Embed Size (px)
Citation preview
Business Results
This presentation may contain forward-looking statement about Daishin Securities Co., Ltd.
All statements that address expectations or projections about the future are forward-looking statements.
Although they reflect our current expectations, these statements are not guarantees of future performance, but involve a number of risks, uncertainties, and assumptions.
Daishin Securities assumes no obligation to provide revisions to any forward-looking statements should circumstances change.
FY2019 2Quarter
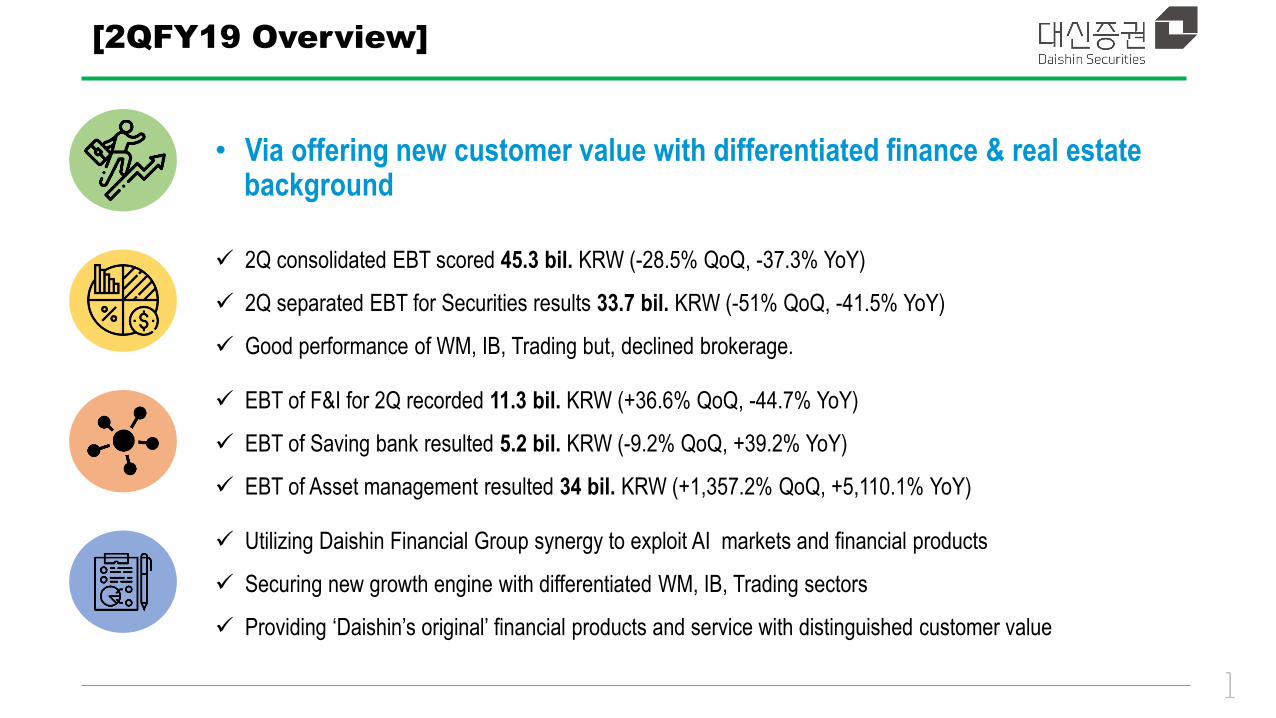
[2QFY19 Overview]
• Via offering new customer value with differentiated finance & real estate background
2Q consolidated EBT scored 45.3 bil. KRW (-28.5% QoQ, -37.3% YoY)
2Q separated EBT for Securities results 33.7 bil. KRW (-51% QoQ, -41.5% YoY)
Good performance of WM, IB, Trading but, declined brokerage.
EBT of F&I for 2Q recorded 11.3 bil. KRW (+36.6% QoQ, -44.7% YoY)
EBT of Saving bank resulted 5.2 bil. KRW (-9.2% QoQ, +39.2% YoY)
EBT of Asset management resulted 34 bil. KRW (+1,357.2% QoQ, +5,110.1% YoY)
1
Utilizing Daishin Financial Group synergy to exploit AI markets and financial products
Securing new growth engine with differentiated WM, IB, Trading sectors
Providing ‘Daishin’s original’ financial products and service with distinguished customer value
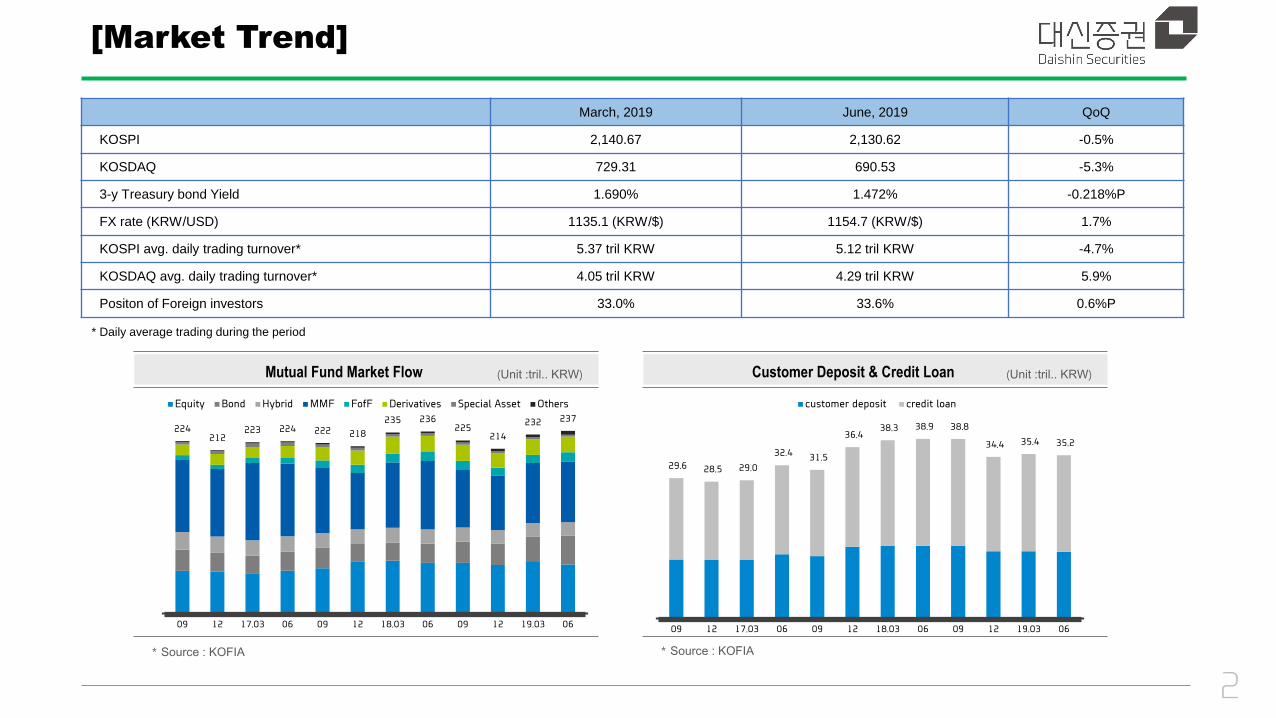
[Market Trend]
March, 2019 June, 2019 QoQ
KOSPI 2,140.67 2,130.62 -0.5%
KOSDAQ 729.31 690.53 -5.3%
3-y Treasury bond Yield 1.690% 1.472% -0.218%P
FX rate (KRW/USD) 1135.1 (KRW/$) 1154.7 (KRW/$) 1.7%
KOSPI avg. daily trading turnover* 5.37 tril KRW 5.12 tril KRW -4.7%
KOSDAQ avg. daily trading turnover* 4.05 tril KRW 4.29 tril KRW 5.9%
Positon of Foreign investors 33.0% 33.6% 0.6%P
* Daily average trading during the period
Mutual Fund Market Flow (Unit :tril.. KRW)
* Source : KOFIA
Customer Deposit & Credit Loan (Unit :tril.. KRW)
* Source : KOFIA
2
237 232
214 225
236 235
218 222 224 223 212
224
0619.0312090618.0312090617.031209
Equity Bond Hybrid MMF FofF Derivatives Special Asset Others
29.6 28.5 29.0
32.4 31.5
36.4 38.3 38.9 38.8
34.4 35.4 35.2
09 12 17.03 06 09 12 18.03 06 09 12 19.03 06
customer deposit credit loan
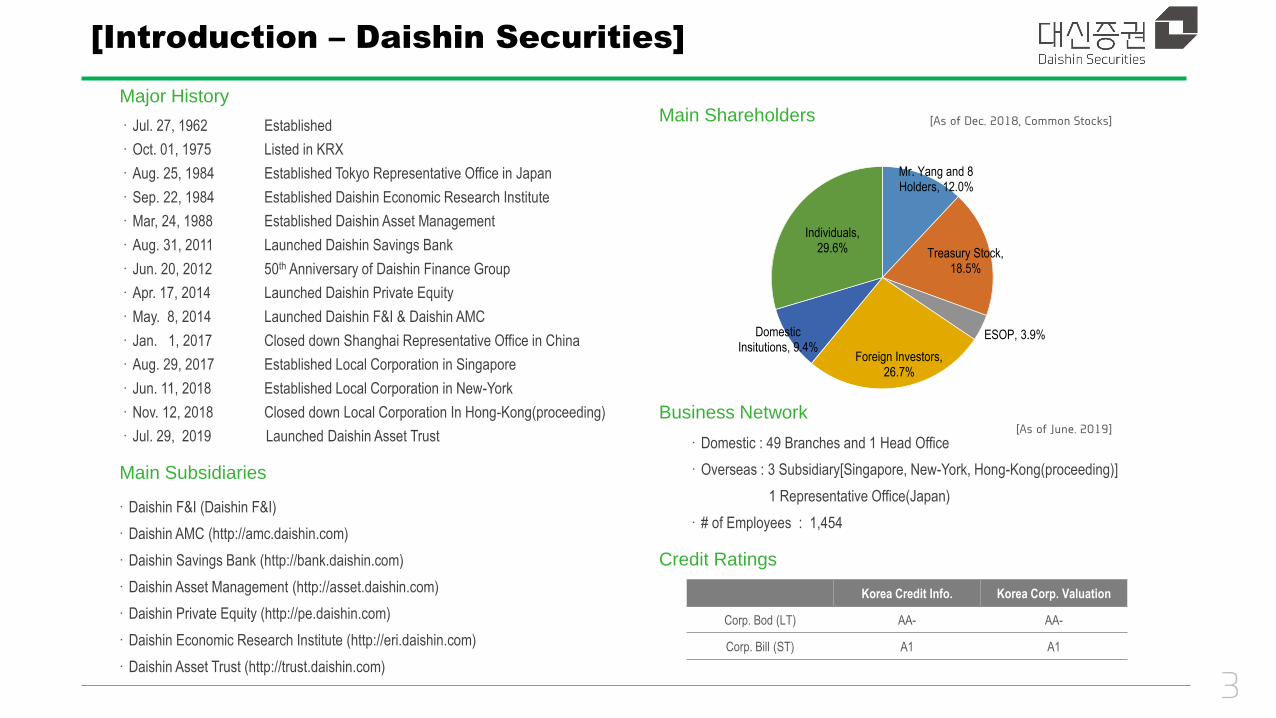
[Introduction – Daishin Securities]
Major History
Main Subsidiaries
·Daishin F&I (Daishin F&I)
·Daishin AMC (http://amc.daishin.com)
·Daishin Savings Bank (http://bank.daishin.com)
·Daishin Asset Management (http://asset.daishin.com)
·Daishin Private Equity (http://pe.daishin.com)
·Daishin Economic Research Institute (http://eri.daishin.com)
·Daishin Asset Trust (http://trust.daishin.com)
·Jul. 27, 1962 Established
·Oct. 01, 1975 Listed in KRX
·Aug. 25, 1984 Established Tokyo Representative Office in Japan
·Sep. 22, 1984 Established Daishin Economic Research Institute
·Mar, 24, 1988 Established Daishin Asset Management
·Aug. 31, 2011 Launched Daishin Savings Bank
·Jun. 20, 2012 50th Anniversary of Daishin Finance Group
·Apr. 17, 2014 Launched Daishin Private Equity
·May. 8, 2014 Launched Daishin F&I & Daishin AMC
·Jan. 1, 2017 Closed down Shanghai Representative Office in China
·Aug. 29, 2017 Established Local Corporation in Singapore
·Jun. 11, 2018 Established Local Corporation in New-York
·Nov. 12, 2018 Closed down Local Corporation In Hong-Kong(proceeding)
·Jul. 29, 2019 Launched Daishin Asset Trust
Business Network
·Domestic : 49 Branches and 1 Head Office
·Overseas : 3 Subsidiary[Singapore, New-York, Hong-Kong(proceeding)]
1 Representative Office(Japan)
·# of Employees : 1,454
Main Shareholders [As of Dec. 2018, Common Stocks]
[As of June. 2019]
Credit Ratings
Korea Credit Info. Korea Corp. Valuation
Corp. Bod (LT) AA- AA-
Corp. Bill (ST) A1 A1
3
Mr. Yang and 8 Holders, 12.0%
Treasury Stock, 18.5%
ESOP, 3.9%
Foreign Investors, 26.7%
Domestic Insitutions, 9.4%
Individuals, 29.6%
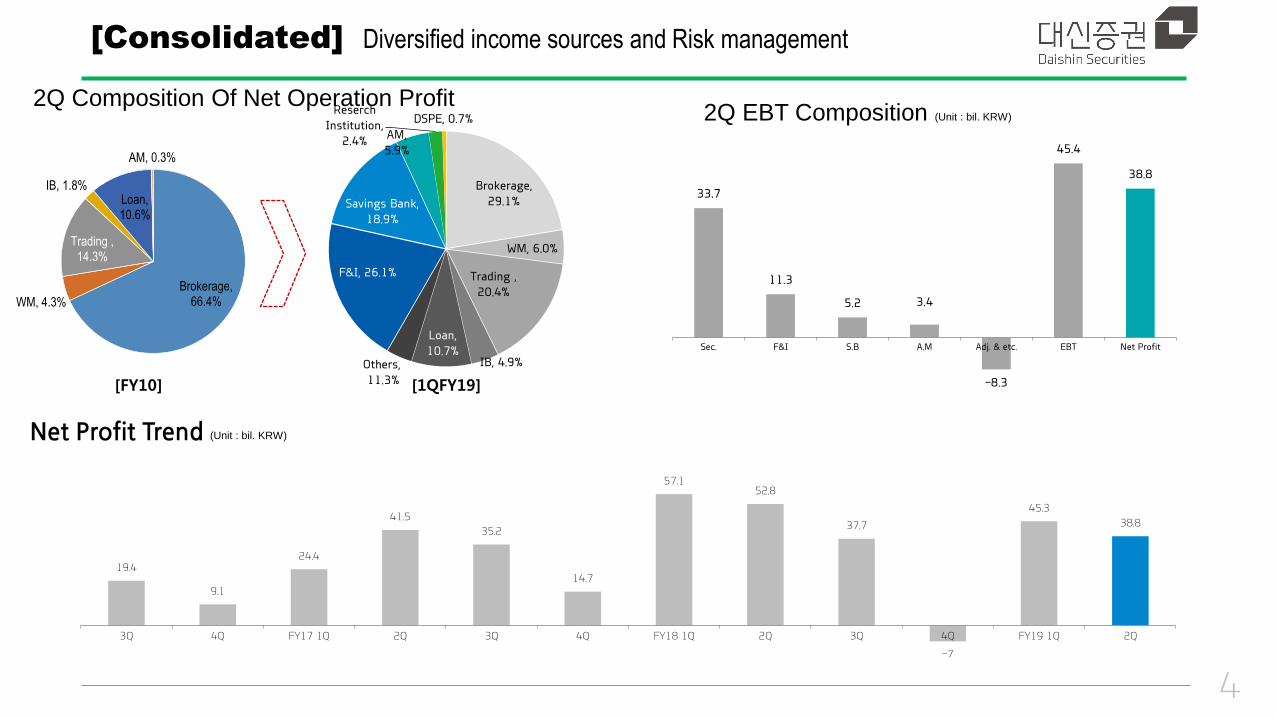
[Consolidated] Diversified income sources and Risk management
2Q Composition Of Net Operation Profit
[FY10] [1QFY19]
2Q EBT Composition (Unit : bil. KRW)
Net Profit Trend (Unit : bil. KRW)
4
Brokerage, 66.4% WM, 4.3%
Trading , 14.3%
IB, 1.8% Loan, 10.6%
AM, 0.3%
19.4
9.1
24.4
41.5
35.2
14.7
57.1 52.8
37.7
-7
45.3
38.8
3Q 4Q FY17 1Q 2Q 3Q 4Q FY18 1Q 2Q 3Q 4Q FY19 1Q 2Q
Brokerage,
29.1%
WM, 6.0%
Trading ,
20.4%
IB, 4.9%
Loan,
10.7% Others,
11.3%
F&I, 26.1%
Savings Bank,
18.9%
AM,
5.9%
Reserch
Institution,
2.4%
DSPE, 0.7%
33.7
11.3
5.2 3.4
-8.3
45.4
38.8
Sec. F&I S.B A.M Adj. & etc. EBT Net Profit
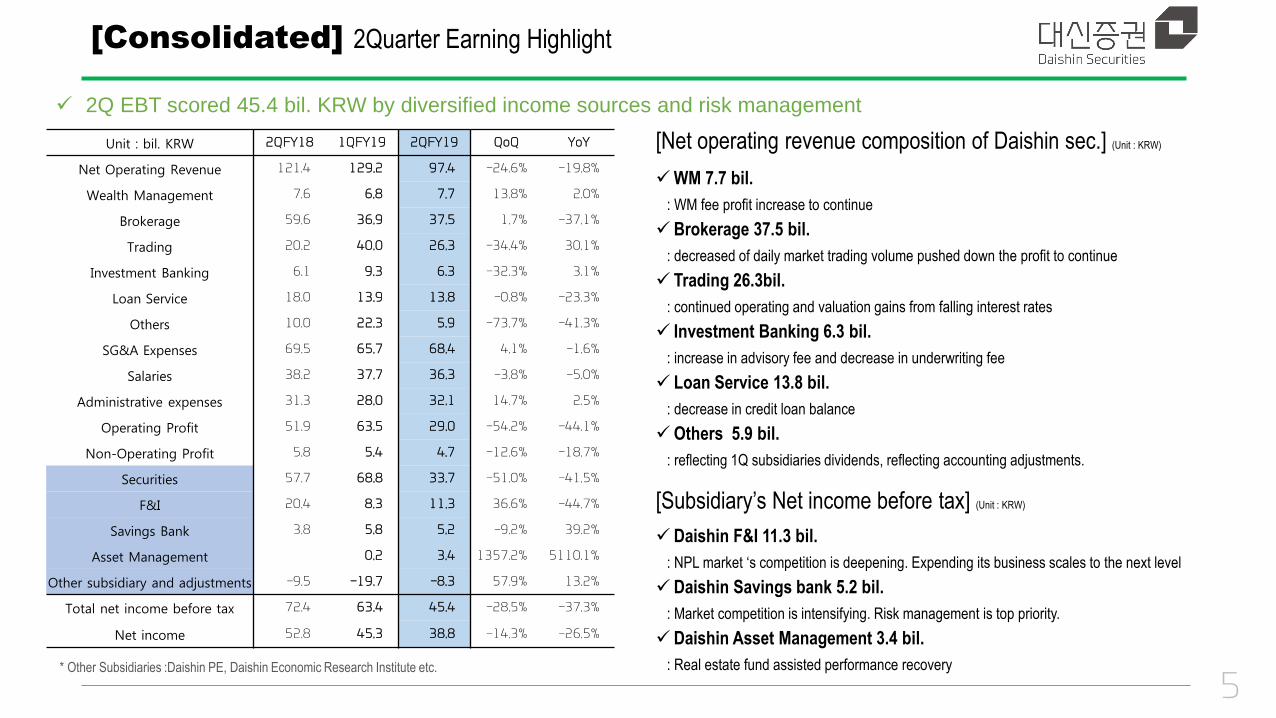
[Consolidated] 2Quarter Earning Highlight
Unit : bil. KRW 2QFY18 1QFY19 2QFY19 QoQ YoY
Net Operating Revenue 121.4 129.2 97.4 -24.6% -19.8%
Wealth Management 7.6 6.8 7.7 13.8% 2.0%
Brokerage 59.6 36.9 37.5 1.7% -37.1%
Trading 20.2 40.0 26.3 -34.4% 30.1%
Investment Banking 6.1 9.3 6.3 -32.3% 3.1%
Loan Service 18.0 13.9 13.8 -0.8% -23.3%
Others 10.0 22.3 5.9 -73.7% -41.3%
SG&A Expenses 69.5 65.7 68.4 4.1% -1.6%
Salaries 38.2 37.7 36.3 -3.8% -5.0%
Administrative expenses 31.3 28.0 32.1 14.7% 2.5%
Operating Profit 51.9 63.5 29.0 -54.2% -44.1%
Non-Operating Profit 5.8 5.4 4.7 -12.6% -18.7%
Securities 57.7 68.8 33.7 -51.0% -41.5%
F&I 20.4 8.3 11.3 36.6% -44.7%
Savings Bank 3.8 5.8 5.2 -9.2% 39.2%
Asset Management 0.2 3.4 1357.2% 5110.1%
Other subsidiary and adjustments -9.5 -19.7 -8.3 57.9% 13.2%
Total net income before tax 72.4 63.4 45.4 -28.5% -37.3%
Net income 52.8 45.3 38.8 -14.3% -26.5%
2Q EBT scored 45.4 bil. KRW by diversified income sources and risk management
[Net operating revenue composition of Daishin sec.] (Unit : KRW)
WM 7.7 bil.
: WM fee profit increase to continue
Brokerage 37.5 bil.
: decreased of daily market trading volume pushed down the profit to continue
Trading 26.3bil.
: continued operating and valuation gains from falling interest rates
Investment Banking 6.3 bil.
: increase in advisory fee and decrease in underwriting fee
Loan Service 13.8 bil.
: decrease in credit loan balance
Others 5.9 bil.
: reflecting 1Q subsidiaries dividends, reflecting accounting adjustments.
[Subsidiary’s Net income before tax] (Unit : KRW)
Daishin F&I 11.3 bil.
: NPL market ‘s competition is deepening. Expending its business scales to the next level
Daishin Savings bank 5.2 bil.
: Market competition is intensifying. Risk management is top priority.
Daishin Asset Management 3.4 bil.
: Real estate fund assisted performance recovery
5 * Other Subsidiaries :Daishin PE, Daishin Economic Research Institute etc.
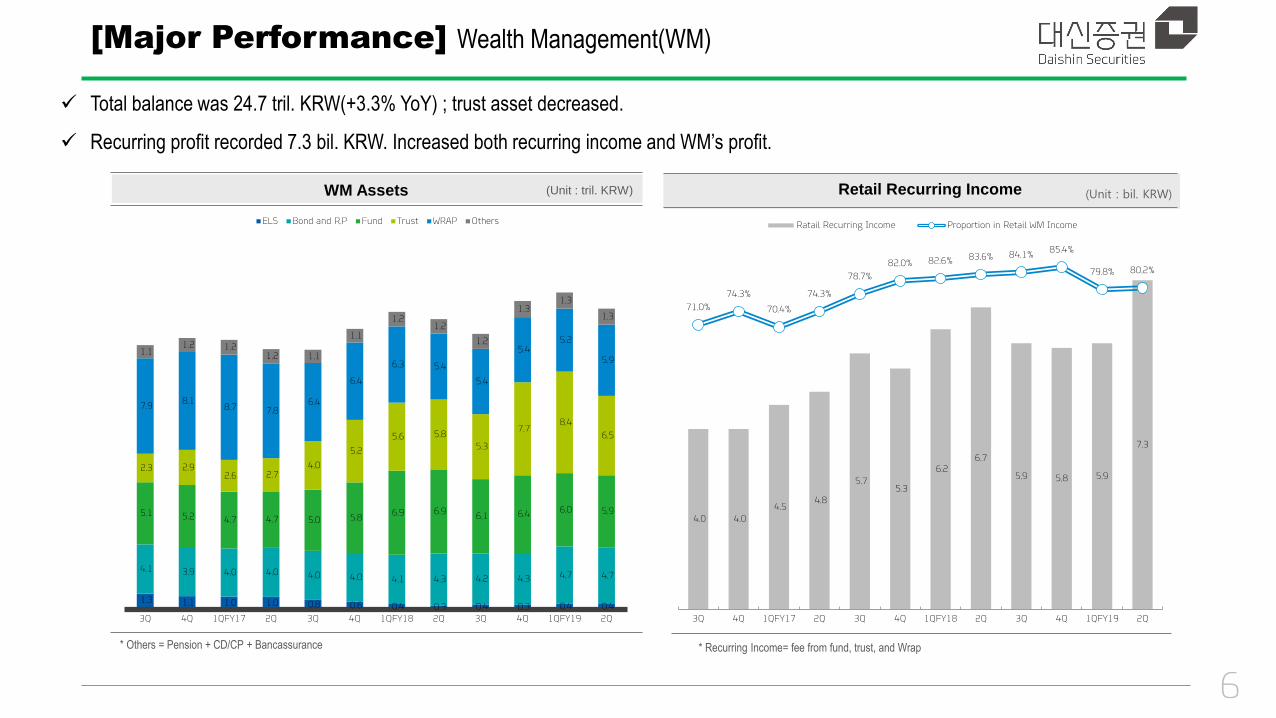
[Major Performance] Wealth Management(WM)
Total balance was 24.7 tril. KRW(+3.3% YoY) ; trust asset decreased.
Recurring profit recorded 7.3 bil. KRW. Increased both recurring income and WM’s profit.
WM Assets (Unit : tril. KRW)
* Others = Pension + CD/CP + Bancassurance
Retail Recurring Income (Unit : bil. KRW)
* Recurring Income= fee from fund, trust, and Wrap
6
1.3 1.1 1.0 1.0 0.8 0.6 0.4 0.3 0.4 0.3 0.4 0.4
4.1 3.9 4.0 4.0 4.0 4.0 4.1 4.3 4.2 4.3 4.7 4.7
5.1 5.2 4.7 4.7 5.0 5.8 6.9 6.9
6.1 6.4 6.0 5.9
2.3 2.9 2.6 2.7
4.0
5.2
5.6 5.8
5.3
7.7 8.4
6.5
7.9 8.1
8.7 7.8 6.4
6.4
6.3 5.4
5.4
5.4 5.2
5.9 1.1
1.2 1.2 1.2 1.1
1.1
1.2 1.2
1.2
1.3 1.3
1.3
3Q 4Q 1QFY17 2Q 3Q 4Q 1QFY18 2Q 3Q 4Q 1QFY19 2Q
ELS Bond and R.P Fund Trust WRAP Others
4.0 4.0
4.5 4.8
5.7 5.3
6.2 6.7
5.9 5.8 5.9
7.3
71.0%
74.3%
70.4%
74.3%
78.7%
82.0% 82.6% 83.6% 84.1% 85.4%
79.8% 80.2%
3Q 4Q 1QFY17 2Q 3Q 4Q 1QFY18 2Q 3Q 4Q 1QFY19 2Q
Ratail Recurring Income Proportion in Retail WM Income
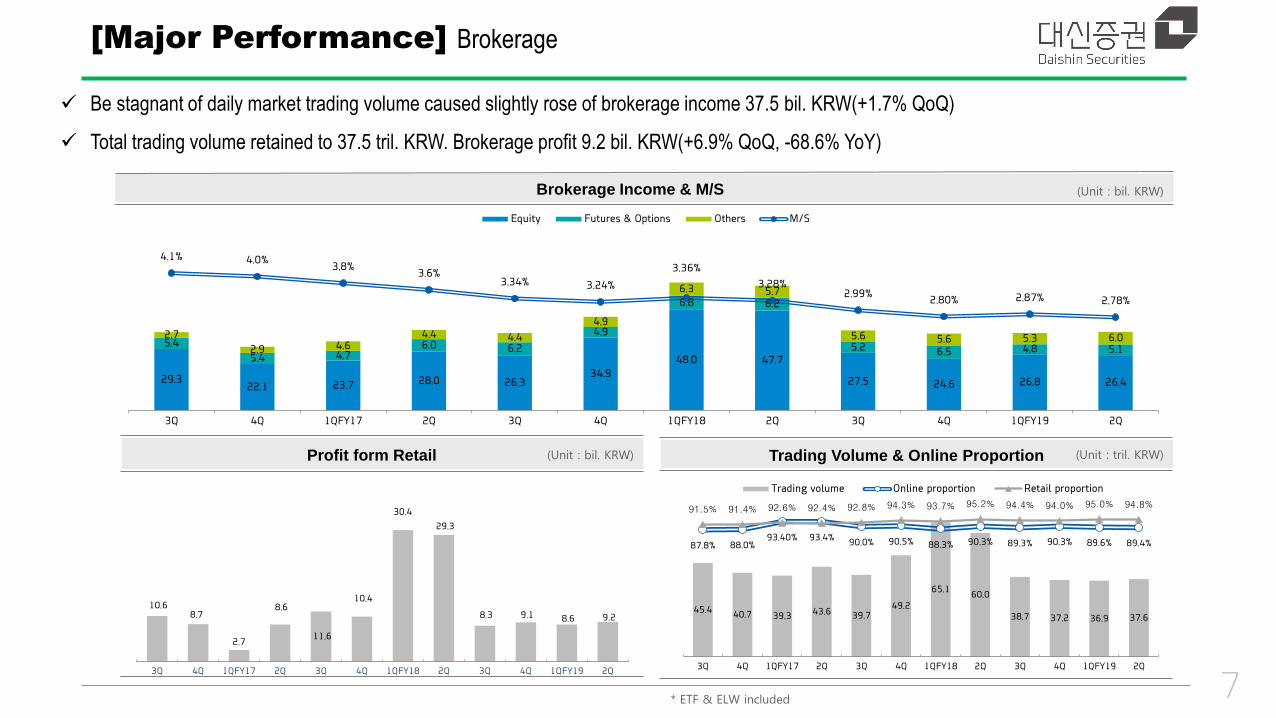
[Major Performance] Brokerage
Be stagnant of daily market trading volume caused slightly rose of brokerage income 37.5 bil. KRW(+1.7% QoQ)
Total trading volume retained to 37.5 tril. KRW. Brokerage profit 9.2 bil. KRW(+6.9% QoQ, -68.6% YoY)
Brokerage Income & M/S (Unit : bil. KRW)
Profit form Retail (Unit : bil. KRW) Trading Volume & Online Proportion (Unit : tril. KRW)
* ETF & ELW included 7
10.6 8.7
2.7
8.6
11.6
10.4
30.4
29.3
8.3 9.1 8.6 9.2
3Q 4Q 1QFY17 2Q 3Q 4Q 1QFY18 2Q 3Q 4Q 1QFY19 2Q
29.3 22.1 23.7 28.0 26.3
34.9
48.0 47.7
27.5 24.6 26.8 26.4
5.4
5.4 4.7 6.0 6.2
4.9
6.8 6.2
5.2 6.5 4.8 5.1
2.7
2.9 4.6 4.4 4.4
4.9
6.3 5.7
5.6 5.6 5.3 6.0
4.1% 4.0% 3.8%
3.6% 3.34% 3.24%
3.36%
3.28% 2.99%
2.80% 2.87% 2.78%
3Q 4Q 1QFY17 2Q 3Q 4Q 1QFY18 2Q 3Q 4Q 1QFY19 2Q
Equity Futures & Options Others M/S
45.4 40.7 39.3 43.6 39.7
49.2
65.1 60.0
38.7 37.2 36.9 37.6
87.8% 88.0% 93.40% 93.4%
90.0% 90.5% 88.3% 90.3% 89.3% 90.3% 89.6% 89.4%
91.5% 91.4% 92.6% 92.4% 92.8% 94.3% 93.7% 95.2% 94.4% 94.0% 95.0% 94.8%
3Q 4Q 1QFY17 2Q 3Q 4Q 1QFY18 2Q 3Q 4Q 1QFY19 2Q
Trading volume Online proportion Retail proportion
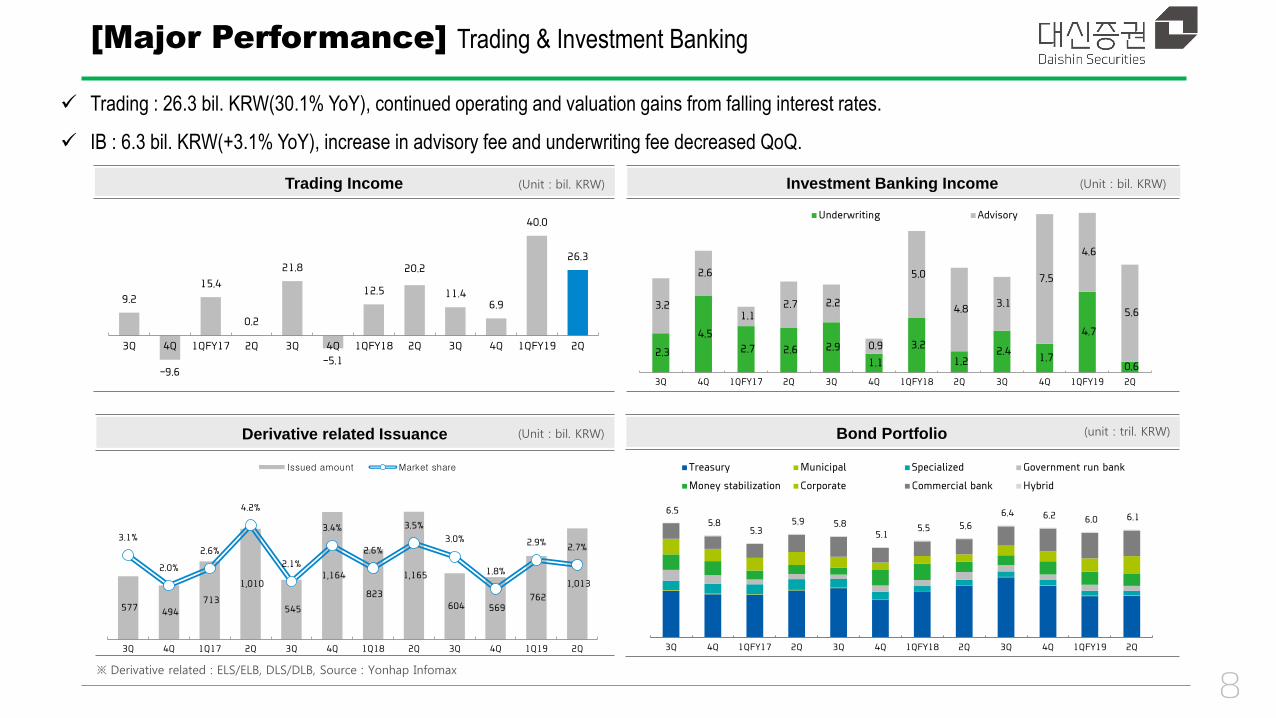
[Major Performance] Trading & Investment Banking
Trading : 26.3 bil. KRW(30.1% YoY), continued operating and valuation gains from falling interest rates.
IB : 6.3 bil. KRW(+3.1% YoY), increase in advisory fee and underwriting fee decreased QoQ.
Trading Income (Unit : bil. KRW) Investment Banking Income (Unit : bil. KRW)
Derivative related Issuance (Unit : bil. KRW) Bond Portfolio (unit : tril. KRW)
8 ※ Derivative related : ELS/ELB, DLS/DLB, Source : Yonhap Infomax
9.2
-9.6
15.4
0.2
21.8
-5.1
12.5
20.2
11.4 6.9
40.0
26.3
3Q 4Q 1QFY17 2Q 3Q 4Q 1QFY18 2Q 3Q 4Q 1QFY19 2Q
577 494
713
1,010
545
1,164
823
1,165
604 569 762
1,013
3.1%
2.0%
2.6%
4.2%
2.1%
3.4%
2.6%
3.5%
3.0%
1.8%
2.9% 2.7%
3Q 4Q 1Q17 2Q 3Q 4Q 1Q18 2Q 3Q 4Q 1Q19 2Q
Issued amount Market share
2.3
4.5
2.7 2.6 2.9
1.1
3.2
1.2 2.4
1.7
4.7
0.6
3.2
2.6
1.1 2.7 2.2
0.9
5.0
4.8 3.1
7.5
4.6
5.6
3Q 4Q 1QFY17 2Q 3Q 4Q 1QFY18 2Q 3Q 4Q 1QFY19 2Q
Underwriting Advisory
6.5
5.8 5.3
5.9 5.8 5.1
5.5 5.6
6.4 6.2 6.0 6.1
3Q 4Q 1QFY17 2Q 3Q 4Q 1QFY18 2Q 3Q 4Q 1QFY19 2Q
Treasury Municipal Specialized Government run bank
Money stabilization Corporate Commercial bank Hybrid
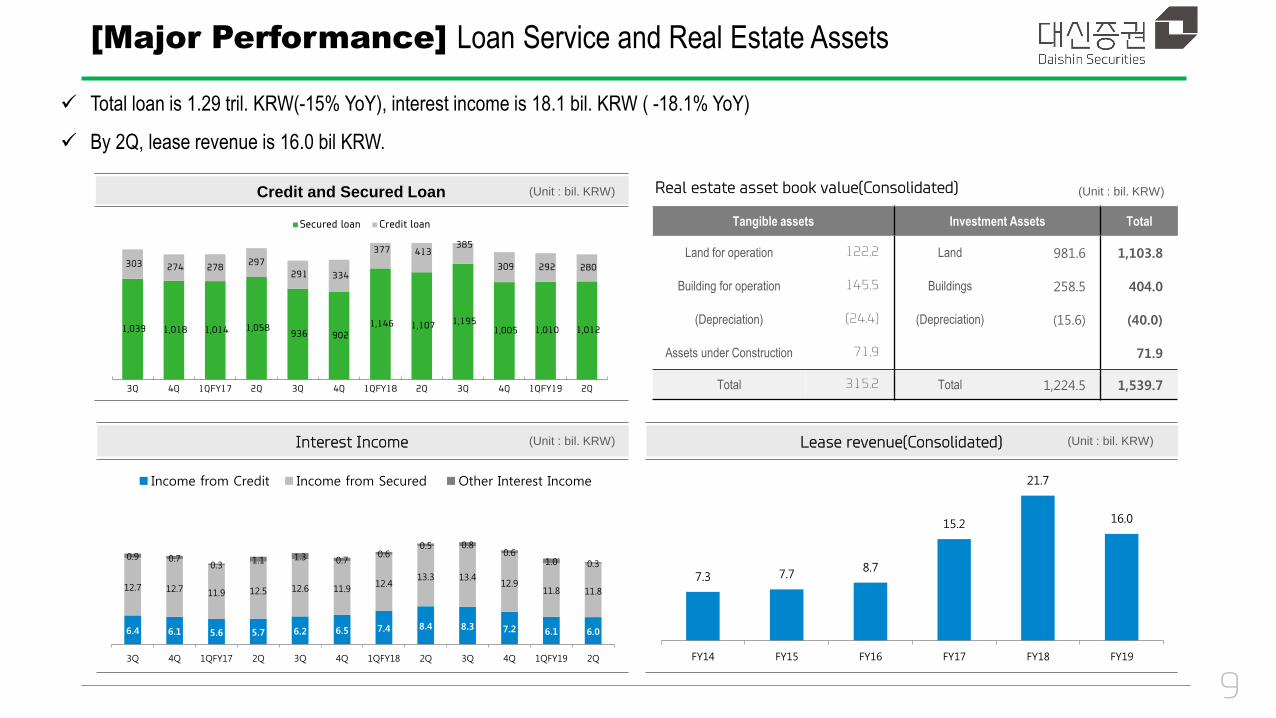
[Major Performance] Loan Service and Real Estate Assets
Total loan is 1.29 tril. KRW(-15% YoY), interest income is 18.1 bil. KRW ( -18.1% YoY)
By 2Q, lease revenue is 16.0 bil KRW.
Credit and Secured Loan (Unit : bil. KRW) Real estate asset book value(Consolidated) (Unit : bil. KRW)
Tangible assets Investment Assets Total
Land for operation 122.2 Land 981.6 1,103.8
Building for operation 145.5 Buildings 258.5 404.0
(Depreciation) (24.4) (Depreciation) (15.6) (40.0)
Assets under Construction 71.9 71.9
Total 315.2 Total 1,224.5 1,539.7
Lease revenue(Consolidated) (Unit : bil. KRW)
9
Interest Income (Unit : bil. KRW)
1,039 1,018 1,014 1,058 936 902
1,146 1,107 1,195 1,005 1,010 1,012
303 274 278 297
291 334
377 413 385
309 292 280
3Q 4Q 1QFY17 2Q 3Q 4Q 1QFY18 2Q 3Q 4Q 1QFY19 2Q
Secured loan Credit loan
6.4 6.1 5.6 5.7 6.2 6.5 7.4 8.4 8.3 7.2 6.1 6.0
12.7 12.7 11.9 12.5 12.6 11.9 12.4
13.3 13.4 12.9
11.8 11.8
0.9 0.7 0.3
1.1 1.3 0.7 0.6
0.5 0.8 0.6
1.0 0.3
3Q 4Q 1QFY17 2Q 3Q 4Q 1QFY18 2Q 3Q 4Q 1QFY19 2Q
Income from Credit Income from Secured Other Interest Income
7.3 7.7 8.7
15.2
21.7
16.0
FY14 FY15 FY16 FY17 FY18 FY19
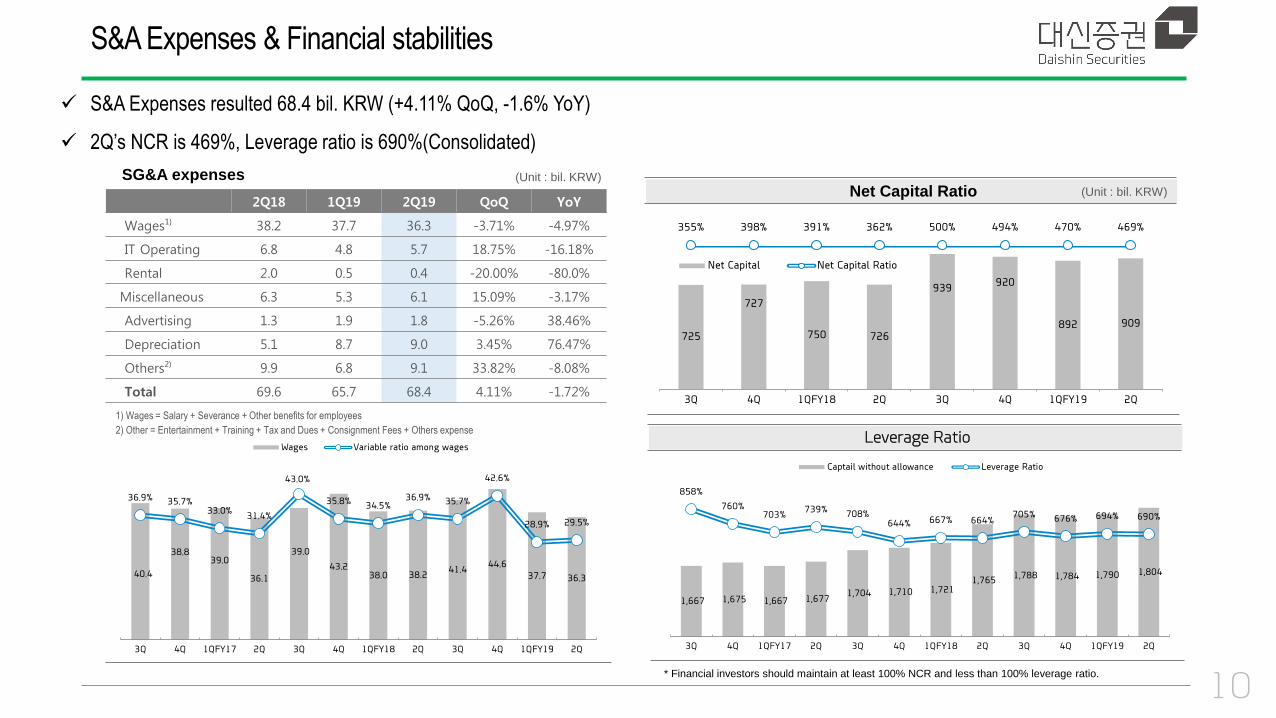
S&A Expenses & Financial stabilities
SG&A expenses (Unit : bil. KRW)
(단위 : 십억원)
2Q18 1Q19 2Q19 QoQ YoY
Wages1) 38.2 37.7 36.3 -3.71% -4.97%
IT Operating 6.8 4.8 5.7 18.75% -16.18%
Rental 2.0 0.5 0.4 -20.00% -80.0%
Miscellaneous 6.3 5.3 6.1 15.09% -3.17%
Advertising 1.3 1.9 1.8 -5.26% 38.46%
Depreciation 5.1 8.7 9.0 3.45% 76.47%
Others2) 9.9 6.8 9.1 33.82% -8.08%
Total 69.6 65.7 68.4 4.11% -1.72%
S&A Expenses resulted 68.4 bil. KRW (+4.11% QoQ, -1.6% YoY)
2Q’s NCR is 469%, Leverage ratio is 690%(Consolidated)
Net Capital Ratio (Unit : bil. KRW)
Leverage Ratio
10
1) Wages = Salary + Severance + Other benefits for employees
2) Other = Entertainment + Training + Tax and Dues + Consignment Fees + Others expense
1,667 1,675 1,667 1,677 1,704 1,710 1,721
1,765 1,788 1,784 1,790 1,804
858%
760% 703%
739% 708%
644% 667% 664% 705% 676% 694% 690%
3Q 4Q 1QFY17 2Q 3Q 4Q 1QFY18 2Q 3Q 4Q 1QFY19 2Q
Captail without allowance Leverage Ratio
40.4
38.8 39.0
36.1
39.0
43.2 38.0 38.2
41.4 44.6
37.7 36.3
36.9% 35.7% 33.0%
31.4%
43.0%
35.8% 34.5% 36.9% 35.7%
42.6%
28.9% 29.5%
3Q 4Q 1QFY17 2Q 3Q 4Q 1QFY18 2Q 3Q 4Q 1QFY19 2Q
Wages Variable ratio among wages
725
727
750 726
939 920
892 909
355% 398% 391% 362% 500% 494% 470% 469%
3Q 4Q 1QFY18 2Q 3Q 4Q 1QFY19 2Q
Net Capital Net Capital Ratio
* Financial investors should maintain at least 100% NCR and less than 100% leverage ratio.
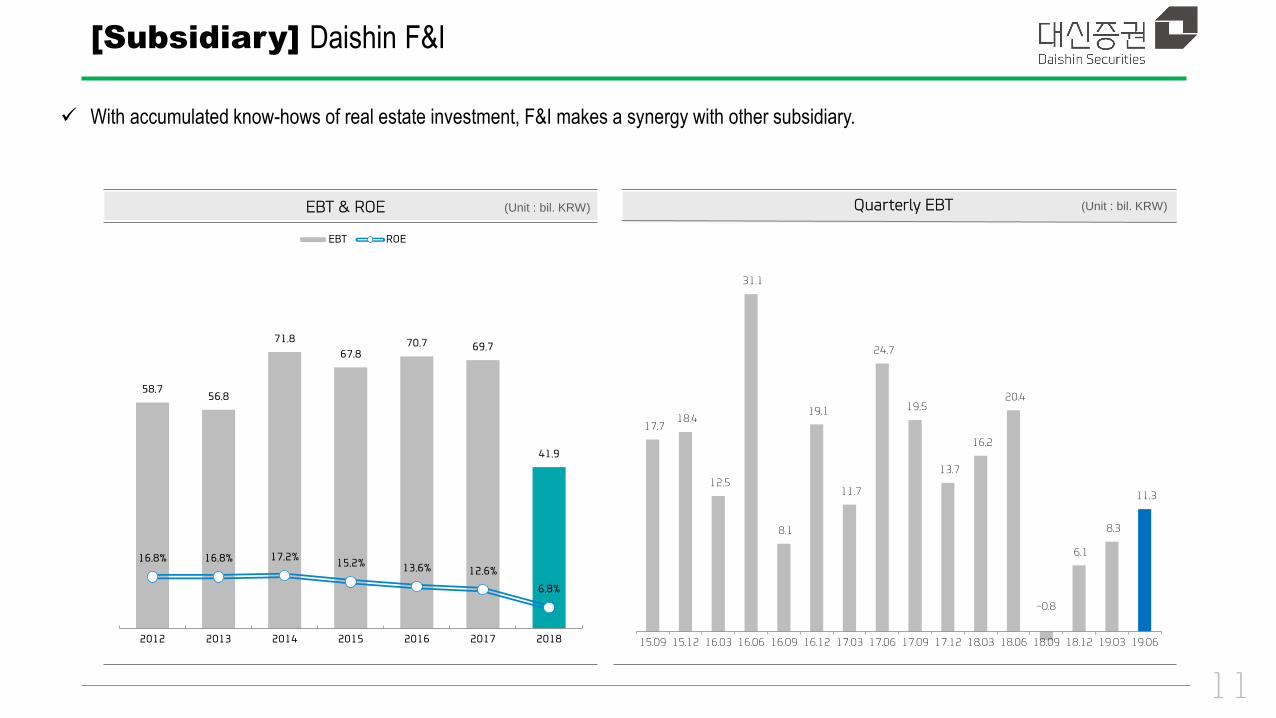
[Subsidiary] Daishin F&I
With accumulated know-hows of real estate investment, F&I makes a synergy with other subsidiary.
EBT & ROE (Unit : bil. KRW) Quarterly EBT (Unit : bil. KRW)
11
58.7 56.8
71.8
67.8 70.7 69.7
41.9
16.8% 16.8% 17.2% 15.2% 13.6% 12.6%
6.8%
2012 2013 2014 2015 2016 2017 2018
EBT ROE
17.7 18.4
12.5
31.1
8.1
19.1
11.7
24.7
19.5
13.7
16.2
20.4
-0.8
6.1
8.3
11.3
15.09 15.12 16.03 16.06 16.09 16.12 17.03 17.06 17.09 17.12 18.03 18.06 18.09 18.12 19.03 19.06
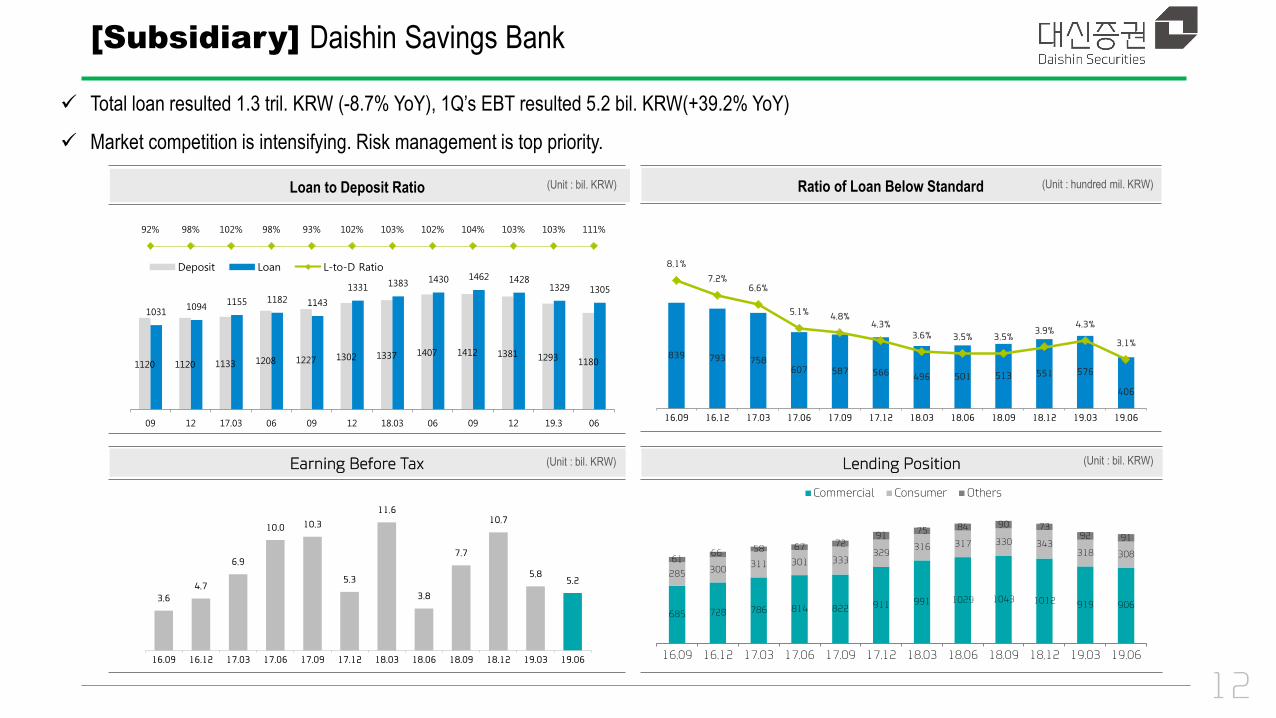
[Subsidiary] Daishin Savings Bank
Total loan resulted 1.3 tril. KRW (-8.7% YoY), 1Q’s EBT resulted 5.2 bil. KRW(+39.2% YoY)
Market competition is intensifying. Risk management is top priority.
Loan to Deposit Ratio (Unit : bil. KRW) Ratio of Loan Below Standard (Unit : hundred mil. KRW)
Earning Before Tax (Unit : bil. KRW) Lending Position (Unit : bil. KRW)
12
839 793 758 607 587 566 496 501 513 551 576
406
8.1%
7.2% 6.6%
5.1% 4.8%
4.3% 3.6% 3.5% 3.5%
3.9% 4.3%
3.1%
16.09 16.12 17.03 17.06 17.09 17.12 18.03 18.06 18.09 18.12 19.03 19.06
3.6
4.7
6.9
10.0 10.3
5.3
11.6
3.8
7.7
10.7
5.8 5.2
16.09 16.12 17.03 17.06 17.09 17.12 18.03 18.06 18.09 18.12 19.03 19.06
1120 1120 1133 1208 1227 1302 1337 1407 1412 1381 1293 1180
1031 1094
1155 1182 1143
1331 1383 1430 1462 1428 1329 1305
92% 98% 102% 98% 93% 102% 103% 102% 104% 103% 103% 111%
09 12 17.03 06 09 12 18.03 06 09 12 19.3 06
Deposit Loan L-to-D Ratio
685 728 786 814 822 911 991 1029 1043 1012 919 906
285 300 311 301 333
329 316 317 330 343
318 308 61
66 58 67 72 91
75 84 90 73 92 91
16.09 16.12 17.03 17.06 17.09 17.12 18.03 18.06 18.09 18.12 19.03 19.06
Commercial Consumer Others
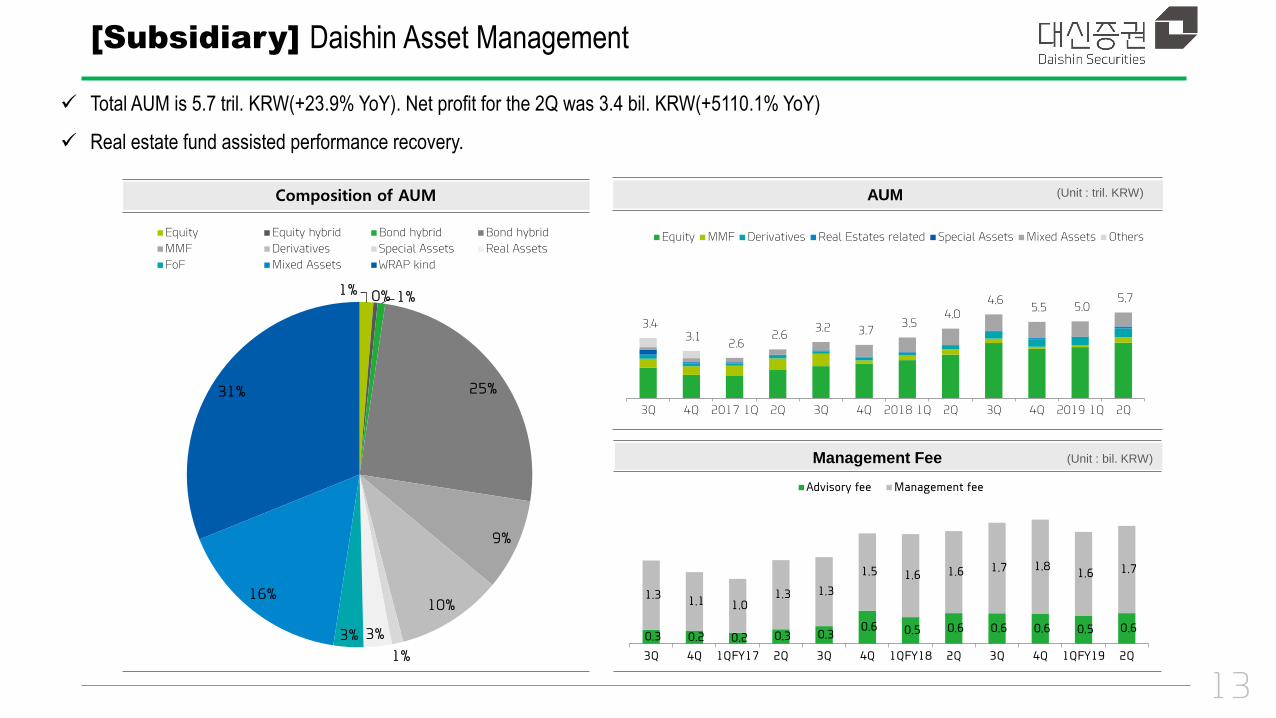
[Subsidiary] Daishin Asset Management
Total AUM is 5.7 tril. KRW(+23.9% YoY). Net profit for the 2Q was 3.4 bil. KRW(+5110.1% YoY)
Real estate fund assisted performance recovery.
Composition of AUM AUM (Unit : tril. KRW)
Management Fee (Unit : bil. KRW)
13
1% 0% 1%
25%
9%
10%
1%
3% 3%
16%
31%
Equity Equity hybrid Bond hybrid Bond hybrid
MMF Derivatives Special Assets Real Assets
FoF Mixed Assets WRAP kind
3.4 3.1
2.6 2.6
3.2 3.7 3.5
4.0 4.6
5.5 5.0 5.7
3Q 4Q 2017 1Q 2Q 3Q 4Q 2018 1Q 2Q 3Q 4Q 2019 1Q 2Q
Equity MMF Derivatives Real Estates related Special Assets Mixed Assets Others
0.3 0.2 0.2 0.3 0.3 0.6 0.5 0.6 0.6 0.6 0.5 0.6
1.3 1.1 1.0
1.3 1.3
1.5 1.6 1.6 1.7 1.8 1.6 1.7
3Q 4Q 1QFY17 2Q 3Q 4Q 1QFY18 2Q 3Q 4Q 1QFY19 2Q
Advisory fee Management fee
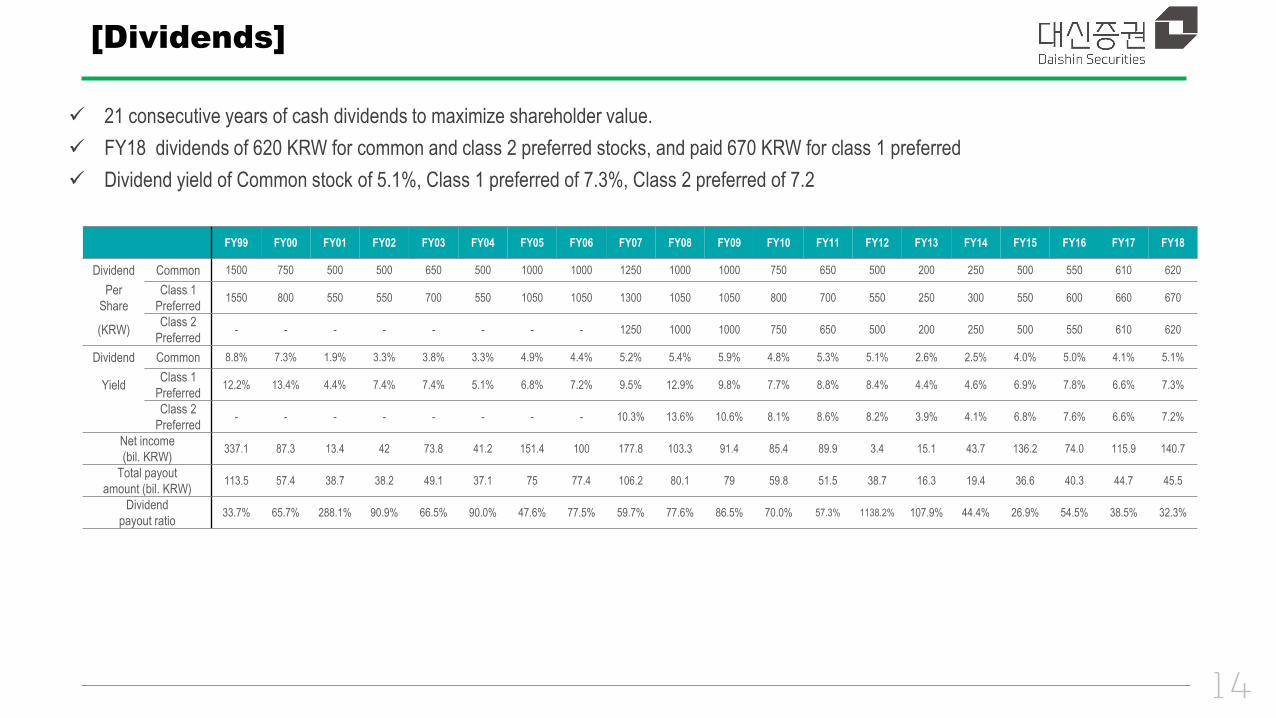
[Dividends]
FY99 FY00 FY01 FY02 FY03 FY04 FY05 FY06 FY07 FY08 FY09 FY10 FY11 FY12 FY13 FY14 FY15 FY16 FY17 FY18
Dividend Common 1500 750 500 500 650 500 1000 1000 1250 1000 1000 750 650 500 200 250 500 550 610 620
Per
Share
Class 1
Preferred 1550 800 550 550 700 550 1050 1050 1300 1050 1050 800 700 550 250 300 550 600 660 670
(KRW) Class 2
Preferred - - - - - - - - 1250 1000 1000 750 650 500 200 250 500 550 610 620
Dividend Common 8.8% 7.3% 1.9% 3.3% 3.8% 3.3% 4.9% 4.4% 5.2% 5.4% 5.9% 4.8% 5.3% 5.1% 2.6% 2.5% 4.0% 5.0% 4.1% 5.1%
Yield Class 1
Preferred 12.2% 13.4% 4.4% 7.4% 7.4% 5.1% 6.8% 7.2% 9.5% 12.9% 9.8% 7.7% 8.8% 8.4% 4.4% 4.6% 6.9% 7.8% 6.6% 7.3%
Class 2
Preferred - - - - - - - - 10.3% 13.6% 10.6% 8.1% 8.6% 8.2% 3.9% 4.1% 6.8% 7.6% 6.6% 7.2%
Net income
(bil. KRW) 337.1 87.3 13.4 42 73.8 41.2 151.4 100 177.8 103.3 91.4 85.4 89.9 3.4 15.1 43.7 136.2 74.0 115.9 140.7
Total payout
amount (bil. KRW) 113.5 57.4 38.7 38.2 49.1 37.1 75 77.4 106.2 80.1 79 59.8 51.5 38.7 16.3 19.4 36.6 40.3 44.7 45.5
Dividend
payout ratio 33.7% 65.7% 288.1% 90.9% 66.5% 90.0% 47.6% 77.5% 59.7% 77.6% 86.5% 70.0% 57.3% 1138.2% 107.9% 44.4% 26.9% 54.5% 38.5% 32.3%
21 consecutive years of cash dividends to maximize shareholder value.
FY18 dividends of 620 KRW for common and class 2 preferred stocks, and paid 670 KRW for class 1 preferred
Dividend yield of Common stock of 5.1%, Class 1 preferred of 7.3%, Class 2 preferred of 7.2
14
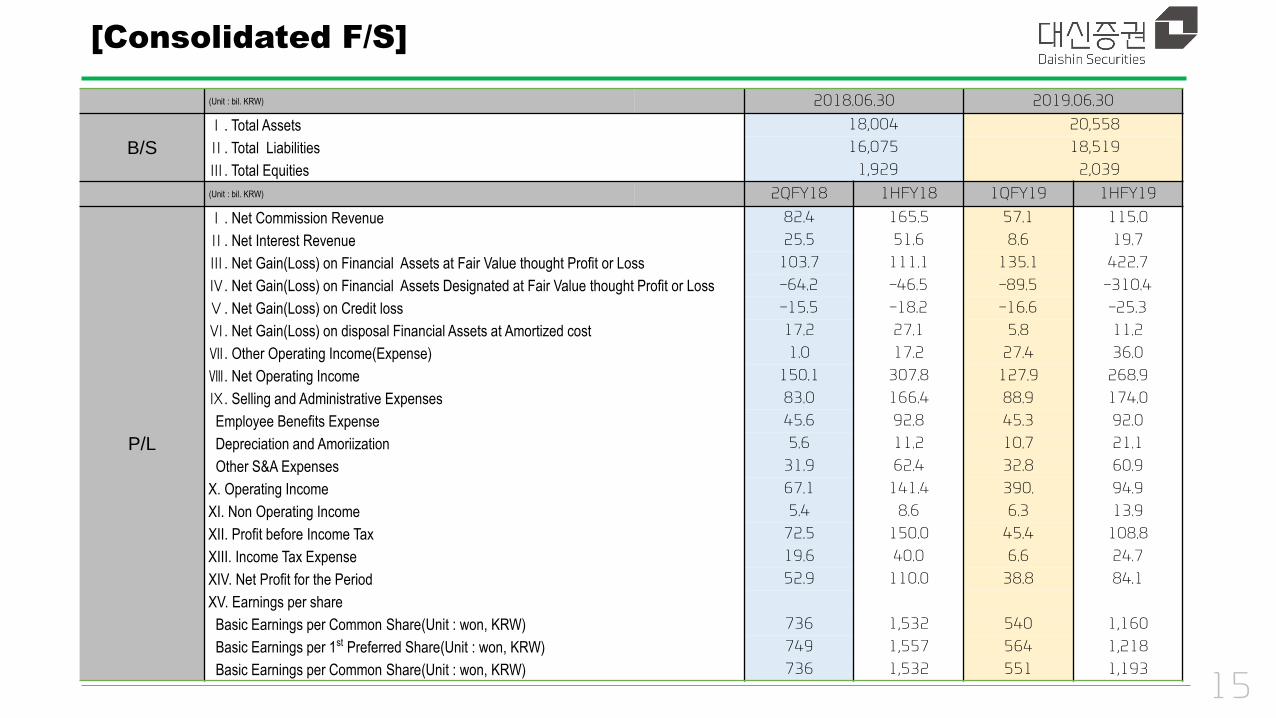
[Consolidated F/S]
15
(Unit : bil. KRW) 2018.06.30 2019.06.30
B/S
Ⅰ. Total Assets 18,004 20,558
Ⅱ. Total Liabilities 16,075 18,519
Ⅲ. Total Equities 1,929 2,039
(Unit : bil. KRW) 2QFY18 1HFY18 1QFY19 1HFY19
P/L
Ⅰ. Net Commission Revenue 82.4 165.5 57.1 115.0
Ⅱ. Net Interest Revenue 25.5 51.6 8.6 19.7
Ⅲ. Net Gain(Loss) on Financial Assets at Fair Value thought Profit or Loss 103.7 111.1 135.1 422.7
Ⅳ. Net Gain(Loss) on Financial Assets Designated at Fair Value thought Profit or Loss -64.2 -46.5 -89.5 -310.4
Ⅴ. Net Gain(Loss) on Credit loss -15.5 -18.2 -16.6 -25.3
Ⅵ. Net Gain(Loss) on disposal Financial Assets at Amortized cost 17.2 27.1 5.8 11.2
Ⅶ. Other Operating Income(Expense) 1.0 17.2 27.4 36.0
Ⅷ. Net Operating Income 150.1 307.8 127.9 268.9
Ⅸ. Selling and Administrative Expenses 83.0 166.4 88.9 174.0
Employee Benefits Expense 45.6 92.8 45.3 92.0
Depreciation and Amoriization 5.6 11.2 10.7 21.1
Other S&A Expenses 31.9 62.4 32.8 60.9
X. Operating Income 67.1 141.4 390. 94.9
XI. Non Operating Income 5.4 8.6 6.3 13.9
XII. Profit before Income Tax 72.5 150.0 45.4 108.8
XIII. Income Tax Expense 19.6 40.0 6.6 24.7
XIV. Net Profit for the Period 52.9 110.0 38.8 84.1
XV. Earnings per share
Basic Earnings per Common Share(Unit : won, KRW) 736 1,532 540 1,160
Basic Earnings per 1st Preferred Share(Unit : won, KRW) 749 1,557 564 1,218
Basic Earnings per Common Share(Unit : won, KRW) 736 1,532 551 1,193
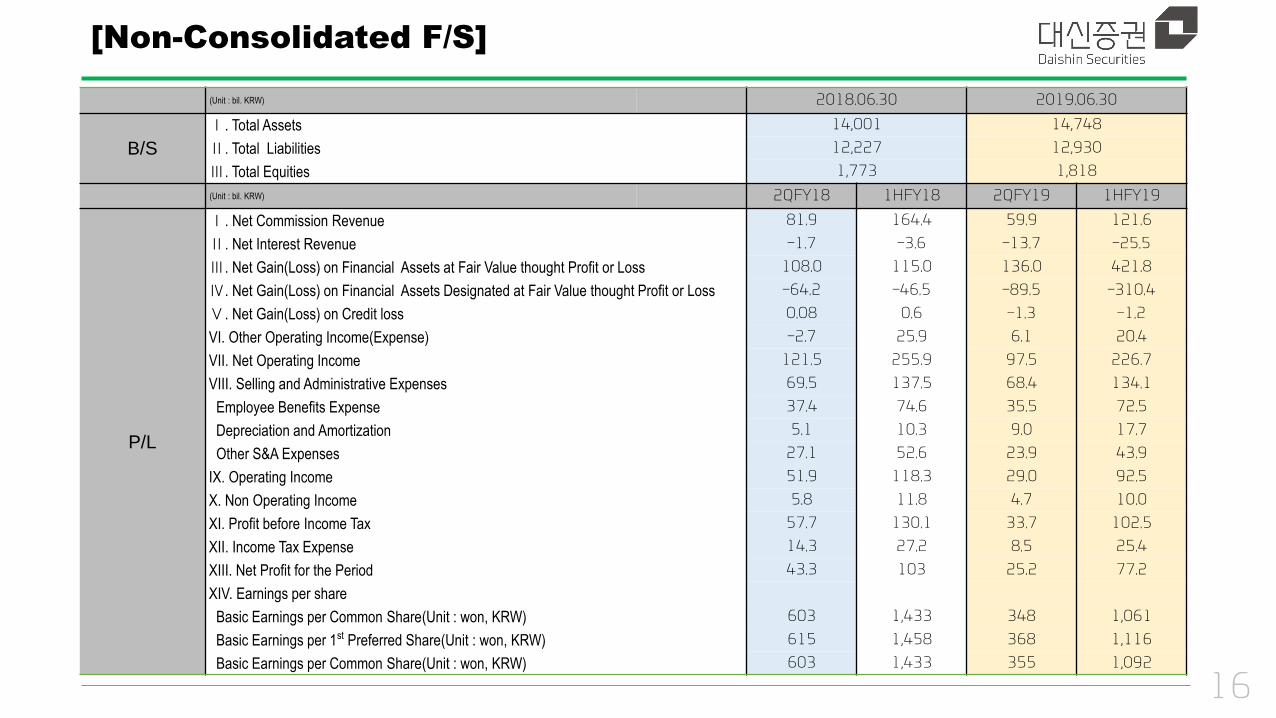
[Non-Consolidated F/S]
16
(Unit : bil. KRW) 2018.06.30 2019.06.30
B/S
Ⅰ. Total Assets 14,001 14,748
Ⅱ. Total Liabilities 12,227 12,930
Ⅲ. Total Equities 1,773 1,818
(Unit : bil. KRW) 2QFY18 1HFY18 2QFY19 1HFY19
P/L
Ⅰ. Net Commission Revenue 81.9 164.4 59.9 121.6
Ⅱ. Net Interest Revenue -1.7 -3.6 -13.7 -25.5
Ⅲ. Net Gain(Loss) on Financial Assets at Fair Value thought Profit or Loss 108.0 115.0 136.0 421.8
Ⅳ. Net Gain(Loss) on Financial Assets Designated at Fair Value thought Profit or Loss -64.2 -46.5 -89.5 -310.4
Ⅴ. Net Gain(Loss) on Credit loss 0.08 0.6 -1.3 -1.2
VI. Other Operating Income(Expense) -2.7 25.9 6.1 20.4
VII. Net Operating Income 121.5 255.9 97.5 226.7
VIII. Selling and Administrative Expenses 69.5 137.5 68.4 134.1
Employee Benefits Expense 37.4 74.6 35.5 72.5
Depreciation and Amortization 5.1 10.3 9.0 17.7
Other S&A Expenses 27.1 52.6 23.9 43.9
IX. Operating Income 51.9 118.3 29.0 92.5
X. Non Operating Income 5.8 11.8 4.7 10.0
XI. Profit before Income Tax 57.7 130.1 33.7 102.5
XII. Income Tax Expense 14.3 27.2 8.5 25.4
XIII. Net Profit for the Period 43.3 103 25.2 77.2
XIV. Earnings per share
Basic Earnings per Common Share(Unit : won, KRW) 603 1,433 348 1,061
Basic Earnings per 1st Preferred Share(Unit : won, KRW) 615 1,458 368 1,116
Basic Earnings per Common Share(Unit : won, KRW) 603 1,433 355 1,092