Embed Size (px)
Citation preview
Seediscussions,stats,andauthorprofilesforthispublicationat:https://www.researchgate.net/publication/24189985
BiophysicalcharacterizationandunfoldingofLEF4factorofRNApolymerasefromAcNPV
ArticleinBiopolymers·July2009
DOI:10.1002/bip.21180·Source:PubMed
CITATIONS
6
READS
36
6authors,including:
SheebaRasheedi
CaseWesternReserveUniversity
13PUBLICATIONS235CITATIONS
SEEPROFILE
SoghraHaq
UniversityofOmarAl-Mukhtar
26PUBLICATIONS1,058CITATIONS
SEEPROFILE
SudipGhosh
DeMontfortUniversity
110PUBLICATIONS2,790CITATIONS
SEEPROFILE
NasreenEhtesham
NationalInstituteOfPathology
72PUBLICATIONS1,286CITATIONS
SEEPROFILE
AllcontentfollowingthispagewasuploadedbySheebaRasheedion02December2016.
Theuserhasrequestedenhancementofthedownloadedfile.
Biophysical Characterization and Unfolding of LEF4 Factor of RNAPolymerase from AcNPV
Sheeba Rasheedi,1 Madhuri Suragani,2 Soghra K. Haq,2 Sudip Ghosh,2 Nasreen Z. Ehtesham,2
Seyed E. Hasnain3,4,5
1 Laboratory of Molecular and Cellular Biology, Centre for DNA Fingerprinting and Diagnostics,
Hyderabad, Andhra Pradesh 500 076, India
2 Molecular Biology Unit, National Institute of Nutrition, Hyderabad, Andhra Pradesh 500 007, India
3 Vice Chancellor, University of Hyderabad, Hyderabad, Andhra Pradesh 500 046, India
4 Institute of Life Sciences, University of Hyderabad Campus, Hyderabad, Andhra Pradesh 500 046, India
5 Jawaharlal Nehru Centre for Advanced Scientific Research, Bangalore, Karnataka 560 064, India
Received 6 August 2008; revised 6 December 2008; accepted 10 February 2009
Published online 9 March 2009 in Wiley InterScience (www.interscience.wiley.com). DOI 10.1002/bip.21180
This article was originally published online as an accepted
preprint. The ‘‘Published Online’’ date corresponds to the
preprint version. You can request a copy of the preprint by
emailing the Biopolymers editorial office at biopolymers@wiley.
com
INTRODUCTION
The Autographa californica nuclear polyhedrosis virus
(AcNPV) encodes around 150 proteins, some of
which are involved in the regulation of expression
from viral gene promoters along with the participa-
tion of some host factors. The hyperactive polyhedrin
promoter (Ppolh) is activated by binding of polyhedrin pro-
moter binding protein (PPBP) within the basal Ppolh nucle-
Biophysical Characterization and Unfolding of LEF4 Factor of RNAPolymerase from AcNPV
Correspondence to: Seyed E. Hasnain; e-mail: [email protected] or Nasreen Z.
Ehtesham; e-mail: [email protected]
ABSTRACT:
Late expression factor 4 (LEF4) is one of the four subunits
of Autographa californica nuclear polyhedrosis virus
(AcNPV) RNA polymerase. LEF4 was overexpressed in
Escherichia coli and recombinant protein was subjected
to structural characterization. Chemical induced
unfolding of LEF4 was investigated using intrinsic
fluorescence, hydrophobic dye binding, fluorescence
quenching, and circular dichroism (CD) techniques. The
unfolding of LEF4 was found to be a non-two state,
biphasic transition. Intermediate states of LEF4 at 2M
GnHCl and 4M urea shared some common structural
features and hence may lie on the same pathway of
protein folding. Steady-state fluorescence and far-UV CD
showed that while there was considerable shift in the
wavelength of emission maximum (kmax), the secondary
structure of LEF4 intermediates at 2M GnHCl and 4M
urea remained intact. Further, temperature induced
denaturation of LEF4 was monitored using far-UV CD.
This study points to the structural stability of LEF4 under
the influence of denaturants like urea and temperature.
Although LEF4 is an interesting model protein to study
protein folding intermediates, in terms of functional
significance the robust nature of this protein might reflect
one of the several strategies adapted by the virus to
survive under very adverse environmental and
physiological conditions. # 2009 Wiley Periodicals, Inc.
Biopolymers 91: 574–582, 2009.
Keywords: LEF4; AcNPV; fluorescence quenching;
GnHCl; urea; Stern-Volmer equation
VVC 2009 Wiley Periodicals, Inc.
574 Biopolymers Volume 91 / Number 7
otide determinant.1,2 This factor participates in transcription
from very late gene promoters.3,4 The participation of Sp-like
cellular factors and involvement of TFIID-Sp protein interac-
tion in transcription regulation of polyhedrin promoter has
been reported.5,6 Guarino et al.7 identified virus-encoded
RNA polymerase complex consisting of four subunits-LEF4,
LEF8, LEF9, and P47 constituting the holoenzyme. Although
LEF4 does not show any distinct RNA polymerase sequence
motif, it is reported to harbor 50mRNA capping activity.8 It
has been found that LEF4 protein has both RNA 50-triphos-
phatase and guanylyltransferase activities in vitro.
The stability of a native protein is a function of external
variables such as pH, temperature, and solvent composition
as they disrupt different kinds of non-covalent interactions
that are important for the intrinsic stability. Therefore, analy-
sis of the role of such variables in the formation of the native
structure of a protein is a prerequisite in describing the forces
that are responsible for conformational stability. Such studies
involve monitoring of conformational changes due to pertur-
bation of a protein molecule by various agents such as guani-
dine hydrochloride (GnHCl), urea, and temperature. We
report here the biophysical characterization of recombinant
late expression factor 4 (LEF4) of AcNPV, in an attempt to
understand its structure-function relationship. This report
describes the unfolding pattern of the protein factor in the
presence of denaturants like GnHCl, urea, and temperature.
Our results based on comprehensive biophysical analysis sug-
gest that LEF4 is an unusually stable protein.
RESULTS AND DISCUSSIONThe baculovirus AcNPV very late polyhedrin protein is criti-
cal for virus dissemination and survival under adverse envi-
ronmental as well as physiological condition of the insect
host gut. This protein is transcriptionally regulated by an
RNA polymerase complex, which includes LEF4 as a subunit.
We chose to conduct biophysical studies on the purified
recombinant LEF4 to shed some light on its structural stabil-
ity. An elaborate study was performed to evaluate the confor-
mational changes associated with GnHCl and urea induced
unfolding. Thermal denaturation of LEF4 as monitored by
far-UV circular dichroism (CD) was also carried out.
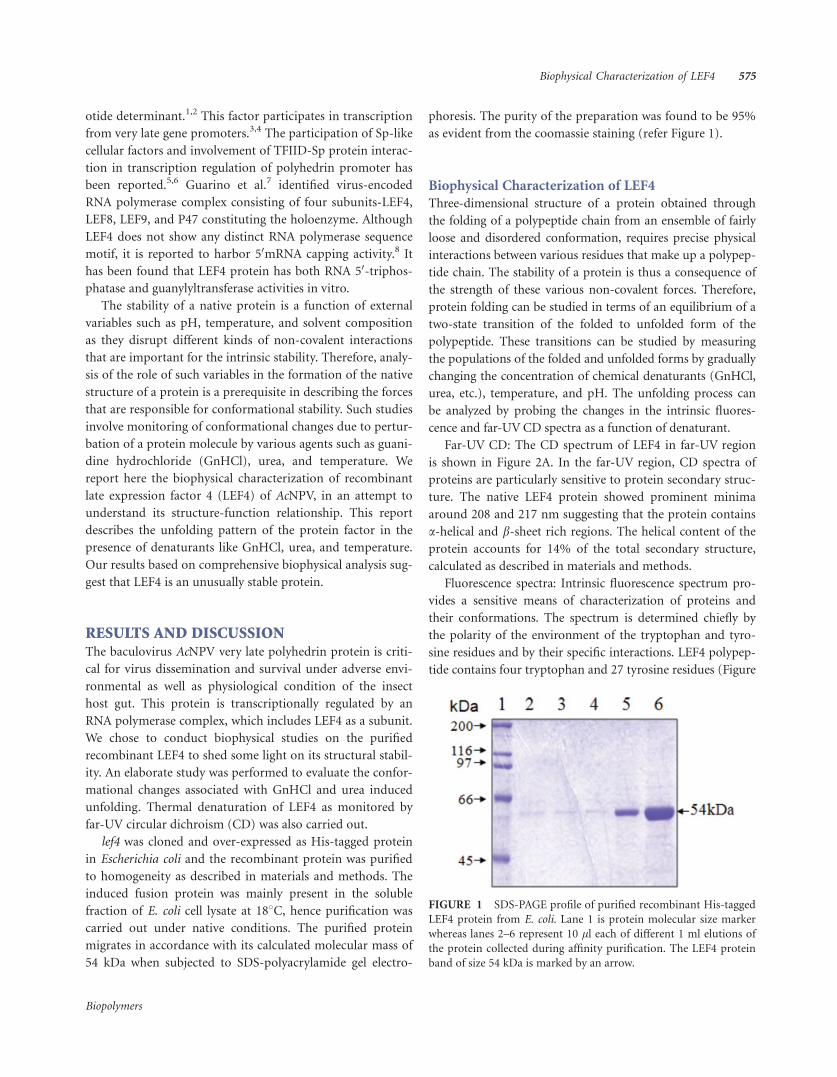
lef4 was cloned and over-expressed as His-tagged protein
in Escherichia coli and the recombinant protein was purified
to homogeneity as described in materials and methods. The
induced fusion protein was mainly present in the soluble
fraction of E. coli cell lysate at 188C, hence purification was
carried out under native conditions. The purified protein
migrates in accordance with its calculated molecular mass of
54 kDa when subjected to SDS-polyacrylamide gel electro-
phoresis. The purity of the preparation was found to be 95%
as evident from the coomassie staining (refer Figure 1).
Biophysical Characterization of LEF4
Three-dimensional structure of a protein obtained through
the folding of a polypeptide chain from an ensemble of fairly
loose and disordered conformation, requires precise physical
interactions between various residues that make up a polypep-
tide chain. The stability of a protein is thus a consequence of
the strength of these various non-covalent forces. Therefore,
protein folding can be studied in terms of an equilibrium of a
two-state transition of the folded to unfolded form of the
polypeptide. These transitions can be studied by measuring
the populations of the folded and unfolded forms by gradually
changing the concentration of chemical denaturants (GnHCl,
urea, etc.), temperature, and pH. The unfolding process can
be analyzed by probing the changes in the intrinsic fluores-
cence and far-UVCD spectra as a function of denaturant.
Far-UV CD: The CD spectrum of LEF4 in far-UV region
is shown in Figure 2A. In the far-UV region, CD spectra of
proteins are particularly sensitive to protein secondary struc-
ture. The native LEF4 protein showed prominent minima
around 208 and 217 nm suggesting that the protein contains
a-helical and b-sheet rich regions. The helical content of the
protein accounts for 14% of the total secondary structure,
calculated as described in materials and methods.
Fluorescence spectra: Intrinsic fluorescence spectrum pro-
vides a sensitive means of characterization of proteins and
their conformations. The spectrum is determined chiefly by
the polarity of the environment of the tryptophan and tyro-
sine residues and by their specific interactions. LEF4 polypep-
tide contains four tryptophan and 27 tyrosine residues (Figure
FIGURE 1 SDS-PAGE profile of purified recombinant His-tagged
LEF4 protein from E. coli. Lane 1 is protein molecular size marker
whereas lanes 2–6 represent 10 ll each of different 1 ml elutions of
the protein collected during affinity purification. The LEF4 protein
band of size 54 kDa is marked by an arrow.
Biophysical Characterization of LEF4 575
Biopolymers
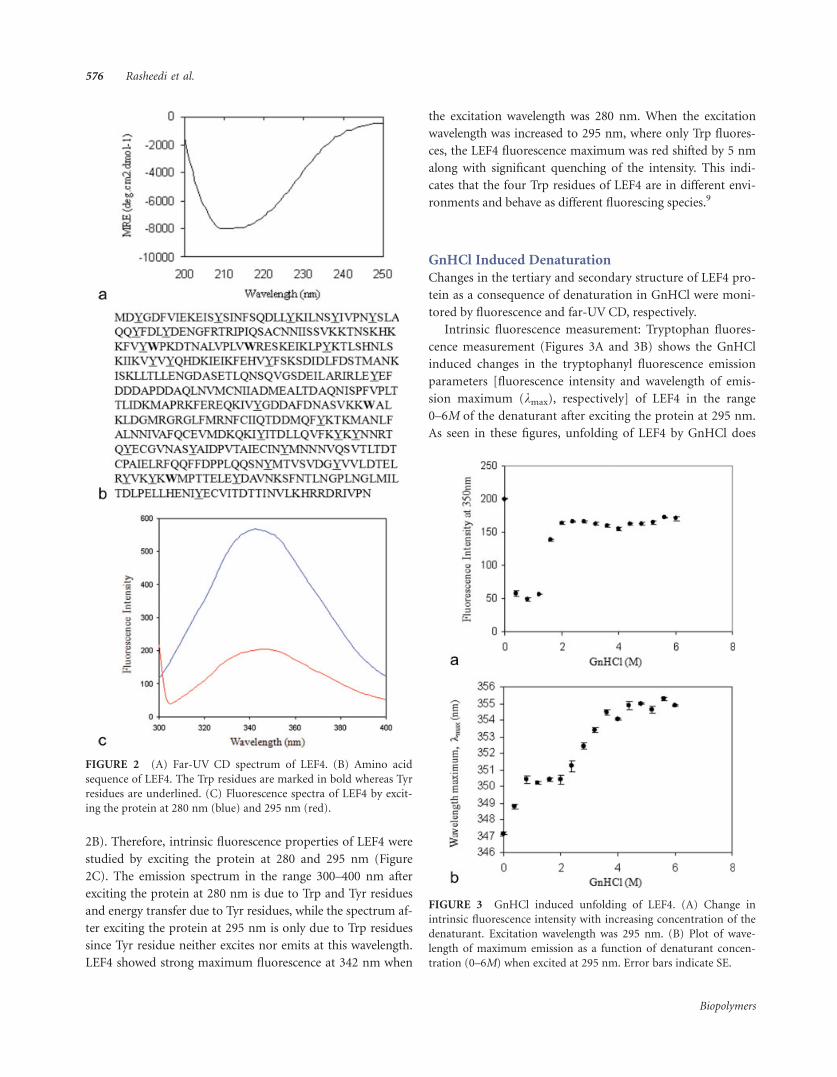
2B). Therefore, intrinsic fluorescence properties of LEF4 were
studied by exciting the protein at 280 and 295 nm (Figure
2C). The emission spectrum in the range 300–400 nm after
exciting the protein at 280 nm is due to Trp and Tyr residues
and energy transfer due to Tyr residues, while the spectrum af-
ter exciting the protein at 295 nm is only due to Trp residues
since Tyr residue neither excites nor emits at this wavelength.
LEF4 showed strong maximum fluorescence at 342 nm when
the excitation wavelength was 280 nm. When the excitation
wavelength was increased to 295 nm, where only Trp fluores-
ces, the LEF4 fluorescence maximum was red shifted by 5 nm
along with significant quenching of the intensity. This indi-
cates that the four Trp residues of LEF4 are in different envi-
ronments and behave as different fluorescing species.9
GnHCl Induced Denaturation
Changes in the tertiary and secondary structure of LEF4 pro-
tein as a consequence of denaturation in GnHCl were moni-
tored by fluorescence and far-UV CD, respectively.
Intrinsic fluorescence measurement: Tryptophan fluores-
cence measurement (Figures 3A and 3B) shows the GnHCl
induced changes in the tryptophanyl fluorescence emission
parameters [fluorescence intensity and wavelength of emis-
sion maximum (kmax), respectively] of LEF4 in the range
0–6M of the denaturant after exciting the protein at 295 nm.
As seen in these figures, unfolding of LEF4 by GnHCl does
FIGURE 2 (A) Far-UV CD spectrum of LEF4. (B) Amino acid
sequence of LEF4. The Trp residues are marked in bold whereas Tyr
residues are underlined. (C) Fluorescence spectra of LEF4 by excit-
ing the protein at 280 nm (blue) and 295 nm (red).
FIGURE 3 GnHCl induced unfolding of LEF4. (A) Change in
intrinsic fluorescence intensity with increasing concentration of the
denaturant. Excitation wavelength was 295 nm. (B) Plot of wave-
length of maximum emission as a function of denaturant concen-
tration (0–6M) when excited at 295 nm. Error bars indicate SE.
576 Rasheedi et al.
Biopolymers
not follow two-state transition. The native protein has a kmax
at 347 nm. At low GnHCl concentrations (upto �1M),
the fluorescence emission intensity is decreased along with a
�3 nm red shift. In the concentration range 1.2–2M GnHCl,
the intensity increases while no change in kmax was observed.
On the other hand, a red shift of around 4 nm from 350.4
to 354.4 nm is seen in the GnHCl concentration range of
2–3.6M. It is consistent with the exposure of tryptophan
residues to the polar environment by protein unfolding.
These results clearly suggest that the gross conformational
changes in the protein leading to unfolding followed biphasic
transition.
Since LEF4 harbors 27 tyrosyl residues distributed
throughout the polypeptide chain, we investigated the tyrosyl
fluorescence to get additional insight into the structural fea-
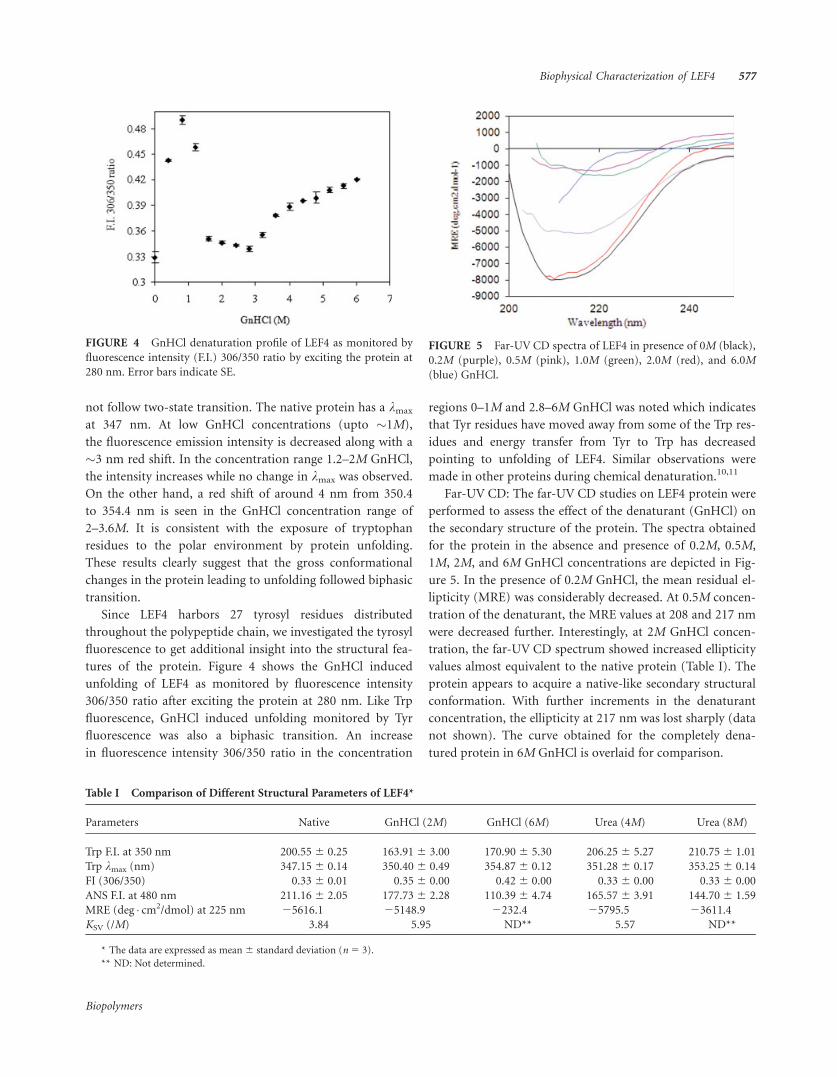
tures of the protein. Figure 4 shows the GnHCl induced
unfolding of LEF4 as monitored by fluorescence intensity
306/350 ratio after exciting the protein at 280 nm. Like Trp
fluorescence, GnHCl induced unfolding monitored by Tyr
fluorescence was also a biphasic transition. An increase
in fluorescence intensity 306/350 ratio in the concentration
regions 0–1M and 2.8–6M GnHCl was noted which indicates
that Tyr residues have moved away from some of the Trp res-
idues and energy transfer from Tyr to Trp has decreased
pointing to unfolding of LEF4. Similar observations were
made in other proteins during chemical denaturation.10,11
Far-UV CD: The far-UV CD studies on LEF4 protein were
performed to assess the effect of the denaturant (GnHCl) on
the secondary structure of the protein. The spectra obtained
for the protein in the absence and presence of 0.2M, 0.5M,
1M, 2M, and 6M GnHCl concentrations are depicted in Fig-
ure 5. In the presence of 0.2M GnHCl, the mean residual el-
lipticity (MRE) was considerably decreased. At 0.5M concen-
tration of the denaturant, the MRE values at 208 and 217 nm
were decreased further. Interestingly, at 2M GnHCl concen-
tration, the far-UV CD spectrum showed increased ellipticity
values almost equivalent to the native protein (Table I). The
protein appears to acquire a native-like secondary structural
conformation. With further increments in the denaturant
concentration, the ellipticity at 217 nm was lost sharply (data
not shown). The curve obtained for the completely dena-
tured protein in 6M GnHCl is overlaid for comparison.
FIGURE 4 GnHCl denaturation profile of LEF4 as monitored by
fluorescence intensity (F.I.) 306/350 ratio by exciting the protein at
280 nm. Error bars indicate SE.
FIGURE 5 Far-UV CD spectra of LEF4 in presence of 0M (black),
0.2M (purple), 0.5M (pink), 1.0M (green), 2.0M (red), and 6.0M
(blue) GnHCl.
Table I Comparison of Different Structural Parameters of LEF4*
Parameters Native GnHCl (2M) GnHCl (6M) Urea (4M) Urea (8M)
Trp F.I. at 350 nm 200.556 0.25 163.916 3.00 170.906 5.30 206.25 6 5.27 210.756 1.01
Trp kmax (nm) 347.156 0.14 350.406 0.49 354.876 0.12 351.28 6 0.17 353.256 0.14
FI (306/350) 0.33 6 0.01 0.356 0.00 0.42 6 0.00 0.33 6 0.00 0.33 6 0.00
ANS F.I. at 480 nm 211.166 2.05 177.736 2.28 110.396 4.74 165.57 6 3.91 144.706 1.59
MRE (deg � cm2/dmol) at 225 nm 25616.1 25148.9 2232.4 25795.5 23611.4
KSV (/M) 3.84 5.95 ND** 5.57 ND**
* The data are expressed as mean6 standard deviation (n5 3).
** ND: Not determined.
Biophysical Characterization of LEF4 577
Biopolymers
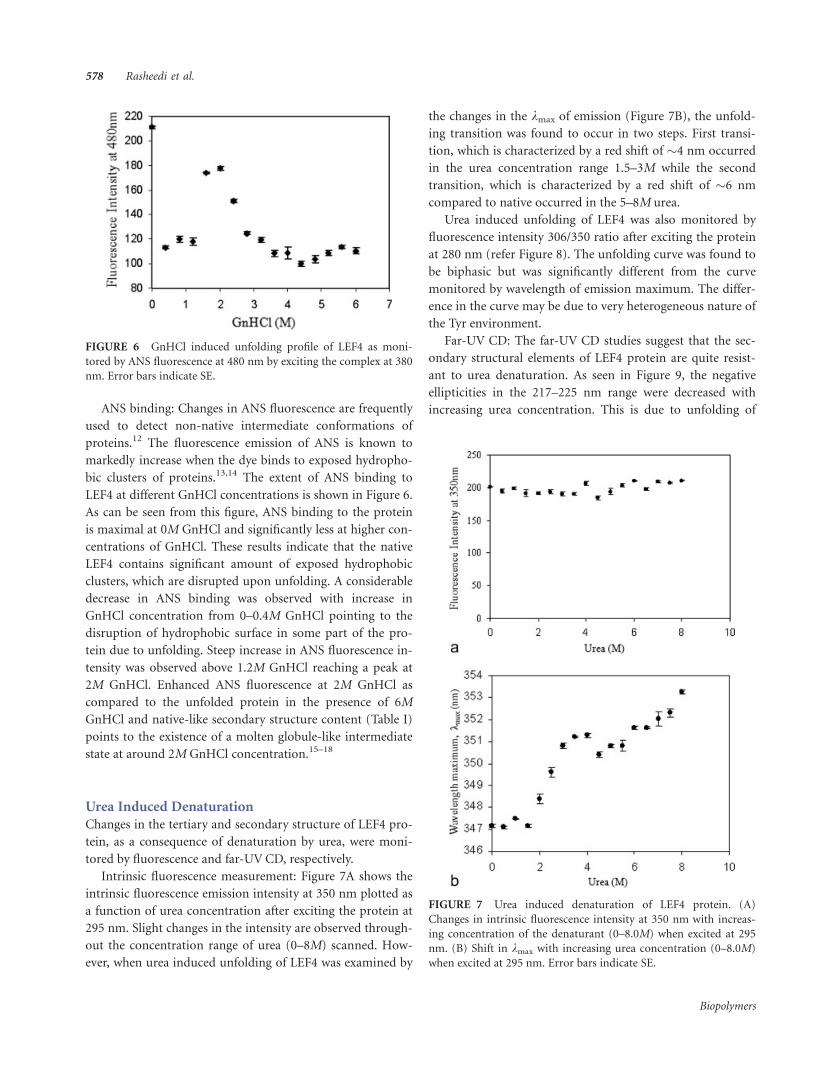
ANS binding: Changes in ANS fluorescence are frequently
used to detect non-native intermediate conformations of
proteins.12 The fluorescence emission of ANS is known to
markedly increase when the dye binds to exposed hydropho-
bic clusters of proteins.13,14 The extent of ANS binding to
LEF4 at different GnHCl concentrations is shown in Figure 6.
As can be seen from this figure, ANS binding to the protein
is maximal at 0M GnHCl and significantly less at higher con-
centrations of GnHCl. These results indicate that the native
LEF4 contains significant amount of exposed hydrophobic
clusters, which are disrupted upon unfolding. A considerable
decrease in ANS binding was observed with increase in
GnHCl concentration from 0–0.4M GnHCl pointing to the
disruption of hydrophobic surface in some part of the pro-
tein due to unfolding. Steep increase in ANS fluorescence in-
tensity was observed above 1.2M GnHCl reaching a peak at
2M GnHCl. Enhanced ANS fluorescence at 2M GnHCl as
compared to the unfolded protein in the presence of 6M
GnHCl and native-like secondary structure content (Table I)
points to the existence of a molten globule-like intermediate
state at around 2M GnHCl concentration.15–18
Urea Induced Denaturation
Changes in the tertiary and secondary structure of LEF4 pro-
tein, as a consequence of denaturation by urea, were moni-
tored by fluorescence and far-UV CD, respectively.
Intrinsic fluorescence measurement: Figure 7A shows the
intrinsic fluorescence emission intensity at 350 nm plotted as
a function of urea concentration after exciting the protein at
295 nm. Slight changes in the intensity are observed through-
out the concentration range of urea (0–8M) scanned. How-
ever, when urea induced unfolding of LEF4 was examined by
the changes in the kmax of emission (Figure 7B), the unfold-
ing transition was found to occur in two steps. First transi-
tion, which is characterized by a red shift of �4 nm occurred
in the urea concentration range 1.5–3M while the second
transition, which is characterized by a red shift of �6 nm
compared to native occurred in the 5–8M urea.
Urea induced unfolding of LEF4 was also monitored by
fluorescence intensity 306/350 ratio after exciting the protein
at 280 nm (refer Figure 8). The unfolding curve was found to
be biphasic but was significantly different from the curve
monitored by wavelength of emission maximum. The differ-
ence in the curve may be due to very heterogeneous nature of
the Tyr environment.
Far-UV CD: The far-UV CD studies suggest that the sec-
ondary structural elements of LEF4 protein are quite resist-
ant to urea denaturation. As seen in Figure 9, the negative
ellipticities in the 217–225 nm range were decreased with
increasing urea concentration. This is due to unfolding of
FIGURE 6 GnHCl induced unfolding profile of LEF4 as moni-
tored by ANS fluorescence at 480 nm by exciting the complex at 380
nm. Error bars indicate SE.
FIGURE 7 Urea induced denaturation of LEF4 protein. (A)
Changes in intrinsic fluorescence intensity at 350 nm with increas-
ing concentration of the denaturant (0–8.0M) when excited at 295
nm. (B) Shift in kmax with increasing urea concentration (0–8.0M)
when excited at 295 nm. Error bars indicate SE.
578 Rasheedi et al.
Biopolymers
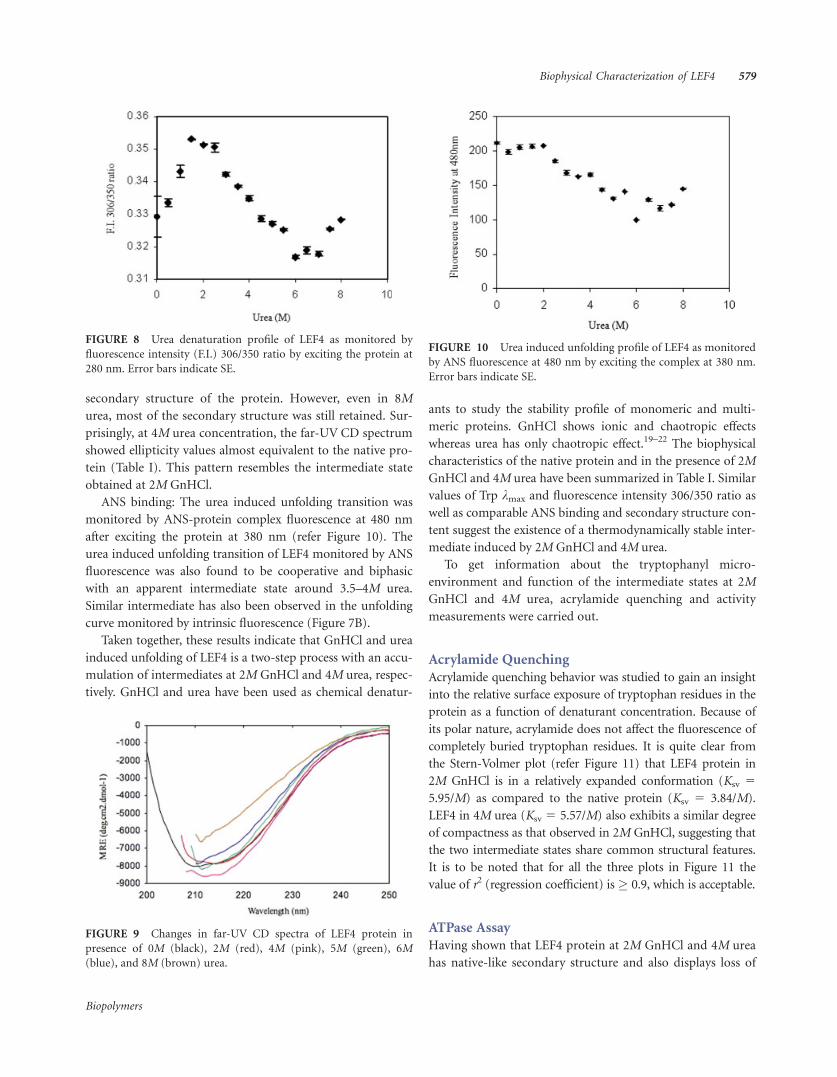
secondary structure of the protein. However, even in 8M
urea, most of the secondary structure was still retained. Sur-
prisingly, at 4M urea concentration, the far-UV CD spectrum
showed ellipticity values almost equivalent to the native pro-
tein (Table I). This pattern resembles the intermediate state
obtained at 2M GnHCl.
ANS binding: The urea induced unfolding transition was
monitored by ANS-protein complex fluorescence at 480 nm
after exciting the protein at 380 nm (refer Figure 10). The
urea induced unfolding transition of LEF4 monitored by ANS
fluorescence was also found to be cooperative and biphasic
with an apparent intermediate state around 3.5–4M urea.
Similar intermediate has also been observed in the unfolding
curve monitored by intrinsic fluorescence (Figure 7B).
Taken together, these results indicate that GnHCl and urea
induced unfolding of LEF4 is a two-step process with an accu-
mulation of intermediates at 2M GnHCl and 4M urea, respec-
tively. GnHCl and urea have been used as chemical denatur-
ants to study the stability profile of monomeric and multi-
meric proteins. GnHCl shows ionic and chaotropic effects
whereas urea has only chaotropic effect.19–22 The biophysical
characteristics of the native protein and in the presence of 2M
GnHCl and 4M urea have been summarized in Table I. Similar
values of Trp kmax and fluorescence intensity 306/350 ratio as
well as comparable ANS binding and secondary structure con-
tent suggest the existence of a thermodynamically stable inter-
mediate induced by 2M GnHCl and 4M urea.
To get information about the tryptophanyl micro-
environment and function of the intermediate states at 2M
GnHCl and 4M urea, acrylamide quenching and activity
measurements were carried out.
Acrylamide Quenching
Acrylamide quenching behavior was studied to gain an insight
into the relative surface exposure of tryptophan residues in the
protein as a function of denaturant concentration. Because of
its polar nature, acrylamide does not affect the fluorescence of
completely buried tryptophan residues. It is quite clear from
the Stern-Volmer plot (refer Figure 11) that LEF4 protein in
2M GnHCl is in a relatively expanded conformation (Ksv 5
5.95/M) as compared to the native protein (Ksv 5 3.84/M).
LEF4 in 4M urea (Ksv 5 5.57/M) also exhibits a similar degree
of compactness as that observed in 2M GnHCl, suggesting that
the two intermediate states share common structural features.
It is to be noted that for all the three plots in Figure 11 the
value of r2 (regression coefficient) is � 0.9, which is acceptable.
ATPase Assay
Having shown that LEF4 protein at 2M GnHCl and 4M urea
has native-like secondary structure and also displays loss of
FIGURE 8 Urea denaturation profile of LEF4 as monitored by
fluorescence intensity (F.I.) 306/350 ratio by exciting the protein at
280 nm. Error bars indicate SE.
FIGURE 9 Changes in far-UV CD spectra of LEF4 protein in
presence of 0M (black), 2M (red), 4M (pink), 5M (green), 6M
(blue), and 8M (brown) urea.
FIGURE 10 Urea induced unfolding profile of LEF4 as monitored
by ANS fluorescence at 480 nm by exciting the complex at 380 nm.
Error bars indicate SE.
Biophysical Characterization of LEF4 579
Biopolymers
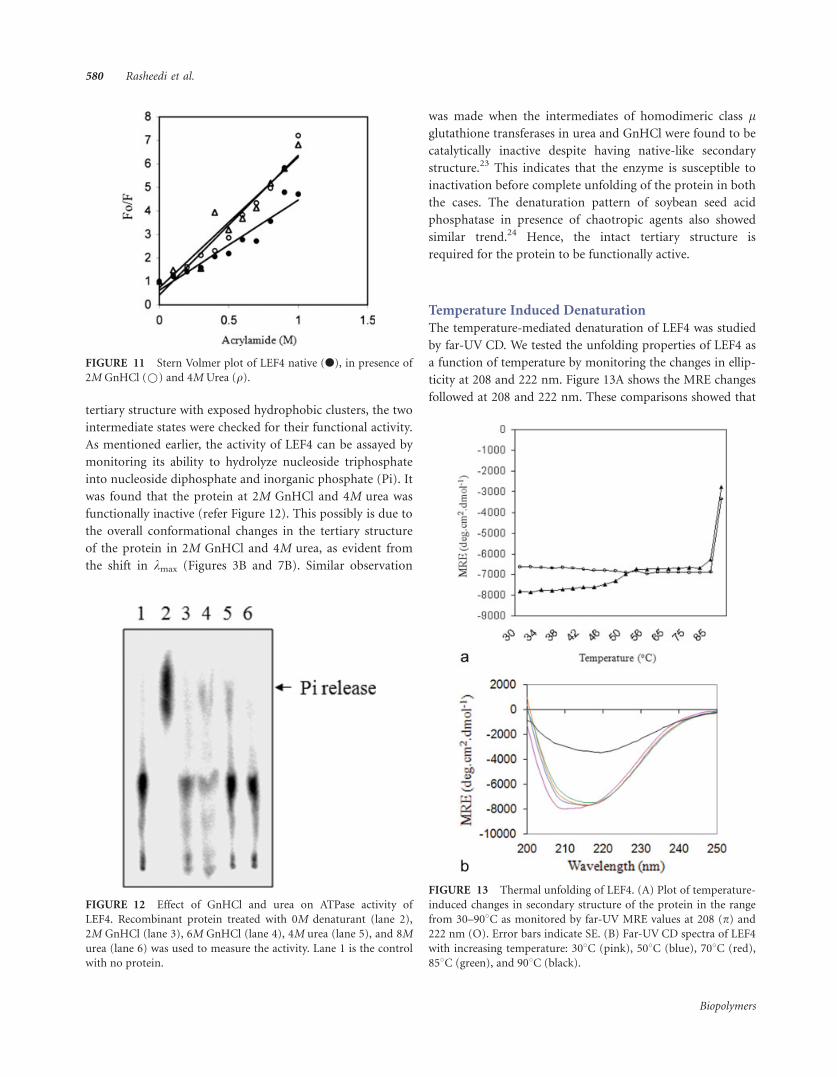
tertiary structure with exposed hydrophobic clusters, the two
intermediate states were checked for their functional activity.
As mentioned earlier, the activity of LEF4 can be assayed by
monitoring its ability to hydrolyze nucleoside triphosphate
into nucleoside diphosphate and inorganic phosphate (Pi). It
was found that the protein at 2M GnHCl and 4M urea was
functionally inactive (refer Figure 12). This possibly is due to
the overall conformational changes in the tertiary structure
of the protein in 2M GnHCl and 4M urea, as evident from
the shift in kmax (Figures 3B and 7B). Similar observation
was made when the intermediates of homodimeric class lglutathione transferases in urea and GnHCl were found to be
catalytically inactive despite having native-like secondary
structure.23 This indicates that the enzyme is susceptible to
inactivation before complete unfolding of the protein in both
the cases. The denaturation pattern of soybean seed acid
phosphatase in presence of chaotropic agents also showed
similar trend.24 Hence, the intact tertiary structure is
required for the protein to be functionally active.
Temperature Induced Denaturation
The temperature-mediated denaturation of LEF4 was studied
by far-UV CD. We tested the unfolding properties of LEF4 as
a function of temperature by monitoring the changes in ellip-
ticity at 208 and 222 nm. Figure 13A shows the MRE changes
followed at 208 and 222 nm. These comparisons showed that
FIGURE 11 Stern Volmer plot of LEF4 native (l), in presence of
2M GnHCl (*) and 4M Urea (q).
FIGURE 12 Effect of GnHCl and urea on ATPase activity of
LEF4. Recombinant protein treated with 0M denaturant (lane 2),
2M GnHCl (lane 3), 6M GnHCl (lane 4), 4M urea (lane 5), and 8M
urea (lane 6) was used to measure the activity. Lane 1 is the control
with no protein.
FIGURE 13 Thermal unfolding of LEF4. (A) Plot of temperature-
induced changes in secondary structure of the protein in the range
from 30–908C as monitored by far-UV MRE values at 208 (p) and222 nm (O). Error bars indicate SE. (B) Far-UV CD spectra of LEF4
with increasing temperature: 308C (pink), 508C (blue), 708C (red),
858C (green), and 908C (black).
580 Rasheedi et al.
Biopolymers
the protein resists unfolding along a wide range of tempera-
ture. No significant change was observed even upto 858C sug-
gesting that LEF4 is a considerably thermostable protein. Visi-
ble aggregates of the protein were observed at temperature
above 858C with a sharp decrease in the MRE. This decrease
in MRE values may be a reflection of reduced protein concen-
tration due to visible precipitation at this temperature. The
corresponding far-UV CD spectra are shown in Figure 13B.
The spectrum at 858C is almost similar to the native protein
spectrum at 258C with the 208 nm ellipticity slightly decreased
indicating the thermostable nature of this protein.
CONCLUSIONThe results presented in this study have increased our knowl-
edge of the partially folded intermediate states of LEF4 protein
thereby pointing to the use of the viral coded LEF4 protein as
a model to study protein folding intermediates. LEF4 is appa-
rently a very stable protein as far as its conformation is con-
cerned. It resists total structural changes in the presence of
chemical denaturants like urea. It also resists temperature
induced unfolding. During the very late gene expression when
polyhedrin is over transcribed (representing over 50% of the
total cell protein) the polh transcription machinery necessarily
has to be very robust to bring about rapid rounds of transcrip-
tion within a very short time. The extreme stability of LEF4
will naturally be very useful in such situations. Several exam-
ples are known in biological system where a single protein per-
forms more than one unrelated functions in the cell. BV/ODV-
E26 is one such viral protein that is reported to be present in
different functional states in AcNPV infected cell and hence is
described as a multifunctional protein factor.25 The possibility
of LEF4 participating in tasks other than transcription, there-
fore, is highly conceivable. Given the fact that lef4 expression
overlaps with the time the virus prepares itself for occlusion, it
may possibly have a role in protecting the virus from any kind
of stress. The robust nature of this protein might reflect one of
the many tools adapted by the virus to survive under very
adverse environment. Therefore, it is likely that LEF4 is one of
the several protein factors that acquire additional functions to
assist the viruses for their survival in host free environment.
MATERIALS AND METHODS
MaterialsGnHCl was purchased from USB whereas urea was from Sigma
Aldrich. Very high purity acrylamide was obtained from USB. 8-
Anilino-1-naphthalenesulphonic acid (ANS) was purchased from
Sigma-Aldrich. All other reagents were of high quality grade.
Cloning of lef4 ORF in Expression VectorPolymerase chain reaction (PCR) was performed by adding 50 ng of
Bacmid (from Gibco BRL) as template to a 50 ll of total reactioncontaining 100 ng each of forward and reverse primers (FP:
cttGGATCCatggactacggcgattttgtg; RP: ttcCTCGAGttaatttggcac-
gattcggtc), 0.2 mM dNTPs (Amersham Pharmacia) and 0.1 U of Accu
DNA polymerase (Sigma Aldrich). PCR consisted of initial denatura-
tion step at 948C for 5 min followed by repeated steps (10 cycles) of
denaturation at 948C for 60 s, annealing at 508C for 60 s and poly-
merization at 688C for 3 min, followed by 25 cycles of denaturation
at 948C for 60 s, annealing at 608C for 60 s and polymerization at
688C for 3 min. Final extension was carried out at 688C for 7 min.
PCR amplified product was ligated in the pBSK1 vector (Stratagene)
linearized with SmaI. The lef4 gene was excised from pBSK1 using
BamHI and XhoI and subcloned under T7 promoter into pET28a
(Invitrogen) vector that was linearized with same restriction enzymes.
Expression and Purification of Recombinant LEF4
from E. colilef4 ORF was expressed under T7 promoter in pET28a using Bl21
(DE3) cells and 0.1 mM IPTG at 188C for 24 h. The induced culture
was then harvested and the cell pellet resuspended in extraction
buffer [20 mM Tris (pH 8.0) and 300 mM NaCl] and sonicated. The
lysed cells were centrifuged at 13000 rpm for 20 min. Recombinant
protein was found predominantly in the soluble fraction; hence the
supernatant was absorbed to the TALON affinity resin (Clontech)
pre-equilibrated with the same buffer. Washes were given with
10 mM imidazole in extraction buffer. The His-tagged protein was
eluted with 200 mM imidazole in the same buffer. Finally, the puri-
fied protein was dialyzed against 20 mM Tris (pH 8.0) and 100 mM
NaCl and used for fluorescence and CD studies. All the measure-
ments were recorded at 258C.
Fluorescence MeasurementsAll fluorescence measurements were carried out on a Cary Eclipse
Fluorescence Spectrophotometer. The concentration of LEF4 used
was in the range 0.46–1.84 mM. Cuvette pathlength of 1 cm was
used for fluorescence studies. For intrinsic tryptophan fluorescence,
the excitation wavelength was set at 280 and 295 nm and the emis-
sion spectra recorded in the range of 300–400 nm with 5 and 10 nm
slit widths for excitation and emission, respectively. Binding of ANS
to LEF4 at various denaturant concentrations was studied by excit-
ing the dye at 380 nm and the emission spectra were recorded from
400–600 nm with 10 nm slit width for excitation and emission. The
molar ratio of protein and ANS was 1:100. The error bars in the
plots represent standard error (SE) of mean for three to four inde-
pendent measurements.
CD MeasurementsCD measurements were carried out on a Jasco J-810 spectropo-
larimeter. MRE was calculated as shown by Hackeng et al.26 using
following equation:
MRE ¼ hobs=n 3 l 3 c 3 10
where yobs is observed ellipticity in millidegrees, n is number of
aminoacid residues, l is pathlength in centimeters, and c is molar
Biophysical Characterization of LEF4 581
Biopolymers
concentration. Each spectrum was recorded as an average of five
scans. The far-UV CD spectra were recorded at 200–250 nm wave-
length at a concentration of 3.70 mM in a 1 mm pathlength cuvette.
The values obtained were normalized by subtracting the baseline
recorded for the buffer having same concentration of denaturant
under similar conditions. The percent a-helix was obtained by the
method of Chen et al.27 according to the following equation:
% a-helix ¼ MRE222 � 2340
303003 100
GnHCl/Urea Induced DenaturationUnfolding of LEF4 in the presence of the denaturants was studied
by fluorescence and far-UV CD. Increasing amounts of the fresh
stock solutions (8M GnHCl or 10M Urea) were added to a fixed
concentration of protein in 20 mM Tris (pH 8.0) and 100 mM NaCl
and allowed to equilibrate for 6 h at 258C before recording the
spectra.
Acrylamide QuenchingQuenching of intrinsic tryptophan fluorescence was performed on a
Cary Eclipse Fluorescence Spectrophotometer using a stock solution
of 5M acrylamide. To a fixed amount (1.84 mM) of protein, increas-
ing amounts of acrylamide (0.1–1.0M) were added and the samples
were incubated for 30 min prior to taking the fluorescence measure-
ments. For the intrinsic tryptophan fluorescence spectra, the protein
samples were excited at 295 nm and emission recorded at 344 nm.
The data obtained were analyzed according to the Stern-Volmer
equation.28
Thermal StabilityChanges in the secondary structure of LEF4 with increase in temper-
ature were measured using CD. These measurements were carried
out using a thermostatically controlled cell holder, in a temperature
range of 25–908C with an increment of 5 6 0.108C. The sample was
first equilibrated for at least 15 min at a particular temperature
before an emission spectrum was collected.
ATPase AssayReaction was carried out at 308C for 15 min in a final volume of
5 ll containing 50 mM Tris-HCl (pH 7.8), 5 mM DTT, 1 mM
MnCl2, 50 mM KCl, [c232P]ATP (0.02 lCi), and purified recombi-
nant LEF4 (25 nM); 1 ll of the sample was spotted on poly-
ethyleneimine cellulose TLC plate and run in 0.75M potassium
phosphate buffer (pH 3.6). The intensity of the fastest moving spot
corresponding to inorganic phosphate (Pi) was analyzed using
‘‘Image Quant’’ software.
S.R. was recipient of Senior Research Fellowship from the Council
of Scientific and Industrial Research (CSIR), Government of India.
We are thankful to Basir Ahmad for his help in the data analysis. We
also acknowledge the help provided by Jisha Chalissery in perform-
ing the ATPase assay.
REFERENCES1. Burma, S.; Mukherjee, B.; Jain, A.; Habib, S.; Hasnain, S. E. J
Biol Chem 1994, 269, 2750–2757.
2. Mukherjee, B.; Burma, S.; Hasnain, S. E. J Biol Chem 1995, 270,
4405–4411.
3. Ghosh, S.; Jain, A.; Mukherjee, B.; Habib, S.; Hasnain, S. E. J
Virol 1998, 72, 7484–7493.
4. Jain, A.; Hasnain, S. E. Eur J Biochem 1996, 239, 384–390.
5. Ramachandran, A.; Jain, A.; Arora, P.; Bashyam, M. D.; Chatter-
jee, U.; Ghosh, S.; Parnaik, V. K.; Hasnain, S. E. J Biol Chem
2001, 276, 23440–23449.
6. Rasheedi, S.; Ramachandran, A.; Ehtesham, N. Z.; Hasnain, S.
E. Arch Virol 2007, 152, 1819–1828.
7. Guarino, L. A.; Xu, B.; Jin, J.; Dong, W. J Virology 1998, 72,
7985–7991.
8. Gross, C. H.; Shuman, S. J Virology 1998, 72, 10020–10028.
9. Bell, J. E.; Dalziel, K. Biochim Biophys Acta 1975, 410, 243–251.
10. Sanchez del Pino, M. M.; Fersht, A. R. Biochemistry 1997, 36,
5560–5565.
11. Ahmad, B.; Ankita Khan, R. H. Arch Biochem Biophys 2005,
437, 159–167.
12. Semisotnov, G. V.; Rodionova, N. A.; Razgulyaev, O. I.; Uversky,
V. N.; Gilmanshin, R. Biopolymers 1991, 31, 119–128.
13. Ahmad, B.; Ansari, M. A.; Sen, P.; Khan, R. H. Biopolymers
2006, 81, 350–359.
14. Haq, S. K.; Rasheedi, S.; Khan, R. H. Eur J Biochem 2002, 269,
47–52.
15. Gast, K.; Siemer, A.; Zirwer, D.; Damaschun, G. Eur Biophys J
2001, 30, 273–283.
16. Bychkova, V. E.; Berni, R.; Rossi, G. L.; Kutyshenko, V. P.; Ptit-
syn, O. B. Biochemistry 1992, 31, 7566–7571.
17. Goto, Y.; Fink, A. L. Biochemistry 1989, 28, 945–952.
18. Kuwajima, K. Proteins 1989, 6, 87–103.
19. Pace, C. N. Methods Enzymol 1986, 131, 266–280.
20. Monera, O. D.; Kay, C. M.; Hodges, R. S. Protein Sci 1994, 3,
1984–1991.
21. Kohn, W. D.; Kay, C. M.; Hodges, R. S. Protein Sci 1995, 4, 237–
250.
22. Kohn, W. D.; Monera, O. P.; Kay, C. M.; Hodges, R. S. J Biol
Chem 1995, 270, 25495–25506.
23. Hornby, J. A.; Luo, J. K.; Stevens, J. M.; Wallace, L. A.; Kaplan,
W.; Armstrong, R. N.; Dirr, H. W. Biochemistry 2000, 39,
12336–12344.
24. Cavagis, A. D. M.; Granjeiro, P. A.; Ferreira, C. V.; Aoyama, H.
Phytochemistry 2004, 65, 831–836.
25. Burks, J. K.; Summers, M. D.; Braunagel, S. C. Virology 2007,
361, 194–203.
26. Hackeng, T. M.; Fernandez, J. A.; Dawson, P. E.; Kent, S. B. H.;
Griffin, J. H. Proc Natl Acad Sci USA 2000, 97, 14074–14078.
27. Chen, Y. H.; Yang, J. T.; Martinez, H. M. Biochemistry 1972, 11,
4120–4131.
28. Pawar, S. A.; Deshpande, V. V. Eur J Biochem 2000, 267, 6331–
6338.
Reviewing Editor: Alfred Wittinghofer
582 Rasheedi et al.
Biopolymers


