Embed Size (px)
Citation preview

A biophysical model of an inner hair cella)
David G. Zeddiesb)
Northwestern University Institute for Neuroscience and Hugh Knowles Center, Frances Searle Building,Northwestern University, Evanston, Illinois 60208-3550
Jonathan H. Siegelc)
Northwestern University Institute for Neuroscience, Communication Sciences and Disorders, Audiology andHearing Sciences, Frances Searle Building, Northwestern University, Evanston, Illinois 60208-3550
~Received 2 July 2003; accepted for publication 5 April 2004!
Whole-cell patch-clamp recordings on isolated inner hair cells~IHCs! of guinea pig cochleae haverevealed the presence of voltage-gated potassium channels. A biophysical model of an IHC ispresented that indicates activation of slow voltage-gated potassium channels may lead to receptorpotentials whose dc component decreases during the stimulus, and membrane potentialhyperpolarizes when the stimulus is turned off. Both the decreasing dc and the hyperpolarizationare, respectively, consistent with rapid adaptation and suppression of spontaneous rate in theauditory nerve. Receptor potentials recordedin vivo do not show these features, and when anonspecific leak is included in the model to simulate microelectrode impalement, the model’sreceptor potentials become similar to thosein vivo. The nonspecific leak creates an electrical shuntthat masks slow channel activity and allows the cell to depolarize. Both the decreasing dc and thehyperpolarization are sensitive to the resting potential. Because the reported resting potentialsinvivo andin vitro differ greatly, the model is used to investigate homeostatic mechanisms responsiblefor the resting potential. It is found that the voltage-gated potassium channels have the greatestinfluence on the resting potential, but that the standing transducer current may be sufficient toeliminate the decreasing dc and after-stimulus hyperpolarization. ©2004 Acoustical Society ofAmerica. @DOI: 10.1121/1.1755237#
PACS numbers: 43.64.Bt, 43.64.Ld, 43.64.Wn@WPS# Pages: 426–441
ahs-d,gio
K
et
-mizeve
f
i-res-
eionre-to
theaythe
l tonelstheand
theen-
r-ac-
ned
nda-
l oinnc
s i-
o
I. INTRODUCTION
Receptor potentials recorded in guinea pig inner hcells ~IHCs! in vivo have a constant dc component througout the response~Russell and Sellick, 1983; Cody and Rusell, 1987! and show little, if any, evidence of voltage-gateion channel activity ~Russell and Sellick, 1983; Dallos1984!. On the other hand, whole-cell patch-clamp recordinon isolated guinea pig IHCs clearly show voltage-gatedchannel activity ~Kros and Crawford, 1990; Kroset al.,1998; Raybouldet al., 2001!. Kros and Crawford~1990!characterized two distinct populations of voltage-gated1
channels: one with extremely fast gating kinetics~t,1 ms!and the other with somewhat slower kinetics~2 ms,t,10ms!. Here, we create a biophysical model of an IHC, basprimarily on Kros and Crawford’s~1990! data, and show thathe gating of the slower K1 channels may cause the dc component of the receptor potential to decrease during the stilus and the membrane potential to become hyperpolarfollowing the stimulus. Because the receptor potential drithe synapse, the decreasing dc and the hyperpolarization
a!Portions of this work were presented in ‘‘A physiologically based modethe inner hair cell,’’ Midwinter Meeting of the Association for ResearchOtolaryngology, St. Petersburg Beach, FL, February 1995, and ‘‘Influeof the basolateral membrane on the development of receptor potentialsimulated inner hair cell,’’ Midwinter Meeting of the Association for research in Otolaryngology, St. Petersburg Beach, FL, February 1996.
b!Current address: Center for Comparative and Evolutionary BiologyHearing, University of Maryland, College Park, MD 20742.
c!Electronic mail: [email protected]
426 J. Acoust. Soc. Am. 116 (1), July 2004 0001-4966/2004/
ir-
sn
d
u-dsol-
lowing the stimulus may contribute to the well-known audtory nerve phenomena adaptation and after-stimulus suppsion of the spontaneous rate~see, e.g., Kianget al., 1965!.
If the activity of the slow K1 channels does contributto auditory nerve phenomena then we must explain whychannel activity is not evident in the receptor potentialscordedin vivo. To do so, we include a leak in the modelsimulate the microelectrode impalement that occurs in theinvivo studies. We find that the leak appears to account fordifferences, but we also find that multiple mechanisms mbe operating. The most obvious is that the leak obscuresactivity of the voltage-gated channels~i.e., shunting!, but aless obvious mechanism is that the leak allows the celdepolarize to a potential where the voltage-gated chanare activated and no longer affect the receptor potential insame manner. Indeed, we find that the decreasing dcafter-stimulus hyperpolarization are very sensitive tostarting potential of the cell and therefore the resting pottial could determine whether or not they occur.
Although the resting potential could be of great impotance to the development of the receptor potentials, thetual resting potential of IHCs is not known.In vivo measure-ments place the IHC resting potential in the range of230 to240 mV ~e.g., Cody and Russell, 1987; Dallos, 1985!,whereas the resting potentials of guinea pig IHCs determiin vitro in patch-clamp experiments are closer to260 mV~Kros and Crawford, 1990; Gitter and Zenner, 1990; aDulon et al., 1995!. All of these experiments perturb mechnisms directly responsible for the resting potential.In vitro
f
en a
f
116(1)/426/16/$20.00 © 2004 Acoustical Society of America
nelsig
t
eN
ete
entolt
picoeC
ia
th
is
ner
eaini
er
-e
nd
on
calo-
cal-
to
dy
of
em-ined,l toem-thethet isgle
experiments remove the IHC from its native environmeand the isolation process may damage transducer channthe stereocilia. The isolated cells are kept in a bath of h@Na1# which does not reflect thein vivo state where theapical end of the cell is exposed to high@K1# and an elec-trical potential. Therefore the standing transducer currenan isolated IHC is expected to be quite different than it isinvivo; the magnitude is likely to be diminished and if thtransducer channels are open they carry a much larger1
current than they wouldin vivo. The whole-cell patch-clampmethod itself can also affect the resting potential. The pipfilling solution diffuses into the cell and artificially sets thintracellular ionic concentrations~Marty and Neher, 1983!.While the in vivo experiments are less likely to impair thtransducer or disturb the cell’s normal ionic environmeusing sharp microelectrodes introduces a leak in the baseral membrane that can depolarize the cell and run downionic gradients.
What is the likely resting potentialin vivo? Owing to thenonlinear nature of the cellular components~transducer,voltage-gated channels, and Na1/K1 pumps! the effects ofmeasuring the potential with microelectrodes cannot simbe subtracted out. For this reason a nonlinear biophysmodel that can keep track of relevant currents and ionic ccentrations was created to explore the interactions betwmechanisms that influence the resting potential of the IH
II. METHODS
A. In vivo environment of IHCs
To model the IHC we must take into account its peculionic environment~see Slepecky, 1996 for review!. In vivo,the basolateral membrane of the cell is bathed incerebrospinal-like fluid~low @K1# and high @Na1#), peri-lymph, that fills scala tympani. The apical end of the cellexposed to the intracellular-like~high @K1# and low@Na1#)endolymph of scala media. In addition to the ionic concetration differences there is also an electrical potential diffence such that endolymph is about185 mV relative to peri-lymph. This electrical potential is known as the endocochlpotential~EP!. A number of studies have been conductedefforts to measure the magnitude of the EP and to determthe ionic concentrations of mammalian endolymph and plymph. The compiled results~Salt and Konishi, 1986! arelisted in Table I.
Although the intracellular ionic concentrations in mammalian hair cells are not well established, there is someperimental evidence available for the K1 gradient. Anniko,Lim, and Wroblewski ~1984! report that the cytoplasmicK1/Na1 is 20:1 in IHCs that have been shock frozen ameasured by x-ray microanalysis.
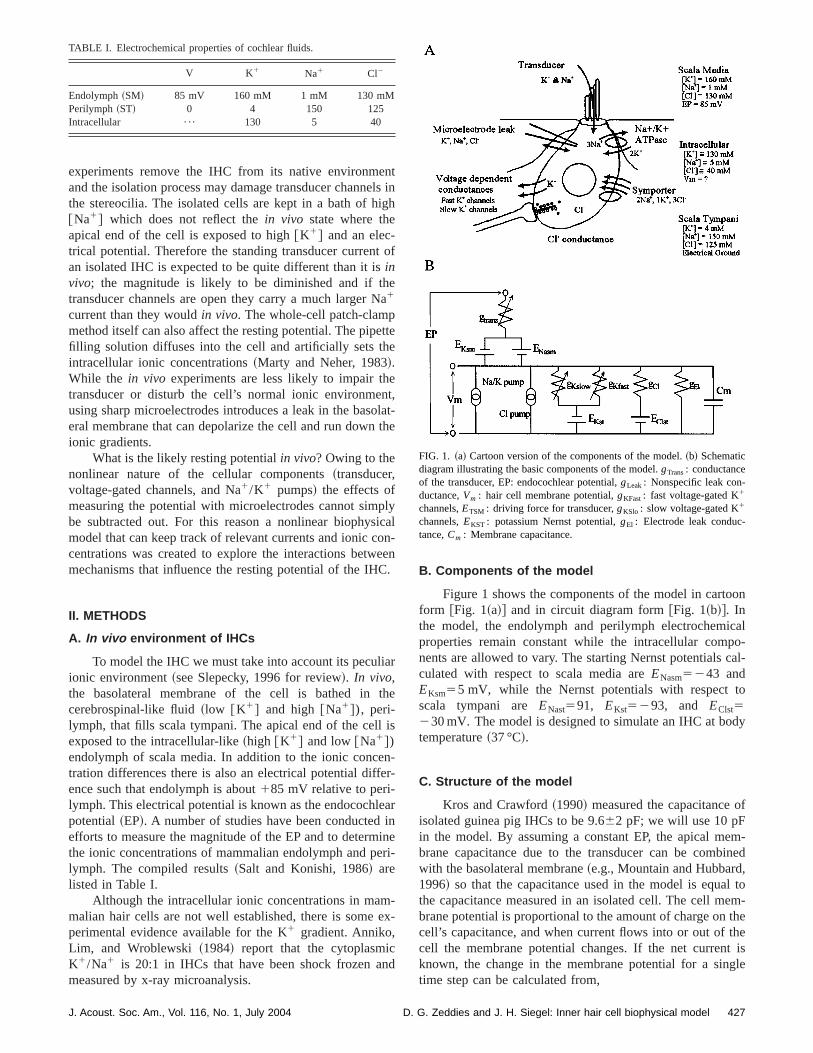
TABLE I. Electrochemical properties of cochlear fluids.
V K1 Na1 Cl2
Endolymph~SM! 85 mV 160 mM 1 mM 130 mMPerilymph~ST! 0 4 150 125Intracellular ¯ 130 5 40
J. Acoust. Soc. Am., Vol. 116, No. 1, July 2004 D.
tin
h
of
a
te
,at-he
lyaln-en.
r
e
--
r
nei-
x-
B. Components of the model
Figure 1 shows the components of the model in cartoform @Fig. 1~a!# and in circuit diagram form@Fig. 1~b!#. Inthe model, the endolymph and perilymph electrochemiproperties remain constant while the intracellular compnents are allowed to vary. The starting Nernst potentialsculated with respect to scala media areENasm5243 andEKsm55 mV, while the Nernst potentials with respectscala tympani areENast591, EKst5293, and EClst5230 mV. The model is designed to simulate an IHC at botemperature~37 °C!.
C. Structure of the model
Kros and Crawford~1990! measured the capacitanceisolated guinea pig IHCs to be 9.662 pF; we will use 10 pFin the model. By assuming a constant EP, the apical mbrane capacitance due to the transducer can be combwith the basolateral membrane~e.g., Mountain and Hubbard1996! so that the capacitance used in the model is equathe capacitance measured in an isolated cell. The cell mbrane potential is proportional to the amount of charge oncell’s capacitance, and when current flows into or out ofcell the membrane potential changes. If the net currenknown, the change in the membrane potential for a sintime step can be calculated from,
FIG. 1. ~a! Cartoon version of the components of the model.~b! Schematicdiagram illustrating the basic components of the model.gTrans: conductanceof the transducer, EP: endocochlear potential,gLeak: Nonspecific leak con-ductance,Vm : hair cell membrane potential,gKFast: fast voltage-gated K1
channels,ETSM : driving force for transducer,gKSlo : slow voltage-gated K1
channels,EKST : potassium Nernst potential,gEl : Electrode leak conduc-tance,Cm : Membrane capacitance.
427G. Zeddies and J. H. Siegel: Inner hair cell biophysical model
e-n
d
ifigean
sm
ham
blenlivt
Een
u
e
int o
al
ies
ross
cur-omand
-
tede
-
t
boutn-con-
oft annt-
ans-
m
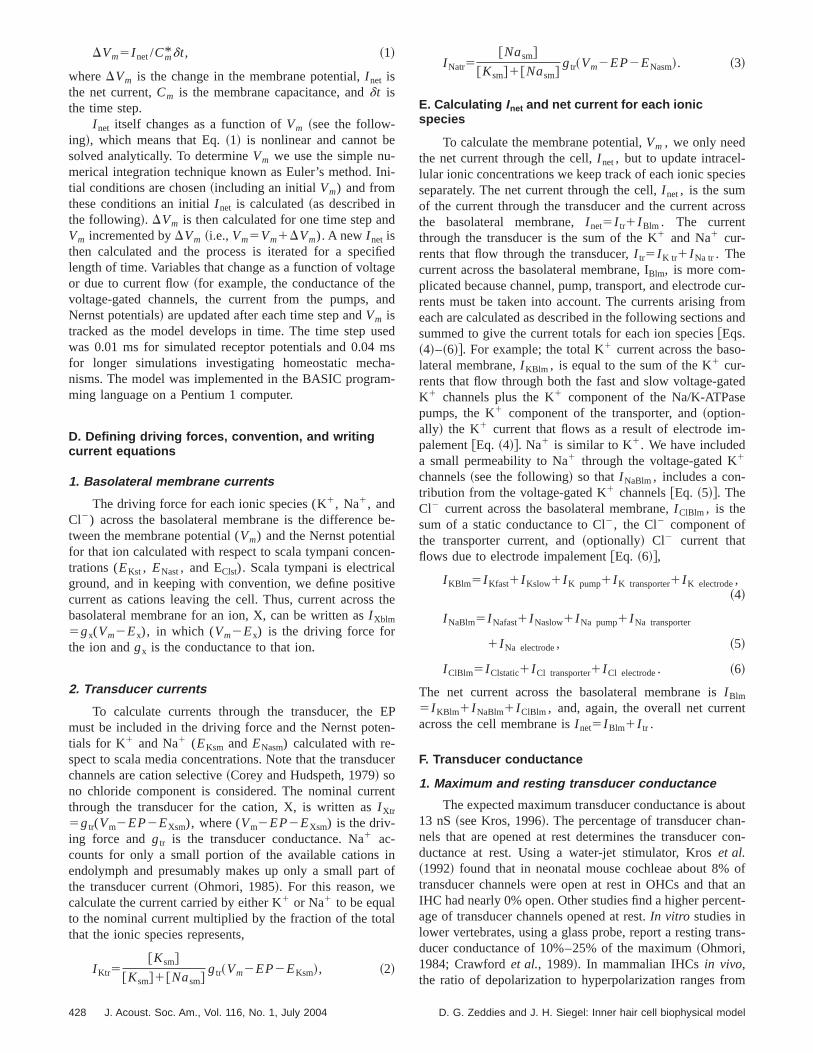
DVm5I net/Cm* dt, ~1!
whereDVm is the change in the membrane potential,I net isthe net current,Cm is the membrane capacitance, anddt isthe time step.
I net itself changes as a function ofVm ~see the follow-ing!, which means that Eq.~1! is nonlinear and cannot bsolved analytically. To determineVm we use the simple numerical integration technique known as Euler’s method. Itial conditions are chosen~including an initialVm) and fromthese conditions an initialI net is calculated~as described inthe following!. DVm is then calculated for one time step anVm incremented byDVm ~i.e.,Vm5Vm1DVm). A new I net isthen calculated and the process is iterated for a speclength of time. Variables that change as a function of voltaor due to current flow~for example, the conductance of thvoltage-gated channels, the current from the pumps,Nernst potentials! are updated after each time step andVm istracked as the model develops in time. The time step uwas 0.01 ms for simulated receptor potentials and 0.04for longer simulations investigating homeostatic mecnisms. The model was implemented in the BASIC programing language on a Pentium 1 computer.
D. Defining driving forces, convention, and writingcurrent equations
1. Basolateral membrane currents
The driving force for each ionic species (K1, Na1, andCl2) across the basolateral membrane is the differencetween the membrane potential (Vm) and the Nernst potentiafor that ion calculated with respect to scala tympani conctrations (EKst , ENast, and EClst). Scala tympani is electricaground, and in keeping with convention, we define positcurrent as cations leaving the cell. Thus, current acrossbasolateral membrane for an ion, X, can be written asI Xblm
5gx(Vm2Ex), in which (Vm2Ex) is the driving force forthe ion andgx is the conductance to that ion.
2. Transducer currents
To calculate currents through the transducer, themust be included in the driving force and the Nernst pottials for K1 and Na1 (EKsm andENasm) calculated with re-spect to scala media concentrations. Note that the transdchannels are cation selective~Corey and Hudspeth, 1979! sono chloride component is considered. The nominal currthrough the transducer for the cation, X, is written asI Xtr
5gtr(Vm2EP2EXsm), where (Vm2EP2EXsm) is the driv-ing force andgtr is the transducer conductance. Na1 ac-counts for only a small portion of the available cationsendolymph and presumably makes up only a small parthe transducer current~Ohmori, 1985!. For this reason, wecalculate the current carried by either K1 or Na1 to be equalto the nominal current multiplied by the fraction of the totthat the ionic species represents,
I Ktr5@Ksm#
@Ksm#1@Nasm#gtr~Vm2EP2EKsm!, ~2!
428 J. Acoust. Soc. Am., Vol. 116, No. 1, July 2004
i-
ede
d
eds--
e-
-
ehe
P-
cer
nt
f
I Natr5@Nasm#
@Ksm#1@Nasm#gtr~Vm2EP2ENasm!. ~3!
E. Calculating Inet and net current for each ionicspecies
To calculate the membrane potential,Vm , we only needthe net current through the cell,I net, but to update intracel-lular ionic concentrations we keep track of each ionic specseparately. The net current through the cell,I net, is the sumof the current through the transducer and the current acthe basolateral membrane,I net5I tr1I Blm . The currentthrough the transducer is the sum of the K1 and Na1 cur-rents that flow through the transducer,I tr5I K tr1I Na tr. Thecurrent across the basolateral membrane, IBlm, is more com-plicated because channel, pump, transport, and electroderents must be taken into account. The currents arising freach are calculated as described in the following sectionssummed to give the current totals for each ion species@Eqs.~4!–~6!#. For example; the total K1 current across the basolateral membrane,I KBlm , is equal to the sum of the K1 cur-rents that flow through both the fast and slow voltage-gaK1 channels plus the K1 component of the Na/K-ATPaspumps, the K1 component of the transporter, and~option-ally! the K1 current that flows as a result of electrode impalement@Eq. ~4!#. Na1 is similar to K1. We have includeda small permeability to Na1 through the voltage-gated K1
channels~see the following! so thatI NaBlm, includes a con-tribution from the voltage-gated K1 channels@Eq. ~5!#. TheCl2 current across the basolateral membrane,I ClBlm , is thesum of a static conductance to Cl2, the Cl2 component ofthe transporter current, and~optionally! Cl2 current thatflows due to electrode impalement@Eq. ~6!#,
I KBlm5I Kfast1I Kslow1I K pump1I K transporter1I K electrode,~4!
I NaBlm5I Nafast1I Naslow1I Na pump1I Na transporter
1I Na electrode, ~5!
I ClBlm5I Clstatic1I Cl transporter1I Cl electrode. ~6!
The net current across the basolateral membrane isI Blm
5I KBlm1I NaBlm1I ClBlm , and, again, the overall net currenacross the cell membrane isI net5I Blm1I tr .
F. Transducer conductance
1. Maximum and resting transducer conductance
The expected maximum transducer conductance is a13 nS~see Kros, 1996!. The percentage of transducer chanels that are opened at rest determines the transducerductance at rest. Using a water-jet stimulator, Kroset al.~1992! found that in neonatal mouse cochleae about 8%transducer channels were open at rest in OHCs and thaIHC had nearly 0% open. Other studies find a higher perceage of transducer channels opened at rest.In vitro studies inlower vertebrates, using a glass probe, report a resting trducer conductance of 10%–25% of the maximum~Ohmori,1984; Crawfordet al., 1989!. In mammalian IHCsin vivo,the ratio of depolarization to hyperpolarization ranges fro
D. G. Zeddies and J. H. Siegel: Inner hair cell biophysical model
raio
attio
pgreteKal
utu
thucn
ol
, w
cecentca
sogteha
od
i
rrn
thO
ion-verer-
lt-
ich
rnal
dia
re-
isKium, soon-
tics
-ime-
thee
ants
about 8:1~Dallos and Cheatham, 1989! to 3:1 ~Russel andSellick, 1983!. Assuming the resistance of the basolatemembrane is linear, the depolarization to hyperpolarizatratio suggests that between 12.5% and 33%~i.e., 1/8 and 1/3!of the transducer channels are open at rest. If voltage-gchannels were to open during depolarization then the raobtained would be an overestimate of the percentagetransducer channels open at rest. This occurs because oing voltage-gated K1 channels limits depolarization resultinin a smaller depolarization to hyperpolarization ratio. Thefore, the 12.5%–33% values are likely to be overestimabecause they do not include the effects of voltage-gated1
channels. The presence of the electrode in the cell maybias the transducerin vivo, and as Kroset al. ~1992! suggest,the higher values obtained from the glass probes that reqdirect contact may bias the transducer. Here we will tesrange of values, but the default resting transducer condtance will be set to 0.5 nS~about 4% of 13 nS!.
2. Transducer stimulation
Much of the use of the model will be concerned wihomeostatic issues and will use a static resting transdconductance, but to simulate receptor potentials the traducer conductance can be varied. The second-order Bmann function shown in Eq.~7!, fit by Kros et al. ~1993!,gives the percentage of channels open,Po , as a function ofthe voltage,V, applied to their water-jet stimultor,
Po5~11K2~11K1!21, ~7!
where
K15exp~1.2* ~0.912V!!, K25exp~0.43* ~1.752V!!.
To simulate receptor potentials in response to tone burstscalculatePo as the voltage to the water-jet stimulator,V, isvaried sinusoidally. To get the conductance of the transduPo is multiplied by a maximum transducer conductanGTr max. GTr max was chosen to be 7.5 nS for the experimesimulating receptor potentials, one half of the theoretimaximum.
G. Basolateral membrane: Conductances andcurrents
1. Voltage dependence of K¿ channel conductance
Kros and Crawford’s~1990! patch-clamp experimenton isolated guinea pig IHCs characterized two pharmacolcally distinct potassium currents. The larger current exhibivery fast kinetics while the smaller current was somewslower. Both currents were active over a voltage rangeabout 265 to 220 mV. Activation curves for the fast anslow channels were obtained by digitizing the data pointsfigures from tail current experiments~Figs. 8 and 10 of Krosand Crawford, 1990! using Autocad~Autodesk! with a Sum-maSketch tablet. These figures are the instantaneous cuthat flows after a voltage step from different holding potetials to a consistent command potential~247 mV for fastchannels and246 mV for slow channels!. The driving forceis therefore constant and can be divided out to yieldchannel conductance at various membrane potentials.
J. Acoust. Soc. Am., Vol. 116, No. 1, July 2004 D.
ln
eds
ofen-
-s
so
ireac-
ers-tz-
e
r,
sl
i-dtf
n
ent-
eur
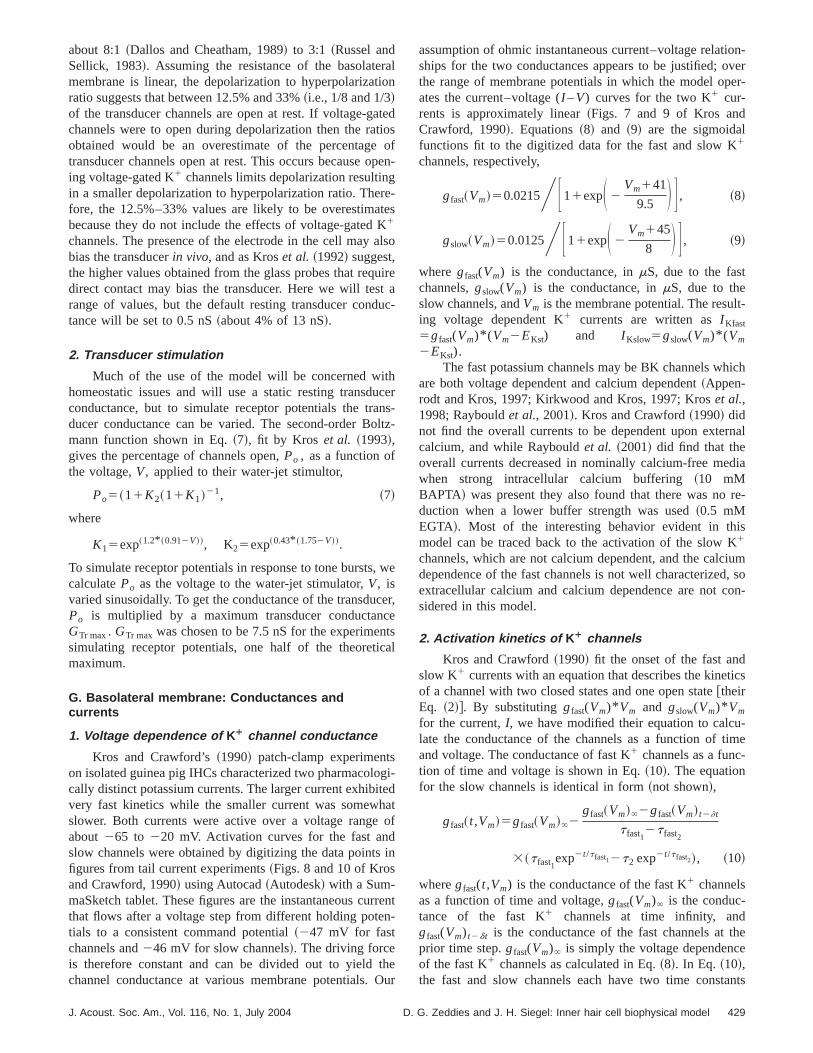
assumption of ohmic instantaneous current–voltage relatships for the two conductances appears to be justified; othe range of membrane potentials in which the model opates the current–voltage (I –V) curves for the two K1 cur-rents is approximately linear~Figs. 7 and 9 of Kros andCrawford, 1990!. Equations~8! and ~9! are the sigmoidalfunctions fit to the digitized data for the fast and slow K1
channels, respectively,
gfast~Vm!50.0215YF11expS 2Vm141
9.5 D G , ~8!
gslow~Vm!50.0125YF11expS 2Vm145
8 D G , ~9!
where gfast(Vm) is the conductance, inmS, due to the fastchannels,gslow(Vm) is the conductance, inmS, due to theslow channels, andVm is the membrane potential. The resuing voltage dependent K1 currents are written asI Kfast
5gfast(Vm)* (Vm2EKst) and I Kslow5gslow(Vm)* (Vm
2EKst).The fast potassium channels may be BK channels wh
are both voltage dependent and calcium dependent~Appen-rodt and Kros, 1997; Kirkwood and Kros, 1997; Kroset al.,1998; Raybouldet al., 2001!. Kros and Crawford~1990! didnot find the overall currents to be dependent upon extecalcium, and while Raybouldet al. ~2001! did find that theoverall currents decreased in nominally calcium-free mewhen strong intracellular calcium buffering~10 mMBAPTA! was present they also found that there was noduction when a lower buffer strength was used~0.5 mMEGTA!. Most of the interesting behavior evident in thmodel can be traced back to the activation of the slow1
channels, which are not calcium dependent, and the calcdependence of the fast channels is not well characterizedextracellular calcium and calcium dependence are not csidered in this model.
2. Activation kinetics of K¿ channels
Kros and Crawford~1990! fit the onset of the fast andslow K1 currents with an equation that describes the kineof a channel with two closed states and one open state@theirEq. ~2!#. By substitutinggfast(Vm)* Vm and gslow(Vm)* Vm
for the current,I, we have modified their equation to calculate the conductance of the channels as a function of tand voltage. The conductance of fast K1 channels as a function of time and voltage is shown in Eq.~10!. The equationfor the slow channels is identical in form~not shown!,
gfast~ t,Vm!5gfast~Vm!`2gfast~Vm!`2gfast~Vm! t2]t
t fast12t fast2
3~t fast1exp2t/t fast12t2 exp2t/t fast2!, ~10!
wheregfast(t,Vm) is the conductance of the fast K1 channelsas a function of time and voltage,gfast(Vm)` is the conduc-tance of the fast K1 channels at time infinity, andgfast(Vm) t2dt is the conductance of the fast channels atprior time step.gfast(Vm)` is simply the voltage dependencof the fast K1 channels as calculated in Eq.~8!. In Eq. ~10!,the fast and slow channels each have two time const
429G. Zeddies and J. H. Siegel: Inner hair cell biophysical model
gcth
psthe
iaKr-
llla
-
e
pt
-
d
ac/
-ti
etir
ns-g
for
c-to
s an
ro-
nde,
-nce
llysnt-
rf 50the
t ofm-
inen-dt isases
g’’there-
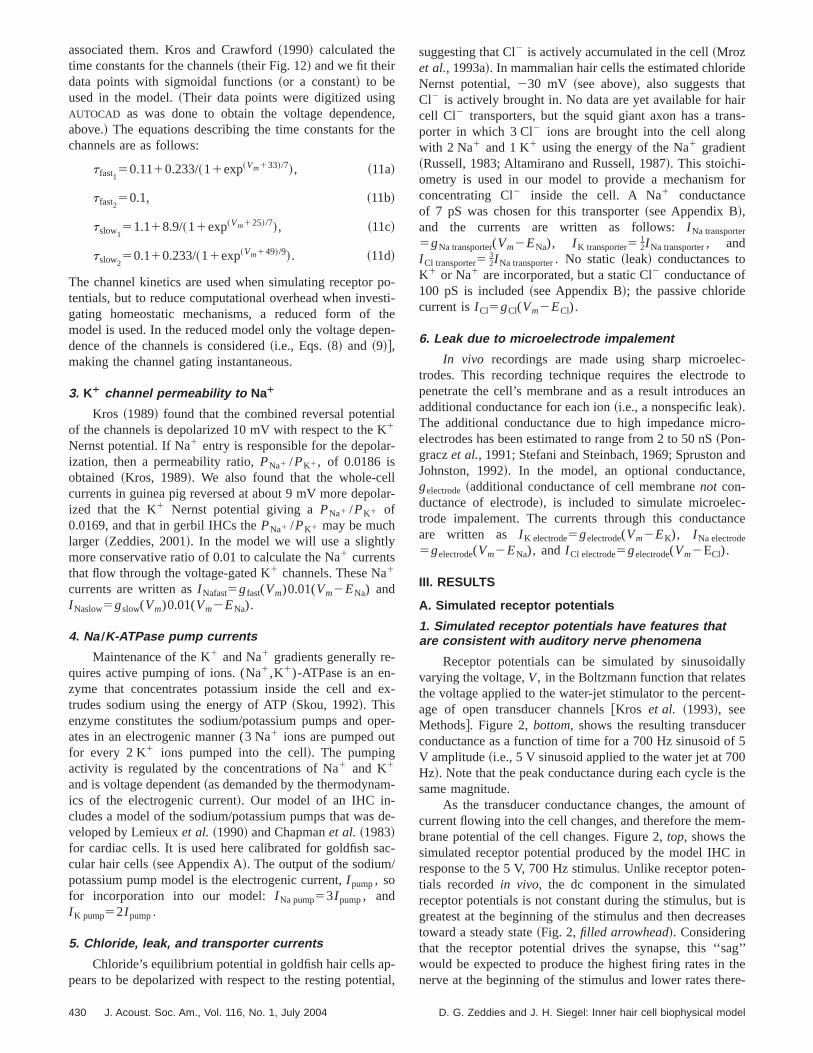
associated them. Kros and Crawford~1990! calculated thetime constants for the channels~their Fig. 12! and we fit theirdata points with sigmoidal functions~or a constant! to beused in the model.~Their data points were digitized usinAUTOCAD as was done to obtain the voltage dependenabove.! The equations describing the time constants forchannels are as follows:
t fast150.1110.233/~11exp~Vm133!/7!, ~11a!
t fast250.1, ~11b!
tslow151.118.9/~11exp~Vm125!/7!, ~11c!
tslow250.110.233/~11exp~Vm149!/9!. ~11d!
The channel kinetics are used when simulating receptortentials, but to reduce computational overhead when invegating homeostatic mechanisms, a reduced form ofmodel is used. In the reduced model only the voltage depdence of the channels is considered~i.e., Eqs.~8! and ~9!#,making the channel gating instantaneous.
3. K¿ channel permeability to Na¿
Kros ~1989! found that the combined reversal potentof the channels is depolarized 10 mV with respect to the1
Nernst potential. If Na1 entry is responsible for the depolaization, then a permeability ratio,PNa1 /PK1, of 0.0186 isobtained~Kros, 1989!. We also found that the whole-cecurrents in guinea pig reversed at about 9 mV more depoized that the K1 Nernst potential giving aPNa1 /PK1 of0.0169, and that in gerbil IHCs thePNa1 /PK1 may be muchlarger ~Zeddies, 2001!. In the model we will use a slightlymore conservative ratio of 0.01 to calculate the Na1 currentsthat flow through the voltage-gated K1 channels. These Na1
currents are written asI Nafast5gfast(Vm)0.01(Vm2ENa) andI Naslow5gslow(Vm)0.01(Vm2ENa).
4. Na ÕK-ATPase pump currents
Maintenance of the K1 and Na1 gradients generally requires active pumping of ions. (Na1,K1)-ATPase is an en-zyme that concentrates potassium inside the cell andtrudes sodium using the energy of ATP~Skou, 1992!. Thisenzyme constitutes the sodium/potassium pumps and oates in an electrogenic manner (3 Na1 ions are pumped oufor every 2 K1 ions pumped into the cell!. The pumpingactivity is regulated by the concentrations of Na1 and K1
and is voltage dependent~as demanded by the thermodynamics of the electrogenic current!. Our model of an IHC in-cludes a model of the sodium/potassium pumps that wasveloped by Lemieuxet al. ~1990! and Chapmanet al. ~1983!for cardiac cells. It is used here calibrated for goldfish scular hair cells~see Appendix A!. The output of the sodiumpotassium pump model is the electrogenic current,I pump, sofor incorporation into our model:I Na pump53I pump, andI K pump52I pump.
5. Chloride, leak, and transporter currents
Chloride’s equilibrium potential in goldfish hair cells appears to be depolarized with respect to the resting poten
430 J. Acoust. Soc. Am., Vol. 116, No. 1, July 2004
e,e
o-ti-en-
l
r-
x-
er-
e-
-
al,
suggesting that Cl2 is actively accumulated in the cell~Mrozet al., 1993a!. In mammalian hair cells the estimated chloridNernst potential,230 mV ~see above!, also suggests thaCl2 is actively brought in. No data are yet available for hacell Cl2 transporters, but the squid giant axon has a traporter in which 3 Cl2 ions are brought into the cell alonwith 2 Na1 and 1 K1 using the energy of the Na1 gradient~Russell, 1983; Altamirano and Russell, 1987!. This stoichi-ometry is used in our model to provide a mechanismconcentrating Cl2 inside the cell. A Na1 conductanceof 7 pS was chosen for this transporter~see Appendix B!,and the currents are written as follows:I Na transporter
5gNa transporter(Vm2ENa), I K transporter512I Na transporter, and
I Cl transporter532I Na transporter. No static ~leak! conductances to
K1 or Na1 are incorporated, but a static Cl2 conductance of100 pS is included~see Appendix B!; the passive chloridecurrent isI Cl5gCl(Vm2ECl).
6. Leak due to microelectrode impalement
In vivo recordings are made using sharp microeletrodes. This recording technique requires the electrodepenetrate the cell’s membrane and as a result introduceadditional conductance for each ion~i.e., a nonspecific leak!.The additional conductance due to high impedance micelectrodes has been estimated to range from 2 to 50 nS~Pon-graczet al., 1991; Stefani and Steinbach, 1969; Spruston aJohnston, 1992!. In the model, an optional conductancgelectrode~additional conductance of cell membranenot con-ductance of electrode!, is included to simulate microelectrode impalement. The currents through this conductaare written as I K electrode5gelectrode(Vm2EK), I Na electrode
5gelectrode(Vm2ENa), andI Cl electrode5gelectrode(Vm2ECl).
III. RESULTS
A. Simulated receptor potentials
1. Simulated receptor potentials have features thatare consistent with auditory nerve phenomena
Receptor potentials can be simulated by sinusoidavarying the voltage,V, in the Boltzmann function that relatethe voltage applied to the water-jet stimulator to the perceage of open transducer channels@Kros et al. ~1993!, seeMethods#. Figure 2,bottom, shows the resulting transduceconductance as a function of time for a 700 Hz sinusoid oV amplitude~i.e., 5 V sinusoid applied to the water jet at 70Hz!. Note that the peak conductance during each cycle issame magnitude.
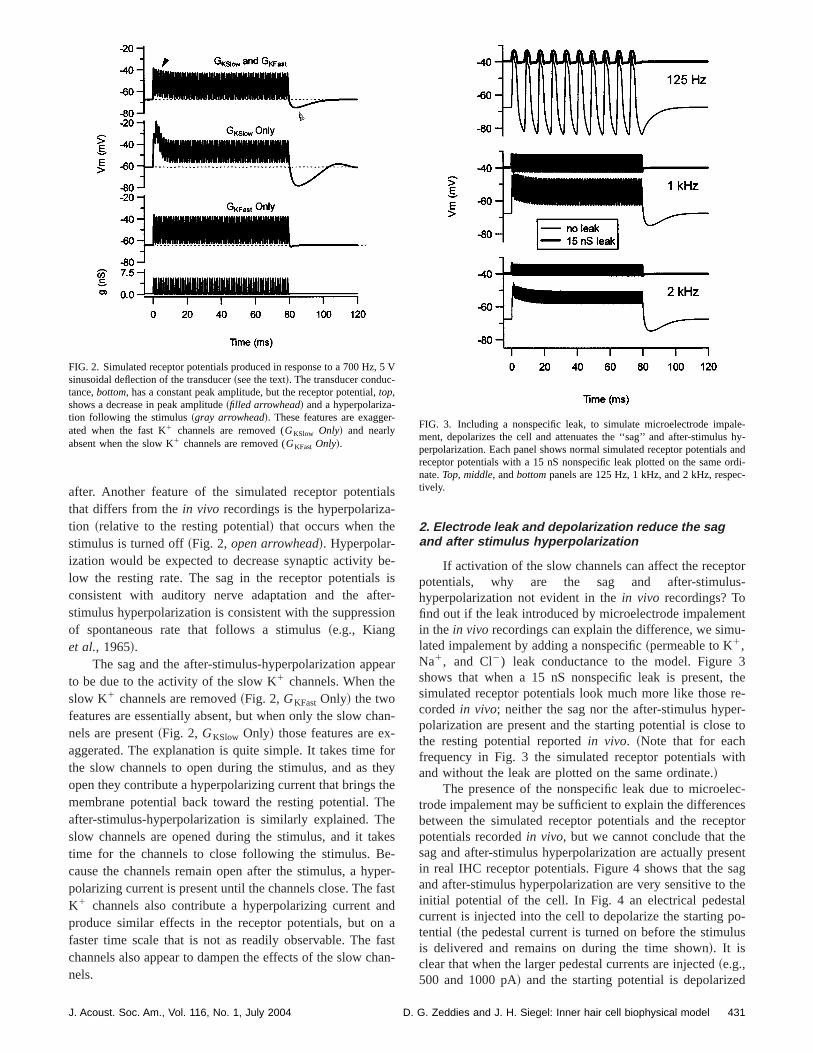
As the transducer conductance changes, the amouncurrent flowing into the cell changes, and therefore the mebrane potential of the cell changes. Figure 2,top, shows thesimulated receptor potential produced by the model IHCresponse to the 5 V, 700 Hz stimulus. Unlike receptor pottials recordedin vivo, the dc component in the simulatereceptor potentials is not constant during the stimulus, bugreatest at the beginning of the stimulus and then decretoward a steady state~Fig. 2, filled arrowhead!. Consideringthat the receptor potential drives the synapse, this ‘‘sawould be expected to produce the highest firing rates innerve at the beginning of the stimulus and lower rates the
D. G. Zeddies and J. H. Siegel: Inner hair cell biophysical model
ia-
b
teio
e
ha-fohthh
hekepfan
nfaha
tors-
ntu-
3there-r-
e to
ith
lec-cesptoreent
sagthealo-lus
d
, 5-
r-le-hy-and
ordi-c-
after. Another feature of the simulated receptor potentthat differs from thein vivo recordings is the hyperpolarization ~relative to the resting potential! that occurs when thestimulus is turned off~Fig. 2,open arrowhead!. Hyperpolar-ization would be expected to decrease synaptic activitylow the resting rate. The sag in the receptor potentialsconsistent with auditory nerve adaptation and the afstimulus hyperpolarization is consistent with the suppressof spontaneous rate that follows a stimulus~e.g., Kianget al., 1965!.
The sag and the after-stimulus-hyperpolarization appto be due to the activity of the slow K1 channels. When theslow K1 channels are removed~Fig. 2,GKFast Only! the twofeatures are essentially absent, but when only the slow cnels are present~Fig. 2, GKSlow Only! those features are exaggerated. The explanation is quite simple. It takes timethe slow channels to open during the stimulus, and as topen they contribute a hyperpolarizing current that bringsmembrane potential back toward the resting potential. Tafter-stimulus-hyperpolarization is similarly explained. Tslow channels are opened during the stimulus, and it tatime for the channels to close following the stimulus. Bcause the channels remain open after the stimulus, a hypolarizing current is present until the channels close. TheK1 channels also contribute a hyperpolarizing current aproduce similar effects in the receptor potentials, but ofaster time scale that is not as readily observable. Thechannels also appear to dampen the effects of the slow cnels.
FIG. 2. Simulated receptor potentials produced in response to a 700 Hzsinusoidal deflection of the transducer~see the text!. The transducer conductance,bottom, has a constant peak amplitude, but the receptor potential,top,shows a decrease in peak amplitude~filled arrowhead! and a hyperpolariza-tion following the stimulus~gray arrowhead!. These features are exaggeated when the fast K1 channels are removed (GKSlow Only! and nearlyabsent when the slow K1 channels are removed (GKFast Only!.
J. Acoust. Soc. Am., Vol. 116, No. 1, July 2004 D.
ls
e-isr-n
ar
n-
reyee
es-er-stdastn-
2. Electrode leak and depolarization reduce the sagand after stimulus hyperpolarization
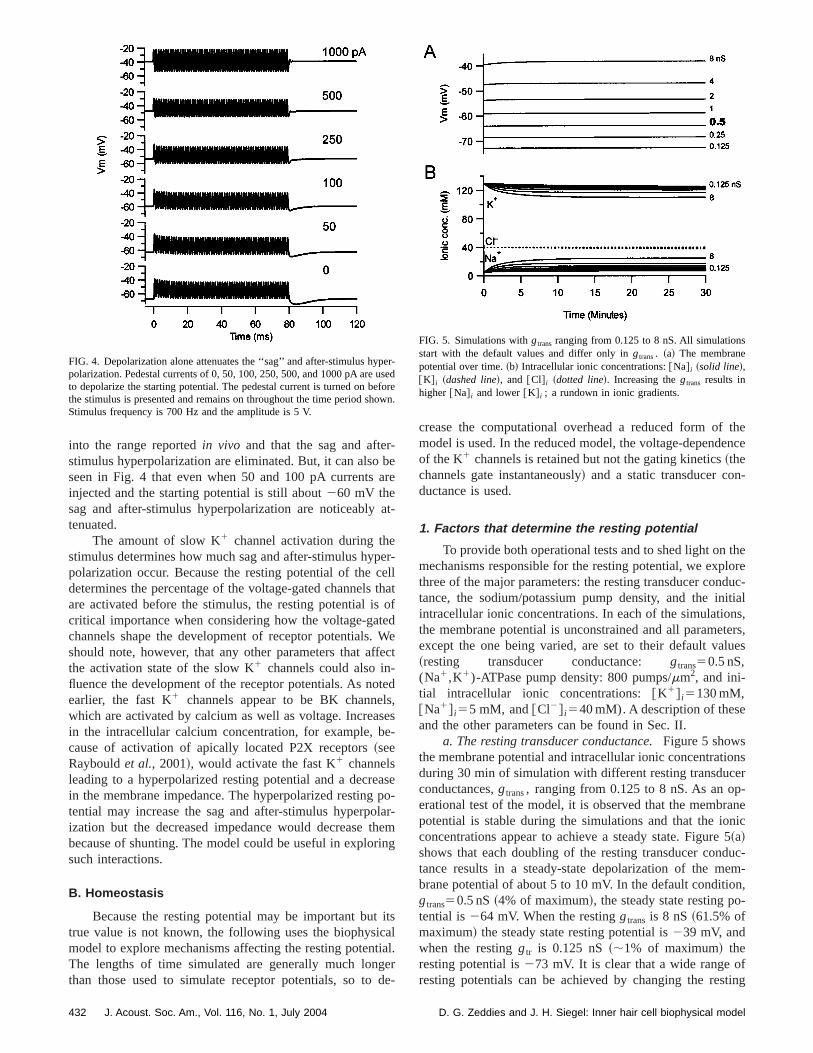
If activation of the slow channels can affect the receppotentials, why are the sag and after-stimuluhyperpolarization not evident in thein vivo recordings? Tofind out if the leak introduced by microelectrode impalemein the in vivo recordings can explain the difference, we simlated impalement by adding a nonspecific~permeable to K1,Na1, and Cl2) leak conductance to the model. Figureshows that when a 15 nS nonspecific leak is present,simulated receptor potentials look much more like thosecordedin vivo; neither the sag nor the after-stimulus hypepolarization are present and the starting potential is closthe resting potential reportedin vivo. ~Note that for eachfrequency in Fig. 3 the simulated receptor potentials wand without the leak are plotted on the same ordinate.!
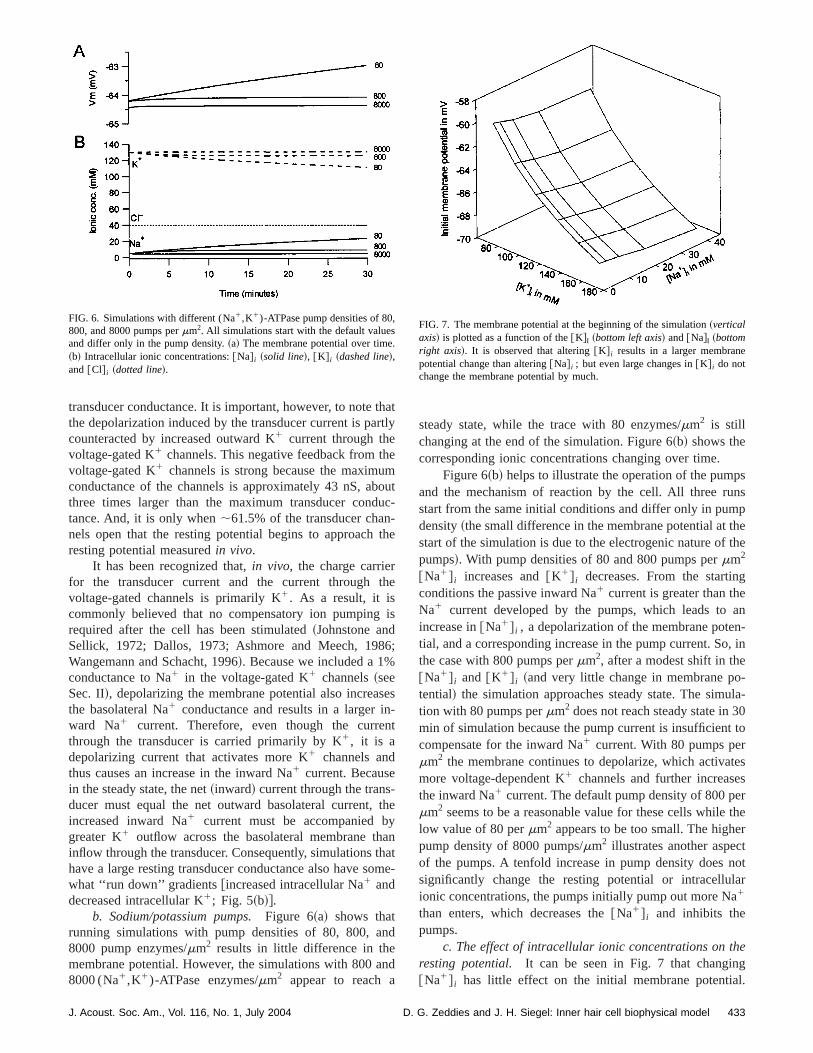
The presence of the nonspecific leak due to microetrode impalement may be sufficient to explain the differenbetween the simulated receptor potentials and the recepotentials recordedin vivo, but we cannot conclude that thsag and after-stimulus hyperpolarization are actually presin real IHC receptor potentials. Figure 4 shows that theand after-stimulus hyperpolarization are very sensitive toinitial potential of the cell. In Fig. 4 an electrical pedestcurrent is injected into the cell to depolarize the starting ptential ~the pedestal current is turned on before the stimuis delivered and remains on during the time shown!. It isclear that when the larger pedestal currents are injected~e.g.,500 and 1000 pA! and the starting potential is depolarize
V
FIG. 3. Including a nonspecific leak, to simulate microelectrode impament, depolarizes the cell and attenuates the ‘‘sag’’ and after-stimulusperpolarization. Each panel shows normal simulated receptor potentialsreceptor potentials with a 15 nS nonspecific leak plotted on the samenate.Top, middle, andbottompanels are 125 Hz, 1 kHz, and 2 kHz, respetively.
431G. Zeddies and J. H. Siegel: Inner hair cell biophysical model
r-ba
a
pece
t
te. Wffe-te
lsse
apla
thin
itcatiaged
theence
-
theloreduc-itialns,ters,ues
onser-anenic5uc-
em-n,-
fting
peus
efoow
into the range reportedin vivo and that the sag and aftestimulus hyperpolarization are eliminated. But, it can alsoseen in Fig. 4 that even when 50 and 100 pA currentsinjected and the starting potential is still about260 mV thesag and after-stimulus hyperpolarization are noticeablytenuated.
The amount of slow K1 channel activation during thestimulus determines how much sag and after-stimulus hypolarization occur. Because the resting potential of thedetermines the percentage of the voltage-gated channelsare activated before the stimulus, the resting potential iscritical importance when considering how the voltage-gachannels shape the development of receptor potentialsshould note, however, that any other parameters that athe activation state of the slow K1 channels could also influence the development of the receptor potentials. As noearlier, the fast K1 channels appear to be BK channewhich are activated by calcium as well as voltage. Increain the intracellular calcium concentration, for example, bcause of activation of apically located P2X receptors~seeRaybouldet al., 2001!, would activate the fast K1 channelsleading to a hyperpolarized resting potential and a decrein the membrane impedance. The hyperpolarized restingtential may increase the sag and after-stimulus hyperpoization but the decreased impedance would decreasebecause of shunting. The model could be useful in explorsuch interactions.
B. Homeostasis
Because the resting potential may be important buttrue value is not known, the following uses the biophysimodel to explore mechanisms affecting the resting potenThe lengths of time simulated are generally much lonthan those used to simulate receptor potentials, so to
FIG. 4. Depolarization alone attenuates the ‘‘sag’’ and after-stimulus hypolarization. Pedestal currents of 0, 50, 100, 250, 500, and 1000 pA areto depolarize the starting potential. The pedestal current is turned on bthe stimulus is presented and remains on throughout the time period shStimulus frequency is 700 Hz and the amplitude is 5 V.
432 J. Acoust. Soc. Am., Vol. 116, No. 1, July 2004
ere
t-
r-llhatofde
ct
d,es-
seo-r-
emg
sll.re-
crease the computational overhead a reduced form ofmodel is used. In the reduced model, the voltage-dependof the K1 channels is retained but not the gating kinetics~thechannels gate instantaneously! and a static transducer conductance is used.
1. Factors that determine the resting potential
To provide both operational tests and to shed light onmechanisms responsible for the resting potential, we expthree of the major parameters: the resting transducer contance, the sodium/potassium pump density, and the inintracellular ionic concentrations. In each of the simulatiothe membrane potential is unconstrained and all parameexcept the one being varied, are set to their default val~resting transducer conductance: gtrans50.5 nS,(Na1,K1)-ATPase pump density: 800 pumps/mm2, and ini-tial intracellular ionic concentrations:@K1# i5130 mM,@Na1# i55 mM, and@Cl2# i540 mM). A description of theseand the other parameters can be found in Sec. II.
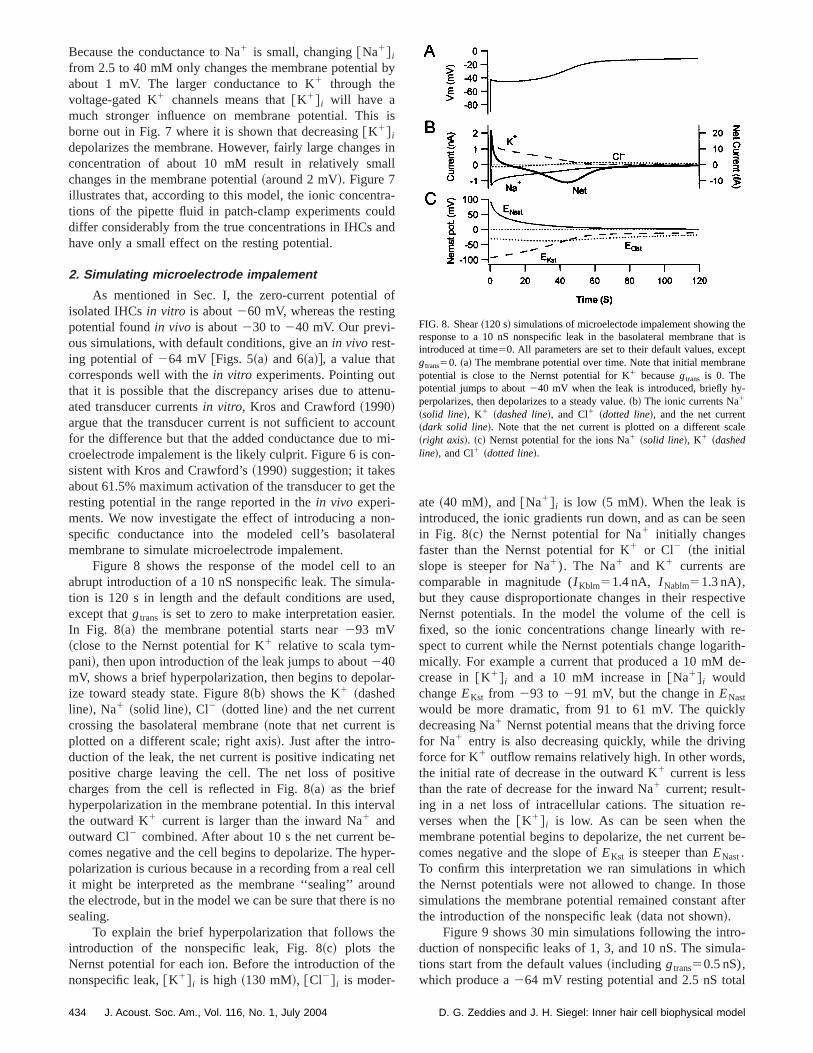
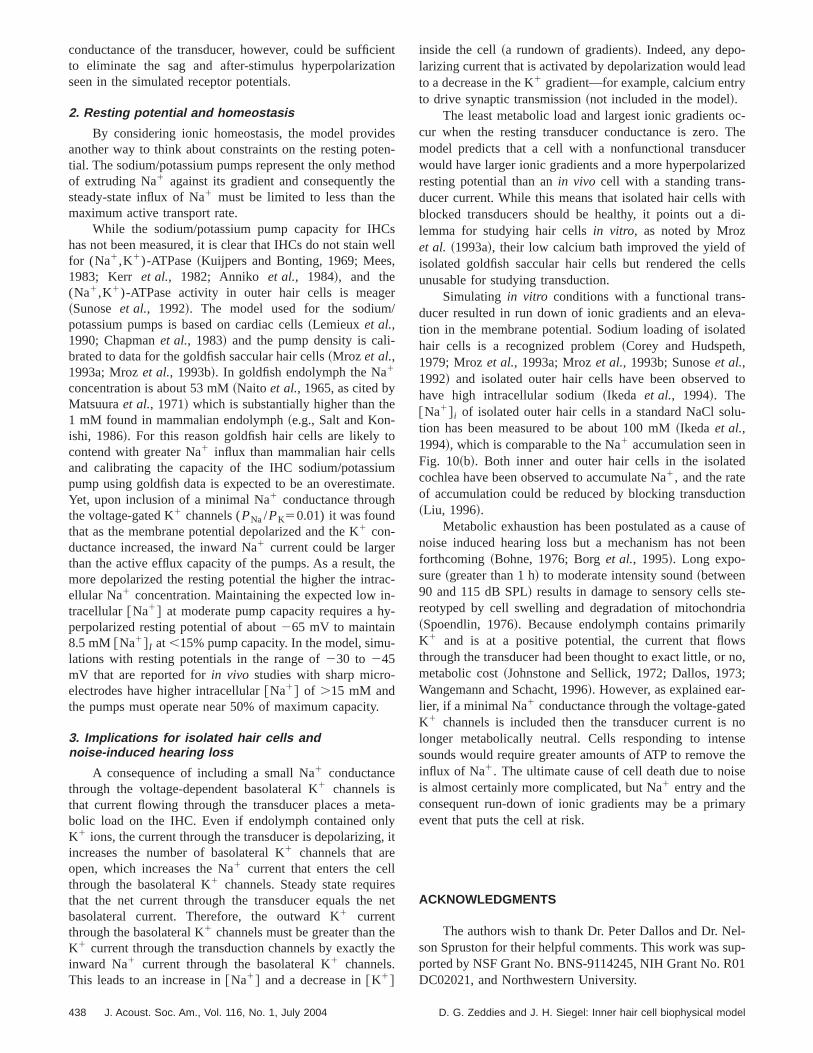
a. The resting transducer conductance.Figure 5 showsthe membrane potential and intracellular ionic concentratiduring 30 min of simulation with different resting transducconductances,gtrans, ranging from 0.125 to 8 nS. As an operational test of the model, it is observed that the membrpotential is stable during the simulations and that the ioconcentrations appear to achieve a steady state. Figure~a!shows that each doubling of the resting transducer condtance results in a steady-state depolarization of the mbrane potential of about 5 to 10 mV. In the default conditiogtrans50.5 nS~4% of maximum!, the steady state resting potential is264 mV. When the restinggtrans is 8 nS~61.5% ofmaximum! the steady state resting potential is239 mV, andwhen the restinggtr is 0.125 nS~;1% of maximum! theresting potential is273 mV. It is clear that a wide range oresting potentials can be achieved by changing the res
r-edren.
FIG. 5. Simulations withgtrans ranging from 0.125 to 8 nS. All simulationsstart with the default values and differ only ingtrans. ~a! The membranepotential over time.~b! Intracellular ionic concentrations:@Na# i ~solid line!,@K# i ~dashed line!, and @Cl# i ~dotted line!. Increasing thegtrans results inhigher @Na# i and lower@K# i ; a rundown in ionic gradients.
D. G. Zeddies and J. H. Siegel: Inner hair cell biophysical model
thrt
heumou-t
th
i
6
sen-n
-tya
thom
nd
n
psnsp
thethe
geann-, in
-ula-0
t tortess
erthe
ertnotlara
egl.
,s.
transducer conductance. It is important, however, to notethe depolarization induced by the transducer current is pacounteracted by increased outward K1 current through thevoltage-gated K1 channels. This negative feedback from tvoltage-gated K1 channels is strong because the maximconductance of the channels is approximately 43 nS, abthree times larger than the maximum transducer condtance. And, it is only when;61.5% of the transducer channels open that the resting potential begins to approachresting potential measuredin vivo.
It has been recognized that,in vivo, the charge carrierfor the transducer current and the current throughvoltage-gated channels is primarily K1. As a result, it iscommonly believed that no compensatory ion pumpingrequired after the cell has been stimulated~Johnstone andSellick, 1972; Dallos, 1973; Ashmore and Meech, 198Wangemann and Schacht, 1996!. Because we included a 1%conductance to Na1 in the voltage-gated K1 channels~seeSec. II!, depolarizing the membrane potential also increathe basolateral Na1 conductance and results in a larger iward Na1 current. Therefore, even though the currethrough the transducer is carried primarily by K1, it is adepolarizing current that activates more K1 channels andthus causes an increase in the inward Na1 current. Becausein the steady state, the net~inward! current through the transducer must equal the net outward basolateral current,increased inward Na1 current must be accompanied bgreater K1 outflow across the basolateral membrane thinflow through the transducer. Consequently, simulationshave a large resting transducer conductance also have swhat ‘‘run down’’ gradients@increased intracellular Na1 anddecreased intracellular K1; Fig. 5~b!#.
b. Sodium/potassium pumps.Figure 6~a! shows thatrunning simulations with pump densities of 80, 800, a8000 pump enzymes/mm2 results in little difference in themembrane potential. However, the simulations with 800 a8000 (Na1,K1)-ATPase enzymes/mm2 appear to reach a
FIG. 6. Simulations with different (Na1,K1)-ATPase pump densities of 80800, and 8000 pumps permm2. All simulations start with the default valueand differ only in the pump density.~a! The membrane potential over time~b! Intracellular ionic concentrations:@Na# i ~solid line!, @K# i ~dashed line!,and @Cl# i ~dotted line!.
J. Acoust. Soc. Am., Vol. 116, No. 1, July 2004 D.
atly
utc-
he
e
s
;
s
t
he
nat
e-
d
steady state, while the trace with 80 enzymes/mm2 is stillchanging at the end of the simulation. Figure 6~b! shows thecorresponding ionic concentrations changing over time.
Figure 6~b! helps to illustrate the operation of the pumand the mechanism of reaction by the cell. All three rustart from the same initial conditions and differ only in pumdensity~the small difference in the membrane potential atstart of the simulation is due to the electrogenic nature ofpumps!. With pump densities of 80 and 800 pumps permm2
@Na1# i increases and@K1# i decreases. From the startinconditions the passive inward Na1 current is greater than thNa1 current developed by the pumps, which leads toincrease in@Na1# i , a depolarization of the membrane potetial, and a corresponding increase in the pump current. Sothe case with 800 pumps permm2, after a modest shift in the@Na1# i and @K1# i ~and very little change in membrane potential! the simulation approaches steady state. The simtion with 80 pumps permm2 does not reach steady state in 3min of simulation because the pump current is insufficiencompensate for the inward Na1 current. With 80 pumps pemm2 the membrane continues to depolarize, which activamore voltage-dependent K1 channels and further increasethe inward Na1 current. The default pump density of 800 pmm2 seems to be a reasonable value for these cells whilelow value of 80 permm2 appears to be too small. The highpump density of 8000 pumps/mm2 illustrates another aspecof the pumps. A tenfold increase in pump density doessignificantly change the resting potential or intracelluionic concentrations, the pumps initially pump out more N1
than enters, which decreases the@Na1# i and inhibits thepumps.
c. The effect of intracellular ionic concentrations on thresting potential. It can be seen in Fig. 7 that changin@Na1# i has little effect on the initial membrane potentia
FIG. 7. The membrane potential at the beginning of the simulation~verticalaxis! is plotted as a function of the@K#I ~bottom left axis! and@Na#I ~bottomright axis!. It is observed that altering@K# i results in a larger membranepotential change than altering@Na# i ; but even large changes in@K# i do notchange the membrane potential by much.
433G. Zeddies and J. H. Siegel: Inner hair cell biophysical model
b
sall
trauldn
og
tn
umn
th
ner
alaeer
la
t
eiv
va
epecends
e
he
een
tiveis
re-ith-e-
lyeg,
e-ebe-
hosefter
-la-
l
heat is
eptne
-
le
Because the conductance to Na1 is small, changing@Na1# i
from 2.5 to 40 mM only changes the membrane potentialabout 1 mV. The larger conductance to K1 through thevoltage-gated K1 channels means that@K1# i will have amuch stronger influence on membrane potential. Thisborne out in Fig. 7 where it is shown that decreasing@K1# i
depolarizes the membrane. However, fairly large changeconcentration of about 10 mM result in relatively smchanges in the membrane potential~around 2 mV!. Figure 7illustrates that, according to this model, the ionic concentions of the pipette fluid in patch-clamp experiments codiffer considerably from the true concentrations in IHCs ahave only a small effect on the resting potential.
2. Simulating microelectrode impalement
As mentioned in Sec. I, the zero-current potentialisolated IHCsin vitro is about260 mV, whereas the restinpotential foundin vivo is about230 to 240 mV. Our previ-ous simulations, with default conditions, give anin vivo rest-ing potential of264 mV @Figs. 5~a! and 6~a!#, a value thatcorresponds well with thein vitro experiments. Pointing outhat it is possible that the discrepancy arises due to atteated transducer currentsin vitro, Kros and Crawford~1990!argue that the transducer current is not sufficient to accofor the difference but that the added conductance due tocroelectrode impalement is the likely culprit. Figure 6 is cosistent with Kros and Crawford’s~1990! suggestion; it takesabout 61.5% maximum activation of the transducer to getresting potential in the range reported in thein vivo experi-ments. We now investigate the effect of introducing a nospecific conductance into the modeled cell’s basolatmembrane to simulate microelectrode impalement.
Figure 8 shows the response of the model cell toabrupt introduction of a 10 nS nonspecific leak. The simution is 120 s in length and the default conditions are usexcept thatgtrans is set to zero to make interpretation easiIn Fig. 8~a! the membrane potential starts near293 mV~close to the Nernst potential for K1 relative to scala tym-pani!, then upon introduction of the leak jumps to about240mV, shows a brief hyperpolarization, then begins to depoize toward steady state. Figure 8~b! shows the K1 ~dashedline!, Na1 ~solid line!, Cl2 ~dotted line! and the net currencrossing the basolateral membrane~note that net current isplotted on a different scale; right axis!. Just after the intro-duction of the leak, the net current is positive indicating npositive charge leaving the cell. The net loss of positcharges from the cell is reflected in Fig. 8~a! as the briefhyperpolarization in the membrane potential. In this interthe outward K1 current is larger than the inward Na1 andoutward Cl2 combined. After about 10 s the net current bcomes negative and the cell begins to depolarize. The hypolarization is curious because in a recording from a realit might be interpreted as the membrane ‘‘sealing’’ arouthe electrode, but in the model we can be sure that there isealing.
To explain the brief hyperpolarization that follows thintroduction of the nonspecific leak, Fig. 8~c! plots theNernst potential for each ion. Before the introduction of tnonspecific leak,@K1# i is high ~130 mM!, @Cl2# i is moder-
434 J. Acoust. Soc. Am., Vol. 116, No. 1, July 2004
y
is
in
-
d
f
u-
nti-
-
e
-al
n-
d,.
r-
te
l
-r-ll
no
ate ~40 mM!, and @Na1# i is low ~5 mM!. When the leak isintroduced, the ionic gradients run down, and as can be sin Fig. 8~c! the Nernst potential for Na1 initially changesfaster than the Nernst potential for K1 or Cl2 ~the initialslope is steeper for Na1). The Na1 and K1 currents arecomparable in magnitude (I Kblm51.4 nA, I Nablm51.3 nA),but they cause disproportionate changes in their respecNernst potentials. In the model the volume of the cellfixed, so the ionic concentrations change linearly withspect to current while the Nernst potentials change logarmically. For example a current that produced a 10 mM dcrease in@K1# i and a 10 mM increase in@Na1# i wouldchangeEKst from 293 to 291 mV, but the change inENast
would be more dramatic, from 91 to 61 mV. The quickdecreasing Na1 Nernst potential means that the driving forcfor Na1 entry is also decreasing quickly, while the drivinforce for K1 outflow remains relatively high. In other wordsthe initial rate of decrease in the outward K1 current is lessthan the rate of decrease for the inward Na1 current; result-ing in a net loss of intracellular cations. The situation rverses when the@K1# i is low. As can be seen when thmembrane potential begins to depolarize, the net currentcomes negative and the slope ofEKst is steeper thanENast.To confirm this interpretation we ran simulations in whicthe Nernst potentials were not allowed to change. In thsimulations the membrane potential remained constant athe introduction of the nonspecific leak~data not shown!.
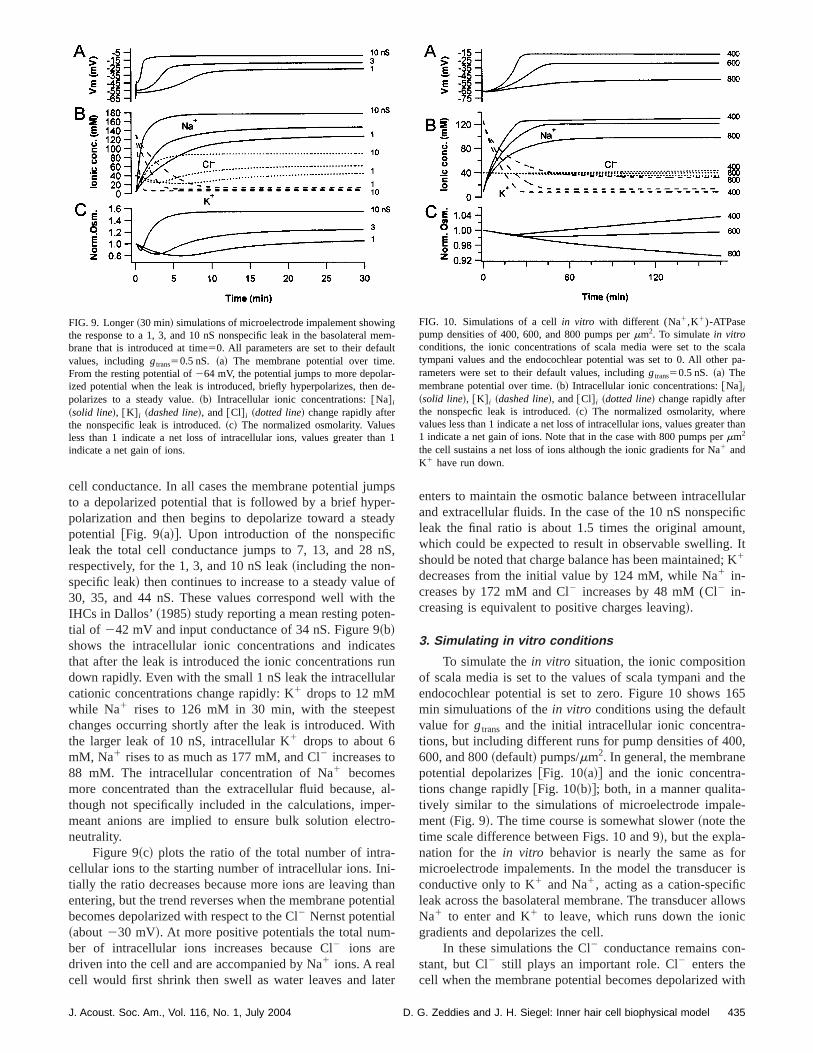
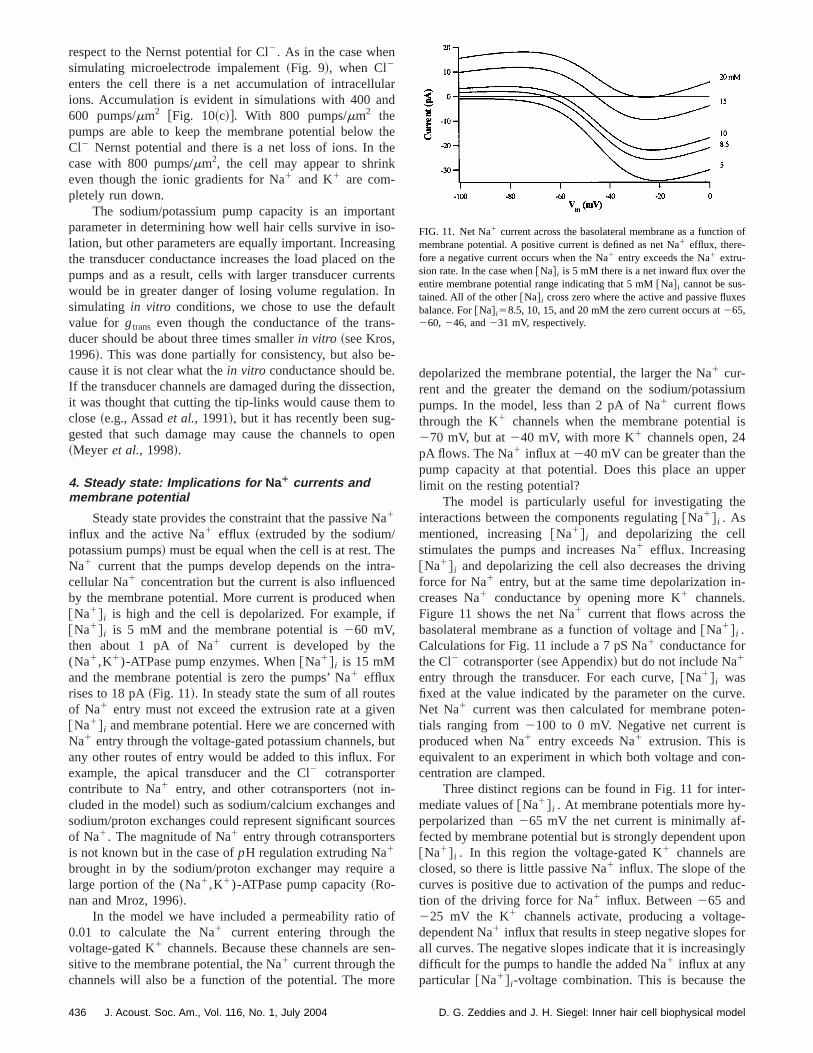
Figure 9 shows 30 min simulations following the introduction of nonspecific leaks of 1, 3, and 10 nS. The simutions start from the default values~including gtrans50.5 nS),which produce a264 mV resting potential and 2.5 nS tota
FIG. 8. Shear~120 s! simulations of microelectode impalement showing tresponse to a 10 nS nonspecific leak in the basolateral membrane thintroduced at time50. All parameters are set to their default values, excgtrans50. ~a! The membrane potential over time. Note that initial membrapotential is close to the Nernst potential for K1 becausegtrans is 0. Thepotential jumps to about240 mV when the leak is introduced, briefly hyperpolarizes, then depolarizes to a steady value.~b! The ionic currents Na1
~solid line!, K1 ~dashed line!, and Cl1 ~dotted line!, and the net current~dark solid line!. Note that the net current is plotted on a different sca~right axis!. ~c! Nernst potential for the ions Na1 ~solid line!, K1 ~dashedline!, and Cl1 ~dotted line!.
D. G. Zeddies and J. H. Siegel: Inner hair cell biophysical model
meradcnS
othn-
terula
stit
, aertro
-i-
thn
-
te
ularificnt,. It; K
the165t-0,
e--e-
rr is
cllowsc
-
with
gmelt.r-d
san
calapa-
than
cell conductance. In all cases the membrane potential juto a depolarized potential that is followed by a brief hyppolarization and then begins to depolarize toward a stepotential @Fig. 9~a!#. Upon introduction of the nonspecifileak the total cell conductance jumps to 7, 13, and 28respectively, for the 1, 3, and 10 nS leak~including the non-specific leak! then continues to increase to a steady value30, 35, and 44 nS. These values correspond well withIHCs in Dallos’~1985! study reporting a mean resting potetial of 242 mV and input conductance of 34 nS. Figure 9~b!shows the intracellular ionic concentrations and indicathat after the leak is introduced the ionic concentrationsdown rapidly. Even with the small 1 nS leak the intracellucationic concentrations change rapidly: K1 drops to 12 mMwhile Na1 rises to 126 mM in 30 min, with the steepechanges occurring shortly after the leak is introduced. Wthe larger leak of 10 nS, intracellular K1 drops to about 6mM, Na1 rises to as much as 177 mM, and Cl2 increases to88 mM. The intracellular concentration of Na1 becomesmore concentrated than the extracellular fluid becausethough not specifically included in the calculations, impmeant anions are implied to ensure bulk solution elecneutrality.
Figure 9~c! plots the ratio of the total number of intracellular ions to the starting number of intracellular ions. Intially the ratio decreases because more ions are leavingentering, but the trend reverses when the membrane potebecomes depolarized with respect to the Cl2 Nernst potential~about230 mV!. At more positive potentials the total number of intracellular ions increases because Cl2 ions aredriven into the cell and are accompanied by Na1 ions. A realcell would first shrink then swell as water leaves and la
FIG. 9. Longer~30 min! simulations of microelectrode impalement showinthe response to a 1, 3, and 10 nS nonspecific leak in the basolateralbrane that is introduced at time50. All parameters are set to their defauvalues, includinggtrans50.5 nS. ~a! The membrane potential over timeFrom the resting potential of264 mV, the potential jumps to more depolaized potential when the leak is introduced, briefly hyperpolarizes, thenpolarizes to a steady value.~b! Intracellular ionic concentrations:@Na# i
~solid line!, @K# i ~dashed line!, and@Cl# i ~dotted line! change rapidly afterthe nonspecific leak is introduced.~c! The normalized osmolarity. Valueless than 1 indicate a net loss of intracellular ions, values greater thindicate a net gain of ions.
J. Acoust. Soc. Am., Vol. 116, No. 1, July 2004 D.
ps-y
,
fe
snr
h
l---
antial
r
enters to maintain the osmotic balance between intracelland extracellular fluids. In the case of the 10 nS nonspecleak the final ratio is about 1.5 times the original amouwhich could be expected to result in observable swellingshould be noted that charge balance has been maintained1
decreases from the initial value by 124 mM, while Na1 in-creases by 172 mM and Cl2 increases by 48 mM (Cl2 in-creasing is equivalent to positive charges leaving!.
3. Simulating in vitro conditions
To simulate thein vitro situation, the ionic compositionof scala media is set to the values of scala tympani andendocochlear potential is set to zero. Figure 10 showsmin simuluations of thein vitro conditions using the defaulvalue for gtrans and the initial intracellular ionic concentrations, but including different runs for pump densities of 40600, and 800~default! pumps/mm2. In general, the membranpotential depolarizes@Fig. 10~a!# and the ionic concentrations change rapidly@Fig. 10~b!#; both, in a manner qualitatively similar to the simulations of microelectrode impalment~Fig. 9!. The time course is somewhat slower~note thetime scale difference between Figs. 10 and 9!, but the expla-nation for the in vitro behavior is nearly the same as fomicroelectrode impalements. In the model the transduceconductive only to K1 and Na1, acting as a cation-specifileak across the basolateral membrane. The transducer aNa1 to enter and K1 to leave, which runs down the ionigradients and depolarizes the cell.
In these simulations the Cl2 conductance remains constant, but Cl2 still plays an important role. Cl2 enters thecell when the membrane potential becomes depolarized
m-
e-
1
FIG. 10. Simulations of a cellin vitro with different (Na1,K1)-ATPasepump densities of 400, 600, and 800 pumps permm2. To simulatein vitroconditions, the ionic concentrations of scala media were set to the stympani values and the endocochlear potential was set to 0. All otherrameters were set to their default values, includinggtrans50.5 nS. ~a! Themembrane potential over time.~b! Intracellular ionic concentrations:@Na# i
~solid line!, @K# i ~dashed line!, and@Cl# i ~dotted line! change rapidly afterthe nonspecfic leak is introduced.~c! The normalized osmolarity, wherevalues less than 1 indicate a net loss of intracellular ions, values greater1 indicate a net gain of ions. Note that in the case with 800 pumps permm2
the cell sustains a net loss of ions although the ionic gradients for Na1 andK1 have run down.
435G. Zeddies and J. H. Siegel: Inner hair cell biophysical model
land
tthk
anosinnenIn
uls
e.tito-o
N/hetredhe
i
e
seibo
nrcs
e
oese
r
ium
is
eper
e
l
ingn-
e
rve.en-s
on-
r--
-pon
uc-
e-orgly
e
n of
es
respect to the Nernst potential for Cl2. As in the case whensimulating microelectrode impalement~Fig. 9!, when Cl2
enters the cell there is a net accumulation of intracelluions. Accumulation is evident in simulations with 400 a600 pumps/mm2 @Fig. 10~c!#. With 800 pumps/mm2 thepumps are able to keep the membrane potential belowCl2 Nernst potential and there is a net loss of ions. Incase with 800 pumps/mm2, the cell may appear to shrineven though the ionic gradients for Na1 and K1 are com-pletely run down.
The sodium/potassium pump capacity is an importparameter in determining how well hair cells survive in islation, but other parameters are equally important. Increathe transducer conductance increases the load placed opumps and as a result, cells with larger transducer currwould be in greater danger of losing volume regulation.simulating in vitro conditions, we chose to use the defavalue for gtrans even though the conductance of the tranducer should be about three times smallerin vitro ~see Kros,1996!. This was done partially for consistency, but also bcause it is not clear what thein vitro conductance should beIf the transducer channels are damaged during the dissecit was thought that cutting the tip-links would cause themclose~e.g., Assadet al., 1991!, but it has recently been suggested that such damage may cause the channels to~Meyer et al., 1998!.
4. Steady state: Implications for Na¿ currents andmembrane potential
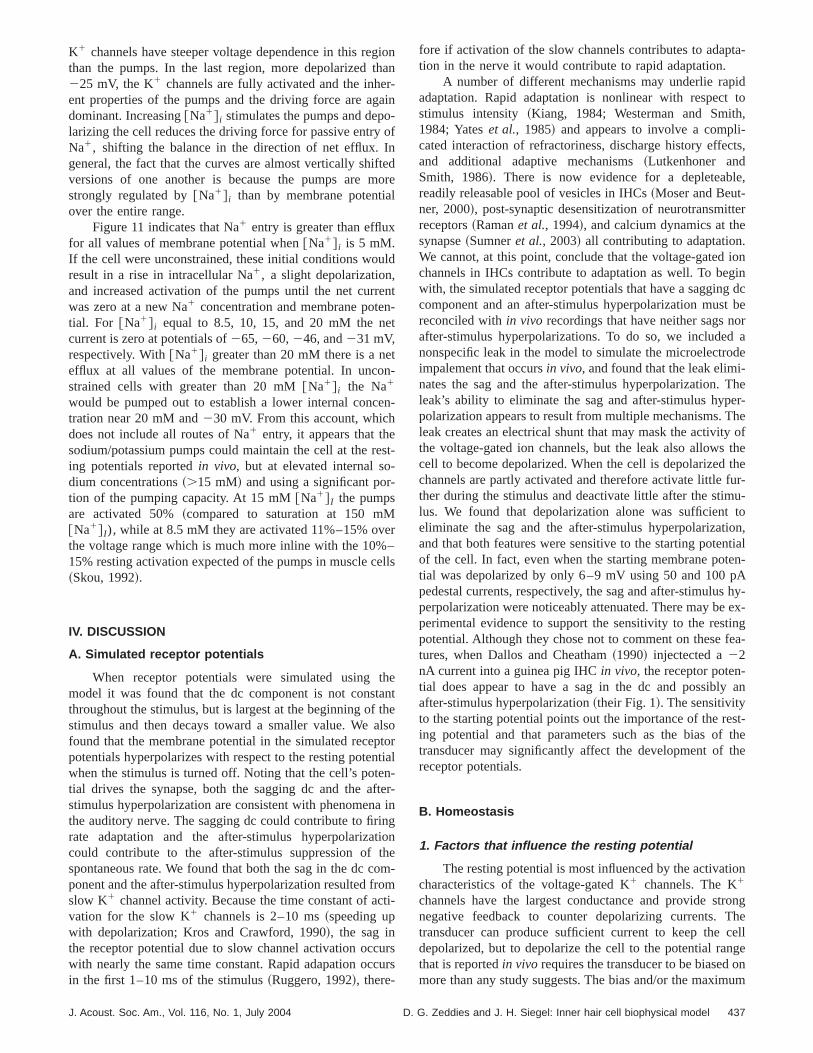
Steady state provides the constraint that the passive1
influx and the active Na1 efflux ~extruded by the sodiumpotassium pumps! must be equal when the cell is at rest. TNa1 current that the pumps develop depends on the incellular Na1 concentration but the current is also influencby the membrane potential. More current is produced w@Na1# i is high and the cell is depolarized. For example,@Na1# i is 5 mM and the membrane potential is260 mV,then about 1 pA of Na1 current is developed by th(Na1,K1)-ATPase pump enzymes. When@Na1# i is 15 mMand the membrane potential is zero the pumps’ Na1 effluxrises to 18 pA~Fig. 11!. In steady state the sum of all routeof Na1 entry must not exceed the extrusion rate at a giv@Na1# i and membrane potential. Here we are concerned wNa1 entry through the voltage-gated potassium channels,any other routes of entry would be added to this influx. Fexample, the apical transducer and the Cl2 cotransportercontribute to Na1 entry, and other cotransporters~not in-cluded in the model! such as sodium/calcium exchanges asodium/proton exchanges could represent significant souof Na1. The magnitude of Na1 entry through cotransporteris not known but in the case ofpH regulation extruding Na1
brought in by the sodium/proton exchanger may requirlarge portion of the (Na1,K1)-ATPase pump capacity~Ro-nan and Mroz, 1996!.
In the model we have included a permeability ratio0.01 to calculate the Na1 current entering through thvoltage-gated K1 channels. Because these channels aresitive to the membrane potential, the Na1 current through thechannels will also be a function of the potential. The mo
436 J. Acoust. Soc. Am., Vol. 116, No. 1, July 2004
r
hee
t-gthets
t-
-
on,
pen
a
a-
nf
nthutr
des
a
f
n-
e
depolarized the membrane potential, the larger the Na1 cur-rent and the greater the demand on the sodium/potasspumps. In the model, less than 2 pA of Na1 current flowsthrough the K1 channels when the membrane potential270 mV, but at240 mV, with more K1 channels open, 24pA flows. The Na1 influx at 240 mV can be greater than thpump capacity at that potential. Does this place an uplimit on the resting potential?
The model is particularly useful for investigating thinteractions between the components regulating@Na1# i . Asmentioned, increasing@Na1# i and depolarizing the celstimulates the pumps and increases Na1 efflux. Increasing@Na1# i and depolarizing the cell also decreases the drivforce for Na1 entry, but at the same time depolarization icreases Na1 conductance by opening more K1 channels.Figure 11 shows the net Na1 current that flows across thbasolateral membrane as a function of voltage and@Na1# i .Calculations for Fig. 11 include a 7 pS Na1 conductance forthe Cl2 cotransporter~see Appendix! but do not include Na1
entry through the transducer. For each curve,@Na1# i wasfixed at the value indicated by the parameter on the cuNet Na1 current was then calculated for membrane pottials ranging from2100 to 0 mV. Negative net current iproduced when Na1 entry exceeds Na1 extrusion. This isequivalent to an experiment in which both voltage and ccentration are clamped.
Three distinct regions can be found in Fig. 11 for intemediate values of@Na1# i . At membrane potentials more hyperpolarized than265 mV the net current is minimally affected by membrane potential but is strongly dependent u@Na1# i . In this region the voltage-gated K1 channels areclosed, so there is little passive Na1 influx. The slope of thecurves is positive due to activation of the pumps and redtion of the driving force for Na1 influx. Between265 and225 mV the K1 channels activate, producing a voltagdependent Na1 influx that results in steep negative slopes fall curves. The negative slopes indicate that it is increasindifficult for the pumps to handle the added Na1 influx at anyparticular @Na1# i-voltage combination. This is because th
FIG. 11. Net Na1 current across the basolateral membrane as a functiomembrane potential. A positive current is defined as net Na1 efflux, there-fore a negative current occurs when the Na1 entry exceeds the Na1 extru-sion rate. In the case when@Na# i is 5 mM there is a net inward flux over theentire membrane potential range indicating that 5 mM@Na# i cannot be sus-tained. All of the other@Na# i cross zero where the active and passive fluxbalance. For@Na# i58.5, 10, 15, and 20 mM the zero current occurs at265,260, 246, and231 mV, respectively.
D. G. Zeddies and J. H. Siegel: Inner hair cell biophysical model
ghar-a
o-o
Infte
ol
ld,en-et
etn
en
es--
e–
el
thanthalpttinfteaintiothooct
ucu
ta-
idto,
i-cts,
le,
tere.ionging dc
beor
ade
-Theer-he
y ofthethefur-u-to
on,ntialen-pA
hy-ex-ingea-
an
st-the
the
ion
ronghe
cellge
onum
K1 channels have steeper voltage dependence in this rethan the pumps. In the last region, more depolarized t225 mV, the K1 channels are fully activated and the inheent properties of the pumps and the driving force are agdominant. Increasing@Na1# i stimulates the pumps and deplarizing the cell reduces the driving force for passive entryNa1, shifting the balance in the direction of net efflux.general, the fact that the curves are almost vertically shiversions of one another is because the pumps are mstrongly regulated by@Na1# i than by membrane potentiaover the entire range.
Figure 11 indicates that Na1 entry is greater than effluxfor all values of membrane potential when@Na1# i is 5 mM.If the cell were unconstrained, these initial conditions wouresult in a rise in intracellular Na1, a slight depolarizationand increased activation of the pumps until the net currwas zero at a new Na1 concentration and membrane potetial. For @Na1# i equal to 8.5, 10, 15, and 20 mM the ncurrent is zero at potentials of265,260,246, and231 mV,respectively. With@Na1# i greater than 20 mM there is a nefflux at all values of the membrane potential. In uncostrained cells with greater than 20 mM@Na1# i the Na1
would be pumped out to establish a lower internal conctration near 20 mM and230 mV. From this account, whichdoes not include all routes of Na1 entry, it appears that thesodium/potassium pumps could maintain the cell at the ring potentials reportedin vivo, but at elevated internal sodium concentrations~.15 mM! and using a significant portion of the pumping capacity. At 15 mM@Na1# I the pumpsare activated 50%~compared to saturation at 150 mM@Na1# I), while at 8.5 mM they are activated 11%–15% ovthe voltage range which is much more inline with the 10%15% resting activation expected of the pumps in muscle c~Skou, 1992!.
IV. DISCUSSION
A. Simulated receptor potentials
When receptor potentials were simulated usingmodel it was found that the dc component is not constthroughout the stimulus, but is largest at the beginning ofstimulus and then decays toward a smaller value. Wefound that the membrane potential in the simulated recepotentials hyperpolarizes with respect to the resting potenwhen the stimulus is turned off. Noting that the cell’s potetial drives the synapse, both the sagging dc and the astimulus hyperpolarization are consistent with phenomenthe auditory nerve. The sagging dc could contribute to firrate adaptation and the after-stimulus hyperpolarizacould contribute to the after-stimulus suppression ofspontaneous rate. We found that both the sag in the dc cponent and the after-stimulus hyperpolarization resulted frslow K1 channel activity. Because the time constant of avation for the slow K1 channels is 2–10 ms~speeding upwith depolarization; Kros and Crawford, 1990!, the sag inthe receptor potential due to slow channel activation occwith nearly the same time constant. Rapid adapation ocin the first 1–10 ms of the stimulus~Ruggero, 1992!, there-
J. Acoust. Soc. Am., Vol. 116, No. 1, July 2004 D.
ionn
in
f
dre
nt
-
-
t-
r
ls
etesooral-r-ingnem-mi-
rsrs
fore if activation of the slow channels contributes to adaption in the nerve it would contribute to rapid adaptation.
A number of different mechanisms may underlie rapadaptation. Rapid adaptation is nonlinear with respectstimulus intensity ~Kiang, 1984; Westerman and Smith1984; Yateset al., 1985! and appears to involve a complcated interaction of refractoriness, discharge history effeand additional adaptive mechanisms~Lutkenhoner andSmith, 1986!. There is now evidence for a depleteabreadily releasable pool of vesicles in IHCs~Moser and Beut-ner, 2000!, post-synaptic desensitization of neurotransmitreceptors~Ramanet al., 1994!, and calcium dynamics at thsynapse~Sumneret al., 2003! all contributing to adaptationWe cannot, at this point, conclude that the voltage-gatedchannels in IHCs contribute to adaptation as well. To bewith, the simulated receptor potentials that have a saggincomponent and an after-stimulus hyperpolarization mustreconciled within vivo recordings that have neither sags nafter-stimulus hyperpolarizations. To do so, we includednonspecific leak in the model to simulate the microelectroimpalement that occursin vivo, and found that the leak eliminates the sag and the after-stimulus hyperpolarization.leak’s ability to eliminate the sag and after-stimulus hyppolarization appears to result from multiple mechanisms. Tleak creates an electrical shunt that may mask the activitthe voltage-gated ion channels, but the leak also allowscell to become depolarized. When the cell is depolarizedchannels are partly activated and therefore activate littlether during the stimulus and deactivate little after the stimlus. We found that depolarization alone was sufficienteliminate the sag and the after-stimulus hyperpolarizatiand that both features were sensitive to the starting poteof the cell. In fact, even when the starting membrane pottial was depolarized by only 6–9 mV using 50 and 100pedestal currents, respectively, the sag and after-stimulusperpolarization were noticeably attenuated. There may beperimental evidence to support the sensitivity to the restpotential. Although they chose not to comment on these ftures, when Dallos and Cheatham~1990! injectected a22nA current into a guinea pig IHCin vivo, the receptor poten-tial does appear to have a sag in the dc and possiblyafter-stimulus hyperpolarization~their Fig. 1!. The sensitivityto the starting potential points out the importance of the reing potential and that parameters such as the bias oftransducer may significantly affect the development ofreceptor potentials.
B. Homeostasis
1. Factors that influence the resting potential
The resting potential is most influenced by the activatcharacteristics of the voltage-gated K1 channels. The K1
channels have the largest conductance and provide stnegative feedback to counter depolarizing currents. Ttransducer can produce sufficient current to keep thedepolarized, but to depolarize the cell to the potential ranthat is reportedin vivo requires the transducer to be biasedmore than any study suggests. The bias and/or the maxim
437G. Zeddies and J. H. Siegel: Inner hair cell biophysical model
ieio
etehhee
sw,
er/
-
e
to
uma
rthan-y
-
-
.
etly,
llesn
heth
ady
oc-Thecerzed
ithdi-
fells
-va-ed,
to
lu-
d
ion
e ofeen
te-rialy
sno,3;-ednosethese
ary
el-up-01
conductance of the transducer, however, could be sufficto eliminate the sag and after-stimulus hyperpolarizatseen in the simulated receptor potentials.
2. Resting potential and homeostasis
By considering ionic homeostasis, the model providanother way to think about constraints on the resting potial. The sodium/potassium pumps represent the only metof extruding Na1 against its gradient and consequently tsteady-state influx of Na1 must be limited to less than thmaximum active transport rate.
While the sodium/potassium pump capacity for IHChas not been measured, it is clear that IHCs do not stainfor (Na1,K1)-ATPase~Kuijpers and Bonting, 1969; Mees1983; Kerr et al., 1982; Anniko et al., 1984!, and the(Na1,K1)-ATPase activity in outer hair cells is meag~Sunoseet al., 1992!. The model used for the sodiumpotassium pumps is based on cardiac cells~Lemieux et al.,1990; Chapmanet al., 1983! and the pump density is calibrated to data for the goldfish saccular hair cells~Mroz et al.,1993a; Mrozet al., 1993b!. In goldfish endolymph the Na1
concentration is about 53 mM~Naito et al., 1965, as cited byMatsuuraet al., 1971! which is substantially higher than th1 mM found in mammalian endolymph~e.g., Salt and Kon-ishi, 1986!. For this reason goldfish hair cells are likelycontend with greater Na1 influx than mammalian hair cellsand calibrating the capacity of the IHC sodium/potassipump using goldfish data is expected to be an overestimYet, upon inclusion of a minimal Na1 conductance throughthe voltage-gated K1 channels (PNa/PK50.01) it was foundthat as the membrane potential depolarized and the K1 con-ductance increased, the inward Na1 current could be largethan the active efflux capacity of the pumps. As a result,more depolarized the resting potential the higher the intrellular Na1 concentration. Maintaining the expected low itracellular@Na1# at moderate pump capacity requires a hperpolarized resting potential of about265 mV to maintain8.5 mM @Na1# I at ,15% pump capacity. In the model, simulations with resting potentials in the range of230 to 245mV that are reported forin vivo studies with sharp microelectrodes have higher intracellular@Na1# of .15 mM andthe pumps must operate near 50% of maximum capacity
3. Implications for isolated hair cells andnoise-induced hearing loss
A consequence of including a small Na1 conductancethrough the voltage-dependent basolateral K1 channels isthat current flowing through the transducer places a mbolic load on the IHC. Even if endolymph contained onK1 ions, the current through the transducer is depolarizingincreases the number of basolateral K1 channels that areopen, which increases the Na1 current that enters the cethrough the basolateral K1 channels. Steady state requirthat the net current through the transducer equals thebasolateral current. Therefore, the outward K1 currentthrough the basolateral K1 channels must be greater than tK1 current through the transduction channels by exactlyinward Na1 current through the basolateral K1 channels.This leads to an increase in@Na1# and a decrease in@K1#
438 J. Acoust. Soc. Am., Vol. 116, No. 1, July 2004
ntn
sn-od
ell
te.
ec-
-
a-
it
et
e
inside the cell~a rundown of gradients!. Indeed, any depo-larizing current that is activated by depolarization would leto a decrease in the K1 gradient—for example, calcium entrto drive synaptic transmission~not included in the model!.
The least metabolic load and largest ionic gradientscur when the resting transducer conductance is zero.model predicts that a cell with a nonfunctional transduwould have larger ionic gradients and a more hyperpolariresting potential than anin vivo cell with a standing trans-ducer current. While this means that isolated hair cells wblocked transducers should be healthy, it points out alemma for studying hair cellsin vitro, as noted by Mrozet al. ~1993a!, their low calcium bath improved the yield oisolated goldfish saccular hair cells but rendered the cunusable for studying transduction.
Simulating in vitro conditions with a functional transducer resulted in run down of ionic gradients and an eletion in the membrane potential. Sodium loading of isolathair cells is a recognized problem~Corey and Hudspeth1979; Mrozet al., 1993a; Mrozet al., 1993b; Sunoseet al.,1992! and isolated outer hair cells have been observedhave high intracellular sodium~Ikeda et al., 1994!. The@Na1# i of isolated outer hair cells in a standard NaCl sotion has been measured to be about 100 mM~Ikeda et al.,1994!, which is comparable to the Na1 accumulation seen inFig. 10~b!. Both inner and outer hair cells in the isolatecochlea have been observed to accumulate Na1, and the rateof accumulation could be reduced by blocking transduct~Liu, 1996!.
Metabolic exhaustion has been postulated as a causnoise induced hearing loss but a mechanism has not bforthcoming ~Bohne, 1976; Borget al., 1995!. Long expo-sure~greater than 1 h! to moderate intensity sound~between90 and 115 dB SPL! results in damage to sensory cells sreotyped by cell swelling and degradation of mitochond~Spoendlin, 1976!. Because endolymph contains primariK1 and is at a positive potential, the current that flowthrough the transducer had been thought to exact little, ormetabolic cost~Johnstone and Sellick, 1972; Dallos, 197Wangemann and Schacht, 1996!. However, as explained earlier, if a minimal Na1 conductance through the voltage-gatK1 channels is included then the transducer current islonger metabolically neutral. Cells responding to intensounds would require greater amounts of ATP to removeinflux of Na1. The ultimate cause of cell death due to noiis almost certainly more complicated, but Na1 entry and theconsequent run-down of ionic gradients may be a primevent that puts the cell at risk.
ACKNOWLEDGMENTS
The authors wish to thank Dr. Peter Dallos and Dr. Nson Spruston for their helpful comments. This work was sported by NSF Grant No. BNS-9114245, NIH Grant No. RDC02021, and Northwestern University.
D. G. Zeddies and J. H. Siegel: Inner hair cell biophysical model
thls,orn
seaiA
ed
old
o
er
neonfisp
sL
mnr-retre
ioneer
se
it
Mfo
ce
e
on-nder
e
s
yclese
theps
ty.nc-er
ian-eitntlarwsto
e
n-tial
teatu-
ehair00
a
p
ndi-
APPENDIX A: SODIUM ÕPOTASSIUM PUMPS
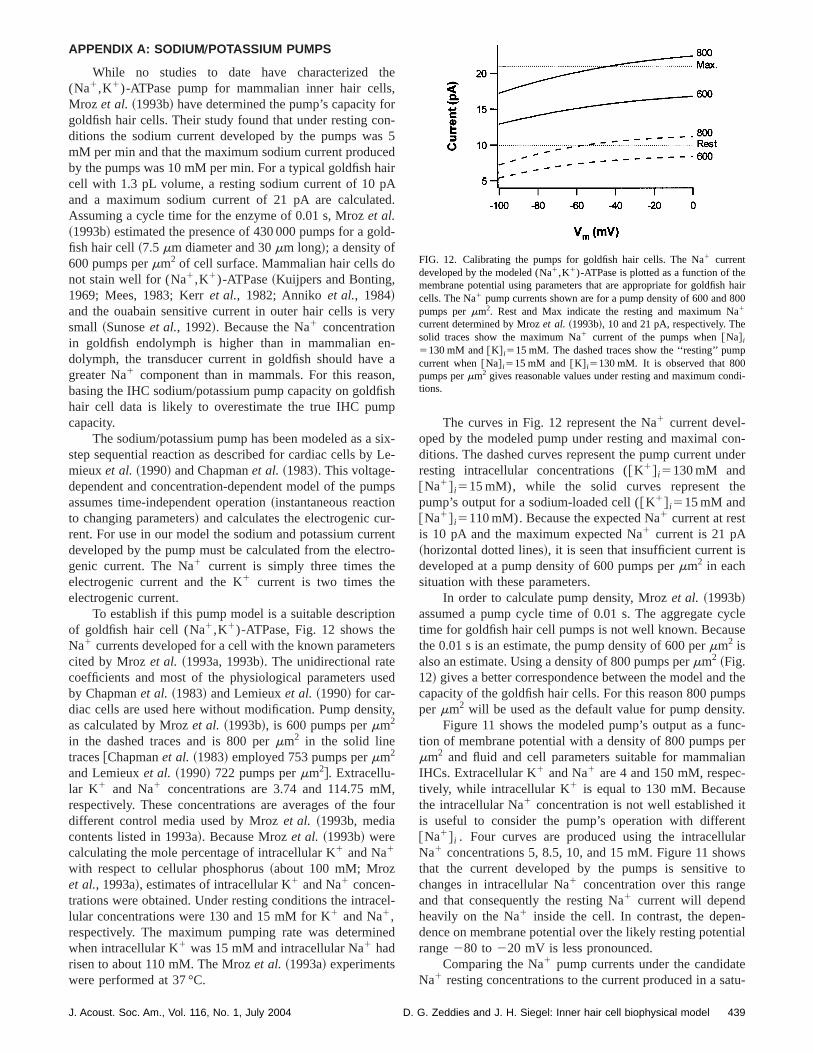
While no studies to date have characterized(Na1,K1)-ATPase pump for mammalian inner hair celMroz et al. ~1993b! have determined the pump’s capacity fgoldfish hair cells. Their study found that under resting coditions the sodium current developed by the pumps wamM per min and that the maximum sodium current producby the pumps was 10 mM per min. For a typical goldfish hcell with 1.3 pL volume, a resting sodium current of 10 pand a maximum sodium current of 21 pA are calculatAssuming a cycle time for the enzyme of 0.01 s, Mrozet al.~1993b! estimated the presence of 430 000 pumps for a gfish hair cell~7.5mm diameter and 30mm long!; a density of600 pumps permm2 of cell surface. Mammalian hair cells dnot stain well for (Na1,K1)-ATPase~Kuijpers and Bonting,1969; Mees, 1983; Kerret al., 1982; Anniko et al., 1984!and the ouabain sensitive current in outer hair cells is vsmall ~Sunoseet al., 1992!. Because the Na1 concentrationin goldfish endolymph is higher than in mammalian edolymph, the transducer current in goldfish should havgreater Na1 component than in mammals. For this reasbasing the IHC sodium/potassium pump capacity on goldhair cell data is likely to overestimate the true IHC pumcapacity.
The sodium/potassium pump has been modeled as astep sequential reaction as described for cardiac cells bymieuxet al. ~1990! and Chapmanet al. ~1983!. This voltage-dependent and concentration-dependent model of the puassumes time-independent operation~instantaneous reactioto changing parameters! and calculates the electrogenic curent. For use in our model the sodium and potassium curdeveloped by the pump must be calculated from the elecgenic current. The Na1 current is simply three times thelectrogenic current and the K1 current is two times theelectrogenic current.
To establish if this pump model is a suitable descriptof goldfish hair cell (Na1,K1)-ATPase, Fig. 12 shows thNa1 currents developed for a cell with the known parametcited by Mrozet al. ~1993a, 1993b!. The unidirectional ratecoefficients and most of the physiological parameters uby Chapmanet al. ~1983! and Lemieuxet al. ~1990! for car-diac cells are used here without modification. Pump densas calculated by Mrozet al. ~1993b!, is 600 pumps permm2
in the dashed traces and is 800 permm2 in the solid linetraces@Chapmanet al. ~1983! employed 753 pumps permm2
and Lemieuxet al. ~1990! 722 pumps permm2#. Extracellu-lar K1 and Na1 concentrations are 3.74 and 114.75 mrespectively. These concentrations are averages of thedifferent control media used by Mrozet al. ~1993b, mediacontents listed in 1993a!. Because Mrozet al. ~1993b! werecalculating the mole percentage of intracellular K1 and Na1
with respect to cellular phosphorus~about 100 mM; Mrozet al., 1993a!, estimates of intracellular K1 and Na1 concen-trations were obtained. Under resting conditions the intralular concentrations were 130 and 15 mM for K1 and Na1,respectively. The maximum pumping rate was determinwhen intracellular K1 was 15 mM and intracellular Na1 hadrisen to about 110 mM. The Mrozet al. ~1993a! experimentswere performed at 37 °C.
J. Acoust. Soc. Am., Vol. 116, No. 1, July 2004 D.
e
-5dr
.
-
y
-a,h
ix-e-
ps
nto-
s
d
y,
,ur
l-
d
The curves in Fig. 12 represent the Na1 current devel-oped by the modeled pump under resting and maximal cditions. The dashed curves represent the pump current uresting intracellular concentrations (@K1# i5130 mM and@Na1# i515 mM), while the solid curves represent thpump’s output for a sodium-loaded cell (@K1# i515 mM and@Na1# i5110 mM). Because the expected Na1 current at restis 10 pA and the maximum expected Na1 current is 21 pA~horizontal dotted lines!, it is seen that insufficient current ideveloped at a pump density of 600 pumps permm2 in eachsituation with these parameters.
In order to calculate pump density, Mrozet al. ~1993b!assumed a pump cycle time of 0.01 s. The aggregate ctime for goldfish hair cell pumps is not well known. Becauthe 0.01 s is an estimate, the pump density of 600 permm2 isalso an estimate. Using a density of 800 pumps permm2 ~Fig.12! gives a better correspondence between the model andcapacity of the goldfish hair cells. For this reason 800 pumper mm2 will be used as the default value for pump densi
Figure 11 shows the modeled pump’s output as a fution of membrane potential with a density of 800 pumps pmm2 and fluid and cell parameters suitable for mammalIHCs. Extracellular K1 and Na1 are 4 and 150 mM, respectively, while intracellular K1 is equal to 130 mM. Becausthe intracellular Na1 concentration is not well establishedis useful to consider the pump’s operation with differe@Na1# i . Four curves are produced using the intracelluNa1 concentrations 5, 8.5, 10, and 15 mM. Figure 11 shothat the current developed by the pumps is sensitivechanges in intracellular Na1 concentration over this rangand that consequently the resting Na1 current will dependheavily on the Na1 inside the cell. In contrast, the depedence on membrane potential over the likely resting potenrange280 to 220 mV is less pronounced.
Comparing the Na1 pump currents under the candidaNa1 resting concentrations to the current produced in a s
FIG. 12. Calibrating the pumps for goldfish hair cells. The Na1 currentdeveloped by the modeled (Na1,K1)-ATPase is plotted as a function of thmembrane potential using parameters that are appropriate for goldfishcells. The Na1 pump currents shown are for a pump density of 600 and 8pumps permm2. Rest and Max indicate the resting and maximum N1
current determined by Mrozet al. ~1993b!, 10 and 21 pA, respectively. Thesolid traces show the maximum Na1 current of the pumps when@Na# i
5130 mM and@K# i515 mM. The dashed traces show the ‘‘resting’’ pumcurrent when@Na# i515 mM and@K# i5130 mM. It is observed that 800pumps permm2 gives reasonable values under resting and maximum cotions.
439G. Zeddies and J. H. Siegel: Inner hair cell biophysical model
fraet
h
1%
p
dy
tia
e
g
gt
or
ohef-in
af
7a
bi-
olall
ont.
es
thek’’
-
-
ind
ndtors,
’ J.
i.
a-
-
RL
rating condition of 150 mM@Na1# i gives the percentage omaximum pump capacity at rest. If the estimate of the intcellular Na1 concentration of 5 mM is correct and the modof the pumps is representative, then the pumps are operaat only 3% capacity. However when@Na1# i is 15 mM, theresting capacity over the voltage range2100 to 0 mV is41%–50%, which leaves little reserve for active cells. Texpected capacity at rest~for muscle cells! is between 10%and 15%~Skou, 1992!. When the intracellular Na1 concen-tration is 8.5 mM the pumps are activated to between 1and 15% over the voltage range~with @Na1# i510 mM acti-vation is 17%–22%!.
APPENDIX B: CHLORIDE PUMP, CL À CONDUCTANCE,AND LEAK CONDUCTANCE FOR NA ¿
From the development of the sodium/potassium pumwe have estimates of how much Na1 current flows across thebasolateral membrane under resting conditions~Fig. 11!. Be-cause the active extrusion of Na1 by the sodium/potassiumpumps is the only way for sodium to leave the cell, steastate requirements constrain the passive influx of Na1 to beequal to the efflux.
The estimate for the Cl2 Nernst potential (EClst) of 230mV ~see Sec. II! and the assumption that the resting potenis hyperpolarized with respect to230 mV, requires that themodel incorporate an active chloride transporter to conctrate Cl2 inside the cell. The squid giant axon has suchcarrier in which 3 Cl2 ions are transported into the cell alonwith 2 Na1 and 1 K1 using the energy of the Na1 gradient~Russell, 1983; Altamirano and Russell, 1987!. In these stud-ies it was found that when the squid axon was voltaclamped to260 mV, Cl2 was brought into the cell so thathe Nernst potential for Cl2 settled at about240 mV.
No data are available to give an indication of transpcapacity of the Na1/K1/Cl2 current in hair cells, but it isnoted that the steady-state Na1 influx through the Cl2 trans-porter must be less than the Na1 efflux generated by the(Na1,K1)-ATPase pumps. If the Na1/K1/Cl2 current ismaximized, by setting the Na1 influx equal to the Na1 cur-rent generated by the (Na1,K1)-ATPase pumps, then nother Na1 entry would be tolerable. Conversely, setting tNa1/K1/Cl2 cotransport capacity very low makes the efects of this current on resting potential difficult to ascertain simulations. For these reasons the Na1 current due totransport carriers will be arbitrarily designated as 1 pA250 mV. A 1 pA Na1 current with the assumptions oENast591 mV and a membrane potential of250 mV gives aNa1 conductance for the Cl2 transporter of 7 pS.
For use in the model the Na1/K1/Cl2 cotransporter istreated very simplistically. The Na1 conductance is set topS, the K1 current is then calculated as one half of the N1
current and the Cl2 current is three halves of the Na1 cur-rent. Isolated hair cells are relatively impermeant to Cl2 ions~Ashmore and Meech, 1986; Sunoseet al., 1992!. Gitteret al. ~1986!, however, found voltage-gated Cl2 channels inmembrane patches pulled from an OHC. Because thephysical model requires a Cl2 conductance and little information is known, it will be considered static~not voltage
440 J. Acoust. Soc. Am., Vol. 116, No. 1, July 2004
-ling
e
s
-
l
n-a
e
t
t
o-
dependent! with a magnitude of 100 pS. While there are ndirect data to support the chosen value of 100 pS for C2
conductance, it is observed that the requirement of a smconductance combined with a low driving force~about 30mV! means that Cl2 should play only a minor role in settingthe IHC resting potential.
Because Na1 has such a high driving force for entry intthe cell, a small conductance would give rise to large curreThe 7 pS value chosen for the Na1 conductance inNa1/K1/Cl2 transporter is set to a maximal size that donot impose unwarranted restrictions on Na1 entry at othersites. While it does represent a maximal value, 7 pS is onorder of a single channel. For this reason no other ‘‘leaconductance for Na1 is incorporated into the model.
Altamirano, A. A., and Russell, J. M.~1987!. ‘‘Coupled Na/K/Cl efflux.‘Reverse’ unidirectional fluxes in squid giant axons,’’ J. Gen. Physiol.89,669–686.
Anniko, M., Lim, D., and Wroblewski, R.~1984!. ‘‘Elemental compositionof individual cells and tissues in the cochlea,’’ Acta Oto-Laryngol.98,439–453.
Appenrodt, P., and Kros, C. J.~1997!. ‘‘Single-channel recordings of largeconductance Ca21 activated K1 channels,’’ J. Physiol.~London! 507,147P.
Ashmore, J. F., and Meech, R. W.~1986!. ‘‘Ionic basis of membrane potential in outer hair cells of guinea pig cochlea,’’ Nature~London! 322, 368–371.
Assad, J. A., Shepard, G. M., and Corey, D. P.~1991!. ‘‘Tip-link integrityand mechanical transduction in vertebrate hair cells,’’ Neuron7, 985–994.
Bohne, B. A.~1976!. ‘‘Mechanisms of noise damage in the inner ear,’’Effects of Noise on Hearing, edited by D. Henderson, R. P. Hamernik, anD. S. M. J. H. Dosanjh~Raven, New York!, pp. 41–68.
Borg, E., Canlon, B., and Engstrom, B.~1995!. ‘‘Noise-induced hearingloss. Literature review and experiments in rabbits. Morphological aelectrophysiological features, exposure parameters and temporal facvariability and interactions,’’ Scand. Audiol. Suppl.40, 1–147.
Chapman, J. B., Johnson, E. A., and Kootsey, J. M.~1983!. ‘‘Electrical andbiochemical properties of an enzyme model of the sodium pump.’Membr. Biol. 74, 139–153.
Cody, A. R., and Russell, I. J.~1987!. ‘‘The response of hair cells in thebasal turn of the guinea-pig cochlea to tones,’’ J. Physiol.~London! 383,551–569.
Corey, D. P., and Hudspeth, A. J.~1979!. ‘‘Ionic basis of the receptor po-tential in a vertebrate hair cell,’’ Nature~London! 281, 675–677.
Crawford, A. C., Evans, M. G., and Fettiplace, R.~1989!. ‘‘Activation andadaptation of transducer currents in turtle hair cells,’’ J. Physiol.~London!419, 405–434.
Dallos, P.~1973!. The Auditory Periphery: Biophysics and Physiology~Aca-demic, New York!.
Dallos, P.~1984!. ‘‘Some electrical circuit properties of the organ of CortII. Analysis including reactive elements,’’ Hear. Res.14, 281–291.
Dallos, P.~1985!. ‘‘Membrane potential and response changes in mammlian cochlear hair cells during intracellular recording,’’ J. Neurosci.5,1609–1615.
Dallos, P., and Cheatham, M. A.~1989!. ‘‘Cochlear nonlinearities reflectedin inner hair cell responses,’’ inCochlear Mechanisms: Structure, Function, and Models, edited by J. P. Wilson and D. T. Kemp~Plenum, NewYork!, pp. 197–204.
Dallos, P., and Cheatham, M. A.~1990!. ‘‘Effects of electrical polarizationon inner hair cell receptor potentials,’’ J. Acoust. Soc. Am.87, 1636–1647.
Dulon, D., Sugasawa, M., Blanchet, C., and Erostegui, C.~1995!. ‘‘Directmeasurements of Ca~21!-activated K1 currents in inner hair cells of theguinea-pig cochlea using photolabile Ca21 chelators,’’ Pfluegers Arch.430, 365–373.
Gitter, A. H., Zenner, H. P., and Fromter, E.~1986!. ‘‘Membrane potentialand ion channels in isolated outer hair cells of guinea pig cochlea,’’ OJ. Otorhinolaryngol. Relat. Spec.48, 68–75.
Gitter, A. H., and Zenner, H. P.~1990!. ‘‘The cell potential of isolated innerhair cellsin vitro,’’ Hear. Res.45, 87–93.
D. G. Zeddies and J. H. Siegel: Inner hair cell biophysical model
co
-
ell
mm
r
i
a
lea
r o
i
ees
e
--
r, Ater
sa
lth
c-
d
cell
g,’’
for
yy
air
siol.
-.
fneu-
llu-
the
y
-
dsis,
Ikeda, K., Sunose, H., and Takasaka, T.~1994!. ‘‘Ion transport mechanismsin the outer hair cell of the mammalian cochlea,’’ Prog. Neurobiol.~Ox-ford! 42, 703–717.
Johnstone, B. M., and Sellick, P. M.~1972!. ‘‘The peripheral auditory appa-ratus,’’ Q. Rev. Biophys.5, 1–57.
Kerr, T. P., Ross, M. D., and Ernst, S. A.~1982!. ‘‘Cellular localization ofNa1, K1-ATPase in the mammalian cochlear duct: Significance forchlear fluid balance,’’ Am. J. Otolaryngol.3, 332–338.
Kiang, N. Y. S.~1984!. ‘‘Peripheral neural processing of auditory information,’’ in Handbook of Physiology, edited by I. Darian-Smith~AmericanPhysiology Society, Bethesda!, Sec. I. ~The Nervous System!, Vol. III~Sensory Processes, Part 2!, pp. 639–694.
Kiang, N. Y. S., Watanabe, T., Thomas, C., and Clark, L. F.~1965!. Dis-charge Patterns of Single Fibers in the Cat’s Auditory Nerve~MIT, Cam-bridge!.
Kirkwood, N. K., and Kros, C. J.~1997!. ‘‘Rapid photorelease of calciumaugments the fast potassium conductance of guinea-pig inner hair cJ. Physiol.~London! 504, 127P.
Kros, C. J.~1989!. ‘‘Membrane properties of inner hair cells isolated frothe guinea-pig cochlea,’’ Ph.D. thesis, University of Cambridge, Cabridge, England.
Kros, C. J.~1996!. ‘‘Physiology of mammalian cochlear hair cells,’’ inTheCochlea, edited by P. Dallos, A. N. Popper, and R. R. Fay~Springer, NewYork!, pp. 318–385.
Kros, C. J., and Crawford, A. C.~1990!. ‘‘Potassium currents in inner haicells isolated from the guinea-pig cochlea,’’ J. Physiol.~London! 421,263–291.
Kros, C. J., Ruppersberg, J. P., and Rusch, A.~1998!. ‘‘Expression of apotassium current in inner hair cells during development of hearingmice,’’ Nature~London! 394, 281–284.
Kros, C. J., Rusch, A., Lennan, G. W. T., and Richardson, G. P.~1993!.‘‘Voltage dependence of transducer currents in outer hair cells of neonmice,’’ in Biophysics of Hair Cell Sensory Systems, edited by H. Duifhuis,J. W. Horst, P. v. Dijk, and S. M. v. Netten~World Scientific, Singapore!,pp. 141–150.
Kros, C. J., Rusch, A., and Richardson, G. P.~1992!. ‘‘Mechano-electricaltransducer currents in hair cells of the cultured neonatal mouse cochProc. R. Soc. London, Ser. B249, 185–193.
Kuijpers, W., and Bonting, S. L.~1969!. ‘‘Studies on (Na1-K1)-activatedATPase. XXIV. Localization and properties of ATPase in the inner eathe guinea pig,’’ Biochim. Biophys. Acta173, 477–485.
Lemieux, D. R., Roberge, F. A., and Savard, P.~1990!. ‘‘A model study ofthe contribution of active Na-K transport to membrane repolarizationcardiac cells,’’ J. Theor. Biol.142, 1–34.
Liu, T. C. ~1996!. ‘‘Measurement of intracellular ionic concentrations in thisolated organ of corti using fluorescent probes,’’ Ph.D. thesis, Northwern University, Evanston, IL.
Lutkenhoner, B., and Smith, R. L.~1986!. ‘‘Rapid adaptation of auditory-nerve fibers: Fine structure at high stimulus intensities,’’ Hear. Res.24,289–294.
Marty, A., and Neher, E.~1983!. ‘‘Tight-seal whole-cell recording,’’ inSingle-Channel Recording, edited by B. Sakmann and E. Neher~Plenum,New York!, pp. 107–121.
Matsuura, S., Ikeda, K., and Furukawa, T.~1971!. ‘‘Effects of Na1, K1, andouabain on microphonic potentials of the goldfish inner ear,’’ JapanesPhysiol.21, 563–578.
Mees, K. ~1983!. ‘‘Ultrastructural localization of K1-dependent, ouabainsensitive NPPase~Na-K-ATPase! in the guinea pig inner ear,’’ Acta OtoLaryngol.95, 277–289.
Meyer, J., Furness, D. N., Zenner, H. P., Hackney, C. M., and GummeW. ~1998!. ‘‘Evidence for opening of hair-cell transduction channels aftip-link loss,’’ J. Neurosci.18, 6748–6746.
Moser, T., and Beutner, D.~2000!. ‘‘Kinetics of exocytosis and endocytosiat the cochlear inner hair cell afferent synapse of the mouse,’’ Proc. NAcad. Sci. USA97, 883–888.
Mountain, D. C., and Hubbard, A. E.~1996!. ‘‘Physiology of mammaliancochlear hair cells,’’ inAuditory Computation, edited by H. L. Hawkins, T.A. McMullen, A. N. Popper, and R. R. Fay~Springer, New York!, pp.121–156.
Mroz, E. A., Nissim, K. R., and Lechene, C.~1993a!. ‘‘Electron-probeanalysis of isolated goldfish hair cells: Implications for preparing heacells,’’ Hear. Res.70, 9–21.
J. Acoust. Soc. Am., Vol. 116, No. 1, July 2004 D.
-
s,’’
-
n
tal
,’’
f
n
t-
J.
.
tl.
y
Mroz, E. A., Nissim, K. R., and Lechene, C.~1993b!. ‘‘Rapid resting ionfluxes in goldfish hair cells are balanced by (Na1,K1)-ATPase,’’ Hear.
Res.70, 22–30.Naito, T., Uyematsu, H., Nakamura, T., Horii, T., and Miyazaki, T.~1965!.
‘‘Studies on inorganic ions of inner ear fluids,’’ Japanese J. Otol.68, 1628~in Japanese!.
Ohmori, H. ~1984!. ‘‘Mechanoelectrical transducer has discrete condutances in the chick vestibular hair cell,’’ Proc. Natl. Acad. Sci. USA81,1888–1891.
Ohmori, H. ~1985!. ‘‘Mechano-electrical transduction currents in isolatevestibular hair cells of the chick,’’ J. Physiol.~London! 359, 189–217.
Pongracz, F., Firestein, S., and Shepherd, G. M.~1991!. ‘‘Electrotonic struc-ture of olfactory sensory neurons analyzed by intracellular and wholepatch techniques,’’ J. Neurophysiol.65, 747–758.
Raman, I. M., Zhang, S., and Trussell, L. O.~1994!. ‘‘Pathway-specificvariants of AMPA receptors and their contribution to neuronal signalinJ. Neurosci.14, 4998–5010.
Raybould, N. P., Jagger, D. J., and Housley, G. D.~2001!. ‘‘Positional analy-sis of guinea pig inner hair cell membrane conductances: Implicationsregulation of the membrane filter,’’ J. Assoc. Res. Otolaryngol.2, 362–376.
Ronan, D., and Mroz, E. A.~1996!. ‘‘Stability of solute composition in asimple hair-cell model,’’ Abst. Assoc. Res. Otolaryngol.19, 134.
Ruggero, M. A.~1992!. ‘‘Physiology and coding of sound in the auditornerve@review#,’’ in The Mammalian Auditory Pathway: Neurophysiolog,edited by A. N. Popper and R. R. Fay~Springer, New York!, pp. 34–93.
Russell, I. J., and Sellick, P. M.~1983a!. ‘‘Low-frequency characteristics ofintracellularly recorded receptor potentials in guinea-pig cochlear hcells,’’ J. Physiol.~London! 338, 179–206.
Russell, J. M.~1983b!. ‘‘Cation-coupled chloride influx in squid axon. Roleof potassium and stoichiometry of the transport process,’’ J. Gen. Phy81, 909–925.
Salt, A. N., and Konishi, T.~1986!. ‘‘The cochlear fluids: Perylimph andendolymph,’’ in Neurobiology of Hearing: The Cochlea, edited by R. A.Altschuler, D. W. Hoffman, and R. P. Bobbin~Raven, New York!, pp.108–122.
Skou, J. C.~1992!. ‘‘The Na,K-ATPase,’’ News in Physiological Sci.7,95–100.
Slepecky, N.~1996!. ‘‘Structure of the Mammalian Cochlea,’’ inThe Co-chlea, edited by P. Dallos, A. N. Popper, and R. R. Fay~Springer, NewYork!, pp. 44–129.
Spoendlin, H.~1976!. ‘‘Anatomical changes following various noise exposures,’’ in Effects of Noise on Hearing, edited by D. Henderson, R. PHamernik, and D. S. M. J. H. Dosanjh~Raven, New York!, pp. 69–90.
Spruston, N., and Johnston, D.~1992!. ‘‘Perforated patch-clamp analysis othe passive membrane properties of three classes of hippocampalrons,’’ J. Neurophysiol.67, 508–529.
Stefani, E., and Steinbach, A. B.~1969!. ‘‘Resting potential and electricaproperties of frog slow muscle fibers. Effect of different external sotions,’’ J. Physiol.~London! 203, 383–401.
Sumner, C. J., Lopez-Poveda, E. A., O’Mard, L. P., and Meddis, R.~2003!.‘‘Adaptation in a revised inner-hair cell model,’’ J. Acoust. Soc. Am.113,893–901.
Sunose, H., Ikeda, K., Saito, Y., Nishiyama, A., and Takasaka, T.~1992!.‘‘Membrane potential measurement in isolated outer hair cells ofguinea pig cochlea using conventional microelectrodes,’’ Hear. Res.62,237–244.
Wangemann, P., and Schacht, J.~1996!. ‘‘Homeostatic mechanisms in thecochlea,’’ inThe Cochlea, edited by P. Dallos, A. N. Popper, and R. R. Fa~Springer, New York!, pp. 130–185.
Westerman, L. A., and Smith, R. L.~1984!. ‘‘Rapid and short-term adaptation in auditory nerve responses,’’ Hear. Res.15, 249–260.
Yates, G. K., Robertson, D., and Johnstone, B. M.~1985!. ‘‘Very rapidadaptation in the guinea pig auditory nerve,’’ Hear. Res.17, 1–12.
Zeddies, D. G.~2001!. ‘‘An Investigation of the influence of voltage-gateion channels on the receptor potential of inner hair cells,’’ Ph.D. theNorthwestern University, Evanston, IL.
441G. Zeddies and J. H. Siegel: Inner hair cell biophysical model


