Embed Size (px)
Citation preview
I
Biophysical and Kinetic Analysis of Escherichia
coli DNA Ligase Activity and Inhibition
Arqam Alomari
School of Biological Sciences
The thesis is submitted in partial fulfilment of the requirements for the
award of the degree of Doctor of Philosophy of the University of
Portsmouth.
July 2018
II
Abstract DNA ligases are essential enzymes across all three domains of life. Their role is to bind nicked
DNA or DNA ends and re-join broken nucleic acid strands. In bacteria, there are two key
pathways that DNA ligases are involved in: DNA replication during cell division and DNA
repair for breaks in DNA that occur as a result of damage. In E.coli, there are two genes for
DNA ligases: LigA, whose structure has been published and LigB as a second ligase (unknown
in structure) that has a different DNA, and therefore protein, sequence.
The overall aim of this work was first to clone, express, purify and test the kinetic and
binding reactions of LigA and LigB as native proteins (not fusion-tagged versions, which most
previous studies have used). This has not been reported before and the characterisation of the
kinetics of LigA and LigB are very sparse in the literature. In this study we attempted to cover
the lack of kinetic data on native LigA and LigB by studying how its functioning is affected by
varying [DNA], [NAD+], reaction temperature, [NMN] and [NH4SO4]. The aim was to find the
Vmax (maximal theoretical rate), Km (Michaelis equilibrium constant) and kcat (turnover
number) for the nick-sealing reaction with each different variable.
We found that the Km values for LigA and LigB (how tightly they bound the nicked
DNA) for singly-nicked DNA substrate were 12.22±6.42 and 3.50±1.34 nM, respectively.
Therefore, native LigA was 6.4-fold tighter than native LigB. The Km values for varying NAD+
cofactor concentration were sharply different (1.55±0.33 vs. 0.16±0.03 µM), and show that
LigB bound NAD+ 9.6 times tighter than LigA. However, the Vmax values showed that LigA
was 4-fold faster than LigB. Both native enzymes had a similar optimum temperature for
activity. For LigA this was ~20ºC, and for LigB approximately ~16ºC. The remaining two
parameters, [NMN] and [NH4SO4], were only studied for LigA. The interesting result for NMN
was that it inhibited the reaction of LigA with an IC50 of 31.34±1.58 µM. This shows that one
of the ligation products (NMN) acts as a feedback inhibitor. The Km for the ammonium sulphate
III
concentration experiment on LigA was 37.64±40.64 µM, and that [NH4SO4] stimulated the
LigA reaction when present about 1.6 fold.
The results from these characterisation studies allowed the development of a three-part
molecular screening method (in silico to in vitro to in vivo) to build towards potential future
studies that could then explore small molecule compounds that affect these basic kinetic
parameters and find new ligase inhibitors. Therefore the second aim of the work was to explore
the potential of DNA ligases (LigA in particular) as possible antibiotic targets. These involved
the use of a molecular docking programme called Molecular Operating Environment (MOE).
This software (in silico) was used to identify eight chemical compounds from a large
library of possible small molecular inhibitors. The key question in this work was to see if these
compounds could inhibit the E.coli DNA LigA in vitro (by denaturing gel experiments) and in
vivo (by Kirby-Bauer bacterial surface-inhibition experiments). We found that four out of the
eight compounds (5-Azacytidine, Geneticin (G418), Chlorhexidine and Imidazolidinyl Urea)
did inhibit the activity of LigA in vitro with IC50 values of 10.34±4.14, 45.31±13.81,
20.66±6.11 and 7.56±14.48 µM, respectively. Three of the eight compounds: Geneticin
(G418), Chlorhexidine and Imidazolidinyl, did inhibit the growth of the bacteria (in vivo) with
IC50 values of 0.63± 0.17, 0.17±0.03 and 233.25±143.35 mM, respectively. They had success
in all three areas of study (in silico, in vitro and in vivo) and make them suitable candidates for
future drug development studies as a promising chemical leads to target bacteria.
In conclusion, this thesis provides important kinetic and binding data on LigA and LigB
that will help explain how they work in E.coli. This thesis also provides clear evidence for at
least three new ligase inhibitors of E.coli.
IV
I would like to dedicate this thesis to my parents (God bless their soul), my
family and my university (Mosul)

V
Acknowledgements The massive amount of support and encourage that I have received through my PhD can�t be
easily summarised in this acknowledgement. I will ever never forget all the grateful supervisor,
family, friends and colleagues who have helped and motivated me during my research.
First of all, I would like to give a huge thanks, acknowledgements and love to my family (my
wife Marwa and my children: Mohamad, Noor and Tasneem) who was supporting and assisting
me for all these five years to finish my study, especially as they are alone in this country. I
express my sincere thanks to my sponsor (HCED) and my country Iraq for funding and giving
me this kind opportunity to carry on my Postgraduate study.
Special thanks to my greatest supervisor Dr. Darren for his wisdom and knowledge that he
gave to me to submit and end my thesis smoothly. Many thanks Dr Darren for all the support,
assistance and encouragement that you awarded to me through all my PhD and life. I will never
forget your sympathy and humanity through all the days that I struggled when my family
trapped in the last war that happened in the end of 2016 against ISIS in my city (Mosul).
I would also like to thank the rest of my supervisory team Dr. Andy and Dr. Allen for all their
comments and support that facilitated many difficulties during my PhD. In addition, I would
like to thanks my family (brothers and sister), and my aunt Mrs Sahar Alomari and my
colleagues (Mr. Fakhri and Dr. Haitham) in my city who guaranteed, encouraged and motivated
me throughout all the years even when they have been thousands of miles away. My special
appreciated and thanks to my close friend Younis Al-taweel for all his recommendations and
support that make me stay focus in my study. Finally, there are so many staff, MRes and PhD
students that I want to thank them for their help at the lab, but too many to mention. Thank you
so much for all your advice and guidance throughout my PhD.
VI
Contents Chapter 1 - Introduction
1.1. The importance of DNA Ligases 1
1.2. Ligases across the Domains of Life 2
1.3. Types of DNA Ligase 3
1.3.1. EcoLigA 4
1.3.2. EcoLigB 7
1.4. Structure of E coli DNA Ligase A 9
1.5. DNA ligation mechanism 17
1.6. Antibiotic resistance 20
1.7. Theory of Biophysical Techniques 21
1.7.1. Michaelis-Menten Kinetics 21
1.7.2. Electrophoretic Mobility-Shift Assay (EMSA) 23
1.7.3. Sedimentation Velocity Analytical Ultracentrifugation of LigA 25
1.7.4. Beta-Clamp Proteins 27
1.7.5. Molecular Docking Programme 30
1.8. Purpose of this Work 31
Chapter 2 - Materials and Methods
2.1. Electrophoresis Protocols 33
2.1.1. Agarose gel electrophoresis 33
2.1.2. Native Polyacrylamide Gel Electrophoresis (N-PAGE) 34
2.1.3. Denaturing polyacrylamide gel electrophoresis 35
2.1.4. Sodium Dodecyl Sulphate Polyacrylamide Gel Electrophoresis (SDS-PAGE)
36
VII
2.1.5. Spectrophotometry 38
2.2. Purification Protocols 39
2.2.1. Overview of LigA and LigB purification 39
2.2.2. Initial cloning of LigA and LigB genes by PCR from E.coli genomic DNA
40
2.2.3. Transformation of Plasmids 40
2.2.4. DNA Extraction (Qiagen purification) 41
2.2.5. Obtaining LigA and LigB genes by commercial synthesis (GeneArt) 42
2.2.6. DNA Restriction Enzyme Digest 43
2.2.7. Ethanol precipitation 43
2.2.8. Ligation into pET29c and pET28b 44
2.2.9. Colony PCR 45
2.2.10. DNA sequencing 46
2.2.11. Cell Culture Optical Density 47
2.2.12. Mini inductions of LigA and LigB 47
2.2.13. Testing the solubility of native LigB 48
2.2.14. Testing the solubility of expressed LigB protein in NaCl and TritonX-100
49
2.2.15. LigB refolding experiment 51
2.2.16. Main inductions of LigA and LigB 52
2.2.17. LigA purification strategy 1 55
2.2.18. LigA purification strategy 2 57
2.2.19. LigB purification strategy 1 58
2.2.20. LigB purification strategy 2 60
2.2.21. LigB purification strategy 3 61
VIII
2.2.22. Mass spectrometry of LigA and LigB 62
2.3. Kinetic Characterisation Studies 63
2.3.1. Establishing a functional DNA ligase assay 63
2.3.2. Checking annealing of the three oligonucleotides 64
2.3.3. Determining the precise concentration of commercial (NEB) LigA 65
2.3.4. Testing the 5� and 3� groups required at a nick 65
2.3.5 Timecourse kinetics of native LigA and LigB 68
2.3.6 Additional Cofactors and Conditions 69
2.3.7. Quantitation of Timecourse gels 69
2.4. Electrophoretic mobility shift assays (EMSAs) on LigA and LigB 70
2.5. Analytical ultracentrifugation (AUC) 71
2.6 Beta-sliding clamp experiments 73
2.7. Molecular Operating Environment (MOE) 75
2.8. In vitro inhibition Assay of native LigA protein 76
2.9. In vivo Kirby-Bauer experiments 77
Chapter 3- Cloning, Expression and Purification of Native LigA and LigB
3.1 Introduction 79
3.2 Cloning 80
3.2.1 Cloning of LigA and LigB genes by PCR from E.coli genomic DNA 80
3.2.2 Cloning of LigA and LigB genes by Gene Synthesis 81
3.2.3 Ligation into pET29c and pET28b and colony PCR 83
3.2.4 DNA sequencing 83
3.3 Expression of LigA and LigB 86
3.3.1 Small scale inductions of LigA and LigB 86
3.3.2 Solubility of LigA 90
IX
3.3.3 The insolubility of LigB 90
3.3.4 The solubility of expressed LigB protein in NaCl and TritonX-100 90
3.3.5 Refolding LigB protein 92
3.3.6 New strategy to obtain soluble LigB 94
3.3.7 Large scale induction of LigA and LigB 94
3.4 Purification of LigA and LigB 95
3.4.1 Purification of native LigA 95
3.4.2 Purification of native and His-tag LigB 104
3.5 Determining concentrations of purified DNA ligases 111
3.5.1 Mass spectrometry on LigA and LigB 111
3.5.2 Analytical Ultracentrifugation (AUC) for native LigA 111
3.6 Discussion and Conclusions 115
Chapter 4- Comparative Kinetics and DNA Binding Studies of Native LigA and Native
LigB
4.1. Introduction 117
4.2. The Development of a Nicked DNA Ligation Assay 118
4.2.1. Determining the Precise Concentration of Commercial (NEB) LigA 118
4.2.2. Checking Annealing of the Three Oligonucleotides 119
4.2.3. Testing the 5� and 3� Groups Required at a Nick 119
4.2.4. Testing the Nick-Joining Ligation Activity of Native LigA and LigB 121
4.3. Kinetics of Native LigA and LigB on Different Reaction Cofactors, Conditions and
Temperature 123
4.3.1. Varying [DNA] Substrate 123
4.3.2. Varying [NAD+] Cofactor 127
4.3.3. Temperature 132
X
4.3.4. Varying [NMN] 135
4.3.5. Varying [Ammonium Sulphate] 137
4.4. Initial Experiments of Electrophoretic Mobility Shift Assay (EMSA) on Native LigA
and LigB 139
4.4.1. EMSA with Nicked DNA LigA 139
4.4.2. Nicked DNA LigB Experiment 141
4.5. Iinitial β-clamp and Gamma-Loader Experiments 141
4.6. Discussion 146
Chapter 5- In Silico Molecular Docking.
5.1. Preparation of Native LigA Structure in MOE 150
5.2. Positive Control Simulation for rAMP Docking 151
5.3. Identifying key Amino Acids in LigA from Mutagenesis Studies 154
5.4. Select Docking Sites Using MOE 154
5.5. Docking Results for Sites 1 to 4 159
5.5.1. Binding of MOE Library Arcos 800 into Site 1 161
5.5.2. Binding of MOE Library Arcos 800 into Site 2 163
5.5.3. Binding of MOE Library Arcos 800 into Site 3 163
5.5.4. Binding of MOE Library Arcos 800 into Site 4 166
5.6. Discussion 168
Chapter 6- In vitro and In vivo inhibition Assay of native LigA protein
6.1. Design of in vitro Assays 170
6.2. In vitro Assays Results 173
6.2.1. Glutathione Disulphide 173
6.2.2. 5-Azacytidine 175
XI
6.2.3. Geneticin (G418) 177
6.2.4. Chlorhexidine 179
6.2.5. Bestatin 181
6.2.6. Imidazolidinyl Urea 183
6.3. In vivo Assay Results 185
6.4. Discussion 199
Chapter 7- Final Discussion 204
References 215
Appendix
Appendix 1. 230
1.1. The chemical structure of NAD+ and NADH 230
Appendix 2. 231
2.1. DNA sequence of GeneArt LigA (5�-3�) 231
2.2. Protein sequence of LigA (N-C terminal) 231
2.3. DNA sequence of GeneArt LigB (5�-3�) 232
2.4. Protein sequence of LigB (N-C terminal) 232
2.5. DNA sequence map of pET29c expression vector (5�-3�) 233
2.6. DNA sequence map of pET28b expression vector (5�-3�) 236
Appendix 3. 239
3.1. Native LigA protein coverage with peptide by Mass Spectrometry 239
3.2. Native LigB protein coverage with peptide by Mass Spectrometry 240
Appendix 4. 241
4.1. LigA with varying [DNA], 5 and 10 nM 241
XII
4.2. LigA with varying [DNA], 30 and 60 nM 242
4.3. LigA with varying [DNA], 60 and 100 nM 243
4.4. LigB with varying [DNA], 5 and 10 nM 244
4.5. LigB with varying [DNA], 30 and 60 nM 245
4.6. LigB with varying [DNA], 80 and 100 nM 246
Appendix 6. 247
6.1. The Inhibition of LigA with Varying Glutathione Disulphide Concentrations
247
6.2. The Inhibition of LigA with Varying 5-Azacytidine Concentrations 248
6.3. The Inhibition of LigA with Varying Geneticin/G418 Concentrations 248
6.4. The Inhibition of LigA with Varying Chlorhexidine Concentrations 249
6.5. The Inhibition of LigA with Varying Bestatin Concentrations 250
6.6. The Inhibition of LigA with Varying Imidazolidinyl Urea Concentrations
251
6.7. In vivo glutathione disulphide 252
6.8. In vivo 5-Azacytidine 252
6.9. In vivo Geneticin 252
6.10. In vivo chlorohexidine 253
6.11. In vivo Imidazolidinyl Urea 253
XIII
List of Figures Figure 1.1. Brief Summary of the Fixing of Single Nicked DNA 6
Figure 1.2. Mapping of E. coli LigA contacts to nicked DNA 8
Figure 1.3. Alignment of LigA vs LigB proteins via using Clustal Omega 10
Figure 1.4. Alignment and Comparison between LigA and LigB in their NTase, Zn and
BRCT Domains 11
Figure 1.5. Crystal Structure of E. coli DNA Ligase A (PDB 2OWO) 13
Figure 1.6. The Alignment of the Structure of LigA Nucleotidyltransferase Domain 15
Figure 1.7. Three-Steps of the Reaction Mechanism of DNA Ligase 18
Figure 1.8. The Movement of Protein Domains of LigA that Bind with NAD+ to ligate the
Nick DNA 19
Figure 1.9. An Overview of Michaelis-Menten Kinetics Analysis 22
Figure 1.10. An Overview of Gel-Shift (EMSA) Analysis 24
Figure 1.11. Overview of Sedimentation Velocity Analytical Ultracentrifugation 26
Figure 1.12. The Crystal Structure of E. coli eta-clamp Protein (PDB code 3BEP) 29
Figure 1.13 This diagram shows the interaction between the docked molecule of 2-
(Aminometyl)imidazole (cyan) as an example and amino acid Asp36 of LigA
(PDB 2OWO) 32
Figure 2.1 Flowchart of ligase cloning, expression and purification strategy each box
above was explained in details down 39
Figure 2.2. DNA substrates A-E, with different 5� and 3� groups at the nick or Hex group
(dotted circle) 67
Figure 2.3. Installation of the AUC cell 74
Figure 3.1. Initial PCR Cloning from E.coli K12 and GeneArt Synthesised Genes 82
XIV
Figure 3.2. Agar Plates Following Ligation and Transformation, and Agarose Gel of
Colony PCR for LigA, LigB and LigB His-tag 84
Figure 3.3. The sequencing results of Native LigA, Native LigB and LigB His-tag Genes
85
Figure 3.4. The Growth of E.coli Bacteria with the Expressed of Native LigA and LigB
87
Figure 3.5. Small Scale Inductions of LigA and LigB in E. coli BL21 (DE3) 89
Figure 3.6. The Test of Sonication (time course) on LigB Protein 91
Figure 3.7. Solubility Tests of Expressed LigB Protein on 10% SDS gel 93
Figure 3.8. Large Scale Inductions of LigA, LigB and LigB His-tag in E.coli BL21 (DE3
97
Figure 3.9. Removal of DNA/RNA and nucleases from the purified supernatant
LigA 98
Figure 3.10. Purification of Native LigA by Using Heparin Column 100
Figure 3.11. Purification of Native LigA by Using HiTrap Column Fast Flow 102
Figure 3.12. The Final Purification of Native LigA by Size exclusion Column and ligation
Activity Test on LigA 103
Figure 3.13. Removal of DNA/RNA and Nucleases from the Purify Supernatant
LigB 105
Figure 3.14. The First Purification of Native LigB by HiTrap HP Column 107
Figure 3.15. Purification of Native LigB by Using Heparin Column 109
Figure 3.16. The final Purification of Native LigB by Using Heparin Columna nd ligation
Activity Test on Native LigB 110
Figure 3.17. The Final Purification and Summary Brief of Mass Spectrometry reading on
Native LigA and LigB 112
XV
Figure 3.18. Sedimentation Velocity AUC of LigA 114
Figure 4.1. Determining the Concentration of NEB LigA and the Annealing Reactions
Using Different Ratios of Oligos 120
Figure 4.2. Denaturing Gel of LigA (NEB) Timecourses Using DNA Substrates A-E for
Testing 5� and 3� Groups Required at a Nick and the Activity Test of Native
LigA and LigB 122
Figure 4.3. Ligase A Reaction with Varying [DNA] Substrate Concentration 125
Figure 4.4. Ligase A Reaction with Varying [DNA] Substrate Concentration 126
Figure 4.5. Ligase B Reaction with Varying [DNA] Substrate Concentration 128
Figure 4.6. Ligase A Reaction with Varying [NAD+] Cofactor Concentration 130
Figure 4.7. Ligase B Reaction with Varying [NAD+] Cofactor Concentration 131
Figure 4.8. Ligase A Reaction with Different Temperature 133
Figure 4.9. Ligase B Reaction with Different Temperature 134
Figure 4.10. Ligase A Reaction with Varying NMN Concentrations 136
Figure 4.11. Ligase A Reaction with Varying [NH4SO4] Cofactor Concentration 138
Figure 4.12. EDTA-Containing Buffer Used for LigA Bandshift 140
Figure 4.13. EDTA -Containing Buffer Used for LigB Bandshift 142
Figure 4.14. B-clamp Protein Interaction with LigA Protein 145
Figure 5.1. The Flow Diagram of MOE and the Crystal Structure of LigA 152
Figure 5.2. The Mechanism of E.coli DNA Ligase LigA and the Docking position of rAMP
in 2OWO 153
Figure 5.3. Identifying key Amino Acids in 2OWO from Mutagenesis Studies 156
Figure 5.4. The Descriptions of the Sites Selected for Molecular Docking in MOE 158
Figure 5.5. The Docking Results Sites (1-4) and the Eight Compounds that were
Identified 160
XVI
Figure 5.6. Binding of MOE Library Arcos 800 into Site1 162
Figure 5.7. Binding of MOE Library Arcos 800 into Site2 164
Figure 5.8. Binding of MOE Library Arcos 800 into Site3 165
Figure 5.9. Binding of MOE Library Arcos 800 into Site4 167
Figure 6.1. The chemical structure of the eight compounds that had large number of S-value
via using MOE programme 172
Figure 6.2. The Inhibition of LigA with Varying Glutathione Disulphide Concentrations
174
Figure 6.3. The Inhibition of LigA with 5-Azacytidine Concentrations 176
Figure 6.4. The Inhibition of LigA with Varying G418 Concentrations 178
Figure 6.5. The Inhibition of LigA with Varying Chlorhexidine Concentrations 180
Figure 6.6. The inhibition of LigA with varying Bestatin concentrations 182
Figure 6.7. The Inhibition of LigA with Varying Imidazolidinyl Urea Concentrations 184
Figure 6.8. The in vivo Inhibition of glutathione disulphide on the growth of E.coli 188
Figure 6.9. The in vivo Inhibition of 5-Azacytidine on the growth of E.coli 189
Figure 6.10. The in vivo Inhibition of Geneticin (G418) on the growth of E.coli 191
Figure 6.11. The in vivo Inhibition of Chlorhexidine on the growth of E.coli 192
Figure 6.12. The in vivo Inhibition of Bestatin on the growth of E.coli 194
Figure 6.13. The in vivo Inhibition of 2-(Aminometyl) Imidazole on the growth of E.coli
195
Figure 6.14. The in vivo Inhibition of Imidazolidinyl Urea on the growth of E.coli 197
Figure 6.15. The in vivo Inhibition of Imidazo [1,2-a] pyridine-7-carboxylic acid on the growth of E.coli 198
XVII
List of TablesTable 2.1 A table with the components used in β-clamp experiments 75
Table 4.1. The Overview of Studies and Comparison of Kinetics and DNA Binding
Experiments on Native LigA and LigB 149
Table 5.1. The collected Mutagenesis studies of different amino acids found within LigA
using Uniprot database 155
Table 5.2. The brief summary of the key amino acids that selected for molecular docking
in Site 1-4 in MOE 158
Table 6.1. A summary of the results for all the compounds, listing their S-values, the sites
of MOE, the IC50 in vitro and IC50 in vivo 200

XVIII
Abbreviations
Å Angstrom (1×10⁻¹⁰ m)
A, T, C, G Adenine, thymine, cytosine, guanine
A260, A280 UV absorbance at 260 or 280 nm
AMP Adenosine 5'-monophosphate
AMPS Ammonium persulphate
ATP Adenosine 5'-triphosphate
AUC Analytical Ultracentrifuge
β-clamp E.coli beta-sliding clamp
Bmax Maximal enzyme binding
bp Base pair(s)
BSA Bovine serum albumin
Da Daltons (Kilo Dalton)
DEAE Diethylaminoethyl
DNA Deoxyribonucleic acid
dNTP Deoxyribonucleotide triphosphate
dsDNA Double-stranded DNA
DTT Dithiothreitol
E.coli Escherichia coli strain HB101
EDTA Ethylenediaminetetraacetic acid
EMSA Electrophoretic mobility-shift assay
EtBr Ethidium bromide
g Gram (mg, μg, ng)
HEX Hexachlorofluorescein
HhH Helix-hairpin-helix Domain
XIX
HPLC High-pressure liquid chromatography
hr, min Hour(s), minutes(s)
IC50 Inhibitory Concentration (μM, nM)
IPTG Isopropyl-β-D-thiogalactopyranoside XII
kcat Rate constant (min-1)
Kd, Km Dissociation/Michaelis constant (μM, nM)
Lig1 Human DNA ligase 1
LigA E.coli DNA ligase A
LigB E.coli DNA ligase B
M Molar concentration (mM, μM, nM)
MOE Molecular Operating Environment
Mr Molecular Weight
NAD+ Nicotinamide adenine dinucleotide
NH4SO4 Ammonium sulphate
NMN Nicotinamide mononucleotide
NMR Nuclear Magnetic Resonance
NTase Nucleotidyltransferase Domain
OB Oligomer binding
PAGE Polyacrylamide gel electrophoresis
PCR Polymerase chain reaction
PDB Protein Database
PNK polynucleotide kinase
RNA Ribonucleic acid
rpm Revolutions per minute
SDS Sodium dodecyl sulphate
XX
ssDNA Single-stranded DNA
S-value Theoretical in silico binding energy
TAE Tris-acetate EDTA buffer
TBE Tris-borate EDTA buffer
TEMED N,N,N',N' tetramethylethylenediamine
Tris 2-amino-2-hydroxymethylaminomethane
UV Ultraviolet
Vmax Maximal enzyme velocity
Zn Zinc finger
XXI
Presentation Details
Oral Presentations:
E. coli DNA Ligases: A new antibiotic drug target?
Presented by Arqam Alomari at the Science Together conference at the University of
Portsmouth, UK (May, 2017).
E. coli DNA Ligases: A new antibiotic drug target?
Presented by Arqam Alomari at the Institute of Biomolecular and Biomedical Sciences
(IBBS) conference at the University of Portsmouth, UK (June, 2017).
Poster Presentations:
Cloning and Kinetics of Escherichia coli DNA Ligases
Presented by Arqam Alomari at the Portsmouth University conference at Nuffield Building,
Portsmouth, UK (July, 2015).
Comparative Kinetic Analysis of E. coli Ligase A and Ligase B and Potential Inhibitors
Presented by Arqam Alomari at the Royal Society of Chemistry Nucleic Acids Group Conference), London, UK (July, 2017).
Kinetics, Binding and Inhibition of native E. coli DNA Ligases
Presented by Arqam Alomari at the 7th Cambridge Symposium, Cambridge, UK (3-7th Sept,
2017).
1
Chapter 1: Introduction This opening chapter starts with an overview of the importance of ligases and where they are
found across the three domains of life. This is followed by details on E.coli LigA and LigB,
their structure and mechanism. The final part describes the problem of antibiotic resistance,
ligases as potential drug targets, techniques used and the purpose of this work.
1.1. The Importance of DNA Ligases.
DNA ligases are essential cellular enzymes that repair breaks in DNA that occur as a result of
damage or DNA metabolism. DNA ligases are indispensable enzymes that play a critical role
in all DNA processes, including replication, repair and DNA recombination (Lehman, 1974;
Mills et al., 2011). These enzymes are labelled as NAD+ or ATP �dependent based on the
respective cofactor specificities (Srivastava et al., 2005). The hydrolysis of an ATP or NAD+
cofactor provides the free-energy that is essential to push the reaction forward (Singleton et al.,
1999). DNA ligases are cornerstone tools for catalysing the formation of a phosphodiester bond
between a 5�-phosphorylated DNA termini and 3�-OH of DNA (Lohman et al., 2011).
Therefore, DNA ligases are absolutely necessary for genome integrity and are attractive drug
targets (Horiuchi et al., 1975).
For example, in DNA replication, DNA ligase is responsible for joining Okazaki
fragments on the lagging strand of a replication fork in vivo. In DNA repair pathways, they
restore continuity of the DNA backbone as the final step in nucleotide excision and base
excision repair (Weiss & Richardson, 1967). Ligases are also crucial chemical components in
the development of DNA biotechnology, including, cloning, molecular diagnostics and
sequencing methods (Shuman, 2009). The discovery of Escherichia coli DNA ligases just over
50 years ago (1967) was reported by the Lehman laboratory and four other groups in 1967, and
this was a key event in molecular biology and biotechnology (Olivera et al., 1967; Gefter et
al., 1967; Gellert, 1967; Zimmerman et al, 1967). Many other DNA ligases have been
discovered since and they are present in all domains of life (prokaryotes, eukaryotes, archaea
2
and viruses) (Le et al., 2008). NAD+-dependent DNA ligases are found exclusively in bacteria,
some archaea and a few eukaryotic viruses. ATP-dependent DNA ligases are found mainly in
eukaryotes, archaea and bacteriophages (Tomkinson et al., 2006).
Many studies have shown that the NAD+- dependent DNA ligases are an essential
enzyme in several bacteria for their viability, via knockout of its gene (Rychta et al., 2007).
Breaks (�nicks�) in the DNA sugar-phosphate backbone can result from external factors such
as UV radiation or chemical damage, or from internal factors such as oxidative damage. Nicks
are also included during the normal processes of DNA replication, recombination and repair.
Subsequently, in humans this can cause thousands of molecular lesions per day (Jackson &
Bartek, 2009). Therefore, if these lesions in critical genes are left unresolved, they can lead to
cancer development and tissue atrophy (Branzei & Foiani, 2008). So DNA ligases are
substantial enzymes for preserving genomic integrity in all cells
1.2. Ligases across the Domains of Life.
NAD+-dependent ligases are found mainly in bacteria and some eukaryotic viruses, whereas
ATP-dependent DNA ligases are found mainly in eukaryotes (animals and plants) and in some
bacteria, bacteriophage viruses and archaea (Edgell & Doolittle, 1997; Kletzin, 1992). The
following are some examples of ligases across the three domains of life:
All DNA ligases in archaea characterized to date have ATP-dependent
adenylyltransferase and nick-joining activities (Keppetipola & Shuman, 2005). However,
Thermococcus fumicolans and Pyrococcus abyssi are one type of archaeal DNA ligases that
can use multiple cofactors like ATP or ADP (Chambers & Patrick, 2015). In 2006, Nishida and
his group identified the structure of DNA ligase from the archaeal species Pyrococcus furiosus
(Ellenberger & Tomkinson, 2008). Its structure is comprised of a middle adenylation domain,
N-terminal DNA-binding domain and an OB-fold domain. The architecture of each domain
looked like those of human DNA ligase I, however the domain arrangements completely
different between the two enzymes (Nishida et al., 2006). There are three families of ATP-
3
dependent that are present in eukaryotes: these are called LigI, LigIII and LigIV. LigI and
LigIV families are found in all eukaryotes, whereas the members of the Lig III family are only
found in vertebrates. These ligases share common catalytic regions which are the NTase
domain, the DNA-binding domain and OB-fold domain. The catalytic region encircles nicked
DNA with each of the domains contacting the DNA duplex (Ellenberger & Tomkinson, 2008).
1.3. Types of DNA Ligases.
All DNA ligases follow the same reaction mechanism for fixing a DNA nick. Depending on
the cofactor used by the enzyme, DNA ligases can be divided into two classes: those that
require NAD+ and those requiring ATP (Zhu & Shuman, 2005; Doherty & Suh, 2000). This
requires an AMP group to be covalently donated from the cofactor onto the ligase enzyme. The
AMP can come from either adenosine triphosphate (ATP) or from oxidised nicotinamide
adenine dinucleotide (NAD+). In evolutionary terms, organisms can be divided into three
domains: the Eukarya (eukaryotes), Archaea and Prokaryotes (Bacteria). ATP-dependent DNA
ligases are found in archaea and eukaryotes, whereas the NAD+-dependent enzymes are present
only in Eubacteria and entomopox viruses (Sriskanda et al, 2001).
All known bacterial species encode at least one highly conserved NAD+-dependent
DNA ligase (Weinstock et al., 1979). Since all eubacteria contain NAD+-dependent DNA
ligases, the uniqueness of these enzymes to bacteria makes them attractive targets for novel
antibiotics (Wilkinson & Bowater, 2001). Additionally, NAD+-dependent DNA LigA is also
not present in human and therefore is very potent attractive drug target (Srivastava et al., 2005;
Gong et al., 2004). Some bacteria encode additional NAD+-dependent or ATP-dependent
ligase enzymes (Petit & Ehrlich, 2000; Gong et al., 2004). A number of bacteria have been
stated that ATP is the cofactor used and Haemophilus influenzae is ATP-dependant, which
improve this (Cheng, 1997; Wilkinson et al., 2001).
4
Together NAD+- and ATP-dependent DNA ligases are extremely modular proteins with
distinct domain architectures (Cheng & Shuman, 1997; Wilkinson et al., 2001). The differences
in substrate specificity and structural exclusivity of the bacterial enzymes have enticed many
to exploit this target for the discovery of novel antibacterial agents. The selectivity inhibition
of bacterial DNA ligases with no inhibition of human DNA ligase have been stimulated by the
identification of NAD+-competitive ligands with antibacterial activity (Mills et al., 2011;
Sassetti et al., 2003; Miesel et al., 2003).
Because NAD+-dependent DNA ligase is essential for DNA replication and repair, it
has attracted interest as a prospective broad-spectrum antibacterial target, in bacteria NAD+-
dependent DNA ligases has a highly conserved phylogenetic and distinctly different from the
eukaryotic DNA ligases (Benson, 2004; Sheraz et al., 2004; Chen et al., 2002). Therefore,
NAD+-dependent ligases present a promising drug target for antimicrobial therapy (Brötz-
Oesterhelt et al., 2003). According to the tight phylogenetic distribution and comparing the
different structures of LigA compared to ATP-dependent in human, researchers are strongly
interested in the NAD+ ligase family as target for the development of new broad-spectrum
antibiotics (Nandakumar et al., 2007).
1.3.1. EcoLigA.
The prototype of the NAD+-dependent class of DNA ligase is E.coli Ligase A (LigA). A LigA
can be found in every bacterial species (Sriskanda & Shuman, 2001a). The main function of
DNA ligase LigA is to form a phosphodiester bond at single-strand breaks between adjacent
3′-hydroxyl and 5′-phosphate termini in double-stranded DNA (Lehman, 1979; Lahiri et al.,
2012; Shuman, 2009). In 2001, Kaczmarek stated that the deactivation of the LigA gene in
E.coli led to complete non-viability of the growth in all bacteria (Kaczmarek et al., 2001).
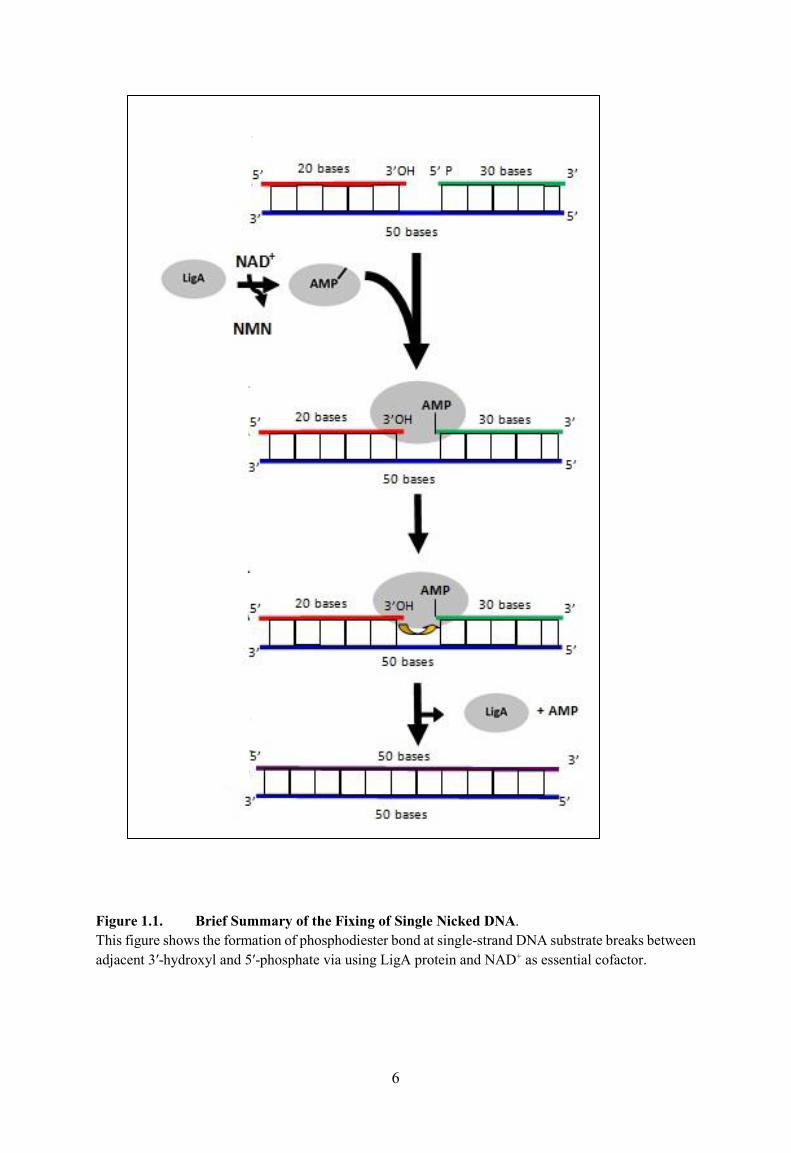
Figure 1.1 shows a general explanation of the sealing of a single nicked DNA with the
presence of LigA and NAD+ as essential cofactor. The figure shows the AMP group moving
from NAD+ to the LigA (grey oval) and then transferring to the 5� end of the nick to allow the
5
nick to be sealed. The complete coding sequence of the open reading frame (ORF) of E.coli
NAD+-dependent LigA was proved to be correct by the determination of the amino acid
composing of the purified enzyme and is prototypical of all bacterial NAD+-dependent ligases.
The molecular weight of E.coli LigA protein is 73,690 Da and it has 671 amino acid residues.
Residues 1-316 consist of amino acids of a core nuclotidyltransferase domain (NTase plus Ia
domain).
Four C-terminal domains include 317-404 of amino acid of OB-fold domain, 405-432
amino acid of a tetracysteine zinc-finger domain, a helix-hairpin-helix domain (433-586 amino
acid) and a BRCT domain (amino acid 587-671). Each subset of the LigA domain modules has
a different responsibility during the ligation pathway, with only the NTase domain being
required for all steps of the ligation (Wang et al., 2009). In 2007, the Shuman group reported
the crystal structure of E.coli LigA bound to a short (26 bp), nicked DNA molecule at 2.3Å
resolution, which engaged to adenylated DNA (Shuman et al., 2007) In 2008, the Shuman
group used mutational and deletion analysis of specific amino acid residues of the LigA protein
on the OB and HhH domains of E.coli LigA by alanine scanning and conservative substitutions,
entailing 43 mutations at 22 amino acids. They identified that Arg333, Arg379, Val383 and Ile384
are essential functional groups of amino acids in the OB domain that engage the DNA
phosphodiester backbone flanking the nick (Wang et al., 2008).
6
Figure 1.1. Brief Summary of the Fixing of Single Nicked DNA. This figure shows the formation of phosphodiester bond at single-strand DNA substrate breaks between adjacent 3′-hydroxyl and 5′-phosphate via using LigA protein and NAD+ as essential cofactor.
7
The essential functional groups of amino acids in the HhH domain include four
glycines: Gly455, Gly489, Gly521, Gly553, which bind the phosphate backbone across the minor
groove at the outer edge of the LigA-DNA interface. Also, the essential amino acids was Arg487
and Arg44 in HhH domain. Arg487 penetrates the minor groove at the outer edge of 3�-OH side
of the nick, and Arg44 supports the protein to hold and contact the nuclotidyltransferase domain
(Wang et al., 2008; Lim et al., 2001).
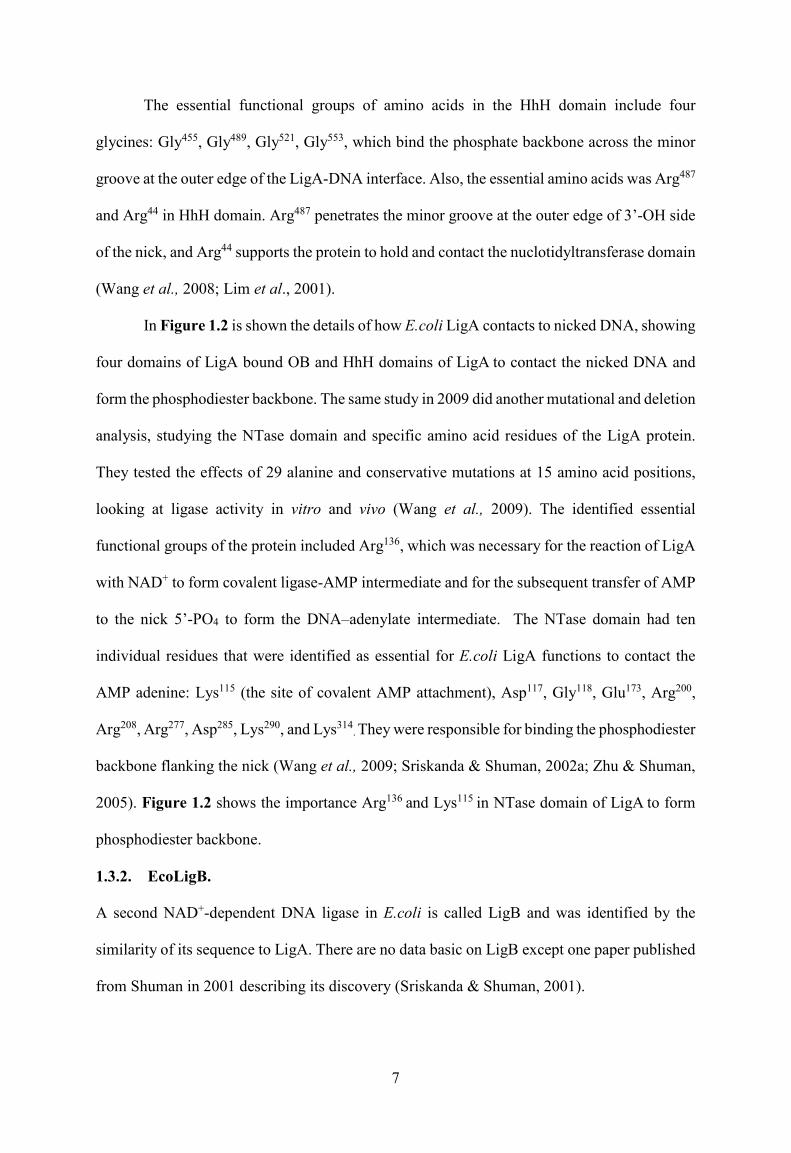
In Figure 1.2 is shown the details of how E.coli LigA contacts to nicked DNA, showing
four domains of LigA bound OB and HhH domains of LigA to contact the nicked DNA and
form the phosphodiester backbone. The same study in 2009 did another mutational and deletion
analysis, studying the NTase domain and specific amino acid residues of the LigA protein.
They tested the effects of 29 alanine and conservative mutations at 15 amino acid positions,
looking at ligase activity in vitro and vivo (Wang et al., 2009). The identified essential
functional groups of the protein included Arg136, which was necessary for the reaction of LigA
with NAD+ to form covalent ligase-AMP intermediate and for the subsequent transfer of AMP
to the nick 5�-PO4 to form the DNA�adenylate intermediate. The NTase domain had ten
individual residues that were identified as essential for E.coli LigA functions to contact the
AMP adenine: Lys115 (the site of covalent AMP attachment), Asp117, Gly118, Glu173, Arg200,
Arg208, Arg277, Asp285, Lys290, and Lys314. They were responsible for binding the phosphodiester
backbone flanking the nick (Wang et al., 2009; Sriskanda & Shuman, 2002a; Zhu & Shuman,
2005). Figure 1.2 shows the importance Arg136 and Lys115 in NTase domain of LigA to form
phosphodiester backbone.
1.3.2. EcoLigB.
A second NAD+-dependent DNA ligase in E.coli is called LigB and was identified by the
similarity of its sequence to LigA. There are no data basic on LigB except one paper published
from Shuman in 2001 describing its discovery (Sriskanda & Shuman, 2001).
8
Figure 1.2. Mapping of E. coli LigA contacts to nicked DNA (PDB 2OWO). The top right image shows the four domains of LigA bound to nicked DNA-adenylate. The middle images is double strand of DNA shows two-dimensional, the nicked strands of DNA with 5�-adenylate on the right side. The nick DNA contacts of LigA side chain and main-chain (NTase, OB and HhH domains) are indicated by arrows. Water interactions are shown with red spheres. R208 and R487 with red colour are amino acids that contact with outer margin on the 3�-OH side of nick DNA. LigA residues that penetrate the DNA helix and interact with the bases are indicated within the DNA base pair ladder. Figure taken from Wang and Shuman, 2008 and 2009.
9
The length of this second NAD+-dependent DNA ligase protein is 562 amino acids, with a
molecular weight 63,179 Da. It has 97% sequence similarity of the LigB is referred to
enterohemorrhagic E.coli strain O157:H7 (GenBank no. AE005592) (Sriskanda & Shuman,
2001). The function of LigB is to catalyse the formation of phosphodiester linkages between
5'-phosphoryl and 3'-hydroxyl groups in dsDNA. The amino acid sequence of LigB revealed
its possible function by comparing with E.coli DNA ligase LigA by applying manual
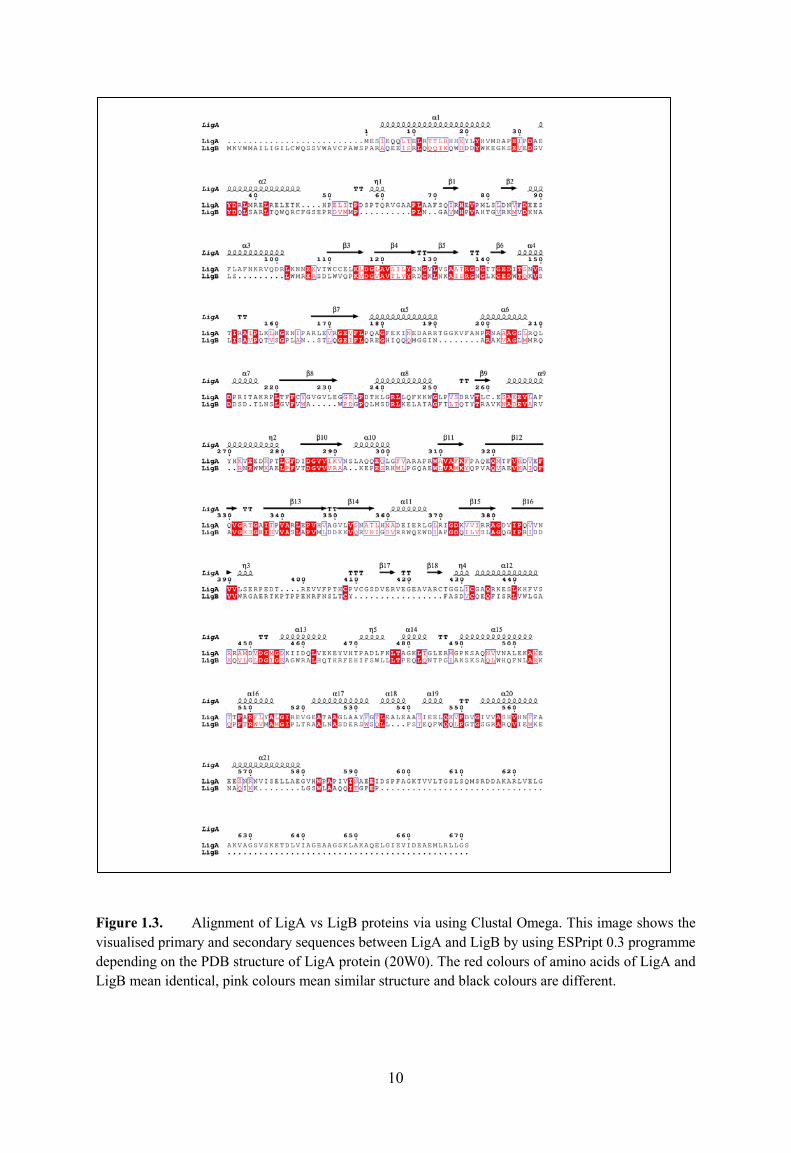
alignment. Figure 1.3 shows the primary and secondary sequence of LigA and LigB and they
were aligned using the Clustal programme. Sriskanda & Shuman in 2001 reported that
recombinant LigB from E.coli had the ability of catalysing the joining of one nicked DNA in
the presence of a divalent cation and NAD+. Like LigA, it also has nuclotidyltransferase
domain, which includes five catalytic motifs (I, III, IIIa, V and VI), an OB domain and an HhH
domain. The active site in E.coli DNA ligase that bind AMP group in LigA is Lys 115, but in
LigB enzyme it is Lys 126.
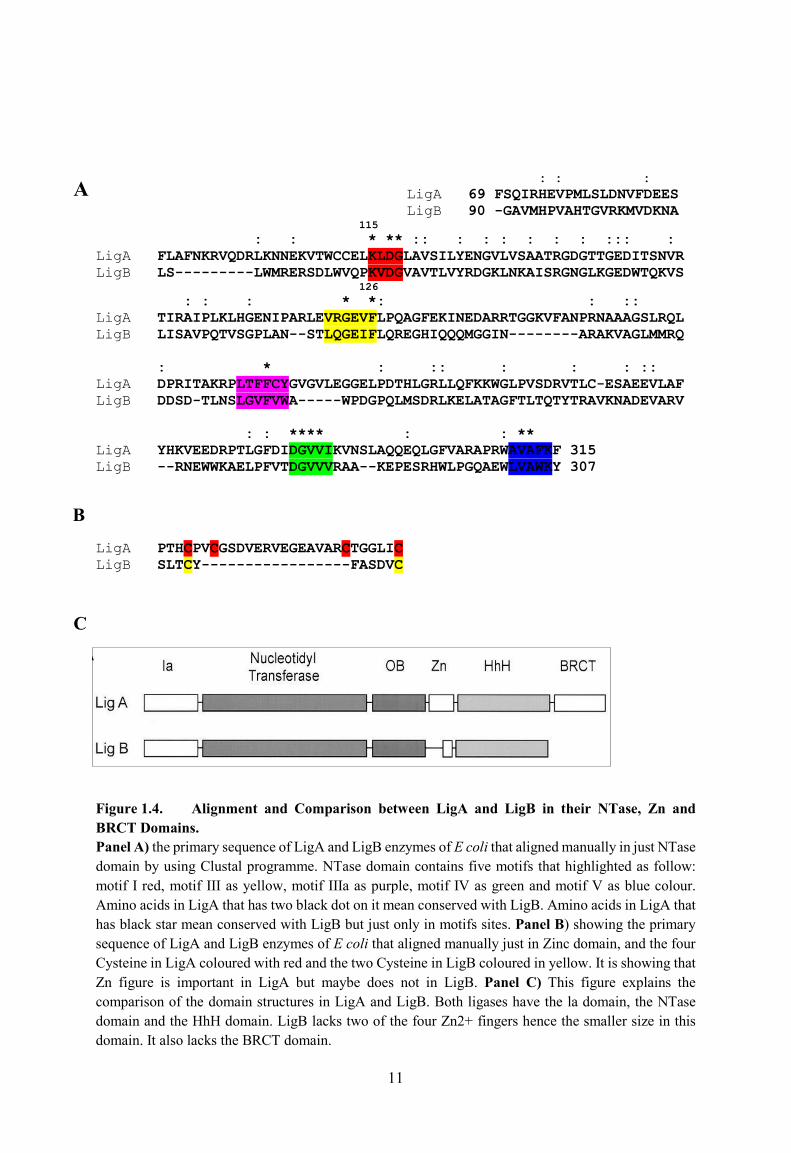
Figure 1.4A shows the primary sequence of NTase domain of E.coli DNA LigA that
aligned to the primary sequence of LigB by using Clustal programme showing the five motifs
in both enzymes. However, the C-terminal BRCT domain and two of the four Zn2+ binding
cysteines that exist in all other bacteria NAD+ ligase are not present in LigB protein (Sriskanda
& Shuman, 2001). Figure 1.4B and C shows the manually aligned comparison between the
primary sequence of LigA and LigB E coli explains the absence of two Zn2+ finger and the
whole BRCT domain in LigB.
1.4. Structure of E. coli DNA Ligase LigA.
The tertiary structures of all prokaryote DNA ligases have some similarity in terms of fold
structure and common domains. Several studies of tertiary structures of DNA ligase proteins
have stated that they all possess a catalytic core for all domains of life, which contains two
parts: an adenylation domain (also named as the nuclotidyltransferase or NTase domain), and
an Oligomer Binding (OB domain) fold (Lee et al., 2000; Georlette et al., 2004).
10
Figure 1.3. Alignment of LigA vs LigB proteins via using Clustal Omega. This image shows the visualised primary and secondary sequences between LigA and LigB by using ESPript 0.3 programme depending on the PDB structure of LigA protein (20W0). The red colours of amino acids of LigA and LigB mean identical, pink colours mean similar structure and black colours are different.
11
: : :LigA 69 FSQIRHEVPMLSLDNVFDEES LigB 90 -GAVMHPVAHTGVRKMVDKNA
115 : : * ** :: : : : : : : ::: : LigA FLAFNKRVQDRLKNNEKVTWCCELKLDGLAVSILYENGVLVSAATRGDGTTGEDITSNVR LigB LS---------LWMRERSDLWVQPKVDGVAVTLVYRDGKLNKAISRGNGLKGEDWTQKVS
126 : : : * *: : :: LigA TIRAIPLKLHGENIPARLEVRGEVFLPQAGFEKINEDARRTGGKVFANPRNAAAGSLRQL LigB LISAVPQTVSGPLAN--STLQGEIFLQREGHIQQQMGGIN--------ARAKVAGLMMRQ
: * : :: : : : :: LigA DPRITAKRPLTFFCYGVGVLEGGELPDTHLGRLLQFKKWGLPVSDRVTLC-ESAEEVLAF LigB DDSD-TLNSLGVFVWA-----WPDGPQLMSDRLKELATAGFTLTQTYTRAVKNADEVARV
: : **** : : ** LigA YHKVEEDRPTLGFDIDGVVIKVNSLAQQEQLGFVARAPRWAVAFKF 315 LigB --RNEWWKAELPFVTDGVVVRAA--KEPESRHWLPGQAEWLVAWKY 307
LigA PTHCPVCGSDVERVEGEAVARCTGGLICLigB SLTCY-----------------FASDVC
Figure 1.4. Alignment and Comparison between LigA and LigB in their NTase, Zn and BRCT Domains.Panel A) the primary sequence of LigA and LigB enzymes of E coli that aligned manually in just NTase domain by using Clustal programme. NTase domain contains five motifs that highlighted as follow: motif I red, motif III as yellow, motif IIIa as purple, motif IV as green and motif V as blue colour. Amino acids in LigA that has two black dot on it mean conserved with LigB. Amino acids in LigA that has black star mean conserved with LigB but just only in motifs sites. Panel B) showing the primary sequence of LigA and LigB enzymes of E coli that aligned manually just in Zinc domain, and the four Cysteine in LigA coloured with red and the two Cysteine in LigB coloured in yellow. It is showing that Zn figure is important in LigA but maybe does not in LigB. Panel C) This figure explains the comparison of the domain structures in LigA and LigB. Both ligases have the la domain, the NTase domain and the HhH domain. LigB lacks two of the four Zn2+ fingers hence the smaller size in this domain. It also lacks the BRCT domain.
C
B
A
12
The essential ligase enzyme in E.coli is called LigA. In 2007, Shuman and his group
solved the tertiary structure of LigA bound to a nicked DNA (Nandakumar et al., 2007). E.coli
LigA protein has 671 amino acids in length and monomer molecular weight of 73,690 Da. The
crystal structure of E.coli LigA bound to the nicked DNA-adenylate (LigA.AppDNA [AMP
that bind nicked-DNA]) showed that LigA surrounded the helix of DNA as a C-shaped protein
clamp (Gajiwala & Pinko 2004; Sriskanda & Shuman, 2002). Figure 1.5A shows the crystal
structure of E.coli DNA Ligase A (PDB 2OWO). In comparison to E.coli LigA, 35%-50% of
bacterial species have a similar sequence (Ishino et al., 1986). The structure of the NAD+-
dependent catalytic core of ligases from Bacillus stearothermophilus & Thermus filiformis
have previously been described (Singleton et al., 1999; Lee et al., 2000). Although, more
recently the crystal structure of E.coli LigA-adenylated nick complex has also been studied,
revealing the basis of DNA binding and recognition (Nandakumar & Shuman, 2007).
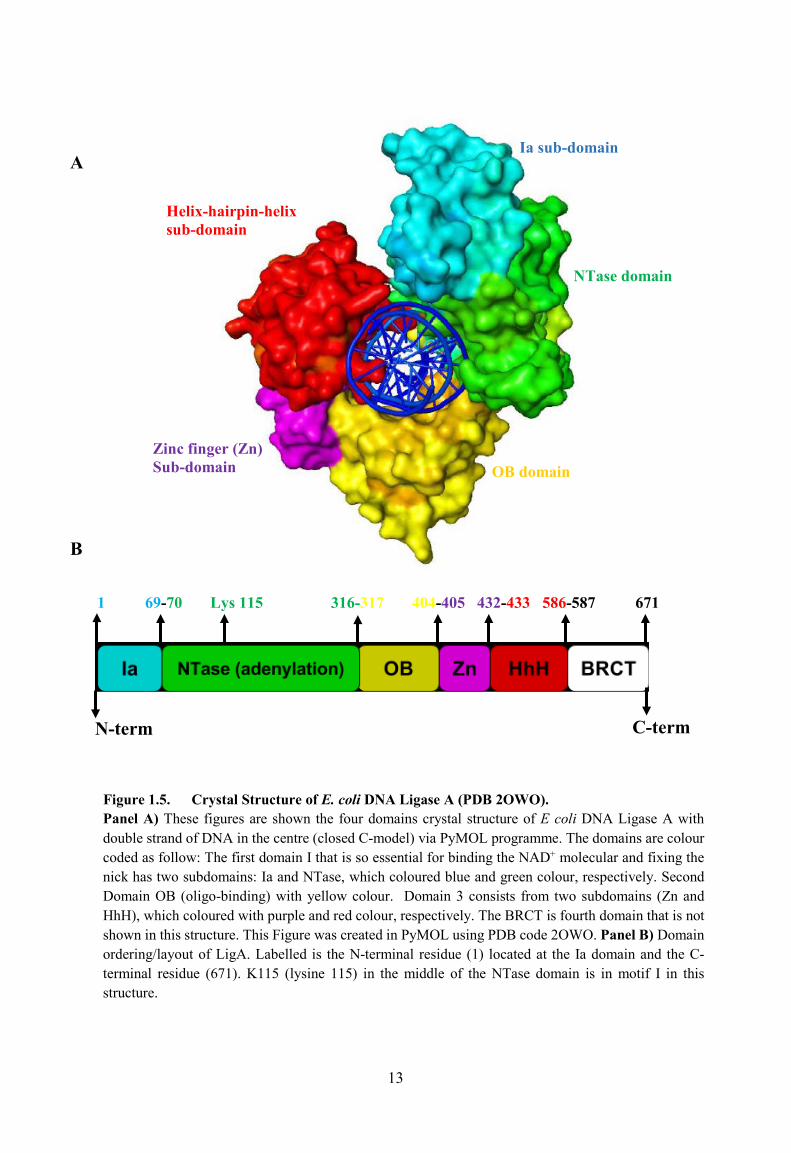
Figure 1.5A shows the crystal structure of NAD+-dependent DNA LigA has showed
main domains: a nucleotidyltransferase (NTase domain) (green, 70-316 amino acid) and an
oligomer-binding (OB fold) (yellow, 317-404 amino acids). The NTase domain has a further
part called the Ia sub-domain (light blue, 1-69 amino acids). The lysine residue 115 in the
NTase (adenylation) domain is essential for NAD+ cofactor binding (Singleton et al., 1999 &
Zhu & Shuman, 2005). The lysine is in a hydrophilic pocket (Shuman and Lima, 2004;
Sriskanda & Shuman, 2002b; Wilkinson et al., 2005).
13
Figure 1.5. Crystal Structure of E. coli DNA Ligase A (PDB 2OWO). Panel A) These figures are shown the four domains crystal structure of E coli DNA Ligase A with double strand of DNA in the centre (closed C-model) via PyMOL programme. The domains are colour coded as follow: The first domain I that is so essential for binding the NAD+ molecular and fixing the nick has two subdomains: Ia and NTase, which coloured blue and green colour, respectively. Second Domain OB (oligo-binding) with yellow colour. Domain 3 consists from two subdomains (Zn and HhH), which coloured with purple and red colour, respectively. The BRCT is fourth domain that is not shown in this structure. This Figure was created in PyMOL using PDB code 2OWO. Panel B) Domain ordering/layout of LigA. Labelled is the N-terminal residue (1) located at the Ia domain and the C-terminal residue (671). K115 (lysine 115) in the middle of the NTase domain is in motif I in this structure.
1 69-70 Lys 115 316-317 404-405 432-433 586-587 671
B
A
N-term C-term
Ia sub-domain
Zinc finger (Zn)Sub-domain
NTase domain
Helix-hairpin-helix sub-domain
OB domain
14
This lysine 115 of LigA in NTase domain reacts with NAD+ in eubacteria and becomes
adenylated with an AMP group to form a covalent ligase-(lysyl-N)-AMP intermediate. Later,
this AMP group is transferred to the DNA nick and eventually is release (Zhao et al., 2006;
Little et al., 1967). The large NTase domain of E coli DNA ligase has five particular amino
acid sequence motifs that are named I, III, IIIa, IV, and V which form the nucleotide-binding
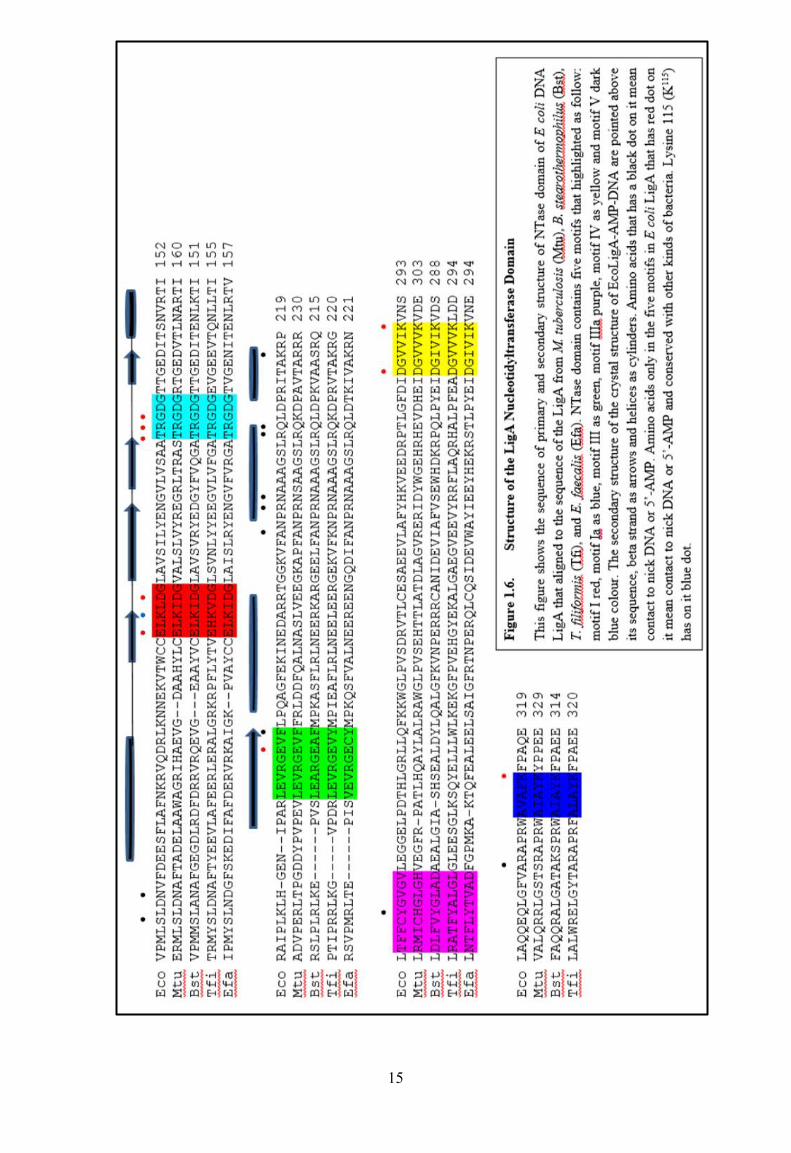
pocket. Figure 1.6 shows the sequence alignment of LigA nucleotidyltransferase domain in
E.coli and other bacteria stains. Motif I includes Lysine 115 to form a covalent ligase-(lysyl-
N)-AMP intermediate in the first step of the ligase reaction. Side chain of motif I and III, IIIa,
IV, and V contact to the AMP and are essential for ligase catalytic activity in vitro and in vivo.
The secondary structure of the NTase domain is composed of anti-parallel β-sheets flanked by
α-helices, though the construction varies in different species. Studies by alanine-scanning-
mutagenesis identified different amino acid residues in the adenylation domain that were
important for ligase activity (Singleton et al., 1999). Each of these steps of the ligation reaction
rely on a various domains of the LigA structure, with the NTase domain, which is being
required for all steps of the reaction in all bacterial ligases (Wang et al., 2009).
The Ia domain is a subdomain of Domain 1. It is unique to NAD+-dependent ligases
and is required for the reaction of LigA with NAD+ to form the ligase-AMP intermediate (Step
1, LigA.App) (Benarroch & Shuman, 2006; Singleton et al., 1999). Deleting the Ia domain
completely abolishes the ligation function for the protein, so is considered essential for the
reaction (Lim et al., 2001; Jeon et al., 2004: Timson; Wigley, 1999). Alanine substitutions of
residues were tested within Ia domain of E.coli LigA DNA ligase and have included five amino
acid residues that are implicated specifically in adenylation and AMP transfer: Y22, H23, D32,
Y35 and D36, which reduce the activity enzyme to more than 80% (Sriskanda & Shuman,
2002b).
15
16
The OB fold (domain 2, 317-404 amino acids) is joined to the adenylation domain in the
structure of LigA. This domain plays a crucial role for touching the un-nicked (template) strand
of DNA and binding over the nick to help to form LigA.AppDNA (LigA+AMP+phosphate on
the DNA). It is also joined in the DNA phosphodiester backbone (Lee et al., 2000; Wang et
al., 2008). Comparison of the E.coli LigA.AppDNA complex with different bacterial ligases
that were also captured as the dual LigA (step1 in different stages: LigA.NAD+ and LigA.App)
revealed that LigA involves a nearly 180º rotation of the OB domain to bind the DNA, which
explained the concave surface of the OB β- barrel fits into the DNA minor groove (Gajiwala
& Pinko, 2004)..
The Zn2+ domain, the HhH domains (Domain 3) which are followed with OB fold and
the BRCT domain (Domain 4), which placed at C-end of the structure (Lee et al., 2000). The
subdomain 3 (Zn2+motif) has four cysteine residues that co-ordinate a zinc ion. This module is
preserved over all known eubacteria NAD+ ligases (except LigB) (Lavesa-Curto et al., 2004).
The Zinc finger module plays a crucial role in bridging the OB and helix-hairpin-helix domains
and for recognising the nick site and DNA interaction (Nandakumar et al., 2007).
The hairpin of the second subdomain (HhH motif) is highly positive and is thought to
be required for non-specific DNA-binding (Doherty & Suh, 2000). Finally, The BRCT domain
of E.coli LigA ligase is called domain 4 and is found in all NAD+ and some ATP-ligases. The
secondary structure of BRCT domain is composed of parallel β-sheets and α-helices. It is about
80-100 amino acids in length and has a hydrophobic nature to the fold. Because the BRCT
domain is not present in all ligases, it is not looked at to be an important compound to ligase
function (Timson & Wigley, 1999). However, deletion analysis revealed that the BRCT
domain of E.coli LigA is required in its totality for effective nick sealing in vitro (Lim et al.,
2001).
17
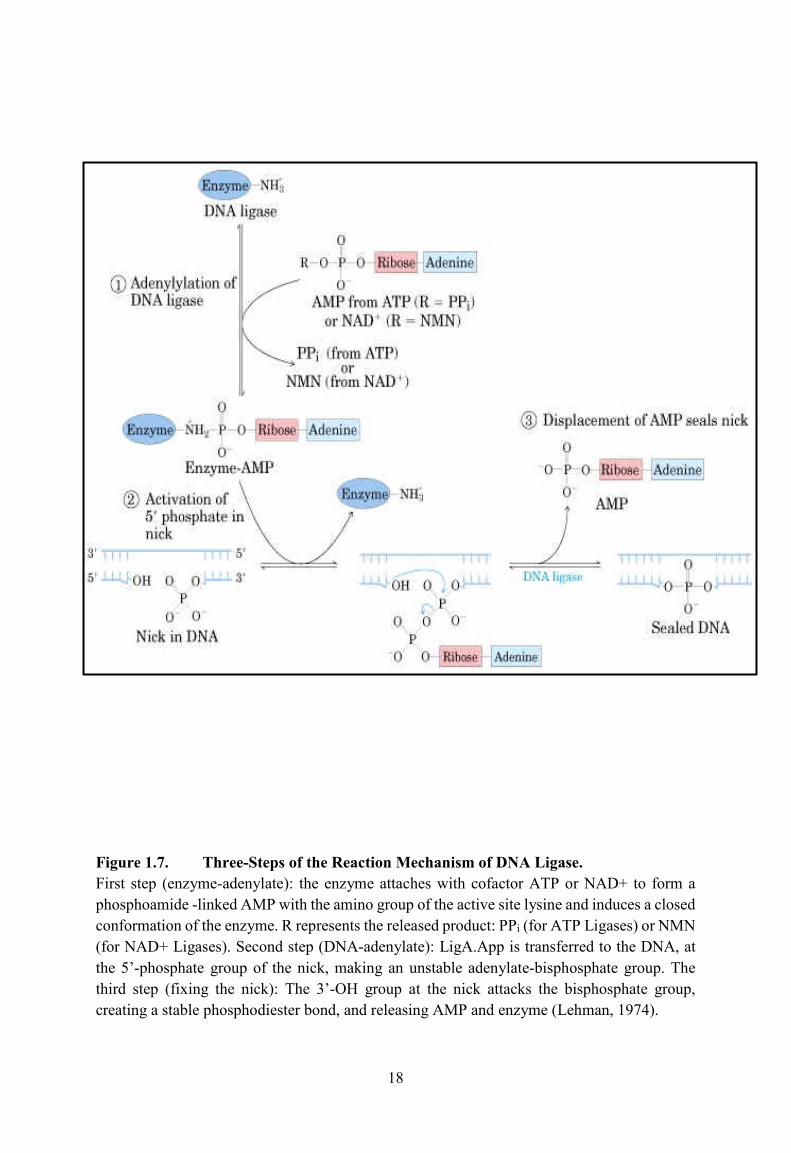
1.5. DNA Ligation Mechanism.
The reaction mechanisms of several DNA ligases have been well authenticated (Lehman, 1974;
Doherty & Suh, 2000; Timson et al., 2000). This is shown on the next page in Figure 1.7
Briefly, in the first step, a lysine nucleophile in the ligase attacks the α-phosphorus of ATP or
NAD+ to form a covalent lysyl�N-AMP intermediate and leave either pyrophosphate, which is
related to ATP, or nicotinamide mononucleotide (NMN), which is related to NAD+ (Chauleau
& Shuman, 2016; Shuman, 2009). When LigA reacts with NAD+ in the absence of nucleic acid
it becomes adenylated and then catalytically active (primed), and is able to bind DNA and
release NMN (Miesel et al., 2007; Pergolizzi, et al., 2016).
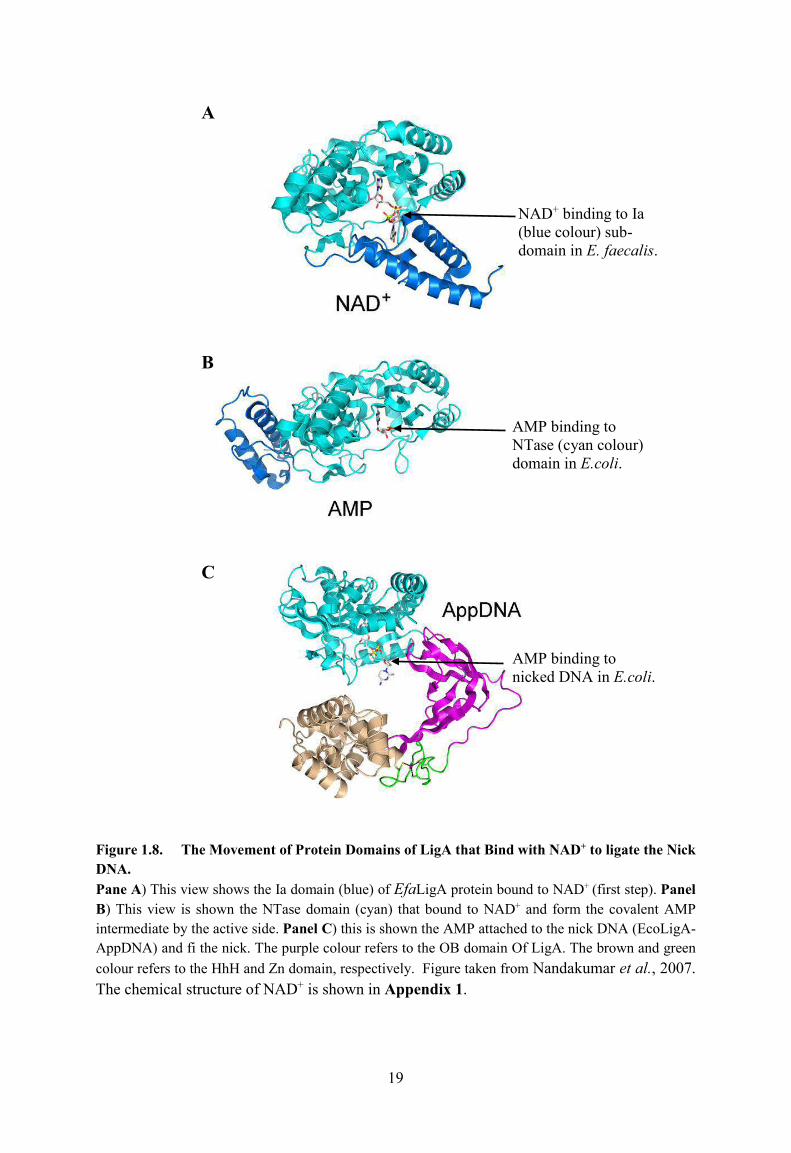
As an example, Figure 1.8A shows the view of NAD+ attached to the Ia sub-domain in
E. faecalis (Efa) (Nandakumar et al., 2007). This compression method is called the �open-
close� process; before ligase reacts with NAD+ to be adenylated, the nucleic acid strand face
of the OB domain is rotated away from the active site. This is the open conformation of the
protein (Georlette et al., 2004). Once ligase is adenylated with AMP (LigA.Ap), the second
domain (OB domain) changes its conformation and rotates around, displaying its DNA-binding
face towards the active site.
Figure 1.8B shows the view of AMP that bind in Lysine 115 in NTase domain of LigA.
This is called the closed conformation (Murzin, 1993, Lee et al., 2000, Kaczmareck et al.,
2001; Lavesa-Curto et al., 2004). The conformation of this structure allows the active site of
ligase to bind to the DNA (Georlette et al., 2003). In the second step, the phosphorus of lysyl-
AMP (LigA.App) binds to the nicked duplex DNA and transfers the adenylate from the active
site to the 5-PO4 terminus to form the DNA-adenylated intermediate.
18
Figure 1.7. Three-Steps of the Reaction Mechanism of DNA Ligase. First step (enzyme-adenylate): the enzyme attaches with cofactor ATP or NAD+ to form a phosphoamide -linked AMP with the amino group of the active site lysine and induces a closed conformation of the enzyme. R represents the released product: PPi (for ATP Ligases) or NMN (for NAD+ Ligases). Second step (DNA-adenylate): LigA.App is transferred to the DNA, at the 5�-phosphate group of the nick, making an unstable adenylate-bisphosphate group. The third step (fixing the nick): The 3�-OH group at the nick attacks the bisphosphate group, creating a stable phosphodiester bond, and releasing AMP and enzyme (Lehman, 1974).
19
Figure 1.8. The Movement of Protein Domains of LigA that Bind with NAD+ to ligate the Nick DNA. Pane A) This view shows the Ia domain (blue) of EfaLigA protein bound to NAD+ (first step). Panel B) This view is shown the NTase domain (cyan) that bound to NAD+ and form the covalent AMP intermediate by the active side. Panel C) this is shown the AMP attached to the nick DNA (EcoLigA-AppDNA) and fi the nick. The purple colour refers to the OB domain Of LigA. The brown and green colour refers to the HhH and Zn domain, respectively. Figure taken from Nandakumar et al., 2007. The chemical structure of NAD+ is shown in Appendix 1.
B
C
A
NAD+ binding to Ia(blue colour) sub-domain in E. faecalis.
AMP binding to NTase (cyan colour) domain in E.coli.
AMP binding to nicked DNA in E.coli.
20
Figure 1.8C above shows the view of LigA-AMP in NTase domain that bound to nick
DNA (Lig-App). Nick 3′-OH on the DNA�adenylylate forms a 3′�5′ phosphodiester and
releases the AMP (which initially came from the NAD+ cofactor). Ligase then becomes free
and ready to re-adenylate for another round of ligation (Miesel et al., 2007).
1.6. Antibiotic Resistance.
Antibiotic resistance in bacteria is emerging as a potential medical disaster as a result of the
speed with which bacteria exchange their genetic material or obtain new genes. Large numbers
of antibiotics that synthesised over the past few decades has caused complacency about the
threat of bacterial resistance. Bacteria have become resistant to antimicrobial agents as a result
of mutations that grant natural resistance to individual bacterial cells or the exchange of genetic
material via plasmids and transposons (Neu, 1991). Antimicrobial resistance is one of the
highest health issues and called one of the world's most pressing public health problems
(Davies & Davies, 2010).
The common and widespread use of antibiotics by humans in medicinal and agriculture
provides a selective pressure for any resistant organisms to become dominant (Berkowitz,
1995). Therefore, bacterial pathogens have become more resistant to commonly used
antibiotics (Feng, 2015). The development of antimicrobial resistance has been described as
having potentially catastrophic consequences for humanity (Davies & Davies, 2010), and has
recently been described as a �ticking time-bomb� by Dame Sally Davies of the General
Medical Council (GMC).
Bacterial ligases are exciting possible new targets for antimicrobial therapies, since
eukaryotic ligases have different protein sequences, different cofactor, are much larger and are
composed of many subunits (Montecucco et al., 1988). The obvious goal in this work is to
block the reaction of the active side of LigA in eubacteria. This could lead to reduced DNA
repair and replication and kill the bacteria. Biochemical studies have shown that mutations that
affect in E. coli DNA ligase activity end up being lethal to the entire cell (Modrich & Lehman,
21
1971; Konrad et al., 1973). Bacterial DNA ligases may be a promising antibiotic target, since
they share no homology in details to eukaryote ligases, and also open the door to other species
of bacteria, for example genes encoding NAD+-dependent DNA ligase are essential in
Salmonella typhimurium, Bacillus subtilis and Staphylococcus aureus (Sriskanda & Shuman,
2001).
A recent study by Meier et al., 2008 identified a compound (2,4-diamino-7-
dimethylamino-pyrimido[4,5-d]pyrimidine) with the ability to specifically disrupt the function
of the Streptococcus pneumoniae LigA enzyme in vitro and in vivo but does not disrupt the
function of ATP-dependent enzymes. Here, we look at identifying compounds that can bind to
LigA and affect its activity, through a combination of in silico, in vitro and in vivo techniques.
1.7. Theory of Biophysical Techniques.
In this section the background theory to the main experimental techniques in this thesis are
discussed. These include enzyme kinetics, electrophoretic mobility-shift assay (EMSA),
sedimentation velocity analytical ultracentrifugation of LigA, Beta-clamp protein and
molecular docking programme (MOE).
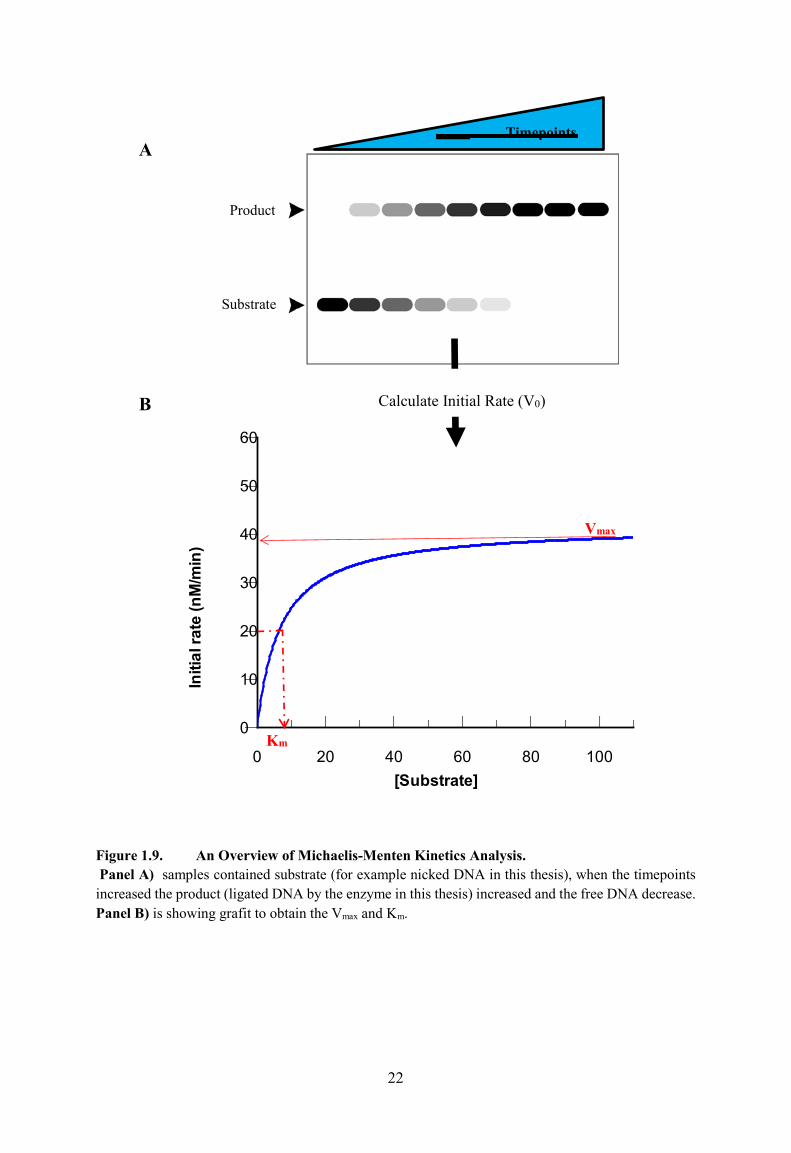
1.7.1. Michaelis-Menten Kinetics.
Michaelis-Menten kinetics is the way of measuring two important parameters about enzymes:
Vmax and Km. The definition of Vmax is the maximum theoretical rate of reaction. This is
obtained by plotting the initial rate (V0) against varying concentration of the substrate being
investigated. Figure 1.9A and B shows an overview of Michaelis-Menten kinetics analysis
explaing the Vmax and Km.
22
Figure 1.9. An Overview of Michaelis-Menten Kinetics Analysis. Panel A) samples contained substrate (for example nicked DNA in this thesis), when the timepoints increased the product (ligated DNA by the enzyme in this thesis) increased and the free DNA decrease. Panel B) is showing grafit to obtain the Vmax and Km.
0 20 40 60 80 100
0
10
20
30
40
50
60
[Substrate]
Initi
al ra
te (n
M/m
in)
A
B
Substrate
Product
Km
Vmax
Timepoints
Calculate Initial Rate (V0)
23
The definition of Km is the concentration of substrate that gives half maximum rate. It
is obtained from the Michaelis-Menten equation by fitting. The Vmax and Km values were
elucidated by plotting their V0 values for each timecourse and fitting to the Michaelis- Menten
equation:
Equation 1.1:
Once Vmax is known, the kcat can be calculated. The definition of kcat is the number of
substrate molecules (nicked-DNA molecules) converted to product per minute. The kcat is also
known as the turnover number. In this thesis it was calculated by dividing the Vmax (nM/min)
by the enzyme concentration (30 nM for all the kinetics experiments).
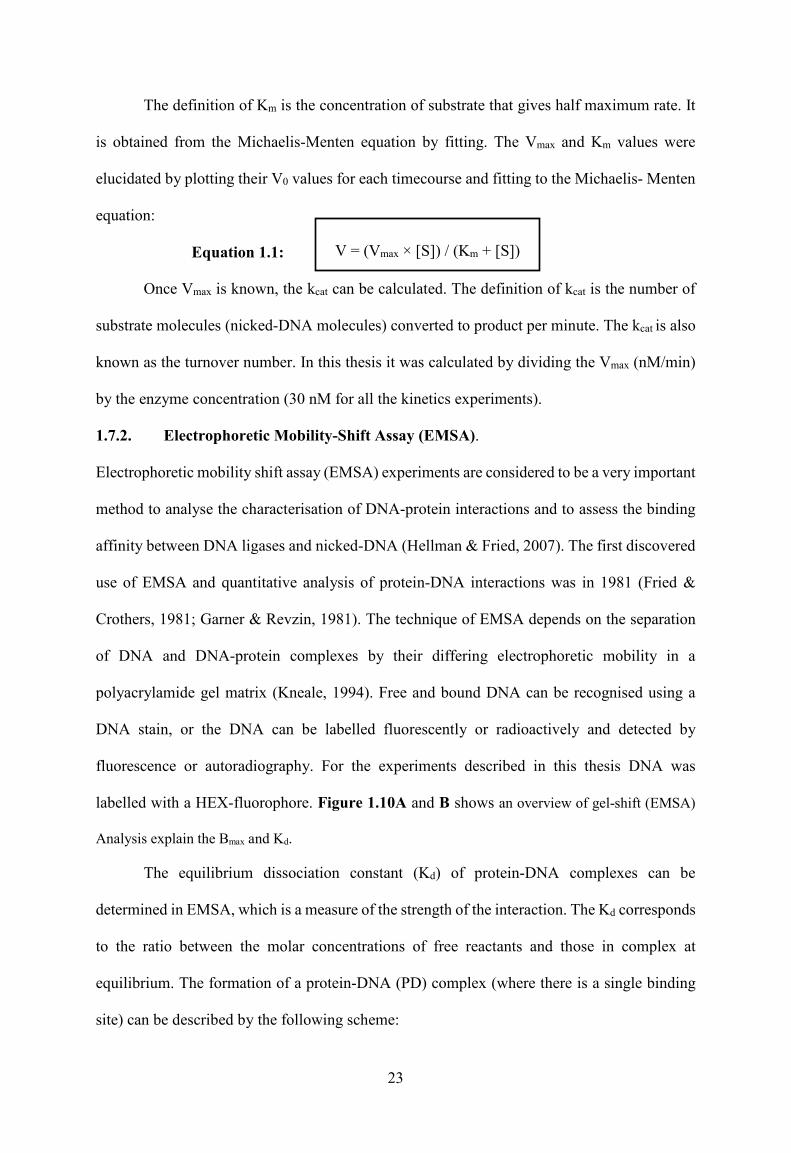
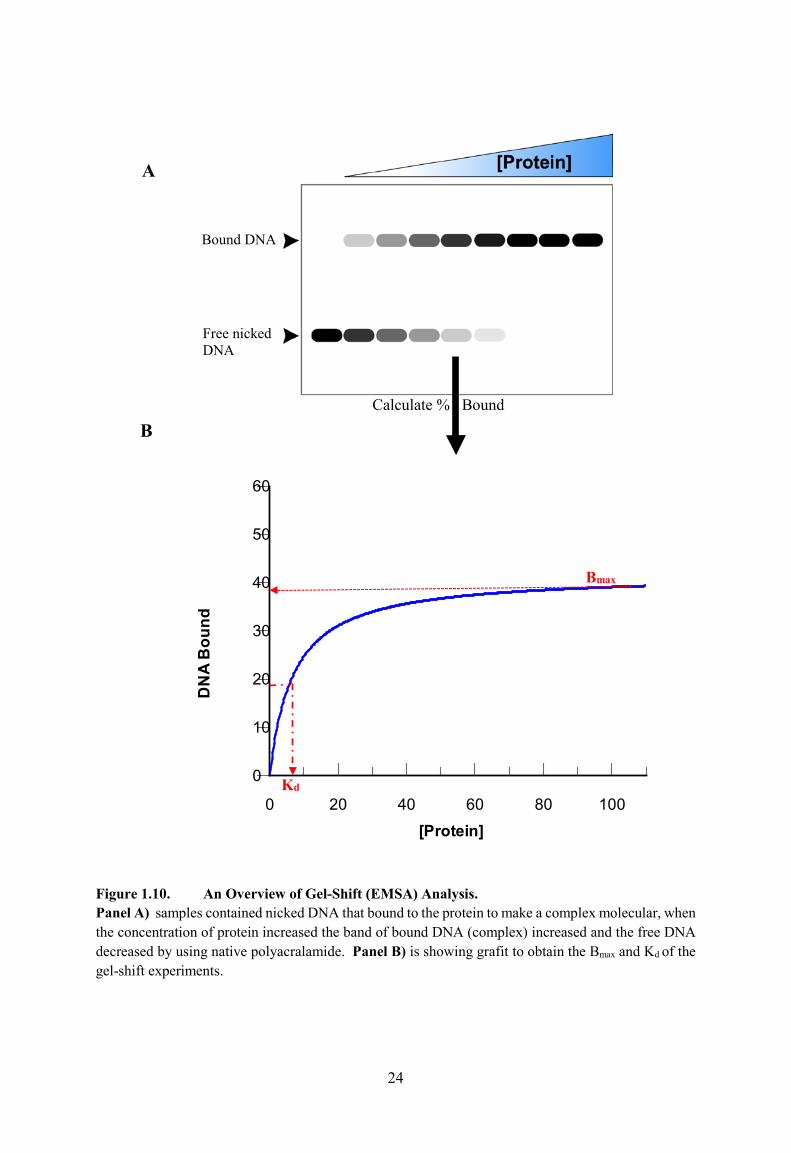
1.7.2. Electrophoretic Mobility-Shift Assay (EMSA).
Electrophoretic mobility shift assay (EMSA) experiments are considered to be a very important
method to analyse the characterisation of DNA-protein interactions and to assess the binding
affinity between DNA ligases and nicked-DNA (Hellman & Fried, 2007). The first discovered
use of EMSA and quantitative analysis of protein-DNA interactions was in 1981 (Fried &
Crothers, 1981; Garner & Revzin, 1981). The technique of EMSA depends on the separation
of DNA and DNA-protein complexes by their differing electrophoretic mobility in a
polyacrylamide gel matrix (Kneale, 1994). Free and bound DNA can be recognised using a
DNA stain, or the DNA can be labelled fluorescently or radioactively and detected by
fluorescence or autoradiography. For the experiments described in this thesis DNA was
labelled with a HEX-fluorophore. Figure 1.10A and B shows an overview of gel-shift (EMSA)
Analysis explain the Bmax and Kd.
The equilibrium dissociation constant (Kd) of protein-DNA complexes can be
determined in EMSA, which is a measure of the strength of the interaction. The Kd corresponds
to the ratio between the molar concentrations of free reactants and those in complex at
equilibrium. The formation of a protein-DNA (PD) complex (where there is a single binding
site) can be described by the following scheme:
V = (Vmax × [S]) / (Km + [S])
24
Figure 1.10. An Overview of Gel-Shift (EMSA) Analysis. Panel A) samples contained nicked DNA that bound to the protein to make a complex molecular, when the concentration of protein increased the band of bound DNA (complex) increased and the free DNA decreased by using native polyacralamide. Panel B) is showing grafit to obtain the Bmax and Kd of the gel-shift experiments.
0 20 40 60 80 100
0
10
20
30
40
50
60
[Protein]
DN
A B
ound
Kd
Free nicked DNA
Bound DNA
A
B
Bmax
Calculate % Bound
25
The Kd corresponds to the ratio between the product of the molar concentrations of (free)
reactants and that of the complex at equilibrium in the following equation:
Where [P] is the molar concentration of free protein, [D] is the molar concentration of free
DNA and [PD] is the molar concentration of protein-DNA complex. The Bmax and Kd values
were calculated by plotting their Bound (B) values for each binding experiment and fitting to
a single- site binding equation:
Equation 1.3:
The Kd has the units of molar concentration (M) and the Kd is typically used in preference to
the association constant (Ka), because the units of concentration can be used with reference to
reactant concentration. The Kd is the concentration of protein that gives half maximal binding.
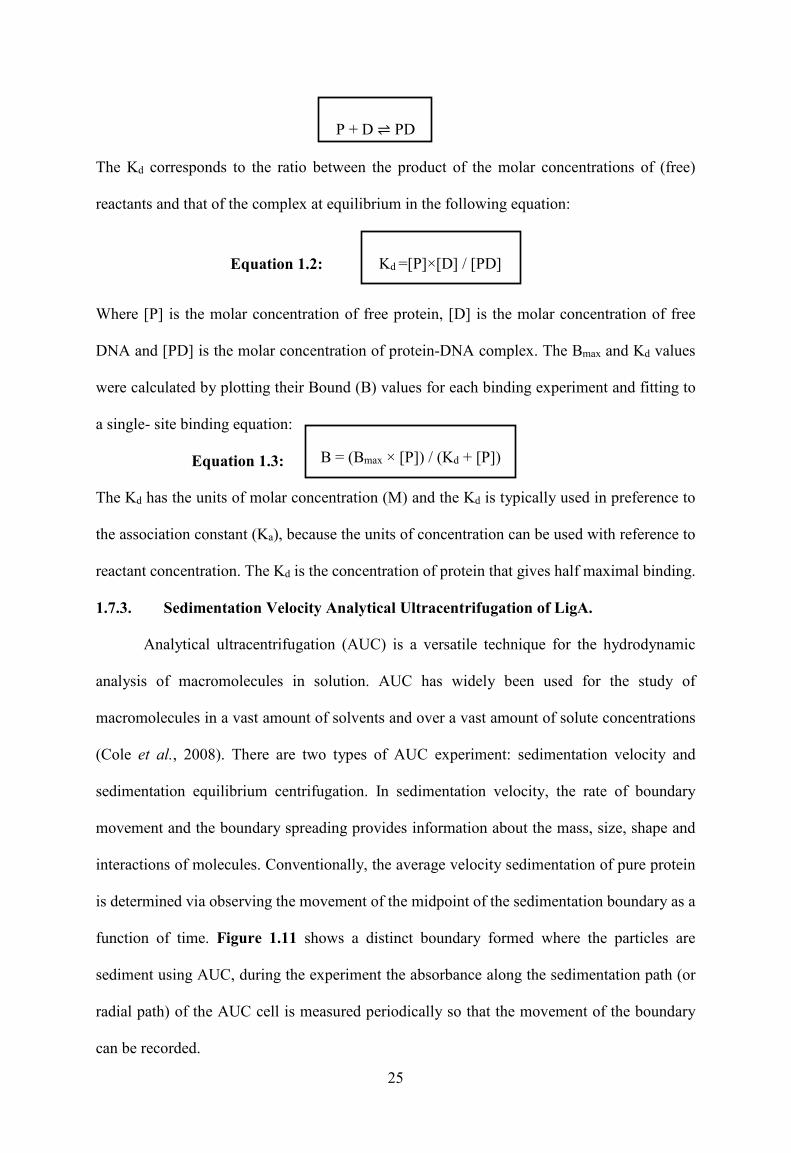
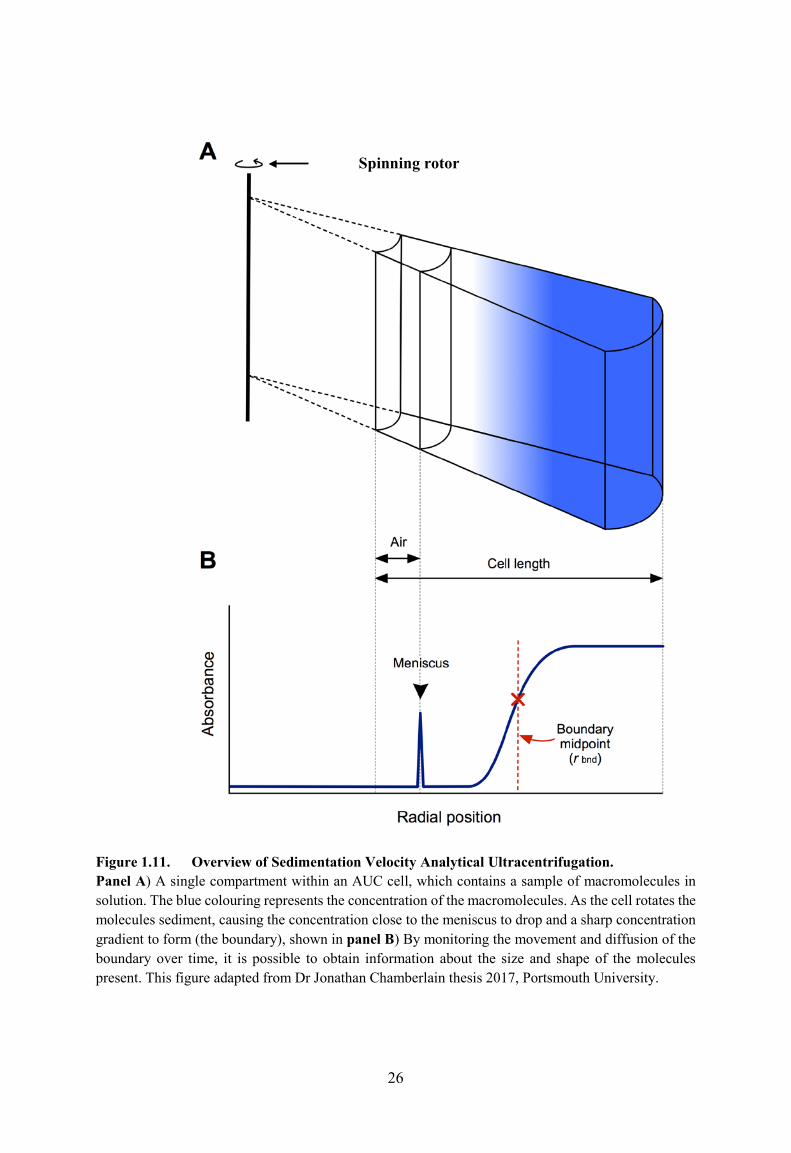
1.7.3. Sedimentation Velocity Analytical Ultracentrifugation of LigA.
Analytical ultracentrifugation (AUC) is a versatile technique for the hydrodynamic
analysis of macromolecules in solution. AUC has widely been used for the study of
macromolecules in a vast amount of solvents and over a vast amount of solute concentrations
(Cole et al., 2008). There are two types of AUC experiment: sedimentation velocity and
sedimentation equilibrium centrifugation. In sedimentation velocity, the rate of boundary
movement and the boundary spreading provides information about the mass, size, shape and
interactions of molecules. Conventionally, the average velocity sedimentation of pure protein
is determined via observing the movement of the midpoint of the sedimentation boundary as a
function of time. Figure 1.11 shows a distinct boundary formed where the particles are
sediment using AUC, during the experiment the absorbance along the sedimentation path (or
radial path) of the AUC cell is measured periodically so that the movement of the boundary
can be recorded.
P + D ⇌ PD
Kd =[P]×[D] / [PD]Equation 1.2:
B = (Bmax × [P]) / (Kd + [P])
26
Figure 1.11. Overview of Sedimentation Velocity Analytical Ultracentrifugation. Panel A) A single compartment within an AUC cell, which contains a sample of macromolecules in solution. The blue colouring represents the concentration of the macromolecules. As the cell rotates the molecules sediment, causing the concentration close to the meniscus to drop and a sharp concentration gradient to form (the boundary), shown in panel B) By monitoring the movement and diffusion of the boundary over time, it is possible to obtain information about the size and shape of the molecules present. This figure adapted from Dr Jonathan Chamberlain thesis 2017, Portsmouth University.
Spinning rotor
27
The high absorption optics of sedimentation velocity in AUC experiments allows the
monitoring of individual species in a system of strong polydispersity (Karibyants et al., 1997).
The frictional force and floating (buoyancy) force acting upon the protein has opposed the
sedimentation, these resisting forces can be characterised in an AUC experiment through the
Svedberg equation (equation 1.3):
= 2 =
(1− ῡ)
Where S is the sedimentation coefficient, v is the rate of sedimentation, ω is the angular
velocity of the rotor, r is the radius (distance from the centre of rotation), M is the molar mass,
ῡ is the partial specific volume (density of the protein), ρ is the solvent density, NA is
Avogadro's constant, and f is the frictional coefficient. The sedimentation coefficient is
expressed in Svedberg units (S), with 1 S being equal to exactly 10-13 seconds. It provides a
relatively straightforward method to determine the molecular mass distribution of
macromolecules over a large range of sizes and concentrations.
In sedimentation velocity (SV), the sample is spun at very high speeds to sediment
macromolecules. The maximum absorbance of proteins between 220 nm (peptide bond) and
280 nm (aromatic bound). However, the maximum absorbance of individual protein can be
change by primary, secondary, tertiary and quaternary structure, but still the absorbance
between 220-280 nm. This can be used during AUC analysis to determine their radial position
in the sample cell using the appropriate light wavelength. The absorbance then recorded to a
reference cell. This technique was used in this thesis to investigate the stoichiometry of the
ligase protein by measuring the molecular mass.
1.7.4. Beta-Clamp Proteins.
For efficient DNA replication, DNA polymerases are required to achieve a very high degree of
processivity. This comes from a protein-protein interaction with a ring-shaped protein called
Equation 1.4:
28
sliding clamp that is bound to the template DNA (Hedglin et al., 2013). One surface of the
sliding clamp binds to the DNA polymerase and interacts with the beta clamp-loader complex,
which opens and reseals the clamp (Johnson & O'Donnell, 2005; Indiani & O'Donnell, 2006).
The beta-clamp keeps the polymerase III enzyme at the replication fork of DNA and
enormously increases processivity (from 10s to 1000s base pairs) at all replication steps
(Stukenberg et al. 1991).
Biochemical studies and structural analyses show that the functional structure of clamps
and clamp loaders is conserved across the three domains of life. Without replication sliding
clamps in the cell, DNA replication during division would be incredibly slow and affect the
replication of long size of DNA (O'Donnell & Kornberg, 1985). In eubacteria, this processivity
factor is named the beta-sliding clamp. The β-clamp, (γ) gamma clamp-loader complex and
polymerase III comprise the core of the DNA replication fork (Stukenberg et al. 1991).
In 1992, Kong et al., stated that the crystal structure of the β-clamp is 35Å diameter,
which is sufficiently wide to host double-stranded DNA. Two structurally-distinct faces can be
identified on the β sliding�clamp. The clamp monomer consists of three domains and forms a
homodimer. In 2008, the O�Donnell group solved the structure of beta-clamp bound to DNA
and the structure revealed that DNA pushes through the beta-clamp such as a curtain ring on a
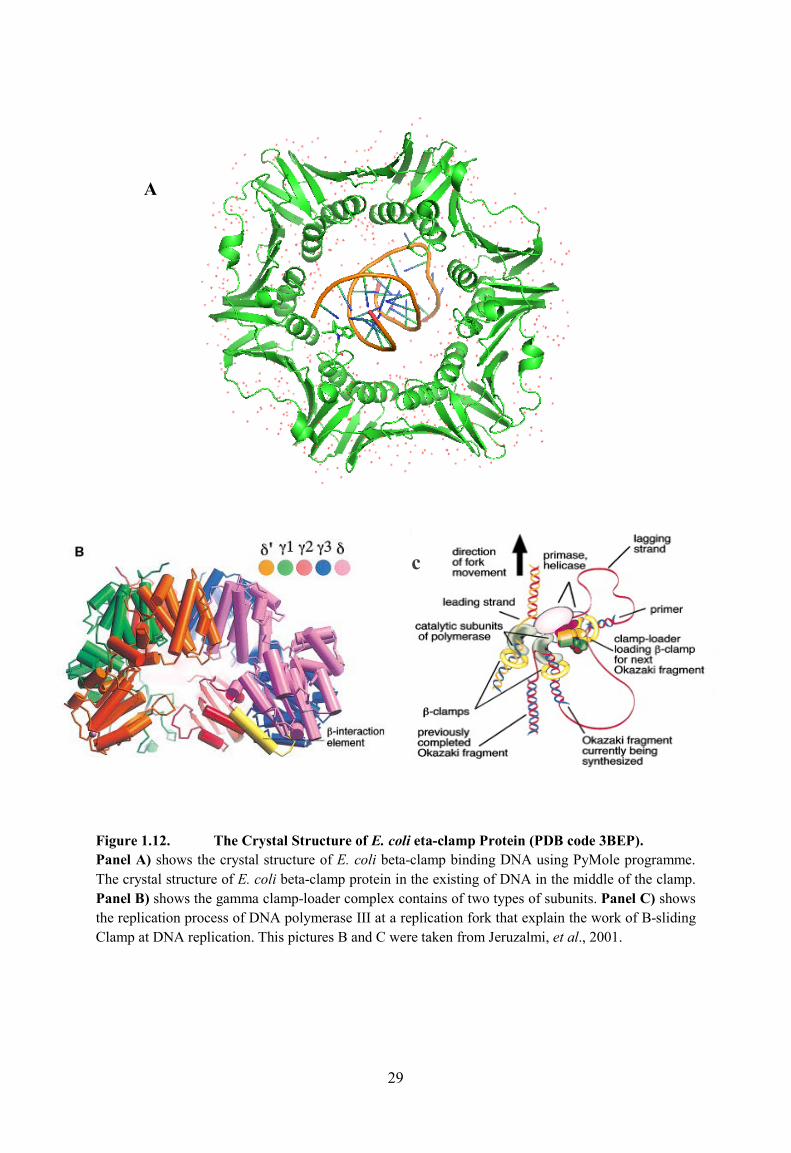
pole, at a 22° angle (Georgescu et al., 2008). Figure 1.12A shows the crystal structure of E.
coli beta-clamp protein in complex with DNA in the centre (PDB code 3BEP).
The gamma clamp loading complex has 5-subunits in a complex: three γ subunits (1,2
and 3), one δ subunit and one δ’ subunit. This complex is important for opening the beta clamp
and docking it onto the DNA (Jeruzalmi et al., 2001). One face has several small loops and the
face of the ring that interacts with gamma loader is the C-terminal face (Indiani & O'Donnell,
2006). The clamp loader complexes that loaded β-clamp onto DNA consists of two types of
subunits γ and δ (Onrust et al., 1995). The gamma clamp-loader homodimer (Figure 1.12B)
shows the gamma clamp-loader that contains of two types of subunits.
29
Figure 1.12. The Crystal Structure of E. coli eta-clamp Protein (PDB code 3BEP). Panel A) shows the crystal structure of E. coli beta-clamp binding DNA using PyMole programme. The crystal structure of E. coli beta-clamp protein in the existing of DNA in the middle of the clamp.Panel B) shows the gamma clamp-loader complex contains of two types of subunits. Panel C) shows the replication process of DNA polymerase III at a replication fork that explain the work of B-sliding Clamp at DNA replication. This pictures B and C were taken from Jeruzalmi, et al., 2001.
A
c
30
The powerful proteins that bind ATP and undergo substantial (but undefined)
conformational change is γ subunits of the complex (Hingorani and O'Donnell, 1998; Naktinis
et al., 1995). Ring opening requires the δ subunit wrench, which has affinity for the β subunit
on its own (Naktinis et al., 1995). Figure 1.12C above shows the replication process of DNA
polymerase III at a replication fork interacting with β-sliding Clamp.
1.7.5. Molecular Docking Programme.
To conduct in-silico structural molecular docking programme there are a variety of programs
and MOE is an example of a good accepted program with a broad range of features and free
online resources (Molecular Operating Environment, 2013). The Molecular Operating
Environment (MOE) is a global software system for science developed by Chemical
Computing Group. Drug design is supported strongly by MOE programme through molecular
stimulation, protein structure analysis, data processing of small molecular and docking study
of protein and small molecules (Molecular Operating Environment Book, 2013).
Use of MOE for molecular modelling allows researchers to view, display, analyse
and interpret biomolecular data in a straightforward way by using interactive three-dimensional
computer graphics tools (Roy & Luck, 2007). MOE can use Protein Data Bank (PDB) codes
to generate the 3D structures of proteins to analyse (Molecular Operating Environment, 2013).
Also databases containing large libraries of molecules can dock into the structure of proteins
to determine the active side of the amino acid by using sophisticated programmes such as MOE
using a number of docking algorithms. Public resources such as the ZINC database (Sterling
& Irwin, 2015) and commercial websites such as Sigma-Aldrich are easily used and accessed
for small molecule database to virtual screening.
In MOE, to predict if there is a ligand conformation that binds to the target site of
the structure of protein, several ligand orientations can be used by docking, which then allow
docking of these ligands to be conducted. Strengths of association (binding affinities) between
31
a ligand and a receptor can be predicted using scoring functions, which suggest if the interaction
will likely form a stable complex. This is also known as the S-value, which is similar to the
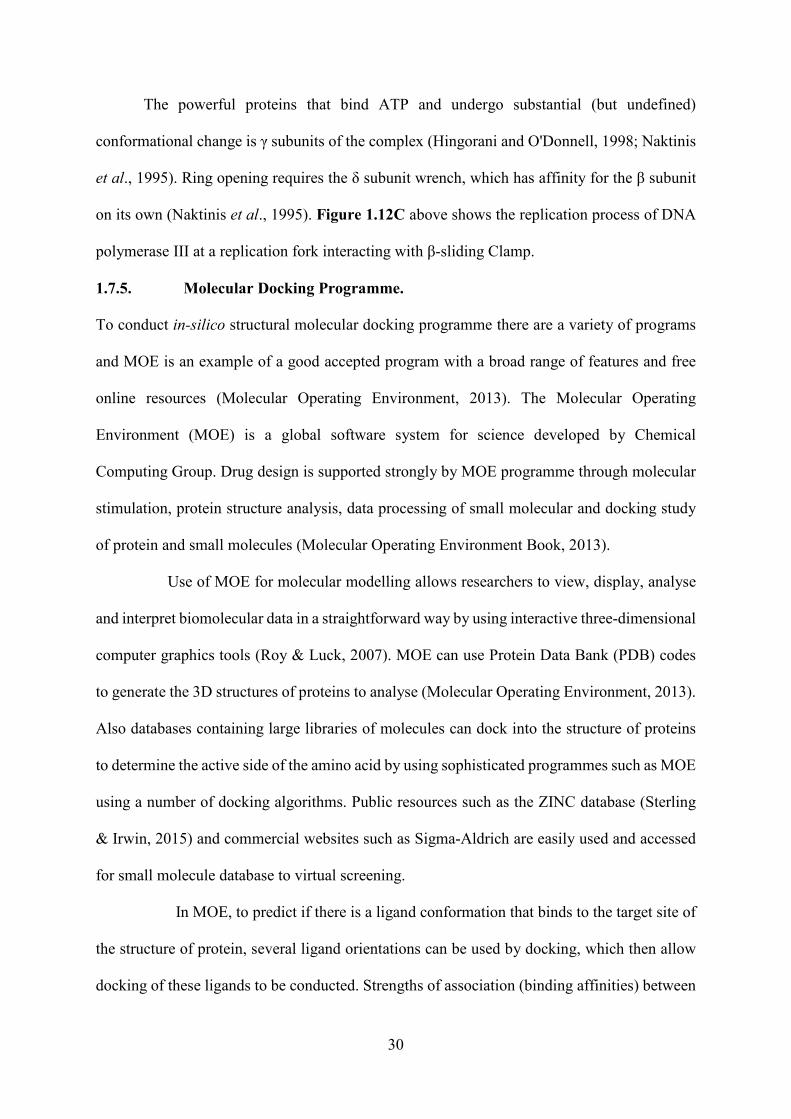
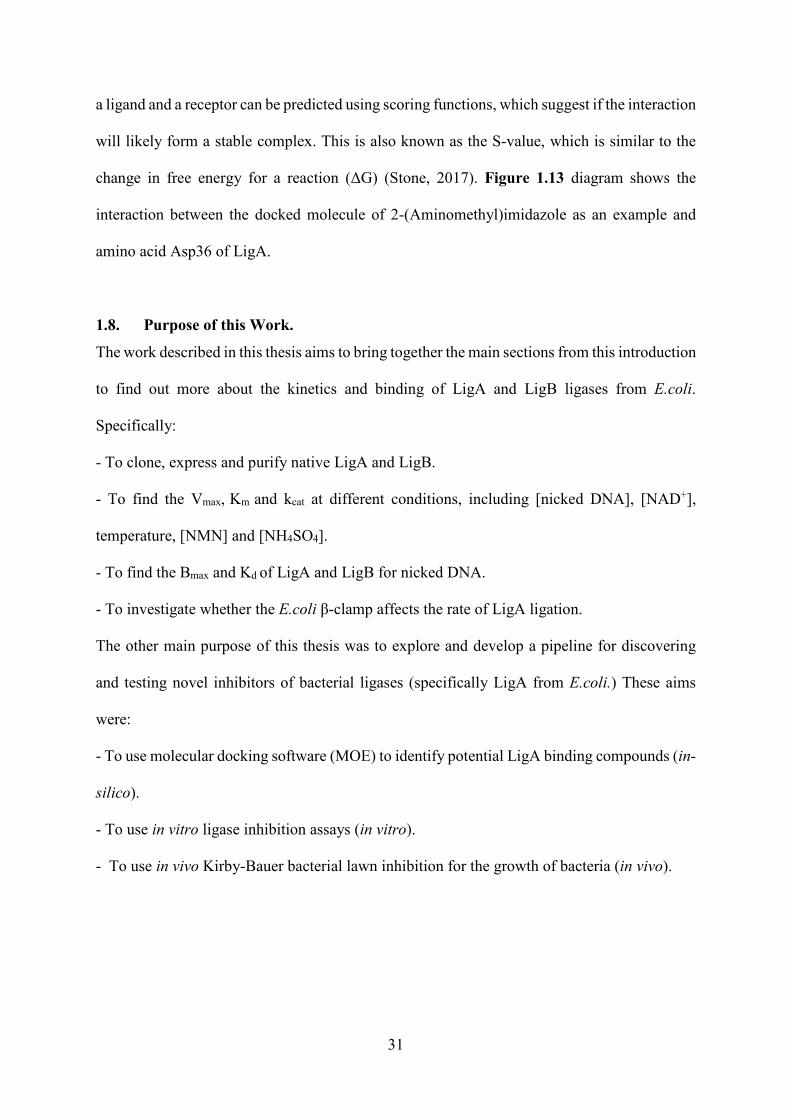
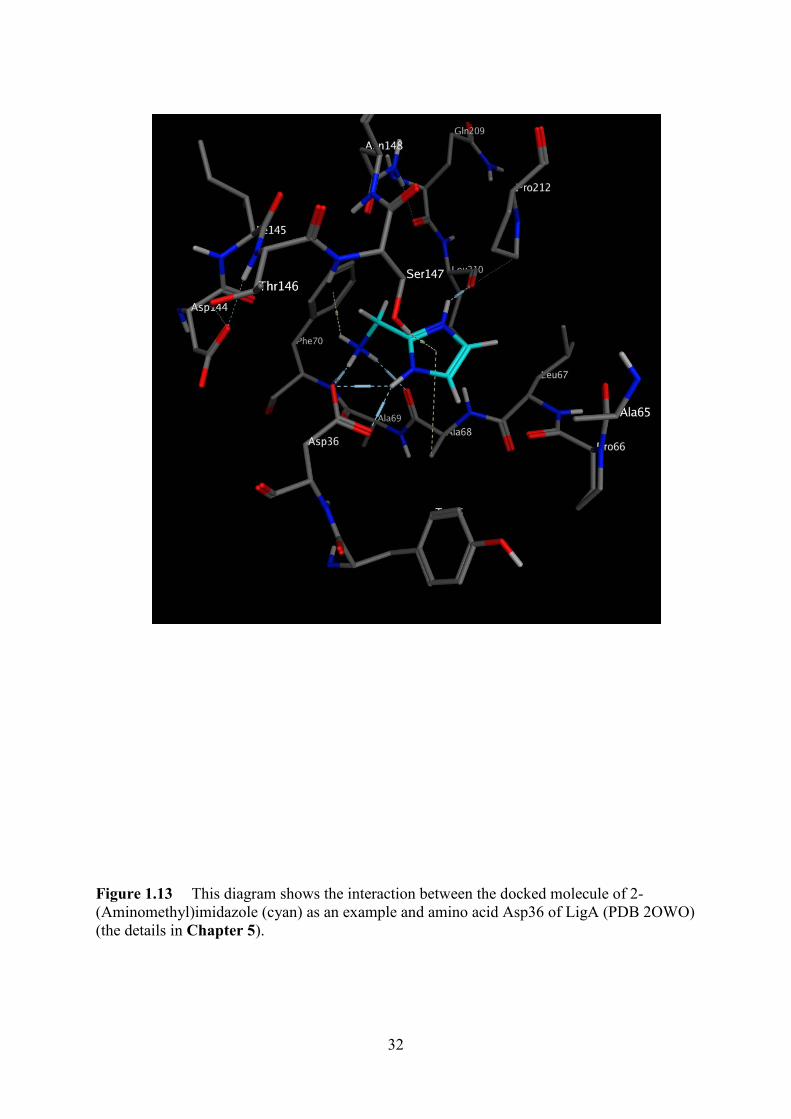
change in free energy for a reaction (ΔG) (Stone, 2017). Figure 1.13 diagram shows the
interaction between the docked molecule of 2-(Aminomethyl)imidazole as an example and
amino acid Asp36 of LigA.
1.8. Purpose of this Work.
The work described in this thesis aims to bring together the main sections from this introduction
to find out more about the kinetics and binding of LigA and LigB ligases from E.coli.
Specifically:
- To clone, express and purify native LigA and LigB.
- To find the Vmax, Km and kcat at different conditions, including [nicked DNA], [NAD+],
temperature, [NMN] and [NH4SO4].
- To find the Bmax and Kd of LigA and LigB for nicked DNA.
- To investigate whether the E.coli β-clamp affects the rate of LigA ligation.
The other main purpose of this thesis was to explore and develop a pipeline for discovering
and testing novel inhibitors of bacterial ligases (specifically LigA from E.coli.) These aims
were:
- To use molecular docking software (MOE) to identify potential LigA binding compounds (in-
silico).
- To use in vitro ligase inhibition assays (in vitro).
- To use in vivo Kirby-Bauer bacterial lawn inhibition for the growth of bacteria (in vivo).
32
Figure 1.13 This diagram shows the interaction between the docked molecule of 2-(Aminomethyl)imidazole (cyan) as an example and amino acid Asp36 of LigA (PDB 2OWO) (the details in Chapter 5).
33
Chapter 2: Materials and Methods
In this chapter, the key materials and methods used in this thesis will be described. Many of
these methods, including cloning and expression, were taken from Sambrook & Russell (2001).
Methods are included in the approximate order in which they were performed. Briefly these
include electrophoresis, gene cloning, protein expression and purification, kinetic and binding
assays, biophysical characterisation and molecular docking studies. Different chemicals,
laboratory materials and reagents were ordered from different scientific companies in UK such
as Fisher Scientific (FS), Sigma Aldrich (SA), BioRad (BR), Qiagen (QG), Thermo-Scientific
(TS), Life Technologies (LT) and New England Biolabs (NEB).
2.1. Electrophoresis Protocols.
2.1.1. Agarose gel electrophoresis.
Materials
1- Agarose powder. Low EEO: 0.09-0.013. Lonza.
2- 50× TAE stock: 2 M Tris-acetate, 100 mM EDTA. Used at 1× concentration.
3- 4× agarose gel loading buffer: 40% (w/v) sucrose, 100 mM Tris-HCl (pH 7.2), 100 mM
EDTA, bromophenol blue powder, completed with distilled water to desired volume.
Used at 1× concentration.
4- Ethidium bromide (EtBr) stain: 10 mg/ml stock solution in distilled water. Used at 0.5
μg/ml concentration.
5- SyBr stain, 10,000× stock. Molecular Probes. Used 1 µl per 10 ml distilled water.
Method
DNA fragments were separated according to size by gel electrophoresis using BioRad Sub-cell
Submarine electrophoresis equipment. Three gram of agarose were added to 150 mL of 1×
TAE buffer to prepare 2% (w/v) agarose gels and the mixture was boiled in a microwave until
fully dissolved (~ two min). Once the solution had cooled, ethidium bromide was added to a
34
final concentration of 0.5 μg/ml, mixed by gentle agitation, and poured into the gel plate and
then allowed to set completely for approximately 30 min. 1× TAE running buffer containing
0.5 μg/ml ethidium bromides was added to the gels. The agarose gel loading buffer (1×) was
added to the DNA samples and mixed well to load alongside the appropriate 500 bp DNA
marker (NEB) , the gel was run for 1 hour and 30 min at 80 V (10 V/cm). Gels were imaged
and photographed by using an ultraviolet light box (G-Box Syngene).
2.1.2. Native Polyacrylamide Gel Electrophoresis (N-PAGE).
Materials
1- Gel solution: 40% (w/v) Polyacrylamide (Acrylamide:Bis-Acrylamide (29:1)). Used at
15% (w/v) concentration. National Diagnostics.
2- Ammonium persulphate (APS): 20% (w/v). Used at 0.1% (w/v) concentration. Sigma.
3- TEMED: 98% (v/v). Used at 0.1% (v/v) concentration. Fisher.
4- 10× Native gel running buffer, TBE: 890 mM Tris-base (pH 8.3), 880 mM boric acid
and 20 mM EDTA. Used at 2× concentration.
5- 5× Native gel loading buffer: 40% (v/v) sucrose, 100mM Tris-HCl (pH 8.00), 100 mM
EDTA, 0.4% (w/v) bromophenol blue, completed with distilled water to desired
volume. Used at 1× concentration.
Method
Oligonucleotides DNA fragments were analysed using native PAGE (Non-denaturing
polyacrylamide gels) at final concentration of 10-15% (w/v). As an example, to prepare a 15%
(w/v) PA gel, 40% (w/v) gel solution was added into the 15% PAGE gel cassette including
0.1% (w/v) APS, 1× TBE and last thing was added 0.1% (v/v) TEMED final concentration,
inserting the well comb into the top of the cassette and setting aside for 20 minutes. The silicon
gasket and clamps were taken away from cassette, and the cassette was put into the gel tank,
and 2× TBE buffer was filled to the tank. The gel was pre-equilibrated for 15 min at 100 V at
35
room temperature after the well comb was taken away from the cassette. Different volumes of
5× native gel loading buffer were added to 1× concentration to the DNA or RNA samples
alongside the appropriate DNA marker without heating. The gels were run for about 90 minutes
at 100 V at room temperature. N-PAGE gels were stained with SYBR Gold and visualised with
a Fuji FLA-5000 fluorescence phosphorimager. Gels containing fluorescent oligonucleotides
were analysed without additional staining.
2.1.3. Denaturing Polyacrylamide Gel Electrophoresis.
Materials
1- Denaturing gel solution: 40 % (w/v) Polyacrylamide (Acrylamide:Bis-Acrylamide
(19:1)). Used at 15% (w/v) concentration. National Diagnostics.
2- Urea-diluent: 50% (w/v). Used at 26 % (w/v) concentration.
3- APS: 20% (w/v) (Sigma). Used at 0.1% (w/v) concentration.
4- TEMED: 98% (v/v) (Fisher). Used at 0.1% (v/v) concentration.
5- 10× TBE-Urea: 890 mM Tris base pH 8.3, 880 mM boric acid, 20 mM EDTA and 25%
urea (w/v). Used at 1 × concentration.
6- 10× denaturing gel running buffer TBE: 890 mM Tris base, 880 mM boric acid and 20
mM EDTA. Used at 1 × concentration. (EDTA buffer needs a NaOH (sodium
hydroxide) about 20 g for 1 litter to dissolve completely till pH 8.00).
7- 5× Denaturing gel loading buffer (stop buffer): Formamide (80% (w/v)), EDTA (10
mM, pH 8.0), and NaOH (2 mM), bromophenolblue (0.04% (w/v). Used at 1×
concentration.
8- Fujifilm FLA-5000 phosphorimager.
Method
For denaturing gels, during the experiment of ligase reaction (time-course) 15% (w/v) of
Polyacrylamide gels (19-1) was used to analyse single strands of Hex-labelled DNA. The size
36
of the gel used in this experiment was 45 cm long to give good resolution of band of the DNA.
The equipment used was a SequiGEN GT 58 electrophoresis system (Bio-Rad) and set
following the instruction of the kit. A gel (15% (w/v)) was prepared as above in clean beaker
and injected into the base of the gel kit and then the comb (18 wells) was added and left till the
gel completely set about 20 minutes.
The gel was pre-run using 1× TBE buffer for 1 hour at 50 W until the temperature of
tank was at ~50 °C. The wells samples were rinsed by using syringe twice to make them clean
and the DNA samples were about 10 µl that heated at 100 °C for 2 min prior to loading. The
denaturing gel was run at 50 W for about 90 min within the samples of DNA. The gel was
carefully taken away and passed to wet chromatography paper (3MM). For DNA substrates
that contained a Hex-label, D-PAGE gels were visualised using a Fujifilm FLA-5000
phosphorimager, using fluorescently labelled oligonucleotides. Image-J software was used to
quantify reactions.
2.1.4. Sodium Dodecyl Sulphate Polyacrylamide Gel Electrophoresis (SDS-PAGE).
Materials
1- Resolving gel: 30 % (w/v) Acrylamide plus 0.8% (w/v) Bis-Acrylamide. Used at 10%
(w/v) concentration. National Diagnostics.
2- Resolving buffer 4×: 1.5 M Tris-HCl (pH 8.8) and 0.4% (w/v) SDS. Used at 10% (w/v)
concentration. National Diagnostics.
3- Stacking gel: 30 % (w/v) Acrylamide plus 0.8% (w/v) Bis-Acrylamide. Used at 5%
(w/v) concentration. National Diagnostics.
4- Stacking buffer: 0.5 M Tris-HCl (pH 6.8) and 0.4% (w/v) SDS. Used at 5% (w/v)
concentration. National Diagnostics.
5- APS: 20% (w/v). Used at 0.1% (w/v) concentration. Sigma.
6- TEMED: 98% (v/v). Used at 0.1% (v/v) concentration. Fisher.
37
7- 5× Running buffer of SDS PAGE: 125 mM Tris-HCl (pH 8.3), 125 mM Glycine,
0.5% sodium dodecyl sulphate (SDS). Used at 1× concentration.
8- 5× Loading buffer of SDS gel: 50 mM Tris-HCl (pH 6.8), 10 % Glycine, 2 % SDS, 0.1
% bromophenol blue. Used at 1 × concentration.
Method
Samples of proteins were analysed to determine the purity of proteins using a 10% (w/v)
resolving gel with a 5% (w/v) stacking gel. The kit of SDS gel (including tank, spacer and
comb of a Bio-Rad Miniprotean) was washed using distal water before assembling together. A
10% (w/v) resolving gel and 5% (v/v) stacking gel were prepared following the recipe above
and poured into different beaker, excepting adding 0.1% (w/v) TEMED to the resolving gel in
the end, and mixed for 20 seconds very well and then poured to the mini cassette 1.5 mm to 1
cm below the depth of the inserted comb. To prevent oxygen from diffusing inside the gel, 100
µl of butanol were added to the top of resolving gel.
When the gel set completely (about 20 min), the butanol was poured out of the cassette
and the exposed resolving gel top was washed with DW lots of the time. TEMED 0.1% (w/v)
final concentration was added to the 5% (v/v) stacking gel and mixed for 20 seconds very well
and then poured on top of the resolving gel, which is set completely in the first step, and the
comb (10-wells) was added. Once the stacking gel set completely ~20 min, the complex gel
cassette was putting to gather on the tank. The comb was removed and 1× running buffer of
SDS gel was added to both side of the chamber covered the top of the cassette in the middle of
the tank.
Prior to heating protein samples, ~10 μl of stock β-mercaptoethanol was added to a 1.5
ml SDS loading buffer. Samples (~20 µl) were prepared and heated to 95 °C for two min in
100 µl SDS gel-loading buffer (1×) for analysing and testing proteins on SDS PAGE. Heated
samples were cooled on ice and then loaded onto the SDS PAGE gel and were electrophoresed
38
in SDS Tris-Glycine running buffer. Gels were run at 80 V (i.e. 8 V/cm) until the dye arrived
to the resolving gel border, and then voltage increased to 150 V. Protein gel were washed twice
time by DW and heated using microwave for 2 min to get rid of the SDS buffer. The gel was
stained with protein Safe-stain (Fisher) using microwave, but before reach to boiling point and
washed again with DW few times and then distained use microwave again. Then left in a
staining tray containing DW overnight and visualised using white light transillumination (G-
BOX).
2.1.5. Spectrophotometry.
Ultraviolet light spectroscopy was used to determine the concentration of oligonucleotides,
PCR fragments, plasmids and protein molecules. DNAs and proteins molecules in this research
were determined at 260 nm and 280 nm wavelengths respectively. The instrument used was a
Nanoodrop 2000c UV Spectrophotometer. This was calibrated and blanked using a buffer-
matched solution containing no DNA or protein and then the absorption of light between 220
and 380 nm was measured through the sample containing DNA or protein. There were different
settings in this instrument for measuring dsDNA, ssDNA and oligonucleotides.
DNA concentrations were given in ng/μl, and proteins concentrations were given in
mg/ml. Those were converted to molar concentrations (such as nM or mM) via molecular mass.
To measure the cell density when growing E. coli cultures, visible light spectroscopy was used
to determine the optical density at 600 nm (OD600) of bacterial cell cultures using a CO8000
Cell Density Meter.
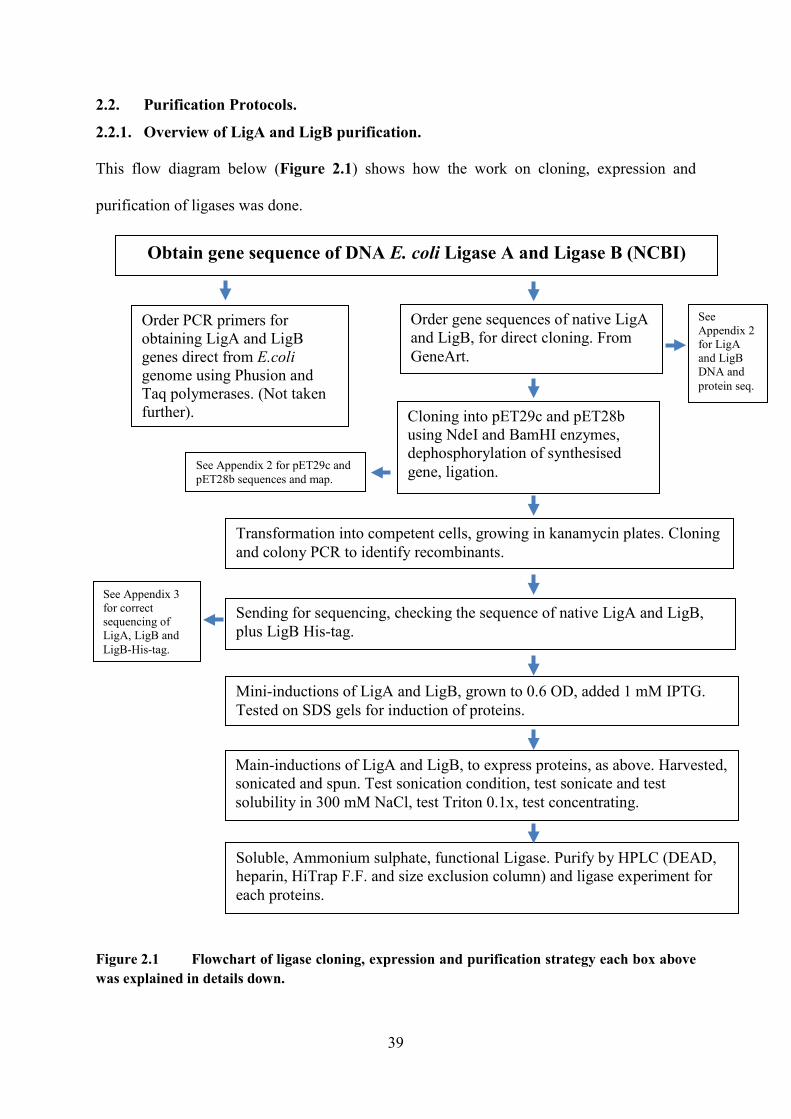
39
2.2. Purification Protocols.
2.2.1. Overview of LigA and LigB purification.
This flow diagram below (Figure 2.1) shows how the work on cloning, expression and
purification of ligases was done.
Figure 2.1 Flowchart of ligase cloning, expression and purification strategy each box above was explained in details down.
Sending for sequencing, checking the sequence of native LigA and LigB, plus LigB His-tag.
Order PCR primers for obtaining LigA and LigB genes direct from E.coligenome using Phusion and Taq polymerases. (Not taken further).
Order gene sequences of native LigA and LigB, for direct cloning. From GeneArt.
Cloning into pET29c and pET28b using NdeI and BamHI enzymes, dephosphorylation of synthesised gene, ligation.
Transformation into competent cells, growing in kanamycin plates. Cloning and colony PCR to identify recombinants.
Mini-inductions of LigA and LigB, grown to 0.6 OD, added 1 mM IPTG. Tested on SDS gels for induction of proteins.
See Appendix 2 for LigA and LigB DNA and protein seq.
Obtain gene sequence of DNA E. coli Ligase A and Ligase B (NCBI)
See Appendix 2 for pET29c and pET28b sequences and map.
Main-inductions of LigA and LigB, to express proteins, as above. Harvested,sonicated and spun. Test sonication condition, test sonicate and test solubility in 300 mM NaCl, test Triton 0.1x, test concentrating.
Soluble, Ammonium sulphate, functional Ligase. Purify by HPLC (DEAD, heparin, HiTrap F.F. and size exclusion column) and ligase experiment for each proteins.
See Appendix 3 for correct sequencing of LigA, LigB and LigB-His-tag.
40
2.2.2. Initial cloning of LigA and LigB genes by PCR from E.coli genomic DNA.
Materials
1- 20 units of Phusion enzyme (NEB).
2- Template DNA of E coli K12.
3- Forward and reverse primers of LigA and LigB:
LigA TOP 5�- ATGGAATCAATCGAACAACAACTGACAGAA LigA BOT 5�- TCAGCTACCCAGCAAACGCAGCATTTCCGC
LigB TOP 5�- ATGAAAGTATGGATGGCGATATTAATAGGT LigB BOT 5�- CTAAGGTTCAAAACCTGTGATCTGCTGGGC
4- 1 µM of dNTPs.
5- Free water to complete the volume of reaction till 50 µl.
Method
The complete coding sequence of the open reading frame of Ligase A and B of E. coli DNA ligases
were obtained from the NCBI database. For LigA the gene code was 946885 and for LigB 948164.
PCR primer pairs (30 bases) were designed to amplify the LigA or LigB genes directly. Standard
PCR reactions of 25 cycles of 99°C denaturing stage for 30 seconds, a 65°C annealing stage for
30 seconds, and a 72°C elongating step for 90 seconds were carried out on E. coli K12 using 0.5
μL Phusion enzyme or Taq enzyme. PCR reaction products were monitored by 1% agarose gel.
2.2.3. Transformation of Plasmids.
Materials
1. Competent cells: E. coli BL21 (DE3) (NEB).
2. Plasmids: pET-29c and pET-28b. At 200 ng/µl. Plasmids sequences are given in the
appendix 1.
3. SOC Stable Outgrowth Medium (NEB) B9035S).
4. LB Miller agar plates (Fisher Scientific): 15 g Agar, 10 g Tryptone, 5 g Yeast extract
and 10 g sodium chloride, completed with to 500 ml with distilled water and autoclave
sterilised instantly. When the bottle of LB agar cooled to be warm to touch, 50 μg/ml

41
of kanamycin was added, which was the convenient antibiotic for pET-29c. The agar
was poured into plastic petri dishes to about 5 mm in depth. Once the plates set nicely
then were stored at 4°C in cold room for a maximum one month.
Method
Plasmids ~20-100 ng of pET-29c or pET-28b were transferred into tubes containing 50 μl of
competent BL21 (DE3) (NEB) cells. The mixtures were incubated on ice for half an hour. They
were transferred to a heat block at 42°C for exactly half a minute, and then left them on ice for
2 minutes. SOC outgrowth medium (1 mL) was added to each tube of the mixture and they
incubated at 37°C for 1 hour. ~50 µl of growth mixture was then spread onto a LB agar plate
containing 50 μg/ml kanamycin and grown overnight at 37°C. The full DNA sequence of pET-
29c or pET-28b is given in Appendix 2.5 and 2.6.
2.2.4. DNA Extraction (Qiagen purification).
Materials
1- LB broth (Fisher Scientific): 10 g Tryptone, 5 g Yeast extract and 10 g sodium chloride,
completed up with distilled water to the desired volume and autoclaved instantly.
2- Kanamycin: 10 mg/ml stock solution. Filter sterilised immediately. Sigma.
3- QIAGEN Kit for Miniprep (Fisher Scientific).
Method
A 37°C overnight incubation of 3 mL of LB media with the appropriate antibiotic was
inoculated with a single plate colony of cells containing plasmid. The following morning 1 mL
of the culture was centrifuged at 15000× g for 5 minutes. The supernatant was discarded and
the cell pellet was re-suspended in 250 μl Buffer P1 and transferred to a micro centrifuge tube
(Ensure that RNase A has been added to Buffer P1). After suspension of the pellet, 250 μl
Buffer P2 was added and gently inverted the tube 4�6 times to mix until the solution became
viscous and slightly clear. Buffer N3 (350 μl) was added to the tube and immediately mixed
42
and inverted the tube 4�6 times. The tube mixture was centrifuged for 10 min at 13,000 rpm.
The supernatants from the last step were applied to the QIAprep spin column by decanting or
Pipetting and then QIAprep spin column was spun for 30-60 second and the flow-through was
discarded.
The QIAprep spin column was washed by adding 0.5 ml Buffer PB and was spun for
60 seconds and the flow-through was discarded. The QIAprep spin column also was washed
by adding 0.75 ml Buffer PE and spun for 60 second and the flow-through was discarded.
The QIAprep spin column was placed in a clean 1.5 ml microcentrifuge tube and 50 µl of
Elution buffer was added to elute the plasmid (DNA). The concentration of plasmid DNA was
determined by spectrophotometry at 260 nm using a Nanodrop ND-2000C and a sample tested
on 1% agarose gel.
2.2.5. Obtaining LigA and LigB Genes by Commercial Synthesis (GeneArt).
To save time, the complete coding sequence of the open reading frame of LigA and LigB genes
of E.coli DNA ligases were synthesised using GeneArt (Life Technology). These came as
double-stranded DNA. They each had an NdeI site at either end or only for LigB His-tag had
an NdeI and BamHI site, so that they could be cloned directly into the NdeI site of pET-29c or
into NdeI and BamHI of pET-28b for LigB His-tag. The NdeI site is shown within each primer
as a CATATG site for native LigA and LigB, whereas the NdeI and BamHI are shown within
each primer as a CATATG and GGATCC sites only for LigB His-tag. The full DNA sequence
and protein sequence of native LigA and LigB are given in Appendix 2.1, 2.2, 2.3 and 2.4.
43
2.2.6. DNA Restriction Enzyme Digests.
Materials
1- DNA substrate: ~ 500 ng of LigA, LigB (Gene Art Synthesis) pET-29c or pET-28b
vectors.
2- Restriction enzymes: ~ 20 units of NdeI enzyme (NEB).
3- Restriction enzymes: ~ 20 units of BamHI enzyme (NEB) for LigB His-tag.
4- 1× Restriction digest buffer (NEB) for each enzyme.
5- Shrimp Alkaline Phosphatase (SAP) ~ 10 units/reaction.
6- 1× Shrimp Alkaline Phosphatase buffer.
7- Free water to complete the volume of reaction.
Method
LigA and LigB (~500 ng each) were each digested with NdeI and with NdeI/BamHI for LigB
His-tag at 37°C for 2 hrs. The enzymes were then denatured by heating to 65°C for 5 min and
the DNA precipitated by ethanol precipitation (see next section). They were re-suspended in
nuclease-free water and the concentration calculated by spectrophotometry (260 nm) using a
NanoDrop-2000c.
Suitable vectors for expression were kindly supplied by Dr Andy Pickford and Prof. Collayhan,
University of Portsmouth. Fresh pET-29c and pET-28b plasmids miniprep were prepared
(Qiagen kit) as above and a sample (1 μg) was digested with NdeI and BamHI enzymes,
respectively, then dephosphorylated using 10 units Shrimp Alkaline Phosphatase (SAP) at
37°C for 30 minutes for each sample. The enzymes and SAP were removed by heating and
ethanol precipitation. Samples (100 ng) of the uncut and NdeI/BamHI-cut genes were run on
1% agarose gels to observe them.
2.2.7. Ethanol Precipitation.
Materials
44
1- DNA substrate: ~ 500 ng of NdeI cut of LigA and LigB (Gene Art Synthesis),
NdeI/BamHI cut LigB his-tag, NdeI cut of pET29c and NdeI/BamHI cut of pET28b
vectors.
2- 3 M (NaOAc) sodium acetate or 10 M of ammonium acetate.
3- 100% and 70% ethanol.
Method
Alcohol precipitation was used to desalt, purify and concentrate plasmid DNA. A volume of
DNA in solution was measured and 0.1 equivalent volumes of 3 M sodium acetate was added,
followed by 2 total equivalent volumes of ice-cold 100% (v/v) ethanol. The solution was mixed
and placed in a freezer -28 0C for 60 min (or overnight). Precipitated DNA was pelleted in an
Eppendorf cooled-rotor centrifuge for 60 min at 13,000 rpm. The supernatant was removed and
3 volumes of ice-cold 70% (v/v) ethanol were added to remove the salt. DNA was centrifuged
again for 30 min and the alcohol removed. The pellet was allowed to air dry until any remaining
solvent had evaporated and then re-suspended by elution buffer. The concentration of all DNA
samples were checked using a Nanodrop 2000-c spectrophotometer.
2.2.8. Ligation into pET29c or pET28b.
Materials
1- Ligase genes: ~500 ng of NdeI cut LigA or LigB (from GeneArt Synthesis). ~500 ng
of NdeI and BamHI cut LigB His-tag (from GeneArt Synthesis).These were the three
genes to be cloned. Cloning plasmids: ~500 ng of pET-29c cut with NdeI only (for
native LigA). ~500 ng of pET-29c cut with NdeI only (for native LigB). ~500 ng of
pET-28b cut with NdeI and BamHI (for His-tag LigB), the ration of DNAs was 1:1.
2- Competent cell of E. coli: 50 µl of 10-Beta cells (NEB).
3- 2× NEB Instant Sticky ligation Mix.
4- SOC Outgrowth Medium (NEB).
45
5- LB Miller agar plates (Fisher Scientific): 15 g Agar, 10 g Tryptone, 5 g Yeast extract
and 10 g sodium chloride, completed up with distilled water to the desired volume and
autoclave sterilised immediately. Kanamycin (50 μg/ml) was added, which was the
convenient antibiotic for pET29c. The agar was poured into plastic petri plates about 5
mm in depth under the circumstance sterilization. Once the plates set nicely then were
stored at 4 °C in cold room for a maximum one month.
Method
The NdeI-cut LigA and LigB genes, and NdeI and BamHI cut of LigB with His-tag (from
GeneArt) were each ligated into NdeI/SAP-treated pET29c and NdeI-BamHI/SAP-treated
pET28b, respectively. A ratio of 1:20 (insert: vector) was used (5 μL), with 5 μL of 2× NEB
Instant Sticky ligation Mix. The pET29c-LigA/LigB and pET28b-LigB His-tag ligation
mixtures were incubated on ice with competent E. coli 10-Beta cells (NEB) for 20 minutes,
heat-shocked at 42°C for 30 seconds to facilitate plasmid uptake by the cells, and incubated at
37°C for one hour to recover. They were then plated onto agar plates containing kanamycin
(50 µg/ml) and incubated overnight at 37°C until colonies grew. Figure 2.2 shows the brief
summary of the ligation and cloning of native LigA and LigB in pET29c or pET28b plasmids.
2.2.9. Colony PCR.
Materials
1. Forward and reverse primers (1 µM) for pET-29c. Sequences of 30 base primers were:
Top: 5�-TGATGCCGGCCACGATGCGTCCGGCGTAGA
Bot: 5�-GGTACCCAGATCTGGGCTGTCCATGTGCTG
46
2. Forward and reverse primers (1 µM) for pET-28b. Sequences of 30 base primers were:
Top 5�-TGATGCCGGCCACGATGCGTCCGGCGTAGA
Bot 5�-CTTGTCGACGGAGCTCGAATTCGGATCCCG
3. 2× Taq Master Mix enzymes (NEB).
4. Single colony of transformed Beta-10 cells.
5. Free water to complete the volume of reaction to 50 µl.
Method
Rather than sending many colonies for sequencing, colony-PCR was carried out on 30 of the
kanamycin-resistant colonies that grew, to identify bacteria that had a recombinant LigA or
LigB gene. For these 50 μl PCR reactions, 25 µl of Taq Master Mix (NEB) was used, with a
PCR primer pair that amplified the part of pET-29c and pET-28b either side of the cloned gene.
2.2.10. DNA sequencing.
Materials
1- 100 ng of recombinant LigA and LigB plasmids.
2- Forward and reverse primers (10 µM) for pET-29c. Sequences of 30 base primers were:
Top: 5�-TGATGCCGGCCACGATGCGTCCGGCGTAGA
Bot: 5�-GGTACCCAGATCTGGGCTGTCCATGTGCTG
3. Forward and reverse primers (10 µM) for pET-28b. Sequences of 30 base primers were:
Top 5�-TGATGCCGGCCACGATGCGTCCGGCGTAGA
Bot 5�-CTTGTCGACGGAGCTCGAATTCGGATCCCG
Method
Plasmids minipreps (from 2.2.4) were made from 5 ml overnight cultures of E. coli Beta-10
bacteria containing either recombinant pET-29c LigA, pET-29c LigB or pET-28b LigB His-
tag. A sample (100 ng) of each plasmid was sent for DNA sequencing (Beckman Coulter/
Genewiz). The sequencing primers were the same as those used for colony-PCR, and were used
47
separately to sequence the Top (upper) and Bot (lower) strands of the recombinant LigA, LigB
and LigB His-tag genes. Sequencing data were opened in Chromas 2.0 software and the DNA
sequence checked by base manually.
2.2.11. Cell Culture Optical Density.
Materials
1- Cell density meter (CO8000 Cell Density Meter).
2- 1 ml plastic cuvettes.
Method
The optical density of cell cultures was measured by visual (600 nm) light spectrophotometry.
A cell density meter was initially blanked using reference sample of cell media in a
polypropylene cuvette. An inoculated sample was then measured using the optical density via
press reading button and then the results were given in absorbance units. The instruments was
used and maintained according to the manufacturer�s recommendations.
2.2.12. Mini Inductions of LigA and LigB.
Materials
1- LB Miller agar plates (500 ml): 15 g agar, 10 g tryptone, 5 g yeast extract and 10 g
sodium chloride, completed up with distilled water to the desired volume and autoclave
sterilised instantly. Plates were poured and contained 50 µg/ml kanamycin. Fisher
Scientific.
2- LB Broth (500 ml): 10 g tryptone, 5 g yeast extract and 10 g sodium chloride, completed
up with distilled water to the desired volume and autoclaved instantly. When cooled,
kanamycin was added to 50 µg/ml. Fisher Scientific.
3- Isopropyl β-D-1-thiogalactopyranoside (IPTG): 1 M was prepared and filter sterilised
immediately.
4- Competent cell: E. coli BL21 (DE3). NEB.
48
5- Antibiotic: kanamycin 10 mg/ml, stock solution were filter sterilised immediately.
Sigma.
6- Protein marker (Blue Protein Standard, Broad Range). NEB.
7- Commercial LigA (1 U/µl). NEB.
Method
A small-scale protein expression trial of E. coli BL21 (DE3) containing either pET-29c LigA,
pET-29c LigB or pET-28b LigB His-tag construct were conducted. A small amount (2 ng) of
the LigA or LigB plasmids were transformed into competent cells of E. coli BL21 (DE3) (NEB)
and incubated at 37°C for one hour in an orbital shaker. They were plated onto an agar plate
containing 50 μg/mL of kanamycin and incubated overnight at 37°C. A single colony was
picked and added to 1 mL LB broth with 50 μg/mL kanamycin at 37°C overnight with shaking.
A 50 μL aliquot of overnight culture was added to 5 mL LB broth containing kanamycin.
The bacterial samples were cultured until an optical density at 600 nm (OD600) of 0.6
was reached (approximately 2 hours). Protein expression was then induced with 1 mM IPTG
and cells grown at 37°C with shaking until 3 hours after the induction and samples of pre- and
post-IPTG induction were taken at regular time points. Samples of pre- and post-IPTG
induction were run on a 10% SDS-PAGE with both a protein marker and also a separate sample
(1 U) of commercially-available LigA from NEB as a size guide.
2.2.13. Testing the Solubility of Native LigB.
Materials
1- LB broth (Fisher Scientific): 10 g Tryptone, 5 g Yeast extract and 10 g sodium chloride,
completed up with distilled water to the desired volume and autoclaved instantly.
2- Kanamycin: 10 mg/ml stock solution. Filter sterilised immediately. Sigma.
3- Isopropyl β-D-1-thiogalactopyranoside (IPTG): 1 M was prepared and filter sterilised1
immediately.
4- Benzamidine and PMSF 100 mM stock. Used at 10 mM.
49
5- Protease inhibitor. Used at each 2 g of pellet in 100 µl cocktail proteases.
6- Resuspension buffer (Sodium phosphate Mon. and Di. (pH 7.0)) 100 mM stock buffer.
Used at 10 mM and completed up to the desired volume with distilled water, filter
sterilised and vacuum degassed for 20 min.
Method
A 5 mL aliquot of an overnight bacterial culture of recombinant LigB protein was added to 500
mL LB broth containing kanamycin, in an orbital shaker at 37°C until an optical density
(OD600) of 0.6 was reached. Protein expression was then induced with 1 mM IPTG and cultures
were incubated at 37°C until an OD600 of approximately 2.0 was reached (typically 3 hours).
Bacteria cultures were harvested by centrifugation (6000 rpm, 20 minutes, 4°C) in a Beckman
Coulter Avanti J-20XP refrigerated centrifuge using a JLA 8.1000 rotor, and the supernatant
(media) was discarded. The pellets were resuspended in 10 ml of sodium phosphate buffer pH
7.0 containing protease inhibitors (benzamidine, PMSF and cocktail proteases). A test of how
much sonication was needed was carried out by sonicating (Fisher Scientific) the 10 ml sample
on ice first for 1 min (a total of six 10 second pulses, with five 10 seconds pauses). At this point
a 25 µl sample of sonicate was taken for loading on to an SDS gel. The same 10 ml sample was
sonicated in the same way at 1 min intervals for a total for 5 min. Also, for the 5 min sonicated
sample, this was spun down by centrifugation at 18000 rpm for 20 minutes and a sample of the
supernatant and the cell pellet (debris) prepared in SDS buffer.
2.2.14. Testing the Solubility of Expressed LigB Protein in NaCl and TritonX-100.
Materials
1- LB broth (Fisher Scientific): 10 g Tryptone, 5 g Yeast extract and 10 g sodium chloride,
completed up with distilled water to the desired volume and autoclaved instantly.
2- Kanamycin: 10 mg/ml stock solution. Filter sterilised immediately. Sigma.
50
3- Isopropyl β-D-1-thiogalactopyranoside (IPTG): 1 M was prepared and filter sterilised
immediately.
4- Benzamidine and PMSF 100 mM stock. Used at 10 mM.
5- Protease inhibitor. Used at each 2 g of pellet in 100 µl cocktail proteases.
6- Resuspension buffer (Sodium phosphate Mon. and Di. (pH 7.0)) 100 mM stock buffer.
Used at 10 mM and completed up to the desired volume with distilled water, filter
sterilised and vacuum degassed for 20 min.
7- NaCl 5 M stock. Used at 150 and 300 mM.
8- TritonX-100. Used at 0.1%.
Method
As a result of finding that the expressed LigB protein was mainly insoluble, an experiment to
test if the protein could be re-solubilised in either NaCl or with a small amount of TritonX-100
detergent was tried. A sample (10 ml) of resuspended LigB cell pellet with inhibitors from a
500 ml induction was sonicated on ice for a total of 5 minutes (with 10 second pauses between
10 second pulses), to ensure that the pellet was completely disrupted as much as possible. A
third of this (3.3 ml) was kept (0 mM NaCl). Another third was mixed with 150 mM NaCl and
the other third was mixed with 300 mM NaCl. Each third (3.3 ml) was left at room temperature
for 30 minutes, to allow any soluble protein to leave the pellet.
The 150 mM and 300 mM NaCl samples were then split in two (1.7 ml each) and 0.1% (v/v)
TritonX-100 added to one of the two 1.7 ml samples. These two samples (containing 150 or
300 mM NaCl plus 0.1% TritonX-100) were mixed and left at room temperature for 45
minutes. All five samples were spun at 18000 RCF for 15 minutes to separate the �supernatant�
from the cell debris. This gave a total of 10 samples (supernatant and debris from each
condition). An aliquot of 25 µl of each sample was loaded on a 10% SDS-PAGE gel.
51
2.2.15. LigB Refolding Experiment.
Materials
1- Urea powder (reagent grade). Used at 8, 6, 3 and 1.5 M concentrations.
2- Guanidine hydrochloride powder. Used at 0.25 M.
3- Tris-HCL buffer at different pHs. Used at 8.6, 8.0, 7.2 and 7.0.
4- Dithiothreitol (DTT) 1M stock. Used at 20 mM.
5- Mg+2 1 M stock. Used at 10 mM.
6- ZnCl2 1 M stock. Used at different concentrations.
7- Cystamine dihydrochloride 1 M. used at 20 mM.
8- 2-hydroxyethyl-disulfide 8 M. Used at 1 mM.
9- Β-mercaptoethanol 14 M. Used at 5 mM.
10- NaCl 1 M: used at 0.15 M.
11- Dialysis materials. Lab stirrer and dialysis membrane (SpectraPor MWCO 6-8 KDa).
12- Resuspension buffer: sodium phosphate (mono and diphosphate, pH 7.0) at 100 mM
stock buffer. Used at 10 mM and completed up to the desired volume with distilled
water, filter sterilised and vacuum degassed for 20 min.
13- Solubilisation buffer I (SBI): 1 L beaker of 8 M urea, 0.25 M GdmCl, 50 µM ZnCl2
and 20 mM Tris-HCl pH 8.6 with addition of 20 mM of fresh DDT.
14- Solubilisation Buffer (SBII): 1 L beaker of 50 mM Tris-HCl pH 8.0, 6 M urea, 10 mM
Mg+2, 0.1 mM ZnCl2, 20 mM cystamine dihydrochloride and 20 mM DDT
15- Buffer SBIII: 1 L beaker of 50 mM Tris-HCl pH 8.0, 3.5 M urea, 10 mM Mg+2, 0.1
mM ZnCl2, 5 mM B-ME and 1 mM 2-hydroxyethyl-disulfide.
16- Buffer SBIV: 1 L beaker of 50 mM Tris-HCl pH 7.2, 1.5 M urea, 10 mM Mg+2, 0.1
mM ZnCl2 and 0.15 M NaCl.
52
17- Buffer SBV: 1 L beaker of 50 mM Tris-HCl pH 7.2, 10 mM Mg+2, 0.1 mM ZnCl2,
0.15 M NaCl.
Method
A fresh 500 ml LigB induction was centrifuged, resuspended in 10 ml resuspension buffer and
sonicated for 5 min. the sonicate was spun at 18000 RPM for 15 minutes to separate the
supernatant from the pellet. The final pellet that had insoluble protein of LigB was resuspended
in 20 ml solubilisation buffer I (SBI). This solution was mixed very well and stirred at 4°C in
a cold room overnight. The solubilised inclusion body cell suspension was centrifuged at 18000
rpm for 30 min at 4°C and the clear supernatant was kept in a fridge. The protein concentration
of supernatant at 280 nm was measured by spectrophotometry on a Nanodrop ND-2000c.
Buffer SBII was then used to dilute the supernatant to 0.2 mg/ml and subjected to serial
overnight dialysis. SpectraPor molecular porous membrane (MW cut off: 6-8 KDa) was used
to dialyse 15 ml of the 0.2 mg/ml supernatant into buffer SBIII in a 1 L beaker and then stirred
overnight at 4°C in cold room. After overnight stirring, buffer SBIII was changed to 1 L of
buffer SBIV. Finally, buffer SBIV was changed to 1 L of buffer SBV. A sample of the refolded
native LigB protein (25 µl) was run on 10% SDS-PAGE gel.
2.2.16. Main Inductions of LigA and LigB.
Materials
1. LB Miller agar plate: 15 g agar, 10 g tryptone, 5 g yeast extract and 10 g sodium
chloride, completed with distilled water to the desired volume and autoclaved sterilised
instantly. Fisher Scientific.
2. LB Broth: 10 g tryptone, 5 g yeast extract and 10 g sodium chloride, completed up with
distilled water to the desired volume and autoclaved instantly. Fisher Scientific.
3. Isopropyl β-D-1-thiogalactopyranoside (IPTG): 1 M was prepared and filter sterilised
immediately and kept at 4°C.
53
4. Competent cells: E. coli BL21 (DE3). NEB.
5. Kanamycin: 10 mg/ml stock solution. Filter sterilised immediately. Sigma.
6 Resuspension buffer1: sodium phosphate (mono and diphosphate, pH 7.0) at 100 mM
stock buffer. Used at 10 mM and completed up to the desired volume with distilled
water.
7 Resuspension buffer2: 50 mM Tris-HCL, pH 7.2, 0.5 M NaCl and 0.1% (v/v) Triton
X-100. Completed up to the desired volume with distilled water.
8 NaCl 5 M stock. Used at 1 M.
9 Benzamidine and PMSF, 100 mM stock. Used at 10 mM.
10 Protease inhibitor, 1 ml tube. Used at 100 µl for each 10 g of cell pellet.
11 Column binding buffer: sodium phosphate (mono and diphosphate, pH 7.0) at 100 mM
stock buffer. Used at 10 mM and completed up to the desired volume with distilled
water.
12 Dialysis materials. Lab stirrer and dialysis membrane (SpectraPor MWCO 6-8 KDa).
Method
All E. coli cultures were grown in LB media containing kanamycin at 50 μg/ml. The pET29c
LigA, LigB or pET28b LigB His-tag plasmids were transformed into competent cells of E. coli
BL21 (DE3) on ice for 30 min and heating shock for 10 seconds and then incubated at 37°C
for one hour in an orbital shaker. They were plated onto an agar plate containing 50 μg/mL of
kanamycin and incubated overnight at 37°C. A single colony was picked and added to 5 mL
LB broth with 50 μg/mL kanamycin at 37°C overnight with shaking. A sample (1 mL) aliquot
of the overnight bacterial culture of either recombinant LigA or LigB protein was added to 500
mL LB broth containing kanamycin, in an orbital shaker at 37°C until an optical density
(OD600) of 0.6 was reached. Protein expression was then induced with 1 mM IPTG and the
cultures were incubated at 37°C until an OD up to 1.50 (typically 3h.).
54
Bacteria cultures were harvested by centrifugation (6000 rpm, 20 minutes, 4°C) in a
Beckman Coulter Avanti J-20XP refrigerated centrifuge using a JLA 8.1000 rotor, and the
supernatant (media) was discarded. The cell pellets were re-suspended in 20 ml lysis buffer (10
mM sodium phosphate, pH: 7.0) containing protease inhibitors (cocktail protease,
Benzamidine and PMSF). Cells were lysed by sonicating for 5 minutes and spun down by
centrifugation at 18000 rpm for 20 minutes and separated to supernatant and cell pellet (debris)
(soluble and insoluble fractions).
Because the expressed LigB (also LigB His-tag) was totally insoluble in the supernatant
using this method, it was induced and purified with different conditions to LigA above. For
LigB, 1 mL aliquot of the overnight bacterial culture of recombinant LigB protein was added
to 500 mL LB broth containing kanamycin, in an orbital shaker at 37°C until an optical density
(OD600) of 0.6 was reached. Protein expression was then induced with 2 mM IPTG and cultures
were incubated at 17°C until up to OD 1.50 overnight, only for LigB His-tag before adding the
IPTG the culture was added on ice for ~20 min. The pellets of cultures were re-suspended in
15 ml of 50 mM resuspension buffer 2 containing protease inhibitors (cocktail protease,
Benzamidine and PMSF). The lysate was sonicated for 5 minutes and spun down by
centrifugation at 18000 rpm for 20 minutes and separated to supernatant and cell pellet (debris).
This method, using 2 mM IPTG and growth at 17°C, did provide a low concentration of soluble
LigB.
The soluble native LigA and LigB (and His-tag LigB) fractions were then purified using the
same following techniques. The first step was preventing protein-DNA interactions by adding
NaCl to final concentration of 1 M. the second step was to precipitate LigA or LigB by
ammonium sulphate fraction. All steps were performed at 4°C. For step 1, NaCl 1 M was added
to the clarified lysate to remove the DNA and RNA from the proteins. For step 2, they were
then made up to 40% (w/v) (NH4)2SO4 by gradual addition of the solid with slowly mixing at
55
4°C for 2 hours to precipitate the proteins. The samples were centrifuged at 18000 rpm for 20
minutes and then the supernatant was discarded, and the pellet (containing the precipitated
proteins) re-suspended in the appropriate volume of column binding buffer (usually about 1-2
ml). The samples (which still contained NaCl and (NH4)2SO4) were then dialysed via
membrane dialysis overnight in column binding buffer. For soluble native LigA not all the
previous purification steps were used with all the purified protein of LigA.
2.2.17. LigA Purification Strategy 1.
Materials
1. HiTrap Heparin-Sepharose affinity chromatography column, 5 ml (GE Healthcare).
This is for purifying DNA binding protein and is based on cross-linked agarose.
2. HiTrap Q-Sepharose Fast Flow (FF) chromatography column, 5ml (GE Healthcare).
This is a strong anion exchange resin, cross-linked agarose
3. Size exclusion column 120 ml, HiprepTM 16/60 SepharcrylTM S-300 HR (GE
Healthcare).
4. Column binding buffer: sodium phosphate (mono and diphosphate, pH 7.0) at 10 mM,
filter sterilised and vacuum degassed for 20 min.
5. Column elution buffer: sodium phosphate (mono and diphosphate, pH 7.0) at 10 mM
plus 1 M NaCl, filter sterilised and vacuum degassed for 20 min.
6. AKTA Basic HPLC Chromatography instrument. GE Healthcare Ltd.
7. Ethanol 20%: completed with distilled water, filter sterilised and vacuum degassed for
20 min.
8. Distilled water, filter sterilised and vacuum degassed for 20 min.
9. Spin column. Membrane Vivaspin 20 5-20 ml samples MWCO 30,000. Sartorius (Lab
Technology).
56
10. Ligase storage buffer: 30 mM Tris-HCl (pH 8.0), 4 mM MgCl2, 1 mM DTT, 26 µM
NAD+, 50 μg/ml BSA and 30% (v/v) glycerol.
Method
In this method native LigA was purified by HiTrap Heparin-Sepharose affinity, HiTrap Q-
Sepharose Fast Flow (FF) and size exclusion columns. All the steps were done at 4°C in a cold-
room or at room temperature. Five column volumes of degassed distilled water was run to pre-
equilibrate a 5 ml heparin column and then five column volumes of column binding buffer
were run through. The soluble native LigA (1-2 ml) was loaded into a clean 15 ml glass
superloop. The LigA was injected in column binding buffer on to the heparin column. LigA
protein was eluted using column elution buffer during a 0-100% gradient for 40 min and
fractions of 1 ml were collected.
Once the purification of protein finished, minimum five column volumes of distilled
water was used to wash the heparin column and then followed with minimum five column
volume of 20% ethanol for storage. An SDS-PAGE gel (section 2.1.4) was used to test each
peak separately for proteins and any fractions containing the desired native LigA protein
(depending on the molecular weight) were taken and stored at 4°C. The most pure fractions
(about 2 ml) were added together and concentrated by a spin column till ~1 ml and then dialysed
back into column binding buffer.
The dialysed soluble protein of LigA ~1 ml was injected in column binding buffer on to the
HiTrap column (F.F.). LigA protein was eluted using column elution buffer during a 0-100%
gradient for 40 min and fractions of 1 ml were collected. Once the purification of protein
finished, minimum five column volumes of distilled water was used to wash the HiTrap column
(F.F.) and then followed with minimum five column volume of 20% ethanol for storage. An
SDS-PAGE gel (section 2.1.4) was used to test each peak separately for proteins and any
fractions containing the desired native LigA protein (depending on the molecular weight) were
57
taken and stored at 4°C. The most pure fractions (about 2 ml) were added together and
concentrated by a spin column till ~1 ml and then dialysed back into column binding buffer.
The dialysed soluble protein of LigA was added together and ~2 ml were injected into
the plastic superloop and purified via using size exclusion column 20 ml (GE Healthcare) on
AKTA basis machine. All the steps were done at room temperature. Minimum one column
volumes of distilled water was run to pre-equilibrated the column and then one column volumes
of binding buffer (A). The samples were injected in the loop and the buffer that used for running
the purification was column binding buffer by one and a half column volumes to resolve and
elute the protein. Once the purification of protein finished, minimum one column volumes of
distilled water was used to wash the column and then followed with one column volume of
20% ethanol for storage. An SDS-PAGE gel (section 2.1.4) was used to test each peak
separately for proteins and any fractions containing the desired native LigA protein (depending
on the molecular weight) were taken and stored at 4°C. The most pure fractions (about 2 ml)
were added together and concentrated by a spin column till ~1 ml and then dialysed into ligase
storage buffer.
2.2.18. LigA Purification Strategy 2.
Materials
1. HiTrap Diethylaminoethyl (DEAE) chromatography column, 5ml (GE Healthcare).
This is a week anion exchange resin, cross-linked agarose.
2. Column binding buffer: sodium phosphate (mono and diphosphate, pH 7.0) at 10 mM,
filter sterilised and vacuum degassed for 20 min.
3. Column elution buffer: sodium phosphate (mono and diphosphate, pH 7.0) at 10 mM
plus 1 M NaCl, filter sterilised and vacuum degassed for 20 min.
4. AKTA Basic HPLC Chromatography instrument. GE Healthcare Ltd.
58
5. Ethanol 20% (v/v): completed with distilled water, filter sterilised and vacuum
degassed for 20 min.
6. Distilled water, filter sterilised and vacuum degassed for 20 min.
7. Spin column. Membrane Vivaspin 20 5-20 ml samples MWCO 30,000. Sartorius (Lab
Technology).
8. Ligase storage buffer: 30 mM Tris-HCl (pH 8.0), 4 mM MgCl2, 1 mM DTT, 26 µM
NAD+, 50 μg/ml BSA and 30% (v/v) glycerol.
Method
In this method native LigA was purified by DEAE column. All the steps were done at 4°C in
a cold-room. Minimum five column volumes of degassed distilled water was run to pre-
equilibrate a 5 ml DEAE column and then minimum five column volumes of column binding
buffer were run through. The soluble native LigA (1-2 ml) was loaded into a clean 15 ml glass
superloop. The LigA was injected in column binding buffer on to the DEAE column. LigA
protein was eluted using column elution buffer during a 0-100% gradient for 40 min against
column binging buffer and fractions of 1 ml were collected. Once the purification of protein
finished, minimum five column volumes of distilled water was used to wash the DEAE column
and then followed with minimum five column volume of 20% ethanol for storage. An SDS-
PAGE gel (section 2.1.4) was used to test each peak separately for proteins and any fractions
containing the desired native LigA protein (depending on the molecular weight) were taken
and stored at 4°C. The most pure fractions (about 2 ml) were added together and concentrated
by a spin column till ~1 ml and then dialysed into ligase storage buffer.
2.2.19. LigB Purification Strategy1.
Materials
1. HiTrap Q-Sepharose (HP) chromatography column, 5 ml (GE Healthcare).
59
2. Column binding buffer: sodium phosphate (mono and diphosphate, pH 7.0) at 10 mM,
filter sterilised and vacuum degassed for 20 min.
3. Column elution buffer: sodium phosphate (mono and diphosphate, pH 7.0) at 10 mM
plus 1 M NaCl, filter sterilised and vacuum degassed for 20 min.
4. AKTA Basic HPLC Chromatography instrument. GE Healthcare Ltd.
5. Ethanol 20%: completed with distilled water, filter sterilised1 and vacuum degassed for
20 min.
6. Distilled water, filter sterilised and vacuum degassed for 20 min.
7. Spin column. Membrane Vivaspin 20 5-20 ml samples MWCO 30,000. Sartorius
(Lab Technology).
8. Ligase storage buffer: 30 mM Tris-HCl (pH 8.0), 4 mM MgCl2, 1 mM DTT, 26 µM
NAD+, 50 μg/ml BSA and 30% (v/v) glycerol.
Method
The soluble protein (~1 ml) was injected into the glass superloop and purified via using AKTA
basis machine. All the steps were done at room temperature. Minimum five column volumes
of distilled water and vacuum degassed was run to pre-equilibrate the HiTrap HP column and
then minimum five column volumes of column binding buffer. The soluble native LigB (1-2
ml) was loaded into a clean 15 ml glass superloop. The LigB was injected in column binding
buffer on to the heparin column. LigB protein was eluted using column elution buffer during a
0-100% gradient for 40 min against column binging buffer and fractions of 1 ml were collected.
Once the purification of protein finished, minimum five column volumes of distilled water was
used to wash the column and then followed with minimum five column volume of 20% ethanol
for storage. SDS PAGE gel (2.2.1) was used for test each peak separately and any fractions
containing the desired protein (depending on the molecular weight) were taken and stored at
60
4°C. The most pure fractions (about 2 ml) were added together and concentrated by a spin
column till ~1 ml and then dialysed into ligase storage buffer.
2.2.20. LigB Purification Strategy 2.
Materials
1. HiTrap Heparin-Sepharose affinity chromatography column, 5 ml (GE Healthcare).
This is for purifying DNA binding protein and is based on cross-linked agarose.
2. Column binding buffer: sodium phosphate (mono and diphosphate, pH 7.0) at 10 mM,
filter sterilised and vacuum degassed for 20 min.
3. Column elution buffer: sodium phosphate (mono and diphosphate, pH 7.0) at 10 mM
plus 1 M NaCl, filter sterilised and vacuum degassed for 20 min.
4. AKTA Basic HPLC Chromatography instrument. GE Healthcare Ltd.
5. Ethanol 20%: completed with distilled water, filter sterilised1 and vacuum degassed for
20 min.
6. Distilled water, filter sterilised and vacuum degassed for 20 min.
7. Spin column. Membrane Vivaspin 20 5-20 ml samples MWCO 30,000. Sartorius (Lab
Technology).
8. Ligase storage buffer: 30 mM Tris-HCl (pH 8.0), 4 mM MgCl2, 1 mM DTT, 26 µM
NAD+, 50 μg/ml BSA and 30% (v/v) glycerol.
Method
The soluble protein (~1 ml) was injected into the glass superloop and purified via using AKTA
basis machine. All the steps were done at room temperature. Minimum five column volumes
of distilled water and vacuum degassed was run to pre-equilibrate the heparin column and then
minimum five column volumes of column binding buffer. The soluble native LigB (1-2 ml)
61
was loaded into a clean 15 ml glass superloop. The LigB was injected in column binding buffer
on to the heparin column. LigB protein was eluted using column elution buffer during a 0-
100% gradient for 40 min against column binging buffer and fractions of 1 ml were collected.
Once the purification of protein finished, minimum five column volumes of distilled
water was used to wash the heparin column and then followed with minimum five column
volume of 20% ethanol for storage. SDS PAGE gel (2.2.1) was used for test each peak
separately and any fractions containing the desired protein (depending on the molecular
weight) were taken and stored at 4°C. The most pure fractions (about 2 ml) were added together
and concentrated by a spin column till ~1 ml and then dialysed into ligase storage buffer.
2.2.21. LigB Purification Strategy 3.
Materials
1. HisTrap HP column (5 ml), Nickel Affinity Chromatography (Ni-NTA resin (QIAGEN)).
2. Column binding buffer: 10 mM sodium phosphate (pH 7.0), 20 mM imidazole and 500 mM
NaCl, completed up to the desired volume with distilled water, filter sterilised and vacuum
degassed for 20 min.
3. Column elution buffer: 10 mM sodium phosphate (pH 7.0), 500 mM imidazole and 500 mM
NaCl, completed up to the desired volume with distilled water, filter sterilised and vacuum
degassed for 20 min.
4. Distilled water, filter sterilised and vacuum degassed for 20 min
5. Stripping buffer: 10 mM sodium phosphate pH 7, 50 mM EDTA and 500 mM NaCl,
completed up to the desired volume with distilled water, filter sterilised and vacuum degassed
for 20 min.
6. Nickle buffer (NiSO4): 10 mM of NiSo4, completed up to the desired volume with distilled
water, filter sterilised and vacuum degassed for 20 min.
62
7. 20 % Ethanol: completed with distilled water to the desired volume, filter sterilised and
vacuum degassed for 20 min.
Method
The soluble protein (1 ml) was injected into the class superloop and purified via using AKTA
basis machine. All the steps were done at room temperature. Minimum five column volumes
of distilled water and vacuum degassed was run to wash the HisTrap from the 20% ethanol and
to pre-equilibrate the HisTrap column and then minimum five column volumes of column
binding buffer. The soluble LigB His-tag (1-2 ml) was loaded into a clean 10 ml glass
superloop. The LigB His-tag was injected into column binding buffer on to the HisTrap
column. LigB His-tag protein was eluted using column elution buffer containing 10 mM of
sodium phosphate pH 7, 0.5 M sodium chloride and 500 mM imidazole during a 0-100% gradient
for 40 min against column binding buffer and fractions of 1 ml were collected.
Once the purification of protein finished, minimum five column volumes of distilled water was
used to wash the HisTrap column and then followed with minimum five column volumes of
stripping buffer containing 10 mM sodium phosphate pH 7, 50 mM EDTA and 500 mM NaCl
was used to wash and remove all the NiSO4 buffer that used from the HisTrap column. After
that minimum five column volumes of 10 mM fresh NiSO4 buffer was used to charge the
column again and then 20% ethanol for storage. SDS PAGE gel (2.2.1) was used for test each
peak separately and any fractions containing the desired protein (depending on the molecular
weight) were taken and stored at 4°C. The most pure fractions (about 2 ml) were added together
and concentrated by a spin column till ~1 ml and then dialysed into ligase storage buffer or
column binding buffer.
2.2.22. Mass Spectrometry of LigA and LigB.
Material
63
1- Pure LigA and LigB (both from first strategy).
2- Instant Blue (Expendeon).
3- Nuclease free water.
Method
Despite knowing molecular weight and amino acid sequences of LigA and LigB proteins, the
determination of molecular mass is needed. The LigA from purification strategy1 and LigB
from purification strategy2 were used for mass spectrometry to check they were correct
proteins with the right molecular weight. A sample (different amount of µg for native LigA
and LigB) of each ligase was run on a SDS gel and stained in a clean plastic dish with Instant
Blue (Expendeon) for six hours or overnight. Gloves were worn at all stages to prevent
contamination from human skin proteins. A slice of the SDS gel with each ligase was cut out
by autoclaved razor blade and added to an autoclaved tubes. The gels sliced were covered with
about ~500 µl of nuclease free water. Each sample was sent to Mass Spectrometry
Facility/Leeds University, to check the amino acids sequence and molecular mass. After two
weeks, the results were sent back by spreadsheet and checked for accuracy.
2.3. Kinetic Characterisation Study:
2.3.1. Establishing a Functional DNA Ligase Assay.
In vitro assays of ligation activity were performed using a double stranded DNA substrate with
a single nick. The oligonucleotides used in this study were designed and purchased from
Invitrogen (ThermoFisher Scientific) in powdered form, with the %GC set to 50%. These
oligonucleotides included one �bottom strand� DNA of length 50 bases (5�-
CATTACGTATACCAGGTGTCCTGTGAGCAGCGAAGGCCCATACGCGAGAT-3�) and
two �top stranded� DNA of length 20 bases (5�-ATCTCGCGTATGGGCCTTCG-3�) and 30
bases (5�-CTGCTCACAGGACACCTGGTATACGTAATG-3�), both of which were
complementary to the 50 base bottom strand. The 20 bases long oligonucleotide had a
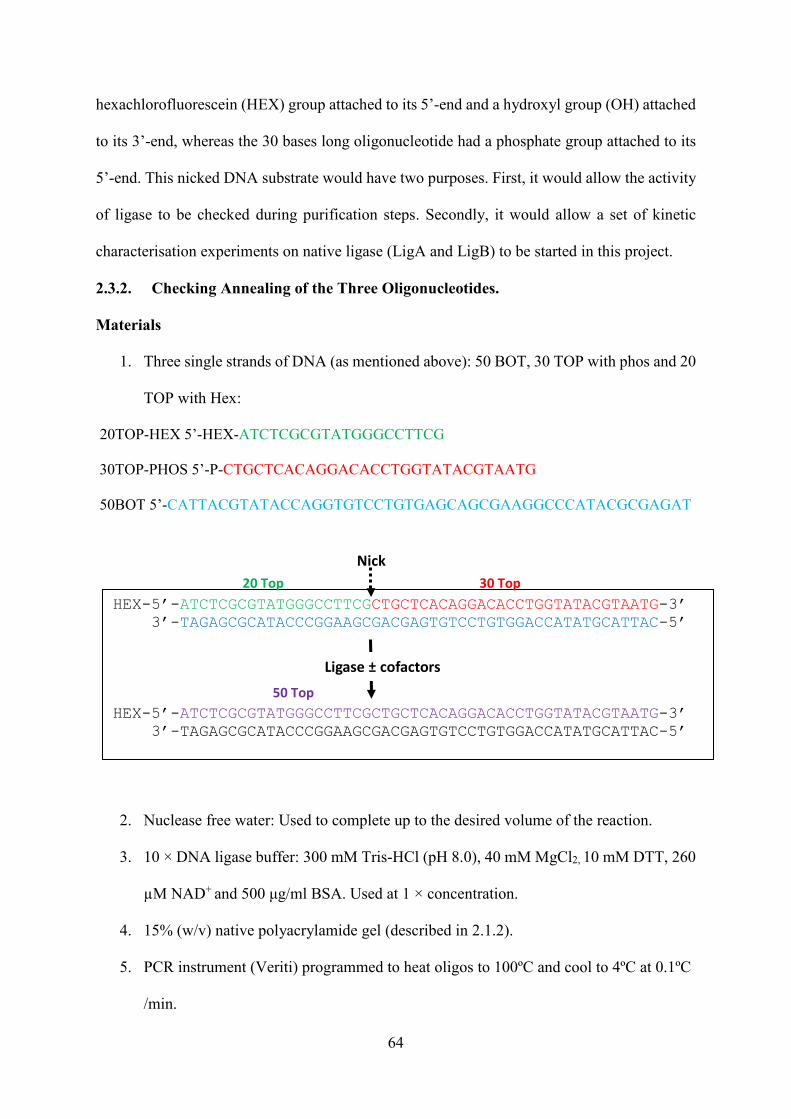
64
hexachlorofluorescein (HEX) group attached to its 5�-end and a hydroxyl group (OH) attached
to its 3�-end, whereas the 30 bases long oligonucleotide had a phosphate group attached to its
5�-end. This nicked DNA substrate would have two purposes. First, it would allow the activity
of ligase to be checked during purification steps. Secondly, it would allow a set of kinetic
characterisation experiments on native ligase (LigA and LigB) to be started in this project.
2.3.2. Checking Annealing of the Three Oligonucleotides.
Materials
1. Three single strands of DNA (as mentioned above): 50 BOT, 30 TOP with phos and 20
TOP with Hex:
20TOP-HEX 5�-HEX-ATCTCGCGTATGGGCCTTCG
30TOP-PHOS 5�-P-CTGCTCACAGGACACCTGGTATACGTAATG
50BOT 5�-CATTACGTATACCAGGTGTCCTGTGAGCAGCGAAGGCCCATACGCGAGAT
2. Nuclease free water: Used to complete up to the desired volume of the reaction.
3. 10 × DNA ligase buffer: 300 mM Tris-HCl (pH 8.0), 40 mM MgCl2, 10 mM DTT, 260
µM NAD+ and 500 μg/ml BSA. Used at 1 × concentration.
4. 15% (w/v) native polyacrylamide gel (described in 2.1.2).
5. PCR instrument (Veriti) programmed to heat oligos to 100ºC and cool to 4ºC at 0.1ºC
/min.
HEX-5�-ATCTCGCGTATGGGCCTTCGCTGCTCACAGGACACCTGGTATACGTAATG-3� 3�-TAGAGCGCATACCCGGAAGCGACGAGTGTCCTGTGGACCATATGCATTAC-5�
HEX-5�-ATCTCGCGTATGGGCCTTCGCTGCTCACAGGACACCTGGTATACGTAATG-3� 3�-TAGAGCGCATACCCGGAAGCGACGAGTGTCCTGTGGACCATATGCATTAC-5�
Nick20 Top
50 Top
Ligase ± cofactors
30 Top
65
Method
To form the oligoduplex, different ratios of the two top strands (20 and 30 Top) and 50 Bot
were tried. They were suspended in nuclease-free water at the following ratios:
20:30:50 1:1:1 10:10:10 µM
20:30:50 1.5:1.5:1 15:15:10 µM
20:30:50 2:2:1 20:20:10 µM
These three reactions were set up in 1× ligation buffer and were annealed by slow cooling
overnight in a PCR machine. Samples of each were checked on a 15% (w/v) native
polyacrylamide gel (described above in 2.1.2).
2.3.3. Determining the Precise Concentration of Commercial (NEB) LigA.
Materials
1. Commercial LigA, 0.5 U/µl (NEB).
2. A quantitative protein marker, (Affymetrix, USB Products, USA).
3. 10% (w/v) SDS PAGE gel.
4. Gel stain (SimplyBlueTM SafeStain) (Fisher Scientific).
Method
NEB LigA concentration was unknown (units only). Therefore the concentration of NEB LigA
was determined by running an SDS-PAGE gel with three concentrations of the enzyme as
follows: 1 μl, 2 μl and 4 μl NEB LigA. Also, 5 μL of a quantitative protein marker was loaded.
Each band of this marker had 0.5 μg protein. By comparing between them, it was shown that
the concentration of 1 μl NEB LigA was equivalent to 0.5 µg. With a molecular weight of 73
kDa, the NEB LigA concentration was ~ 6 µM. This was used as a positive control enzyme to
test and check the sealing of nick in the DNA substrate.
2.3.4. Testing the 5� and 3� Groups required at a nick.
Materials
66
Five single strands of DNA: 20TOP-HEX, 30TOP-PHOS, 30TOP, 50BOT and 50BOT-HEX:
20TOP-HEX 5�-HEX-ATCTCGCGTATGGGCCTTCG
30TOP-PHOS 5�-P-CTGCTCACAGGACACCTGGTATACGTAATG
30TOP 5�-P-CTGCTCACAGGACACCTGGTATACGTAATG
50BOT 5�-CATTACGTATACCAGGTGTCCTGTGAGCAGCGAAGGCCCATACGCGAGAT
50BOT-Hex 5�-CATTACGTATACCAGGTGTCCTGTGAGCAGCGAAGGCCCATACGCGAGAT
1. Phosphorylated 30TOP oligonucleotide (500 nM), from a 50 µl reaction with 20 U
polynucleotide kinase (PNK) (NEB) and purified by micro spin column.
2. Commercial LigA, 0.5 U/µl (NEB) stock at 6 µM (Section 2.3.3).
3. 10 × DNA ligase buffer: 300 mM Tris-HCl (pH 8.0), 40 mM MgCl2, 10 mM DTT, 260
µM NAD+ and 500 μg/ml BSA. Used at 1 × concentration.
4. Nuclease free water: Used to complete up to the desired volume of the reaction.
5. 15% (w/v) denaturing PAGE gel (see Section 2.1.3).
Method
The 5� and 3� side of the nick in the 50 bp oligoduplex was tested to see how different groups
affected the ligation. The six oligonucleotides from items 1 and 2 above were annealed in
different combinations to give five different nicked DNA substrates, called A, B C, D and E.
These were annealed at 1:1:1 ratios about 100 nM concentration. These are shown on the next
page in Figure 2.3. The dotted purple circles show the groups present at the nick. Substrate A
had two OH groups at the nick and would not be expected to ligate. Substrate B had a
5�phosphate and 3�OH group and would be expected to ligate. Substrates C and D were the
same as Substrates A and B, except that they had a HEX group at the 5� end of the 50BOT
strand. Substrate E used a 30TOP strand with a 5� OH group, which was then phosphorylated
using 20 U of Polynucleotide Kinase (PNK) enzyme.
A short ligation timecourse reaction (as described in Section 2.3.5 below) was performed using
~1 µM of commercial LigA (NEB) on these five substrates.
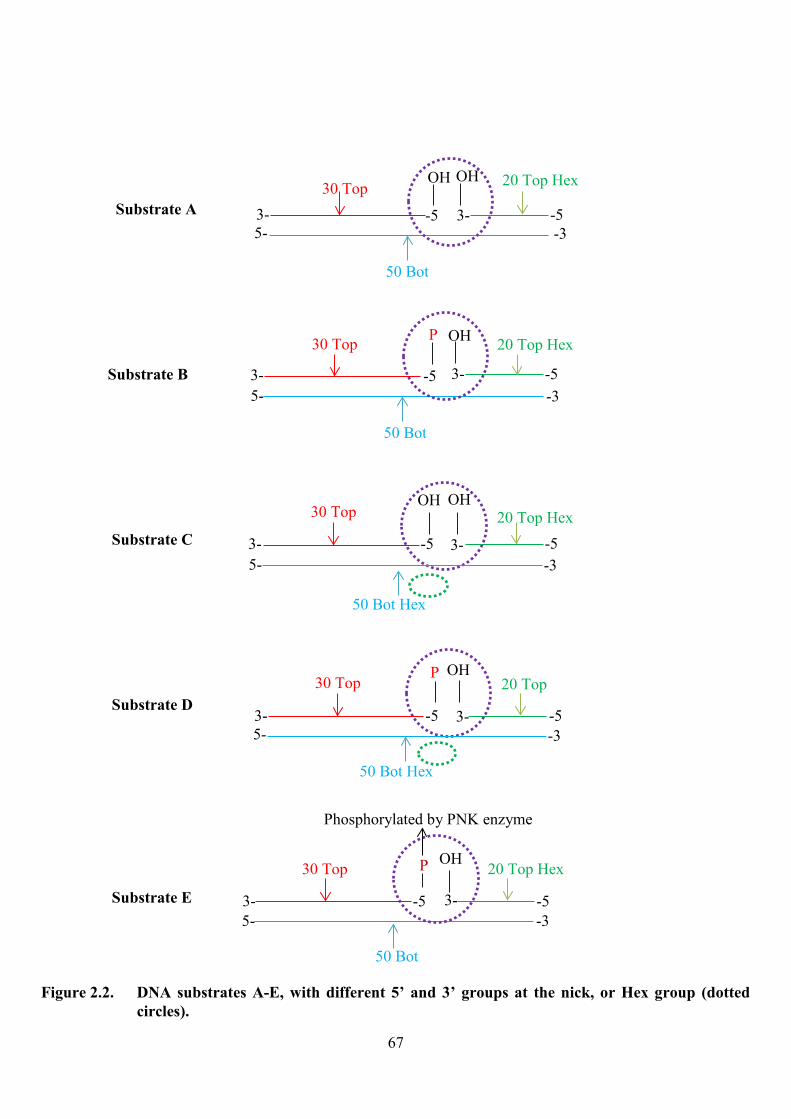
67
Substrate A
Substrate B
Substrate C
Substrate D
Substrate E
P OH 20 Top Hex30 Top
Phosphorylated by PNK enzyme
OH OH 20 Top Hex30 Top
50 Bot
P30 Top 20 Top Hex
OH OH
3-
P
-5 3- -5
OH
50 Bot Hex
30 Top
5- -3
20 Top
3- -5 3- -55- -3
3- -5 3- -55- -3
30 Top 20 Top Hex
3- -5 3- -5
OH
5- -3
50 Bot Hex
50 Bot
3-
50 Bot
-5 3- -55- -3
Figure 2.2. DNA substrates A-E, with different 5� and 3� groups at the nick, or Hex group (dotted circles).
68
2.3.5. Timecourse kinetics of Native LigA and LigB.
Materials
1. Purified native LigA (70, 35 or 20 µM stocks) or LigB (4 or 2 µM stocks).
2. Commercial LigA, 0.5 U/µl (NEB) stock at 6 Um (Section 2.3.3).
3. 1 µM of oligoduplex substrate (from 10 µM stock). Usually DNA Substrate B (Figure
2.1) prepared as in Section 2.3.2.
4. 10 × DNA ligase buffer: 300 mM Tris-HCl (pH 8.0), 40 mM MgCl2, 10 mM DTT, 260
µM NAD+ and 500 μg/ml BSA. Used at 1 × concentration.
5. Nuclease-free water: Used to complete up to the desired volume of the reaction.
6. PCR machine to control timecourse temperature.
7. Ligase Stop buffer: formamide (80% (w/v)), EDTA (10 mM, pH 8.0), and NaOH (2
mM), bromophenolblue (0.04% (w/v).
8. Denaturing PAGE gel equipment, SequiGen (Bio-Rad), 50 cm length, 0.3 mm thick.
9. 15% (w/v) denaturing PAGE gel.
10. 3MM chromatography paper.
Method
Timecourse experiments on the 50 bp oligoduplex sequence were used throughout this thesis.
The DNA substrate used most regularly was Substrate B (see Figure 2.1), with a HEX group
on the 20TOP strand only. Annealing of oligonucleotides to make this oligoduplex was carried
out as in Section 2.3.2 above. A typical timecourse reaction (50 µl) was started and contained
the components in the following order:
1- Nuclease-free water.
2- 1× DNA ligase buffer (from 10× stock).
3- 100 nM of oligoduplex substrate (from 1 µM stock).
4- 30-40 nM of purified ligase (native LigA or LigB).
69
The reaction was incubated at 16ºC in a PCR machine, with 5 µl of aliquots being removed at
various time points. In a typical reaction time-points at 30 seconds, 1 min., 3 min., 5 min., 10
min., 30 min., and 180 min were taken. Time-points were stopped using 6 µl of Ligase Stop
buffer. Samples were heated at 100ºC for 2 min and then loaded on to a denaturing gel. The
gel was run as in Section 2.1.3.
2.3.6. Additional Cofactors and Conditions.
As described in future sections, different components were also added to the typical time-
course reactions described above in Section 2.3.5. These were as follows:
- DNA 5-100 nM FROM 1 µM stock.
- NAD+ 0-25 µM FROM 100 µM stock.
- Temperature 5-35ºC.
- NMN 25-400 µM FROM 1mM stock.
- Ammonium sulphate (NH4SO4) FROM 50-10,000 µM FROM 1M stock.
2.3.7. Quantitation of Timecourse gels.
The bands on the denaturing gels were quantified using the program ImageJ (imagej.nih.gov).
The density values of the peaks from ImageJ were used to calculate the percentage of LigA
and LigB activities in terms of reduction of 20TOP-HEX intensity and increase in 50TOP-
HEX intensity at every single time point. Initial rates of reaction (V0) were determined by
obtaining the gradient of a line of best fit for the first 20% of the formation of the 50TOP-HEX
product for each reaction in Microsoft Excel. The Vmax and Km values were elucidated by
plotting their V0 values for each timecourse and fitting to the Michaelis- Menten equation:
Equation 2.1: V = Vmax + [S]/ Km + [S]
The definition of Vmax is the maximum theoretical rate of reaction. It was obtained by plotting
the initial rate (V0) against the varying concentration of the substrate being investigated. Since
V0 was measured in nM/min, the Vmax values were also in nM/min.
70
The definition of Km is the concentration of substrate that gives half maximum rate. It was
obtained from the Michaelis- Menten equation fit.
The definition of kcat is the number of substrate molecules (nicked-DNA molecules in this
thesis) converted to product per minute. The kcat which is also known as the turnover number.
It was calculated by dividing the Vmax (nM/min) by the enzyme concentration (30 nM for all
the experiments).
The software used for all curve-fitting was Grafit version 5.0.11 (Erithicus Software).
2.4. Electrophoretic Mobility Shift Assays (EMSAs) on LigA and LigB.
Materials
1- 1 µM of annealed oligoduplex (Section 2.3.4). This contained three single strands of
DNA (oligos): 50BOT, 30TOP with phos and 20TOP with Hex, used at 50 nM
concentration.
2- 5× Binding buffer I: 50 mM Tris-HCl (pH 7.5), 0.5 mM EDTA, 100 mM NaCl, kept at
room temperature, used at 1× concentration.
3- NAD+ at 1 mM. Used at 50 uM final concentration.
4- 3× Loading buffer I: 3× Binding buffer I, 40%(w/v) sucrose, 0.01% (w/v) of
bromophenol blue and kept at room temoerature, used at 0.6 × concentration.
5- Gel solution (native PAGE gel): 40% (w/v) Polyacrylamide (Acrylamide:Bis-
Acrylamide (29:1)). Used at 6% (w/v) prepared as in Section 2.1.2.
6- 10× TBE. Used at 0.5× TBE for preparing the gel and running buffer.
Method
The experiments of bandshift were carried out using non-denaturing gel electrophoresis on
purified wildtype LigA and LigB bound to nicked DNA. Bandshift buffers was tested, this
contained 0.1 mM EDTA (Binding buffer I) with 10 mM Tris- HCl (pH 7.5) and 20 mM NaCl.
Each microfuge reaction tube had a total of 25 µl, with 50 nM nicked-DNA substrate, 1×
71
Binding buffer I, and 50 µM NAD+ and a specific concentration of native LigA or LigB. The
concentration range (in nM) of LigA used was 0, 7, 15, 32, 64, 125, 250, 500, 1000 and 2000
nM. For LigB, the range used was 0.0, 31.0, 62.0, 125.0, 250.0, 500.0, 1000.0, 2000.0, 4000.0
and 6000.0 nM. The DNA-ligase complex was incubated for 1 hour at 4ºC. A 5 µl aliquot of
3× Loading buffer I was added to each complex according to each experiment. Bandshifts
samples were loaded on a pre-equilibrated 6% native polyacralamide gel in 0.5X TBE buffer
and the running buffer as well was 0.5× TBE. The gel was run for 3 hours at 70 V at room
temperature. Native gels were visualised using a Fujifilm FLA5000 phosphorimager, using
fluorescently HEX-labelled oligonucleotides. ImageGauge software was used to quantify
reactions of the free nicked DNA and the ligase-bound nicked-DNA. The Kd was estimated by
fitting the concentration (in nM) of ligase-bound DNA using the �Bound versus Total� model
contained within the GraFit software:
Equation 2.1: B = (Bmax × [ligase]) / (Kd + [ligase])
The Kd where bound is the percentage of counts from the gel; [ligase] is the free concentration
LigA or LigB; Bmax is the percentage at which the reaction between the nicked DNA and the
ligases reached saturation; and Kd is the dissociation constant measured in nM in these
experiments which corresponds to the concentration of LigA and LigB with nicked DNA that
gives half maximal binding. The software used for all curve-fitting was Grafit version 5.0.11
(Erithicus Software).
2.5. Analytical Ultracentrifugation (AUC)
Materials
1- AUC buffer: 30 mM Tris-HCl (pH 8.0), 4 mM MgCl2, 1 mM DTT, 26 µM NAD+, 3%
(v/v) glycerol.
2- AUC buffer + LigA: 30 mM Tris-HCl (pH 8.0), 4 mM MgCl2, 1 mM DTT, 26 µM
NAD+, 3% (v/v) glycerol and 2 µM native LigA.
72
3- AUC Instrument: Beckman Optima XL-A analytical ultracentrifuge (Beckman-
Coulter).
4- AUC Software: Sedfit version 15.01b and Sednterp.
Method
Analytical ultracentrifugation (AUC) is a powerful technique of characterizing molecules in
solution. A Beckman Optima XL-A analytical ultracentrifuge (Beckman-Coulter, Palo Alto,
CA) was used for sedimentation equilibrium experiment. AUC experiments of purified native
LigA were carried out at 15°C, and data were analysed using Sedfit version 15.01b (Schuck,
2000). The partial specific volume (c) of LigA protein was estimated using Sednterp as 0.743
mL/g (Laue et al., 1992). All stoichiometries are indicated to assuming that LigA is monomeric.
Two-sections of AUC cell were used for each sample. Each cell contained 400 μL of AUC
buffer and 425 μL of AUC buffer + LigA in the appropriate sectors of each cell. Each assembly
contained a centrepiece with a 12 mm optical path length.
Each cell was assembled by individual components by order as follow (Figure 2.4): a
window gasket, window liner, and quartz window were put in order into each of the window
holders after cleaned them very well with absolute alcohol and sterile water. One of the cells
was placed into the cell housing followed by the 12 mm Epon charcoal-filled centrepiece
guided by its keyway. The second window holder was placed up the centrepiece followed by
the greased screw ring washer and the greased screw ring and tightened to 700 kPa. A sample
of 400 μL AUC Buffer was injected into the left filling hole and a 425 μL sample of AUC
Buffer + LigA was injected into the right filling hole. The difference between the sample and
reference volumes allowed for discrimination between the two menisci.
To finish, the plug gaskets and housing plugs were screwed into the cell housings. Cells
were loaded into an An-50 Ti analytical rotor which was left in the centrifuge overnight to
equilibrate to 15°C. Experiments were performed at 40,000 rpm, and radial scans were
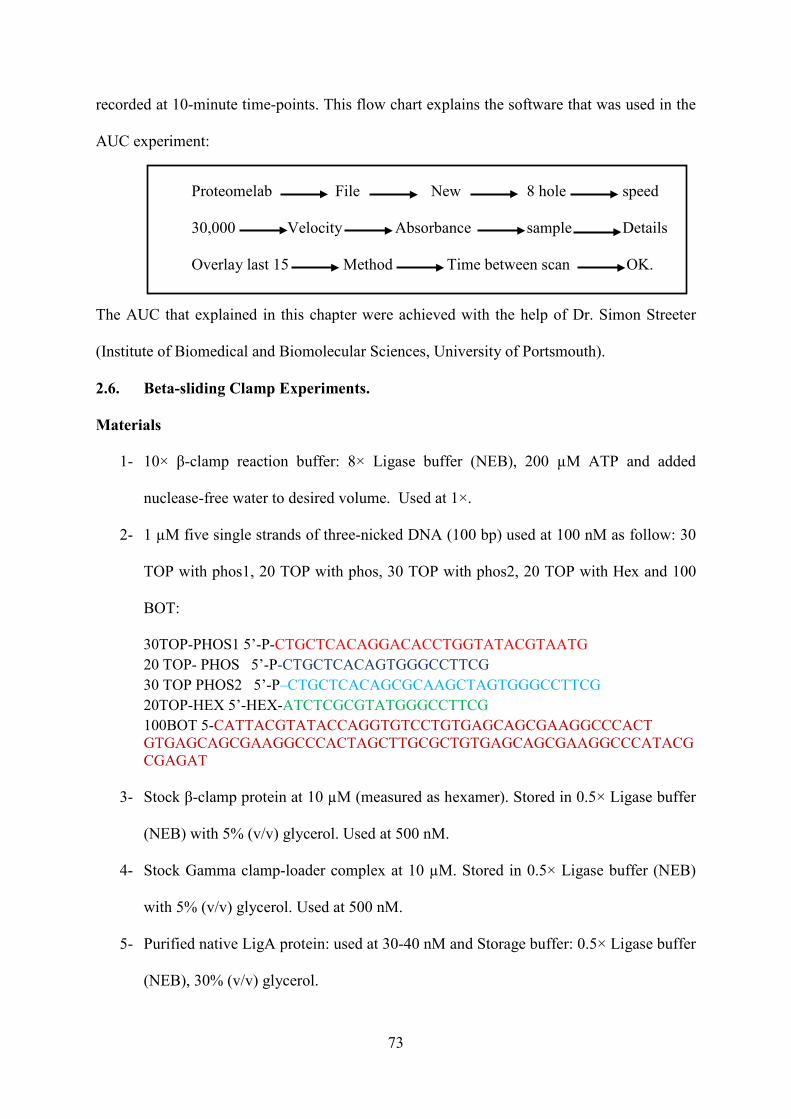
73
recorded at 10-minute time-points. This flow chart explains the software that was used in the
AUC experiment:
Proteomelab File New 8 hole speed
30,000 Velocity Absorbance sample Details
Overlay last 15 Method Time between scan OK.
The AUC that explained in this chapter were achieved with the help of Dr. Simon Streeter
(Institute of Biomedical and Biomolecular Sciences, University of Portsmouth).
2.6. Beta-sliding Clamp Experiments.
Materials
1- 10× β-clamp reaction buffer: 8× Ligase buffer (NEB), 200 µM ATP and added
nuclease-free water to desired volume. Used at 1×.
2- 1 µM five single strands of three-nicked DNA (100 bp) used at 100 nM as follow: 30
TOP with phos1, 20 TOP with phos, 30 TOP with phos2, 20 TOP with Hex and 100
BOT:
30TOP-PHOS1 5�-P-CTGCTCACAGGACACCTGGTATACGTAATG 20 TOP- PHOS 5�-P-CTGCTCACAGTGGGCCTTCG 30 TOP PHOS2 5�-P�CTGCTCACAGCGCAAGCTAGTGGGCCTTCG 20TOP-HEX 5�-HEX-ATCTCGCGTATGGGCCTTCG100BOT 5-CATTACGTATACCAGGTGTCCTGTGAGCAGCGAAGGCCCACT GTGAGCAGCGAAGGCCCACTAGCTTGCGCTGTGAGCAGCGAAGGCCCATACGCGAGAT
3- Stock β-clamp protein at 10 µM (measured as hexamer). Stored in 0.5× Ligase buffer
(NEB) with 5% (v/v) glycerol. Used at 500 nM.
4- Stock Gamma clamp-loader complex at 10 µM. Stored in 0.5× Ligase buffer (NEB)
with 5% (v/v) glycerol. Used at 500 nM.
5- Purified native LigA protein: used at 30-40 nM and Storage buffer: 0.5× Ligase buffer
(NEB), 30% (v/v) glycerol.
74
Screw Ring
Washer
Window Holder
Window Gasket
Window Liner
Window
Centrepiece
Filling Holes Keyway
Window
Window Liner
Window Gasket
Window Holder
Cell Housing
Housing Plug
Plug Gasket
Constructed cell
Figure 2.3. Installation of the AUC cell. The single components of the AUC cells that set by order as described above, which was adapted from flow-through centrepiece assembly manual, (Beckman Coulter, 2003).
75
Methods
Purified β-sliding clamp protein and Gamma clamp-loader complex (γ complex) were very
kindly supplied from Prof. Mike O'Donnell (HHMI, Rockefeller University, NY). They
arrived in ice-box as one aliquot of ~100 µl in 1× clamp-loader storage buffer. The Mr of β-
sliding clamp as a dimer was 81,200 Da. The Mr of Gamma clamp-loader was 200,000 Da. In
these experiments, timecourse experiment was used by preparing two tubes in the ice, the first
tube was without β-clamp proteins (control tube), but included native LigA. Whereas the
second tube contains β-clamp and native LigA proteins. 50 µl of the second tube was prepared
by adding 100 nM of double strand of three nicked-DNA (100 bp), 1× Beta-clamp buffer
reaction, 500 nM of each Beta and Gamma proteins and 30-40 nM of purified LigA (first
strategy of LigA purification). The complex mixture was completed with free water till the
desired volume. The mixture of complex compounds were mixed very well plenty of time
before doing timecourse at 15ºC .Timepoints were taken at 0.5, 1, 3, 5, 10, 30 and 60 minutes.
A table with the components use in these experiments is shown below in Table 2.1.
Table 2.1
Component Expt 1 Expt 2Free water - - Clamp-buffer 1× 1× Three Nicked DNA 100 nM 100 nM Fix Beta 0 nM 500 nM Fix Gamma protein 0 nM 500 nM Ligase enzyme (LigA) 40 nM 30 nM
A 15% (w/v) denaturing gel (as described in Section 2.1.3) was used to determine if the β-
sliding clamp will increase the processivity of DNA ligases along double strand of nicked
DNA.
2.7. Molecular Operating Environment (MOE).
76
The method for using the in silico docking software, Molecular Operating Environment (MOE)
is described in full in Chapter 5. The University of Portsmouth subscribed to a full version of
MOE 7.0 (Chemical Computing Group).
2.8. In vitro Inhibition Assay of Native LigA Protein.
Materials
1. 1 µM of annealed oligoduplex (Section 2.3.4). This contained three single strands of
DNA (oligos): 50BOT, 30TOP with phos and 20TOP with Hex, used at 100 nM
concentration.
2. 10× DNA ligase buffer: 300 mM Tris-HCl (pH 8.0), 40 mM MgCl2, 10 mM DTT, 260
µM NAD+ and 500 μg/ml BSA. Used at 1× concentration.
3. Purified native LigA (20 µM stocks): Used at 30-40 nM final concentration.
4. 5× Denaturing gel loading buffer (stop buffer): Formamide (80% (w/v)), EDTA (10
mM, pH 8.0), and NaOH (2 mM), bromophenolblue (0.04% (w/v). Used at 1×
concentration.
5. Eight solid compounds were used (S i gm a A l d r i c h ) : Oxidised Glutathione, 5-
Azacytidine, Geneticin (G418), Chlorhexidine, Bestatin, 2-(Aminomethyl)
imidazole, Imidazolidinyl Urea and Imidazo [1,2-a]pyridine-7-carboxylic acid.
6. Nuclease-free water: Used to complete up to the desired volume of the reaction.
Method
Compounds were ordered in solid form depending on the numbers of S-value that we had from
MOE software (Chapter 5). T h e y w e r e suspended in nuclease-free water to a concentration
of 3 mM and stored at 4°C. They were tested at increasing concentrations (40 nM � 400
µM) to analyse their effect on LigA nick ligation of DNA. For each concentration a 5 0
µI reaction mixture (l00 nM DNA, 30-40 nM LigA, l× DNA Ligase buffer and the
required compound concentration) was made with nuclease-free water. The timepoints
77
were taken of each reaction mixture (timecourse) and added to a denaturing stop buffer to
quench the reaction. The samples were heated at l00°C for two minutes and then run on a
15% Urea denaturing Polyacrylamide gel at 50 watts for one hour.
The gel was analysed on a Fujifilm FLA-5000 phosphorimager, which identified the
fluorescent HEX tags on the 20 base DNA strand. The resulting image was analysed
using the computer programme ImageJ to determine the percentage of total DNA existing
as an incomplete 20 base strand compared to the DNA existing as a fully repaired double
stranded 50 base complex.
2.9. In vivo Kirby-Bauer Experiment.
Materials
1. Mueller-Hinton LB agar: 15 g agar, 10 g tryptone, 5 g yeast extract and 10 g sodium
chloride, completed with distilled water to the desired volume and autoclaved
sterilised instantly. Fisher Scientific.
2. LB Broth: 10 g tryptone, 5 g yeast extract and 10 g sodium chloride, completed up
with distilled water to the desired volume and autoclaved instantly. Fisher Scientific.
3. Wild type E. coli K12 (NEB) glycerol stock.
4. Ampicillin as positive control: 2.5 mg/ml stock solution. Filter sterilised
immediately. Sigma.
5. Nuclease-free water as negative control.
6. Antimicrobial susceptibility test discs. Fisher Scientific.
7. Four solid compounds were used: 5-Azacytidinc, Geneticin (G418), Chlorhexidine
and Imidazolidinyl Urea. Sigma Aldrich.
Method The in vivo Kirby-Bauer technique is one of the most useful tools to determine the effectiveness
of which compounds on the growth of the bacteria. Autoclave Hinton agar was used to prepare
Kirby�Bauer plate which were plated using a wild type E.coli K12 (NEB) and incubated at
78
37°C for overnight. A small colony was suspended in l ml of LB broth in a plastic cuvette till
the OD600 of the broth was between 0.08-0.13, which is the measure of the absorbance using a
spectrophotometer at 625 nm (Hudzicki, 2016). This concentration was streaked across fresh
Mueller-Hinton plates using a sterile swab, covering the plates four times. Six sterile disks
were placed on the plate using tweezers, they were soaked in either a control or a compound.
A disk soaked in H20 reaction buffer was used as a negative control and 2.5 mg/ml Ampicillin
as a positive control, and different concentrations of compounds were used at varying
concentrations of the compound tested. These plates were left to incubate for 2 4 hours at
37ºC and were analysed. The diameter values of zone inhibition of each disk was measured in
ImageJ software and curve of IC50 inhibition was used in vivo experiments. The diameter data
were fit to a modified Michaelis-Menten equation using Grafit software. The Vmax and Km were
modified to Imax (Maximum Inhibition) and IC50 (like Km).
79
Chapter 3: Cloning, Expression and Purification of Native LigA and LigB
In this chapter the first step towards the goal of studying the kinetics and binding
characterisation of native LigA and LigB was taken. This involved cloning the genes of LigA
and LigB that were carried out in this study by using different plasmids and a cloning kit. The
focus of the work presented in this chapter was to purity native LigA and LigB proteins by
using different columns, conditions and buffers, and comparing their solubility, activity and
properties under a range of experimental conditions. Also, Section 3.5.2 contains analytical
ultracentrifugation (AUC) results, a powerful technique for the hydrodynamic analysis of
macromolecules in solution (proteins).
3.1. Introduction.
E.coli DNA ligase (LigA) was first discovered in 1967 by the Lehman group and other
laboratories (Olivera and Lehman, 1967, Gellert, 1967a). DNA ligases in E.coli has two
proteins called LigA and LigB in different DNA and different protein sequence (Sriskanda &
Shuman, 2001).
The main objective of the chapter was to clone, express and purify native LigA and
LigB, which are two of the key repair enzymes in E.coli. The challenge was to determine how
best to induce and purify the two native enzymes, using a combination of chromatography
techniques. A key part of this was the decision not to use a His-tagged version of each protein
(as previous literature reports have), since this positively-charged group can interfere with
DNA binding properties (Chant et al. 2005). The kinetics and binding properties measured
(described in Chapter 4) of these enzymes have been measured on DNA nicks under these
native (no-tag) expression conditions.
This chapter is organised in to three main sections. Section 3.2 (cloning) includes the
two strategies for cloning these genes were used to clone LigA and LigB: a PCR primer
80
approach and synthetic gene and also ligate, transform and sequences. In Section 3.3
(expression), which required the IPTG at different concentrations, contains two steps for LigA
protein: small and large scale induction. The expression for LigB (which was completely
insoluble) includes four stages: small scale induction, solubility, refolding and large scale
induction at different conditions and buffers. In section 3.4 (purification) that includes different
strategies for LigA by using few columns: heparin column, Diethylaminoethyl column, HiTrap
column and size exclusion column, but the purification for LigB used only three columns:
HiTrap Q-Sepharose (HP), heparin and nickel column.
3.2. Cloning.
3.2.1. Cloning of LigA and LigB genes by PCR from E.coli genomic DNA.
The LigA and LigB coding sequence were cloned into pET-29c vector by using Phusion
enzyme as described in section 2.2.2, using PCR primers that were designed according to the
NCBI database. An N-terminal or C-terminal His-tag was not included in these gene cloning
experiments. The concentration of each primer pair was 500 nM. Standard PCR reactions of 25
cycles of 99°C denaturing stage for 30 seconds, a 65°C annealing stage for 30 seconds, and a 72°C
elongating step for 90 seconds were carried out on E.coli K12 using 0.5 μl. A control PCR reaction
was included. Experiments were monitored by 2% agarose gel as shown in Figure 3.1A. This
gel showed that all three PCR reactions worked, producing the expected PCR sizes (shown to
the right of the gel): LigA was 2016 bp, LigB 1683 bp and control PCR 1450 bp However,
repeated ligation attempts of the LigA and LigB PCR products into pET29c did not give a
recombinant vector.
81
3.2.2. Cloning of LigA and LigB Genes by Gene Synthesis.
Subsequently, the complete coding sequence of LigA, LigB and LigB His-tag genes of E.coli
DNA ligases were synthesised (GeneArt, Life Technologies. Fisher Scientific). Two vectors
were used for cloning: pET-29c and pET-28b.
In the first round of cloning, the native LigA and LigB genes were synthesised with a
single NdeI site at either end of the gene (this gave non-directional insertion) for cloning into
pET-29c. Each gene was digested with NdeI restriction enzyme. A sample (100 ng) of the
undigested and digested LigA and LigB genes were run on a 1% agarose gel and are shown in
Figure 3.1B. The gel showed that the full-length synthesised LigA and LigB genes (lanes 1
and 3) ran at expected size (2045 and 1712 bp). Lanes 2 and 4 showed the digested genes which
were 32 bp shorter, ready for cloning. Lanes 5 and 6 showed empty pET29c vector uncut
(circular) and NdeI-cut (linear 5372 bp).
In the second round of cloning, the LigB His-tag gene was synthesised with an NdeI at
the 5� and BamHI site at either end (3�) to allow directional cloning into pET-28b. This was to
give a His-tag form of LigB gene to help with purification. There was an NdeI site and BamHI
site at each end, so that they cloned directly into the NdeI site and BamHI site of pET28b
(Figure not shown).
The restriction enzymes were removed by heating, and then the DNA precipitated by
ethanol precipitation (Section 2.2.7) and re-suspended in 10 mM Tris-HCL and pH 8.0. The
two vectors that used were also cut with the correct restriction enzymes and purified via ethanol
precipitation. The two cut vectors were then dephosphorylated by using Shrimp Alkaline
Phosphatase (SAP).
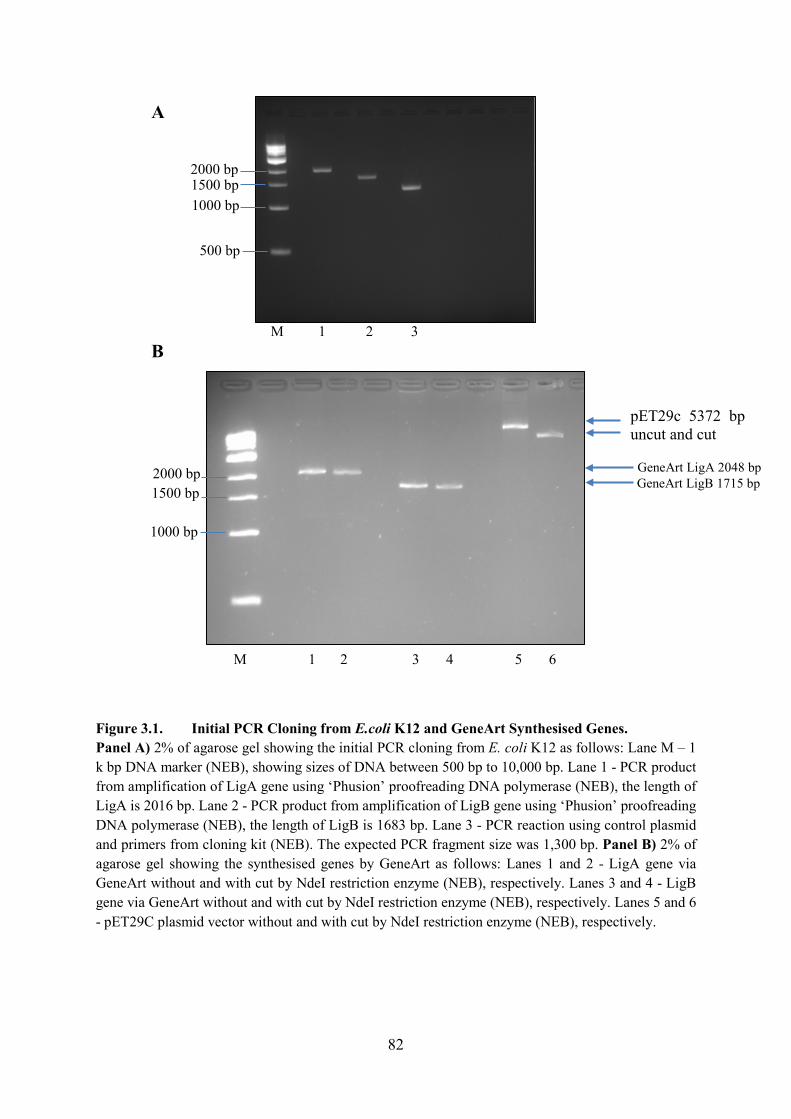
82
Figure 3.1. Initial PCR Cloning from E.coli K12 and GeneArt Synthesised Genes. Panel A) 2% of agarose gel showing the initial PCR cloning from E. coli K12 as follows: Lane M � 1 k bp DNA marker (NEB), showing sizes of DNA between 500 bp to 10,000 bp. Lane 1 - PCR product from amplification of LigA gene using �Phusion� proofreading DNA polymerase (NEB), the length of LigA is 2016 bp. Lane 2 - PCR product from amplification of LigB gene using �Phusion� proofreading DNA polymerase (NEB), the length of LigB is 1683 bp. Lane 3 - PCR reaction using control plasmid and primers from cloning kit (NEB). The expected PCR fragment size was 1,300 bp. Panel B) 2% of agarose gel showing the synthesised genes by GeneArt as follows: Lanes 1 and 2 - LigA gene via GeneArt without and with cut by NdeI restriction enzyme (NEB), respectively. Lanes 3 and 4 - LigB gene via GeneArt without and with cut by NdeI restriction enzyme (NEB), respectively. Lanes 5 and 6 - pET29C plasmid vector without and with cut by NdeI restriction enzyme (NEB), respectively.
1000 bp1500 bp2000 bp
500 bp
1500 bp
B
M 5 64321
M 321
A
2000 bp
1000 bp
pET29c 5372 bpuncut and cut
GeneArt LigB 1715 bpGeneArt LigA 2048 bp
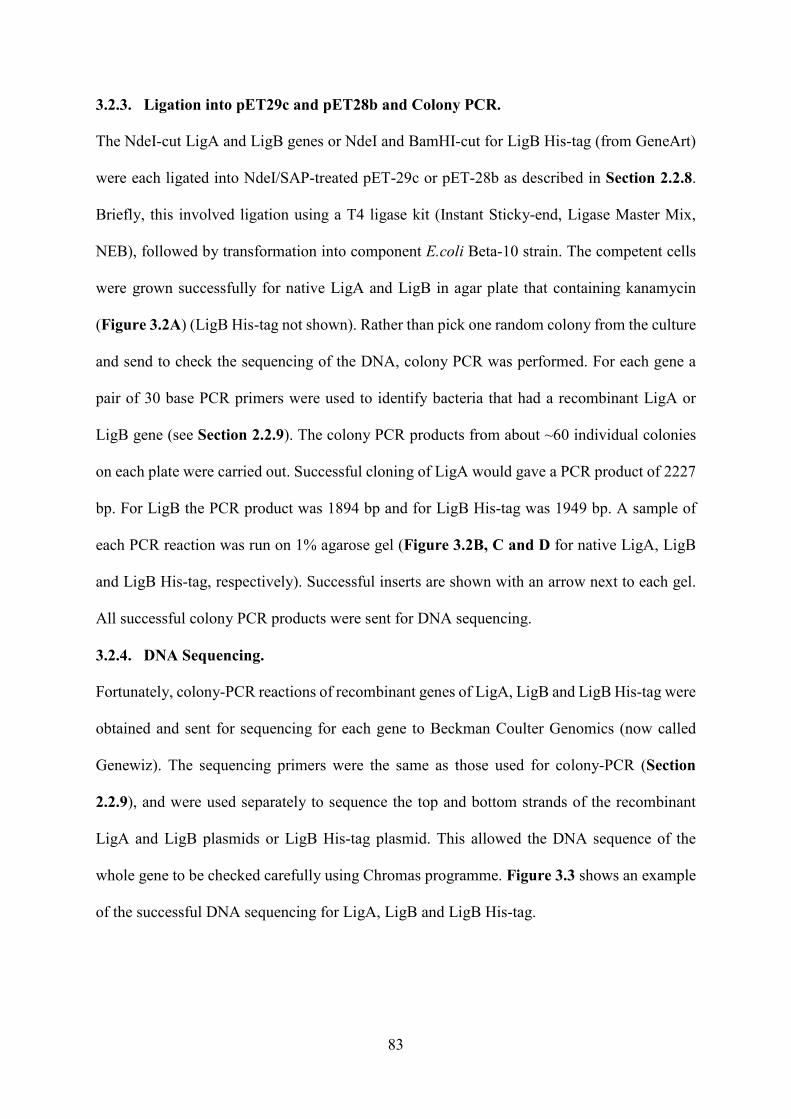
83
3.2.3. Ligation into pET29c and pET28b and Colony PCR.
The NdeI-cut LigA and LigB genes or NdeI and BamHI-cut for LigB His-tag (from GeneArt)
were each ligated into NdeI/SAP-treated pET-29c or pET-28b as described in Section 2.2.8.
Briefly, this involved ligation using a T4 ligase kit (Instant Sticky-end, Ligase Master Mix,
NEB), followed by transformation into component E.coli Beta-10 strain. The competent cells
were grown successfully for native LigA and LigB in agar plate that containing kanamycin
(Figure 3.2A) (LigB His-tag not shown). Rather than pick one random colony from the culture
and send to check the sequencing of the DNA, colony PCR was performed. For each gene a
pair of 30 base PCR primers were used to identify bacteria that had a recombinant LigA or
LigB gene (see Section 2.2.9). The colony PCR products from about ~60 individual colonies
on each plate were carried out. Successful cloning of LigA would gave a PCR product of 2227
bp. For LigB the PCR product was 1894 bp and for LigB His-tag was 1949 bp. A sample of
each PCR reaction was run on 1% agarose gel (Figure 3.2B, C and D for native LigA, LigB
and LigB His-tag, respectively). Successful inserts are shown with an arrow next to each gel.
All successful colony PCR products were sent for DNA sequencing.
3.2.4. DNA Sequencing.
Fortunately, colony-PCR reactions of recombinant genes of LigA, LigB and LigB His-tag were
obtained and sent for sequencing for each gene to Beckman Coulter Genomics (now called
Genewiz). The sequencing primers were the same as those used for colony-PCR (Section
2.2.9), and were used separately to sequence the top and bottom strands of the recombinant
LigA and LigB plasmids or LigB His-tag plasmid. This allowed the DNA sequence of the
whole gene to be checked carefully using Chromas programme. Figure 3.3 shows an example
of the successful DNA sequencing for LigA, LigB and LigB His-tag.
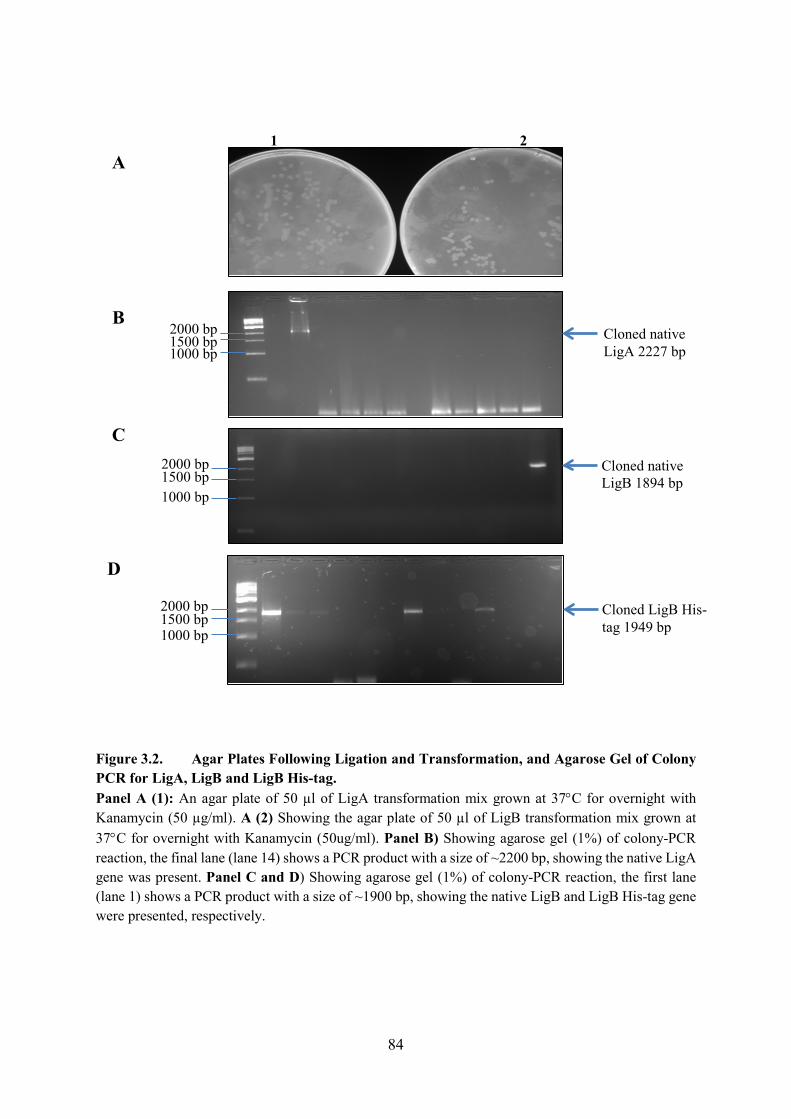
84
Figure 3.2. Agar Plates Following Ligation and Transformation, and Agarose Gel of Colony PCR for LigA, LigB and LigB His-tag. Panel A (1): An agar plate of 50 µl of LigA transformation mix grown at 37°C for overnight with Kanamycin (50 µg/ml). A (2) Showing the agar plate of 50 µl of LigB transformation mix grown at 37°C for overnight with Kanamycin (50ug/ml). Panel B) Showing agarose gel (1%) of colony-PCR reaction, the final lane (lane 14) shows a PCR product with a size of ~2200 bp, showing the native LigA gene was present. Panel C and D) Showing agarose gel (1%) of colony-PCR reaction, the first lane (lane 1) shows a PCR product with a size of ~1900 bp, showing the native LigB and LigB His-tag gene were presented, respectively.
B
Cloned native LigB 1894 bp
A
1000 bp 1500 bp 2000 bp
1
C
D
Cloned native LigA 2227 bp 1000 bp
1500 bp 2000 bp
2
B
Cloned LigB His-tag 1949 bp 1000 bp
1500 bp 2000 bp

85
3.3. Expression of LigA and LigB.
Methionine
B
Figure 3.3. The sequencing results of Native LigA, Native LigB and LigB His-tag Genes. Panel A) This figure shows example of the Top sequencing of cloned GenArt native LigA gene of E.coliDNA ligase. Panel B) shows the Top sequencing of cloned GenArt native LigB of E.coli DNA ligase. Panel C) shows the Bot sequencing of cloned GenArt LigB with His-tag gene, which conformed via Beckman coulter/Genewiz for all of them. The whole correct sequencing for all the genes are in Appedix 3. Blue arrows on the top of the figures explain the sequencing direction.
Methionine
Stop codon
A
C
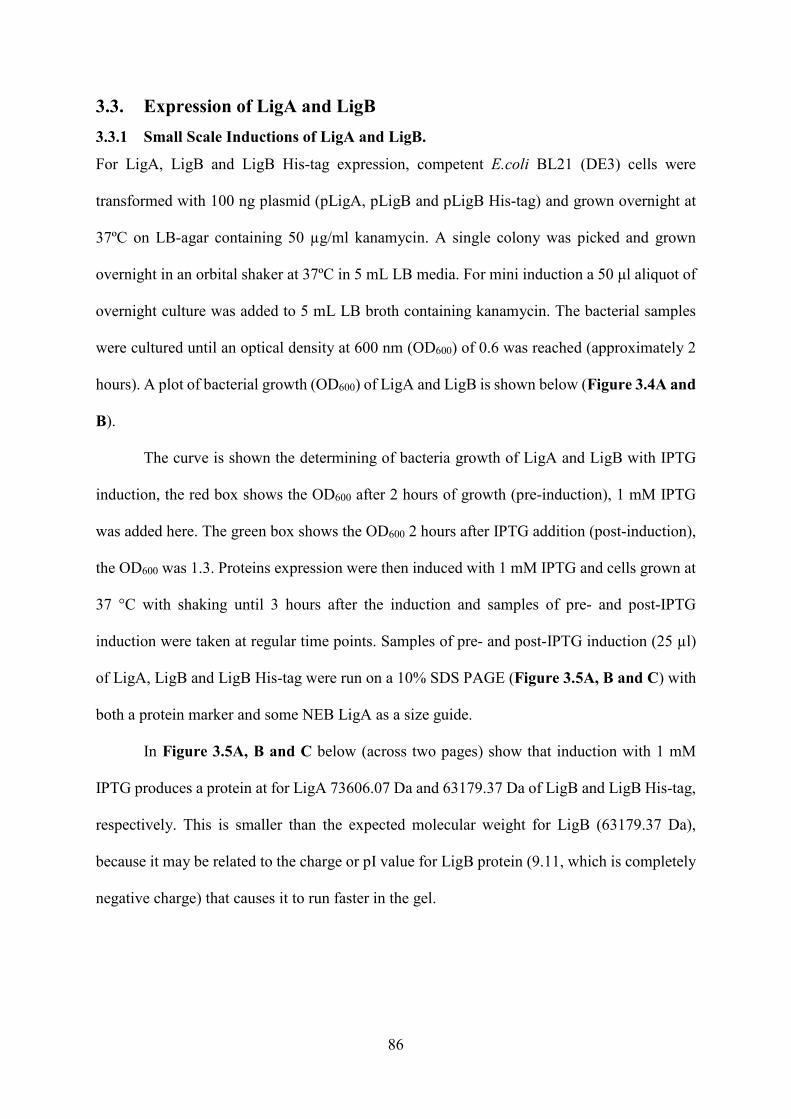
86
3.3. Expression of LigA and LigB 3.3.1 Small Scale Inductions of LigA and LigB.
For LigA, LigB and LigB His-tag expression, competent E.coli BL21 (DE3) cells were
transformed with 100 ng plasmid (pLigA, pLigB and pLigB His-tag) and grown overnight at
37ºC on LB-agar containing 50 µg/ml kanamycin. A single colony was picked and grown
overnight in an orbital shaker at 37ºC in 5 mL LB media. For mini induction a 50 μl aliquot of
overnight culture was added to 5 mL LB broth containing kanamycin. The bacterial samples
were cultured until an optical density at 600 nm (OD600) of 0.6 was reached (approximately 2
hours). A plot of bacterial growth (OD600) of LigA and LigB is shown below (Figure 3.4A and
B).
The curve is shown the determining of bacteria growth of LigA and LigB with IPTG
induction, the red box shows the OD600 after 2 hours of growth (pre-induction), 1 mM IPTG
was added here. The green box shows the OD600 2 hours after IPTG addition (post-induction),
the OD600 was 1.3. Proteins expression were then induced with 1 mM IPTG and cells grown at
37 °C with shaking until 3 hours after the induction and samples of pre- and post-IPTG
induction were taken at regular time points. Samples of pre- and post-IPTG induction (25 µl)
of LigA, LigB and LigB His-tag were run on a 10% SDS PAGE (Figure 3.5A, B and C) with
both a protein marker and some NEB LigA as a size guide.
In Figure 3.5A, B and C below (across two pages) show that induction with 1 mM
IPTG produces a protein at for LigA 73606.07 Da and 63179.37 Da of LigB and LigB His-tag,
respectively. This is smaller than the expected molecular weight for LigB (63179.37 Da),
because it may be related to the charge or pI value for LigB protein (9.11, which is completely
negative charge) that causes it to run faster in the gel.
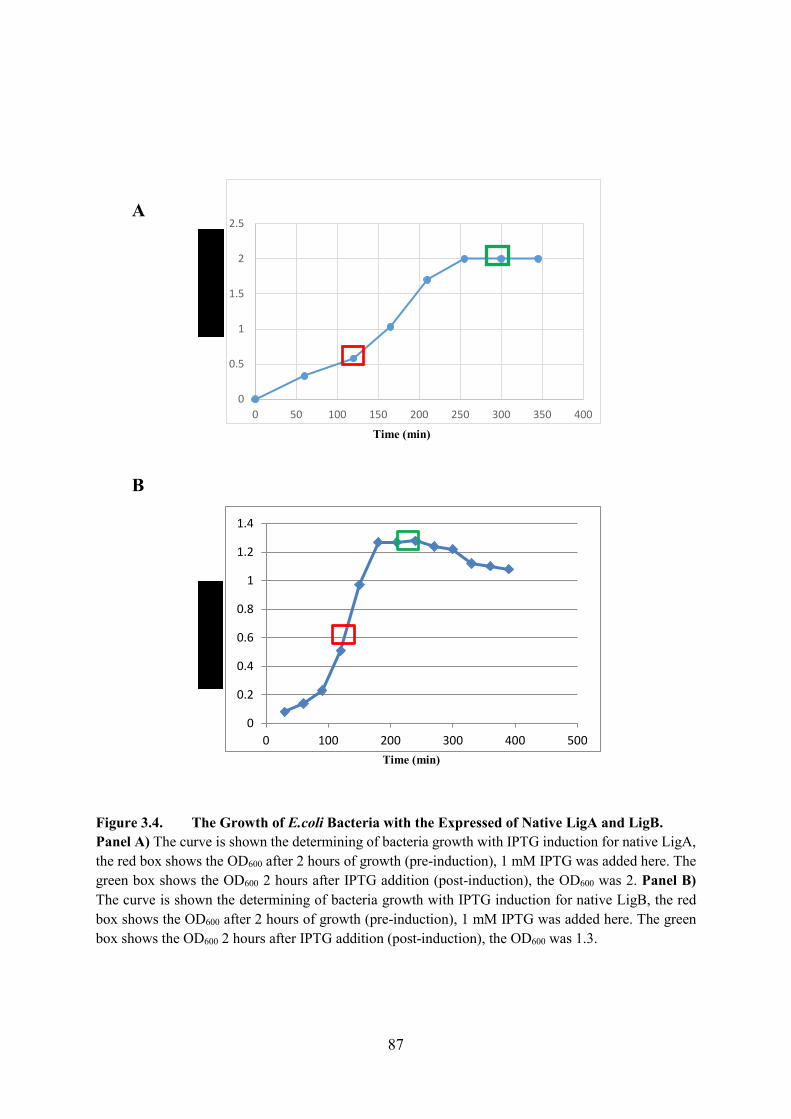
87
Figure 3.4. The Growth of E.coli Bacteria with the Expressed of Native LigA and LigB. Panel A) The curve is shown the determining of bacteria growth with IPTG induction for native LigA, the red box shows the OD600 after 2 hours of growth (pre-induction), 1 mM IPTG was added here. The green box shows the OD600 2 hours after IPTG addition (post-induction), the OD600 was 2. Panel B) The curve is shown the determining of bacteria growth with IPTG induction for native LigB, the red box shows the OD600 after 2 hours of growth (pre-induction), 1 mM IPTG was added here. The green box shows the OD600 2 hours after IPTG addition (post-induction), the OD600 was 1.3.
O
D60
0
B
0
0.2
0.4
0.6
0.8
1
1.2
1.4
0 100 200 300 400 500
A
Time (min)
0
0.5
1
1.5
2
2.5
0 50 100 150 200 250 300 350 400
Time (min)
O
D60
0
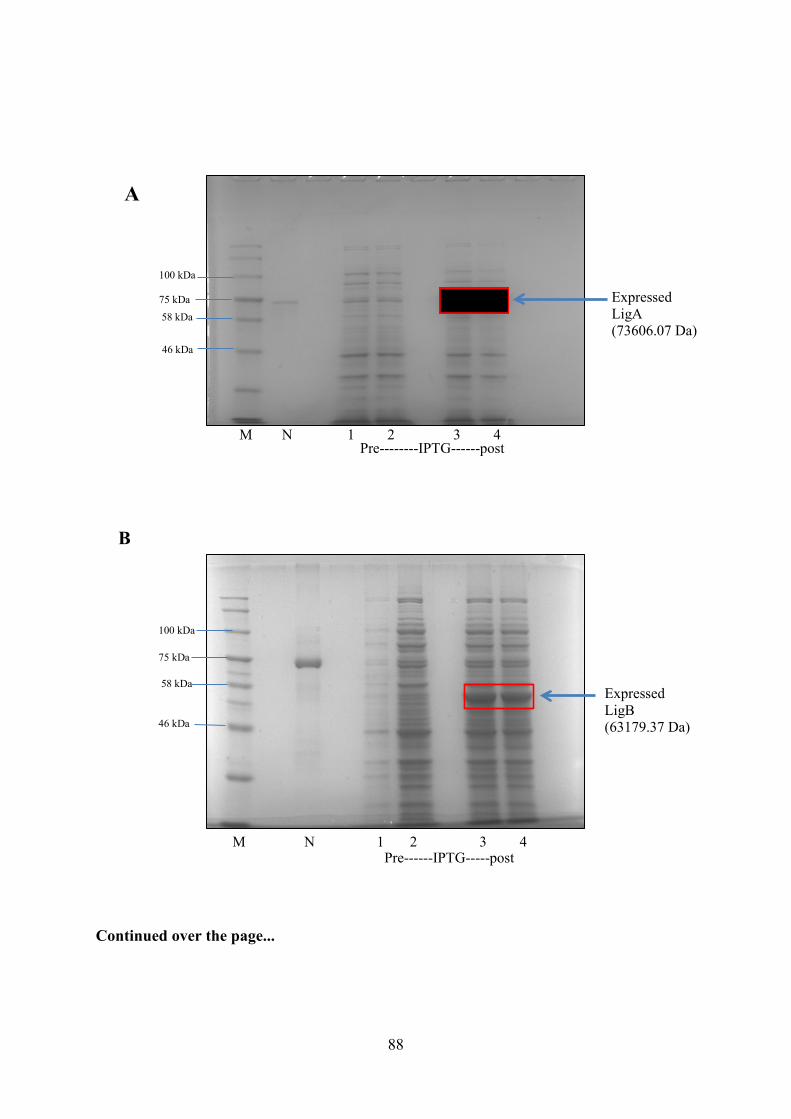
88
Continued over the page...
Pre------IPTG-----post
100 kDa
75 kDa58 kDa
46 kDa
Expressed LigA (73606.07 Da)
M N 1 2 3 4 Pre--------IPTG------post
B
Expressed LigB (63179.37 Da)
100 kDa
75 kDa
58 kDa
46 kDa
M N 1 2 3 4
A
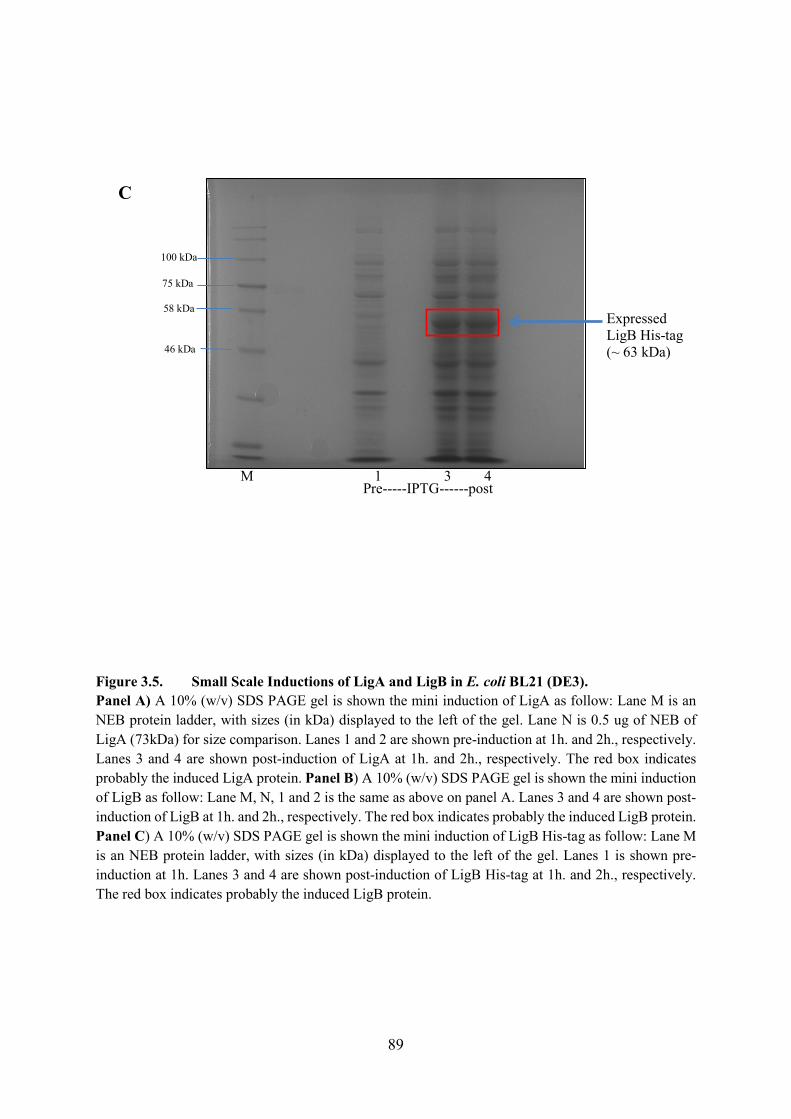
89
Figure 3.5. Small Scale Inductions of LigA and LigB in E. coli BL21 (DE3). Panel A) A 10% (w/v) SDS PAGE gel is shown the mini induction of LigA as follow: Lane M is an NEB protein ladder, with sizes (in kDa) displayed to the left of the gel. Lane N is 0.5 ug of NEB of LigA (73kDa) for size comparison. Lanes 1 and 2 are shown pre-induction at 1h. and 2h., respectively. Lanes 3 and 4 are shown post-induction of LigA at 1h. and 2h., respectively. The red box indicates probably the induced LigA protein. Panel B) A 10% (w/v) SDS PAGE gel is shown the mini induction of LigB as follow: Lane M, N, 1 and 2 is the same as above on panel A. Lanes 3 and 4 are shown post-induction of LigB at 1h. and 2h., respectively. The red box indicates probably the induced LigB protein. Panel C) A 10% (w/v) SDS PAGE gel is shown the mini induction of LigB His-tag as follow: Lane M is an NEB protein ladder, with sizes (in kDa) displayed to the left of the gel. Lanes 1 is shown pre-induction at 1h. Lanes 3 and 4 are shown post-induction of LigB His-tag at 1h. and 2h., respectively. The red box indicates probably the induced LigB protein.
100 kDa
75 kDa
46 kDa
Pre-----IPTG------post
Expressed LigB His-tag (~ 63 kDa)
58 kDa
M 1 3 4
C
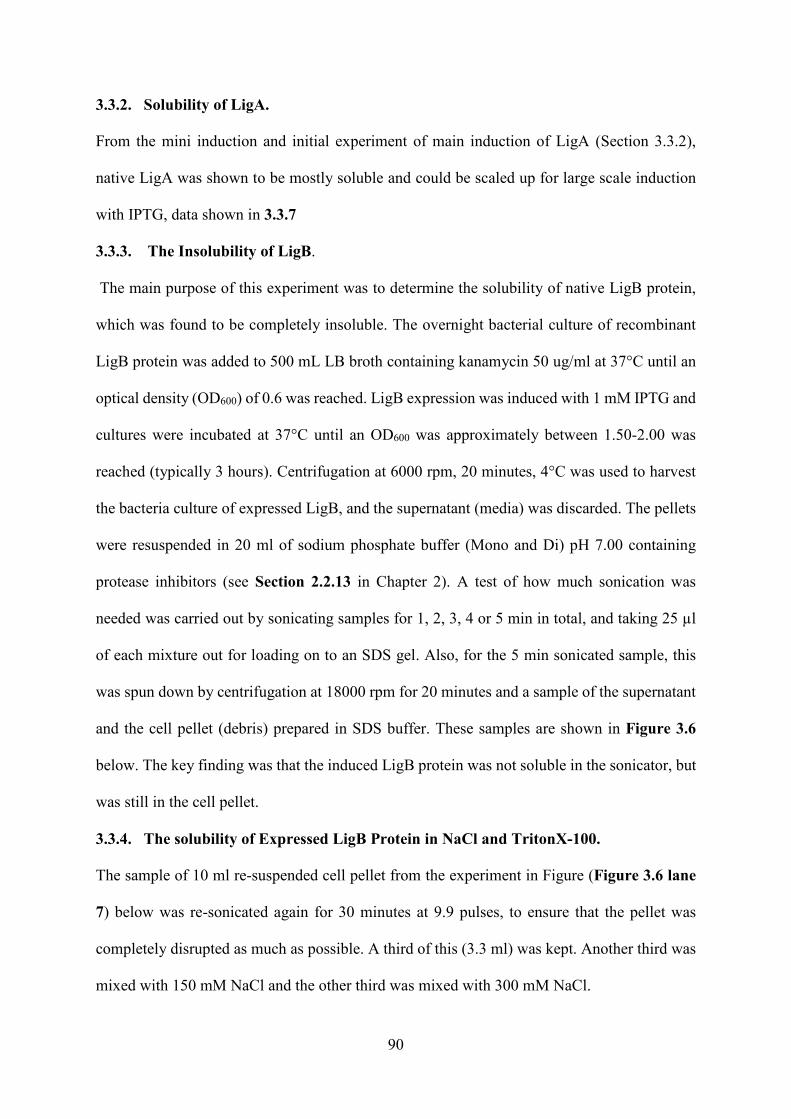
90
3.3.2. Solubility of LigA.
From the mini induction and initial experiment of main induction of LigA (Section 3.3.2),
native LigA was shown to be mostly soluble and could be scaled up for large scale induction
with IPTG, data shown in 3.3.7
3.3.3. The Insolubility of LigB.
The main purpose of this experiment was to determine the solubility of native LigB protein,
which was found to be completely insoluble. The overnight bacterial culture of recombinant
LigB protein was added to 500 mL LB broth containing kanamycin 50 ug/ml at 37°C until an
optical density (OD600) of 0.6 was reached. LigB expression was induced with 1 mM IPTG and
cultures were incubated at 37°C until an OD600 was approximately between 1.50-2.00 was
reached (typically 3 hours). Centrifugation at 6000 rpm, 20 minutes, 4°C was used to harvest
the bacteria culture of expressed LigB, and the supernatant (media) was discarded. The pellets
were resuspended in 20 ml of sodium phosphate buffer (Mono and Di) pH 7.00 containing
protease inhibitors (see Section 2.2.13 in Chapter 2). A test of how much sonication was
needed was carried out by sonicating samples for 1, 2, 3, 4 or 5 min in total, and taking 25 µl
of each mixture out for loading on to an SDS gel. Also, for the 5 min sonicated sample, this
was spun down by centrifugation at 18000 rpm for 20 minutes and a sample of the supernatant
and the cell pellet (debris) prepared in SDS buffer. These samples are shown in Figure 3.6
below. The key finding was that the induced LigB protein was not soluble in the sonicator, but
was still in the cell pellet.
3.3.4. The solubility of Expressed LigB Protein in NaCl and TritonX-100.
The sample of 10 ml re-suspended cell pellet from the experiment in Figure (Figure 3.6 lane
7) below was re-sonicated again for 30 minutes at 9.9 pulses, to ensure that the pellet was
completely disrupted as much as possible. A third of this (3.3 ml) was kept. Another third was
mixed with 150 mM NaCl and the other third was mixed with 300 mM NaCl.
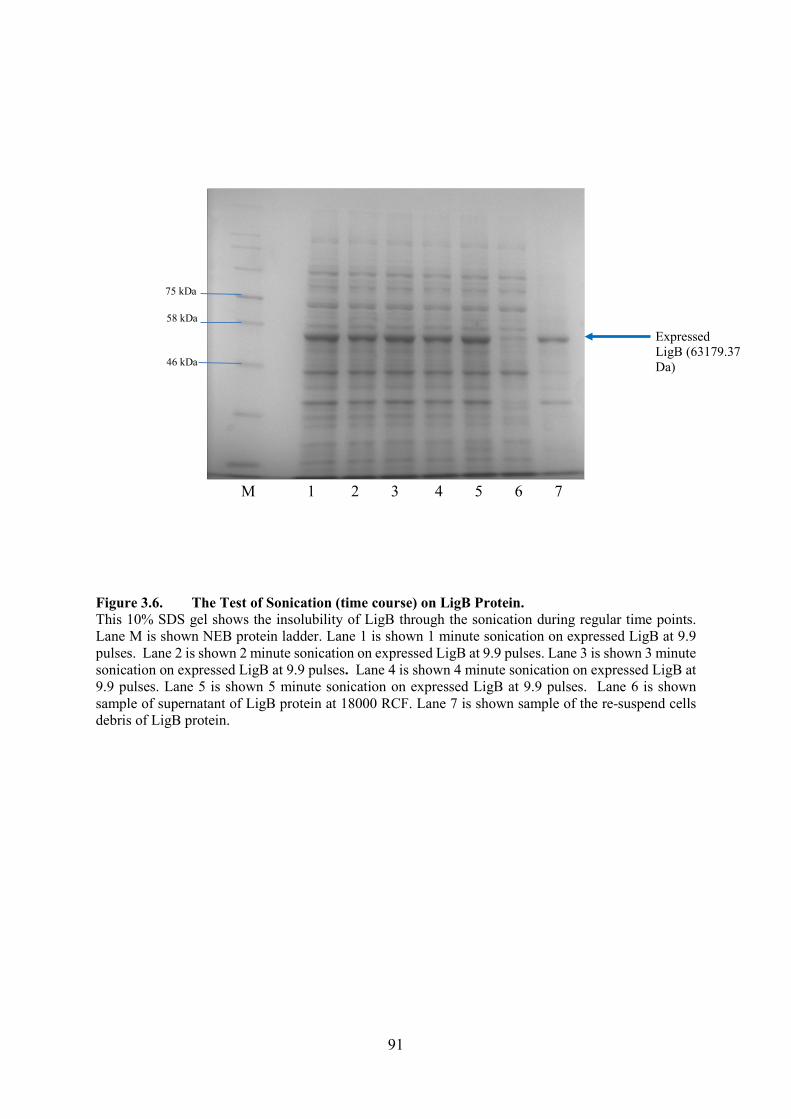
91
Figure 3.6. The Test of Sonication (time course) on LigB Protein. This 10% SDS gel shows the insolubility of LigB through the sonication during regular time points. Lane M is shown NEB protein ladder. Lane 1 is shown 1 minute sonication on expressed LigB at 9.9 pulses. Lane 2 is shown 2 minute sonication on expressed LigB at 9.9 pulses. Lane 3 is shown 3 minute sonication on expressed LigB at 9.9 pulses. Lane 4 is shown 4 minute sonication on expressed LigB at 9.9 pulses. Lane 5 is shown 5 minute sonication on expressed LigB at 9.9 pulses. Lane 6 is shown sample of supernatant of LigB protein at 18000 RCF. Lane 7 is shown sample of the re-suspend cells debris of LigB protein.
M 1 2 3 4 5 6 7
ExpressedLigB (63179.37 Da)
75 kDa
58 kDa
46 kDa
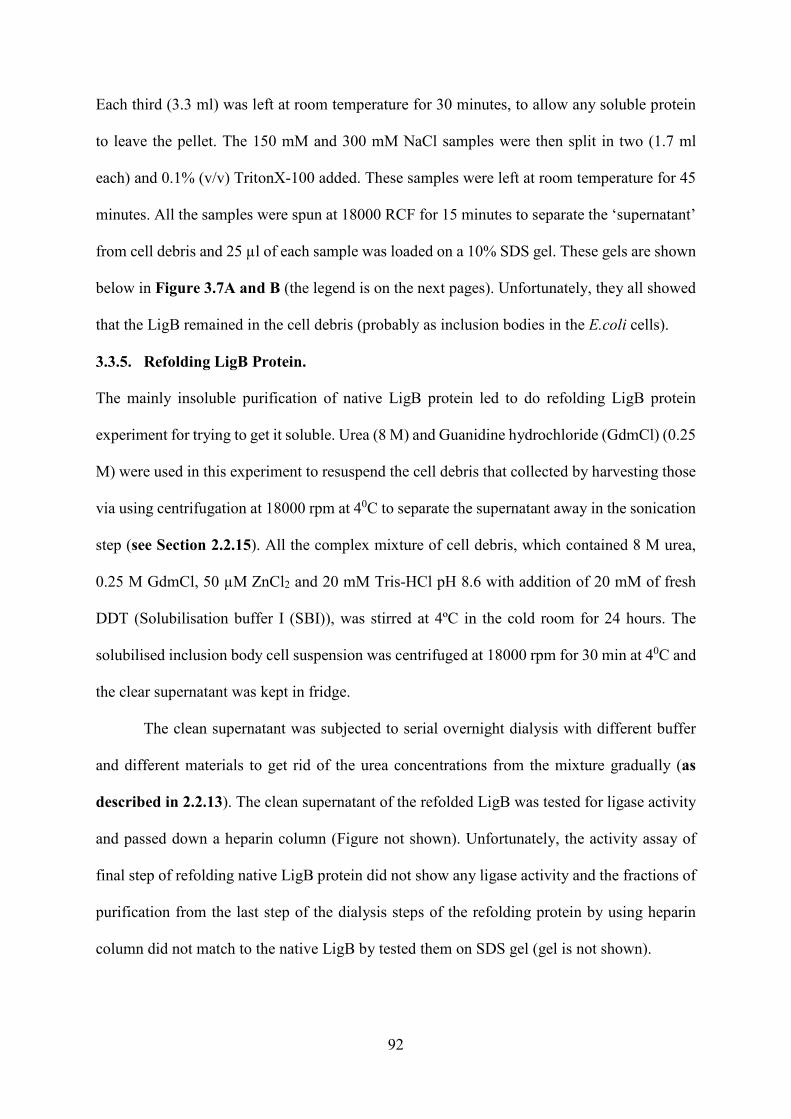
92
Each third (3.3 ml) was left at room temperature for 30 minutes, to allow any soluble protein
to leave the pellet. The 150 mM and 300 mM NaCl samples were then split in two (1.7 ml
each) and 0.1% (v/v) TritonX-100 added. These samples were left at room temperature for 45
minutes. All the samples were spun at 18000 RCF for 15 minutes to separate the �supernatant�
from cell debris and 25 µl of each sample was loaded on a 10% SDS gel. These gels are shown
below in Figure 3.7A and B (the legend is on the next pages). Unfortunately, they all showed
that the LigB remained in the cell debris (probably as inclusion bodies in the E.coli cells).
3.3.5. Refolding LigB Protein.
The mainly insoluble purification of native LigB protein led to do refolding LigB protein
experiment for trying to get it soluble. Urea (8 M) and Guanidine hydrochloride (GdmCl) (0.25
M) were used in this experiment to resuspend the cell debris that collected by harvesting those
via using centrifugation at 18000 rpm at 40C to separate the supernatant away in the sonication
step (see Section 2.2.15). All the complex mixture of cell debris, which contained 8 M urea,
0.25 M GdmCl, 50 µM ZnCl2 and 20 mM Tris-HCl pH 8.6 with addition of 20 mM of fresh
DDT (Solubilisation buffer I (SBI)), was stirred at 4ºC in the cold room for 24 hours. The
solubilised inclusion body cell suspension was centrifuged at 18000 rpm for 30 min at 40C and
the clear supernatant was kept in fridge.
The clean supernatant was subjected to serial overnight dialysis with different buffer
and different materials to get rid of the urea concentrations from the mixture gradually (as
described in 2.2.13). The clean supernatant of the refolded LigB was tested for ligase activity
and passed down a heparin column (Figure not shown). Unfortunately, the activity assay of
final step of refolding native LigB protein did not show any ligase activity and the fractions of
purification from the last step of the dialysis steps of the refolding protein by using heparin
column did not match to the native LigB by tested them on SDS gel (gel is not shown).
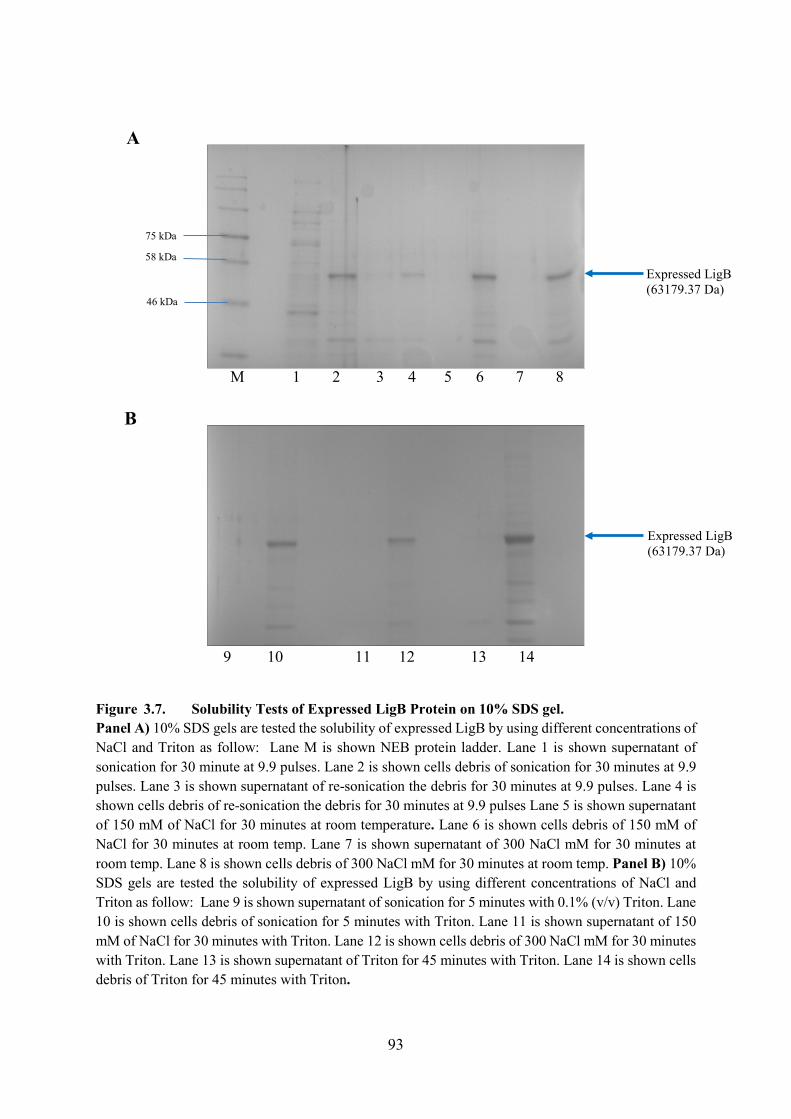
93
Figure 3.7. Solubility Tests of Expressed LigB Protein on 10% SDS gel. Panel A) 10% SDS gels are tested the solubility of expressed LigB by using different concentrations of NaCl and Triton as follow: Lane M is shown NEB protein ladder. Lane 1 is shown supernatant of sonication for 30 minute at 9.9 pulses. Lane 2 is shown cells debris of sonication for 30 minutes at 9.9 pulses. Lane 3 is shown supernatant of re-sonication the debris for 30 minutes at 9.9 pulses. Lane 4 is shown cells debris of re-sonication the debris for 30 minutes at 9.9 pulses Lane 5 is shown supernatant of 150 mM of NaCl for 30 minutes at room temperature. Lane 6 is shown cells debris of 150 mM of NaCl for 30 minutes at room temp. Lane 7 is shown supernatant of 300 NaCl mM for 30 minutes at room temp. Lane 8 is shown cells debris of 300 NaCl mM for 30 minutes at room temp. Panel B) 10% SDS gels are tested the solubility of expressed LigB by using different concentrations of NaCl and Triton as follow: Lane 9 is shown supernatant of sonication for 5 minutes with 0.1% (v/v) Triton. Lane 10 is shown cells debris of sonication for 5 minutes with Triton. Lane 11 is shown supernatant of 150 mM of NaCl for 30 minutes with Triton. Lane 12 is shown cells debris of 300 NaCl mM for 30 minutes with Triton. Lane 13 is shown supernatant of Triton for 45 minutes with Triton. Lane 14 is shown cells debris of Triton for 45 minutes with Triton.
M 1 2 3 4 5 6 7 8
Expressed LigB (63179.37 Da)
Expressed LigB (63179.37 Da)
9 10 11 12 13 14
75 kDa
58 kDa
46 kDa
A
B
94
3.3.6. New Strategy to Obtain Soluble LigB.
For LigB the solubility in NaCl and TritonX-100 and refolding experiments did not give any
soluble LigB. At this stage a new strategy was tried, in which the incubation temperature for
induction was decreased from 37ºC to 17ºC and left for ~17 hours. IPTG was added at OD600
0.60 and after 17 hours was about 1.50-2.00.
3.3.7. Large Scale Induction of LigA and LigB.
A large-scale protein expression of BL21 (DE3) cells containing pET29c-LigA, pET29c-LigB
or pET28b-LigB His-tag construct were conducted. A 10 mL aliquot of the overnight bacterial
culture of recombinant LigA, LigB and LigB His-tag proteins were added to 500 mL LB broth
containing kanamycin 50 ug/ml, in an orbital shaker at 37°C until an optical density (OD600)
of 0.6 was reached (about 2 hours). Protein expression was induced with 1 mM isopropyl B-
D-thiogalactoside (IPTG) as above, and the culture incubated at 37ºC for 2 hours and half
(LigA and LigB His-tag) or at 17ºC overnight (LigB) (Sriskanda & Shuman, 2001) until an
OD600 ~ 1.50-2.00 was reached to increase the solubility of LigB. Bacterial cultures were
harvested by centrifugation at 6000 rpm for 20 minutes at 4°C and the media discarded.
The cell pellet was re-suspended in 15 ml Lysis buffer (10 mM sodium phosphate, pH
7.0, containing benzamidine and PMSF protease inhibitor cocktail (Sigma-Aldrich, UK)) (see
Section 2.216). Lysis buffer for LigB also contained 500 mM NaCl and 0.1% (v/v) Triton X-
100. Cells were sonicated on ice in 10 second pulses over 3 minutes and spun at 18000 rpm for
20 minutes at 4ºC to separate supernatant and cell debris. Samples of pre- and post-IPTG
induction were run on a 10% SDS PAGE (for LigA Figure 3.8A, for native LigB 3.8B and
for LigB His-tag 3.8C). Figure 3.8A and B (native LigA and native LigB) showed 10% SDS
gel that includes five lanes with the marker (NEB protein ladder- blue protein standard), with
sizes (in kDa) displayed to the left of the gel. Lane 1 was the pre-induction of expressed native
LigA and native LigB before the OD600 reach to 0.60, respectively. Lanes 2 was post-induction
95
of expressed native LigA and native LigB by adding 1 mM IPTG when the OD600 was about
1.50-2.00, respectively. Lanes 3 was a sample of sonication of native LigA and native LigB
that got obtained through the sonication, respectively. Lane 4 is a sample of supernatant of
expressed native LigA and native LigB, respectively. Lane 5 is a sample of debris of expressed
native LigA and native LigB, respectively. Figure 3.8C for LigB His-tag was a 10% SDS
PAGE gel that shown the Main Induction of LigB His-tag in E.coli BL21 (DE3) as follow:
Lane M is an NEB protein ladder, with sizes (in kDa) displayed to the left of the gel. Lane 1 is
pre-induction of expressed LigB His-tag. Lane 2 is post-induction of expressed LigB His-tag.
Lane 3 is a sample of supernatant of expressed LigB His-tag. Lane 4 is a sample of debris of
expressed LigB His-tag.
3.4. Purification of LigA and LigB.
3.4.1. Purification of Native LigA.
Up to this stage, the appropriate genes of LigA was cloned into the bacterial expression vector
of pET29c. The expression plasmid pET29c LigA was induced in E.coli BL21 (DE3) by adding
1 mM IPTG, strain that contains the T7 RNA polymerase gene under the control of lac operator
promoter.
The next stage was to purify the enzymes. In the first step, NaCl was adjusted to 1M in
order to disrupt protein-nucleic acid interactions. DNA ligase LigA was subsequently purified
from the supernatant using ammonium sulphate; all steps were at 4ºC. Ammonium sulphate
was added slowly over two hours to a final concentration of 40% (w/v) in order to precipitate
the LigA enzyme (Figure 3.9).
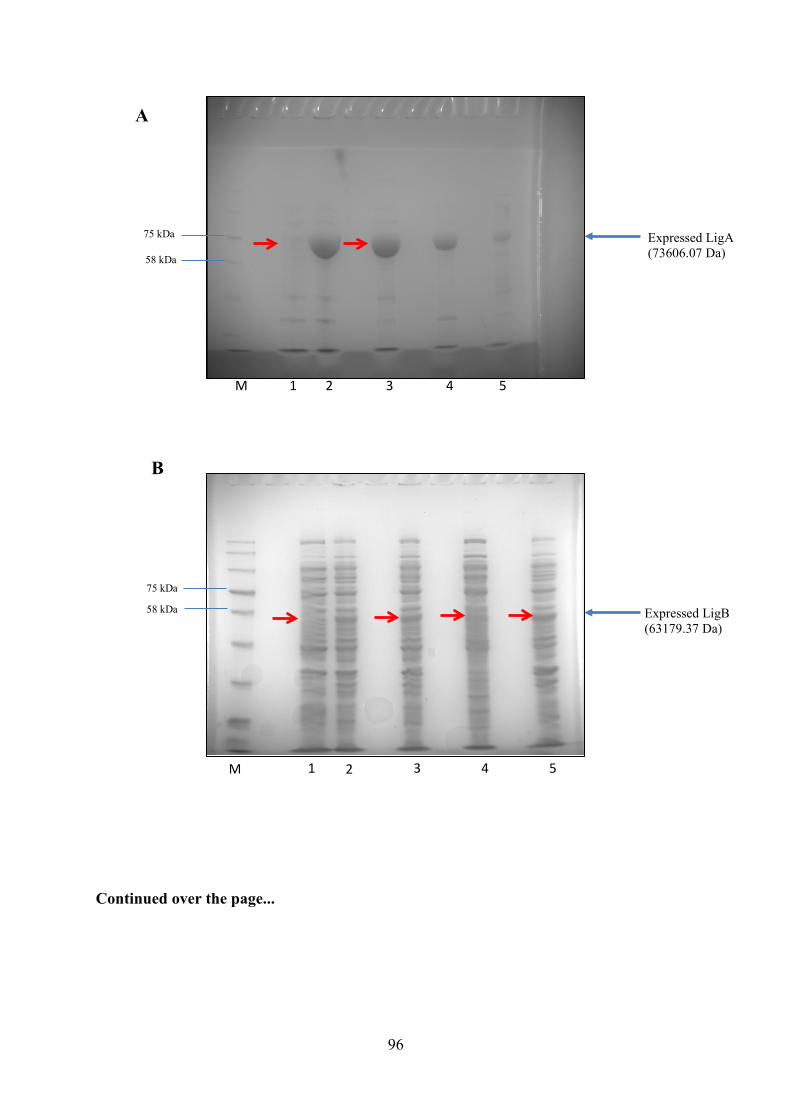
96
Continued over the page...
A
M 21 3 54
75 kDa
58 kDa
Expressed LigA (73606.07 Da)
5M 431 2
75 kDa
58 kDa
B
Expressed LigB (63179.37 Da)
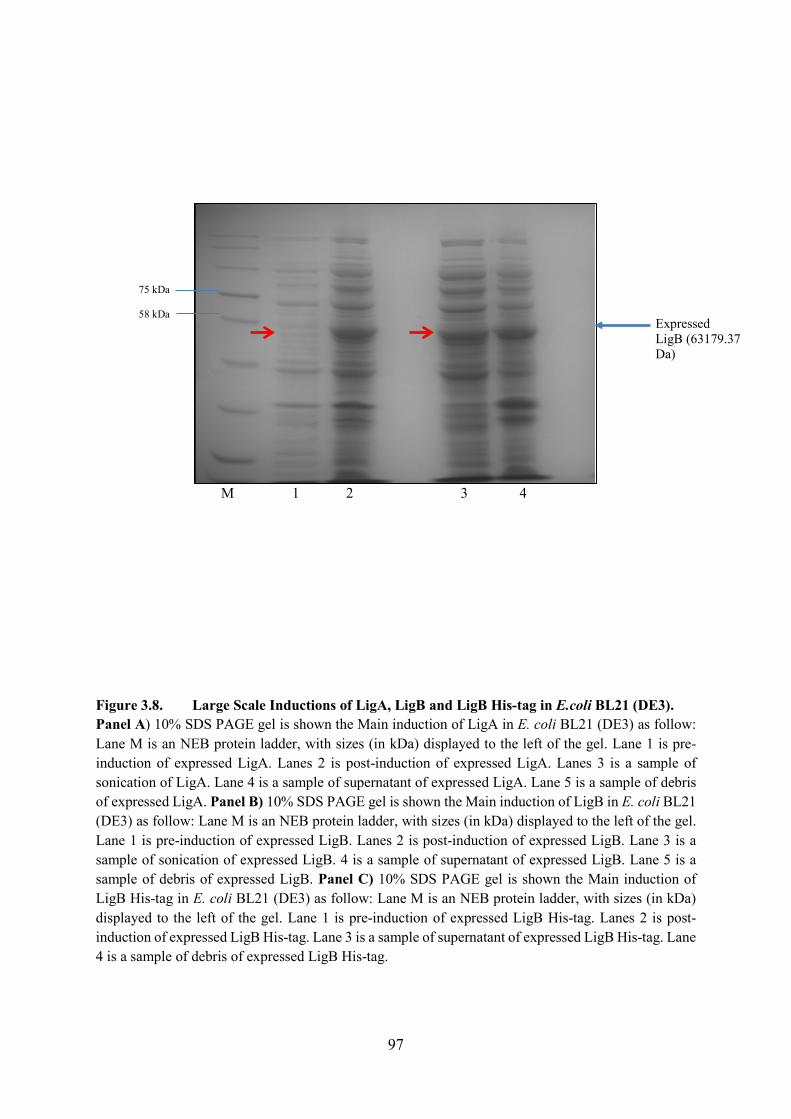
97
Figure 3.8. Large Scale Inductions of LigA, LigB and LigB His-tag in E.coli BL21 (DE3). Panel A) 10% SDS PAGE gel is shown the Main induction of LigA in E. coli BL21 (DE3) as follow: Lane M is an NEB protein ladder, with sizes (in kDa) displayed to the left of the gel. Lane 1 is pre-induction of expressed LigA. Lanes 2 is post-induction of expressed LigA. Lanes 3 is a sample of sonication of LigA. Lane 4 is a sample of supernatant of expressed LigA. Lane 5 is a sample of debris of expressed LigA. Panel B) 10% SDS PAGE gel is shown the Main induction of LigB in E. coli BL21 (DE3) as follow: Lane M is an NEB protein ladder, with sizes (in kDa) displayed to the left of the gel. Lane 1 is pre-induction of expressed LigB. Lanes 2 is post-induction of expressed LigB. Lane 3 is a sample of sonication of expressed LigB. 4 is a sample of supernatant of expressed LigB. Lane 5 is a sample of debris of expressed LigB. Panel C) 10% SDS PAGE gel is shown the Main induction of LigB His-tag in E. coli BL21 (DE3) as follow: Lane M is an NEB protein ladder, with sizes (in kDa) displayed to the left of the gel. Lane 1 is pre-induction of expressed LigB His-tag. Lanes 2 is post-induction of expressed LigB His-tag. Lane 3 is a sample of supernatant of expressed LigB His-tag. Lane 4 is a sample of debris of expressed LigB His-tag.
Expressed LigB (63179.37 Da)
4M 31 2
58 kDa
75 kDa
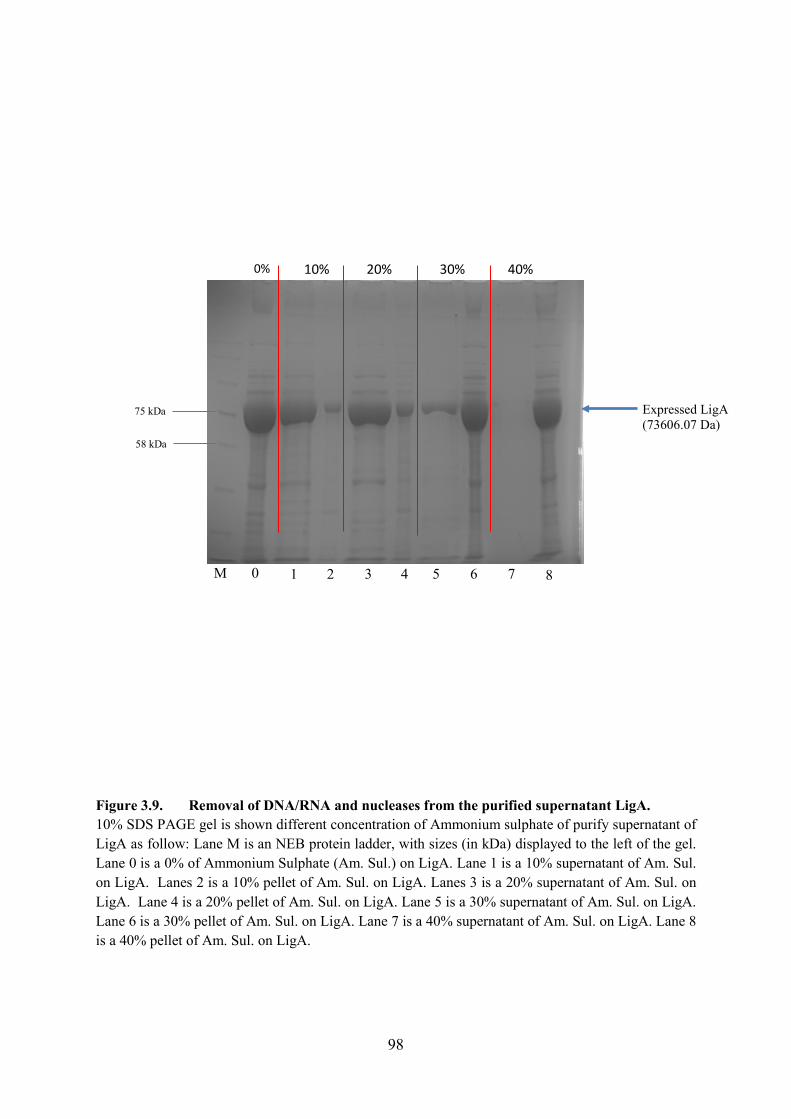
98
Figure 3.9. Removal of DNA/RNA and nucleases from the purified supernatant LigA. 10% SDS PAGE gel is shown different concentration of Ammonium sulphate of purify supernatant of LigA as follow: Lane M is an NEB protein ladder, with sizes (in kDa) displayed to the left of the gel. Lane 0 is a 0% of Ammonium Sulphate (Am. Sul.) on LigA. Lane 1 is a 10% supernatant of Am. Sul. on LigA. Lanes 2 is a 10% pellet of Am. Sul. on LigA. Lanes 3 is a 20% supernatant of Am. Sul. on LigA. Lane 4 is a 20% pellet of Am. Sul. on LigA. Lane 5 is a 30% supernatant of Am. Sul. on LigA. Lane 6 is a 30% pellet of Am. Sul. on LigA. Lane 7 is a 40% supernatant of Am. Sul. on LigA. Lane 8 is a 40% pellet of Am. Sul. on LigA.
M 0 1 2 3 4 5 6 7 8
20%10% 40%30%0%
75 kDa
58 kDa
Expressed LigA (73606.07 Da)
99
Therefore different concentrations of ammonium sulphate purification step did work in LigA.
Following centrifugation at 18000 rpm for 20 minutes, the pellet was re-suspended in an
appropriate volume of column binding buffer (10 mM sodium phosphate, pH 7.0) and the top
solution was removed. Salt was removed via membrane dialysis (Spectra/Por-MWCO: 6-8
KDa) overnight at 40C in column binding buffer ready for column loading. Native LigA was
purified from the soluble fraction using two strategies (as described in materials and methods,
Section 2.2). The first strategy for LigA was to use a HiTrap Heparin affinity chromatography
column (5 ml, GE Healthcare) that was carried out by using column binding buffer first and
column elution buffer next (10 sodium phosphate plus 1 M NaCl) (see Section 2.2.17).
Fractions eluting from the column were analysed by SDS/PAGE in order to confirm which
contained the proteins, depending on the molecular weight of the enzyme along the marker.
Figure 3.10A shows flow chart of the purification of LigA procedure. Figure 3.10B shows the
corresponding samples of native LigA (shown by blue arrows down) were run on an 10% (w/v)
SDS-PAGE gel that pooled protein from heparin column as follow: Lane M is an NEB protein
ladder in the left side, with sizes (in kDa) displayed to the left of the gel. Lane 1 to 9 are the
purification of LigA on heparin column. Figure 3.10C shows a peak in 280 nm at 100% elution
buffer by using HiTrap Heparin affinity column of native LigA protein that highlighted with
black star. Any fractions containing the desired protein (depending on the molecular weight)
were taken and then buffer was exchanged with column binding buffer using dialysis for
purified native LigA. Fractions containing the purified protein of native LigA were pooled
together in volume of 2 ml. The soluble protein (~2 ml) were dialysed overnight in column
binding buffer and loaded into the glass superloop and purified using HiTrap Q-Sepharose,
Fast Flow (FF) chromatography column (5ml, GE Healthcare).
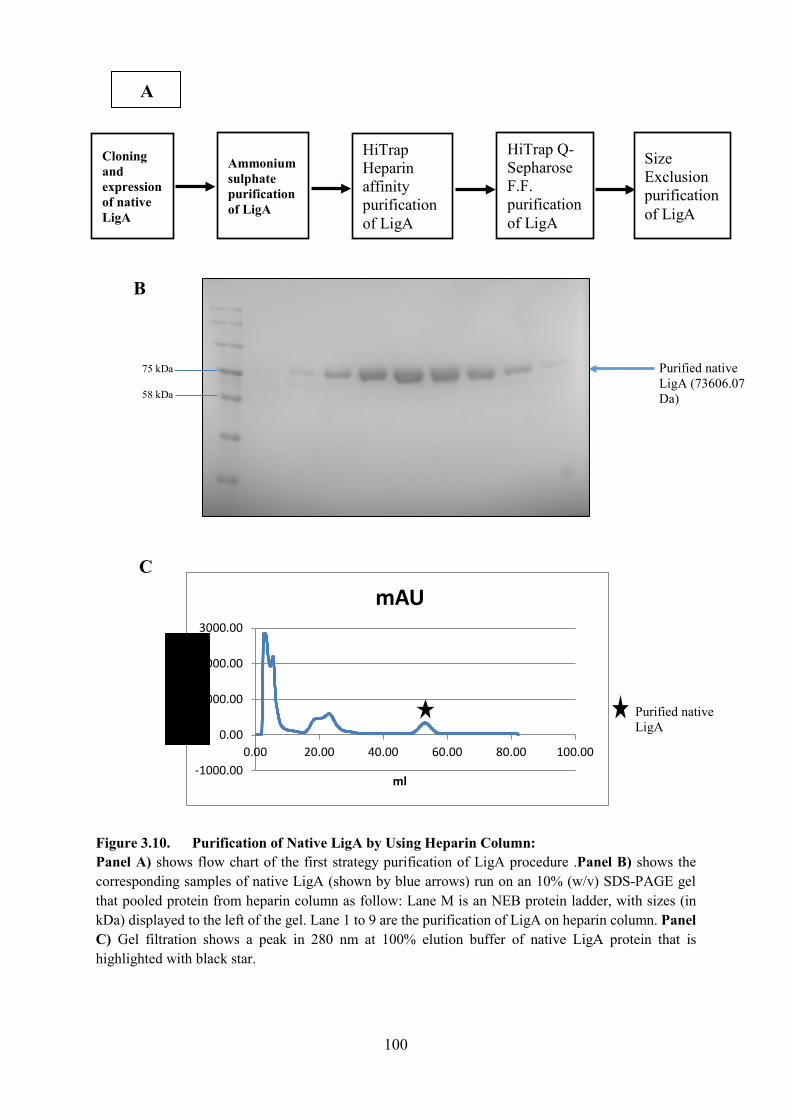
100
Figure 3.10. Purification of Native LigA by Using Heparin Column: Panel A) shows flow chart of the first strategy purification of LigA procedure .Panel B) shows the corresponding samples of native LigA (shown by blue arrows) run on an 10% (w/v) SDS-PAGE gel that pooled protein from heparin column as follow: Lane M is an NEB protein ladder, with sizes (in kDa) displayed to the left of the gel. Lane 1 to 9 are the purification of LigA on heparin column. Panel C) Gel filtration shows a peak in 280 nm at 100% elution buffer of native LigA protein that is highlighted with black star.
-1000.00
0.00
1000.00
2000.00
3000.00
0.00 20.00 40.00 60.00 80.00 100.00
ml
mAUC
M 542 31 76 8 9
Purified nativeLigA m
AU
280
nm
75 kDa
58 kDa
Purified nativeLigA (73606.07 Da)
B
Cloning and expression of native LigA
Ammonium sulphate purification of LigA
HiTrap Heparin affinity purification of LigA
HiTrap Q-Sepharose F.F. purification of LigA
Size Exclusion purification of LigA
A
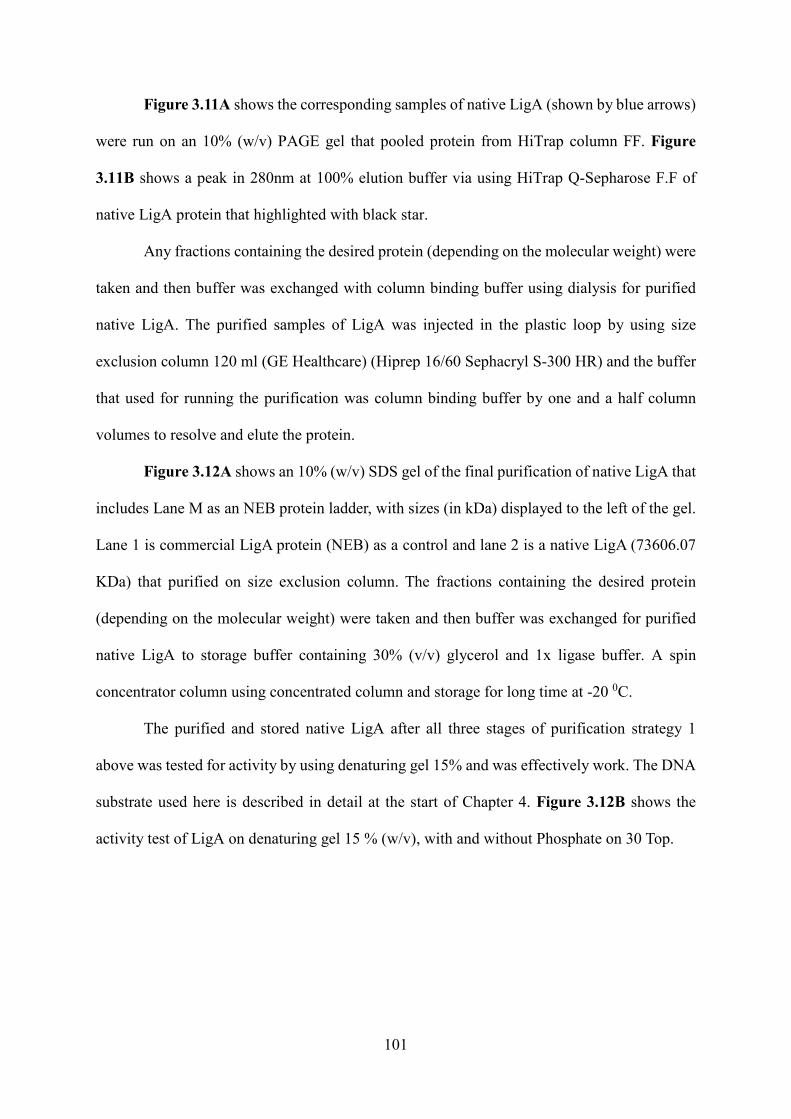
101
Figure 3.11A shows the corresponding samples of native LigA (shown by blue arrows)
were run on an 10% (w/v) PAGE gel that pooled protein from HiTrap column FF. Figure
3.11B shows a peak in 280nm at 100% elution buffer via using HiTrap Q-Sepharose F.F of
native LigA protein that highlighted with black star.
Any fractions containing the desired protein (depending on the molecular weight) were
taken and then buffer was exchanged with column binding buffer using dialysis for purified
native LigA. The purified samples of LigA was injected in the plastic loop by using size
exclusion column 120 ml (GE Healthcare) (Hiprep 16/60 Sephacryl S-300 HR) and the buffer
that used for running the purification was column binding buffer by one and a half column
volumes to resolve and elute the protein.
Figure 3.12A shows an 10% (w/v) SDS gel of the final purification of native LigA that
includes Lane M as an NEB protein ladder, with sizes (in kDa) displayed to the left of the gel.
Lane 1 is commercial LigA protein (NEB) as a control and lane 2 is a native LigA (73606.07
KDa) that purified on size exclusion column. The fractions containing the desired protein
(depending on the molecular weight) were taken and then buffer was exchanged for purified
native LigA to storage buffer containing 30% (v/v) glycerol and 1x ligase buffer. A spin
concentrator column using concentrated column and storage for long time at -20 0C.
The purified and stored native LigA after all three stages of purification strategy 1
above was tested for activity by using denaturing gel 15% and was effectively work. The DNA
substrate used here is described in detail at the start of Chapter 4. Figure 3.12B shows the
activity test of LigA on denaturing gel 15 % (w/v), with and without Phosphate on 30 Top.
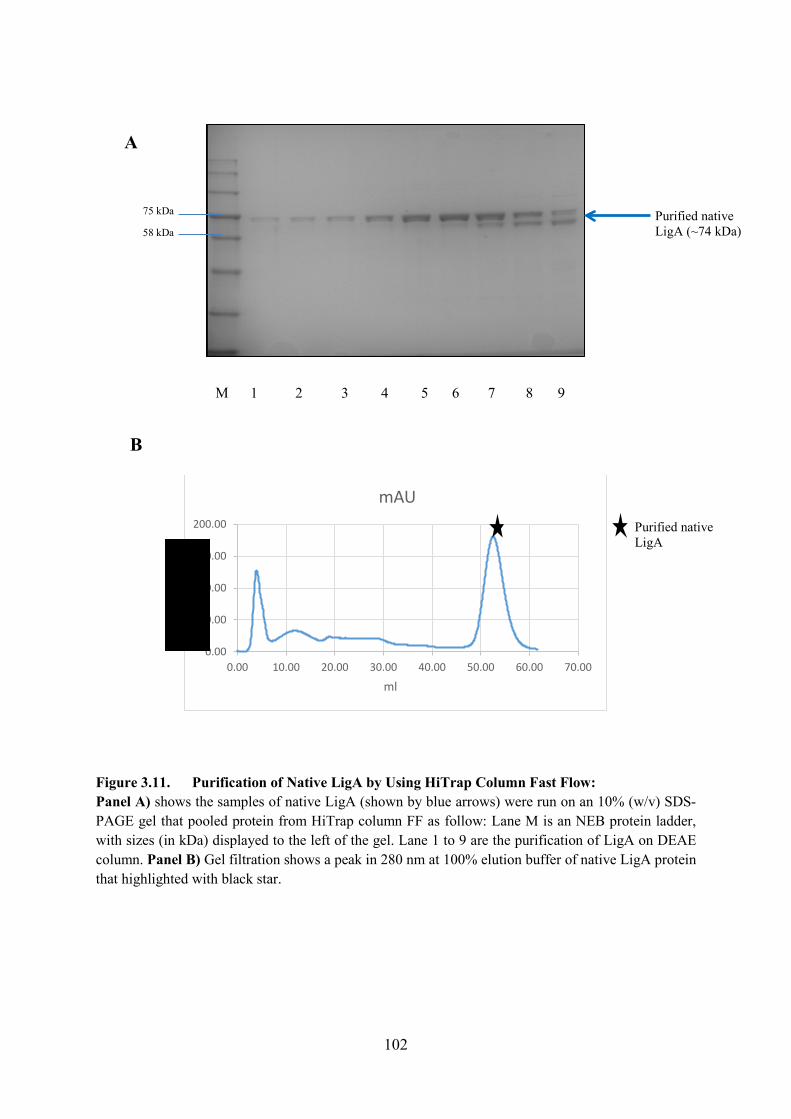
102
Figure 3.11. Purification of Native LigA by Using HiTrap Column Fast Flow: Panel A) shows the samples of native LigA (shown by blue arrows) were run on an 10% (w/v) SDS-PAGE gel that pooled protein from HiTrap column FF as follow: Lane M is an NEB protein ladder, with sizes (in kDa) displayed to the left of the gel. Lane 1 to 9 are the purification of LigA on DEAE column. Panel B) Gel filtration shows a peak in 280 nm at 100% elution buffer of native LigA protein that highlighted with black star.
0.00
50.00
100.00
150.00
200.00
0.00 10.00 20.00 30.00 40.00 50.00 60.00 70.00
ml
mAU
mA
U 2
80nm
Purified nativeLigA
M 542 31 76 8 9
75 kDa
58 kDaPurified nativeLigA (~74 kDa)
B
A
103
Figure 3.12. The Final Purification of Native LigA by Size exclusion Column and ligation Activity Test on LigA. A) 10% SDS gel (w/v) shows the final purification of native LigA as follow: Lane M is an NEB protein ladder, with sizes (in kDa) displayed to the left of the gel. Lane 1 is commercial LigA protein (NEB). Lane 2 is a native LigA (73606.07 KDa) that purified on size exclusion column. Lane 3 is a native LigB (63179.37 KDa) purified on HiTrap heparin column (all details of purified LigB in Section 3.4.2). B) is shown the activity of LigA by using denaturing gel 15%. The DNA subastrate that used here was described in detail in Chapter 4, which includes 50 BOT, 20 TOP with Hex and 30 TOP with phosphate in lane 1 and without phosphate in lane 2.
M 2 31
75 kDa
58 kDa
Bromophenol blue
1 2
50 Top
20 Top
A
B ± 5� Phosphate + -on 30 Top
Purified native LigA (73606.07 Da)Purified native LigB (63179.37 Da)
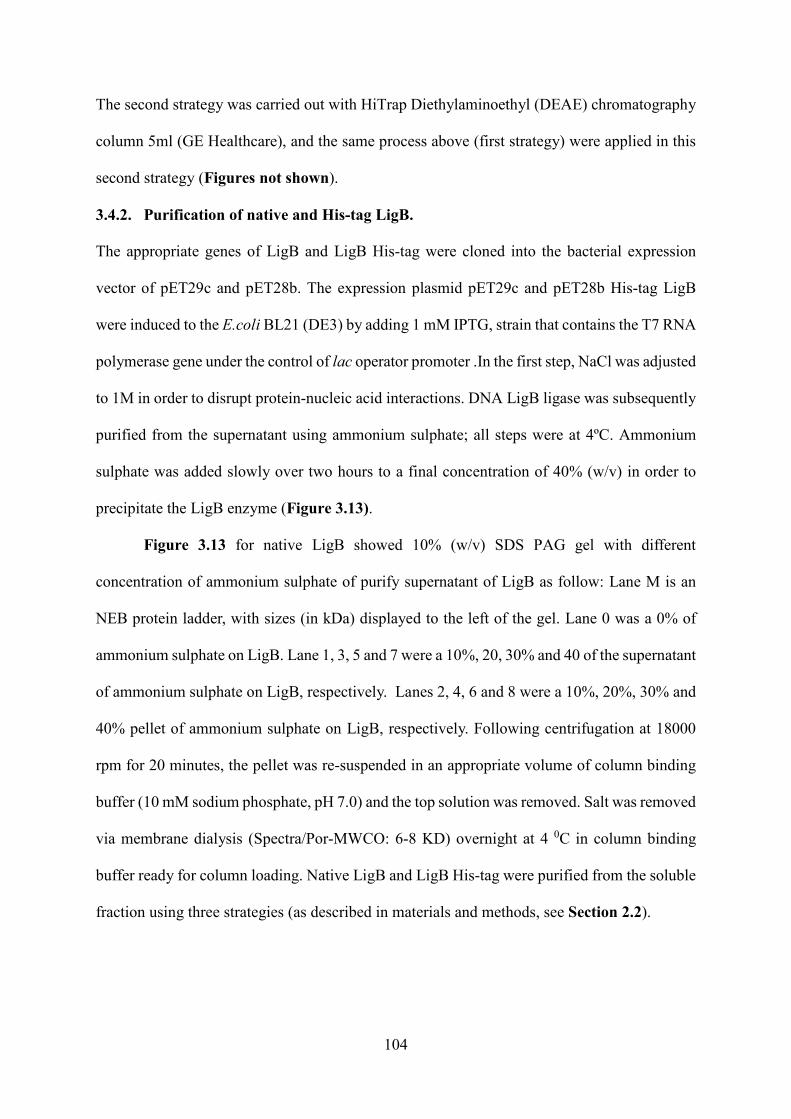
104
The second strategy was carried out with HiTrap Diethylaminoethyl (DEAE) chromatography
column 5ml (GE Healthcare), and the same process above (first strategy) were applied in this
second strategy (Figures not shown).
3.4.2. Purification of native and His-tag LigB.
The appropriate genes of LigB and LigB His-tag were cloned into the bacterial expression
vector of pET29c and pET28b. The expression plasmid pET29c and pET28b His-tag LigB
were induced to the E.coli BL21 (DE3) by adding 1 mM IPTG, strain that contains the T7 RNA
polymerase gene under the control of lac operator promoter .In the first step, NaCl was adjusted
to 1M in order to disrupt protein-nucleic acid interactions. DNA LigB ligase was subsequently
purified from the supernatant using ammonium sulphate; all steps were at 4ºC. Ammonium
sulphate was added slowly over two hours to a final concentration of 40% (w/v) in order to
precipitate the LigB enzyme (Figure 3.13).
Figure 3.13 for native LigB showed 10% (w/v) SDS PAG gel with different
concentration of ammonium sulphate of purify supernatant of LigB as follow: Lane M is an
NEB protein ladder, with sizes (in kDa) displayed to the left of the gel. Lane 0 was a 0% of
ammonium sulphate on LigB. Lane 1, 3, 5 and 7 were a 10%, 20, 30% and 40 of the supernatant
of ammonium sulphate on LigB, respectively. Lanes 2, 4, 6 and 8 were a 10%, 20%, 30% and
40% pellet of ammonium sulphate on LigB, respectively. Following centrifugation at 18000
rpm for 20 minutes, the pellet was re-suspended in an appropriate volume of column binding
buffer (10 mM sodium phosphate, pH 7.0) and the top solution was removed. Salt was removed
via membrane dialysis (Spectra/Por-MWCO: 6-8 KD) overnight at 4 0C in column binding
buffer ready for column loading. Native LigB and LigB His-tag were purified from the soluble
fraction using three strategies (as described in materials and methods, see Section 2.2).
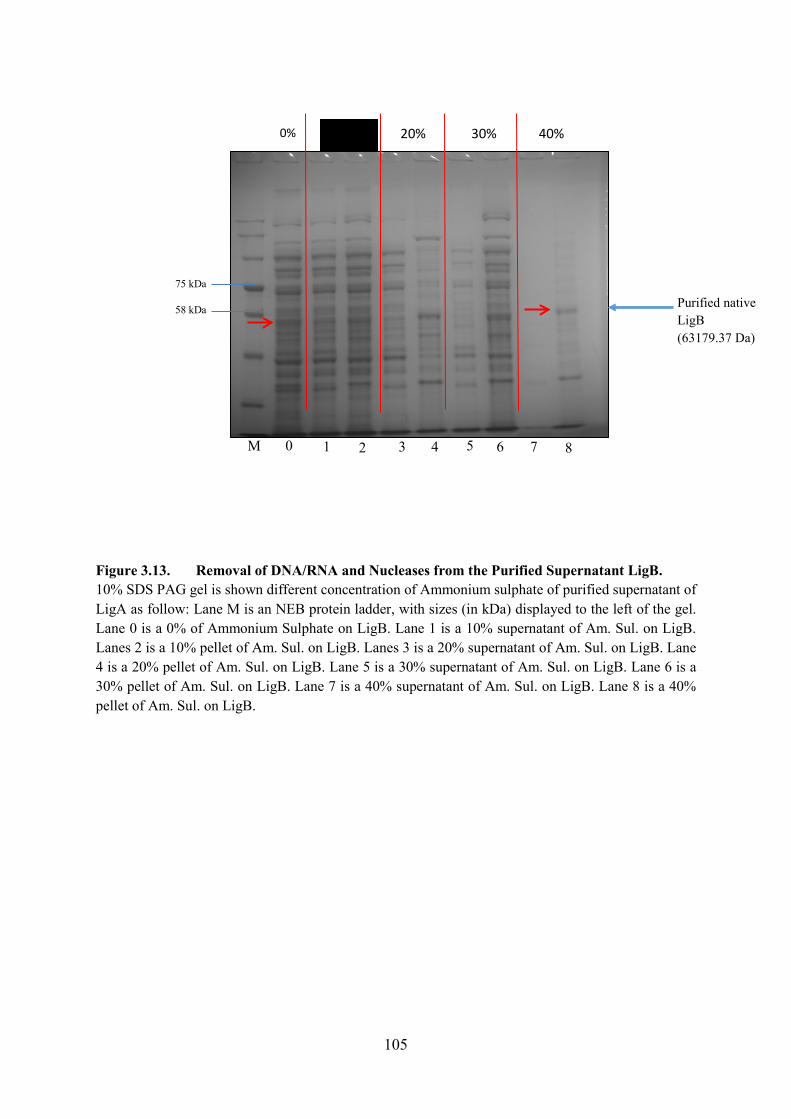
105
Figure 3.13. Removal of DNA/RNA and Nucleases from the Purified Supernatant LigB. 10% SDS PAG gel is shown different concentration of Ammonium sulphate of purified supernatant of LigA as follow: Lane M is an NEB protein ladder, with sizes (in kDa) displayed to the left of the gel. Lane 0 is a 0% of Ammonium Sulphate on LigB. Lane 1 is a 10% supernatant of Am. Sul. on LigB. Lanes 2 is a 10% pellet of Am. Sul. on LigB. Lanes 3 is a 20% supernatant of Am. Sul. on LigB. Lane 4 is a 20% pellet of Am. Sul. on LigB. Lane 5 is a 30% supernatant of Am. Sul. on LigB. Lane 6 is a 30% pellet of Am. Sul. on LigB. Lane 7 is a 40% supernatant of Am. Sul. on LigB. Lane 8 is a 40% pellet of Am. Sul. on LigB.
58 kDa
75 kDa
20% 30% 40%
0
0%
M 1 2 3 4 5 6 7 8
Purified native LigB (63179.37 Da)

106
The first strategy for native LigB was to use a HiTrap HP (see Section 2.2.19) chromatography
column (5 ml, GE Healthcare) that was carried out by using column binding buffer first and
column elution buffer with next (10 mM sodium phosphate plus 1 M NaCl) (see Section
2.2.17). Fractions eluting from the column were analysed by SDS/PAGE in order to confirm
which contained the proteins, depending on the molecular weight of the enzyme along the
marker. Figure 3.14A shows flow chart of the purification of LigB procedure. Figure 3.14B
shows an SDS gel of the first purification of native LigB that includes Lane M as an NEB
protein ladder, with sizes (in kDa) displayed to the left of the gel. Lane 1 is commercial LigA
protein (NEB) as a control. Lane 2 is commercial T4 protein (NEB). Lane 3 is a native LigA
and lane 4 is a native LigB (73606.07 KDa) that purified on just HiTrap HP column. The stored
native LigB after all three stages of purification strategy 1 above was tested its activity by using
denaturing gel 15 %. The DNA substrate that used here is described in detail at the start of
Chapter 4 (the corresponding fractions of native LigB on SDS gel was not shown). Figure
3.14C shows a peak in 280 nm at 100% elution buffer by using HiTrap HP column of native
LigB protein that highlighted with black star.
Any fractions containing the desired protein (depending on the molecular weight) were
taken and then buffer was exchanged for purified native LigB to storage buffer containing 30%
(v/v) glycerol and 1× ligase buffer. A spin concentrator column using concentrated column
several time and storage at -20ºC. Figure 3.16B (next two pages) shows the activity test of
native LigB that purified by HiTrap HP on denaturing gel 15% down next few pages. The
second strategy for native LigB was to use a HiTrap Heparin affinity chromatography column
(5 ml, GE Healthcare) that was carried out by using column binding buffer first and column
elution buffer with next (10 sodium phosphate plus 1 M NaCl) (see Section 2.2.17). Fractions
eluting from the column were analysed by SDS/PAGE in order to confirm which contained the
proteins, depending on the molecular weight of the enzyme along the marker.

107
Figure 3.14. The First Purification of Native LigB by HiTrap HP Column. Panel A) shows flow chart of the first strategy purification of LigB procedure. Panel B) 10% SDS gel (w/v) shows the purification of native LigB as follow: Lane M is an NEB protein ladder, with sizes (in kDa) displayed to the left of the gel. Lane 1 is commercial LigA protein (NEB). Lane 2 is commercial T4 protein (NEB). Lane 3 is a native LigA (73606.07 KDa) that purified on size exclusion column (see Section 3.4.1). Lane 4 is a native LigB (63179.37 KDa) purified on HiTrap HP column. Panel C) Gel filtration shows a peak in 280 nm at 100% elution buffer of native LigB protein by HiTrap HP that highlighted with black star.
-500.00
0.00
500.00
1000.00
1500.00
0.00 20.00 40.00 60.00 80.00
mAU
mAU
75 kDa
58 kDa
mA
U 2
80nm
Purified nativeLigB
B
B
432M 1
Expressed LigA (73606.07 Da) Expressed LigB (63179.37 Da)
Cloning and expression of native LigB
Ammonium sulphate purification of LigB
HiTrap HP Column Purification of LigB
A
108
Figure 3.15A shows flow chart of the purification of LigB procedure using heparin column.
Figure 3.15B showed the corresponding samples of native LigB (shown by blue arrows down)
were run on an 10% (w/v) SDS-PAGE gel that pooled protein from heparin column as follow:
Lane M is an NEB protein ladder in the left side, with sizes (in kDa) displayed to the left of the
gel. Lane 1 to 6 are the purification of LigB on heparin column. Figure 3.15C shows a peak in
280 nm at 100% elution buffer by using HiTrap Heparin affinity column of native LigB protein
that highlighted with black star. Any fractions containing the desired protein (depending on the
molecular weight) were taken and then buffer was exchanged for purified native LigB to
storage buffer containing 30% (v/v) glycerol and 1× ligase buffer. A spin concentrator column
using concentrated column several time and storage at -20ºC. Figure 3.16A shows an SDS gel
of the final purification of native LigB that includes Lane M as an NEB protein ladder, with
sizes (in kDa) displayed to the left of the gel. Lane 1 is commercial LigA protein (NEB) as a
control and lane 3 is a native LigB (73606.07 KDa) that purified on just heparin column. The
purified and storage native LigB after all the purification in strategy 1 above and 2 was tested
for activity by using denaturing gel 15 % (w/v) and was effectively work. The DNA substrate
that used here is described in detail at the start of Chapter 4.
Figure 3.16B shows the activity test of native LigB by first and second strategies
(HiTrap HP and heparin column) on denaturing gel 15 % (w/v). The third strategy of LigB His-
tag was carried out with Nickel Affinity Chromatography by using HisTrap HP column (5 ml)
that was carried out by using Binding buffer (buffer A) (see Section 2.2.17 in materials and
methods Chapter) that includes 20 mM imidazole and 500 mM NaCl first and elution buffer
(buffer B) with next 500 mM imidazole and 500 mM NaCl. Fractions eluting from the column
were analysed by DS/PAGE in order to confirm which contained the proteins, depending on
the molecular weight of the enzyme along the marker (Figure not shown). Unfortunately the
fractions of LigB His-tag came out with the flow rate and trapped with unbinding proteins.
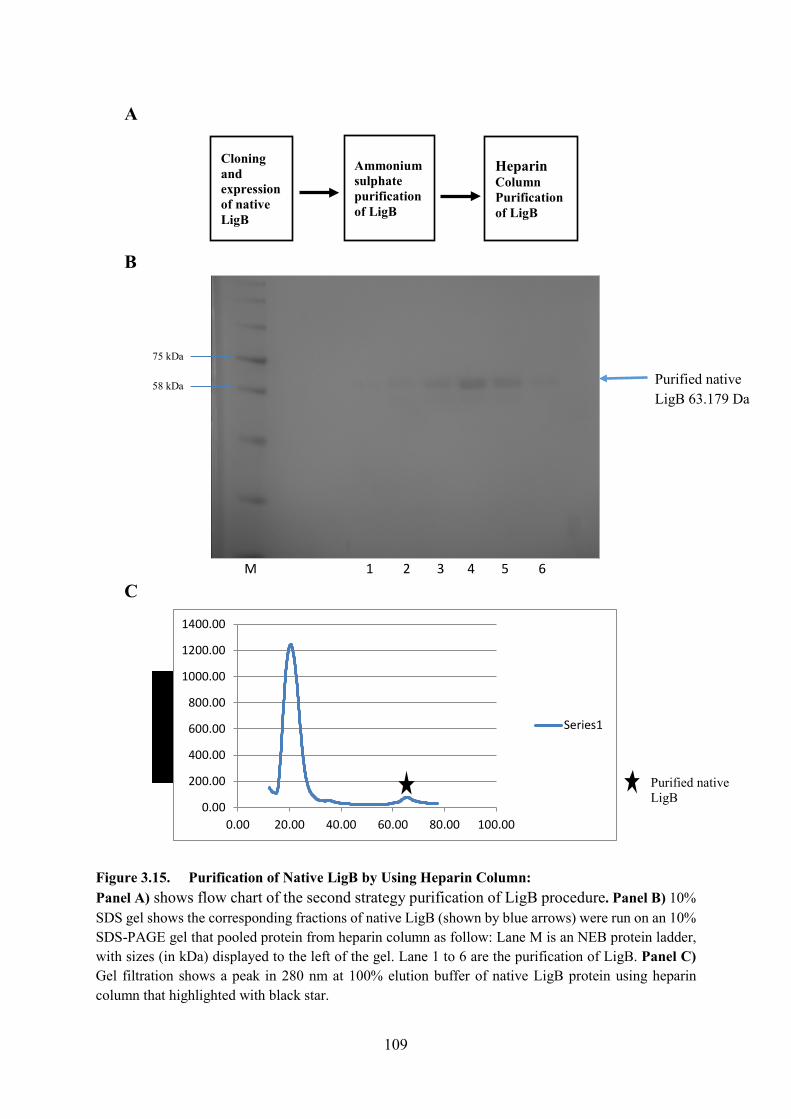
109
Figure 3.15. Purification of Native LigB by Using Heparin Column: Panel A) shows flow chart of the second strategy purification of LigB procedure. Panel B) 10% SDS gel shows the corresponding fractions of native LigB (shown by blue arrows) were run on an 10% SDS-PAGE gel that pooled protein from heparin column as follow: Lane M is an NEB protein ladder, with sizes (in kDa) displayed to the left of the gel. Lane 1 to 6 are the purification of LigB. Panel C)Gel filtration shows a peak in 280 nm at 100% elution buffer of native LigB protein using heparin column that highlighted with black star.
75 kDa
58 kDa
M 1 2 3 4 5 6
Purified nativeLigB
Purified native LigB 63.179 Da
mA
U 2
80nm
C
B
0.00
200.00
400.00
600.00
800.00
1000.00
1200.00
1400.00
0.00 20.00 40.00 60.00 80.00 100.00
Series1
A
Cloning and expression of native LigB
Ammonium sulphate purification of LigB
HeparinColumn Purification of LigB
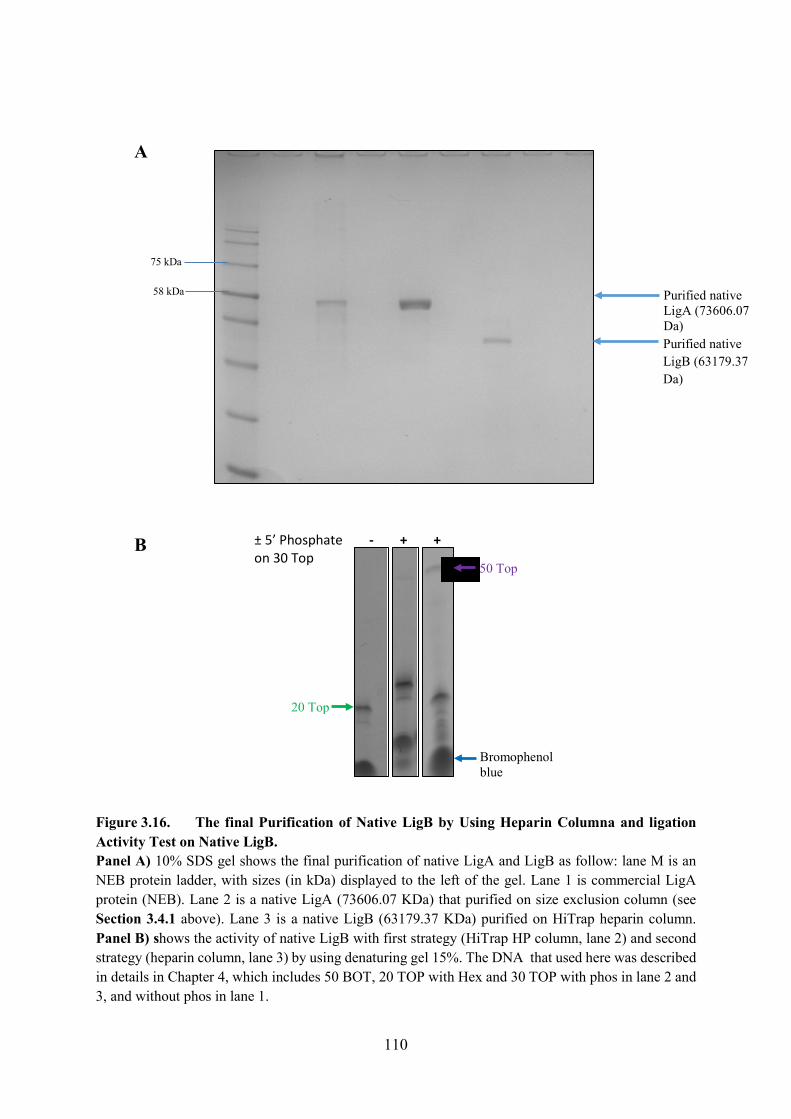
110
Figure 3.16. The final Purification of Native LigB by Using Heparin Columna and ligation Activity Test on Native LigB. Panel A) 10% SDS gel shows the final purification of native LigA and LigB as follow: lane M is an NEB protein ladder, with sizes (in kDa) displayed to the left of the gel. Lane 1 is commercial LigA protein (NEB). Lane 2 is a native LigA (73606.07 KDa) that purified on size exclusion column (see Section 3.4.1 above). Lane 3 is a native LigB (63179.37 KDa) purified on HiTrap heparin column. Panel B) shows the activity of native LigB with first strategy (HiTrap HP column, lane 2) and second strategy (heparin column, lane 3) by using denaturing gel 15%. The DNA that used here was described in details in Chapter 4, which includes 50 BOT, 20 TOP with Hex and 30 TOP with phos in lane 2 and 3, and without phos in lane 1.
1 2 3
50 Top
M 2 31
Bromophenol blue
75 kDa
58 kDa
A
± 5� Phosphate - + +on 30 Top
20 Top
B
Purified native LigA (73606.07 Da)Purified native LigB (63179.37 Da)
111
3.5. Determining Concentrations of Purified DNA Ligases.
It was also important at this stage to exactly determine the molar concentration of E.coli DNA
ligase for native LigA, LigB and LigA NEB that were purified via different columns. This was
done via sodium dodecyl sulphate polyacrylamide gel electrophoresis (SDS-PAGE) (see
Section 3.4), a quantitative protein marker (see Section 4.2 in Chapter 4) and mass
spectrometry (see Section 3.4.4).
3.5.1. Mass Spectrometry on LigA and LigB.
Despite knowing the molecular weight of LigA and LigB proteins known on the NCBI database
or SDS gel, the determination of molecular mass is needed to confirm the enzymes were pure
and correct proteins and correct mass. The LigA from purification strategy1 and the LigB from
purification strategy2 were used for mass spectrometry to check their molecular mass. A
sample of each ligase was run on a SDS gel and stained in a clean plastic dish for few hours
(see Section 2.2.22). The DNA ligases for LigA and LigB were sliced on the gel and sent to
Leeds University to check the amino acids sequence and molecular mass. Figure 3.17A shows
10% (w/v) SDS gel of native LigA and LigB, which stained with special stain called Instant
Blue (Expendeon), includes three lanes. Successfully the results were sent back by spreadsheet
and then checked for each protein (LigA and LigB) accuracy and they were correct (see Figure
3.17B and C). the full results of LigA and LigB are given in Appendix 3.1 and 3.2, and these
show all the small fragments of each polypeptide and how these match sequence.
3.5.2. Analytical Ultracentrifugation (AUC) for Native LigA.
Having cloned, expressed and purified LigA and LigB (Section 3.2) and checked the sequence
by mass spectrometry (Section 3.4.4). The correct shape and fold of native LigA (but not native
LigB) was tested by AUC.
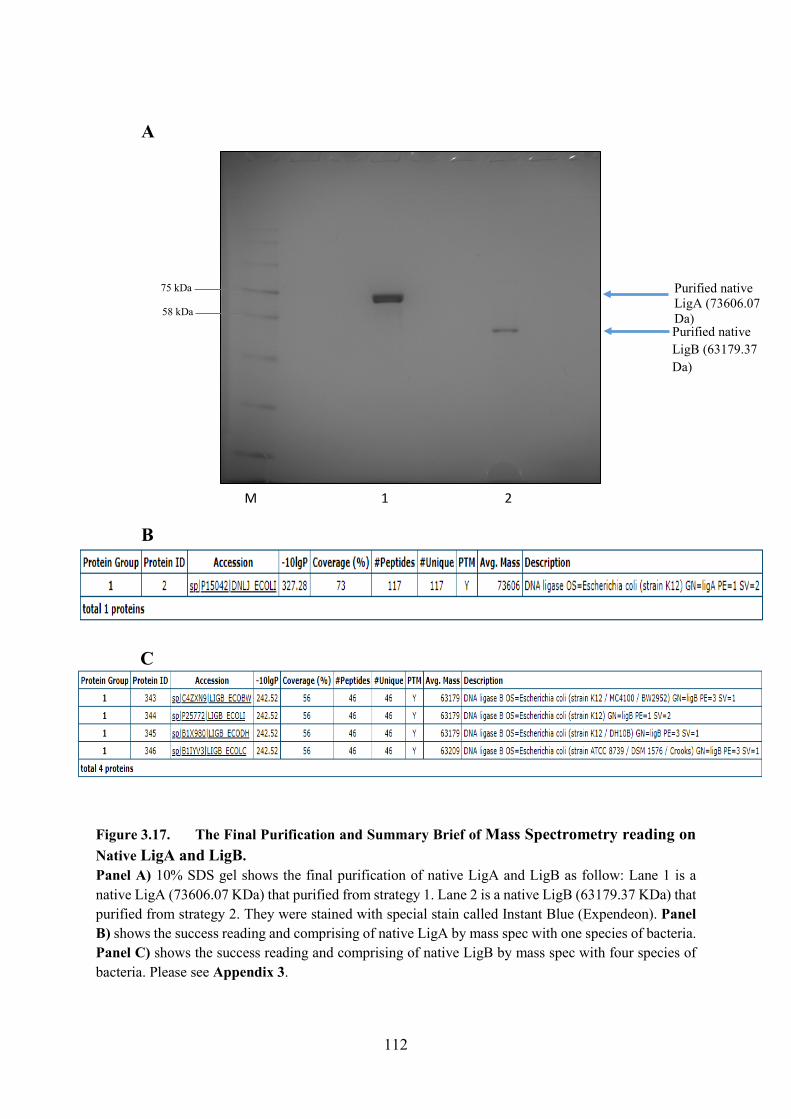
112
Figure 3.17. The Final Purification and Summary Brief of Mass Spectrometry reading on Native LigA and LigB. Panel A) 10% SDS gel shows the final purification of native LigA and LigB as follow: Lane 1 is a native LigA (73606.07 KDa) that purified from strategy 1. Lane 2 is a native LigB (63179.37 KDa) that purified from strategy 2. They were stained with special stain called Instant Blue (Expendeon). Panel B) shows the success reading and comprising of native LigA by mass spec with one species of bacteria. Panel C) shows the success reading and comprising of native LigB by mass spec with four species of bacteria. Please see Appendix 3.
M 21
75 kDa
58 kDa
A
B
C
Purified native LigA (73606.07 Da)Purified native LigB (63179.37 Da)
113
To determine the shape, molecular mass distribution (c(S)) and the size of native LigA,
A Beckman Optima XL-A analytical ultracentrifuge (Beckman-Coulter, Palo Alto, CA) was
used for sedimentation equilibrium experiment for LigA protein. The total molecular weights
of LigA proteins in the present study were 73,606.07 Da (NCBI). The partial specific volume
(ῡ) of LigA protein was estimated using Sednterp as 0.743 mL/g (Laue et al., 1992). All
stoichiometries are indicated assuming that LigA is monomeric. Two-sections of AUC cell
were used for each sample. Each cell contained 400 µL of AUC buffer that contains 30 mM
Tris-HCl (pH 8.0), 4 mM MgCl2, 1 mM DTT, 26 µM NAD+, 3% (v/v) glycerol and 425 µL of
AUC buffer + ~2 µM LigA in the appropriate sectors of each cell.
Each assembly contained a centrepiece with a 12 mm optical path length. The rotor was
accelerated to 21000 to 28000 rpm and radial scans were recorded at 10-minute time-points.
The temperature that used in this study was set at 15ºC. Figure 3.18A shows 150 recorded
radial scans, in which migration of the LigA protein moved down the cell due to the high
gravity field (acceleration applied). Figure 3.18B shows the measurement of the residuals to
the fit for each of the 150 fits. These show how well the data were fit and the nearly straight
line shows this was a good data set. Figure 3.18C shows a plot of the sedimentation coefficients
(s) calculated from the radial scans. The S value is defined as the sedimentation velocity divided
by the gravity field (s = vt/a). Most LigA molecules had an S value of 3.0, which gave a
molecular mass of 69,110 Da (see the top of peak).
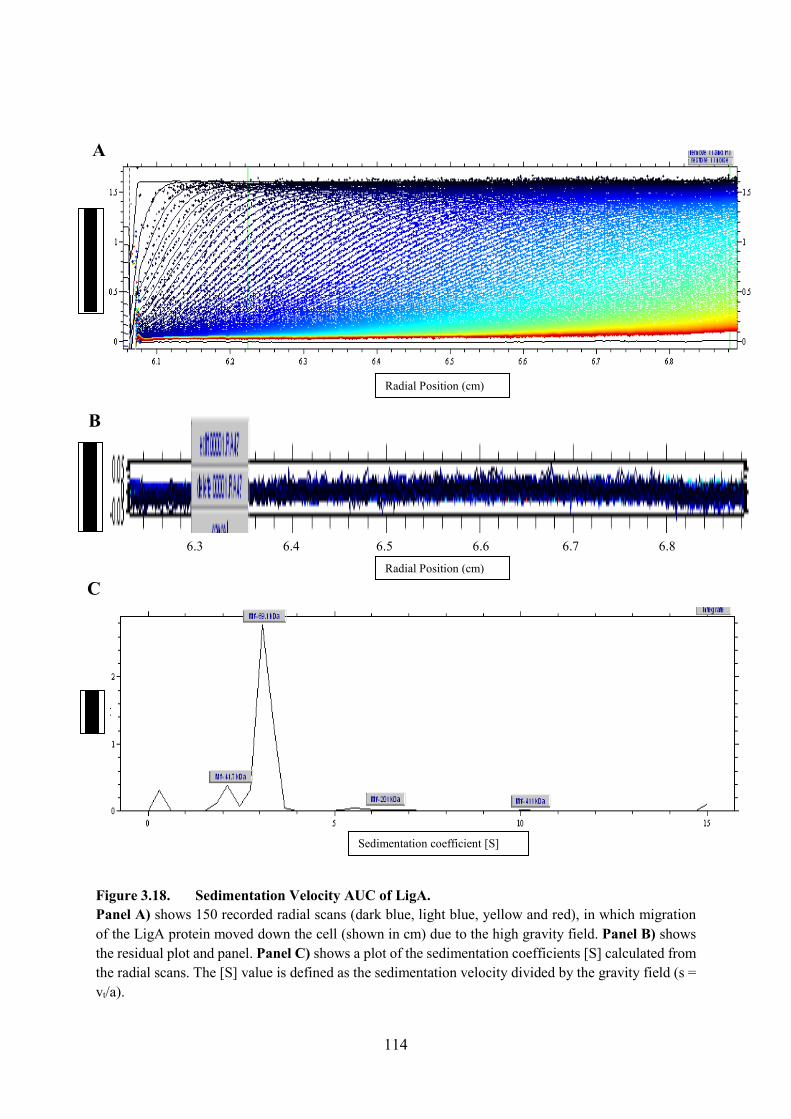
114
Figure 3.18. Sedimentation Velocity AUC of LigA. Panel A) shows 150 recorded radial scans (dark blue, light blue, yellow and red), in which migration of the LigA protein moved down the cell (shown in cm) due to the high gravity field. Panel B) shows the residual plot and panel. Panel C) shows a plot of the sedimentation coefficients [S] calculated from the radial scans. The [S] value is defined as the sedimentation velocity divided by the gravity field (s = vt/a).
A
B
Radial Position (cm)
Sedimentation coefficient [S]
Res
idua
l A28
0
C
6.3 6.4 6.5 6.6 6.7 6.8
Radial Position (cm)
c(S)
Abs
orba
nce
A28
0
115
3.6. Discussion and Conclusions
The work in this chapter has shown that the genes for LigA, LigB and LigB His-tag were
successfully cloned into pET28b and pET29c vectors that was purchased from Gene Art
(GeneArt, Life Technologies. Fisher Scientific). The genes for LigA and LigB were first
attempted to be cloned by PCR using fusion enzyme on E.coli K12, but this was unsucessful
because the end postion of the primer (forward and reverse) that was used to clone native LigA
and LigB did not have the end site of NdeI enzyme, but was worth to check the cloning by
PCR.
The colony PCR for pET28b vector that was used for cloning LigB His-tag was faster
and easier than pET29c, because pET28b vector had NdeI and BamHI-cut in the end of the
vector and the genes, which was called LigB bidirectional. The cloning of native LigA and
LigB that used pET29c was challenging during undertaking colony PCR, and the reason was
that pET-29c had just NdeI site at either end of the plasmid and genes (unidirectional cloning),
which gave non-directional insertion, and obtained high chance to ligate the plasmid without
the insert gene because some of them had wrong direction.
The expression of native LigA in competent cell E.coli BL21 (DE3) by adding 1 mM
IPTG gave high amount of expressed LigA and has shown to be mostly soluble in the water ~
37 µM n 1 ml. However, the expression for native LigB was shown to be completely insoluble.
The positive solubility of native LigA and the high amount of expressed LigA allowed us to
use different column. The purification of native LigA was carried out by using two strategies
(1 and 2) (see Section 3.4). The activity assay for purified LigA showed very potent ligation
by using strategy 1 and 2 as showing in Chapter 4, and there was no different activity by
comparing between these two stratgeies to purify native LigA.
The negative solubility and small amount of expressed native LigB were a hard
challenge which led us to use different way and method to make LigB soluble. The solubility
116
of expressed native LigB protein in NaCl and TritonX-100 and refolding native LigB protein
experiments did not gave any soluble native LigB (see Section 3.3.3, 3.3.4 and 3.3.5). At this
stage new two strategies were tried for LigB. Firstly, in which the incubation temperature for
induction was decreased from 37ºC to 17ºC and left for ~17 hours. IPTG was added at OD600
0.60 and after 17 hours was about 1.50-2.00. Secondly, whilst doing the first strategy, LigB
were cloned again via using different plasmid (pET28b) that contained a His-tag cloning
sequence, to give LigB His-tag to increase the chance to get it maybe soluble.
Successfully the native LigB protein and LigB His-tag were expressed and obtained
soluble by using these two strategies. Unfortunately, the purification of LigB His-tag using
HisTrap column (see Section 2.2.17 in materials and methods) was not successful, but the
native LigB induced at 17ºC was purified using HiTrap heparin column. The comparative study
of the activity assay of native LigA and LigB are compared in Chapter 4 (next Chapter), and
the results showed that native LigA was faster than native LigB, but native LigB was tighter
than LigA by doing kinetic and binding experiments. More discussion with other studies was
added in the final discussion in Chapter 7.
117
Chapter 4: Comparative Kinetics and DNA Binding
Studies of Native LigA and Native LigB Having shown in Chapter Three that native LigA and native LigB could be purified, a large set
of kinetics and DNA binding experiments to compare LigA and LigB with each other were
carried out. The main purpose of the work in this chapter was to examine the behaviour of
native LigA and LigB since this has not been reported before. More we know about DNA
ligases enzymes the higher the chance of developing a commercially viable inhibitor which can
stop the advance of antibiotic resistance (Pergolizzi et al., 2015 & Stokes et al., 2011).
4.1. Introduction.
The first section in this Chapter (Section 4.2) explains the development of a nicked
DNA ligation assay. This involved firstly designing and annealing oligonucleotides to make
suitable DNA ligase substrate. This substrate was checked by using a commercial LigA ligase
from NEB and the concentrations of this NEB LigA had to be determined (no commercial stock
of LigB was available). The reason for using NEB LigA was early in the beginning of the
project whilst cloning and purifying LigA and LigB were in progress and the NEB LigA
allowed the development of DNA substrate assay.
In Section 4.3 a number of parameters (cofactors and reaction conditions) were tested
using purified native LigA and LigB to compare these two ligases against each other. This
include finding the Vmax and Km for these enzymes under many different reaction conditions.
These include changes in [DNA], [NAD+], Temperature, [NMN] and [NH4SO4]. The Km values
measured for [DNA] and [NAD+] correspond to real Km values, for [NMN] an IC50 value was
measured and for [NH4SO4] an apparent Km was measured.
In Section 4.4, Electrophoretic Mobility Shift Assay (EMSA) experiments were carried
out on native LigA and LigB binding to nicked oligodeoplexes. EMSA is considered to be a
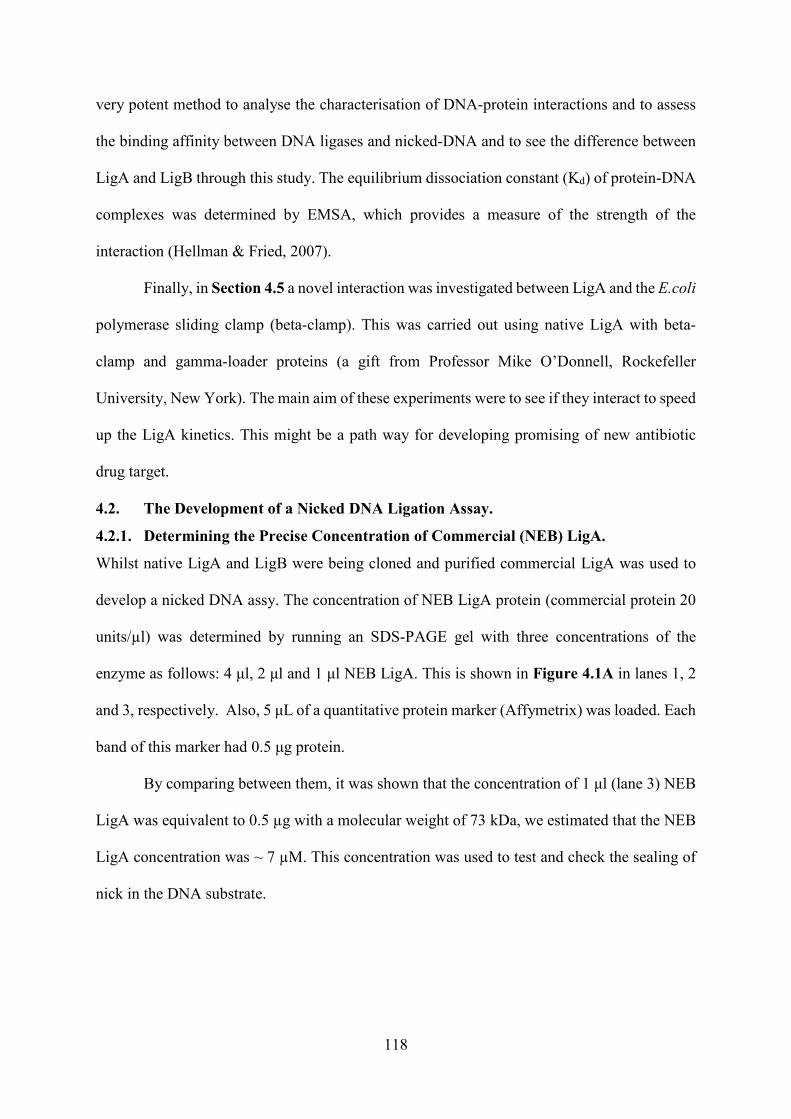
118
very potent method to analyse the characterisation of DNA-protein interactions and to assess
the binding affinity between DNA ligases and nicked-DNA and to see the difference between
LigA and LigB through this study. The equilibrium dissociation constant (Kd) of protein-DNA
complexes was determined by EMSA, which provides a measure of the strength of the
interaction (Hellman & Fried, 2007).
Finally, in Section 4.5 a novel interaction was investigated between LigA and the E.coli
polymerase sliding clamp (beta-clamp). This was carried out using native LigA with beta-
clamp and gamma-loader proteins (a gift from Professor Mike O�Donnell, Rockefeller
University, New York). The main aim of these experiments were to see if they interact to speed
up the LigA kinetics. This might be a path way for developing promising of new antibiotic
drug target.
4.2. The Development of a Nicked DNA Ligation Assay.
4.2.1. Determining the Precise Concentration of Commercial (NEB) LigA.
Whilst native LigA and LigB were being cloned and purified commercial LigA was used to
develop a nicked DNA assy. The concentration of NEB LigA protein (commercial protein 20
units/µl) was determined by running an SDS-PAGE gel with three concentrations of the
enzyme as follows: 4 μl, 2 μl and 1 μl NEB LigA. This is shown in Figure 4.1A in lanes 1, 2
and 3, respectively. Also, 5 μL of a quantitative protein marker (Affymetrix) was loaded. Each
band of this marker had 0.5 μg protein.
By comparing between them, it was shown that the concentration of 1 μl (lane 3) NEB
LigA was equivalent to 0.5 µg with a molecular weight of 73 kDa, we estimated that the NEB
LigA concentration was ~ 7 µM. This concentration was used to test and check the sealing of
nick in the DNA substrate.
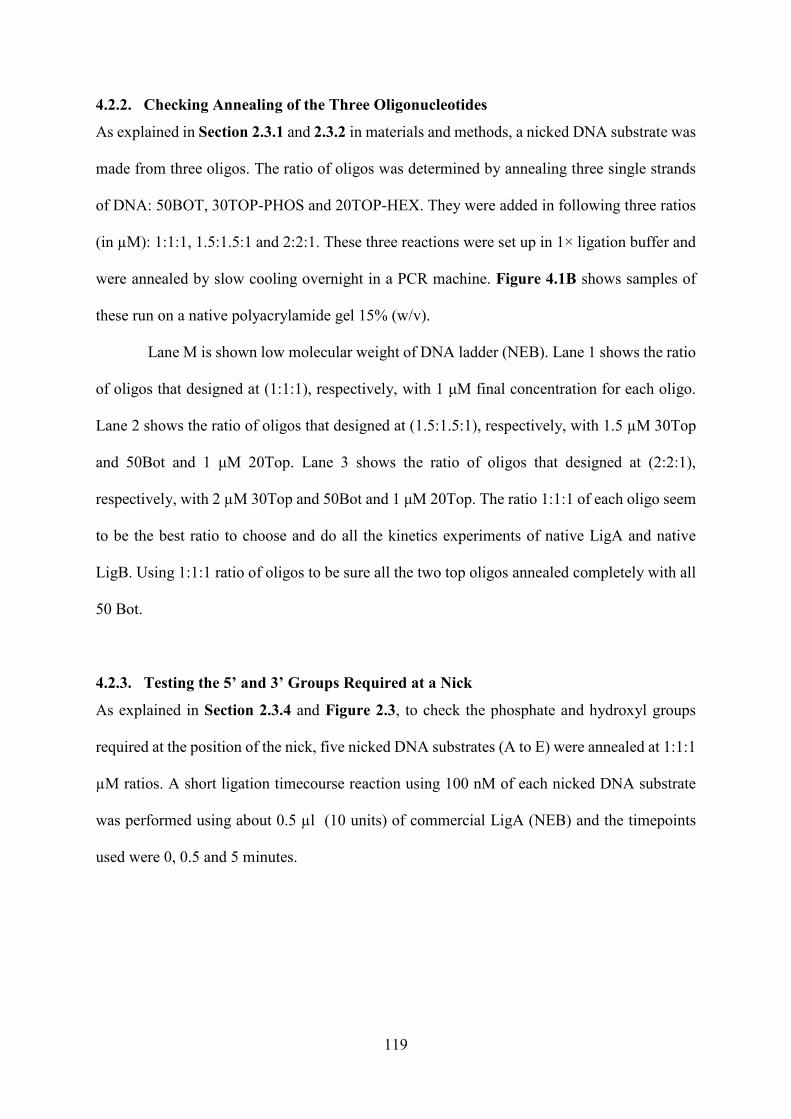
119
4.2.2. Checking Annealing of the Three Oligonucleotides
As explained in Section 2.3.1 and 2.3.2 in materials and methods, a nicked DNA substrate was
made from three oligos. The ratio of oligos was determined by annealing three single strands
of DNA: 50BOT, 30TOP-PHOS and 20TOP-HEX. They were added in following three ratios
(in µM): 1:1:1, 1.5:1.5:1 and 2:2:1. These three reactions were set up in 1× ligation buffer and
were annealed by slow cooling overnight in a PCR machine. Figure 4.1B shows samples of
these run on a native polyacrylamide gel 15% (w/v).
Lane M is shown low molecular weight of DNA ladder (NEB). Lane 1 shows the ratio
of oligos that designed at (1:1:1), respectively, with 1 μM final concentration for each oligo.
Lane 2 shows the ratio of oligos that designed at (1.5:1.5:1), respectively, with 1.5 µM 30Top
and 50Bot and 1 μM 20Top. Lane 3 shows the ratio of oligos that designed at (2:2:1),
respectively, with 2 µM 30Top and 50Bot and 1 μM 20Top. The ratio 1:1:1 of each oligo seem
to be the best ratio to choose and do all the kinetics experiments of native LigA and native
LigB. Using 1:1:1 ratio of oligos to be sure all the two top oligos annealed completely with all
50 Bot.
4.2.3. Testing the 5� and 3� Groups Required at a Nick
As explained in Section 2.3.4 and Figure 2.3, to check the phosphate and hydroxyl groups
required at the position of the nick, five nicked DNA substrates (A to E) were annealed at 1:1:1
µM ratios. A short ligation timecourse reaction using 100 nM of each nicked DNA substrate
was performed using about 0.5 µl (10 units) of commercial LigA (NEB) and the timepoints
used were 0, 0.5 and 5 minutes.
120
Figure 4.1. Determining the Concentration of NEB LigA and the Annealing Reactions Using Different Ratios of Oligos. Panel A) shows 10% (w/v) SDS gel shows different lanes as follow: Lanes M are markers of protein (Affymetrix) with 0.5 µg for each band of protein. Lane 1 is 4 μL E.coli DNA Ligase (NEB). Lane 2 is 2 μL E.coli DNA Ligase (NEB). Lane 3 is 1 μL E.coli DNA Ligase (NEB). Panel B) Native polyacrylamide gel 15% (w/v) shows annealing reactions of oligos using different ratios as follow: Lane M is shown low molecular weight of DNA ladder (NEB). Lane 1 is shown the ratio of oligos that designed at (1:1:1), respectively, with 1 μM final concentration for each oligo. Lane 2 is shown the ratio of oligos that designed at (1.5:1.5:1), respectively, with 1.5 µM 30Top and 50Bot and 1 μM 20Top. Lane 3 is shown the ratio of oligos that designed at (2:2:1), respectively, with 2 µM 30Top and 50Bot and 1 μM 20Top. The red box shows the annealed 50 bp nicked duplex.
1 2 3M
Annealed 50 bp �nicked� DNA
Oligos that had not annealed
50 bp
DNA ligase 73606.07 kDa 50 kDa
M 1 2 3 M
100 kDa
75 kDa
B
A
121
In Figure 4.2A shows five nicked DNA substrates as follow: Substrate A annealed with
50BOT, 30TOP and 20 TOP-HEX. Substrate B annealed with 50BOT, 30TOP-PHOS and 20
TOP-HEX. Substrate C annealed 50BOT-HEX, 30 TOP and 20TOP-HEX. Substrate D was
50BOT-HEX, 30 TOP-PHOS and 20 TOP-HEX. Substrate E set with 50 BOT (Phosphorylated
by PNK enzyme, in the lab), 30 TOP-PHOS and 20 TOP-HEX (see Figure 2.3 in Chapter2).
On these five substrates showed that the substrates with a 5�-phosphate and 3�OH group
are ligated (Substrate B), since the equivalent substrate with a 50 Bot-HEX strand (Substrate
D) showed unclear results. Subsequently the substrates and products migrate through the gel
as single stranded molecules. Thus, the amount of DNA ligation is easily distinguishable as the
distance migrated by the DNA will be dependent on the degree of ligation. Ligated products
where the 20 and 30 base strands have been joined will migrate less distance on the denaturing
gel, compared to just the 20 base strand and the visualisation of the unlighted and ligated
products in the denaturing gel is possible due to the attached fluorescent HEX group.
4.2.4. Testing the Nick-Joining Ligation Activity of Native LigA and LigB.
The two native proteins purified in this study (Chapter 3 (3.4)) were first tested on substrate
B (Figure 2.3). As before, DNA substrate B was made by adding a single stranded �bottom
strand� oligonucleotide of length 50 bases to two �top stranded� oligonucleotides of length 20
and 30 bases, both of which were complementary to adjacent sections of the 50 base bottom
strand. The complementarity between the bottom and top strands positions the two top strands
adjacent to each other in a way such that the 3�-hydroxyl group of the 20 base strand and 5�-
phosphate group of the 30 base strand were exposed at the nick. Figure 4.2B shows the test
activity of native LigA and LigB via using 15% (w/v) denaturing gel.
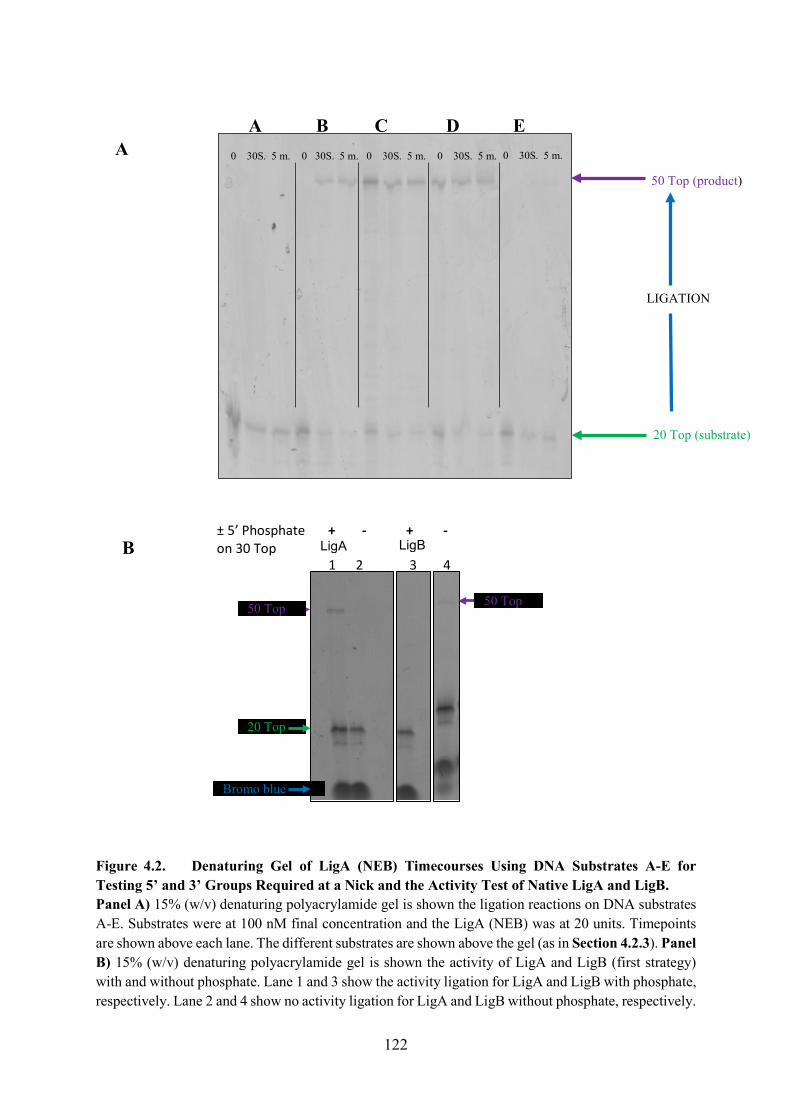
122
Figure 4.2. Denaturing Gel of LigA (NEB) Timecourses Using DNA Substrates A-E for Testing 5� and 3� Groups Required at a Nick and the Activity Test of Native LigA and LigB. Panel A) 15% (w/v) denaturing polyacrylamide gel is shown the ligation reactions on DNA substrates A-E. Substrates were at 100 nM final concentration and the LigA (NEB) was at 20 units. Timepoints are shown above each lane. The different substrates are shown above the gel (as in Section 4.2.3). Panel B) 15% (w/v) denaturing polyacrylamide gel is shown the activity of LigA and LigB (first strategy) with and without phosphate. Lane 1 and 3 show the activity ligation for LigA and LigB with phosphate, respectively. Lane 2 and 4 show no activity ligation for LigA and LigB without phosphate, respectively.
50 Top (product)
20 Top (substrate)
LIGATION
LigA LigB± 5� Phosphate + - + -on 30 Top
50 Top
20 Top
Bromo blue
1 2 3 4
50 Top
B
0 30S. 5 m. 0 30S. 5 m. 0 30S. 5 m. 0 30S. 5 m.0 30S. 5 m.
A B C D EA
123
Once a solution containing nicked DNA substrate of 100 nM and LigA or LigB of the
requisite concentration were incubated at the appropriate conditions, the nick on the top strand
would be sealed by the proteins. The aliquots taken at specific time points and added to the
stop buffer essentially provides a snapshot of the extent of ligation that occurred over a defined
duration. During electrophoresis of the aliquots, the denaturing gel (that has urea) disrupts the
double-strand structure of the DNA and causes it to unfold into a linear chain.
4.3. Kinetics of Native LigA and LigB on Different Reaction Cofactors, Conditions and
Temperature.
In this section the concentration of five different parameters were tested to determine the
parameters Vmax and Km. These were [DNA], [NAD+], Temperature, [NMN] and [NH4SO4].
Kinetic assays on LigA and LigB were carried out in 1× Ligase reaction buffer. The
concentration of nicked oligoduplex was 100 nM in most experiments, save for those in which
this was varied between 5-100 nM. Reactions were also supplemented with various cofactors
(Sigma-Aldrich, UK) depending on each experiment: NAD+ (from 0 to 25 µM), NMN
(nicotinamide mononucleotide, from 0 to 400 µM) or NH4SO4 (from 0 to 10 mM).
Each timecourse (50 µl) contained nicked oligoduplex Substrate 2 (see Figure 4.2 above),
1× Ligase buffer, the requisite cofactor(s) and 30 nM of either LigA or LigB (first strategy of
purification). Experiments were routinely conducted at 15ºC or 16ºC, though for one subset of
experiments, the reaction temperature was varied between 5 and 35ºC. Timepoints (~7 µl) were
taken at regular intervals over one or two hours and added to 6 µl Stop buffer (80% (v/v)
deionised formamide, 10 mM EDTA, 2 mM NaOH and 0.4% (v/v) bromophenol blue).
4.3.1. Varying [DNA] Substrate.
In order to characterise the kinetic behaviour of LigA and LigB at varying DNA substrate
concentrations, ligation was carried out at substrate concentrations ranging from 5 nM to 100
nM.
124
For LigA the varying DNA substrate was 5, 10, 30, 60, 80 and 100 nM. Figure 4.3A
shows 15% (w/v) denaturing gel used to analyse the time course samples of LigA activity with
100 nM of [DNA] as an example for all the substrates and cofactors, to catalyse the nicked
DNA into ligated DNA. Fig 4.3B shows the raw and corrected data percentage of substrate
(%/min, in this thesis (nM/min)) converted product which were determined from band intensity
analyse by using ImageJ and Excel programme. Fig 4.3C is a graph showing the percentage
average of 20mer substrate Vs 50mer product by plotted just the correct data of 50mer (to get
the initial rate (V0) of 50mer fixed DNA at between 20-30% of the reaction).
Figure 4.4A shows a 15% (w/v) denaturing gel with eight timepoints at a DNA
substrate concentration of 100 nM as an example of a lots of denaturing gels. All the gels
corresponding to the experiments of varying [DNA] substrate are shown in Appendix 4.1, 2
and 3. The band intensity of free DNA (20Top) and the nicked DNA (50Top) were analysed
using ImageJ and plotted in the Excel programme to get the V0 for each timecourse of DNA
substrate. For LigA and LigB, optimal nick joining activity was observed between 0.8 and 0.1
µM. Figure 4.4B shows the corrected data of the initial rate (V0) for all the varying DNA
substrate against the time by using the single exponential fit in GraFit programme.
Figure 4.4C shows a graph that plotted of initial rate for all varying DNA substrate,
which contained the Vmax and the Km (Michaelis-Menten kinetics, Section 1.7). The Vmax
obtained by plotting the initial rate against varying DNA substrate concentrations was nM/min
and the Km (the [DNA] substrate that given half Vmax rate), was nM. The kcat (turnover number)
was min-1. The Vmax was 62.10±8.56 nM/min and Km was 12.22±6.42 nM. The kcat was 2.07
min-1.
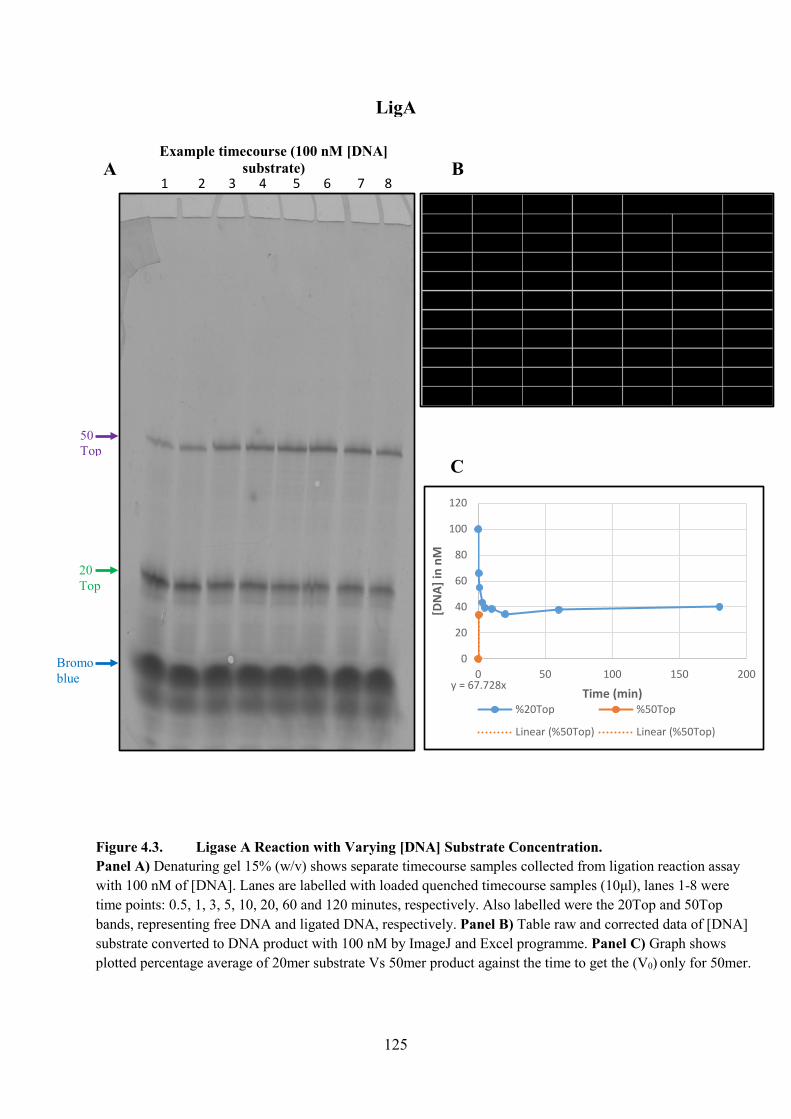
125
Figure 4.3. Ligase A Reaction with Varying [DNA] Substrate Concentration. Panel A) Denaturing gel 15% (w/v) shows separate timecourse samples collected from ligation reaction assay with 100 nM of [DNA]. Lanes are labelled with loaded quenched timecourse samples (10μl), lanes 1-8 were time points: 0.5, 1, 3, 5, 10, 20, 60 and 120 minutes, respectively. Also labelled were the 20Top and 50Top bands, representing free DNA and ligated DNA, respectively. Panel B) Table raw and corrected data of [DNA] substrate converted to DNA product with 100 nM by ImageJ and Excel programme. Panel C) Graph shows plotted percentage average of 20mer substrate Vs 50mer product against the time to get the (V0) only for 50mer.
1 2 3 4 5 6 7 8A B
C
Example timecourse (100 nM [DNA] substrate)
20Top
50 Top
Bromo blue y = 67.728x
0
20
40
60
80
100
120
0 50 100 150 200
[DN
A] in
nM
Time (min)%20Top %50Top
Linear (%50Top) Linear (%50Top)
LigA
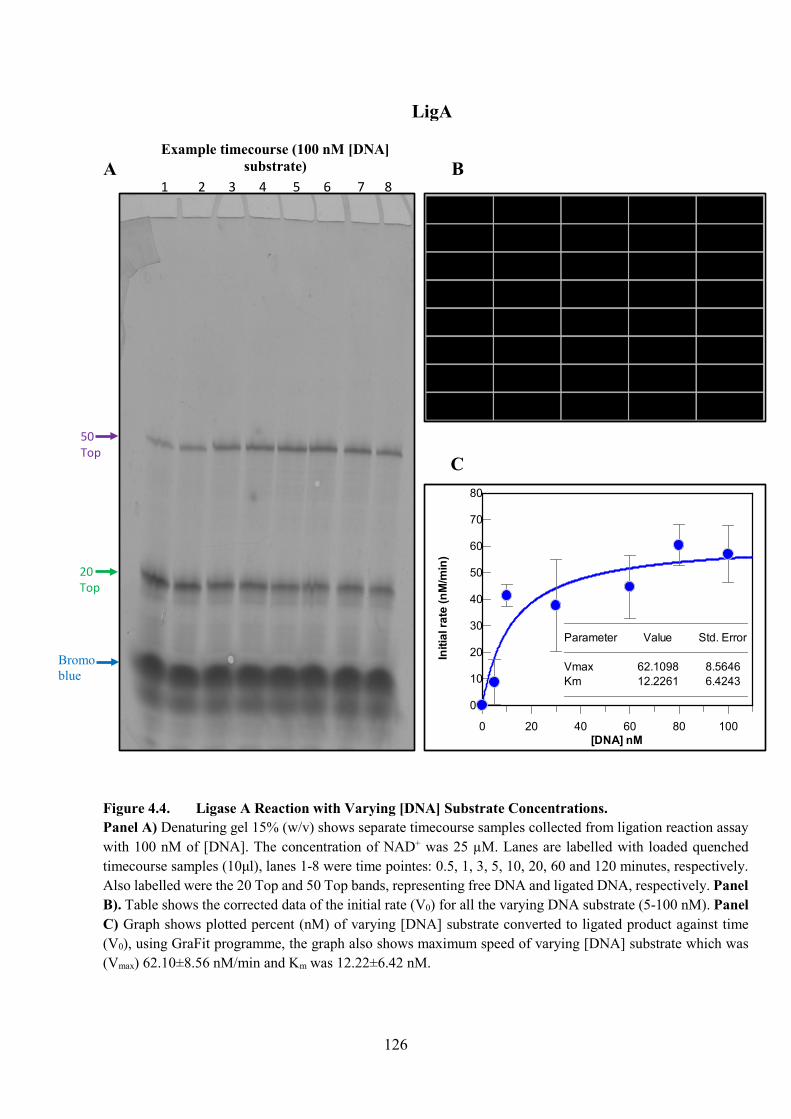
126
Figure 4.4. Ligase A Reaction with Varying [DNA] Substrate Concentrations.Panel A) Denaturing gel 15% (w/v) shows separate timecourse samples collected from ligation reaction assay with 100 nM of [DNA]. The concentration of NAD+ was 25 µM. Lanes are labelled with loaded quenched timecourse samples (10μl), lanes 1-8 were time pointes: 0.5, 1, 3, 5, 10, 20, 60 and 120 minutes, respectively. Also labelled were the 20 Top and 50 Top bands, representing free DNA and ligated DNA, respectively. Panel B). Table shows the corrected data of the initial rate (V0) for all the varying DNA substrate (5-100 nM). Panel C) Graph shows plotted percent (nM) of varying [DNA] substrate converted to ligated product against time (V0), using GraFit programme, the graph also shows maximum speed of varying [DNA] substrate which was (Vmax) 62.10±8.56 nM/min and Km was 12.22±6.42 nM.
1 2 3 4 5 6 7 8A B
C
20 Top
50Top
0 20 40 60 80 100
0
10
20
30
40
50
60
70
80
Parameter Value Std. Error
Vmax 62.1098 8.5646Km 12.2261 6.4243
[DNA] nM
Initi
al ra
te (n
M/m
in)
Example timecourse (100 nM [DNA] substrate)
Bromo blue
LigA
127
For LigB, the varying DNA substrate was 5, 10, 30, 60, 80 and 100 nM. Figure 4.5A
shows a 15% (w/v) denaturing gel with eight timepoints at a DNA substrate concentration of
100 nM as an example of twelve of denaturing gels. All the gels corresponding to the
experiments of varying [DNA] substrate are shown in Appendix 4.4, 5 and 6. The band
intensity of free DNA (20Top) and the nicked DNA (50Top) were analysed using ImageJ and
plotted in the Excel programme to get the V0 for each time-course of DNA substrate. Figure
4.5B shows the corrected data of the initial rate (V0) for all the varying DNA substrate by using
the single exponential fit in GraFit programme. Figure 4.5C shows a graph of initial rate for
all varying DNA substrate against the time by using LigB protein, which contained the Vmax
and the Km. The Vmax obtained was 9.73±0.58 nM/min and Km was 3.50±1.34 nM. The kcat
(turnover number) was 0.32 min-1.
4.3.2. Varying [NAD+] Cofactor.
The master solutions of NAD+ were prepared from a different stock of Nicotinamide Adenine
Dinucleotide obtained from Sigma-Aldrich. The NAD+ obtained from Sigma-Aldrich was
initially in powdered form, so the required amount (in grams) needed to make up the stocks
were determined by multiplying the molecular weight of NAD+ with the final volume and the
required molarity. NAD+ is one of the most important cofactor in the ligation process. LigA
requires NAD+ to obtain the AMP group that is used during the mechanism of ligase. Without
the NAD+ the reaction of ligation will be stopped completely (Shuman, 2009). In order to
examine the effect of NAD+, varying concentrations were tested; ligation was performed in the
presence of NAD+ concentrations ranging from 0.1 μM to 25 μM. For LigA the varying NAD+
cofactor was 0.1, 0.5, 1, 5, 10 and 25 µM. Figure 4.6A shows 15% (w/v) denaturing gel with
eight timepoints at a [NAD+] cofactor concentration of 25 µM as an example of twelve of
denaturing gels.
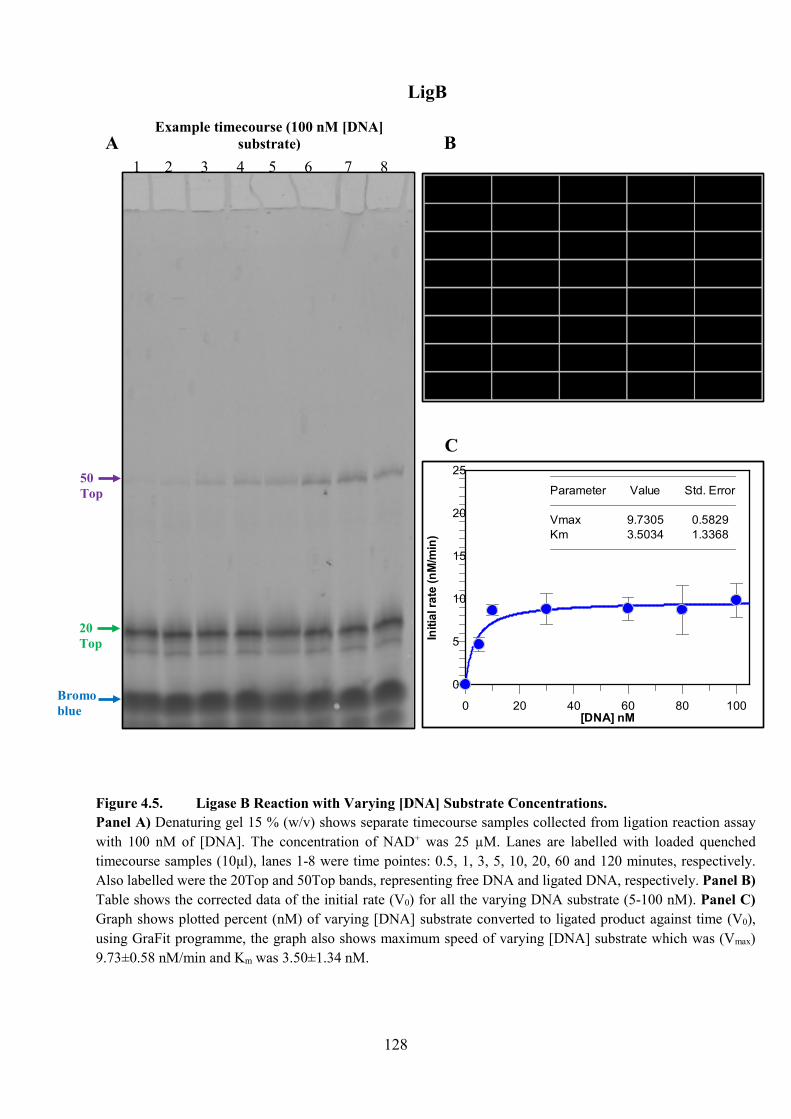
128
Figure 4.5. Ligase B Reaction with Varying [DNA] Substrate Concentrations.Panel A) Denaturing gel 15 % (w/v) shows separate timecourse samples collected from ligation reaction assay with 100 nM of [DNA]. The concentration of NAD+ was 25 µM. Lanes are labelled with loaded quenched timecourse samples (10μl), lanes 1-8 were time pointes: 0.5, 1, 3, 5, 10, 20, 60 and 120 minutes, respectively. Also labelled were the 20Top and 50Top bands, representing free DNA and ligated DNA, respectively. Panel B) Table shows the corrected data of the initial rate (V0) for all the varying DNA substrate (5-100 nM). Panel C) Graph shows plotted percent (nM) of varying [DNA] substrate converted to ligated product against time (V0), using GraFit programme, the graph also shows maximum speed of varying [DNA] substrate which was (Vmax) 9.73±0.58 nM/min and Km was 3.50±1.34 nM.
20Top
1 2 3 4 5 6 7 8
50Top
Bromo blue
B
C
Example timecourse (100 nM [DNA] substrate)A
0 20 40 60 80 100
0
5
10
15
20
25
Parameter Value Std. Error
Vmax 9.7305 0.5829Km 3.5034 1.3368
[DNA] nM
Initi
al ra
te (n
M/m
in)
LigB
129
All the gels corresponding to the experiments of varying [NAD+] cofactor are (for space
reasons) given as high resolution .tif files on the attached CD. The band intensity of free DNA
(20Top) and the nicked DNA (50Top) were analysed using ImageJ and plotted in the Excel
programme to get the V0 for each time-course of NAD+ cofactor. At low NAD+ concentrations,
initial rates rises rapidly until around 25 μM. Figure 4.6B shows the corrected data of the initial
rate (V0) for all the varying NAD+ cofactor by using the single exponential fit in GraFit
programme. Figure 4.6C shows a graph of initial rate for all varying NAD+ cofactor against
the time, which contained the Vmax and the Km. The Vmax was 61.14±3.22 µM/min and Km was
1.55±0.33 µM. The kcat was 2.038 min-1.
For LigB the varying NAD+ cofactor was 0.1, 0.5, 1, 5, 10 and 25 µM. Figure 4.7A
shows 15% (w/v) denaturing gel with eight timepoints at a [NAD+] cofactor concentration of
25 µM as an example of twelve of denaturing gels. All the gels corresponding to the
experiments of varying [NAD+] cofactor are (for space reasons) given as high resolution .tif
files on the attached CD. The band intensity of free DNA (20Top) and the nicked DNA (50Top)
were analysed using ImageJ and plotted in the Excel programme to get the V0 for each time-
course of NAD+ cofactor. At low NAD+ concentrations, initial rates rises rapidly until around
5 μM, where the increase slows down and by around 10 and 25 μM the curve begins to plateau.
Figure 4.7B shows the corrected data of the initial rate (V0) for all the varying NAD+
cofactor by using the single exponential fit in GraFit programme. Figure 4.7C shows a graph
of initial rate for all varying NAD+ cofactor against the time by using LigB protein, which
contained the Vmax and the Km. The Vmax was 15.37±0.52 µM/min and Km was 0.16±0.03 µM.
the kcat was 0.512 min-1.
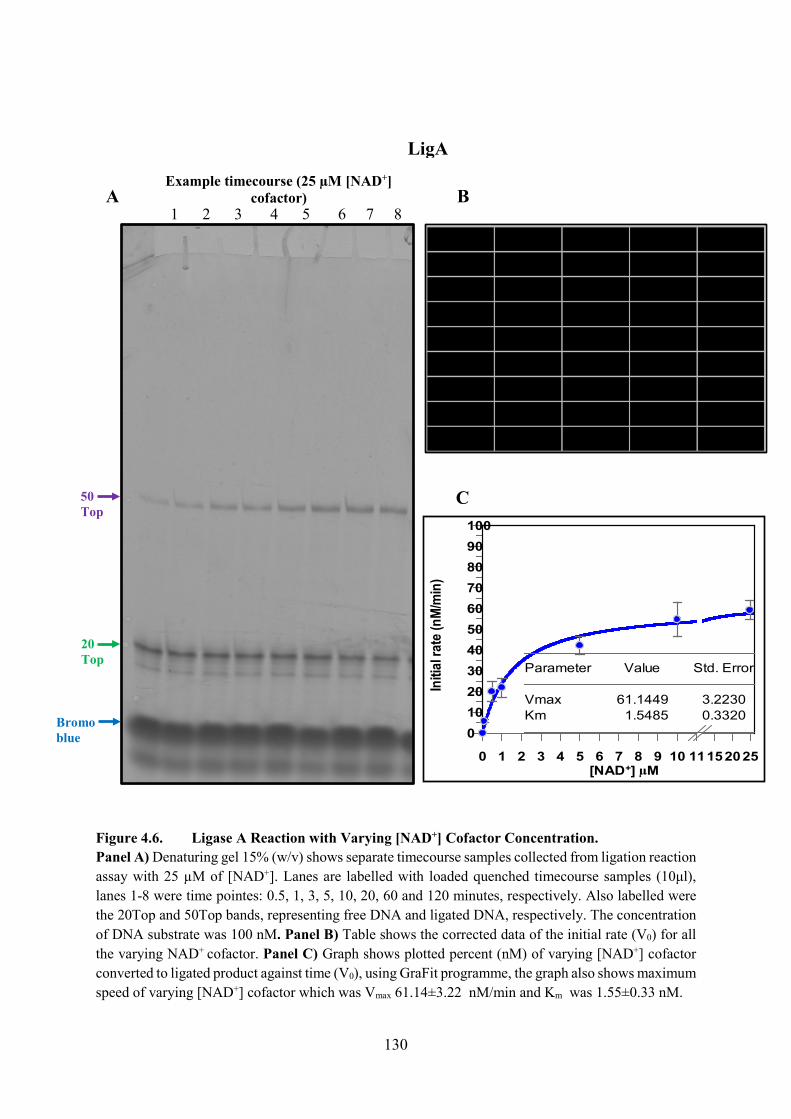
130
Figure 4.6. Ligase A Reaction with Varying [NAD+] Cofactor Concentration.Panel A) Denaturing gel 15% (w/v) shows separate timecourse samples collected from ligation reaction assay with 25 µM of [NAD+]. Lanes are labelled with loaded quenched timecourse samples (10μl), lanes 1-8 were time pointes: 0.5, 1, 3, 5, 10, 20, 60 and 120 minutes, respectively. Also labelled were the 20Top and 50Top bands, representing free DNA and ligated DNA, respectively. The concentration of DNA substrate was 100 nM. Panel B) Table shows the corrected data of the initial rate (V0) for all the varying NAD+ cofactor. Panel C) Graph shows plotted percent (nM) of varying [NAD+] cofactor converted to ligated product against time (V0), using GraFit programme, the graph also shows maximum speed of varying [NAD+] cofactor which was Vmax 61.14±3.22 nM/min and Km was 1.55±0.33 nM.
Example timecourse (25 µM [NAD+] cofactor)
1 2 3 4 5 6 7 8BA
20 Top
50 Top
Bromo blue
C
0 1 2 3 4 5 6 7 8 9 10 11
0102030405060708090100
Parameter Value Std. Error
Vmax 61.1449 3.2230Km 1.5485 0.3320
152025
Initi
al ra
te (n
M/m
in)
[NAD+] µM
LigA
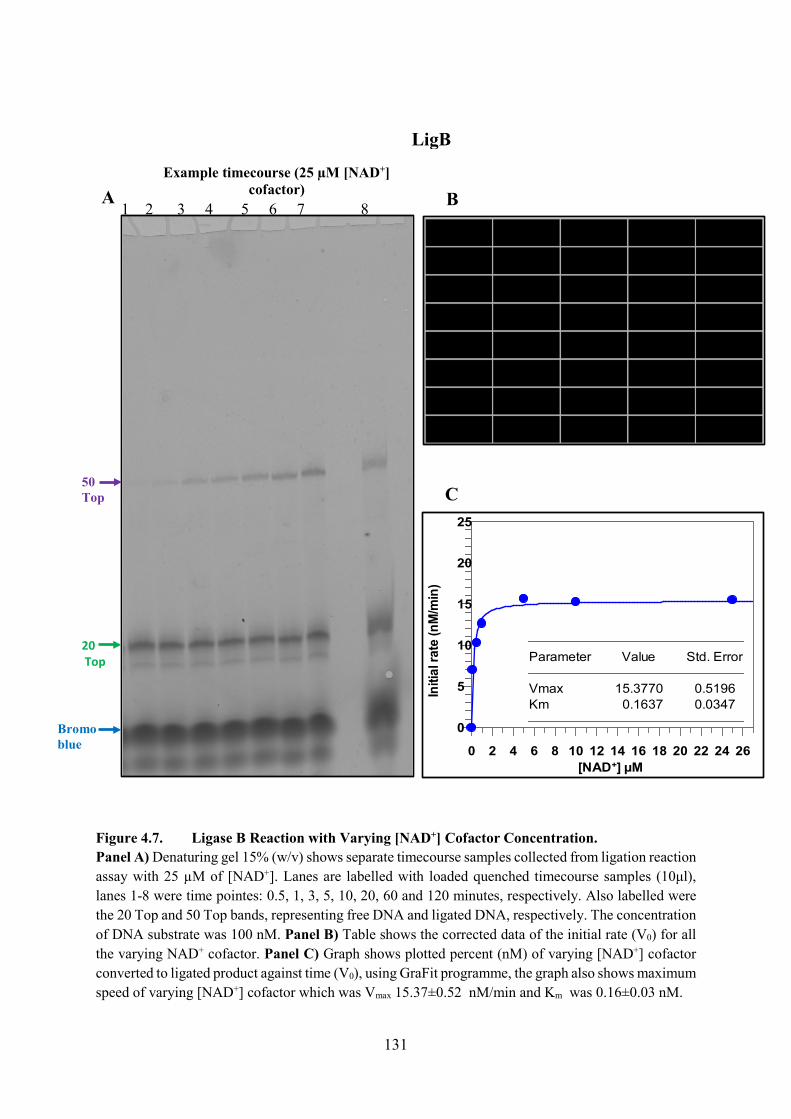
131
Figure 4.7. Ligase B Reaction with Varying [NAD+] Cofactor Concentration.Panel A) Denaturing gel 15% (w/v) shows separate timecourse samples collected from ligation reaction assay with 25 µM of [NAD+]. Lanes are labelled with loaded quenched timecourse samples (10μl), lanes 1-8 were time pointes: 0.5, 1, 3, 5, 10, 20, 60 and 120 minutes, respectively. Also labelled were the 20 Top and 50 Top bands, representing free DNA and ligated DNA, respectively. The concentration of DNA substrate was 100 nM. Panel B) Table shows the corrected data of the initial rate (V0) for all the varying NAD+ cofactor. Panel C) Graph shows plotted percent (nM) of varying [NAD+] cofactor converted to ligated product against time (V0), using GraFit programme, the graph also shows maximum speed of varying [NAD+] cofactor which was Vmax 15.37±0.52 nM/min and Km was 0.16±0.03 nM.
0 2 4 6 8 10 12 14 16 18 20 22 24 26
0
5
10
15
20
25
[NAD+] µM
Initi
al ra
te (n
M/m
in)
Parameter Value Std. Error
Vmax 15.3770 0.5196Km 0.1637 0.0347
Example timecourse (25 µM [NAD+] cofactor)
1 2 3 4 5 6 7 8
20 Top
50 Top
Bromo blue
A
C
B
LigB
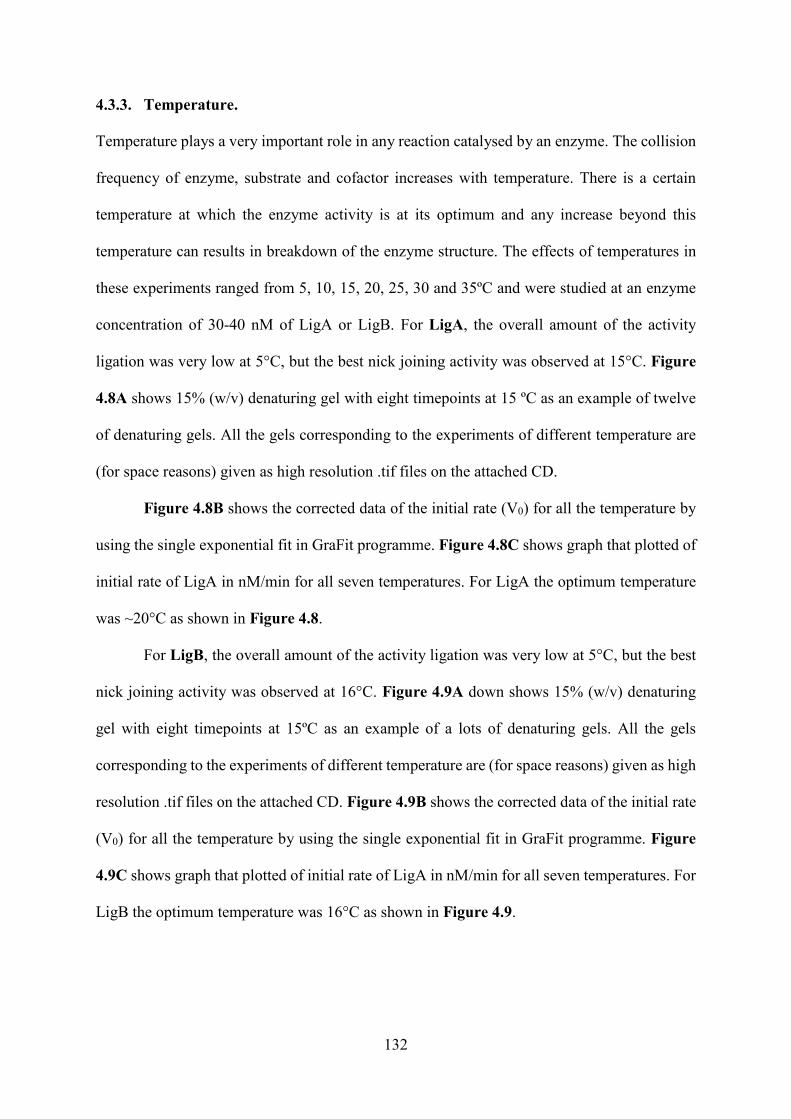
132
4.3.3. Temperature.
Temperature plays a very important role in any reaction catalysed by an enzyme. The collision
frequency of enzyme, substrate and cofactor increases with temperature. There is a certain
temperature at which the enzyme activity is at its optimum and any increase beyond this
temperature can results in breakdown of the enzyme structure. The effects of temperatures in
these experiments ranged from 5, 10, 15, 20, 25, 30 and 35ºC and were studied at an enzyme
concentration of 30-40 nM of LigA or LigB. For LigA, the overall amount of the activity
ligation was very low at 5°C, but the best nick joining activity was observed at 15°C. Figure
4.8A shows 15% (w/v) denaturing gel with eight timepoints at 15 ºC as an example of twelve
of denaturing gels. All the gels corresponding to the experiments of different temperature are
(for space reasons) given as high resolution .tif files on the attached CD.
Figure 4.8B shows the corrected data of the initial rate (V0) for all the temperature by
using the single exponential fit in GraFit programme. Figure 4.8C shows graph that plotted of
initial rate of LigA in nM/min for all seven temperatures. For LigA the optimum temperature
was ~20°C as shown in Figure 4.8.
For LigB, the overall amount of the activity ligation was very low at 5°C, but the best
nick joining activity was observed at 16°C. Figure 4.9A down shows 15% (w/v) denaturing
gel with eight timepoints at 15ºC as an example of a lots of denaturing gels. All the gels
corresponding to the experiments of different temperature are (for space reasons) given as high
resolution .tif files on the attached CD. Figure 4.9B shows the corrected data of the initial rate
(V0) for all the temperature by using the single exponential fit in GraFit programme. Figure
4.9C shows graph that plotted of initial rate of LigA in nM/min for all seven temperatures. For
LigB the optimum temperature was 16°C as shown in Figure 4.9.
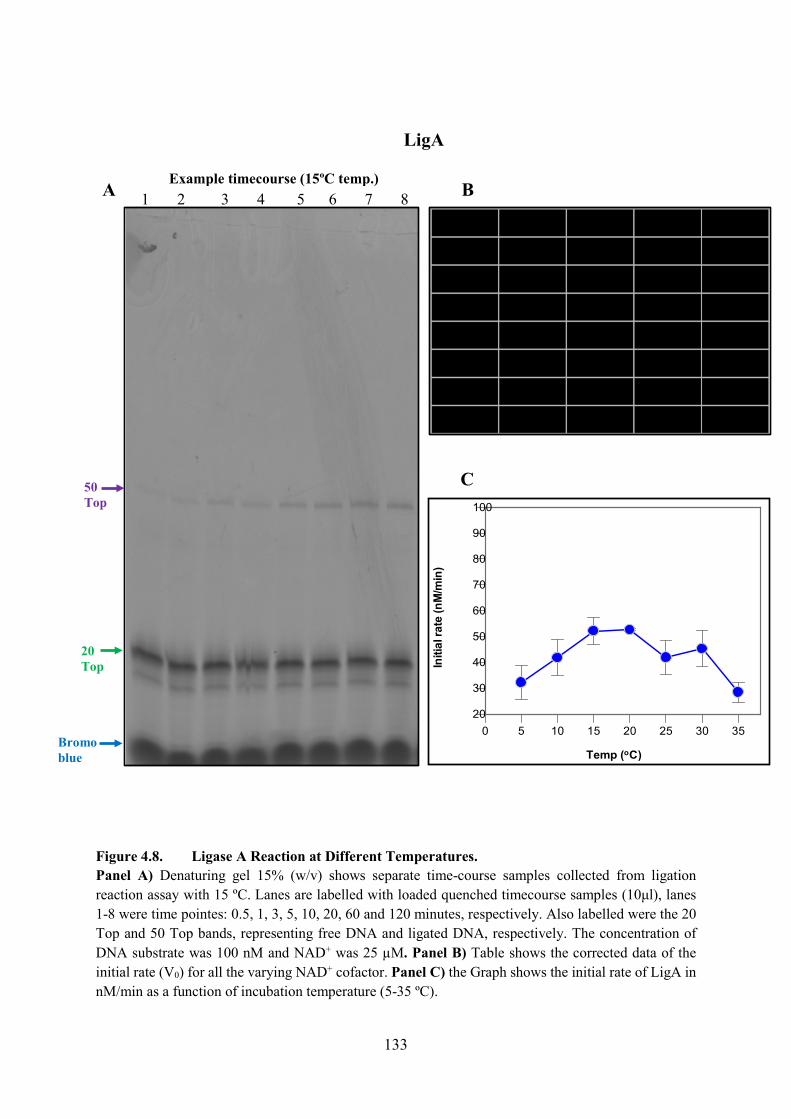
133
Figure 4.8. Ligase A Reaction at Different Temperatures.Panel A) Denaturing gel 15% (w/v) shows separate time-course samples collected from ligation reaction assay with 15 ºC. Lanes are labelled with loaded quenched timecourse samples (10μl), lanes 1-8 were time pointes: 0.5, 1, 3, 5, 10, 20, 60 and 120 minutes, respectively. Also labelled were the 20 Top and 50 Top bands, representing free DNA and ligated DNA, respectively. The concentration of DNA substrate was 100 nM and NAD+ was 25 µM. Panel B) Table shows the corrected data of the initial rate (V0) for all the varying NAD+ cofactor. Panel C) the Graph shows the initial rate of LigA in nM/min as a function of incubation temperature (5-35 ºC).
1 2 3 4 5 6 7 8 A BExample timecourse (15ºC temp.)
20 Top
50 Top
Bromo blue
C
Temp (oC)
0 5 10 15 20 25 30 35
Initi
al ra
te (n
M/m
in)
20
30
40
50
60
70
80
90
100
LigA
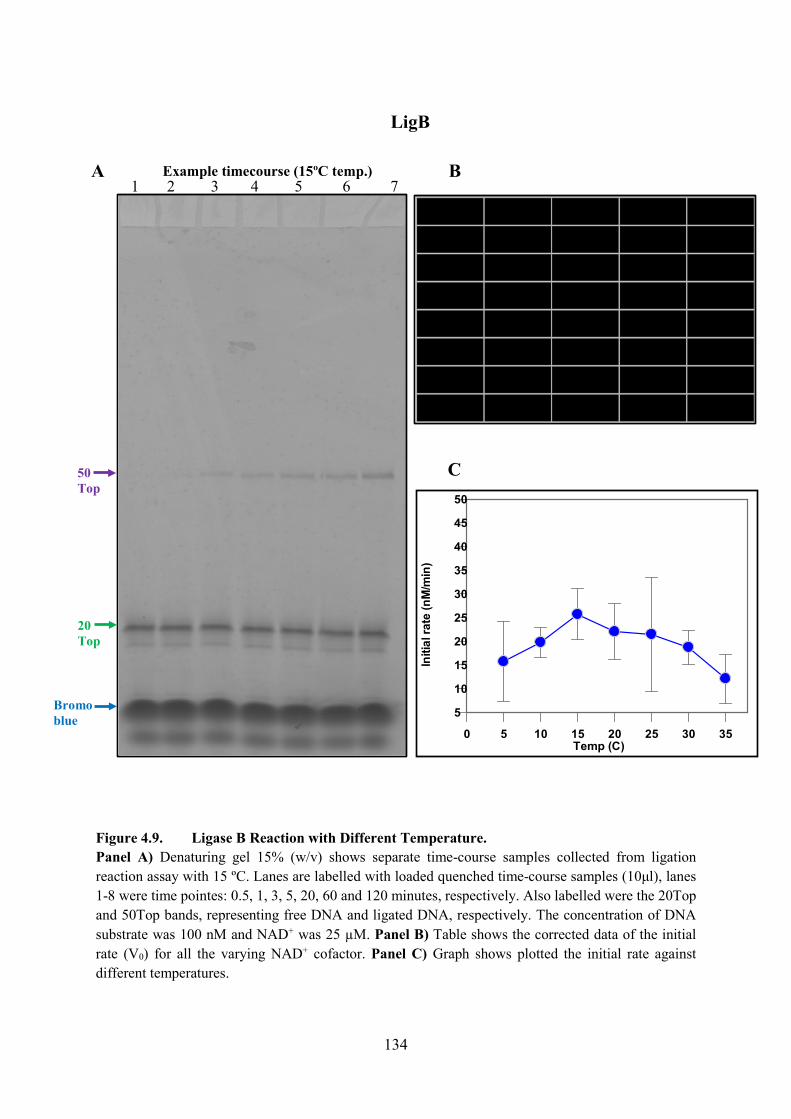
134
Figure 4.9. Ligase B Reaction with Different Temperature.Panel A) Denaturing gel 15% (w/v) shows separate time-course samples collected from ligation reaction assay with 15 ºC. Lanes are labelled with loaded quenched time-course samples (10μl), lanes 1-8 were time pointes: 0.5, 1, 3, 5, 20, 60 and 120 minutes, respectively. Also labelled were the 20Top and 50Top bands, representing free DNA and ligated DNA, respectively. The concentration of DNA substrate was 100 nM and NAD+ was 25 µM. Panel B) Table shows the corrected data of the initial rate (V0) for all the varying NAD+ cofactor. Panel C) Graph shows plotted the initial rate against different temperatures.
1 2 3 4 5 6 7 A Example timecourse (15ºC temp.) B
Temp (C)0 5 10 15 20 25 30 35
5
10
15
20
25
30
35
40
45
50
Initi
al ra
te (n
M/m
in)
20Top
50 Top
Bromoblue
C
LigB

135
4.3.4. Varying [NMN]
A master solution of NMN was prepared from a different stock nicotinamide mononucleotide
(NMN). NMN was obtained from Sigma-Aldrich in a powdered form and the required amount
(grams) needed to make the stock was determined by the same calculation as the one used
above for NAD+. NMN experiments were only conducted for LigA not LigB, because the
difficult and limited solubility of LigB prep. The varying NMN was 25, 50, 100, 200 and 400
µM and the concentration of DNA substrate was 100 nM. Figure 4.10A shows a 15% (w/v)
denaturing gel with eight timepoints at a [NMN] cofactor concentration of 400 µM as an
example of a lots of denaturing gels. All the gels corresponding to the experiments of varying
[NMN] cofactor are (for space reasons) given as high resolution .tif files on the attached CD.
The band intensity of free DNA (20Top) and the nicked DNA (50Top) were analysed using
ImageJ and plotted in the Excel programme to get the V0 for each time-course of NMN.
Increasing NMN concentrations does have an effect on LigA, as the rate of ligation catalysed
by LigA shows an overall decrease.
The NMN appears to inhibit the ligase reaction. Initially the rate decreases sharply
between 0 and 50 μM. At higher NMN concentrations up to 400 µM of NMN the increase in
inhibition is less rapid. Figure 4.10B shows the corrected data of the initial rate (V0) for all the
varying NMN concentrations by using the single exponential fit in GraFit programme. Figure
4.10C shows a graph of initial rate against NMN concentration. Because these data showed
inhibition of LigA, it was fitted in GraFit using an IC50 inhibition equation. This equation gives
three parameters: Yrange (the difference in initial rate between theoretical maximum and
minimum), IC50 (the concentration of NMN that given a half-maximal inhibition
concentration), slope factor (the angle of the curve). From Figure 4.x the Yrange for NMN was
13.89±0.56 µM/min, and the inhibition IC50 was 31.34±1.56 µM.

136
Figure 4.10. Ligase A Reaction with Varying NMN ConcentrationsPanel A) Denaturing gel 15% (w/v) shows separate timecourse samples collected from ligation reaction assay with [NMN] at 200 µM. Lanes are labelled with loaded quenched timecourse samples (10μl), lanes 1-7 were time pointes: 0.5, 1, 3, 5, 10, 30 and 60 minutes, respectively. Also labelled were the 20Top and 50Top bands, representing free DNA and ligated DNA, respectively. The concentration of DNA substrate was 100 nM and NAD+ was 25 µM. Panel B) Table shows the corrected data of the initial rate (V0) for all the varying NMN. Panel C) shows a graph of initial rate against NMN, Yrange is the difference in initial rate between theoretical maximum and minimum, and IC50 is the concentration of NMN that given a half-maximal inhibition concentration. Yrange for NMN that inhibit the LigA protein was 13.89±0.56 µM/min, and the inhibition IC50 was 31.34±1.56 µM.
1 2 3 4 5 6 7 B
[NMN]µM V0 V0 Mean S.E. Mean0 33.02 29.36 31.19 1.8325 27.49 29 28.245 0.75550 12.41 23.94 18.175 5.765
100 22.49 12.27 17.38 5.11200 18.37 17.15 17.76 0.61400 12.8 20.81 16.805 4.005
AExample timecourse (200 µM NMN)
20Top
50 Top
Bromo blue
C
LigA
[NMN] µM0 200 400
0
5
10
15
20
25
30
35
40Parameter Value Std. Error
Y Range 13.8819 0.5564IC 50 31.3494 1.5871Slope factor 5.7950 0.9906Background 17.3085 0.2808
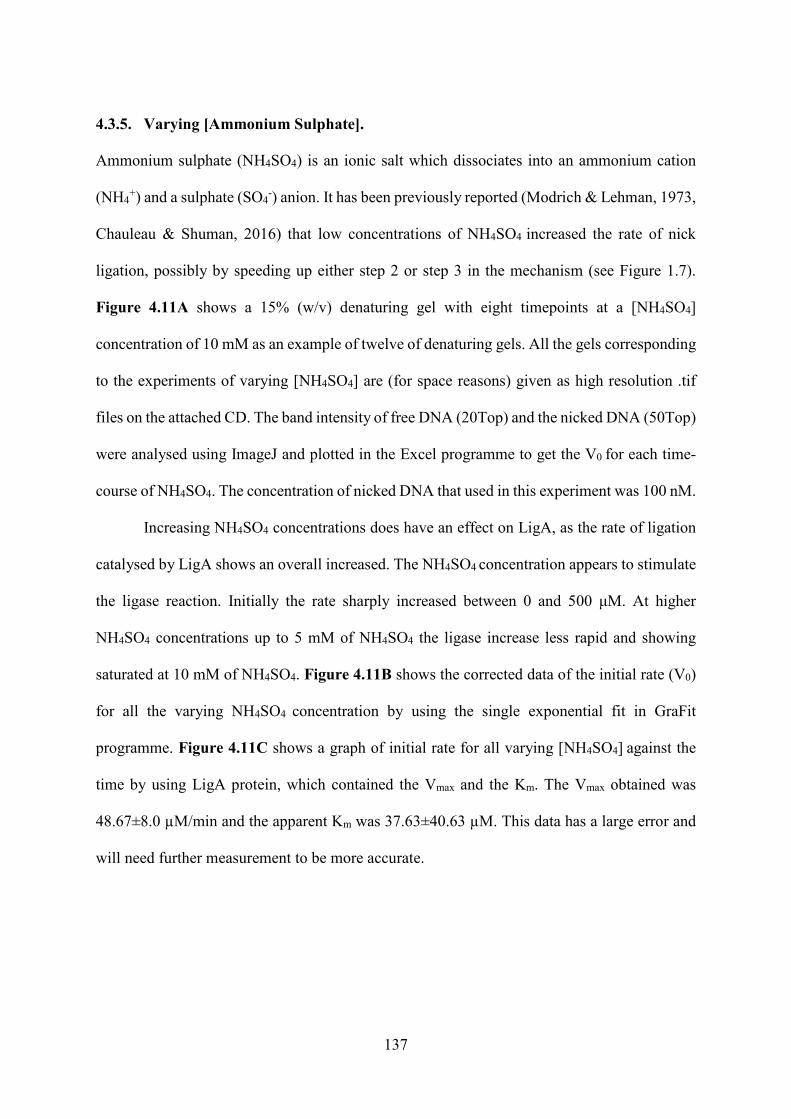
137
4.3.5. Varying [Ammonium Sulphate].
Ammonium sulphate (NH4SO4) is an ionic salt which dissociates into an ammonium cation
(NH4+) and a sulphate (SO4
-) anion. It has been previously reported (Modrich & Lehman, 1973,
Chauleau & Shuman, 2016) that low concentrations of NH4SO4 increased the rate of nick
ligation, possibly by speeding up either step 2 or step 3 in the mechanism (see Figure 1.7).
Figure 4.11A shows a 15% (w/v) denaturing gel with eight timepoints at a [NH4SO4]
concentration of 10 mM as an example of twelve of denaturing gels. All the gels corresponding
to the experiments of varying [NH4SO4] are (for space reasons) given as high resolution .tif
files on the attached CD. The band intensity of free DNA (20Top) and the nicked DNA (50Top)
were analysed using ImageJ and plotted in the Excel programme to get the V0 for each time-
course of NH4SO4. The concentration of nicked DNA that used in this experiment was 100 nM.
Increasing NH4SO4 concentrations does have an effect on LigA, as the rate of ligation
catalysed by LigA shows an overall increased. The NH4SO4 concentration appears to stimulate
the ligase reaction. Initially the rate sharply increased between 0 and 500 μM. At higher
NH4SO4 concentrations up to 5 mM of NH4SO4 the ligase increase less rapid and showing
saturated at 10 mM of NH4SO4. Figure 4.11B shows the corrected data of the initial rate (V0)
for all the varying NH4SO4 concentration by using the single exponential fit in GraFit
programme. Figure 4.11C shows a graph of initial rate for all varying [NH4SO4] against the
time by using LigA protein, which contained the Vmax and the Km. The Vmax obtained was
48.67±8.0 µM/min and the apparent Km was 37.63±40.63 µM. This data has a large error and
will need further measurement to be more accurate.
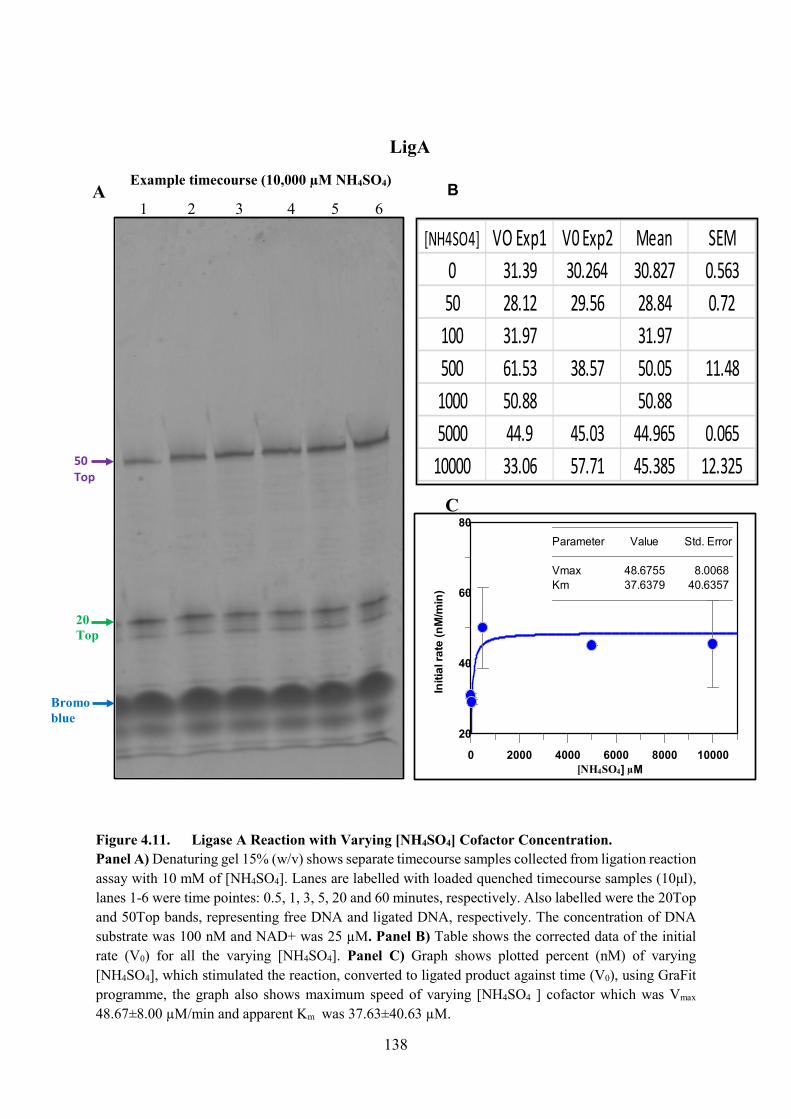
138
Figure 4.11. Ligase A Reaction with Varying [NH4SO4] Cofactor Concentration.Panel A) Denaturing gel 15% (w/v) shows separate timecourse samples collected from ligation reaction assay with 10 mM of [NH4SO4]. Lanes are labelled with loaded quenched timecourse samples (10μl), lanes 1-6 were time pointes: 0.5, 1, 3, 5, 20 and 60 minutes, respectively. Also labelled were the 20Top and 50Top bands, representing free DNA and ligated DNA, respectively. The concentration of DNA substrate was 100 nM and NAD+ was 25 µM. Panel B) Table shows the corrected data of the initial rate (V0) for all the varying [NH4SO4]. Panel C) Graph shows plotted percent (nM) of varying [NH4SO4], which stimulated the reaction, converted to ligated product against time (V0), using GraFit programme, the graph also shows maximum speed of varying [NH4SO4 ] cofactor which was Vmax
48.67±8.00 µM/min and apparent Km was 37.63±40.63 µM.
1 2 3 4 5 6
50 Top
A
C
B
[NH4SO4] VO Exp1 V0 Exp2 Mean SEM0 31.39 30.264 30.827 0.56350 28.12 29.56 28.84 0.72
100 31.97 31.97500 61.53 38.57 50.05 11.481000 50.88 50.885000 44.9 45.03 44.965 0.065
10000 33.06 57.71 45.385 12.325
Example timecourse (10,000 µM NH4SO4)
20 Top
Bromoblue
0 2000 4000 6000 8000 10000
20
40
60
80Parameter Value Std. Error
Vmax 48.6755 8.0068Km 37.6379 40.6357
Initi
al ra
te (n
M/m
in)
[NH4SO4] µM
LigA
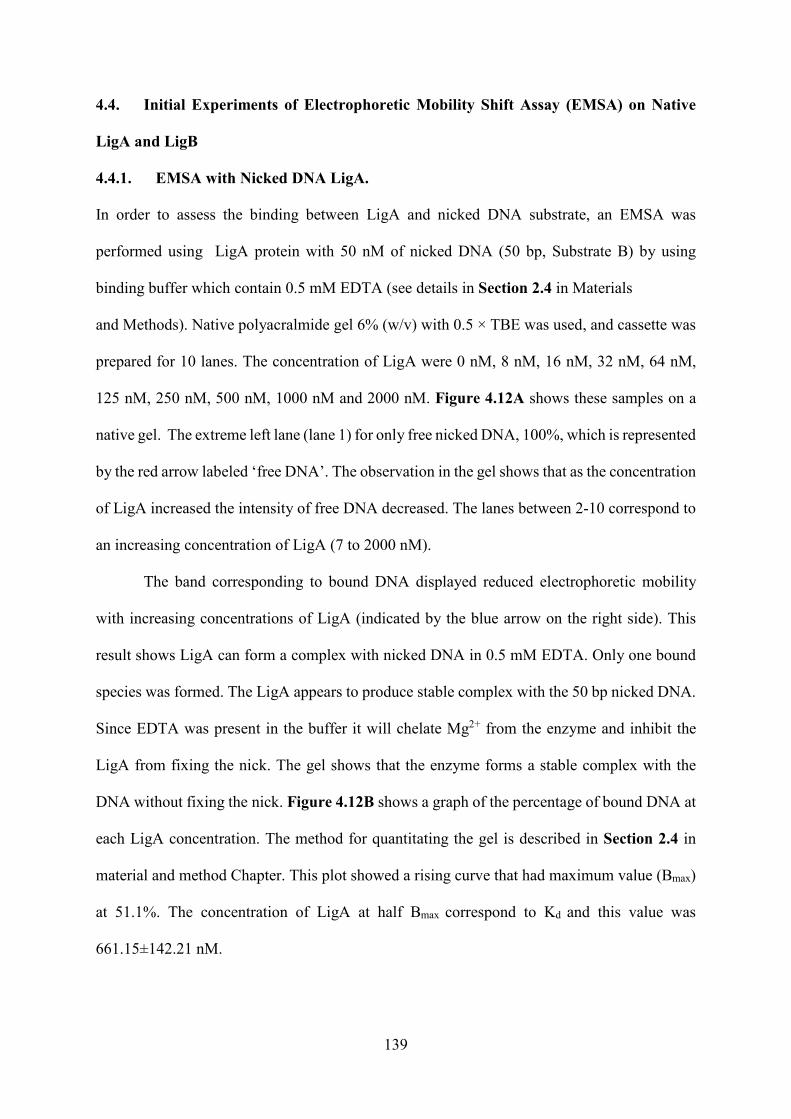
139
4.4. Initial Experiments of Electrophoretic Mobility Shift Assay (EMSA) on Native
LigA and LigB
4.4.1. EMSA with Nicked DNA LigA.
In order to assess the binding between LigA and nicked DNA substrate, an EMSA was
performed using LigA protein with 50 nM of nicked DNA (50 bp, Substrate B) by using
binding buffer which contain 0.5 mM EDTA (see details in Section 2.4 in Materials
and Methods). Native polyacralmide gel 6% (w/v) with 0.5 × TBE was used, and cassette was
prepared for 10 lanes. The concentration of LigA were 0 nM, 8 nM, 16 nM, 32 nM, 64 nM,
125 nM, 250 nM, 500 nM, 1000 nM and 2000 nM. Figure 4.12A shows these samples on a
native gel. The extreme left lane (lane 1) for only free nicked DNA, 100%, which is represented
by the red arrow labeled �free DNA�. The observation in the gel shows that as the concentration
of LigA increased the intensity of free DNA decreased. The lanes between 2-10 correspond to
an increasing concentration of LigA (7 to 2000 nM).
The band corresponding to bound DNA displayed reduced electrophoretic mobility
with increasing concentrations of LigA (indicated by the blue arrow on the right side). This
result shows LigA can form a complex with nicked DNA in 0.5 mM EDTA. Only one bound
species was formed. The LigA appears to produce stable complex with the 50 bp nicked DNA.
Since EDTA was present in the buffer it will chelate Mg2+ from the enzyme and inhibit the
LigA from fixing the nick. The gel shows that the enzyme forms a stable complex with the
DNA without fixing the nick. Figure 4.12B shows a graph of the percentage of bound DNA at
each LigA concentration. The method for quantitating the gel is described in Section 2.4 in
material and method Chapter. This plot showed a rising curve that had maximum value (Bmax)
at 51.1%. The concentration of LigA at half Bmax correspond to Kd and this value was
661.15±142.21 nM.
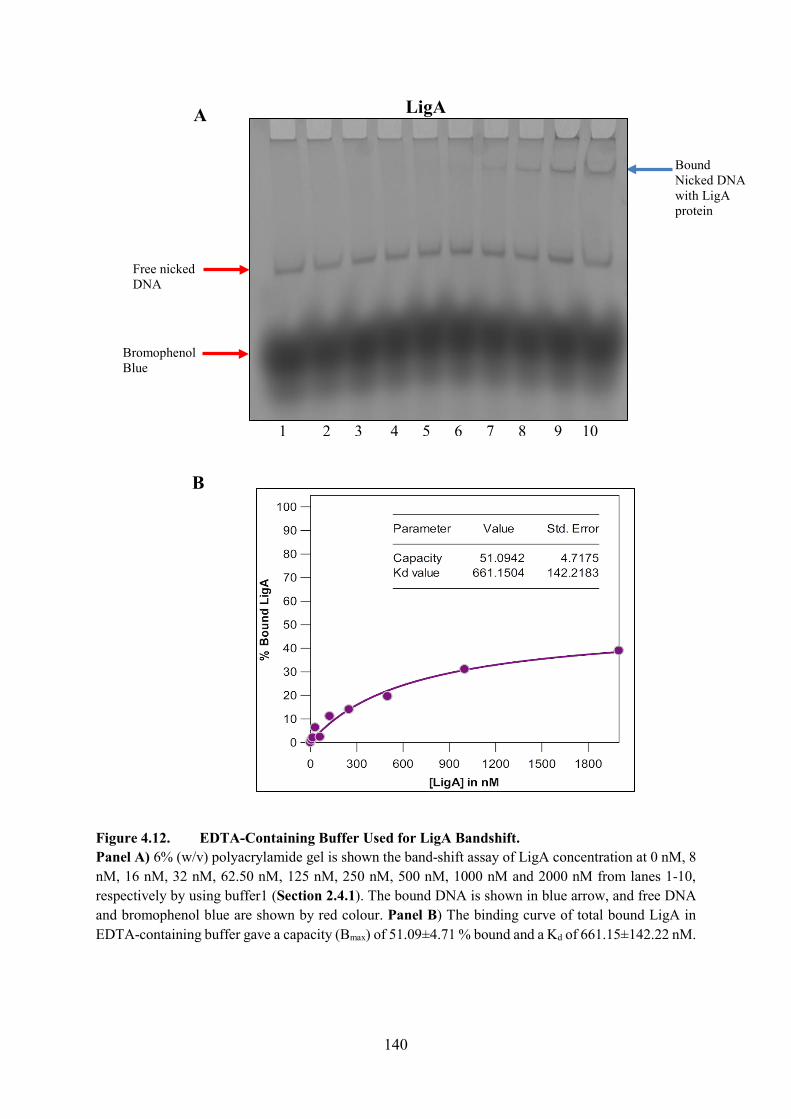
140
Figure 4.12. EDTA-Containing Buffer Used for LigA Bandshift. Panel A) 6% (w/v) polyacrylamide gel is shown the band-shift assay of LigA concentration at 0 nM, 8 nM, 16 nM, 32 nM, 62.50 nM, 125 nM, 250 nM, 500 nM, 1000 nM and 2000 nM from lanes 1-10, respectively by using buffer1 (Section 2.4.1). The bound DNA is shown in blue arrow, and free DNA and bromophenol blue are shown by red colour. Panel B) The binding curve of total bound LigA in EDTA-containing buffer gave a capacity (Bmax) of 51.09±4.71 % bound and a Kd of 661.15±142.22 nM.
Free nicked DNA
Bromophenol Blue
Bound Nicked DNA with LigA protein
B
A
1 2 3 4 5 6 7 8 9 10
LigA
141
4.4.2. Nicked DNA LigB Experiment.
EMSA was carried out on recombinant LigB protein with 50 nM of nicked DNA by using
binding buffer (1× EDTA). Native polyacralmide gel 6% with 9 lanes was used. The
concentration of LigB that purified from second strategy (see Section 3.4.2) were 30 nM, 62
nM, 125 nM, 250 nM, 500 nM, 1000 nM, 2000 nM, 4000 nM and 6000 nM respectively.
Figure 4.13A shows lane 1 was free nicked DNA and lanes 2-9 were coresponding to the
concentration of native LigB (31-6000 nM). Noticeably on the gel, at higher concentrations
more bound species appeared. Indicated by the blue arrows, a bandshift emerged that showed
one, two and three bound species as the concentration of LigB increased. However, when the
area of each lane was calculated using Image J, there were bound species identified at lower
concentrations. The results in this figure show that LigB can form a complex with nicked DNA
in the present 0.5 mM EDTA. Three bound species were formed, which was different in LigA.
The bromophenol blue and free DNA, indicated by the red arrow was used as a tracking dye to
show when the migration of the free DNA was near the bottom. Figure 4.13B shows a corrected
counts table showing the percentage of total three bound species. Figure 4.13C shows a graph of
the percentage of bound DNA at each LigB concentration. The method for quantitating the gel
was described in Section 2.4. This plot showed a rising curve that had maximum value (Bmax)
(capacity) at ~170%. This total comes from adding together the percentage of each of the three
species. It is clear that this method of fitting the data is too simple to account for what appear
to be multiple LigB proteins bound to nicked DNA; futher studies using LigB are required. The
concentration of LigB at half Bmax correspond to Kd and this value was 4566.29±1146.70 nM.
4.5. Iinitial β-clamp and Gamma-Loader Experiments.
The main aim of this section was to test a potential interaction between LigA and the ring-
shaped E.coli beta sliding-clamp (see Figure 1.12). During bacterial DNA replication, the beta
sliding-clamp component is a ring shaped protein that encircles the duplex and binds the DNA
polymerase, tethering it to DNA for high processivity (Levin et al., 1997). In 2001 Prof.
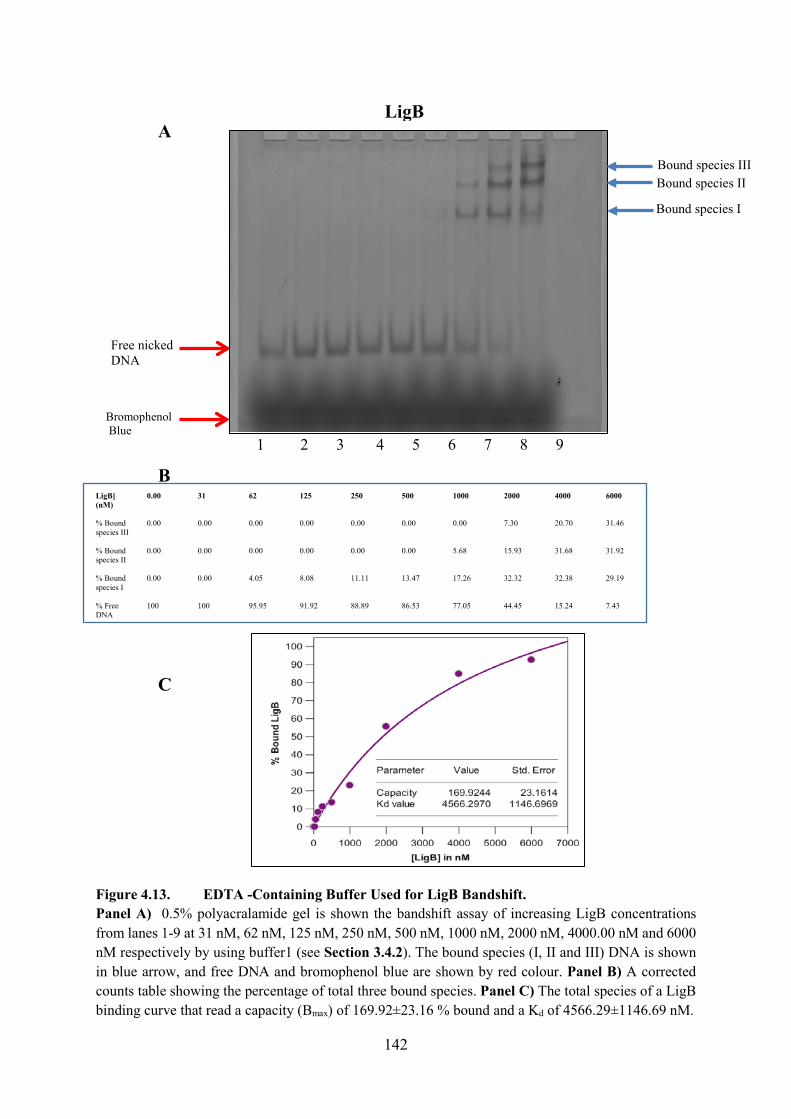
142
LigB] (nM)
0.00 31 62 125 250 500 1000 2000 4000 6000
% Bound species III
0.00 0.00 0.00 0.00 0.00 0.00 0.00 7.30 20.70 31.46
% Bound species II
0.00 0.00 0.00 0.00 0.00 0.00 5.68 15.93 31.68 31.92
% Bound species I
0.00 0.00 4.05 8.08 11.11 13.47 17.26 32.32 32.38 29.19
% Free DNA
100 100 95.95 91.92 88.89 86.53 77.05 44.45 15.24 7.43
Figure 4.13. EDTA -Containing Buffer Used for LigB Bandshift. Panel A) 0.5% polyacralamide gel is shown the bandshift assay of increasing LigB concentrations from lanes 1-9 at 31 nM, 62 nM, 125 nM, 250 nM, 500 nM, 1000 nM, 2000 nM, 4000.00 nM and 6000 nM respectively by using buffer1 (see Section 3.4.2). The bound species (I, II and III) DNA is shown in blue arrow, and free DNA and bromophenol blue are shown by red colour. Panel B) A corrected counts table showing the percentage of total three bound species. Panel C) The total species of a LigB binding curve that read a capacity (Bmax) of 169.92±23.16 % bound and a Kd of 4566.29±1146.69 nM.
Bound species IIIBound species II
Bound species I
Free nicked DNA
BromophenolBlue
1 2 3 4 5 6 7 8 9
A
B
LigB
C
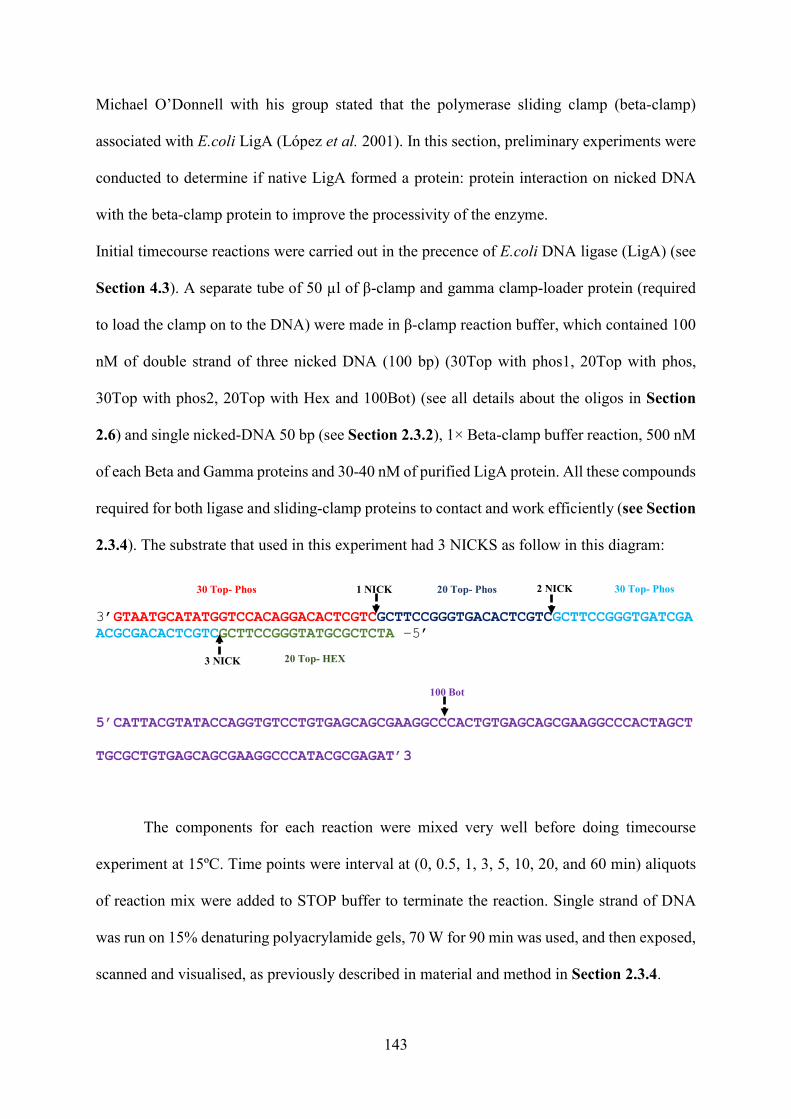
143
Michael O�Donnell with his group stated that the polymerase sliding clamp (beta-clamp)
associated with E.coli LigA (López et al. 2001). In this section, preliminary experiments were
conducted to determine if native LigA formed a protein: protein interaction on nicked DNA
with the beta-clamp protein to improve the processivity of the enzyme.
Initial timecourse reactions were carried out in the precence of E.coli DNA ligase (LigA) (see
Section 4.3). A separate tube of 50 µl of β-clamp and gamma clamp-loader protein (required
to load the clamp on to the DNA) were made in β-clamp reaction buffer, which contained 100
nM of double strand of three nicked DNA (100 bp) (30Top with phos1, 20Top with phos,
30Top with phos2, 20Top with Hex and 100Bot) (see all details about the oligos in Section
2.6) and single nicked-DNA 50 bp (see Section 2.3.2), 1× Beta-clamp buffer reaction, 500 nM
of each Beta and Gamma proteins and 30-40 nM of purified LigA protein. All these compounds
required for both ligase and sliding-clamp proteins to contact and work efficiently (see Section
2.3.4). The substrate that used in this experiment had 3 NICKS as follow in this diagram:
3�GTAATGCATATGGTCCACAGGACACTCGTCGCTTCCGGGTGACACTCGTCGCTTCCGGGTGATCGAACGCGACACTCGTCGCTTCCGGGTATGCGCTCTA �5�
5�CATTACGTATACCAGGTGTCCTGTGAGCAGCGAAGGCCCACTGTGAGCAGCGAAGGCCCACTAGCT
TGCGCTGTGAGCAGCGAAGGCCCATACGCGAGAT�3
The components for each reaction were mixed very well before doing timecourse
experiment at 15ºC. Time points were interval at (0, 0.5, 1, 3, 5, 10, 20, and 60 min) aliquots
of reaction mix were added to STOP buffer to terminate the reaction. Single strand of DNA
was run on 15% denaturing polyacrylamide gels, 70 W for 90 min was used, and then exposed,
scanned and visualised, as previously described in material and method in Section 2.3.4.
20 Top- HEX
30 Top- Phos 20 Top- Phos 30 Top- Phos1 NICK 2 NICK
3 NICK
100 Bot
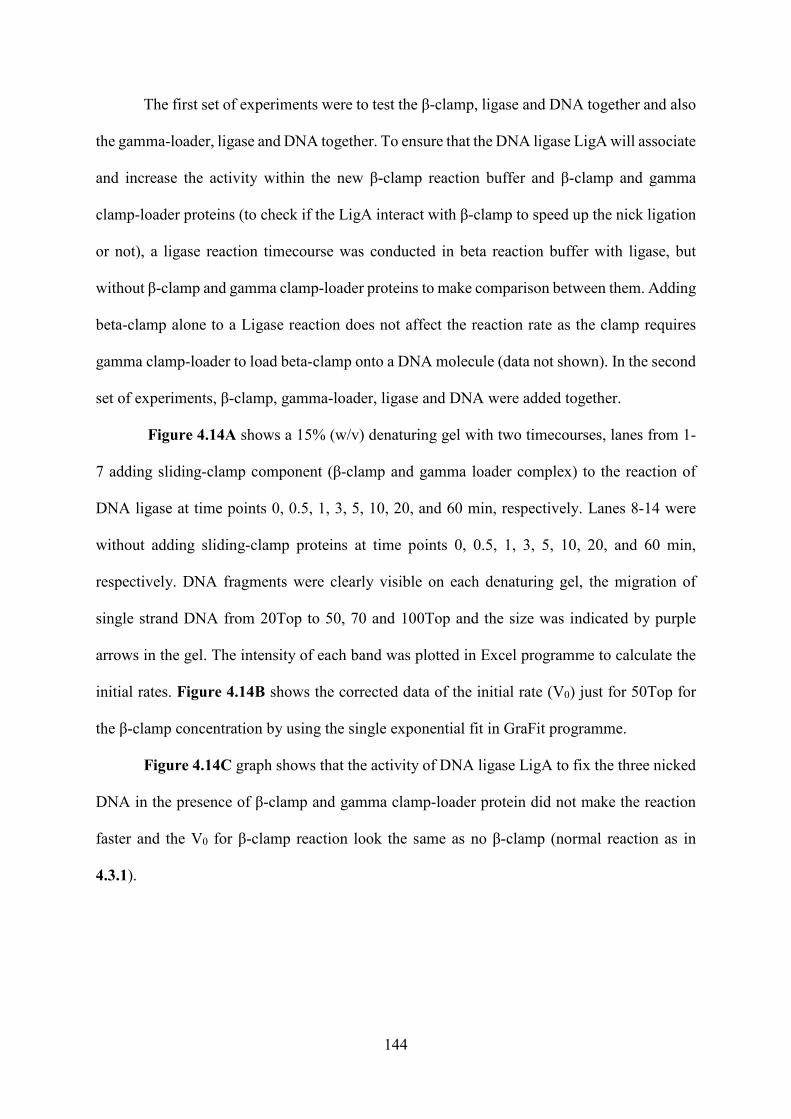
144
The first set of experiments were to test the β-clamp, ligase and DNA together and also
the gamma-loader, ligase and DNA together. To ensure that the DNA ligase LigA will associate
and increase the activity within the new β-clamp reaction buffer and β-clamp and gamma
clamp-loader proteins (to check if the LigA interact with β-clamp to speed up the nick ligation
or not), a ligase reaction timecourse was conducted in beta reaction buffer with ligase, but
without β-clamp and gamma clamp-loader proteins to make comparison between them. Adding
beta-clamp alone to a Ligase reaction does not affect the reaction rate as the clamp requires
gamma clamp-loader to load beta-clamp onto a DNA molecule (data not shown). In the second
set of experiments, β-clamp, gamma-loader, ligase and DNA were added together.
Figure 4.14A shows a 15% (w/v) denaturing gel with two timecourses, lanes from 1-
7 adding sliding-clamp component (β-clamp and gamma loader complex) to the reaction of
DNA ligase at time points 0, 0.5, 1, 3, 5, 10, 20, and 60 min, respectively. Lanes 8-14 were
without adding sliding-clamp proteins at time points 0, 0.5, 1, 3, 5, 10, 20, and 60 min,
respectively. DNA fragments were clearly visible on each denaturing gel, the migration of
single strand DNA from 20Top to 50, 70 and 100Top and the size was indicated by purple
arrows in the gel. The intensity of each band was plotted in Excel programme to calculate the
initial rates. Figure 4.14B shows the corrected data of the initial rate (V0) just for 50Top for
the β-clamp concentration by using the single exponential fit in GraFit programme.
Figure 4.14C graph shows that the activity of DNA ligase LigA to fix the three nicked
DNA in the presence of β-clamp and gamma clamp-loader protein did not make the reaction
faster and the V0 for β-clamp reaction look the same as no β-clamp (normal reaction as in
4.3.1).
145
Figure 4.14. B-clamp Protein Interaction with LigA Protein. Panel A) Denaturing gel 15% (w/v) is showing two timecourses, lanes 1-7 adding sliding-clamp component to the reaction of DNA ligase at time points 0.5, 1, 3, 5, 10, 20 and 60 min. Lanes 8-14 without adding sliding-clamp proteins at time points 0.5, 1, 3, 5, 10, 20 and 60 min, the concentration of DNA substrate was 100 nM of double strand three nicked DNA in this gel. Panels B) Table shows the corrected data of the initial rate (V0) that plotted with % intensity against time for the complex reaction of β-clamp and without β-clamp. Panel C) Graphs showing results of the average of initial rates of each DNA fragment that pointed in arrows (50, 70 and 100Top), the initial rate for β-clamp proteins interaction with LigA was 33.128 and the initial rate for just LigA protein (no adding β-clamp) was 31.201.
The average of initial rate time(min) Beta-clam N adding Beta-clamp
0 0 00.5 24.77979 24.51886
1 33.12802 31.200953 42.67717 41.39235 43.85978 45.65941
10 43.75492 49.0976720 48.38052 52.6440160 52.13564 60.546
y = 33.128x + 2.7386
y = 31.201x + 2.9728
0
10
20
30
40
0 0.5 1 1.5
[DN
A] in
nM
Time [min]Beta-clamp
N adding Beta-clamp
Linear (Beta-clamp)
1 2 3 4 5 6 7 8 9 10 11 12 13 14
With β-clamp without β-clamp
20 Top
50 Top1Nick
Bromoblue
A
70 Top2Nick
100 Top2Nick
B
C
146
4.6. Discussion.
In this Chapter, a large number of kinetics and binding experiments were performed. In this
Discussion I will explain these results by comparing most of experiments of native LigA and
LigB. In Section 4.2 the aim was to develop a new ligation assay. This involved firstly
designing and annealing oligonucleotides to make suitable DNA ligase substrate. In this study
the length of double strand of nicked DNA that used was 50 base pair and the nick was between
bases 30 and 20 TOP. This length was similar to previous studies (Wilkinson et al., 2005).
In this study the nicked DNA was checked by commercial LigA first to determine the
best concentration. A hexachlorofluorescein (Hex) group was attached to 5�-end at 20 base
pair was used in this study, which had an excitation wavelength of 535 nm ( which allowed to
be easily image), easy and safe, to determine and plot the ligation strand (50Top) of nicked
DNA at 100 nM concentration as used in this experiments. These was similar to Mills et al.
2011 used tetramethyl carboxyrhodamine fluorescent (TAMRA) that labelled at the 3�-end.
Whereas Liu et al. in 2004 was used radiolabelling P32 at 5�-end of oligonucleotides.
Next, in Section 4.3, I provided the first side-by-side comparison of native LigA and
LigB for three out of five parameters: [DNA], [NAD+] and Temperature. Michaelis-Menten
kinetics for native LigA and LigB showed that the Vmax of LigA and LigB for a singly-nicked
DNA substrate were different, at 62.10± 8.56 and 9.73±0.58 nM/min, respectively. The Km
values for LigA and LigB (how tightly they bound the nicked DNA) were slightly similar, at
12.22±6.42 and 3.50±1.34 nM, respectively. LigB bound nicked DNA ~ 4-fold tighter than
LigA, which is a new results. It is possible that LigA and LigB have different function in the
cell with different affinities for nicked DNA for example it would interesting to observe with
microscope where in the bacteria LigA and LigB are. There no studies on this before. As well
more discussions with others studies was added in the final discussion (Chapter 7).
Both enzymes required NAD+ as cofactor, but showed different Vmax values
(61.14±3.22 and 15.37±0.60 µM/min, respectively), as well their Km values were sharply
147
different (1.55±0.33 and 0.16±0.03 µM), and showing that LigB bound NAD+ obviously tighter
than LigA. The Vmax values showed that LigA was 4-fold faster than LigB. Similar to the result
for [DNA], perhaps there is a different role in the cell of LigA and LigB.
The other parameter that was compared for LigA and LigB was incubation temperature.
This showed that both native enzymes had a slightly different optimum temperature for
activity. For LigA this was ~20ºC, and for LigB approximately ~16ºC. Most DNA ligases are
used at 16ºC or room temperature and can be denatured by heat (Lohman et al., 2011B). Also,
we found LigA if left at room temperature overnight lost almost its activity. Therefore,
although some DNA ligases such as the three ATP-dependent ligases from bacteriophage T4
that required 37ºC for optimum activity (Bullard and Bowater, 2006). The temperature used
in every LigA and LigB reaction (kinetics study) was 16ºC, which was closed to the optimum
temperature for each enzyme.
The remaining two parameters [NMN] and [NH4SO4] were only studied for LigA. Data
for LigB were not obtained because the difficult and limited solubility of LigB prep. The
interesting result for NMN was that inhibited the reaction of LigA. The Yrange for [NMN] was
13.89±0.56 µM/min, and the inhibition IC50 was 31.34±1.56 µM. As seen in the previous
kinetics experiments, the ligation catalysed by LigA or LigB doesn�t go to completion even at
ideal reaction conditions. We hypothesised that the NMN, which is released during ligation as
a by-product, could somehow be involved in this ligation.
The ammonium sulphate experiment on LigA confirms previous papers that have
reported this effect and stimulate the reaction of the LigA enzyme (Modrich & Lehman, 1973;
Chauleau & Shuman, 2016). The Km for [NH4SO4] was 37.64±40.64 µM, but this has a large
error and will need further measurement to be more accurate. In the crystal structure of 2OWO
(see Figure 1.5) there are four sulphate anions but no ammonium cation.
148
In Section 4.4, comparative gel-shift studies in EDTA containing buffers (no Mg2+
added) showed that LigA bound the 50 bp nicked DNA with a Kd of 661.15±142.22 nM and
LigB 4,566.30±1146.70 nM. This showed that LigA bound approximately 6.9-fold tighter than
LigB. Interestingly, LigA only formed one type of protein-DNA complex since there was only
one bound species on the gel. Otherwise, for LigB there were three types of protein-DNA
complex, which shows possibly multiple LigB monomeric in the 50 bp nicked DNA or the
LigB bend the nick DNA to form different species. Further studies on LigA and LigB, could
include mass spec and Western blot analysis (Kneale, 1994).
In Section 4.5, to determine the processivity of DNA ligase LigA in E.coli, we
predicted here that the β-clamp complex interact directly with Lig1 eubacteria (Levin et al,
1997). Improving the interacting between DNA ligase and sliding-clamp (β-clamp and gamma
loader complex) will be increasing the attention as a therapeutic target. We found here in this
study that DNA ligase E.coli LigA did not interact with β-clamp complex in vitro (all the
conditions of studied in this experiment explained in Section 4.5). More discussions with others
studies was added in the final discussion in Chapter 7.
Overall, these studies show that the two ligase enzymes in E.coli have different kinetic
and binding profiles. Possibly this means that they have different functional roles within the
bacteria cell. For the two parameters [DNA] and [NAD+], the Vmax values for LigA were ~7
and 4-fold faster than LigB. All five parameters taken together show these two enzymes that
do the same reaction may have different roles in the cell, such as replication or repair.
Further experiment would be needed to examine this idea, for example separate
mutation studies for native LigA and LigB in vivo would help locate and explain the function
for each protein. For example, gene knockout experiments would help greatly. The LigA gene
has been examined before (Rychta et al., 2007) and when inactivated, appeared to cause the
E.coli to die.
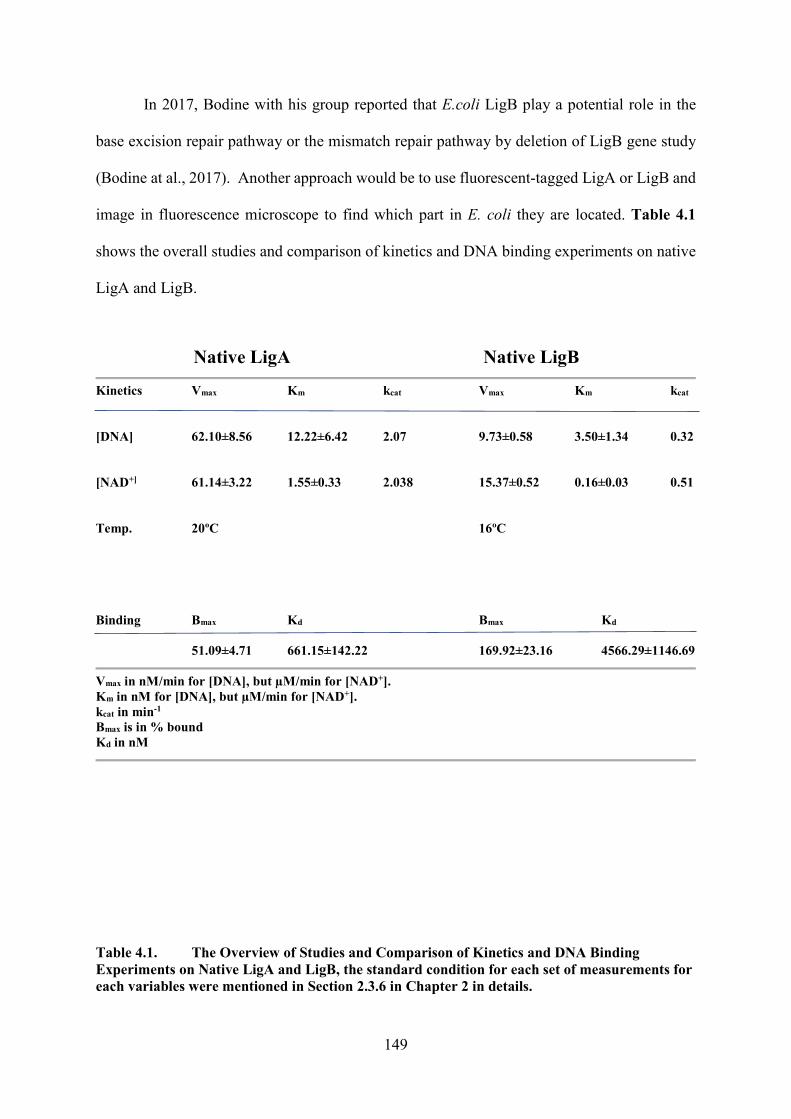
149
In 2017, Bodine with his group reported that E.coli LigB play a potential role in the
base excision repair pathway or the mismatch repair pathway by deletion of LigB gene study
(Bodine at al., 2017). Another approach would be to use fluorescent-tagged LigA or LigB and
image in fluorescence microscope to find which part in E. coli they are located. Table 4.1
shows the overall studies and comparison of kinetics and DNA binding experiments on native
LigA and LigB.
Native LigA Native LigB
Kinetics Vmax Km kcat Vmax Km kcat
[DNA] 62.10±8.56 12.22±6.42 2.07 9.73±0.58 3.50±1.34 0.32
[NAD+] 61.14±3.22 1.55±0.33 2.038 15.37±0.52 0.16±0.03 0.51
Temp. 20ºC 16ºC
Binding Bmax Kd Bmax Kd
51.09±4.71 661.15±142.22 169.92±23.16 4566.29±1146.69
Vmax in nM/min for [DNA], but µM/min for [NAD+]. Km in nM for [DNA], but µM/min for [NAD+]. kcat in min-1
Bmax is in % bound Kd in nM
Table 4.1. The Overview of Studies and Comparison of Kinetics and DNA Binding Experiments on Native LigA and LigB, the standard condition for each set of measurements for each variables were mentioned in Section 2.3.6 in Chapter 2 in details.
150
Chapter 5: In Silico Molecular Docking
One of the main objectives of this PhD study was to clone and investigate the activity of native
LigA and LigB (Chapters 3 and 4). Another key objective was to explore the potential of DNA
ligases as possible antibiotic targets. The reason they might be attractive targets for new
inhibitors is that DNA ligases are essential enzymes in DNA repair and replication (as
described in Chapter 1). Work in this chapter describes using a molecular docking programme
called Molecular Operating Environment (MOE). This software was used to identify chemical
compounds from a large library of possible small molecular inhibitors.
5.1. Preparation of Native LigA Structure in MOE.
All the computational processes for native LigA were performed within the molecular docking
program MOE, version 7.0 (Chemical Computing Group, 2013). Figure 5.1A shows a flow
diagram of the key processes that were performed to discover new potential inhibitors of LigA.
The first stage was to prepare the LigA structure. The crystal structure of native LigA was
downloaded from the PDB (2OWO) as text file and opened using MOE. The crystal structure
was input and checked by using MOE for additional information within the pdb.txt files, such
as the binding of the DNA.
The double strand DNA chain was removed to reduce the computation requirements.
The domains of LigA have different functions, generally, Ia is involved with the capture of
NAD+, NTase provides a scaffold for the catalysis Adenylate transfer reaction and OB, Znf and
HhH domains assist with DNA binding and structural conformation changes (see Chapter 1.4).
The sequence of LigA (amino acids 1-586, not including BRCT domain 587-671) was chosen
to select all the amino acids chain by docking in MOE.
151
Figure 5.1B shows the structure of LigA (Nandakumar et al, 2007) with the five
domains: Ia, NTase, OB, Znf and HhH. Also shown is the AMP group which is actually
attached to the 5� phosphate at the nick (the nicked DNA its self has been removed). Since the
LigA-DNA co-crystal (Nandakumar et al, 2007) was prepared in the presence of EDTA, it was
speculated that co-ordinated divalent cations are required to provide structure and complete the
second and third reactions described below in Figure 5.2A (mechanism of LigA). As these are
absent in the structure, the reaction has effectively been halted just before the 3�OH attacks the
adenylated DNA to complete the ligation step (Wilkinson et al, 2001). Priming (prior to DNA
binding).
5.2. Positive Control Simulation for rAMP Docking.
Prior to commencing the key site finding and docking, a positive control experiment was
performed where the AMP group (shown in cyan in Figure 5.1B) was removed from the
2OWO structure in MOE file. The purpose of this docking control experiment was to test the
MOE programme if it was able to identify the binding site for AMP by docking ribose AMP
(rAMP) with the whole sequence of LigA protein (four sites).
The rAMP molecule was selected from the ZINC library of molecules (ZINC library
03860159), downloaded and saved as a MOL file in a biologically relevant conformation (Irwin
et al., 2012). MOE was then instructed to dock rAMP into any site on LigA. MOE successfully
identified the AMP binding site and correctly orientated the rAMP molecule. Figure 5.2B
shows diagrams of 2-D representation of the rAMP ligand bound in the active site of LigA as
shown in 2OWO. The docking position of rAMP was the same as in 2OWO with AMP bound
to the nicked DNA by re-docking the rAMP in MOE technique.
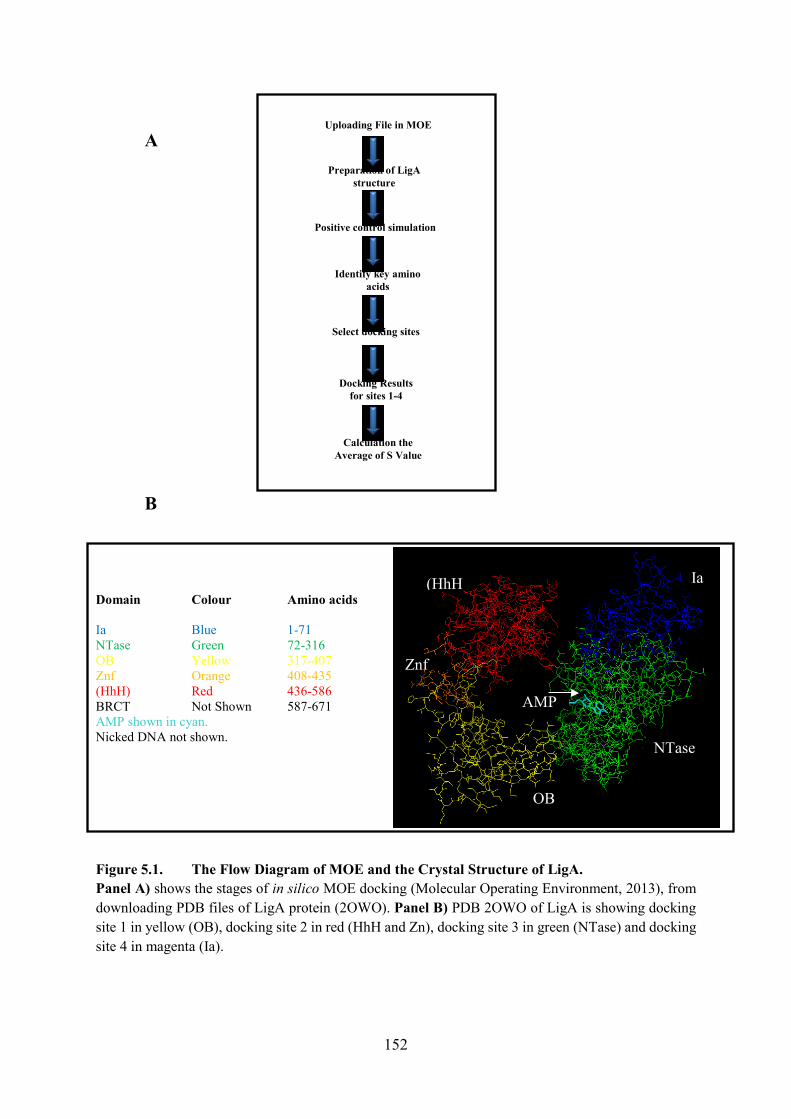
152
Domain Colour Amino acids
Ia Blue 1-71NTase Green 72-316OB Yellow 317-407 Znf Orange 408-435 (HhH) Red 436-586 BRCT Not Shown 587-671 AMP shown in cyan. Nicked DNA not shown.
Figure 5.1. The Flow Diagram of MOE and the Crystal Structure of LigA. Panel A) shows the stages of in silico MOE docking (Molecular Operating Environment, 2013), from downloading PDB files of LigA protein (2OWO). Panel B) PDB 2OWO of LigA is showing docking site 1 in yellow (OB), docking site 2 in red (HhH and Zn), docking site 3 in green (NTase) and docking site 4 in magenta (Ia).
Docking Results for sites 1-4
Calculation the Average of S Value
Uploading File in MOE
Positive control simulation
Identify key amino acids
Select docking sites
Preparation of LigA structure
Ia
NTase
OB
Znf
(HhH
AMP
A
B
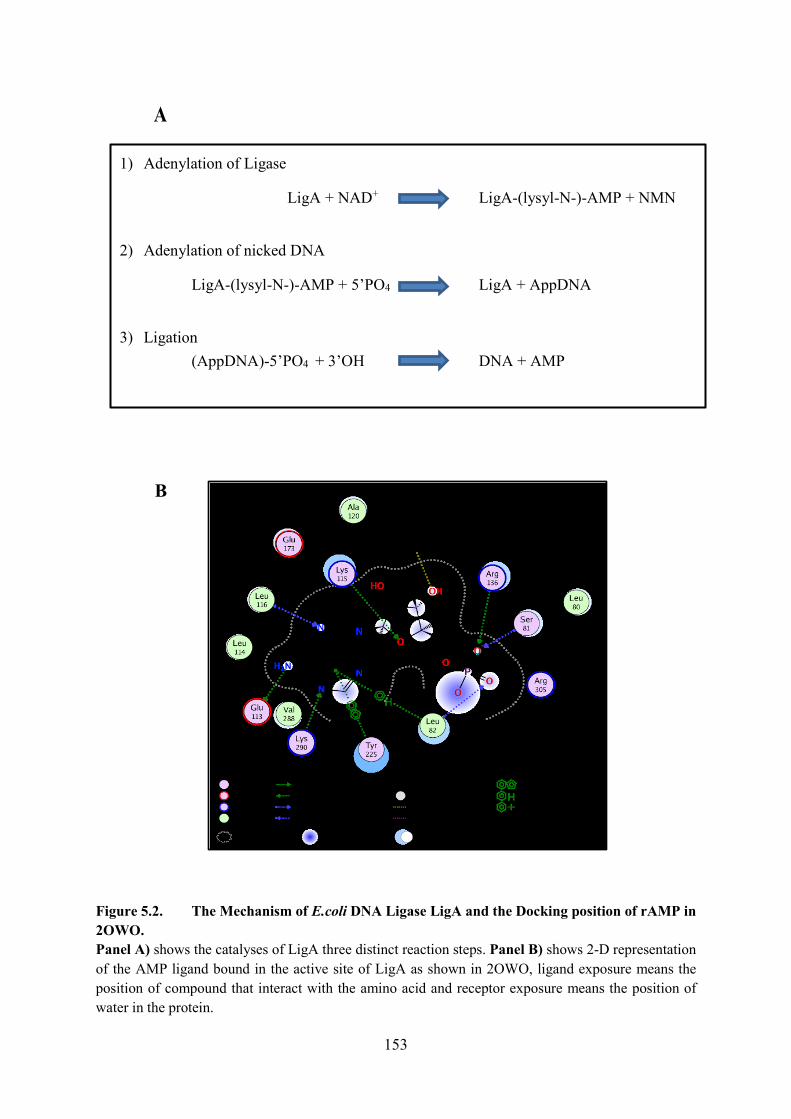
153
1) Adenylation of Ligase
LigA + NAD+ LigA-(lysyl-N-)-AMP + NMN
2) Adenylation of nicked DNA
LigA-(lysyl-N-)-AMP + 5�PO4 LigA + AppDNA
3) Ligation (AppDNA)-5�PO4 + 3�OH DNA + AMP
Figure 5.2. The Mechanism of E.coli DNA Ligase LigA and the Docking position of rAMP in 2OWO. Panel A) shows the catalyses of LigA three distinct reaction steps. Panel B) shows 2-D representation of the AMP ligand bound in the active site of LigA as shown in 2OWO, ligand exposure means the position of compound that interact with the amino acid and receptor exposure means the position of water in the protein.
A
B
154
5.3. Identifying key Amino Acids in LigA from Mutagenesis Studies.
To identify the key amino acids in LigA structure, two steps were used: the first was to map all
the amino acids from previous mutagenesis studies on the LigA structure. The second step was
to use the site finder function in MOE to map all the accessible binding sites for small chemical
compounds. To select the most appropriate sites, information on which residues were essential
for catalytic activity needed to be found. These were determined from previous publications
(Sriskanda & Shuman, 2002a; Zhu & Shuman, 2005; Wang et al., 2008; Wang et al., 2009).
Helpfully, the Uniprot database (www.uniprot.org) included all these single mutation studies
on LigA.
Table 5.1 shows the mutagenesis studies of different amino acids found within LigA.
Amino acid mutations that had little or no effect are shown in pink and white, and the amino
acids that are critical are shown in green. Figure 5.3A shows a PyMOL image of PDB 2OWO
with the protein backbone shown in white. Shown in red are all the amino acid residues from
Table 5.1 that when mutated gave a > 95% reduction in activity.
For the second stage, once the crystal structure of LigA protein was prepared, the �Site
Finder� function panel in MOE was used to predict possible binding sites (Galli et al., 2014).
Depending on the previous survey of mutagenesis studies of different amino acids on LigA, a
large number of possible docking sites were found using the same mutagenesis position for all
domains of LigA protein. (Not all of these were used). Figure 5.3B shows an MOE image of
2OWO with all the detected drug-able sites shown with red and white spheres and the LigA
main chain in ribbon format.
5.4. Select Docking Sites Using MOE.
The key results from section 5.3 was to map where the essential amino acids were (Figure
5.3A) and where the drug-able sites were (Figure 5.3B). Based on these maps, four
potential docking sites were chosen.
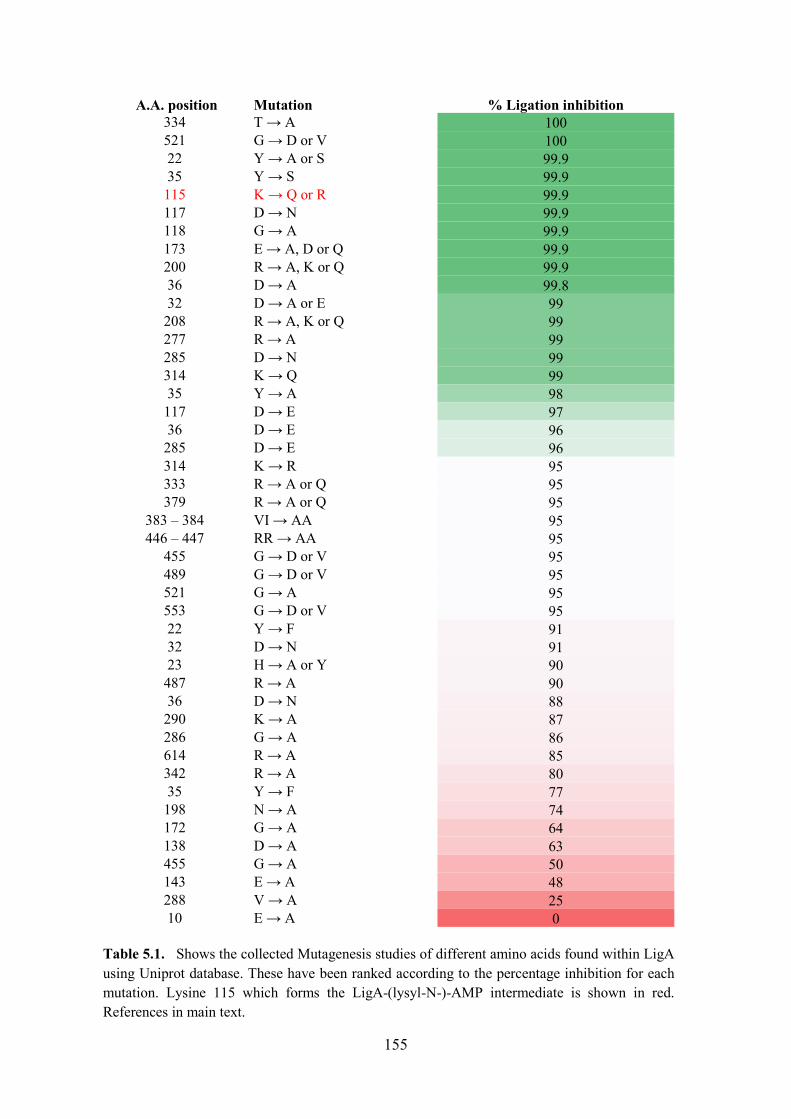
155
A.A. position Mutation % Ligation inhibition334 T → A 100521 G → D or V 10022 Y → A or S 99.935 Y → S 99.9115 K → Q or R 99.9117 D → N 99.9118 G → A 99.9173 E → A, D or Q 99.9200 R → A, K or Q 99.936 D → A 99.832 D → A or E 99208 R → A, K or Q 99277 R → A 99285 D → N 99314 K → Q 9935 Y → A 98117 D → E 9736 D → E 96285 D → E 96314 K → R 95333 R → A or Q 95379 R → A or Q 95
383 � 384 VI → AA 95446 � 447 RR → AA 95
455 G → D or V 95489 G → D or V 95521 G → A 95553 G → D or V 9522 Y → F 9132 D → N 9123 H → A or Y 90487 R → A 9036 D → N 88290 K → A 87286 G → A 86614 R → A 85342 R → A 8035 Y → F 77198 N → A 74172 G → A 64138 D → A 63455 G → A 50143 E → A 48288 V → A 2510 E → A 0
Table 5.1. Shows the collected Mutagenesis studies of different amino acids found within LigA using Uniprot database. These have been ranked according to the percentage inhibition for each mutation. Lysine 115 which forms the LigA-(lysyl-N-)-AMP intermediate is shown in red. References in main text.
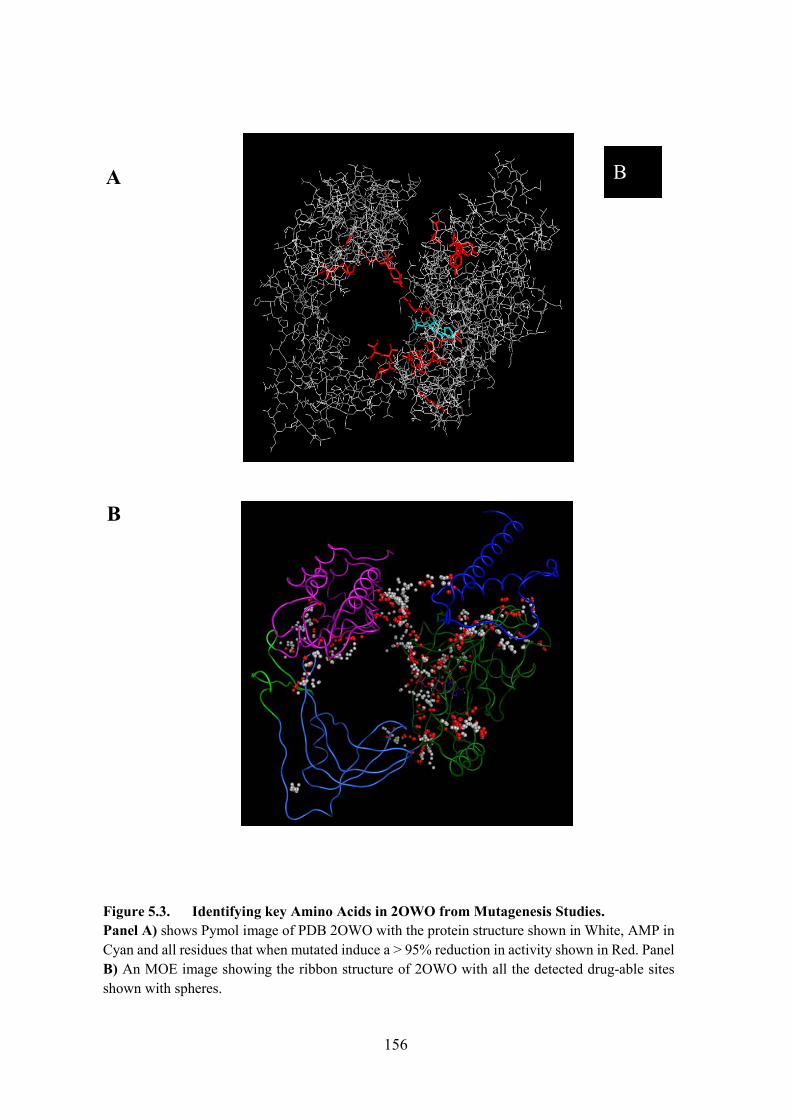
156
Figure 5.3. Identifying key Amino Acids in 2OWO from Mutagenesis Studies. Panel A) shows Pymol image of PDB 2OWO with the protein structure shown in White, AMP in Cyan and all residues that when mutated induce a > 95% reduction in activity shown in Red. Panel B) An MOE image showing the ribbon structure of 2OWO with all the detected drug-able sites shown with spheres.
B A
B
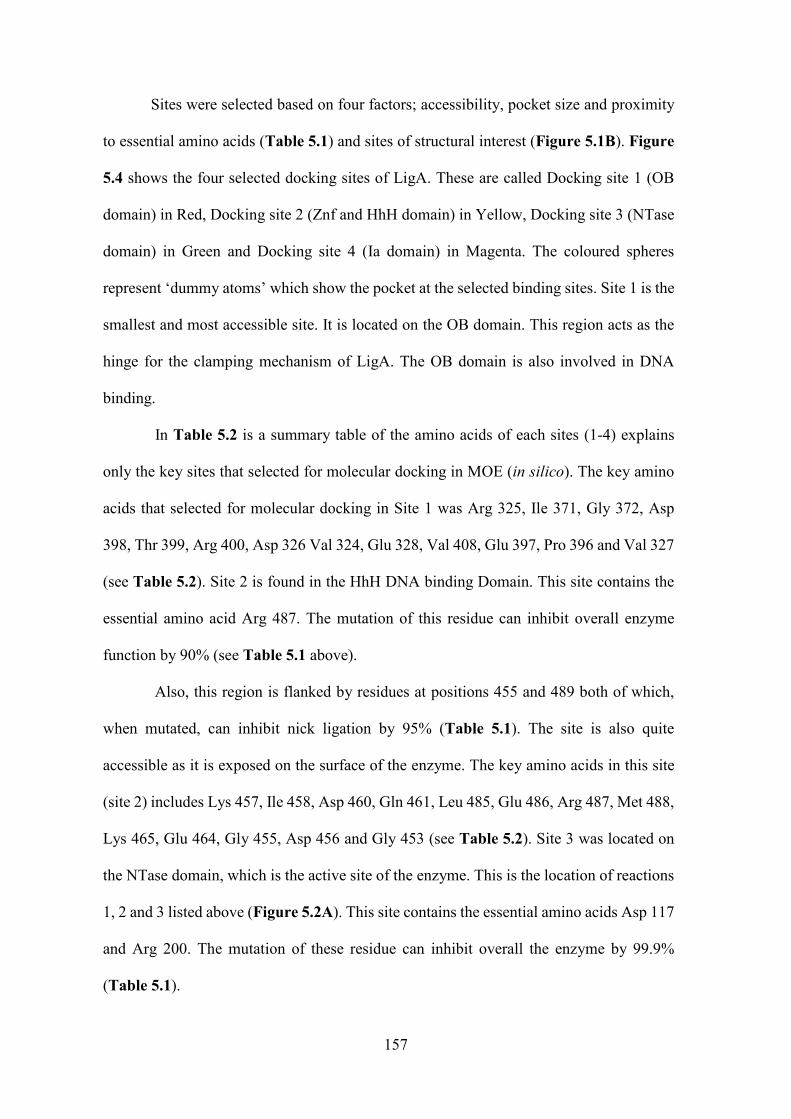
157
Sites were selected based on four factors; accessibility, pocket size and proximity
to essential amino acids (Table 5.1) and sites of structural interest (Figure 5.1B). Figure
5.4 shows the four selected docking sites of LigA. These are called Docking site 1 (OB
domain) in Red, Docking site 2 (Znf and HhH domain) in Yellow, Docking site 3 (NTase
domain) in Green and Docking site 4 (Ia domain) in Magenta. The coloured spheres
represent �dummy atoms� which show the pocket at the selected binding sites. Site 1 is the
smallest and most accessible site. It is located on the OB domain. This region acts as the
hinge for the clamping mechanism of LigA. The OB domain is also involved in DNA
binding.
In Table 5.2 is a summary table of the amino acids of each sites (1-4) explains
only the key sites that selected for molecular docking in MOE (in silico). The key amino
acids that selected for molecular docking in Site 1 was Arg 325, Ile 371, Gly 372, Asp
398, Thr 399, Arg 400, Asp 326 Val 324, Glu 328, Val 408, Glu 397, Pro 396 and Val 327
(see Table 5.2). Site 2 is found in the HhH DNA binding Domain. This site contains the
essential amino acid Arg 487. The mutation of this residue can inhibit overall enzyme
function by 90% (see Table 5.1 above).
Also, this region is flanked by residues at positions 455 and 489 both of which,
when mutated, can inhibit nick ligation by 95% (Table 5.1). The site is also quite
accessible as it is exposed on the surface of the enzyme. The key amino acids in this site
(site 2) includes Lys 457, Ile 458, Asp 460, Gln 461, Leu 485, Glu 486, Arg 487, Met 488,
Lys 465, Glu 464, Gly 455, Asp 456 and Gly 453 (see Table 5.2). Site 3 was located on
the NTase domain, which is the active site of the enzyme. This is the location of reactions
1, 2 and 3 listed above (Figure 5.2A). This site contains the essential amino acids Asp 117
and Arg 200. The mutation of these residue can inhibit overall the enzyme by 99.9%
(Table 5.1).
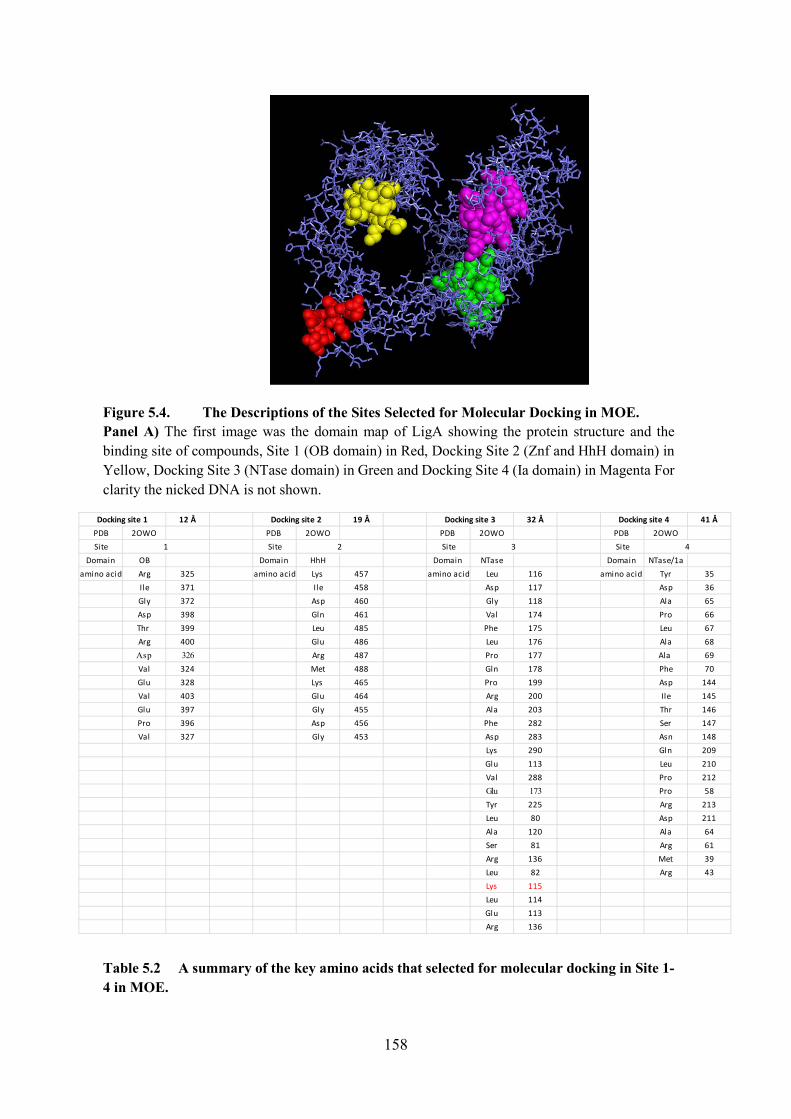
158
Figure 5.4. The Descriptions of the Sites Selected for Molecular Docking in MOE.Panel A) The first image was the domain map of LigA showing the protein structure and the binding site of compounds, Site 1 (OB domain) in Red, Docking Site 2 (Znf and HhH domain) in Yellow, Docking Site 3 (NTase domain) in Green and Docking Site 4 (Ia domain) in Magenta For clarity the nicked DNA is not shown.
Table 5.2 A summary of the key amino acids that selected for molecular docking in Site 1-4 in MOE.
12 Å 19 Å 32 Å 41 ÅPDB 2OWO PDB 2OWO PDB 2OWO PDB 2OWOSite Site Site Site
Domain OB Domain HhH Domain NTase Domain NTase/1aamino acid Arg 325 amino acid Lys 457 amino acid Leu 116 amino acid Tyr 35
Ile 371 Ile 458 Asp 117 Asp 36Gly 372 Asp 460 Gly 118 Ala 65Asp 398 Gln 461 Val 174 Pro 66Thr 399 Leu 485 Phe 175 Leu 67Arg 400 Glu 486 Leu 176 Ala 68Asp 326 Arg 487 Pro 177 Ala 69Val 324 Met 488 Gln 178 Phe 70Glu 328 Lys 465 Pro 199 Asp 144Val 403 Glu 464 Arg 200 Ile 145Glu 397 Gly 455 Ala 203 Thr 146Pro 396 Asp 456 Phe 282 Ser 147Val 327 Gly 453 Asp 283 Asn 148
Lys 290 Gln 209Glu 113 Leu 210Val 288 Pro 212Glu 173 Pro 58Tyr 225 Arg 213Leu 80 Asp 211Ala 120 Ala 64Ser 81 Arg 61Arg 136 Met 39Leu 82 Arg 43Lys 115Leu 114Glu 113Arg 136
Docking site 1 Docking site 2 Docking site 3 Docking site 4
1 2 3 4
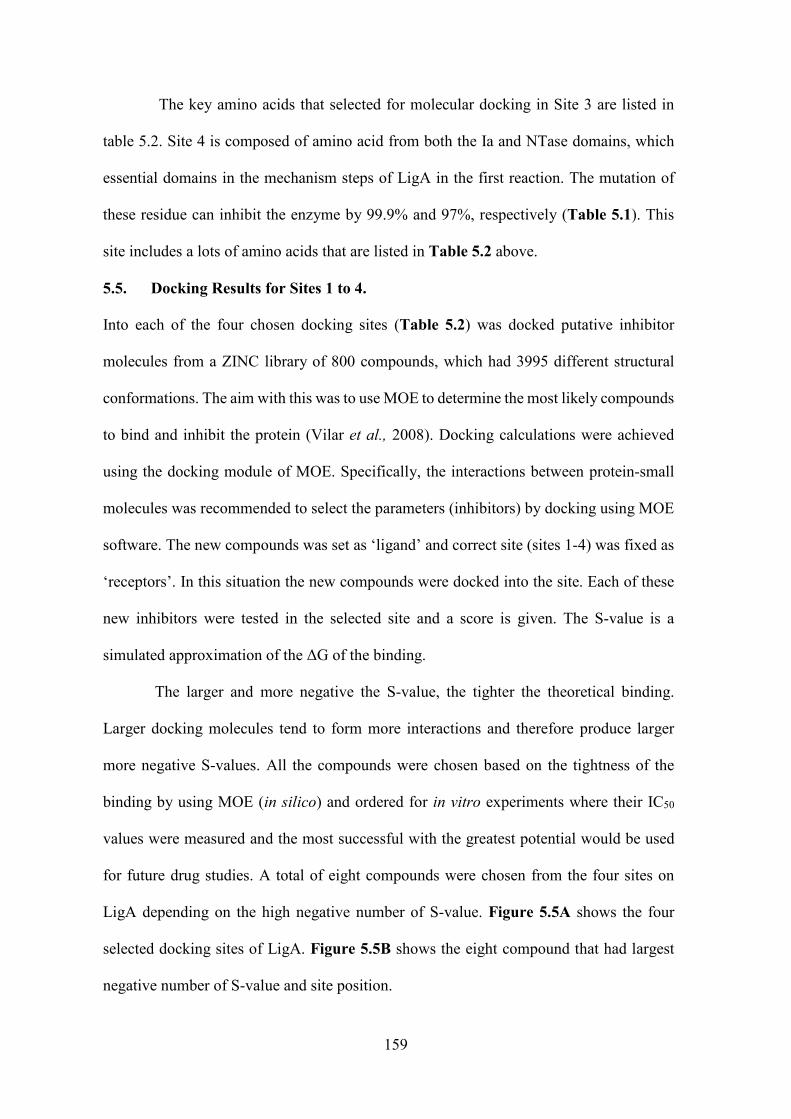
159
The key amino acids that selected for molecular docking in Site 3 are listed in
table 5.2. Site 4 is composed of amino acid from both the Ia and NTase domains, which
essential domains in the mechanism steps of LigA in the first reaction. The mutation of
these residue can inhibit the enzyme by 99.9% and 97%, respectively (Table 5.1). This
site includes a lots of amino acids that are listed in Table 5.2 above.
5.5. Docking Results for Sites 1 to 4.
Into each of the four chosen docking sites (Table 5.2) was docked putative inhibitor
molecules from a ZINC library of 800 compounds, which had 3995 different structural
conformations. The aim with this was to use MOE to determine the most likely compounds
to bind and inhibit the protein (Vilar et al., 2008). Docking calculations were achieved
using the docking module of MOE. Specifically, the interactions between protein-small
molecules was recommended to select the parameters (inhibitors) by docking using MOE
software. The new compounds was set as �ligand� and correct site (sites 1-4) was fixed as
�receptors�. In this situation the new compounds were docked into the site. Each of these
new inhibitors were tested in the selected site and a score is given. The S-value is a
simulated approximation of the ΔG of the binding.
The larger and more negative the S-value, the tighter the theoretical binding.
Larger docking molecules tend to form more interactions and therefore produce larger
more negative S-values. All the compounds were chosen based on the tightness of the
binding by using MOE (in silico) and ordered for in vitro experiments where their IC50
values were measured and the most successful with the greatest potential would be used
for future drug studies. A total of eight compounds were chosen from the four sites on
LigA depending on the high negative number of S-value. Figure 5.5A shows the four
selected docking sites of LigA. Figure 5.5B shows the eight compound that had largest
negative number of S-value and site position.
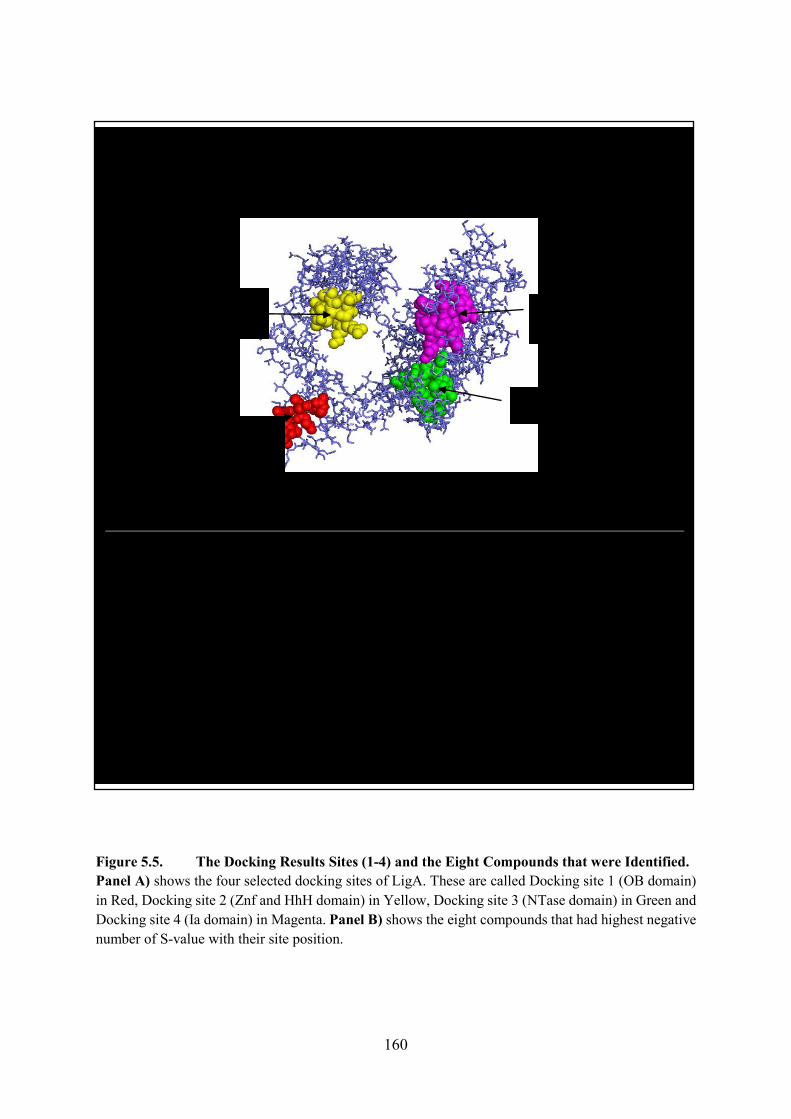
160
Name Site S value
1. Oxidised Glutathione 2 -47.7642. 5-Azacytidine 3 -43.42763. Geneticin (G418) 1 -40.1014. Chlorhexidine 1 -39.06455. Bestatin/ Ubenimex 4 -36.74356. 2-(Aminomethyl) imidazole 4 -36.12027. Imidazolidinyl Urea 2 -35.14608. Imidazo [1,2-a] pyridine-7-carboxylic acid 3 -29.5067
Site 2(HhH domain)
Site 1(OB domain)
Site 4 NTase/Ia domain
Site 3 NTase domain
A
Figure 5.5. The Docking Results Sites (1-4) and the Eight Compounds that were Identified.Panel A) shows the four selected docking sites of LigA. These are called Docking site 1 (OB domain) in Red, Docking site 2 (Znf and HhH domain) in Yellow, Docking site 3 (NTase domain) in Green and Docking site 4 (Ia domain) in Magenta. Panel B) shows the eight compounds that had highest negative number of S-value with their site position.
B
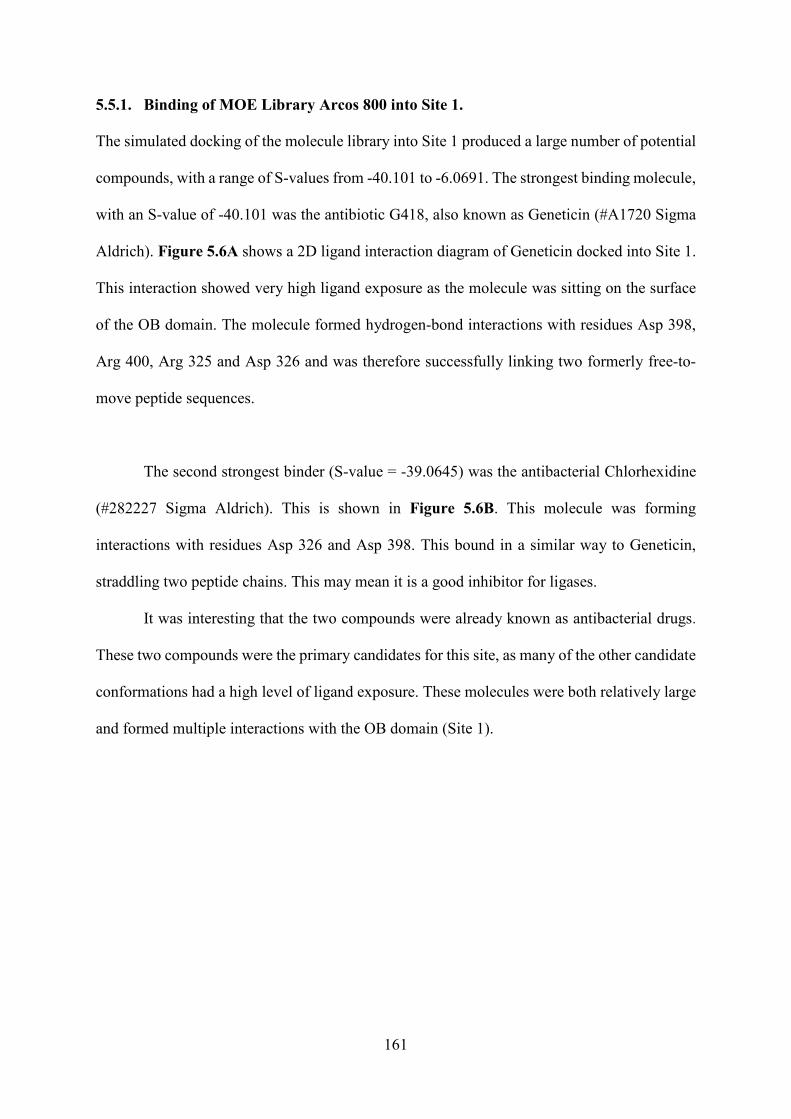
161
5.5.1. Binding of MOE Library Arcos 800 into Site 1.
The simulated docking of the molecule library into Site 1 produced a large number of potential
compounds, with a range of S-values from -40.101 to -6.0691. The strongest binding molecule,
with an S-value of -40.101 was the antibiotic G418, also known as Geneticin (#A1720 Sigma
Aldrich). Figure 5.6A shows a 2D ligand interaction diagram of Geneticin docked into Site 1.
This interaction showed very high ligand exposure as the molecule was sitting on the surface
of the OB domain. The molecule formed hydrogen-bond interactions with residues Asp 398,
Arg 400, Arg 325 and Asp 326 and was therefore successfully linking two formerly free-to-
move peptide sequences.
The second strongest binder (S-value = -39.0645) was the antibacterial Chlorhexidine
(#282227 Sigma Aldrich). This is shown in Figure 5.6B. This molecule was forming
interactions with residues Asp 326 and Asp 398. This bound in a similar way to Geneticin,
straddling two peptide chains. This may mean it is a good inhibitor for ligases.
It was interesting that the two compounds were already known as antibacterial drugs.
These two compounds were the primary candidates for this site, as many of the other candidate
conformations had a high level of ligand exposure. These molecules were both relatively large
and formed multiple interactions with the OB domain (Site 1).
162
Figure 5.6. Binding of MOE Library Arcos 800 into Site1. Panel A) 2D ligand interaction diagrams showing the interactions at binding site 1 of Geneticin (A1720 Sigma). Panel B) 2D ligand interaction diagrams showing the interactions at binding site 1 of Chlorhexidine (282227 Aldrich).
Geneticin
ChlorhexidineB
A
163
5.5.2. Binding of MOE Library Arcos 800 into Site 2.
Docking at this site produced a rage of S-values from -47.7664 to -7.5062. The strongest
binding candidate (S-value = -47.764) was Oxidised Glutathione (Glutathione disulphide)
(#49740 Sigma). Figure 5.7A shows a 2D ligand interaction diagram of Oxidised Glutathione
docked into Site 2. This molecule forms multiple interactions with various sections of the
binding pocket. It is relatively large and in an accessible region, it remains exposed.
This candidate molecule was selected as the strongest binding, which interactions with
residues 465, 486, 460, 457 and 458. The next candidate inhibitor was Imidazolidinyl urea
(#l5133 Aldrich), which had a higher S-value (S value = -35.1460). Figure 5.7B shows a 2D
ligand interaction diagram of Imidazolidinyl urea docked into Site 2. It showed an interaction
and displacement with 486, 457, 487 and 488. (see Figure 1.2 in Chapter 1). Imidazolidinyl
urea also fitted well into the binding pocket with minimal exposure.
5.5.3. Binding of MOE Library Arcos 800 into Site 3.
Site 3 is the active site of the enzyme. This is the location of reactions 1, 2 and 3 listed above.
The docking run produced a range of S-values from -47.3090 to 448.9537. This much greater
range indicates that this binding pocket is less exposed and accessible than those described
previously. As binding site 3 is an AMP binding site, it is expected that nucleotide and
nucleoside analogues will bind this site also. The strongest binding molecule was 5-
Azacytidine (S-value = -43.4276) (#A2385 Sigma) a chemotherapeutic nucleoside analogue
which form a direct sidechain hydrogen bind with Lys 115, Glu 113 and Leu 116. Figure 5.8A
shows a 2D ligand interaction diagram of 5-Azacytidine docked into Site 3. Imidazo[1,2-
a]pyridine-7-carboxylic acid was the second candidate with S-value -29.5067 (#CDS017300
Aldrich). Figure 5.8B shows a 2D ligand interaction diagram of Imidazo[1,2-a]pyridine-7-
carboxylic acid docked into Site 3.
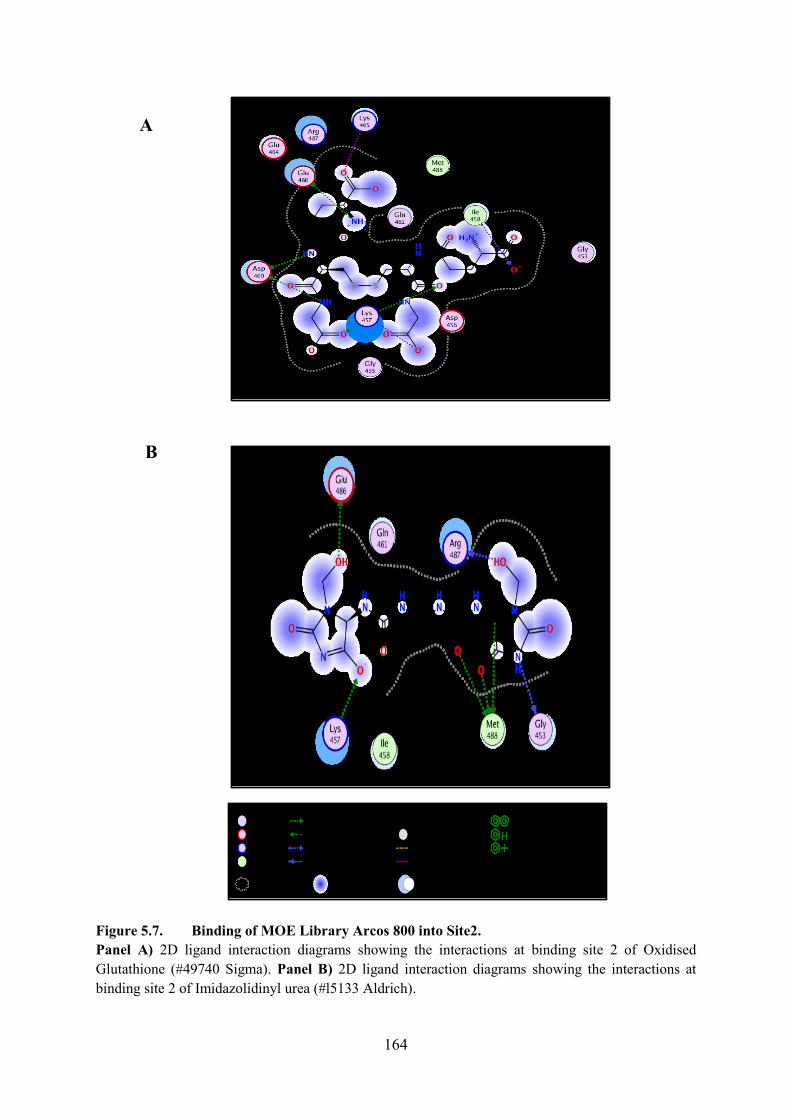
164
Figure 5.7. Binding of MOE Library Arcos 800 into Site2. Panel A) 2D ligand interaction diagrams showing the interactions at binding site 2 of Oxidised Glutathione (#49740 Sigma). Panel B) 2D ligand interaction diagrams showing the interactions at binding site 2 of Imidazolidinyl urea (#l5133 Aldrich).
Oxidised Glutathione
Imidazolidinyl urea
A
B
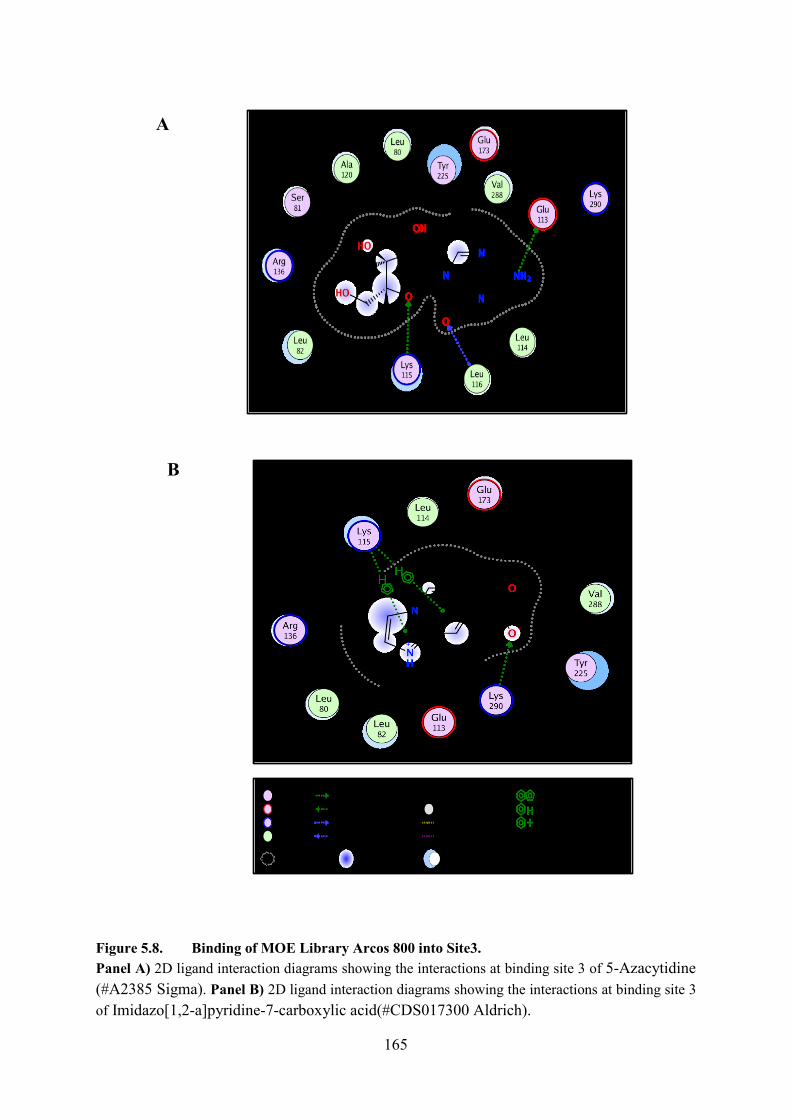
165
Figure 5.8. Binding of MOE Library Arcos 800 into Site3. Panel A) 2D ligand interaction diagrams showing the interactions at binding site 3 of 5-Azacytidine (#A2385 Sigma). Panel B) 2D ligand interaction diagrams showing the interactions at binding site 3 of Imidazo[1,2-a]pyridine-7-carboxylic acid(#CDS017300 Aldrich).
5-Azacytidine
Imidazo[1,2-a]pyridine-7-carboxylic
A
B
166
5.5.4. Binding of MOE Library Arcos 800 into Site 4.
Site 4 is composed of amino acid residues from both the Ia and NTase domains. It is speculated
that this region is essential to the priming reaction 1. The site also contains residues 35 and 36
both of which, when mutated induce a ≥ 99.8% reduction in nick ligation.
(Table 5.1 above). For this site, the first candidate was Bestatin/Ubenimex (S-value = -
36.7435) (#482609 Aldrich).
Figure 5.9A shows a 2D ligand interaction diagram of Bestatin/Ubenimex docked into
Site 4. This molecule formed hydrogen-bond interactions with residues Arg 43, Asp 36, Ala
65 and Ser 147. 2-(Aminometyl) imidazole (S-value = - 36.1202) (#723340 Aldrich) have been
selected. These have been selected as they both interact directly with Asp 36 and fit well in the
binding pore, Ser 147, Leu 210, Phe 70 and Ala 68. Figure 5.9B shows a 2D ligand interaction
diagram of 2-(Aminometyl) imidazole docked into Site 4.
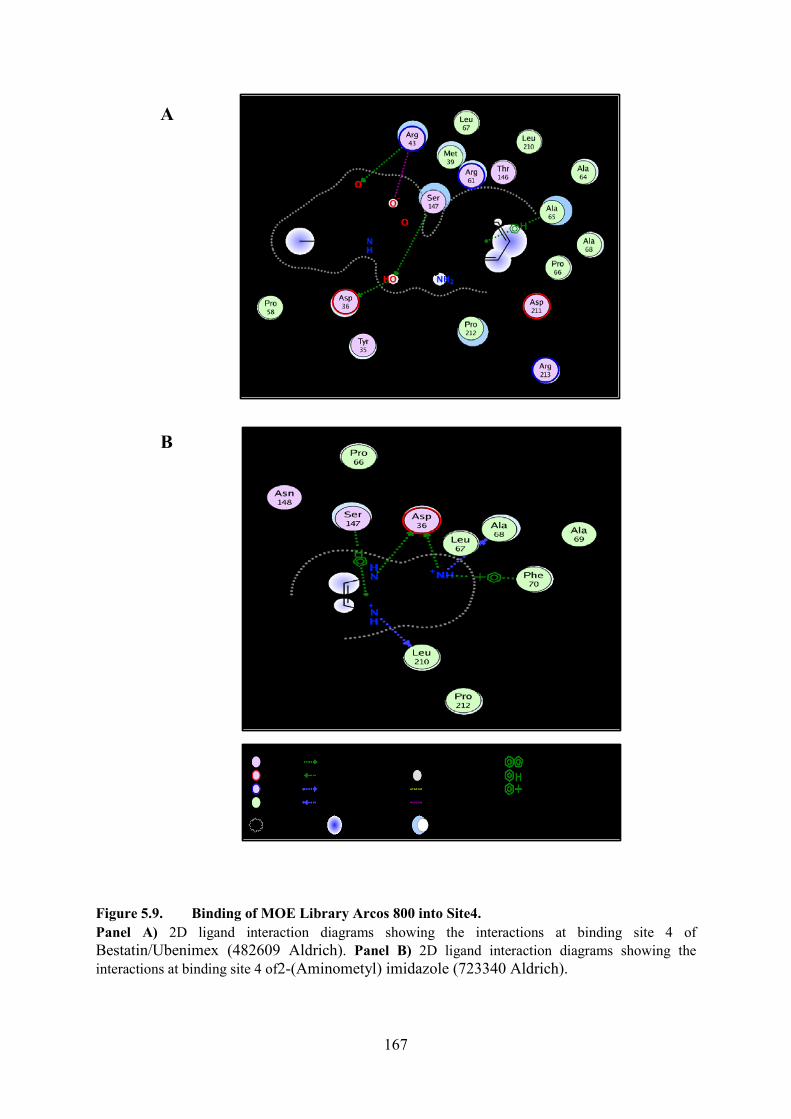
167
Figure 5.9. Binding of MOE Library Arcos 800 into Site4. Panel A) 2D ligand interaction diagrams showing the interactions at binding site 4 ofBestatin/Ubenimex (482609 Aldrich). Panel B) 2D ligand interaction diagrams showing the interactions at binding site 4 of2-(Aminometyl) imidazole (723340 Aldrich).
Bestatin/Ubenime
2-(Aminomethyl) imidazole
A
B
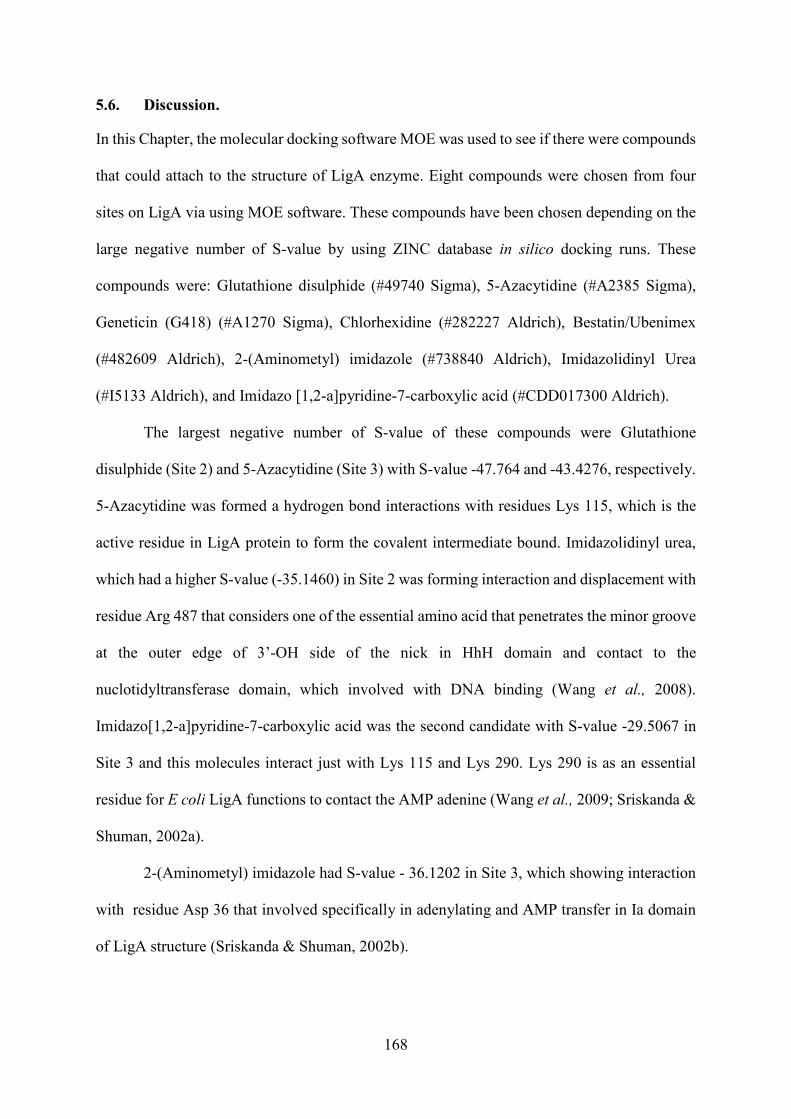
168
5.6. Discussion.
In this Chapter, the molecular docking software MOE was used to see if there were compounds
that could attach to the structure of LigA enzyme. Eight compounds were chosen from four
sites on LigA via using MOE software. These compounds have been chosen depending on the
large negative number of S-value by using ZINC database in silico docking runs. These
compounds were: Glutathione disulphide (#49740 Sigma), 5-Azacytidine (#A2385 Sigma),
Geneticin (G418) (#A1270 Sigma), Chlorhexidine (#282227 Aldrich), Bestatin/Ubenimex
(#482609 Aldrich), 2-(Aminometyl) imidazole (#738840 Aldrich), Imidazolidinyl Urea
(#I5133 Aldrich), and Imidazo [1,2-a]pyridine-7-carboxylic acid (#CDD017300 Aldrich).
The largest negative number of S-value of these compounds were Glutathione
disulphide (Site 2) and 5-Azacytidine (Site 3) with S-value -47.764 and -43.4276, respectively.
5-Azacytidine was formed a hydrogen bond interactions with residues Lys 115, which is the
active residue in LigA protein to form the covalent intermediate bound. Imidazolidinyl urea,
which had a higher S-value (-35.1460) in Site 2 was forming interaction and displacement with
residue Arg 487 that considers one of the essential amino acid that penetrates the minor groove
at the outer edge of 3�-OH side of the nick in HhH domain and contact to the
nuclotidyltransferase domain, which involved with DNA binding (Wang et al., 2008).
Imidazo[1,2-a]pyridine-7-carboxylic acid was the second candidate with S-value -29.5067 in
Site 3 and this molecules interact just with Lys 115 and Lys 290. Lys 290 is as an essential
residue for E coli LigA functions to contact the AMP adenine (Wang et al., 2009; Sriskanda &
Shuman, 2002a).
2-(Aminometyl) imidazole had S-value - 36.1202 in Site 3, which showing interaction
with residue Asp 36 that involved specifically in adenylating and AMP transfer in Ia domain
of LigA structure (Sriskanda & Shuman, 2002b).
169
The further MOE experiments that I suggest is to do the homologous sites in different
bacteria to see if the compounds that bind that site regardless of any S-value will inhibit the
different bacteria in vitro and in vivo and inhibit the growing of bacteria (see Figure 1.4 in
Chapter 1). Because of the crystal structure of LigB protein was not solved yet, LigB has
limitation in MOE techniques. However, the manually alignment of the primary and secondary
structures of LigB and LigA was done by Clustal programme (see Figure 1.3 in Chapter1).
The next Chapter (Chapter 6) explores these eight compounds tested firstly in vitro by ligation
assays with LigA using denaturing gel and in vivo using Kirby Bauer technique.
The biological activities of some of these eight compounds are already known, for
example: 5-Azacytidine is a chemical analogue of cytidine in DNA or RNA. It is effects on
DNA and protein synthesis in embryonic tissues, cells in tissue culture, regenerating livers,
bacteria and phages (Čihák, 1974). It is used in the treatment of myelodysplastic syndrome
and sometimes used for acute myeloid leukaemia (Estey, 2013). Geneticin blocks polypeptide
synthesise by inhibiting the elongation step in both prokaryotic and eukaryotic cells (Vicens et
al., 2003). Chlorhexidine is an antiseptic that is used for skin disinfection before surgery in
hospital. It has a positive charge that allows to interact with the cell wall of bacteria as negative
charge and inhibit it (Davis et al., 2010). Bestatin (Ubenimex) is known as protease inhibitor
and is being studied for use in the treatment of acute myelocytic leukemia (Hirayama, et al.,
2003) and lymphedema (Tian, et al., 2017). More discussion about their inhibitions in vitro on
E.coli DNA ligase LigA and in vivo are shown in Chapter 6.
170
Chapter 6: In vitro and In vivo inhibition Assay of native LigA protein.
The previous study and data of Molecular Operating Environment in Chapter 5 described the
successful docking of the compounds on native LigA protein using in silico technique.
Accordingly, this results chapter utilises this enzyme (native LigA) for inhibition studies with
the different compounds and different concentrations. Compounds were selected based on the
tightness of the binding and ordered for in vitro testing where their IC5o values were measured
and the most successful with the greatest potential for future drug studies. Key questions
addressed in this chapter within this work include, whether these compounds or inhibitors can
inhibit the LigA protein in vitro or in vivo as well.
Here in this chapter we will describe the various in vitro (denaturing gel) and in vivo
(Kirby-Bauer) experiments that were used to investigate whether these different compounds
that have a high negative number of S-value (MOE) can bind to LigA and affect its activity
through a combination of in silico, in vitro and in vivo techniques. The resulting data in this
chapter will provide information about which compound or inhibitor that can use and inhibit
the LigA protein making it a promising antibiotic target in the future. This will be a building
block towards potential future studies of inhibitions that could then explore and exploit small-
molecule chemical libraries for compounds that affect and kill the bacteria.
6.1. Design of in vitro Assays.
In this study the powerful combination was to identify new compounds or inhibitor that
selected via using MOE technique with the ability to bind to the LigA enzyme. Eight starting
compounds were filtered out of 800 potential compounds that showed the ability to limit or
stop the function of LigA in the process of nick repairing in DNA by using molecular docking
(in silico) (previous chapter).
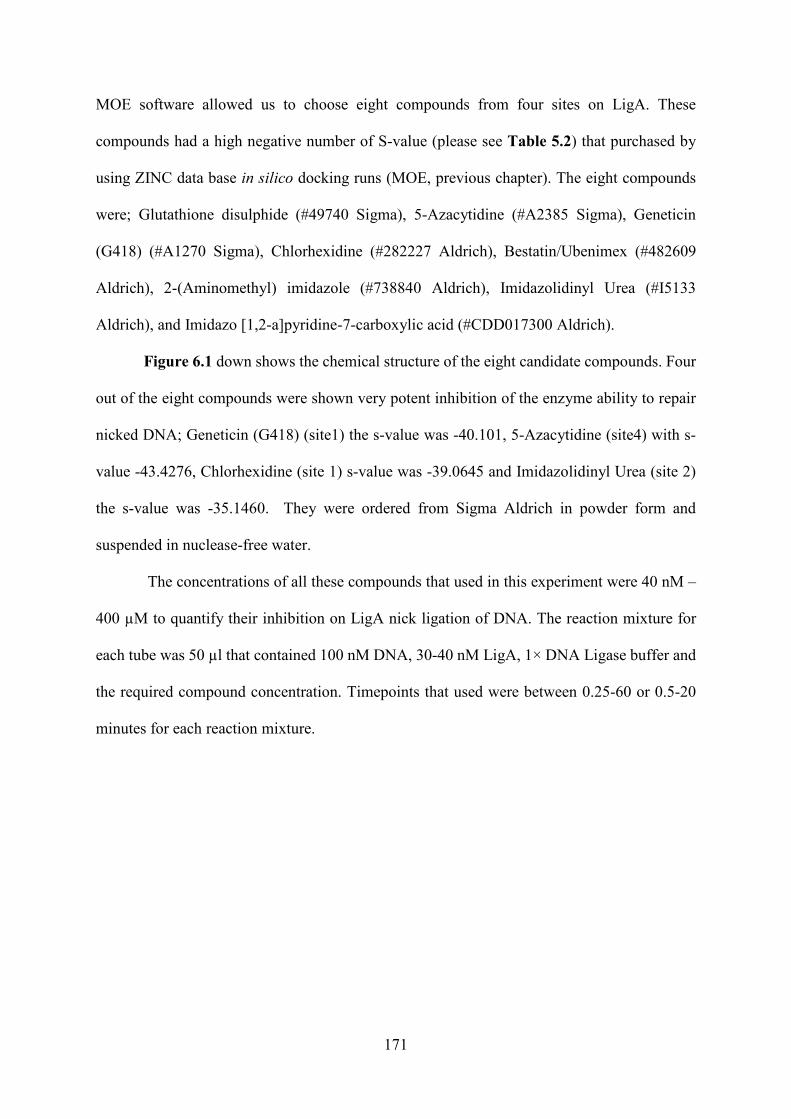
171
MOE software allowed us to choose eight compounds from four sites on LigA. These
compounds had a high negative number of S-value (please see Table 5.2) that purchased by
using ZINC data base in silico docking runs (MOE, previous chapter). The eight compounds
were; Glutathione disulphide (#49740 Sigma), 5-Azacytidine (#A2385 Sigma), Geneticin
(G418) (#A1270 Sigma), Chlorhexidine (#282227 Aldrich), Bestatin/Ubenimex (#482609
Aldrich), 2-(Aminomethyl) imidazole (#738840 Aldrich), Imidazolidinyl Urea (#I5133
Aldrich), and Imidazo [1,2-a]pyridine-7-carboxylic acid (#CDD017300 Aldrich).
Figure 6.1 down shows the chemical structure of the eight candidate compounds. Four
out of the eight compounds were shown very potent inhibition of the enzyme ability to repair
nicked DNA; Geneticin (G418) (site1) the s-value was -40.101, 5-Azacytidine (site4) with s-
value -43.4276, Chlorhexidine (site 1) s-value was -39.0645 and Imidazolidinyl Urea (site 2)
the s-value was -35.1460. They were ordered from Sigma Aldrich in powder form and
suspended in nuclease-free water.
The concentrations of all these compounds that used in this experiment were 40 nM �
400 µM to quantify their inhibition on LigA nick ligation of DNA. The reaction mixture for
each tube was 50 µl that contained 100 nM DNA, 30-40 nM LigA, 1× DNA Ligase buffer and
the required compound concentration. Timepoints that used were between 0.25-60 or 0.5-20
minutes for each reaction mixture.
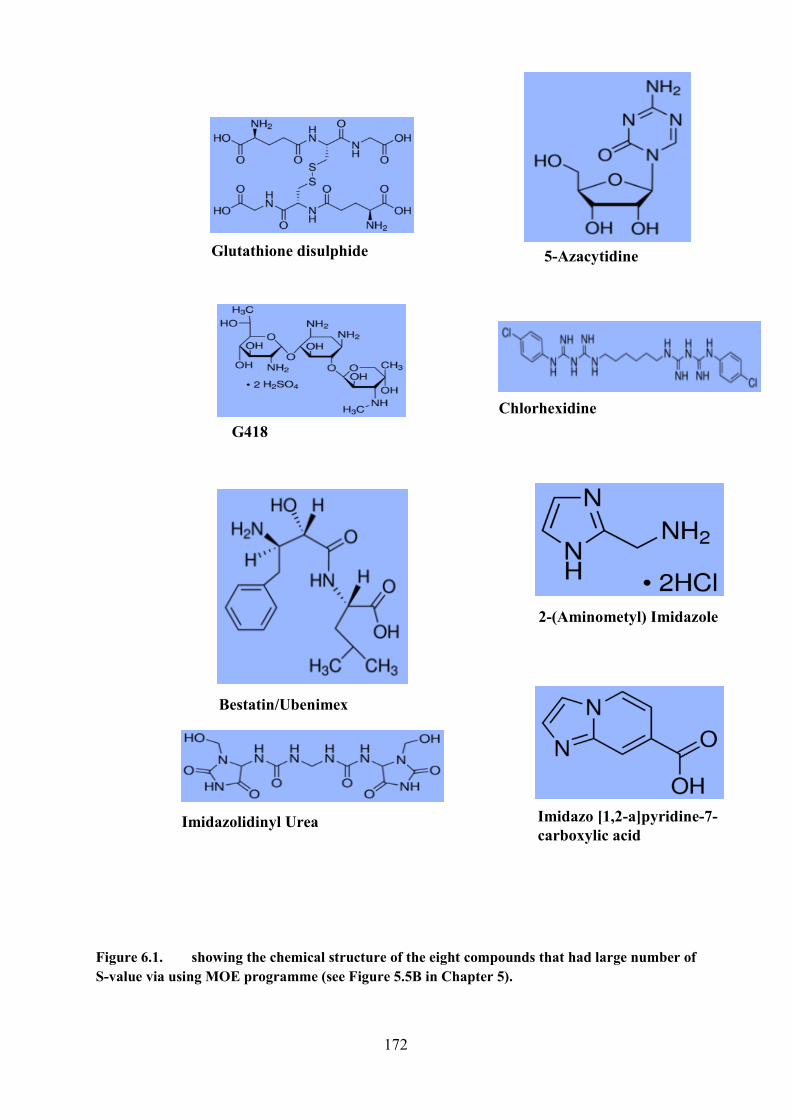
172
Figure 6.1. showing the chemical structure of the eight compounds that had large number of S-value via using MOE programme (see Figure 5.5B in Chapter 5).
G418 Chlorhexidine
Glutathione disulphide
Imidazolidinyl Urea
5-Azacytidine
Imidazo [1,2-a]pyridine-7-carboxylic acid
Bestatin/Ubenimex
2-(Aminometyl) Imidazole
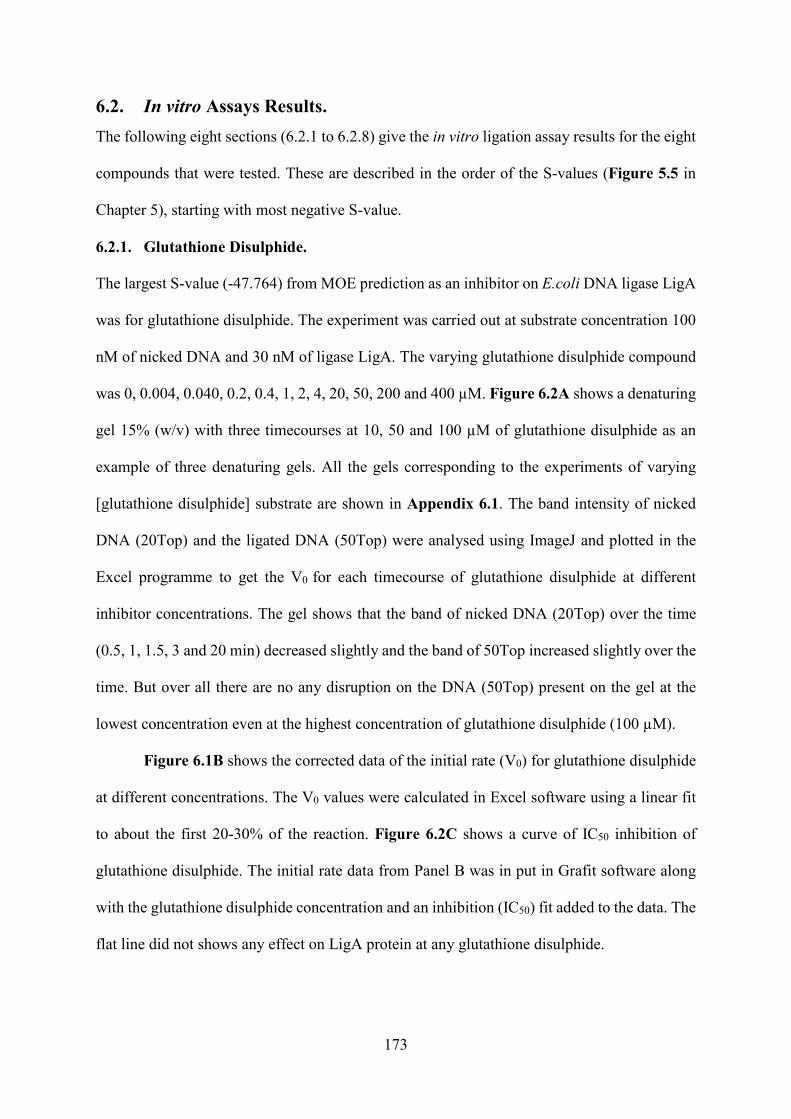
173
6.2. In vitro Assays Results. The following eight sections (6.2.1 to 6.2.8) give the in vitro ligation assay results for the eight
compounds that were tested. These are described in the order of the S-values (Figure 5.5 in
Chapter 5), starting with most negative S-value.
6.2.1. Glutathione Disulphide.
The largest S-value (-47.764) from MOE prediction as an inhibitor on E.coli DNA ligase LigA
was for glutathione disulphide. The experiment was carried out at substrate concentration 100
nM of nicked DNA and 30 nM of ligase LigA. The varying glutathione disulphide compound
was 0, 0.004, 0.040, 0.2, 0.4, 1, 2, 4, 20, 50, 200 and 400 µM. Figure 6.2A shows a denaturing
gel 15% (w/v) with three timecourses at 10, 50 and 100 µM of glutathione disulphide as an
example of three denaturing gels. All the gels corresponding to the experiments of varying
[glutathione disulphide] substrate are shown in Appendix 6.1. The band intensity of nicked
DNA (20Top) and the ligated DNA (50Top) were analysed using ImageJ and plotted in the
Excel programme to get the V0 for each timecourse of glutathione disulphide at different
inhibitor concentrations. The gel shows that the band of nicked DNA (20Top) over the time
(0.5, 1, 1.5, 3 and 20 min) decreased slightly and the band of 50Top increased slightly over the
time. But over all there are no any disruption on the DNA (50Top) present on the gel at the
lowest concentration even at the highest concentration of glutathione disulphide (100 µM).
Figure 6.1B shows the corrected data of the initial rate (V0) for glutathione disulphide
at different concentrations. The V0 values were calculated in Excel software using a linear fit
to about the first 20-30% of the reaction. Figure 6.2C shows a curve of IC50 inhibition of
glutathione disulphide. The initial rate data from Panel B was in put in Grafit software along
with the glutathione disulphide concentration and an inhibition (IC50) fit added to the data. The
flat line did not shows any effect on LigA protein at any glutathione disulphide.
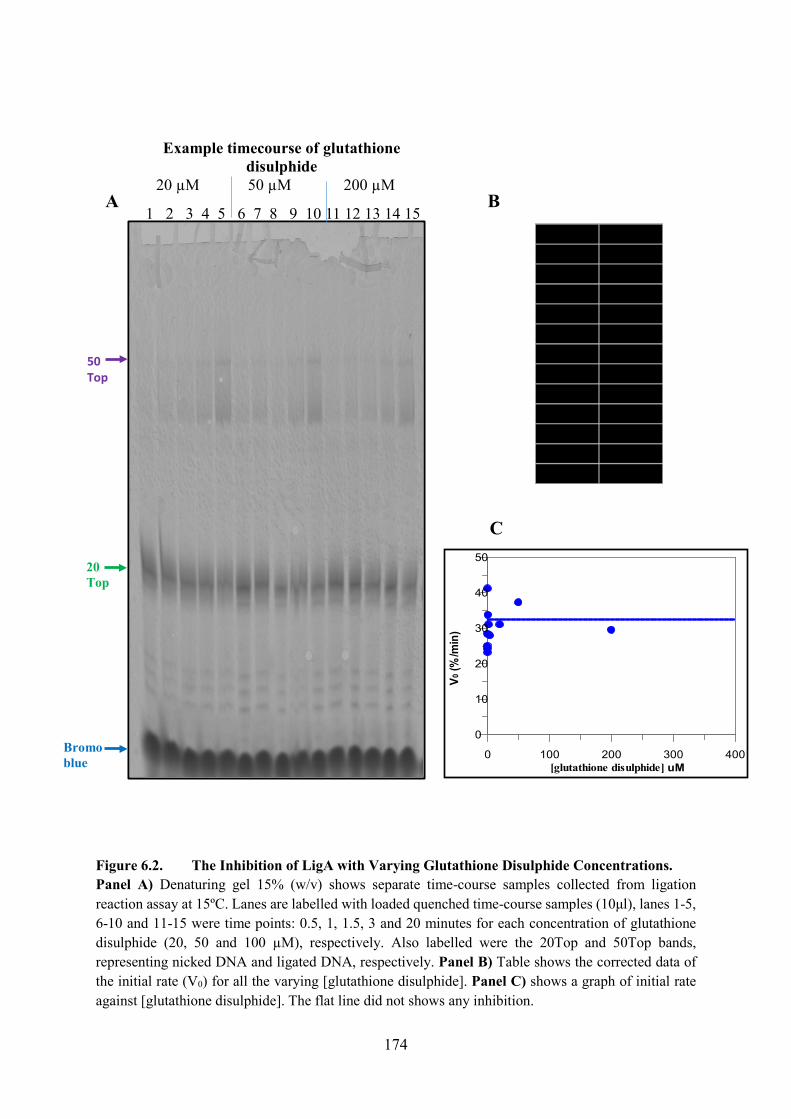
174
Figure 6.2. The Inhibition of LigA with Varying Glutathione Disulphide Concentrations.Panel A) Denaturing gel 15% (w/v) shows separate time-course samples collected from ligation reaction assay at 15ºC. Lanes are labelled with loaded quenched time-course samples (10μl), lanes 1-5, 6-10 and 11-15 were time points: 0.5, 1, 1.5, 3 and 20 minutes for each concentration of glutathione disulphide (20, 50 and 100 µM), respectively. Also labelled were the 20Top and 50Top bands, representing nicked DNA and ligated DNA, respectively. Panel B) Table shows the corrected data of the initial rate (V0) for all the varying [glutathione disulphide]. Panel C) shows a graph of initial rate against [glutathione disulphide]. The flat line did not shows any inhibition.
1 2 3 4 5 6 7 8 9 10 11 12 13 14 15
50 Top
Bromo blue
C
Example timecourse of glutathione disulphide
20 µM 50 µM 200 µM A B
[glutathione disulphide] uM0 100 200 300 400
V0 (%
/min
)
0
10
20
30
40
5020 Top
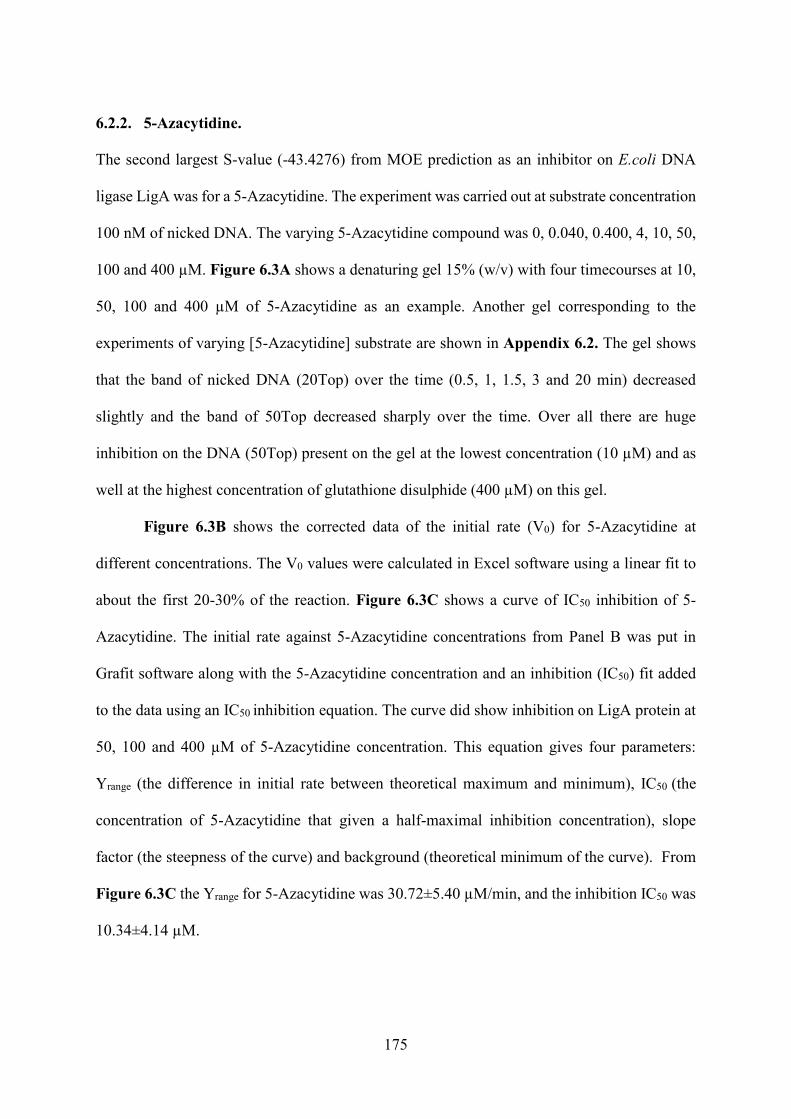
175
6.2.2. 5-Azacytidine.
The second largest S-value (-43.4276) from MOE prediction as an inhibitor on E.coli DNA
ligase LigA was for a 5-Azacytidine. The experiment was carried out at substrate concentration
100 nM of nicked DNA. The varying 5-Azacytidine compound was 0, 0.040, 0.400, 4, 10, 50,
100 and 400 µM. Figure 6.3A shows a denaturing gel 15% (w/v) with four timecourses at 10,
50, 100 and 400 µM of 5-Azacytidine as an example. Another gel corresponding to the
experiments of varying [5-Azacytidine] substrate are shown in Appendix 6.2. The gel shows
that the band of nicked DNA (20Top) over the time (0.5, 1, 1.5, 3 and 20 min) decreased
slightly and the band of 50Top decreased sharply over the time. Over all there are huge
inhibition on the DNA (50Top) present on the gel at the lowest concentration (10 µM) and as
well at the highest concentration of glutathione disulphide (400 µM) on this gel.
Figure 6.3B shows the corrected data of the initial rate (V0) for 5-Azacytidine at
different concentrations. The V0 values were calculated in Excel software using a linear fit to
about the first 20-30% of the reaction. Figure 6.3C shows a curve of IC50 inhibition of 5-
Azacytidine. The initial rate against 5-Azacytidine concentrations from Panel B was put in
Grafit software along with the 5-Azacytidine concentration and an inhibition (IC50) fit added
to the data using an IC50 inhibition equation. The curve did show inhibition on LigA protein at
50, 100 and 400 µM of 5-Azacytidine concentration. This equation gives four parameters:
Yrange (the difference in initial rate between theoretical maximum and minimum), IC50 (the
concentration of 5-Azacytidine that given a half-maximal inhibition concentration), slope
factor (the steepness of the curve) and background (theoretical minimum of the curve). From
Figure 6.3C the Yrange for 5-Azacytidine was 30.72±5.40 µM/min, and the inhibition IC50 was
10.34±4.14 µM.
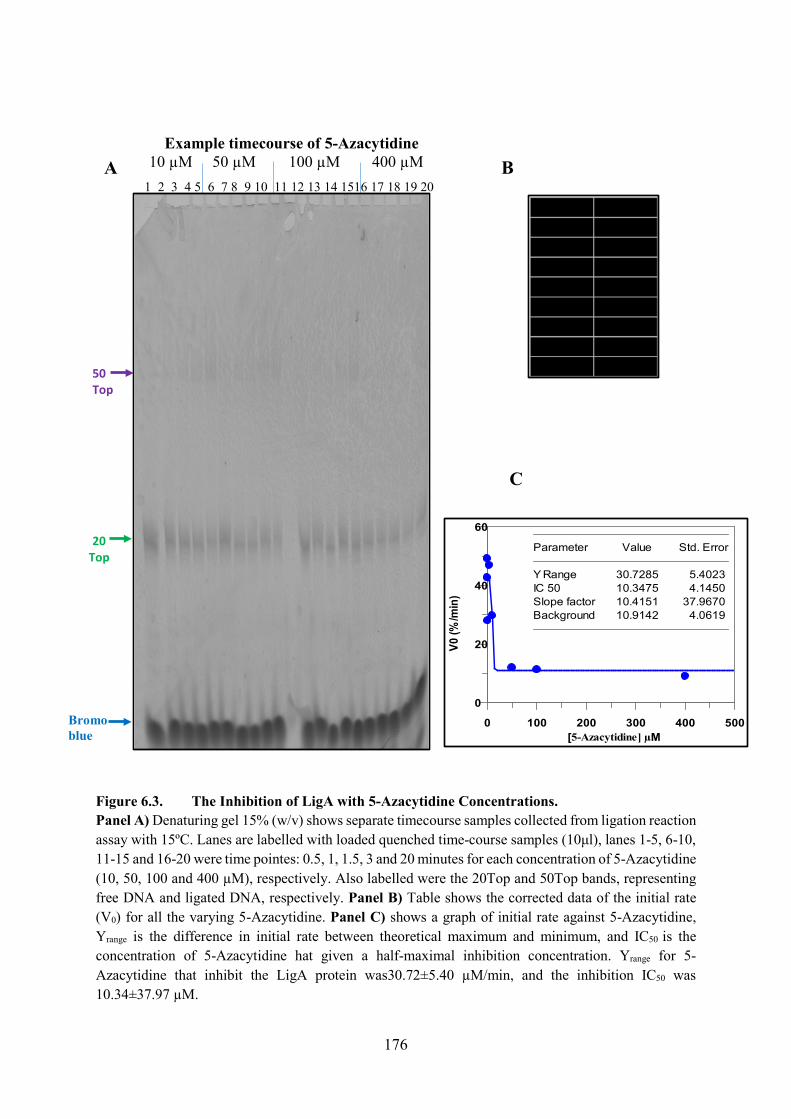
176
Figure 6.3. The Inhibition of LigA with 5-Azacytidine Concentrations.Panel A) Denaturing gel 15% (w/v) shows separate timecourse samples collected from ligation reaction assay with 15ºC. Lanes are labelled with loaded quenched time-course samples (10μl), lanes 1-5, 6-10, 11-15 and 16-20 were time pointes: 0.5, 1, 1.5, 3 and 20 minutes for each concentration of 5-Azacytidine (10, 50, 100 and 400 µM), respectively. Also labelled were the 20Top and 50Top bands, representing free DNA and ligated DNA, respectively. Panel B) Table shows the corrected data of the initial rate (V0) for all the varying 5-Azacytidine. Panel C) shows a graph of initial rate against 5-Azacytidine, Yrange is the difference in initial rate between theoretical maximum and minimum, and IC50 is the concentration of 5-Azacytidine hat given a half-maximal inhibition concentration. Yrange for 5-Azacytidine that inhibit the LigA protein was30.72±5.40 µM/min, and the inhibition IC50 was 10.34±37.97 µM.
20 Top
50 Top
Bromo blue
A
C
[5-Azacytidine] µM0 100 200 300 400 500
V0 (%
/min
)
0
20
40
60
Parameter Value Std. Error
Y Range 30.7285 5.4023IC 50 10.3475 4.1450Slope factor 10.4151 37.9670Background 10.9142 4.0619
1 2 3 4 5 6 7 8 9 10 11 12 13 14 1516 17 18 19 20
Example timecourse of 5-Azacytidine 10 µM 50 µM 100 µM 400 µM B
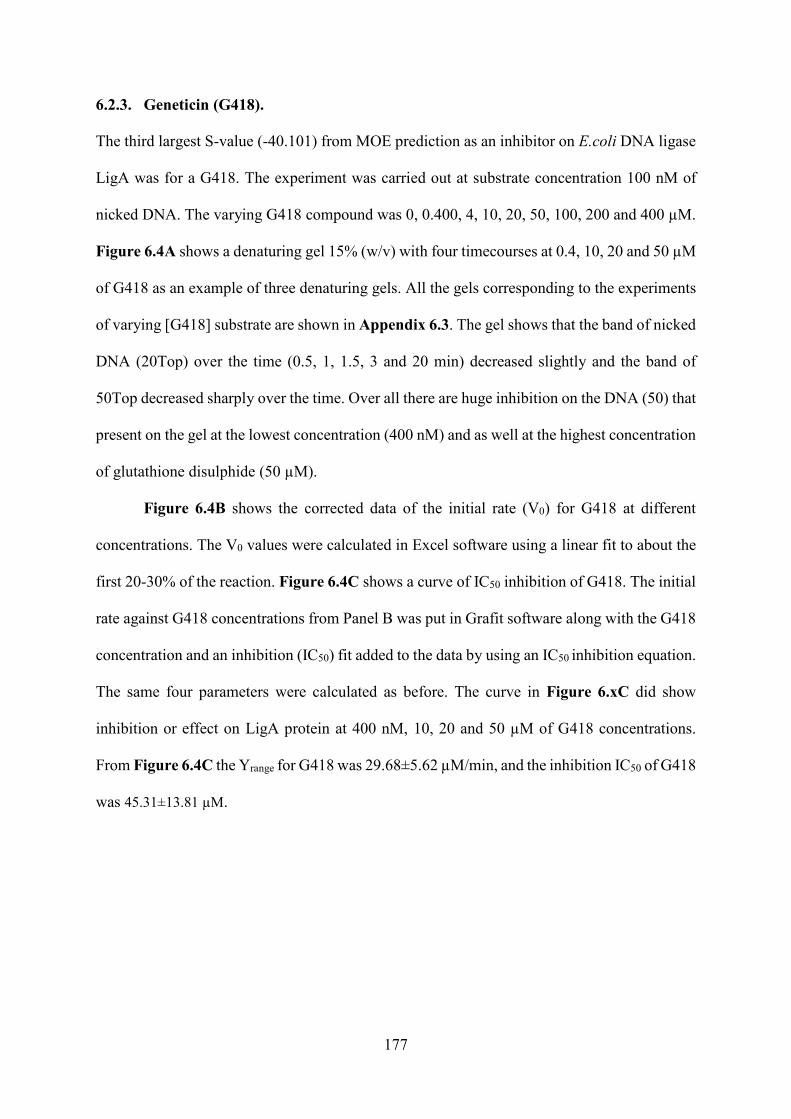
177
6.2.3. Geneticin (G418).
The third largest S-value (-40.101) from MOE prediction as an inhibitor on E.coli DNA ligase
LigA was for a G418. The experiment was carried out at substrate concentration 100 nM of
nicked DNA. The varying G418 compound was 0, 0.400, 4, 10, 20, 50, 100, 200 and 400 µM.
Figure 6.4A shows a denaturing gel 15% (w/v) with four timecourses at 0.4, 10, 20 and 50 µM
of G418 as an example of three denaturing gels. All the gels corresponding to the experiments
of varying [G418] substrate are shown in Appendix 6.3. The gel shows that the band of nicked
DNA (20Top) over the time (0.5, 1, 1.5, 3 and 20 min) decreased slightly and the band of
50Top decreased sharply over the time. Over all there are huge inhibition on the DNA (50) that
present on the gel at the lowest concentration (400 nM) and as well at the highest concentration
of glutathione disulphide (50 µM).
Figure 6.4B shows the corrected data of the initial rate (V0) for G418 at different
concentrations. The V0 values were calculated in Excel software using a linear fit to about the
first 20-30% of the reaction. Figure 6.4C shows a curve of IC50 inhibition of G418. The initial
rate against G418 concentrations from Panel B was put in Grafit software along with the G418
concentration and an inhibition (IC50) fit added to the data by using an IC50 inhibition equation.
The same four parameters were calculated as before. The curve in Figure 6.xC did show
inhibition or effect on LigA protein at 400 nM, 10, 20 and 50 µM of G418 concentrations.
From Figure 6.4C the Yrange for G418 was 29.68±5.62 µM/min, and the inhibition IC50 of G418
was 45.31±13.81 µM.
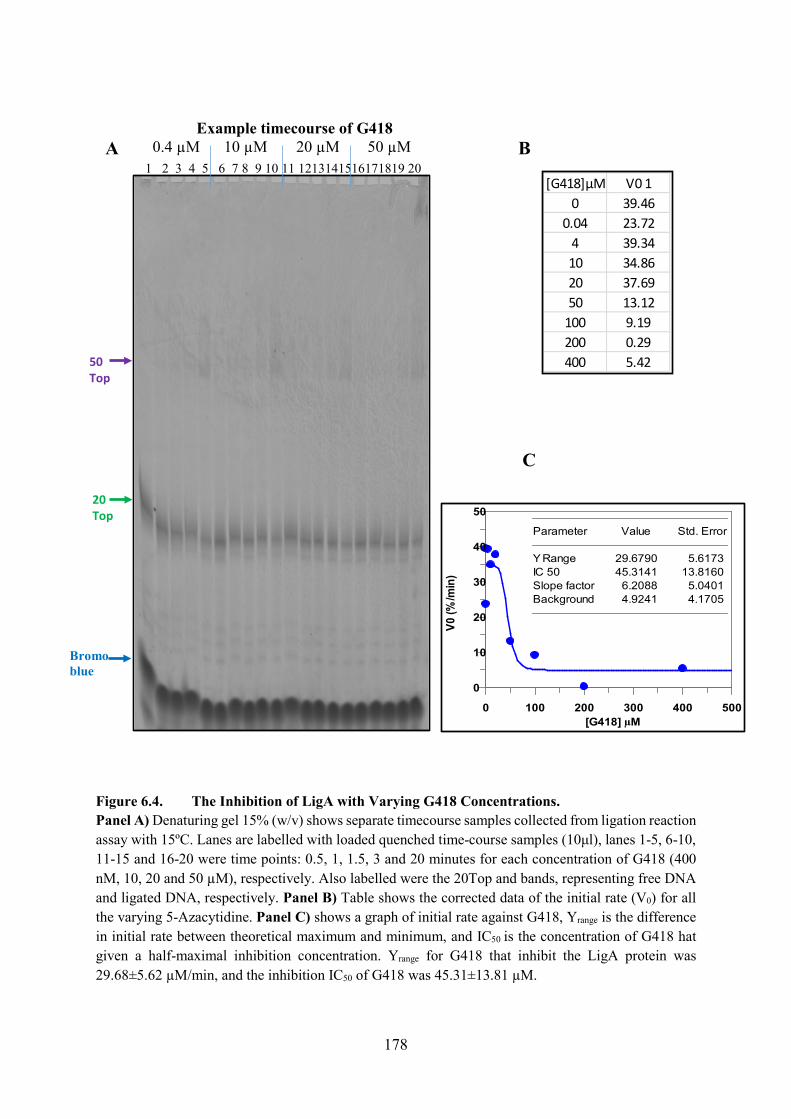
178
Figure 6.4. The Inhibition of LigA with Varying G418 Concentrations.Panel A) Denaturing gel 15% (w/v) shows separate timecourse samples collected from ligation reaction assay with 15ºC. Lanes are labelled with loaded quenched time-course samples (10μl), lanes 1-5, 6-10, 11-15 and 16-20 were time points: 0.5, 1, 1.5, 3 and 20 minutes for each concentration of G418 (400 nM, 10, 20 and 50 µM), respectively. Also labelled were the 20Top and bands, representing free DNA and ligated DNA, respectively. Panel B) Table shows the corrected data of the initial rate (V0) for all the varying 5-Azacytidine. Panel C) shows a graph of initial rate against G418, Yrange is the difference in initial rate between theoretical maximum and minimum, and IC50 is the concentration of G418 hat given a half-maximal inhibition concentration. Yrange for G418 that inhibit the LigA protein was 29.68±5.62 µM/min, and the inhibition IC50 of G418 was 45.31±13.81 µM.
1 2 3 4 5 6 7 8 9 10 11 1213141516171819 20
50 Top
Bromo blue
C
A B
[G418]µM V0 10 39.46
0.04 23.724 39.3410 34.8620 37.6950 13.12
100 9.19200 0.29400 5.42
20Top
[G418] µM0 100 200 300 400 500
V0 (%
/min
)
0
10
20
30
40
50
Parameter Value Std. Error
Y Range 29.6790 5.6173IC 50 45.3141 13.8160Slope factor 6.2088 5.0401Background 4.9241 4.1705
Example timecourse of G418 0.4 µM 10 µM 20 µM 50 µM
179
6.2.4. Chlorhexidine.
The fourth largest S-value (-39.0645) from MOE prediction as an inhibitor on E.coli DNA
ligase LigA was for Chlorhexidine. The experiment was carried out at substrate concentration
100 nM of nicked DNA. The varying Chlorhexidine compound was 0, 0.040, 0.400, 4, 20, 50,
100 and 400 µM. Figure 6.5A shows a denaturing gel 15% (w/v) with four timecourses at 50,
100, 200 and 400 µM of a Chlorhexidine as an example. Another gel corresponding to the
experiments of varying [Chlorhexidine] substrate are shown in Appendix 6.4.
The gel shows that the band of nicked DNA (20Top) over the time (0.5, 1, 1.5, 3 and 20 min)
decreased sharply especially at 400 µM, and chlorhexidine visually showed the largest
disruption to nick repair (Figure 6.5A). At the 100, 200 and 400 µM concentrations there was
no visible 50 base DNA present on the gel, showing its apparent complete disruption to DNA
repair. This was not shown on the other compounds tested.
Figure 6.5B shows the corrected data of the initial rate (V0) for chlorhexidine at
different concentrations. Figure 6.5C shows a curve of IC50 inhibition of chlorhexidine. The
curve did show inhibition on LigA protein at 50, 100, 200 and 400 µM of chlorhexidine
concentration. From Figure 6.5C the Yrange for chlorhexidine was 27.98±2.73 µM/min, and the
inhibition IC50 was 20.66±6.11 µM.
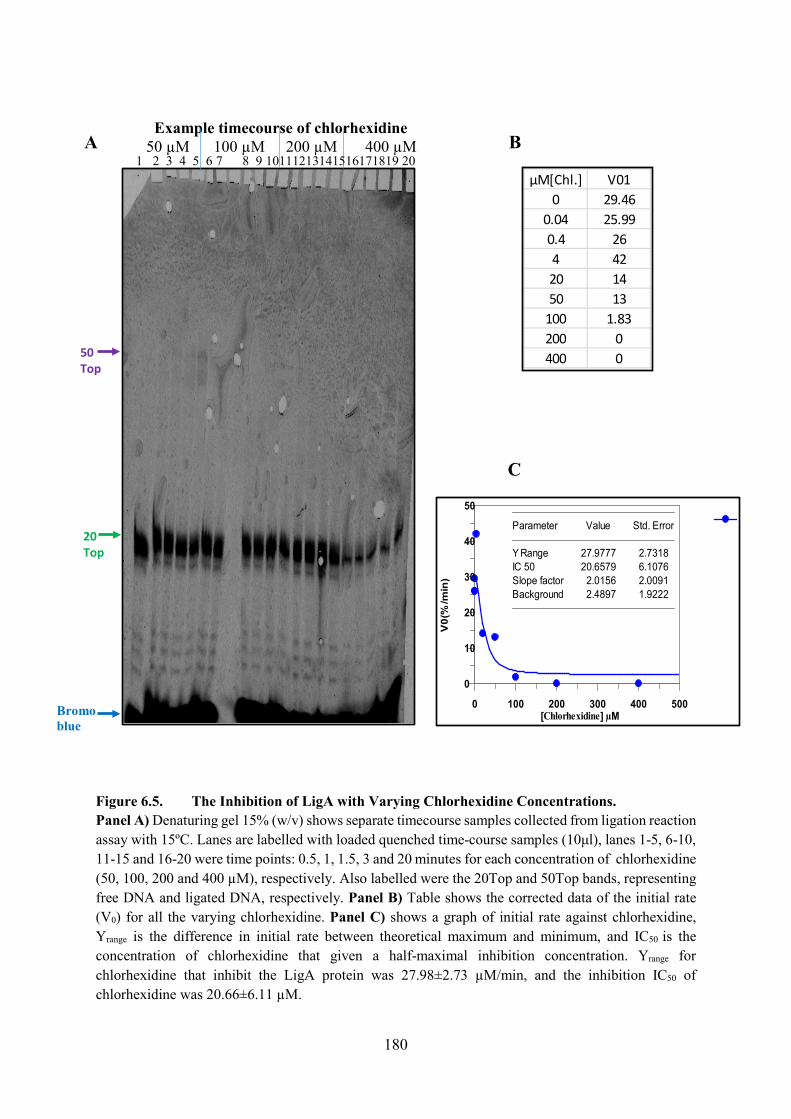
180
Figure 6.5. The Inhibition of LigA with Varying Chlorhexidine Concentrations.Panel A) Denaturing gel 15% (w/v) shows separate timecourse samples collected from ligation reaction assay with 15ºC. Lanes are labelled with loaded quenched time-course samples (10μl), lanes 1-5, 6-10, 11-15 and 16-20 were time points: 0.5, 1, 1.5, 3 and 20 minutes for each concentration of chlorhexidine (50, 100, 200 and 400 µM), respectively. Also labelled were the 20Top and 50Top bands, representing free DNA and ligated DNA, respectively. Panel B) Table shows the corrected data of the initial rate (V0) for all the varying chlorhexidine. Panel C) shows a graph of initial rate against chlorhexidine, Yrange is the difference in initial rate between theoretical maximum and minimum, and IC50 is the concentration of chlorhexidine that given a half-maximal inhibition concentration. Yrange for chlorhexidine that inhibit the LigA protein was 27.98±2.73 µM/min, and the inhibition IC50 of chlorhexidine was 20.66±6.11 µM.
Example timecourse of chlorhexidine 50 µM 100 µM 200 µM 400 µM
20Top
50 Top
Bromo blue
A B
[Chlorhexidine] µM 0 100 200 300 400 500
V0(
%/m
in)
0
10
20
30
40
50
Parameter Value Std. Error
Y Range 27.9777 2.7318IC 50 20.6579 6.1076Slope factor 2.0156 2.0091Background 2.4897 1.9222
µM[Chl.] V010 29.46
0.04 25.990.4 264 4220 1450 13
100 1.83200 0400 0
C
1 2 3 4 5 6 7 8 9 10111213141516171819 20
181
6.2.5. Bestatin.
The fifth largest S-value (-36.7435) from MOE prediction as an inhibitor on E.coli DNA ligase
LigA was for Bestatin. The experiment was carried out at substrate concentration 100 nM of
nicked DNA. The varying Bestatin compound was 0, 0.040, 0.4, 4, 10, 20, 50, 100 and 400
µM. Figure 6.6A shows a denaturing gel 15% (w/v) with two timecourses at 40 and 400 nM
of Bestatin as an example of two denaturing gels. All the gels corresponding to the experiments
of varying [Bestatin] substrate are shown in Appendix 6.5. The band intensity of nicked DNA
(20Top) and the ligated DNA (50Top) were analysed using ImageJ and plotted in the Excel
programme to get the V0 for each timecourse of Bestatin at different inhibitor concentrations.
The gel shows that the band of nicked DNA (20Top) over the time (0.5, 1, 1.5, 3 and 20 min)
decreased slightly and the band of 50Top increased slightly over the time. But over all there
are no disruption on the DNA (50Top) present on this gel at the lowest concentration even at
the highest concentration of Bestatin (100 µM).
Figure 6.6B shows the corrected data of the initial rate (V0) for Bestatin at different
concentrations. The V0 values were calculated in Excel software using a linear fit to about the
first 30% of the reaction. Figure 6.6C shows a curve of IC50 inhibition of Bestatin. The initial
rate data from Panel B was in put in Grafit software along with the Bestatin concentration and
an inhibition (IC50) fit added to the data. The flat line did not shows any inhibition or effect on
LigA protein at any Bestatin.
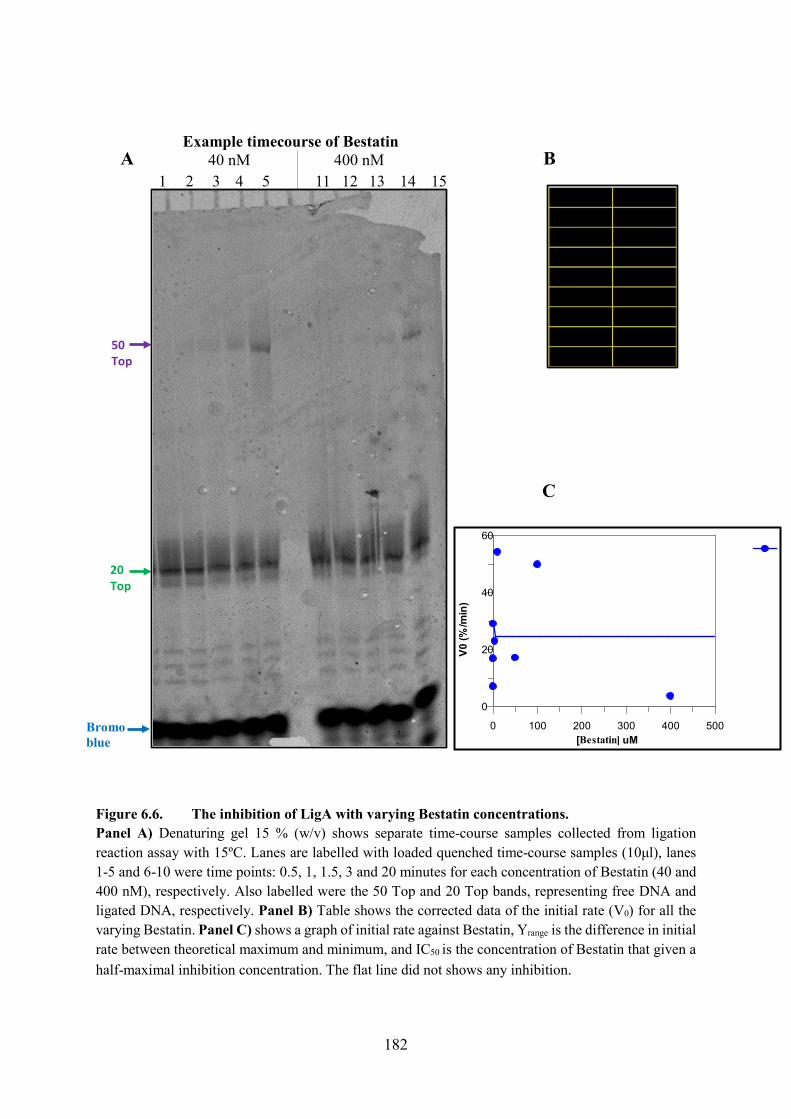
182
Figure 6.6. The inhibition of LigA with varying Bestatin concentrations.Panel A) Denaturing gel 15 % (w/v) shows separate time-course samples collected from ligation reaction assay with 15ºC. Lanes are labelled with loaded quenched time-course samples (10μl), lanes 1-5 and 6-10 were time points: 0.5, 1, 1.5, 3 and 20 minutes for each concentration of Bestatin (40 and 400 nM), respectively. Also labelled were the 50 Top and 20 Top bands, representing free DNA and ligated DNA, respectively. Panel B) Table shows the corrected data of the initial rate (V0) for all the varying Bestatin. Panel C) shows a graph of initial rate against Bestatin, Yrange is the difference in initial rate between theoretical maximum and minimum, and IC50 is the concentration of Bestatin that given a half-maximal inhibition concentration. The flat line did not shows any inhibition.
Example timecourse of Bestatin 40 nM 400 nM
20 Top
50 Top
Bromo blue
BA
C
1 2 3 4 5 11 12 13 14 15
[Bestatin] uM0 100 200 300 400 500
V0 (%
/min
)
0
20
40
60
183
6.2.6. Imidazolidinyl Urea.
The seventh largest S-value (-35.1460) from MOE prediction as an inhibitor on E.coli DNA
ligase LigA was for an Imidazolidinyl Urea. The experiment was carried out at substrate
concentration 100 nM of nicked DNA. The varying Imidazolidinyl Urea compound was 0.04,
0.400, 4, 10, 50, 200 and 400 µM. Figure 6.8A shows a denaturing gel 15% (w/v) with four
timecourses at 10, 50 and 200 µM of Imidazolidinyl Urea as an example of three denaturing
gels. All the gels corresponding to the experiments of varying [Imidazolidinyl Urea] substrate
are shown in Appendix 6.6. The gel shows that the band of nicked DNA (20Top) over the time
(0.5, 1, 1.5, 3 and 20 min) decreased slightly and the band of 50Top decreased slightly over the
time with 10 and 50 µM, but decreased sharply with 200 µM. Over all there are high inhibition
on the DNA (50Top) that present on the gel at the high concentration (200 µM).
Figure 6.8B shows the corrected data of the initial rate (V0) for Imidazolidinyl Urea at
different concentrations. The V0 values were calculated in Excel software using a linear fit to
about the first 30% of the reaction. Figure 6.8C shows a curve of IC50 inhibition of
Imidazolidinyl Urea. The initial rate against Imidazolidinyl Urea concentrations from Panel B
was put in Grafit software and an inhibition (IC50) fit added to the data by using an IC50
inhibition equation. The same four parameters were calculated as before. The curve in Figure
6.8C did show inhibition on LigA protein at 50, 200 and 400 µM of Imidazolidinyl Urea
concentrations. From Figure 6.4C the Yrange for Imidazolidinyl Urea was 18.99±9.75 µM/min,
and the inhibition IC50 of Imidazolidinyl Urea was 7.56±14.48 µM.
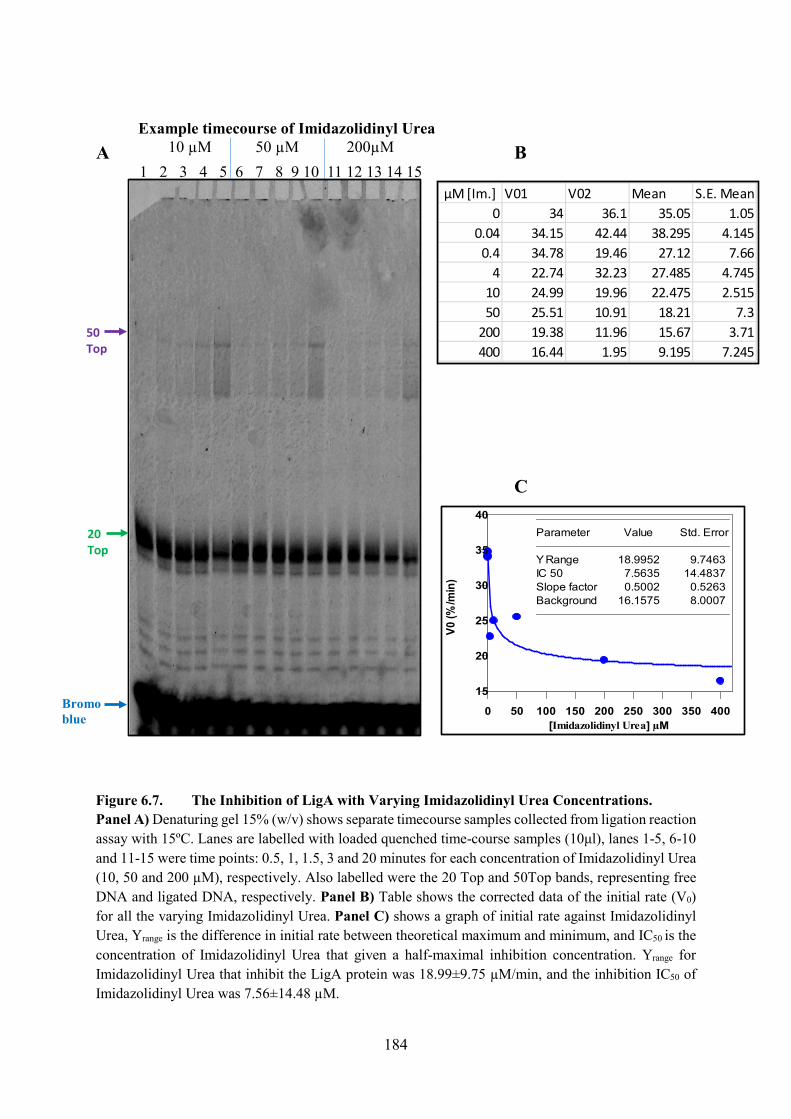
184
Figure 6.7. The Inhibition of LigA with Varying Imidazolidinyl Urea Concentrations.Panel A) Denaturing gel 15% (w/v) shows separate timecourse samples collected from ligation reaction assay with 15ºC. Lanes are labelled with loaded quenched time-course samples (10μl), lanes 1-5, 6-10 and 11-15 were time points: 0.5, 1, 1.5, 3 and 20 minutes for each concentration of Imidazolidinyl Urea (10, 50 and 200 µM), respectively. Also labelled were the 20 Top and 50Top bands, representing free DNA and ligated DNA, respectively. Panel B) Table shows the corrected data of the initial rate (V0) for all the varying Imidazolidinyl Urea. Panel C) shows a graph of initial rate against Imidazolidinyl Urea, Yrange is the difference in initial rate between theoretical maximum and minimum, and IC50 is the concentration of Imidazolidinyl Urea that given a half-maximal inhibition concentration. Yrange for Imidazolidinyl Urea that inhibit the LigA protein was 18.99±9.75 µM/min, and the inhibition IC50 of Imidazolidinyl Urea was 7.56±14.48 µM.
1 2 3 4 5 6 7 8 9 10 11 12 13 14 15
Example timecourse of Imidazolidinyl Urea 10 µM 50 µM 200µM B
Bromo blue
20 Top
50 Top
A
C
[Imidazolidinyl Urea] µM 0 50 100 150 200 250 300 350 400
V0 (%
/min
)
15
20
25
30
35
40Parameter Value Std. Error
Y Range 18.9952 9.7463IC 50 7.5635 14.4837Slope factor 0.5002 0.5263Background 16.1575 8.0007
µM [Im.] V01 V02 Mean S.E. Mean0 34 36.1 35.05 1.05
0.04 34.15 42.44 38.295 4.1450.4 34.78 19.46 27.12 7.66
4 22.74 32.23 27.485 4.74510 24.99 19.96 22.475 2.51550 25.51 10.91 18.21 7.3
200 19.38 11.96 15.67 3.71400 16.44 1.95 9.195 7.245
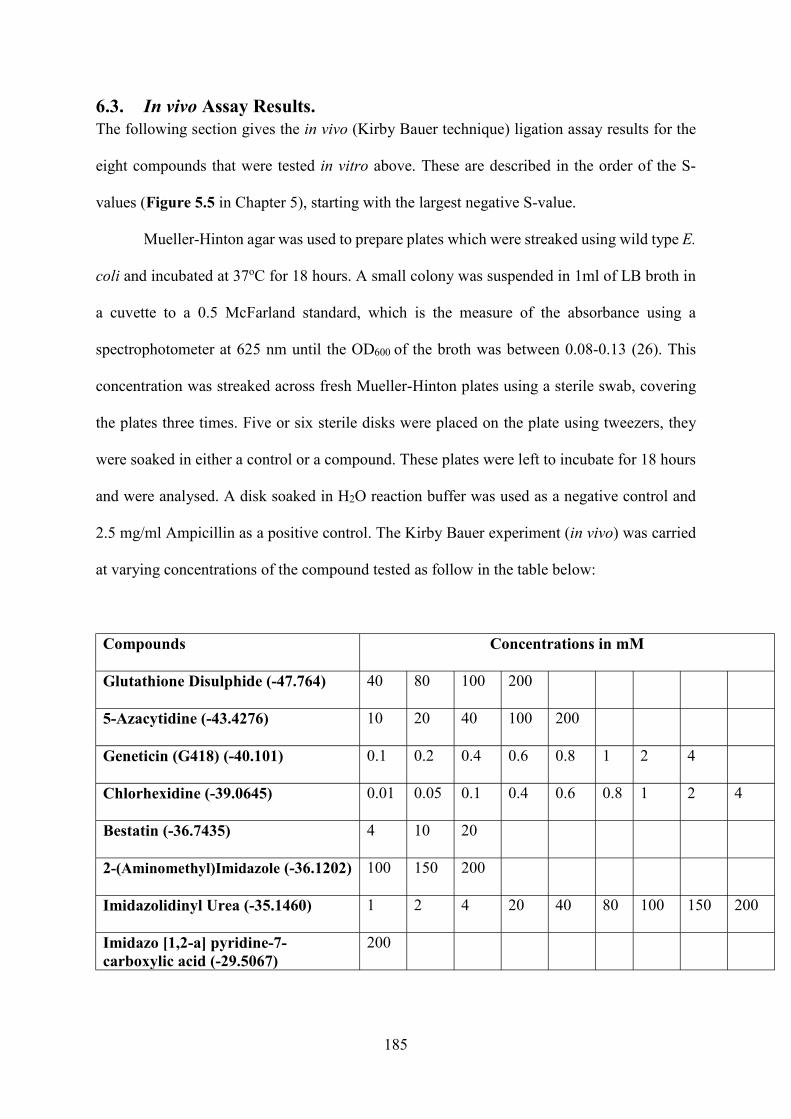
185
6.3. In vivo Assay Results. The following section gives the in vivo (Kirby Bauer technique) ligation assay results for the
eight compounds that were tested in vitro above. These are described in the order of the S-
values (Figure 5.5 in Chapter 5), starting with the largest negative S-value.
Mueller-Hinton agar was used to prepare plates which were streaked using wild type E.
coli and incubated at 37oC for 18 hours. A small colony was suspended in 1ml of LB broth in
a cuvette to a 0.5 McFarland standard, which is the measure of the absorbance using a
spectrophotometer at 625 nm until the OD600 of the broth was between 0.08-0.13 (26). This
concentration was streaked across fresh Mueller-Hinton plates using a sterile swab, covering
the plates three times. Five or six sterile disks were placed on the plate using tweezers, they
were soaked in either a control or a compound. These plates were left to incubate for 18 hours
and were analysed. A disk soaked in H2O reaction buffer was used as a negative control and
2.5 mg/ml Ampicillin as a positive control. The Kirby Bauer experiment (in vivo) was carried
at varying concentrations of the compound tested as follow in the table below:
Compounds Concentrations in mM
Glutathione Disulphide (-47.764) 40 80 100 200
5-Azacytidine (-43.4276) 10 20 40 100 200
Geneticin (G418) (-40.101) 0.1 0.2 0.4 0.6 0.8 1 2 4
Chlorhexidine (-39.0645) 0.01 0.05 0.1 0.4 0.6 0.8 1 2 4
Bestatin (-36.7435) 4 10 20
2-(Aminomethyl)Imidazole (-36.1202) 100 150 200
Imidazolidinyl Urea (-35.1460) 1 2 4 20 40 80 100 150 200
Imidazo [1,2-a] pyridine-7-carboxylic acid (-29.5067)
200
186
The largest S-value (-47.764) from MOE prediction as an inhibitor on E.coli DNA ligase LigA
was for glutathione disulphide. Figure 6.8A shows a Mueller-Hinton agar plate with three
concentrations 40, 80 and 100 mM of glutathione disulphide as one example of two Mueller-
Hinton agar plates. Another agar plate that corresponding to this experiment is shown in
Appendix 6.7. The agar plate shows five discs: negative control (just H2O), 5 mg/ml
Ampicillin as a positive control, 40 mM, 80 mM and 100 mM of glutathione disulphide that
dissolved in free water (all the discs were labelled down in the agar plate). This agar plate
shows there is no inhibition zone of glutathione disulphide even the highest concentration (200
mM). Figure 6.8B shows the data of the inhibition zones by measuring the diameter of the
zone around the disk for all the concentrations of glutathione disulphide. The diameter values
were measured in ImageJ software. Figure 6.8C shows a curve of IC50 inhibition of glutathione
disulphide. The data were fit to a modified Michaelis-Menten equation using Grafit software.
The Vmax and Km were modified to Imax (Maximum Inhibition, in mm) and IC50 (like Km, in
mM). The curve did not show any inhibition on the growth of the bacteria at 0, 40, 80, 100 and
200 mM concentration of glutathione disulphide. This equation gives two parameters: Imax (the
theoretical maximum diameter) and IC50 (the concentration of glutathione disulphide that give
a half-maximal Imax). From Figure 6.8C the flat line did not shows any inhibition or effect on
the growth of E.coli at any concentration of glutathione disulphide. This compares to in vitro
results (see Section 6.2.1), which showed the glutathione disulphide did not inhibit LigA
enzyme.
187
The second largest S-value (-43.4276) from MOE prediction as an inhibitor on E.coli
DNA ligase LigA was for a 5-Azacytidine. Figure 6.9A shows a Mueller-Hinton agar plate
with three concentrations 10, 20 and 40 mM of 5-Azacytidine as one example of two Mueller-
Hinton agar plates. Another agar plate that corresponding to this experiment is shown in
Appendix 6.8. The agar plate shows five disks: negative control (just H2O), 5 mg/ml
Ampicillin as a positive control, 10, 20 and 40 mM of 5-Azacytidine (all the disks were labelled
down in the agar plate). This agar plate shows there is no inhibition zone of 5-Azacytidine even
at high concentration (200 mM). Figure 6.9B shows the data of the inhibition zones by
measuring the diameter of the zone around the disk for all the concentrations of 5-Azacytidine.
The diameter values were measured in ImageJ software.
Figure 6.9C shows a curve of IC50 inhibition of 5-Azacytidine. The data were fit to a
modified Michaelis-Menten equation using Grafit software. The Vmax and Km were modified
to Imax (Maximum Inhibition) and IC50 (like Km). The curve did not show any inhibition on the
growth of the bacteria at 0, 40, 80, 100 and 200 mM concentration of 5-Azacytidine. This
equation gives two parameters: Imax (the theoretical maximum diameter in mm) and IC50 (the
concentration of glutathione disulphide that give a half-maximal Imax in mM). From Figure
6.9C above the flat line did not shows any inhibition or effect on the growth of E.coli at any
concentration of 5-Azacytidine. This different to in vitro results (see Section 6.2.2), which
showed the 5-Azacytidine did inhibit LigA enzyme or the growth of bacteria.
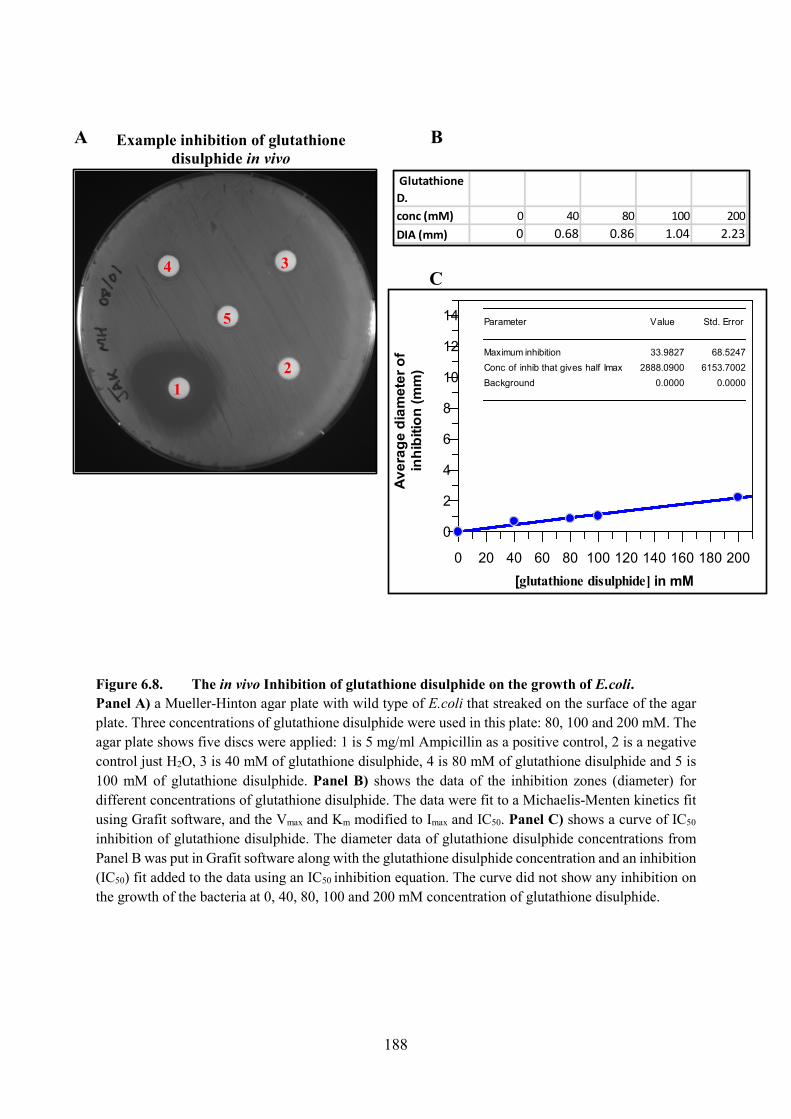
188
Figure 6.8. The in vivo Inhibition of glutathione disulphide on the growth of E.coli.Panel A) a Mueller-Hinton agar plate with wild type of E.coli that streaked on the surface of the agar plate. Three concentrations of glutathione disulphide were used in this plate: 80, 100 and 200 mM. The agar plate shows five discs were applied: 1 is 5 mg/ml Ampicillin as a positive control, 2 is a negative control just H2O, 3 is 40 mM of glutathione disulphide, 4 is 80 mM of glutathione disulphide and 5 is 100 mM of glutathione disulphide. Panel B) shows the data of the inhibition zones (diameter) for different concentrations of glutathione disulphide. The data were fit to a Michaelis-Menten kinetics fit using Grafit software, and the Vmax and Km modified to Imax and IC50. Panel C) shows a curve of IC50
inhibition of glutathione disulphide. The diameter data of glutathione disulphide concentrations from Panel B was put in Grafit software along with the glutathione disulphide concentration and an inhibition (IC50) fit added to the data using an IC50 inhibition equation. The curve did not show any inhibition on the growth of the bacteria at 0, 40, 80, 100 and 200 mM concentration of glutathione disulphide.
Glutathione D.conc (mM) 0 40 80 100 200DIA (mm) 0 0.68 0.86 1.04 2.23
12
34
5
Example inhibition of glutathione disulphide in vivo
A B
C
[glutathione disulphide] in mM0 20 40 60 80 100 120 140 160 180 200
Ave
rage
dia
met
er o
f in
hibi
tion
(mm
)
0
2
4
6
8
10
12
14 Parameter Value Std. Error
Maximum inhibition 33.9827 68.5247Conc of inhib that gives half Imax 2888.0900 6153.7002Background 0.0000 0.0000
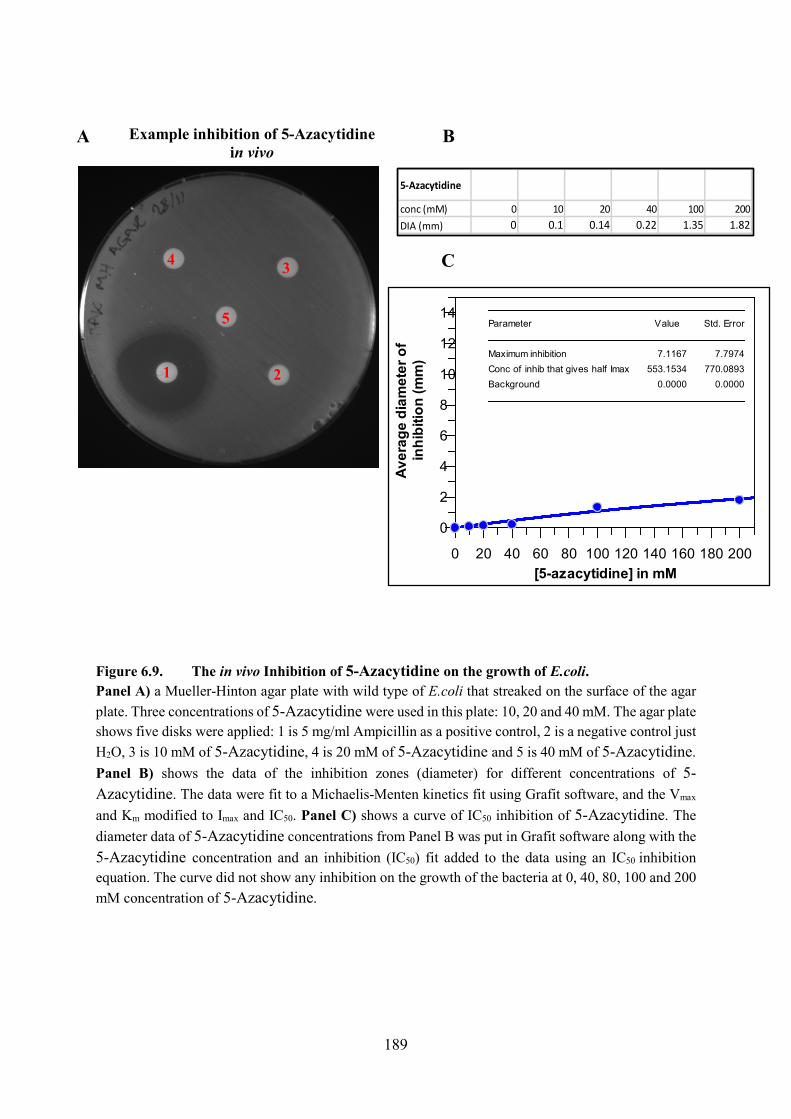
189
Figure 6.9. The in vivo Inhibition of 5-Azacytidine on the growth of E.coli.Panel A) a Mueller-Hinton agar plate with wild type of E.coli that streaked on the surface of the agar plate. Three concentrations of 5-Azacytidine were used in this plate: 10, 20 and 40 mM. The agar plate shows five disks were applied: 1 is 5 mg/ml Ampicillin as a positive control, 2 is a negative control just H2O, 3 is 10 mM of 5-Azacytidine, 4 is 20 mM of 5-Azacytidine and 5 is 40 mM of 5-Azacytidine. Panel B) shows the data of the inhibition zones (diameter) for different concentrations of 5-Azacytidine. The data were fit to a Michaelis-Menten kinetics fit using Grafit software, and the Vmax
and Km modified to Imax and IC50. Panel C) shows a curve of IC50 inhibition of 5-Azacytidine. The diameter data of 5-Azacytidine concentrations from Panel B was put in Grafit software along with the5-Azacytidine concentration and an inhibition (IC50) fit added to the data using an IC50 inhibition equation. The curve did not show any inhibition on the growth of the bacteria at 0, 40, 80, 100 and 200 mM concentration of 5-Azacytidine.
B
C
1 2
34
5
Example inhibition of 5-Azacytidinein vivo
A
5-Azacytidine
conc (mM) 0 10 20 40 100 200DIA (mm) 0 0.1 0.14 0.22 1.35 1.82
1 2
34
5
[5-azacytidine] in mM0 20 40 60 80 100 120 140 160 180 200
Aver
age
diam
eter
of
inhi
bitio
n (m
m)
0
2
4
6
8
10
12
14Parameter Value Std. Error
Maximum inhibition 7.1167 7.7974Conc of inhib that gives half Imax 553.1534 770.0893Background 0.0000 0.0000
190
The third largest S-value (-40.101) from MOE prediction as an inhibitor on E.coli DNA ligase
LigA was for a G418. Figure 6.10A shows a Mueller-Hinton agar plate with three
concentrations 1, 2 and 4 mM of G418 as one example of three Mueller-Hinton agar plates.
Another two agar plates that corresponding to this experiment are shown in Appendix 6.9. This
agar plate shows a huge inhibition zone with all three concentrations. Comparing with another
compounds small concentration of G418 did the inhibition very well. Figure 6.10B shows the
data of the inhibition zones by measuring the diameter of the zone around the disk for all the
concentrations of G418. Figure 6.10C shows a curve of IC50 inhibition of G418. The curve did
show very nice inhibition on the growth of the bacteria at all the concentration except the 0.01
mM of G418. From Figure 6.10C the Imax for G418 was 20.59 ± 1.96 mM/min, and the
inhibition IC50 of G418 was 0.63± 0.17mM. This compares to in vitro results (see Section
6.2.3), which showed that the G418 did inhibit LigA enzyme.
The fourth largest S-value (-39.0645) from MOE prediction as an inhibitor on E.coli
DNA ligase LigA was for a chlorohexidine. Figure 6.11A shows a Mueller-Hinton agar plate
with three concentrations 1, 2 and 4 mM of chlorhexidine as one example of three Mueller-
Hinton agar plates. Another two agar plates that corresponding to this experiment are shown in
Appendix 6.10. The agar plate shows five disks: 1 is 5 mg/ml Ampicillin as a positive control,
2 is control (just H2O), 3 is 1 mM of chlorohexidine, 3 is 2 mM of chlorohexidine and 5 is 4
mM of chlorohexidine (all the discs were labelled down in the agar plate). This agar plate
shows a huge inhibition zone with all three concentrations. Comparing with another
compounds small concentration of chlorhexidine did the inhibition very well even at 0.01 mM.
Figure 6.11B shows the data of the inhibition zones by measuring the diameter of the zone
around the disk for all the concentrations of. Figure 6.11C shows a curve of IC50 inhibition of
chlorhexidine.
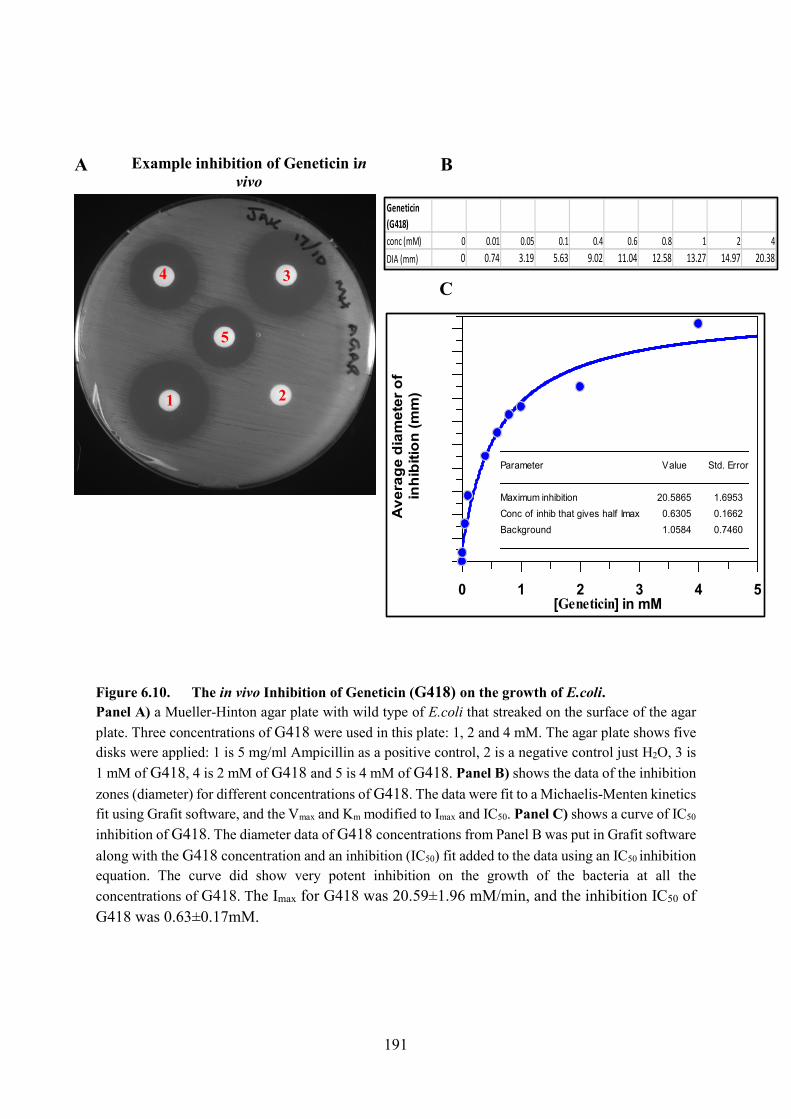
191
Figure 6.10. The in vivo Inhibition of Geneticin (G418) on the growth of E.coli.Panel A) a Mueller-Hinton agar plate with wild type of E.coli that streaked on the surface of the agar plate. Three concentrations of G418 were used in this plate: 1, 2 and 4 mM. The agar plate shows five disks were applied: 1 is 5 mg/ml Ampicillin as a positive control, 2 is a negative control just H2O, 3 is 1 mM of G418, 4 is 2 mM of G418 and 5 is 4 mM of G418. Panel B) shows the data of the inhibition zones (diameter) for different concentrations of G418. The data were fit to a Michaelis-Menten kinetics fit using Grafit software, and the Vmax and Km modified to Imax and IC50. Panel C) shows a curve of IC50
inhibition of G418. The diameter data of G418 concentrations from Panel B was put in Grafit software along with the G418 concentration and an inhibition (IC50) fit added to the data using an IC50 inhibition equation. The curve did show very potent inhibition on the growth of the bacteria at all the concentrations of G418. The Imax for G418 was 20.59±1.96 mM/min, and the inhibition IC50 of G418 was 0.63±0.17mM.
Geneticin (G418)conc (mM) 0 0.01 0.05 0.1 0.4 0.6 0.8 1 2 4DIA (mm) 0 0.74 3.19 5.63 9.02 11.04 12.58 13.27 14.97 20.38
Example inhibition of Geneticin invivo
[Geneticin] in mM0 1 2 3 4 5
Ave
rage
dia
met
er o
f in
hibi
tion
(mm
)
Parameter Value Std. Error
Maximum inhibition 20.5865 1.6953Conc of inhib that gives half Imax 0.6305 0.1662Background 1.0584 0.7460
B
C
1 2
34
5
A
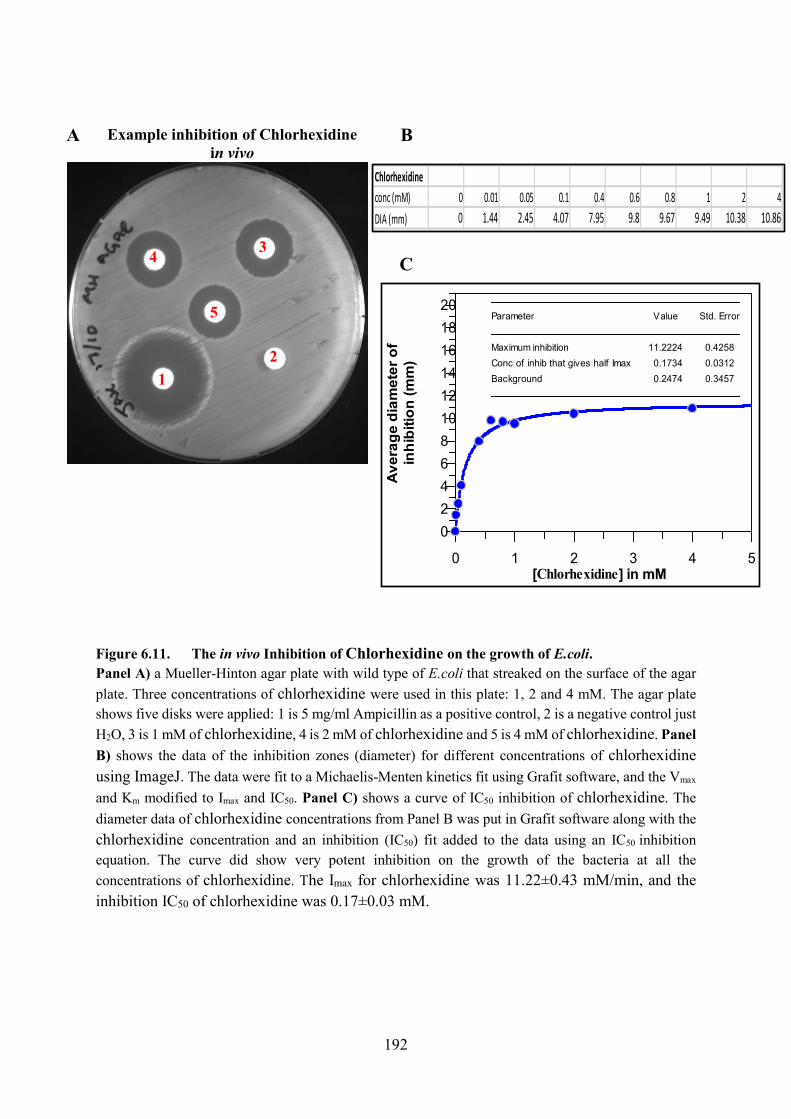
192
Figure 6.11. The in vivo Inhibition of Chlorhexidine on the growth of E.coli.Panel A) a Mueller-Hinton agar plate with wild type of E.coli that streaked on the surface of the agar plate. Three concentrations of chlorhexidine were used in this plate: 1, 2 and 4 mM. The agar plate shows five disks were applied: 1 is 5 mg/ml Ampicillin as a positive control, 2 is a negative control just H2O, 3 is 1 mM of chlorhexidine, 4 is 2 mM of chlorhexidine and 5 is 4 mM of chlorhexidine. PanelB) shows the data of the inhibition zones (diameter) for different concentrations of chlorhexidine using ImageJ. The data were fit to a Michaelis-Menten kinetics fit using Grafit software, and the Vmax
and Km modified to Imax and IC50. Panel C) shows a curve of IC50 inhibition of chlorhexidine. The diameter data of chlorhexidine concentrations from Panel B was put in Grafit software along with thechlorhexidine concentration and an inhibition (IC50) fit added to the data using an IC50 inhibition equation. The curve did show very potent inhibition on the growth of the bacteria at all the concentrations of chlorhexidine. The Imax for chlorhexidine was 11.22±0.43 mM/min, and the inhibition IC50 of chlorhexidine was 0.17±0.03 mM.
2
34
Chlorhexidineconc (mM) 0 0.01 0.05 0.1 0.4 0.6 0.8 1 2 4DIA (mm) 0 1.44 2.45 4.07 7.95 9.8 9.67 9.49 10.38 10.86
Example inhibition of Chlorhexidinein vivo
12
34
5
B
C
A
[Chlorhexidine] in mM0 1 2 3 4 5
Ave
rage
dia
met
er o
f in
hibi
tion
(mm
)
02468101214161820
Parameter Value Std. Error
Maximum inhibition 11.2224 0.4258Conc of inhib that gives half Imax 0.1734 0.0312Background 0.2474 0.3457
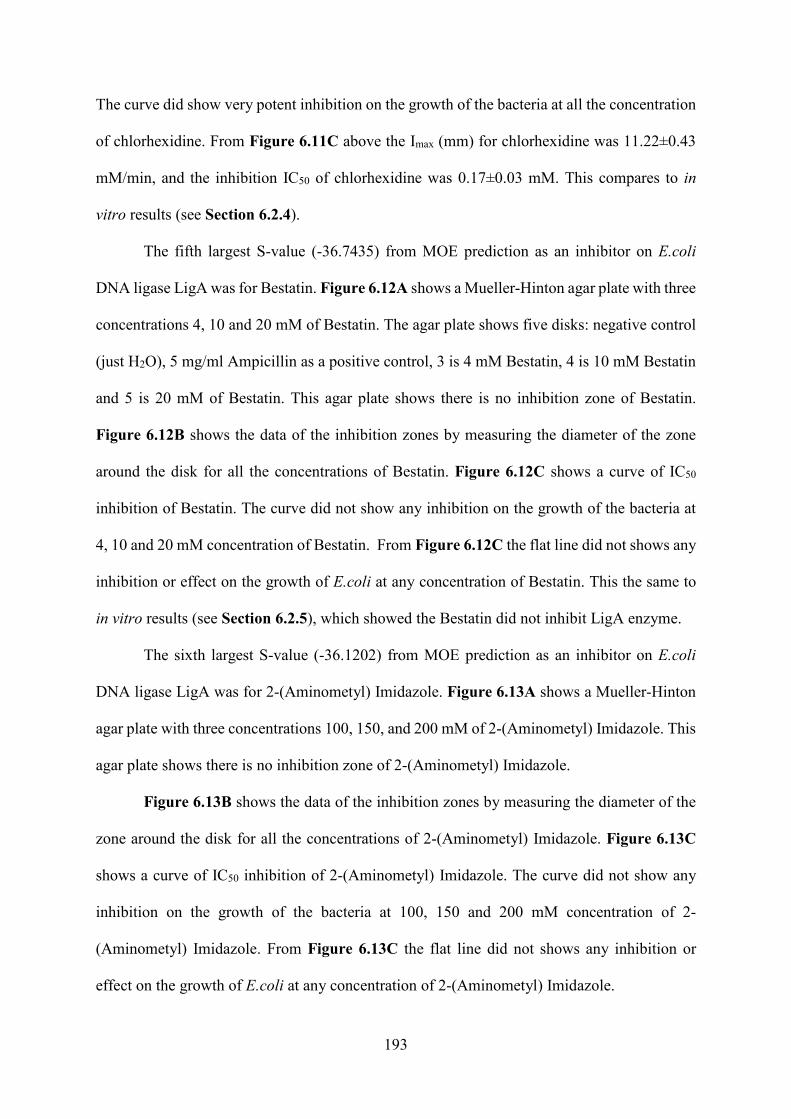
193
The curve did show very potent inhibition on the growth of the bacteria at all the concentration
of chlorhexidine. From Figure 6.11C above the Imax (mm) for chlorhexidine was 11.22±0.43
mM/min, and the inhibition IC50 of chlorhexidine was 0.17±0.03 mM. This compares to in
vitro results (see Section 6.2.4).
The fifth largest S-value (-36.7435) from MOE prediction as an inhibitor on E.coli
DNA ligase LigA was for Bestatin. Figure 6.12A shows a Mueller-Hinton agar plate with three
concentrations 4, 10 and 20 mM of Bestatin. The agar plate shows five disks: negative control
(just H2O), 5 mg/ml Ampicillin as a positive control, 3 is 4 mM Bestatin, 4 is 10 mM Bestatin
and 5 is 20 mM of Bestatin. This agar plate shows there is no inhibition zone of Bestatin.
Figure 6.12B shows the data of the inhibition zones by measuring the diameter of the zone
around the disk for all the concentrations of Bestatin. Figure 6.12C shows a curve of IC50
inhibition of Bestatin. The curve did not show any inhibition on the growth of the bacteria at
4, 10 and 20 mM concentration of Bestatin. From Figure 6.12C the flat line did not shows any
inhibition or effect on the growth of E.coli at any concentration of Bestatin. This the same to
in vitro results (see Section 6.2.5), which showed the Bestatin did not inhibit LigA enzyme.
The sixth largest S-value (-36.1202) from MOE prediction as an inhibitor on E.coli
DNA ligase LigA was for 2-(Aminometyl) Imidazole. Figure 6.13A shows a Mueller-Hinton
agar plate with three concentrations 100, 150, and 200 mM of 2-(Aminometyl) Imidazole. This
agar plate shows there is no inhibition zone of 2-(Aminometyl) Imidazole.
Figure 6.13B shows the data of the inhibition zones by measuring the diameter of the
zone around the disk for all the concentrations of 2-(Aminometyl) Imidazole. Figure 6.13C
shows a curve of IC50 inhibition of 2-(Aminometyl) Imidazole. The curve did not show any
inhibition on the growth of the bacteria at 100, 150 and 200 mM concentration of 2-
(Aminometyl) Imidazole. From Figure 6.13C the flat line did not shows any inhibition or
effect on the growth of E.coli at any concentration of 2-(Aminometyl) Imidazole.
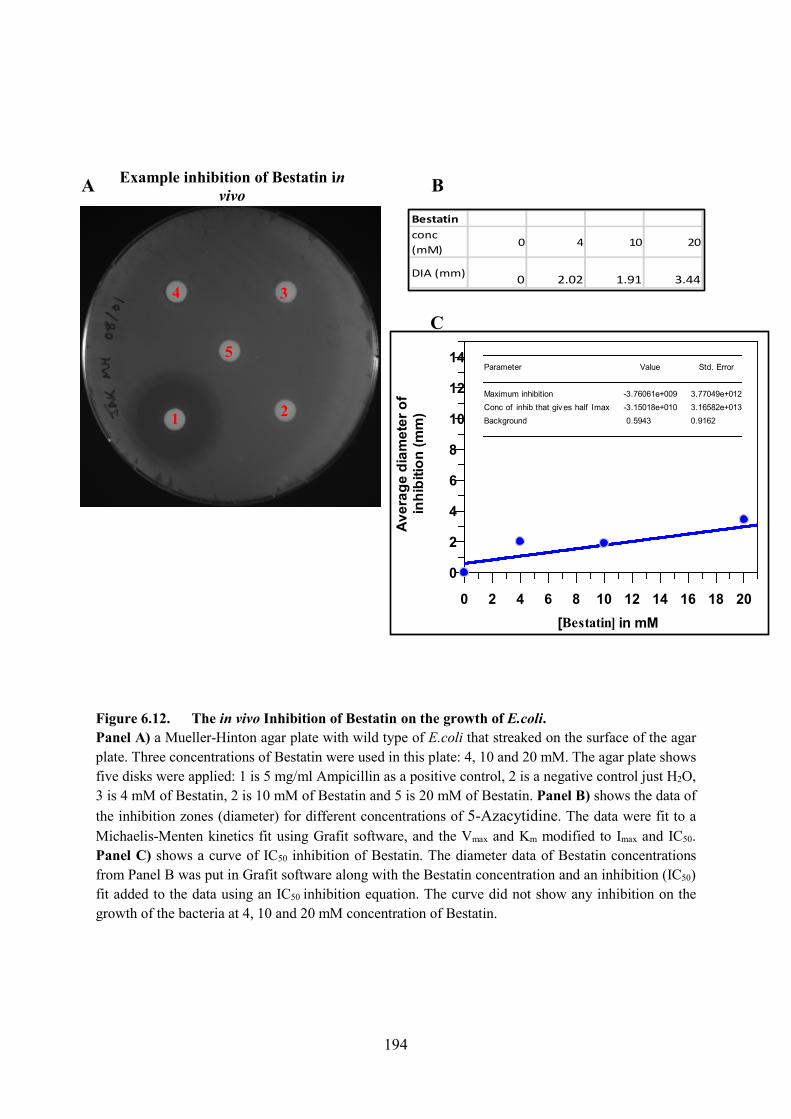
194
Figure 6.12. The in vivo Inhibition of Bestatin on the growth of E.coli.Panel A) a Mueller-Hinton agar plate with wild type of E.coli that streaked on the surface of the agar plate. Three concentrations of Bestatin were used in this plate: 4, 10 and 20 mM. The agar plate shows five disks were applied: 1 is 5 mg/ml Ampicillin as a positive control, 2 is a negative control just H2O, 3 is 4 mM of Bestatin, 2 is 10 mM of Bestatin and 5 is 20 mM of Bestatin. Panel B) shows the data of the inhibition zones (diameter) for different concentrations of 5-Azacytidine. The data were fit to a Michaelis-Menten kinetics fit using Grafit software, and the Vmax and Km modified to Imax and IC50. Panel C) shows a curve of IC50 inhibition of Bestatin. The diameter data of Bestatin concentrations from Panel B was put in Grafit software along with the Bestatin concentration and an inhibition (IC50) fit added to the data using an IC50 inhibition equation. The curve did not show any inhibition on the growth of the bacteria at 4, 10 and 20 mM concentration of Bestatin.
Bestatinconc (mM)
0 4 10 20
DIA (mm) 0 2.02 1.91 3.44
1 2
34
5
B
C
A Example inhibition of Bestatin invivo
[Bestatin] in mM0 2 4 6 8 10 12 14 16 18 20
Aver
age
diam
eter
of
inhi
bitio
n (m
m)
0
2
4
6
8
10
12
14Parameter Value Std. Error
Maximum inhibition -3.76061e+009 3.77049e+012Conc of inhib that giv es half Imax -3.15018e+010 3.16582e+013Background 0.5943 0.9162
195
Figure 6.13. The in vivo Inhibition of 2-(Aminometyl) Imidazole on the growth of E.coli.Panel A) a Mueller-Hinton agar plate with wild type of E.coli that streaked on the surface of the agar plate. Three concentrations of 2-(Aminometyl) Imidazole were used in this plate: 100, 150 and 200 mM. The agar plate shows five disks were applied: 1 is 5 mg/ml Ampicillin as a positive control, 2 is a negative control just H2O, 3 is 100 mM of 2-(Aminometyl) Imidazole, 2 is 150 mM of 2-(Aminometyl) Imidazole and 5 is 200 mM of 2-(Aminometyl) Imidazole. Panel B) shows the data of the inhibition zones (diameter) for different concentrations of 2-(Aminometyl) Imidazole. The data were used a Michaelis-Menten kinetics fit using Grafit software, and the Vmax and Km modified to Imax
and IC50. Panel C) shows a curve of IC50 inhibition of 2-(Aminometyl) Imidazole. The diameter data of 2-(Aminometyl) Imidazole concentrations from Panel B was put in Grafit software along with the2-(Aminometyl) Imidazole concentration and an inhibition (IC50) fit added to the data using an IC50
inhibition equation. The curve did not show any inhibition on the growth of the bacteria at 100, 150 and 200 mM concentration of 2-(Aminometyl) Imidazole.
2-(Aminomethyl)imidazole
conc (mM) 0 100 150 200
DIA (mm) 0 0.07 0.14 0.04
1
34
5
B
C
AExample inhibition of 2-
(Aminometyl) Imidazole in vivo
2
[2-(Aminometyl) Imidazole] in mM0 20 40 60 80 100 120 140 160 180 200
Ave
rage
dia
met
er o
f in
hibi
tion
(mm
)
0
2
4
6
8
10
12
14Parameter Value Std. Error
Maximum inhibition -0.0021 0.0105Conc of inhib that gives half Imax -153.1569 14.9680Background 0.0383 0.0297
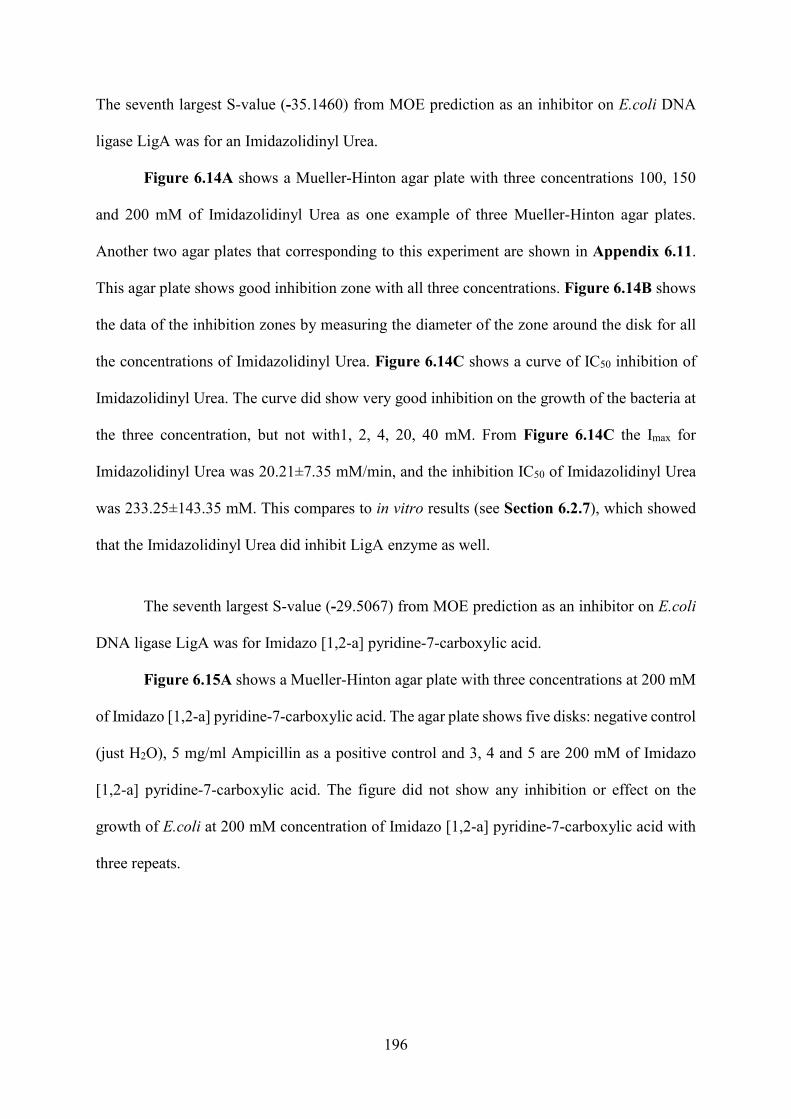
196
The seventh largest S-value (-35.1460) from MOE prediction as an inhibitor on E.coli DNA
ligase LigA was for an Imidazolidinyl Urea.
Figure 6.14A shows a Mueller-Hinton agar plate with three concentrations 100, 150
and 200 mM of Imidazolidinyl Urea as one example of three Mueller-Hinton agar plates.
Another two agar plates that corresponding to this experiment are shown in Appendix 6.11.
This agar plate shows good inhibition zone with all three concentrations. Figure 6.14B shows
the data of the inhibition zones by measuring the diameter of the zone around the disk for all
the concentrations of Imidazolidinyl Urea. Figure 6.14C shows a curve of IC50 inhibition of
Imidazolidinyl Urea. The curve did show very good inhibition on the growth of the bacteria at
the three concentration, but not with1, 2, 4, 20, 40 mM. From Figure 6.14C the Imax for
Imidazolidinyl Urea was 20.21±7.35 mM/min, and the inhibition IC50 of Imidazolidinyl Urea
was 233.25±143.35 mM. This compares to in vitro results (see Section 6.2.7), which showed
that the Imidazolidinyl Urea did inhibit LigA enzyme as well.
The seventh largest S-value (-29.5067) from MOE prediction as an inhibitor on E.coli
DNA ligase LigA was for Imidazo [1,2-a] pyridine-7-carboxylic acid.
Figure 6.15A shows a Mueller-Hinton agar plate with three concentrations at 200 mM
of Imidazo [1,2-a] pyridine-7-carboxylic acid. The agar plate shows five disks: negative control
(just H2O), 5 mg/ml Ampicillin as a positive control and 3, 4 and 5 are 200 mM of Imidazo
[1,2-a] pyridine-7-carboxylic acid. The figure did not show any inhibition or effect on the
growth of E.coli at 200 mM concentration of Imidazo [1,2-a] pyridine-7-carboxylic acid with
three repeats.

197
Figure 6.14. The in vivo Inhibition of Imidazolidinyl Urea on the growth of E.coli.Panel A) a Mueller-Hinton agar plate with wild type of E.coli that streaked on the surface of the agar plate. Three concentrations of Imidazolidinyl Urea were used in this plate: 100, 150 and 200 mM. The agar plate shows five disks were applied: 1 is 5 mg/ml Ampicillin as a positive control, 2 is a negative control just H2O, 3 is 100 mM of Imidazolidinyl Urea, 4 is 150 mM of Imidazolidinyl Urea and 5 is 200 mM of Imidazolidinyl Urea. Panel B) shows the data of the inhibition zones (diameter) for different concentrations of Imidazolidinyl Urea using ImageJ. The data were fit to a Michaelis-Menten kinetics fit using Grafit software, and the Vmax and Km modified to Imax and IC50. Panel C)shows a curve of IC50 inhibition of Imidazolidinyl Urea. The diameter data of Imidazolidinyl Urea concentrations from Panel B was put in Grafit software along with the Imidazolidinyl Urea concentration and an inhibition (IC50) fit added to the data using an IC50 inhibition equation. The curve did show very potent inhibition on the growth of the bacteria at all the concentrations of Imidazolidinyl Urea. The Imax for Imidazolidinyl Urea was 20.21±7.35 mM/min, and the inhibition IC50 of Imidazolidinyl Urea was 233.25±143.35 mM.
Imidazolidinyl urea
conc (mM) 1 2 4 20 40 80 100 150 200
DIA (mm) 0 0 1.76 2.94 3.89 5.75 5.77 7.67 10.59
1
34
5
B
C
A Example inhibition of Imidazolidinyl Urea in vivo
2
[Imidazolidinyl Urea] in mM0 20 40 60 80 100 120 140 160 180 200
Ave
rage
dia
met
er o
f in
hibi
tion
(mm
)
02468101214161820
Parameter Value Std. Error
Maximum inhibition 20.2999 7.3528Conc of inhib that gives half Imax 233.2587 143.3519Background 0.4589 0.4102
198
Figure 6.15. The in vivo Inhibition of Imidazo [1,2-a] pyridine-7-carboxylic acid on the growth of E.coli.
Panel A) a Mueller-Hinton agar plate with wild type of E.coli that streaked on the surface of the agar plate. The concentration of Imidazo [1,2-a] pyridine-7-carboxylic acid was used in this plate just 200 mM, but repeated three times. The agar plate shows five disks were applied: 1 is 5 mg/ml Ampicillin as a positive control, 2 is a negative control just H2O, 3, 4 and 5 is 200 mM of Imidazo [1,2-a] pyridine-7-carboxylic acid. The plate did show any inhibition or effect on the growth of E.coli at 200 mM concentration of Imidazo [1,2-a] pyridine-7-carboxylic acid with three repeats.
1 2
34
5
Example inhibition of Imidazo [1,2-a] pyridine-7-carboxylic acid in vivo
199
6.4. Discussion. In this chapter we described the various experiments in vitro and in vivo (denaturing gel and
Kirby-Bauer) that were utilized to research if these different compounds or inhibitors that had
a high negative S-value (MOE in Chapter 5) can interact or bind to LigA and inhibit its
activity. This is the second and third stage of a combination of in silico, in vitro and in vivo
techniques. A list of LigA binding compounds was identified (in silico), based on their ability
to bind the enzyme in one of four sites (Figure 5.4 in Chapter 5). These different compounds
were: Glutathione disulphide (#49740 Sigma), 5-Azacytidine (#A2385 Sigma), Geneticin
(G418) (#A1270 Sigma), Chlorhexidine (#282227 Aldrich), Bestatin/Ubenimex (#482609
Aldrich), 2-(Aminometyl) imidazole (#738840 Aldrich), Imidazolidinyl Urea (#I5133
Aldrich), and Imidazo[1,2-a]pyridine-7-carboxylic acid (#CDD017300 Aldrich). In this
chapter, these compounds or inhibitors were examined in vitro, at different concentrations to
check their ability to inhibit the nick-sealing ability of LigA. They were all then tested for cell
toxicity using the Kirby-Bauer plating technique (in vivo).
Table 6.1 shows a summary of the results for all the compounds, listing their S-values,
the sites of MOE, the IC50 in vitro and IC50 in vivo. Each of these compounds will be discussed
individually. The first compound (Glutathione disulphide), had the largest negative S-value
from MOE and docked in Site 3, meaning that it docked very well in silico. However, both the
in vitro and in vivo experiment did not show any inhibition of LigA. This shows that although
a compound may be predicted in MOE, but it maybe not affect the protein in vitro and in vivo.
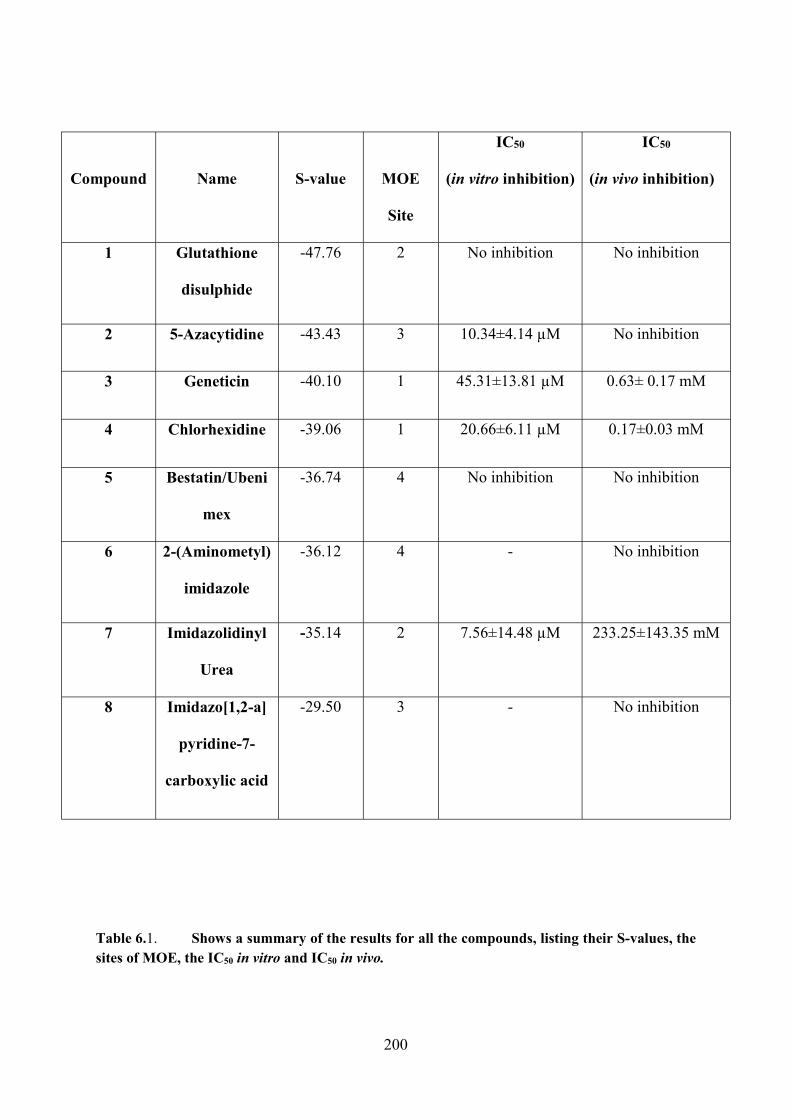
200
Compound Name S-value MOE
Site
IC50
(in vitro inhibition)
IC50
(in vivo inhibition)
1 Glutathione
disulphide
-47.76 2 No inhibition No inhibition
2 5-Azacytidine -43.43 3 10.34±4.14 µM No inhibition
3 Geneticin -40.10 1 45.31±13.81 µM 0.63± 0.17 mM
4 Chlorhexidine -39.06 1 20.66±6.11 µM 0.17±0.03 mM
5 Bestatin/Ubeni
mex
-36.74 4 No inhibition No inhibition
6 2-(Aminometyl)
imidazole
-36.12 4 - No inhibition
7 Imidazolidinyl
Urea
-35.14 2 7.56±14.48 µM 233.25±143.35 mM
8 Imidazo[1,2-a]
pyridine-7-
carboxylic acid
-29.50 3 - No inhibition
Table 6.1. Shows a summary of the results for all the compounds, listing their S-values, the sites of MOE, the IC50 in vitro and IC50 in vivo.
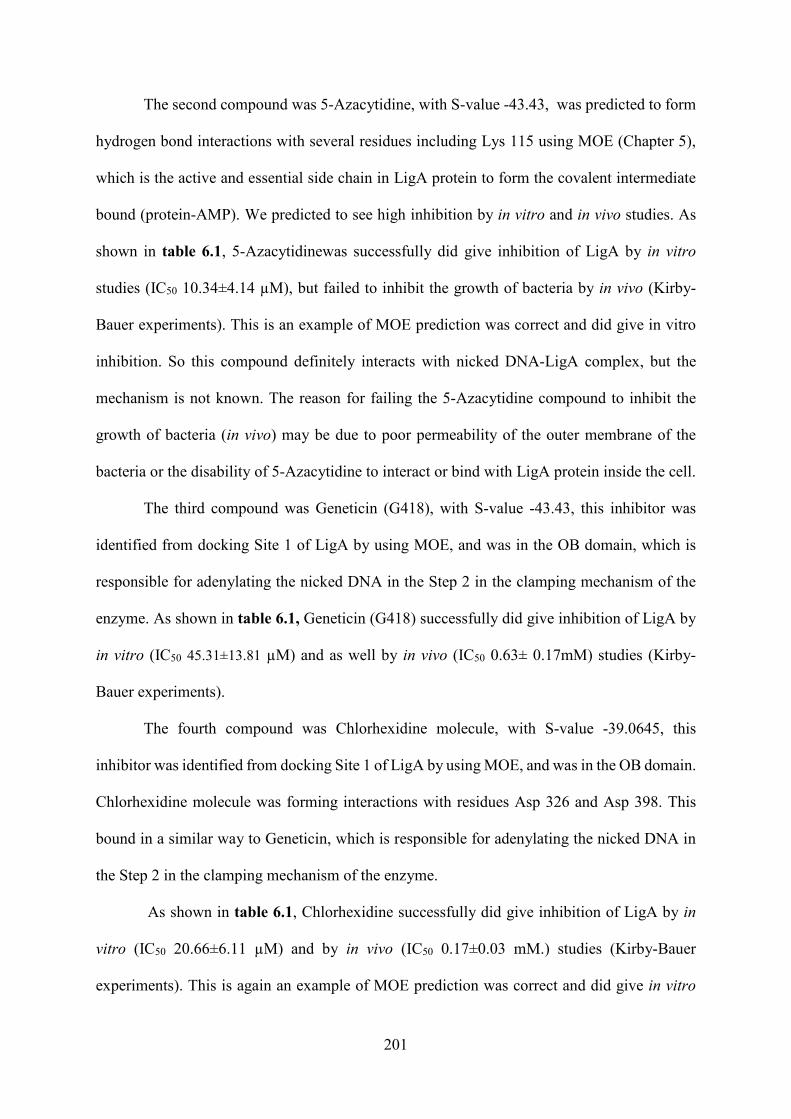
201
The second compound was 5-Azacytidine, with S-value -43.43, was predicted to form
hydrogen bond interactions with several residues including Lys 115 using MOE (Chapter 5),
which is the active and essential side chain in LigA protein to form the covalent intermediate
bound (protein-AMP). We predicted to see high inhibition by in vitro and in vivo studies. As
shown in table 6.1, 5-Azacytidinewas successfully did give inhibition of LigA by in vitro
studies (IC50 10.34±4.14 µM), but failed to inhibit the growth of bacteria by in vivo (Kirby-
Bauer experiments). This is an example of MOE prediction was correct and did give in vitro
inhibition. So this compound definitely interacts with nicked DNA-LigA complex, but the
mechanism is not known. The reason for failing the 5-Azacytidine compound to inhibit the
growth of bacteria (in vivo) may be due to poor permeability of the outer membrane of the
bacteria or the disability of 5-Azacytidine to interact or bind with LigA protein inside the cell.
The third compound was Geneticin (G418), with S-value -43.43, this inhibitor was
identified from docking Site 1 of LigA by using MOE, and was in the OB domain, which is
responsible for adenylating the nicked DNA in the Step 2 in the clamping mechanism of the
enzyme. As shown in table 6.1, Geneticin (G418) successfully did give inhibition of LigA by
in vitro (IC50 45.31±13.81 µM) and as well by in vivo (IC50 0.63± 0.17mM) studies (Kirby-
Bauer experiments).
The fourth compound was Chlorhexidine molecule, with S-value -39.0645, this
inhibitor was identified from docking Site 1 of LigA by using MOE, and was in the OB domain.
Chlorhexidine molecule was forming interactions with residues Asp 326 and Asp 398. This
bound in a similar way to Geneticin, which is responsible for adenylating the nicked DNA in
the Step 2 in the clamping mechanism of the enzyme.
As shown in table 6.1, Chlorhexidine successfully did give inhibition of LigA by in
vitro (IC50 20.66±6.11 µM) and by in vivo (IC50 0.17±0.03 mM.) studies (Kirby-Bauer
experiments). This is again an example of MOE prediction was correct and did give in vitro
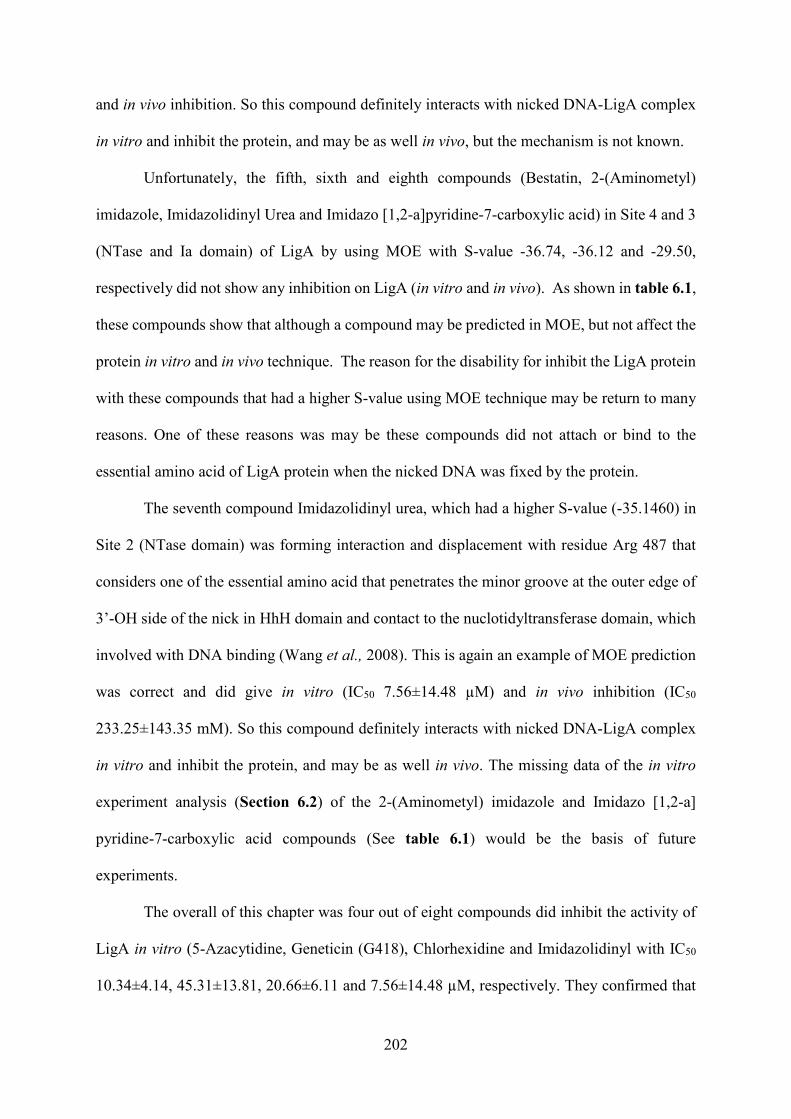
202
and in vivo inhibition. So this compound definitely interacts with nicked DNA-LigA complex
in vitro and inhibit the protein, and may be as well in vivo, but the mechanism is not known.
Unfortunately, the fifth, sixth and eighth compounds (Bestatin, 2-(Aminometyl)
imidazole, Imidazolidinyl Urea and Imidazo [1,2-a]pyridine-7-carboxylic acid) in Site 4 and 3
(NTase and Ia domain) of LigA by using MOE with S-value -36.74, -36.12 and -29.50,
respectively did not show any inhibition on LigA (in vitro and in vivo). As shown in table 6.1,
these compounds show that although a compound may be predicted in MOE, but not affect the
protein in vitro and in vivo technique. The reason for the disability for inhibit the LigA protein
with these compounds that had a higher S-value using MOE technique may be return to many
reasons. One of these reasons was may be these compounds did not attach or bind to the
essential amino acid of LigA protein when the nicked DNA was fixed by the protein.
The seventh compound Imidazolidinyl urea, which had a higher S-value (-35.1460) in
Site 2 (NTase domain) was forming interaction and displacement with residue Arg 487 that
considers one of the essential amino acid that penetrates the minor groove at the outer edge of
3�-OH side of the nick in HhH domain and contact to the nuclotidyltransferase domain, which
involved with DNA binding (Wang et al., 2008). This is again an example of MOE prediction
was correct and did give in vitro (IC50 7.56±14.48 µM) and in vivo inhibition (IC50
233.25±143.35 mM). So this compound definitely interacts with nicked DNA-LigA complex
in vitro and inhibit the protein, and may be as well in vivo. The missing data of the in vitro
experiment analysis (Section 6.2) of the 2-(Aminometyl) imidazole and Imidazo [1,2-a]
pyridine-7-carboxylic acid compounds (See table 6.1) would be the basis of future
experiments.
The overall of this chapter was four out of eight compounds did inhibit the activity of
LigA in vitro (5-Azacytidine, Geneticin (G418), Chlorhexidine and Imidazolidinyl with IC50
10.34±4.14, 45.31±13.81, 20.66±6.11 and 7.56±14.48 µM, respectively. They confirmed that
203
were work and active against E.coli DNA ligase in vitro, which is increased the chance for
being future antibiotic (See 5.6 in Chapter 5). Especially for Geneticin as we know its biology
activity, if scientist can link the eukaryotic cells with neoR gen that has resistance against
Geneticin via using gene editing technique (Harvey, et al., 2013).
Three of the eight compounds: Geneticin (G418), Chlorhexidine and Imidazolidinyl,
did inhibit the growth of the bacteria (in vivo) with IC50 0.63± 0.17, 0.17±0.03 and
233.25±143.35 mM, respectively. They had success in all three areas of study (in silico, in vitro
and in vivo) and make them a suitable candidates and increase the chance for being future drug
development studies as a promising drug target for bacteria. Site 1 and 2 (HhH and OB domain)
of E.coli DNA ligase LigA protein using MOE technique had the success rate of compounds
to inhibit the enzyme in three technique in silico, in vitro an in vivo. These indicates its potential
as a key site in further MOE docking runs and opens the possibilities for further structural
studies to inhibit LigA activity. More discussion with other data was added in the final
discussion in Chapter 7.
204
Chapter 7: Final Discussion
DNA Ligases play a crucial role in repairing damaged DNA as well as other crucial DNA
metabolism processes as replication and recombination (Lehman, 1974; Mills et al., 2011).
They are also a promising antibacterial drug target. The overall aim of my work was to bring
together a series of experiments on these two known DNA ligases from E.coli LigA and LigB,
comparing their properties and functions under a range of experimental conditions. The main
findings of this thesis can be divided into four main areas. The first plan was to clone, express
and purify native LigA and LigB. The second finding was to compare the kinetics and DNA
binding studies of native LigA and native LigB.
The third was to use in silico molecular docking (MOE programme) to find new
compounds (inhibitors) that would inhibit DNA LigA. The fourth finding was to test eight of
the new compounds found by using MOE, using both in vitro (time-courses on purified
enzyme) and in vivo (Kirby-Bauer) to use them as new antibiotic or inhibitors in the future. In
E.coli, there are in fact two DNA ligases: LigA (already solved the crystal structure, 2OWO)
(Shuman et al., 2007) and a second ligase (LigB) that has a different DNA and protein sequence
(Sriskanda & Shuman, 2001), but has no solved 3D structure.
The main aim of Chapter 3 was to clone, express and purify native LigA and LigB,
which are two of the key repair enzymes in E. coli. The challenge was to determine how best
to induce and purify the two native enzymes, using different chromatography techniques. The
key role of this was the decision not to use a His-tagged version of each protein, since this
positively-charged group can interfere with DNA binding properties (Chant et al. 2005).
However, Sriskanda and Shuman in 2001 successfully purified E.coli LigB protein as a second
DNA ligase using His-tagged version.
205
In this study the expression of native LigA in competent cell E. coli BL21 (DE3) by
adding 1 mM IPTG gave very high amount of expressed LigA and has shown to be mostly
soluble in buffer. However, the expression for native LigB was shown to be completely
insoluble which led us to use a different way. The key features of LigB purification are listed
in Chapter 3 (see Section 3.4.2). The solubility of expressed native LigB protein in NaCl and
TritonX-100, or refolding native LigB protein and using His-tagged version did not give or
show any soluble LigB. This is in contrast to Sriskanda and Shuman in 2001 who did obtain
soluble His-tag LigB. Finally, using different condition and buffer during the expression of
native LigB protein as I mentioned in the main introduction in Chapter 3 (see Section 3.4.2)
small amount of native LigB was successfully purified and active.
During purification, native LigA and LigB proteins were tested by a functional assay
to look for ligation activity. Proteins that have approximately the correct size on SDS-PAGE
gels were tested for ligase activity and by mass spectrometry to check their molecular mass.
The overall aim of Chapter 4 in this study was to bring together a series kinetic and
binding experiments on these two DNA ligases, comparing their properties and functions under
a range of experimental conditions. These were important building blocks towards potential
future studies that could then explore and exploit small-molecule chemical libraries for
compounds by using MOE technique (Chapter 5) that affect these basic kinetic parameters in
vitro and in vivo to kill the bacteria and making them a promising antibiotic target in the future
(Chapter 6).
Chapter 4 was to determine the kinetics and binding experiments of the native (no-tag)
LigA and LigB proteins. This included finding the Vmax and Km for kinetics and Bmax and Kd
for binding experiments for these enzymes under many different reaction conditions. For
kinetic experiments the variables tested were [DNA], [NAD+], temperature for both native
LigA and LigB (~30 nM for both enzymes).and [NH4SO4] and [NMN] only for LigA. For
206
binding experiments gel-shift studies in EDTA-containing buffers (no Mg2+ added) was carried
out for both enzymes. The Km values for all the parameters above of native LigA and LigB
were determined using the Michalis-Menten fit (steady-state study). One of the important
parameters which affect the enzyme activity is [DNA] substrate and [NAD+] cofactor. The Vmax
of native LigA and LigB for singly-nicked DNA substrate concentration in this study were
62.10±8.56 nM and 9.73±0.58 nM, respectively. Therefore, native LigA was 6.4-fold faster
than native LigB. The kcat for LigA and LigB for single-nicked [DNA] substrate were 2.07 min-
1 and 0.32-1, respectively.
In a different study (single-turnover study) Sriskanda & Shuman 2001, obtained the
initial rate for nick joining by LigB E.coli DNA ligase adenylate (0.026 s-1) which was about
8.5-fold slower than LigA E.coli DNA ligase (0.22 s-1). The Km values for LigA and LigB (how
tightly they bound the nicked DNA) for singly-nicked DNA substrate were 12.22±6.42 and
3.50±1.34 nM, respectively, which is different to the Km value for Staphylococcus aureus DNA
ligase LigA that achieved in a similar study (stead-state) by Gul et al, 2006 who characterised
the Km value for acridinium-ester-labelled DNA substrate (2.5±0.2 nM) (Gul et al, 2006).
The Km value that obtained for NAD+ for E.coli LigA in this study was 1.55±0.33 µM
which was quite similar to the Km value for NAD+ cofactor for S. aureus LigA (2.75±0.1 µM)
that obtained by Gul et al, 2006. This result was slightly different with Sriskanda et al., 1999,
they found the Km value for NAD+ of the wild-type E.coli DNA ligase LigA 3 µM.
In 2004, Gong and his group stated that Mycobacterium tuberculosis encodes an NAD+-
dependent DNA ligase (LigA) plus three distinct ATP-dependent ligase homologs (LigB,
LigC, and LigD). They reported that NAD+-dependent DNA ligase (LigA) is essential enzyme
for ligation and growth of M. tuberculosis, whereas ATP-dependent ligase LigB is
distinguished for nick joining the DNA, but is not essential for the growth of M. tuberculosis
bacteria. The Km value for NAD+ cofactor for NAD+-dependent DNA ligase LigA of M.
207
tuberculosis was 1 µM which was about 1.5-fold tight than the Km value for NAD+ for E.coli
DNA LigA (1.55±0.33 µM) in this study, and the Km value for NAD+ cofactor for ATP-
dependent ligase LigB of M. tuberculosis was 0.34 mM which was much less tight than the Km
value for NAD+ for E.coli DNA LigB (0.16±0.03 µM) in this study (Gong et al.,, 2004).
However, Hua et al., 2008 identified that Deinococcus radiodurans (DR) encoded an
NAD+-dependent DNA ligase (DRLigA) and an ATP-dependent DNA ligase (DRLigB)
(which totally different to E.coli NAD+-dependent of LigB) in the genome of this extremely
radioresistant bacterium. Their results showed that DRLigB displayed higher activity than
DRLigA at sticky and blunt ended joining of DNA, indicating that DRLigB is a key DNA
ligase of D. radiodurans in DNA recombination and double-strand break repair.
Temperature is one of the important parameters which affect enzyme activity, as the
enzyme will not function properly at a temperature which is too high or low. This study showed
that native E.coli DNA ligases LigA and LigB enzymes had a slightly different optimum
temperature for activity. For LigA this the optimum temperature was ~20°C as shown in Figure
4.8, and for LigB approximately the optimum temperature was 16°C as shown in Figure 4.9.
Most DNA ligases are used at 16ºC or room temperature and can be denatured by heat (Lohman
et al., 2011B). Also, we found LigA if left at room temperature overnight lost almost its
activity. In this thesis the temperature used in every ligase reaction (kinetics study) was 16ºC,
which was close to the optimum temperature for each enzyme. Different reaction temperatures
have been used in the literature. For example, Wilkinson et al. in 2005, the reaction of the
ligase activity of E.coli DNA ligase LigA was incubated at 25ºC. As well Gul et al, 2006 used
room temperature for incubating Staphylococcus aureus DNA ligase LigA for all their kinetic
experiments.
To the extent of our knowledge this is the first study which has replicated and
subsequently confirmed by Dugaiczyk et al., 1975 findings that the optimum temperature for
208
ligating cohesive ends by LigA is in the range of 10-15°C. However contrary to Dugaiczyk�s
findings, which stated that increasing the temperature from 0-10°C increased rate of reaction
but an increase of up to 15°C did not further increase the rate, here in this study we found that
the optimum temperature for native LigA was ~20°C and ~16ºC for LigB.
Otherwise, the optimal temperature of NAD+-dependent DNA ligase (LigA) and an
ATP-dependent DNA ligase (LigB) of Deinococcus radiodurans were 60ºC as Hua et al., 2008
reported.
In comparative gel-shift studies in EDTA-containing buffers (no Mg2+ added) showed
that LigA bound the 50 bp single nicked DNA with a Kd of 661.15±142.22 nM and LigB
4,566.30±1146.70 nM in this study. The error bars are quite large so further points are needed.
The main purpose of the initial gel-shift experiments in this thesis was to test if native LigA
and LigB are different enzymes in the way they bind the nick DNA. These results confirm
previous work by Wilkinson et al, 2005, when they did gel-mobility shift experiments for E.coli
NAD+-dependent DNA ligase LigA: approximately 50% of the protein was complexed to DNA
at a 4:1 ratio of protein:DNA and the Kd for the complex was ~5 µM, which was about 7.5-
fold less tighter than native LigA in this study, but was similar to native LigB.
In 1999, Doherty & Wigley stated that the ATP-dependent DNA ligase from
bacteriophage T7 contains two domains: large domain (adenylation) and small domain (oligo-
binding (OB)). The larger domain (adenylation or ligation domain) was able to band shift both
single and double-stranded DNA, while the smaller domain (OB domain) was only able to bind
to double-stranded DNA.
Depending on the results finding for three parameters using kinetics experiments for
native LigA and LigB showed that the Vmax for varying DNA substrate and varying NAD+
cofactor for LigA were faster than LigB, but the Km for both parameters for LigA were less
tighter than LigB. These results together show that two enzymes do the same reaction may
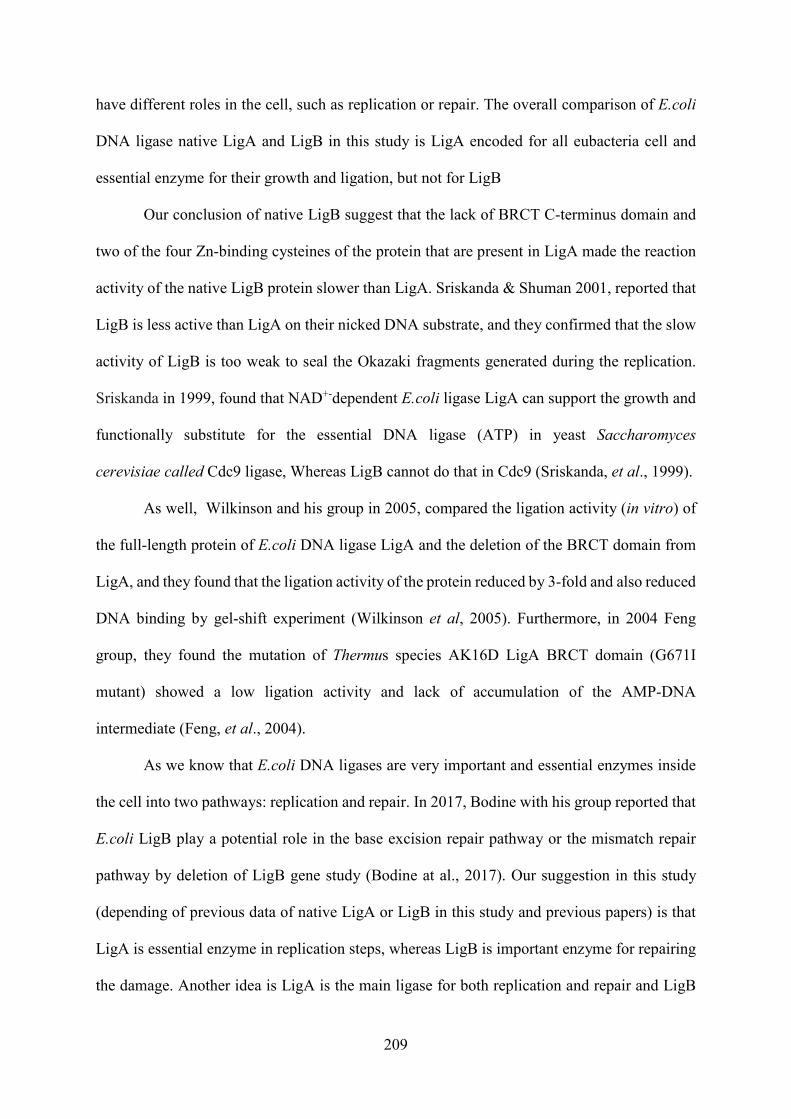
209
have different roles in the cell, such as replication or repair. The overall comparison of E.coli
DNA ligase native LigA and LigB in this study is LigA encoded for all eubacteria cell and
essential enzyme for their growth and ligation, but not for LigB
Our conclusion of native LigB suggest that the lack of BRCT C-terminus domain and
two of the four Zn-binding cysteines of the protein that are present in LigA made the reaction
activity of the native LigB protein slower than LigA. Sriskanda & Shuman 2001, reported that
LigB is less active than LigA on their nicked DNA substrate, and they confirmed that the slow
activity of LigB is too weak to seal the Okazaki fragments generated during the replication.
Sriskanda in 1999, found that NAD+-dependent E.coli ligase LigA can support the growth and
functionally substitute for the essential DNA ligase (ATP) in yeast Saccharomyces
cerevisiae called Cdc9 ligase, Whereas LigB cannot do that in Cdc9 (Sriskanda, et al., 1999).
As well, Wilkinson and his group in 2005, compared the ligation activity (in vitro) of
the full-length protein of E.coli DNA ligase LigA and the deletion of the BRCT domain from
LigA, and they found that the ligation activity of the protein reduced by 3-fold and also reduced
DNA binding by gel-shift experiment (Wilkinson et al, 2005). Furthermore, in 2004 Feng
group, they found the mutation of Thermus species AK16D LigA BRCT domain (G671I
mutant) showed a low ligation activity and lack of accumulation of the AMP-DNA
intermediate (Feng, et al., 2004).
As we know that E.coli DNA ligases are very important and essential enzymes inside
the cell into two pathways: replication and repair. In 2017, Bodine with his group reported that
E.coli LigB play a potential role in the base excision repair pathway or the mismatch repair
pathway by deletion of LigB gene study (Bodine at al., 2017). Our suggestion in this study
(depending of previous data of native LigA or LigB in this study and previous papers) is that
LigA is essential enzyme in replication steps, whereas LigB is important enzyme for repairing
the damage. Another idea is LigA is the main ligase for both replication and repair and LigB
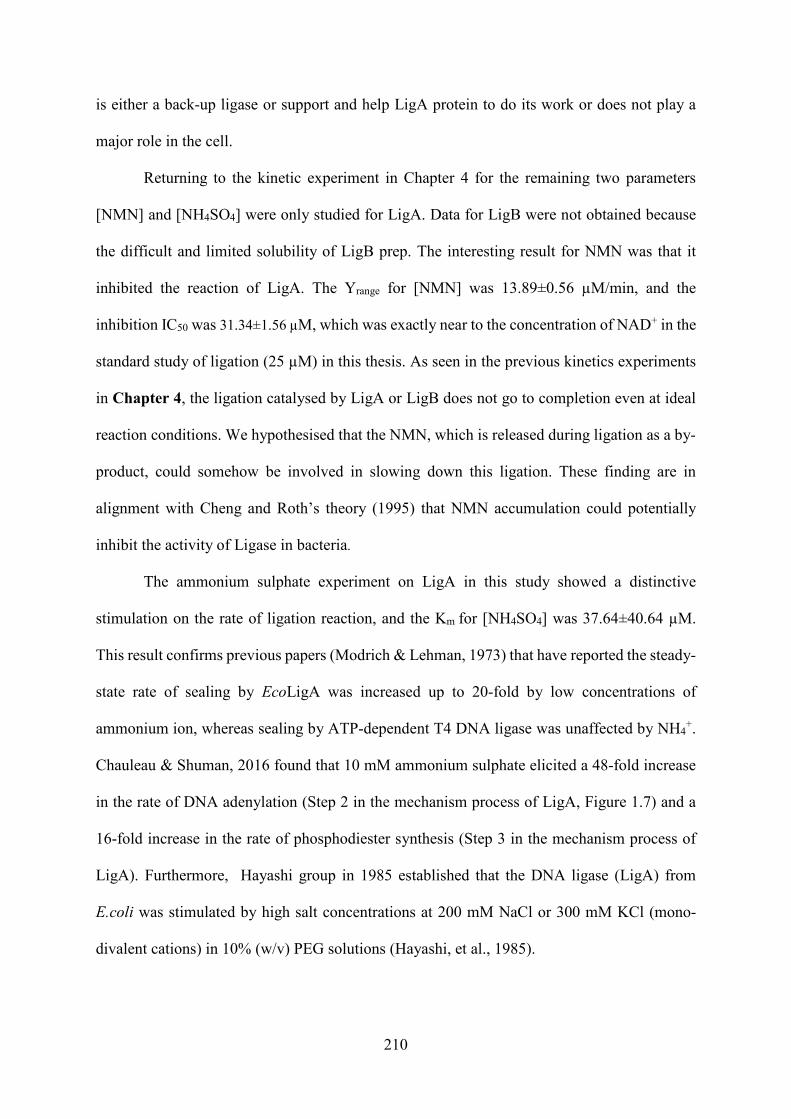
210
is either a back-up ligase or support and help LigA protein to do its work or does not play a
major role in the cell.
Returning to the kinetic experiment in Chapter 4 for the remaining two parameters
[NMN] and [NH4SO4] were only studied for LigA. Data for LigB were not obtained because
the difficult and limited solubility of LigB prep. The interesting result for NMN was that it
inhibited the reaction of LigA. The Yrange for [NMN] was 13.89±0.56 µM/min, and the
inhibition IC50 was 31.34±1.56 µM, which was exactly near to the concentration of NAD+ in the
standard study of ligation (25 µM) in this thesis. As seen in the previous kinetics experiments
in Chapter 4, the ligation catalysed by LigA or LigB does not go to completion even at ideal
reaction conditions. We hypothesised that the NMN, which is released during ligation as a by-
product, could somehow be involved in slowing down this ligation. These finding are in
alignment with Cheng and Roth�s theory (1995) that NMN accumulation could potentially
inhibit the activity of Ligase in bacteria.
The ammonium sulphate experiment on LigA in this study showed a distinctive
stimulation on the rate of ligation reaction, and the Km for [NH4SO4] was 37.64±40.64 µM.
This result confirms previous papers (Modrich & Lehman, 1973) that have reported the steady-
state rate of sealing by EcoLigA was increased up to 20-fold by low concentrations of
ammonium ion, whereas sealing by ATP-dependent T4 DNA ligase was unaffected by NH4+.
Chauleau & Shuman, 2016 found that 10 mM ammonium sulphate elicited a 48-fold increase
in the rate of DNA adenylation (Step 2 in the mechanism process of LigA, Figure 1.7) and a
16-fold increase in the rate of phosphodiester synthesis (Step 3 in the mechanism process of
LigA). Furthermore, Hayashi group in 1985 established that the DNA ligase (LigA) from
E.coli was stimulated by high salt concentrations at 200 mM NaCl or 300 mM KCl (mono-
divalent cations) in 10% (w/v) PEG solutions (Hayashi, et al., 1985).
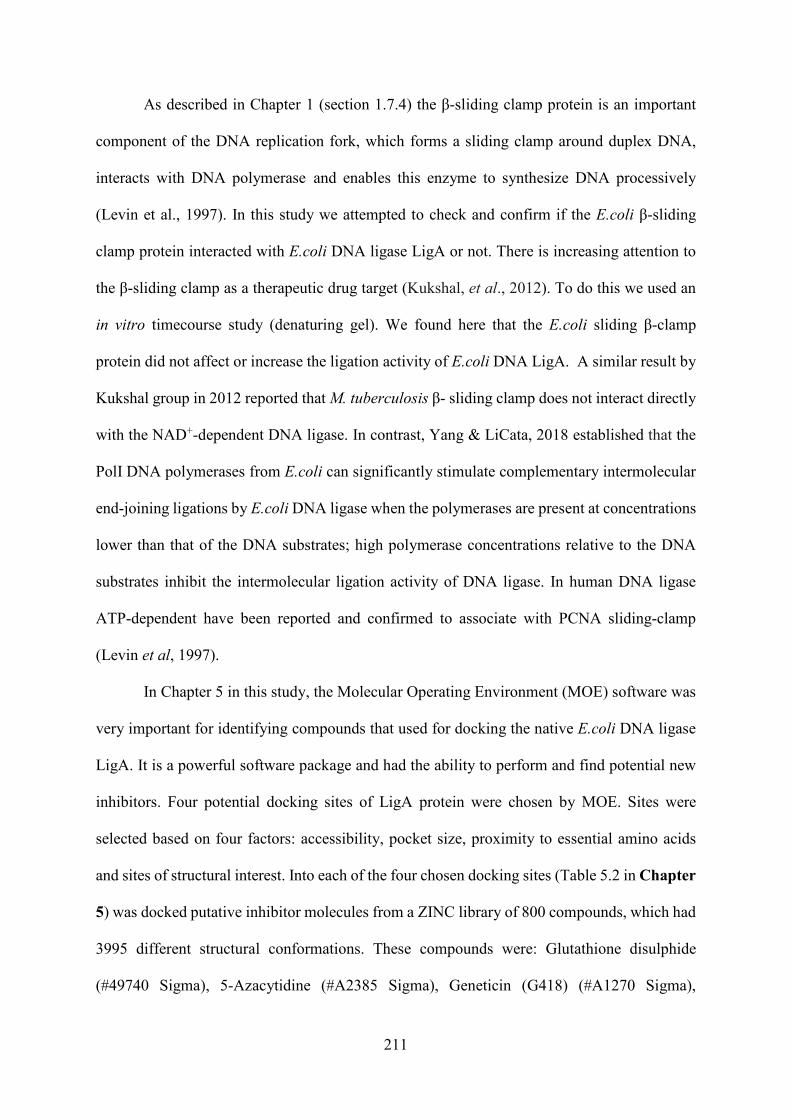
211
As described in Chapter 1 (section 1.7.4) the β-sliding clamp protein is an important
component of the DNA replication fork, which forms a sliding clamp around duplex DNA,
interacts with DNA polymerase and enables this enzyme to synthesize DNA processively
(Levin et al., 1997). In this study we attempted to check and confirm if the E.coli β-sliding
clamp protein interacted with E.coli DNA ligase LigA or not. There is increasing attention to
the β-sliding clamp as a therapeutic drug target (Kukshal, et al., 2012). To do this we used an
in vitro timecourse study (denaturing gel). We found here that the E.coli sliding β-clamp
protein did not affect or increase the ligation activity of E.coli DNA LigA. A similar result by
Kukshal group in 2012 reported that M. tuberculosis β- sliding clamp does not interact directly
with the NAD+-dependent DNA ligase. In contrast, Yang & LiCata, 2018 established that the
PolI DNA polymerases from E.coli can significantly stimulate complementary intermolecular
end-joining ligations by E.coli DNA ligase when the polymerases are present at concentrations
lower than that of the DNA substrates; high polymerase concentrations relative to the DNA
substrates inhibit the intermolecular ligation activity of DNA ligase. In human DNA ligase
ATP-dependent have been reported and confirmed to associate with PCNA sliding-clamp
(Levin et al, 1997).
In Chapter 5 in this study, the Molecular Operating Environment (MOE) software was
very important for identifying compounds that used for docking the native E.coli DNA ligase
LigA. It is a powerful software package and had the ability to perform and find potential new
inhibitors. Four potential docking sites of LigA protein were chosen by MOE. Sites were
selected based on four factors: accessibility, pocket size, proximity to essential amino acids
and sites of structural interest. Into each of the four chosen docking sites (Table 5.2 in Chapter
5) was docked putative inhibitor molecules from a ZINC library of 800 compounds, which had
3995 different structural conformations. These compounds were: Glutathione disulphide
(#49740 Sigma), 5-Azacytidine (#A2385 Sigma), Geneticin (G418) (#A1270 Sigma),
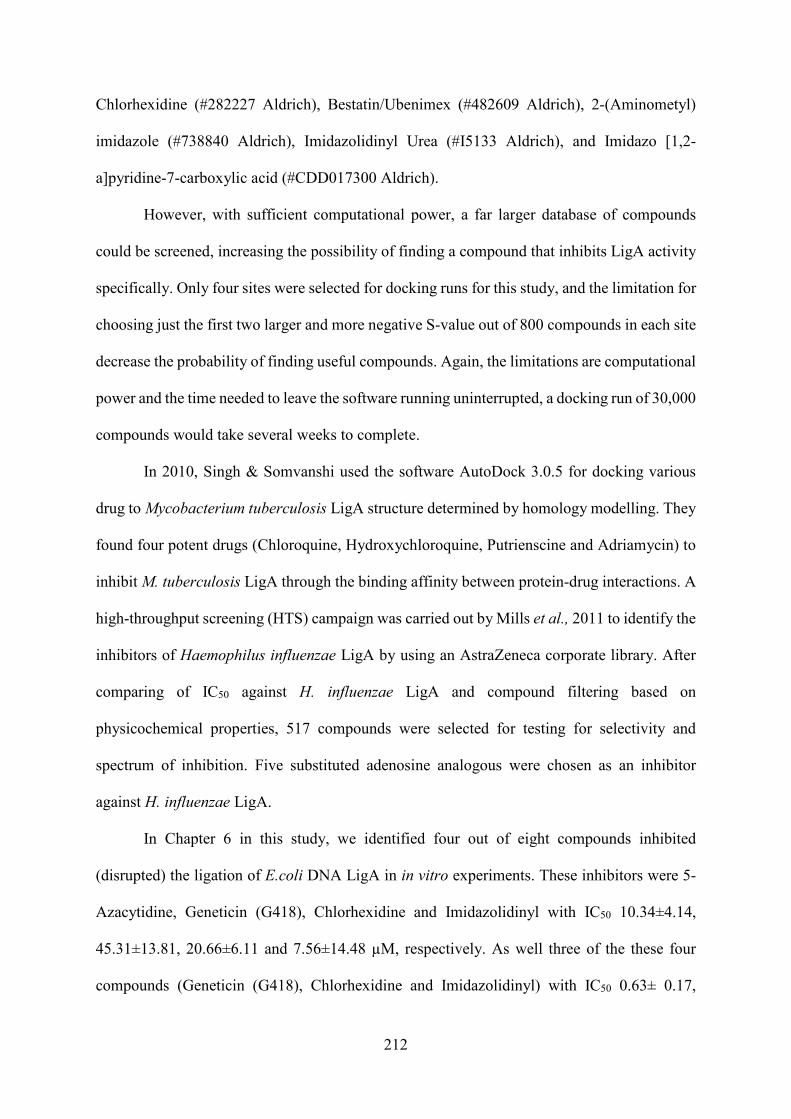
212
Chlorhexidine (#282227 Aldrich), Bestatin/Ubenimex (#482609 Aldrich), 2-(Aminometyl)
imidazole (#738840 Aldrich), Imidazolidinyl Urea (#I5133 Aldrich), and Imidazo [1,2-
a]pyridine-7-carboxylic acid (#CDD017300 Aldrich).
However, with sufficient computational power, a far larger database of compounds
could be screened, increasing the possibility of finding a compound that inhibits LigA activity
specifically. Only four sites were selected for docking runs for this study, and the limitation for
choosing just the first two larger and more negative S-value out of 800 compounds in each site
decrease the probability of finding useful compounds. Again, the limitations are computational
power and the time needed to leave the software running uninterrupted, a docking run of 30,000
compounds would take several weeks to complete.
In 2010, Singh & Somvanshi used the software AutoDock 3.0.5 for docking various
drug to Mycobacterium tuberculosis LigA structure determined by homology modelling. They
found four potent drugs (Chloroquine, Hydroxychloroquine, Putrienscine and Adriamycin) to
inhibit M. tuberculosis LigA through the binding affinity between protein-drug interactions. A
high-throughput screening (HTS) campaign was carried out by Mills et al., 2011 to identify the
inhibitors of Haemophilus influenzae LigA by using an AstraZeneca corporate library. After
comparing of IC50 against H. influenzae LigA and compound filtering based on
physicochemical properties, 517 compounds were selected for testing for selectivity and
spectrum of inhibition. Five substituted adenosine analogous were chosen as an inhibitor
against H. influenzae LigA.
In Chapter 6 in this study, we identified four out of eight compounds inhibited
(disrupted) the ligation of E.coli DNA LigA in in vitro experiments. These inhibitors were 5-
Azacytidine, Geneticin (G418), Chlorhexidine and Imidazolidinyl with IC50 10.34±4.14,
45.31±13.81, 20.66±6.11 and 7.56±14.48 µM, respectively. As well three of the these four
compounds (Geneticin (G418), Chlorhexidine and Imidazolidinyl) with IC50 0.63± 0.17,
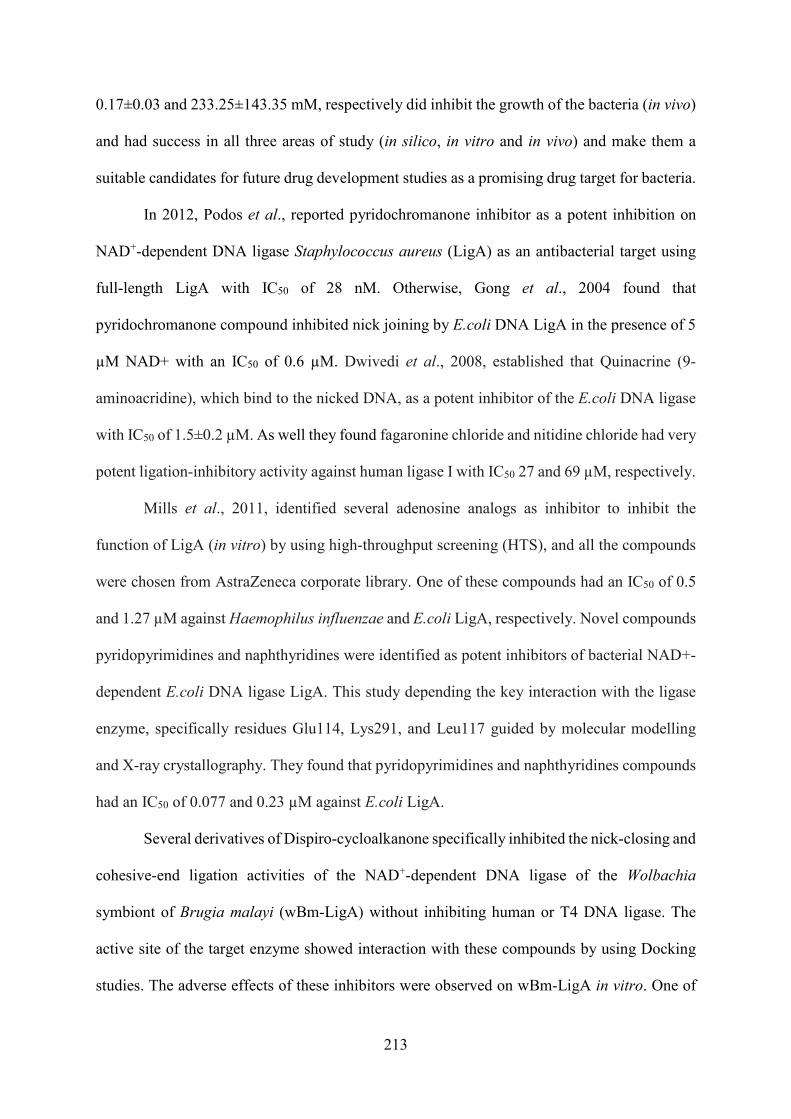
213
0.17±0.03 and 233.25±143.35 mM, respectively did inhibit the growth of the bacteria (in vivo)
and had success in all three areas of study (in silico, in vitro and in vivo) and make them a
suitable candidates for future drug development studies as a promising drug target for bacteria.
In 2012, Podos et al., reported pyridochromanone inhibitor as a potent inhibition on
NAD+-dependent DNA ligase Staphylococcus aureus (LigA) as an antibacterial target using
full-length LigA with IC50 of 28 nM. Otherwise, Gong et al., 2004 found that
pyridochromanone compound inhibited nick joining by E.coli DNA LigA in the presence of 5
µM NAD+ with an IC50 of 0.6 µM. Dwivedi et al., 2008, established that Quinacrine (9-
aminoacridine), which bind to the nicked DNA, as a potent inhibitor of the E.coli DNA ligase
with IC50 of 1.5±0.2 µM. As well they found fagaronine chloride and nitidine chloride had very
potent ligation-inhibitory activity against human ligase I with IC50 27 and 69 µM, respectively.
Mills et al., 2011, identified several adenosine analogs as inhibitor to inhibit the
function of LigA (in vitro) by using high-throughput screening (HTS), and all the compounds
were chosen from AstraZeneca corporate library. One of these compounds had an IC50 of 0.5
and 1.27 µM against Haemophilus influenzae and E.coli LigA, respectively. Novel compounds
pyridopyrimidines and naphthyridines were identified as potent inhibitors of bacterial NAD+-
dependent E.coli DNA ligase LigA. This study depending the key interaction with the ligase
enzyme, specifically residues Glu114, Lys291, and Leu117 guided by molecular modelling
and X-ray crystallography. They found that pyridopyrimidines and naphthyridines compounds
had an IC50 of 0.077 and 0.23 µM against E.coli LigA.
Several derivatives of Dispiro-cycloalkanone specifically inhibited the nick-closing and
cohesive-end ligation activities of the NAD+-dependent DNA ligase of the Wolbachia
symbiont of Brugia malayi (wBm-LigA) without inhibiting human or T4 DNA ligase. The
active site of the target enzyme showed interaction with these compounds by using Docking
studies. The adverse effects of these inhibitors were observed on wBm-LigA in vitro. One of
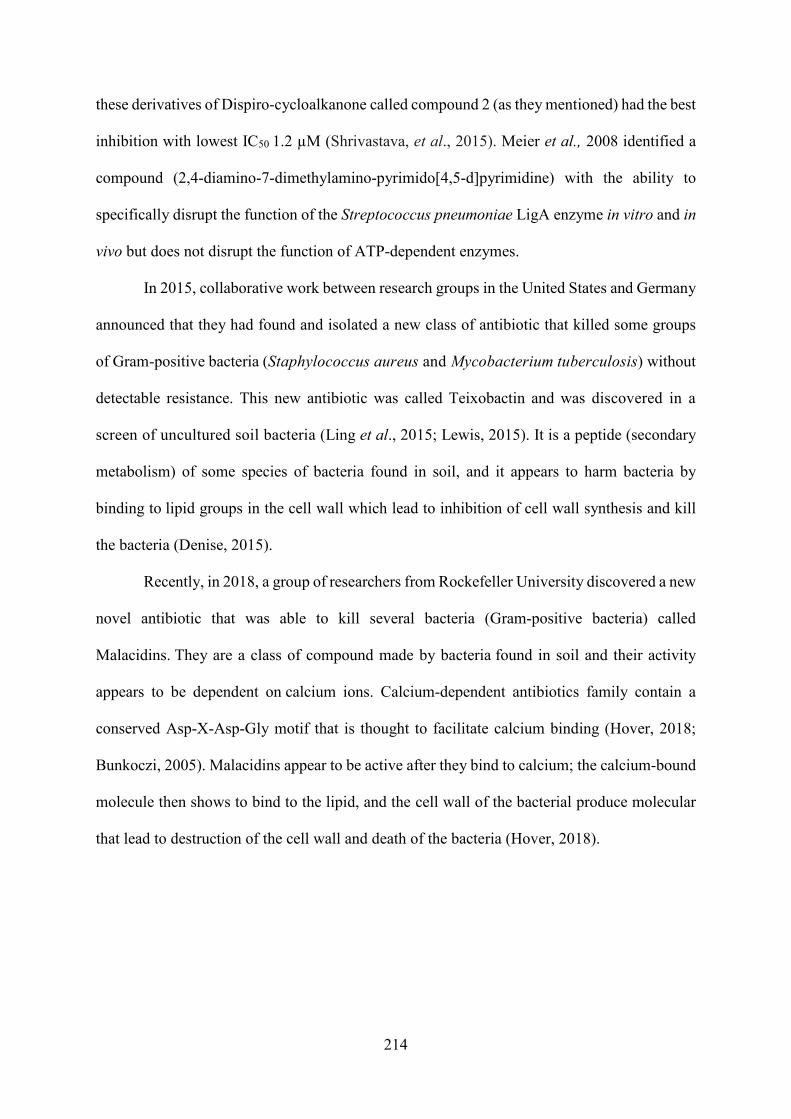
214
these derivatives of Dispiro-cycloalkanone called compound 2 (as they mentioned) had the best
inhibition with lowest IC50 1.2 µM (Shrivastava, et al., 2015). Meier et al., 2008 identified a
compound (2,4-diamino-7-dimethylamino-pyrimido[4,5-d]pyrimidine) with the ability to
specifically disrupt the function of the Streptococcus pneumoniae LigA enzyme in vitro and in
vivo but does not disrupt the function of ATP-dependent enzymes.
In 2015, collaborative work between research groups in the United States and Germany
announced that they had found and isolated a new class of antibiotic that killed some groups
of Gram-positive bacteria (Staphylococcus aureus and Mycobacterium tuberculosis) without
detectable resistance. This new antibiotic was called Teixobactin and was discovered in a
screen of uncultured soil bacteria (Ling et al., 2015; Lewis, 2015). It is a peptide (secondary
metabolism) of some species of bacteria found in soil, and it appears to harm bacteria by
binding to lipid groups in the cell wall which lead to inhibition of cell wall synthesis and kill
the bacteria (Denise, 2015).
Recently, in 2018, a group of researchers from Rockefeller University discovered a new
novel antibiotic that was able to kill several bacteria (Gram-positive bacteria) called
Malacidins. They are a class of compound made by bacteria found in soil and their activity
appears to be dependent on calcium ions. Calcium-dependent antibiotics family contain a
conserved Asp-X-Asp-Gly motif that is thought to facilitate calcium binding (Hover, 2018;
Bunkoczi, 2005). Malacidins appear to be active after they bind to calcium; the calcium-bound
molecule then shows to bind to the lipid, and the cell wall of the bacterial produce molecular
that lead to destruction of the cell wall and death of the bacteria (Hover, 2018).
215
References: Benarroch, D., & Shuman, S. (2006). Characterization of mimivirus NAD+-dependent DNA
ligase. Virology, 353(1), 133-143.
Benson, E. L., Tomich, P. K., Wolfe, M. L., Choi, G. H., Hagadorn, J. C., Mutchler, V. T., &
Garlick, R. L. (2004). A high-throughput resonance energy transfer assay for Staphylococcus
aureus DNA ligase. Analytical biochemistry, 324(2), 298-300.
Berkowitz, F. E. (1995) Antibiotic resistance in bacteria. Southern medical journal, 88(8), 797-
804.
Bodine, T. J., Evangelista, M. A., Chang, H. T., Ayoub, C. A., Samuel, B. S., Sucgang, R., &
Zechiedrich, L. (2017). Escherichia coli DNA ligase B may mitigate damage from oxidative
stress. PloS one, 12(7), e0180800.
Bullard, D. R., & Bowater, R. P. (2006). Direct comparison of nick-joining activity of the
nucleic acid ligases from bacteriophage T4. Biochemical Journal, 398(1), 135-144.
Bunkoczi, G., Vertesy, L. & Sheldrick, G. M (2005). Structure of the lipopeptide antibiotic
tsushimycin. Acta Crystallogr. Sect. D. 61, 1160�1164.
Branzei, D. and Foiani, M. (2008) Regulation of DNA repair throughout the cell cycle. Nat
Rev Mol Cell Biol., 9, 297�308.
Brotz-Oesterhelt, H., Knezevic, I., Bartel, S., Lampe, T., Warnecke-Eberz, U., Ziegelbauer, K.,
Habich, D. & Labischinski, H. (2003). Specific and potent inhibition of NAD+-dependent
DNA ligase by pyridochromanones. J Biol Chem 278, 39435-39442.
Cole, J. L., Lary, J. W., Moody, T. P., & Laue, T. M. (2008). Analytical ultracentrifugation:
sedimentation velocity and sedimentation equilibrium. Methods in cell biology, 84, 143-179.
Chambers, C. and Patrick, W. (2015). Archaeal Nucleic Acid Ligases and Their Potential in
Biotechnology. Archaea, 2015, pp.1-10.
216
Chauleau, M., & Shuman, S. (2016). Kinetic mechanism and fidelity of nick sealing by
Escherichia coli NAD+-dependent DNA ligase (LigA). Nucleic acids research, 44(5), 2298-
2309.
Chen, X. C., Hentz, N. G., Hubbard, F., Meier, T. I., Sittampalam, S., & Zhao, G. (2002).
Development of a fluorescence resonance energy transfer assay for measuring the activity of
Streptococcus pneumoniae DNA ligase, an enzyme essential for DNA replication, repair, and
recombination. Analytical biochemistry, 309(2), 232-240.
Cheng, C. (1997). Characterization of an ATP-dependent DNA ligase encoded by
Haemophilus influenzae. Nucleic Acids Research, 25(7), pp.1369-1374.
Cheng, C. and Shuman, S. (1997) Characterization of an ATP-dependent DNA ligase encoded
by Haemophilus influenzae. Nucleic Acids Res., 25, 1369�1375.
Cheng, W. and Roth, J. (1995) Isolation of NAD cycle mutants defective in nicotinamide
mononucleotide deamidase in Salmonella typhimurium. J Bacteriol, 177, 6711�6717.
Cherepanov, A.V. and de Vries, S. (2002). Dynamic mechanism of nick recognition by DNA
ligase. Eur. J. Biochem. 269, 5993�5999.
Čihák, A. (1974). Biological effects of 5-azacytidine in eukaryotes. Oncology, 30(5), 405-422.
Davies, J., & Davies, D. (2010). Origins and evolution of antibiotic resistance. Microbiology
and Molecular Biology Reviews : MMBR, 74, 417�433.http://doi.org/10.1128/MMBR.00016-
10.
Davis, Bryan G., Minh Q. Hoang, Mohammad A. Khan, and Donald E. Hunt (2010).
"Chlorhexidine acetate antiseptic cleaning agent." U.S. Patent 7,704,935, issued April 27.
Denise, G. (2015). From a pile of dirt, hope for a powerful new antibiotic. The New York Times.
217
Doherty, A. J., & Wigley, D. B. (1999). Functional domains of an ATP-dependent DNA
ligase1. Journal of molecular biology, 285(1), 63-71.
Doherty,A.J. and Suh,S.W. (2000) Structural and mechanistic conservation in DNA ligases.
Dugaiczyk, A., Boyer, H.W. and Goodman, H.M. (1975) Ligation of EcoRI
endonucleasegenerated DNA fragments into linear and circular structures. J Mol Biol., 96,
171�184.
Dwivedi, N., Dube, D., Pandey, J., Singh, B., Kukshal, V., Ramachandran, R., & Tripathi, R.
P. (2008). NAD+‐Dependent DNA Ligase: A novel target waiting for the right
inhibitor. Medicinal research reviews, 28(4), 545-568.
Edgell, D. R., & Doolittle, W. F. (1997). Archaea and the origin (s) of DNA replication
proteins. Cell, 89(7), 995-998.
Fraser, C. (2012). Bisubstrate Kinetics and Processivity Measurements on Escherichia Coli
DNA Ligase A (Doctoral dissertation, University of Portsmouth).
Ellenberger, T. and Tomkinson, A. (2008). Eukaryotic DNA Ligases: Structural and Functional
Insights. Annual Review of Biochemistry, 77(1), pp.313-338.
Estey, E. H. (2013). Epigenetics in clinical practice: the examples of azacitidine and decitabine
in myelodysplasia and acute myeloid leukemia. Leukemia, 27(9), 1803.
Feng, H., Parker, J. M., Lu, J., & Cao, W. (2004). Effects of deletion and site-directed mutations
on ligation steps of NAD+-dependent DNA ligase: a biochemical analysis of BRCA1 C-
terminal domain. Biochemistry, 43(39), 12648-12659.
Feng, S. (2015). Development of an antimicrobial cement using human defensins-like
antimicrobial peptides (Doctoral dissertation, University of Birmingham).
Fraser, C. (2012). Bisubstrate Kinetics and Processivity Measurements on Escherichia Coli
DNA Ligase A (Doctoral dissertation, University of Portsmouth).

218
Fried, M., & Crothers, D. M. (1981). Equilibria and kinetics of lac repressor-operator
interactions by polyacrylamide gel electrophoresis. Nucleic Acids Research, 9(23), 6505�6525.
Gajiwala, K. S., & Pinko, C. (2004). Structural rearrangement accompanying NAD+ synthesis
within a bacterial DNA ligase crystal. Structure, 12(8), 1449-1459.
Garner, M. M., & Revzin, A. (1981). A gel electrophoresis method for quantifying the binding
of proteins to specific DNA regions: application to components of the Escherichia coli lactose
operon regulatory system. Nucleic Acids Research, 9(13), 3047�3060.
Gefter, M. L., Becker, A. and Hurwitz, J. (1967). The enzymatic repair of DNA. I. Formation
of circular Lamda-DNA. Proc. Nat. Acad. Sci. 58, 240-247.
Gellert, M. (1967). Formation of covalent circles of lamda DNA by E.coli extracts. Proc. Nat.
Acad. Sci. 57, 148-155.
Georgescu, R. E., Kim, S. S., Yurieva, O., Kuriyan, J., Kong, X. P., & O'Donnell, M. (2008).
Structure of a sliding clamp on DNA. Cell, 132(1), 43-54.
Georlette, D., Blaise, V., Bouillenne, F., Damien, B., Thorbjarnardottir, S. H., Depiereux, E.,
Gerday, C., Uversky, V. N. & Feller, G. (2004). Adenylation-dependent conformation and
unfolding pathways of the NAD+-dependent DNA ligase from the thermophile Thermus
scotoductus. Biophys J. 86, 1089-1104. 168.
Gong, C., Martins, A., Bongiorno, P., Glickman, M., & Shuman, S. (2004). Biochemical and
genetic analysis of the four DNA ligases of mycobacteria. Journal of Biological
Chemistry, 279(20), 20594-20606.
Gul, S., Brown, R., May, E., Mazzulla, M., Smyth, M.G., Berry, C., Morby, A. and Powell,
Hayashi, K. I., Nakazawa, M., Ishizaki, Y., Hiraoka, N., & Obayashi, A. (1985). Stimulation
of intermolecular ligation with E. coli DNA ligase by high concentration of monovalent cations
in polyethylene glycol solutions. Nucleic acids research, 13(22), 7979-7992.
219
Gul, S., Brown, R., May, E., Mazzulla, M., Smyth, M.G., Berry, C., Morby, A. and Powell,
D.J. (2004) Staphylococcus aureus DNA ligase: characterization of its kinetics of catalysis
and development of a high-throughput screening compatible chemiluminescent
hybridization protection assay. Biochem J., 383, 551-559.
Hirayama, Y., Sakamaki, S., Takayanagi, N., Tsuji, Y., Sagawa, T., Chiba, H., ... & Niitsu, Y.
(2003). Chemotherapy with ubenimex corresponding to patient age and organ disorder for 18
cases of acute myelogeneous leukemia in elderly patients--effects, complications and long-
term survival. Gan to kagaku ryoho. Cancer & chemotherapy, 30(8), 1113-1118.
Hedglin, M., Kumar, R., & Benkovic, S. J. (2013). Replication clamps and clamp loaders. Cold
Spring Harbor perspectives in biology, 5(4), a010165.
Hellman, L. M., & Fried, M. G. (2007). Electrophoretic mobility shift assay (EMSA) for
detecting protein�nucleic acid interactions. Nature Protocols, 2(8), 1849�1861.
Hingorani, M. M., & O�Donnell, M. (1998). ATP binding to the Escherichia coli clamp loader
powers opening of the ring-shaped clamp of DNA polymerase III holoenzyme. Journal of
Biological Chemistry, 273(38), 24550-24563.
Horiuchi, T., Sato, T., & Nagata, T. (1975). DNA degradation in an amber mutant of
Escherichia coli K12 affecting DNA ligase and viability. Journal of molecular biology, 95(2),
271-287.
Hover, B. M., Kim, S. H., Katz, M., Charlop-Powers, Z., Owen, J. G., Ternei, M. A.,. & Perlin,
D. S. (2018). Culture-independent discovery of the malacidins as calcium-dependent
antibiotics with activity against multidrug-resistant Gram-positive pathogens. Nature
microbiology, 3(4), 415.
Hudzicki, J. (2016). Kirby-Bauer Disk Diffusion Susceptibility Test Protocol;(December
2009):1�23.
Indiani, C., & O'Donnell, M. (2006). The replication clamp-loading machine at work in the
three domains of life. Nature reviews Molecular cell biology, 7(10), 751.
220
Irwin, J. J., Sterling, T., Mysinger, M. M., Bolstad, E. S., & Coleman, R. G. (2012). ZINC: A
free tool to discover chemistry for biology. Journal of Chemical Information and Modeling,
52(7), 1757�1768. http://doi.org/10.1021/ci3001277.
Ishino, Y., Shinagawa, H., Makino, K., Tsunasawa, S., Sakiyama, F., & Nakata, A. (1986).
Nucleotide sequence of the lig gene and primary structure of DNA ligase of Escherichia
coli. Molecular and General Genetics MGG, 204(1), 1-7.
Jeon, H. J., Shin, H. J., Choi, J. J., Hoe, H. S., Kim, H. K., Suh, S. W., & Kwon, S. T. (2004).
Mutational analyses of the thermostable NAD+-dependent DNA ligase from Thermus
filiformis. FEMS microbiology letters, 237(1), 111-118.
Jackson, S.P. and Bartek, J. (2009) The DNA-damage response in human biology and
disease. Nature., 461, 1071�1078.
Jeruzalmi, D., O'Donnell, M., & Kuriyan, J. (2001). Crystal structure of the processivity clamp
loader gamma (γ) complex of E. coli DNA polymerase III. Cell, 106(4), 429-441.
Jeruzalmi, D., Yurieva, O., Zhao, Y., Young, M., Stewart, J., Hingorani, M., ... & Kuriyan, J.
(2001). Mechanism of processivity clamp opening by the delta subunit wrench of the clamp
loader complex of E. coli DNA polymerase III. Cell, 106(4), 417-428.
Johnson, A., & O'Donnell, M. (2005). Cellular DNA replicases: components and dynamics at
the replication fork. Annu. Rev. Biochem., 74, 283-315.
Kaczmarek, F. S., Zaniewski, R. P., Gootz, T. D., Danley, D. E., Mansour, M. N., Griffor, M.,
Kamath, A. V., Cronan, M., Mueller, J., Sun, D., Martin, P. K., Benton, B., McDowell, L.,
Biek, D. & Schmid, M. B. (2001). Cloning and functional characterization of an NAD+-
dependent DNA ligase from Staphylococcus aureus. J Bacterio.183, 3016-24.
Karibyants, N., Dautzenberg, H., & Coelfen, H. (1997). Characterization of PSS/PDADMAC-
co-AA polyelectrolyte complexes and their stoichiometry using analytical
ultracentrifugation. Macromolecules, 30(25), 7803-7809.
221
Kneale, G. G. (Ed.). (1994). DNA-Protein Interactions: Principles and Protocols. United
States: Humana Press.
Keppetipola, N. and Shuman, S. (2005). Characterization of a Thermophilic ATP-Dependent
DNA Ligase from the Euryarchaeon Pyrococcus horikoshii. Journal of Bacteriology, 187(20),
pp.6902-6908.
Kletzin, A. (1992). Molecular characterisation of a DNA ligase gene of the extremely
thermophilic archaeon Desulfurolobus ambivalens shows close phylogenetic relationship to
eukaryotic ligases. Nucleic acids research, 20(20), 5389-5396.
Kong, X. P., Onrust, R., O'Donnell, M., & Kuriyan, J. (1992). Three-dimensional structure of
the β subunit of E. coli DNA polymerase III holoenzyme: a sliding DNA clamp. Cell, 69(3),
425-437.
Konrad EB, Modrich P, Lehman IR (1973). Genetic and Enzymatic Characterization of a
Conditional Lethal Mutant of Escherichia coli K12 with a Temperature-sensitive DNA
Ligase. 1973;519�29.
Kukshal, V., Khanam, T., Chopra, D., Singh, N., Sanyal, S., & Ramachandran, R. (2012). M.
tuberculosis sliding β-clamp does not interact directly with the NAD+-dependent DNA
ligase. PLoS One, 7(4), e35702.
Lahiri, S. D., Gu, R. F., Gao, N., Karantzeni, I., Walkup, G. K., & Mills, S. D. (2012). Structure
guided understanding of NAD+ recognition in bacterial DNA ligases. ACS chemical
biology, 7(3), 571-580.
Lavesa-Curto, M., Sayer, H., Bullard, D., MacDonald, A., Wilkinson, A., Smith, A., Bowater,
L., Hemmings, A. & Bowater, R. P. (2004). Characterization of a temperature-sensitive DNA
ligase from Escherichia coli. Microbiology. 150, 4171-80.
222
Le, D., Hua, X., Huang, L., Gao, G., Lu, H., Xu, Z., Hua, Y. (2008). Biochemical
characterization of two DNA ligases from Deinococcus radiodurans. Protein and peptide
letters, 15(6), 600-605.
Lee, J. Y., Chang, C., Song, H. K., Moon, J., Yang, J. K., Kim, H. K., Kwon, S. T. & Suh, S.
W. (2000). Crystal structure of NAD(+)-dependent DNA ligase: modular architecture and
functional implications. EMBO J. 19, 1119-1129.
Lewis, K. (2015). NovoBiotic reports the discovery of teixobactin, a new antibiotic without
detectable resistance, Cambridge, Massachusetts. Novo Biotic Pharmaceuticals.
Lohman, G.J., Chen, L. and Evans, T.C. (2011A) Kinetic characterization of single strand
break ligation in duplex DNA by T4 DNA ligase. J Biol Chem., 286, 44187�44196.
Lohman, G. J., Tabor, S., & Nichols, N. M. (2011B). DNA ligases. Current Protocols in
Molecular Biology, 94(1), 3-14.
Lehnman, I. R. (1974). DNA ligase: structure, mechanism, and function. Science, 186(4166),
790-797.
Levin, D. S., Bai, W., Yao, N., O�Donnell, M., & Tomkinson, A. E. (1997). An interaction
between DNA ligase I and proliferating cell nuclear antigen: implications for Okazaki fragment
synthesis and joining. Proceedings of the National Academy of Sciences, 94(24), 12863-12868.
Lim, J. H., Choi, J., Kim, W., Ahn, B. Y., & Han, Y. S. (2001). Mutational analyses of Aquifex
pyrophilus DNA ligase define essential domains for self-adenylation and DNA binding
activity. Archives of biochemistry and biophysics, 388(2), 253-260.
Ling, L. L., Schneider, T., Peoples, A. J., Spoering, A. L., Engels, I., Conlon, B. P., ... & Jones,
M. (2015). A new antibiotic kills pathogens without detectable resistance. Nature, 517(7535),
455.
223
Little, J. W., Zimmerman, S. B., Oshinsky, C. K., & Gellert, M. (1967). Enzymatic joining of
DNA strands, II. An enzyme-adenylate intermediate in the dpn-dependent DNA ligase
reaction. Proceedings of the National Academy of Sciences, 58(5), 2004-2011.
Liu, P., Burdzy, A., & Sowers, L. C. (2004). DNA ligases ensure fidelity by interrogating minor
groove contacts. Nucleic acids research, 32(15), 4503-4511.
López de Saro, F.J. and O'Donnell, M. (2001). Interaction of the beta sliding clamp with MutS,
ligase, and DNA polymerase I. 98, 8376-8380.
Meier, T. I., Yan, D., Peery, R. B., McAllister, K. A., Zook, C., Peng, S. B., & Zhao, G. (2008).
Identification and characterization of an inhibitor specific to bacterial NAD+‐dependent DNA
ligases. The FEBS journal, 275(21), 5258-5271.
Miesel, L., Greene, J., & Black, T. A. (2003). Genetic strategies for antibacterial drug
discovery. Nature reviews. Genetics, 4(6), 442.
Miesel, L., Kravec, C., Xin, A. T., McMonagle, P., Ma, S., Pichardo, J., & Palermo, R. (2007).
A high-throughput assay for the adenylation reaction of bacterial DNA ligase. Analytical
biochemistry, 366(1), 9-17.
Mills, S. D., Eakin, A. E., Buurman, E. T., Newman, J. V., Gao, N., Huynh, H., ... & Yang, W.
(2011). Novel bacterial NAD+-dependent DNA ligase inhibitors with broad-spectrum activity
and antibacterial efficacy in vivo. Antimicrobial agents and chemotherapy, 55(3), 1088-1096.
Modrich P, Lehman IR. (1971). Enzymatic Characterization of a Mutant of Escherichia coli
with an Altered DNA Ligase;68(5):1002�5.
Modrich, P., & Lehman, I. R. (1973). Deoxyribonucleic Acid Ligase. a steady state kinetic
analysis of the reaction catalyzed by the enzyme from escherichia coli. Journal of Biological
Chemistry, 248(21), 7502-7511.
224
Molecular Operating Environment. (2013). Molecular Operating Environment (MOE). 1010
Sherbooke St. West, Suite #910, Montreal, QC, Canada, H3A 2R7, 2016.: Chemical
Computing Group Inc.,.
Montecucco, A., Pedrali-Noy, G., Spadari, S. & Ciarrocchi, G. (1988). Multiple roles of DNA
ligase at the replication fork. Biochim Biophys Acta 951, 330-334.
Murphy-Benenato, K. E., Gingipalli, L., Boriack-Sjodin, P. A., Martinez-Botella, G.,
Carcanague, D., Eyermann, C. J., ... & Jahic, H. (2015). Negishi cross-coupling enabled
synthesis of novel NAD+-dependent DNA ligase inhibitors and SAR development. Bioorganic
& medicinal chemistry letters, 25(22), 5172-5177.
Murzin, A. G. (1993). OB (oligonucleotide/oligosaccharide binding)-fold: common structural
and functional solution for non-homologous sequences. Embo J. 12, 861-867 171.
Naktinis, V., Onrust, R., Fang, L., & O'Donnell, M. (1995). Assembly of a chromosomal
replication machine: two DNA polymerases, a clamp loader, and sliding clamps in one
holoenzyme particle. II. Intermediate complex between the clamp loader and its clamp. Journal
of Biological Chemistry, 270(22), 13358-13365.
Nandakumar, J., Nair, P. A., & Shuman, S. (2007). Last stop on the road to repair: structure of
E. coli DNA ligase bound to nicked DNA-adenylate. Molecular cell, 26(2), 257-271.
Neu, H. C. (1992). The crisis in antibiotic resistance. Science, 257(5073), 1064-1074.
Nishida, H., Kiyonari, S., Ishino, Y. and Morikawa, K. (2006). The Closed Structure of an
Archaeal DNA Ligase from Pyrococcus furiosus. Journal of Molecular Biology, 360(5),
pp.956-967. Nucleic Acids Res., 28, 4051�4058. Nucleotide sequence of the lig gene and
primary structure of DNA ligase of Escherichia coli. Mol Gen Genet. 204, 1-7.
O'Donnell, M. E., & Kornberg, A. (1985). Complete replication of templates by Escherichia
coli DNA polymerase III holoenzyme. Journal of Biological Chemistry, 260(23), 12884-
12889.
225
Olivera, B. M., Hall, Z. W., Anraku, Y., Chien, J. R. and Lehman, I. R. (1967). On the
mechanism of the polynucleotide joining reaction. Cold Spring Harb. Symp. Quant. Biol. 33,
27-31.
Onrust, R., Finkelstein, J., Naktinis, V., Turner, J., Fang, L., & O'Donnell, M. (1995).
Assembly of a chromosomal replication machine: two DNA polymerases, a clamp loader, and
sliding clamps in one holoenzyme particle. I. Organization of the clamp loader. Journal of
Biological Chemistry, 270(22), 13348-13357.
Pascal, J.M., O�Brien, P.J., Tomkinson, A.E., and Ellenberger, T. (2004). Human DNA ligase
I completely encircles and partially unwinds nicked DNA. Nature 432, 473�478.
Petit, M. A., & Ehrlich, S. D. (2000). The NAD-dependent ligase encoded by yerG is an
essential gene of Bacillus subtilis. Nucleic acids research, 28(23), 4642-4648.
Pergolizzi, G., Cominetti, M.M., Butt, J.N., Field, R.A., Bowater, R.P. and Wagner, G.K.
(2015) Base-modified NAD and AMP derivatives and their activity against bacterial DNA
ligases. Org Biomol Chem., 13, 6380�6398.
Pergolizzi, G., Wagner, G. K., & Bowater, R. P. (2016). Biochemical and structural
characterisation of DNA ligases from bacteria and archaea. Bioscience reports, BSR20160003.
Podos, S. D., Thanassi, J. A., & Pucci, M. J. (2012). Mechanistic assessment of DNA ligase as
an antibacterial target in Staphylococcus aureus. Antimicrobial agents and
chemotherapy, 56(8), 4095-4102.
Roy, U., & Luck, L. A. (2007). Molecular modeling of estrogen receptor using molecular
operating environment. Biochemistry and Molecular Biology Education, 35(4), 238-243.
Rychta, E., Korycka-machala, M., Brzostek, A., Sayer, H., Rumijowska-galewicz, A.,
Bowater, R., & Dziadek, J. (2007). �Evaluation of NAD+-dependent DNA ligase of
mycobacteria as a potential target for antibiotics�, Anitimicrobial Agents & Chemotherapy, 51,
pp. 2888-2897.
226
Sassetti, C.M., Boyd, D.H. and Rubin, E.J. (2003) Genes required for mycobacterial growth
defined by high density mutagenesis. Mol Microbiol., 48, 77�84.
Sheraz, G. U. L., Brown, R., Earl, M. A. Y., Mazzulla, M., Smyth, M. G., Berry, C., & Powell,
D. J. (2004). Staphylococcus aureus DNA ligase: characterization of its kinetics of catalysis
and development of a high-throughput screening compatible chemiluminescent hybridization
protection assay. Biochemical Journal, 383(3), 551-559.
Shrivastava, N., Nag, J. K., Pandey, J., Tripathi, R. P., Shah, P., Siddiqi, M. I., & Misra-
Bhattacharya, S. (2015). Homology modeling of NAD+-dependent DNA ligase of the
Wolbachia endosymbiont of Brugia malayi and its drug target potential using dispiro-
cycloalkanones. Antimicrobial agents and chemotherapy, 59(7), 3736-3747.
Shuman, S. & Lima, C. D. (2004). The polynucleotide ligase and RNA capping enzyme
superfamily of covalent nucleotidyltransferases. Curr. Opin. Struct. Biol. 14, 757-764.
Shuman, S. (2009). DNA ligases: progress and prospects. Journal of Biological
Chemistry, 284(26), 17365-17369.
Singh, V., & Somvanshi, P. (2010). Toward the virtual screening of potential drugs in the
homology modeled NAD+ dependent DNA ligase from Mycobacterium tuberculosis. Protein
and peptide letters, 17(2), 269-276.
Stokes, S.S., Huynh, H., Gowravaram, M., Albert, R., Cavero-Tomas, M., Chen, B., Harang,
J.,Loch, J.T., Lu, M., Mullen, G.B., et al. (2011) Discovery of bacterial NAD+-dependent
DNA ligase inhibitors: optimization of antibacterial activity. Bioorg Med Chem Lett., 21,
4556�4560.
Singleton, M. R., Hakansson, K., Timson, D. J. & Wigley, D. B. (1999). Structure of the
adenylation domain of an NAD+-dependent DNA ligase. Structure. 7, 35-42.
Sriskanda, V., & Shuman, S. (2001). A second NAD+-dependent DNA ligase (LigB) in
Escherichia coli. Nucleic acids research, 29(24), 4930-4934.
227
Sriskanda, V. & Shuman, S. (2002a). Role of nucleotidyl transferase motif V in strand joining
by chlorella virus DNA ligase. J Biol Chem 277, 9661-9667.
Sriskanda, V. & Shuman, S. (2002b). Conserved residues in domain Ia are required for the
reaction of Escherichia coli DNA ligase with NAD+. J Biol Chem 277, 9695-9700.
Sriskanda, V., Moyer, R. W., & Shuman, S. (2001). NAD+-dependent DNA ligase encoded by
a eukaryotic virus. Journal of Biological Chemistry, 276(39), 36100-36109.
Sriskanda, V., Schwer, B., Ho, C. K., & Shuman, S. (1999). Mutational analysis of Escherichia
coli DNA ligase identifies amino acids required for nick-ligation in vitro and for in vivo
complementation of the growth of yeast cells deleted for CDC9 and LIG4. Nucleic acids
research, 27(20), 3953-3963.
Srivastava, S. K., Dube, D., Tewari, N., Dwivedi, N., Tripathi, R. P., & Ramachandran, R.
(2005). Mycobacterium tuberculosis NAD+-dependent DNA ligase is selectively inhibited by
glycosylamines compared with human DNA ligase I. Nucleic acids research, 33(22), 7090-
7101.
Sterling, T., & Irwin, J. J. (2015). ZINC 15 - Ligand Discovery for Everyone. Journal of
Chemical Information and Modeling, 55(11), 2324�2337.
http://doi.org/10.1021/acs.jcim.5b00559.
Stone, Carlanne (2017). Metabolite-RNase Communication, (Doctoral dissertation, University
of Portsmouth).
Stukenberg, P. T., Studwell-Vaughan, P. S., & O'Donnell, M. (1991). Mechanism of the sliding
beta-clamp of DNA polymerase III holoenzyme. Journal of Biological Chemistry, 266(17),
11328-11334.
Timson, D. J., & Wigley, D. B. (1999). Functional domains of an NAD+-dependent DNA
ligase. Journal of molecular biology, 285(1), 73-83.
228
Tian, W., Rockson, S. G., Jiang, X., Kim, J., Begaye, A., Shuffle, E. M., ... & Zamanian, R. T.
(2017). Leukotriene B4 antagonism ameliorates experimental lymphedema. Science
translational medicine, 9(389).
Tomkinson, A. E., Vijayakumar, S., Pascal, J. M., & Ellenberger, T. (2006). DNA ligases:
structure, reaction mechanism, and function. Chemical reviews, 106(2), 687-699.
Vicens, Q., & Westhof, E. (2003). Crystal structure of geneticin bound to a bacterial 16 S
ribosomal RNA A site oligonucleotide. Journal of molecular biology, 326(4), 1175-1188.
Vilar, Santiago; Cozzo, Giorgio; Moro S. (2008). Medicinal Chemistry and the Molecular
Operating Environment (MOE): Application of QSAR and Molecular Docking to Drug
Discovery. Curr Top Med Chem.8(18):1555�72.
Wang, L. K., Nair, P. A., & Shuman, S. (2008). Structure-guided mutational analysis of the
OB, HhH, and BRCT domains of Escherichia coli DNA ligase. Journal of Biological
Chemistry, 283(34), 23343-23352.
Wang, L. K., Zhu, H., & Shuman, S. (2009). Structure-guided mutational analysis of the
nucleotidyltransferase domain of Escherichia coli DNA ligase (LigA). Journal of Biological
Chemistry, 284(13), 8486-8494.
Weinstock, G. M., McEntee, K., & Lehman, I. R. (1979). ATP-dependent renaturation of DNA
catalyzed by the recA protein of Escherichia coli. Proceedings of the National Academy of
Sciences, 76(1), 126-130.
Weiss, B., & Richardson, C. C. (1967). Enzymatic breakage and joining of deoxyribonucleic
acid, I. Repair of single-strand breaks in DNA by an enzyme system from Escherichia coli
infected with T4 bacteriophage. Proceedings of the National Academy of Sciences of the
United States of America, 57(4), 1021.
Wilkinson, A., Day, J., & Bowater, R. (2001). Bacterial DNA ligases. Molecular microbiology
40(6), 1241-1248..
229
Wilkinson, A., Smith, A., Bullard, D., Lavesa-Curto, M., Sayer, H., Bonner, A., & Bowater,
R. (2005). Analysis of ligation and DNA binding by Escherichia coli DNA ligase
(LigA). Biochimica et Biophysica Acta (BBA)-Proteins and Proteomics, 1749(1), 113-122.
Yang, Y., & LiCata, V. J. (2018). Pol I DNA polymerases stimulate DNA end-joining by
Escherichia coli DNA ligase. Biochemical and biophysical research communications, 497(1),
13-18.
Zhao, A., Gray, F. C., & MacNeill, S. A. (2006). ATP‐and NAD+‐dependent DNA ligases
share an essential function in the halophilic archaeon Haloferax volcanii. Molecular
microbiology, 59(3), 743-752.
Zhu, H. & Shuman, S. (2005). Structure-guided mutational analysis of the
nucleotidyltransferase domain of Escherichia coli NAD+-dependent DNA ligase (LigA). J.
Biol. Chem. 280, 12137-12144 175.
Zimmerman, S. B., Little, J. W., Oshinsky, C. K., and Gellert, M. (1967). Enzymatic joining
of DNA strands: A novel reaction of diphosphopyridine nucleotide. PNAS. 57, 1841-18.
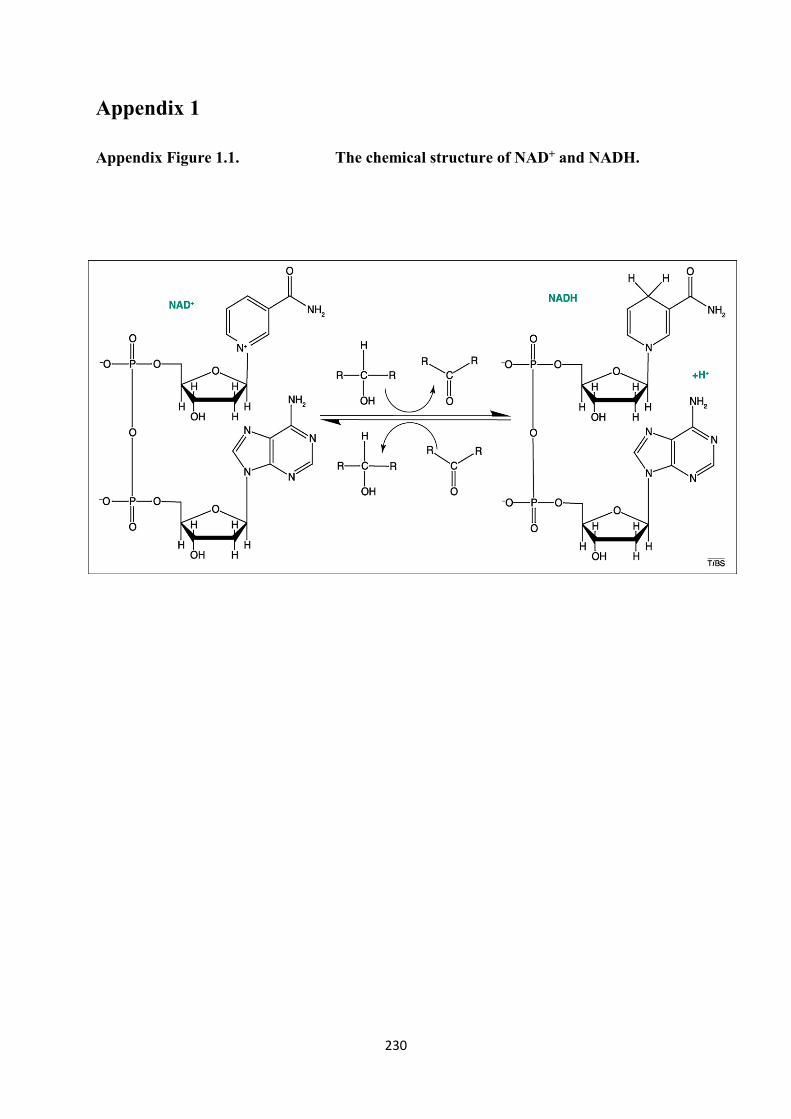
230
Appendix 1
Appendix Figure 1.1. The chemical structure of NAD+ and NADH.
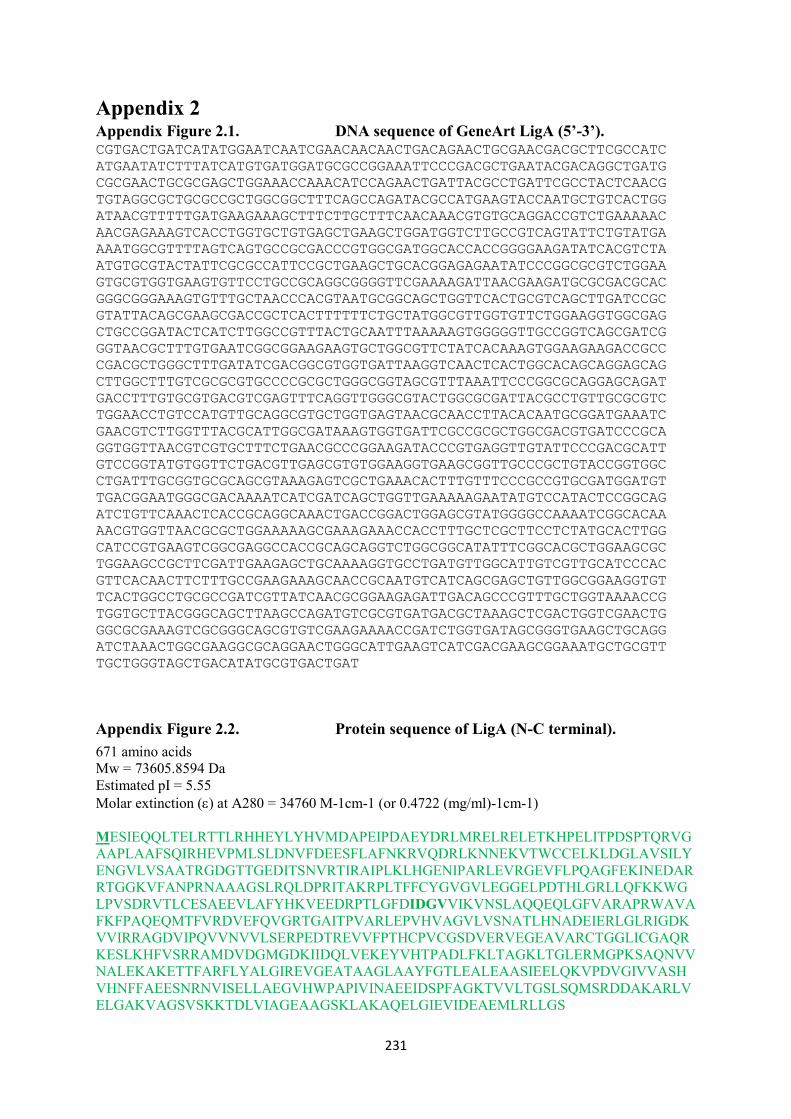
231
Appendix 2 Appendix Figure 2.1. DNA sequence of GeneArt LigA (5�-3�).CGTGACTGATCATATGGAATCAATCGAACAACAACTGACAGAACTGCGAACGACGCTTCGCCATC ATGAATATCTTTATCATGTGATGGATGCGCCGGAAATTCCCGACGCTGAATACGACAGGCTGATG CGCGAACTGCGCGAGCTGGAAACCAAACATCCAGAACTGATTACGCCTGATTCGCCTACTCAACG TGTAGGCGCTGCGCCGCTGGCGGCTTTCAGCCAGATACGCCATGAAGTACCAATGCTGTCACTGG ATAACGTTTTTGATGAAGAAAGCTTTCTTGCTTTCAACAAACGTGTGCAGGACCGTCTGAAAAAC AACGAGAAAGTCACCTGGTGCTGTGAGCTGAAGCTGGATGGTCTTGCCGTCAGTATTCTGTATGA AAATGGCGTTTTAGTCAGTGCCGCGACCCGTGGCGATGGCACCACCGGGGAAGATATCACGTCTA ATGTGCGTACTATTCGCGCCATTCCGCTGAAGCTGCACGGAGAGAATATCCCGGCGCGTCTGGAA GTGCGTGGTGAAGTGTTCCTGCCGCAGGCGGGGTTCGAAAAGATTAACGAAGATGCGCGACGCAC GGGCGGGAAAGTGTTTGCTAACCCACGTAATGCGGCAGCTGGTTCACTGCGTCAGCTTGATCCGC GTATTACAGCGAAGCGACCGCTCACTTTTTTCTGCTATGGCGTTGGTGTTCTGGAAGGTGGCGAG CTGCCGGATACTCATCTTGGCCGTTTACTGCAATTTAAAAAGTGGGGGTTGCCGGTCAGCGATCG GGTAACGCTTTGTGAATCGGCGGAAGAAGTGCTGGCGTTCTATCACAAAGTGGAAGAAGACCGCC CGACGCTGGGCTTTGATATCGACGGCGTGGTGATTAAGGTCAACTCACTGGCACAGCAGGAGCAG CTTGGCTTTGTCGCGCGTGCCCCGCGCTGGGCGGTAGCGTTTAAATTCCCGGCGCAGGAGCAGAT GACCTTTGTGCGTGACGTCGAGTTTCAGGTTGGGCGTACTGGCGCGATTACGCCTGTTGCGCGTC TGGAACCTGTCCATGTTGCAGGCGTGCTGGTGAGTAACGCAACCTTACACAATGCGGATGAAATC GAACGTCTTGGTTTACGCATTGGCGATAAAGTGGTGATTCGCCGCGCTGGCGACGTGATCCCGCA GGTGGTTAACGTCGTGCTTTCTGAACGCCCGGAAGATACCCGTGAGGTTGTATTCCCGACGCATT GTCCGGTATGTGGTTCTGACGTTGAGCGTGTGGAAGGTGAAGCGGTTGCCCGCTGTACCGGTGGC CTGATTTGCGGTGCGCAGCGTAAAGAGTCGCTGAAACACTTTGTTTCCCGCCGTGCGATGGATGT TGACGGAATGGGCGACAAAATCATCGATCAGCTGGTTGAAAAAGAATATGTCCATACTCCGGCAG ATCTGTTCAAACTCACCGCAGGCAAACTGACCGGACTGGAGCGTATGGGGCCAAAATCGGCACAA AACGTGGTTAACGCGCTGGAAAAAGCGAAAGAAACCACCTTTGCTCGCTTCCTCTATGCACTTGG CATCCGTGAAGTCGGCGAGGCCACCGCAGCAGGTCTGGCGGCATATTTCGGCACGCTGGAAGCGC TGGAAGCCGCTTCGATTGAAGAGCTGCAAAAGGTGCCTGATGTTGGCATTGTCGTTGCATCCCAC GTTCACAACTTCTTTGCCGAAGAAAGCAACCGCAATGTCATCAGCGAGCTGTTGGCGGAAGGTGT TCACTGGCCTGCGCCGATCGTTATCAACGCGGAAGAGATTGACAGCCCGTTTGCTGGTAAAACCG TGGTGCTTACGGGCAGCTTAAGCCAGATGTCGCGTGATGACGCTAAAGCTCGACTGGTCGAACTG GGCGCGAAAGTCGCGGGCAGCGTGTCGAAGAAAACCGATCTGGTGATAGCGGGTGAAGCTGCAGG ATCTAAACTGGCGAAGGCGCAGGAACTGGGCATTGAAGTCATCGACGAAGCGGAAATGCTGCGTT TGCTGGGTAGCTGACATATGCGTGACTGAT
Appendix Figure 2.2. Protein sequence of LigA (N-C terminal). 671 amino acids Mw = 73605.8594 Da Estimated pI = 5.55 Molar extinction (ε) at A280 = 34760 M-1cm-1 (or 0.4722 (mg/ml)-1cm-1)
MESIEQQLTELRTTLRHHEYLYHVMDAPEIPDAEYDRLMRELRELETKHPELITPDSPTQRVGAAPLAAFSQIRHEVPMLSLDNVFDEESFLAFNKRVQDRLKNNEKVTWCCELKLDGLAVSILYENGVLVSAATRGDGTTGEDITSNVRTIRAIPLKLHGENIPARLEVRGEVFLPQAGFEKINEDARRTGGKVFANPRNAAAGSLRQLDPRITAKRPLTFFCYGVGVLEGGELPDTHLGRLLQFKKWGLPVSDRVTLCESAEEVLAFYHKVEEDRPTLGFDIDGVVIKVNSLAQQEQLGFVARAPRWAVAFKFPAQEQMTFVRDVEFQVGRTGAITPVARLEPVHVAGVLVSNATLHNADEIERLGLRIGDKVVIRRAGDVIPQVVNVVLSERPEDTREVVFPTHCPVCGSDVERVEGEAVARCTGGLICGAQRKESLKHFVSRRAMDVDGMGDKIIDQLVEKEYVHTPADLFKLTAGKLTGLERMGPKSAQNVVNALEKAKETTFARFLYALGIREVGEATAAGLAAYFGTLEALEAASIEELQKVPDVGIVVASHVHNFFAEESNRNVISELLAEGVHWPAPIVINAEEIDSPFAGKTVVLTGSLSQMSRDDAKARLVELGAKVAGSVSKKTDLVIAGEAAGSKLAKAQELGIEVIDEAEMLRLLGS
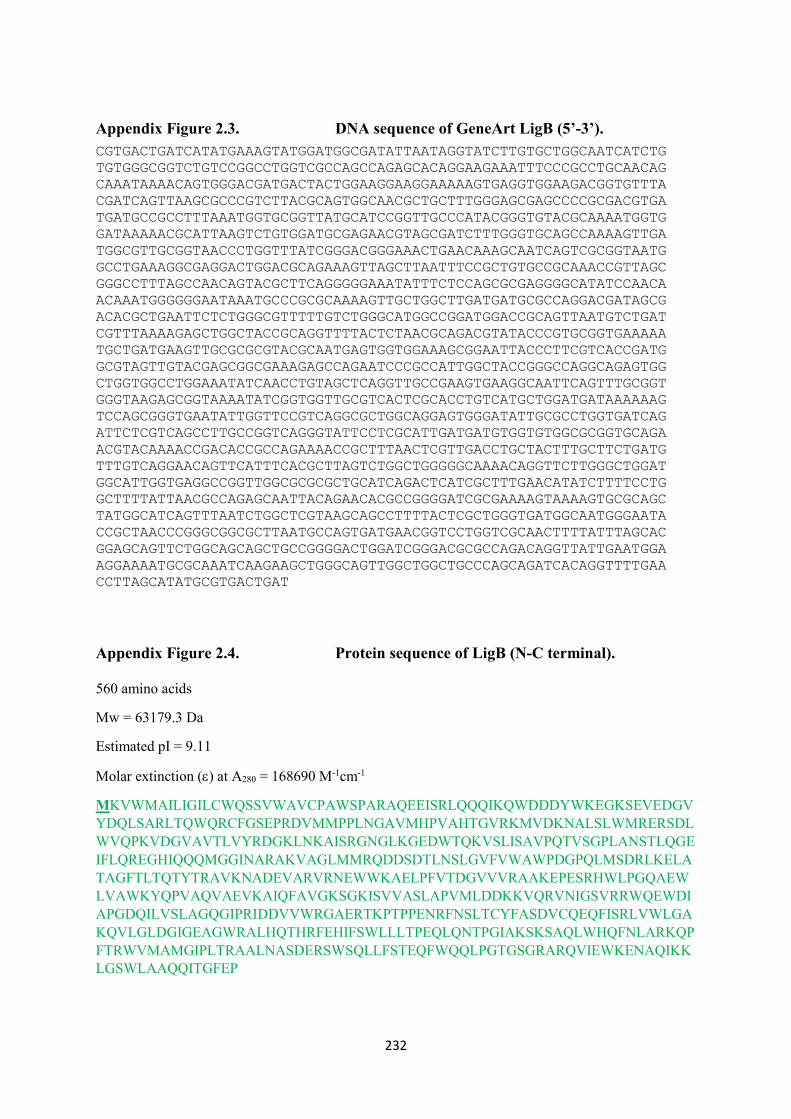
232
Appendix Figure 2.3. DNA sequence of GeneArt LigB (5�-3�). CGTGACTGATCATATGAAAGTATGGATGGCGATATTAATAGGTATCTTGTGCTGGCAATCATCTG TGTGGGCGGTCTGTCCGGCCTGGTCGCCAGCCAGAGCACAGGAAGAAATTTCCCGCCTGCAACAG CAAATAAAACAGTGGGACGATGACTACTGGAAGGAAGGAAAAAGTGAGGTGGAAGACGGTGTTTA CGATCAGTTAAGCGCCCGTCTTACGCAGTGGCAACGCTGCTTTGGGAGCGAGCCCCGCGACGTGA TGATGCCGCCTTTAAATGGTGCGGTTATGCATCCGGTTGCCCATACGGGTGTACGCAAAATGGTG GATAAAAACGCATTAAGTCTGTGGATGCGAGAACGTAGCGATCTTTGGGTGCAGCCAAAAGTTGA TGGCGTTGCGGTAACCCTGGTTTATCGGGACGGGAAACTGAACAAAGCAATCAGTCGCGGTAATG GCCTGAAAGGCGAGGACTGGACGCAGAAAGTTAGCTTAATTTCCGCTGTGCCGCAAACCGTTAGC GGGCCTTTAGCCAACAGTACGCTTCAGGGGGAAATATTTCTCCAGCGCGAGGGGCATATCCAACA ACAAATGGGGGGAATAAATGCCCGCGCAAAAGTTGCTGGCTTGATGATGCGCCAGGACGATAGCG ACACGCTGAATTCTCTGGGCGTTTTTGTCTGGGCATGGCCGGATGGACCGCAGTTAATGTCTGAT CGTTTAAAAGAGCTGGCTACCGCAGGTTTTACTCTAACGCAGACGTATACCCGTGCGGTGAAAAA TGCTGATGAAGTTGCGCGCGTACGCAATGAGTGGTGGAAAGCGGAATTACCCTTCGTCACCGATG GCGTAGTTGTACGAGCGGCGAAAGAGCCAGAATCCCGCCATTGGCTACCGGGCCAGGCAGAGTGG CTGGTGGCCTGGAAATATCAACCTGTAGCTCAGGTTGCCGAAGTGAAGGCAATTCAGTTTGCGGT GGGTAAGAGCGGTAAAATATCGGTGGTTGCGTCACTCGCACCTGTCATGCTGGATGATAAAAAAG TCCAGCGGGTGAATATTGGTTCCGTCAGGCGCTGGCAGGAGTGGGATATTGCGCCTGGTGATCAG ATTCTCGTCAGCCTTGCCGGTCAGGGTATTCCTCGCATTGATGATGTGGTGTGGCGCGGTGCAGA ACGTACAAAACCGACACCGCCAGAAAACCGCTTTAACTCGTTGACCTGCTACTTTGCTTCTGATG TTTGTCAGGAACAGTTCATTTCACGCTTAGTCTGGCTGGGGGCAAAACAGGTTCTTGGGCTGGAT GGCATTGGTGAGGCCGGTTGGCGCGCGCTGCATCAGACTCATCGCTTTGAACATATCTTTTCCTG GCTTTTATTAACGCCAGAGCAATTACAGAACACGCCGGGGATCGCGAAAAGTAAAAGTGCGCAGC TATGGCATCAGTTTAATCTGGCTCGTAAGCAGCCTTTTACTCGCTGGGTGATGGCAATGGGAATA CCGCTAACCCGGGCGGCGCTTAATGCCAGTGATGAACGGTCCTGGTCGCAACTTTTATTTAGCAC GGAGCAGTTCTGGCAGCAGCTGCCGGGGACTGGATCGGGACGCGCCAGACAGGTTATTGAATGGA AGGAAAATGCGCAAATCAAGAAGCTGGGCAGTTGGCTGGCTGCCCAGCAGATCACAGGTTTTGAA CCTTAGCATATGCGTGACTGAT
Appendix Figure 2.4. Protein sequence of LigB (N-C terminal).
560 amino acids
Mw = 63179.3 Da
Estimated pI = 9.11
Molar extinction (ε) at A280 = 168690 M-1cm-1
MKVWMAILIGILCWQSSVWAVCPAWSPARAQEEISRLQQQIKQWDDDYWKEGKSEVEDGVYDQLSARLTQWQRCFGSEPRDVMMPPLNGAVMHPVAHTGVRKMVDKNALSLWMRERSDLWVQPKVDGVAVTLVYRDGKLNKAISRGNGLKGEDWTQKVSLISAVPQTVSGPLANSTLQGEIFLQREGHIQQQMGGINARAKVAGLMMRQDDSDTLNSLGVFVWAWPDGPQLMSDRLKELATAGFTLTQTYTRAVKNADEVARVRNEWWKAELPFVTDGVVVRAAKEPESRHWLPGQAEWLVAWKYQPVAQVAEVKAIQFAVGKSGKISVVASLAPVMLDDKKVQRVNIGSVRRWQEWDIAPGDQILVSLAGQGIPRIDDVVWRGAERTKPTPPENRFNSLTCYFASDVCQEQFISRLVWLGAKQVLGLDGIGEAGWRALHQTHRFEHIFSWLLLTPEQLQNTPGIAKSKSAQLWHQFNLARKQPFTRWVMAMGIPLTRAALNASDERSWSQLLFSTEQFWQQLPGTGSGRARQVIEWKENAQIKKLGSWLAAQQITGFEP
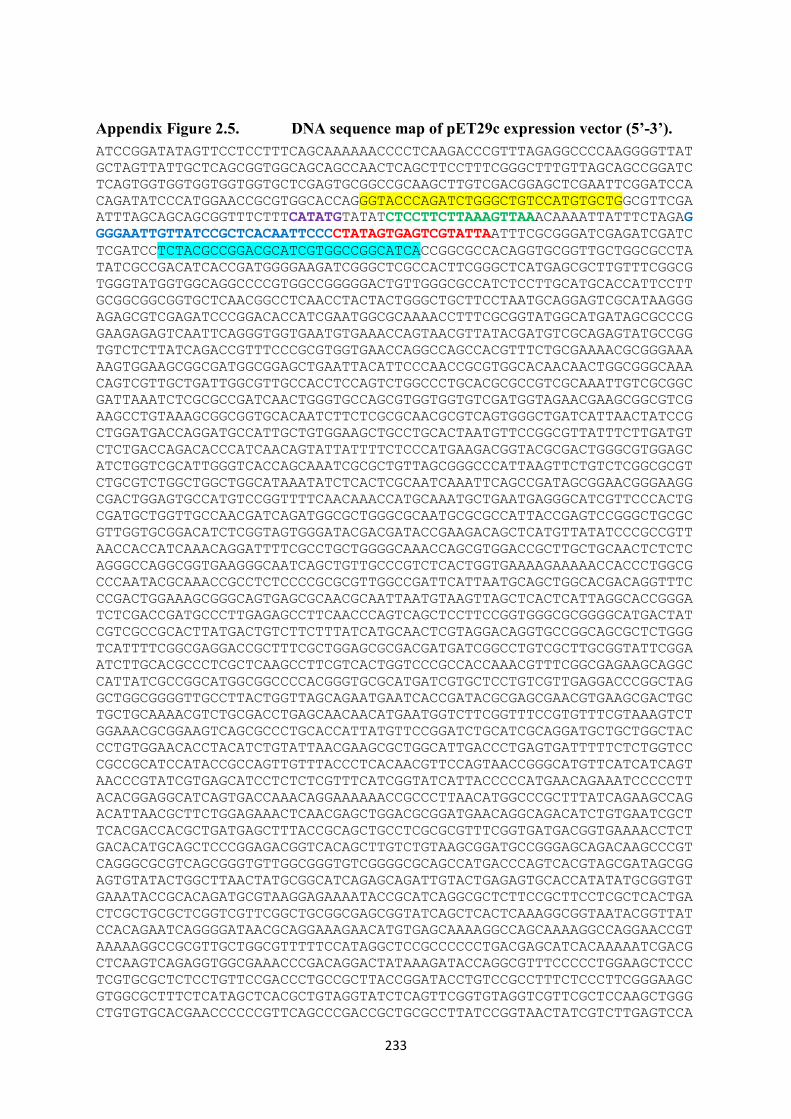
233
Appendix Figure 2.5. DNA sequence map of pET29c expression vector (5�-3�).ATCCGGATATAGTTCCTCCTTTCAGCAAAAAACCCCTCAAGACCCGTTTAGAGGCCCCAAGGGGTTATGCTAGTTATTGCTCAGCGGTGGCAGCAGCCAACTCAGCTTCCTTTCGGGCTTTGTTAGCAGCCGGATCTCAGTGGTGGTGGTGGTGGTGCTCGAGTGCGGCCGCAAGCTTGTCGACGGAGCTCGAATTCGGATCCACAGATATCCCATGGAACCGCGTGGCACCAGGGTACCCAGATCTGGGCTGTCCATGTGCTGGCGTTCGAATTTAGCAGCAGCGGTTTCTTTCATATGTATATCTCCTTCTTAAAGTTAAACAAAATTATTTCTAGAGGGGAATTGTTATCCGCTCACAATTCCCCTATAGTGAGTCGTATTAATTTCGCGGGATCGAGATCGATCTCGATCCTCTACGCCGGACGCATCGTGGCCGGCATCACCGGCGCCACAGGTGCGGTTGCTGGCGCCTATATCGCCGACATCACCGATGGGGAAGATCGGGCTCGCCACTTCGGGCTCATGAGCGCTTGTTTCGGCGTGGGTATGGTGGCAGGCCCCGTGGCCGGGGGACTGTTGGGCGCCATCTCCTTGCATGCACCATTCCTTGCGGCGGCGGTGCTCAACGGCCTCAACCTACTACTGGGCTGCTTCCTAATGCAGGAGTCGCATAAGGGAGAGCGTCGAGATCCCGGACACCATCGAATGGCGCAAAACCTTTCGCGGTATGGCATGATAGCGCCCGGAAGAGAGTCAATTCAGGGTGGTGAATGTGAAACCAGTAACGTTATACGATGTCGCAGAGTATGCCGGTGTCTCTTATCAGACCGTTTCCCGCGTGGTGAACCAGGCCAGCCACGTTTCTGCGAAAACGCGGGAAAAAGTGGAAGCGGCGATGGCGGAGCTGAATTACATTCCCAACCGCGTGGCACAACAACTGGCGGGCAAACAGTCGTTGCTGATTGGCGTTGCCACCTCCAGTCTGGCCCTGCACGCGCCGTCGCAAATTGTCGCGGCGATTAAATCTCGCGCCGATCAACTGGGTGCCAGCGTGGTGGTGTCGATGGTAGAACGAAGCGGCGTCGAAGCCTGTAAAGCGGCGGTGCACAATCTTCTCGCGCAACGCGTCAGTGGGCTGATCATTAACTATCCGCTGGATGACCAGGATGCCATTGCTGTGGAAGCTGCCTGCACTAATGTTCCGGCGTTATTTCTTGATGTCTCTGACCAGACACCCATCAACAGTATTATTTTCTCCCATGAAGACGGTACGCGACTGGGCGTGGAGCATCTGGTCGCATTGGGTCACCAGCAAATCGCGCTGTTAGCGGGCCCATTAAGTTCTGTCTCGGCGCGTCTGCGTCTGGCTGGCTGGCATAAATATCTCACTCGCAATCAAATTCAGCCGATAGCGGAACGGGAAGGCGACTGGAGTGCCATGTCCGGTTTTCAACAAACCATGCAAATGCTGAATGAGGGCATCGTTCCCACTGCGATGCTGGTTGCCAACGATCAGATGGCGCTGGGCGCAATGCGCGCCATTACCGAGTCCGGGCTGCGCGTTGGTGCGGACATCTCGGTAGTGGGATACGACGATACCGAAGACAGCTCATGTTATATCCCGCCGTTAACCACCATCAAACAGGATTTTCGCCTGCTGGGGCAAACCAGCGTGGACCGCTTGCTGCAACTCTCTCAGGGCCAGGCGGTGAAGGGCAATCAGCTGTTGCCCGTCTCACTGGTGAAAAGAAAAACCACCCTGGCGCCCAATACGCAAACCGCCTCTCCCCGCGCGTTGGCCGATTCATTAATGCAGCTGGCACGACAGGTTTCCCGACTGGAAAGCGGGCAGTGAGCGCAACGCAATTAATGTAAGTTAGCTCACTCATTAGGCACCGGGATCTCGACCGATGCCCTTGAGAGCCTTCAACCCAGTCAGCTCCTTCCGGTGGGCGCGGGGCATGACTATCGTCGCCGCACTTATGACTGTCTTCTTTATCATGCAACTCGTAGGACAGGTGCCGGCAGCGCTCTGGGTCATTTTCGGCGAGGACCGCTTTCGCTGGAGCGCGACGATGATCGGCCTGTCGCTTGCGGTATTCGGAATCTTGCACGCCCTCGCTCAAGCCTTCGTCACTGGTCCCGCCACCAAACGTTTCGGCGAGAAGCAGGCCATTATCGCCGGCATGGCGGCCCCACGGGTGCGCATGATCGTGCTCCTGTCGTTGAGGACCCGGCTAGGCTGGCGGGGTTGCCTTACTGGTTAGCAGAATGAATCACCGATACGCGAGCGAACGTGAAGCGACTGCTGCTGCAAAACGTCTGCGACCTGAGCAACAACATGAATGGTCTTCGGTTTCCGTGTTTCGTAAAGTCTGGAAACGCGGAAGTCAGCGCCCTGCACCATTATGTTCCGGATCTGCATCGCAGGATGCTGCTGGCTACCCTGTGGAACACCTACATCTGTATTAACGAAGCGCTGGCATTGACCCTGAGTGATTTTTCTCTGGTCCCGCCGCATCCATACCGCCAGTTGTTTACCCTCACAACGTTCCAGTAACCGGGCATGTTCATCATCAGTAACCCGTATCGTGAGCATCCTCTCTCGTTTCATCGGTATCATTACCCCCATGAACAGAAATCCCCCTTACACGGAGGCATCAGTGACCAAACAGGAAAAAACCGCCCTTAACATGGCCCGCTTTATCAGAAGCCAGACATTAACGCTTCTGGAGAAACTCAACGAGCTGGACGCGGATGAACAGGCAGACATCTGTGAATCGCTTCACGACCACGCTGATGAGCTTTACCGCAGCTGCCTCGCGCGTTTCGGTGATGACGGTGAAAACCTCTGACACATGCAGCTCCCGGAGACGGTCACAGCTTGTCTGTAAGCGGATGCCGGGAGCAGACAAGCCCGTCAGGGCGCGTCAGCGGGTGTTGGCGGGTGTCGGGGCGCAGCCATGACCCAGTCACGTAGCGATAGCGGAGTGTATACTGGCTTAACTATGCGGCATCAGAGCAGATTGTACTGAGAGTGCACCATATATGCGGTGTGAAATACCGCACAGATGCGTAAGGAGAAAATACCGCATCAGGCGCTCTTCCGCTTCCTCGCTCACTGACTCGCTGCGCTCGGTCGTTCGGCTGCGGCGAGCGGTATCAGCTCACTCAAAGGCGGTAATACGGTTATCCACAGAATCAGGGGATAACGCAGGAAAGAACATGTGAGCAAAAGGCCAGCAAAAGGCCAGGAACCGTAAAAAGGCCGCGTTGCTGGCGTTTTTCCATAGGCTCCGCCCCCCTGACGAGCATCACAAAAATCGACGCTCAAGTCAGAGGTGGCGAAACCCGACAGGACTATAAAGATACCAGGCGTTTCCCCCTGGAAGCTCCCTCGTGCGCTCTCCTGTTCCGACCCTGCCGCTTACCGGATACCTGTCCGCCTTTCTCCCTTCGGGAAGCGTGGCGCTTTCTCATAGCTCACGCTGTAGGTATCTCAGTTCGGTGTAGGTCGTTCGCTCCAAGCTGGGCTGTGTGCACGAACCCCCCGTTCAGCCCGACCGCTGCGCCTTATCCGGTAACTATCGTCTTGAGTCCA
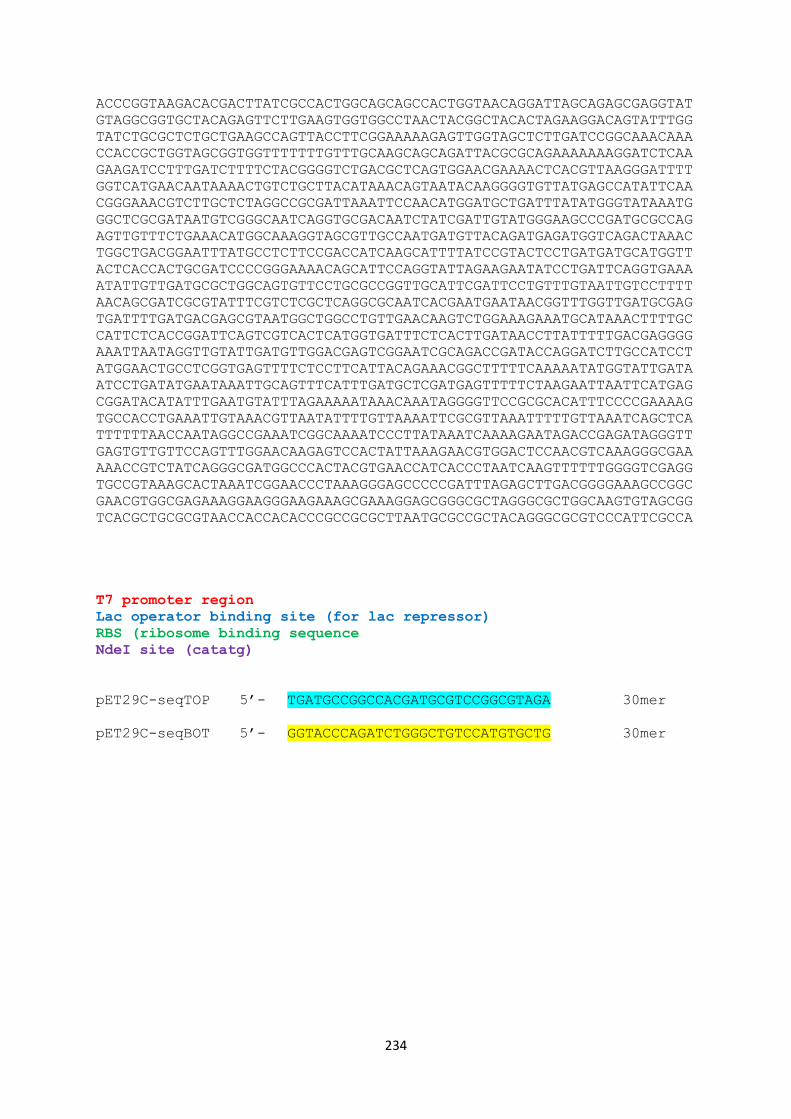
234
ACCCGGTAAGACACGACTTATCGCCACTGGCAGCAGCCACTGGTAACAGGATTAGCAGAGCGAGGTATGTAGGCGGTGCTACAGAGTTCTTGAAGTGGTGGCCTAACTACGGCTACACTAGAAGGACAGTATTTGGTATCTGCGCTCTGCTGAAGCCAGTTACCTTCGGAAAAAGAGTTGGTAGCTCTTGATCCGGCAAACAAACCACCGCTGGTAGCGGTGGTTTTTTTGTTTGCAAGCAGCAGATTACGCGCAGAAAAAAAGGATCTCAAGAAGATCCTTTGATCTTTTCTACGGGGTCTGACGCTCAGTGGAACGAAAACTCACGTTAAGGGATTTTGGTCATGAACAATAAAACTGTCTGCTTACATAAACAGTAATACAAGGGGTGTTATGAGCCATATTCAACGGGAAACGTCTTGCTCTAGGCCGCGATTAAATTCCAACATGGATGCTGATTTATATGGGTATAAATGGGCTCGCGATAATGTCGGGCAATCAGGTGCGACAATCTATCGATTGTATGGGAAGCCCGATGCGCCAGAGTTGTTTCTGAAACATGGCAAAGGTAGCGTTGCCAATGATGTTACAGATGAGATGGTCAGACTAAACTGGCTGACGGAATTTATGCCTCTTCCGACCATCAAGCATTTTATCCGTACTCCTGATGATGCATGGTTACTCACCACTGCGATCCCCGGGAAAACAGCATTCCAGGTATTAGAAGAATATCCTGATTCAGGTGAAAATATTGTTGATGCGCTGGCAGTGTTCCTGCGCCGGTTGCATTCGATTCCTGTTTGTAATTGTCCTTTTAACAGCGATCGCGTATTTCGTCTCGCTCAGGCGCAATCACGAATGAATAACGGTTTGGTTGATGCGAGTGATTTTGATGACGAGCGTAATGGCTGGCCTGTTGAACAAGTCTGGAAAGAAATGCATAAACTTTTGCCATTCTCACCGGATTCAGTCGTCACTCATGGTGATTTCTCACTTGATAACCTTATTTTTGACGAGGGGAAATTAATAGGTTGTATTGATGTTGGACGAGTCGGAATCGCAGACCGATACCAGGATCTTGCCATCCTATGGAACTGCCTCGGTGAGTTTTCTCCTTCATTACAGAAACGGCTTTTTCAAAAATATGGTATTGATAATCCTGATATGAATAAATTGCAGTTTCATTTGATGCTCGATGAGTTTTTCTAAGAATTAATTCATGAGCGGATACATATTTGAATGTATTTAGAAAAATAAACAAATAGGGGTTCCGCGCACATTTCCCCGAAAAGTGCCACCTGAAATTGTAAACGTTAATATTTTGTTAAAATTCGCGTTAAATTTTTGTTAAATCAGCTCATTTTTTAACCAATAGGCCGAAATCGGCAAAATCCCTTATAAATCAAAAGAATAGACCGAGATAGGGTTGAGTGTTGTTCCAGTTTGGAACAAGAGTCCACTATTAAAGAACGTGGACTCCAACGTCAAAGGGCGAAAAACCGTCTATCAGGGCGATGGCCCACTACGTGAACCATCACCCTAATCAAGTTTTTTGGGGTCGAGGTGCCGTAAAGCACTAAATCGGAACCCTAAAGGGAGCCCCCGATTTAGAGCTTGACGGGGAAAGCCGGCGAACGTGGCGAGAAAGGAAGGGAAGAAAGCGAAAGGAGCGGGCGCTAGGGCGCTGGCAAGTGTAGCGGTCACGCTGCGCGTAACCACCACACCCGCCGCGCTTAATGCGCCGCTACAGGGCGCGTCCCATTCGCCA
T7 promoter region Lac operator binding site (for lac repressor) RBS (ribosome binding sequence NdeI site (catatg)
pET29C-seqTOP 5�- TGATGCCGGCCACGATGCGTCCGGCGTAGA 30mer
pET29C-seqBOT 5�- GGTACCCAGATCTGGGCTGTCCATGTGCTG 30mer
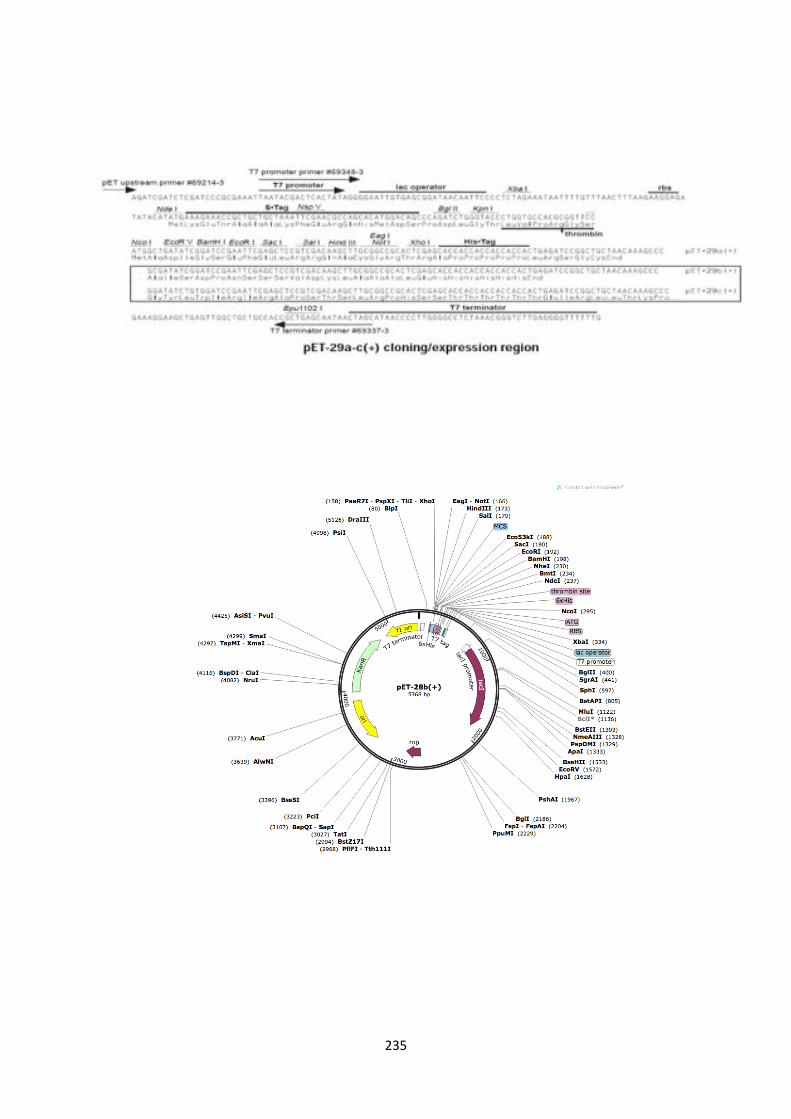
235
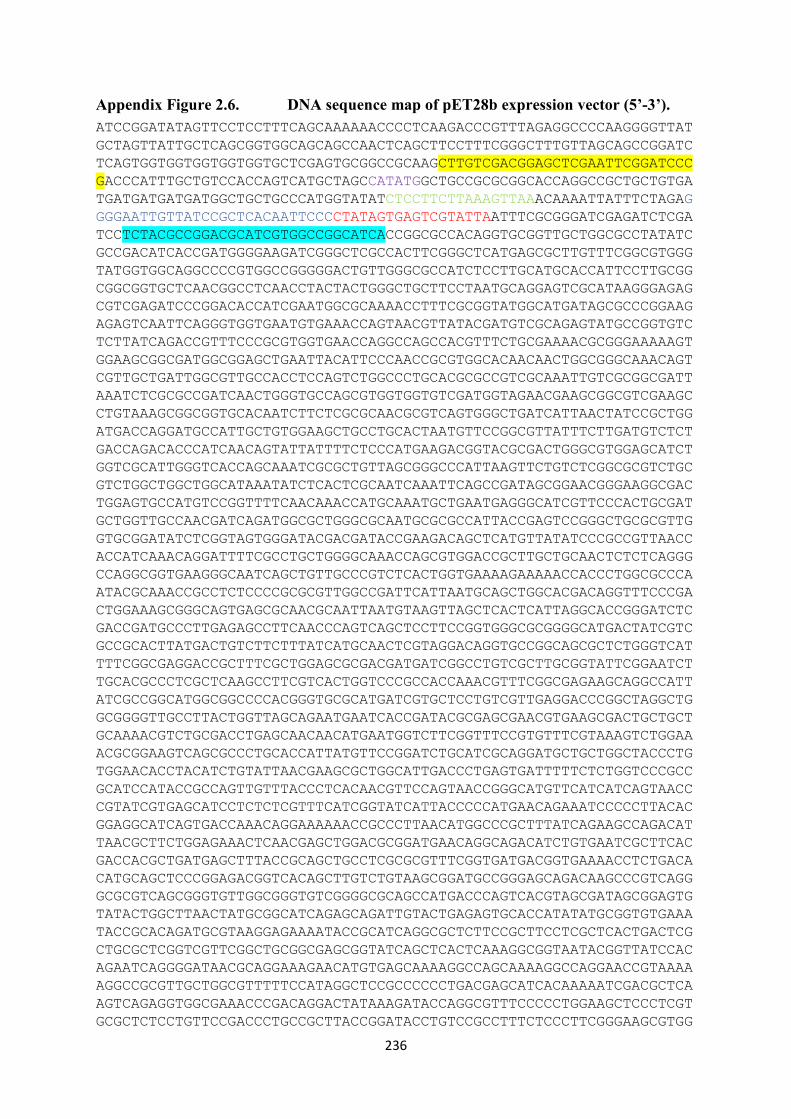
236
Appendix Figure 2.6. DNA sequence map of pET28b expression vector (5�-3�).ATCCGGATATAGTTCCTCCTTTCAGCAAAAAACCCCTCAAGACCCGTTTAGAGGCCCCAAGGGGTTATGCTAGTTATTGCTCAGCGGTGGCAGCAGCCAACTCAGCTTCCTTTCGGGCTTTGTTAGCAGCCGGATCTCAGTGGTGGTGGTGGTGGTGCTCGAGTGCGGCCGCAAGCTTGTCGACGGAGCTCGAATTCGGATCCCGACCCATTTGCTGTCCACCAGTCATGCTAGCCATATGGCTGCCGCGCGGCACCAGGCCGCTGCTGTGATGATGATGATGATGGCTGCTGCCCATGGTATATCTCCTTCTTAAAGTTAAACAAAATTATTTCTAGAGGGGAATTGTTATCCGCTCACAATTCCCCTATAGTGAGTCGTATTAATTTCGCGGGATCGAGATCTCGATCCTCTACGCCGGACGCATCGTGGCCGGCATCACCGGCGCCACAGGTGCGGTTGCTGGCGCCTATATCGCCGACATCACCGATGGGGAAGATCGGGCTCGCCACTTCGGGCTCATGAGCGCTTGTTTCGGCGTGGGTATGGTGGCAGGCCCCGTGGCCGGGGGACTGTTGGGCGCCATCTCCTTGCATGCACCATTCCTTGCGGCGGCGGTGCTCAACGGCCTCAACCTACTACTGGGCTGCTTCCTAATGCAGGAGTCGCATAAGGGAGAGCGTCGAGATCCCGGACACCATCGAATGGCGCAAAACCTTTCGCGGTATGGCATGATAGCGCCCGGAAGAGAGTCAATTCAGGGTGGTGAATGTGAAACCAGTAACGTTATACGATGTCGCAGAGTATGCCGGTGTCTCTTATCAGACCGTTTCCCGCGTGGTGAACCAGGCCAGCCACGTTTCTGCGAAAACGCGGGAAAAAGTGGAAGCGGCGATGGCGGAGCTGAATTACATTCCCAACCGCGTGGCACAACAACTGGCGGGCAAACAGTCGTTGCTGATTGGCGTTGCCACCTCCAGTCTGGCCCTGCACGCGCCGTCGCAAATTGTCGCGGCGATTAAATCTCGCGCCGATCAACTGGGTGCCAGCGTGGTGGTGTCGATGGTAGAACGAAGCGGCGTCGAAGCCTGTAAAGCGGCGGTGCACAATCTTCTCGCGCAACGCGTCAGTGGGCTGATCATTAACTATCCGCTGGATGACCAGGATGCCATTGCTGTGGAAGCTGCCTGCACTAATGTTCCGGCGTTATTTCTTGATGTCTCTGACCAGACACCCATCAACAGTATTATTTTCTCCCATGAAGACGGTACGCGACTGGGCGTGGAGCATCTGGTCGCATTGGGTCACCAGCAAATCGCGCTGTTAGCGGGCCCATTAAGTTCTGTCTCGGCGCGTCTGCGTCTGGCTGGCTGGCATAAATATCTCACTCGCAATCAAATTCAGCCGATAGCGGAACGGGAAGGCGACTGGAGTGCCATGTCCGGTTTTCAACAAACCATGCAAATGCTGAATGAGGGCATCGTTCCCACTGCGATGCTGGTTGCCAACGATCAGATGGCGCTGGGCGCAATGCGCGCCATTACCGAGTCCGGGCTGCGCGTTGGTGCGGATATCTCGGTAGTGGGATACGACGATACCGAAGACAGCTCATGTTATATCCCGCCGTTAACCACCATCAAACAGGATTTTCGCCTGCTGGGGCAAACCAGCGTGGACCGCTTGCTGCAACTCTCTCAGGGCCAGGCGGTGAAGGGCAATCAGCTGTTGCCCGTCTCACTGGTGAAAAGAAAAACCACCCTGGCGCCCAATACGCAAACCGCCTCTCCCCGCGCGTTGGCCGATTCATTAATGCAGCTGGCACGACAGGTTTCCCGACTGGAAAGCGGGCAGTGAGCGCAACGCAATTAATGTAAGTTAGCTCACTCATTAGGCACCGGGATCTCGACCGATGCCCTTGAGAGCCTTCAACCCAGTCAGCTCCTTCCGGTGGGCGCGGGGCATGACTATCGTCGCCGCACTTATGACTGTCTTCTTTATCATGCAACTCGTAGGACAGGTGCCGGCAGCGCTCTGGGTCATTTTCGGCGAGGACCGCTTTCGCTGGAGCGCGACGATGATCGGCCTGTCGCTTGCGGTATTCGGAATCTTGCACGCCCTCGCTCAAGCCTTCGTCACTGGTCCCGCCACCAAACGTTTCGGCGAGAAGCAGGCCATTATCGCCGGCATGGCGGCCCCACGGGTGCGCATGATCGTGCTCCTGTCGTTGAGGACCCGGCTAGGCTGGCGGGGTTGCCTTACTGGTTAGCAGAATGAATCACCGATACGCGAGCGAACGTGAAGCGACTGCTGCTGCAAAACGTCTGCGACCTGAGCAACAACATGAATGGTCTTCGGTTTCCGTGTTTCGTAAAGTCTGGAAACGCGGAAGTCAGCGCCCTGCACCATTATGTTCCGGATCTGCATCGCAGGATGCTGCTGGCTACCCTGTGGAACACCTACATCTGTATTAACGAAGCGCTGGCATTGACCCTGAGTGATTTTTCTCTGGTCCCGCCGCATCCATACCGCCAGTTGTTTACCCTCACAACGTTCCAGTAACCGGGCATGTTCATCATCAGTAACCCGTATCGTGAGCATCCTCTCTCGTTTCATCGGTATCATTACCCCCATGAACAGAAATCCCCCTTACACGGAGGCATCAGTGACCAAACAGGAAAAAACCGCCCTTAACATGGCCCGCTTTATCAGAAGCCAGACATTAACGCTTCTGGAGAAACTCAACGAGCTGGACGCGGATGAACAGGCAGACATCTGTGAATCGCTTCACGACCACGCTGATGAGCTTTACCGCAGCTGCCTCGCGCGTTTCGGTGATGACGGTGAAAACCTCTGACACATGCAGCTCCCGGAGACGGTCACAGCTTGTCTGTAAGCGGATGCCGGGAGCAGACAAGCCCGTCAGGGCGCGTCAGCGGGTGTTGGCGGGTGTCGGGGCGCAGCCATGACCCAGTCACGTAGCGATAGCGGAGTGTATACTGGCTTAACTATGCGGCATCAGAGCAGATTGTACTGAGAGTGCACCATATATGCGGTGTGAAATACCGCACAGATGCGTAAGGAGAAAATACCGCATCAGGCGCTCTTCCGCTTCCTCGCTCACTGACTCGCTGCGCTCGGTCGTTCGGCTGCGGCGAGCGGTATCAGCTCACTCAAAGGCGGTAATACGGTTATCCACAGAATCAGGGGATAACGCAGGAAAGAACATGTGAGCAAAAGGCCAGCAAAAGGCCAGGAACCGTAAAAAGGCCGCGTTGCTGGCGTTTTTCCATAGGCTCCGCCCCCCTGACGAGCATCACAAAAATCGACGCTCAAGTCAGAGGTGGCGAAACCCGACAGGACTATAAAGATACCAGGCGTTTCCCCCTGGAAGCTCCCTCGTGCGCTCTCCTGTTCCGACCCTGCCGCTTACCGGATACCTGTCCGCCTTTCTCCCTTCGGGAAGCGTGG
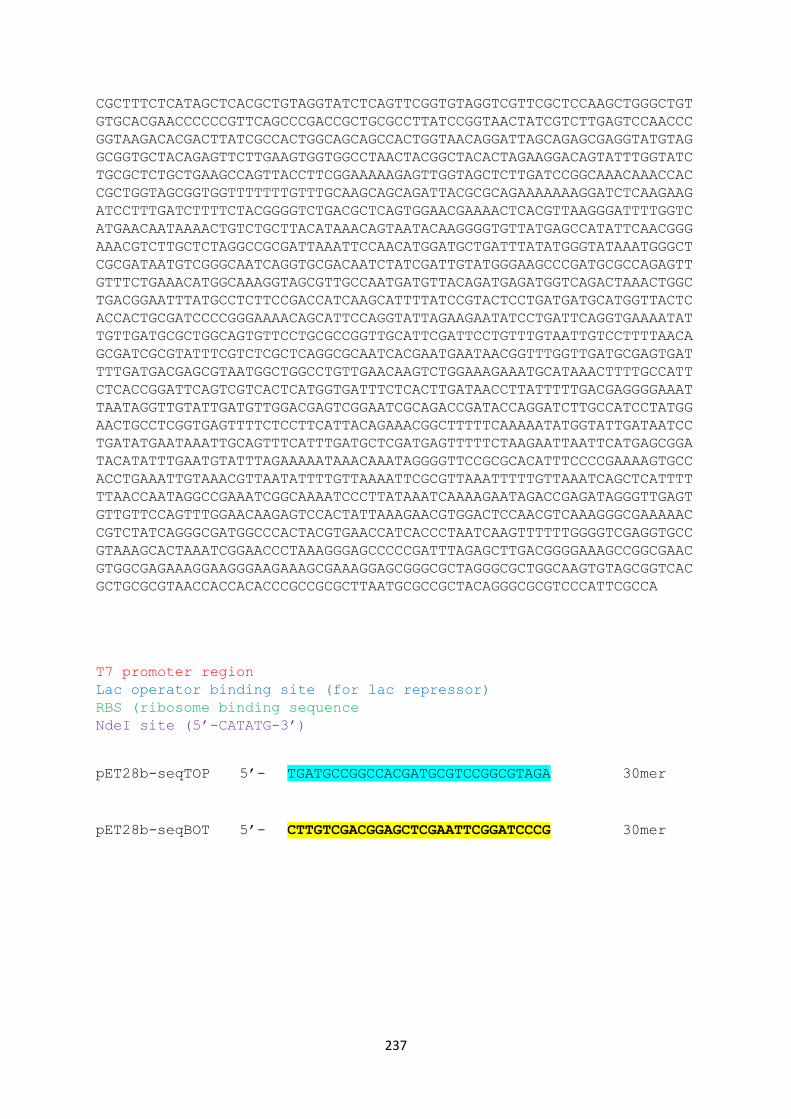
237
CGCTTTCTCATAGCTCACGCTGTAGGTATCTCAGTTCGGTGTAGGTCGTTCGCTCCAAGCTGGGCTGTGTGCACGAACCCCCCGTTCAGCCCGACCGCTGCGCCTTATCCGGTAACTATCGTCTTGAGTCCAACCCGGTAAGACACGACTTATCGCCACTGGCAGCAGCCACTGGTAACAGGATTAGCAGAGCGAGGTATGTAGGCGGTGCTACAGAGTTCTTGAAGTGGTGGCCTAACTACGGCTACACTAGAAGGACAGTATTTGGTATCTGCGCTCTGCTGAAGCCAGTTACCTTCGGAAAAAGAGTTGGTAGCTCTTGATCCGGCAAACAAACCACCGCTGGTAGCGGTGGTTTTTTTGTTTGCAAGCAGCAGATTACGCGCAGAAAAAAAGGATCTCAAGAAGATCCTTTGATCTTTTCTACGGGGTCTGACGCTCAGTGGAACGAAAACTCACGTTAAGGGATTTTGGTCATGAACAATAAAACTGTCTGCTTACATAAACAGTAATACAAGGGGTGTTATGAGCCATATTCAACGGGAAACGTCTTGCTCTAGGCCGCGATTAAATTCCAACATGGATGCTGATTTATATGGGTATAAATGGGCTCGCGATAATGTCGGGCAATCAGGTGCGACAATCTATCGATTGTATGGGAAGCCCGATGCGCCAGAGTTGTTTCTGAAACATGGCAAAGGTAGCGTTGCCAATGATGTTACAGATGAGATGGTCAGACTAAACTGGCTGACGGAATTTATGCCTCTTCCGACCATCAAGCATTTTATCCGTACTCCTGATGATGCATGGTTACTCACCACTGCGATCCCCGGGAAAACAGCATTCCAGGTATTAGAAGAATATCCTGATTCAGGTGAAAATATTGTTGATGCGCTGGCAGTGTTCCTGCGCCGGTTGCATTCGATTCCTGTTTGTAATTGTCCTTTTAACAGCGATCGCGTATTTCGTCTCGCTCAGGCGCAATCACGAATGAATAACGGTTTGGTTGATGCGAGTGATTTTGATGACGAGCGTAATGGCTGGCCTGTTGAACAAGTCTGGAAAGAAATGCATAAACTTTTGCCATTCTCACCGGATTCAGTCGTCACTCATGGTGATTTCTCACTTGATAACCTTATTTTTGACGAGGGGAAATTAATAGGTTGTATTGATGTTGGACGAGTCGGAATCGCAGACCGATACCAGGATCTTGCCATCCTATGGAACTGCCTCGGTGAGTTTTCTCCTTCATTACAGAAACGGCTTTTTCAAAAATATGGTATTGATAATCCTGATATGAATAAATTGCAGTTTCATTTGATGCTCGATGAGTTTTTCTAAGAATTAATTCATGAGCGGATACATATTTGAATGTATTTAGAAAAATAAACAAATAGGGGTTCCGCGCACATTTCCCCGAAAAGTGCCACCTGAAATTGTAAACGTTAATATTTTGTTAAAATTCGCGTTAAATTTTTGTTAAATCAGCTCATTTTTTAACCAATAGGCCGAAATCGGCAAAATCCCTTATAAATCAAAAGAATAGACCGAGATAGGGTTGAGTGTTGTTCCAGTTTGGAACAAGAGTCCACTATTAAAGAACGTGGACTCCAACGTCAAAGGGCGAAAAACCGTCTATCAGGGCGATGGCCCACTACGTGAACCATCACCCTAATCAAGTTTTTTGGGGTCGAGGTGCCGTAAAGCACTAAATCGGAACCCTAAAGGGAGCCCCCGATTTAGAGCTTGACGGGGAAAGCCGGCGAACGTGGCGAGAAAGGAAGGGAAGAAAGCGAAAGGAGCGGGCGCTAGGGCGCTGGCAAGTGTAGCGGTCACGCTGCGCGTAACCACCACACCCGCCGCGCTTAATGCGCCGCTACAGGGCGCGTCCCATTCGCCA
T7 promoter region Lac operator binding site (for lac repressor) RBS (ribosome binding sequence NdeI site (5�-CATATG-3�)
pET28b-seqTOP 5�- TGATGCCGGCCACGATGCGTCCGGCGTAGA 30mer
pET28b-seqBOT 5�- CTTGTCGACGGAGCTCGAATTCGGATCCCG 30mer
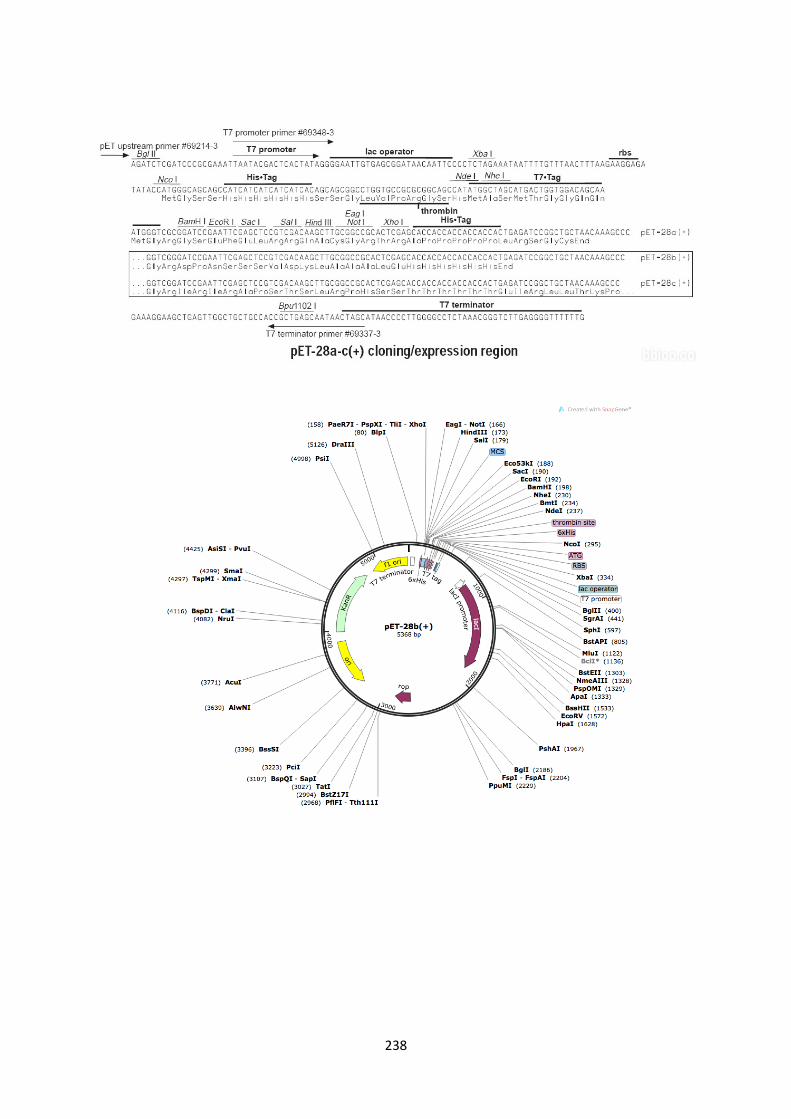
238
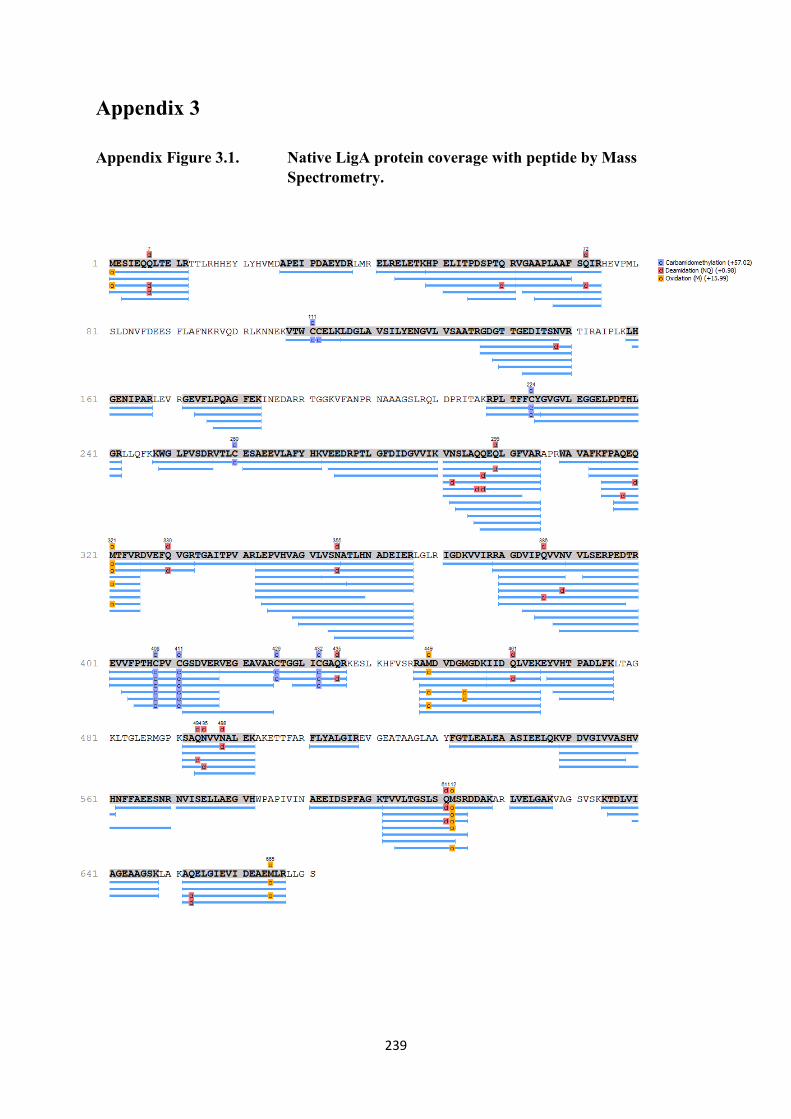
239
Appendix 3
Appendix Figure 3.1. Native LigA protein coverage with peptide by Mass Spectrometry.
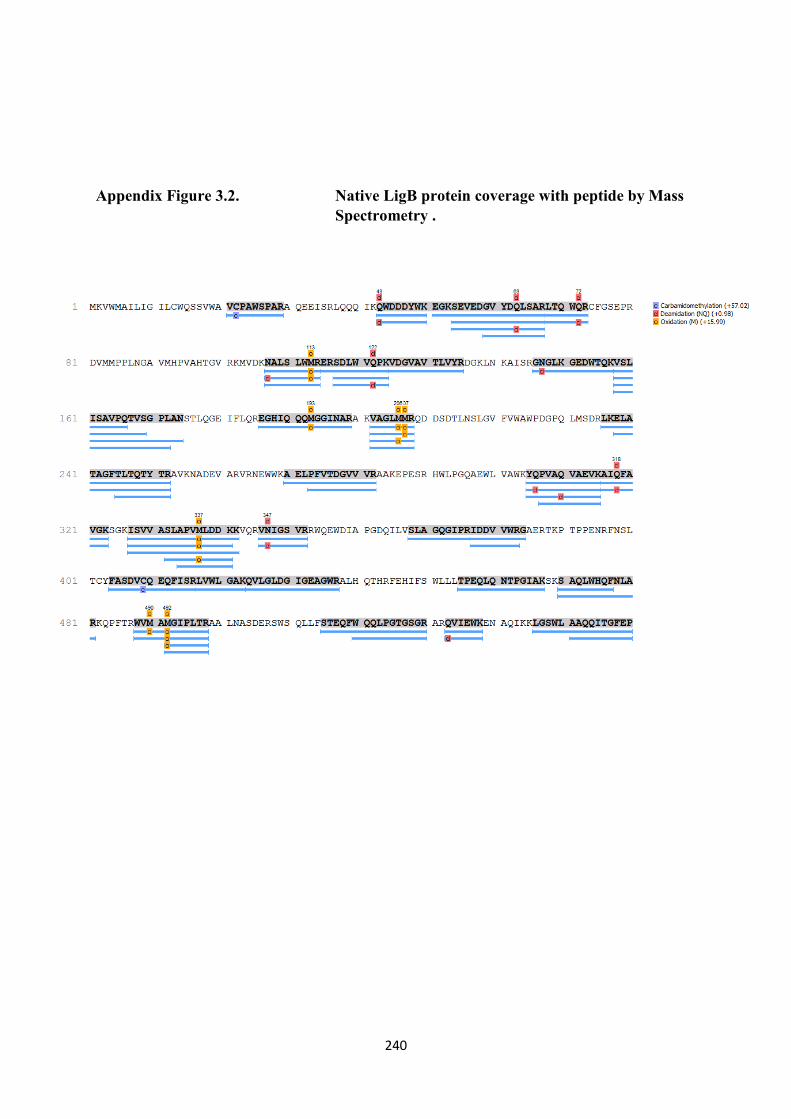
240
Appendix Figure 3.2. Native LigB protein coverage with peptide by Mass Spectrometry .
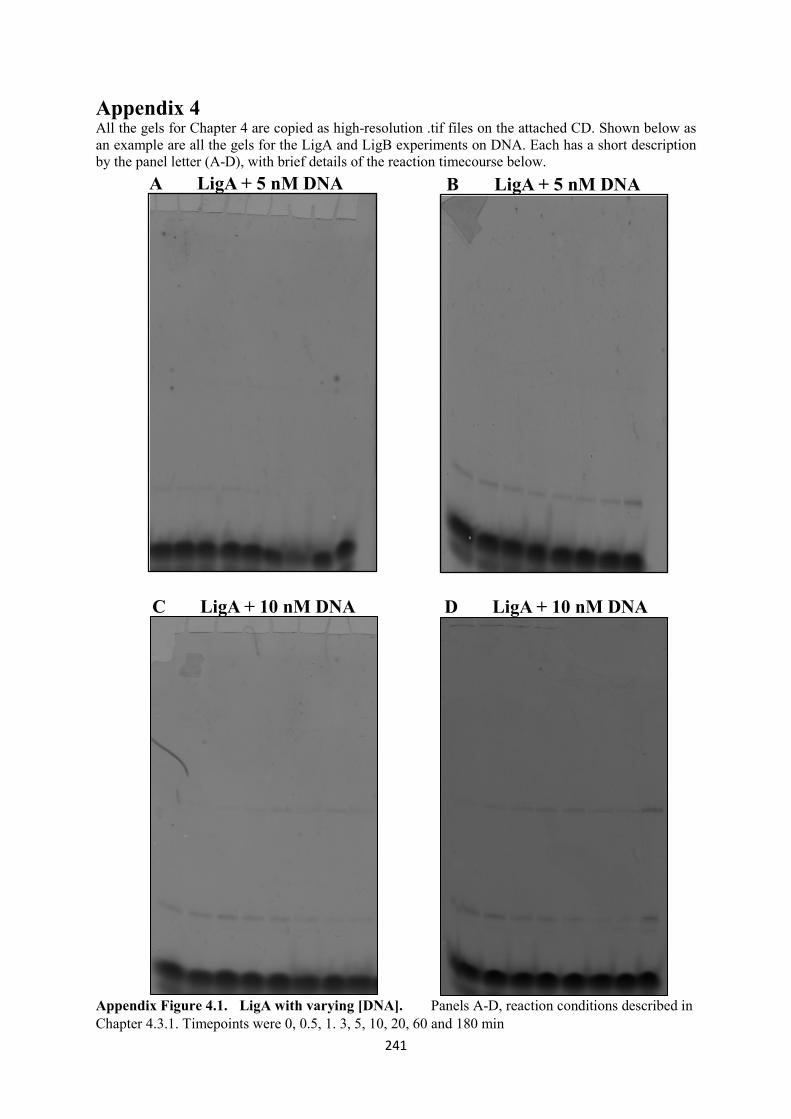
241
Appendix 4 All the gels for Chapter 4 are copied as high-resolution .tif files on the attached CD. Shown below as an example are all the gels for the LigA and LigB experiments on DNA. Each has a short description by the panel letter (A-D), with brief details of the reaction timecourse below.
Appendix Figure 4.1. LigA with varying [DNA]. Panels A-D, reaction conditions described in Chapter 4.3.1. Timepoints were 0, 0.5, 1. 3, 5, 10, 20, 60 and 180 min
A LigA + 5 nM DNA B LigA + 5 nM DNA
C LigA + 10 nM DNA D LigA + 10 nM DNA
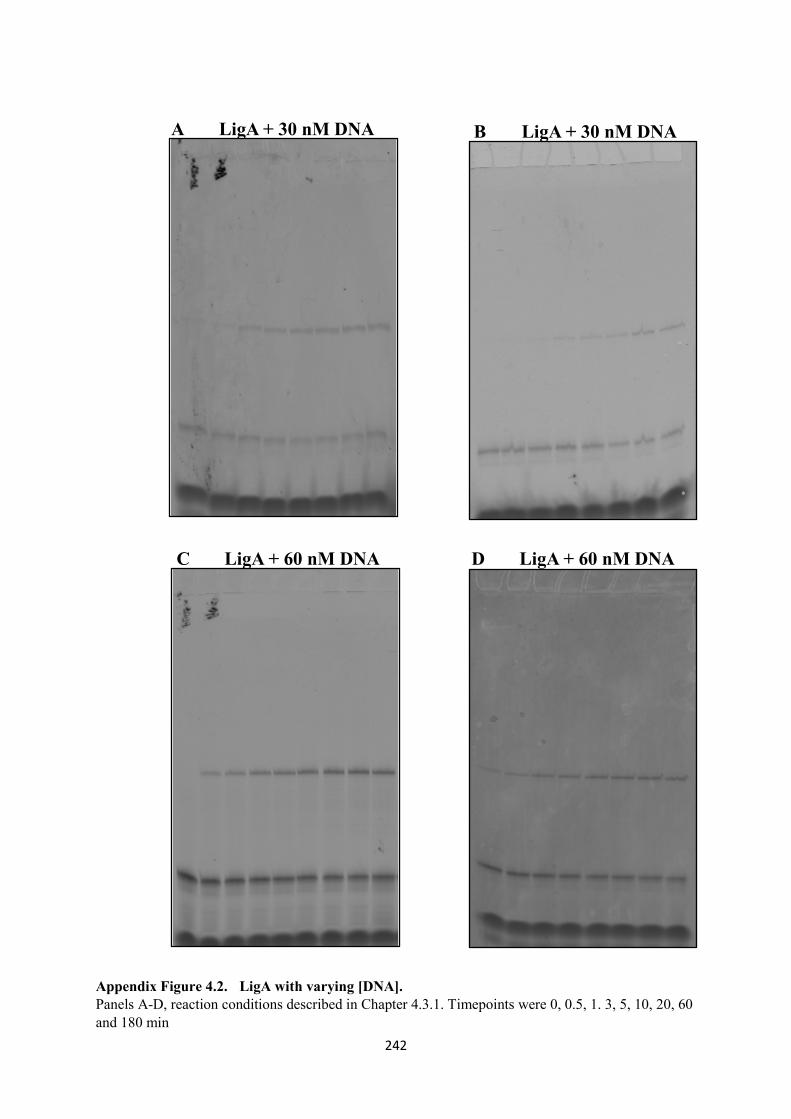
242
Appendix Figure 4.2. LigA with varying [DNA]. Panels A-D, reaction conditions described in Chapter 4.3.1. Timepoints were 0, 0.5, 1. 3, 5, 10, 20, 60 and 180 min
A LigA + 30 nM DNA B LigA + 30 nM DNA
C LigA + 60 nM DNA D LigA + 60 nM DNA
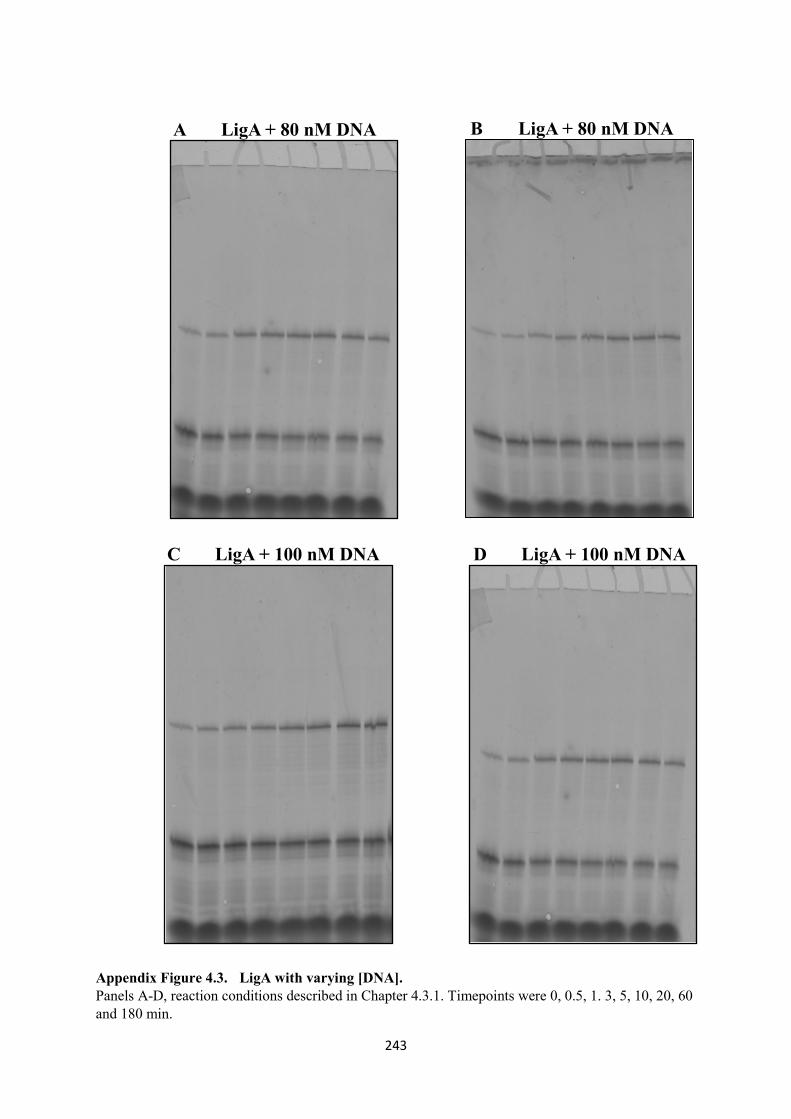
243
Appendix Figure 4.3. LigA with varying [DNA]. Panels A-D, reaction conditions described in Chapter 4.3.1. Timepoints were 0, 0.5, 1. 3, 5, 10, 20, 60 and 180 min.
A LigA + 80 nM DNA B LigA + 80 nM DNA
C LigA + 100 nM DNA D LigA + 100 nM DNA
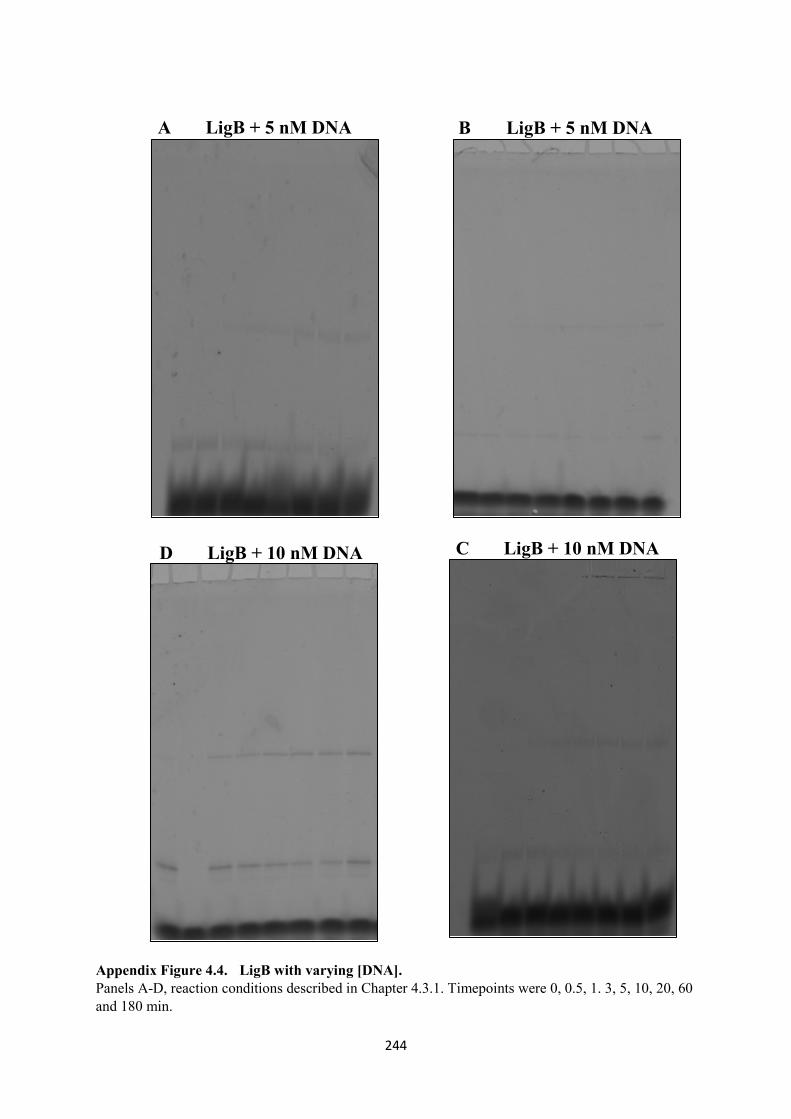
244
Appendix Figure 4.4. LigB with varying [DNA]. Panels A-D, reaction conditions described in Chapter 4.3.1. Timepoints were 0, 0.5, 1. 3, 5, 10, 20, 60 and 180 min.
A LigB + 5 nM DNA B LigB + 5 nM DNA
D LigB + 10 nM DNA C LigB + 10 nM DNA
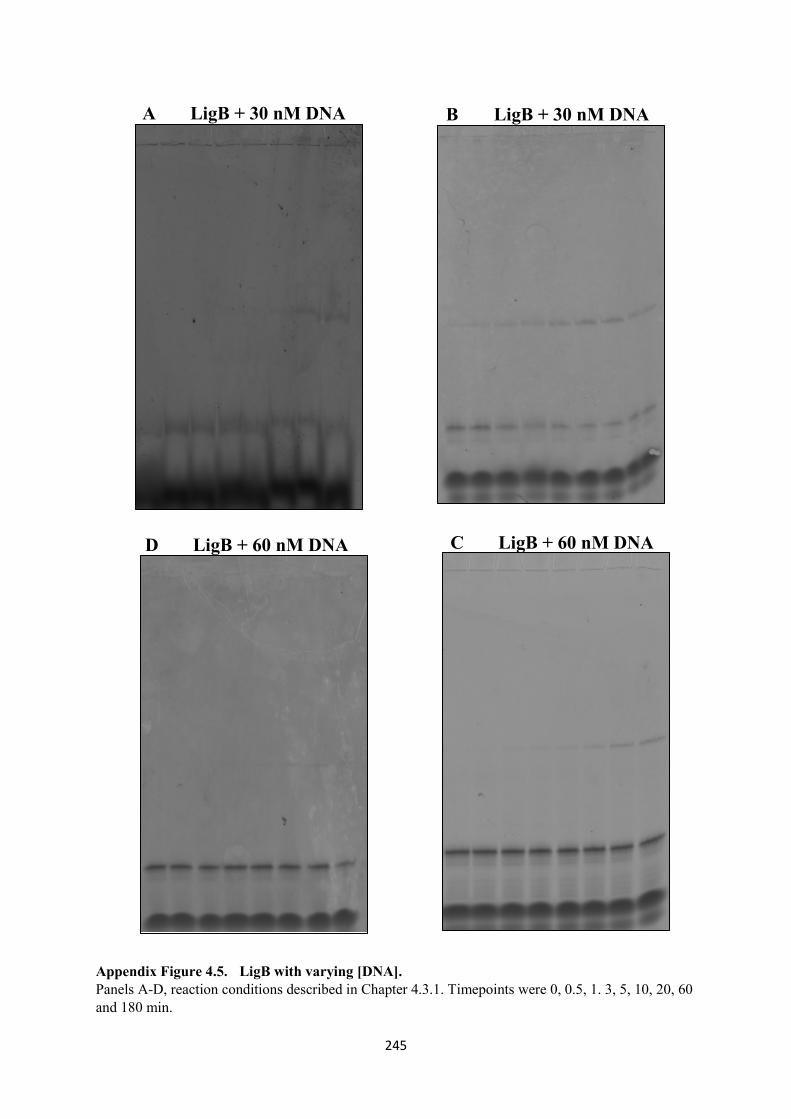
245
Appendix Figure 4.5. LigB with varying [DNA]. Panels A-D, reaction conditions described in Chapter 4.3.1. Timepoints were 0, 0.5, 1. 3, 5, 10, 20, 60 and 180 min.
A LigB + 30 nM DNA B LigB + 30 nM DNA
D LigB + 60 nM DNA C LigB + 60 nM DNA
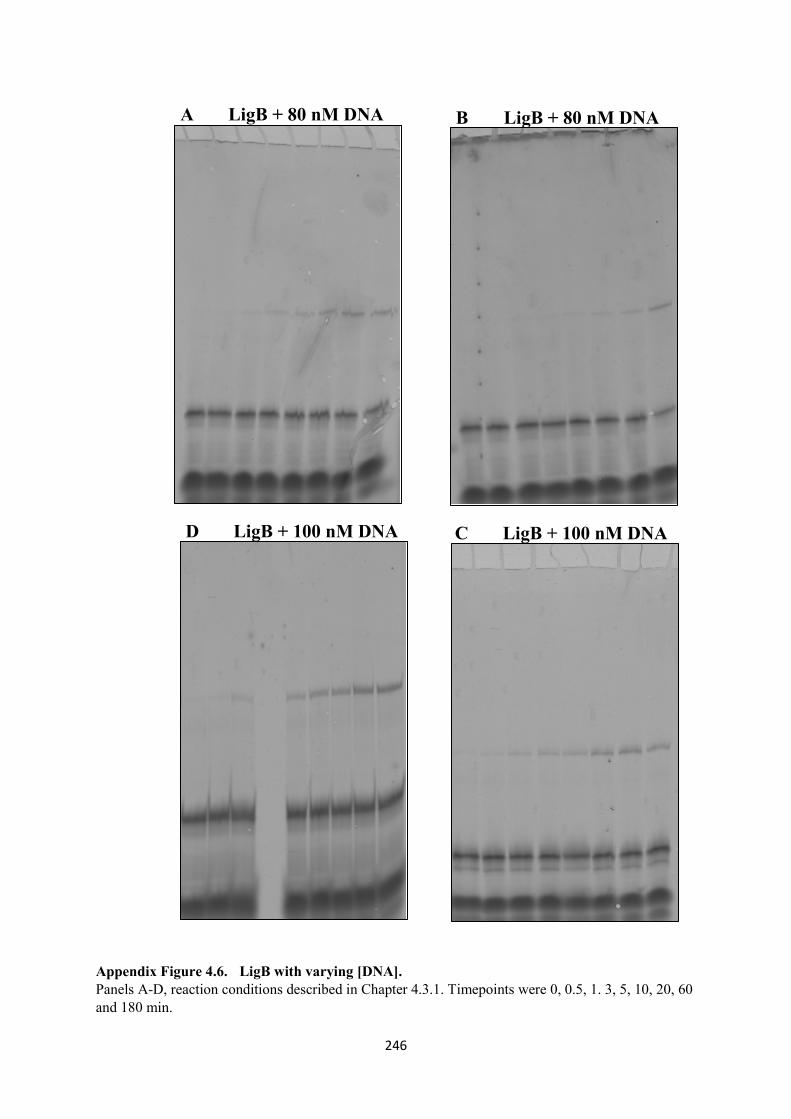
246
Appendix Figure 4.6. LigB with varying [DNA]. Panels A-D, reaction conditions described in Chapter 4.3.1. Timepoints were 0, 0.5, 1. 3, 5, 10, 20, 60 and 180 min.
A LigB + 80 nM DNA B LigB + 80 nM DNA
D LigB + 100 nM DNA C LigB + 100 nM DNA

247
Appendix 6. Appendix Figure 6.1. The Inhibition of LigA with Varying Glutathione Disulphide
Concentrations.
In vitro Glutathione Disulphide,at 0, 0.04, 0.4, 4 nM (left to right).
In vitro Glutathione Disulphide,at 0.4, 4 and 0 µM (left to right).
In vitro Glutathione Disulphide, at 0, 0.2 and 1, and 2 µM (left to right).
In vitro Glutathione Disulphide, at 20, 50, 200 and 400 µM (left to right).
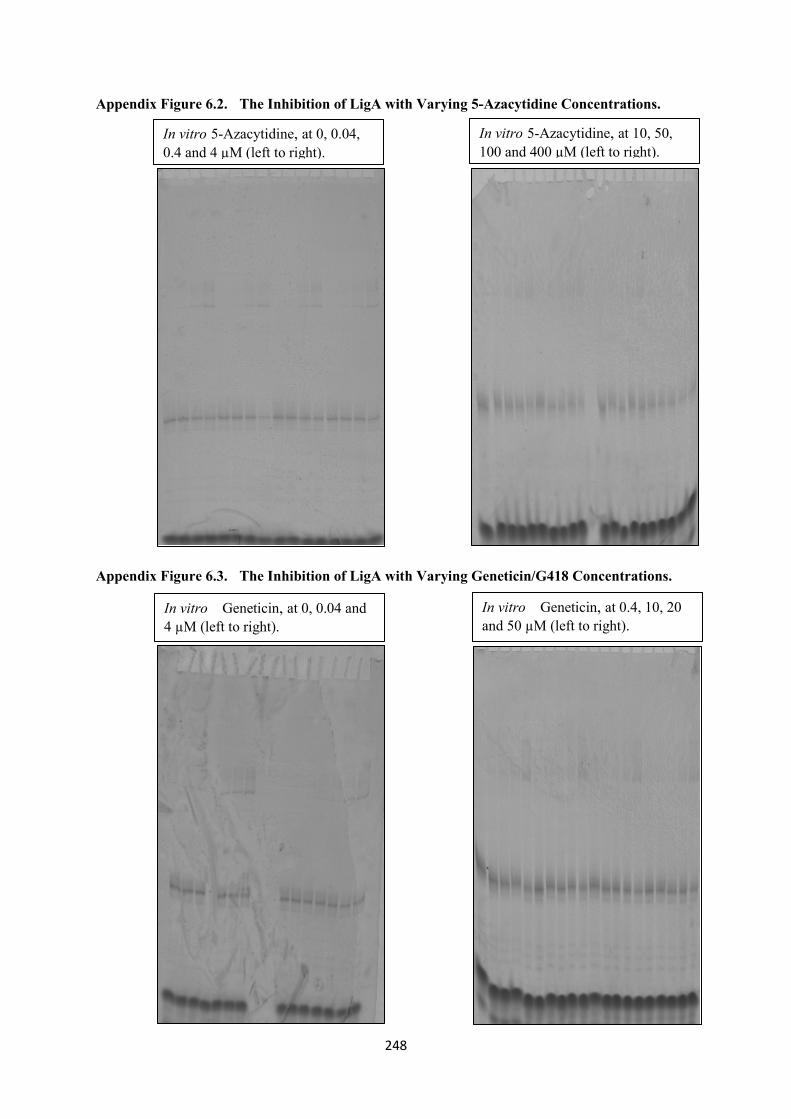
248
Appendix Figure 6.2. The Inhibition of LigA with Varying 5-Azacytidine Concentrations.
Appendix Figure 6.3. The Inhibition of LigA with Varying Geneticin/G418 Concentrations.
In vitro 5-Azacytidine, at 0, 0.04, 0.4 and 4 µM (left to right).
In vitro 5-Azacytidine, at 10, 50, 100 and 400 µM (left to right).
In vitro Geneticin, at 0, 0.04 and 4 µM (left to right).
In vitro Geneticin, at 0.4, 10, 20 and 50 µM (left to right).
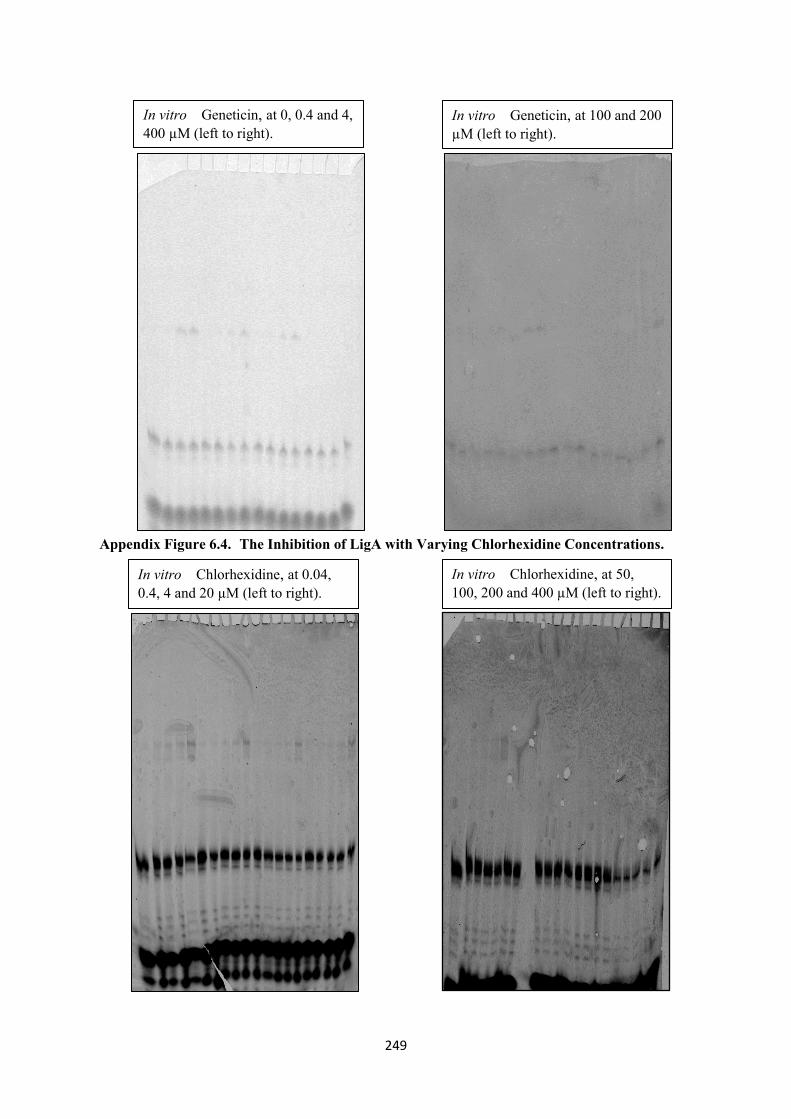
249
Appendix Figure 6.4. The Inhibition of LigA with Varying Chlorhexidine Concentrations.
In vitro Chlorhexidine, at 0.04, 0.4, 4 and 20 µM (left to right).
In vitro Chlorhexidine, at 50, 100, 200 and 400 µM (left to right).
In vitro Geneticin, at 0, 0.4 and 4, 400 µM (left to right).
In vitro Geneticin, at 100 and 200 µM (left to right).
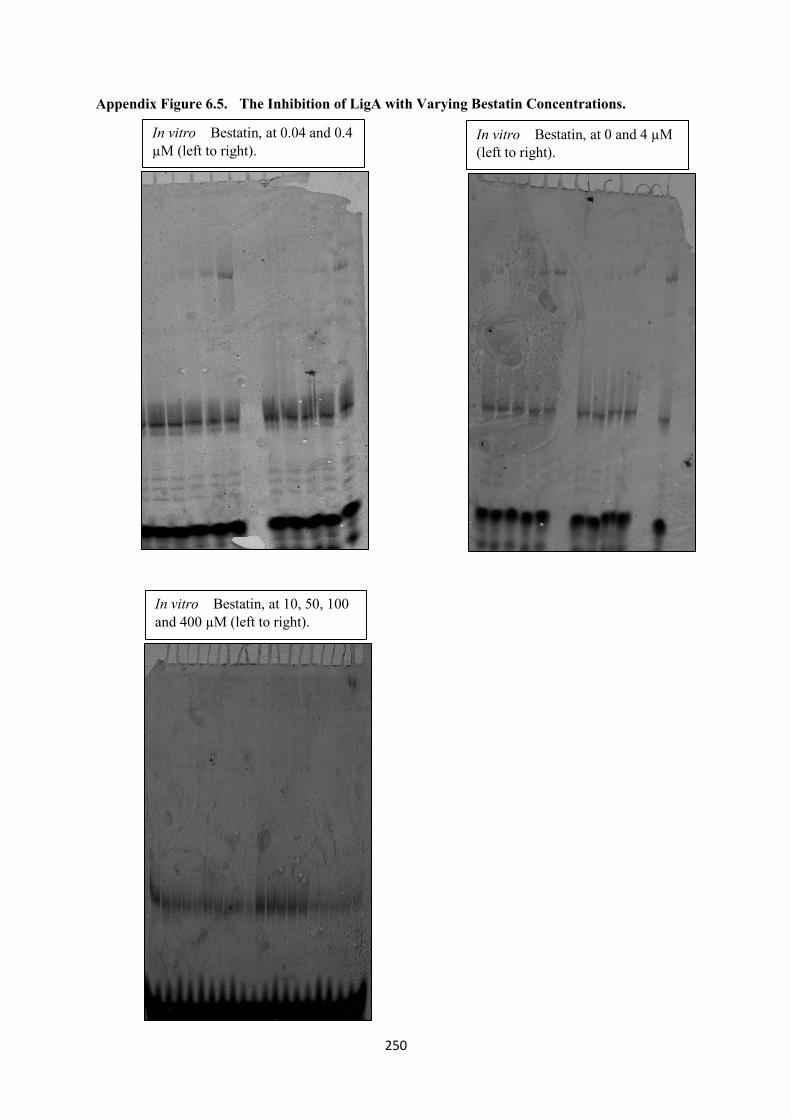
250
Appendix Figure 6.5. The Inhibition of LigA with Varying Bestatin Concentrations.
In vitro Bestatin, at 0.04 and 0.4 µM (left to right).
In vitro Bestatin, at 0 and 4 µM (left to right).
In vitro Bestatin, at 10, 50, 100 and 400 µM (left to right).
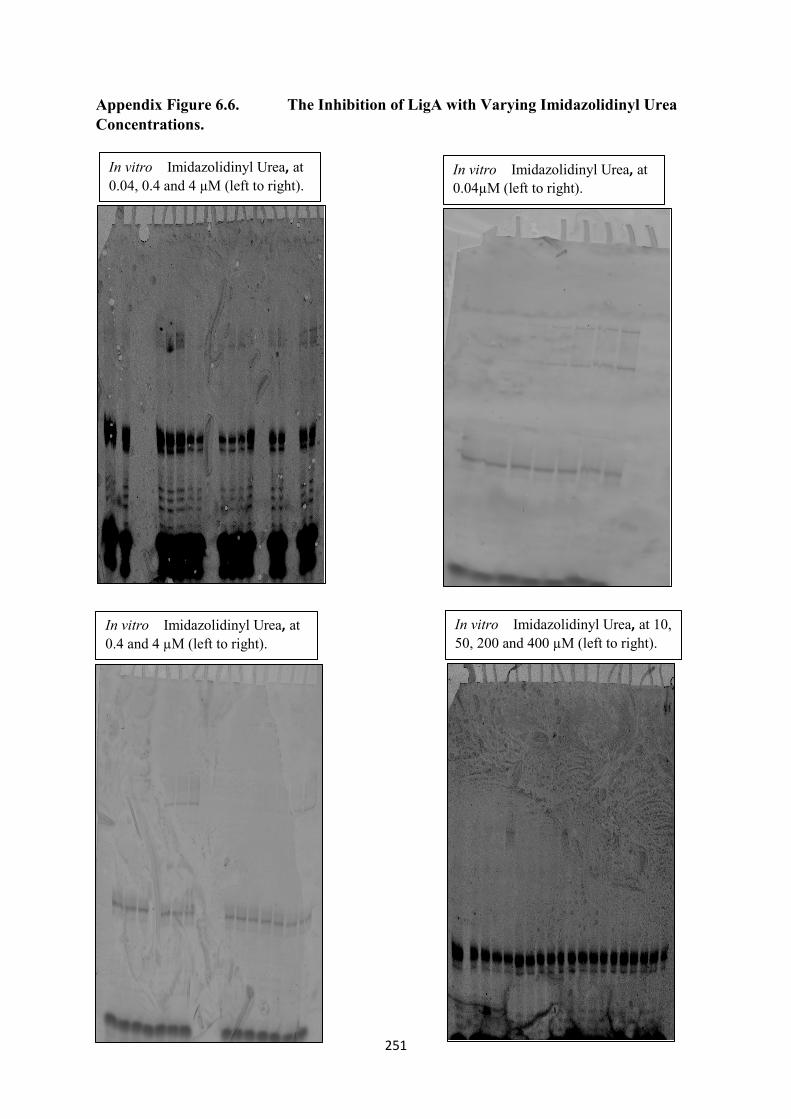
251
Appendix Figure 6.6. The Inhibition of LigA with Varying Imidazolidinyl UreaConcentrations.
In vitro Imidazolidinyl Urea, at0.04, 0.4 and 4 µM (left to right).
In vitro Imidazolidinyl Urea, at0.04µM (left to right).
In vitro Imidazolidinyl Urea, at0.4 and 4 µM (left to right).
In vitro Imidazolidinyl Urea, at 10, 50, 200 and 400 µM (left to right).
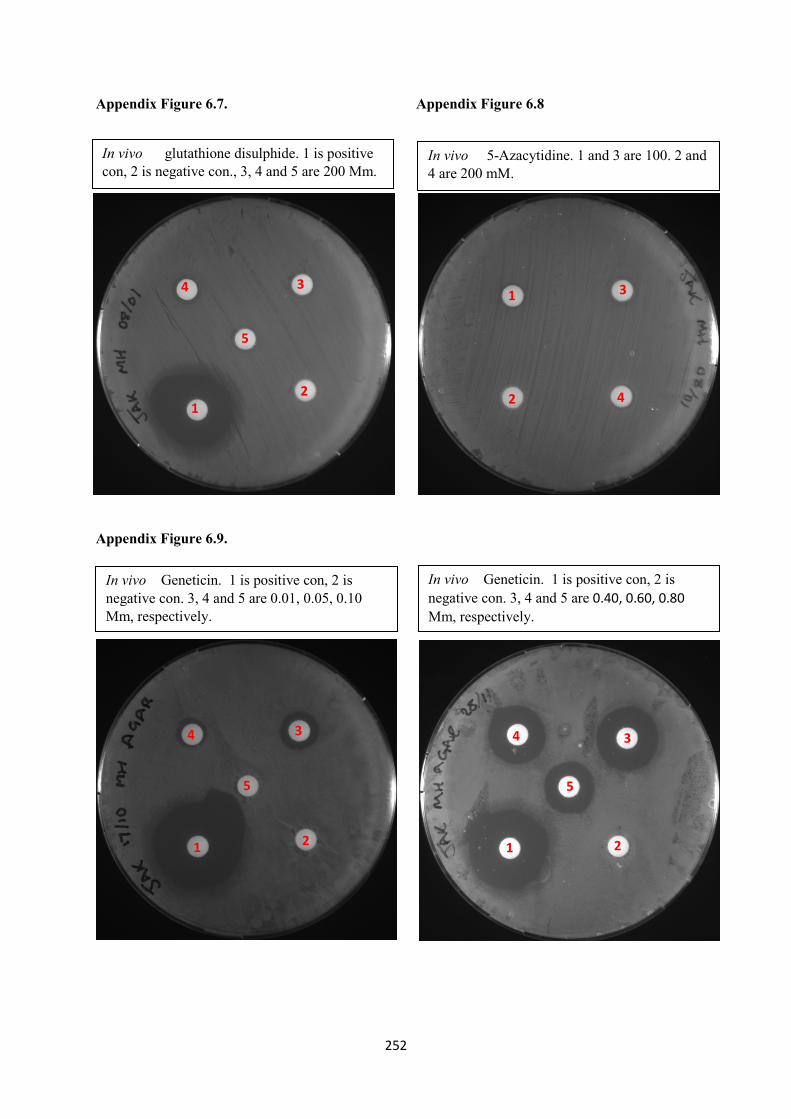
252
Appendix Figure 6.7. Appendix Figure 6.8
Appendix Figure 6.9.
In vivo glutathione disulphide. 1 is positive con, 2 is negative con., 3, 4 and 5 are 200 Mm.
In vivo 5-Azacytidine. 1 and 3 are 100. 2 and 4 are 200 mM.
In vivo Geneticin. 1 is positive con, 2 is negative con. 3, 4 and 5 are 0.01, 0.05, 0.10 Mm, respectively.
In vivo Geneticin. 1 is positive con, 2 is negative con. 3, 4 and 5 are 0.40, 0.60, 0.80Mm, respectively.
12
4
5
31
2 4
3
1 2
4
5
3
1 2
4 3
5
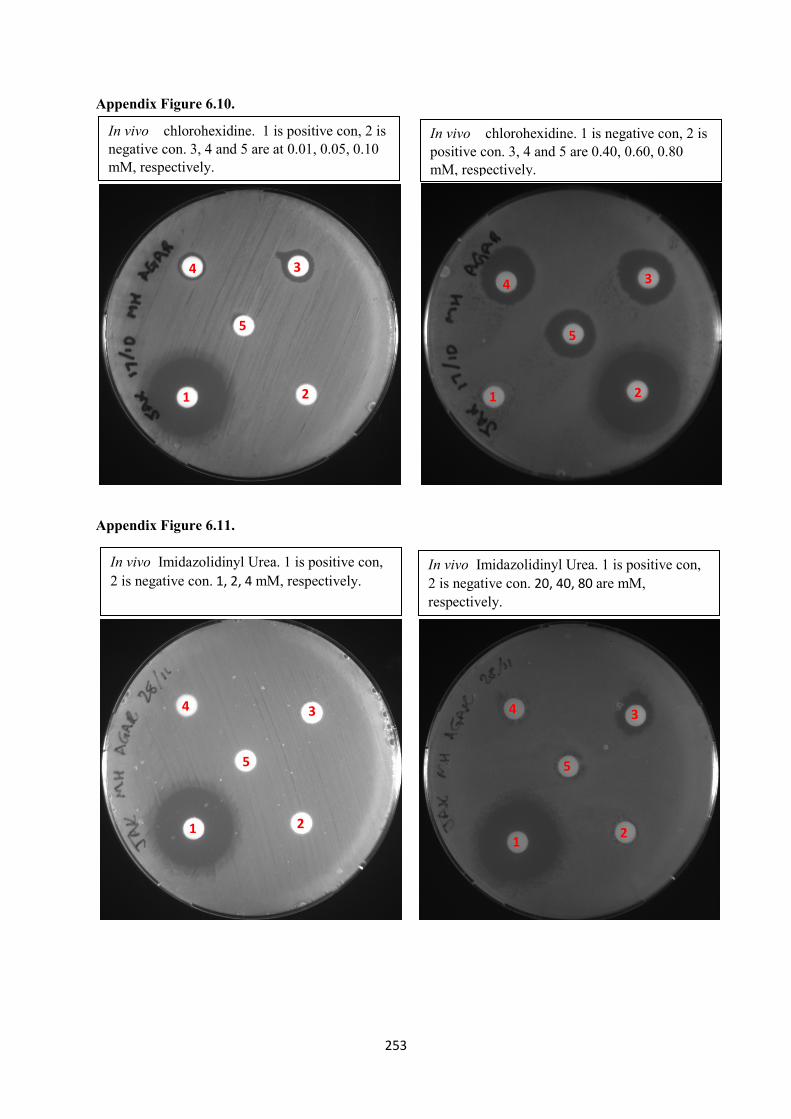
253
Appendix Figure 6.10.
Appendix Figure 6.11.
In vivo chlorohexidine. 1 is positive con, 2 is negative con. 3, 4 and 5 are at 0.01, 0.05, 0.10 mM, respectively.
In vivo chlorohexidine. 1 is negative con, 2 is positive con. 3, 4 and 5 are 0.40, 0.60, 0.80 mM, respectively.
In vivo Imidazolidinyl Urea. 1 is positive con, 2 is negative con. 1, 2, 4 mM, respectively.
In vivo Imidazolidinyl Urea. 1 is positive con, 2 is negative con. 20, 40, 80 are mM, respectively.
5
1 2
34
1 2
4 3
5
1 2
34
5
34
5
1 2


![[Biophysical methods in diagnosis of intrapartal fetal hypoxia]](https://img.dokumen.tips/doc/110x75/635d79bda0f1eac29f0c35ef/biophysical-methods-in-diagnosis-of-intrapartal-fetal-hypoxia.jpg)


