Embed Size (px)
Citation preview
Disease Markers
Biomarkers in Infectious Diseases
Lead Guest Editor: Hyundoo HwangGuest Editors: Boo‑Young Hwang and Juan Bueno

Biomarkers in Infectious Diseases

Disease Markers
Biomarkers in Infectious Diseases
Lead Guest Editor: Hyundoo HwangGuest Editors: Boo-Young Hwang and Juan Bueno

Copyright © 2018 Hindawi. All rights reserved.
This is a special issue published in “Disease Markers.” All articles are open access articles distributed under the Creative Commons At-tribution License, which permits unrestricted use, distribution, and reproduction in any medium, provided the original work is properlycited.

Editorial Board
George Agrogiannis, GreeceSilvia Angeletti, ItalyElena Anghileri, ItalyPaul Ashwood, USAFabrizia Bamonti, ItalyValeria Barresi, ItalyJasmin Bektic, AustriaGiuseppe Biondi-Zoccai, ItalyLuisella Bocchio-Chiavetto, ItalyMonica Cantile, ItalyDonald H. Chace, USAKishore Chaudhry, IndiaCarlo Chiarla, ItalyM. M. Corsi Romanelli, ItalyYvan Devaux, LuxembourgBenoit Dugue, FranceChiara Fenoglio, ItalyHelge Frieling, GermanyPaola Gazzaniga, ItalyGiorgio Ghigliotti, ItalyMatteo Giulietti, ItalyAlvaro González, SpainEmilia Hadziyannis, GreeceMariann Harangi, HungaryMichael Hawkes, CanadaAndreas Hillenbrand, GermanyHubertus Himmerich, UKJohannes Honekopp, UK
Shih-Ping Hsu, TaiwanYi-Chia Huang, TaiwanChao Hung Hung, TaiwanSunil Hwang, USAMichalis V. Karamouzis, GreeceMałgorzata Knaś, PolandChih-Hung Ku, TaiwanDinesh Kumbhare, CanadaMark M. Kushnir, USATaina K. Lajunen, FinlandOlav Lapaire, SwitzerlandClaudio Letizia, ItalyXiaohong Li, USARalf Lichtinghagen, GermanyLance A. Liotta, USALeigh A. Madden, UKMichele Malaguarnera, ItalyErminia Manfrin, ItalyUpender Manne, USAFerdinando Mannello, ItalySerge Masson, ItalyGiuseppe Murdaca, ItalySzilárd Nemes, SwedenChiara Nicolazzo, ItalyDennis W. T. Nilsen, NorwayEsperanza Ortega, SpainRoberta Palla, ItalySheng Pan, USA
Marco E. M. Peluso, ItalyRobert Pichler, AustriaAlex J. Rai, USAIrene Rebelo, PortugalAndrea Remo, ItalyGad Rennert, IsraelManfredi Rizzo, ItalyRoberta Rizzo, ItalyIwona Rudkowska, CanadaMaddalena Ruggieri, ItalyVincent Sapin, FranceTori L. Schaefer, USAAlexandra Scholze, DenmarkAndreas Scorilas, GreeceAnja Hviid Simonsen, DenmarkEric A. Singer, USATomás Sobrino, SpainTimo Sorsa, FinlandMirte Mayke Streppel, NetherlandsFrank Tacke, GermanyStamatios E. Theocharis, GreeceTilman Todenhöfer, GermanyMarco Tomasetti, ItalyNatacha Turck, SwitzerlandHeather Wright Beatty, CanadaNelson Yee, USA
Contents
Biomarkers in Infectious DiseasesHyundoo Hwang , Boo-Young Hwang , and Juan BuenoEditorial (2 pages), Article ID 8509127, Volume 2018 (2018)
Novel Biomarker Candidates for Febrile Neutropenia in Hematological Patients Using NontargetedMetabolomicsMarika Lappalainen, Jenna Jokkala, Auni Juutilainen, Sari Hämäläinen, Irma Koivula, Esa Jantunen,Kati Hanhineva, and Kari PulkkiResearch Article (16 pages), Article ID 6964529, Volume 2018 (2018)
Serum Procalcitonin Levels in Acute Encephalopathy with Biphasic Seizures and Late ReducedDiffusionYosuke Fujii , Masato Yashiro, Mutsuko Yamada, Tomonobu Kikkawa, Nobuyuki Nosaka, Yukie Saito,Kohei Tsukahara, Masanori Ikeda, Tsuneo Morishima, and Hirokazu TsukaharaResearch Article (4 pages), Article ID 2380179, Volume 2018 (2018)
Urinary Clusterin Is Upregulated in Nephropathia EpidemicaEkaterina V. Martynova, Adelya N. Maksudova, Venera G. Shakirova, Sayar R. Abdulkhakov,Ilsiyar M. Khaertynova, Vladimir A. Anokhin , Vilena V. Ivanova, Ilesanmi M. Abiola,Ekaterina E. Garanina, Leisan G. Tazetdinova, Aigul H. Valiullina, and Svetlana F. KhaiboullinaResearch Article (7 pages), Article ID 8658507, Volume 2018 (2018)
Elevated Serum Levels of Mixed Lineage Kinase Domain-Like Protein Predict Survival of Patientsduring Intensive Care Unit TreatmentMihael Vucur , Christoph Roderburg , Lukas Kaiser, AnneTheres Schneider, Sanchari Roy,Sven Heiko Loosen, Mark Luedde, Christian Trautwein, Alexander Koch, Frank Tacke ,and Tom LueddeResearch Article (8 pages), Article ID 1983421, Volume 2018 (2018)
Serum Cytokine Profiles in Patients with Dengue Fever at the Acute Infection PhaseJunyuan Huang , Weiwen Liang , Shaoyan Chen , Ye Zhu , Haiming Chen ,Chris Ka Pun Mok , and Yingchun ZhouResearch Article (8 pages), Article ID 8403937, Volume 2018 (2018)
Diagnostic Value of the lncRNA NEAT1 in Peripheral Blood Mononuclear Cells of Patients with SepsisShuying Huang, Kejian Qian, Yuanfang Zhu, Zikun Huang, Qing Luo, and Cheng QingResearch Article (6 pages), Article ID 7962836, Volume 2017 (2018)
Polymorphisms in the SP110 and TNF-𝛼 Gene and Susceptibility to Pulmonary and Spinal Tuberculosisamong Southern Chinese PopulationYing Zhou, Chun-yan Tan, Zhi-jiang Mo, Qi-le Gao, Dan He, Jiong Li, Rong-fu Huang, Yan-bing Li,Chao-feng Guo, Qiang Guo, Long-jie Wang, Guan-teng Yang, and Hong-qi ZhangResearch Article (8 pages), Article ID 4590235, Volume 2017 (2018)
Usefulness of Age-Stratified N-Terminal Prohormone of Brain Natriuretic Peptide for DiagnosingKawasaki DiseaseSang Hoon Lee, Eun Song Song, Somy Yoon, Seunghee Hong, Hwa Jin Cho, Eun Mi Yang,Gwang Hyeon Eom, Gaeun Kang, and Young Kuk ChoResearch Article (9 pages), Article ID 6263121, Volume 2017 (2018)
EditorialBiomarkers in Infectious Diseases
Hyundoo Hwang ,1 Boo-Young Hwang ,2 and Juan Bueno3
1BBB Inc., Seoul, Republic of Korea2Pusan National University Hospital, Busan, Republic of Korea3Fundación Centro de Investigación y Biotecnología de la Biodiversidad (BIOLABB), Armenia, Colombia
Correspondence should be addressed to Hyundoo Hwang; [email protected] and Boo-Young Hwang; [email protected]
Received 2 April 2018; Accepted 3 April 2018; Published 20 June 2018
Copyright © 2018 Hyundoo Hwang et al. This is an open access article distributed under the Creative Commons AttributionLicense, which permits unrestricted use, distribution, and reproduction in any medium, provided the original work isproperly cited.
Infectious diseases are categorized as illnesses caused bypathogenic microorganisms such as viruses, bacteria, para-sites, or fungi. Such diseases have been major threat world-wide and have a great impact on public health and theworld economy. Among different types of infectious diseases,HIV, tuberculosis, and malaria are known as the leadingcauses of deaths globally. Furthermore, varied types ofneglected tropical diseases, such as Chagas disease, dengue,yellow fever, West Nile, Japanese encephalitis, and chikungu-nya, are also considered to be major global threats. Althoughsuch diseases emerge in tropical and subtropical regions, therisk of these infectious illnesses can be worldwide because ofglobal economy and migration. With more than half of theworld population at risk of such fatal illnesses, infectious dis-eases are classified among the most dangerous threats to thesociety. Fortunately, detection of such infections in the earlystages is estimated to significantly reduce the mortality rate.During the past decades, the development of universal andreliable methods to detect biomarkers for diagnostics andprognostics of the infectious diseases and the search forhighly specific and sensitive biomarkers have been the mostimportant challenges. The search and discovery of newbiomarkers become necessary in infectious diseases in orderto determine endpoints, predict the clinical outcome totherapy, and allow the development of new drugs [1].
In this horizon, the search for the ideal biomarkers ininfectious diseases (with high sensitivity, specificity, and pre-dictive capacity) must be focused towards detection andidentification of the infectious agent, monitoring of the
clinical response, and orienting the duration of the treatment,such as the case of procalcitonin (PCT) assay, that can dis-criminate between a viral and a bacterial infection and hasbeen approved by Food and Drug Administration [2]. Also,the description of new biomarkers requires the developmentof reproducible diagnostic methods that have accuracy insamples such as blood, sputum, urine, and cerebrospinalfluid [3]. Finally, by virtue of the above, the physicianrequires robust, reproducible, and automated methodscapable of being used within the clinical consultation, inorder to give an adequate prescription and an optimizeduse of the medicines.
In this special issue, we have assembled eight manuscriptsidentifying biomarkers for infectious diseases includinginfectious encephalopathy, dengue fever, Kawasaki disease,nephropathia epidemica, and tuberculosis. In the followingpages, four research articles identifying serum proteinmarkers for infectious diseases are included. An infectiousdisease marker that can be detected by a noninvasive urinetest is suggested. Also, this special issue includes one andtwo research articles suggesting metabolic and geneticbiomarkers for diagnosis of sepsis, respectively.
Y. Fujii et al. suggest PCT and the ratio of PCT andC-reactive protein (CRP) in serum as biomarkers for theauxiliary diagnosis of acute encephalopathy with biphasicseizures and late reduced diffusion (AESD). AESD is an epi-lepsy syndrome, which has been known to be associated withinfection, most prevalent in East Asia. AESD is characterizedby a febrile seizure followed by a cluster of complex partial
HindawiDisease MarkersVolume 2018, Article ID 8509127, 2 pageshttps://doi.org/10.1155/2018/8509127
seizures for several days and reduced diffusion in the frontaland frontoparietal subcortical white matter in magneticresonance imaging.
M. Vucur et al. demonstrate that serum levels of mixedlineage kinase domain-like protein (MLKL) after three daysof intensive care unit (ICU) treatment can be used as a bio-marker for prognosis of critically ill and septic patients.MLKL has been known as the key driver of necroptotic celldeath. The researchers found that patients with high serumMLKL levels on day three had a significantly impairedsurvival at the ICU or overall as compared to those withlow MLKL. They also found that serum MLKL concentra-tions correlate with organ failure markers in critically illand septic patients.
J. Huang et al. investigated cytokine profiles in serum ofpatients infected with dengue viruses during the Guangdongoutbreak in 2014, in which more than 50000 of dengue fevercases were reported and 6 patients died. They found that thelevels of CCL17 and CXCL5 were significantly lower than thecontrols, while several proinflammatory cytokines such asCXCL9, IP-10, CXCL11, IL-8, and IL-10 were highly upreg-ulated in the patients after dengue infection. These resultsdetermine the association of clinical routine indexes andthe inflammatory cytokines and would be useful to under-stand the interplay between the virus and the host responsesduring the acute stage of dengue infection.
S. H. Lee et al. investigated the age-stratified cutoff valuesof serum N-terminal prohormone of brain natriuretic pep-tide (NT-proBNP) for the Kawasaki disease patients classi-fied into four subgroups by age (<6 months, 6–12 months,12–24 months, and >24 months). NT-proBNP has beenknown as a biomarker for diagnosing Kawasaki disease.However, as the normal range of NT-proBNP widely varieswith age, applying the same cutoff value of NT-proBNP toeach patient regardless of age would be unreasonable. There-fore, the study by S.H. Lee et al. would provide useful infor-mation to apply the serum NT-proBNP level to diagnoseKawasaki disease in patients with different ages to distinguishthose conditions from simple febrile illness.
Identifying urinary biomarkers is also very importantbecause they offer more specificity for events in the kidney.E. V. Martynova et al. offer urinary clusterin as a biomarkerof early- and late-stage nephropathia epidemica, which is atype of haemorrhagic fever with renal syndrome caused byPuumala virus infection. Nephropathia epidemica is charac-terized by renal dysfunction which progresses through sev-eral stages. The disease progression has been monitored bymeasuring the levels of blood urea nitrogen (BUN) and cre-atinine in serum, which reflect renal performance. Accordingto E. V. Martynova et al., however, changes in serum creati-nine and BUN concentrations primarily indicate the pres-ence of changes in filtration capacity and, thus, are notalways reflective of tissue injury. Therefore, there is a needfor an alternative noninvasive method to assess kidney per-formance in nephropathia epidemica cases. In this study,they found that clusterin is upregulated in urine at the earlyand late phases of nephropathia epidemica.
M. Lappalainen et al. performed a nontargeted metabolo-mic profiling to find early diagnostic markers in febrile
neutropenia. They found that androsterone/5α-dihydrotes-tosterone sulfate (ADTS/DHTS), citruline, and a fragmentof phosphatidylethanolamines can be applied to discriminatepatients of febrile neutropenia with complicated andnoncomplicated course, based on the significant metabolicfeatures. In particular, ADTS/DHTS shows a strong correla-tion with plasma CRP and PCT, which are widely usedbiomarkers in febrile neutropenia.
Genetic markers are also very useful for diagnosing infec-tious diseases. S. Huang et al. examined expression of longnoncoding RNA nuclear-enriched abundant transcript 1(NEAT1) in peripheral blood mononuclear cells in patientswith sepsis to explore its diagnostic value and clinical signifi-cance in sepsis. NEAT1 has been known as an importantregulator in cancers, as well as in infectious diseases, such asHIV, hantavirus, and Zika virus. In this study, S. Huang et al.first discovered upregulated NEAT1 expression in patientswith sepsis, indicating an association between NEAT1 andimmune dysfunction in sepsis. They suggest NEAT1 as apotential molecular marker for early diagnosis of sepsis.
Tuberculosis, caused by Mycobacterium tuberculosisinfection, is also one of the leading causes of death in theworld. There were around 1.7 million deaths related to tuber-culosis in 2016. Human speckled 110 (SP110) gene, which isthe closest homology to the mouse intracellular pathogenresistance 1 (Ipr1) gene inmouse, mediating innate immunityinmouse TBmodels, is thought to be associated with tubercu-losis susceptibility. Tumor necrosis factor-α (TNF-α) has alsobeen known as a key player in host resistance to tuberculosisinfection. Y. Zhou et al. investigated the influence and dif-ference of single nucleotide polymorphisms in SP110 andTNF-α genes in pulmonary and spinal tuberculosispatients in southern China.
Overall, the research articles in this special issue providevarious perspectives on the research in biomarkers ofinfectious diseases. This special issue is aimed at promotingcommunication among researchers and broadening ourknowledge on biomarkers of infectious diseases. We wouldlike to thank all the authors as well as the reviewers whoparticipated in the elaboration of this special issue.
Hyundoo HwangBoo-Young Hwang
Juan Bueno
References
[1] R. S. Wallis, M. Maeurer, P. Mwaba et al., “Tuberculosis—ad-vances in development of new drugs, treatment regimens,host-directed therapies, and biomarkers,” The Lancet InfectiousDiseases, vol. 16, no. 4, pp. e34–e46, 2016.
[2] P. Morency-Potvin, D. N. Schwartz, and R. A.Weinstein, “Anti-microbial stewardship: how the microbiology laboratory canright the ship,” Clinical Microbiology Reviews, vol. 30, no. 1,pp. 381–407, 2017.
[3] B. Spellberg, J. Bartlett, R. Wunderink, and D. N. Gilbert,“Novel approaches are needed to develop tomorrow’s antibacte-rial therapies,” American Journal of Respiratory and CriticalCare Medicine, vol. 191, no. 2, pp. 135–140, 2015.
2 Disease Markers
Research ArticleNovel Biomarker Candidates for Febrile Neutropenia inHematological Patients Using Nontargeted Metabolomics
Marika Lappalainen,1,2 Jenna Jokkala,3 Auni Juutilainen,2 Sari Hämäläinen,4 Irma Koivula,4
Esa Jantunen,2,4,5 Kati Hanhineva,3 and Kari Pulkki 6,7,8
1Department of Internal Medicine, Central Hospital of Central Finland, Jyväskylä, Finland2Institute of Clinical Medicine/Internal Medicine, University of Eastern Finland, Kuopio, Finland3Institute of Public Health and Clinical Nutrition, University of Eastern Finland, Kuopio, Finland4Department of Medicine, Kuopio University Hospital, Kuopio, Finland5Siun Sote-Hospital District of North Carelia, Joensuu, Finland6Eastern Finland Laboratory Centre, Kuopio, Finland7Laboratory Division, Turku University Hospital, Turku, Finland8Clinical Chemistry, Faculty of Medicine, University of Turku, Turku, Finland
Correspondence should be addressed to Kari Pulkki; [email protected]
Received 3 November 2017; Revised 4 February 2018; Accepted 22 February 2018; Published 12 April 2018
Academic Editor: Hyundoo Hwang
Copyright © 2018 Marika Lappalainen et al. This is an open access article distributed under the Creative CommonsAttribution License, which permits unrestricted use, distribution, and reproduction in any medium, provided the originalwork is properly cited.
Background. Novel potential small molecular biomarkers for sepsis were analyzed with nontargeted metabolite profiling to findbiomarkers for febrile neutropenia after intensive chemotherapy for hematological malignancies. Methods. Altogether, 85patients were included into this prospective study at the start of febrile neutropenia after intensive chemotherapy for acutemyeloid leukemia or after autologous stem cell transplantation. The plasma samples for the nontargeted metabolite profilinganalysis by liquid chromatography-mass spectrometry were taken when fever rose over 38° and on the next morning. Results.Altogether, 90 differential molecular features were shown to explain the differences between patients with complicated(bacteremia, severe sepsis, or fatal outcome) and noncomplicated courses of febrile neutropenia. The most differentialcompounds were an androgen hormone, citrulline, and phosphatidylethanolamine PE(18:0/20:4). The clinical relevance of thefindings was evaluated by comparing them with conventional biomarkers like C-reactive protein and procalcitonin. Conclusion.These results hold promise to find out novel biomarkers for febrile neutropenia, including citrulline. Furthermore, androgenmetabolism merits further studies.
1. Introduction
Febrile neutropenia is a common complication in hemato-logical patients receiving intensive chemotherapy. Althougha minority of these patients develop septic shock [1, 2], sepsisis still a major cause of morbidity and mortality during theneutropenic phase [3, 4]. In these patients, life-threateningcomplications can develop in hours depending on the patho-gen. Not only C-reactive protein (CRP) and procalcitonin(PCT) but also several other biomarkers have been exploredto identify patients at risk for complicated course of febrileneutropenia [5]. CRP and PCT both have some limitations
such as nonspecificity and delayed response. PCT is superiorto CRP for predictive purposes and is slightly more pathogen-dependent, especially in gram-negative bacteremia [3, 6].However, there still is a need for more rapid and accuratemarkers, which also could be used for de-escalation strategiesof broad-spectrum antibiotics.
Nontargeted metabolite profiling or metabolomics is ahypothesis-free study approach that focuses on finding differ-ences in metabolite profiles between study subjects contribut-ing to thediscovery of novel small-sizedmolecular biomarkersfor disease progression or prevention [7, 8]. In previousstudies, metabolomics has been used to differentiate sepsis
HindawiDisease MarkersVolume 2018, Article ID 6964529, 16 pageshttps://doi.org/10.1155/2018/6964529
from systemic inflammatory response syndrome [9–12] andto detect prognostic biomarkers for septic shock [11, 13–15].There is only one previous study including metabolomics inpatients with febrile neutropenia. Richter et al. [16] foundtwenty-one biomarker candidates including three peptides,six proteins, and six phosphatidylcholines (PC), which identi-fied febrile neutropenic patients with proven infection fromthose without it.
The use of metabolomics as a tool for discovery ofdiagnostic markers in febrile neutropenia is a novelapproach. The purpose of our study was to evaluate thedifferences found in a metabolic profile and to identifypotentially useful biomarker candidates for further valida-tion to recognize early increased risk of adverse outcomein hematological patients with febrile neutropenia afterintensive chemotherapy.
2. Patients and Methods
2.1. Patients. Between December 2009 and November 2012,altogether 85 hematological patients treated at the adulthematology ward of the Department of Medicine, KuopioUniversity Hospital, and who gave written permission wereincluded into this prospective study. The inclusion criteriawere fulfilled if the patient was ≤70 years old, if the patientreceived intensive chemotherapy for acute myeloid leukemia(AML), or if the patient was an autologous stem cell trans-plant (ASCT) recipient and had febrile neutropenia (see def-initions later). There were 54 males and 31 females with amedian age of 61 years (18–70 years). Twenty-three patientshad AML, and 62 were ASCT recipients (40 non-Hodgkinlymphoma, 19 multiple myeloma, and 3 Hodgkin lym-phoma). Only the first induction course of AML patientswas included in the study.
All patients were carefully followed up at the hematologyward from the start of febrile neutropenia until recovery ofneutropenia. Blood pressure, oxygen saturation, respiratoryfrequency, heart rate, skin temperature, urine output, andfluid intake were closely followed up. Each patient was exam-ined daily thoroughly for clinical signs and sources of infec-tions. Serum and plasma samples for laboratory analyseswere taken at the onset of neutropenic fever on day 0 (d0)and further samples on the next morning (d1). Broad-spectrum antibiotics were started as soon as the samples forblood cultures had been taken. Fifty-four patients (64%)received granulocyte colony-stimulating factor to shortenthe length of the neutropenic period.
The study setting was to investigate differences in theresponses of patients with and without complicated courseof febrile neutropenia on two consecutive days. The noncom-plicated patient group was regarded as a control group.
2.2. Data Collection. Clinical data, including the hour anddate of the start of fever, possible sites of infections, andhemodynamic parameters suggesting development of septicshock were recorded on a structured data collection form.Laboratory findings, including microbiological blood cultureresults, were registered.
2.3. Definitions. Febrile neutropenia was defined using the cri-teria from IDSA (InfectiousDiseases Society ofAmerica) [17].Neutropenia was defined as a neutrophil count< 0.5× 10⁹/Lor with a predicted decrease to <0.5× 10⁹/L during thenext 48h. Fever was defined as a single oral temperatureof ≥38.3°C or a temperature of ≥38.0°C sustained over a1-hour period.
Sepsis was defined as a syndrome in which systemicinflammatory response was present with infection. Severesepsis was defined as sepsis with organ dysfunction.Septic shock was defined if hypoperfusion (systolic arterialpressure < 90mmHg, a mean arterial pressure < 60mmHg,or a reduction in systolic blood pressure of >40mmHg frombaseline) was present despite adequate volume resuscitation,in the absence of other causes of hypotension [18, 19].
Complicated course of febrile neutropenia was defined asa positive blood culture finding and/or development of severesepsis or septic shock during the period from the onset offebrile neutropenia until the recovery of neutropenia.
2.4. Laboratory Measurements. The concentration of serumCRP was measured with a Konelab 60i Clinical ChemistryAnalyzer (Lab systems CLD, Konelab, Helsinki, Finland) orCobas 6000 analyzer (Hitachi, Tokyo, Japan). The intra-and interassay CV% were 2.3–4.3%. The upper referencelimit of serum or plasma CRP of a healthy reference popula-tion is 3mg/L. Plasma PCT was measured from EDTAplasma using a Cobas 6000 analyzer (Hitachi, Tokyo, Japan)with a sensitivity of 0.06μg/L. The CVs (intra- and interas-say) were 1.4% and 3.0% for 0.46μg/L and 1.1% and 2.6%for 9.4μg/L PCT, respectively. Blood cultures (2-3 setsincluding two bottles/set) were drawn immediately at thebeginning of neutropenic fever (day 0), and an additionalsampling was done if fever persisted for 3–5 days. They wereprocessed using the automated blood culture system Bactec9240 (Becton Dickinson, Sparks, MD, USA). The incubationepisode for aerobic and anaerobic bottles was 7 days and forMYCO F/Lytic bottles 42 days. The plasma samples for meta-bolomics assays were stored frozen at −80°C until analyzed.
2.5. Nontargeted LC-MS Metabolite Profiling Analyses. Themethods including sample preparation and analysis weresimilar as described previously [20]. In detail, the sampleswere prepared in 96-well plates by mixing an aliquot of100μL of EDTA plasma samples with 400μL of acetonitrile(VWR International), mixed on a vortex at maximum speedfor 15 s, incubated on an ice bath for 15min to precipitateproteins, and centrifuged at 16,000×g for 10min to filterthe samples (0.2μm polytetrafluoroethylene filters in a 96-well plate) and collect the supernatant. Aliquots of 2μL weretaken from at least half of the plasma samples, mixedtogether in a tube, and used as the quality control (QC)sample in the analysis; a solvent blank was prepared inthe same manner.
The samples were analyzed by nontargeted liquid chro-matography quadrupole time-of-flight mass spectrometry(LC-QTOF-MS) using the UHPLC-QTOF-MS system (Agi-lent Technologies, Karlsruhe, Germany), which consisted ofa 1290 LC system, Jet Stream electrospray ionization (ESI),
2 Disease Markers
and 6540 UHD accurate-mass QTOF spectrometry. Thesamples were analyzed by using two different chromato-graphic techniques: reversed phase (RP) and hydrophilicinteraction (HILIC) liquid chromatography. The sample traywas kept at 4°C during the analysis. The data acquisition soft-ware was theMassHunter Acquisition B.04.00 (Agilent Tech-nologies). The QC samples were injected after every 12samples and 10 samples at the beginning of the analysis.The order of the analysis of the samples was random.
In the RP technique, 2μL of the sample solution wasinjected onto the column (Zorbax Eclipse XDB-C18Rapid-Resolution HD 1.8μm, 2.1× 100mm; Agilent Tech-nologies, Palo Alto, CA, USA) and maintained at 50°C.The mobile phases, delivered at 0.4mL/min, consisted ofwater (eluent A, Milli-Q purified; Millipore) and methanol(eluent B; Sigma-Aldrich), both containing 0.1% (v/v) offormic acid (Sigma-Aldrich). The following gradient pro-file was used: 2%→ 100% B (0–10min), 100% B (10–14.50min), 100%→ 2%B (14.50–14.51min), and 2% B(14.51–16.50min).
In the HILIC technique, 2μL of the sample solution wasinjected onto the column (Acquity UPLC BEH Amide1.7μm, 2.1× 100mm, Waters Corporation, Milford, MA,USA) and maintained at 45°C. The mobile phases, deliveredat 0.6mL/min, consisted of 50% acetonitrile in water (v/v;eluent A) and 90% acetonitrile in water (v/v; eluent B), bothcontaining 20mmol/L ammonium formate, pH3 (Sigma-Aldrich). The following gradient profile was used: 100% B(0–2.5min), 100%→ 0% B (2.5–10min), 0%→ 100% B(10.0–10.01min), and 100% B (10.01–12.50min).
The MS conditions after both chromatographic analyseswere as follows: Jet Stream ESI source, operated in positiveand negative ionization mode, a drying gas temperature325°C, gas flow 10L/min, a sheath gas temperature 350°C,sheath gas flow 11L/min, nebulizer pressure 45 pounds persquare inch, capillary voltage 3500V, nozzle voltage 1000V,fragmentor voltage 100V, and a skimmer 45V. For dataacquisition, a 2GHz extended dynamic range mode wasused, and the instrument was set to acquire over the m/z20–1600. Data were collected in the centroid mode at theacquisition rate of 1.67 spectra/s (i.e., 600ms/spectrum) withan abundance threshold of 150. For the automatic data-dependent MS/MS analyses performed on the QC samples,the 4 most abundant ions were selected for fragmentationfrom every precursor scan cycle with a scan rate 3.33 spec-tra/s. These ions were excluded after two product ion spectraand released again for fragmentation after a 0.25min hold.The precursor scan time was based on ion intensity, endingat 20,000 counts or after 200ms in HILIC and 25,000 countsor 200ms in RP, respectively. The product ion scan time was200ms. Collision energies used were 10, 20, and 40V in sub-sequent assays. The continuous mass axis calibration wasperformed monitoring two reference ions from an infusionsolution throughout the assays: m/z 121.05087300 and922.00979800 in positive mode and m/z 112.98558700 and966.00072500 in negative mode.
2.6. Metabolomics Data Analysis. Liquid chromatography-mass spectrometry (LC-MS) data were collected first with
the “Find by Molecular Feature” algorithm (MassHunterQualitative Analysis B.06.00, Agilent Technologies, USA).The peak collection threshold was 1000–4000 countsdepending on chromatography mode, and the allowed ionspecies were restricted to [M+H]+ in ESI(+) and [M−H]−in ESI(−). Data files (.cef format) were exported to Mass Pro-filer Professional version 14.0 (Agilent Technologies) forpeak alignment to create a list of potential molecular features.The molecular features were restricted to those present atleast in 50% of samples within one study group, and theresulting entity list was used for feature-specific data rea-nalyzation back from raw data with the “Find by Formula”algorithm (MassHunter Qualitative Analysis B.06.00). Forthis recursive analysis, compound mass tolerance was±15.00 ppm, retention time± 0.1min, and symmetric expan-sion value for chromatograms± 35.0 ppm. The resulting peakdata was again aligned with Mass Profiler Professional soft-ware and cleaned by filtering (metabolite features that werepresent in at least 80% of samples in any of the four studygroups) resulting in 417, 420, 2385, and 1276 molecularfeatures from HILIC ESI(+), HILIC ESI(−), RP ESI(+), andRP ESI(−), respectively.
The metabolite features were further subjected for statis-tical analysis by a pair-wise comparison of the case groupconsisting of patients with complicated course of febrileneutropenia and the control group consisting of noncompli-cated febrile neutropenia either at day 0 or day 1 by Student’st-test. The resulting p values were adjusted for multiplecomparisons by Benjamini-Hochberg false discovery rate(FDR) correction within each of the four analyticalapproaches [21]. Finally, the four datasets were exported intoMicrosoft Excel.
The data from each of the four analytical approacheswere subjected to unsupervised principal component analysis(PCA) and supervised classification algorithm partial least-squares discriminant analysis (PLS-DA; SIMCA 14, Ume-trics, Sweden). The data were log10-transformed andPareto-scaled, and the model was validated by SIMCA 13internal cross validation [22, 23]. PLS-DA illustrates thedifferences between the two study groups at either day 0 orday 1, separately, and gives variable importance projection(VIP) values: the larger the VIP value is, the more significantcontributor the metabolite is in the model. The resulting VIPvalues for each metabolite were integrated in the data andused for classifying out the most important metabolitefeatures. Due to small group size and high variability in thegroup, the cut-off VIP value was set to 1.5.
The metabolite features were further filtered according toan average peak area > 50,000 and molecularmass < 1000Dato exclude small and insignificant features from the analysisresulting in a set of 1935 molecular features (144 HILICESI(−), 152 HILIC ESI(+), 517 RP ESI(−), and 1122 RPESI(+)). The molecular features with a VIP value on day 0and day 1 > 1 5 and the corrected p value < 0.05 on eitherday 0 or day 1 were considered the most significant markers.Molecular features with a VIP value > 1 5 on day 0 and day 1but with a noncorrected p value < 0.05 also on both days wereconsidered as the second most important molecular features.Also, molecular features with a VIP value > 1 5 either on day
3Disease Markers
0 or on day 1 and a p value < 0.05 on day 0 and day 1 wereconsidered important and subjected for identification.
The identification of metabolites was based on MS/MSfragmentation spectra acquired in the automatic MS/MSanalysis during the initial data acquisition or later on viareinjection of the samples. The spectra were compared withthe in-house standard-compound library, METLIN Metabo-lomics Database [24], the Human Metabolome Database[25], and LIPID MAPS [26] or fragmentation patterns char-acteristic for certain metabolite types including phospho-lipids [27, 28]. Shortly, the identification of PCs was basedon the presence of a protonated head group (m/z 184.073)in positive ESI mode and presence of formic acid adduct[M+COO]−, neutral loss of M+COO−60.0182, and the sizeof fatty acyl side-chain fragments in the negative ESI modespectra. Phosphatidylethanolamines (PE) were identifiedbased on the characteristic neutral loss of 141.027Da in thepositive ESI mode and fatty acyl side-chain fragments inthe negative ESI mode spectra. The identification of andros-terone/5α-dihydrotestosterone sulfate (ADTS/DHTS) wasbased on sulfate fragment SO4H2 of 96.9591Da and exactmolecular mass 370.1815Da. However, as the sulfate frag-ment is highly dominant and the fragmentation patternshows no other clear fragments, the metabolite was anno-tated as ADTS/DHTS. MS/MS fragmentation data for allthe identified metabolites is presented in Table 1.
2.7. The Statistical Analysis of the Conventional Biomarkers.CRP and PCT values were expressed as medians and inter-quartiles due to the skewed distribution. The Mann–WhitneyU test was used to detect differences between the groups incontinuous variables. The association between categoricalvariables was studied by χ2 test with Spearman’s correlation.A p value less than 0.05 was considered significant. Dataanalyses were conducted with SPSS 21.0 Software (SPSSInc., Chicago, Illinois, USA).
3. Results
3.1. Course of Febrile Neutropenia and Blood CultureFindings. The characteristics of patients with complicatedcourse of febrile neutropenia are presented in Table 2. Alto-gether, the group included twenty patients (24%). Twelvepatients had bacteremia without any other signs of complica-tion. Eight patients fulfilled the criteria for complicated sep-sis, and three of them developed septic shock. Altogether,six patients needed intensive care unit treatment and threeof them died (mortality 3% in the whole series).
The blood cultures were positive in 18 out of 85 patients(21%) with fourteen gram-positive and three gram-negativebacteremias, respectively. The gram-positive findingsincluded Enterococcus faecium (n = 5), Staphylococcus epi-dermidis (n = 3), Streptococcus mitis (n = 2), Staphylococcushaemolyticus (n = 2), Streptococcus salivarius (n = 1), andGemella morbillorum (n = 1). The gram-negative findingswere Klebsiella oxytoca (n = 1), Escherichia coli (n = 1), andPseudomonas aeruginosa (n = 1). One case of fungemia wasfound (Candida krusei).
3.2. Conventional Biomarkers. The medians (IQ) of CRP forpatients with complicated course of febrile neutropenia were51 (26–100) on d0 and 100 (57–214) on d1. In patientswithout complications, CRP values were 36 (19–67) ond0 and 67 (35–95) on d1. There was a significant statisti-cal difference on d1 (p = 0 014). The medians (IQ) of PCTfor patients with complicated course of febrile neutropeniawere 0.164 (0.120–0.279) on d0 and 0.350 (0.190–1.855)on d1. In patients without complications, PCT values were0.122 (0.077–0.193) on d0 and 0.163 (0.104–0.320) on d1.There was a significant statistical difference between thegroups on both days. p values were 0.027 and 0.020 onday d0 and d1, respectively.
3.3. Nontargeted Metabolite Profiling. Principal componentanalysis of the molecular features collected at four analyticalmodes of LC-MS analysis is presented in the Supplemen-tary Figure (available here). Altogether, 90 molecular fea-tures fulfilled the filtering criteria and were considered tobe important for explaining the metabolic differencesbetween patients with noncomplicated versus complicatedcourse of febrile neutropenia. Of these 90 molecular fea-tures, 52 were tentatively identified corresponding to 25different metabolites (Table 1) (Figure 1).
Six molecular features fulfilled the strictest filtering cri-teria and were considered as the most significant markersto differentiate between noncomplicated and complicatedcourse of febrile neutropenia (Figure 2). Of these markers,one metabolite was unambiguously identified to be citrul-line and two others tentatively identified to be ADTS/DHTS and PE(18:0/20:4), whereas three remained uniden-tified (Table 1). While ADTS/DHTS and PE(18:0/20:4)were significantly increased, citrulline demonstrated lowlevels in patients with complicated course of febrileneutropenia (Figure 2).
Twelve molecular features fulfilled the second moststrict criteria and were considered important in explainingthe differences. These features were tentatively identified tocorrespond to four different lipid metabolites, namely,PC(15:0/22:6), PC(16:0/20:4), PC(16:0/22:6), and PE(16:0/22:6) (Table 1). While PC with 20 : 4 fatty-acyl side chainincreased, the PCs with 22 : 6 side chain decreased inpatients with complicated course of febrile neutropenia(Figure 2). PE(16:0/22:6) showed a similar increase inpatients with complicated course of febrile neutropenia asPE(18:0/20:4), but it did not meet the criteria set for themost significant markers due to a large relative standarddeviation (Table 1).
Additionally, 19 metabolites were identified whichfulfilled the lowest criteria. These tentatively identifiedmetabolites containing various lysophosphatidylcholinesand phosphatidylcholines, butyryl-L-carnitine, L-histidine,and putative pregnenolone sulfate (Table 1). All of theLysoPCs showed decreased levels in patients with compli-cated course of febrile neutropenia. Whereas in the caseof PCs, a similar behavior was seen as with more impor-tant metabolite markers as the PCs containing a 22 : 6fatty-acyl side chain, as they showed decreased levels inpatients with complicated course of febrile neutropenia,
4 Disease Markers
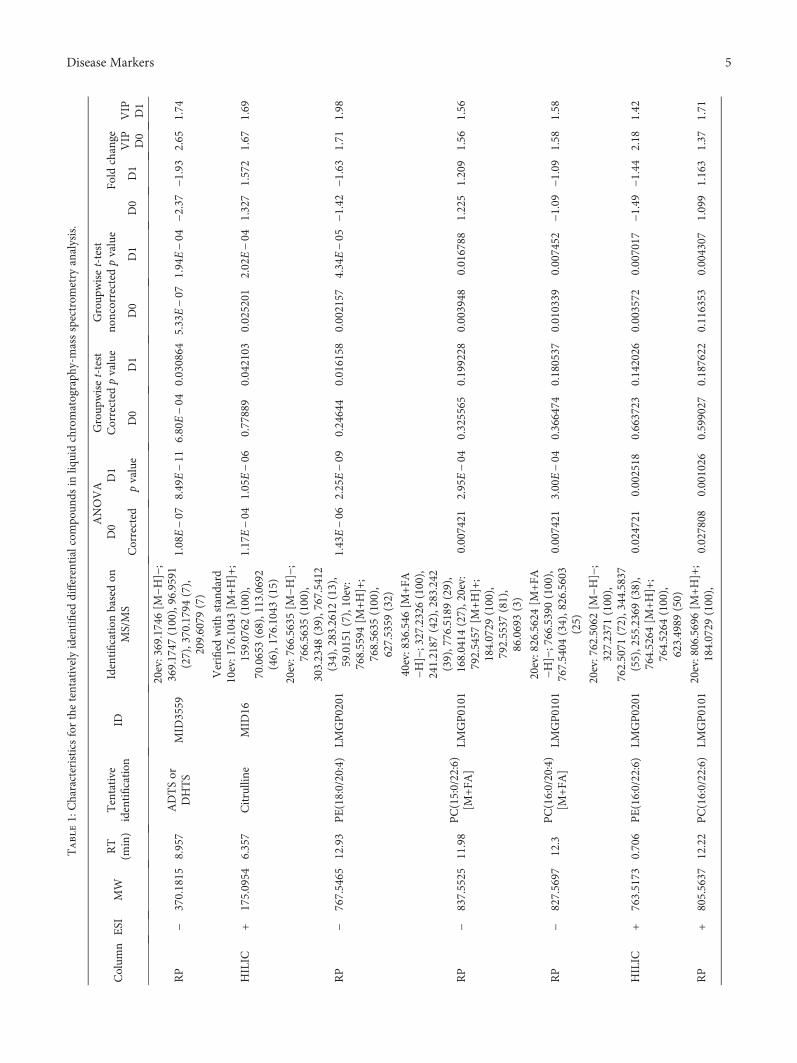
Table1:Characteristics
forthetentativelyidentified
differentialcompo
unds
inliq
uidchromatograph
y-massspectrom
etry
analysis.
Colum
nESI
MW
RT
(min)
Tentative
identification
IDIdentification
basedon
MS/MS
ANOVA
Group
wiset-test
Corrected
pvalue
Group
wiset-test
noncorrected
pvalue
D0
D1
Fold
change
Corrected
pvalue
D0
D1
D0
D1
D0
D1
VIP D0
VIP D1
RP
−370.1815
8.957
ADTSor
DHTS
MID
3559
20ev:369.1746[M
−H]−;
369.1747
(100),96.9591
(27),370.1794(7),
209.6079
(7)
1.08E−07
8.49E−11
6.80E−04
0.030864
5.33E−07
1.94E−04
−2.37
−1.93
2.65
1.74
HILIC
+175.0954
6.357
Citrulline
MID
16
Verified
withstandard
10ev:176.1043[M
+H]+;
159.0762
(100),
70.0653(68),113.0692
(46),176.1043(15)
1.17E−04
1.05E−06
0.77889
0.042103
0.025201
2.02E−04
1.327
1.572
1.67
1.69
RP
−767.5465
12.93
PE(18:0/20:4)
LMGP0201
20ev:766.5635[M
−H]−;
766.5635
(100),
303.2348
(39),767.5412
(34),283.2612(13),
59.0151(7),10ev:
768.5594
[M+H]+;
768.5635
(100),
627.5359
(32)
1.43E−06
2.25E−09
0.24644
0.016158
0.002157
4.34E−05
−1.42
−1.63
1.71
1.98
RP
−837.5525
11.98
PC(15:0/22:6)
[M+FA
]LM
GP0101
40ev:836.546
[M+FA
−H]−;327.2326(100),
241.2187
(42),283.242
(39),776.5189(29),
168.0414
(27),20ev:
792.5457
[M+H]+;
184.0729
(100),
792.5537
(81),
86.0693(3)
0.007421
2.95E−04
0.325565
0.199228
0.003948
0.016788
1.225
1.209
1.56
1.56
RP
−827.5697
12.3
PC(16:0/20:4)
[M+FA
]LM
GP0101
20ev:826.5624[M
+FA
−H]−;766.5390(100),
767.5404
(34),826.5603
(25)
0.007421
3.00E−04
0.366474
0.180537
0.010339
0.007452
−1.09
−1.09
1.58
1.58
HILIC
+763.5173
0.706
PE(16:0/22:6)
LMGP0201
20ev:762.5062[M
−H]−;
327.2371
(100),
762.5071
(72),344.5837
(55),255.2369(38),
764.5264
[M+H]+;
764.5264
(100),
623.4989
(50)
0.024721
0.002518
0.663723
0.142026
0.003572
0.007017
−1.49
−1.44
2.18
1.42
RP
+805.5637
12.22
PC(16:0/22:6)
LMGP0101
20ev:806.5696[M
+H]+;
184.0729
(100),
0.027808
0.001026
0.599027
0.187622
0.116353
0.004307
1.099
1.163
1.37
1.71
5Disease Markers
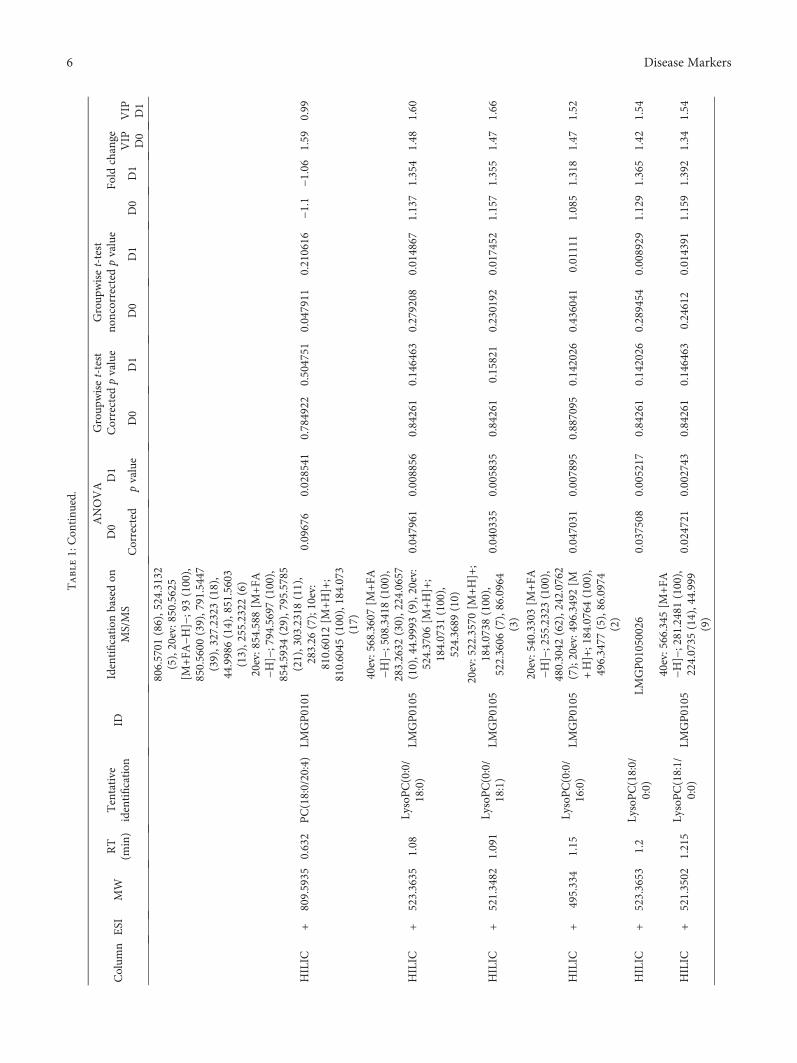
Table1:Con
tinu
ed.
Colum
nESI
MW
RT
(min)
Tentative
identification
IDIdentification
basedon
MS/MS
ANOVA
Group
wiset-test
Corrected
pvalue
Group
wiset-test
noncorrected
pvalue
D0
D1
Fold
change
Corrected
pvalue
D0
D1
D0
D1
D0
D1
VIP D0
VIP D1
806.5701
(86),524.3132
(5),20ev:850.5625
[M+FA
−H]−;93(100),
850.5600
(39),791.5447
(39),327.2323(18),
44.9986(14),851.5603
(13),255.2322(6)
HILIC
+809.5935
0.632
PC(18:0/20:4)
LMGP0101
20ev:854.588
[M+FA
−H]−;794.5697(100),
854.5934
(29),795.5785
(21),303.2318(11),
283.26
(7);10ev:
810.6012
[M+H]+;
810.6045
(100),184.073
(17)
0.09676
0.028541
0.784922
0.504751
0.047911
0.210616
−1.1
−1.06
1.59
0.99
HILIC
+523.3635
1.08
LysoPC(0:0/
18:0)
LMGP0105
40ev:568.3607[M
+FA
−H]−;508.3418(100),
283.2632
(30),224.0657
(10),44.9993
(9),20ev:
524.3706
[M+H]+;
184.0731
(100),
524.3689
(10)
0.047961
0.008856
0.84261
0.146463
0.279208
0.014867
1.137
1.354
1.48
1.60
HILIC
+521.3482
1.091
LysoPC(0:0/
18:1)
LMGP0105
20ev:522.3570[M
+H]+;
184.0738
(100),
522.3606
(7),86.0964
(3)
0.040335
0.005835
0.84261
0.15821
0.230192
0.017452
1.157
1.355
1.47
1.66
HILIC
+495.334
1.15
LysoPC(0:0/
16:0)
LMGP0105
20ev:540.3303[M
+FA
−H]−;255.2323(100),
480.3042
(62),242.0762
(7);20ev:496.3492[M
+H]+;184.0764(100),
496.3477
(5),86.0974
(2)
0.047031
0.007895
0.887095
0.142026
0.436041
0.01111
1.085
1.318
1.47
1.52
HILIC
+523.3653
1.2
LysoPC(18:0/
0:0)
LMGP01050026
0.037508
0.005217
0.84261
0.142026
0.289454
0.008929
1.129
1.365
1.42
1.54
HILIC
+521.3502
1.215
LysoPC(18:1/
0:0)
LMGP0105
40ev:566.345
[M+FA
−H]−;281.2481(100),
224.0735
(14),44.999
(9)
0.024721
0.002743
0.84261
0.146463
0.24612
0.014391
1.159
1.392
1.34
1.54
6 Disease Markers
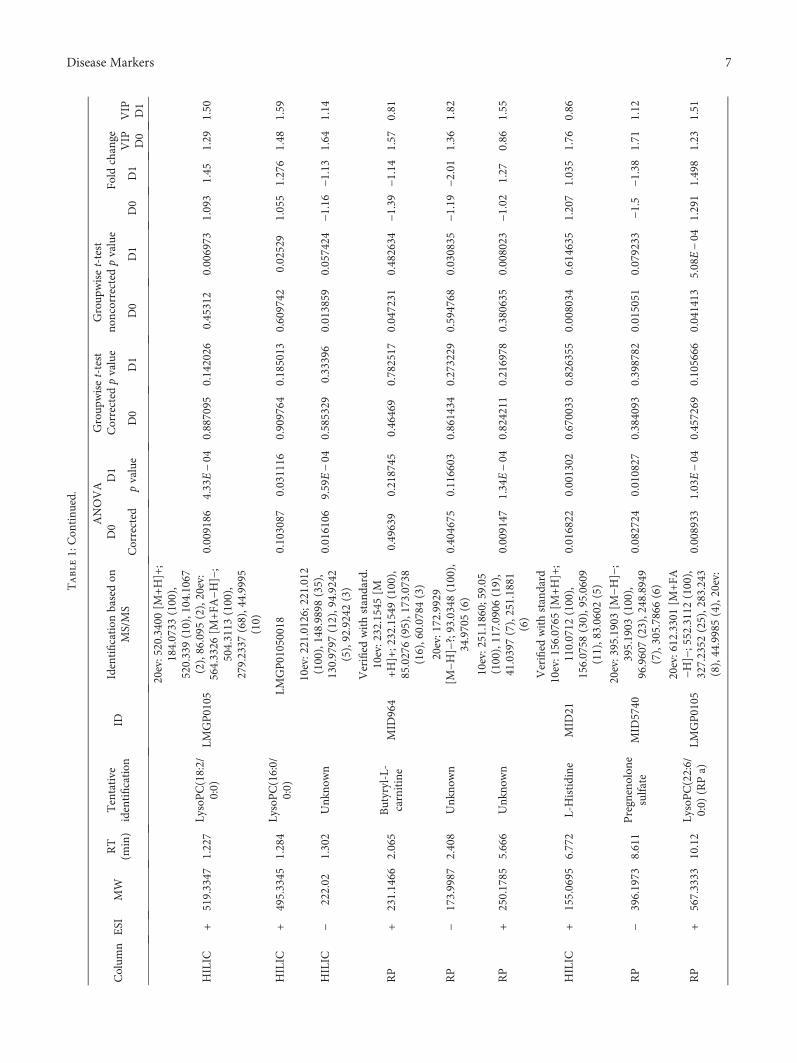
Table1:Con
tinu
ed.
Colum
nESI
MW
RT
(min)
Tentative
identification
IDIdentification
basedon
MS/MS
ANOVA
Group
wiset-test
Corrected
pvalue
Group
wiset-test
noncorrected
pvalue
D0
D1
Fold
change
Corrected
pvalue
D0
D1
D0
D1
D0
D1
VIP D0
VIP D1
HILIC
+519.3347
1.227
LysoPC(18:2/
0:0)
LMGP0105
20ev:520.3400[M
+H]+;
184.0733
(100),
520.339(10),104.1067
(2),86.095
(2),20ev:
564.3326
[M+FA
−H]−;
504.3113
(100),
279.2337
(68),44.9995
(10)
0.009186
4.33E−04
0.887095
0.142026
0.45312
0.006973
1.093
1.45
1.29
1.50
HILIC
+495.3345
1.284
LysoPC(16:0/
0:0)
LMGP01050018
0.103087
0.031116
0.909764
0.185013
0.609742
0.02529
1.055
1.276
1.48
1.59
HILIC
−222.02
1.302
Unk
nown
10ev:221.0126;221.012
(100),148.9898
(35),
130.9797
(12),94.9242
(5),92.9242(3)
0.016106
9.59E−04
0.585329
0.33396
0.013859
0.057424
−1.16
−1.13
1.64
1.14
RP
+231.1466
2.065
Butyryl-L-
carnitine
MID
964
Verified
withstandard.
10ev:232.1545[M
+H]+;232.1549(100),
85.0276(95),173.0738
(16),60.0784
(3)
0.49639
0.218745
0.46469
0.782517
0.047231
0.482634
−1.39
−1.14
1.57
0.81
RP
−173.9987
2.408
Unk
nown
20ev:172.9929
[M−H
]−?;93.0348(100),
34.9705(6)
0.404675
0.116603
0.861434
0.273229
0.594768
0.030835
−1.19
−2.01
1.36
1.82
RP
+250.1785
5.666
Unk
nown
10ev:251.1860;59.05
(100),117.0906
(19),
41.0397(7),251.1881
(6)
0.009147
1.34E−04
0.824211
0.216978
0.380635
0.008023
−1.02
1.27
0.86
1.55
HILIC
+155.0695
6.772
L-Histidine
MID
21
Verified
withstandard
10ev:156.0765[M
+H]+;
110.0712
(100),
156.0758
(30),95.0609
(11),83.0602
(5)
0.016822
0.001302
0.670033
0.826355
0.008034
0.614635
1.207
1.035
1.76
0.86
RP
−396.1973
8.611
Pregnenolon
esulfate
MID
5740
20ev:395.1903[M
−H]−;
395.1903
(100),
96.9607(23),248.8949
(7),305.7866
(6)
0.082724
0.010827
0.384093
0.398782
0.015051
0.079233
−1.5
−1.38
1.71
1.12
RP
+567.3333
10.12
LysoPC(22:6/
0:0)
(RPa)
LMGP0105
20ev:612.3301[M
+FA
−H]−;552.3112(100),
327.2352
(25),283.243
(8),44.9985(4),20ev:
0.008933
1.03E−04
0.457269
0.105666
0.041413
5.08E−04
1.291
1.498
1.23
1.51
7Disease Markers
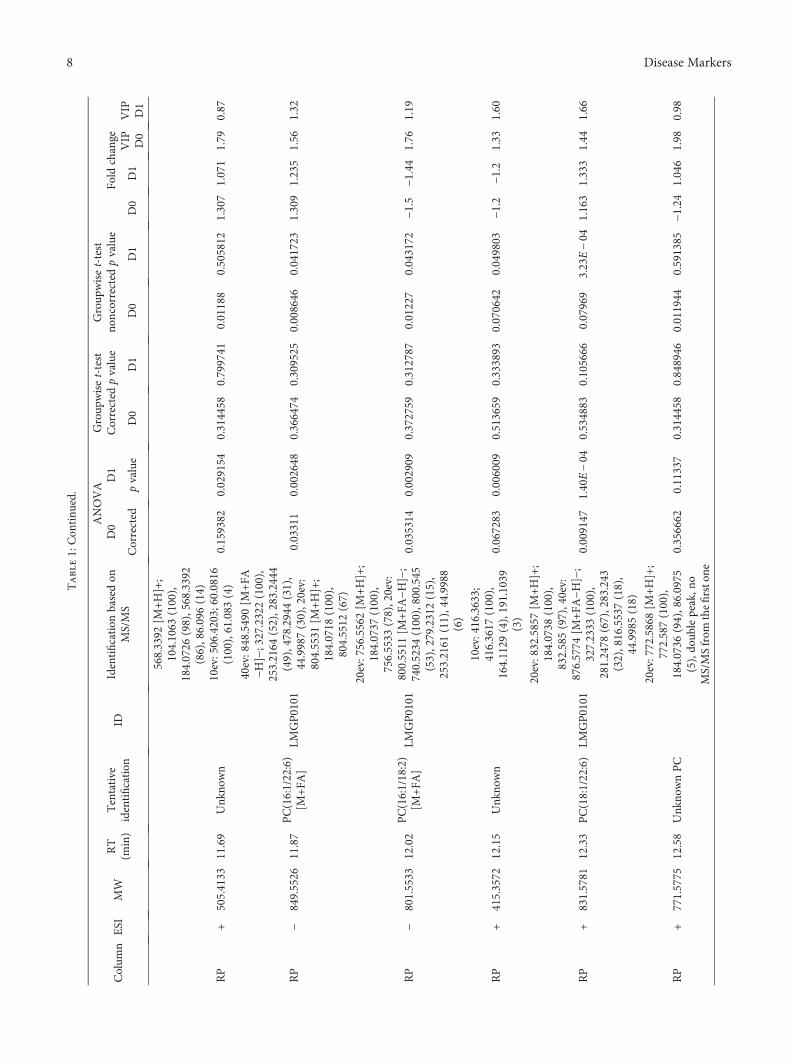
Table1:Con
tinu
ed.
Colum
nESI
MW
RT
(min)
Tentative
identification
IDIdentification
basedon
MS/MS
ANOVA
Group
wiset-test
Corrected
pvalue
Group
wiset-test
noncorrected
pvalue
D0
D1
Fold
change
Corrected
pvalue
D0
D1
D0
D1
D0
D1
VIP D0
VIP D1
568.3392
[M+H]+;
104.1063
(100),
184.0726
(98),568.3392
(86),86.096(14)
RP
+505.4133
11.69
Unk
nown
10ev:506.4203;60.0816
(100),61.083
(4)
0.159382
0.029154
0.314458
0.799741
0.01188
0.505812
1.307
1.071
1.79
0.87
RP
−849.5526
11.87
PC(16:1/22:6)
[M+FA
]LM
GP0101
40ev:848.5490[M
+FA
−H]−;327.2322(100),
253.2164
(52),283.2444
(49),478.2944(31),
44.9987(30),20ev:
804.5531
[M+H]+;
184.0718
(100),
804.5512
(67)
0.03311
0.002648
0.366474
0.309525
0.008646
0.041723
1.309
1.235
1.56
1.32
RP
−801.5533
12.02
PC(16:1/18:2)
[M+FA
]LM
GP0101
20ev:756.5562[M
+H]+;
184.0737
(100),
756.5533
(78),20ev:
800.5511
[M+FA
−H]−;
740.5234
(100),800.545
(53),279.2312(15),
253.2161
(11),44.9988
(6)
0.035314
0.002909
0.372759
0.312787
0.01227
0.043172
−1.5
−1.44
1.76
1.19
RP
+415.3572
12.15
Unk
nown
10ev:416.3633;
416.3617
(100),
164.1129
(4),191.1039
(3)
0.067283
0.006009
0.513659
0.333893
0.070642
0.049803
−1.2
−1.2
1.33
1.60
RP
+831.5781
12.33
PC(18:1/22:6)
LMGP0101
20ev:832.5857[M
+H]+;
184.0738
(100),
832.585(97),40ev:
876.5774
[M+FA
−H]−;
327.2333
(100),
281.2478
(67),283.243
(32),816.5537(18),
44.9985(18)
0.009147
1.40E−04
0.534883
0.105666
0.07969
3.23E−04
1.163
1.333
1.44
1.66
RP
+771.5775
12.58
Unk
nownPC
20ev:772.5868[M
+H]+;
772.587(100),
184.0736
(94),86.0975
(5),do
ublepeak,n
oMS/MSfrom
thefirstone
0.356662
0.11337
0.314458
0.848946
0.011944
0.591385
−1.24
1.046
1.98
0.98
8 Disease Markers
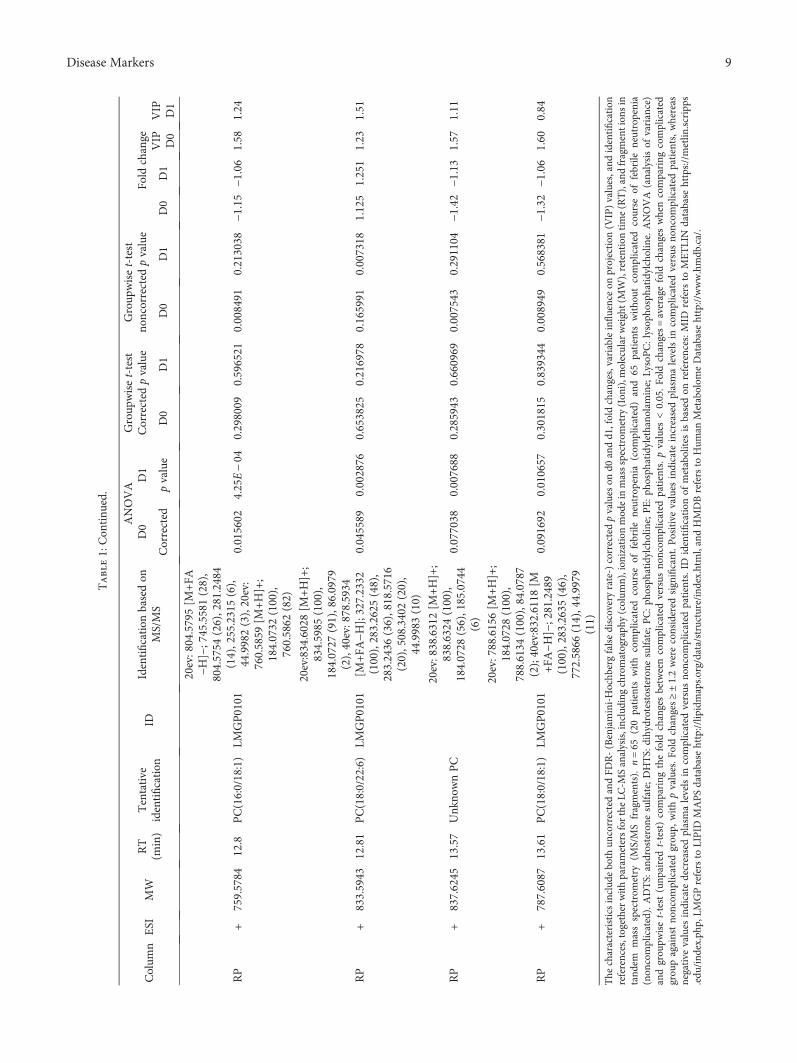
Table1:Con
tinu
ed.
Colum
nESI
MW
RT
(min)
Tentative
identification
IDIdentification
basedon
MS/MS
ANOVA
Group
wiset-test
Corrected
pvalue
Group
wiset-test
noncorrected
pvalue
D0
D1
Fold
change
Corrected
pvalue
D0
D1
D0
D1
D0
D1
VIP D0
VIP D1
RP
+759.5784
12.8
PC(16:0/18:1)
LMGP0101
20ev:804.5795[M
+FA
−H]−;745.5581(28),
804.5754
(26),281.2484
(14),255.2315(6),
44.9982(3),20ev:
760.5859
[M+H]+;
184.0732
(100),
760.5862
(82)
0.015602
4.25E−04
0.298009
0.596521
0.008491
0.213038
−1.15
−1.06
1.58
1.24
RP
+833.5943
12.81
PC(18:0/22:6)
LMGP0101
20ev:834.6028[M
+H]+;
834.5985
(100),
184.0727
(91),86.0979
(2),40ev:878.5934
[M+FA
−H];327.2332
(100),283.2625
(48),
283.2436
(36),818.5716
(20),508.3402(20),
44.9983(10)
0.045589
0.002876
0.653825
0.216978
0.165991
0.007318
1.125
1.251
1.23
1.51
RP
+837.6245
13.57
Unk
nownPC
20ev:838.6312[M
+H]+;
838.6324
(100),
184.0728
(56),185.0744
(6)
0.077038
0.007688
0.285943
0.660969
0.007543
0.291104
−1.42
−1.13
1.57
1.11
RP
+787.6087
13.61
PC(18:0/18:1)
LMGP0101
20ev:788.6156[M
+H]+;
184.0728
(100),
788.6134
(100),84.0787
(2);40ev:832.6118[M
+FA
−H]−;281.2489
(100),283.2635
(46),
772.5866
(14),44.9979
(11)
0.091692
0.010657
0.301815
0.839344
0.008949
0.568381
−1.32
−1.06
1.60
0.84
The
characteristicsinclud
eboth
uncorrectedandFD
R-(Benjamini-Hochb
ergfalsediscoveryrate-)correctedpvalues
ond0
andd1,foldchanges,variableinfluenceon
projection
(VIP)values,and
identification
references,togetherwithparametersfortheLC
-MSanalysis,including
chromatograph
y(colum
n),ion
izationmod
ein
massspectrom
etry
(Ion
i),m
olecular
weight(MW),retentiontime(RT),andfragmention
sin
tand
emmassspectrom
etry
(MS/MSfragments).
n=65
(20patients
with
complicated
course
offebrile
neutropenia(com
plicated)and
65patients
witho
utcomplicated
course
offebrile
neutropenia
(non
complicated).ADTS:
androsterone
sulfate;DHTS:
dihydrotestosteron
esulfate;PC:ph
osph
atidylcholine;PE:ph
osph
atidylethano
lamine;LysoPC:lysoph
osph
atidylcholine.ANOVA
(analysisof
variance)
andgrou
pwiset-test
(unp
airedt-test)comparing
thefold
changesbetweencomplicated
versus
noncom
plicated
patients.pvalues
<0.05.Fo
ldchanges=averagefold
changeswhencomparing
complicated
grou
pagainstno
ncom
plicated
grou
p,withpvalues.F
oldchanges≥±1.2wereconsidered
significant.Positivevalues
indicate
increasedplasmalevelsin
complicated
versus
noncom
plicated
patients,w
hereas
negative
values
indicate
decreasedplasmalevelsin
complicated
versus
noncom
plicated
patients.ID
identification
ofmetabolites
isbasedon
references:M
IDrefers
toMETLIN
database
https://metlin
.scripps
.edu
/ind
ex.php
,LMGPrefersto
LIPID
MAPSdatabase
http://lip
idmaps.org/data/structure/ind
ex.htm
l,andHMDBrefers
toHum
anMetabolom
eDatabasehttp://www.hmdb
.ca/.
9Disease Markers
while other PCs were increased in the complicated group.Butyryl-L-carnitine and tentative pregnenolone sulfateshowed increased levels and L-histidine decreased levelsin patients with complicated course of febrile neutropenia(Table 1).
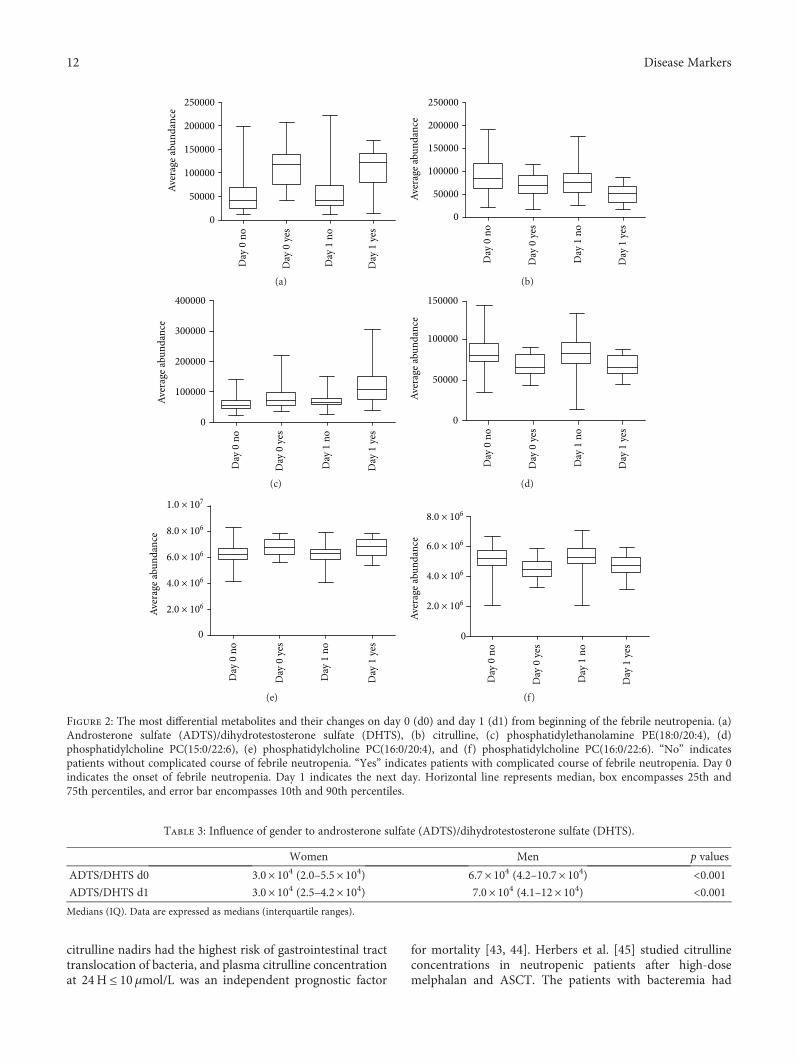
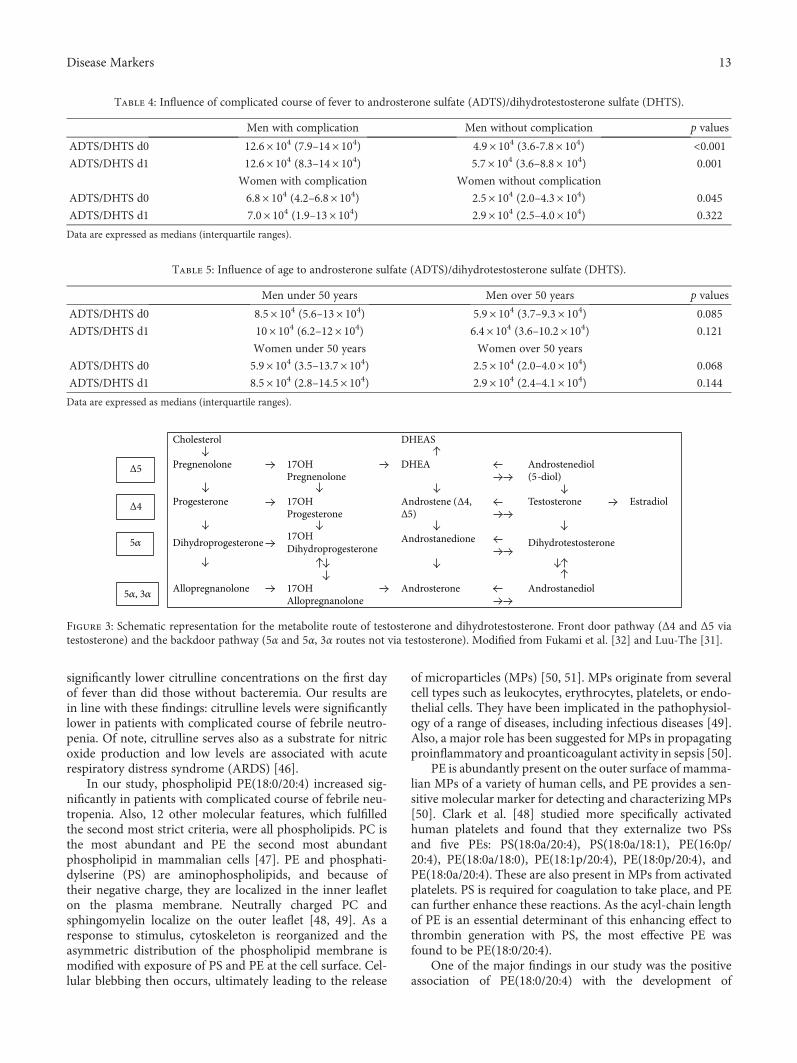
3.4. Correlation of the Metabolomics Findings withConventional Biomarkers. ADTS/DHTS had significant cor-relations with CRP and PCT on both days. With CRP, the pvalues were 0.002 and 0.003 on d0 and d1, respectively, andwith PCT they were <0.001 on both days. Citrulline had asignificant correlation on d1 with CRP (p < 0 001) and PCT(p = 0 001). PE(18:0/22:4) had a significant correlation withPCT on both time points (p = 0 016 and <0.001 on d0 andd1, resp.), but with CRP only on d1 (p = 0 005). Naturally,ADTS/DHTS had a significant difference according togender (Table 3). However, when looking at the differ-ences only among men, the significant difference remainedbetween groups of complicated versus noncomplicatedcourse of febrile neutropenia (p values < 0.001 and 0.001 ondays d0 and d1, resp.). Also, women with complicated courseof febrile neutropenia had higher ADTS/DHTS values thanwomen without complications on d0 had (p = 0 045)(Table 4). The effects of andropause and menopause wereevaluated by dividing patients to those under fifty years ofage and those over fifty years (Table 5). Citrulline orPE(18:0/22:4) levels did not have any difference due togender or age (data not shown).
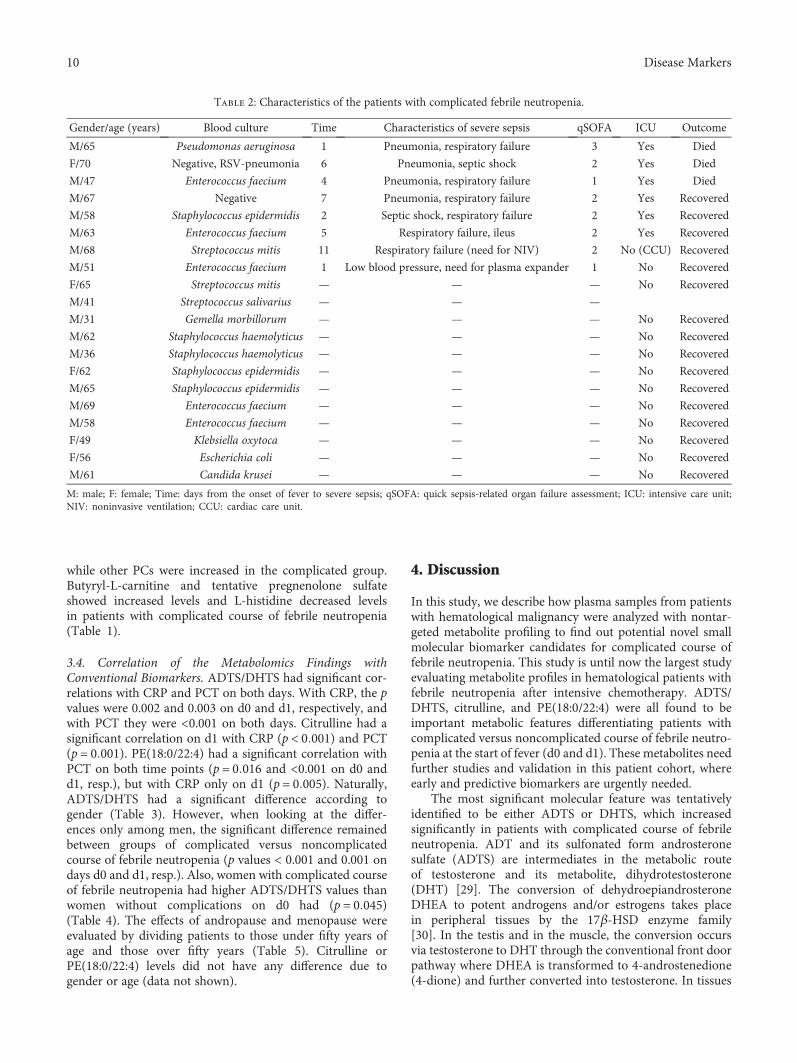
4. Discussion
In this study, we describe how plasma samples from patientswith hematological malignancy were analyzed with nontar-geted metabolite profiling to find out potential novel smallmolecular biomarker candidates for complicated course offebrile neutropenia. This study is until now the largest studyevaluating metabolite profiles in hematological patients withfebrile neutropenia after intensive chemotherapy. ADTS/DHTS, citrulline, and PE(18:0/22:4) were all found to beimportant metabolic features differentiating patients withcomplicated versus noncomplicated course of febrile neutro-penia at the start of fever (d0 and d1). These metabolites needfurther studies and validation in this patient cohort, whereearly and predictive biomarkers are urgently needed.
The most significant molecular feature was tentativelyidentified to be either ADTS or DHTS, which increasedsignificantly in patients with complicated course of febrileneutropenia. ADT and its sulfonated form androsteronesulfate (ADTS) are intermediates in the metabolic routeof testosterone and its metabolite, dihydrotestosterone(DHT) [29]. The conversion of dehydroepiandrosteroneDHEA to potent androgens and/or estrogens takes placein peripheral tissues by the 17β-HSD enzyme family[30]. In the testis and in the muscle, the conversion occursvia testosterone to DHT through the conventional front doorpathway where DHEA is transformed to 4-androstenedione(4-dione) and further converted into testosterone. In tissues
Table 2: Characteristics of the patients with complicated febrile neutropenia.
Gender/age (years) Blood culture Time Characteristics of severe sepsis qSOFA ICU Outcome
M/65 Pseudomonas aeruginosa 1 Pneumonia, respiratory failure 3 Yes Died
F/70 Negative, RSV-pneumonia 6 Pneumonia, septic shock 2 Yes Died
M/47 Enterococcus faecium 4 Pneumonia, respiratory failure 1 Yes Died
M/67 Negative 7 Pneumonia, respiratory failure 2 Yes Recovered
M/58 Staphylococcus epidermidis 2 Septic shock, respiratory failure 2 Yes Recovered
M/63 Enterococcus faecium 5 Respiratory failure, ileus 2 Yes Recovered
M/68 Streptococcus mitis 11 Respiratory failure (need for NIV) 2 No (CCU) Recovered
M/51 Enterococcus faecium 1 Low blood pressure, need for plasma expander 1 No Recovered
F/65 Streptococcus mitis — — — No Recovered
M/41 Streptococcus salivarius — — —
M/31 Gemella morbillorum — — — No Recovered
M/62 Staphylococcus haemolyticus — — — No Recovered
M/36 Staphylococcus haemolyticus — — — No Recovered
F/62 Staphylococcus epidermidis — — — No Recovered
M/65 Staphylococcus epidermidis — — — No Recovered
M/69 Enterococcus faecium — — — No Recovered
M/58 Enterococcus faecium — — — No Recovered
F/49 Klebsiella oxytoca — — — No Recovered
F/56 Escherichia coli — — — No Recovered
M/61 Candida krusei — — — No Recovered
M: male; F: female; Time: days from the onset of fever to severe sepsis; qSOFA: quick sepsis-related organ failure assessment; ICU: intensive care unit;NIV: noninvasive ventilation; CCU: cardiac care unit.
10 Disease Markers
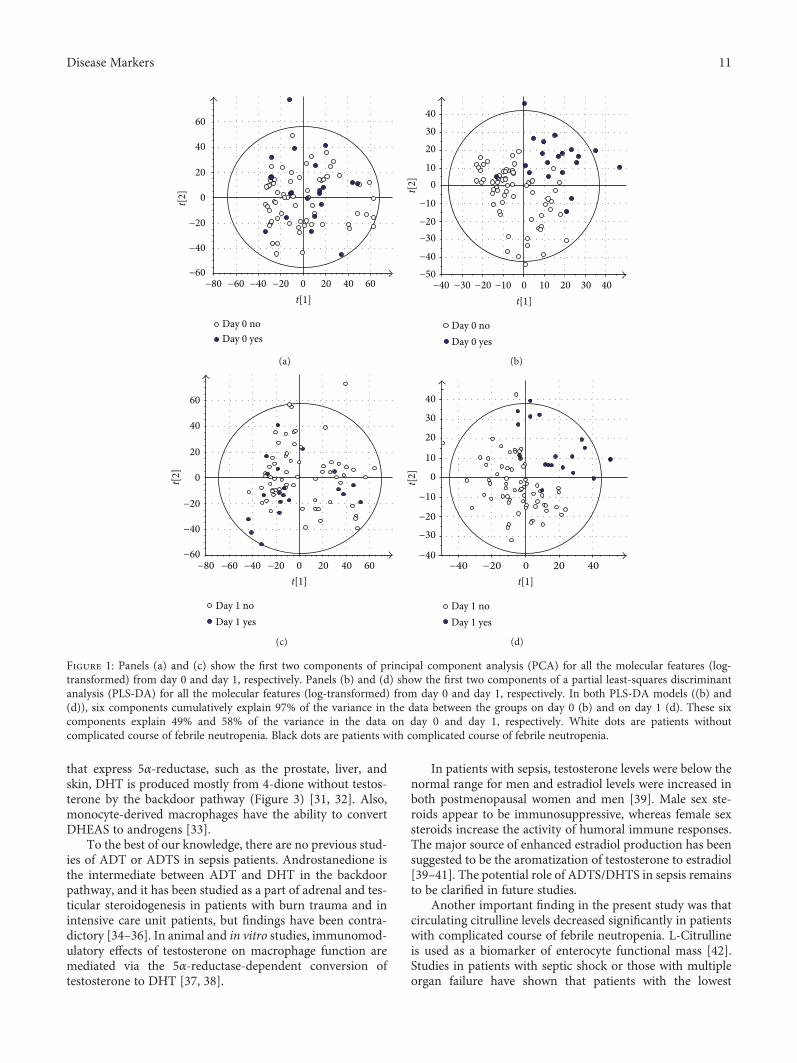
that express 5α-reductase, such as the prostate, liver, andskin, DHT is produced mostly from 4-dione without testos-terone by the backdoor pathway (Figure 3) [31, 32]. Also,monocyte-derived macrophages have the ability to convertDHEAS to androgens [33].
To the best of our knowledge, there are no previous stud-ies of ADT or ADTS in sepsis patients. Androstanedione isthe intermediate between ADT and DHT in the backdoorpathway, and it has been studied as a part of adrenal and tes-ticular steroidogenesis in patients with burn trauma and inintensive care unit patients, but findings have been contra-dictory [34–36]. In animal and in vitro studies, immunomod-ulatory effects of testosterone on macrophage function aremediated via the 5α-reductase-dependent conversion oftestosterone to DHT [37, 38].
In patients with sepsis, testosterone levels were below thenormal range for men and estradiol levels were increased inboth postmenopausal women and men [39]. Male sex ste-roids appear to be immunosuppressive, whereas female sexsteroids increase the activity of humoral immune responses.The major source of enhanced estradiol production has beensuggested to be the aromatization of testosterone to estradiol[39–41]. The potential role of ADTS/DHTS in sepsis remainsto be clarified in future studies.
Another important finding in the present study was thatcirculating citrulline levels decreased significantly in patientswith complicated course of febrile neutropenia. L-Citrullineis used as a biomarker of enterocyte functional mass [42].Studies in patients with septic shock or those with multipleorgan failure have shown that patients with the lowest
Day 0 noDay 0 yes
t[2]
60
60
40
40
20
20
0
0
−20
−20
−40
−40−60
−60−80t[1]
(a)
Day 0 noDay 0 yes
403020
010
−20
−10
−40
−30
−50
t[1]30 4020100−10−20−30−40
t[2]
(b)
Day 1 noDay 1 yes
t[2]
60
60
40
40
20
20
0
0
−20
−20
−40
−40−60
−60−80t[1]
(c)
Day 1 noDay 1 yes
t[1]
40
30
20
0
−20
−10
−40
−30
10
40200−20−40
t[2]
(d)
Figure 1: Panels (a) and (c) show the first two components of principal component analysis (PCA) for all the molecular features (log-transformed) from day 0 and day 1, respectively. Panels (b) and (d) show the first two components of a partial least-squares discriminantanalysis (PLS-DA) for all the molecular features (log-transformed) from day 0 and day 1, respectively. In both PLS-DA models ((b) and(d)), six components cumulatively explain 97% of the variance in the data between the groups on day 0 (b) and on day 1 (d). These sixcomponents explain 49% and 58% of the variance in the data on day 0 and day 1, respectively. White dots are patients withoutcomplicated course of febrile neutropenia. Black dots are patients with complicated course of febrile neutropenia.
11Disease Markers
citrulline nadirs had the highest risk of gastrointestinal tracttranslocation of bacteria, and plasma citrulline concentrationat 24H ≤ 10μmol/L was an independent prognostic factor
for mortality [43, 44]. Herbers et al. [45] studied citrullineconcentrations in neutropenic patients after high-dosemelphalan and ASCT. The patients with bacteremia had
0
50000
100000
150000
200000
250000
Aver
age a
bund
ance
Day
0 n
o
Day
0 y
es
Day
1 n
o
Day
1 y
es
(a)
0
50000
100000
150000
200000
250000
Aver
age a
bund
ance
Day
0 n
o
Day
0 y
es
Day
1 n
o
Day
1 y
es
(b)
0
100000
200000
300000
400000
Aver
age a
bund
ance
Day
0 n
o
Day
0 y
es
Day
1 n
o
Day
1 y
es
(c)
0
50000
100000
150000
Aver
age a
bund
ance
Day
0 n
o
Day
0 y
es
Day
1 n
o
Day
1 y
es
(d)
0
8.0 × 10⁶
1.0 × 10⁷
6.0 × 10⁶
4.0 × 10⁶
2.0 × 10⁶Aver
age a
bund
ance
Day
0 n
o
Day
0 y
es
Day
1 n
o
Day
1 y
es
(e)
0
8.0 × 10⁶
6.0 × 10⁶
4.0 × 10⁶
2.0 × 10⁶
Aver
age a
bund
ance
Day
0 n
o
Day
0 y
es
Day
1 n
o
Day
1 y
es
(f)
Figure 2: The most differential metabolites and their changes on day 0 (d0) and day 1 (d1) from beginning of the febrile neutropenia. (a)Androsterone sulfate (ADTS)/dihydrotestosterone sulfate (DHTS), (b) citrulline, (c) phosphatidylethanolamine PE(18:0/20:4), (d)phosphatidylcholine PC(15:0/22:6), (e) phosphatidylcholine PC(16:0/20:4), and (f) phosphatidylcholine PC(16:0/22:6). “No” indicatespatients without complicated course of febrile neutropenia. “Yes” indicates patients with complicated course of febrile neutropenia. Day 0indicates the onset of febrile neutropenia. Day 1 indicates the next day. Horizontal line represents median, box encompasses 25th and75th percentiles, and error bar encompasses 10th and 90th percentiles.
Table 3: Influence of gender to androsterone sulfate (ADTS)/dihydrotestosterone sulfate (DHTS).
Women Men p values
ADTS/DHTS d0 3.0× 10⁴ (2.0–5.5× 10⁴) 6.7× 10⁴ (4.2–10.7× 10⁴) <0.001ADTS/DHTS d1 3.0× 10⁴ (2.5–4.2× 10⁴) 7.0× 10⁴ (4.1–12× 104) <0.001Medians (IQ). Data are expressed as medians (interquartile ranges).
12 Disease Markers
significantly lower citrulline concentrations on the first dayof fever than did those without bacteremia. Our results arein line with these findings: citrulline levels were significantlylower in patients with complicated course of febrile neutro-penia. Of note, citrulline serves also as a substrate for nitricoxide production and low levels are associated with acuterespiratory distress syndrome (ARDS) [46].
In our study, phospholipid PE(18:0/20:4) increased sig-nificantly in patients with complicated course of febrile neu-tropenia. Also, 12 other molecular features, which fulfilledthe second most strict criteria, were all phospholipids. PC isthe most abundant and PE the second most abundantphospholipid in mammalian cells [47]. PE and phosphati-dylserine (PS) are aminophospholipids, and because oftheir negative charge, they are localized in the inner leafleton the plasma membrane. Neutrally charged PC andsphingomyelin localize on the outer leaflet [48, 49]. As aresponse to stimulus, cytoskeleton is reorganized and theasymmetric distribution of the phospholipid membrane ismodified with exposure of PS and PE at the cell surface. Cel-lular blebbing then occurs, ultimately leading to the release
of microparticles (MPs) [50, 51]. MPs originate from severalcell types such as leukocytes, erythrocytes, platelets, or endo-thelial cells. They have been implicated in the pathophysiol-ogy of a range of diseases, including infectious diseases [49].Also, a major role has been suggested for MPs in propagatingproinflammatory and proanticoagulant activity in sepsis [50].
PE is abundantly present on the outer surface of mamma-lian MPs of a variety of human cells, and PE provides a sen-sitive molecular marker for detecting and characterizing MPs[50]. Clark et al. [48] studied more specifically activatedhuman platelets and found that they externalize two PSsand five PEs: PS(18:0a/20:4), PS(18:0a/18:1), PE(16:0p/20:4), PE(18:0a/18:0), PE(18:1p/20:4), PE(18:0p/20:4), andPE(18:0a/20:4). These are also present in MPs from activatedplatelets. PS is required for coagulation to take place, and PEcan further enhance these reactions. As the acyl-chain lengthof PE is an essential determinant of this enhancing effect tothrombin generation with PS, the most effective PE wasfound to be PE(18:0/20:4).
One of the major findings in our study was the positiveassociation of PE(18:0/20:4) with the development of
Table 4: Influence of complicated course of fever to androsterone sulfate (ADTS)/dihydrotestosterone sulfate (DHTS).
Men with complication Men without complication p values
ADTS/DHTS d0 12.6× 10⁴ (7.9–14× 104) 4.9× 10⁴ (3.6-7.8× 10⁴) <0.001ADTS/DHTS d1 12.6× 10⁴ (8.3–14× 104) 5.7× 10⁴ (3.6–8.8× 10⁴) 0.001
Women with complication Women without complication
ADTS/DHTS d0 6.8× 10⁴ (4.2–6.8× 10⁴) 2.5× 10⁴ (2.0–4.3× 10⁴) 0.045
ADTS/DHTS d1 7.0× 10⁴ (1.9–13× 104) 2.9× 10⁴ (2.5–4.0× 10⁴) 0.322
Data are expressed as medians (interquartile ranges).
Table 5: Influence of age to androsterone sulfate (ADTS)/dihydrotestosterone sulfate (DHTS).
Men under 50 years Men over 50 years p values
ADTS/DHTS d0 8.5× 10⁴ (5.6–13× 104) 5.9× 10⁴ (3.7–9.3× 10⁴) 0.085
ADTS/DHTS d1 10× 104 (6.2–12× 104) 6.4× 10⁴ (3.6–10.2× 10⁴) 0.121
Women under 50 years Women over 50 years
ADTS/DHTS d0 5.9× 10⁴ (3.5–13.7× 10⁴) 2.5× 10⁴ (2.0–4.0× 10⁴) 0.068
ADTS/DHTS d1 8.5× 10⁴ (2.8–14.5× 10⁴) 2.9× 10⁴ (2.4–4.1× 10⁴) 0.144
Data are expressed as medians (interquartile ranges).
Cholesterol DHEAS
Pregnenolone 17OH Pregnenolone
DHEA Androstenediol(5-diol)
Progesterone 17OH Progesterone
Androstene (Δ4, Δ5)
Testosterone Estradiol
Dihydroprogesterone 17OHDihydroprogesterone
Androstanedione Dihydrotestosterone
Allopregnanolone 17OH Allopregnanolone
�훼,3�훼 Androsterone Androstanediol
Δ5
Δ4
5�훼
5�훼, 3�훼
Figure 3: Schematic representation for the metabolite route of testosterone and dihydrotestosterone. Front door pathway (Δ4 and Δ5 viatestosterone) and the backdoor pathway (5α and 5α, 3α routes not via testosterone). Modified from Fukami et al. [32] and Luu-The [31].
13Disease Markers
complicated course of neutropenic sepsis. Previously,PE(18:0/20:4) was found to be one of the relevant phospho-lipids to detectMPs, but the context with clinical data of sepsishas been unsettled. The studies of Larson et al. [51] and Clarket al. [48] were performed in vitro, and there are no studies onPE as predictors on sepsis or neutropenic sepsis in humans.
Changes in the plasma phospholipid profile have beenfound in sepsis. Previously, Rival et al. [52] observed lowertotal concentrations of phospholipids in septic patients com-pared to the reference values. This decrease concernedmainly n-6 and n-3 polyunsaturated fatty acids, especiallythose with a carbon number ≥ 20, which was associated withmortality. Also in patients with ARDS, a significant decreasein the levels of various fatty acids especially in the polysatu-rated fatty acids (PUFA) including docosahexaenoic acid(DHA, 22:6n3) has been found. DHA levels were decreasedalso in patients who were at risk of ARDS [53]. In the experi-mental study, DHA and eicosapentaenoic acid (EPA, 20:5n3)decreased lipopolysaccharide-induced nuclear factor-kappaBactivation and monocyte chemoattractant protein-1 produc-tion and increased peroxisome proliferator-activated receptormRNA expression [54]. The decrease in PUFAs has beenassumed to be due to their degeneration by reactive oxygenspecies or a higher synthesis of inflammatory lipid mediatorsbecause these PUFAs are the precursors of eicosanoids anddocosanoids, which are involved in inflammation, vasomotri-city, and capillary permeability [52].
5. Conclusion
Although nontargeted metabolite profiling is a hypothesis-generating method, these results already provide a newinsight into metabolite markers to differentiate between non-complicated and complicated courses of febrile neutropenia.Our study represents the largest study in this patient popula-tion, even though the relatively low number of patientsreduces the statistical power of the results.
Our findings are consistent with previously publisheddata about citrulline and phospholipids. The current findingsare clinically relevant when compared with CRP and PCT,which are widely used biomarkers in febrile neutropenia.Most of the previous studies are performed in animals orin vitro in contrast to our prospective clinical study, whichhighlights the importance of current findings.
The pathways of androgen metabolism merit furtherstudies in patients with febrile neutropenia. The results arepreliminary and suggest metabolic changes in patients withcomplicated febrile neutropenia. Further targeted tests toidentify and confirm these changes are needed. The wholepathway of metabolites of steroid synthesis in the adrenalgland should be quantified. If specific, consistent metabolitechanges can be identified, a routine laboratory-compatiblemethod may be developed.
Ethical Approval
This study is conducted according to the principles expressedin the Declaration of Helsinki and was approved by the localethics committee (100/2006).
Consent
All patients gave a written informed consent at theenrollment.
Conflicts of Interest
The authors declare that they have no conflict of interest inrelation to the work described.
Acknowledgments
The authors acknowledge Ms. Miia Reponen for skillfultechnical assistance in LC-MS analyses, and the technicalassistance of Ms. Raija Isomäki and Anu Holopainen,MSc, is gratefully acknowledged. The study was financiallysupported by a study grant from the North Savo HospitalDistrict (VTR). Financial support from Biocenter Finlandand Academy of Finland is acknowledged.
Supplementary Materials
Supplementary Figure: principal component analysis ofthe molecular features collected at four analytical modesof liquid chromatography-mass spectrometry analysis.(Supplementary Materials)
References
[1] O. Penack, C. Becker, D. Buchheidt et al., “Management ofsepsis in neutropenic patients: 2014 updated guidelines fromthe Infectious Diseases Working Party of the German Societyof Hematology and Medical Oncology (AGIHO),” Annals ofHematology, vol. 93, no. 7, pp. 1083–1095, 2014.
[2] K. A. Thursky and L. J. Worth, “Can mortality of cancerpatients with fever and neutropenia be improved?,” CurrentOpinion in Infectious Diseases, vol. 28, no. 6, pp. 505–513,2015.
[3] S. Hämäläinen, T. Kuittinen, I. Matinlauri, T. Nousiainen,I. Koivula, and E. Jantunen, “Neutropenic fever and severe sep-sis in adult acute myeloid leukemia (AML) patients receivingintensive chemotherapy: causes and consequences,” Leukemia& Lymphoma, vol. 49, no. 3, pp. 495–501, 2008.
[4] S. Hämäläinen, A. Juutilainen, I. Matinlauri et al., “Serum vas-cular endothelial growth factor in adult haematologicalpatients with neutropenic fever: a comparison with C-reactive protein,” European Journal of Haematology, vol. 83,no. 3, pp. 251–257, 2009.
[5] C. Pierrakos and J. L. Vincent, “Sepsis biomarkers: a review,”Critical Care, vol. 14, no. 1, article R15, 2010.
[6] I. Koivula, S. Hämäläinen, E. Jantunen et al., “Elevated procal-citonin predicts gram-negative sepsis in haematologicalpatients with febrile neutropenia,” Scandinavian Journal ofInfectious Diseases, vol. 43, no. 6-7, pp. 471–478, 2011.
[7] C. H. Johnson, J. Ivanisevic, and G. Siuzdak, “Metabolomics:beyond biomarkers and towards mechanisms,” NatureReviews Molecular Cell Biology, vol. 17, no. 7, pp. 451–459,2016.
[8] V. D. de Mello, J. Paananen, J. Lindström et al., “Indolepropio-nic acid and novel lipid metabolites are associated with a lower
14 Disease Markers
risk of type 2 diabetes in the Finnish Diabetes PreventionStudy,” Scientific Reports, vol. 7, article 46337, 2017.
[9] M. Kiehntopf, D. Schmerler, F. M. Brunkhorst et al., “Massspectometry-based protein patterns in the diagnosis of sep-sis/systemic inflammatory response syndrome,” Shock,vol. 36, no. 6, pp. 560–569, 2011.
[10] D. Schmerler, S. Neugebauer, K. Ludewig, S. Bremer-Streck,F. M. Brunkhorst, and M. Kiehntopf, “Targeted metabolomicsfor discrimination of systemic inflammatory disorders in crit-ically ill patients,” Journal of Lipid Research, vol. 53, no. 7,pp. 1369–1375, 2012.
[11] L. Su, Y. Huang, Y. Zhu et al., “Discrimination of sepsis stagemetabolic profiles with an LC/MS-MS-based metabolomicsapproach,” BMJ Open Respiratory Research, vol. 1, no. 1, articlee000056, 2014.
[12] S. Neugebauer, E. J. Giamarellos-Bourboulis, A. Pelekanouet al., “Metabolite profiles in sepsis: developing prognostictools based on the type of infection,” Critical Care Medicine,vol. 44, no. 9, pp. 1649–1662, 2016.
[13] M. Garcia-Simon, J. M. Morales, V. Modesto-Alapont et al.,“Prognosis biomarkers of severe sepsis and septic shock by1H NMR urine metabolomics in the intensive care unit,” PLoSOne, vol. 10, no. 11, article e0140993, 2015.
[14] M. Ferrario, A. Cambiaghi, L. Brunelli et al., “Mortality predic-tion in patients with severe septic shock: a pilot study using atarget metabolomics approach,” Scientific Reports, vol. 6,no. 1, article 20391, 2016.
[15] Z. Liu, P. Yin, R. Amathieu, P. Savarin, and G. Xu, “Applica-tion of LC-MS-based metabolomics method in differentiatingseptic survivors from non-survivors,”Analytical and Bioanaly-tical Chemistry, vol. 408, no. 27, pp. 7641–7649, 2016.
[16] M. E. Richter, S. Neugebauer, F. Engelmann et al., “Biomarkercandidates for the detection of an infectious etiology of febrileneutropenia,” Infection, vol. 44, no. 2, pp. 175–186, 2016.
[17] W. T. Hughes, D. Armstrong, G. P. Bodey et al., “2002 guide-lines for the use of antimicrobial agents in neutropenicpatients with cancer,” Clinical Infectious Diseases, vol. 34,no. 6, pp. 730–751, 2002.
[18] R. C. Bone, R. A. Balk, F. B. Cerra et al., “Definitions forsepsis and organ failure and guidelines for the use of inno-vative therapies in sepsis,” Chest, vol. 101, no. 6, pp. 1644–1655, 1992.
[19] M. Singer, C. S. Deutschman, C. W. Seymour et al., “The thirdinternational consensus definitions for sepsis and septic shock(Sepsis-3),” JAMA, vol. 315, no. 8, pp. 801–810, 2016.
[20] K. Hanhineva, M. A. Lankinen, A. Pedret et al., “Nontargetedmetabolite profiling discriminates diet-specific biomarkersfor consumption of whole grains, fatty fish, and bilberries ina randomized controlled trial,” The Journal of Nutrition,vol. 145, no. 1, pp. 7–17, 2015.
[21] Y. Benjamini and Y. Hochberg, “Controlling the false discov-ery rate: a practical and powerful approach to multiple test-ing,” Journal of the Royal Statistical Society Series BMethodological, vol. 57, no. 1, pp. 289–300, 1995.
[22] M. Sugimoto, M. Kawakami, M. Robert, T. Soga, andM. Tomita, “Bioinformatics tools for mass spectroscopy-based metabolomic data processing and analysis,” CurrentBioinformatics, vol. 7, no. 1, pp. 96–108, 2012.
[23] R. G. Brereton and G. R. Lloyd, “Partial least squares discrim-inant analysis: taking the magic away,” Journal of Chemo-metrics, vol. 28, no. 4, pp. 213–225, 2014.
[24] C. A. Smith, G. O’Maille, E. J. Want et al., “METLIN: a metab-olite mass spectral database,” Therapeutic Drug Monitoring,vol. 27, no. 6, pp. 747–751, 2005.
[25] D. S. Wishart, T. Jewison, A. C. Guo et al., “HMDB 3.0–thehumanmetabolome database in 2013,”Nucleic Acids Research,vol. 41, no. D1, pp. D801–D807, 2013.
[26] E. Fahy, M. Sud, D. Cotter, and S. Subramaniam, “LIPIDMAPS online tools for lipid research,” Nucleic Acids Research,vol. 35, Supplement 2, pp. W606–W612, 2007.
[27] Y. Q. Xia andM. Jemal, “Phospholipids in liquid chromatogra-phy/mass spectrometry bioanalysis: comparison of three tan-dem mass spectrometric techniques for monitoring plasmaphospholipids, the effect of mobile phase composition onphospholipids elution and the association of phospholipidswith matrix effects,” Rapid Communications in Mass Spec-trometry, vol. 23, no. 14, pp. 2125–2138, 2009.
[28] R. C. Murphy and P. H. Axelsen, “Mass spectrometric analysisof long-chain lipids,”Mass Spectrometry Reviews, vol. 30, no. 4,pp. 579–599, 2011.
[29] K. Homma, T. Hasegawa, T. Nagai et al., “Urine steroid hor-mone profile analysis in cytochrome P450 oxidoreductase defi-ciency: implication for the backdoor pathway todihydrotestosterone,” The Journal of Clinical Endocrinology& Metabolism, vol. 91, no. 7, pp. 2643–2649, 2006.
[30] F. Labrie, A. Bélanger, J. Simard, and L. C. Van Luu-The,“DHEA and peripheral androgen and estrogen formation:intracrinology,” Annals of the New York Academy of Sciences,vol. 774, no. 1, pp. 16–28, 1995.
[31] V. Luu-The, “Assessment of steroidogenesis and steroidogenicenzyme functions,” The Journal of Steroid Biochemistry andMolecular Biology, vol. 137, pp. 176–182, 2013.
[32] M. Fukami, K. Homma, T. Hasegawa, and T. Ogata, “Back-door pathway for dihydrotestosterone biosynthesis: implica-tions for normal and abnormal human sex development,”Developmental Dynamics, vol. 242, no. 4, pp. 320–329, 2013.
[33] M. Schmidt, M. Kreutz, G. Löffler, J. Schölmerich, and R. H.Straub, “Conversion of dehydroepiandrosterone to down-stream steroid hormones in macrophages,” Journal of Endocri-nology, vol. 164, no. 2, pp. 161–169, 2000.
[34] E. D. Lephart, C. R. Baxter, and C. R. Parker Jr, “Effect of burntrauma on adrenal and testicular steroid hormone produc-tion,” The Journal of Clinical Endocrinology & Metabolism,vol. 64, no. 4, pp. 842–848, 1987.
[35] C. E. Wade, J. S. Lindberg, J. L. Cockrell et al., “Upon-admission adrenal steroidogenesis is adapted to the degreeof illness in intensive care unit patients,” The Journal ofClinical Endocrinology & Metabolism, vol. 67, no. 2,pp. 223–227, 1988.
[36] P. Luppa, R. Munker, D. Nagel, M. Weber, and D. Engelhardt,“Serum androgens in intensive-care patients: correlations withclinical findings,” Clinical Endocrinology, vol. 34, no. 4,pp. 305–310, 1991.
[37] C. P. Schneider, M. G. Schwacha, T. S. A. Samy, K. I. Bland,and I. H. Chaudry, “Androgen-mediated modulation of mac-rophage function after trauma-hemorrhage: central role of5α-dihydrotestosterone,” Journal of Applied Physiology,vol. 95, no. 1, pp. 104–112, 2003.
[38] M. Frink, Y. C. Hsieh, S. Hu et al., “Mechanism of salutaryeffects of finasteride on post-traumatic immune/inflammatoryresponse: upregulation of estradiol synthesis,” Annals of Sur-gery, vol. 246, no. 5, pp. 836–843, 2007.
15Disease Markers
[39] M.W. A. Angstwurm, R. Gaertner, and J. Schopohl, “Outcomein elderly patients with severe infection is influenced by sexhormones but not gender,” Critical Care Medicine, vol. 33,no. 12, pp. 2786–2793, 2005.
[40] J. Schröder, V. Kahlke, K. H. Staubach, P. Zabel, and F. Stüber,“Gender differences in human sepsis,” Archives of Surgery,vol. 133, no. 11, pp. 1200–1205, 1998.
[41] M. K. Angele, S. Pratschke, W. J. Hubbard, and I. H. Chaudry,“Gender differences in sepsis: cardiovascular and immunolog-ical aspects,” Virulence, vol. 5, no. 1, pp. 12–19, 2014.
[42] G. Piton and G. Capellier, “Biomarkers of gut barrier failure inthe ICU,” Current Opinion in Critical Care, vol. 22, no. 2,pp. 152–160, 2016.
[43] G. Piton, C. Manzon, E. Monnet et al., “Plasma citrulline kinet-ics and prognostic value in critically ill patients,” IntensiveCare Medicine, vol. 36, no. 4, pp. 702–706, 2010.
[44] P. Crenn, N. Neveux, S. Chevret et al., “Plasma L-citrullineconcentrations and its relationship with inflammation at theonset of septic shock: a pilot study,” Journal of Critical Care,vol. 29, no. 2, pp. 315.e1–315.e6, 2014.
[45] A. H. E. Herbers, N. M. A. Blijlevens, J. P. Donnelly, and T. J.M. de Witte, “Bacteraemia coincides with low citrulline con-centrations after high-dose melphalan in autologous HSCTrecipients,” Bone Marrow Transplantation, vol. 42, no. 5,pp. 345–349, 2008.
[46] L. B. Ware, J. A. Magarik, N. Wickersham et al., “Low plasmacitrulline levels are associated with acute respiratory distresssyndrome in patients with severe sepsis,” Critical Care,vol. 17, no. 1, article R10, 2013.
[47] J. E. Vance and G. Tasseva, “Formation and function of phos-phatidylserine and phosphatidylethanolamine in mammaliancells,” Biochimica et Biophysica Acta (BBA) – Molecular andCell Biology of Lipids, vol. 1831, no. 3, pp. 543–554, 2013.
[48] S. R. Clark, C. P. Thomas, V. J. Hammond et al., “Characteri-zation of platelet aminophospholipid externalization revealsfatty acids as molecular determinants that regulate coagula-tion,” Proceedings of the National Academy of Sciences of theUnited States of America, vol. 110, no. 15, pp. 5875–5880, 2013.
[49] F. Cognasse, H. Hamzeh-Cognasse, S. Laradi et al., “The role ofmicroparticles in inflammation and transfusion: a concisereview,” Transfusion and Apheresis Science, vol. 53, no. 2,pp. 159–167, 2015.
[50] F. Meziani, X. Delabranche, P. Asfar, and F. Toti, “Bench-to-bedside review: circulating microparticles - a new player insepsis?,” Critical Care, vol. 14, no. 5, p. 236, 2010.
[51] M. C. Larson, J. E. Woodliff, C. A. Hillery, T. J. Kearl, andM. Zhao, “Phosphatidylethanolamine is externalized at thesurface of microparticles,” Biochimica et Biophysica Acta(BBA) – Molecular and Cell Biology of Lipids, vol. 1821,no. 12, pp. 1501–1507, 2012.
[52] T. Rival, C. Cinq-Frais, S. Silva-Sifontes et al., “Alteration ofplasma phospholipid fatty acid profile in patients with septicshock,” Biochimie, vol. 95, no. 11, pp. 2177–2181, 2013.
[53] K. V. Kumar, S. M. Rao, R. Gayani, I. K. Mohan, and M. U. R.Naidu, “Oxidant stress and essential fatty acids in patients withrisk and established ARDS,” Clinica Chimica Acta, vol. 298,no. 1-2, pp. 111–120, 2000.
[54] H. Li, X. Z. Ruan, S. H. Powis et al., “EPA and DHA reduceLPS-induced inflammation responses in HK-2 cells: evidencefor a PPAR-γ–dependent mechanism,” Kidney International,vol. 67, no. 3, pp. 867–874, 2005.
16 Disease Markers
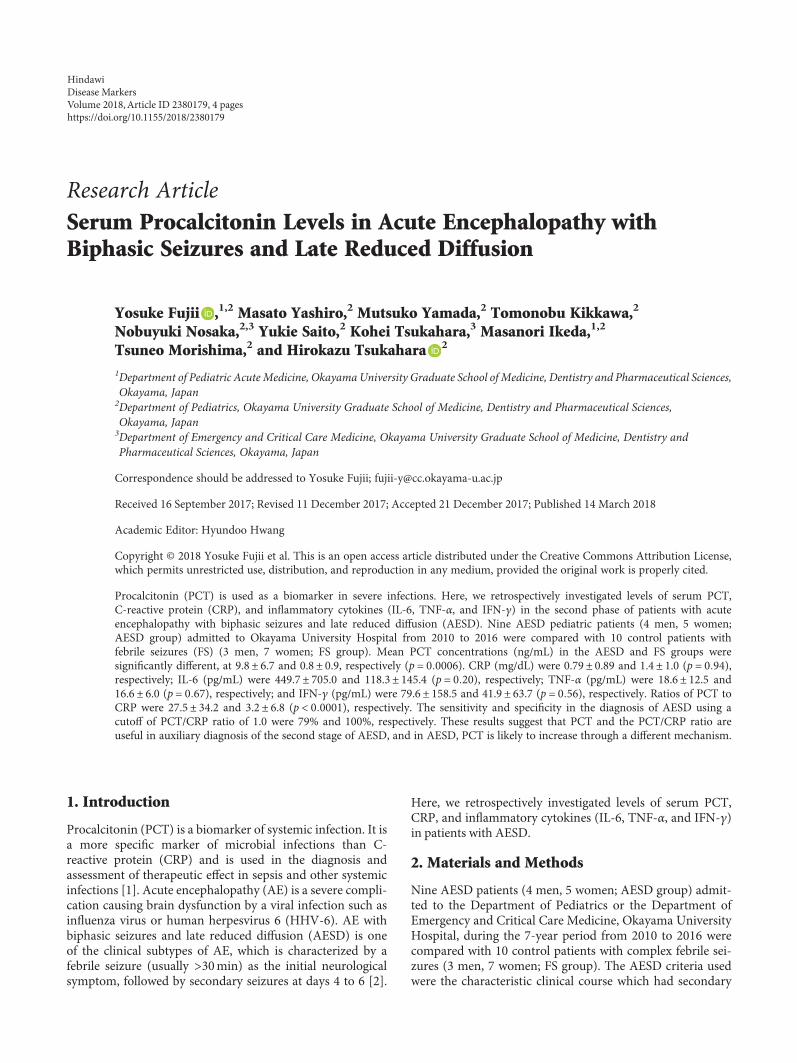
Research ArticleSerum Procalcitonin Levels in Acute Encephalopathy withBiphasic Seizures and Late Reduced Diffusion
Yosuke Fujii ,1,2 Masato Yashiro,2 Mutsuko Yamada,2 Tomonobu Kikkawa,2
Nobuyuki Nosaka,2,3 Yukie Saito,2 Kohei Tsukahara,3 Masanori Ikeda,1,2
Tsuneo Morishima,2 and Hirokazu Tsukahara 2
1Department of Pediatric Acute Medicine, OkayamaUniversity Graduate School of Medicine, Dentistry and Pharmaceutical Sciences,Okayama, Japan2Department of Pediatrics, Okayama University Graduate School of Medicine, Dentistry and Pharmaceutical Sciences,Okayama, Japan3Department of Emergency and Critical Care Medicine, Okayama University Graduate School of Medicine, Dentistry andPharmaceutical Sciences, Okayama, Japan
Correspondence should be addressed to Yosuke Fujii; [email protected]
Received 16 September 2017; Revised 11 December 2017; Accepted 21 December 2017; Published 14 March 2018
Academic Editor: Hyundoo Hwang
Copyright © 2018 Yosuke Fujii et al. This is an open access article distributed under the Creative Commons Attribution License,which permits unrestricted use, distribution, and reproduction in any medium, provided the original work is properly cited.
Procalcitonin (PCT) is used as a biomarker in severe infections. Here, we retrospectively investigated levels of serum PCT,C-reactive protein (CRP), and inflammatory cytokines (IL-6, TNF-α, and IFN-γ) in the second phase of patients with acuteencephalopathy with biphasic seizures and late reduced diffusion (AESD). Nine AESD pediatric patients (4 men, 5 women;AESD group) admitted to Okayama University Hospital from 2010 to 2016 were compared with 10 control patients withfebrile seizures (FS) (3 men, 7 women; FS group). Mean PCT concentrations (ng/mL) in the AESD and FS groups weresignificantly different, at 9.8± 6.7 and 0.8± 0.9, respectively (p = 0 0006). CRP (mg/dL) were 0.79± 0.89 and 1.4± 1.0 (p = 0 94),respectively; IL-6 (pg/mL) were 449.7± 705.0 and 118.3± 145.4 (p = 0 20), respectively; TNF-α (pg/mL) were 18.6± 12.5 and16.6± 6.0 (p = 0 67), respectively; and IFN-γ (pg/mL) were 79.6± 158.5 and 41.9± 63.7 (p = 0 56), respectively. Ratios of PCT toCRP were 27.5± 34.2 and 3.2± 6.8 (p < 0 0001), respectively. The sensitivity and specificity in the diagnosis of AESD using acutoff of PCT/CRP ratio of 1.0 were 79% and 100%, respectively. These results suggest that PCT and the PCT/CRP ratio areuseful in auxiliary diagnosis of the second stage of AESD, and in AESD, PCT is likely to increase through a different mechanism.
1. Introduction
Procalcitonin (PCT) is a biomarker of systemic infection. It isa more specific marker of microbial infections than C-reactive protein (CRP) and is used in the diagnosis andassessment of therapeutic effect in sepsis and other systemicinfections [1]. Acute encephalopathy (AE) is a severe compli-cation causing brain dysfunction by a viral infection such asinfluenza virus or human herpesvirus 6 (HHV-6). AE withbiphasic seizures and late reduced diffusion (AESD) is oneof the clinical subtypes of AE, which is characterized by afebrile seizure (usually >30min) as the initial neurologicalsymptom, followed by secondary seizures at days 4 to 6 [2].
Here, we retrospectively investigated levels of serum PCT,CRP, and inflammatory cytokines (IL-6, TNF-α, and IFN-γ)in patients with AESD.
2. Materials and Methods
Nine AESD patients (4 men, 5 women; AESD group) admit-ted to the Department of Pediatrics or the Department ofEmergency and Critical Care Medicine, Okayama UniversityHospital, during the 7-year period from 2010 to 2016 werecompared with 10 control patients with complex febrile sei-zures (3 men, 7 women; FS group). The AESD criteria usedwere the characteristic clinical course which had secondary
HindawiDisease MarkersVolume 2018, Article ID 2380179, 4 pageshttps://doi.org/10.1155/2018/2380179
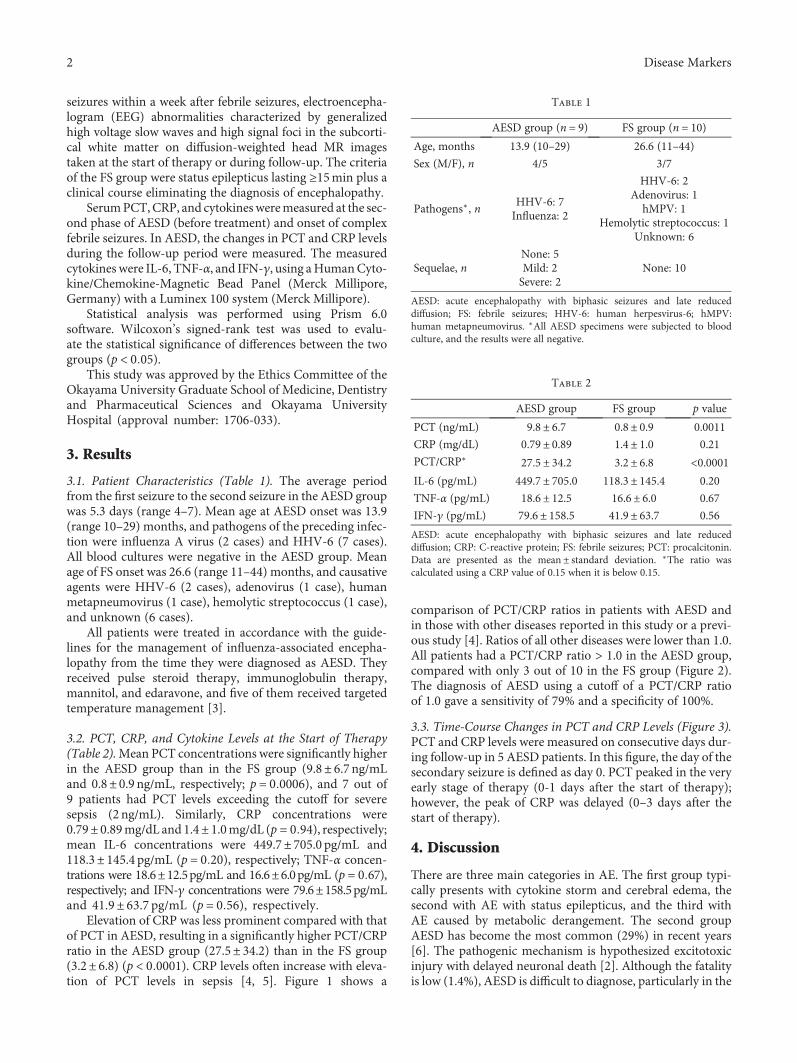
seizures within a week after febrile seizures, electroencepha-logram (EEG) abnormalities characterized by generalizedhigh voltage slow waves and high signal foci in the subcorti-cal white matter on diffusion-weighted head MR imagestaken at the start of therapy or during follow-up. The criteriaof the FS group were status epilepticus lasting ≥15min plus aclinical course eliminating the diagnosis of encephalopathy.
SerumPCT,CRP, and cytokinesweremeasured at the sec-ond phase of AESD (before treatment) and onset of complexfebrile seizures. In AESD, the changes in PCT and CRP levelsduring the follow-up period were measured. The measuredcytokines were IL-6, TNF-α, and IFN-γ, using aHumanCyto-kine/Chemokine-Magnetic Bead Panel (Merck Millipore,Germany) with a Luminex 100 system (Merck Millipore).
Statistical analysis was performed using Prism 6.0software. Wilcoxon’s signed-rank test was used to evalu-ate the statistical significance of differences between the twogroups (p < 0 05).
This study was approved by the Ethics Committee of theOkayama University Graduate School of Medicine, Dentistryand Pharmaceutical Sciences and Okayama UniversityHospital (approval number: 1706-033).
3. Results
3.1. Patient Characteristics (Table 1). The average periodfrom the first seizure to the second seizure in the AESD groupwas 5.3 days (range 4–7). Mean age at AESD onset was 13.9(range 10–29) months, and pathogens of the preceding infec-tion were influenza A virus (2 cases) and HHV-6 (7 cases).All blood cultures were negative in the AESD group. Meanage of FS onset was 26.6 (range 11–44) months, and causativeagents were HHV-6 (2 cases), adenovirus (1 case), humanmetapneumovirus (1 case), hemolytic streptococcus (1 case),and unknown (6 cases).
All patients were treated in accordance with the guide-lines for the management of influenza-associated encepha-lopathy from the time they were diagnosed as AESD. Theyreceived pulse steroid therapy, immunoglobulin therapy,mannitol, and edaravone, and five of them received targetedtemperature management [3].
3.2. PCT, CRP, and Cytokine Levels at the Start of Therapy(Table 2).Mean PCT concentrations were significantly higherin the AESD group than in the FS group (9.8± 6.7 ng/mLand 0.8± 0.9 ng/mL, respectively; p = 0 0006), and 7 out of9 patients had PCT levels exceeding the cutoff for severesepsis (2 ng/mL). Similarly, CRP concentrations were0.79± 0.89mg/dL and 1.4± 1.0mg/dL (p = 0 94), respectively;mean IL-6 concentrations were 449.7± 705.0 pg/mL and118.3± 145.4 pg/mL (p = 0 20), respectively; TNF-α concen-trations were 18.6±12.5pg/mL and 16.6±6.0pg/mL (p = 0 67),respectively; and IFN-γ concentrations were 79.6±158.5pg/mLand 41.9± 63.7 pg/mL (p = 0 56), respectively.
Elevation of CRP was less prominent compared with thatof PCT in AESD, resulting in a significantly higher PCT/CRPratio in the AESD group (27.5± 34.2) than in the FS group(3.2± 6.8) (p < 0 0001). CRP levels often increase with eleva-tion of PCT levels in sepsis [4, 5]. Figure 1 shows a
comparison of PCT/CRP ratios in patients with AESD andin those with other diseases reported in this study or a previ-ous study [4]. Ratios of all other diseases were lower than 1.0.All patients had a PCT/CRP ratio > 1.0 in the AESD group,compared with only 3 out of 10 in the FS group (Figure 2).The diagnosis of AESD using a cutoff of a PCT/CRP ratioof 1.0 gave a sensitivity of 79% and a specificity of 100%.
3.3. Time-Course Changes in PCT and CRP Levels (Figure 3).PCT and CRP levels were measured on consecutive days dur-ing follow-up in 5 AESD patients. In this figure, the day of thesecondary seizure is defined as day 0. PCT peaked in the veryearly stage of therapy (0-1 days after the start of therapy);however, the peak of CRP was delayed (0–3 days after thestart of therapy).
4. Discussion
There are three main categories in AE. The first group typi-cally presents with cytokine storm and cerebral edema, thesecond with AE with status epilepticus, and the third withAE caused by metabolic derangement. The second groupAESD has become the most common (29%) in recent years[6]. The pathogenic mechanism is hypothesized excitotoxicinjury with delayed neuronal death [2]. Although the fatalityis low (1.4%), AESD is difficult to diagnose, particularly in the
Table 1
AESD group (n = 9) FS group (n = 10)Age, months 13.9 (10–29) 26.6 (11–44)
Sex (M/F), n 4/5 3/7
Pathogens∗, nHHV-6: 7Influenza: 2
HHV-6: 2Adenovirus: 1hMPV: 1
Hemolytic streptococcus: 1Unknown: 6
Sequelae, nNone: 5Mild: 2Severe: 2
None: 10
AESD: acute encephalopathy with biphasic seizures and late reduceddiffusion; FS: febrile seizures; HHV-6: human herpesvirus-6; hMPV:human metapneumovirus. ∗All AESD specimens were subjected to bloodculture, and the results were all negative.
Table 2
AESD group FS group p value
PCT (ng/mL) 9.8± 6.7 0.8± 0.9 0.0011
CRP (mg/dL) 0.79± 0.89 1.4± 1.0 0.21
PCT/CRP∗ 27.5± 34.2 3.2± 6.8 <0.0001IL-6 (pg/mL) 449.7± 705.0 118.3± 145.4 0.20
TNF-α (pg/mL) 18.6± 12.5 16.6± 6.0 0.67
IFN-γ (pg/mL) 79.6± 158.5 41.9± 63.7 0.56
AESD: acute encephalopathy with biphasic seizures and late reduceddiffusion; CRP: C-reactive protein; FS: febrile seizures; PCT: procalcitonin.Data are presented as the mean ± standard deviation. ∗The ratio wascalculated using a CRP value of 0.15 when it is below 0.15.
2 Disease Markers
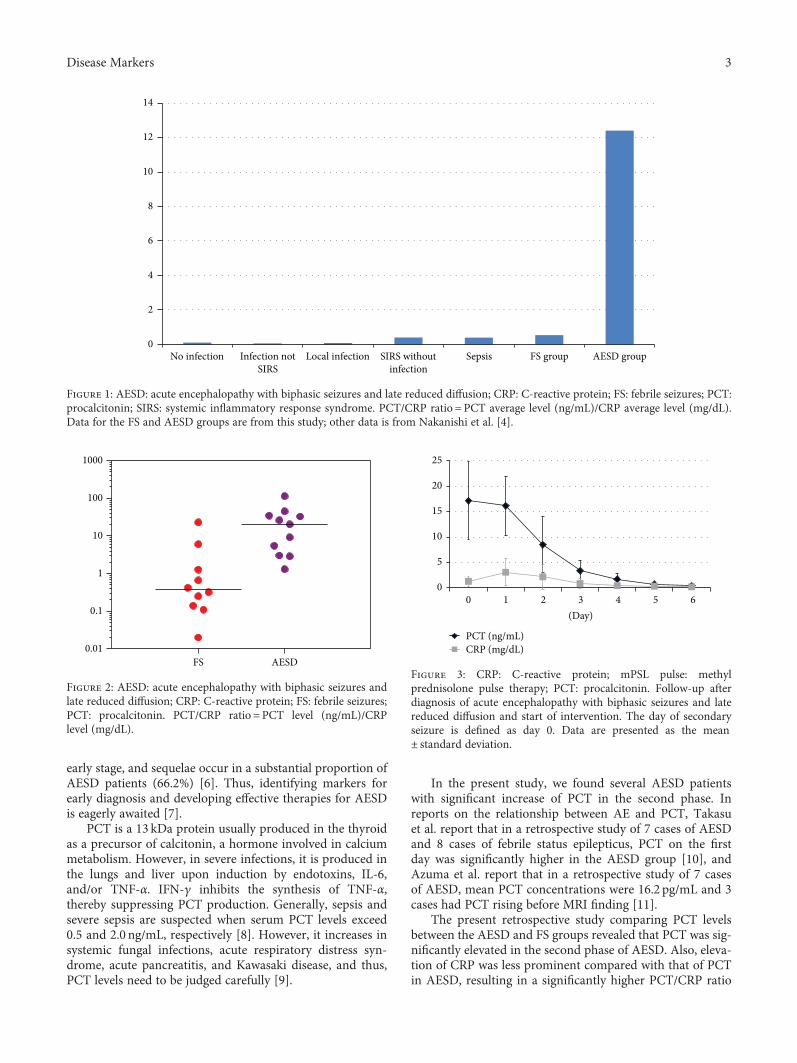
early stage, and sequelae occur in a substantial proportion ofAESD patients (66.2%) [6]. Thus, identifying markers forearly diagnosis and developing effective therapies for AESDis eagerly awaited [7].
PCT is a 13 kDa protein usually produced in the thyroidas a precursor of calcitonin, a hormone involved in calciummetabolism. However, in severe infections, it is produced inthe lungs and liver upon induction by endotoxins, IL-6,and/or TNF-α. IFN-γ inhibits the synthesis of TNF-α,thereby suppressing PCT production. Generally, sepsis andsevere sepsis are suspected when serum PCT levels exceed0.5 and 2.0 ng/mL, respectively [8]. However, it increases insystemic fungal infections, acute respiratory distress syn-drome, acute pancreatitis, and Kawasaki disease, and thus,PCT levels need to be judged carefully [9].
In the present study, we found several AESD patientswith significant increase of PCT in the second phase. Inreports on the relationship between AE and PCT, Takasuet al. report that in a retrospective study of 7 cases of AESDand 8 cases of febrile status epilepticus, PCT on the firstday was significantly higher in the AESD group [10], andAzuma et al. report that in a retrospective study of 7 casesof AESD, mean PCT concentrations were 16.2 pg/mL and 3cases had PCT rising before MRI finding [11].
The present retrospective study comparing PCT levelsbetween the AESD and FS groups revealed that PCT was sig-nificantly elevated in the second phase of AESD. Also, eleva-tion of CRP was less prominent compared with that of PCTin AESD, resulting in a significantly higher PCT/CRP ratio
AESD groupFS groupSepsisLocal infectionNo infection
14
12
10
8
6
4
2
0Infection not
SIRSSIRS without
infection
Figure 1: AESD: acute encephalopathy with biphasic seizures and late reduced diffusion; CRP: C-reactive protein; FS: febrile seizures; PCT:procalcitonin; SIRS: systemic inflammatory response syndrome. PCT/CRP ratio = PCT average level (ng/mL)/CRP average level (mg/dL).Data for the FS and AESD groups are from this study; other data is from Nakanishi et al. [4].
1000
100
10
1
0.01FS AESD
0.1
Figure 2: AESD: acute encephalopathy with biphasic seizures andlate reduced diffusion; CRP: C-reactive protein; FS: febrile seizures;PCT: procalcitonin. PCT/CRP ratio = PCT level (ng/mL)/CRPlevel (mg/dL).
0
5
10
15
20
25
0 1 2 3 4 5 6
PCT (ng/mL)CRP (mg/dL)
(Day)
Figure 3: CRP: C-reactive protein; mPSL pulse: methylprednisolone pulse therapy; PCT: procalcitonin. Follow-up afterdiagnosis of acute encephalopathy with biphasic seizures and latereduced diffusion and start of intervention. The day of secondaryseizure is defined as day 0. Data are presented as the mean± standard deviation.
3Disease Markers
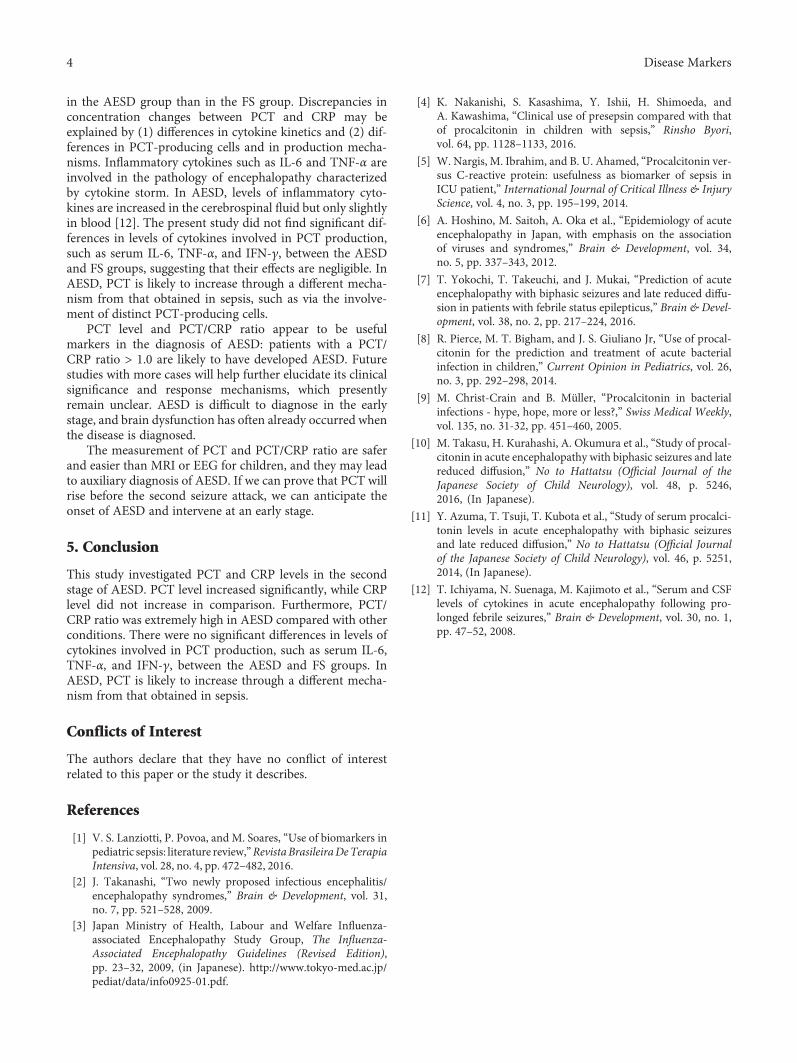
in the AESD group than in the FS group. Discrepancies inconcentration changes between PCT and CRP may beexplained by (1) differences in cytokine kinetics and (2) dif-ferences in PCT-producing cells and in production mecha-nisms. Inflammatory cytokines such as IL-6 and TNF-α areinvolved in the pathology of encephalopathy characterizedby cytokine storm. In AESD, levels of inflammatory cyto-kines are increased in the cerebrospinal fluid but only slightlyin blood [12]. The present study did not find significant dif-ferences in levels of cytokines involved in PCT production,such as serum IL-6, TNF-α, and IFN-γ, between the AESDand FS groups, suggesting that their effects are negligible. InAESD, PCT is likely to increase through a different mecha-nism from that obtained in sepsis, such as via the involve-ment of distinct PCT-producing cells.
PCT level and PCT/CRP ratio appear to be usefulmarkers in the diagnosis of AESD: patients with a PCT/CRP ratio > 1.0 are likely to have developed AESD. Futurestudies with more cases will help further elucidate its clinicalsignificance and response mechanisms, which presentlyremain unclear. AESD is difficult to diagnose in the earlystage, and brain dysfunction has often already occurred whenthe disease is diagnosed.
The measurement of PCT and PCT/CRP ratio are saferand easier than MRI or EEG for children, and they may leadto auxiliary diagnosis of AESD. If we can prove that PCT willrise before the second seizure attack, we can anticipate theonset of AESD and intervene at an early stage.
5. Conclusion
This study investigated PCT and CRP levels in the secondstage of AESD. PCT level increased significantly, while CRPlevel did not increase in comparison. Furthermore, PCT/CRP ratio was extremely high in AESD compared with otherconditions. There were no significant differences in levels ofcytokines involved in PCT production, such as serum IL-6,TNF-α, and IFN-γ, between the AESD and FS groups. InAESD, PCT is likely to increase through a different mecha-nism from that obtained in sepsis.
Conflicts of Interest
The authors declare that they have no conflict of interestrelated to this paper or the study it describes.
References
[1] V. S. Lanziotti, P. Povoa, and M. Soares, “Use of biomarkers inpediatric sepsis: literature review,”RevistaBrasileiraDeTerapiaIntensiva, vol. 28, no. 4, pp. 472–482, 2016.
[2] J. Takanashi, “Two newly proposed infectious encephalitis/encephalopathy syndromes,” Brain & Development, vol. 31,no. 7, pp. 521–528, 2009.
[3] Japan Ministry of Health, Labour and Welfare Influenza-associated Encephalopathy Study Group, The Influenza-Associated Encephalopathy Guidelines (Revised Edition),pp. 23–32, 2009, (in Japanese). http://www.tokyo-med.ac.jp/pediat/data/info0925-01.pdf.
[4] K. Nakanishi, S. Kasashima, Y. Ishii, H. Shimoeda, andA. Kawashima, “Clinical use of presepsin compared with thatof procalcitonin in children with sepsis,” Rinsho Byori,vol. 64, pp. 1128–1133, 2016.
[5] W. Nargis, M. Ibrahim, and B. U. Ahamed, “Procalcitonin ver-sus C-reactive protein: usefulness as biomarker of sepsis inICU patient,” International Journal of Critical Illness & InjuryScience, vol. 4, no. 3, pp. 195–199, 2014.
[6] A. Hoshino, M. Saitoh, A. Oka et al., “Epidemiology of acuteencephalopathy in Japan, with emphasis on the associationof viruses and syndromes,” Brain & Development, vol. 34,no. 5, pp. 337–343, 2012.
[7] T. Yokochi, T. Takeuchi, and J. Mukai, “Prediction of acuteencephalopathy with biphasic seizures and late reduced diffu-sion in patients with febrile status epilepticus,” Brain & Devel-opment, vol. 38, no. 2, pp. 217–224, 2016.
[8] R. Pierce, M. T. Bigham, and J. S. Giuliano Jr, “Use of procal-citonin for the prediction and treatment of acute bacterialinfection in children,” Current Opinion in Pediatrics, vol. 26,no. 3, pp. 292–298, 2014.
[9] M. Christ-Crain and B. Müller, “Procalcitonin in bacterialinfections - hype, hope, more or less?,” Swiss Medical Weekly,vol. 135, no. 31-32, pp. 451–460, 2005.
[10] M. Takasu, H. Kurahashi, A. Okumura et al., “Study of procal-citonin in acute encephalopathy with biphasic seizures and latereduced diffusion,” No to Hattatsu (Official Journal of theJapanese Society of Child Neurology), vol. 48, p. 5246,2016, (In Japanese).
[11] Y. Azuma, T. Tsuji, T. Kubota et al., “Study of serum procalci-tonin levels in acute encephalopathy with biphasic seizuresand late reduced diffusion,” No to Hattatsu (Official Journalof the Japanese Society of Child Neurology), vol. 46, p. 5251,2014, (In Japanese).
[12] T. Ichiyama, N. Suenaga, M. Kajimoto et al., “Serum and CSFlevels of cytokines in acute encephalopathy following pro-longed febrile seizures,” Brain & Development, vol. 30, no. 1,pp. 47–52, 2008.
4 Disease Markers
Research ArticleUrinary Clusterin Is Upregulated in Nephropathia Epidemica
Ekaterina V. Martynova,1 Adelya N. Maksudova,2 Venera G. Shakirova,3
Sayar R. Abdulkhakov,1 Ilsiyar M. Khaertynova,3 Vladimir A. Anokhin ,2
Vilena V. Ivanova,1 Ilesanmi M. Abiola,1 Ekaterina E. Garanina,1 Leisan G. Tazetdinova,1
Aigul H. Valiullina,1 and Svetlana F. Khaiboullina 1,4
1Institute of Fundamental Medicine and Biology, Kazan Federal University, Kazan, Republic of Tatarstan, Russia2Kazan State Medical University, Kazan, Republic of Tatarstan, Russia3Kazan State Medical Academy, Kazan, Republic of Tatarstan, Russia4University of Nevada, Reno, NV, USA
Correspondence should be addressed to Svetlana F. Khaiboullina; [email protected]
Received 12 September 2017; Revised 15 January 2018; Accepted 18 January 2018; Published 26 February 2018
Academic Editor: Hyundoo Hwang
Copyright © 2018 Ekaterina V. Martynova et al. This is an open access article distributed under the Creative Commons AttributionLicense, which permits unrestricted use, distribution, and reproduction in anymedium, provided the original work is properly cited.
Kidney insufficiency is a hallmark of nephropathia epidemica (NE). Little is known about the mechanisms of the NE kidneypathology, with current knowledge mainly based on findings in postmortem tissue. We have analyzed kidney damagebiomarkers in urine collected from early- and late-phase NE using Bio-Plex kidney toxicity panels 1 and 2. To determine thedisease specificity, kidney damage biomarkers were also analyzed in urine samples from patients diagnosed with gout, type 2diabetes, systemic lupus erythematosus, and chronic kidney insufficiency. Analysis of 12 biomarkers suggests damage to thekidney proximal tubule at the onset of NE. Also, upregulation of biomarkers of inflammation and leukocyte chemotaxis weredetected in NE urine. Furthermore, increased clusterin levels were found in early- and late-phase NE urine. Comparativeanalysis revealed that clusterin is a biomarker, upregulated in NE urine.
1. Introduction
Hemorrhagic fever with renal syndrome (HFRS) is a zoo-notic disease caused by several viruses, which are membersof the Hantavirus genus [1]. The mild form of HFRS, oftenreferred to as nephropathia epidemica (NE), is endemic inthe Republic of Tatarstan, Russia [2]. Puumala virus, a han-tavirus species, is the main causative agent of NE in Tatar-stan. NE is acquired by inhaling a virus-contaminatedaerosol [3]. The natural reservoir of Puumala virus is thebank vole (Myodes glareolus), where infection persists for lifewithout apparent symptoms, whereas infection in humans ischaracterized by a constellation of clinical symptoms and cansometimes be fatal [4, 5].The fatality rate is about 0.4% withthe main cause of death being acute renal failure with dissem-inated intravascular coagulation (DIC) syndrome.
The dominant clinical feature of NE is kidney insuffi-ciency, which initially presents as back pain.
Soon after, the disease progresses to an oliguric phase,characterized by decreased urine output (<500mL urine in1–3 days). Some patients develop anuria, where no urine isproduced. The oliguric period is the most critical due tothe high likelihood of developing the life-threatening com-plications. Urinalysis reveals proteinuria and presence oferythrocytes [6]. Additionally, serum levels of creatininecan reach up to 640μM/L in some patients and couldrequire hemodialysis [7]. Clinical recovery begins with theonset of diuresis [8, 9].
Damage to kidney tissue has been reported in NE cases.Histologically, hantavirus infection is defined as a tubulo-interstitial nephritis with prominent leukocyte infiltrationand interstitial hemorrhages [10, 11]. Additionally, IgM,complement component C3, and fibrin deposits along thebasal side of the tubular epithelial cells have been reported[11]. Electron microscopy of renal biopsies reveals discreteperitubular capillary damage with signs of capillary leakage
HindawiDisease MarkersVolume 2018, Article ID 8658507, 7 pageshttps://doi.org/10.1155/2018/8658507
and erythrocyte extravasation [7]. Interstitial leukocyte infil-tration is composed predominantly of mononuclear immuneeffectors including CD8+ cytotoxic T lymphocytes and CD68+ macrophages [7]. It has been suggested that infiltratingmononuclear leukocytes play a role in the pathogenesis ofkidney tissue damage during hantavirus infection. For exam-ple, increased expression of the TNFα, TGFβ, and PDGF hasbeen observed in cells infiltrating the peritubular area of thedistal nephron [12]. Also, increased expression of ICAM-1,VCAM, and PECAM in kidney tissue during the infectionhas been reported. Together, histological data indicate path-ological changes to be more prominent in the tubular areaof the nephron and that less damage, if any, is detected inthe glomerular area [12].
Examination of kidney biopsies obtained from the acuteNE cases is an ideal approach to study the mechanisms ofrenal pathology. However, collection of tissue samples duringNE is often not feasible, especially in patients with severelyimpaired kidney function. Collecting multiple kidney biop-sies is impracticable. Therefore, most of our knowledge onkidney tissue damage has come from studying tissue col-lected postmortem. However, postmortem tissue reflects thelate stage of the NE, and therefore, these data have limitedvalue to determine tissue damage at the early stages of thedisease or in nonfatal cases.
Clinically, NE is characterized by renal dysfunction whichprogresses through several stages including oliguric, polyuric,and convalescent stages [13, 14]. Currently, several methodsare utilized to evaluate renal function including measurementof creatinine clearance and blood urea nitrogen (BUN). Bothmethods have limitations. For example, creatinine clearancerequires urine collection for over 24 hours, which patientsfind inconvenient, and therefore, collections are often inaccu-rate. BUN is a less reliable marker of glomerular filtration ratebecause it canbe affectedby factors unrelated to the renal func-tion. It is also important to note that changes in serum creati-nine and BUN concentrations primarily indicate presence ofchanges in filtration capacity and, thus, are not always reflec-tive of tissue injury. Therefore, there is a need for an alternativenoninvasivemethod toassesskidneyperformance inNEcases.
In this study, we sought to identify biomarkers of kidneytissue injury in NE urine samples. Additionally, we wanted toexamine whether urine samples can be used to determinepresence of NE damage to specific nephron structures.Analysis of 12 biomarkers suggests damage to the kidneyproximal tubule early after the onset of NE. Furthermore,upregulation of biomarkers of inflammation and mononu-clear leukocyte chemotaxis were detected in NE urine.Increased clusterin levels indicate injury to kidney tissue atthe early phase of the disease. Clusterin levels remainedupregulated during the convalescent phase as well, suggestingthat kidney tissue damage is still present at the time of hospi-tal discharge. Comparative analysis revealed that clusterin isa biomarker, upregulated in NE urine.
2. Materials and Methods
2.1. Patients. Urine samples were collected from a total of 64patients (56 male and 8 female) hospitalized in the Republic
Clinical Hospital for the Infectious Disease, Republic ofTatarstan, Russia. All 64 subjects provided at least one urinespecimen for the purpose of urine biomarker analysis, and 36subjects (30 male and 6 female) provided a second urine sam-ple before being discharged from the hospital. Additionally,urine samples were collected from patients diagnosed withgout (32), type 2 diabetes (15), systemic lupus erythematosus(SLE) (8), and chronic kidney insufficiency (CKI) (10). Selec-tion of these diseases was based on the fact that clinical pre-sentation included symptoms of renal dysfunction. Urinesamples from 51 (33 male and 18 female) healthy individualswere also collected. The Institutional Review Board of KazanFederal University approved this study, and informed con-sent was obtained from each study subject according to theguidelines approved under this protocol (article 20, FederalLaw “Protection of Health Right of Citizens of Russian Fed-eration” N323-FZ, November 21, 2011).
Diagnosis of NE was based on clinical presentation andserologically confirmed by detection of antihantavirus anti-bodies. Two serum samples were collected from each patient.The first sample was collected at the time of admission, andthe second sample 7–10 days later. Detection of antihanta-virus antibodies was determined by indirect chemilumines-cence (Vector, Novosibirsk, Russia). Serum samples wereconsidered positive when the titer of antihantavirus antibodyin the second serum sample was ≥4x the first sample.
2.2. Multiplex Analysis. Human kidney toxicity panels 1 and2 (Bio-Rad, Hercules, CA) were used to analyze urine sam-ples according to the manufacturer’s recommendations. Kid-ney toxicity panel 1 detects calbindin, clusterin, glutathioneS-transferase-π (GST-π), IL-18, kidney injury molecule-1(KIM-1), and monocyte chemotactic protein-1 (MCP-1;CCL2), while kidney toxicity panel 2 detects albumin, beta-2-microglobulin (β2M), cystatin C, neutrophil gelatinase-associated lipocalin (NGAL), osteopontin, and trefoil factor3 (TFF3).
2.3. Statistical Analysis. Data are presented as mean± SE.Statistical analysis was performed using Student’s t-testfor comparisons between individual experimental groups(infected and noninfected). Significance was established ata value of P < 0 05.
3. Results
3.1. Changes in Kidney Toxicity Biomarkers in NE Urine.Changes in renal function were analyzed using the kidneytoxicity panels 1 and 2. Urine samples were separated intoearly (7.8± 0.3 days) and late (14.2± 0.3) based on the timeof collection. Elevated serum creatinine (266.3± 18.8μmol/L) and urea (15.9± 0.9mg/dL) were found in early-phaseNE serum as compared to controls (Table 1). Also, oliguriawas characteristic of early-phase NE (572.5± 34.6mL/day).At the late-phase NE, creatinine and urea levels decreased,yet still remaining significantly higher than in controls(89.2± 1.2 versus 67.1± 1.8; P < 0 0001). Also, the urineoutput was higher in late-phase NE cases as compared to
2 Disease Markers
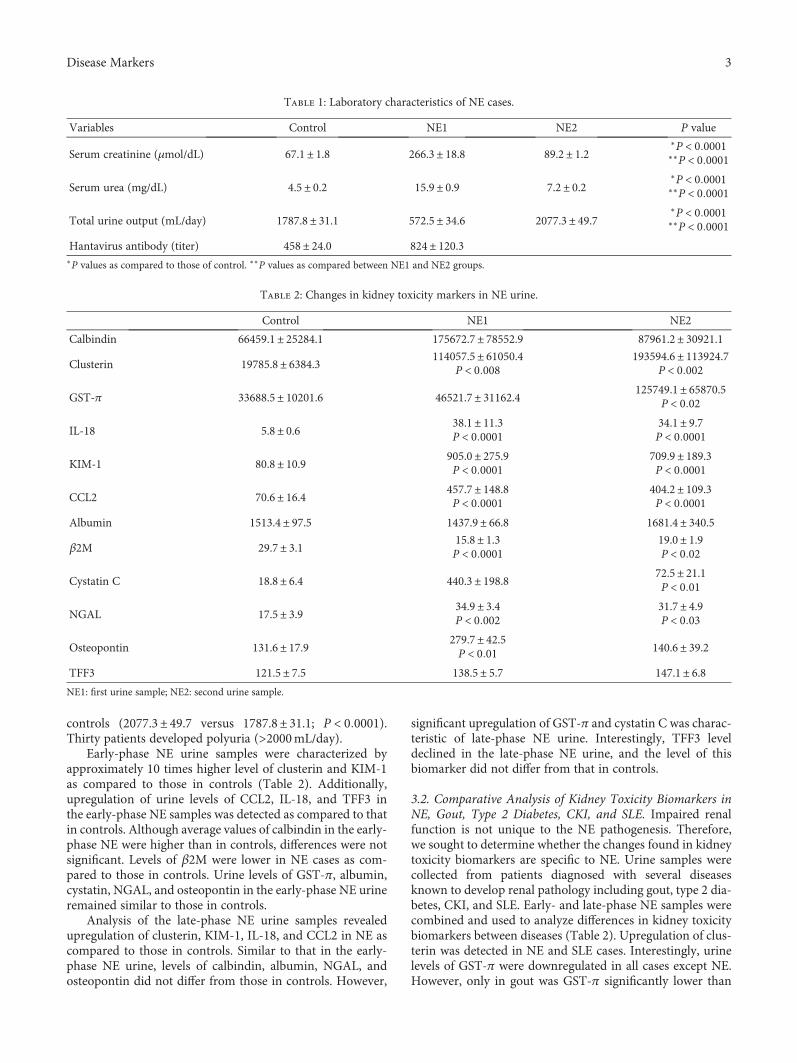
controls (2077.3± 49.7 versus 1787.8± 31.1; P < 0 0001).Thirty patients developed polyuria (>2000mL/day).
Early-phase NE urine samples were characterized byapproximately 10 times higher level of clusterin and KIM-1as compared to those in controls (Table 2). Additionally,upregulation of urine levels of CCL2, IL-18, and TFF3 inthe early-phase NE samples was detected as compared to thatin controls. Although average values of calbindin in the early-phase NE were higher than in controls, differences were notsignificant. Levels of β2M were lower in NE cases as com-pared to those in controls. Urine levels of GST-π, albumin,cystatin, NGAL, and osteopontin in the early-phase NE urineremained similar to those in controls.
Analysis of the late-phase NE urine samples revealedupregulation of clusterin, KIM-1, IL-18, and CCL2 in NE ascompared to those in controls. Similar to that in the early-phase NE urine, levels of calbindin, albumin, NGAL, andosteopontin did not differ from those in controls. However,
significant upregulation of GST-π and cystatin C was charac-teristic of late-phase NE urine. Interestingly, TFF3 leveldeclined in the late-phase NE urine, and the level of thisbiomarker did not differ from that in controls.
3.2. Comparative Analysis of Kidney Toxicity Biomarkers inNE, Gout, Type 2 Diabetes, CKI, and SLE. Impaired renalfunction is not unique to the NE pathogenesis. Therefore,we sought to determine whether the changes found in kidneytoxicity biomarkers are specific to NE. Urine samples werecollected from patients diagnosed with several diseasesknown to develop renal pathology including gout, type 2 dia-betes, CKI, and SLE. Early- and late-phase NE samples werecombined and used to analyze differences in kidney toxicitybiomarkers between diseases (Table 2). Upregulation of clus-terin was detected in NE and SLE cases. Interestingly, urinelevels of GST-π were downregulated in all cases except NE.However, only in gout was GST-π significantly lower than
Table 1: Laboratory characteristics of NE cases.
Variables Control NE1 NE2 P value
Serum creatinine (μmol/dL) 67.1± 1.8 266.3± 18.8 89.2± 1.2∗P < 0 0001∗∗P < 0 0001
Serum urea (mg/dL) 4.5± 0.2 15.9± 0.9 7.2± 0.2∗P < 0 0001∗∗P < 0 0001
Total urine output (mL/day) 1787.8± 31.1 572.5± 34.6 2077.3± 49.7∗P < 0 0001∗∗P < 0 0001
Hantavirus antibody (titer) 458± 24.0 824± 120.3∗P values as compared to those of control. ∗∗P values as compared between NE1 and NE2 groups.
Table 2: Changes in kidney toxicity markers in NE urine.
Control NE1 NE2
Calbindin 66459.1± 25284.1 175672.7± 78552.9 87961.2± 30921.1
Clusterin 19785.8± 6384.3 114057.5± 61050.4P < 0 008
193594.6± 113924.7P < 0 002
GST-π 33688.5± 10201.6 46521.7± 31162.4 125749.1± 65870.5P < 0 02
IL-18 5.8± 0.6 38.1± 11.3P < 0 0001
34.1± 9.7P < 0 0001
KIM-1 80.8± 10.9 905.0± 275.9P < 0 0001
709.9± 189.3P < 0 0001
CCL2 70.6± 16.4 457.7± 148.8P < 0 0001
404.2± 109.3P < 0 0001
Albumin 1513.4± 97.5 1437.9± 66.8 1681.4± 340.5
β2M 29.7± 3.1 15.8± 1.3P < 0 0001
19.0± 1.9P < 0 02
Cystatin C 18.8± 6.4 440.3± 198.8 72.5± 21.1P < 0 01
NGAL 17.5± 3.9 34.9± 3.4P < 0 002
31.7± 4.9P < 0 03
Osteopontin 131.6± 17.9 279.7± 42.5P < 0 01 140.6± 39.2
TFF3 121.5± 7.5 138.5± 5.7 147.1± 6.8NE1: first urine sample; NE2: second urine sample.
3Disease Markers
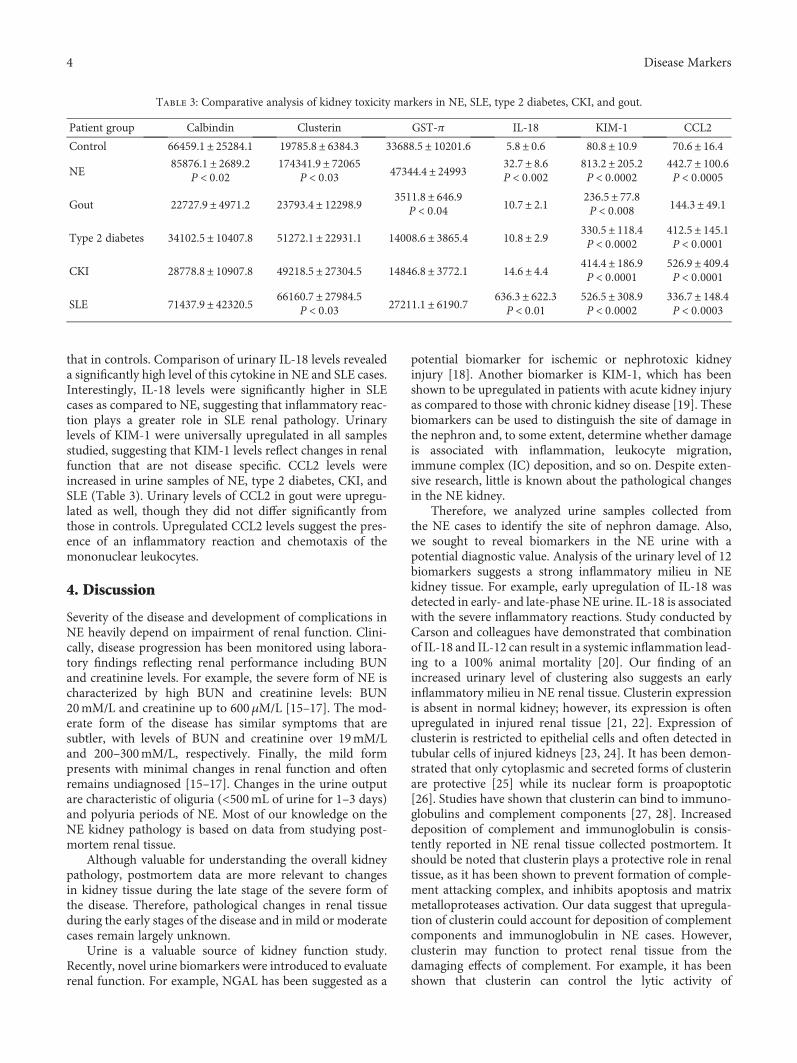
that in controls. Comparison of urinary IL-18 levels revealeda significantly high level of this cytokine in NE and SLE cases.Interestingly, IL-18 levels were significantly higher in SLEcases as compared to NE, suggesting that inflammatory reac-tion plays a greater role in SLE renal pathology. Urinarylevels of KIM-1 were universally upregulated in all samplesstudied, suggesting that KIM-1 levels reflect changes in renalfunction that are not disease specific. CCL2 levels wereincreased in urine samples of NE, type 2 diabetes, CKI, andSLE (Table 3). Urinary levels of CCL2 in gout were upregu-lated as well, though they did not differ significantly fromthose in controls. Upregulated CCL2 levels suggest the pres-ence of an inflammatory reaction and chemotaxis of themononuclear leukocytes.
4. Discussion
Severity of the disease and development of complications inNE heavily depend on impairment of renal function. Clini-cally, disease progression has been monitored using labora-tory findings reflecting renal performance including BUNand creatinine levels. For example, the severe form of NE ischaracterized by high BUN and creatinine levels: BUN20mM/L and creatinine up to 600μM/L [15–17]. The mod-erate form of the disease has similar symptoms that aresubtler, with levels of BUN and creatinine over 19mM/Land 200–300mM/L, respectively. Finally, the mild formpresents with minimal changes in renal function and oftenremains undiagnosed [15–17]. Changes in the urine outputare characteristic of oliguria (<500mL of urine for 1–3 days)and polyuria periods of NE. Most of our knowledge on theNE kidney pathology is based on data from studying post-mortem renal tissue.
Although valuable for understanding the overall kidneypathology, postmortem data are more relevant to changesin kidney tissue during the late stage of the severe form ofthe disease. Therefore, pathological changes in renal tissueduring the early stages of the disease and in mild or moderatecases remain largely unknown.
Urine is a valuable source of kidney function study.Recently, novel urine biomarkers were introduced to evaluaterenal function. For example, NGAL has been suggested as a
potential biomarker for ischemic or nephrotoxic kidneyinjury [18]. Another biomarker is KIM-1, which has beenshown to be upregulated in patients with acute kidney injuryas compared to those with chronic kidney disease [19]. Thesebiomarkers can be used to distinguish the site of damage inthe nephron and, to some extent, determine whether damageis associated with inflammation, leukocyte migration,immune complex (IC) deposition, and so on. Despite exten-sive research, little is known about the pathological changesin the NE kidney.
Therefore, we analyzed urine samples collected fromthe NE cases to identify the site of nephron damage. Also,we sought to reveal biomarkers in the NE urine with apotential diagnostic value. Analysis of the urinary level of 12biomarkers suggests a strong inflammatory milieu in NEkidney tissue. For example, early upregulation of IL-18 wasdetected in early- and late-phase NE urine. IL-18 is associatedwith the severe inflammatory reactions. Study conducted byCarson and colleagues have demonstrated that combinationof IL-18 and IL-12 can result in a systemic inflammation lead-ing to a 100% animal mortality [20]. Our finding of anincreased urinary level of clustering also suggests an earlyinflammatory milieu in NE renal tissue. Clusterin expressionis absent in normal kidney; however, its expression is oftenupregulated in injured renal tissue [21, 22]. Expression ofclusterin is restricted to epithelial cells and often detected intubular cells of injured kidneys [23, 24]. It has been demon-strated that only cytoplasmic and secreted forms of clusterinare protective [25] while its nuclear form is proapoptotic[26]. Studies have shown that clusterin can bind to immuno-globulins and complement components [27, 28]. Increaseddeposition of complement and immunoglobulin is consis-tently reported in NE renal tissue collected postmortem. Itshould be noted that clusterin plays a protective role in renaltissue, as it has been shown to prevent formation of comple-ment attacking complex, and inhibits apoptosis and matrixmetalloproteases activation. Our data suggest that upregula-tion of clusterin could account for deposition of complementcomponents and immunoglobulin in NE cases. However,clusterin may function to protect renal tissue from thedamaging effects of complement. For example, it has beenshown that clusterin can control the lytic activity of
Table 3: Comparative analysis of kidney toxicity markers in NE, SLE, type 2 diabetes, CKI, and gout.
Patient group Calbindin Clusterin GST-π IL-18 KIM-1 CCL2
Control 66459.1± 25284.1 19785.8± 6384.3 33688.5± 10201.6 5.8± 0.6 80.8± 10.9 70.6± 16.4
NE85876.1± 2689.2
P < 0 02174341.9± 72065
P < 0 03 47344.4± 24993 32.7± 8.6P < 0 002
813.2± 205.2P < 0 0002
442.7± 100.6P < 0 0005
Gout 22727.9± 4971.2 23793.4± 12298.9 3511.8± 646.9P < 0 04 10.7± 2.1 236.5± 77.8
P < 0 008 144.3± 49.1
Type 2 diabetes 34102.5± 10407.8 51272.1± 22931.1 14008.6± 3865.4 10.8± 2.9 330.5± 118.4P < 0 0002
412.5± 145.1P < 0 0001
CKI 28778.8± 10907.8 49218.5± 27304.5 14846.8± 3772.1 14.6± 4.4 414.4± 186.9P < 0 0001
526.9± 409.4P < 0 0001
SLE 71437.9± 42320.5 66160.7± 27984.5P < 0 03 27211.1± 6190.7 636.3± 622.3
P < 0 01526.5± 308.9P < 0 0002
336.7± 148.4P < 0 0003
4 Disease Markers
membrane attack complex (MAC) by binding to C5b-7, thuspreventing its binding to cell membranes [29, 30]. Also, it hasbeen suggested that clusterin could interfere with formationof terminal complement components, while not affectingglomerular antibody binding and C3 deposition [31]. Ourfinding of upregulation of clusterin in NE urine implicatesits role in disease pathogenesis. More study is required toevaluate whether clusterin plays a protective role in NE. Anincreased level of KIM-1 was detected in NE urine samples,suggesting damage to the proximal tubule. Normally unde-tectable, KIM-1 is induced more than any other proteinswhen kidneys are injured. Studies have shown that KIM-1upregulation exceeding 12-folds and can be associatedwith the risk of development of acute tubular necrosis[19]. KIM-1 is found to be localized to the apical surfaceof surviving proximal tubule epithelial cells [32]. Studieshave suggested that KIM-1 could be used as biomarkersfor acute renal failure. The diagnostic value of KIM-1 as apredictor of acute kidney failure has been demonstrated byVaidya et al. [33], and it was further confirmed by Liangoset al. [34]. Severe cases of NE are characterized by acutekidney failure [35]; however, the clinical signs of this life-threatening complication appear during late stages of thedisease. Therefore, identifying molecules which could serveas early biomarkers of acute kidney failure has high clinicalimportance. More study is required to further validateKIM-1 as biomarkers of an acute kidney failure in NE. Anal-ysis of kidney toxicity biomarkers collectively suggests thattubular injury is a hallmark of NE. It appears that the injuryto tubular epithelium could lead to functional impairment.This assumption is based on the fact that two biomarkers oftubular function differed significantly in the NE and controlurine. Levels of β2M were lower in urine of NE cases. β2Mis a molecule which is readily filtered through the glomerulusand almost completely reabsorbed and destroyed by proxi-mal tubular cells [36].
Additionally, we found another marker of proximaltubular dysfunction, cystatin C, to be changed in NE urine.Together, our data suggest that tubular injury in NEcases leads to disruption of the tubular function in theproximal nephron.
Significant upregulation of GST-π has been found in NEurine samples collected during the convalescent phase. GST-π is constitutively expressed in distal nephron epithelium,and it is released into the urine upon epithelial cell damage[37, 38], suggesting the injury to the distal nephron epithe-lium. Since upregulation of GST-π in urine was found onlyin the late-phase NE samples, we conclude that abnormalitiesin kidney function at the end of the disease could be related tothe distal nephron epithelial damage. Therefore, we suggestthat damage to the proximal epithelium determines the earlychanges in kidney function, while injury to proximal anddistal epithelia causes the symptoms of renal insufficiencyat late stages of the disease.
In conclusion, we identified clusterin as a biomarkerupregulated in urine of NE and SLE cases. Both diseases arecharacterized by increased serum level of IC and complementactivation. Therefore, we suggest that immune mechanismsare playing a role in the pathogenesis of kidney damage in
NE, where IC and complement deposition are essential.Clusterin was found to be upregulated in the early as wellas convalescent phases of the disease, suggesting prolongedkidney injury extending beyond the recovery stage. Clusterincould account for deposition of complement componentsand immunoglobulin in NE kidneys; however, its role inpathogenesis of renal injury remains to be determined.
Conflicts of Interest
The authors declare no conflicts of interest.
Acknowledgments
The work is performed according to the Russian Govern-ment Program of Competitive Growth of Kazan Federal Uni-versity and subsidy allocated to Kazan Federal University forthe state assignment in the sphere of scientific activities.Some of the experiments were conducted using the equip-ment of Interdisciplinary Center of Collective Use of KazanFederal University supported by the Ministry of Educationof the Russian Federation (ID RFMEFI59414X0003). Thiswork is supported by Program of Competitive Growth ofKFU, Russian Science Foundation 15-14-00016, Interdisci-plinary Center for Analytical Microscopy, and Pharmaceuti-cal Research and Education Center, Kazan (Volga Region)Federal University, Kazan, Russia.
References
[1] J. Mustonen, S. Mäkelä, T. Outinen et al., “The pathogenesis ofnephropathia epidemica: new knowledge and unansweredquestions,” Antiviral Research, vol. 100, no. 3, pp. 589–604,2013.
[2] J. Li, J. Chen, G. Yang et al., “Case-control study of risk factorsfor human infection with avian influenza A (H7N9) virus inShanghai, China, 2013,” Epidemiology and Infection, vol. 143,no. 09, pp. 1826–1832, 2015.
[3] S. B. Garanina, A. E. Platonov, V. I. Zhuravlev et al., “Geneticdiversity and geographic distribution of hantaviruses inRussia,” Zoonoses and Public Health, vol. 56, no. 6-7,pp. 297–309, 2009.
[4] R. Yanagihara, H. L. Amyx, and D. C. Gajdusek, “Experimen-tal infection with Puumala virus, the etiologic agent of nephro-pathia epidemica, in bank voles (Clethrionomys glareolus),”Journal of Virology, vol. 55, no. 1, pp. 34–38, 1985.
[5] G. Diglisic, C. A. Rossi, A. Doti, and D. K. Walshe, “Seroprev-alence study of Hantavirus infection in the community basedpopulation,” Maryland Medical Journal, vol. 48, no. 6,pp. 303–6, 1999.
[6] S. F. Khaiboullina, E. V. Martynova, Z. L. Khamidullina et al.,“Upregulation of IFN-γ and IL-12 is associated with a milderform of hantavirus hemorrhagic fever with renal syndrome,”European Journal of Clinical Microbiology & Infectious Dis-eases, vol. 33, no. 12, pp. 2149–2156, 2014.
[7] D. Ferluga and A. Vizjak, “Hantavirus nephropathy,” Journalof the American Society of Nephrology, vol. 19, no. 9,pp. 1653–1658, 2008.
[8] Z. Bi, P. B. Formenty, and C. E. Roth, “Hantavirus infection: areview and global update,” Journal of Infection in DevelopingCountries, vol. 2, no. 1, pp. 3–23, 2008.
5Disease Markers
[9] T. M. Cosgriff, “Mechanisms of disease in Hantavirusinfection: pathophysiology of hemorrhagic fever with renalsyndrome,” Reviews of Infectious Diseases, vol. 13, no. 1,pp. 97–107, 1991.
[10] J. Mustonen, H. Helin, K. Pietilä et al., “Renal biopsyfindings and clinicopathologic correlations in nephropathiaepidemica,” Clinical Nephrology, vol. 41, no. 3, pp. 121–126, 1994.
[11] J. Groen, J. A. Bruijn, M. N. Gerding, J. G. Jordans, A. Mollvan Charante, and A. D. Osterhaus, “Hantavirus antigendetection in kidney biopsies from patients with nephro-pathia epidemica,” Clinical Nephrology, vol. 46, no. 6,pp. 379–383, 1996.
[12] M. Temonen, J. Mustonen, H. Helin, A. Pasternack, A. Vaheri,and H. Holthöfer, “Cytokines, adhesionmolecules, and cellularinfiltration in nephropathia epidemica kidneys: an immuno-histochemical study,” Clinical Immunology and Immunopa-thology, vol. 78, no. 1, pp. 47–55, 1996.
[13] A. F. Bren, S. K. PavlovČIČ, M. Koselj, J. KovaČ, A. Kandus,and R. Kveder, “Acute renal failure due to hemorrhagic feverwith renal syndrome,” Renal Failure, vol. 18, no. 4, pp. 635–638, 1996.
[14] S. Makela, I. Ala-Houhala, J. Mustonen et al., “Renal functionand blood pressure five years after Puumala virus-inducednephropathy,” Kidney International, vol. 58, no. 4, pp. 1711–1718, 2000.
[15] D. Turcinov, I. Puljiz, A. Markotić, I. Kuzman, andJ. Begovac, “Clinical and laboratory findings in patients witholiguric and non-oliguric hantavirus haemorrhagic feverwith renal syndrome: an analysis of 128 patients,” ClinicalMicrobiology and Infection, vol. 19, no. 7, pp. 674–679,2013.
[16] E. I. Germash, V. S. Timokhov, Zagidullin ShZ, I. M.Zagidullin, and S. N. Ozhgikhin, “The pathogenetic therapyof patients with a severe form of hemorrhagic fever andacute kidney failure,” Terapevticheskiĭ Arkhiv, vol. 69,no. 11, pp. 26–30, 1997.
[17] T. F. Tsai, “Hemorrhagic fever with renal syndrome: clinicalaspects,” Laboratory Animal Science, vol. 37, no. 4, pp. 419–427, 1987.
[18] J. Mishra, Q. Ma, A. Prada et al., “Identification of neutro-phil gelatinase-associated lipocalin as a novel early urinarybiomarker for ischemic renal injury,” Journal of the Ameri-can Society of Nephrology, vol. 14, no. 10, pp. 2534–2543,2003.
[19] W. K. Han, V. Bailly, R. Abichandani, R. Thadhani, and J. V.Bonventre, “Kidney injury molecule-1 (KIM-1): a novelbiomarker for human renal proximal tubule injury,” KidneyInternational, vol. 62, no. 1, pp. 237–244, 2002.
[20] W. E. Carson, J. E. Dierksheide, S. Jabbour et al., “Coad-ministration of interleukin-18 and interleukin-12 induces afatal inflammatory response in mice: critical role of naturalkiller cell interferon-gamma production and STAT-mediatedsignal transduction,” Blood, vol. 96, no. 4, pp. 1465–1473,2000.
[21] J. Dvergsten, J. C. Manivel, R. Correa-Rotter, and M. E.Rosenberg, “Expression of clusterin in human renal diseases,”Kidney International, vol. 45, no. 3, pp. 828–835, 1994.
[22] M. E. Rosenberg andM. S. Paller, “Differential gene expressionin the recovery from ischemic renal injury,” Kidney Interna-tional, vol. 39, no. 6, pp. 1156–1161, 1991.
[23] M. A. Harding, L. J. Chadwick, V. H. Gattone II, and J. P.Calvet, “The SGP-2 gene is developmentally regulated in themouse kidney and abnormally expressed in collecting ductcysts in polycystic kidney disease,” Developmental Biology,vol. 146, no. 2, pp. 483–490, 1991.
[24] R. Correa-Rotter, M. E. Ibarra-Rubio, G. Schwochau et al.,“Induction of clusterin in tubules of nephrotic rats,” Journalof the American Society of Nephrology, vol. 9, no. 1, pp. 33–37, 1998.
[25] G. S. Jung, M. K. Kim, Y. A. Jung et al., “Clusterin attenuatesthe development of renal fibrosis,” Journal of the AmericanSociety of Nephrology, vol. 23, no. 1, pp. 73–85, 2012.
[26] N. Kim, J. C. Yoo, J. Y. Han et al., “Human nuclear clusterinmediates apoptosis by interacting with Bcl-XL through C-terminal coiled coil domain,” Journal of Cellular Physiology,vol. 227, no. 3, pp. 1157–1167, 2012.
[27] M. R. Wilson and S. B. Easterbrook-Smith, “Clusterin bindsby a multivalent mechanism to the Fc and Fab regions ofIgG,” Biochimica et Biophysica Acta (BBA) - Protein Structureand Molecular Enzymology, vol. 1159, no. 3, pp. 319–326,1992.
[28] L. E. French, J. Tschopp, and J. A. Schifferli, “Clusterin in renaltissue: preferential localization with the terminal complementcomplex and immunoglobulin deposits in glomeruli,” Clinicaland Experimental Immunology, vol. 88, no. 3, pp. 389–393,1992.
[29] N. H. Choi, T. Mazda, and M. Tomita, “A serum proteinSP40,40 modulates the formation of membrane attack com-plex of complement on erythrocytes,”Molecular Immunology,vol. 26, no. 9, pp. 835–840, 1989.
[30] N. H. Choi, Y. Nakano, T. Tobe, T. Mazda, and M. Tomita,“Incorporation of SP-40,40 into the soluble membrane attackcomplex (SMAC, SC5b-9) of complement,” InternationalImmunology, vol. 2, no. 5, pp. 413–417, 1990.
[31] J. R. Saunders, A. Aminian, J. L. McRae, K. A. O'Farrell,W. R. Adam, and B. F. Murphy, “Clusterin depletionenhances immune glomerular injury in the isolated perfusedkidney,” Kidney International, vol. 45, no. 3, pp. 817–827,1994.
[32] T. Ichimura, J. V. Bonventre, V. Bailly et al., “Kidney injurymolecule-1 (KIM-1), a putative epithelial cell adhesion mole-cule containing a novel immunoglobulin domain, is up-regulated in renal cells after injury,” The Journal of BiologicalChemistry, vol. 273, no. 7, pp. 4135–4142, 1998.
[33] V. S. Vaidya, S. S. Waikar, M. A. Ferguson et al., “Urinary bio-markers for sensitive and specific detection of acute kidneyinjury in humans,” Clinical and Translational Science, vol. 1,no. 3, pp. 200–208, 2008.
[34] O. Liangos, M. C. Perianayagam, V. S. Vaidya et al., “UrinaryN-acetyl-beta-(D)-glucosaminidase activity and kidney injurymolecule-1 level are associated with adverse outcomes in acuterenal failure,” Journal of the American Society of Nephrology,vol. 18, no. 3, pp. 904–912, 2007.
[35] F. M. Rasche, B. Uhel, R. Ulrich et al., “Thrombocytopeniaand acute renal failure in Puumala hantavirus infections,”Emerging Infectious Diseases, vol. 10, no. 8, pp. 1420–1425,2004.
[36] G. M. Bernier and M. E. Conrad, “Catabolism of humanbeta-2-microglobulin by the rat kidney,” American Journalof Physiology-Legacy Content, vol. 217, no. 5, pp. 1359–1362, 1969.
6 Disease Markers

[37] A. Sundberg, E. L. Appelkvist, G. Dallner, and R. Nilsson,“Glutathione transferases in the urine: sensitive methods fordetection of kidney damage induced by nephrotoxic agentsin humans,” Environmental Health Perspectives, vol. 102,Supplement 3, pp. 293–296, 1994.
[38] D. J.Harrison, R.Kharbanda,D. S.Cunningham, L. I.McLellan,and J. D. Hayes, “Distribution of glutathione S-transferaseisoenzymes in human kidney: basis for possible markers ofrenal injury,” Journal of Clinical Pathology, vol. 42, no. 6,pp. 624–628, 1989.
7Disease Markers
Research ArticleElevated Serum Levels of Mixed Lineage Kinase Domain-LikeProtein Predict Survival of Patients during Intensive CareUnit Treatment
Mihael Vucur ,1,2 Christoph Roderburg ,1 Lukas Kaiser,1,2 Anne Theres Schneider,1,2
Sanchari Roy,1 Sven Heiko Loosen,1 Mark Luedde,3 Christian Trautwein,1 Alexander Koch,1
Frank Tacke ,1 and Tom Luedde 1,2
1Department of Medicine III, University Hospital Aachen, RWTH Aachen University, Pauwelsstrasse 30, 52074 Aachen, Germany2Division of GI and Hepatobiliary Oncology, University Hospital Aachen, RWTH Aachen University, Pauwelsstrasse 30,52074 Aachen, Germany3Department of Internal Medicine III, University of Kiel, Rosalind-Franklin-Str. 12, 24105 Kiel, Germany
Correspondence should be addressed to Tom Luedde; [email protected]
Received 3 November 2017; Accepted 25 December 2017; Published 11 February 2018
Academic Editor: Juan Bueno
Copyright © 2018 Mihael Vucur et al. This is an open access article distributed under the Creative Commons Attribution License,which permits unrestricted use, distribution, and reproduction in any medium, provided the original work is properly cited.
Mixed lineage kinase domain-like (MLKL), a crucial regulator of necroptotic cell death, was shown to play a role in inflammatorydiseases. However, its role as a biomarker in critical illness and sepsis is currently unknown. We analyzed serum levels of MLKL in136 critically ill patients at admission to the intensive care unit (ICU) and after three days of ICU treatment. Results were comparedwith 36 healthy controls and correlated with clinical and laboratory patients’ data. MLKL serum levels of critically ill patients atadmission to the ICU were similar compared to healthy controls. At ICU admission, MLKL serum concentrations wereindependent of disease severity, presence of sepsis, and etiology of critical illness. In contrast, median serum levels of MLKLafter three days of ICU treatment were significantly lower compared to those at admission to the ICU. While serum levels ofMLKL at admission were not predictive for short-term survival during ICU treatment, elevated MLKL concentrations at daythree were an independent negative predictor of patients’ ICU survival. Thus, elevated MLKL levels after three days of ICUtreatment were predictive for patients’ mortality, indicating that sustained deregulated cell death is associated with an adverseprognosis in critical illness.
1. Introduction
In the last years, our understanding of how cell death pro-cesses are involved in the pathophysiology of inflammatoryand infectious diseases has been drastically altered. Besidesapoptosis, multiple forms of regulated necrosis have beenassociated with pathologies such as diabetes, nonalcoholicsteatohepatitis (NASH), heart failure, neurodegenerativediseases, and cancer [1–6].
Necroptosis results from oligomerization of mixedlineage kinase domain-like protein (MLKL) [7], which isinitiated by receptor-interacting serine/threonine-protein
kinase 3- (RIPK3-) dependent phosphorylation [8, 9]. MLKLthen forms a pore that leaks intracellular contents, such ascytokines, chemokines, and other intracellular proteins [10].Thus, the consequences of necroptosis are not necessarilyproinflammatory. During bacterial infections, necroptosiscan either promote pathogen removal or contribute to hostpathology [11]. Moreover, it was recently demonstrated thatnecroptosis plays a fundamental role to limit overwhelmingsystemic inflammation in the context of Staphylococcusaureus sepsis [12]. MLKL as the key driver of necroptotic celldeath might therefore represent an important regulator ofsepsis as the most severe consequence of bacterial infections.
HindawiDisease MarkersVolume 2018, Article ID 1983421, 8 pageshttps://doi.org/10.1155/2018/1983421

It was shown in models of skin infection or sepsis thatMlkl−/− mice had high bacterial loads, an inability to limitinterleukin-1β (IL-1β) production, and excessiveinflammation [12]. In contrast, other groups demonstratedthat Mlkl−/− mice were protected from severe pneumonia,highlighting the need for further research in this field [11].
Intracellular MLKL is the driving force behind necroticcell death in many diseases. However, very little data isavailable on the potential role of circulating MLKL as abiomarker. In this study, we analyzed concentrations ofcirculating MLKL in a large cohort of patients treated inan intensive care unit (ICU). Most importantly, we showthat elevated MLKL levels are predictive of impairedpatients’ survival after three days of ICU treatment, sug-gesting that MLKL represents a potential biomarker inpatients with critical illness.
2. Materials and Methods
2.1. Study Design and Patient Characteristics. In the presentstudy, we included 136 critically ill patients that were consec-utively admitted to our medical ICU. Of those, 76 were maleand 60 female. Patients’ characteristics are presented inTable 1. The study protocol was approved by the local ethicscommittee (ethics committee of the University HospitalAachen, RWTH Aachen University, Aachen, Germany) andconducted in accordance with the ethical standards laiddown in the Declaration of Helsinki. Written informed con-sent was obtained from the patient, his or her spouse, or theappointed legal guardian. Patients’ information and sampleswere acquired prospectively. Follow-up was performed asrecently described [13]. Presence of sepsis disease wasdefined according to the criteria defined in the third consen-sus definitions of sepsis [14]. All other patients were catego-rized as nonsepsis patients [13, 15].
2.2. Measurements of MLKL Serum Levels by ELISA. Bloodwas collected at the time point of admission to the ICU andafter 3 days of treatment. Sample handling and analysis ofroutine laboratory and experimental parameters weredescribed previously [15–17]. MLKL serum levels were mea-sured using a commercially available enzyme immunoassayaccording to manufacturers’ instructions (MBS9300811,MyBioSource Inc.).
2.3. Statistical Analysis. Statistics applied in this analysis havebeen described in detail [15–18]. In summary, data are givenas median and range. The Mann–Whitney U test or theKruskal-Wallis ANOVAwas used. Box plot graphics displaysa statistical summary of the median, quartiles, range, andextreme values. Correlation analyses were performed byusing Spearman correlation tests. The prognostic value ofthe variables was tested by univariate and multivariateanalysis in the Cox regression model. Kaplan-Meier curveswere plotted to display the impact on survival. All statisticalanalyses were performed with SPSS (SPSS, Chicago, IL,USA) [19, 20].
3. Results
3.1. MLKL Serum Concentrations in Critically Ill and SepticPatients at Admission to the ICU. In order to prove thetraceability of MLKL in human serum, we analyzed serumlevels of MLKL by using ELISA in the serum of healthy blooddonors and patients with different inflammatory ormalignant diseases. Of note, we were able to reliably detectMLKL in the serum in all patients collectively (Supplemen-tary Figure 1). To further explore a potential role of serumMLKL concentrations as a biomarker in critically ill andseptic patients, we measured MLKL serum levels in a largeand well-characterized cohort of 136 critically ill patients atadmission to the ICU (patients’ characteristics are given inTable 1) and 36 healthy blood donors. As seen inFigure 1(a), no significant differences in MLKL levels weredetected between critically ill patients and the respective con-trols (Figure 1(a)). Moreover, MLKL concentrations were notrelated to disease severity, as assessed by correlation withthe APACHE-II score (Figure 1(b)), or the presence ofconcomitant metabolic diseases, which had been previouslylinked to elevated MLKL levels in non-ICU populations[21] (Figures 1(c) and 1(d)).
We next analyzed the potential influence of sepsis onMLKL concentrations. Notably, no differences in MLKLlevels between patients with sepsis (n = 96) and patients thatdid not fulfill sepsis criteria became apparent (n = 40;Figure 1(e)). We also tested if serum MLKL concentrationscould be specifically deregulated in certain disease etiologiesin critically ill patients. Our cohort of patients consisted of55 patients with pulmonary sepsis, 12 with abdominal sepsis,6 with urogenital sepsis, and 23 with a different/unknownfocus of sepsis disease. Moreover, 40 patients suffered fromnonsepsis etiologies of critical illness (15 cardiopulmonarydiseases, 9 decompensated liver cirrhosis, 4 acute pancreati-tis, and 12 had another etiology). When comparing serumMLKL concentrations among these different groups, no
Table 1: Study population.
Parameters All patients
Number 136
Sex (male/female) 76/60
Age, median (range) [years] 66 (18–90)
APACHE-II score, median (range) 18.5 (3–40)
SAPS II score, median (range) 44 (9–80)
ICU days, median (range) 9 (1–137)
Preexisting diabetes, n (%) 34.5%
HbA1c [%] 5.9 (4–12.60)
BMI [kg/m2] 26.122 (15.9–59.5)
WBC, median (range) [×103/μl] 12.7 (0.1–208)
CRP, median (range) [mg/dl] 122 (<5–230)Procalcitonin, median (range) [μg/l] 1.0 (0.0–125.2)
Interleukin-6, median (range) [pg/ml] 73 (0–26,000)
APACHE: Acute Physiology and Chronic Health Evaluation; CRP:C-reactive protein; ICU: intensive care unit; SAPS: Simplified AcutePhysiology score; WBC: white blood cell.
2 Disease Markers
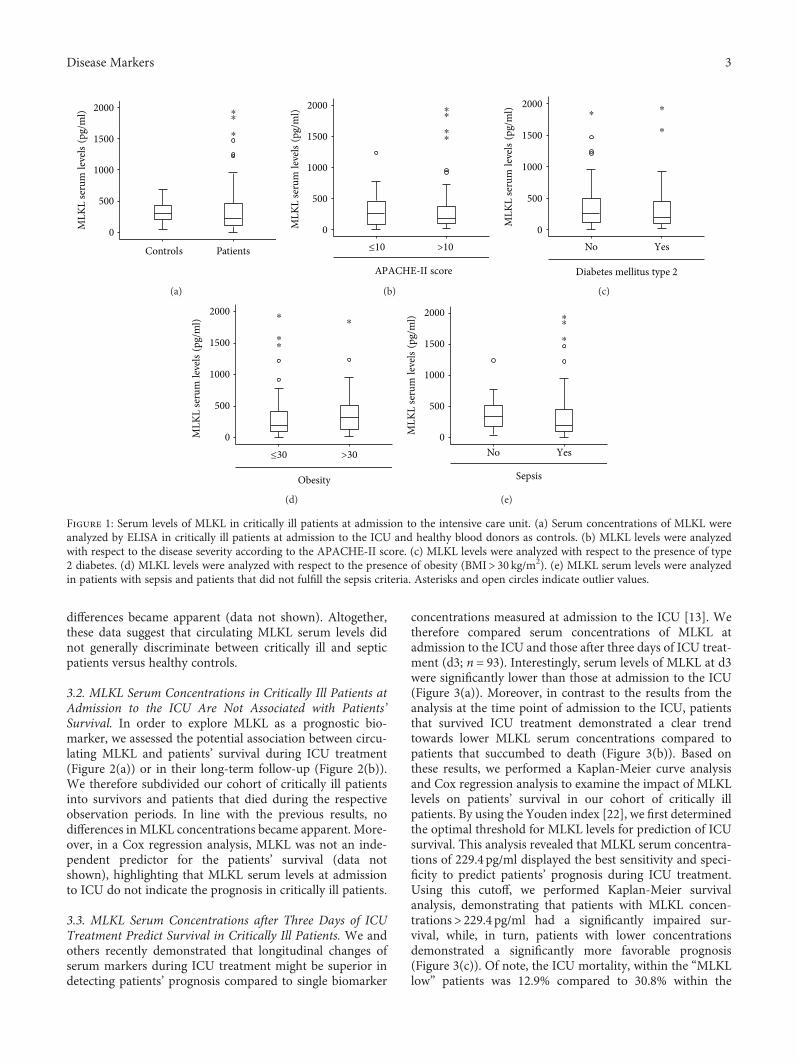
differences became apparent (data not shown). Altogether,these data suggest that circulating MLKL serum levels didnot generally discriminate between critically ill and septicpatients versus healthy controls.
3.2. MLKL Serum Concentrations in Critically Ill Patients atAdmission to the ICU Are Not Associated with Patients’Survival. In order to explore MLKL as a prognostic bio-marker, we assessed the potential association between circu-lating MLKL and patients’ survival during ICU treatment(Figure 2(a)) or in their long-term follow-up (Figure 2(b)).We therefore subdivided our cohort of critically ill patientsinto survivors and patients that died during the respectiveobservation periods. In line with the previous results, nodifferences in MLKL concentrations became apparent. More-over, in a Cox regression analysis, MLKL was not an inde-pendent predictor for the patients’ survival (data notshown), highlighting that MLKL serum levels at admissionto ICU do not indicate the prognosis in critically ill patients.
3.3. MLKL Serum Concentrations after Three Days of ICUTreatment Predict Survival in Critically Ill Patients. We andothers recently demonstrated that longitudinal changes ofserum markers during ICU treatment might be superior indetecting patients’ prognosis compared to single biomarker
concentrations measured at admission to the ICU [13]. Wetherefore compared serum concentrations of MLKL atadmission to the ICU and those after three days of ICU treat-ment (d3; n = 93). Interestingly, serum levels of MLKL at d3were significantly lower than those at admission to the ICU(Figure 3(a)). Moreover, in contrast to the results from theanalysis at the time point of admission to the ICU, patientsthat survived ICU treatment demonstrated a clear trendtowards lower MLKL serum concentrations compared topatients that succumbed to death (Figure 3(b)). Based onthese results, we performed a Kaplan-Meier curve analysisand Cox regression analysis to examine the impact of MLKLlevels on patients’ survival in our cohort of critically illpatients. By using the Youden index [22], we first determinedthe optimal threshold for MLKL levels for prediction of ICUsurvival. This analysis revealed that MLKL serum concentra-tions of 229.4 pg/ml displayed the best sensitivity and speci-ficity to predict patients’ prognosis during ICU treatment.Using this cutoff, we performed Kaplan-Meier survivalanalysis, demonstrating that patients with MLKL concen-trations> 229.4 pg/ml had a significantly impaired sur-vival, while, in turn, patients with lower concentrationsdemonstrated a significantly more favorable prognosis(Figure 3(c)). Of note, the ICU mortality, within the “MLKLlow” patients was 12.9% compared to 30.8% within the
PatientsControls
2000
1500
1000
500
0MLK
L se
rum
leve
ls(p
g/m
l) ⁎⁎
⁎
(a)
>10≤10
2000
1500
1000
500
0
APACHE-II score
MLK
L se
rum
leve
ls(p
g/m
l) ⁎⁎
⁎⁎
(b)
YesNo
2000
1500
1000
500
0
Diabetes mellitus type 2
MLK
L se
rum
leve
ls(p
g/m
l) ⁎⁎
⁎
(c)
>30≤30
2000
1500
1000
500
0
Obesity
MLK
L se
rum
leve
ls(p
g/m
l)
⁎
⁎⁎
⁎
(d)
YesNo
2000
1500
1000
500
0
Sepsis
MLK
L se
rum
leve
ls(p
g/m
l)
⁎
⁎⁎
(e)
Figure 1: Serum levels of MLKL in critically ill patients at admission to the intensive care unit. (a) Serum concentrations of MLKL wereanalyzed by ELISA in critically ill patients at admission to the ICU and healthy blood donors as controls. (b) MLKL levels were analyzedwith respect to the disease severity according to the APACHE-II score. (c) MLKL levels were analyzed with respect to the presence of type2 diabetes. (d) MLKL levels were analyzed with respect to the presence of obesity (BMI> 30 kg/m2). (e) MLKL serum levels were analyzedin patients with sepsis and patients that did not fulfill the sepsis criteria. Asterisks and open circles indicate outlier values.
3Disease Markers
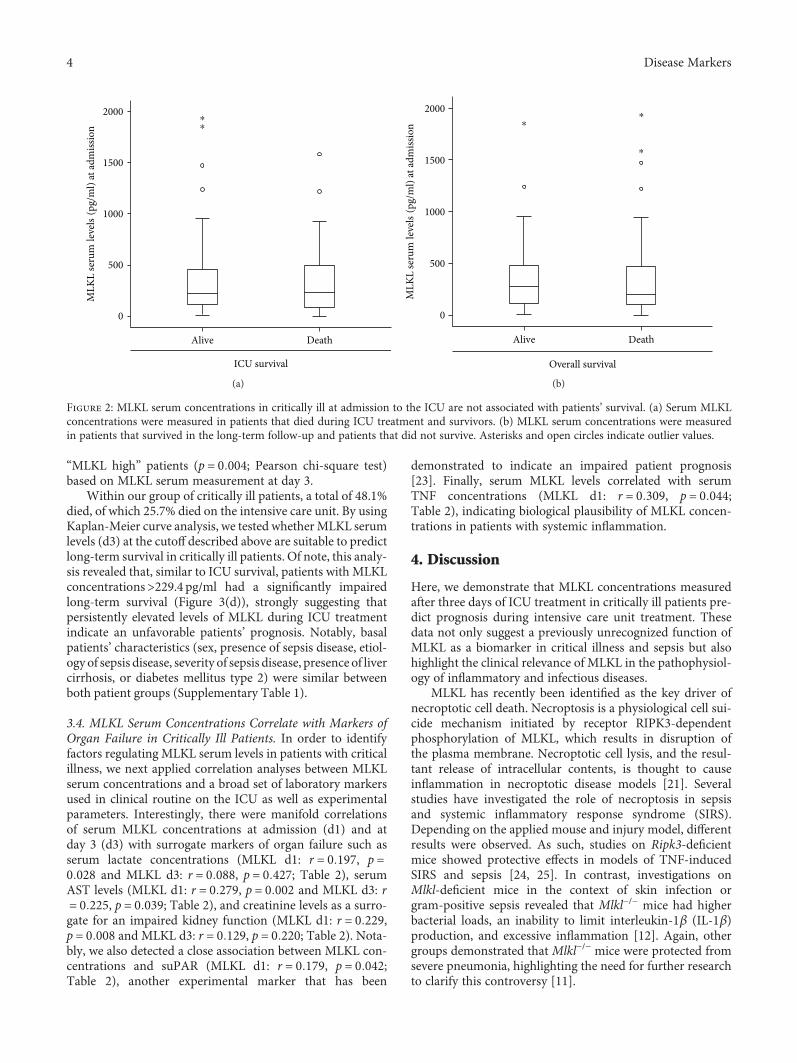
“MLKL high” patients (p = 0 004; Pearson chi-square test)based on MLKL serum measurement at day 3.
Within our group of critically ill patients, a total of 48.1%died, of which 25.7% died on the intensive care unit. By usingKaplan-Meier curve analysis, we tested whetherMLKL serumlevels (d3) at the cutoff described above are suitable to predictlong-term survival in critically ill patients. Of note, this analy-sis revealed that, similar to ICU survival, patients with MLKLconcentrations>229.4 pg/ml had a significantly impairedlong-term survival (Figure 3(d)), strongly suggesting thatpersistently elevated levels of MLKL during ICU treatmentindicate an unfavorable patients’ prognosis. Notably, basalpatients’ characteristics (sex, presence of sepsis disease, etiol-ogy of sepsis disease, severity of sepsis disease, presence of livercirrhosis, or diabetes mellitus type 2) were similar betweenboth patient groups (Supplementary Table 1).
3.4. MLKL Serum Concentrations Correlate with Markers ofOrgan Failure in Critically Ill Patients. In order to identifyfactors regulating MLKL serum levels in patients with criticalillness, we next applied correlation analyses between MLKLserum concentrations and a broad set of laboratory markersused in clinical routine on the ICU as well as experimentalparameters. Interestingly, there were manifold correlationsof serum MLKL concentrations at admission (d1) and atday 3 (d3) with surrogate markers of organ failure such asserum lactate concentrations (MLKL d1: r = 0 197, p =0 028 and MLKL d3: r = 0 088, p = 0 427; Table 2), serumAST levels (MLKL d1: r = 0 279, p = 0 002 and MLKL d3: r= 0 225, p = 0 039; Table 2), and creatinine levels as a surro-gate for an impaired kidney function (MLKL d1: r = 0 229,p = 0 008 and MLKL d3: r = 0 129, p = 0 220; Table 2). Nota-bly, we also detected a close association between MLKL con-centrations and suPAR (MLKL d1: r = 0 179, p = 0 042;Table 2), another experimental marker that has been
demonstrated to indicate an impaired patient prognosis[23]. Finally, serum MLKL levels correlated with serumTNF concentrations (MLKL d1: r = 0 309, p = 0 044;Table 2), indicating biological plausibility of MLKL concen-trations in patients with systemic inflammation.
4. Discussion
Here, we demonstrate that MLKL concentrations measuredafter three days of ICU treatment in critically ill patients pre-dict prognosis during intensive care unit treatment. Thesedata not only suggest a previously unrecognized function ofMLKL as a biomarker in critical illness and sepsis but alsohighlight the clinical relevance of MLKL in the pathophysiol-ogy of inflammatory and infectious diseases.
MLKL has recently been identified as the key driver ofnecroptotic cell death. Necroptosis is a physiological cell sui-cide mechanism initiated by receptor RIPK3-dependentphosphorylation of MLKL, which results in disruption ofthe plasma membrane. Necroptotic cell lysis, and the resul-tant release of intracellular contents, is thought to causeinflammation in necroptotic disease models [21]. Severalstudies have investigated the role of necroptosis in sepsisand systemic inflammatory response syndrome (SIRS).Depending on the applied mouse and injury model, differentresults were observed. As such, studies on Ripk3-deficientmice showed protective effects in models of TNF-inducedSIRS and sepsis [24, 25]. In contrast, investigations onMlkl-deficient mice in the context of skin infection orgram-positive sepsis revealed that Mlkl−/− mice had higherbacterial loads, an inability to limit interleukin-1β (IL-1β)production, and excessive inflammation [12]. Again, othergroups demonstrated that Mlkl−/− mice were protected fromsevere pneumonia, highlighting the need for further researchto clarify this controversy [11].
DeathAlive
2000
1500
1000
500
0
ICU survival
MLK
L se
rum
leve
ls(p
g/m
l) at
adm
issio
n
⁎⁎
(a)
DeathAlive
2000
1500
1000
500
0
Overall survival
MLK
L se
rum
leve
ls(p
g/m
l) at
adm
issio
n ⁎⁎
⁎
(b)
Figure 2: MLKL serum concentrations in critically ill at admission to the ICU are not associated with patients’ survival. (a) Serum MLKLconcentrations were measured in patients that died during ICU treatment and survivors. (b) MLKL serum concentrations were measuredin patients that survived in the long-term follow-up and patients that did not survive. Asterisks and open circles indicate outlier values.
4 Disease Markers
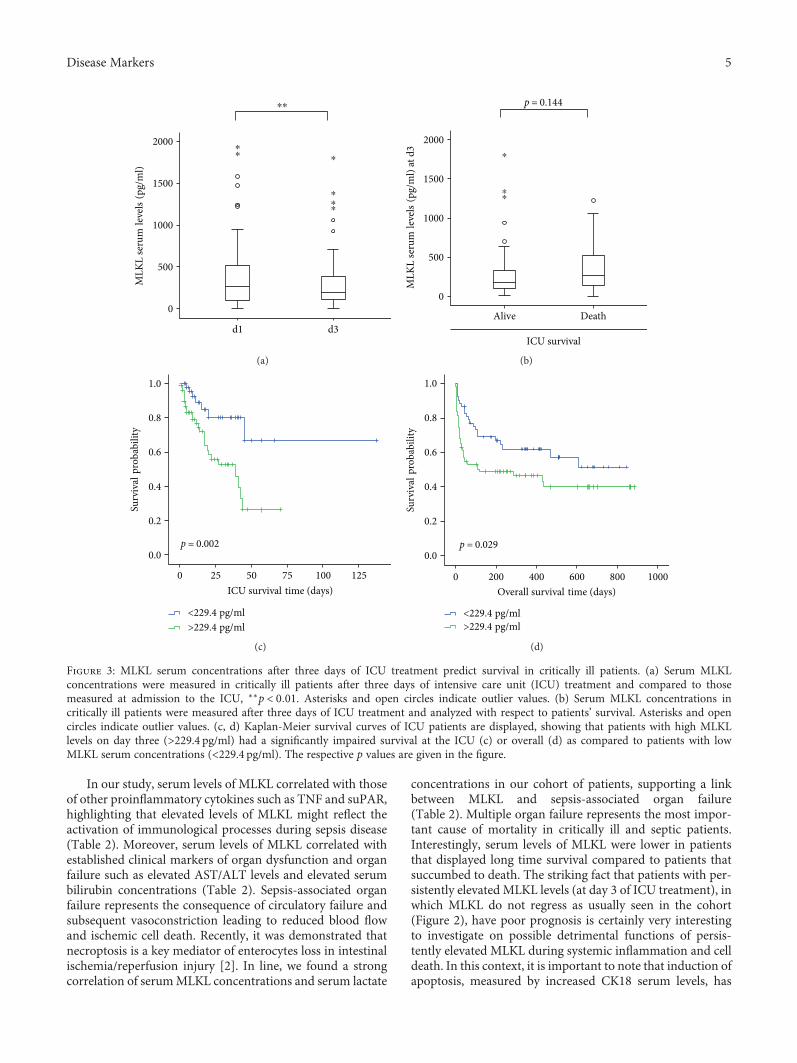
In our study, serum levels of MLKL correlated with thoseof other proinflammatory cytokines such as TNF and suPAR,highlighting that elevated levels of MLKL might reflect theactivation of immunological processes during sepsis disease(Table 2). Moreover, serum levels of MLKL correlated withestablished clinical markers of organ dysfunction and organfailure such as elevated AST/ALT levels and elevated serumbilirubin concentrations (Table 2). Sepsis-associated organfailure represents the consequence of circulatory failure andsubsequent vasoconstriction leading to reduced blood flowand ischemic cell death. Recently, it was demonstrated thatnecroptosis is a key mediator of enterocytes loss in intestinalischemia/reperfusion injury [2]. In line, we found a strongcorrelation of serumMLKL concentrations and serum lactate
concentrations in our cohort of patients, supporting a linkbetween MLKL and sepsis-associated organ failure(Table 2). Multiple organ failure represents the most impor-tant cause of mortality in critically ill and septic patients.Interestingly, serum levels of MLKL were lower in patientsthat displayed long time survival compared to patients thatsuccumbed to death. The striking fact that patients with per-sistently elevated MLKL levels (at day 3 of ICU treatment), inwhich MLKL do not regress as usually seen in the cohort(Figure 2), have poor prognosis is certainly very interestingto investigate on possible detrimental functions of persis-tently elevated MLKL during systemic inflammation and celldeath. In this context, it is important to note that induction ofapoptosis, measured by increased CK18 serum levels, has
d3d1
2000
1500
1000
500
0
MLK
L se
rum
leve
ls(p
g/m
l)⁎⁎
⁎⁎
⁎
⁎
⁎⁎
(a)
DeathAlive
2000
1500
1000
500
0
ICU survival
MLK
L se
rum
leve
ls(p
g/m
l) at
d3
p = 0.144
⁎⁎
⁎
(b)
1251007550250
1.0
0.8
0.6
0.4
0.2
0.0
>229.4 pg/ml<229.4 pg/ml
Surv
ival
prob
abili
ty
ICU survival time (days)
p = 0.002
(c)
10008006004002000
1.0
0.8
0.6
0.4
0.2
0.0
Surv
ival
prob
abili
ty
Overall survival time (days)
p = 0.029
>229.4 pg/ml<229.4 pg/ml
(d)
Figure 3: MLKL serum concentrations after three days of ICU treatment predict survival in critically ill patients. (a) Serum MLKLconcentrations were measured in critically ill patients after three days of intensive care unit (ICU) treatment and compared to thosemeasured at admission to the ICU, ∗∗p < 0 01. Asterisks and open circles indicate outlier values. (b) Serum MLKL concentrations incritically ill patients were measured after three days of ICU treatment and analyzed with respect to patients’ survival. Asterisks and opencircles indicate outlier values. (c, d) Kaplan-Meier survival curves of ICU patients are displayed, showing that patients with high MLKLlevels on day three (>229.4 pg/ml) had a significantly impaired survival at the ICU (c) or overall (d) as compared to patients with lowMLKL serum concentrations (<229.4 pg/ml). The respective p values are given in the figure.
5Disease Markers
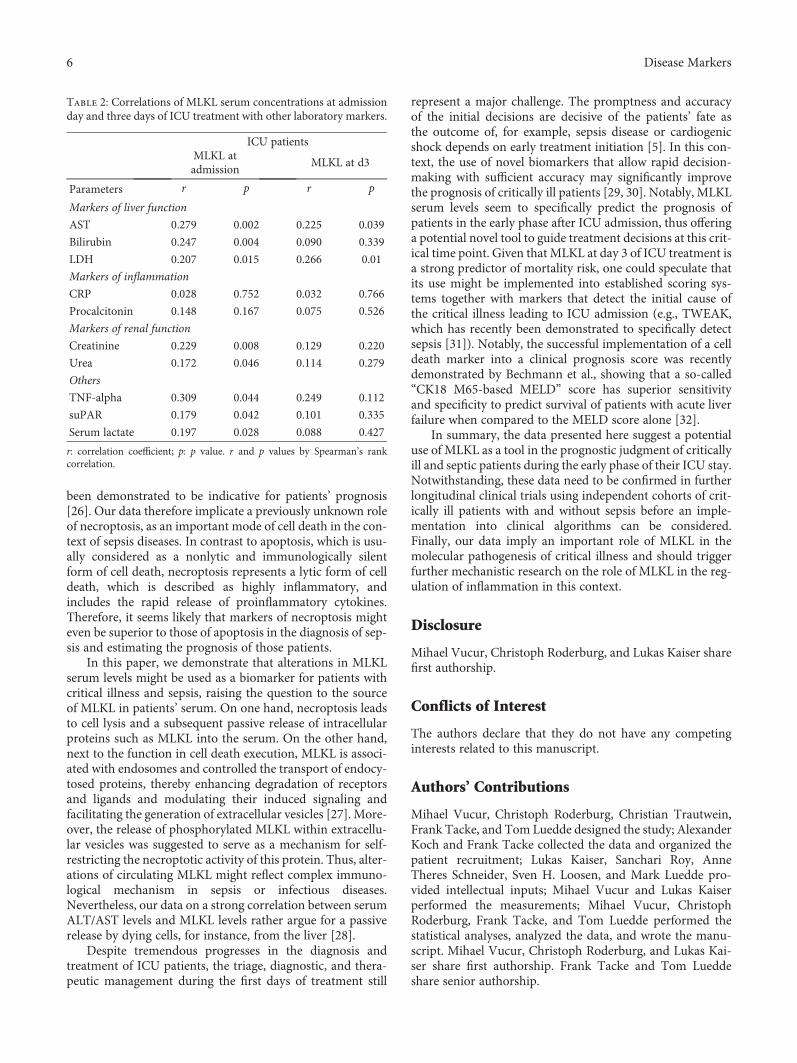
been demonstrated to be indicative for patients’ prognosis[26]. Our data therefore implicate a previously unknown roleof necroptosis, as an important mode of cell death in the con-text of sepsis diseases. In contrast to apoptosis, which is usu-ally considered as a nonlytic and immunologically silentform of cell death, necroptosis represents a lytic form of celldeath, which is described as highly inflammatory, andincludes the rapid release of proinflammatory cytokines.Therefore, it seems likely that markers of necroptosis mighteven be superior to those of apoptosis in the diagnosis of sep-sis and estimating the prognosis of those patients.
In this paper, we demonstrate that alterations in MLKLserum levels might be used as a biomarker for patients withcritical illness and sepsis, raising the question to the sourceof MLKL in patients’ serum. On one hand, necroptosis leadsto cell lysis and a subsequent passive release of intracellularproteins such as MLKL into the serum. On the other hand,next to the function in cell death execution, MLKL is associ-ated with endosomes and controlled the transport of endocy-tosed proteins, thereby enhancing degradation of receptorsand ligands and modulating their induced signaling andfacilitating the generation of extracellular vesicles [27]. More-over, the release of phosphorylated MLKL within extracellu-lar vesicles was suggested to serve as a mechanism for self-restricting the necroptotic activity of this protein. Thus, alter-ations of circulating MLKL might reflect complex immuno-logical mechanism in sepsis or infectious diseases.Nevertheless, our data on a strong correlation between serumALT/AST levels and MLKL levels rather argue for a passiverelease by dying cells, for instance, from the liver [28].
Despite tremendous progresses in the diagnosis andtreatment of ICU patients, the triage, diagnostic, and thera-peutic management during the first days of treatment still
represent a major challenge. The promptness and accuracyof the initial decisions are decisive of the patients’ fate asthe outcome of, for example, sepsis disease or cardiogenicshock depends on early treatment initiation [5]. In this con-text, the use of novel biomarkers that allow rapid decision-making with sufficient accuracy may significantly improvethe prognosis of critically ill patients [29, 30]. Notably, MLKLserum levels seem to specifically predict the prognosis ofpatients in the early phase after ICU admission, thus offeringa potential novel tool to guide treatment decisions at this crit-ical time point. Given that MLKL at day 3 of ICU treatment isa strong predictor of mortality risk, one could speculate thatits use might be implemented into established scoring sys-tems together with markers that detect the initial cause ofthe critical illness leading to ICU admission (e.g., TWEAK,which has recently been demonstrated to specifically detectsepsis [31]). Notably, the successful implementation of a celldeath marker into a clinical prognosis score was recentlydemonstrated by Bechmann et al., showing that a so-called“CK18 M65-based MELD” score has superior sensitivityand specificity to predict survival of patients with acute liverfailure when compared to the MELD score alone [32].
In summary, the data presented here suggest a potentialuse of MLKL as a tool in the prognostic judgment of criticallyill and septic patients during the early phase of their ICU stay.Notwithstanding, these data need to be confirmed in furtherlongitudinal clinical trials using independent cohorts of crit-ically ill patients with and without sepsis before an imple-mentation into clinical algorithms can be considered.Finally, our data imply an important role of MLKL in themolecular pathogenesis of critical illness and should triggerfurther mechanistic research on the role of MLKL in the reg-ulation of inflammation in this context.
Disclosure
Mihael Vucur, Christoph Roderburg, and Lukas Kaiser sharefirst authorship.
Conflicts of Interest
The authors declare that they do not have any competinginterests related to this manuscript.
Authors’ Contributions
Mihael Vucur, Christoph Roderburg, Christian Trautwein,Frank Tacke, and Tom Luedde designed the study; AlexanderKoch and Frank Tacke collected the data and organized thepatient recruitment; Lukas Kaiser, Sanchari Roy, AnneTheres Schneider, Sven H. Loosen, and Mark Luedde pro-vided intellectual inputs; Mihael Vucur and Lukas Kaiserperformed the measurements; Mihael Vucur, ChristophRoderburg, Frank Tacke, and Tom Luedde performed thestatistical analyses, analyzed the data, and wrote the manu-script. Mihael Vucur, Christoph Roderburg, and Lukas Kai-ser share first authorship. Frank Tacke and Tom Lueddeshare senior authorship.
Table 2: Correlations of MLKL serum concentrations at admissionday and three days of ICU treatment with other laboratory markers.
ICU patientsMLKL atadmission
MLKL at d3
Parameters r p r p
Markers of liver function
AST 0.279 0.002 0.225 0.039
Bilirubin 0.247 0.004 0.090 0.339
LDH 0.207 0.015 0.266 0.01
Markers of inflammation
CRP 0.028 0.752 0.032 0.766
Procalcitonin 0.148 0.167 0.075 0.526
Markers of renal function
Creatinine 0.229 0.008 0.129 0.220
Urea 0.172 0.046 0.114 0.279
Others
TNF-alpha 0.309 0.044 0.249 0.112
suPAR 0.179 0.042 0.101 0.335
Serum lactate 0.197 0.028 0.088 0.427
r: correlation coefficient; p: p value. r and p values by Spearman’s rankcorrelation.
6 Disease Markers
Acknowledgments
This work was supported by the German Cancer Aid(Deutsche Krebshilfe 110043 and aMildred Scheel Professor-ship award), the German Research Foundation (LU 1360/3-1and SFB-TRR57/P06), the EMBO Young Investigator Pro-gram, the Jung-Stiftung für Wissenschaft und Forschung,and a grant from the medical faculty of the RWTH AachenUniversity to Tom Luedde. Mihael Vucur was supported bythe START Program of the Faculty of Medicine, RWTHAachen University.
Supplementary Materials
Supplementary Figure 1. Serum levels of MLKL in healthyblood donors and patients with different inflammatory ormalignant diseases. Serum concentrations of MLKL wereanalyzed by ELISA in patients with different inflammatoryor malignant diseases and compared to healthy blood donorsas controls. Supplementary Table 1. Patients’ characteristicswithin low-MLKL and high-MLKL group. Comparison ofbasal patients’ characteristics (sex, presence of sepsis disease,etiology of sepsis disease, severity of sepsis disease, presenceof liver cirrhosis, or diabetes mellitus type 2) between thelow-MLKL and the high-MLKL group, based on the cutoffof 229.4 pg/ml. (Supplementary Materials)
References
[1] I. Jorgensen, M. Rayamajhi, and E. A. Miao, “Programmed celldeath as a defence against infection,” Nature Reviews Immu-nology, vol. 17, no. 3, pp. 151–164, 2017.
[2] L. Galluzzi, O. Kepp, F. K. Chan, and G. Kroemer, “Necropto-sis: mechanisms and relevance to disease,” Annual Review ofPathology, vol. 12, no. 1, pp. 103–130, 2017.
[3] J. Gautheron, M. Vucur, A. T. Schneider et al., “Thenecroptosis-inducing kinase RIPK3 dampens adipose tissueinflammation and glucose intolerance,” Nature Communica-tions, vol. 7, article 11869, 2016.
[4] J. Gautheron, M. Vucur, F. Reisinger et al., “A positivefeedback loop between RIP3 and JNK controls non-alcoholicsteatohepatitis,” EMBO Molecular Medicine, vol. 6, no. 8,pp. 1062–1074, 2014.
[5] M. Vucur, F. Reisinger, J. Gautheron et al., “RIP3 inhibitsinflammatory hepatocarcinogenesis but promotes cholestasisby controlling caspase-8- and JNK-dependent compensatorycell proliferation,” Cell Reports, vol. 4, no. 4, pp. 776–790, 2013.
[6] M. Luedde, M. Lutz, N. Carter et al., “RIP3, a kinase promotingnecroptotic cell death, mediates adverse remodelling aftermyocardial infarction,” Cardiovascular Research, vol. 103,no. 2, pp. 206–216, 2014.
[7] J. M. Murphy, P. E. Czabotar, J. M. Hildebrand et al., “Thepseudokinase MLKL mediates necroptosis via a molecularswitch mechanism,” Immunity, vol. 39, no. 3, pp. 443–453,2013.
[8] L. Sun, H. Wang, Z. Wang et al., “Mixed lineage kinasedomain-like protein mediates necrosis signaling downstreamof RIP3 kinase,” Cell, vol. 148, no. 1-2, pp. 213–227, 2012.
[9] A. Linkermann and D. R. Green, “Necroptosis,” The NewEngland Journal of Medicine, vol. 370, no. 5, pp. 455–465,2014.
[10] A. Kaczmarek, P. Vandenabeele, and D. V. Krysko, “Necropto-sis: the release of damage-associated molecular patterns and itsphysiological relevance,” Immunity, vol. 38, no. 2, pp. 209–223, 2013.
[11] D. Ahn and A. Prince, “Participation of necroptosis in the hostresponse to acute bacterial pneumonia,” Journal of InnateImmunity, vol. 9, no. 3, pp. 262–270, 2017.
[12] K. Kitur, S. Wachtel, A. Brown et al., “Necroptosis promotesStaphylococcus aureus clearance by inhibiting excessiveinflammatory signaling,” Cell Reports, vol. 16, no. 8,pp. 2219–2230, 2016.
[13] C. Roderburg, F. Benz, D. V. Cardenas et al., “Persistentlyelevated osteopontin serum levels predict mortality in criticallyill patients,” Critical Care, vol. 19, no. 1, p. 271, 2015.
[14] M. Singer, C. S. Deutschman, C. W. Seymour et al., “Thethird international consensus definitions for sepsis and sep-tic shock (Sepsis-3),” JAMA, vol. 315, no. 8, pp. 801–810,2016.
[15] F. Tacke, C. Roderburg, F. Benz et al., “Levels of circulatingmiR-133a are elevated in sepsis and predict mortality in criti-cally ill patients,” Critical Care Medicine, vol. 42, no. 5,pp. 1096–1104, 2014.
[16] A. Koch, E. Sanson, A. Helm, S. Voigt, C. Trautwein, andF. Tacke, “Regulation and prognostic relevance of serumghrelin concentrations in critical illness and sepsis,” CriticalCare, vol. 14, no. 3, p. R94, 2010.
[17] A. Koch, O. A. Gressner, E. Sanson, F. Tacke, andC. Trautwein, “Serum resistin levels in critically ill patientsare associated with inflammation, organ dysfunction andmetabolism and may predict survival of non-septic patients,”Critical Care, vol. 13, no. 3, p. R95, 2009.
[18] C. Roderburg, G.W. Urban, K. Bettermann et al., “Micro-RNAprofiling reveals a role for miR-29 in human and murine liverfibrosis,” Hepatology, vol. 53, no. 1, pp. 209–218, 2011.
[19] F. Benz, C. Roderburg, D. Vargas Cardenas et al., “U6 isunsuitable for normalization of serum miRNA levels inpatients with sepsis or liver fibrosis,” Experimental & Molecu-lar Medicine, vol. 45, no. 9, article e42, 2013.
[20] C. Roderburg, F. Benz, D. Vargas Cardenas et al., “ElevatedmiR-122 serum levels are an independent marker of liverinjury in inflammatory diseases,” Liver International, vol. 35,no. 4, pp. 1172–1184, 2015.
[21] M. B. Afonso, P. M. Rodrigues, T. Carvalho et al., “Necroptosisis a key pathogenic event in human and experimental murinemodels of non-alcoholic steatohepatitis,” Clinical Science,vol. 129, no. 8, pp. 721–739, 2015.
[22] W. J. Youden, “Index for rating diagnostic tests,” Cancer,vol. 3, no. 1, pp. 32–35, 1950.
[23] A. Koch, S. Voigt, C. Kruschinski et al., “Circulating solubleurokinase plasminogen activator receptor is stably elevatedduring the first week of treatment in the intensive care unitand predicts mortality in critically ill patients,” Critical Care,vol. 15, no. 1, p. R63, 2011.
[24] L. Duprez, N. Takahashi, F. vanHauwermeiren et al., “RIPkinase-dependent necrosis drives lethal systemic inflamma-tory response syndrome,” Immunity, vol. 35, no. 6, pp. 908–918, 2011.
[25] A. Sharma, S. Matsuo, W. L. Yang, Z. Wang, and P. Wang,“Receptor-interacting protein kinase 3 deficiency inhibitsimmune cell infiltration and attenuates organ injury in sepsis,”Critical Care, vol. 18, no. 4, p. R142, 2014.
7Disease Markers
[26] D. J. Moore, A. Greystoke, F. Butt et al., “A pilot study asses-sing the prognostic value of CK18 and nDNA biomarkers insevere sepsis patients,” Clinical Drug Investigation, vol. 32,no. 3, pp. 179–187, 2012.
[27] S. Yoon, A. Kovalenko, K. Bogdanov, and D. Wallach, “MLKL,the protein that mediates necroptosis, also regulates endoso-mal trafficking and extracellular vesicle generation,” Immu-nity, vol. 47, no. 1, pp. 51–65.e7, 2017.
[28] P. Strnad, F. Tacke, A. Koch, and C. Trautwein, “Liver—guar-dian, modifier and target of sepsis,” Nature Reviews Gastroen-terology & Hepatology, vol. 14, no. 1, pp. 55–66, 2017.
[29] D. F. Gaieski, M. E. Mikkelsen, R. A. Band et al., “Impact oftime to antibiotics on survival in patients with severe sepsisor septic shock in whom early goal-directed therapy was initi-ated in the emergency department,” Critical Care Medicine,vol. 38, no. 4, pp. 1045–1053, 2010.
[30] M. Harker, S. Carville, R. Henderson, H. Gray, and on behalf ofthe Guideline Development Group, “Key recommendationsand evidence from the NICE guideline for the acute manage-ment of ST-segment-elevation myocardial infarction,” Heart,vol. 100, no. 7, pp. 536–543, 2014.
[31] C. Roderburg, F. Benz, F. Schüller et al., “Serum levels of TNFreceptor ligands are dysregulated in sepsis and predict mortal-ity in critically ill patients,” PLoS One, vol. 11, no. 4, articlee0153765, 2016.
[32] L. P. Bechmann, C. Jochum, P. Kocabayoglu et al., “Cytokera-tin 18-based modification of theMELD score improves predic-tion of spontaneous survival after acute liver injury,” Journal ofHepatology, vol. 53, no. 4, pp. 639–647, 2010.
8 Disease Markers
Research ArticleSerum Cytokine Profiles in Patients with Dengue Fever at theAcute Infection Phase
Junyuan Huang ,1 Weiwen Liang ,2 Shaoyan Chen ,1 Ye Zhu ,1 Haiming Chen ,1
Chris Ka Pun Mok ,2,3 and Yingchun Zhou 1
1First Affiliated Hospital of Guangzhou University of Chinese Medicine, Guangzhou, Guangdong, China2State Key Laboratory of Respiratory Disease, National Clinical Research Center for Respiratory Disease,First Affiliated Hospital of Guangzhou Medical University, Guangzhou, Guangdong, China3HKU-Pasteur Research Pole, School of Public Health, HKU Li Ka Shing Faculty of Medicine,The University of Hong Kong, Hong Kong
Correspondence should be addressed to Yingchun Zhou; [email protected]
Junyuan Huang and Weiwen Liang contributed equally to this work.
Received 1 November 2017; Revised 22 December 2017; Accepted 2 January 2018; Published 30 January 2018
Academic Editor: Hyundoo Hwang
Copyright © 2018 Junyuan Huang et al. This is an open access article distributed under the Creative Commons Attribution License,which permits unrestricted use, distribution, and reproduction in any medium, provided the original work is properly cited.
Background. Dengue virus (DENV) is transmitted by mosquito and has been circulating in Guangdong, China, for over 30 years.Dengue infection causes mild to severe disease symptoms in human. Cytokine profiles were suggested to be crucial especially duringthe acute stage in the dengue infection. Aim. To determine the cytokine profiles at the acute stage in patients with primary orsecondary dengue infection in Guangzhou city in the 2014 outbreak. Methods. We investigated 23 inflammatory cytokines inserum collected from dengue-infected patients and analyzed their correlations with their clinical indexes. Results. Theconcentrations of CXCL9, IP-10, CXCL11, IL-8, IL-10, and CCL2 in serum were significantly higher in the groups of DENV-infected patients during the first two weeks than those of control group while CCL17 and CXCL5 showed lower expression levelin the patients. Among these cytokines, CXCL9, CCL17, and CXCL5 showed statistical difference between the groups of primaryand secondary infections. The platelet count and lactate dehydrogenase were correlated with the level of CCL17 and MIP-1α/CXCL5, respectively, in the group of secondary infection. Conclusions. We determined the cytokine profiles in serum of thepatients during the 2014 dengue outbreak. The expression of specific cytokines was associated with the secondary infection.
1. Introduction
Dengue virus (DENV) as a member of Flaviviridae family isan enveloped, positive-sense, single-strain RNA virus withthe size of around 11 kb. It is mainly transmitted by Aedesalbopictus resulting in dengue fever (DF) and, in some cases,progresses to dengue hemorrhagic fever (DHF) and dengueshock syndrome (DSS). The dengue outbreaks frequentlyoccurred in tropical and subtropical climates areas. A reportindicated that there were around 96 million with apparentdengue infections and 294 million with asymptomatic infec-tions globally in 2010 [1]. During 2010 to 2015, around15.7% of DENV-infected cases developed DHF and 0.7% ofDENV-infected cases died globally. In endemic areas, many
people have been infected by dengue virus more than oncein their entire life. Indeed, around 55.9% of DENV-infectedcases were known as secondary infection [2]. The nonneutra-lizing antibodies against heterotypic DENV in secondaryinfection was thought to be partially responsible for thesevere dengue due to the antibody-dependent enhancement(ADE) [3]. However, many cases of primary infection couldalso progress to severe dengue fever.
Cytokines are a group of protein which serve as signalingtransducer and modulator to regulate the host immunityespecially during infection. Numbers of studies have investi-gated the cytokine profiles in the serum samples of thedengue-infected patients in order to understand the immuneresponses against this pathogen. Importantly, some studies
HindawiDisease MarkersVolume 2018, Article ID 8403937, 8 pageshttps://doi.org/10.1155/2018/8403937
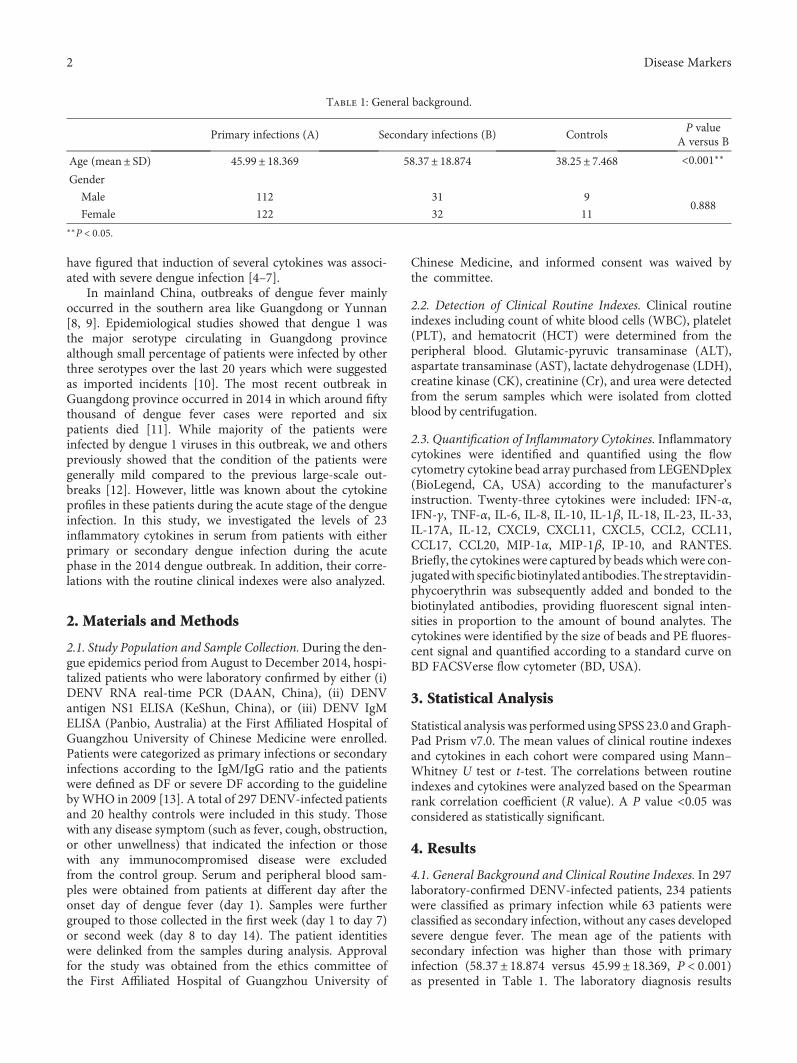
have figured that induction of several cytokines was associ-ated with severe dengue infection [4–7].
In mainland China, outbreaks of dengue fever mainlyoccurred in the southern area like Guangdong or Yunnan[8, 9]. Epidemiological studies showed that dengue 1 wasthe major serotype circulating in Guangdong provincealthough small percentage of patients were infected by otherthree serotypes over the last 20 years which were suggestedas imported incidents [10]. The most recent outbreak inGuangdong province occurred in 2014 in which around fiftythousand of dengue fever cases were reported and sixpatients died [11]. While majority of the patients wereinfected by dengue 1 viruses in this outbreak, we and otherspreviously showed that the condition of the patients weregenerally mild compared to the previous large-scale out-breaks [12]. However, little was known about the cytokineprofiles in these patients during the acute stage of the dengueinfection. In this study, we investigated the levels of 23inflammatory cytokines in serum from patients with eitherprimary or secondary dengue infection during the acutephase in the 2014 dengue outbreak. In addition, their corre-lations with the routine clinical indexes were also analyzed.
2. Materials and Methods
2.1. Study Population and Sample Collection.During the den-gue epidemics period from August to December 2014, hospi-talized patients who were laboratory confirmed by either (i)DENV RNA real-time PCR (DAAN, China), (ii) DENVantigen NS1 ELISA (KeShun, China), or (iii) DENV IgMELISA (Panbio, Australia) at the First Affiliated Hospital ofGuangzhou University of Chinese Medicine were enrolled.Patients were categorized as primary infections or secondaryinfections according to the IgM/IgG ratio and the patientswere defined as DF or severe DF according to the guidelinebyWHO in 2009 [13]. A total of 297 DENV-infected patientsand 20 healthy controls were included in this study. Thosewith any disease symptom (such as fever, cough, obstruction,or other unwellness) that indicated the infection or thosewith any immunocompromised disease were excludedfrom the control group. Serum and peripheral blood sam-ples were obtained from patients at different day after theonset day of dengue fever (day 1). Samples were furthergrouped to those collected in the first week (day 1 to day 7)or second week (day 8 to day 14). The patient identitieswere delinked from the samples during analysis. Approvalfor the study was obtained from the ethics committee ofthe First Affiliated Hospital of Guangzhou University of
Chinese Medicine, and informed consent was waived bythe committee.
2.2. Detection of Clinical Routine Indexes. Clinical routineindexes including count of white blood cells (WBC), platelet(PLT), and hematocrit (HCT) were determined from theperipheral blood. Glutamic-pyruvic transaminase (ALT),aspartate transaminase (AST), lactate dehydrogenase (LDH),creatine kinase (CK), creatinine (Cr), and urea were detectedfrom the serum samples which were isolated from clottedblood by centrifugation.
2.3. Quantification of Inflammatory Cytokines. Inflammatorycytokines were identified and quantified using the flowcytometry cytokine bead array purchased from LEGENDplex(BioLegend, CA, USA) according to the manufacturer’sinstruction. Twenty-three cytokines were included: IFN-α,IFN-γ, TNF-α, IL-6, IL-8, IL-10, IL-1β, IL-18, IL-23, IL-33,IL-17A, IL-12, CXCL9, CXCL11, CXCL5, CCL2, CCL11,CCL17, CCL20, MIP-1α, MIP-1β, IP-10, and RANTES.Briefly, the cytokines were captured by beads which were con-jugatedwith specificbiotinylatedantibodies.Thestreptavidin-phycoerythrin was subsequently added and bonded to thebiotinylated antibodies, providing fluorescent signal inten-sities in proportion to the amount of bound analytes. Thecytokines were identified by the size of beads and PE fluores-cent signal and quantified according to a standard curve onBD FACSVerse flow cytometer (BD, USA).
3. Statistical Analysis
Statistical analysis was performed using SPSS 23.0 andGraph-Pad Prism v7.0. The mean values of clinical routine indexesand cytokines in each cohort were compared using Mann–Whitney U test or t-test. The correlations between routineindexes and cytokines were analyzed based on the Spearmanrank correlation coefficient (R value). A P value <0.05 wasconsidered as statistically significant.
4. Results
4.1. General Background and Clinical Routine Indexes. In 297laboratory-confirmed DENV-infected patients, 234 patientswere classified as primary infection while 63 patients wereclassified as secondary infection, without any cases developedsevere dengue fever. The mean age of the patients withsecondary infection was higher than those with primaryinfection (58.37± 18.874 versus 45.99± 18.369, P < 0 001)as presented in Table 1. The laboratory diagnosis results
Table 1: General background.
Primary infections (A) Secondary infections (B) ControlsP value
A versus B
Age (mean± SD) 45.99± 18.369 58.37± 18.874 38.25± 7.468 <0.001∗∗
Gender
Male 112 31 90.888
Female 122 32 11∗∗P < 0 05.
2 Disease Markers
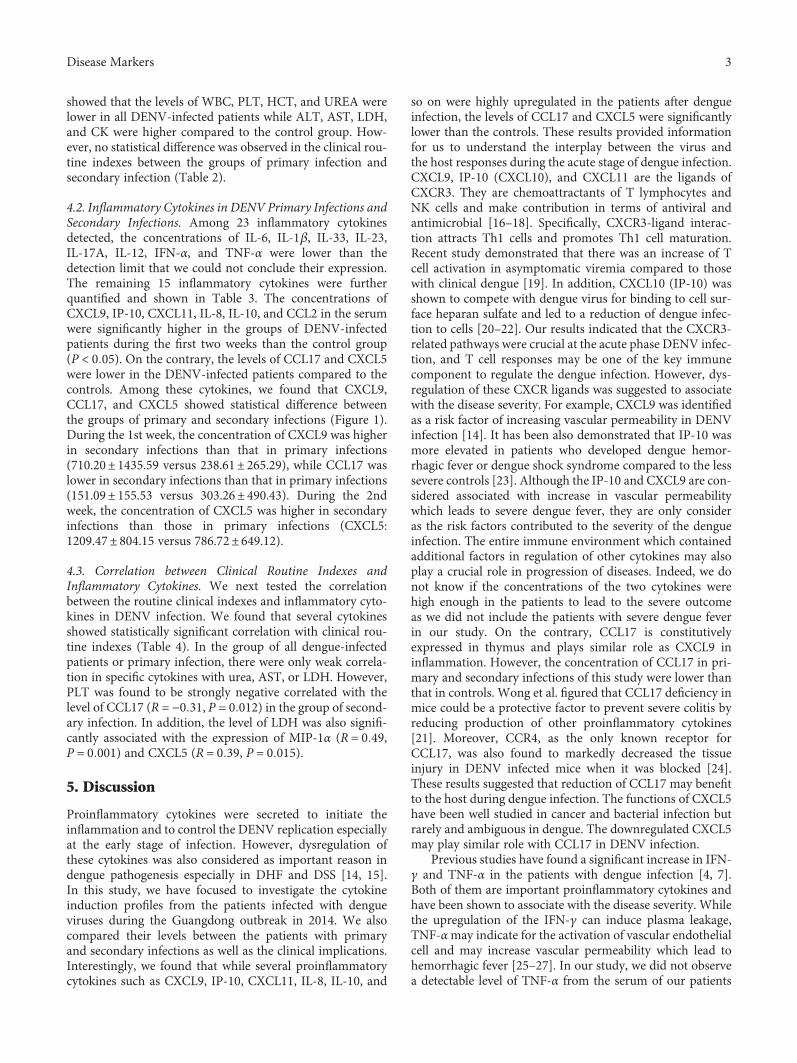
showed that the levels of WBC, PLT, HCT, and UREA werelower in all DENV-infected patients while ALT, AST, LDH,and CK were higher compared to the control group. How-ever, no statistical difference was observed in the clinical rou-tine indexes between the groups of primary infection andsecondary infection (Table 2).
4.2. Inflammatory Cytokines in DENV Primary Infections andSecondary Infections. Among 23 inflammatory cytokinesdetected, the concentrations of IL-6, IL-1β, IL-33, IL-23,IL-17A, IL-12, IFN-α, and TNF-α were lower than thedetection limit that we could not conclude their expression.The remaining 15 inflammatory cytokines were furtherquantified and shown in Table 3. The concentrations ofCXCL9, IP-10, CXCL11, IL-8, IL-10, and CCL2 in the serumwere significantly higher in the groups of DENV-infectedpatients during the first two weeks than the control group(P < 0 05). On the contrary, the levels of CCL17 and CXCL5were lower in the DENV-infected patients compared to thecontrols. Among these cytokines, we found that CXCL9,CCL17, and CXCL5 showed statistical difference betweenthe groups of primary and secondary infections (Figure 1).During the 1st week, the concentration of CXCL9 was higherin secondary infections than that in primary infections(710.20± 1435.59 versus 238.61± 265.29), while CCL17 waslower in secondary infections than that in primary infections(151.09± 155.53 versus 303.26± 490.43). During the 2ndweek, the concentration of CXCL5 was higher in secondaryinfections than those in primary infections (CXCL5:1209.47± 804.15 versus 786.72± 649.12).
4.3. Correlation between Clinical Routine Indexes andInflammatory Cytokines. We next tested the correlationbetween the routine clinical indexes and inflammatory cyto-kines in DENV infection. We found that several cytokinesshowed statistically significant correlation with clinical rou-tine indexes (Table 4). In the group of all dengue-infectedpatients or primary infection, there were only weak correla-tion in specific cytokines with urea, AST, or LDH. However,PLT was found to be strongly negative correlated with thelevel of CCL17 (R = −0 31, P = 0 012) in the group of second-ary infection. In addition, the level of LDH was also signifi-cantly associated with the expression of MIP-1α (R = 0 49,P = 0 001) and CXCL5 (R = 0 39, P = 0 015).
5. Discussion
Proinflammatory cytokines were secreted to initiate theinflammation and to control the DENV replication especiallyat the early stage of infection. However, dysregulation ofthese cytokines was also considered as important reason indengue pathogenesis especially in DHF and DSS [14, 15].In this study, we have focused to investigate the cytokineinduction profiles from the patients infected with dengueviruses during the Guangdong outbreak in 2014. We alsocompared their levels between the patients with primaryand secondary infections as well as the clinical implications.Interestingly, we found that while several proinflammatorycytokines such as CXCL9, IP-10, CXCL11, IL-8, IL-10, and
so on were highly upregulated in the patients after dengueinfection, the levels of CCL17 and CXCL5 were significantlylower than the controls. These results provided informationfor us to understand the interplay between the virus andthe host responses during the acute stage of dengue infection.CXCL9, IP-10 (CXCL10), and CXCL11 are the ligands ofCXCR3. They are chemoattractants of T lymphocytes andNK cells and make contribution in terms of antiviral andantimicrobial [16–18]. Specifically, CXCR3-ligand interac-tion attracts Th1 cells and promotes Th1 cell maturation.Recent study demonstrated that there was an increase of Tcell activation in asymptomatic viremia compared to thosewith clinical dengue [19]. In addition, CXCL10 (IP-10) wasshown to compete with dengue virus for binding to cell sur-face heparan sulfate and led to a reduction of dengue infec-tion to cells [20–22]. Our results indicated that the CXCR3-related pathways were crucial at the acute phase DENV infec-tion, and T cell responses may be one of the key immunecomponent to regulate the dengue infection. However, dys-regulation of these CXCR ligands was suggested to associatewith the disease severity. For example, CXCL9 was identifiedas a risk factor of increasing vascular permeability in DENVinfection [14]. It has been also demonstrated that IP-10 wasmore elevated in patients who developed dengue hemor-rhagic fever or dengue shock syndrome compared to the lesssevere controls [23]. Although the IP-10 and CXCL9 are con-sidered associated with increase in vascular permeabilitywhich leads to severe dengue fever, they are only consideras the risk factors contributed to the severity of the dengueinfection. The entire immune environment which containedadditional factors in regulation of other cytokines may alsoplay a crucial role in progression of diseases. Indeed, we donot know if the concentrations of the two cytokines werehigh enough in the patients to lead to the severe outcomeas we did not include the patients with severe dengue feverin our study. On the contrary, CCL17 is constitutivelyexpressed in thymus and plays similar role as CXCL9 ininflammation. However, the concentration of CCL17 in pri-mary and secondary infections of this study were lower thanthat in controls. Wong et al. figured that CCL17 deficiency inmice could be a protective factor to prevent severe colitis byreducing production of other proinflammatory cytokines[21]. Moreover, CCR4, as the only known receptor forCCL17, was also found to markedly decreased the tissueinjury in DENV infected mice when it was blocked [24].These results suggested that reduction of CCL17 may benefitto the host during dengue infection. The functions of CXCL5have been well studied in cancer and bacterial infection butrarely and ambiguous in dengue. The downregulated CXCL5may play similar role with CCL17 in DENV infection.
Previous studies have found a significant increase in IFN-γ and TNF-α in the patients with dengue infection [4, 7].Both of them are important proinflammatory cytokines andhave been shown to associate with the disease severity. Whilethe upregulation of the IFN-γ can induce plasma leakage,TNF-αmay indicate for the activation of vascular endothelialcell and may increase vascular permeability which lead tohemorrhagic fever [25–27]. In our study, we did not observea detectable level of TNF-α from the serum of our patients
3Disease Markers
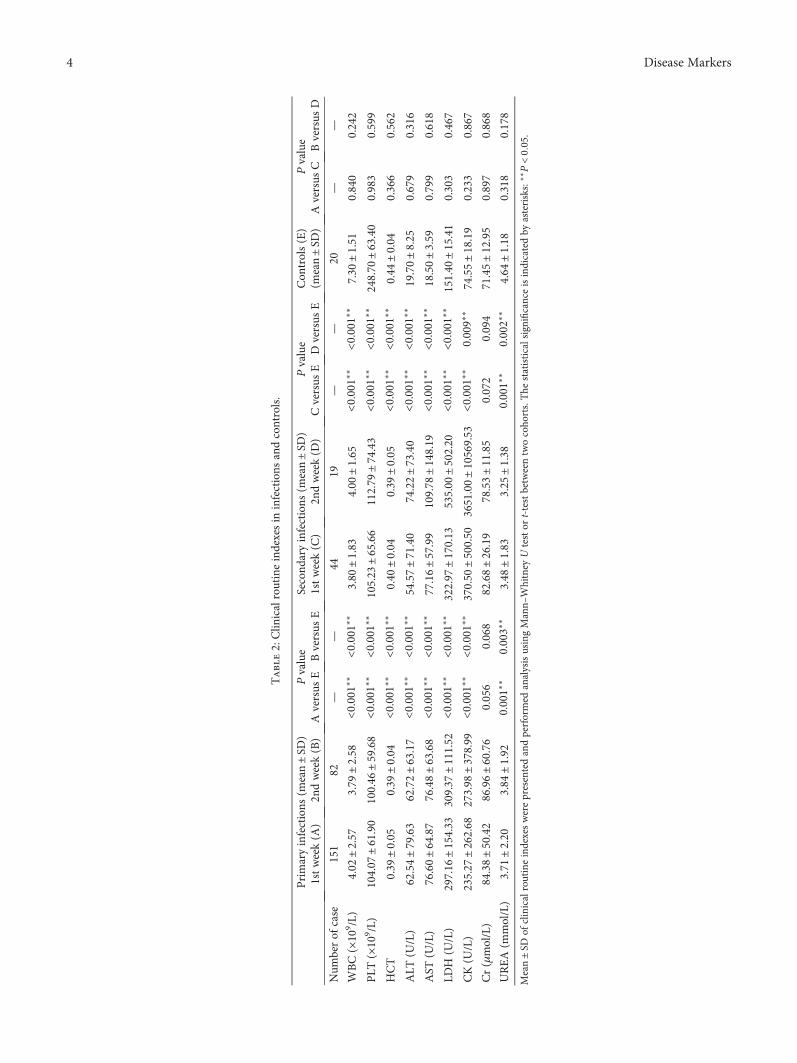
Table2:Clin
icalroutineindexesin
infections
andcontrols.
Primaryinfections
(mean±SD
)Pvalue
Second
aryinfections
(mean±SD
)Pvalue
Con
trols(E)
(mean±SD
)Pvalue
1stweek(A
)2n
dweek(B)
Aversus
EBversus
E1stweek(C)
2ndweek(D
)Cversus
EDversus
EAversus
CBversus
D
Num
berof
case
151
82—
—44
19—
—20
——
WBC(×10
9 /L)
4.02
±2.57
3.79
±2.58
<0.001
∗∗<0
.001
∗∗3.80
±1.83
4.00
±1.65
<0.001
∗∗<0
.001
∗∗7.30
±1.51
0.840
0.242
PLT
(×10
9 /L)
104.07
±61.90
100.46
±59.68
<0.001
∗∗<0
.001
∗∗105.23
±65.66
112.79
±74.43
<0.001
∗∗<0
.001
∗∗248.70
±63.40
0.983
0.599
HCT
0.39
±0.05
0.39
±0.04
<0.001
∗∗<0
.001
∗∗0.40
±0.04
0.39
±0.05
<0.001
∗∗<0
.001
∗∗0.44
±0.04
0.366
0.562
ALT
(U/L)
62.54±79.63
62.72±63.17
<0.001
∗∗<0
.001
∗∗54.57±71.40
74.22±73.40
<0.001
∗∗<0
.001
∗∗19.70±8.25
0.679
0.316
AST
(U/L)
76.60±64.87
76.48±63.68
<0.001
∗∗<0
.001
∗∗77.16±57.99
109.78
±148.19
<0.001
∗∗<0
.001
∗∗18.50±3.59
0.799
0.618
LDH
(U/L)
297.16
±154.33
309.37
±111.52
<0.001
∗∗<0
.001
∗∗322.97
±170.13
535.00
±502.20
<0.001
∗∗<0
.001
∗∗151.40
±15.41
0.303
0.467
CK(U
/L)
235.27
±262.68
273.98
±378.99
<0.001
∗∗<0
.001
∗∗370.50
±500.50
3651.00±10569.53
<0.001
∗∗0.009∗
∗74.55±18.19
0.233
0.867
Cr(μmol/L)
84.38±50.42
86.96±60.76
0.056
0.068
82.68±26.19
78.53±11.85
0.072
0.094
71.45±12.95
0.897
0.868
UREA(m
mol/L)
3.71
±2.20
3.84
±1.92
0.001∗
∗0.003∗
∗3.48
±1.83
3.25
±1.38
0.001∗
∗0.002∗
∗4.64
±1.18
0.318
0.178
Mean±SD
ofclinicalroutineindexeswerepresentedandperformed
analysisusingMann–
Whitney
Utestor
t-testbetweentwocoho
rts.The
statisticalsignificanceisindicatedby
asterisks:
∗∗P<005.
4 Disease Markers
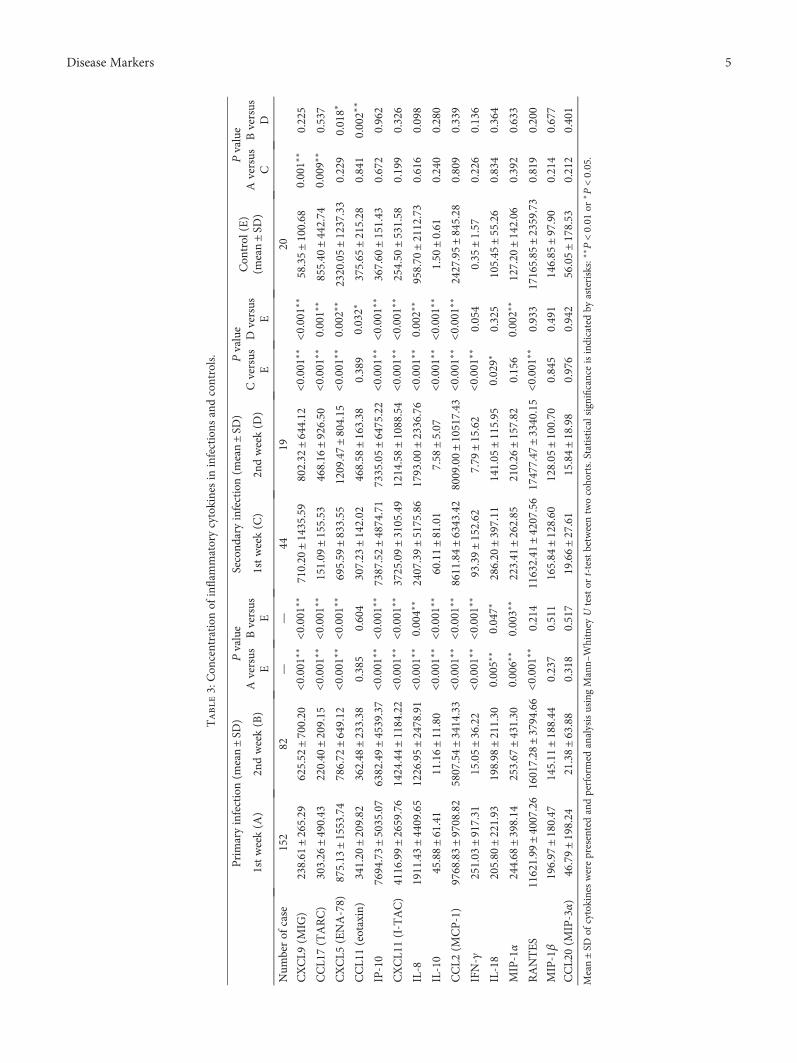
Table3:Con
centration
ofinflam
matorycytokinesin
infections
andcontrols.
Primaryinfection(m
ean±SD
)Pvalue
Second
aryinfection(m
ean±SD
)Pvalue
Con
trol
(E)
(mean±SD
)
Pvalue
1stweek(A
)2n
dweek(B)
Aversus
EBversus
E1stweek(C)
2ndweek(D
)Cversus
ED
versus
EAversus
CBversus
D
Num
berof
case
152
82—
—44
1920
CXCL9
(MIG
)238.61
±265.29
625.52
±700.20
<0.001
∗∗<0
.001
∗∗710.20
±1435.59
802.32
±644.12
<0.001
∗∗<0
.001
∗∗58.35±100.68
0.001∗
∗0.225
CCL1
7(TARC)
303.26
±490.43
220.40
±209.15
<0.001
∗∗<0
.001
∗∗151.09
±155.53
468.16
±926.50
<0.001
∗∗0.001∗
∗855.40
±442.74
0.009∗
∗0.537
CXCL5
(ENA-78)
875.13
±1553.74
786.72
±649.12
<0.001
∗∗<0
.001
∗∗695.59
±833.55
1209.47±804.15
<0.001
∗∗0.002∗
∗2320.05±1237.33
0.229
0.018∗
CCL1
1(eotaxin)
341.20
±209.82
362.48
±233.38
0.385
0.604
307.23
±142.02
468.58
±163.38
0.389
0.032∗
375.65
±215.28
0.841
0.002∗
∗
IP-10
7694.73±5035.07
6382.49±4539.37
<0.001
∗∗<0
.001
∗∗7387.52±4874.71
7335.05±6475.22
<0.001
∗∗<0
.001
∗∗367.60
±151.43
0.672
0.962
CXCL1
1(I-TAC)
4116.99±2659.76
1424.44±1184.22
<0.001
∗∗<0
.001
∗∗3725.09±3105.49
1214.58±1088.54
<0.001
∗∗<0
.001
∗∗254.50
±531.58
0.199
0.326
IL-8
1911.43±4409.65
1226.95±2478.91
<0.001
∗∗0.004∗
∗2407.39±5175.86
1793.00±2336.76
<0.001
∗∗0.002∗
∗958.70
±2112.73
0.616
0.098
IL-10
45.88±61.41
11.16±11.80
<0.001
∗∗<0
.001
∗∗60.11±81.01
7.58
±5.07
<0.001
∗∗<0
.001
∗∗1.50
±0.61
0.240
0.280
CCL2
(MCP-1)
9768.83±9708.82
5807.54±3414.33
<0.001
∗∗<0
.001
∗∗8611.84±6343.42
8009.00±10517.43
<0.001
∗∗<0
.001
∗∗2427.95±845.28
0.809
0.339
IFN-γ
251.03
±917.31
15.05±36.22
<0.001
∗∗<0
.001
∗∗93.39±152.62
7.79
±15.62
<0.001
∗∗0.054
0.35
±1.57
0.226
0.136
IL-18
205.80
±221.93
198.98
±211.30
0.005∗
∗0.047∗
286.20
±397.11
141.05
±115.95
0.029∗
0.325
105.45
±55.26
0.834
0.364
MIP-1α
244.68
±398.14
253.67
±431.30
0.006∗
∗0.003∗
∗223.41
±262.85
210.26
±157.82
0.156
0.002∗
∗127.20
±142.06
0.392
0.633
RANTES
11621.99
±4007.26
16017.28
±3794.66
<0.001
∗∗0.214
11632.41
±4207.56
17477.47
±3340.15
<0.001
∗∗0.933
17165.85
±2359.73
0.819
0.200
MIP-1β
196.97
±180.47
145.11
±188.44
0.237
0.511
165.84
±128.60
128.05
±100.70
0.845
0.491
146.85
±97.90
0.214
0.677
CCL2
0(M
IP-3α)
46.79±198.24
21.38±63.88
0.318
0.517
19.66±27.61
15.84±18.98
0.976
0.942
56.05±178.53
0.212
0.401
Mean±SD
ofcytokineswerepresentedandperformed
analysisusingMann–
Whitney
Utestor
t-testbetweentwocoho
rts.Statisticalsignificanceisindicatedby
asterisks:
∗∗P<00
1or∗P<005.
5Disease Markers
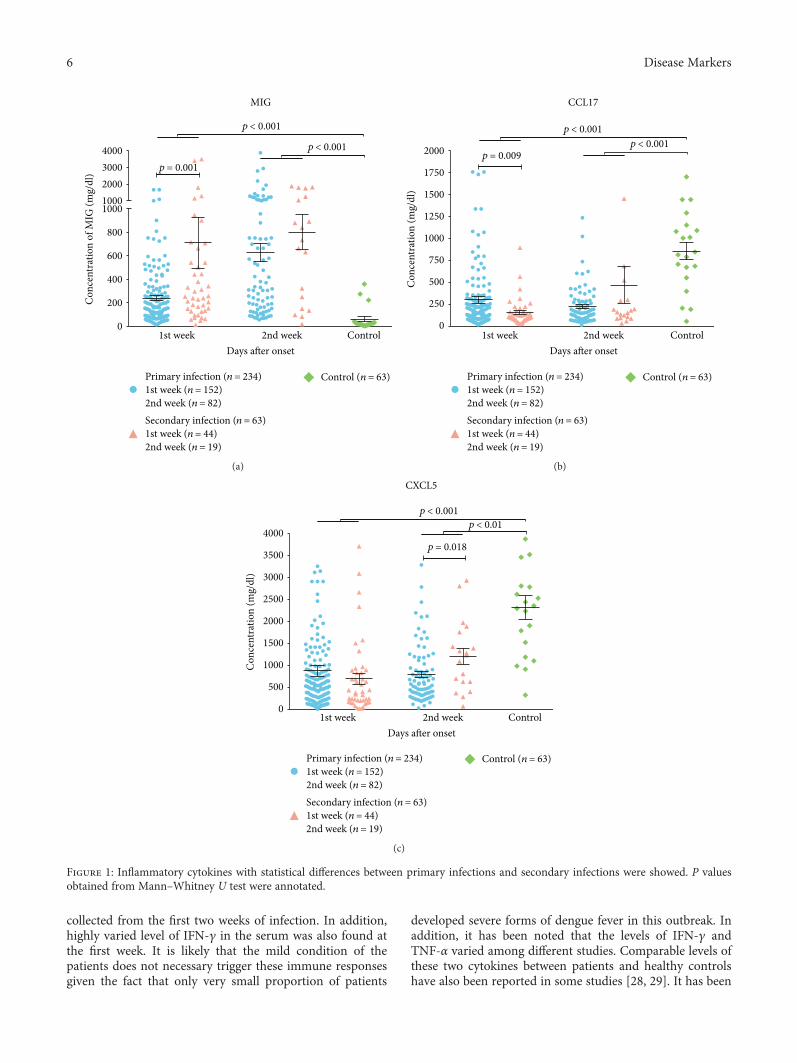
collected from the first two weeks of infection. In addition,highly varied level of IFN-γ in the serum was also found atthe first week. It is likely that the mild condition of thepatients does not necessary trigger these immune responsesgiven the fact that only very small proportion of patients
developed severe forms of dengue fever in this outbreak. Inaddition, it has been noted that the levels of IFN-γ andTNF-α varied among different studies. Comparable levels ofthese two cytokines between patients and healthy controlshave also been reported in some studies [28, 29]. It has been
4000
MIG
p < 0.001
p < 0.001
p = 0.0013000200010001000
800
600
400
200
01st week 2nd week
Days after onsetControl
Primary infection (n = 234)1st week (n = 152)2nd week (n = 82)Secondary infection (n = 63)1st week (n = 44)2nd week (n = 19)
Control (n = 63)
Con
cent
ratio
n of
MIG
(mg/
dl)
(a)
CCL17
p < 0.001
p = 0.009p < 0.001
1st week 2nd weekDays after onset
Primary infection (n = 234)1st week (n = 152)2nd week (n = 82)Secondary infection (n = 63)1st week (n = 44)2nd week (n = 19)
Control (n = 63)
Control
2000
1750
1500
1250
1000
750
500
250
0
Con
cent
ratio
n (m
g/dl
)
(b)
p < 0.001
CXCL5
p < 0.01
p = 0.018
Primary infection (n = 234)1st week (n = 152)2nd week (n = 82)Secondary infection (n = 63)1st week (n = 44)2nd week (n = 19)
Control (n = 63)
1st week 2nd weekDays after onset
Control
4000
3500
3000
2500
2000
1500
1000
500
0
Con
cent
ratio
n (m
g/dl
)
(c)
Figure 1: Inflammatory cytokines with statistical differences between primary infections and secondary infections were showed. P valuesobtained from Mann–Whitney U test were annotated.
6 Disease Markers
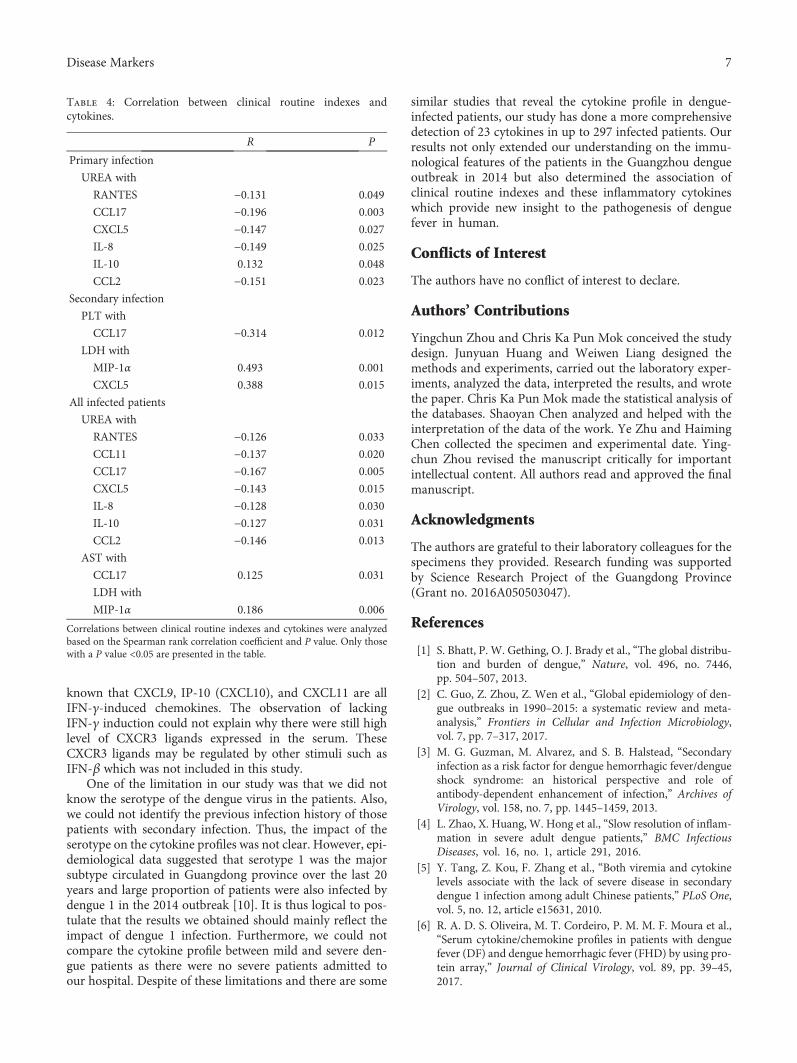
known that CXCL9, IP-10 (CXCL10), and CXCL11 are allIFN-γ-induced chemokines. The observation of lackingIFN-γ induction could not explain why there were still highlevel of CXCR3 ligands expressed in the serum. TheseCXCR3 ligands may be regulated by other stimuli such asIFN-β which was not included in this study.
One of the limitation in our study was that we did notknow the serotype of the dengue virus in the patients. Also,we could not identify the previous infection history of thosepatients with secondary infection. Thus, the impact of theserotype on the cytokine profiles was not clear. However, epi-demiological data suggested that serotype 1 was the majorsubtype circulated in Guangdong province over the last 20years and large proportion of patients were also infected bydengue 1 in the 2014 outbreak [10]. It is thus logical to pos-tulate that the results we obtained should mainly reflect theimpact of dengue 1 infection. Furthermore, we could notcompare the cytokine profile between mild and severe den-gue patients as there were no severe patients admitted toour hospital. Despite of these limitations and there are some
similar studies that reveal the cytokine profile in dengue-infected patients, our study has done a more comprehensivedetection of 23 cytokines in up to 297 infected patients. Ourresults not only extended our understanding on the immu-nological features of the patients in the Guangzhou dengueoutbreak in 2014 but also determined the association ofclinical routine indexes and these inflammatory cytokineswhich provide new insight to the pathogenesis of denguefever in human.
Conflicts of Interest
The authors have no conflict of interest to declare.
Authors’ Contributions
Yingchun Zhou and Chris Ka Pun Mok conceived the studydesign. Junyuan Huang and Weiwen Liang designed themethods and experiments, carried out the laboratory exper-iments, analyzed the data, interpreted the results, and wrotethe paper. Chris Ka Pun Mok made the statistical analysis ofthe databases. Shaoyan Chen analyzed and helped with theinterpretation of the data of the work. Ye Zhu and HaimingChen collected the specimen and experimental date. Ying-chun Zhou revised the manuscript critically for importantintellectual content. All authors read and approved the finalmanuscript.
Acknowledgments
The authors are grateful to their laboratory colleagues for thespecimens they provided. Research funding was supportedby Science Research Project of the Guangdong Province(Grant no. 2016A050503047).
References
[1] S. Bhatt, P. W. Gething, O. J. Brady et al., “The global distribu-tion and burden of dengue,” Nature, vol. 496, no. 7446,pp. 504–507, 2013.
[2] C. Guo, Z. Zhou, Z. Wen et al., “Global epidemiology of den-gue outbreaks in 1990–2015: a systematic review and meta-analysis,” Frontiers in Cellular and Infection Microbiology,vol. 7, pp. 7–317, 2017.
[3] M. G. Guzman, M. Alvarez, and S. B. Halstead, “Secondaryinfection as a risk factor for dengue hemorrhagic fever/dengueshock syndrome: an historical perspective and role ofantibody-dependent enhancement of infection,” Archives ofVirology, vol. 158, no. 7, pp. 1445–1459, 2013.
[4] L. Zhao, X. Huang, W. Hong et al., “Slow resolution of inflam-mation in severe adult dengue patients,” BMC InfectiousDiseases, vol. 16, no. 1, article 291, 2016.
[5] Y. Tang, Z. Kou, F. Zhang et al., “Both viremia and cytokinelevels associate with the lack of severe disease in secondarydengue 1 infection among adult Chinese patients,” PLoS One,vol. 5, no. 12, article e15631, 2010.
[6] R. A. D. S. Oliveira, M. T. Cordeiro, P. M. M. F. Moura et al.,“Serum cytokine/chemokine profiles in patients with denguefever (DF) and dengue hemorrhagic fever (FHD) by using pro-tein array,” Journal of Clinical Virology, vol. 89, pp. 39–45,2017.
Table 4: Correlation between clinical routine indexes andcytokines.
R P
Primary infection
UREA with
RANTES −0.131 0.049
CCL17 −0.196 0.003
CXCL5 −0.147 0.027
IL-8 −0.149 0.025
IL-10 0.132 0.048
CCL2 −0.151 0.023
Secondary infection
PLT with
CCL17 −0.314 0.012
LDH with
MIP-1α 0.493 0.001
CXCL5 0.388 0.015
All infected patients
UREA with
RANTES −0.126 0.033
CCL11 −0.137 0.020
CCL17 −0.167 0.005
CXCL5 −0.143 0.015
IL-8 −0.128 0.030
IL-10 −0.127 0.031
CCL2 −0.146 0.013
AST with
CCL17 0.125 0.031
LDH with
MIP-1α 0.186 0.006
Correlations between clinical routine indexes and cytokines were analyzedbased on the Spearman rank correlation coefficient and P value. Only thosewith a P value <0.05 are presented in the table.
7Disease Markers

[7] N. Pandey, A. Jain, R. K. Garg, R. Kumar, O. P. Agrawal, andP. V. Lakshmana Rao, “Serum levels of IL-8, IFNγ, IL-10,and TGF β and their gene expression levels in severe andnon-severe cases of dengue virus infection,” Archives of Virol-ogy, vol. 160, no. 6, pp. 1463–1475, 2015.
[8] R. Guo, J. Lin, L. Li et al., “The prevalence and endemic natureof dengue infections in Guangdong, South China: an epidemi-ological, serological, and etiological study from 2005–2011,”PLoS One, vol. 9, no. 1, article e85596, 2014.
[9] A. A. James, Z.-R. Lun, J.-Y. Wu, and X.-G. Chen, “Denguefever in mainland China,” The American Journal of TropicalMedicine and Hygiene, vol. 83, no. 3, pp. 664–671, 2010.
[10] S. Lai, Z. Huang, H. Zhou et al., “The changing epidemiologyof dengue in China, 1990–2014: a descriptive analysis of 25years of nationwide surveillance data,” BMC Medicine,vol. 13, no. 1, article 100, 2015.
[11] L. Huang, X. Luo, J. Shao et al., “Epidemiology and character-istics of the dengue outbreak in Guangdong, Southern China,in 2014,” European Journal of Clinical Microbiology & Infec-tious Diseases, vol. 35, no. 2, pp. 269–277, 2016.
[12] Y. P. Lin, Y. Luo, Y. Chen et al., “Clinical and epidemiologicalfeatures of the 2014 large-scale dengue outbreak in Guangzhoucity, China,” BMC Infectious Diseases, vol. 16, no. 1, p. 102,2016.
[13] World Health Organization and the Special Programmefor Research and Training in Tropical Diseases (TDR),Dengue guidelines for diagnosis, treatment, prevention andcontrol: new edition, http://www.who.int/rpc/guidelines/9789241547871/en/.
[14] N. A. Dalrymple and E. R. Mackow, “Endothelial cells elicitimmune-enhancing responses to dengue virus infection,”Journal of Virology, vol. 86, no. 12, pp. 6408–6415, 2012.
[15] A. L. Rothman, “Immunity to dengue virus: a tale of originalantigenic sin and tropical cytokine storms,” Nature ReviewsImmunology, vol. 11, no. 8, pp. 532–543, 2011.
[16] A. Egesten, M. Eliasson, H. M. Johansson et al., “The CXC che-mokine MIG/CXCL9 is important in innate immunity againstStreptococcus pyogenes,” The Journal of Infectious Diseases,vol. 195, no. 5, pp. 684–693, 2007.
[17] S. A. Reid-Yu, B. R. Tuinema, C. N. Small, L. Xing, and B. K.Coombes, “CXCL9 contributes to antimicrobial protection ofthe gut during Citrobacter rodentium infection independentof chemokine-receptor signaling,” PLoS Pathogens, vol. 11,no. 2, article e1004648, 2015.
[18] W. Huang, K. Hu, S. Luo et al., “Herpes simplex virus type 2infection of human epithelial cells induces CXCL9 expressionand CD4+ T cell migration via activation of p38-CCAAT/enhancer-binding protein-β pathway,” The Journal of Immu-nology, vol. 188, no. 12, pp. 6247–6257, 2012.
[19] E. Simon-Lorière, V. Duong, A. Tawfik et al., “Increased adap-tive immune responses and proper feedback regulation protectagainst clinical dengue,” Science Translational Medicine, vol. 9,no. 405, article eaal5088, 2017.
[20] J.-P. Chen, H.-L. Lu, S.-L. Lai et al., “Dengue virus inducesexpression of CXC chemokine ligand 10/IFN-γ-inducible pro-tein 10, which competitively inhibits viral binding to cell sur-face heparan sulfate,” The Journal of Immunology, vol. 177,no. 5, pp. 3185–3192, 2006.
[21] K. L. Wong, W. Chen, T. Balakrishnan, Y. X. Toh, K. Fink, andS.-C. Wong, “Susceptibility and response of human blood
monocyte subsets to primary dengue virus infection,” PLoSOne, vol. 7, no. 5, article e36435, 2012.
[22] P. P. Ip and F. Liao, “Resistance to dengue virus infection inmice is potentiated by CXCL10 and is independent ofCXCL10-mediated leukocyte recruitment,” The Journal ofImmunology, vol. 184, no. 10, pp. 5705–5714, 2010.
[23] P. Fallahi and G. Elia, “Interferon-γ-induced protein 10 indengue virus infection,” La Clinica Terapeutica, vol. 167,no. 6, pp. e186–e191, 2016.
[24] R. Guabiraba, R. E. Marques, A.-G. Besnard et al., “Role of thechemokine receptors CCR1, CCR2 and CCR4 in the pathogen-esis of experimental dengue infection in mice,” PLoS One,vol. 5, no. 12, article e15680, 2010.
[25] I. Kurane, “Dengue hemorrhagic fever with special emphasison immunopathogenesis,” Comparative Immunology, Micro-biology and Infectious Diseases, vol. 30, no. 5-6, pp. 329–340,2007.
[26] J. E. Cardier, E. Mariño, E. Romano et al., “Proinflammatoryfactors present in sera from patients with acute dengue infec-tion induce activation and apoptosis of human microvascularendothelial cells: possible role of TNF-α in endothelial celldamage in dengue,” Cytokine, vol. 30, no. 6, pp. 359–365, 2005.
[27] M. M. Mangada and A. L. Rothman, “Altered cytokineresponses of dengue-specific CD4+ T cells to heterologousserotypes,” The Journal of Immunology, vol. 175, no. 4,pp. 2676–2683, 2005.
[28] A. Rathakrishnan, S. M. Wang, Y. Hu et al., “Cytokine expres-sion profile of dengue patients at different phases of illness,”PLoS One, vol. 7, no. 12, article e52215, 2012.
[29] S. I. de la Cruz Hernández, H. N. Puerta-Guardo, H. FloresAguilar et al., “Primary dengue virus infections induce differ-ential cytokine production in Mexican patients,” Memóriasdo Instituto Oswaldo Cruz, vol. 111, no. 3, pp. 161–167, 2016.
8 Disease Markers
Research ArticleDiagnostic Value of the lncRNA NEAT1 in Peripheral BloodMononuclear Cells of Patients with Sepsis
Shuying Huang,1,2 Kejian Qian,3 Yuanfang Zhu,4 Zikun Huang,5 Qing Luo,5
and Cheng Qing3
1Department of Obstetrics and Gynecology, The First Affiliated Hospital of Nanchang University, Nanchang, Jiangxi 330006, China2Department of Nursing, Jiangxi Health Vocational College, Nanchang, Jiangxi 330052, China3Intensive Care Unit, The First Affiliated Hospital of Nanchang University, Nanchang, Jiangxi 330006, China4Department of Obstetrics and Gynecology, Shenzhen Baoan Maternal and Child Health Hospital, Shenzhen,Guangdong 518133, China5Department of Clinical Laboratory, The First Affiliated Hospital of Nanchang University, Nanchang, Jiangxi 330006, China
Correspondence should be addressed to Cheng Qing; [email protected]
Received 30 August 2017; Accepted 3 December 2017; Published 31 December 2017
Academic Editor: Hyundoo Hwang
Copyright © 2017 Shuying Huang et al. This is an open access article distributed under the Creative Commons Attribution License,which permits unrestricted use, distribution, and reproduction in any medium, provided the original work is properly cited.
Background. This study aims to evaluate the diagnostic value of nuclear-enriched abundant transcript 1 (NEAT1) expression inperipheral blood mononuclear cells (PBMCs) for the early diagnosis of sepsis. Methods. A total of 59 patients with sepsis, 52noninfectious SIRS patients, and 56 healthy controls were recruited fort this study. The levels of NEAT1 expression in PBMCswere measured using quantitative real-time polymerase chain reaction (qRT-PCR). Results. Compared with healthy controls,NEAT1 expression of PBMCs in sepsis and SIRS groups were significantly increased (3.76± 0.71- and 1.64± 0.43-fold,resp.) (P < 0 01), but NEAT1 levels are significantly lower in the SIRS group than in the sepsis group, and there was nostatistical significant relevance between survivors and nonsurvivors in patients with sepsis. NEAT1 with an area under thecurve (AUC) of 0.851 (95% CI: 0.812–0.935) indicated sensitivity (67.85%) and specificity (87.27%) for the diagnosis forsepsis, the positive predictive value (PPV) was 83.3%, and the negative predictive value (NPV) was 71.6%. The AUC forNEAT1 in the diagnosis of SIRS versus healthy controls was 0.755 (95% CI: 0.664–0.847), with 69.23% sensitivity and70.91% specificity, the PPV was 72.3%, and the NPV was 72.49%. Conclusion. Measurement of NEAT1 expression inPBMCs could be considered as a good additive marker for the diagnosis of sepsis.
1. Introduction
Sepsis is defined as a life-threatening organ dysfunctioncaused by a dysregulated host response to infection andis a common cause of death among patients in intensivecare units. Sepsis can occur in patients with serioustrauma, burns, multiple injuries, shock, or after majorsurgery, and it progresses rapidly from bacteremia to vitalorgan failure and even death. At present, sepsis is a majorissue in the field of critical care medicine [1]. Currently,blood culture is the gold standard for the microbiologicaldiagnosis of sepsis, but this method has drawbacks, includ-ing a lack of sensitivity owing to small sample volumes
and the long time required for a confirmed diagnosis,resulting in delayed treatment and high mortality rates[2, 3]. To reduce the mortality rate for patients withsepsis, it is important to develop methods for early diag-nosis, enabling prompt intervention.
Long noncoding RNAs (lncRNAs) are RNA polymeraseII (RNAPII) transcripts that are longer than 200 nucleotides.They lack an open-reading frame, but utilize RNA–RNA,RNA–DNA, and RNA–protein interactions to regulate cellproliferation, apoptosis, damage, autophagy, and differentia-tion at transcriptional and posttranscriptional levels bysplicing, degradation of nucleic acids, RNA capture, andtranslational interference [4]. They are of great significance
HindawiDisease MarkersVolume 2017, Article ID 7962836, 6 pageshttps://doi.org/10.1155/2017/7962836
in a number of diseases, including immune diseases [5],cancer [6], and cardiovascular diseases [7].
lncRNAnuclear-enriched abundant transcript 1 (NEAT1)was recently identified as an important regulator of cell func-tions; it interacts with many important regulators within cellsand has roles in the formation, differentiation, and metastasisof neoplastic diseases, such as colon cancer [8], gall bladdercancer [9], ovarian cancer [10], andprostate cancer [11].Nota-bly,NEAT1 is involved in the innate immunity response and isan important immunoregulatory factor. It is involved in theinfection process in various infectious diseases, such as HIVin humans [12], hantavirus [13], and Zika virus [14]. Upregu-lated NEAT1 expression has been observed in mononuclearcells of patients with systemic lupus erythematosus [15].Furthermore, NEAT1 can regulate the expression of IL-6 andCXCL10 inflammatory factors in THP-1 cells. We deducedthatNEAT1maybe involved in the immune response in sepsisbased on the close relationships between IL-6 and CXCL10cytokines and the inflammatory response in sepsis. However,previous studies have not examined the role of NEAT1 insepsis. Accordingly, in this study, NEAT1 expression wasexamined in peripheral blood mononuclear cells (PBMCs) inpatients with sepsis, noninfectious SIRS, and healthy volun-teers to analyze its relationship with sepsis development andprognosis and to explore the diagnostic value and clinicalsignificance ofNEAT1 in sepsis.
2. Materials and Methods
2.1. Patients and Healthy Controls. The diagnosis of sepsisand systemic inflammatory response syndrome (SIRS) wasaccording to the American College of Chest Physicians andthe Society of Critical Care Medicine (ACCP/SCCM) [16].Exclusion criteria were as follows: individuals younger than18 years old, patients suffering from immune diseases orreceiving long-term glucocorticoids and immunosuppressivedrugs, comorbid chronic liver and renal insufficiency, tuber-culosis, AIDS, cancer, and patients who were pregnant. Atotal of 52 noninfectious SIRS patients (17 cases of com-pound injury, 8 cases of acute pancreatitis, 19 cases ofsystemic lupus erythematosus, 5 cases of thermoplegia, and3 cases of organic phosphorus poisoning) and 59 sepsispatients at The First Affiliated Hospital of Nanchang Univer-sity were selected for this study between May 2016 andDecember 2016. APACHE II scores, SOFA scores, absoluteneutrophil counts, and procalcitonin (PCT) were evaluatedin patients using blood samples collected at various timepoints. The survival statuses of patients were traced andrecorded 28 days after their admission to the intensive careunit. A group of 56 healthy subjects was selected over thesame period and served as normal controls. This study wasapproved by the ethics committee of the hospital, and writteninformed consent was obtained from all patients or fromtheir authorized representatives.
2.2. Detection of NEAT1 in PBMCs
2.2.1. Collection and Processing of Samples. Venous blood(5mL) was collected in sodium heparin tubes in the morning
before eating, mixed well, and left until use. PBMCs wereisolated using the conventional Ficoll gradient method. TotalRNA was extracted using the TRIzol (Invitrogen, Carlsbad,CA, USA) test kit following the manufacturer’s instructions.The quality and concentration of total RNA were determinedusing a spectrophotometer.
2.2.2. RT-qPCR Analysis. PrimeScript RT Master Mix(Takara, Dalian, China) was used for RT-qPCR and cDNAreverse transcription in accordance with the product manual.SYBR Premix EX Taq™ II (Takara) was used for qPCR; theABI 7500 system (Applied Biosystems, Waters, MA, USA)was used for sample loading. The detection proceduresand reaction criteria were set and carried out with refer-ence to the instructions provided with the test kit. Primerswere as follows: NEAT1 forward, 5′-CTTCCTCCCTTTAACTTATCCATTCAC-3′; NEAT1 reverse, 5′-CTCTTCCTCCACCATTACCAACAATAC-3′ [12]. GAPDH was used asan internal reference with the following primers: GAPDHforward, 5′-GCACCGTCAAGGCTGAGAAC-3′; GADPHreverse, 5′-TGGTGAAGACGCCAGTGGA-3′ [12]. Testson all samples were run in triplicate. The relative expressionof RNA was computed based on the 2−ΔΔCt method.
2.2.3. Enzyme-Linked Immunosorbent Assay. Serum C-reactive protein (CRP), PCT, and interleukin-6 (IL-6) weredetermined by enzyme-linked immunosorbent assays (Bio-Source, Kansas City, MO, USA) in accordance with theproduct manual.
2.3. Statistical Analysis. Statistical analyses were performedusing GraphPad Prism (version 5). Quantitative results areexpressed as means± standard deviation. Differences in morethan 2 group data were evaluated by the one-way ANOVAor Kruskal-Wallis analysis of variance by ranks. The t-testwas used to compare the means of two populations with nor-mally distributed values. TheMann–WhitneyU test was usedfor comparisons between two groups for which data were notnormally distributed. Qualitative data were tested using χ2
tests. The diagnostic value ofNEAT1was analyzed by plottinga receiver operating characteristic (ROC) curve. P < 0 05 wasconsidered statistically significant.
3. Results
3.1. General Clinical Information. In total, 52 noninfectiousSIRS patients, 59 patients with sepsis, and 56 healthy volun-teers were included in this study. As shown in Table 1, therewere no differences in age and gender between these threegroups. The levels of leukocytes, blood lactate, and CRP weresignificantly higher in patients with sepsis than in the SIRSand control groups. Also, the sepsis group had higher levelsof PCT, SOFA score, APACHEII score, and mortality thanthe SIRS group (Table 1).
3.2. Analysis of Sepsis Survivors and Nonsurvivors. Furthercomparisons indicated that the SOFA scores, APACHE IIscores, PCT, Lac, and CRP were significantly higher insepsis nonsurvivors than in survivors (Table 2). However,
2 Disease Markers
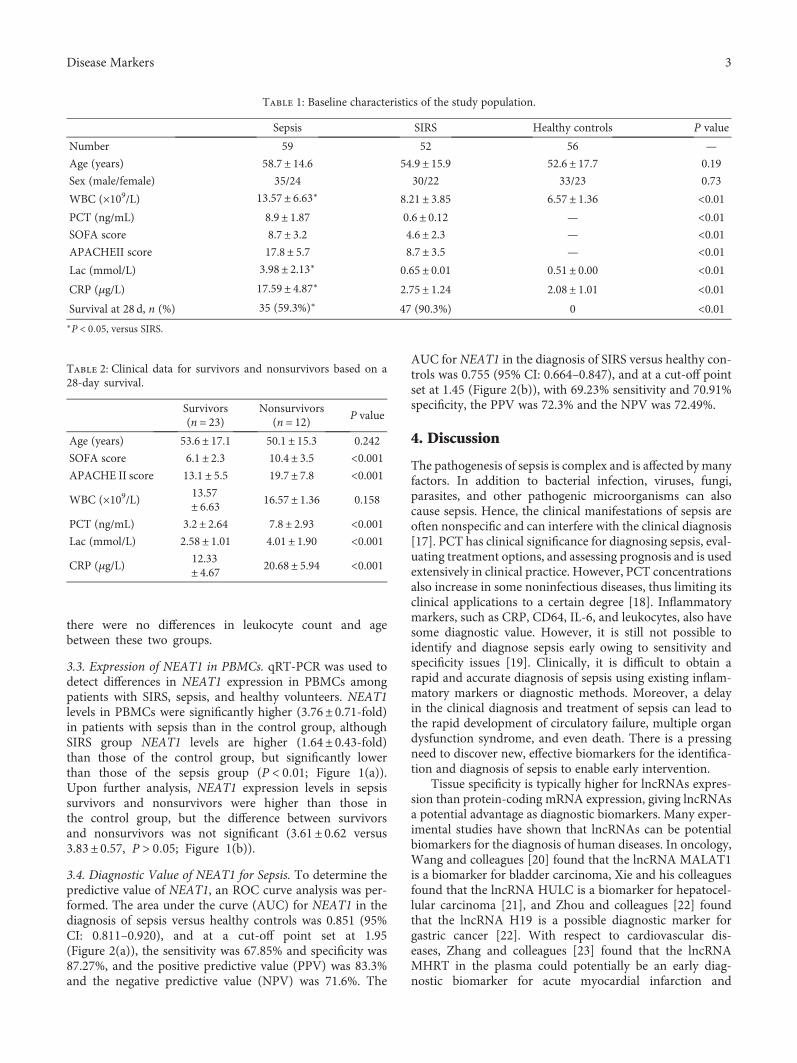
there were no differences in leukocyte count and agebetween these two groups.
3.3. Expression of NEAT1 in PBMCs. qRT-PCR was used todetect differences in NEAT1 expression in PBMCs amongpatients with SIRS, sepsis, and healthy volunteers. NEAT1levels in PBMCs were significantly higher (3.76± 0.71-fold)in patients with sepsis than in the control group, althoughSIRS group NEAT1 levels are higher (1.64± 0.43-fold)than those of the control group, but significantly lowerthan those of the sepsis group (P < 0 01; Figure 1(a)).Upon further analysis, NEAT1 expression levels in sepsissurvivors and nonsurvivors were higher than those inthe control group, but the difference between survivorsand nonsurvivors was not significant (3.61± 0.62 versus3.83± 0.57, P > 0 05; Figure 1(b)).
3.4. Diagnostic Value of NEAT1 for Sepsis. To determine thepredictive value of NEAT1, an ROC curve analysis was per-formed. The area under the curve (AUC) for NEAT1 in thediagnosis of sepsis versus healthy controls was 0.851 (95%CI: 0.811–0.920), and at a cut-off point set at 1.95(Figure 2(a)), the sensitivity was 67.85% and specificity was87.27%, and the positive predictive value (PPV) was 83.3%and the negative predictive value (NPV) was 71.6%. The
AUC for NEAT1 in the diagnosis of SIRS versus healthy con-trols was 0.755 (95% CI: 0.664–0.847), and at a cut-off pointset at 1.45 (Figure 2(b)), with 69.23% sensitivity and 70.91%specificity, the PPV was 72.3% and the NPV was 72.49%.
4. Discussion
The pathogenesis of sepsis is complex and is affected by manyfactors. In addition to bacterial infection, viruses, fungi,parasites, and other pathogenic microorganisms can alsocause sepsis. Hence, the clinical manifestations of sepsis areoften nonspecific and can interfere with the clinical diagnosis[17]. PCT has clinical significance for diagnosing sepsis, eval-uating treatment options, and assessing prognosis and is usedextensively in clinical practice. However, PCT concentrationsalso increase in some noninfectious diseases, thus limiting itsclinical applications to a certain degree [18]. Inflammatorymarkers, such as CRP, CD64, IL-6, and leukocytes, also havesome diagnostic value. However, it is still not possible toidentify and diagnose sepsis early owing to sensitivity andspecificity issues [19]. Clinically, it is difficult to obtain arapid and accurate diagnosis of sepsis using existing inflam-matory markers or diagnostic methods. Moreover, a delayin the clinical diagnosis and treatment of sepsis can lead tothe rapid development of circulatory failure, multiple organdysfunction syndrome, and even death. There is a pressingneed to discover new, effective biomarkers for the identifica-tion and diagnosis of sepsis to enable early intervention.
Tissue specificity is typically higher for lncRNAs expres-sion than protein-coding mRNA expression, giving lncRNAsa potential advantage as diagnostic biomarkers. Many exper-imental studies have shown that lncRNAs can be potentialbiomarkers for the diagnosis of human diseases. In oncology,Wang and colleagues [20] found that the lncRNA MALAT1is a biomarker for bladder carcinoma, Xie and his colleaguesfound that the lncRNA HULC is a biomarker for hepatocel-lular carcinoma [21], and Zhou and colleagues [22] foundthat the lncRNA H19 is a possible diagnostic marker forgastric cancer [22]. With respect to cardiovascular dis-eases, Zhang and colleagues [23] found that the lncRNAMHRT in the plasma could potentially be an early diag-nostic biomarker for acute myocardial infarction and
Table 1: Baseline characteristics of the study population.
Sepsis SIRS Healthy controls P value
Number 59 52 56 —
Age (years) 58.7± 14.6 54.9± 15.9 52.6± 17.7 0.19
Sex (male/female) 35/24 30/22 33/23 0.73
WBC (×109/L) 13.57± 6.63∗ 8.21± 3.85 6.57± 1.36 <0.01PCT (ng/mL) 8.9± 1.87 0.6± 0.12 — <0.01SOFA score 8.7± 3.2 4.6± 2.3 — <0.01APACHEII score 17.8± 5.7 8.7± 3.5 — <0.01Lac (mmol/L) 3.98± 2.13∗ 0.65± 0.01 0.51± 0.00 <0.01CRP (μg/L) 17.59± 4.87∗ 2.75± 1.24 2.08± 1.01 <0.01Survival at 28 d, n (%) 35 (59.3%)∗ 47 (90.3%) 0 <0.01∗P < 0 05, versus SIRS.
Table 2: Clinical data for survivors and nonsurvivors based on a28-day survival.
Survivors(n = 23)
Nonsurvivors(n = 12) P value
Age (years) 53.6± 17.1 50.1± 15.3 0.242
SOFA score 6.1± 2.3 10.4± 3.5 <0.001APACHE II score 13.1± 5.5 19.7± 7.8 <0.001
WBC (×109/L) 13.57± 6.63 16.57± 1.36 0.158
PCT (ng/mL) 3.2± 2.64 7.8± 2.93 <0.001Lac (mmol/L) 2.58± 1.01 4.01± 1.90 <0.001
CRP (μg/L)12.33± 4.67 20.68± 5.94 <0.001
3Disease Markers
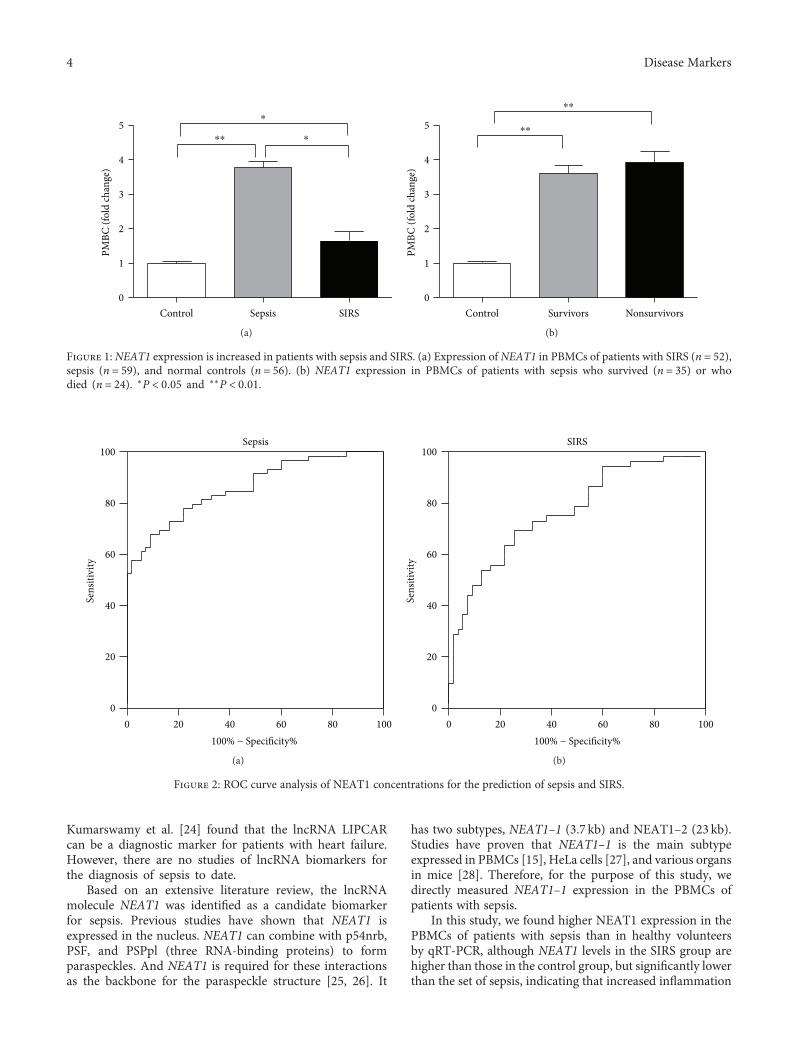
Kumarswamy et al. [24] found that the lncRNA LIPCARcan be a diagnostic marker for patients with heart failure.However, there are no studies of lncRNA biomarkers forthe diagnosis of sepsis to date.
Based on an extensive literature review, the lncRNAmolecule NEAT1 was identified as a candidate biomarkerfor sepsis. Previous studies have shown that NEAT1 isexpressed in the nucleus. NEAT1 can combine with p54nrb,PSF, and PSPpl (three RNA-binding proteins) to formparaspeckles. And NEAT1 is required for these interactionsas the backbone for the paraspeckle structure [25, 26]. It
has two subtypes, NEAT1–1 (3.7 kb) and NEAT1–2 (23 kb).Studies have proven that NEAT1–1 is the main subtypeexpressed in PBMCs [15], HeLa cells [27], and various organsin mice [28]. Therefore, for the purpose of this study, wedirectly measured NEAT1–1 expression in the PBMCs ofpatients with sepsis.
In this study, we found higher NEAT1 expression in thePBMCs of patients with sepsis than in healthy volunteersby qRT-PCR, although NEAT1 levels in the SIRS group arehigher than those in the control group, but significantly lowerthan the set of sepsis, indicating that increased inflammation
PMBC
(fol
d ch
ange
)
5⁎
⁎⁎ ⁎
4
3
2
1
0Control Sepsis SIRS
(a)
⁎⁎
⁎⁎
PMBC
(fol
d ch
ange
)
5
4
3
2
1
0Control Survivors Nonsurvivors
(b)
Figure 1: NEAT1 expression is increased in patients with sepsis and SIRS. (a) Expression of NEAT1 in PBMCs of patients with SIRS (n = 52),sepsis (n = 59), and normal controls (n = 56). (b) NEAT1 expression in PBMCs of patients with sepsis who survived (n = 35) or whodied (n = 24). ∗P < 0 05 and ∗∗P < 0 01.
Sepsis
100% − Specificity%
Sens
itivi
ty
0
20
40
60
80
100
0 20 40 60 80 100
(a)
00
20
20
40
SIRS
100% − Specificity%
Sens
itivi
ty
40
60
60
80
80
100
100
(b)
Figure 2: ROC curve analysis of NEAT1 concentrations for the prediction of sepsis and SIRS.
4 Disease Markers
can lead to higher levels of NEAT1. According to previousstudies, human umbilical vein endothelial cells (HUVECs)infected with hantavirus exhibit increased NEAT1–1 expres-sion. Transfection with upregulated NEAT1–1 promoted thesecretion of the inflammatory factor IFN in these cells; thismechanism is associated with the activation of the RIG-I/IRF7 signaling pathway [14]. In a study of immune functionof patients with SLE [15],NEAT1 expression was increased inthe PBMCs of these patients; NEAT1 expression increasesrapidly in PBMCs by stimulation with LPS in vitro, and peaklevels are reached at 2 h, compared with 12–48 h required forPCT to reach peak levels [29]. These results indicated thatNEAT1–1 is an early inflammatory response factor. Further-more, the study indicated that NEAT1 promotes inflamma-tory responses in PBMCs by activating the JNK/ERKMAPK signaling pathway. These studies suggest that NEAT1is a proinflammatory molecule. In our study, NEAT1 wassignificantly upregulated in the PBMCs of patients withsepsis, consistent with the excessive inflammatory responseduring sepsis observed in clinical studies. In addition,NEAT1can be upregulated more rapidly at the early stages of inflam-mation than PCT. Therefore, NEAT1 is a potentially effectivemarker for rapid sepsis diagnosis.
There was no difference in NEAT1 expression betweensepsis survivors and nonsurvivors, showing that it has nopredictive value for mortality of sepsis. Further ROC curveanalysis revealed that NEAT1 has clinical value for sepsisdiagnosis, which is more useful for SIRS diagnosis. Con-sidering that the cut-off point is set at 1.95 and 1.45 inthe sepsis and SIRS groups, it is possible to be identifiedas indicators of the two diseases in the future but stillneeds a lot of research to confirm. Moreover, the PCT,SOFA scores, and APACHE II scores were higher in thesepsis group than in the healthy individuals, and thesedifferences could be explained by the inclusion of patientswho were relatively older, with more serious conditions inthe sepsis group.
Unfortunately, owing to the small clinical sample size, wewere unable to evaluate the use of NEAT1 in the early diag-nosis of sepsis nor were we able to examine different stagesof sepsis in patients of various ages, genders, comorbidities,or pregnancy status; hence, it was not possible to compareNEAT1 with PCT or other traditional molecular markers ofsepsis. We also did not conduct an in-depth study of themolecular mechanisms linking NEAT1 to sepsis. Theselimitations will guide future in-depth studies of the use ofNEAT1 as a molecular marker for sepsis diagnosis.
In conclusion, upregulated NEAT1 expression in patientswith sepsis was discovered for the first time in our study,indicating an association between NEAT1 and immunedysfunction in patients with sepsis. NEAT1 is a potentialmolecular marker for sepsis diagnosis, offering a new optionfor early diagnosis. Of course, extensive research is stillneeded to enable the practical applications of NEAT1.
Conflicts of Interest
The authors declare no conflicts of interests.
Authors’ Contributions
Shuying Huang and Kejian Qian contributed equally tothis work.
Acknowledgments
This work was supported by the Natural Science Foundationof Jiangxi Province, China (nos. 20161BAB215224 and2017BAB205028 to Cheng Qing).
References
[1] T. J. Graetz and R. S. Hotchkiss, “Sepsis: preventing organfailure in sepsis – the search continues,” Nature ReviewsNephrology, vol. 13, no. 1, pp. 5-6, 2017.
[2] J. Ho, H. Chan, S. H. Wong et al., “The involvement ofregulatory non-coding RNAs in sepsis: a systematic review,”Critical Care, vol. 20, no. 1, p. 383, 2016.
[3] C. N. Correia, N. C. Nalpas, K. E. McLoughlin et al., “Circulat-ing microRNAs as potential biomarkers of infectious disease,”Frontiers in Immunology, vol. 8, p. 118, 2017.
[4] J. Beermann, M. T. Piccoli, J. Viereck, and T. Thum, “Non-coding RNAs in development and disease: background,mechanisms, and therapeutic approaches,” PhysiologicalReviews, vol. 96, no. 4, pp. 1297–1325, 2016.
[5] A. T. Satpathy and H. Y. Chang, “Long noncoding RNA inhematopoiesis and immunity,” Immunity, vol. 42, no. 5,pp. 792–804, 2015.
[6] C. Jiang, X. Li, H. Zhao, and H. Liu, “Long non-coding RNAs:potential new biomarkers for predicting tumor invasion andmetastasis,” Molecular Cancer, vol. 15, no. 1, p. 62, 2016.
[7] T. Peters, S. Hermans-Beijnsberger, A. Beqqali et al., “Longnon-coding RNA Malat-1 is dispensable during pressureoverload-induced cardiac remodeling and failure in mice,”PLoS One, vol. 11, no. 2, article e0150236, 2016.
[8] Y. Li, Y. Li, W. Chen et al., “NEAT expression is associatedwith tumor recurrence and unfavorable prognosis in colorectalcancer,” Oncotarget, vol. 6, no. 29, pp. 27641–27650, 2015.
[9] M. Parasramka, I. K. Yan, X. Wang et al., “BAP1 dependentexpression of long non-coding RNA NEAT-1 contributes tosensitivity to gemcitabine in cholangiocarcinoma,” MolecularCancer, vol. 16, no. 1, p. 22, 2017.
[10] Z. J. Chen, Z. Zhang, B. B. Xie, and H. Y. Zhang, “Clinicalsignificance of up-regulated lncRNA NEAT1 in prognosis ofovarian cancer,” European Review for Medical and Pharmaco-logical Sciences, vol. 20, no. 16, pp. 3373–3377, 2016.
[11] D. Chakravarty, A. Sboner, S. S. Nair et al., “The oestrogenreceptor alpha-regulated lncRNA NEAT1 is a critical modula-tor of prostate cancer,” Nature Communications, vol. 5,p. 5383, 2014.
[12] C. Jin, X. Peng, T. Xie et al., “Detection of the long noncodingRNAs nuclear-enriched autosomal transcript 1 (NEAT1) andmetastasis associated lung adenocarcinoma transcript 1 inthe peripheral blood of HIV-1-infected patients,” HIVMedicine, vol. 17, no. 1, pp. 68–72, 2016.
[13] A. Ramaiah, D. Contreras, V. Gangalapudi, M. S. Padhye,J. Tang, and V. Arumugaswami, “Dysregulation of longnon-coding RNA (lncRNA) genes and predicted lncRNA-protein interactions during Zika virus infection,” bioRxiv,p. 061788, 2016.
5Disease Markers
[14] H. Ma, P. Han, W. Ye et al., “The long noncoding RNANEAT1 exerts antihantaviral effects by acting as positivefeedback for RIG-I signaling,” Journal of Virology, vol. 91,no. 9, article e02250-16, 2017.
[15] F. Zhang, L. Wu, J. Qian et al., “Identification of the longnoncoding RNA NEAT1 as a novel inflammatory regulatoracting through MAPK pathway in human lupus,” Journal ofAutoimmunity, vol. 75, pp. 96–104, 2016.
[16] M. M. Levy, M. P. Fink, J. C. Marshall et al., “2001SCCM/ESICM/ACCP/ATS/SIS international sepsis defini-tions conference,” Critical Care Medicine, vol. 31, no. 4,pp. 1250–1256, 2003.
[17] A. Lever and I. Mackenzie, “Sepsis: definition, epidemiology,and diagnosis,” BMJ, vol. 335, no. 7625, pp. 879–883, 2007.
[18] Y. H. Dou, J. K. Du, H. L. Liu, and X. D. Shong, “The role of pro-calcitonin in the identification of invasive fungal infection—asystemic review and meta-analysis,” Diagnostic Microbiologyand Infectious Disease, vol. 76, no. 4, pp. 464–469, 2013.
[19] D. W. Jekarl, S. Y. Lee, J. Lee et al., “Procalcitonin as adiagnostic marker and IL-6 as a prognostic marker for sepsis,”Diagnostic Microbiology and Infectious Disease, vol. 75, no. 4,pp. 342–347, 2013.
[20] X. S. Wang, Z. Zhang, H. C. Wang et al., “Rapid identificationof UCA1 as a very sensitive and specific unique marker forhuman bladder carcinoma,” Clinical Cancer Research, vol. 12,no. 16, pp. 4851–4858, 2006.
[21] H. Xie, H. Ma, and D. Zhou, “Plasma HULC as a promisingnovel biomarker for the detection of hepatocellular carci-noma,” BioMed Research International, vol. 2013, ArticleID 136106, 5 pages, 2013.
[22] X. Zhou, C. Yin, Y. Dang, F. Ye, and G. Zhang, “Identificationof the long non-coding RNA H19 in plasma as a novelbiomarker for diagnosis of gastric cancer,” Scientific Reports,vol. 5, article 11516, 2015.
[23] J. Zhang, C. Gao, M. Meng, and H. Tang, “Long noncodingRNA MHRT protects cardiomyocytes against H2O2-inducedapoptosis,” Biomolecules & Therapeutics, vol. 24, no. 1,pp. 19–24, 2016.
[24] R. Kumarswamy, C. Bauters, I. Volkmann et al., “Circulatinglong noncoding RNA, LIPCAR, predicts survival in patientswith heart failure,” Circulation Research, vol. 114, no. 10,pp. 1569–1575, 2014.
[25] C. S. Bond and A. H. Fox, “Paraspeckles: nuclear bodies builton long noncoding RNA,” The Journal of Cell Biology,vol. 186, no. 5, pp. 637–644, 2009.
[26] C. M. Clemson, J. N. Hutchinson, S. A. Sara et al., “Anarchitectural role for a nuclear noncoding RNA: NEAT1RNA is essential for the structure of paraspeckles,” MolecularCell, vol. 33, no. 6, pp. 717–726, 2009.
[27] Y. T. Sasaki, T. Ideue, andM. Sano, “MENε/β noncoding RNAsare essential for structural integrity of nuclear paraspeckles,”Proceedings of the National Academy of Sciences of the UnitedStates of America, vol. 106, no. 8, pp. 2525–2530, 2009.
[28] S. Nakagawa, T. Naganuma, G. Shioi, and T. Hirose,“Paraspeckles are subpopulation-specific nuclear bodies thatare not essential in mice,” The Journal of Cell Biology,vol. 193, no. 1, pp. 31–39, 2011.
[29] P. Dandona, D. Nix, M. F. Wilson et al., “Procalcitoninincrease after endotoxin injection in normal subjects,” TheJournal of Clinical Endocrinology and Metabolism, vol. 79,no. 6, pp. 1605–1608, 1994.
6 Disease Markers
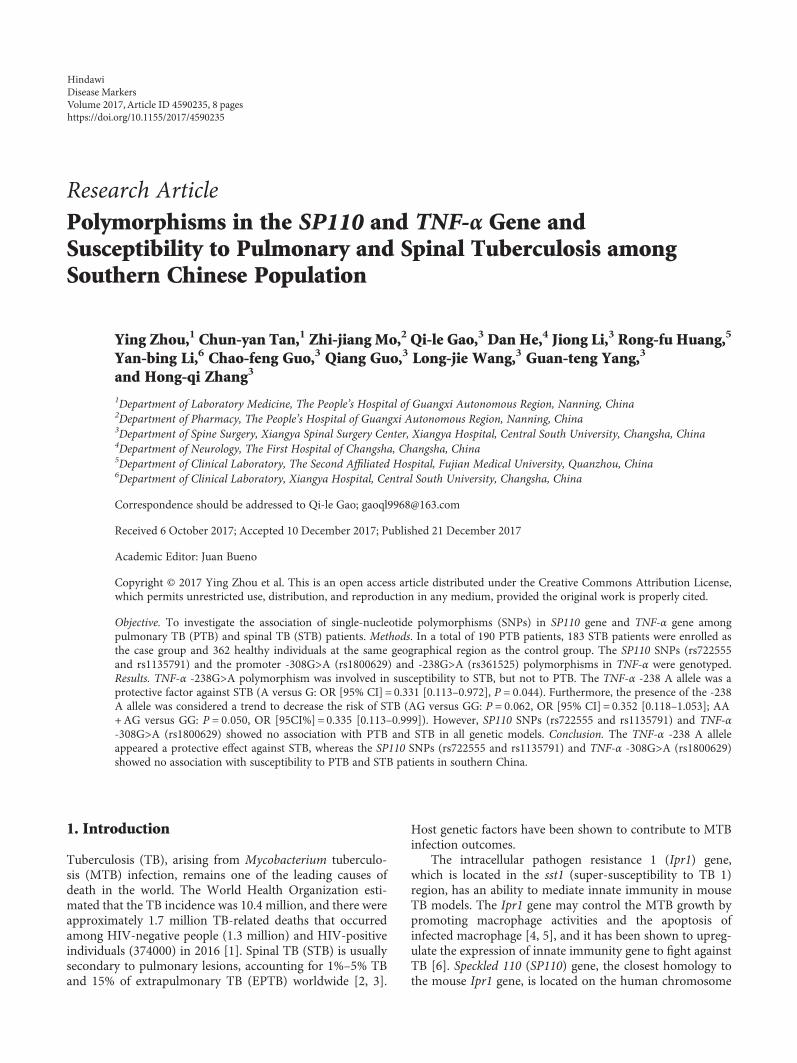
Research ArticlePolymorphisms in the SP110 and TNF-α Gene andSusceptibility to Pulmonary and Spinal Tuberculosis amongSouthern Chinese Population
Ying Zhou,1 Chun-yan Tan,1 Zhi-jiang Mo,2 Qi-le Gao,3 Dan He,4 Jiong Li,3 Rong-fu Huang,5
Yan-bing Li,6 Chao-feng Guo,3 Qiang Guo,3 Long-jie Wang,3 Guan-teng Yang,3
and Hong-qi Zhang3
1Department of Laboratory Medicine, The People’s Hospital of Guangxi Autonomous Region, Nanning, China2Department of Pharmacy, The People’s Hospital of Guangxi Autonomous Region, Nanning, China3Department of Spine Surgery, Xiangya Spinal Surgery Center, Xiangya Hospital, Central South University, Changsha, China4Department of Neurology, The First Hospital of Changsha, Changsha, China5Department of Clinical Laboratory, The Second Affiliated Hospital, Fujian Medical University, Quanzhou, China6Department of Clinical Laboratory, Xiangya Hospital, Central South University, Changsha, China
Correspondence should be addressed to Qi-le Gao; [email protected]
Received 6 October 2017; Accepted 10 December 2017; Published 21 December 2017
Academic Editor: Juan Bueno
Copyright © 2017 Ying Zhou et al. This is an open access article distributed under the Creative Commons Attribution License,which permits unrestricted use, distribution, and reproduction in any medium, provided the original work is properly cited.
Objective. To investigate the association of single-nucleotide polymorphisms (SNPs) in SP110 gene and TNF-α gene amongpulmonary TB (PTB) and spinal TB (STB) patients. Methods. In a total of 190 PTB patients, 183 STB patients were enrolled asthe case group and 362 healthy individuals at the same geographical region as the control group. The SP110 SNPs (rs722555and rs1135791) and the promoter -308G>A (rs1800629) and -238G>A (rs361525) polymorphisms in TNF-α were genotyped.Results. TNF-α -238G>A polymorphism was involved in susceptibility to STB, but not to PTB. The TNF-α -238 A allele was aprotective factor against STB (A versus G: OR [95% CI] = 0.331 [0.113–0.972], P = 0 044). Furthermore, the presence of the -238A allele was considered a trend to decrease the risk of STB (AG versus GG: P = 0 062, OR [95% CI] = 0.352 [0.118–1.053]; AA+AG versus GG: P = 0 050, OR [95CI%] = 0.335 [0.113–0.999]). However, SP110 SNPs (rs722555 and rs1135791) and TNF-α-308G>A (rs1800629) showed no association with PTB and STB in all genetic models. Conclusion. The TNF-α -238 A alleleappeared a protective effect against STB, whereas the SP110 SNPs (rs722555 and rs1135791) and TNF-α -308G>A (rs1800629)showed no association with susceptibility to PTB and STB patients in southern China.
1. Introduction
Tuberculosis (TB), arising from Mycobacterium tuberculo-sis (MTB) infection, remains one of the leading causes ofdeath in the world. The World Health Organization esti-mated that the TB incidence was 10.4 million, and there wereapproximately 1.7 million TB-related deaths that occurredamong HIV-negative people (1.3 million) and HIV-positiveindividuals (374000) in 2016 [1]. Spinal TB (STB) is usuallysecondary to pulmonary lesions, accounting for 1%–5% TBand 15% of extrapulmonary TB (EPTB) worldwide [2, 3].
Host genetic factors have been shown to contribute to MTBinfection outcomes.
The intracellular pathogen resistance 1 (Ipr1) gene,which is located in the sst1 (super-susceptibility to TB 1)region, has an ability to mediate innate immunity in mouseTB models. The Ipr1 gene may control the MTB growth bypromoting macrophage activities and the apoptosis ofinfected macrophage [4, 5], and it has been shown to upreg-ulate the expression of innate immunity gene to fight againstTB [6]. Speckled 110 (SP110) gene, the closest homology tothe mouse Ipr1 gene, is located on the human chromosome
HindawiDisease MarkersVolume 2017, Article ID 4590235, 8 pageshttps://doi.org/10.1155/2017/4590235
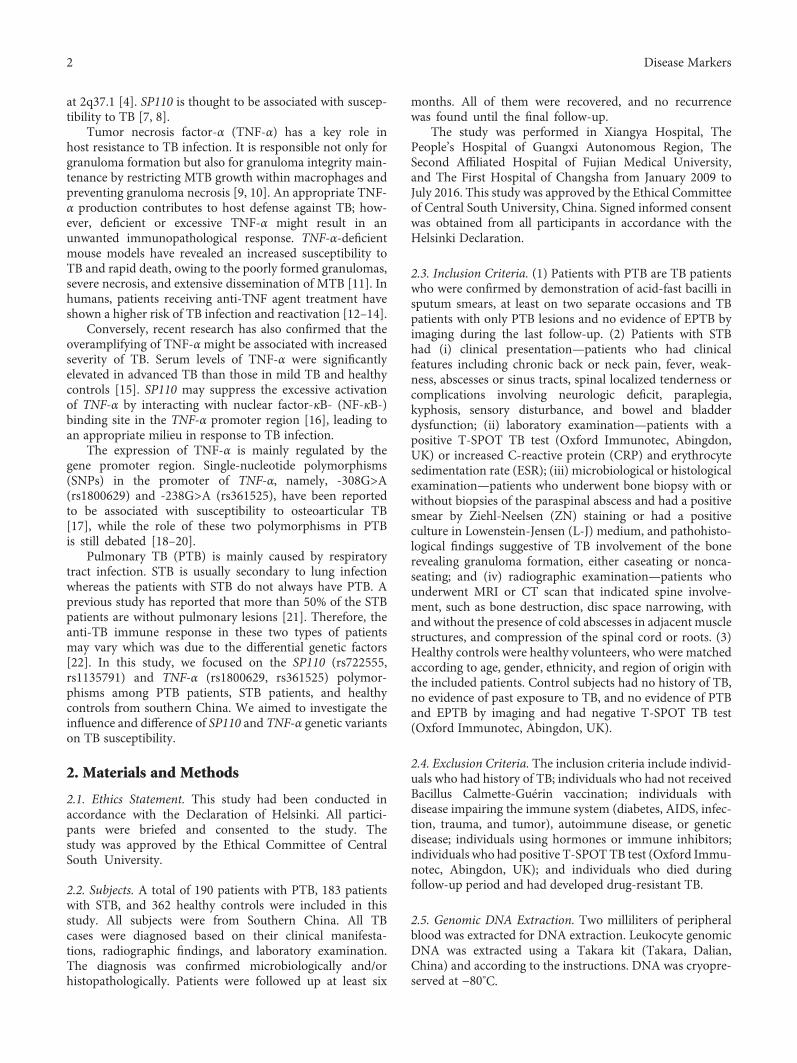
at 2q37.1 [4]. SP110 is thought to be associated with suscep-tibility to TB [7, 8].
Tumor necrosis factor-α (TNF-α) has a key role inhost resistance to TB infection. It is responsible not only forgranuloma formation but also for granuloma integrity main-tenance by restricting MTB growth within macrophages andpreventing granuloma necrosis [9, 10]. An appropriate TNF-α production contributes to host defense against TB; how-ever, deficient or excessive TNF-α might result in anunwanted immunopathological response. TNF-α-deficientmouse models have revealed an increased susceptibility toTB and rapid death, owing to the poorly formed granulomas,severe necrosis, and extensive dissemination of MTB [11]. Inhumans, patients receiving anti-TNF agent treatment haveshown a higher risk of TB infection and reactivation [12–14].
Conversely, recent research has also confirmed that theoveramplifying of TNF-αmight be associated with increasedseverity of TB. Serum levels of TNF-α were significantlyelevated in advanced TB than those in mild TB and healthycontrols [15]. SP110 may suppress the excessive activationof TNF-α by interacting with nuclear factor-κB- (NF-κB-)binding site in the TNF-α promoter region [16], leading toan appropriate milieu in response to TB infection.
The expression of TNF-α is mainly regulated by thegene promoter region. Single-nucleotide polymorphisms(SNPs) in the promoter of TNF-α, namely, -308G>A(rs1800629) and -238G>A (rs361525), have been reportedto be associated with susceptibility to osteoarticular TB[17], while the role of these two polymorphisms in PTBis still debated [18–20].
Pulmonary TB (PTB) is mainly caused by respiratorytract infection. STB is usually secondary to lung infectionwhereas the patients with STB do not always have PTB. Aprevious study has reported that more than 50% of the STBpatients are without pulmonary lesions [21]. Therefore, theanti-TB immune response in these two types of patientsmay vary which was due to the differential genetic factors[22]. In this study, we focused on the SP110 (rs722555,rs1135791) and TNF-α (rs1800629, rs361525) polymor-phisms among PTB patients, STB patients, and healthycontrols from southern China. We aimed to investigate theinfluence and difference of SP110 and TNF-α genetic variantson TB susceptibility.
2. Materials and Methods
2.1. Ethics Statement. This study had been conducted inaccordance with the Declaration of Helsinki. All partici-pants were briefed and consented to the study. Thestudy was approved by the Ethical Committee of CentralSouth University.
2.2. Subjects. A total of 190 patients with PTB, 183 patientswith STB, and 362 healthy controls were included in thisstudy. All subjects were from Southern China. All TBcases were diagnosed based on their clinical manifesta-tions, radiographic findings, and laboratory examination.The diagnosis was confirmed microbiologically and/orhistopathologically. Patients were followed up at least six
months. All of them were recovered, and no recurrencewas found until the final follow-up.
The study was performed in Xiangya Hospital, ThePeople’s Hospital of Guangxi Autonomous Region, TheSecond Affiliated Hospital of Fujian Medical University,and The First Hospital of Changsha from January 2009 toJuly 2016. This study was approved by the Ethical Committeeof Central South University, China. Signed informed consentwas obtained from all participants in accordance with theHelsinki Declaration.
2.3. Inclusion Criteria. (1) Patients with PTB are TB patientswho were confirmed by demonstration of acid-fast bacilli insputum smears, at least on two separate occasions and TBpatients with only PTB lesions and no evidence of EPTB byimaging during the last follow-up. (2) Patients with STBhad (i) clinical presentation—patients who had clinicalfeatures including chronic back or neck pain, fever, weak-ness, abscesses or sinus tracts, spinal localized tenderness orcomplications involving neurologic deficit, paraplegia,kyphosis, sensory disturbance, and bowel and bladderdysfunction; (ii) laboratory examination—patients with apositive T-SPOT TB test (Oxford Immunotec, Abingdon,UK) or increased C-reactive protein (CRP) and erythrocytesedimentation rate (ESR); (iii) microbiological or histologicalexamination—patients who underwent bone biopsy with orwithout biopsies of the paraspinal abscess and had a positivesmear by Ziehl-Neelsen (ZN) staining or had a positiveculture in Lowenstein-Jensen (L-J) medium, and pathohisto-logical findings suggestive of TB involvement of the bonerevealing granuloma formation, either caseating or nonca-seating; and (iv) radiographic examination—patients whounderwent MRI or CT scan that indicated spine involve-ment, such as bone destruction, disc space narrowing, withand without the presence of cold abscesses in adjacent musclestructures, and compression of the spinal cord or roots. (3)Healthy controls were healthy volunteers, who were matchedaccording to age, gender, ethnicity, and region of origin withthe included patients. Control subjects had no history of TB,no evidence of past exposure to TB, and no evidence of PTBand EPTB by imaging and had negative T-SPOT TB test(Oxford Immunotec, Abingdon, UK).
2.4. Exclusion Criteria. The inclusion criteria include individ-uals who had history of TB; individuals who had not receivedBacillus Calmette-Guérin vaccination; individuals withdisease impairing the immune system (diabetes, AIDS, infec-tion, trauma, and tumor), autoimmune disease, or geneticdisease; individuals using hormones or immune inhibitors;individuals who had positive T-SPOTTB test (Oxford Immu-notec, Abingdon, UK); and individuals who died duringfollow-up period and had developed drug-resistant TB.
2.5. Genomic DNA Extraction. Two milliliters of peripheralblood was extracted for DNA extraction. Leukocyte genomicDNA was extracted using a Takara kit (Takara, Dalian,China) and according to the instructions. DNA was cryopre-served at −80°C.
2 Disease Markers
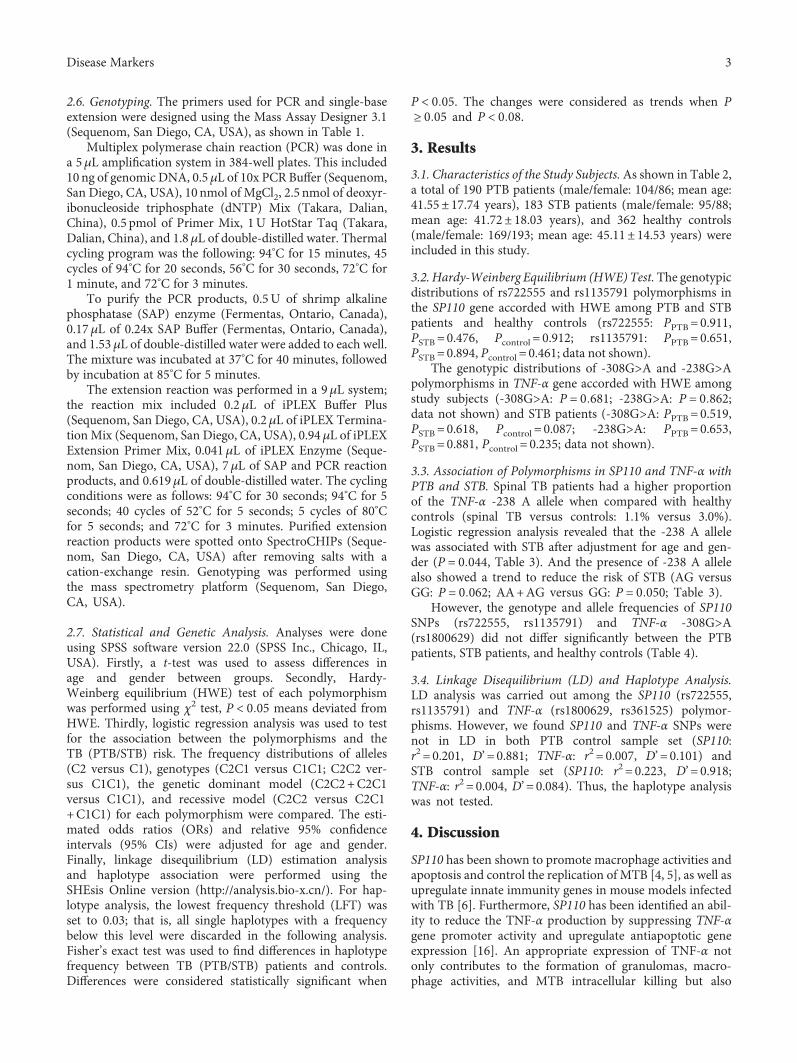
2.6. Genotyping. The primers used for PCR and single-baseextension were designed using the Mass Assay Designer 3.1(Sequenom, San Diego, CA, USA), as shown in Table 1.
Multiplex polymerase chain reaction (PCR) was done ina 5μL amplification system in 384-well plates. This included10 ng of genomic DNA, 0.5μL of 10x PCR Buffer (Sequenom,San Diego, CA, USA), 10nmol of MgCl2, 2.5 nmol of deoxyr-ibonucleoside triphosphate (dNTP) Mix (Takara, Dalian,China), 0.5 pmol of Primer Mix, 1U HotStar Taq (Takara,Dalian, China), and 1.8μL of double-distilled water. Thermalcycling program was the following: 94°C for 15 minutes, 45cycles of 94°C for 20 seconds, 56°C for 30 seconds, 72°C for1 minute, and 72°C for 3 minutes.
To purify the PCR products, 0.5U of shrimp alkalinephosphatase (SAP) enzyme (Fermentas, Ontario, Canada),0.17μL of 0.24x SAP Buffer (Fermentas, Ontario, Canada),and 1.53μL of double-distilled water were added to each well.The mixture was incubated at 37°C for 40 minutes, followedby incubation at 85°C for 5 minutes.
The extension reaction was performed in a 9μL system;the reaction mix included 0.2μL of iPLEX Buffer Plus(Sequenom, San Diego, CA, USA), 0.2μL of iPLEX Termina-tion Mix (Sequenom, San Diego, CA, USA), 0.94μL of iPLEXExtension Primer Mix, 0.041μL of iPLEX Enzyme (Seque-nom, San Diego, CA, USA), 7μL of SAP and PCR reactionproducts, and 0.619μL of double-distilled water. The cyclingconditions were as follows: 94°C for 30 seconds; 94°C for 5seconds; 40 cycles of 52°C for 5 seconds; 5 cycles of 80°Cfor 5 seconds; and 72°C for 3 minutes. Purified extensionreaction products were spotted onto SpectroCHIPs (Seque-nom, San Diego, CA, USA) after removing salts with acation-exchange resin. Genotyping was performed usingthe mass spectrometry platform (Sequenom, San Diego,CA, USA).
2.7. Statistical and Genetic Analysis. Analyses were doneusing SPSS software version 22.0 (SPSS Inc., Chicago, IL,USA). Firstly, a t-test was used to assess differences inage and gender between groups. Secondly, Hardy-Weinberg equilibrium (HWE) test of each polymorphismwas performed using χ2 test, P < 0 05 means deviated fromHWE. Thirdly, logistic regression analysis was used to testfor the association between the polymorphisms and theTB (PTB/STB) risk. The frequency distributions of alleles(C2 versus C1), genotypes (C2C1 versus C1C1; C2C2 ver-sus C1C1), the genetic dominant model (C2C2+C2C1versus C1C1), and recessive model (C2C2 versus C2C1+C1C1) for each polymorphism were compared. The esti-mated odds ratios (ORs) and relative 95% confidenceintervals (95% CIs) were adjusted for age and gender.Finally, linkage disequilibrium (LD) estimation analysisand haplotype association were performed using theSHEsis Online version (http://analysis.bio-x.cn/). For hap-lotype analysis, the lowest frequency threshold (LFT) wasset to 0.03; that is, all single haplotypes with a frequencybelow this level were discarded in the following analysis.Fisher’s exact test was used to find differences in haplotypefrequency between TB (PTB/STB) patients and controls.Differences were considered statistically significant when
P < 0 05. The changes were considered as trends when P≥ 0 05 and P < 0 08.
3. Results
3.1. Characteristics of the Study Subjects.As shown in Table 2,a total of 190 PTB patients (male/female: 104/86; mean age:41.55± 17.74 years), 183 STB patients (male/female: 95/88;mean age: 41.72± 18.03 years), and 362 healthy controls(male/female: 169/193; mean age: 45.11± 14.53 years) wereincluded in this study.
3.2. Hardy-Weinberg Equilibrium (HWE) Test.The genotypicdistributions of rs722555 and rs1135791 polymorphisms inthe SP110 gene accorded with HWE among PTB and STBpatients and healthy controls (rs722555: PPTB= 0.911,PSTB = 0.476, Pcontrol = 0.912; rs1135791: PPTB= 0.651,PSTB = 0.894, Pcontrol = 0.461; data not shown).
The genotypic distributions of -308G>A and -238G>Apolymorphisms in TNF-α gene accorded with HWE amongstudy subjects (-308G>A: P = 0 681; -238G>A: P = 0 862;data not shown) and STB patients (-308G>A: PPTB = 0.519,PSTB = 0.618, Pcontrol = 0.087; -238G>A: PPTB= 0.653,PSTB = 0.881, Pcontrol = 0.235; data not shown).
3.3. Association of Polymorphisms in SP110 and TNF-α withPTB and STB. Spinal TB patients had a higher proportionof the TNF-α -238 A allele when compared with healthycontrols (spinal TB versus controls: 1.1% versus 3.0%).Logistic regression analysis revealed that the -238 A allelewas associated with STB after adjustment for age and gen-der (P = 0 044, Table 3). And the presence of -238 A allelealso showed a trend to reduce the risk of STB (AG versusGG: P = 0 062; AA+AG versus GG: P = 0 050; Table 3).
However, the genotype and allele frequencies of SP110SNPs (rs722555, rs1135791) and TNF-α -308G>A(rs1800629) did not differ significantly between the PTBpatients, STB patients, and healthy controls (Table 4).
3.4. Linkage Disequilibrium (LD) and Haplotype Analysis.LD analysis was carried out among the SP110 (rs722555,rs1135791) and TNF-α (rs1800629, rs361525) polymor-phisms. However, we found SP110 and TNF-α SNPs werenot in LD in both PTB control sample set (SP110:r2 = 0.201, D’=0.881; TNF-α: r2 = 0.007, D’=0.101) andSTB control sample set (SP110: r2 = 0.223, D’=0.918;TNF-α: r2 = 0.004, D’=0.084). Thus, the haplotype analysiswas not tested.
4. Discussion
SP110 has been shown to promote macrophage activities andapoptosis and control the replication of MTB [4, 5], as well asupregulate innate immunity genes in mouse models infectedwith TB [6]. Furthermore, SP110 has been identified an abil-ity to reduce the TNF-α production by suppressing TNF-αgene promoter activity and upregulate antiapoptotic geneexpression [16]. An appropriate expression of TNF-α notonly contributes to the formation of granulomas, macro-phage activities, and MTB intracellular killing but also
3Disease Markers
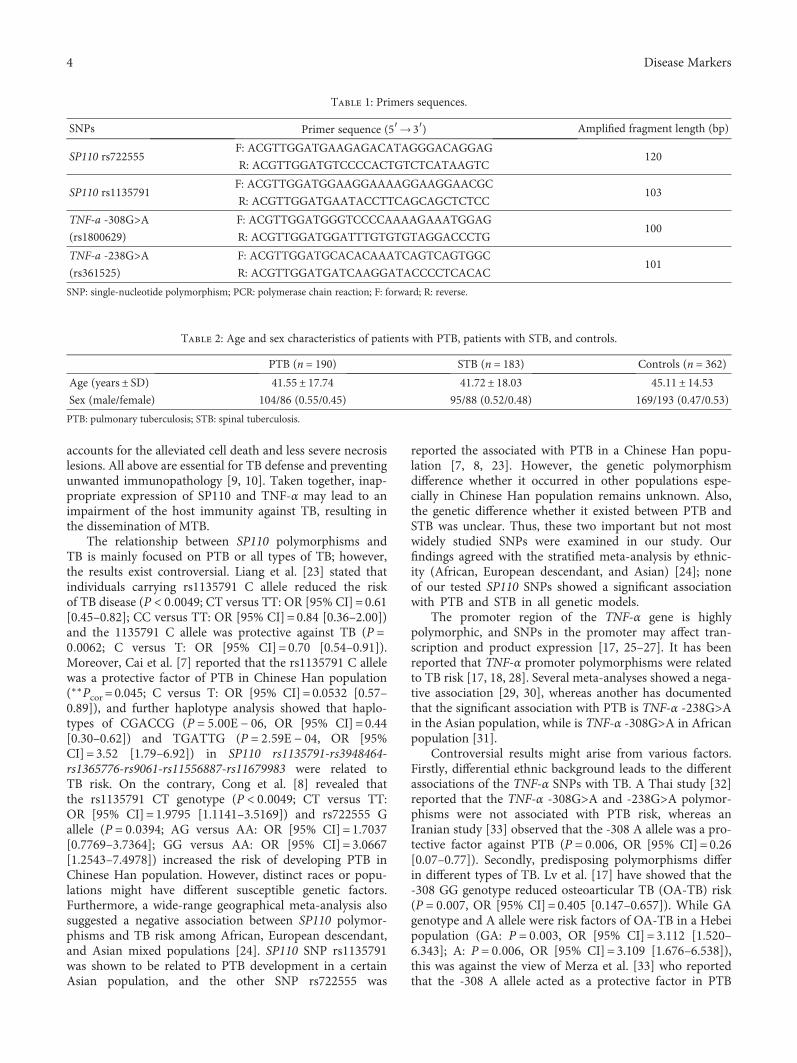
accounts for the alleviated cell death and less severe necrosislesions. All above are essential for TB defense and preventingunwanted immunopathology [9, 10]. Taken together, inap-propriate expression of SP110 and TNF-α may lead to animpairment of the host immunity against TB, resulting inthe dissemination of MTB.
The relationship between SP110 polymorphisms andTB is mainly focused on PTB or all types of TB; however,the results exist controversial. Liang et al. [23] stated thatindividuals carrying rs1135791 C allele reduced the riskof TB disease (P < 0 0049; CT versus TT: OR [95% CI] = 0.61[0.45–0.82]; CC versus TT: OR [95% CI] = 0.84 [0.36–2.00])and the 1135791 C allele was protective against TB (P =0 0062; C versus T: OR [95% CI] = 0.70 [0.54–0.91]).Moreover, Cai et al. [7] reported that the rs1135791 C allelewas a protective factor of PTB in Chinese Han population(∗∗Pcor = 0.045; C versus T: OR [95% CI] = 0.0532 [0.57–0.89]), and further haplotype analysis showed that haplo-types of CGACCG (P = 5 00E − 06, OR [95% CI] = 0.44[0.30–0.62]) and TGATTG (P = 2 59E − 04, OR [95%CI] = 3.52 [1.79–6.92]) in SP110 rs1135791-rs3948464-rs1365776-rs9061-rs11556887-rs11679983 were related toTB risk. On the contrary, Cong et al. [8] revealed thatthe rs1135791 CT genotype (P < 0 0049; CT versus TT:OR [95% CI] = 1.9795 [1.1141–3.5169]) and rs722555 Gallele (P = 0 0394; AG versus AA: OR [95% CI] = 1.7037[0.7769–3.7364]; GG versus AA: OR [95% CI] = 3.0667[1.2543–7.4978]) increased the risk of developing PTB inChinese Han population. However, distinct races or popu-lations might have different susceptible genetic factors.Furthermore, a wide-range geographical meta-analysis alsosuggested a negative association between SP110 polymor-phisms and TB risk among African, European descendant,and Asian mixed populations [24]. SP110 SNP rs1135791was shown to be related to PTB development in a certainAsian population, and the other SNP rs722555 was
reported the associated with PTB in a Chinese Han popu-lation [7, 8, 23]. However, the genetic polymorphismdifference whether it occurred in other populations espe-cially in Chinese Han population remains unknown. Also,the genetic difference whether it existed between PTB andSTB was unclear. Thus, these two important but not mostwidely studied SNPs were examined in our study. Ourfindings agreed with the stratified meta-analysis by ethnic-ity (African, European descendant, and Asian) [24]; noneof our tested SP110 SNPs showed a significant associationwith PTB and STB in all genetic models.
The promoter region of the TNF-α gene is highlypolymorphic, and SNPs in the promoter may affect tran-scription and product expression [17, 25–27]. It has beenreported that TNF-α promoter polymorphisms were relatedto TB risk [17, 18, 28]. Several meta-analyses showed a nega-tive association [29, 30], whereas another has documentedthat the significant association with PTB is TNF-α -238G>Ain the Asian population, while is TNF-α -308G>A in Africanpopulation [31].
Controversial results might arise from various factors.Firstly, differential ethnic background leads to the differentassociations of the TNF-α SNPs with TB. A Thai study [32]reported that the TNF-α -308G>A and -238G>A polymor-phisms were not associated with PTB risk, whereas anIranian study [33] observed that the -308 A allele was a pro-tective factor against PTB (P = 0 006, OR [95% CI]= 0.26[0.07–0.77]). Secondly, predisposing polymorphisms differin different types of TB. Lv et al. [17] have showed that the-308 GG genotype reduced osteoarticular TB (OA-TB) risk(P = 0 007, OR [95% CI] = 0.405 [0.147–0.657]). While GAgenotype and A allele were risk factors of OA-TB in a Hebeipopulation (GA: P = 0 003, OR [95% CI] = 3.112 [1.520–6.343]; A: P = 0 006, OR [95% CI] = 3.109 [1.676–6.538]),this was against the view of Merza et al. [33] who reportedthat the -308 A allele acted as a protective factor in PTB
Table 1: Primers sequences.
SNPs Primer sequence (5′→ 3′) Amplified fragment length (bp)
SP110 rs722555F: ACGTTGGATGAAGAGACATAGGGACAGGAG
120R: ACGTTGGATGTCCCCACTGTCTCATAAGTC
SP110 rs1135791F: ACGTTGGATGGAAGGAAAAGGAAGGAACGC
103R: ACGTTGGATGAATACCTTCAGCAGCTCTCC
TNF-a -308G>A F: ACGTTGGATGGGTCCCCAAAAGAAATGGAG100
(rs1800629) R: ACGTTGGATGGATTTGTGTGTAGGACCCTG
TNF-a -238G>A F: ACGTTGGATGCACACAAATCAGTCAGTGGC101
(rs361525) R: ACGTTGGATGATCAAGGATACCCCTCACAC
SNP: single-nucleotide polymorphism; PCR: polymerase chain reaction; F: forward; R: reverse.
Table 2: Age and sex characteristics of patients with PTB, patients with STB, and controls.
PTB (n = 190) STB (n = 183) Controls (n = 362)Age (years± SD) 41.55± 17.74 41.72± 18.03 45.11± 14.53Sex (male/female) 104/86 (0.55/0.45) 95/88 (0.52/0.48) 169/193 (0.47/0.53)
PTB: pulmonary tuberculosis; STB: spinal tuberculosis.
4 Disease Markers
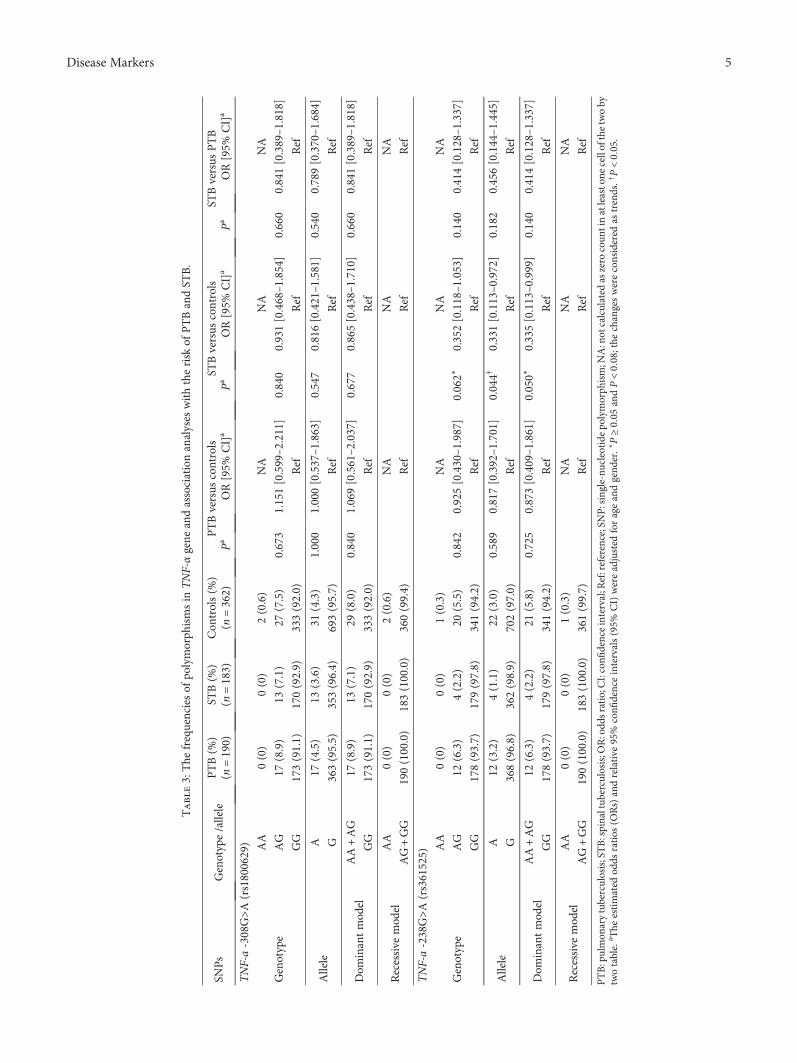
Table3:The
frequenciesof
polymorph
ismsin
TNF-αgene
andassociationanalyses
withtherisk
ofPTBandST
B.
SNPs
Genotype/allele
PTB(%
)ST
B(%
)Con
trols(%
)PTBversus
controls
STBversus
controls
STBversus
PTB
(n=190)
(n=183)
(n=362)
Pa
OR[95%
CI]a
Pa
OR[95%
CI]a
Pa
OR[95%
CI]a
TNF-a-308G>A
(rs1800629)
Genotype
AA
0(0)
0(0)
2(0.6)
NA
NA
NA
AG
17(8.9)
13(7.1)
27(7.5)
0.673
1.151[0.599–2.211]
0.840
0.931[0.468–1.854]
0.660
0.841[0.389–1.818]
GG
173(91.1)
170(92.9)
333(92.0)
Ref
Ref
Ref
Allele
A17
(4.5)
13(3.6)
31(4.3)
1.000
1.000[0.537–1.863]
0.547
0.816[0.421–1.581]
0.540
0.789[0.370–1.684]
G363(95.5)
353(96.4)
693(95.7)
Ref
Ref
Ref
Dom
inantmod
elAA+AG
17(8.9)
13(7.1)
29(8.0)
0.840
1.069[0.561–2.037]
0.677
0.865[0.438–1.710]
0.660
0.841[0.389–1.818]
GG
173(91.1)
170(92.9)
333(92.0)
Ref
Ref
Ref
Recessive
mod
elAA
0(0)
0(0)
2(0.6)
NA
NA
NA
AG+GG
190(100.0)
183(100.0)
360(99.4)
Ref
Ref
Ref
TNF-a-238G>A
(rs361525)
Genotype
AA
0(0)
0(0)
1(0.3)
NA
NA
NA
AG
12(6.3)
4(2.2)
20(5.5)
0.842
0.925[0.430–1.987]
0.062∗
0.352[0.118–1.053]
0.140
0.414[0.128–1.337]
GG
178(93.7)
179(97.8)
341(94.2)
Ref
Ref
Ref
Allele
A12
(3.2)
4(1.1)
22(3.0)
0.589
0.817[0.392–1.701]
0.044†
0.331[0.113–0.972]
0.182
0.456[0.144–1.445]
G368(96.8)
362(98.9)
702(97.0)
Ref
Ref
Ref
Dom
inantmod
elAA+AG
12(6.3)
4(2.2)
21(5.8)
0.725
0.873[0.409–1.861]
0.050∗
0.335[0.113–0.999]
0.140
0.414[0.128–1.337]
GG
178(93.7)
179(97.8)
341(94.2)
Ref
Ref
Ref
Recessive
mod
elAA
0(0)
0(0)
1(0.3)
NA
NA
NA
AG+GG
190(100.0)
183(100.0)
361(99.7)
Ref
Ref
Ref
PTB:pulmon
arytuberculosis;STB:spinaltub
erculosis;OR:odd
sratio;CI:confi
denceinterval;R
ef:reference;SNP:single-nu
cleotide
polymorph
ism;N
A:notcalculated
aszero
coun
tinatleasto
necellofthetwoby
twotable.
a The
estimated
odds
ratios
(ORs)andrelative
95%
confi
denceintervals(95%
CI)wereadjusted
forageandgend
er.∗P≥00
5and
P<008;the
changeswereconsidered
astrends.†P<00
5.
5Disease Markers
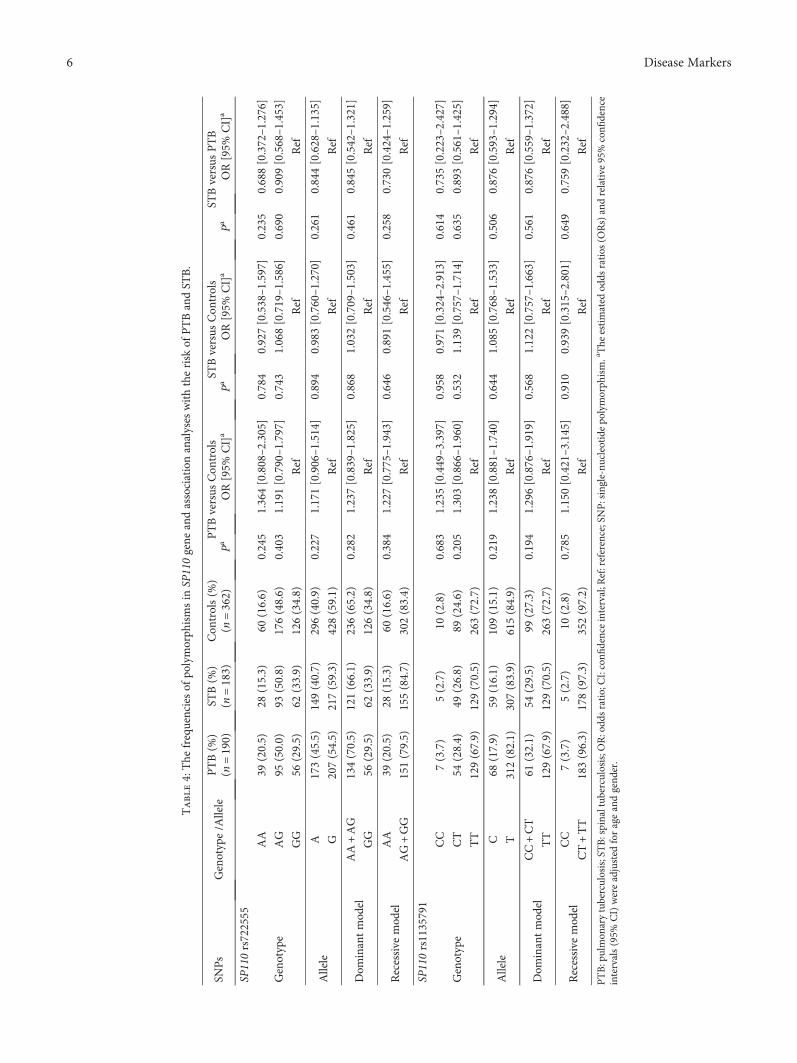
Table4:The
frequenciesof
polymorph
ismsin
SP110gene
andassociationanalyses
withtherisk
ofPTBandST
B.
SNPs
Genotype/A
llele
PTB(%
)ST
B(%
)Con
trols(%
)PTBversus
Con
trols
STBversus
Con
trols
STBversus
PTB
(n=190)
(n=183)
(n=362)
PaOR[95%
CI]a
Pa
OR[95%
CI]a
PaOR[95%
CI]a
SP110rs722555
Genotype
AA
39(20.5)
28(15.3)
60(16.6)
0.245
1.364[0.808–2.305]
0.784
0.927[0.538–1.597]
0.235
0.688[0.372–1.276]
AG
95(50.0)
93(50.8)
176(48.6)
0.403
1.191[0.790–1.797]
0.743
1.068[0.719–1.586]
0.690
0.909[0.568–1.453]
GG
56(29.5)
62(33.9)
126(34.8)
Ref
Ref
Ref
Allele
A173(45.5)
149(40.7)
296(40.9)
0.227
1.171[0.906–1.514]
0.894
0.983[0.760–1.270]
0.261
0.844[0.628–1.135]
G207(54.5)
217(59.3)
428(59.1)
Ref
Ref
Ref
Dom
inantmod
elAA+AG
134(70.5)
121(66.1)
236(65.2)
0.282
1.237[0.839–1.825]
0.868
1.032[0.709–1.503]
0.461
0.845[0.542–1.321]
GG
56(29.5)
62(33.9)
126(34.8)
Ref
Ref
Ref
Recessive
mod
elAA
39(20.5)
28(15.3)
60(16.6)
0.384
1.227[0.775–1.943]
0.646
0.891[0.546–1.455]
0.258
0.730[0.424–1.259]
AG+GG
151(79.5)
155(84.7)
302(83.4)
Ref
Ref
Ref
SP110rs1135791
Genotype
CC
7(3.7)
5(2.7)
10(2.8)
0.683
1.235[0.449–3.397]
0.958
0.971[0.324–2.913]
0.614
0.735[0.223–2.427]
CT
54(28.4)
49(26.8)
89(24.6)
0.205
1.303[0.866–1.960]
0.532
1.139[0.757–1.714]
0.635
0.893[0.561–1.425]
TT
129(67.9)
129(70.5)
263(72.7)
Ref
Ref
Ref
Allele
C68
(17.9)
59(16.1)
109(15.1)
0.219
1.238[0.881–1.740]
0.644
1.085[0.768–1.533]
0.506
0.876[0.593–1.294]
T312(82.1)
307(83.9)
615(84.9)
Ref
Ref
Ref
Dom
inantmod
elCC+CT
61(32.1)
54(29.5)
99(27.3)
0.194
1.296[0.876–1.919]
0.568
1.122[0.757–1.663]
0.561
0.876[0.559–1.372]
TT
129(67.9)
129(70.5)
263(72.7)
Ref
Ref
Ref
Recessive
mod
elCC
7(3.7)
5(2.7)
10(2.8)
0.785
1.150[0.421–3.145]
0.910
0.939[0.315–2.801]
0.649
0.759[0.232–2.488]
CT+TT
183(96.3)
178(97.3)
352(97.2)
Ref
Ref
Ref
PTB:pulmon
arytuberculosis;STB:spinaltub
erculosis;OR:odd
sratio;CI:confi
denceinterval;R
ef:reference;SNP:single-nu
cleotide
polymorph
ism.aThe
estimated
odds
ratios
(ORs)andrelative
95%confi
dence
intervals(95%
CI)wereadjusted
forageandgend
er.
6 Disease Markers
(A versus G: P = 0 006, OR=0.26). Finally, the oppositeassociation with the TNF-α SNPs existed in TB evolution,probably due to the consequence of natural selection. Aprevious study found that the -308 G allele (P = 0 02,OR=1.8) and -238 A allele (P < 0 0001, OR=2.2) repre-sented susceptibility factors for TB, whereas haplotype of-308A-238G heterozygote showed a protective effect onTB (P = 0 01, OR [95% CI] = 0.46 [0.24–0.85]) [28].
In our study, we investigated the TNF-α -308G>Apolymorphism (rs1800629) which was reported to be asso-ciated with the regulation of TNF-α levels [17, 27], andthe other one TNF-α SNP was -238G>A (rs361525) whichwas TB-associated [18, 28]. Our results demonstrated thatthe TNF-α -238G>A was associated with STB, but notwith PTB. The -238 A allele had shown a protective effecton STB (P = 0 044, OR [95% CI] = 0.331 [0.113–0.972])after adjusting for age and gender. Furthermore, we observeda marginal statistically different distributions of AG geno-type (AG versus GG: P = 0 062, OR [95CI%]= 0.352[0.118–1.053]) and the dominant model (AA+AG versusGG: P = 0 050, OR [95CI%]=0.335 [0.113–0.999], Table 3).Although the above two genetic models showed that theupper bound of 95% CI exceeded 1 (1.053) or closed to 1(0.999), the presence of the -238 A allele was considered atrend to decrease the risk of STB. The regulatory role ofTNF-α in the differentiation of osteoclast might be relatedto this [34]. However, we failed to find any association ofTNF-α -308G>A polymorphism with PTB and STB in ourstudy populations.
In conclusion, our study provides further evidencesupporting the host genetic variability in TB susceptibility,especially in different types of TB infection. The TNF-α-238 A allele indicates a protective effect against STB, butnot against PTB, whereas the SP110 SNPs (rs722555 andrs1135791) and TNF-α -308G>A (rs1800629) show no asso-ciation with susceptibility to PTB and STB in southernChina. Our study may serve to assess the susceptible geneticfactors and the possible outcomes of TB infection.
Additional Points
Highlight. (i) SP110 is responsible for host innate immu-nity in tuberculosis (TB) controlling. Tumor necrosis fac-tor-α (TNF-α) contributes to the protective immuneresponse against TB. (ii) Interaction of SP110 and TNF-αmay induce a downregulation of TNF-α, leading to anappropriate milieu in response to TB infection. (iii) TheTNF-α -238 A allele appeared to have a protective effectagainst STB, whereas the SP110 (rs722555, rs1135791)and TNF-α -308G>A (rs1800629) polymorphisms werenot associated with susceptibility to PTB and STB patientsin southern China.
Disclosure
Ying Zhou and Chun-yan Tan are considered co-firstauthors.
Conflicts of Interest
All of the authors declare they have no competing interests.
Authors’ Contributions
Hong-qi Zhang and Qi-le Gao conceived and designedthe experiments. Ying Zhou, Qi-le Gao, Rong-fu Huang,Yan-bing Li, and Dan He performed the experiments.Ying Zhou, Zhi-jiang Mo, and Chao-feng Guo analyzedthe data. Chun-yan Tan, Qiang Guo, Jiong Li, Guan-tengYang, Long-jie Wang, and Rong-fu Huang providedreagents, materials, and technical assistance. Ying Zhou,Jiong Li and Qi-le Gao wrote the paper. Ying Zhou andChun-yan Tan contributed equally to this work. All authorsapproved the final version of the paper.
Acknowledgments
This work was supported by the National Natural Sci-ence Foundation of China (Grant no. 81401818) andMedical and Health Planning Project of Guangxi ZhuangAutonomous Region Health and Family Planning Commis-sion, China (no. Z2016611).
References
[1] World Health Organization, Global Tuberculosis Report 2017,World Health Organization, Geneva, 2017.
[2] P. Polley and R. Dunn, “Noncontiguous spinal tuberculosis:incidence and management,” European Spine Journal,vol. 18, no. 8, pp. 1096–1101, 2009.
[3] P. Schirmer, C. A. Renault, and M. Holodniy, “Is spinaltuberculosis contagious?,” International Journal of InfectiousDiseases, vol. 14, no. 8, pp. e659–e666, 2010.
[4] H. Pan, B. S. Yan, M. Rojas et al., “Ipr1 gene mediates innateimmunity to tuberculosis,” Nature, vol. 434, no. 7034,pp. 767–772, 2005.
[5] D. B. Bloch, A. Nakajima, T. Gulick et al., “Sp110 localizes tothe PML-Sp100 nuclear body and may function as a nuclearhormone receptor transcriptional coactivator,” Molecularand Cellular Biology, vol. 20, no. 16, pp. 6138–6146, 2000.
[6] N. Li, P. Liu, L. Wang et al., “Effect of Ipr1 on expression levelsof immune genes related to macrophage anti-infection ofmycobacterium tuberculosis,” International Journal of Clinicaland Experimental Medicine, vol. 8, no. 3, pp. 3411–3419, 2015.
[7] L. Cai, S. L. Deng, L. Liang et al., “Identification of geneticassociations of SP110/MYBBP1A/RELA, with pulmonarytuberculosis in the Chinese Han population,”Human Genetics,vol. 132, no. 3, pp. 265–273, 2013.
[8] C. Jian-ni, L. Ge, Z. Dan, Y. Tao, and Y. Xiong, “Study onrelation between Sp110 gene polymorphism and tuberculosisgenetic susceptibility of Chongqing Han People,” Journal ofHygiene Research, vol. 39, no. 5, pp. 540–544, 2010.
[9] J. L. Flynn, M. M. Goldstein, J. Chan et al., “Tumor necrosisfactor-α is required in the protective immune response againstmycobacterium tuberculosis in mice,” Immunity, vol. 2, no. 6,pp. 561–572, 1995.
[10] H. Clay, H. E. Volkman, and L. Ramakrishnan, “Tumor necro-sis factor signaling mediates resistance to mycobacteria by
7Disease Markers
inhibiting bacterial growth and macrophage death,” Immu-nity, vol. 29, no. 2, pp. 283–294, 2008.
[11] A. G. Bean, D. R. Roach, H. Briscoe et al., “Structural deficien-cies in granuloma formation in TNF gene-targeted miceunderlie the heightened susceptibility to aerosol Mycobacte-rium tuberculosis infection, which is not compensated for bylymphotoxin,” The Journal of Immunology, vol. 162, no. 6,pp. 3504–3511, 1999.
[12] E. S. Kim, G. A. Song, and K. B. Cho, “Significant risk andassociated factors of active tuberculosis infection in Koreanpatients with inflammatory bowel disease using anti-TNFagents,” World Journal of Gastroenterology, vol. 21, no. 11,pp. 3308–3316, 2015.
[13] T. Ergun, D. Seckin, B. E. Baskan et al., “The risk of tuberculo-sis in patients with psoriasis treated with anti-tumor necrosisfactor agents,” International Journal of Dermatology, vol. 54,no. 5, pp. 594–599, 2015.
[14] M. A. Gardam, E. C. Keystone, R. Menzies et al., “Anti-tumournecrosis factor agents and tuberculosis risk: mechanisms ofaction and clinical management,” The Lancet InfectiousDiseases, vol. 3, no. 3, pp. 148–155, 2003.
[15] G. Fiorenza, L. Rateni, M. A. Farroni, C. Bogué, and D. G.Dlugovitzky, “TNF-α, TGF-β andNOrelationship in sera fromtuberculosis (TB) patients of different severity,” ImmunologyLetters, vol. 98, no. 1, pp. 45–48, 2005.
[16] J. S. Leu, M. L. Chen, S. Y. Chang et al., “SP110b controls hostimmunity and susceptibility to tuberculosis,” AmericanJournal of Respiratory and Critical Care Medicine, vol. 195,no. 3, pp. 369–382, 2017.
[17] Y. J. Lv, S. J. Liu, W. N. Hu et al., “Association of tumornecrosis factor-α gene polymorphism with osteoarticulartuberculosis prognosis in a Hebei population,” Genetics andMolecular Research, vol. 15, no. 4, 2016.
[18] H. M. Fan, Z. Wang, F. M. Feng et al., “Association ofTNF-α-238G/A and 308 G/A gene polymorphisms withpulmonary tuberculosis among patients with coal worker’spneumoconiosis,” Biomedical and Environmental Sciences,vol. 23, no. 2, pp. 137–145, 2010.
[19] Y. H. Lee and G. G. Song, “Associations between tumor necro-sis factor-α polymorphisms and susceptibility to pulmonarytuberculosis: meta-analysis,” Genetics and Molecular Research,vol. 14, no. 3, pp. 8602–8612, 2015.
[20] N. Mabunda, L. E. Alvarado-Arnez, A. Vubil et al., “Genepolymorphisms in patients with pulmonary tuberculosis fromMozambique,” Molecular Biology Reports, vol. 42, no. 1,pp. 71–76, 2015.
[21] N. Schlesinger, A. Lardizabal, J. Rao, J. Rao, and R. McDonald,“Tuberculosis of the spine: experience in an inner city hospi-tal,” JCR: Journal of Clinical Rheumatology, vol. 11, no. 1,pp. 17–20, 2005.
[22] P. Selvaraj, S. M. Kurian, G. Chandra, A. M. Reetha,N. Charles, and P. R. Narayanan, “Vitamin D receptor genevariants of BsmI, ApaI, TaqI, and FokI polymorphisms inspinal tuberculosis,” Clinical Genetics, vol. 65, no. 1,pp. 73–76, 2004.
[23] L. Liang, Y. L. Zhao, J. Yue et al., “Association of SP110 genepolymorphisms with susceptibility to tuberculosis in a Chinesepopulation,” Infection, Genetics and Evolution, vol. 11, no. 5,pp. 934–939, 2011.
[24] X. Lei, H. Zhu, L. Zha, and Y. Wang, “SP110 gene polymor-phisms and tuberculosis susceptibility: a systematic review
and meta-analysis based on 10 624 subjects,” Infection, Genet-ics and Evolution, vol. 12, no. 7, pp. 1473–1480, 2012.
[25] R. K. Garg and D. S. Somvanshi, “Spinal tuberculosis: areview,” The Journal of Spinal Cord Medicine, vol. 34, no. 5,pp. 440–454, 2011.
[26] S. Sharma, B. Ghosh, and S. K. Sharma, “Association of TNFpolymorphisms with sarcoidosis, its prognosis and tumournecrosis factor (TNF)-α levels in Asian Indians,” Clinical &Experimental Immunology, vol. 151, no. 2, pp. 251–259, 2008.
[27] K. M. Kroeger, K. S. Carville, and L. J. Abraham, “The -308tumor necrosis factor-α promoter polymorphism effectstranscription,” Molecular Immunology, vol. 34, no. 5,pp. 391–399, 1997.
[28] P. A. Correa, L. M. Gomez, J. Cadena, and J. M. Anaya, “Auto-immunity and tuberculosis. Opposite association with TNFpolymorphism,” The Journal of Rheumatology, vol. 32, no. 2,pp. 219–224, 2005.
[29] Z. Zhang, H. Zhu, X. Pu et al., “Association between tumornecrosis factor alpha-238G/a polymorphism and tuberculosissusceptibility: a meta-analysis study,” BMC Infectious Diseases,vol. 12, no. 1, p. 328, 2012.
[30] Q. Wang, P. Zhan, L. X. Qiu, Q. Qian, and L. K. Yu, “TNF-308gene polymorphism and tuberculosis susceptibility: a meta-analysis involving 18 studies,” Molecular Biology Reports,vol. 39, no. 4, pp. 3393–3400, 2012.
[31] Y. X. Yi, J. B. Han, L. Zhao, Y. Fang, Y. F. Zhang, and G. Y.Zhou, “Tumor necrosis factor alpha gene polymorphism con-tributes to pulmonary tuberculosis susceptibility: evidencefrom a meta-analysis,” International Journal of Clinical andExperimental Medicine, vol. 8, no. 11, pp. 20690–20700, 2015.
[32] S. Vejbaesya, N. Chierakul, P. Luangtrakool, andC. Sermduangprateep, “NRAMP1 and TNF-α polymorphismsand susceptibility to tuberculosis in Thais,” Respirology,vol. 12, no. 2, pp. 202–206, 2007.
[33] M. Merza, P. Farnia, S. Anoosheh et al., “The NRAMPI, VDRand TNF-α gene polymorphisms in Iranian tuberculosispatients: the study on host susceptibility,” Brazilian Journalof Infectious Diseases, vol. 13, no. 4, pp. 252–256, 2009.
[34] Y. Cao, I. D. C. Jansen, S. Sprangers, T. J. de Vries, andV. Everts, “TNF-α has both stimulatory and inhibitory effectson mouse monocyte-derived osteoclastogenesis,” Journal ofCellular Physiology, vol. 232, no. 12, pp. 3273–3285, 2017.
8 Disease Markers
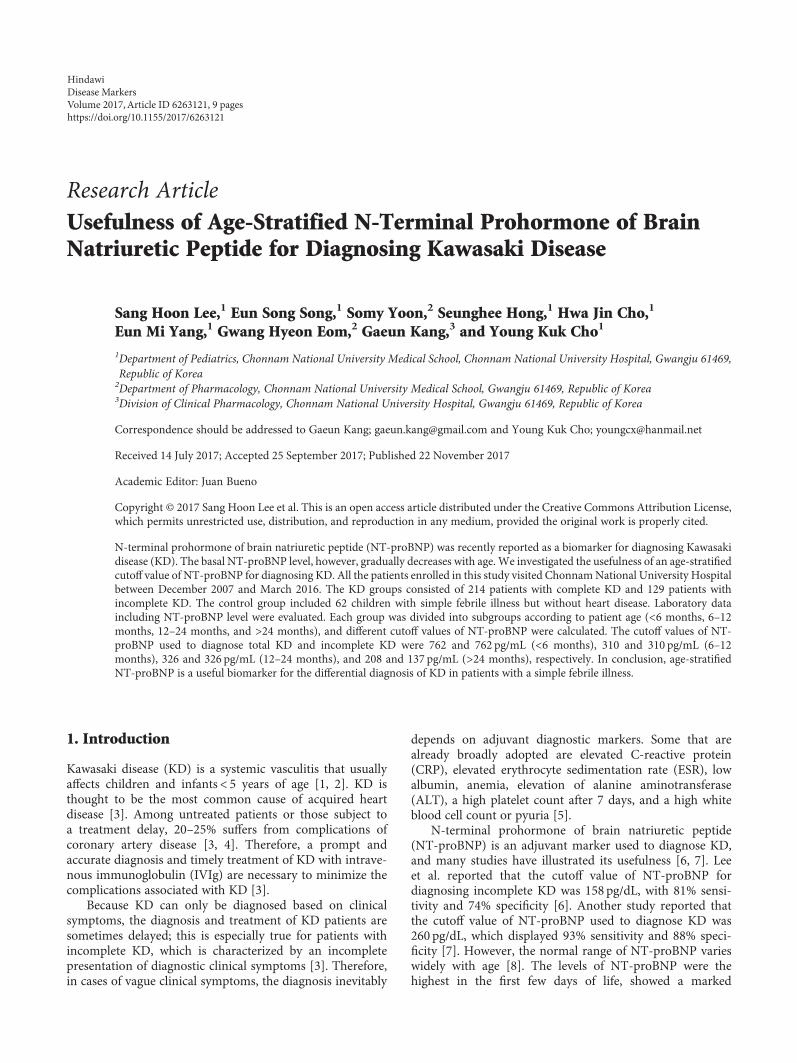
Research ArticleUsefulness of Age-Stratified N-Terminal Prohormone of BrainNatriuretic Peptide for Diagnosing Kawasaki Disease
Sang Hoon Lee,1 Eun Song Song,1 Somy Yoon,2 Seunghee Hong,1 Hwa Jin Cho,1
Eun Mi Yang,1 Gwang Hyeon Eom,2 Gaeun Kang,3 and Young Kuk Cho1
1Department of Pediatrics, Chonnam National University Medical School, Chonnam National University Hospital, Gwangju 61469,Republic of Korea2Department of Pharmacology, Chonnam National University Medical School, Gwangju 61469, Republic of Korea3Division of Clinical Pharmacology, Chonnam National University Hospital, Gwangju 61469, Republic of Korea
Correspondence should be addressed to Gaeun Kang; [email protected] and Young Kuk Cho; [email protected]
Received 14 July 2017; Accepted 25 September 2017; Published 22 November 2017
Academic Editor: Juan Bueno
Copyright © 2017 Sang Hoon Lee et al. This is an open access article distributed under the Creative Commons Attribution License,which permits unrestricted use, distribution, and reproduction in any medium, provided the original work is properly cited.
N-terminal prohormone of brain natriuretic peptide (NT-proBNP) was recently reported as a biomarker for diagnosing Kawasakidisease (KD). The basal NT-proBNP level, however, gradually decreases with age. We investigated the usefulness of an age-stratifiedcutoff value of NT-proBNP for diagnosing KD. All the patients enrolled in this study visited ChonnamNational University Hospitalbetween December 2007 and March 2016. The KD groups consisted of 214 patients with complete KD and 129 patients withincomplete KD. The control group included 62 children with simple febrile illness but without heart disease. Laboratory dataincluding NT-proBNP level were evaluated. Each group was divided into subgroups according to patient age (<6 months, 6–12months, 12–24 months, and >24 months), and different cutoff values of NT-proBNP were calculated. The cutoff values of NT-proBNP used to diagnose total KD and incomplete KD were 762 and 762 pg/mL (<6 months), 310 and 310 pg/mL (6–12months), 326 and 326 pg/mL (12–24 months), and 208 and 137 pg/mL (>24 months), respectively. In conclusion, age-stratifiedNT-proBNP is a useful biomarker for the differential diagnosis of KD in patients with a simple febrile illness.
1. Introduction
Kawasaki disease (KD) is a systemic vasculitis that usuallyaffects children and infants< 5 years of age [1, 2]. KD isthought to be the most common cause of acquired heartdisease [3]. Among untreated patients or those subject toa treatment delay, 20–25% suffers from complications ofcoronary artery disease [3, 4]. Therefore, a prompt andaccurate diagnosis and timely treatment of KD with intrave-nous immunoglobulin (IVIg) are necessary to minimize thecomplications associated with KD [3].
Because KD can only be diagnosed based on clinicalsymptoms, the diagnosis and treatment of KD patients aresometimes delayed; this is especially true for patients withincomplete KD, which is characterized by an incompletepresentation of diagnostic clinical symptoms [3]. Therefore,in cases of vague clinical symptoms, the diagnosis inevitably
depends on adjuvant diagnostic markers. Some that arealready broadly adopted are elevated C-reactive protein(CRP), elevated erythrocyte sedimentation rate (ESR), lowalbumin, anemia, elevation of alanine aminotransferase(ALT), a high platelet count after 7 days, and a high whiteblood cell count or pyuria [5].
N-terminal prohormone of brain natriuretic peptide(NT-proBNP) is an adjuvant marker used to diagnose KD,and many studies have illustrated its usefulness [6, 7]. Leeet al. reported that the cutoff value of NT-proBNP fordiagnosing incomplete KD was 158 pg/dL, with 81% sensi-tivity and 74% specificity [6]. Another study reported thatthe cutoff value of NT-proBNP used to diagnose KD was260 pg/dL, which displayed 93% sensitivity and 88% speci-ficity [7]. However, the normal range of NT-proBNP varieswidely with age [8]. The levels of NT-proBNP were thehighest in the first few days of life, showed a marked
HindawiDisease MarkersVolume 2017, Article ID 6263121, 9 pageshttps://doi.org/10.1155/2017/6263121
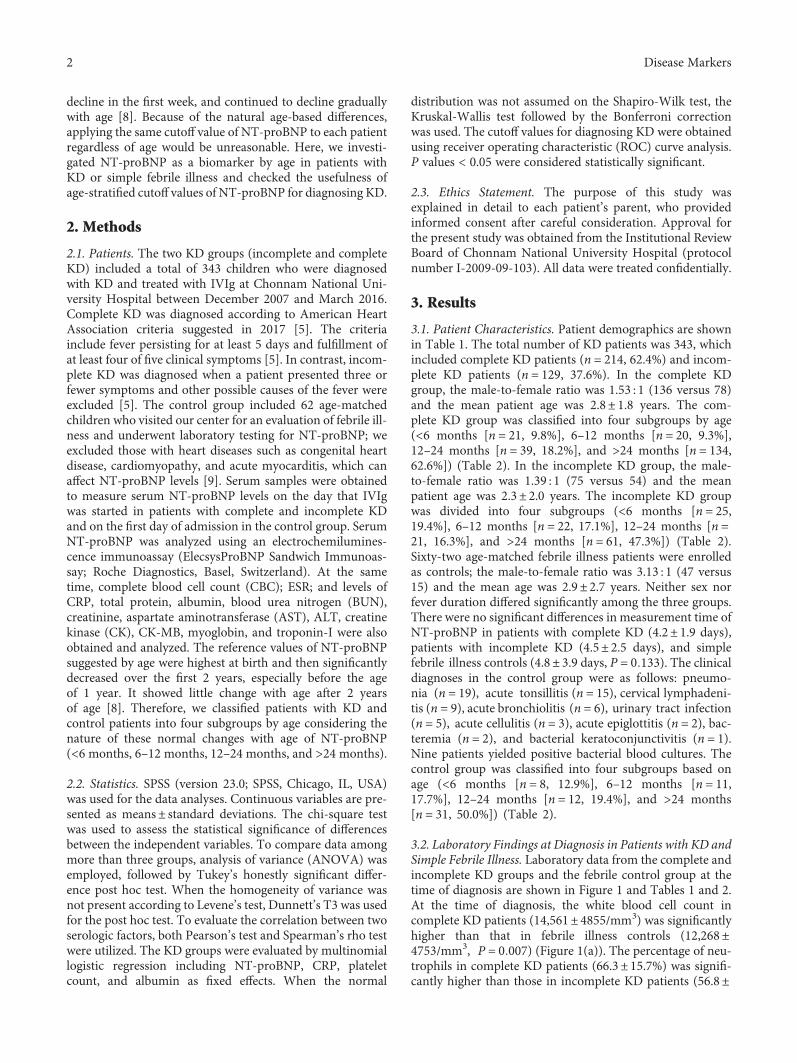
decline in the first week, and continued to decline graduallywith age [8]. Because of the natural age-based differences,applying the same cutoff value of NT-proBNP to each patientregardless of age would be unreasonable. Here, we investi-gated NT-proBNP as a biomarker by age in patients withKD or simple febrile illness and checked the usefulness ofage-stratified cutoff values of NT-proBNP for diagnosing KD.
2. Methods
2.1. Patients. The two KD groups (incomplete and completeKD) included a total of 343 children who were diagnosedwith KD and treated with IVIg at Chonnam National Uni-versity Hospital between December 2007 and March 2016.Complete KD was diagnosed according to American HeartAssociation criteria suggested in 2017 [5]. The criteriainclude fever persisting for at least 5 days and fulfillment ofat least four of five clinical symptoms [5]. In contrast, incom-plete KD was diagnosed when a patient presented three orfewer symptoms and other possible causes of the fever wereexcluded [5]. The control group included 62 age-matchedchildren who visited our center for an evaluation of febrile ill-ness and underwent laboratory testing for NT-proBNP; weexcluded those with heart diseases such as congenital heartdisease, cardiomyopathy, and acute myocarditis, which canaffect NT-proBNP levels [9]. Serum samples were obtainedto measure serum NT-proBNP levels on the day that IVIgwas started in patients with complete and incomplete KDand on the first day of admission in the control group. SerumNT-proBNP was analyzed using an electrochemilumines-cence immunoassay (ElecsysProBNP Sandwich Immunoas-say; Roche Diagnostics, Basel, Switzerland). At the sametime, complete blood cell count (CBC); ESR; and levels ofCRP, total protein, albumin, blood urea nitrogen (BUN),creatinine, aspartate aminotransferase (AST), ALT, creatinekinase (CK), CK-MB, myoglobin, and troponin-I were alsoobtained and analyzed. The reference values of NT-proBNPsuggested by age were highest at birth and then significantlydecreased over the first 2 years, especially before the ageof 1 year. It showed little change with age after 2 yearsof age [8]. Therefore, we classified patients with KD andcontrol patients into four subgroups by age considering thenature of these normal changes with age of NT-proBNP(<6 months, 6–12 months, 12–24 months, and >24 months).
2.2. Statistics. SPSS (version 23.0; SPSS, Chicago, IL, USA)was used for the data analyses. Continuous variables are pre-sented as means± standard deviations. The chi-square testwas used to assess the statistical significance of differencesbetween the independent variables. To compare data amongmore than three groups, analysis of variance (ANOVA) wasemployed, followed by Tukey’s honestly significant differ-ence post hoc test. When the homogeneity of variance wasnot present according to Levene’s test, Dunnett’s T3 was usedfor the post hoc test. To evaluate the correlation between twoserologic factors, both Pearson’s test and Spearman’s rho testwere utilized. The KD groups were evaluated by multinomiallogistic regression including NT-proBNP, CRP, plateletcount, and albumin as fixed effects. When the normal
distribution was not assumed on the Shapiro-Wilk test, theKruskal-Wallis test followed by the Bonferroni correctionwas used. The cutoff values for diagnosing KD were obtainedusing receiver operating characteristic (ROC) curve analysis.P values < 0.05 were considered statistically significant.
2.3. Ethics Statement. The purpose of this study wasexplained in detail to each patient’s parent, who providedinformed consent after careful consideration. Approval forthe present study was obtained from the Institutional ReviewBoard of Chonnam National University Hospital (protocolnumber I-2009-09-103). All data were treated confidentially.
3. Results
3.1. Patient Characteristics. Patient demographics are shownin Table 1. The total number of KD patients was 343, whichincluded complete KD patients (n = 214, 62.4%) and incom-plete KD patients (n = 129, 37.6%). In the complete KDgroup, the male-to-female ratio was 1.53 : 1 (136 versus 78)and the mean patient age was 2.8± 1.8 years. The com-plete KD group was classified into four subgroups by age(<6 months [n = 21, 9.8%], 6–12 months [n = 20, 9.3%],12–24 months [n = 39, 18.2%], and >24 months [n = 134,62.6%]) (Table 2). In the incomplete KD group, the male-to-female ratio was 1.39 : 1 (75 versus 54) and the meanpatient age was 2.3± 2.0 years. The incomplete KD groupwas divided into four subgroups (<6 months [n = 25,19.4%], 6–12 months [n = 22, 17.1%], 12–24 months [n =21, 16.3%], and >24 months [n = 61, 47.3%]) (Table 2).Sixty-two age-matched febrile illness patients were enrolledas controls; the male-to-female ratio was 3.13 : 1 (47 versus15) and the mean age was 2.9± 2.7 years. Neither sex norfever duration differed significantly among the three groups.There were no significant differences in measurement time ofNT-proBNP in patients with complete KD (4.2± 1.9 days),patients with incomplete KD (4.5± 2.5 days), and simplefebrile illness controls (4.8± 3.9 days, P = 0 133). The clinicaldiagnoses in the control group were as follows: pneumo-nia (n = 19), acute tonsillitis (n = 15), cervical lymphadeni-tis (n = 9), acute bronchiolitis (n = 6), urinary tract infection(n = 5), acute cellulitis (n = 3), acute epiglottitis (n = 2), bac-teremia (n = 2), and bacterial keratoconjunctivitis (n = 1).Nine patients yielded positive bacterial blood cultures. Thecontrol group was classified into four subgroups based onage (<6 months [n = 8, 12.9%], 6–12 months [n = 11,17.7%], 12–24 months [n = 12, 19.4%], and >24 months[n = 31, 50.0%]) (Table 2).
3.2. Laboratory Findings at Diagnosis in Patients with KD andSimple Febrile Illness. Laboratory data from the complete andincomplete KD groups and the febrile control group at thetime of diagnosis are shown in Figure 1 and Tables 1 and 2.At the time of diagnosis, the white blood cell count incomplete KD patients (14,561± 4855/mm3) was significantlyhigher than that in febrile illness controls (12,268±4753/mm3, P = 0 007) (Figure 1(a)). The percentage of neu-trophils in complete KD patients (66.3± 15.7%) was signifi-cantly higher than those in incomplete KD patients (56.8±
2 Disease Markers
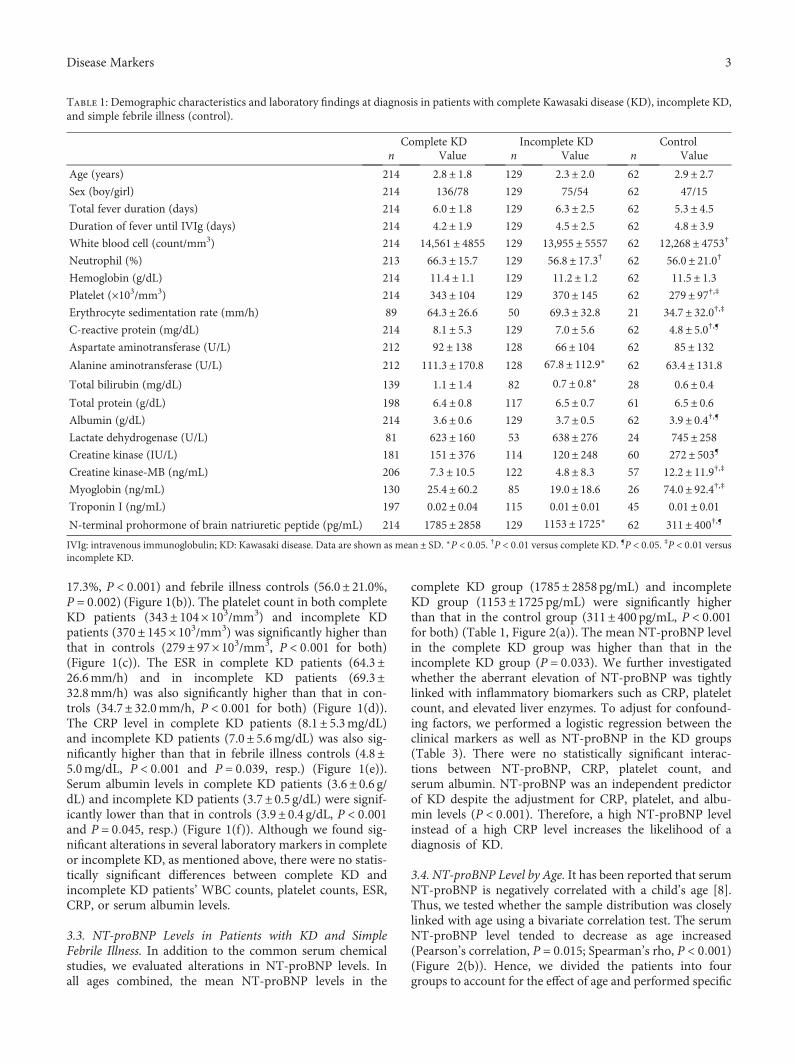
17.3%, P < 0 001) and febrile illness controls (56.0± 21.0%,P = 0 002) (Figure 1(b)). The platelet count in both completeKD patients (343± 104× 103/mm3) and incomplete KDpatients (370± 145× 103/mm3) was significantly higher thanthat in controls (279± 97× 103/mm3, P < 0 001 for both)(Figure 1(c)). The ESR in complete KD patients (64.3±26.6mm/h) and in incomplete KD patients (69.3±32.8mm/h) was also significantly higher than that in con-trols (34.7± 32.0mm/h, P < 0 001 for both) (Figure 1(d)).The CRP level in complete KD patients (8.1± 5.3mg/dL)and incomplete KD patients (7.0± 5.6mg/dL) was also sig-nificantly higher than that in febrile illness controls (4.8±5.0mg/dL, P < 0 001 and P = 0 039, resp.) (Figure 1(e)).Serum albumin levels in complete KD patients (3.6± 0.6 g/dL) and incomplete KD patients (3.7± 0.5 g/dL) were signif-icantly lower than that in controls (3.9± 0.4 g/dL, P < 0 001and P = 0 045, resp.) (Figure 1(f)). Although we found sig-nificant alterations in several laboratory markers in completeor incomplete KD, as mentioned above, there were no statis-tically significant differences between complete KD andincomplete KD patients’ WBC counts, platelet counts, ESR,CRP, or serum albumin levels.
3.3. NT-proBNP Levels in Patients with KD and SimpleFebrile Illness. In addition to the common serum chemicalstudies, we evaluated alterations in NT-proBNP levels. Inall ages combined, the mean NT-proBNP levels in the
complete KD group (1785± 2858 pg/mL) and incompleteKD group (1153± 1725 pg/mL) were significantly higherthan that in the control group (311± 400 pg/mL, P < 0 001for both) (Table 1, Figure 2(a)). The mean NT-proBNP levelin the complete KD group was higher than that in theincomplete KD group (P = 0 033). We further investigatedwhether the aberrant elevation of NT-proBNP was tightlylinked with inflammatory biomarkers such as CRP, plateletcount, and elevated liver enzymes. To adjust for confound-ing factors, we performed a logistic regression between theclinical markers as well as NT-proBNP in the KD groups(Table 3). There were no statistically significant interac-tions between NT-proBNP, CRP, platelet count, andserum albumin. NT-proBNP was an independent predictorof KD despite the adjustment for CRP, platelet, and albu-min levels (P < 0 001). Therefore, a high NT-proBNP levelinstead of a high CRP level increases the likelihood of adiagnosis of KD.
3.4. NT-proBNP Level by Age. It has been reported that serumNT-proBNP is negatively correlated with a child’s age [8].Thus, we tested whether the sample distribution was closelylinked with age using a bivariate correlation test. The serumNT-proBNP level tended to decrease as age increased(Pearson’s correlation, P = 0 015; Spearman’s rho, P < 0 001)(Figure 2(b)). Hence, we divided the patients into fourgroups to account for the effect of age and performed specific
Table 1: Demographic characteristics and laboratory findings at diagnosis in patients with complete Kawasaki disease (KD), incomplete KD,and simple febrile illness (control).
Complete KD Incomplete KD Controln Value n Value n Value
Age (years) 214 2.8± 1.8 129 2.3± 2.0 62 2.9± 2.7Sex (boy/girl) 214 136/78 129 75/54 62 47/15
Total fever duration (days) 214 6.0± 1.8 129 6.3± 2.5 62 5.3± 4.5Duration of fever until IVIg (days) 214 4.2± 1.9 129 4.5± 2.5 62 4.8± 3.9White blood cell (count/mm3) 214 14,561± 4855 129 13,955± 5557 62 12,268± 4753†
Neutrophil (%) 213 66.3± 15.7 129 56.8± 17.3† 62 56.0± 21.0†
Hemoglobin (g/dL) 214 11.4± 1.1 129 11.2± 1.2 62 11.5± 1.3Platelet (×103/mm3) 214 343± 104 129 370± 145 62 279± 97†,‡
Erythrocyte sedimentation rate (mm/h) 89 64.3± 26.6 50 69.3± 32.8 21 34.7± 32.0†,‡
C-reactive protein (mg/dL) 214 8.1± 5.3 129 7.0± 5.6 62 4.8± 5.0†,¶
Aspartate aminotransferase (U/L) 212 92± 138 128 66± 104 62 85± 132Alanine aminotransferase (U/L) 212 111.3± 170.8 128 67.8± 112.9∗ 62 63.4± 131.8Total bilirubin (mg/dL) 139 1.1± 1.4 82 0.7± 0.8∗ 28 0.6± 0.4Total protein (g/dL) 198 6.4± 0.8 117 6.5± 0.7 61 6.5± 0.6Albumin (g/dL) 214 3.6± 0.6 129 3.7± 0.5 62 3.9± 0.4†,¶
Lactate dehydrogenase (U/L) 81 623± 160 53 638± 276 24 745± 258Creatine kinase (IU/L) 181 151± 376 114 120± 248 60 272± 503¶
Creatine kinase-MB (ng/mL) 206 7.3± 10.5 122 4.8± 8.3 57 12.2± 11.9†,‡
Myoglobin (ng/mL) 130 25.4± 60.2 85 19.0± 18.6 26 74.0± 92.4†,‡
Troponin I (ng/mL) 197 0.02± 0.04 115 0.01± 0.01 45 0.01± 0.01N-terminal prohormone of brain natriuretic peptide (pg/mL) 214 1785± 2858 129 1153± 1725∗ 62 311± 400†,¶
IVIg: intravenous immunoglobulin; KD: Kawasaki disease. Data are shown as mean ± SD. ∗P < 0 05. †P < 0 01 versus complete KD. ¶P < 0 05. ‡P < 0 01 versusincomplete KD.
3Disease Markers
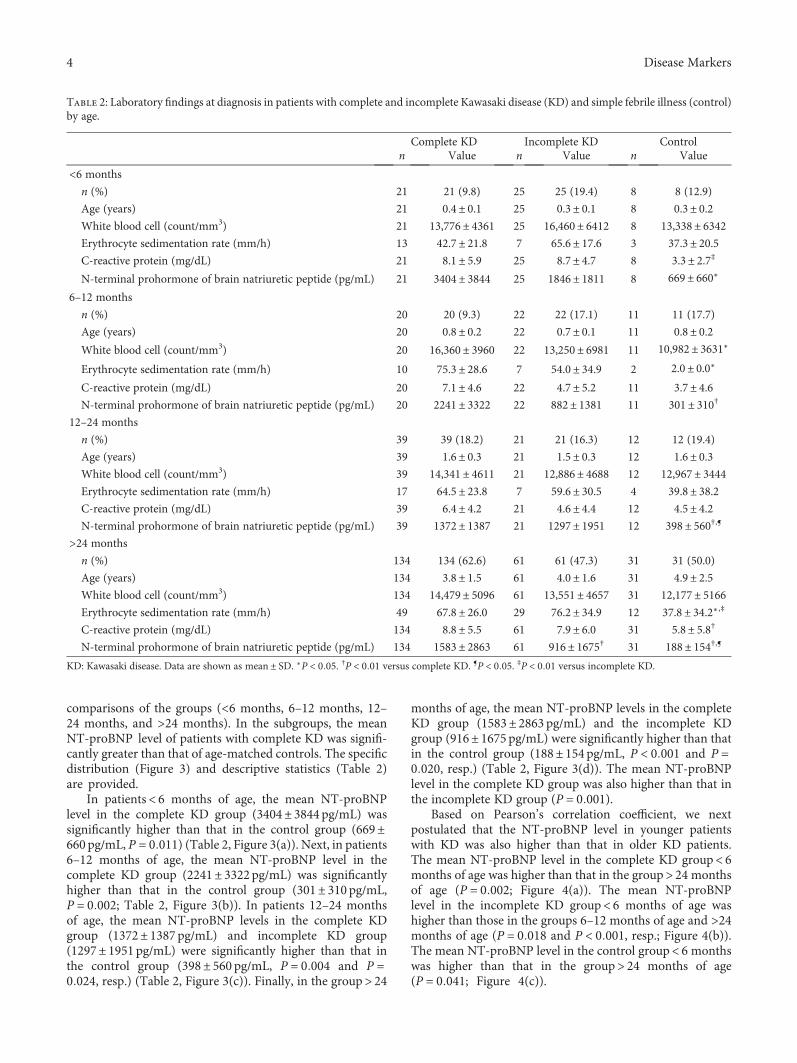
comparisons of the groups (<6 months, 6–12 months, 12–24 months, and >24 months). In the subgroups, the meanNT-proBNP level of patients with complete KD was signifi-cantly greater than that of age-matched controls. The specificdistribution (Figure 3) and descriptive statistics (Table 2)are provided.
In patients< 6 months of age, the mean NT-proBNPlevel in the complete KD group (3404± 3844 pg/mL) wassignificantly higher than that in the control group (669±660 pg/mL, P = 0 011) (Table 2, Figure 3(a)). Next, in patients6–12 months of age, the mean NT-proBNP level in thecomplete KD group (2241± 3322pg/mL) was significantlyhigher than that in the control group (301± 310 pg/mL,P = 0 002; Table 2, Figure 3(b)). In patients 12–24 monthsof age, the mean NT-proBNP levels in the complete KDgroup (1372± 1387 pg/mL) and incomplete KD group(1297± 1951 pg/mL) were significantly higher than that inthe control group (398± 560 pg/mL, P = 0 004 and P =0 024, resp.) (Table 2, Figure 3(c)). Finally, in the group> 24
months of age, the mean NT-proBNP levels in the completeKD group (1583± 2863 pg/mL) and the incomplete KDgroup (916± 1675 pg/mL) were significantly higher than thatin the control group (188± 154 pg/mL, P < 0 001 and P =0 020, resp.) (Table 2, Figure 3(d)). The mean NT-proBNPlevel in the complete KD group was also higher than that inthe incomplete KD group (P = 0 001).
Based on Pearson’s correlation coefficient, we nextpostulated that the NT-proBNP level in younger patientswith KD was also higher than that in older KD patients.The mean NT-proBNP level in the complete KD group< 6months of age was higher than that in the group> 24 monthsof age (P = 0 002; Figure 4(a)). The mean NT-proBNPlevel in the incomplete KD group< 6 months of age washigher than those in the groups 6–12 months of age and >24months of age (P = 0 018 and P < 0 001, resp.; Figure 4(b)).The mean NT-proBNP level in the control group< 6 monthswas higher than that in the group> 24 months of age(P = 0 041; Figure 4(c)).
Table 2: Laboratory findings at diagnosis in patients with complete and incomplete Kawasaki disease (KD) and simple febrile illness (control)by age.
Complete KD Incomplete KD Controln Value n Value n Value
<6 months
n (%) 21 21 (9.8) 25 25 (19.4) 8 8 (12.9)
Age (years) 21 0.4± 0.1 25 0.3± 0.1 8 0.3± 0.2White blood cell (count/mm3) 21 13,776± 4361 25 16,460± 6412 8 13,338± 6342Erythrocyte sedimentation rate (mm/h) 13 42.7± 21.8 7 65.6± 17.6 3 37.3± 20.5C-reactive protein (mg/dL) 21 8.1± 5.9 25 8.7± 4.7 8 3.3± 2.7‡
N-terminal prohormone of brain natriuretic peptide (pg/mL) 21 3404± 3844 25 1846± 1811 8 669± 660∗
6–12 months
n (%) 20 20 (9.3) 22 22 (17.1) 11 11 (17.7)
Age (years) 20 0.8± 0.2 22 0.7± 0.1 11 0.8± 0.2White blood cell (count/mm3) 20 16,360± 3960 22 13,250± 6981 11 10,982± 3631∗
Erythrocyte sedimentation rate (mm/h) 10 75.3± 28.6 7 54.0± 34.9 2 2.0± 0.0∗
C-reactive protein (mg/dL) 20 7.1± 4.6 22 4.7± 5.2 11 3.7± 4.6N-terminal prohormone of brain natriuretic peptide (pg/mL) 20 2241± 3322 22 882± 1381 11 301± 310†
12–24 months
n (%) 39 39 (18.2) 21 21 (16.3) 12 12 (19.4)
Age (years) 39 1.6± 0.3 21 1.5± 0.3 12 1.6± 0.3White blood cell (count/mm3) 39 14,341± 4611 21 12,886± 4688 12 12,967± 3444Erythrocyte sedimentation rate (mm/h) 17 64.5± 23.8 7 59.6± 30.5 4 39.8± 38.2C-reactive protein (mg/dL) 39 6.4± 4.2 21 4.6± 4.4 12 4.5± 4.2N-terminal prohormone of brain natriuretic peptide (pg/mL) 39 1372± 1387 21 1297± 1951 12 398± 560†,¶
>24 months
n (%) 134 134 (62.6) 61 61 (47.3) 31 31 (50.0)
Age (years) 134 3.8± 1.5 61 4.0± 1.6 31 4.9± 2.5White blood cell (count/mm3) 134 14,479± 5096 61 13,551± 4657 31 12,177± 5166Erythrocyte sedimentation rate (mm/h) 49 67.8± 26.0 29 76.2± 34.9 12 37.8± 34.2∗ ,‡
C-reactive protein (mg/dL) 134 8.8± 5.5 61 7.9± 6.0 31 5.8± 5.8†
N-terminal prohormone of brain natriuretic peptide (pg/mL) 134 1583± 2863 61 916± 1675† 31 188± 154†,¶
KD: Kawasaki disease. Data are shown as mean ± SD. ∗P < 0 05. †P < 0 01 versus complete KD. ¶P < 0 05. ‡P < 0 01 versus incomplete KD.
4 Disease Markers
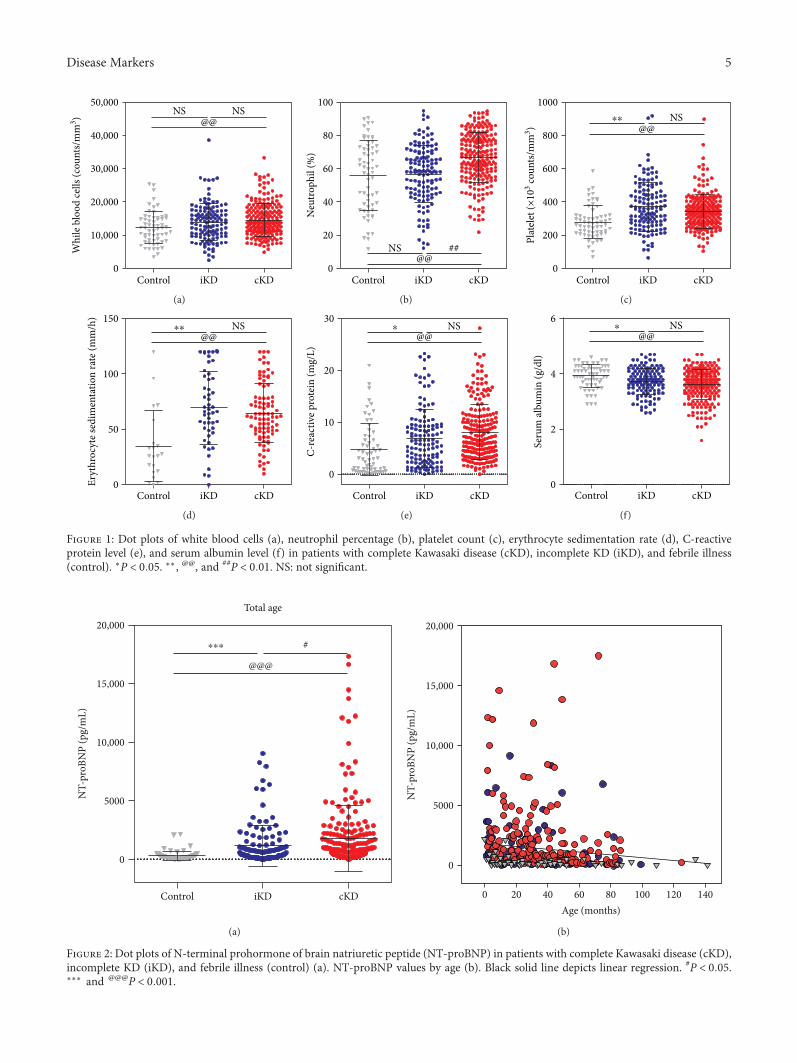
50,000NS NS
@@40,000
30,000
20,000
10,000
0Control
Whi
le b
lood
cells
(cou
nts/
mm
3 )
iKD cKD
(a)
NS ##@@
100
80
60
40
20
0
Neu
troph
il (%
)
Control iKD cKD
(b)
NS⁎⁎
@@
1000
800
600
400
200
0
Plat
elet
(×10
3 coun
ts/m
m3 )
Control iKD cKD
(c)
NS⁎⁎
@@
150
100
50
0Eryt
hroc
yte s
edim
enta
tion
rate
(mm
/h)
Control iKD cKD
(d)
NS⁎
@@30
20
10
0
C-re
activ
e pro
tein
(mg/
L)
Control iKD cKD
(e)
NS⁎
@@6
4
2
0
Seru
m al
bum
in (g
/dl)
Control iKD cKD
(f)
Figure 1: Dot plots of white blood cells (a), neutrophil percentage (b), platelet count (c), erythrocyte sedimentation rate (d), C-reactiveprotein level (e), and serum albumin level (f) in patients with complete Kawasaki disease (cKD), incomplete KD (iKD), and febrile illness(control). ∗P < 0 05. ∗∗, @@, and ##P < 0 01. NS: not significant.
0
Control iKD cKD
5000
10,000
15,000
20,000
NT-
proB
NP
(pg/
mL)
Total age
⁎⁎⁎ #
@@@
(a)
0
0 20 40 60 80 100 120 140Age (months)
5000
10,000
15,000
20,000
NT-
proB
NP
(pg/
mL)
(b)
Figure 2: Dot plots of N-terminal prohormone of brain natriuretic peptide (NT-proBNP) in patients with complete Kawasaki disease (cKD),incomplete KD (iKD), and febrile illness (control) (a). NT-proBNP values by age (b). Black solid line depicts linear regression. #P < 0 05.∗∗∗ and @@@P < 0 001.
5Disease Markers
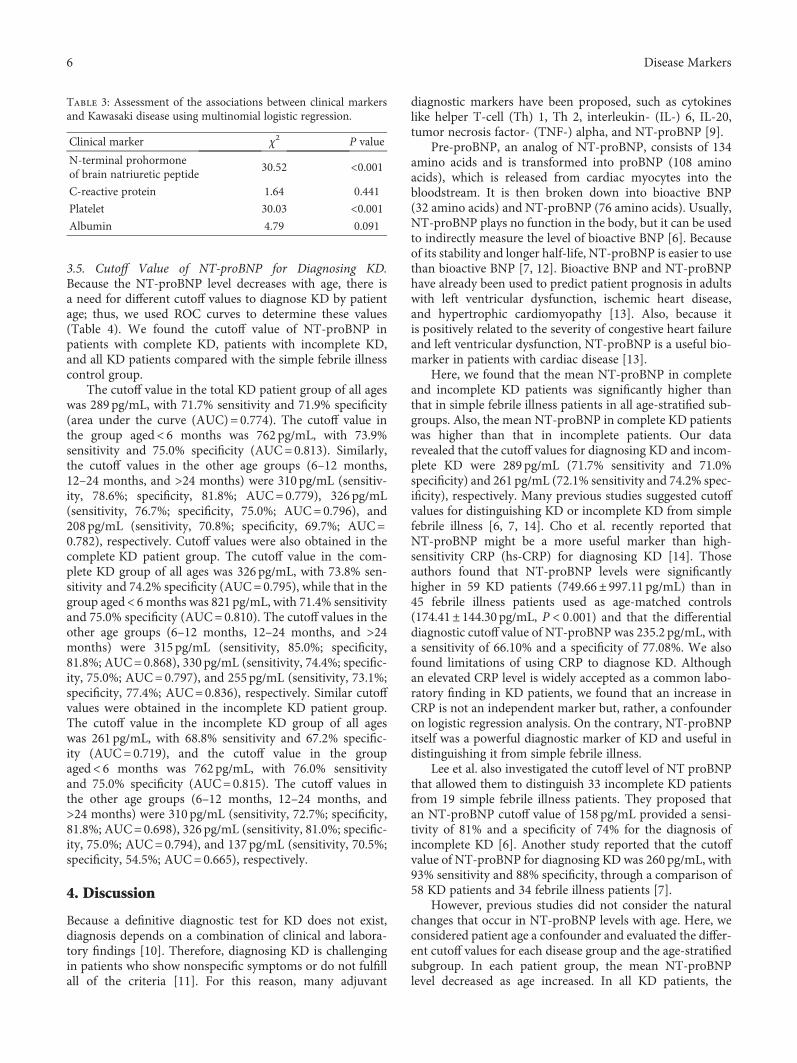
3.5. Cutoff Value of NT-proBNP for Diagnosing KD.Because the NT-proBNP level decreases with age, there isa need for different cutoff values to diagnose KD by patientage; thus, we used ROC curves to determine these values(Table 4). We found the cutoff value of NT-proBNP inpatients with complete KD, patients with incomplete KD,and all KD patients compared with the simple febrile illnesscontrol group.
The cutoff value in the total KD patient group of all ageswas 289 pg/mL, with 71.7% sensitivity and 71.9% specificity(area under the curve (AUC)= 0.774). The cutoff value inthe group aged< 6 months was 762 pg/mL, with 73.9%sensitivity and 75.0% specificity (AUC=0.813). Similarly,the cutoff values in the other age groups (6–12 months,12–24 months, and >24 months) were 310 pg/mL (sensitiv-ity, 78.6%; specificity, 81.8%; AUC=0.779), 326 pg/mL(sensitivity, 76.7%; specificity, 75.0%; AUC=0.796), and208 pg/mL (sensitivity, 70.8%; specificity, 69.7%; AUC=0.782), respectively. Cutoff values were also obtained in thecomplete KD patient group. The cutoff value in the com-plete KD group of all ages was 326 pg/mL, with 73.8% sen-sitivity and 74.2% specificity (AUC=0.795), while that in thegroup aged< 6 months was 821 pg/mL, with 71.4% sensitivityand 75.0% specificity (AUC=0.810). The cutoff values in theother age groups (6–12 months, 12–24 months, and >24months) were 315 pg/mL (sensitivity, 85.0%; specificity,81.8%; AUC=0.868), 330 pg/mL (sensitivity, 74.4%; specific-ity, 75.0%; AUC=0.797), and 255 pg/mL (sensitivity, 73.1%;specificity, 77.4%; AUC=0.836), respectively. Similar cutoffvalues were obtained in the incomplete KD patient group.The cutoff value in the incomplete KD group of all ageswas 261 pg/mL, with 68.8% sensitivity and 67.2% specific-ity (AUC=0.719), and the cutoff value in the groupaged< 6 months was 762 pg/mL, with 76.0% sensitivityand 75.0% specificity (AUC=0.815). The cutoff values inthe other age groups (6–12 months, 12–24 months, and>24 months) were 310 pg/mL (sensitivity, 72.7%; specificity,81.8%; AUC=0.698), 326 pg/mL (sensitivity, 81.0%; specific-ity, 75.0%; AUC=0.794), and 137 pg/mL (sensitivity, 70.5%;specificity, 54.5%; AUC=0.665), respectively.
4. Discussion
Because a definitive diagnostic test for KD does not exist,diagnosis depends on a combination of clinical and labora-tory findings [10]. Therefore, diagnosing KD is challengingin patients who show nonspecific symptoms or do not fulfillall of the criteria [11]. For this reason, many adjuvant
diagnostic markers have been proposed, such as cytokineslike helper T-cell (Th) 1, Th 2, interleukin- (IL-) 6, IL-20,tumor necrosis factor- (TNF-) alpha, and NT-proBNP [9].
Pre-proBNP, an analog of NT-proBNP, consists of 134amino acids and is transformed into proBNP (108 aminoacids), which is released from cardiac myocytes into thebloodstream. It is then broken down into bioactive BNP(32 amino acids) and NT-proBNP (76 amino acids). Usually,NT-proBNP plays no function in the body, but it can be usedto indirectly measure the level of bioactive BNP [6]. Becauseof its stability and longer half-life, NT-proBNP is easier to usethan bioactive BNP [7, 12]. Bioactive BNP and NT-proBNPhave already been used to predict patient prognosis in adultswith left ventricular dysfunction, ischemic heart disease,and hypertrophic cardiomyopathy [13]. Also, because itis positively related to the severity of congestive heart failureand left ventricular dysfunction, NT-proBNP is a useful bio-marker in patients with cardiac disease [13].
Here, we found that the mean NT-proBNP in completeand incomplete KD patients was significantly higher thanthat in simple febrile illness patients in all age-stratified sub-groups. Also, the mean NT-proBNP in complete KD patientswas higher than that in incomplete patients. Our datarevealed that the cutoff values for diagnosing KD and incom-plete KD were 289 pg/mL (71.7% sensitivity and 71.0%specificity) and 261 pg/mL (72.1% sensitivity and 74.2% spec-ificity), respectively. Many previous studies suggested cutoffvalues for distinguishing KD or incomplete KD from simplefebrile illness [6, 7, 14]. Cho et al. recently reported thatNT-proBNP might be a more useful marker than high-sensitivity CRP (hs-CRP) for diagnosing KD [14]. Thoseauthors found that NT-proBNP levels were significantlyhigher in 59 KD patients (749.66± 997.11 pg/mL) than in45 febrile illness patients used as age-matched controls(174.41± 144.30 pg/mL, P < 0 001) and that the differentialdiagnostic cutoff value of NT-proBNP was 235.2 pg/mL, witha sensitivity of 66.10% and a specificity of 77.08%. We alsofound limitations of using CRP to diagnose KD. Althoughan elevated CRP level is widely accepted as a common labo-ratory finding in KD patients, we found that an increase inCRP is not an independent marker but, rather, a confounderon logistic regression analysis. On the contrary, NT-proBNPitself was a powerful diagnostic marker of KD and useful indistinguishing it from simple febrile illness.
Lee et al. also investigated the cutoff level of NT proBNPthat allowed them to distinguish 33 incomplete KD patientsfrom 19 simple febrile illness patients. They proposed thatan NT-proBNP cutoff value of 158 pg/mL provided a sensi-tivity of 81% and a specificity of 74% for the diagnosis ofincomplete KD [6]. Another study reported that the cutoffvalue of NT-proBNP for diagnosing KD was 260 pg/mL, with93% sensitivity and 88% specificity, through a comparison of58 KD patients and 34 febrile illness patients [7].
However, previous studies did not consider the naturalchanges that occur in NT-proBNP levels with age. Here, weconsidered patient age a confounder and evaluated the differ-ent cutoff values for each disease group and the age-stratifiedsubgroup. In each patient group, the mean NT-proBNPlevel decreased as age increased. In all KD patients, the
Table 3: Assessment of the associations between clinical markersand Kawasaki disease using multinomial logistic regression.
Clinical marker χ2 P value
N-terminal prohormoneof brain natriuretic peptide
30.52 <0.001
C-reactive protein 1.64 0.441
Platelet 30.03 <0.001Albumin 4.79 0.091
6 Disease Markers
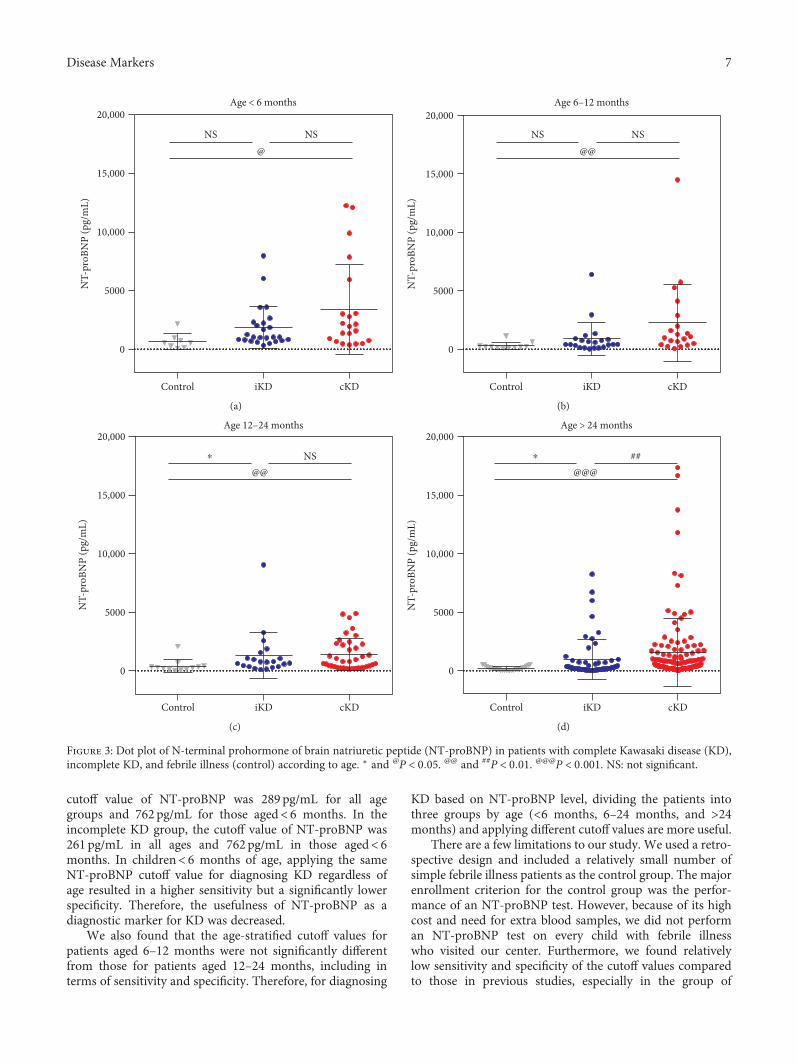
cutoff value of NT-proBNP was 289 pg/mL for all agegroups and 762 pg/mL for those aged< 6 months. In theincomplete KD group, the cutoff value of NT-proBNP was261 pg/mL in all ages and 762 pg/mL in those aged< 6months. In children< 6 months of age, applying the sameNT-proBNP cutoff value for diagnosing KD regardless ofage resulted in a higher sensitivity but a significantly lowerspecificity. Therefore, the usefulness of NT-proBNP as adiagnostic marker for KD was decreased.
We also found that the age-stratified cutoff values forpatients aged 6–12 months were not significantly differentfrom those for patients aged 12–24 months, including interms of sensitivity and specificity. Therefore, for diagnosing
KD based on NT-proBNP level, dividing the patients intothree groups by age (<6 months, 6–24 months, and >24months) and applying different cutoff values are more useful.
There are a few limitations to our study. We used a retro-spective design and included a relatively small number ofsimple febrile illness patients as the control group. The majorenrollment criterion for the control group was the perfor-mance of an NT-proBNP test. However, because of its highcost and need for extra blood samples, we did not performan NT-proBNP test on every child with febrile illnesswho visited our center. Furthermore, we found relativelylow sensitivity and specificity of the cutoff values comparedto those in previous studies, especially in the group of
Control iKD cKD
0
5000
10,000
15,000
20,000Age < 6 months
NS NS@
NT-
proB
NP
(pg/
mL)
(a)
Control iKD cKD
0
5000
10,000
15,000
20,000Age 6–12 months
NT-
proB
NP
(pg/
mL)
NS NS@@
(b)
Control iKD cKD
0
5000
10,000
15,000
20,000Age 12–24 months
NT-
proB
NP
(pg/
mL)
⁎ NS@@
(c)
Control iKD cKD
0
5000
10,000
15,000
20,000Age > 24 months
NT-
proB
NP
(pg/
mL)
⁎ ##@@@
(d)
Figure 3: Dot plot of N-terminal prohormone of brain natriuretic peptide (NT-proBNP) in patients with complete Kawasaki disease (KD),incomplete KD, and febrile illness (control) according to age. ∗ and @P < 0 05. @@ and ##P < 0 01. @@@P < 0 001. NS: not significant.
7Disease Markers
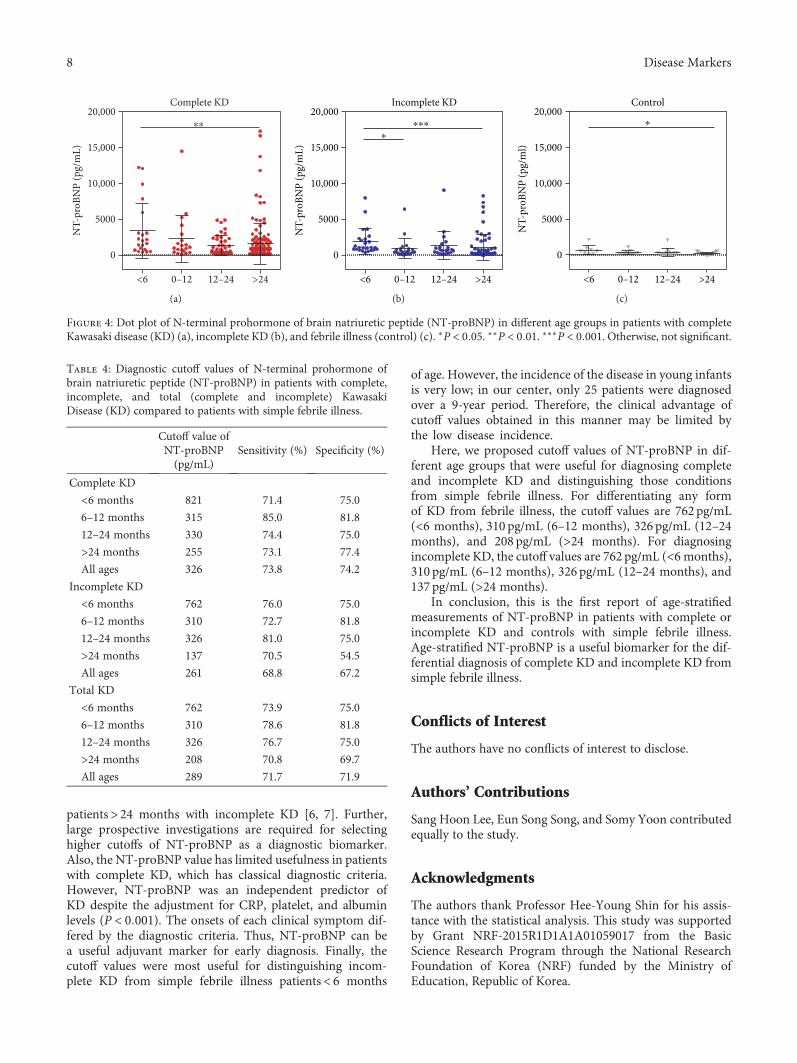
patients> 24 months with incomplete KD [6, 7]. Further,large prospective investigations are required for selectinghigher cutoffs of NT-proBNP as a diagnostic biomarker.Also, the NT-proBNP value has limited usefulness in patientswith complete KD, which has classical diagnostic criteria.However, NT-proBNP was an independent predictor ofKD despite the adjustment for CRP, platelet, and albuminlevels (P < 0 001). The onsets of each clinical symptom dif-fered by the diagnostic criteria. Thus, NT-proBNP can bea useful adjuvant marker for early diagnosis. Finally, thecutoff values were most useful for distinguishing incom-plete KD from simple febrile illness patients< 6 months
of age. However, the incidence of the disease in young infantsis very low; in our center, only 25 patients were diagnosedover a 9-year period. Therefore, the clinical advantage ofcutoff values obtained in this manner may be limited bythe low disease incidence.
Here, we proposed cutoff values of NT-proBNP in dif-ferent age groups that were useful for diagnosing completeand incomplete KD and distinguishing those conditionsfrom simple febrile illness. For differentiating any formof KD from febrile illness, the cutoff values are 762 pg/mL(<6 months), 310 pg/mL (6–12 months), 326 pg/mL (12–24months), and 208 pg/mL (>24 months). For diagnosingincomplete KD, the cutoff values are 762 pg/mL (<6 months),310 pg/mL (6–12 months), 326 pg/mL (12–24 months), and137 pg/mL (>24 months).
In conclusion, this is the first report of age-stratifiedmeasurements of NT-proBNP in patients with complete orincomplete KD and controls with simple febrile illness.Age-stratified NT-proBNP is a useful biomarker for the dif-ferential diagnosis of complete KD and incomplete KD fromsimple febrile illness.
Conflicts of Interest
The authors have no conflicts of interest to disclose.
Authors’ Contributions
Sang Hoon Lee, Eun Song Song, and Somy Yoon contributedequally to the study.
Acknowledgments
The authors thank Professor Hee-Young Shin for his assis-tance with the statistical analysis. This study was supportedby Grant NRF-2015R1D1A1A01059017 from the BasicScience Research Program through the National ResearchFoundation of Korea (NRF) funded by the Ministry ofEducation, Republic of Korea.
Complete KD
⁎⁎
20,000
15,000
10,000
5000
NT-
proB
NP
(pg/
mL)
0
<6 0–12 12–24 >24
(a)
Incomplete KD
⁎⁎⁎
⁎
NT-
proB
NP
(pg/
mL)
20,000
15,000
10,000
5000
0
<6 0–12 12–24 >24
(b)
Control
NT-
proB
NP
(pg/
ml)
20,000
15,000
10,000
5000
0
<6 0–12 12–24 >24
⁎
(c)
Figure 4: Dot plot of N-terminal prohormone of brain natriuretic peptide (NT-proBNP) in different age groups in patients with completeKawasaki disease (KD) (a), incomplete KD (b), and febrile illness (control) (c). ∗P < 0 05. ∗∗P < 0 01. ∗∗∗P < 0 001. Otherwise, not significant.
Table 4: Diagnostic cutoff values of N-terminal prohormone ofbrain natriuretic peptide (NT-proBNP) in patients with complete,incomplete, and total (complete and incomplete) KawasakiDisease (KD) compared to patients with simple febrile illness.
Cutoff value ofNT-proBNP(pg/mL)
Sensitivity (%) Specificity (%)
Complete KD
<6 months 821 71.4 75.0
6–12 months 315 85.0 81.8
12–24 months 330 74.4 75.0
>24 months 255 73.1 77.4
All ages 326 73.8 74.2
Incomplete KD
<6 months 762 76.0 75.0
6–12 months 310 72.7 81.8
12–24 months 326 81.0 75.0
>24 months 137 70.5 54.5
All ages 261 68.8 67.2
Total KD
<6 months 762 73.9 75.0
6–12 months 310 78.6 81.8
12–24 months 326 76.7 75.0
>24 months 208 70.8 69.7
All ages 289 71.7 71.9
8 Disease Markers
References
[1] D. Yanagisawa, M. Ayusawa, M. Kato et al., “Factors affectingN-terminal pro-brain natriuretic peptide elevation in the acutephase of Kawasaki disease,” Pediatrics International, vol. 58,no. 11, pp. 1105–1111, 2016.
[2] K. Takahashi, T. Oharaseki, Y. Yokouchi, H. Yamada,K. Shibuya, and S. Naoe, “A half-century of autopsy results–incidence of pediatric vasculitis syndromes, especiallyKawasaki disease,” Circulation Journal, vol. 76, no. 4, pp. 964–970, 2012.
[3] K. H. Lin, S. S. Chang, C. W. Yu et al., “Usefulness ofnatriuretic peptide for the diagnosis of Kawasaki disease: asystematic review and meta-analysis,” British Medical Jour-nal Open, vol. 5, no. 4, article e006703, 2015.
[4] M. Toyono, D. Takagi, J. Oyamada, S. Shimada, M. Aoki-Okazaki, and T. Takahashi, “Coronary artery aneurysmafter Kawasaki disease in a single coronary artery,” CirculationJournal, vol. 77, no. 9, pp. 2409–2411, 2013.
[5] B. W. McCrindle, A. H. Rowley, J. W. Newburger et al.,“Diagnosis, treatment, and long-term management ofKawasaki disease: a scientific statement for health profes-sionals from the American Heart Association,” Circulation,vol. 135, no. 17, pp. e927–e999, 2017.
[6] D. W. Lee, Y. H. Kim, M. C. Hyun, T. C. Kwon, and S. B. Lee,“NT-proBNP as a useful tool in diagnosing incompleteKawasaki disease,” Korean Journal of Pediatrics, vol. 53,no. 4, pp. 519–524, 2010.
[7] H. J. Lee, H. J. Kim, H. S. Kim, and S. J. Sohn, “NT-pro BNP: anew diagnostic screening tool for Kawasaki disease,” KoreanJournal of Pediatrics, vol. 49, no. 5, pp. 539–544, 2006.
[8] A. Nir, A. Lindinger, M. Rauh et al., “NT-pro-B-type natri-uretic peptide in infants and children: reference values basedon combined data from four studies,” Pediatric Cardiology,vol. 30, no. 1, pp. 3–8, 2009.
[9] A. Rawat and S. Singh, “Biomarkers for diagnosis of Kawasakidisease,” Indian Pediatrics, vol. 52, no. 6, pp. 473-474, 2015.
[10] D. Eleftheriou, M. Levin, D. Shingadia, R. Tulloh, N. J. Klein,and P. A. Brogan, “Management of Kawasaki disease,”Archives of Disease in Childhood, vol. 99, no. 1, pp. 74–83,2014.
[11] K. K. Seaton and A. Kharbanda, “Evidence-based managementof Kawasaki disease in the emergency department,” PediatricEmergency Medicine Practice, vol. 12, no. 1, pp. 1–20, 2015.
[12] M. Weber and C. Hamm, “Role of B-type natriuretic peptide(BNP) and NT-proBNP in clinical routine,” Heart, vol. 92,no. 6, pp. 843–849, 2006.
[13] I. Nevo, M. Erlichman, N. Algur, and A. Nir, “N-terminalpro B-type natriuretic peptide levels in infants and childrenwith acute non-cardiac diseases,” Israel Medical AssociationJournal, vol. 13, no. 7, pp. 420–424, 2011.
[14] S. Y. Cho, Y. Kim, S. H. Cha, J. T. Suh, M. Y. Han, and H. J. Lee,“Adjuvant laboratory marker of Kawasaki disease; NT-pro-BNP or hs-CRP?,” Annals of Clinical and LaboratoryScience, vol. 41, no. 4, pp. 360–363, 2011.
9Disease Markers


