Embed Size (px)
Citation preview
RESEARCH ARTICLE Open Access
Serum protein profiles as potential biomarkers forinfectious disease status in pigsMiriam GJ Koene1*†, Han A Mulder2†, Norbert Stockhofe-Zurwieden1†, Leo Kruijt2† and Mari A Smits2†
Abstract
Background: In veterinary medicine and animal husbandry, there is a need for tools allowing the early warning ofdiseases. Preferably, tests should be available that warn farmers and veterinarians during the incubation periods ofdisease and before the onset of clinical signs. The objective of this study was to explore the potential of serumprotein profiles as an early biomarker for infectious disease status. Serum samples were obtained from anexperimental pig model for porcine circovirus-associated disease (PCVAD), consisting of Porcine Circovirus type 2(PCV2) infection in combination with either Porcine Parvovirus (PPV) or Porcine Reproductive and RespiratorySyndrome virus (PRRSV). Sera were collected before and after onset of clinical signs at day 0, 5 and 19 postinfection. Serum protein profiles were evaluated against sera from non-infected control animals.
Results: Protein profiles were generated by SELDI-TOF mass spectrometry in combination with the Proteominer™technology to enrich for low-abundance proteins. Based on these protein profiles, the experimentally infected pigscould be classified according to their infectious disease status. Before the onset of clinical signs 88% of theinfected animals could be classified correctly, after the onset of clinical sigs 93%. The sensitivity of the classificationappeared to be high. The protein profiles could distinguish between separate infection models, although specificitywas moderate to low. Classification of PCV2/PRRSV infected animals was superior compared to PCV2/PPV infectedanimals. Limiting the number of proteins in the profiles (ranging from 568 to 10) had only minor effects on theclassification performance.
Conclusions: This study shows that serum protein profiles have potential for detection and identification of viralinfections in pigs before clinical signs of the disease become visible.
BackgroundIn present livestock husbandry with increasing require-ments for higher health and welfare issues but also tighteconomical margins, there is a need for tools allowing theearly warning for disease. Ideally, easy to perform toolsshould be available that warn farmers and veterinariansthat animals are infected, preferably before the onset ofclinical signs. Regular use of such tools may diminishgrowth retardations and production losses. However, testsfor early diagnosis can only be developed when animal-associated “biomarkers” exist that differ between unin-fected healthy animals and infected, but not yet diseased,animals. The search for such biomarkers can be performedby two different approaches, either focusing on differences
in predefined “candidate” markers, or by comparative fin-gerprint analysis of “all” components present in a biologi-cal sample.In human medicine extensive research has been per-
formed aiming at the discovery of early biomarkers for dif-ferent kinds of disease, including cancer. Early diagnosis isimportant because of increased treatment options and bet-ter prognosis when treatments are initiated at an earlierstage [1-3]. In such settings, involving alteration of severalpathways and processes, it has been suggested that multi-ple marker assays lead to an increase in clinical sensitivityand specificity relative to single-marker assays [4]. Also forthe early detection of infections in veterinary medicine ithas been shown that a combination of protein biomarkersincreases the performance, i.e. for transmissible spongi-form encephalopathies (TSEs), paratuberculosis, Dichelo-bacternodosus and Fasciola hepatica [5-9].
* Correspondence: [email protected]† Contributed equally1Central Veterinary Institute of Wageningen UR, Lelystad, the NetherlandsFull list of author information is available at the end of the article
Koene et al. BMC Veterinary Research 2012, 8:32http://www.biomedcentral.com/1746-6148/8/32
© 2012 Koene et al; licensee BioMed Central Ltd. This is an Open Access article distributed under the terms of the Creative CommonsAttribution License (http://creativecommons.org/licenses/by/2.0), which permits unrestricted use, distribution, and reproduction inany medium, provided the original work is properly cited.
The discovery of potential biomarkers for a number ofhuman and animal diseases has been facilitated by proteo-mic analysis, some of which have already been commercia-lized [10]. Comparative proteomic analyses can beperformed relatively easily using surface enhanced laserdesorption/ionization time-of-flight mass spectrometry(SELDI-TOF-MS) [11]. SELDI-TOF-MS technologyincludes the use of protein chip arrays that specificallybind intact proteins present in biological samples, such asbody fluids or tissue extracts. Arrays may vary in their sur-face chemistry, for instance they may have hydrophobic orhydrophilic properties, thereby selectively binding pro-teins. Protein components are solely identified by theirspecific molecular weights. By comparing SELDI-TOF-MSprofiles, protein components that differ in abundancebetween (groups of) samples can be recognized.SELDI-TOF-MS generates a profile of peaks represent-
ing the relative abundance of each protein componentretained on the chip and has a high specificity in distin-guishing (groups of) samples. This is especially true whenused in combination with a technology to enrich low-abundant proteins, i.e. the Proteominer™ technology,which is based on affinity chromatography using a solidphase combinatorial peptide ligand library. The latterleads to a reduction of the dynamic range of plasma pro-tein concentrations and an improved access to low abun-dant proteins. The combination of these technologiesprovides protein profiles representing the relative concen-trations of a large number of high- and low-abundant pro-teins in a biological sample [12,13]. In addition, thistechnology can be used at a medium throughput scale.To assess the potential of serum protein profiles as a
diagnostic marker for viral infectious diseases in pigs, weused an experimental animal model for porcine circovirus-associated disease (PCVD), an important swine diseasemostly known in the manifestation of postweaningmulti-systemic wasting syndrome (PMWS). It is, at present, oneof the most economically important diseases in swineindustry. Although Porcine Circovirus type 2 (PCV2) isregarded as the primary causative agent, PCVD is consid-ered a multifactorial disease. PCV2 pathogenesis appearsto be related to the immune-modulatory effects of thevirus while other micro-organisms contribute to the clini-cal signs associated with PCVD. Both porcine parvovirus(PPV) and porcine reproductive and respiratory syndromevirus (PRRSV) have been shown to be associated as co-fac-tors. Experimental co-infections of PPV or PRRSV withPCV2 have fully reproduced PCVAD. These data havebeen supported by field data in which these viruses havebeen isolated in association with PMWS [14].The objective of this study was to explore the potential
of serum protein profiles consisting of both high- andlow-abundant proteins, as measured by SELDI-TOF-MS,for the diagnosis of early infectious disease status in pigs.
To this end the serum protein profiles, obtained fromexperimentally infected PCV2/PPV, PCV2/PRRSV, andcontrol animals were used to investigate the classificationaccuracy for different comparisons, i.e. infected versusnon-infected, PCV2/PPV versus control, PCV2/PRRSVversus control, and the three-way classification PCV2/PPV, PCV2/PRRSV, and control. In addition, we investi-gated the classification performance of subsets of proteinprofiles that varied in the number of used proteincomponents.
ResultsClinical signs and pathologyDuring the course of the experiment, all pigs infected withPCV2 in combination with either PPV or PRRSV devel-oped clinical disease signs with a varying degree of sever-ity. No systemic disease signs were observed in the controlgroup with the exception of a temporary lameness in onepig and paleness in two pigs. Three pigs in the PCV2/PRRSV infected group and one pig from the PCV2/PPVinfected group were euthanized for humane reasons at25 and 26 days post infection. Two pigs died directly afterblood sampling, supposedly not related to the experimen-tal infection; one from the control group (at 18 days postinfection) and another pig from the PCV2/PRRSV group(at 12 days post infection).Pigs in both the PCV2/PRRSV and the PCV2/PPV
infected groups showed signs of wasting with a significantdifference in weekly body weight gain compared to thecontrol group. This was consistently seen starting at oneweek post infection (p < 0.001 and p < 0.05, respectively).Body weight gain was significantly lower in the PCV2/PRRSV infected group compared to the PCV2/PPVinfected group in the first week post infection. In the sec-ond week post infection, weight gain was similar in bothinfected groups. Data are shown in Figure 1A.Mean rectal temperature in pigs in the PCV2/PRRSV
infected group increased to febrile temperatures, i.e. rectaltemperatures ≥ 40.0°C from two days post infection on forseven days and again elevated mean body temperatureswere seen at 14 days post infection and for a period of fivedays between 18 and 23 days post infection (Figure 1B). Inthe PCV2/PPV infected group febrile body temperatureswere observed incidentally at seven days post infectionand at 13 days post infection.Clinical signs started to appear between day six and
seven in all pigs from the PCV2/PRRSV infected groupand also in a number of pigs from the PCV2/PPV infectedgroup. In the PCV2/PRRSV group the mean clinical score,based on the occurrence and severity of clinical symptoms,reached 2.5 (moderate to severe disease) of a maximumscore of 3. In this group severe disease signs started todevelop from seven days post infection on (Figure 1C). Inthe PCV2/PPV infected group the manifestation of disease
Koene et al. BMC Veterinary Research 2012, 8:32http://www.biomedcentral.com/1746-6148/8/32
Page 2 of 14

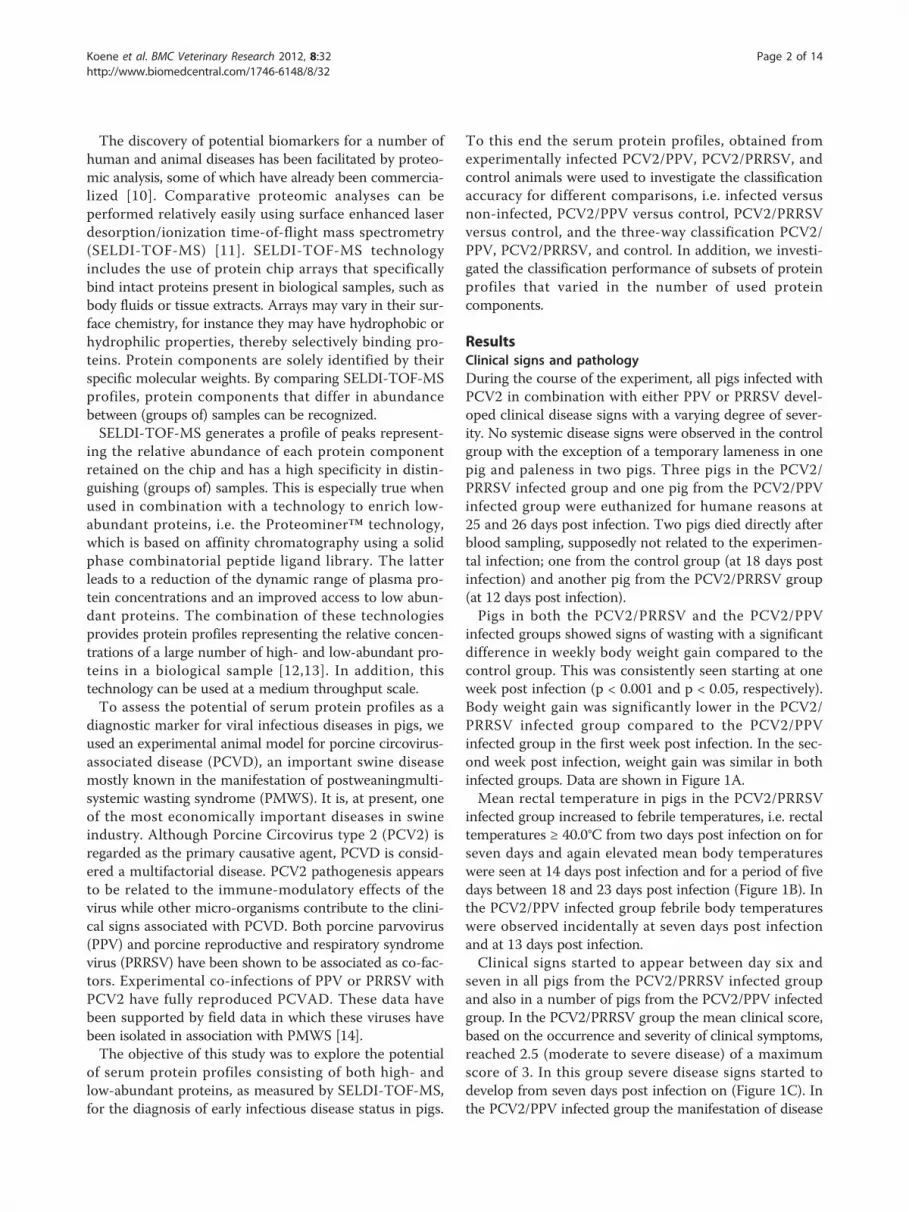
symptoms occurred slightly later and the mean clinicalscore was generally lower in this group. Clinical signs assevere depression were observed in more than 80% of allpigs from the PCV2/PRRSV group compared to 10% inthe PCV2/PPV group. Whereas respiratory distress wasrecorded in all infected pigs, 75% from the PRRSV co-infected group showed signs of pneumonia and only about20% of the PPV co-infected group (Figure 2). A palpableincrease of the size of the inguinal lymph nodes was foundin all PCV2/PRRSV infected pigs from 12 days post infec-tion on and in three pigs from the PCV2/PPV infectedgroup from 12, 19 or 21 days post infection on.
At necropsy, typically for PMWS, inguinal lymph nodesand also other lymph nodes were enlarged in all infectedpigs and the mean weights of the inguinal lymph nodes inboth infected groups were higher than in the control group(PCV2/PRRSV vs. control, p < 0.03; PCV2/PPV versus con-trol, p < 0.08). In the PCV2/PRRSV infected group two ofnine pigs had a macroscopically identifiable pneumonia,although a moderate to severe interstitial pneumonia wasfound in eight of nine pigs based on histology. In thePCV2/PPV infected group macroscopic changes wererestricted to increased size of the inguinal lymph node andkidney, liver or lung changes in a few pigs. Histologically,
Figure 1 Body weight gain (A), Body temperatures (B) and clinical scores (C) in experimentally infected groups. Course of the bodyweight gain (Figure 1A), body temperature (Figure 1B) and clinical scores (Figure 1C) were recorded in experimental groups of three weeks old,colostrum-deprived piglets inoculated with either a combination of PCV2 and PRRSV (PCV2/PRRSV), PCV2 and PPV (PCV2/PPV), or phosphatebuffered saline (controls). For each experimental group consisting of eight (PCV2/PPV) or nine animals (PCV2/PRRSV, controls) data werecollected for a period of 26 days post inoculation. Rectal temperatures were measured twice daily and clinical scores were determined based ona collection of predefined clinical symptoms ranging from no disease (0) to severe disease (3). Arrows (↑) indicate time of sampling for SELDI-TOF protein profiling.
Koene et al. BMC Veterinary Research 2012, 8:32http://www.biomedcentral.com/1746-6148/8/32
Page 3 of 14
most striking was a slight to moderate hepatitis in seven ofeight pigs. In five of 17 PCV2 infected pigs lymph nodedepletion was observed, in others a hyperplasia was moreprominent.After termination of the experiment, tissue samples were
tested for the presence of PRRSV and PCV2 nucleic aciddetection by PCR. All infected animals showed strongpositive results for PCV2 in lymph nodes, lung and spleen.Although in control animals no PCV2 nucleic acid wasdetected in pharyngeal swabs throughout the study, lowlevels of PCV2 nucleic acid were found in single or severaltissue specimens of six control animals. PRRSV nucleicacid was detected in lungs of all PCV2/PRRSV infectedanimals but not of the other groups. No PCR testing hasbeen performed for PPV.
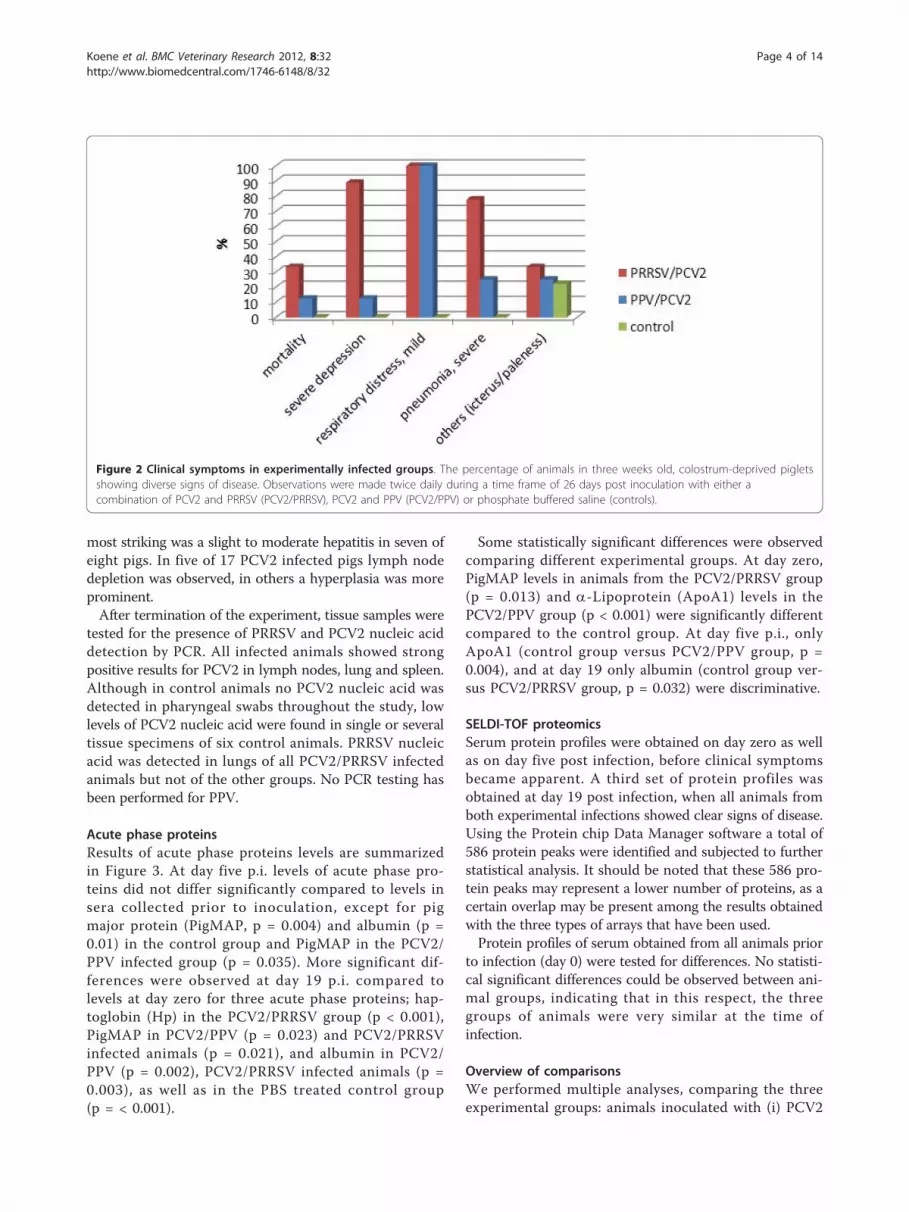
Acute phase proteinsResults of acute phase proteins levels are summarizedin Figure 3. At day five p.i. levels of acute phase pro-teins did not differ significantly compared to levels insera collected prior to inoculation, except for pigmajor protein (PigMAP, p = 0.004) and albumin (p =0.01) in the control group and PigMAP in the PCV2/PPV infected group (p = 0.035). More significant dif-ferences were observed at day 19 p.i. compared tolevels at day zero for three acute phase proteins; hap-toglobin (Hp) in the PCV2/PRRSV group (p < 0.001),PigMAP in PCV2/PPV (p = 0.023) and PCV2/PRRSVinfected animals (p = 0.021), and albumin in PCV2/PPV (p = 0.002), PCV2/PRRSV infected animals (p =0.003), as well as in the PBS treated control group(p = < 0.001).
Some statistically significant differences were observedcomparing different experimental groups. At day zero,PigMAP levels in animals from the PCV2/PRRSV group(p = 0.013) and a-Lipoprotein (ApoA1) levels in thePCV2/PPV group (p < 0.001) were significantly differentcompared to the control group. At day five p.i., onlyApoA1 (control group versus PCV2/PPV group, p =0.004), and at day 19 only albumin (control group ver-sus PCV2/PRRSV group, p = 0.032) were discriminative.
SELDI-TOF proteomicsSerum protein profiles were obtained on day zero as wellas on day five post infection, before clinical symptomsbecame apparent. A third set of protein profiles wasobtained at day 19 post infection, when all animals fromboth experimental infections showed clear signs of disease.Using the Protein chip Data Manager software a total of586 protein peaks were identified and subjected to furtherstatistical analysis. It should be noted that these 586 pro-tein peaks may represent a lower number of proteins, as acertain overlap may be present among the results obtainedwith the three types of arrays that have been used.Protein profiles of serum obtained from all animals prior
to infection (day 0) were tested for differences. No statisti-cal significant differences could be observed between ani-mal groups, indicating that in this respect, the threegroups of animals were very similar at the time ofinfection.
Overview of comparisonsWe performed multiple analyses, comparing the threeexperimental groups: animals inoculated with (i) PCV2
Figure 2 Clinical symptoms in experimentally infected groups. The percentage of animals in three weeks old, colostrum-deprived pigletsshowing diverse signs of disease. Observations were made twice daily during a time frame of 26 days post inoculation with either acombination of PCV2 and PRRSV (PCV2/PRRSV), PCV2 and PPV (PCV2/PPV) or phosphate buffered saline (controls).
Koene et al. BMC Veterinary Research 2012, 8:32http://www.biomedcentral.com/1746-6148/8/32
Page 4 of 14
and PPV (PCV2/PPV); (ii) PCV2 and PRRSV (PCV2/PRRSV); and (iii) PBS (controls), at three time points.An overview of these analyses is given in Table 1. Thecomparisons can be categorized as follows: (1) infectedanimals (PCV2/PPV together with PCV2/PRRSV) versusnon-infected control animals, (2) PCV2/PPV infectedanimals versus control animals or PCV2/PRRSV infectedanimals versus control animals, (3) PCV2/PPV, PCV2/PRRSV, and control animals as three distinct groups toexplore the discriminatory power of serum protein pro-files to distinguish the different infection models.For each comparison the number of significantly dif-
ferent protein peaks in their profiles was determined as
well as the classification accuracy. Additionally we testedwhether reducing the number of protein peaks in a pro-file affected the accuracy of classification. Next to wholeprotein profiles consisting of 586 protein peaks, we alsotested profiles with 500, 200, 100, 50, 20, and 10 proteincomponents. For this, proteins were ranked by signifi-cance and those with highest significance were selected.
Number of significant different protein peaksFor each comparison the number of significantly differentprotein peaks is shown in Table 2. Based on a maximump-value of 0.01, the number of differentially expressedprotein components ranged from 15 (PCV2/PPV versus
Figure 3 Acute phase protein levels in experimentally infected groups. Mean levels of C-reactive protein (CRP), serum amyloid A(SAA),haptoglobin (Hp), pig major protein (PigMAP), a-Lipoprotein (ApoA1), and albumin were determined in three weeks old, colostrum-deprived pigletsinoculated with either a combination of PCV2 and PRRSV (PCV2/PRRSV), PCV2 and PPV (PCV2/PPV), or phosphate buffered saline (controls).
Koene et al. BMC Veterinary Research 2012, 8:32http://www.biomedcentral.com/1746-6148/8/32
Page 5 of 14
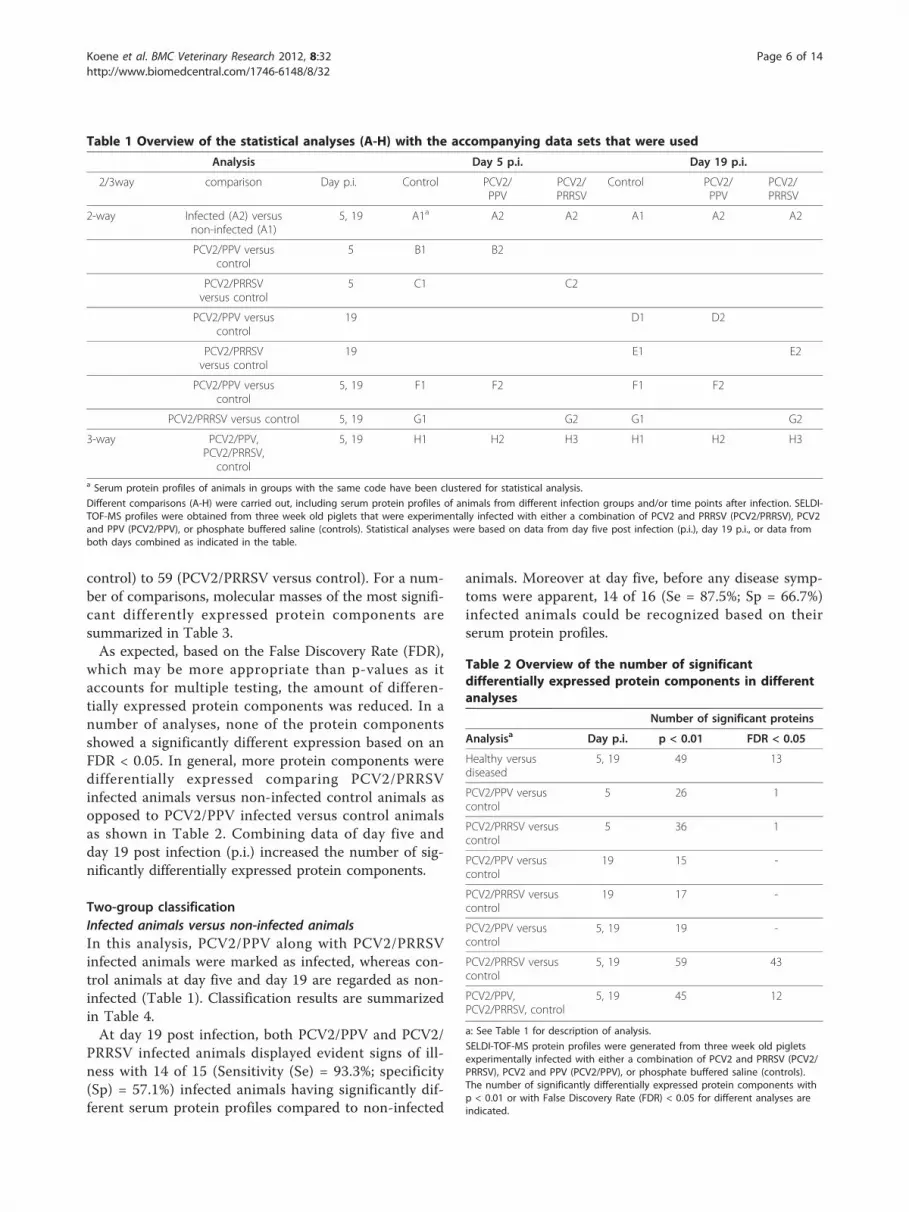
control) to 59 (PCV2/PRRSV versus control). For a num-ber of comparisons, molecular masses of the most signifi-cant differently expressed protein components aresummarized in Table 3.As expected, based on the False Discovery Rate (FDR),
which may be more appropriate than p-values as itaccounts for multiple testing, the amount of differen-tially expressed protein components was reduced. In anumber of analyses, none of the protein componentsshowed a significantly different expression based on anFDR < 0.05. In general, more protein components weredifferentially expressed comparing PCV2/PRRSVinfected animals versus non-infected control animals asopposed to PCV2/PPV infected versus control animalsas shown in Table 2. Combining data of day five andday 19 post infection (p.i.) increased the number of sig-nificantly differentially expressed protein components.
Two-group classificationInfected animals versus non-infected animalsIn this analysis, PCV2/PPV along with PCV2/PRRSVinfected animals were marked as infected, whereas con-trol animals at day five and day 19 are regarded as non-infected (Table 1). Classification results are summarizedin Table 4.At day 19 post infection, both PCV2/PPV and PCV2/
PRRSV infected animals displayed evident signs of ill-ness with 14 of 15 (Sensitivity (Se) = 93.3%; specificity(Sp) = 57.1%) infected animals having significantly dif-ferent serum protein profiles compared to non-infected
animals. Moreover at day five, before any disease symp-toms were apparent, 14 of 16 (Se = 87.5%; Sp = 66.7%)infected animals could be recognized based on theirserum protein profiles.
Table 1 Overview of the statistical analyses (A-H) with the accompanying data sets that were used
Analysis Day 5 p.i. Day 19 p.i.
2/3way comparison Day p.i. Control PCV2/PPV
PCV2/PRRSV
Control PCV2/PPV
PCV2/PRRSV
2-way Infected (A2) versusnon-infected (A1)
5, 19 A1a A2 A2 A1 A2 A2
PCV2/PPV versuscontrol
5 B1 B2
PCV2/PRRSVversus control
5 C1 C2
PCV2/PPV versuscontrol
19 D1 D2
PCV2/PRRSVversus control
19 E1 E2
PCV2/PPV versuscontrol
5, 19 F1 F2 F1 F2
PCV2/PRRSV versus control 5, 19 G1 G2 G1 G2
3-way PCV2/PPV,PCV2/PRRSV,
control
5, 19 H1 H2 H3 H1 H2 H3
a Serum protein profiles of animals in groups with the same code have been clustered for statistical analysis.
Different comparisons (A-H) were carried out, including serum protein profiles of animals from different infection groups and/or time points after infection. SELDI-TOF-MS profiles were obtained from three week old piglets that were experimentally infected with either a combination of PCV2 and PRRSV (PCV2/PRRSV), PCV2and PPV (PCV2/PPV), or phosphate buffered saline (controls). Statistical analyses were based on data from day five post infection (p.i.), day 19 p.i., or data fromboth days combined as indicated in the table.
Table 2 Overview of the number of significantdifferentially expressed protein components in differentanalyses
Number of significant proteins
Analysisa Day p.i. p < 0.01 FDR < 0.05
Healthy versusdiseased
5, 19 49 13
PCV2/PPV versuscontrol
5 26 1
PCV2/PRRSV versuscontrol
5 36 1
PCV2/PPV versuscontrol
19 15 -
PCV2/PRRSV versuscontrol
19 17 -
PCV2/PPV versuscontrol
5, 19 19 -
PCV2/PRRSV versuscontrol
5, 19 59 43
PCV2/PPV,PCV2/PRRSV, control
5, 19 45 12
a: See Table 1 for description of analysis.
SELDI-TOF-MS protein profiles were generated from three week old pigletsexperimentally infected with either a combination of PCV2 and PRRSV (PCV2/PRRSV), PCV2 and PPV (PCV2/PPV), or phosphate buffered saline (controls).The number of significantly differentially expressed protein components withp < 0.01 or with False Discovery Rate (FDR) < 0.05 for different analyses areindicated.
Koene et al. BMC Veterinary Research 2012, 8:32http://www.biomedcentral.com/1746-6148/8/32
Page 6 of 14
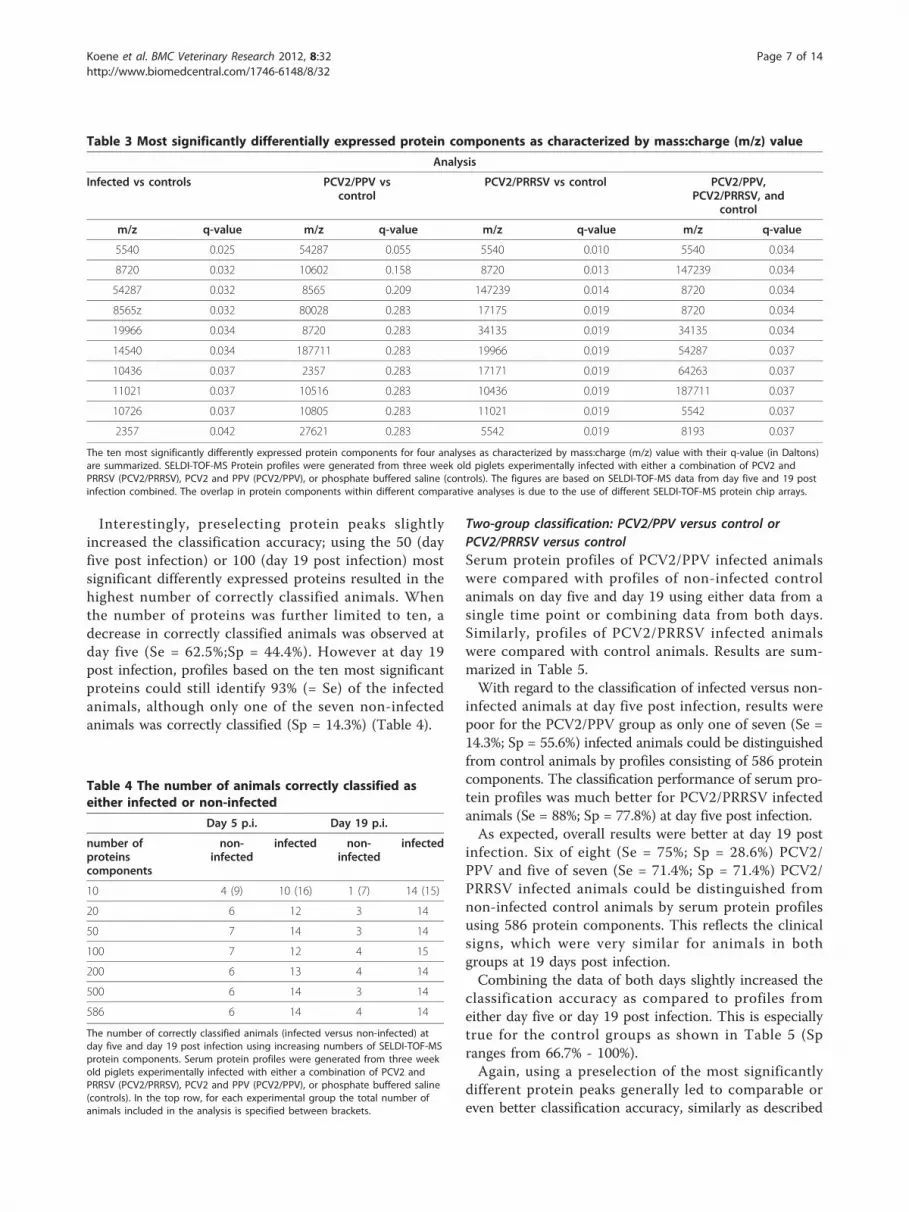
Interestingly, preselecting protein peaks slightlyincreased the classification accuracy; using the 50 (dayfive post infection) or 100 (day 19 post infection) mostsignificant differently expressed proteins resulted in thehighest number of correctly classified animals. Whenthe number of proteins was further limited to ten, adecrease in correctly classified animals was observed atday five (Se = 62.5%;Sp = 44.4%). However at day 19post infection, profiles based on the ten most significantproteins could still identify 93% (= Se) of the infectedanimals, although only one of the seven non-infectedanimals was correctly classified (Sp = 14.3%) (Table 4).
Two-group classification: PCV2/PPV versus control orPCV2/PRRSV versus controlSerum protein profiles of PCV2/PPV infected animalswere compared with profiles of non-infected controlanimals on day five and day 19 using either data from asingle time point or combining data from both days.Similarly, profiles of PCV2/PRRSV infected animalswere compared with control animals. Results are sum-marized in Table 5.With regard to the classification of infected versus non-
infected animals at day five post infection, results werepoor for the PCV2/PPV group as only one of seven (Se =14.3%; Sp = 55.6%) infected animals could be distinguishedfrom control animals by profiles consisting of 586 proteincomponents. The classification performance of serum pro-tein profiles was much better for PCV2/PRRSV infectedanimals (Se = 88%; Sp = 77.8%) at day five post infection.As expected, overall results were better at day 19 post
infection. Six of eight (Se = 75%; Sp = 28.6%) PCV2/PPV and five of seven (Se = 71.4%; Sp = 71.4%) PCV2/PRRSV infected animals could be distinguished fromnon-infected control animals by serum protein profilesusing 586 protein components. This reflects the clinicalsigns, which were very similar for animals in bothgroups at 19 days post infection.Combining the data of both days slightly increased the
classification accuracy as compared to profiles fromeither day five or day 19 post infection. This is especiallytrue for the control groups as shown in Table 5 (Spranges from 66.7% - 100%).Again, using a preselection of the most significantly
different protein peaks generally led to comparable oreven better classification accuracy, similarly as described
Table 3 Most significantly differentially expressed protein components as characterized by mass:charge (m/z) value
Analysis
Infected vs controls PCV2/PPV vscontrol
PCV2/PRRSV vs control PCV2/PPV,PCV2/PRRSV, and
control
m/z q-value m/z q-value m/z q-value m/z q-value
5540 0.025 54287 0.055 5540 0.010 5540 0.034
8720 0.032 10602 0.158 8720 0.013 147239 0.034
54287 0.032 8565 0.209 147239 0.014 8720 0.034
8565z 0.032 80028 0.283 17175 0.019 8720 0.034
19966 0.034 8720 0.283 34135 0.019 34135 0.034
14540 0.034 187711 0.283 19966 0.019 54287 0.037
10436 0.037 2357 0.283 17171 0.019 64263 0.037
11021 0.037 10516 0.283 10436 0.019 187711 0.037
10726 0.037 10805 0.283 11021 0.019 5542 0.037
2357 0.042 27621 0.283 5542 0.019 8193 0.037
The ten most significantly differently expressed protein components for four analyses as characterized by mass:charge (m/z) value with their q-value (in Daltons)are summarized. SELDI-TOF-MS Protein profiles were generated from three week old piglets experimentally infected with either a combination of PCV2 andPRRSV (PCV2/PRRSV), PCV2 and PPV (PCV2/PPV), or phosphate buffered saline (controls). The figures are based on SELDI-TOF-MS data from day five and 19 postinfection combined. The overlap in protein components within different comparative analyses is due to the use of different SELDI-TOF-MS protein chip arrays.
Table 4 The number of animals correctly classified aseither infected or non-infected
Day 5 p.i. Day 19 p.i.
number ofproteinscomponents
non-infected
infected non-infected
infected
10 4 (9) 10 (16) 1 (7) 14 (15)
20 6 12 3 14
50 7 14 3 14
100 7 12 4 15
200 6 13 4 14
500 6 14 3 14
586 6 14 4 14
The number of correctly classified animals (infected versus non-infected) atday five and day 19 post infection using increasing numbers of SELDI-TOF-MSprotein components. Serum protein profiles were generated from three weekold piglets experimentally infected with either a combination of PCV2 andPRRSV (PCV2/PRRSV), PCV2 and PPV (PCV2/PPV), or phosphate buffered saline(controls). In the top row, for each experimental group the total number ofanimals included in the analysis is specified between brackets.
Koene et al. BMC Veterinary Research 2012, 8:32http://www.biomedcentral.com/1746-6148/8/32
Page 7 of 14

for the classification of infected versus non-infectedanimals.
Three-group classificationTo assess the power of serum protein profiles as a diag-nostic marker for specific infections, we explored theclassification performance of serum protein profiles todistinguish between the three distinct animal groups (i)non-infected control animals, (ii) PCV2/PRRSV and (iii)PCV2/PPV infected animals) in one analysis, i.e. three-group classification. As expected, three-group classifica-tion as shown in Table 6 gave similar results comparedto the two-group classification, but with lower classifica-tion accuracy.Table 7 shows the contingency tables for day five and 19
for true disease status and classification based on serumprotein profiling using 50 most significant protein peaks.At day five, almost all (8/9) PCV2/PRRSV infected animalswere classified correctly. A single PCV2/PRRSV infectedanimal was misclassified as PCV2/PPV infected. On theother hand, only two of seven PCV2/PPV animals wereidentified correctly. One was improperly classified asPCV2/PRRSV infected, while four animals could not bediscriminated from non-infected animals. However at 19days post infection, five of eight PCV2/PPV infected ani-mals were accurately classified, while only three of sevenPCV2/PRRSV infected animals could be identified basedon their serum protein profiles. The other four animals
were misclassified as PCV2/PPV infected. Control animals,when misclassified, were labeled as PCV2/PPV infectedanimals, but never as PCV2/PRRSV infected.In conclusion, PCV2/PRRSV infected animals could
well be distinguished from control animals as early asday five, while PCV2/PPV infections were best distin-guished from non-infected control animals at day 19.Classification results showed a very high significance atday five (P < 0.001) and were near significance at day 19(P = 0.095). It can be concluded that based on SELDI-TOF protein profiles, at day five post infection PCV2/PRRSV infected animals are easier to distinguish com-pared to PCV2/PPV infected animals.
DiscussionLivestock health is an important issue for farmers andveterinarians as well as for consumers. It has an importanteconomic drive as it affects productivity. In addition, fromthe animal welfare perspective there is a need for para-meters that can objectively measure abnormalities or dete-rioration of health, preferably in an early stage of disease.Although the number of animals involved in this studywas rather small, this study shows that SELDI-TOF MSprofiles of high- and low-abundant serum proteins havepotential as diagnostic markers for early detection of viralinfections in pigs. We also show that classification of ani-mals using ridge penalized partial least squares analysis ofthe protein profiles might be a powerful approach for this.
Table 5 Number of animals correctly classified according to infection status, evaluating two distinct classes
Separate/combined
numberof used
protein markers1
Day 5p.i.
Day 19 p.i. Day 5p.i.
Day 19p.i.
PCV2/PPV
Control PCV2/PPV
Control PCV2/PRRSV
Control PCV2/PRRSV
Control
Separate 10 2 (7) 5 (9) 4 (8) 5 (7) 8 (9) 6 (9) 5 (7) 6 (7)
20 2 3 5 5 8 6 5 6
50 2 5 6 5 6 6 5 6
100 2 5 6 3 7 7 5 6
200 1 5 6 3 8 8 4 6
500 1 5 6 2 8 7 5 5
586 1 5 6 2 8 7 5 5
Combined 10 2 (7) 5 (9) 7 (8) 3 (7) 7 (9) 8 (9) 5 (7) 6 (7)
20 2 7 6 4 8 8 6 5
50 2 8 5 6 7 9 5 6
100 2 6 6 5 7 9 6 6
200 2 6 8 4 7 9 6 5
500 3 6 7 4 7 8 5 6
586 3 6 7 5 7 9 5 6
The number of correctly classified animals according to infection status (2-way classification), based on serum protein profiles at day five and day 19 postinfection (p.i.). The classification results are presented using either data of each day separately or combined. Protein components were selected based on theirdifferential expression in piglets infected with PCV2/PPV, PCV2/PRRSV and control piglets, using those with the lowest p-values. In the top row, for eachexperimental group the total number of animals included in the analysis is specified between brackets.
Koene et al. BMC Veterinary Research 2012, 8:32http://www.biomedcentral.com/1746-6148/8/32
Page 8 of 14
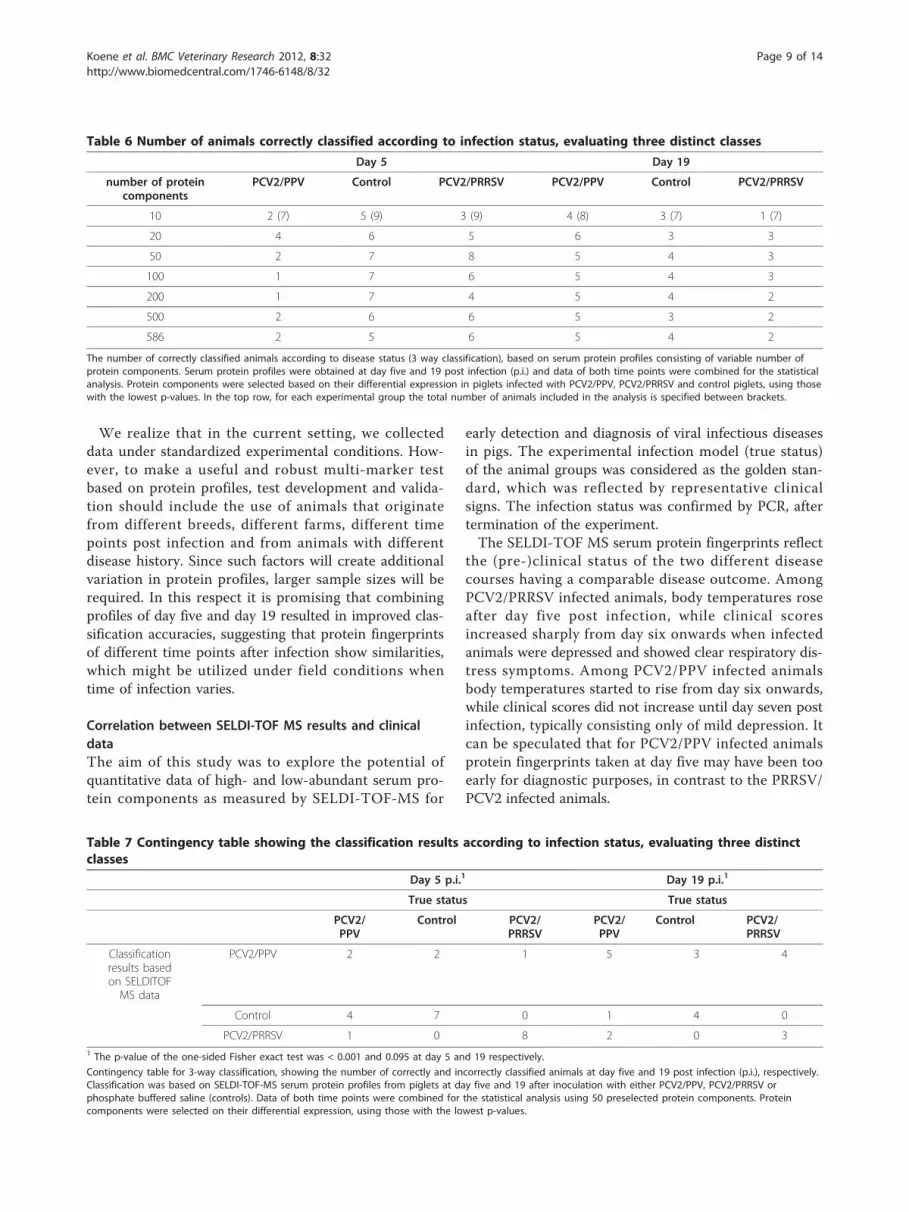
We realize that in the current setting, we collecteddata under standardized experimental conditions. How-ever, to make a useful and robust multi-marker testbased on protein profiles, test development and valida-tion should include the use of animals that originatefrom different breeds, different farms, different timepoints post infection and from animals with differentdisease history. Since such factors will create additionalvariation in protein profiles, larger sample sizes will berequired. In this respect it is promising that combiningprofiles of day five and day 19 resulted in improved clas-sification accuracies, suggesting that protein fingerprintsof different time points after infection show similarities,which might be utilized under field conditions whentime of infection varies.
Correlation between SELDI-TOF MS results and clinicaldataThe aim of this study was to explore the potential ofquantitative data of high- and low-abundant serum pro-tein components as measured by SELDI-TOF-MS for
early detection and diagnosis of viral infectious diseasesin pigs. The experimental infection model (true status)of the animal groups was considered as the golden stan-dard, which was reflected by representative clinicalsigns. The infection status was confirmed by PCR, aftertermination of the experiment.The SELDI-TOF MS serum protein fingerprints reflect
the (pre-)clinical status of the two different diseasecourses having a comparable disease outcome. AmongPCV2/PRRSV infected animals, body temperatures roseafter day five post infection, while clinical scoresincreased sharply from day six onwards when infectedanimals were depressed and showed clear respiratory dis-tress symptoms. Among PCV2/PPV infected animalsbody temperatures started to rise from day six onwards,while clinical scores did not increase until day seven postinfection, typically consisting only of mild depression. Itcan be speculated that for PCV2/PPV infected animalsprotein fingerprints taken at day five may have been tooearly for diagnostic purposes, in contrast to the PRRSV/PCV2 infected animals.
Table 6 Number of animals correctly classified according to infection status, evaluating three distinct classes
Day 5 Day 19
number of proteincomponents
PCV2/PPV Control PCV2/PRRSV PCV2/PPV Control PCV2/PRRSV
10 2 (7) 5 (9) 3 (9) 4 (8) 3 (7) 1 (7)
20 4 6 5 6 3 3
50 2 7 8 5 4 3
100 1 7 6 5 4 3
200 1 7 4 5 4 2
500 2 6 6 5 3 2
586 2 5 6 5 4 2
The number of correctly classified animals according to disease status (3 way classification), based on serum protein profiles consisting of variable number ofprotein components. Serum protein profiles were obtained at day five and 19 post infection (p.i.) and data of both time points were combined for the statisticalanalysis. Protein components were selected based on their differential expression in piglets infected with PCV2/PPV, PCV2/PRRSV and control piglets, using thosewith the lowest p-values. In the top row, for each experimental group the total number of animals included in the analysis is specified between brackets.
Table 7 Contingency table showing the classification results according to infection status, evaluating three distinctclasses
Day 5 p.i.1 Day 19 p.i.1
True status True status
PCV2/PPV
Control PCV2/PRRSV
PCV2/PPV
Control PCV2/PRRSV
Classificationresults basedon SELDITOFMS data
PCV2/PPV 2 2 1 5 3 4
Control 4 7 0 1 4 0
PCV2/PRRSV 1 0 8 2 0 31 The p-value of the one-sided Fisher exact test was < 0.001 and 0.095 at day 5 and 19 respectively.
Contingency table for 3-way classification, showing the number of correctly and incorrectly classified animals at day five and 19 post infection (p.i.), respectively.Classification was based on SELDI-TOF-MS serum protein profiles from piglets at day five and 19 after inoculation with either PCV2/PPV, PCV2/PRRSV orphosphate buffered saline (controls). Data of both time points were combined for the statistical analysis using 50 preselected protein components. Proteincomponents were selected on their differential expression, using those with the lowest p-values.
Koene et al. BMC Veterinary Research 2012, 8:32http://www.biomedcentral.com/1746-6148/8/32
Page 9 of 14
It should be noted that among the control animals noapparent clinical signs were observed. The low contentof PCV2 viral DNA in tissue samples of some controlanimals are considered to have been “false positive” testresults. However it cannot be fully excluded that, inspite of containment measures during the animal experi-ment, some level of cross contamination with the PCV2virus occurred in the control group.
Using a whole-protein profile approach instead ofcandidate proteinsIn the discovery of biomarkers a targeted approach is oftenused, aiming at a selection of predefined biomarkers basedon current knowledge of the biological function of pro-teins or known associations. An example for suchapproach is the use of acute phase proteins for early diag-nostic markers for infections. As levels of these proteinschange early in the process of infection or tissue trauma,they have been suggested as suitable biomarkers [15,16].In the present study, the analysis of acute phase proteins
led to disappointing results (Figure 3). Similar to ourexperience, experiments conducted by Heegaard et al.found large between-animal variation and major differ-ences in prechallenge concentrations between experimen-tal groups [16], limiting the use of acute phase proteins asgeneral disease markers.As an alternative, we explored a whole protein profile
approach using SELDI-TOF-MS and comparative finger-print analysis of whole protein profiles present in bloodsamples and studied its value for early disease diagnosis.This approach was chosen because it enables the identifi-cation and selection of “reactive profiles” without anyprior knowledge of the biological functions of the compo-nents constituting the profiles. Although knowledge ofbiological function of proteins could have additional valueand can be used as biological validation, it is not manda-tory. Another advantage is that protein profile fingerprintsenable the monitoring of quantitative changes rather thandetermining particular threshold levels of individual serumproteins.A major challenge in the discovery of protein biomar-
kers from blood is the vast difference in concentrationbetween high- and low-abundant proteins. With tradi-tional analysis methods, the high-abundance proteinsusually dominate the proteome profiles, making the identi-fication of less abundant protein components more chal-lenging. Different strategies have been developed toeliminate some of the most abundant proteins from bloodserum or plasma [17]. Here we applied the Proteominer™fractionation kit from Bio-Rad. It is based on a bead-bound random peptide library that provides a vast amountof different binding sites for different proteins. Since thereis only a small number of ligands that can bind to thesame protein, this limits the number of identical high-
abundant protein components that can bind to the bead-bound library. The combination of depletion, enrichmentand fractionation through the Proteominer™ fractionationkit used in this study has led to the detection of a highnumber of differentially expressed high- and/or low-abun-dance proteins (as shown in Table 2) underlining thevalue of this technique. Focussing on low-abundance pro-teins, rather than the classical plasma proteins, might be amore promising approach since low abundant biomarkersmay include proteins that either leak into the plasma fromdifferent tissues as a result of the infection or that play arole as signal molecules.
Classification of infected versus non-infected animalsThe difficulty with multiple disease classification is thatlarge sample sizes are required. Therefore, classifying ani-mals as infected and not-infected or diseased and not-dis-eased is probably a first starting point. In this study, nodisease symptoms were yet apparent at day five, exceptthat a number of pigs in the PCV2/PRRSV group had ele-vated body temperatures. Notably, 14 of 16 (87.5%)infected animals could be recognized based on serum pro-tein profiles. As expected, at day 19 post infection resultswere even better (93.3%). Further analysis will have to pro-vide information whether these differences are due toinflammatory processes or other viral -host interactions.From experimental studies increases in IFNg secretingcells and interleukin 10 have been shown as early as 7 and10 days post infection, respectively [18-20].Also classification according to distinct infection models
showed promising results. However, the lower sensitivityas revealed by Table 6 suggests that classification withrespect of specific infectious diseases will be challenging.Interestingly, the classification performance on both sam-ple days for infected animals was superior compared tonon-infected animals. This probably reflects the normalvariation in serum protein profiles among “healthy” ani-mals which is relatively large compared to infected animalsin this small cohort. Also Batxelli-Molina et al. foundmore extensive variation in serum protein profiles fromnon-infected animals compared to infected animals [6].It has been shown that in clinical settings multiple
marker assays have increased sensitivity and specificitycompared to single-marker assays [10]. It may be specu-lated that increasing the number of markers leads to afurther improvement of the diagnostic performance.Indeed, the number of protein components that were sta-tistically significant in differential expression between thedistinct animal groups (as shown in Table 2) correlatedwell with the classification accuracy: the higher the num-ber of significant protein markers between the groups,the better the classification accuracy. However, our find-ings also suggest that extending protein profiles to morethan about 20 markers does not substantially increase
Koene et al. BMC Veterinary Research 2012, 8:32http://www.biomedcentral.com/1746-6148/8/32
Page 10 of 14
classification accuracy. In our case, limiting the numberof (preselecting) proteins from whole protein profiles of586 to the ten most significant differentially expressedcomponents did only marginally decrease the classifica-tion accuracy. Also the small number of animals used inthis study limits the power of a high number of proteinsin their contribution to classification accuracy. This indi-cates that although there might be quite a number ofproteins markers associated with the disease status, per-formance of profiles seems to be more affected by thepredictive value of individual proteins than by the num-ber of proteins included in the profile.
Statistical methodsFor evaluation of SELDI-TOF data a decision tree methodis frequently used. However, to analyse complete sets ofmultiple protein peaks, more sophisticated statisticalmethods are required. We used ridge penalized partialleast regression to classify animals, which is superior todecision tree analysis when there are many proteins con-tributing to the classification or, in other words, whenmany proteins are likely to be different between infectedand non-infected animals. Partial least squares techniqueshave also been applied in disease classification in humans[2,21]. The significance testing of individual proteins wasequivalent to the approach used by Batxelli-Molina et al.[6] and Barr et al. [5] for testing the significance of pro-teins in the diagnosis of prion diseases.In this case, we used one-leave-out cross-validation,
because of the very limited number of animals per class.Due to the fact that one animal is left out, the unbalancein animals per disease class may be larger. Nevertheless,two-group as well as three-group classifications were quitesuccessful, although with lower accuracy in the latter.Clearly larger sample sizes are necessary to improve theclassification accuracy to more than 90% sensitivity andspecificity required for diagnostic purposes.
Towards development of biomarkers for livestock healthThis study shows the potential of protein profiles in com-bination with advanced statistical methods to distinguishinfected from non-infected animals, providing etiologicalinformation as well. Such an approach may be valuable inthe diagnosis of infectious diseases in the early stage ofdisease. In this study we examined sera from animalsexperimentally infected with PCV2 in combination witheither PPV or PRRSV. As shown in Table 3 a number ofprotein components were significantly differentiallyexpressed in multiple comparisons. For instance proteinwith mass:charge 8720 was evident in all four analyses.Such proteins may be regarded as key candidate markersand further investigation is warranted.In follow-up studies it would be of interest to explore
the classification of animals according to aetiology, such
as bacterial, viral, and parasitical infections. Also differ-entiation according to disease stage, i.e. acute versuschronic or affected organ system could be useful. Theultimate goal might be the development of assays forhealth versus disease as opposed to specific etiologicagents.The advances of proteomic technologies and promising
study results have fed the hope to obtain biomarkers forimproved and faster diagnostics. Due to the high costs andrequired technical skills, spectrometry has traditionallybeen limited to research settings. However, it is nowincreasingly used for diagnostic purposes in routine set-tings for the identification of infectious microorganisms[15]. SELDI-TOF-MS is a promising tool to determineprotein profiles at medium throughput level and at reason-able costs. In human medicine, proteomic methods areincreasingly used for early diagnosis of diseases [20]. Inaddition, it appears that the challenges of multiplexingsuch tests (e.g., on arrays) are sufficiently daunting thatquantitative mass spectrometry may have value as an addi-tional format for multiplexing protein measurements inthe future given aggressive technology development. Amajor disadvantage for mass diagnostics as required inlivestock veterinary medicine is the invasive procedure ofblood sampling to get appropriate test material for analysisof biomarkers in serum. An alternative for the use of serawould be to explore the potential of protein profiles ineasy to access biological samples like saliva, urine orfaeces. Also, the recent developments in the field ofmicro- and nanotechnology have seen a rapid surge ininterest in electronic devices for medical implants for invivo health monitoring. In the human biomedical field sev-eral promising prototypes are emerging, for example formonitoring of patients with chronic cardiac or neurologi-cal diseases [22]. Similar developments may be expectedfor the veterinary health care sector.
ConclusionsIn this study the potential of quantitative protein profilesby SELDI-TOF MS for early diagnosis of viral infections inpigs was explored. Results from serum of pigs experimen-tally infected with a combination of PCV/PPV and PCV2/PRRSV indicate that SELDI-TOF protein profiles havepotential for detection of (viral) infection in pigs in earlyphase of the disease. The accuracy of classification ofinfected versus non-infected animals was good, as 88% ofthe infected animals could be classified based on theserum protein profiles at day five post infection, that isbefore clinical symptoms became apparent. At day 19 postinfection, 93% of the infected animals were classified assuch. Results for PCV2/PRRSV were superior compared toPCV2/PPV infected animals, especially at day five postinfection. The lower specificity, both at day five (67%) andday 19 post infection (57%), probably reflects the variation
Koene et al. BMC Veterinary Research 2012, 8:32http://www.biomedcentral.com/1746-6148/8/32
Page 11 of 14
in serum protein profiles among non-infected animals.Limiting the number of proteins in the profile generallyhad minor effects on the classification accuracy. Accuracyof three-way classification was less than that of two-wayclassification. It can be concluded that SELDI-TOF MSprotein profiles may have potential as biomarker for earlydiagnosis of viral infections in animal husbandry.
MethodsExperimental infectionThe animal experiment was according to Dutch lawapproved of by the Animal Ethical Committee of CVI(trial code 2008056c). Animals: Twenty- six, colostrum-deprived piglets from a conventional breeding line(TOPIGS 20™) of three weeks of age were housed inthree different animal rooms with HEPA filtered supplyand exhaust air filtration. Piglets were tested negative byPCR assay for PCV2, PPV and PRRSV prior to start of thestudy and allocated to three groups, which were eitherinoculated with PBS, or a combination with either PCV2/PRRSV or PCV2/PPV. Virus inocula: Tissue-culture pro-pagated PCV2b strain 1324 (2nd passage), isolated in 2002in the Republic of Ireland from a pooled tissue homoge-nate from a PMWS diseased animal and PPV strain 1005(8th passage) were kindly supplied by Prof. G. Allan, Uni-versity of Belfast. The 7th passage of PRRSV strain Ter-Huurne, a EU-strain of PRRSV, propagated on lungmacrophages was used. The titer of the PCV2 virus inocu-lum was 2 × 10⁵ TCID50/ml, of the PPV virus inoculum2 × 106 TCID50/ml and of the PRRSV virus inoculum 1 ×10⁶ TCID50/ml. On day zero, individual pigs receivedeither the PBS sham inoculum, or the virus pools in avolume of three ml each. For this, aerosols of the inoculawere produced by a commercial, gravity-fed, single triggerairbrush (Evolution™, Harder&Steenbeek, NL) with anozzle of 0.2 mm, creating an aerosol with 90% of dropletssmaller than 99 μm in diameter, 50% of droplets smallerthan 50 μm, and 10% droplets smaller than 26 μm. Theaerosol was administered intranasally alternately to eachnostril during inspiration phases. Pigs were weighedweekly and followed clinically for a period of 27 days afterinfection. Rectal temperatures were measured twice daily.Inguinal lymph nodes were palpated daily to monitorincrease in size and clinical symptoms were recorded byusing pre-defined identifiers. These identifiers or a combi-nation of identifiers were used to define a clinical scoreper day as no disease (0), mild (1), moderate (2) or severe(3) disease. Serum blood samples were taken from theexternal jugular vein at days 0, 2, 5, 7, 9, 12, 15, 19 and 22.After coagulation, serum was separated by centrifugationat 2000 g for 10 min. and stored at -80°C until analysis. Atday 27, pigs were euthanized and a full necropsy was per-formed. Tissue specimens were taken for virus nucleic
acid detection by polymerase chain reaction (PCR) analysisas described [14]. Briefly, RNA and DNA were extractedfrom organ suspensions using the QIAmp blood and tis-sue kit (Qiagen, Westburg, the Netherlands) for DNA andthe High Pure RNA isolation kit for RNA (Roche diagnos-tics, Germany) according to the manufacturer’s recom-mendations. To quantify the amount of PCV2 DNAcopies in organ samples, a real-time fluorescent-probePCR with the light-Cycler probes (LC red 640 - ATC TCATCA TGT CCA CCG CCC AGG A) (FL fluorescein-CGT TGT ACT GTG GTA CGC TTG ACA GT) andthe primers (1391; 5’-CTC CCC TGT CAC CCT GGGTG -3’ and 1577; 5’-CTC TCC CGC ACC TTC GGATAT-3’) amplifying a 186-bp fragment from the cap geneof PCV2 were used. The viral RNA concentration ofPRRSV was assessed by a reverse transcription real timePCR with the following primers: 5’-GAT GAC RTC CGGCAY C -3’ (forward); 5’- CAG TTC CTG CGC CTT GAT-3’ (reverse) exerted on a MX3005 (Stratagene) machine.
Acute phase proteinsThe serum concentration of haptoglobin was measured byuse of an assay based on haemoglobin-haptoglobin bind-ing [23] while serum CRP and pig MAP [24] and SAAconcentrations were assayed by ELISA [16]. The concen-tration of Apo A1 was determined by radial immunodiffu-sion [16] and albumin was measured using a dye-bindingassay for this protein on an automated biochemistry analy-ser (Prestige Analyser, Trio-Diagnostics Ltd, York). Assaysfor porcine APP were performed by ReactivLab Ltd, (Glas-gow, UK).
Serum enrichment and fractionationTo detect the proteins present in low levels it is advisableto remove the most abundant proteins first [13]. Recently,a new method for enriching low-abundance proteins hasbeen commercially available. This technology is knownunder de trade name of ProteoMiner® (BioRad, Veenen-daal) and is based on the use of a combinatorial peptidebinding library, which affinity-captures and amplifies thelow abundance proteome [12]. ProteoMiner® treatmentwas performed according to manufacturer’s recommenda-tion. Briefly, 525 mg bulk beads swelled by rehydrationwith 10 ml 20% (v/v) aqueous EtOH. 100 μl of this beadssolution is after washing with water and PBS in a 96-wellfilter plate (Pall-5039) mixed with 200 μl centrifugedserum for two hours at 4°C. After binding and washingthe beads three times with 200 μl PBS, the proteins wereeluted three times with 20 μl of each of the four elutionreagents; fraction1 (1 M NaCl, 20 mM HEPES pH7.5),fraction2 (200 mM glycine pH2.4), fraction3 (60% ethyleneglycol), fraction4 (33% isopropyl alcohol, 16.7% acetoni-trile, 0.1% TFA). Between every elution the beads where
Koene et al. BMC Veterinary Research 2012, 8:32http://www.biomedcentral.com/1746-6148/8/32
Page 12 of 14
mixed for 5 minutes at room temperature, and centrifuged1 min at 1000 g to collect the eluent from filter plate to acollection plate.
Protein profilingProtein examination was performed according to themanufacturer’s instructions. Briefly, a volume of 100 μlof the 10-fold diluted fractions, in appropriate bindingbuffer depending of the array, were incubated on thespots of three type of ProteinChip arrays (BioRad). Acation exchange (CM10) array with CM10 binding buf-fer (100 mM sodium-acetate pH 4.0), a copper-coatedIMAC array with IMAC binding buffer (0.1 M sodiumphosphate, 0.5 M NaCl pH7), and a reverse phase (H50)array with H50 binding buffer (10% acetonitrile, 0.1%trifluoroacetic acid (TFA)).After 60 minutes incubation the arrays were washed
three times with 200 μl appropriate binding buffer, fol-lowed by a wash with 200 μlMilliQ water.After the arrays were dry, 2 × 1 μl of a saturated solution
of sinapinic acid (SPA) in 50% acetonitrile (v/v), 0.5% tri-fluoroacetic acid (v/v) was added. The mass spectra of theproteins captured on the chips were recorded with thePCS4000 ProteinChip array reader (BioRad) by using Pro-teinChip Data Manager software 3.5.0.Previous to the measurements, the mass spectrometer
was checked using the OQ kit (BioRad) for high voltageconditioning, detector calibration, detector sensitivity,mass drift, mass resolution, and mass accuracy. For cali-brating, the All-in-One Protein Standard II (Biorad) wasused.The resulting protein profiles, obtained from the time-
of-flight mass spectrometry spectra were analysed fordifferences in expression using Bio-Rad ProteinChipData Manager, version 3.5.0 with the integrated Biomar-ker Wizard™ cluster analyses software (Biorad). First,peaks with a signal to noise ratio higher than five wereselected. These were clustered with peaks having similarmasses in other profiles with signal to noise ratioshigher than two. Before cluster analyses, the baselinewas subtracted and profiles were normalized using totalion current.
Data processingAfter the identification of the peaks and normalizationof the profiles, a total of 586 proteins from 26 animalswere subjected to statistical analysis. For a number ofproteins data were unavailable at some time points. Twoanimals died during the experiment and only data onday zero and day five were available. Additionally somemissing values existed for subsets of proteins (e.g. CM10or IMAC). Animals with absent data on a specific daywere excluded only for that day.
Significance testing proteinsInitially an ANOVA was performed for each protein, todetect significant differences between disease groups(PCV2/PPV, PCV2/PRRSV, versus control, or infected ver-sus uninfected animals) using an F-test. Multiple testingincreases the risk of false positives. To reduce the risk offalse positives, the false discovery rate (FDR) was used.The FDR was set to 5% and the obtained P-values of theF-test were converted into so-called q-values using thepackage ‘qvalue’ in R [25]. The different comparisons arelisted in Table 1. In addition, we tested also for differencesprior to infection at day zero. No proteins showed signifi-cant differences between animal groups for any contrast,confirming that animals of the three experimental groupswere very similar pre-infection.Classification of animals based on protein profilesFor classification of animals based on expression of severalproteins we used partial least squares with penalized logis-tic regression [26]. The method combines partial leastsquares with logistic regression. Partial least squares isboth a tool for linear regression and a tool for dimensionreduction [27] as we have more explanatory variables, i.e.proteins, than observations. Logistic regression is a com-mon method for binary data using generalized linear mod-els. The method used here combines both and makes it asuitable method for predicting to which categories animalsbelong based on many predictors [26]. Combining logisticregression with partial least squares has been also appliedto disease classification in humans [28]. Here we used thefunctions rpls (for two-group classification) and mrpls (forthree-group classification) from R-package plsgenomics[26]. The parameters lambda and the number of latentvariables were determined using cross-validation. Theridge partial least squares method was applied in twoways: 1. by using all proteins and 2. by preselecting the topn proteins with the lowest p-values of ANOVA.To assess the accuracy of classification we performed a
leave-one-out cross-validation, so that every record wasleft out once from the training set and was predictedbased on the others being in the training set. When weused data of different days all records of one animal wereused as validation set and the remaining as training set toprevent that the animal itself could have one record astraining and another in the validation set. When usingpreselected proteins, the significance was based on thetraining set only to prevent the data from the validationanimal effecting the preselection of proteins.Data from day five and day 19 were used both sepa-
rately and combined for analyses concerning two-groupclassification (that is distinguishing either infected fromnon-infected animals, or animals from each diseasegroup (PCV2/PPV, PCV2/PRRSV) versus control ani-mals). For the three-group classification data of day five
Koene et al. BMC Veterinary Research 2012, 8:32http://www.biomedcentral.com/1746-6148/8/32
Page 13 of 14
and 19 were combined. The accuracy of classificationwas given as number of correctly identified animals. Inaddition, sensitivity and specificity were calculated fortwo-way classifications, but not for three-way classifica-tions because sensitivity and specificity are not suitable forthat situation. All analyses are summarized in Table 1.
AcknowledgementsThis work was supported by the Dutch Ministry of Economic Affairs,Agriculture and Innovation (formerly Agriculture, Nature and Food Quality),through project “HiHealth”, KB-05-001-002 and by the European Union (6th
FP: 513928, PCVD).
Author details1Central Veterinary Institute of Wageningen UR, Lelystad, the Netherlands.2Animal Breeding and Genomics Centre, Wageningen UR Livestock Research,Lelystad, the Netherlands.
Authors’ contributionsMGJK coordinated the study, participated in its design and harmonized thedrafting of the manuscript. HAM performed the statistical analyses andparticipated in the drafting of the manuscript. NSZ conceived of the animalexperiment, provided the serum samples and participated in the drafting ofthe manuscript. LK performed the SELDI-TOF analyses and participated inthe drafting of the manuscript. MAS conceived of the study, participated inits design and participated in the drafting of the manuscript. All authorsread and approved the final manuscript.
Received: 10 September 2011 Accepted: 22 March 2012Published: 22 March 2012
References1. Elstner A, Stockhammer F, Nguyen-Dobinsky TN, Nguyen QL, Pilgermann I,
Gill A, Guhr A, Zhang T, von Eckardstein K, Picht T, et al: Identification ofdiagnostic serum protein profiles of glioblastoma patients. J Neurooncol2010.
2. Gutkin M, Shamir R, Dror G: SlimPLS: a method for feature selection ingene expression-based disease classification. PLoS One 2009, 4(7):e6416.
3. Reddy G, Dalmasso EA: SELDI ProteinChip(R) Array Technology: Protein-Based Predictive Medicine and Drug Discovery Applications. J BiomedBiotechnol 2003, 2003(4):237-241.
4. Rodriguez-Enriquez S, Pacheco-Velazquez SC, Gallardo-Perez JC, Marin-Hernandez A, Aguilar-Ponce JL, Ruiz-Garcia E, Ruizgodoy-Rivera LM,Meneses-Garcia A, Moreno-Sanchez R: Multi-biomarker pattern for tumoridentification and prognosis. J Cell Biochem 2011.
5. Barr JB, Watson M, Head MW, Ironside JW, Harris N, Hogarth C, Fraser JR,Barron R: Differential protein profiling as a potential multi-markerapproach for TSE diagnosis. BMC infectious diseases 2009, 9:188.
6. Batxelli-Molina I, Salvetat N, Andreoletti O, Guerrier L, Vicat G, Molina F,Mourton-Gilles C: Ovine serum biomarkers of early and late phasescrapie. BMC veterinary research 2010, 6:49.
7. Rioux MC, Carmona C, Acosta D, Ward B, Ndao M, Gibbs BF, Bennett HP,Spithill TW: Discovery and validation of serum biomarkers expressedover the first twelve weeks of Fasciola hepatica infection in sheep. Int JParasitol 2008, 38(1):123-136.
8. Zhong L, Taylor D, Begg DJ, Whittington RJ: Biomarker discovery for ovineparatuberculosis (Johne’s disease) by proteomic serum profiling. CompImmunolMicrobiol Infect Dis 2011, 34(4):315-326.
9. Zhong L, Taylor DL, Whittington RJ: Proteomic profiling of ovine serum bySELDI-TOF MS: optimisation, reproducibility and feasibility of biomarkerdiscovery using routinely collected samples. Comp ImmunolMicrobiolInfect Dis 2010, 33(1):47-63.
10. Zhang Z, Bast RC Jr, Yu Y, Li J, Sokoll LJ, Rai AJ, Rosenzweig JM, Cameron B,Wang YY, Meng XY, et al: Three biomarkers identified from serumproteomic analysis for the detection of early stage ovarian cancer.Cancer Res 2004, 64(16):5882-5890.
11. Tang N, Tornatore P, Weinberger SR: Current developments in SELDIaffinity technology. Mass spectrometry reviews 2004, 23(1):34-44.
12. Guerrier L, Righetti PG, Boschetti E: Reduction of dynamic proteinconcentration range of biological extracts for the discovery of low-abundance proteins by means of hexapeptide ligand library. Nat Protoc2008, 3(5):883-890.
13. Marco-Ramell A, Bassols A: Enrichment of low-abundance proteins frombovine and porcine serum samples for proteomic studies. Res Vet Sci2010, 89(3):340-343.
14. Wellenberg GJ, Stockhofe-Zurwieden N, Boersma WJ, De Jong MF,Elbers AR: The presence of co-infections in pigs with clinical signs ofPMWS in The Netherlands: a case-control study. Res Vet Sci 2004,77(2):177-184.
15. Gruys E, Toussaint MJ, Niewold TA, Koopmans SJ, van Dijk E, Meloen RH:Monitoring health by values of acute phase proteins. ActaHistochem2006, 108(3):229-232.
16. Heegaard PM, Stockmarr A, Pineiro M, Carpintero R, Lampreave F,Campbell FM, Eckersall PD, Toussaint MJ, Gruys E, Sorensen NS: Optimalcombinations of acute phase proteins for detecting infectious disease inpigs. Vet Res 2011, 42(1):50.
17. Bandow JE: Comparison of protein enrichment strategies for proteomeanalysis of plasma. Proteomics 2010, 10(7):1416-1425.
18. Nevedomskaya E, Derks R, Deelder AM, Mayboroda OA, Palmblad M:Alignment of capillary electrophoresis-mass spectrometry datasets usingaccurate mass information. Analytical and bioanalytical chemistry 2009,395(8):2527-2533.
19. Palmblad M, van der Burgt YE, Dalebout H, Derks RJ, Schoenmaker B,Deelder AM: Improving mass measurement accuracy in massspectrometry based proteomics by combining open source tools forchromatographic alignment and internal calibration. Journal ofproteomics 2009, 72(4):722-724.
20. Palmblad M, Tiss A, Cramer R: Mass spectrometry in clinical proteomics -from the present to the future. Proteomics Clinical applications 2009,3(1):6-17.
21. Rajalahti T, Kroksveen AC, Arneberg R, Berven FS, Vedeler CA, Myhr KM,Kvalheim OM: A multivariate approach to reveal biomarker signatures fordisease classification: application to mass spectral profiles ofcerebrospinal fluid from patients with multiple sclerosis. J Proteome Res2010, 9(7):3608-3620.
22. Body Sensor Networks. Edited by: Yang G-Z, Yacoub M , 1 2006.23. Eckersall P, Duthie S, Safi S, Moffatt D, Horadagoda N, Doyle S, Parton R,
Bennett D, Fitzpatrick J: An automated biochemical assay forhaptoglobin: Prevention of interference from albumin. Comp Haem Inter1999, 9:117-124.
24. Diack AB, Gladney CD, Mellencamp MA, Stear MJ, Eckersall PD:Characterisation of plasma acute phase protein concentrations in a highhealth boar herd. Vet ImmunolImmunopathol 2011, 139(2-4):107-112.
25. Storey JD, Tibshirani R: Statistical significance for genomewide studies.ProcNatlAcadSci USA 2003, 100(16):9440-9445.
26. Fort G, Lambert-Lacroix S: Classification using partial least squares withpenalized logistic regression. Bioinformatics 2005, 21(7):1104-1111.
27. Martens H, Naess T: Multivariate calibration New York, US: Wiley; 1989.28. Smit S, Hoefsloot HC, Smilde AK: Statistical data processing in clinical
proteomics. J Chromatogr B AnalytTechnol Biomed Life Sci 2008, 866(1-2):77-88.
doi:10.1186/1746-6148-8-32Cite this article as: Koene et al.: Serum protein profiles as potentialbiomarkers for infectious disease status in pigs. BMC Veterinary Research2012 8:32.
Koene et al. BMC Veterinary Research 2012, 8:32http://www.biomedcentral.com/1746-6148/8/32
Page 14 of 14


