Embed Size (px)
Citation preview
Research ArticleTexture Analysis of Dynamic Contrast-Enhanced MRI inEvaluating Pathologic Complete Response (pCR) of Mass-LikeBreast Cancer after Neoadjuvant Therapy
Kun Cao , Bo Zhao , Xiao-Ting Li , Yan-Ling Li , and Ying-Shi Sun
Department of Radiology, Key Laboratory of Carcinogenesis and Translational Research, Ministry of Education,Peking University Cancer Hospital and Institute, Beijing, China
Correspondence should be addressed to Ying-Shi Sun; [email protected]
Received 11 October 2019; Revised 28 November 2019; Accepted 9 December 2019; Published 26 December 2019
Academic Editor: Ozkan Kanat
Copyright © 2019KunCao et al..is is an open access article distributed under the Creative CommonsAttribution License, whichpermits unrestricted use, distribution, and reproduction in any medium, provided the original work is properly cited.
Objectives. MRI is the standard imaging method in evaluating treatment response of breast cancer after neoadjuvant therapy(NAT), while identification of pathologic complete response (pCR) remains challenging. Texture analysis (TA) on post-NATdynamic contrast-enhanced (DCE) MRI was explored to assess the existence of pCR in mass-like cancer.Materials and Methods.A primary cohort of 112 consecutive patients (40 pCR and 72 non-pCR) with mass-like breast cancers who received preoperativeNATwere retrospectively enrolled. On post-NATMRI, volumes of the residual-enhanced areas and TA first-order features (19 foreach sequence) of the corresponding areas were achieved for both early- and late-phase DCE using an in-house radiomicssoftware. Groups were divided according to the operational pathology. Receiver operating characteristic curves and binary logisticregression analysis were used to select features and achieve a predicting formula. Overall diagnostic abilities were comparedbetween TA and radiologists’ subjective judgments. Validation was performed on a time-independent cohort of 39 consecutivepatients. Results. TA features with high consistency (Cronbach’s alpha >0.9) between 2 observers showed significant differencesbetween pCR and non-pCR groups. Logistic regression using features selected by ROC curves generated a synthesized formulacontaining 3 variables (volume of residual enhancement, entropy, and robust mean absolute deviation from early-phase) to yieldAUC� 0.81, higher than that of using radiologists’ subjective judgment (AUC� 0.72), and entropy was an independent risk factor(P< 0.001). Accuracy and sensitivity for identifying pCR were 83.93% and 70.00%. AUC of the validation cohort was 0.80.Conclusions. TA may help to improve the diagnostic ability of post-NAT MRI in identifying pCR in mass-like breast cancer.Entropy, as a first-order feature to depict residual tumor heterogeneity, is an important factor.
1. Introduction
Neoadjuvant therapy (NAT) is an essential procedure inbreast cancer treatment. Whether a pathologic completeresponse (pCR) can be achieved represents a prognosticfactor that is related to tumor recurrence and survival [1].Proper evaluation of residual tumor tissue after NAT canhelp clinicians optimize NAT while avoiding unnecessarytherapy. Magnetic resonance imaging (MRI) is consideredthe best approach with the highest accuracy to evaluate suchresidual tumors [2–4].
However, imaging appearances of residual tumors aftertreatment are different from those at pretreatment, thus
making them difficult to evaluate. .e only criterion cur-rently used on MRI is enhancement [5, 6]. Only when noenhancement is observed at the corresponding primarytumor site can a conclusion of radiological complete re-sponse (iCR) be drawn. Nevertheless, both false positivesand false negatives occur. According to a meta-analysisbased on 25 studies [7], the specificity of MRI in predictingpCR was as high as 90.7%, but the sensitivity was only 63.1%.Hence, such criterion lacks accuracy [8].
Intratumoral heterogeneity is associated with prognosis[9, 10]. A study showed a positive relationship of tumorheterogeneity with recurrence-free survival in breast cancerpatients [11]. Nowadays, some methods to evaluate tumor
HindawiJournal of OncologyVolume 2019, Article ID 4731532, 7 pageshttps://doi.org/10.1155/2019/4731532
heterogeneity on radiologic images are widely available.Texture analysis (TA) is a tool that has recently gained muchattention in the scientific community. In TA, the charac-teristics of the spatial distribution of pixels and their gray-scale intensities within an image are defined and it has beenused in breast tumor studies [12].
Although pretreatment MRI is used in many studies topredict the possibility of achieving pCR after NAT, post-NATMRI is more useful in clinical practice for determiningthe presence of residual tumor tissue and for providingcritical information for surgical planning. In this study, TAfeatures were extracted from both early and late phases ofdynamic contrast-enhanced (DCE) breast MRI after NATand were used to evaluate the ability of TA to predictwhether pCR can be achieved.
2. Materials and Methods
2.1. Patients. Informed patient consent was waived by thelocal institutional review board owing to its retrospectivedesign. Between January 2015 and March 2016, 241 con-secutive patients with biopsy-proven breast cancers andreceived treatment at our hospital were filtered by the fol-lowing criteria. Inclusion: i. treatment was NAT followed bysurgery; ii. completion of both pretreatment and preoper-ative dynamic contrast-enhanced MR imaging at our in-stitution. Exclusion: i. time interval between final MRIexamination and date of surgery was longer than 2 weeks(n� 18); ii. the lesion was reported on pretreatment MRI as anonmass enhancement (n� 64); and iii. poor MR imagequality or incomplete images retrieved from PACS (n� 8).Totally, 151 patients were enrolled and divided into twoindependent sets on the date of pretreatment MRI: 112patients with earlier examination time were used as thetraining set, and the remaining 39 patients were used as thevalidation set.
2.2.MRI Protocols. 1.5 T scanner (360; GE Medical Systems)with a dedicated bilateral 4-channel phased-array breast coilwas used. Patients were in the prone position. Sequences: (a)fast spin-echo T2-weighted sequences and (b) 3D dynamiccontrast-enhanced sequence (VIBRANT) with the followingparameters: Sagittal, TR/TE, 5.3msec/2.6msec; TI,12.0msec; flip angle, 120°; FOV, 20–22 cm; section thick-ness/gap, 2mm/0mm; matrix size with dimensions of256× 256; NEX, 0.75; acquisition time for single phase,45–55 sec with 10–15 sec interval between phases; and totalphases acquired, 1 precontrast plus 5 postcontrast series,starting at the same time as contrast injection. A 0.1mmol/kg bolus of the gadolinium contrast agent was injected intothe arm using high-pressure injectors at a rate of 2.0ml/sfollowed by a 10ml saline flush.
2.3. MRI Assessment. Images were retrieved from the localpicture archiving and communication system. Pretreatmentand post-NAT images were placed side-by-side to locate theexact tumor beds. In cases with multiple lesions, the largestlesion was selected for indexing. On post-NAT early-phase
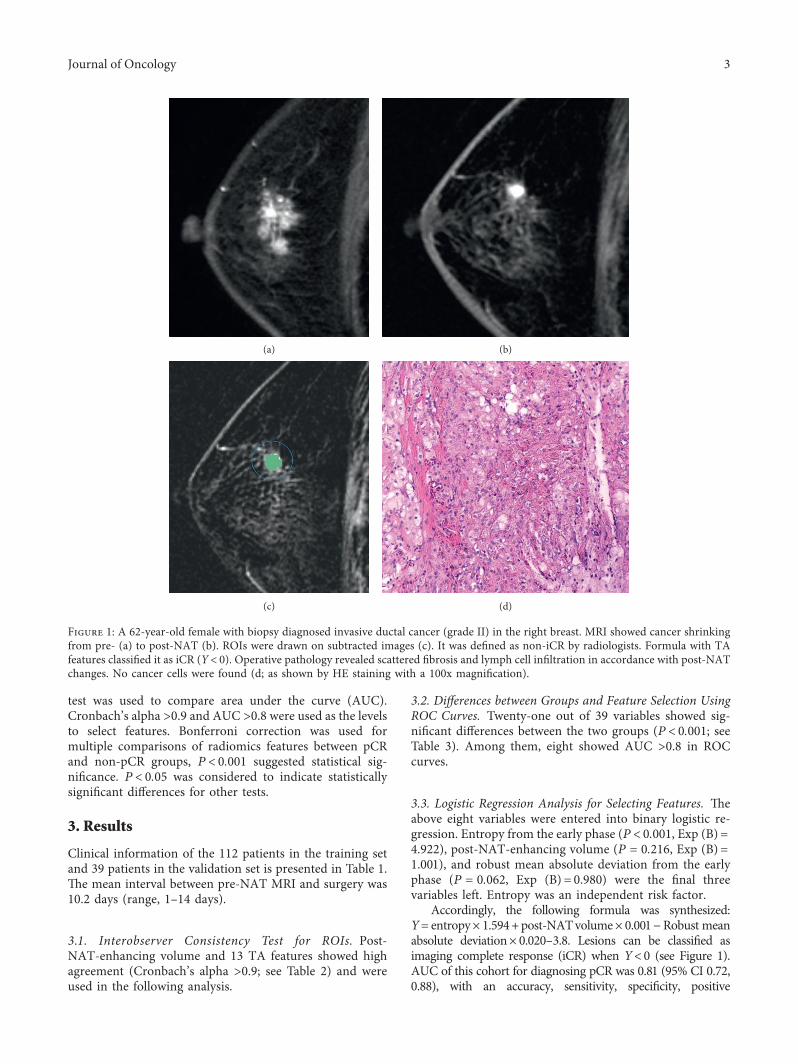
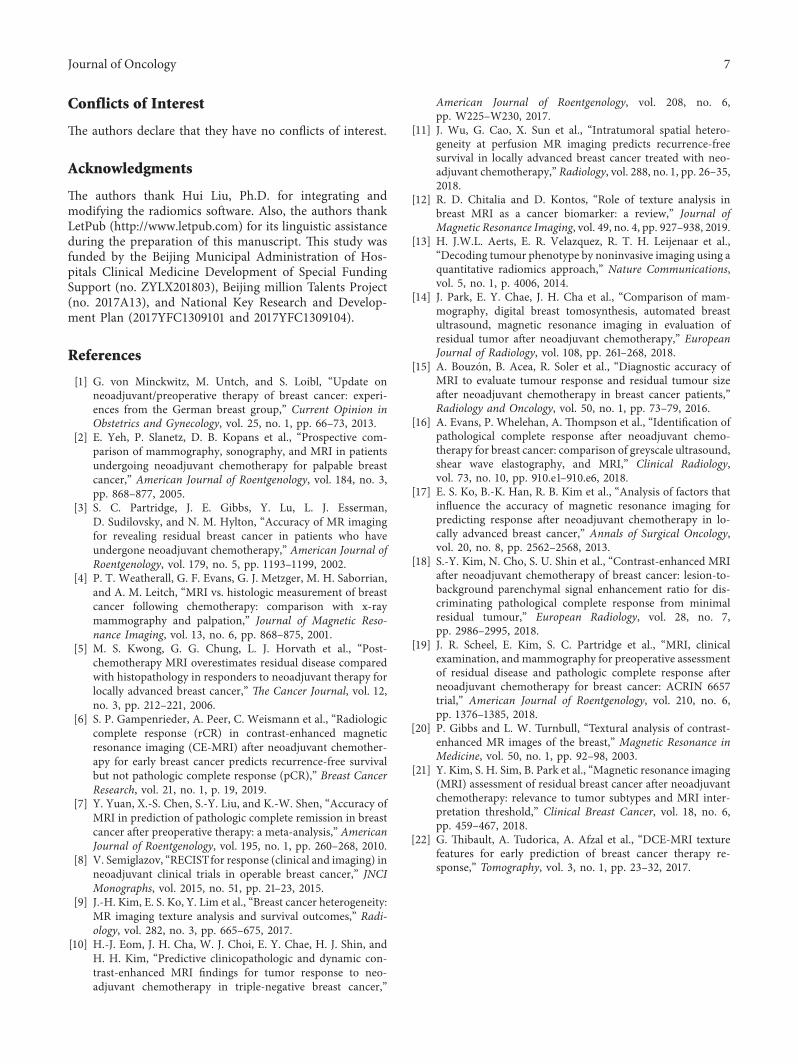
subtracted images (i.e., the subtraction images of the secondDCE phase from the precontrast phase), regions of interest(ROIs) were manually placed slice-by-slice to cover the areaswith suspicious tumor bed enhancement (Figure 1). Forthose images with no suspicious enhancement, radiologistswere requested to put very small ROIs (four to eight pixels)on the corresponding areas. Late-phase subtractive imageswere the subtraction images of the last phase from theprecontrast phase.
ROIs for the first 30 cases (sorted by MRI date) weredrawn, respectively, by a junior resident (Z.B., with 3 years ofexperience in MRI) and a senior attending (C.K., with morethan 10 years of experience in breast imaging) to test in-terobserver consistency. All other ROIs were initially drawnby Z.B. and then reviewed by C.K. Subjective judgment ofcomplete disappearing of enhancement was recorded as iCRby these two radiologists, discussed together and reached inconsensus. Both radiologists were blinded to clinical in-formation during the data collecting period.
Images and ROIs were all transferred into an in-houseradiomics software modified on the 3D-slicer platform. 19conventional TA first-order features were calculated byusing the formulas provided by Aerts et al. [13]. Two sets offeatures were derived from early- and late-subtracted im-ages, respectively, including mean, median, minimal,maximal, 10 percentile, 25 percentile, 75 percentile, 90percentile, range, interquartile range, variance, skewness,kurtosis, uniformity, energy, entropy, mean absolute devi-ation, robust mean absolute deviation, and root meansquared. .e first 10 features were signal intensity- (SI-)related values, so were calculated as ratios to the mean valueon precontrast sequences using same ROIs (rSI� SI/SIpre)when doing comparison between groups and logistic re-gression analysis. Volumes of the residual-enhancing areason post-NAT MR imaging was recorded separately as post-NAT-enhancing volume. .us, 39 features in total wererecorded. Lesions defined as complete response on MRIwere classified as iCR and others as non-iCR.
2.4. Histopathologic Data. All patients underwent eitherlumpectomy or mastectomy. Final histopathologic results ofsurgical specimens were reviewed to determine the existenceof residual tumor as residual invasive cancer (non-pCR) andno residual invasive cancer cells (pCR), which was defined aseither no cancer cells or ductal carcinoma in situ (DCIS). Allwere referred to local diseases regardless of lymph nodestatus.
2.5. Statistical Analysis. SPSS version 22.0 and MedCalcversion 15.0 was used..e Cronbach test was used to test theinterobserver agreement. After the Kolmogorov–Smirnovtest for data distribution, comparisons between pCR andnon-pCR groups were made by an independent-sampleStudent’s t-test for normally distributed data and the Wil-coxon rank-sum test for others. Receiver operating char-acteristic (ROC) and binary logistic regression analyses wereused to select features and to generate the formula. Four-foldtables were drawn to calculate diagnostic ability. DeLong’s
2 Journal of Oncology
test was used to compare area under the curve (AUC).Cronbach’s alpha >0.9 and AUC >0.8 were used as the levelsto select features. Bonferroni correction was used formultiple comparisons of radiomics features between pCRand non-pCR groups, P< 0.001 suggested statistical sig-nificance. P< 0.05 was considered to indicate statisticallysignificant differences for other tests.
3. Results
Clinical information of the 112 patients in the training setand 39 patients in the validation set is presented in Table 1..e mean interval between pre-NAT MRI and surgery was10.2 days (range, 1–14 days).
3.1. Interobserver Consistency Test for ROIs. Post-NAT-enhancing volume and 13 TA features showed highagreement (Cronbach’s alpha >0.9; see Table 2) and wereused in the following analysis.
3.2. Differences between Groups and Feature Selection UsingROC Curves. Twenty-one out of 39 variables showed sig-nificant differences between the two groups (P< 0.001; seeTable 3). Among them, eight showed AUC >0.8 in ROCcurves.
3.3. Logistic Regression Analysis for Selecting Features. .eabove eight variables were entered into binary logistic re-gression. Entropy from the early phase (P< 0.001, Exp (B)�
4.922), post-NAT-enhancing volume (P � 0.216, Exp (B)�
1.001), and robust mean absolute deviation from the earlyphase (P � 0.062, Exp (B)� 0.980) were the final threevariables left. Entropy was an independent risk factor.
Accordingly, the following formula was synthesized:Y� entropy× 1.594+post-NATvolume× 0.001 − Robust meanabsolute deviation× 0.020–3.8. Lesions can be classified asimaging complete response (iCR) when Y<0 (see Figure 1).AUC of this cohort for diagnosing pCR was 0.81 (95% CI 0.72,0.88), with an accuracy, sensitivity, specificity, positive
(a) (b)
(c) (d)
Figure 1: A 62-year-old female with biopsy diagnosed invasive ductal cancer (grade II) in the right breast. MRI showed cancer shrinkingfrom pre- (a) to post-NAT (b). ROIs were drawn on subtracted images (c). It was defined as non-iCR by radiologists. Formula with TAfeatures classified it as iCR (Y< 0). Operative pathology revealed scattered fibrosis and lymph cell infiltration in accordance with post-NATchanges. No cancer cells were found (d; as shown by HE staining with a 100x magnification).
Journal of Oncology 3
predictive value (PPV), and negative predictive value (NPV) of83.93%, 70.00%, 91.67%, 82.35%, and 84.62%, respectively.
3.4. Diagnostic Ability Comparedwith Radiologists. On post-NATMRI, 27 cases (21 pCR and 6 non-pCR) were identifiedas iCR using the no enhancement criterion by two radiol-ogists (Table 4), achieving AUC� 0.72 (95% CI 0.63, 0.80),with the accuracy, sensitivity, specificity, PPV, and NPV of77.68%, 52.50%, 91.67%, 77.78%, and 77.65%. Comparingthe diagnostic abilities of using the above TA formula with
radiologists’ subjective judgment for identifying pCR statusafter NAT, the AUC was improved significantly (P � 0.004)..e accuracy (P � 0.02) and sensitivity (P � 0.02) were alsohigher, while the specificity, PPV, and NPV remain atsimilar levels (P> 0.05).
4. Formula Tested with the Validation Set
In the validation set of 39 cases, using the above TA formula,four pCR cases were wrongly diagnosed as iCR and two non-
Table 1: Clinical characteristics of study population.
CharacteristicsTraining set (N� 112) Validation set (N� 39)
All pCR (N� 40) Non-pCR (N� 72) All pCR (N� 16) Non-pCR (N� 23)Age at diagnosis (y) 48.3± 9.7 48.8± 9.6 48.0± 9.7 47.5± 8.9 48.1± 7.8 47.2± 9.7HistologyIDC 108 39 69 39 16 23Non-IDC 4 1 3 0 0 0Tumor grade of IDC1 4 1 3 0 0 02 77 28 49 23 8 153 27 10 17 16 8 8Histopathological status HRNegative 33 19 14 15 8 7Positive 79 21 58 24 8 16HER2Negative 69 16 53 24 6 18Positive 43 24 19 15 10 5Pathologic T stage at surgery0 26 26 — 12 12 —In situ 14 14 — 4 4 —1 58 — 58 18 — 182 9 — 9 3 — 33 2 — 2 1 — 14 3 — 3 1 — 1
Table 2: Interobserver agreement for ROI drawing (Cronbach’s test).
Features Cronbach’s alpha 95% confidence interval F value P
Post-NAT enhancing volume 0.983∗ 0.963, 0.992 57.30 <0.001Interquartile range 0.965∗ 0.927, 0.983 28.78 <0.001Skewness 0.410 − 0.240, 0.719 1.70 0.08175 percentile 0.972∗ 0.941, 0.987 35.40 <0.001Uniformity 0.815 0.612, 0.912 5.41 <0.001Median 0.938∗ 0.870, 0.971 16.21 <0.001Energy 0.997∗ 0.995, 0.999 396.06 <0.001Robust mean absolute deviation 0.969∗ 0.935, 0.985 32.14 <0.001Mean absolute deviation 0.972∗ 0.940, 0.986 35.14 <0.001Maximum 0.993∗ 0.985, 0.997 142.62 <0.001Root mean squared 0.959∗ 0.913, 0.980 24.28 <0.00190 percentile 0.982∗ 0.961, 0.991 54.52 <0.001Minimum − 0.140 − 1.395, 0.457 0.88 0.637Entropy 0.972∗ 0.941, 0.987 35.57 <0.001Range 0.989∗ 0.976, 0.995 88.52 <0.001Variance 0.967∗ 0.931, 0.984 30.66 <0.00110 percentile 0.725 0.422, 0.869 3.64 <0.001Kurtosis 0.877 0.743, 0.942 8.16 <0.00125 percentile 0.857 0.700, 0.932 7.01 <0.001Mean 0.944∗ 0.883, 0.974 18.02 <0.001∗Features with Cronbach’s alpha>0.9.
4 Journal of Oncology
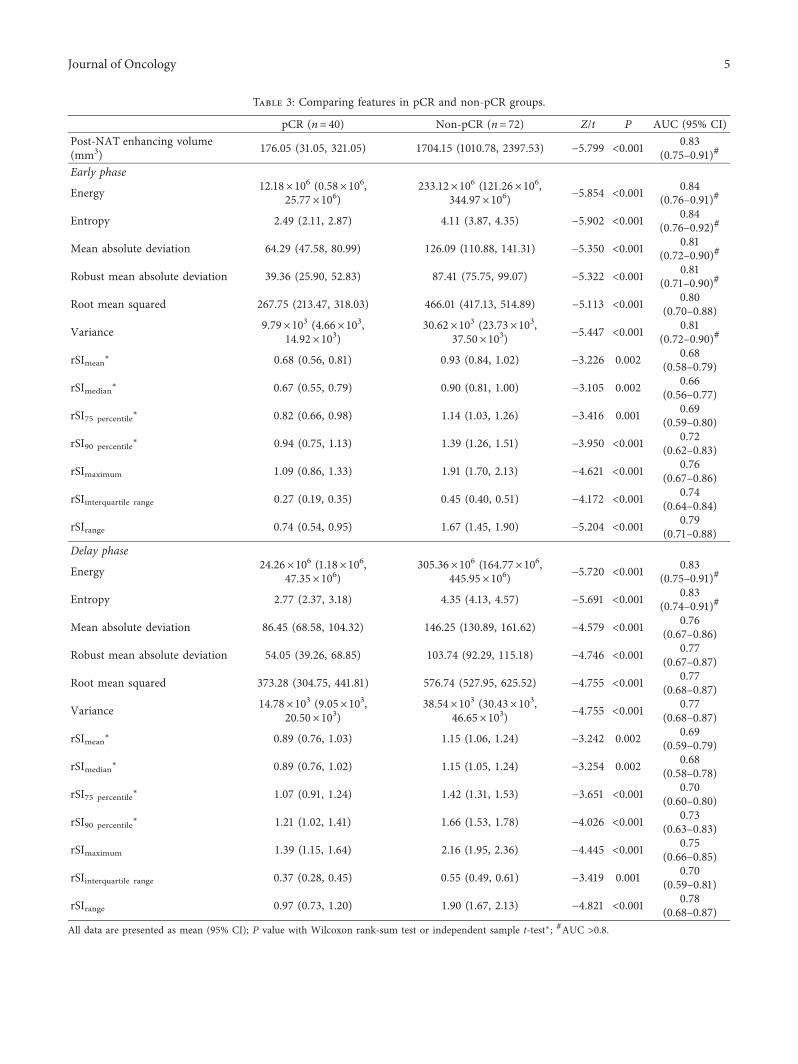
Table 3: Comparing features in pCR and non-pCR groups.
pCR (n� 40) Non-pCR (n� 72) Z/t P AUC (95% CI)Post-NAT enhancing volume(mm3) 176.05 (31.05, 321.05) 1704.15 (1010.78, 2397.53) − 5.799 <0.001 0.83
(0.75–0.91)#
Early phase
Energy 12.18×10⁶ (0.58×106,25.77×106)
233.12×10⁶ (121.26×106,344.97×106) − 5.854 <0.001 0.84
(0.76–0.91)#
Entropy 2.49 (2.11, 2.87) 4.11 (3.87, 4.35) − 5.902 <0.001 0.84(0.76–0.92)#
Mean absolute deviation 64.29 (47.58, 80.99) 126.09 (110.88, 141.31) − 5.350 <0.001 0.81(0.72–0.90)#
Robust mean absolute deviation 39.36 (25.90, 52.83) 87.41 (75.75, 99.07) − 5.322 <0.001 0.81(0.71–0.90)#
Root mean squared 267.75 (213.47, 318.03) 466.01 (417.13, 514.89) − 5.113 <0.001 0.80(0.70–0.88)
Variance 9.79×10³ (4.66×103,14.92×103)
30.62×10³ (23.73×103,37.50×103) − 5.447 <0.001 0.81
(0.72–0.90)#
rSImean∗ 0.68 (0.56, 0.81) 0.93 (0.84, 1.02) − 3.226 0.002 0.68
(0.58–0.79)
rSImedian∗ 0.67 (0.55, 0.79) 0.90 (0.81, 1.00) − 3.105 0.002 0.66
(0.56–0.77)
rSI75 percentile∗ 0.82 (0.66, 0.98) 1.14 (1.03, 1.26) − 3.416 0.001 0.69
(0.59–0.80)
rSI90 percentile∗ 0.94 (0.75, 1.13) 1.39 (1.26, 1.51) − 3.950 <0.001 0.72
(0.62–0.83)
rSImaximum 1.09 (0.86, 1.33) 1.91 (1.70, 2.13) − 4.621 <0.001 0.76(0.67–0.86)
rSIinterquartile range 0.27 (0.19, 0.35) 0.45 (0.40, 0.51) − 4.172 <0.001 0.74(0.64–0.84)
rSIrange 0.74 (0.54, 0.95) 1.67 (1.45, 1.90) − 5.204 <0.001 0.79(0.71–0.88)
Delay phase
Energy 24.26×10⁶ (1.18×106,47.35×106)
305.36×10⁶ (164.77×106,445.95×106) − 5.720 <0.001 0.83
(0.75–0.91)#
Entropy 2.77 (2.37, 3.18) 4.35 (4.13, 4.57) − 5.691 <0.001 0.83(0.74–0.91)#
Mean absolute deviation 86.45 (68.58, 104.32) 146.25 (130.89, 161.62) − 4.579 <0.001 0.76(0.67–0.86)
Robust mean absolute deviation 54.05 (39.26, 68.85) 103.74 (92.29, 115.18) − 4.746 <0.001 0.77(0.67–0.87)
Root mean squared 373.28 (304.75, 441.81) 576.74 (527.95, 625.52) − 4.755 <0.001 0.77(0.68–0.87)
Variance 14.78×10³ (9.05×103,20.50×103)
38.54×10³ (30.43×103,46.65×103) − 4.755 <0.001 0.77
(0.68–0.87)
rSImean∗ 0.89 (0.76, 1.03) 1.15 (1.06, 1.24) − 3.242 0.002 0.69
(0.59–0.79)
rSImedian∗ 0.89 (0.76, 1.02) 1.15 (1.05, 1.24) − 3.254 0.002 0.68
(0.58–0.78)
rSI75 percentile∗ 1.07 (0.91, 1.24) 1.42 (1.31, 1.53) − 3.651 <0.001 0.70
(0.60–0.80)
rSI90 percentile∗ 1.21 (1.02, 1.41) 1.66 (1.53, 1.78) − 4.026 <0.001 0.73
(0.63–0.83)
rSImaximum 1.39 (1.15, 1.64) 2.16 (1.95, 2.36) − 4.445 <0.001 0.75(0.66–0.85)
rSIinterquartile range 0.37 (0.28, 0.45) 0.55 (0.49, 0.61) − 3.419 0.001 0.70(0.59–0.81)
rSIrange 0.97 (0.73, 1.20) 1.90 (1.67, 2.13) − 4.821 <0.001 0.78(0.68–0.87)
All data are presented as mean (95% CI); P value with Wilcoxon rank-sum test or independent sample t-test∗; #AUC >0.8.
Journal of Oncology 5
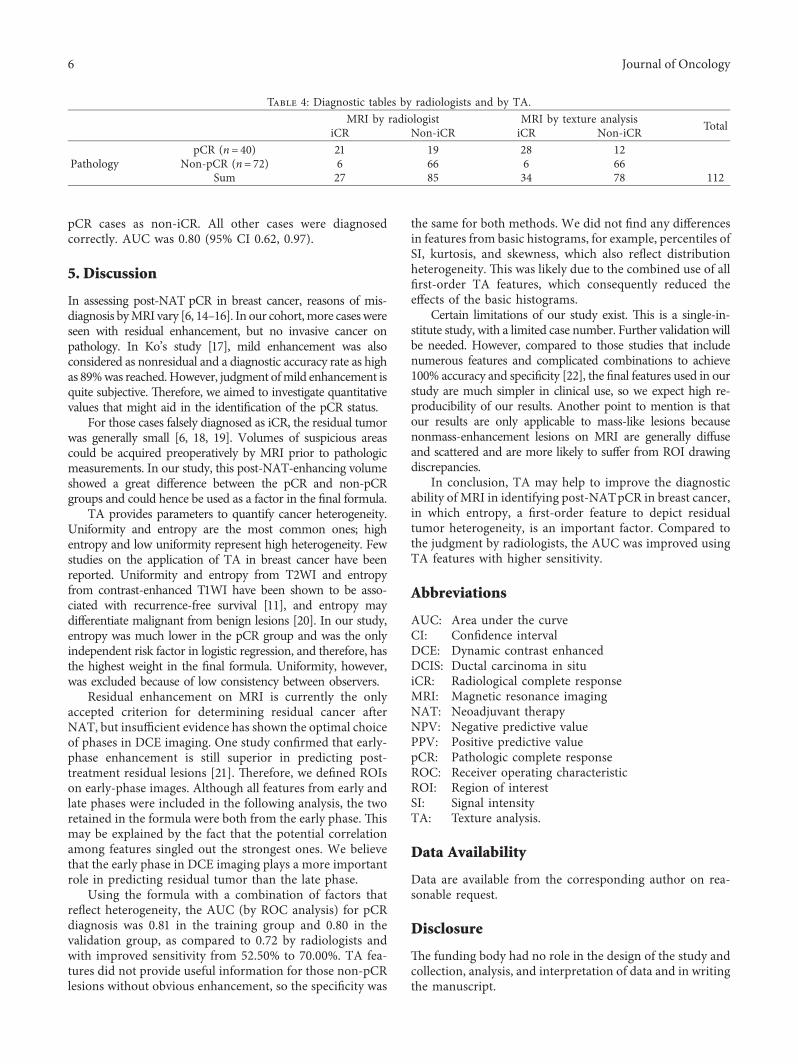
pCR cases as non-iCR. All other cases were diagnosedcorrectly. AUC was 0.80 (95% CI 0.62, 0.97).
5. Discussion
In assessing post-NAT pCR in breast cancer, reasons of mis-diagnosis byMRI vary [6, 14–16]. In our cohort,more caseswereseen with residual enhancement, but no invasive cancer onpathology. In Ko’s study [17], mild enhancement was alsoconsidered as nonresidual and a diagnostic accuracy rate as highas 89%was reached.However, judgment ofmild enhancement isquite subjective. .erefore, we aimed to investigate quantitativevalues that might aid in the identification of the pCR status.
For those cases falsely diagnosed as iCR, the residual tumorwas generally small [6, 18, 19]. Volumes of suspicious areascould be acquired preoperatively by MRI prior to pathologicmeasurements. In our study, this post-NAT-enhancing volumeshowed a great difference between the pCR and non-pCRgroups and could hence be used as a factor in the final formula.
TA provides parameters to quantify cancer heterogeneity.Uniformity and entropy are the most common ones; highentropy and low uniformity represent high heterogeneity. Fewstudies on the application of TA in breast cancer have beenreported. Uniformity and entropy from T2WI and entropyfrom contrast-enhanced T1WI have been shown to be asso-ciated with recurrence-free survival [11], and entropy maydifferentiate malignant from benign lesions [20]. In our study,entropy was much lower in the pCR group and was the onlyindependent risk factor in logistic regression, and therefore, hasthe highest weight in the final formula. Uniformity, however,was excluded because of low consistency between observers.
Residual enhancement on MRI is currently the onlyaccepted criterion for determining residual cancer afterNAT, but insufficient evidence has shown the optimal choiceof phases in DCE imaging. One study confirmed that early-phase enhancement is still superior in predicting post-treatment residual lesions [21]. .erefore, we defined ROIson early-phase images. Although all features from early andlate phases were included in the following analysis, the tworetained in the formula were both from the early phase. .ismay be explained by the fact that the potential correlationamong features singled out the strongest ones. We believethat the early phase in DCE imaging plays a more importantrole in predicting residual tumor than the late phase.
Using the formula with a combination of factors thatreflect heterogeneity, the AUC (by ROC analysis) for pCRdiagnosis was 0.81 in the training group and 0.80 in thevalidation group, as compared to 0.72 by radiologists andwith improved sensitivity from 52.50% to 70.00%. TA fea-tures did not provide useful information for those non-pCRlesions without obvious enhancement, so the specificity was
the same for both methods. We did not find any differencesin features from basic histograms, for example, percentiles ofSI, kurtosis, and skewness, which also reflect distributionheterogeneity. .is was likely due to the combined use of allfirst-order TA features, which consequently reduced theeffects of the basic histograms.
Certain limitations of our study exist. .is is a single-in-stitute study, with a limited case number. Further validation willbe needed. However, compared to those studies that includenumerous features and complicated combinations to achieve100% accuracy and specificity [22], the final features used in ourstudy are much simpler in clinical use, so we expect high re-producibility of our results. Another point to mention is thatour results are only applicable to mass-like lesions becausenonmass-enhancement lesions on MRI are generally diffuseand scattered and are more likely to suffer from ROI drawingdiscrepancies.
In conclusion, TA may help to improve the diagnosticability of MRI in identifying post-NATpCR in breast cancer,in which entropy, a first-order feature to depict residualtumor heterogeneity, is an important factor. Compared tothe judgment by radiologists, the AUC was improved usingTA features with higher sensitivity.
Abbreviations
AUC: Area under the curveCI: Confidence intervalDCE: Dynamic contrast enhancedDCIS: Ductal carcinoma in situiCR: Radiological complete responseMRI: Magnetic resonance imagingNAT: Neoadjuvant therapyNPV: Negative predictive valuePPV: Positive predictive valuepCR: Pathologic complete responseROC: Receiver operating characteristicROI: Region of interestSI: Signal intensityTA: Texture analysis.
Data Availability
Data are available from the corresponding author on rea-sonable request.
Disclosure
.e funding body had no role in the design of the study andcollection, analysis, and interpretation of data and in writingthe manuscript.
Table 4: Diagnostic tables by radiologists and by TA.MRI by radiologist MRI by texture analysis TotaliCR Non-iCR iCR Non-iCR
PathologypCR (n� 40) 21 19 28 12
Non-pCR (n� 72) 6 66 6 66Sum 27 85 34 78 112
6 Journal of Oncology
Conflicts of Interest
.e authors declare that they have no conflicts of interest.
Acknowledgments
.e authors thank Hui Liu, Ph.D. for integrating andmodifying the radiomics software. Also, the authors thankLetPub (http://www.letpub.com) for its linguistic assistanceduring the preparation of this manuscript. .is study wasfunded by the Beijing Municipal Administration of Hos-pitals Clinical Medicine Development of Special FundingSupport (no. ZYLX201803), Beijing million Talents Project(no. 2017A13), and National Key Research and Develop-ment Plan (2017YFC1309101 and 2017YFC1309104).
References
[1] G. von Minckwitz, M. Untch, and S. Loibl, “Update onneoadjuvant/preoperative therapy of breast cancer: experi-ences from the German breast group,” Current Opinion inObstetrics and Gynecology, vol. 25, no. 1, pp. 66–73, 2013.
[2] E. Yeh, P. Slanetz, D. B. Kopans et al., “Prospective com-parison of mammography, sonography, and MRI in patientsundergoing neoadjuvant chemotherapy for palpable breastcancer,” American Journal of Roentgenology, vol. 184, no. 3,pp. 868–877, 2005.
[3] S. C. Partridge, J. E. Gibbs, Y. Lu, L. J. Esserman,D. Sudilovsky, and N. M. Hylton, “Accuracy of MR imagingfor revealing residual breast cancer in patients who haveundergone neoadjuvant chemotherapy,” American Journal ofRoentgenology, vol. 179, no. 5, pp. 1193–1199, 2002.
[4] P. T. Weatherall, G. F. Evans, G. J. Metzger, M. H. Saborrian,and A. M. Leitch, “MRI vs. histologic measurement of breastcancer following chemotherapy: comparison with x-raymammography and palpation,” Journal of Magnetic Reso-nance Imaging, vol. 13, no. 6, pp. 868–875, 2001.
[5] M. S. Kwong, G. G. Chung, L. J. Horvath et al., “Post-chemotherapy MRI overestimates residual disease comparedwith histopathology in responders to neoadjuvant therapy forlocally advanced breast cancer,” 7e Cancer Journal, vol. 12,no. 3, pp. 212–221, 2006.
[6] S. P. Gampenrieder, A. Peer, C. Weismann et al., “Radiologiccomplete response (rCR) in contrast-enhanced magneticresonance imaging (CE-MRI) after neoadjuvant chemother-apy for early breast cancer predicts recurrence-free survivalbut not pathologic complete response (pCR),” Breast CancerResearch, vol. 21, no. 1, p. 19, 2019.
[7] Y. Yuan, X.-S. Chen, S.-Y. Liu, and K.-W. Shen, “Accuracy ofMRI in prediction of pathologic complete remission in breastcancer after preoperative therapy: a meta-analysis,” AmericanJournal of Roentgenology, vol. 195, no. 1, pp. 260–268, 2010.
[8] V. Semiglazov, “RECISTfor response (clinical and imaging) inneoadjuvant clinical trials in operable breast cancer,” JNCIMonographs, vol. 2015, no. 51, pp. 21–23, 2015.
[9] J.-H. Kim, E. S. Ko, Y. Lim et al., “Breast cancer heterogeneity:MR imaging texture analysis and survival outcomes,” Radi-ology, vol. 282, no. 3, pp. 665–675, 2017.
[10] H.-J. Eom, J. H. Cha, W. J. Choi, E. Y. Chae, H. J. Shin, andH. H. Kim, “Predictive clinicopathologic and dynamic con-trast-enhanced MRI findings for tumor response to neo-adjuvant chemotherapy in triple-negative breast cancer,”
American Journal of Roentgenology, vol. 208, no. 6,pp. W225–W230, 2017.
[11] J. Wu, G. Cao, X. Sun et al., “Intratumoral spatial hetero-geneity at perfusion MR imaging predicts recurrence-freesurvival in locally advanced breast cancer treated with neo-adjuvant chemotherapy,” Radiology, vol. 288, no. 1, pp. 26–35,2018.
[12] R. D. Chitalia and D. Kontos, “Role of texture analysis inbreast MRI as a cancer biomarker: a review,” Journal ofMagnetic Resonance Imaging, vol. 49, no. 4, pp. 927–938, 2019.
[13] H. J.W.L. Aerts, E. R. Velazquez, R. T. H. Leijenaar et al.,“Decoding tumour phenotype by noninvasive imaging using aquantitative radiomics approach,” Nature Communications,vol. 5, no. 1, p. 4006, 2014.
[14] J. Park, E. Y. Chae, J. H. Cha et al., “Comparison of mam-mography, digital breast tomosynthesis, automated breastultrasound, magnetic resonance imaging in evaluation ofresidual tumor after neoadjuvant chemotherapy,” EuropeanJournal of Radiology, vol. 108, pp. 261–268, 2018.
[15] A. Bouzon, B. Acea, R. Soler et al., “Diagnostic accuracy ofMRI to evaluate tumour response and residual tumour sizeafter neoadjuvant chemotherapy in breast cancer patients,”Radiology and Oncology, vol. 50, no. 1, pp. 73–79, 2016.
[16] A. Evans, P. Whelehan, A. .ompson et al., “Identification ofpathological complete response after neoadjuvant chemo-therapy for breast cancer: comparison of greyscale ultrasound,shear wave elastography, and MRI,” Clinical Radiology,vol. 73, no. 10, pp. 910.e1–910.e6, 2018.
[17] E. S. Ko, B.-K. Han, R. B. Kim et al., “Analysis of factors thatinfluence the accuracy of magnetic resonance imaging forpredicting response after neoadjuvant chemotherapy in lo-cally advanced breast cancer,” Annals of Surgical Oncology,vol. 20, no. 8, pp. 2562–2568, 2013.
[18] S.-Y. Kim, N. Cho, S. U. Shin et al., “Contrast-enhanced MRIafter neoadjuvant chemotherapy of breast cancer: lesion-to-background parenchymal signal enhancement ratio for dis-criminating pathological complete response from minimalresidual tumour,” European Radiology, vol. 28, no. 7,pp. 2986–2995, 2018.
[19] J. R. Scheel, E. Kim, S. C. Partridge et al., “MRI, clinicalexamination, and mammography for preoperative assessmentof residual disease and pathologic complete response afterneoadjuvant chemotherapy for breast cancer: ACRIN 6657trial,” American Journal of Roentgenology, vol. 210, no. 6,pp. 1376–1385, 2018.
[20] P. Gibbs and L. W. Turnbull, “Textural analysis of contrast-enhanced MR images of the breast,” Magnetic Resonance inMedicine, vol. 50, no. 1, pp. 92–98, 2003.
[21] Y. Kim, S. H. Sim, B. Park et al., “Magnetic resonance imaging(MRI) assessment of residual breast cancer after neoadjuvantchemotherapy: relevance to tumor subtypes and MRI inter-pretation threshold,” Clinical Breast Cancer, vol. 18, no. 6,pp. 459–467, 2018.
[22] G. .ibault, A. Tudorica, A. Afzal et al., “DCE-MRI texturefeatures for early prediction of breast cancer therapy re-sponse,” Tomography, vol. 3, no. 1, pp. 23–32, 2017.
Journal of Oncology 7

Stem Cells International
Hindawiwww.hindawi.com Volume 2018
Hindawiwww.hindawi.com Volume 2018
MEDIATORSINFLAMMATION
of
EndocrinologyInternational Journal of
Hindawiwww.hindawi.com Volume 2018
Hindawiwww.hindawi.com Volume 2018
Disease Markers
Hindawiwww.hindawi.com Volume 2018
BioMed Research International
OncologyJournal of
Hindawiwww.hindawi.com Volume 2013
Hindawiwww.hindawi.com Volume 2018
Oxidative Medicine and Cellular Longevity
Hindawiwww.hindawi.com Volume 2018
PPAR Research
Hindawi Publishing Corporation http://www.hindawi.com Volume 2013Hindawiwww.hindawi.com
The Scientific World Journal
Volume 2018
Immunology ResearchHindawiwww.hindawi.com Volume 2018
Journal of
ObesityJournal of
Hindawiwww.hindawi.com Volume 2018
Hindawiwww.hindawi.com Volume 2018
Computational and Mathematical Methods in Medicine
Hindawiwww.hindawi.com Volume 2018
Behavioural Neurology
OphthalmologyJournal of
Hindawiwww.hindawi.com Volume 2018
Diabetes ResearchJournal of
Hindawiwww.hindawi.com Volume 2018
Hindawiwww.hindawi.com Volume 2018
Research and TreatmentAIDS
Hindawiwww.hindawi.com Volume 2018
Gastroenterology Research and Practice
Hindawiwww.hindawi.com Volume 2018
Parkinson’s Disease
Evidence-Based Complementary andAlternative Medicine
Volume 2018Hindawiwww.hindawi.com
Submit your manuscripts atwww.hindawi.com


