Embed Size (px)
Citation preview
BIOLOGIA (PAKISTAN) ISSN 0006-3096
BIOLOGIA
(PAKISTAN) Vol. 58, No.1&2, 2012
Editor-in-Chief
AZIZULLAH
Editors
PAKISTAN FOREIGN
Nusrat Jahan Jonathan Palmer (New Zealand) Ghazala Yasmeen Athar Tariq (U.S.A.) Ikram-ul-Haq C.J. Secombes (U.K.) M. R. Mirza B. Faye (France) A.U.Khan Salih Dogan (Turkey) Zaheer-ud-din Khan Wolfgang Von Engelhardt M.Sharif Mughal (Germany) Qi Bin Zhang (China)
BIOLOGICAL SOCIETY OF PAKISTAN Biological Laboratories, GC University, Lahore, Pakistan
www.biosoc.pk

BIOLOGICAL SOCIETY OF PAKISTAN Biological Laboratories, GC University, Lahore, Pakistan
PRESIDENT
M. Anwar Malik Department of Zoology,
GC University, Lahore, Pakistan
VICE PRESIDENTS
Zaheer-ud-din Khan Department of Botany,
GC University, Lahore, Pakistan
Anjum Perveen Department of Botany,
University of Karachi, Karachi, Pakistan
Rehana Asghar
Department of Biology
Mirpur, University, AJK
Nusrat Jahan
Department of Zoology
GC University, Lahore, Pakistan
Syed Akram Shah Department of Zoology,
Peshawar University, Peshawar, Pakistan
Asmatulla Kakar Department of Zoology,
University of Balochistan, Quetta, Pakistan
GENERAL SECRETARY
Ikram-ul-Haq, SI Institute of Industrial Biotechnology,
GC University, Lahore, Pakistan
JOINT SECRETARY
Muhammad Afzal Agricultural University, Faisalabad
Pakistan
MANAGING EDITORS Abdul Qayyum Khan Sulehria
Department of Zoology
GC University, Lahore. Pakistan.
Safdar Ali Mirza
Department of Botany
GC University, Lahore. Pakistan.
EDITOR-IN-CHIEF
Azizullah Department of Zoology,
GC University, Lahore, Pakistan
ADVISORY BOARD Tasneem Farasat (LCU for Women, Lahore) M. Fiaz Qamar (GC University, Lahore) Altaf Dasti (B. Z. U., Multan) Wazir Ali Baloch (University of Sindh, Jamshoro) Muhammad Ayub (DG, Fisheries Punjab) Sana Ullah Khan Khattak (University of Peshawar, Peshawar) Zahid Hussain Malik (University of AJK, Muzaffarabad) Tahira Aziz Mughal (LCU for Women, Lahore) Atta Muhammad (Univ. of Balochistan, Quetta) Aliya Rehman (karachi University) Moin-ud-Din Ahmad (Urdu Uni., of Sci. Tech., Karachi)
Pei Sheng-Ji (China) Kazuo N. Watanabe (Japan) Jin Zou (U. K.) Mary Tatnar (U. K.) William Bill Radke (U. S. A.) David B. Wilson (U. S. A.) Lee A. Meserve (U. S. A.) Fabrizio Rueca (Italy) Silvana Diverio (Italy) Giorgia Della Rocca (Italy) R. Pabst (Germany)
Vol. 58, No.1&2, 2012 PK ISSN 0006-3096
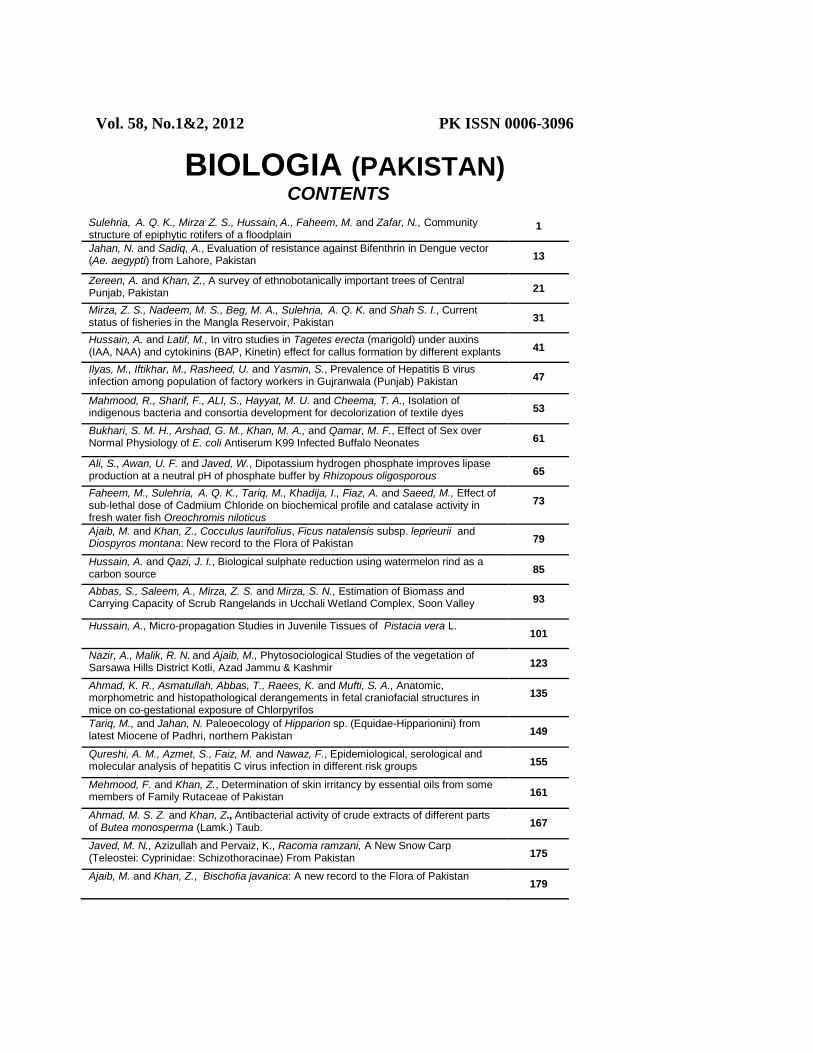
BIOLOGIA (PAKISTAN) CONTENTS
Sulehria,
A. Q. K., Mirza
, Z. S., Hussain,
A., Faheem, M. and Zafar, N., Community
structure of epiphytic rotifers of a floodplain 1
Jahan, N. and Sadiq, A., Evaluation of resistance against Bifenthrin in Dengue vector (Ae. aegypti) from Lahore, Pakistan 13
Zereen, A. and Khan, Z., A survey of ethnobotanically important trees of Central Punjab, Pakistan 21
Mirza, Z. S., Nadeem, M. S., Beg, M. A., Sulehria, A. Q. K. and Shah S. I., Current
status of fisheries in the Mangla Reservoir, Pakistan 31
Hussain, A. and Latif, M., In vitro studies in Tagetes erecta (marigold) under auxins (IAA, NAA) and cytokinins (BAP, Kinetin) effect for callus formation by different explants 41
Ilyas, M., Iftikhar, M., Rasheed, U. and Yasmin, S., Prevalence of Hepatitis B virus infection among population of factory workers in Gujranwala (Punjab) Pakistan 47
Mahmood, R., Sharif, F., ALI, S., Hayyat, M. U. and Cheema, T. A., Isolation of indigenous bacteria and consortia development for decolorization of textile dyes 53
Bukhari, S. M. H., Arshad, G. M., Khan, M. A., and Qamar, M. F., Effect of Sex over Normal Physiology of E. coli Antiserum K99 Infected Buffalo Neonates 61
Ali, S., Awan, U. F. and Javed, W., Dipotassium hydrogen phosphate improves lipase production at a neutral pH of phosphate buffer by Rhizopous oligosporous 65
Faheem, M., Sulehria, A. Q. K., Tariq, M., Khadija, I., Fiaz, A. and Saeed, M., Effect of
sub-lethal dose of Cadmium Chloride on biochemical profile and catalase activity in fresh water fish Oreochromis niloticus
73
Ajaib, M. and Khan, Z., Cocculus laurifolius, Ficus natalensis subsp. leprieurii and Diospyros montana: New record to the Flora of Pakistan 79
Hussain, A. and Qazi, J. I., Biological sulphate reduction using watermelon rind as a carbon source
85
Abbas, S., Saleem, A., Mirza, Z. S. and Mirza, S. N., Estimation of Biomass and Carrying Capacity of Scrub Rangelands in Ucchali Wetland Complex, Soon Valley
93
Hussain, A., Micro-propagation Studies in Juvenile Tissues of Pistacia vera L. 101
Nazir, A., Malik, R. N. and Ajaib, M., Phytosociological Studies of the vegetation of
Sarsawa Hills District Kotli, Azad Jammu & Kashmir 123
Ahmad, K. R., Asmatullah, Abbas, T., Raees, K. and Mufti, S. A., Anatomic, morphometric and histopathological derangements in fetal craniofacial structures in mice on co-gestational exposure of Chlorpyrifos
135
Tariq, M., and Jahan, N. Paleoecology of Hipparion sp. (Equidae-Hipparionini) from latest Miocene of Padhri, northern Pakistan 149
Qureshi, A. M., Azmet, S., Faiz, M. and Nawaz, F., Epidemiological, serological and molecular analysis of hepatitis C virus infection in different risk groups
155
Mehmood, F. and Khan, Z., Determination of skin irritancy by essential oils from some members of Family Rutaceae of Pakistan 161
Ahmad, M. S. Z. and Khan, Z., Antibacterial activity of crude extracts of different parts of Butea monosperma (Lamk.) Taub. 167
Javed, M. N., Azizullah and Pervaiz, K., Racoma ramzani, A New Snow Carp (Teleostei: Cyprinidae: Schizothoracinae) From Pakistan 175
Ajaib, M. and Khan, Z., Bischofia javanica: A new record to the Flora of Pakistan 179
BIOLOGICAL SOCIETY OF PAKISTAN Biological Laboratories, GC University, Lahore, Pakistan
www.biosoc.pk
INSTRUCTIONS TO THE CONTRIBUTORS IN BIOLOGIA- PAKISTAN
1. (a) Manuscripts should be computer typed (in double spacing on one side of the paper
only). Two hard copies and a soft copy should be submitted, following the format of the latest volumes of Biologia-Pakistan. However, the articles can also be submitted online at [email protected].
(b) Nothing in the text should be underlined, except the scientific names which should be written in italics or underlined. (c) The manuscripts should have following margins: Paper size=11 inch (letter); Top=0.5"; Bottom=2.8"; left=1.75"; right=1.75". Manuscript must be typed according to the format
of Biologia-Pakistan, that includes (i) Complete title of the paper with the author/s name/s and addresses, (ii) corresponding author’s email address and running title. i and ii must be on first page. Start from 2
nd page iii) Abstract, (iii) Key words, (iv) Introduction, (v) Materials and Methods,
(vi) Results, (vii) Discussion. (Results and Discussion may be one heading), (viii) References. 2. The manuscripts will be charged @ Rs. 300 per page. However, for members of the Society, first page will be free and the subsequent pages will be charged at the usual basis. 3. The abstract should not exceed 250 words. It should be printed in small font. 4. The author/ s may suggest a running title not exceeding four words, for their papers. It should be indicated on the title page. 5. (a) Tables should be numbered as Table I: Table 2: . Footnotes should be avoided as far as possible.
(b) Figures should be numbered as Fig.,1; Fig., 2: etc. 6. (a) Diagrams should be either original photographs, or if hand drawn, should be inked with black Indian ink.
(b) The size of an illustration, after reduction, should not exceed 4.5 x 6.5 inches. 7. (a) There will be no extra charges for black and white photographs.
(b) Colored photographs will be charged @ actual cost of the positives, plates, printing etc., involved.
8. (a) References should be cited in the text by giving the author’s name followed by the year of publication. The abbreviations of journals or books should be in italics. In case of journal, the volume number should be more bold than the other parts of the reference.
Baker, E. W., 1949. A review of the mite family Cheyletidae in the United States National Museum. Proc. U. S. Nat. Mus., 99: 267-320.
David, L. & Weiser, J., 1994. Role of hemocytes in the propagation of a microsporidian infection in larvae of Galleria mellonella. J. Invertebr. Pathol., 63: 212-213.
Wiegand, M. D., 1992. Vitellogenesis in fish. In: Proc. Internat. Symp. Reprod. Physiol. Fish. (eds Riether, C. J. J. and Goose, H. J.), pp. 136-146.
Ward, H. B. & Whipple, G. C., 1959. Fresh Water Biology.2nd
ed. John Wiley and Sons. New York. 1248 pp. Haq, R., Rehman, A. & Shakoori, A. R., 2001. Survival, culturing, adaptation and metal resistance of
various rotifers and a gastrotrich (Minor phyla) isolated from heavily polluted industrial effluents. Pakistan J. Zool., 33(3):247-253.
Theses Sulehria, A.Q.K., 2010. Planktonic rotifers and their role in fish growth and farm fisheries. Ph.D. Thesis. GC
University, Lahore. Pakistan. 130 pp. (b) The names of the journals and books should be abbreviated according to the latest
edition of the World List of Scientific Periodicals. 9. (a) Galley-proofs will be sent to the author/ s for correction, which should be returned within a week of their receipt.
10. Author/s will receive ecopy.
ANNUAL MEMBERSHIP
PAKISTAN Life Fellow Rs. 5000.00 Fellow Rs. 1000.00 (per annum) Student Member Rs. 500.00 (Will not receive free copy (per annum) of journal)
FOREIGN Fellow US $ 30.00 (per annum)
JOURNAL SUBSCRIPTION Complete Volume Single Copy
PAKISTAN Rs. 1000.00 Rs. 500.00
FOREIGN
Surface mail US $ 100.00 US $ 60.00
Air Mail US $ 120.00 US $ 70.00
All correspondence relating to membership and publication should be addressed to:
MANAGING EDITORS Abdul Qayyum Khan Sulehria
Department of Zoology GC University, Lahore. Pakistan.
Safdar Ali Mirza Department of Botany
GC University, Lahore. Pakistan.
E-mail: [email protected] or [email protected]
BIOLOGICAL SOCIETY OF PAKISTAN Biological Laboratories, GC University, Lahore, Pakistan
www.biosoc.pk
BIOLOGIA (PAKISTAN) 2012, 58 (1&2), 1-12 PK ISSN 0006 - 3096
*Corresponding author: [email protected]
Community structure of epiphytic rotifers of a floodplain
*ABDUL QAYYUM KHAN SULEHRIA1, ZAHID SHARIF MIRZA
2, ALTAF
HUSSAIN3, MEHWISH FAHEEM
4 & NIMRA ZAFAR
5
1,3,4,5
Department of Zoology, GC University, Lahore. 2Fisheries Research & Training Institute, P.O. Batapur , Lahore, Pakistan.
ABSTRACT
Present study was conducted to determine the diversity and density of epiphytic
rotifers of a floodplain. Epiphytic rotifers were collected from January 2012 to June 2012. In total, 33 different species belonging to 12 genera were identified. The highest population density of rotifers (66.2 ± 4.22/ml) was observed during the month of June while the lowest mean number of rotifers (37.0 ± 1.81/ml) was found during the month of January. Most prominent genera with respect to the relative (%) representation of species were Lecane > Lepadella > Cephalodella, which were 38.70%, 28.44%, and 5.64% respectively. Through analysis of variance it was observed that there was statistically significant difference in the physico-chemical parameters and density of rotifers of floodplain from January to June. Rotifers population density showed positive correlation with water temperature, air temperature, electrical conductivity, turbidity and negative correlation with dissolved oxygen, TDS, and pH. Key words: Rotifers, Epiphytic invertebrates, Floodplain, Physico-chemical parameters,
INTRODUCTION
Rotifers make up a crucial component of the zooplanktons found in
freshwaters. Rotifers play a vital role in aquatic food chain by transferring energy and transporting nutrients. Generally, rotifers show great density and diversity among zooplankton, being pioneer organisms having the ability to inhabit different types of habitats, such as temporary floodplains (Martínez et al., 2000, Lansac-Tôha et al., 2009) rivers, lakes and reservoirs (Almeida et al., 2009, Borges & Pedrozo, 2009).
Rotifers are usually present on mosses and lichens, in rain puddles and gutters, in leaf litter or in soil, on mushrooms, in tanks of sewage treatment plants and also on freshwater crustaceans and larvae of aquatic insects (Wallace & Snell, 2010).
Rotifers exhibit a wide range of feeding habits. They are direct consumers of phytoplanktons (Malik & Sulehria, 2003, 2004). Rotifers which live on merged and submerged leaves, roots, and stems of macrophytes are named as epiphytic rotifers. Epiphytic invertebrates are an important portion of riverine food webs, being significant consumers of algae, detritus and metazoans and are an essential food source for many fish. The abundance of epiphytic invertebrates may be strongly influenced by seasonal or annual climatic cycles through their influence on life-history attributes of such biota (Balcombe et al., 2007).
A.K.Q SULEHRIA ET AL BIOLOGIA (PAKISTAN) 2
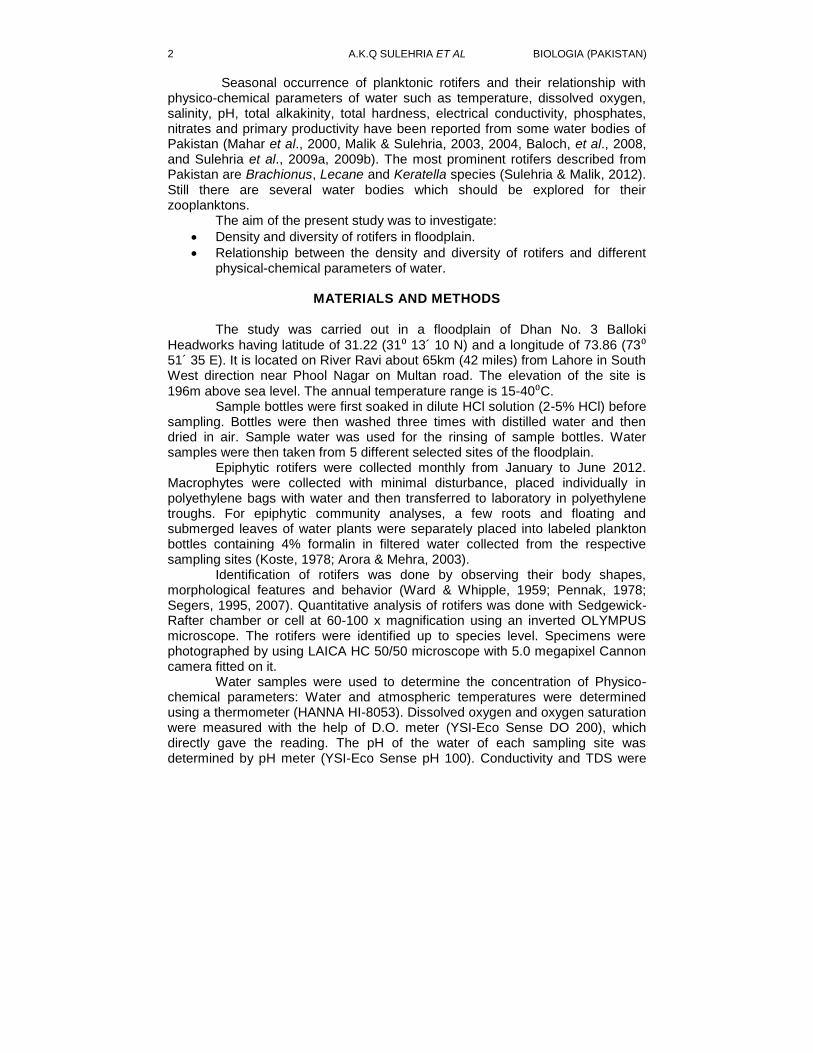
Seasonal occurrence of planktonic rotifers and their relationship with physico-chemical parameters of water such as temperature, dissolved oxygen, salinity, pH, total alkakinity, total hardness, electrical conductivity, phosphates, nitrates and primary productivity have been reported from some water bodies of Pakistan (Mahar et al., 2000, Malik & Sulehria, 2003, 2004, Baloch, et al., 2008, and Sulehria et al., 2009a, 2009b). The most prominent rotifers described from Pakistan are Brachionus, Lecane and Keratella species (Sulehria & Malik, 2012). Still there are several water bodies which should be explored for their zooplanktons. The aim of the present study was to investigate:
Density and diversity of rotifers in floodplain.
Relationship between the density and diversity of rotifers and different physical-chemical parameters of water.
MATERIALS AND METHODS
The study was carried out in a floodplain of Dhan No. 3 Balloki
Headworks having latitude of 31.22 (31⁰ 13´ 10 N) and a longitude of 73.86 (73⁰ 51´ 35 E). It is located on River Ravi about 65km (42 miles) from Lahore in South West direction near Phool Nagar on Multan road. The elevation of the site is
196m above sea level. The annual temperature range is 15-40⁰C. Sample bottles were first soaked in dilute HCl solution (2-5% HCl) before
sampling. Bottles were then washed three times with distilled water and then dried in air. Sample water was used for the rinsing of sample bottles. Water samples were then taken from 5 different selected sites of the floodplain.
Epiphytic rotifers were collected monthly from January to June 2012. Macrophytes were collected with minimal disturbance, placed individually in polyethylene bags with water and then transferred to laboratory in polyethylene troughs. For epiphytic community analyses, a few roots and floating and submerged leaves of water plants were separately placed into labeled plankton bottles containing 4% formalin in filtered water collected from the respective sampling sites (Koste, 1978; Arora & Mehra, 2003).
Identification of rotifers was done by observing their body shapes, morphological features and behavior (Ward & Whipple, 1959; Pennak, 1978; Segers, 1995, 2007). Quantitative analysis of rotifers was done with Sedgewick-Rafter chamber or cell at 60-100 x magnification using an inverted OLYMPUS microscope. The rotifers were identified up to species level. Specimens were photographed by using LAICA HC 50/50 microscope with 5.0 megapixel Cannon camera fitted on it.
Water samples were used to determine the concentration of Physico-chemical parameters: Water and atmospheric temperatures were determined using a thermometer (HANNA HI-8053). Dissolved oxygen and oxygen saturation were measured with the help of D.O. meter (YSI-Eco Sense DO 200), which directly gave the reading. The pH of the water of each sampling site was determined by pH meter (YSI-Eco Sense pH 100). Conductivity and TDS were
VOL. 58 (1&2) EPIPHYTIC ROTIFERS 3
determined using a (YSI-Eco Sense EC 300) conductivity meter. Turbidity was determined by using a turbidity meter (HANNA, Model # HI 93703).
Pearson’s correlation test was performed to evaluate the relationships between the rotifer species and various observed physical-chemical parameters of water that may be regulating their population. Analysis of variance (ANOVA) was applied to the data of rotifers obtained in various months from different sampling sites in order to find the differences. Pearson’s correlation and ANOVA were performed using the software Minitab 13 for windows. Graphs were plotted with the help of MS Excel 2010 for Windows.
RESULTS AND DISCUSSION
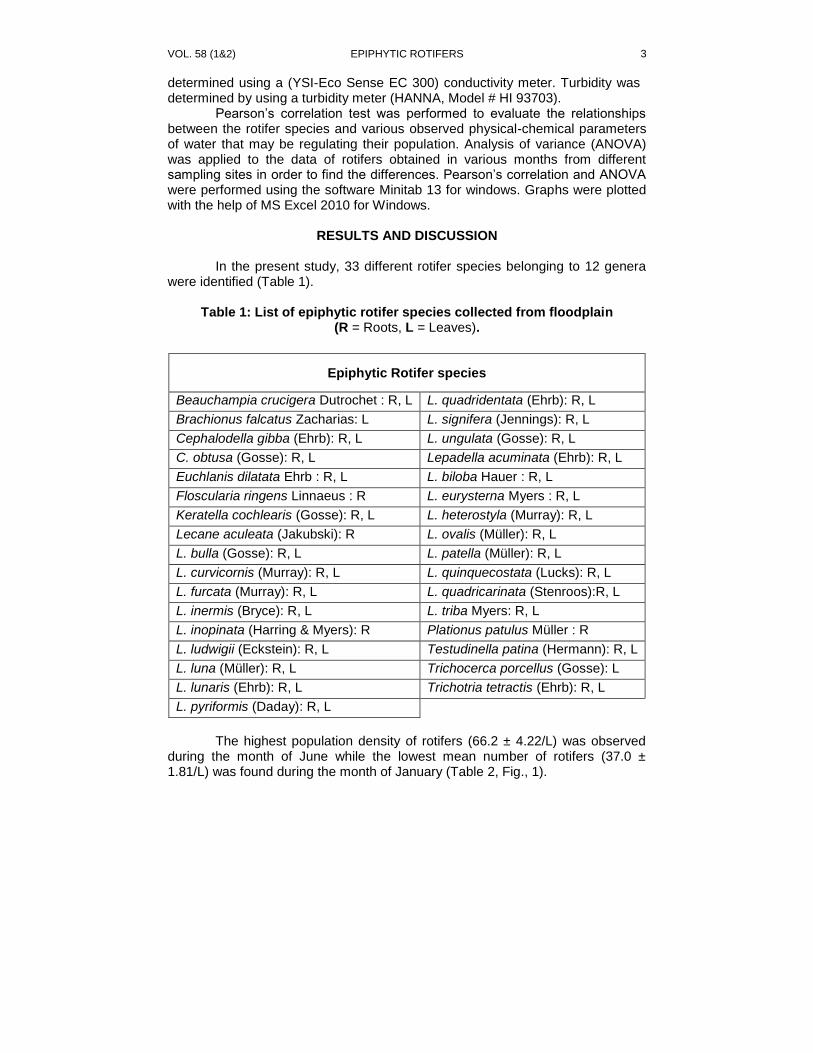
In the present study, 33 different rotifer species belonging to 12 genera
were identified (Table 1).
Table 1: List of epiphytic rotifer species collected from floodplain (R = Roots, L = Leaves).
Epiphytic Rotifer species
Beauchampia crucigera Dutrochet : R, L L. quadridentata (Ehrb): R, L
Brachionus falcatus Zacharias: L L. signifera (Jennings): R, L
Cephalodella gibba (Ehrb): R, L L. ungulata (Gosse): R, L
C. obtusa (Gosse): R, L Lepadella acuminata (Ehrb): R, L
Euchlanis dilatata Ehrb : R, L L. biloba Hauer : R, L
Floscularia ringens Linnaeus : R L. eurysterna Myers : R, L
Keratella cochlearis (Gosse): R, L L. heterostyla (Murray): R, L
Lecane aculeata (Jakubski): R L. ovalis (Müller): R, L
L. bulla (Gosse): R, L L. patella (Müller): R, L
L. curvicornis (Murray): R, L L. quinquecostata (Lucks): R, L
L. furcata (Murray): R, L L. quadricarinata (Stenroos):R, L
L. inermis (Bryce): R, L L. triba Myers: R, L
L. inopinata (Harring & Myers): R Plationus patulus Müller : R
L. ludwigii (Eckstein): R, L Testudinella patina (Hermann): R, L
L. luna (Müller): R, L Trichocerca porcellus (Gosse): L
L. lunaris (Ehrb): R, L Trichotria tetractis (Ehrb): R, L
L. pyriformis (Daday): R, L
The highest population density of rotifers (66.2 ± 4.22/L) was observed
during the month of June while the lowest mean number of rotifers (37.0 ± 1.81/L) was found during the month of January (Table 2, Fig., 1).
A.K.Q SULEHRIA ET AL BIOLOGIA (PAKISTAN) 4
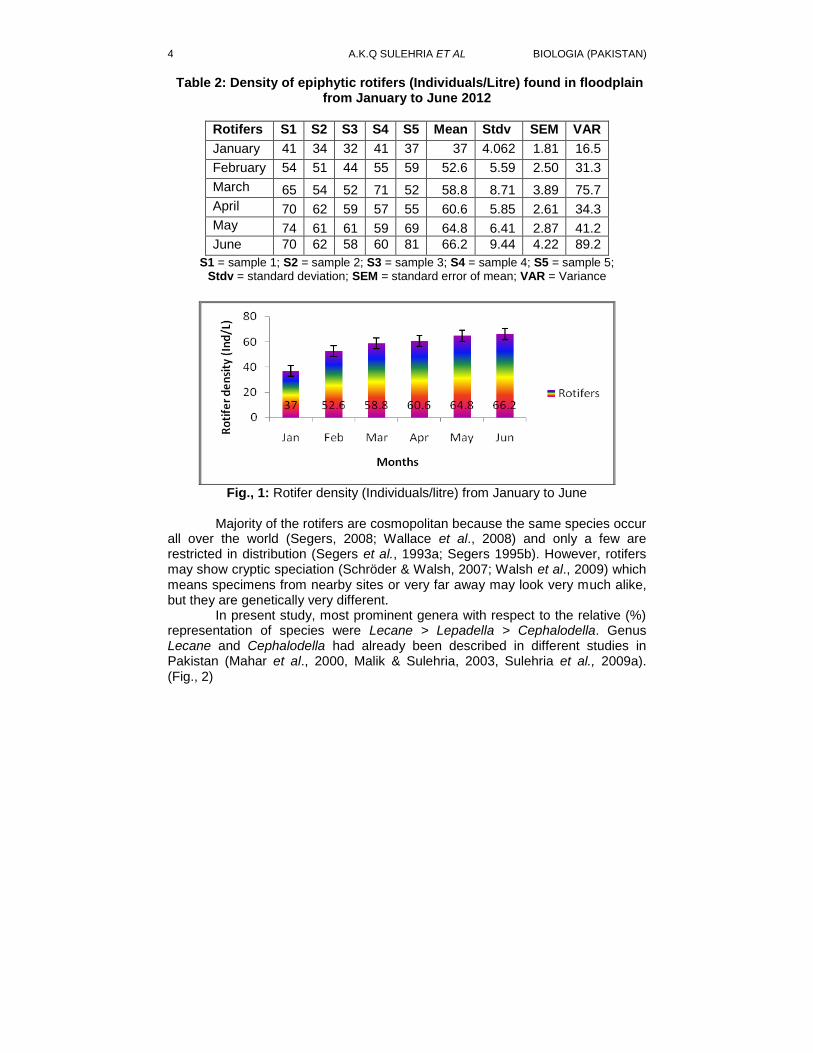
Table 2: Density of epiphytic rotifers (Individuals/Litre) found in floodplain from January to June 2012
Rotifers S1 S2 S3 S4 S5 Mean Stdv SEM VAR
January 41 34 32 41 37 37 4.062 1.81 16.5
February 54 51 44 55 59 52.6 5.59 2.50 31.3
March 65 54 52 71 52 58.8 8.71 3.89 75.7
April 70 62 59 57 55 60.6 5.85 2.61 34.3
May 74 61 61 59 69 64.8 6.41 2.87 41.2
June 70 62 58 60 81 66.2 9.44 4.22 89.2
S1 = sample 1; S2 = sample 2; S3 = sample 3; S4 = sample 4; S5 = sample 5; Stdv = standard deviation; SEM = standard error of mean; VAR = Variance
Fig., 1: Rotifer density (Individuals/litre) from January to June
Majority of the rotifers are cosmopolitan because the same species occur
all over the world (Segers, 2008; Wallace et al., 2008) and only a few are restricted in distribution (Segers et al., 1993a; Segers 1995b). However, rotifers may show cryptic speciation (Schröder & Walsh, 2007; Walsh et al., 2009) which means specimens from nearby sites or very far away may look very much alike, but they are genetically very different.
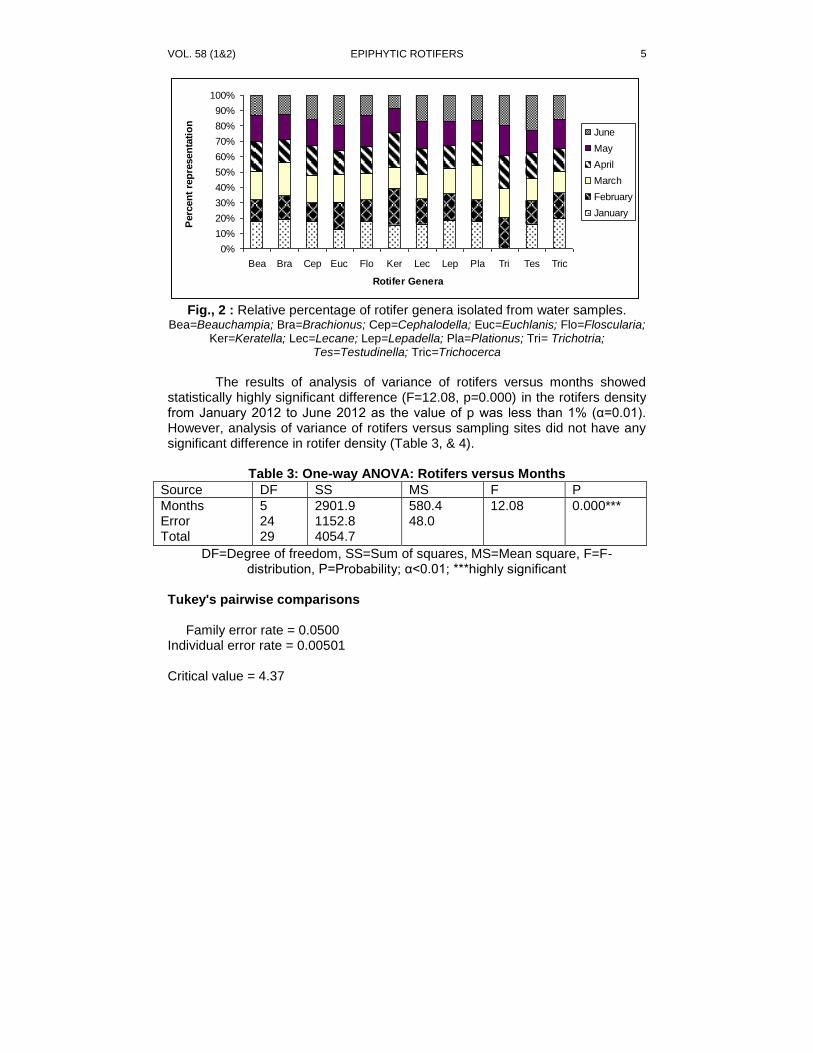
In present study, most prominent genera with respect to the relative (%) representation of species were Lecane > Lepadella > Cephalodella. Genus Lecane and Cephalodella had already been described in different studies in Pakistan (Mahar et al., 2000, Malik & Sulehria, 2003, Sulehria et al., 2009a). (Fig., 2)
VOL. 58 (1&2) EPIPHYTIC ROTIFERS 5
0%
10%
20%
30%
40%
50%
60%
70%
80%
90%
100%
Bea Bra Cep Euc Flo Ker Lec Lep Pla Tri Tes Tric
Rotifer Genera
Perc
en
t re
pre
sen
tati
on
June
May
April
March
February
January
Fig., 2 : Relative percentage of rotifer genera isolated from water samples.
Bea=Beauchampia; Bra=Brachionus; Cep=Cephalodella; Euc=Euchlanis; Flo=Floscularia; Ker=Keratella; Lec=Lecane; Lep=Lepadella; Pla=Plationus; Tri= Trichotria;
Tes=Testudinella; Tric=Trichocerca
The results of analysis of variance of rotifers versus months showed
statistically highly significant difference (F=12.08, p=0.000) in the rotifers density from January 2012 to June 2012 as the value of p was less than 1% (α=0.01). However, analysis of variance of rotifers versus sampling sites did not have any significant difference in rotifer density (Table 3, & 4).
Table 3: One-way ANOVA: Rotifers versus Months
Source DF SS MS F P
Months Error Total
5 24 29
2901.9 1152.8 4054.7
580.4 48.0
12.08 0.000***
DF=Degree of freedom, SS=Sum of squares, MS=Mean square, F=F-distribution, P=Probability; α<0.01; ***highly significant
Tukey's pairwise comparisons Family error rate = 0.0500 Individual error rate = 0.00501 Critical value = 4.37
A.K.Q SULEHRIA ET AL BIOLOGIA (PAKISTAN) 6
Intervals for (column level mean) - (row level mean)
1 2 3 4 5
2 -29.14 -2.06 3 -35.34 -19.74 -8.26 7.34 4 -37.14 -21.54 -15.34 -10.06 5.54 11.74 5 -41.34 -25.74 -19.54 -17.74 -14.26 1.34 7.54 9.34 6 -42.74 -27.14 -20.94 -19.14 -14.94 -15.66 -0.06 6.14 7.94 12.14
Table 4: One-way ANOVA: Rotifers versus Sampling sites
Source DF SS MS F P
Sampling sites Error Total
4 25 29
458 3597 4055
114 144
0.80 0.540*
DF=Degree of freedom, SS=Sum of squares, MS=Mean square, F=F-distribution, P=Probability; α>0.05, *non-significant
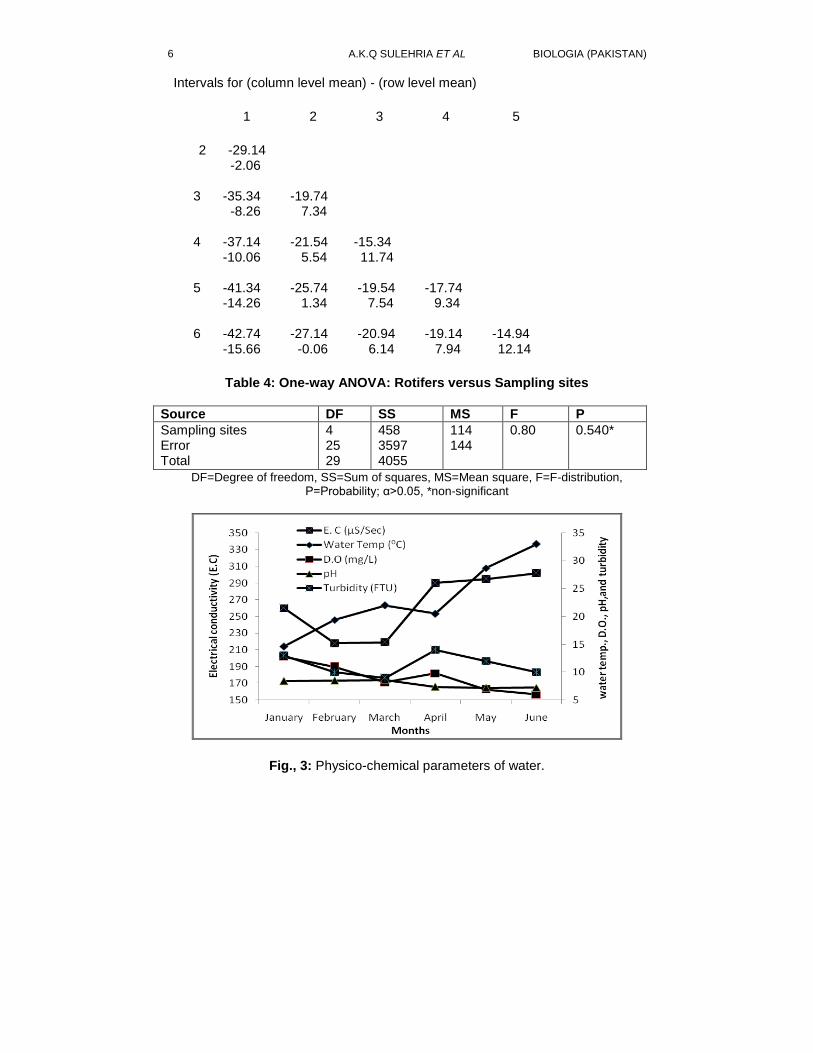
Fig., 3: Physico-chemical parameters of water.
VOL. 58 (1&2) EPIPHYTIC ROTIFERS 7
Taking into consideration the present results (Fig., 3), it is evident that physico-chemical parameters of water had a strong influence on density and diversity of rotifers throughout the period of observation (Siegfrifd et al., 1989, Zarfdjian, et al., 2000, Chittapun et al., 2007). Rotifers are opportunistic organisms and their densities alter with respect to the ecological environment (Allan, 1976).
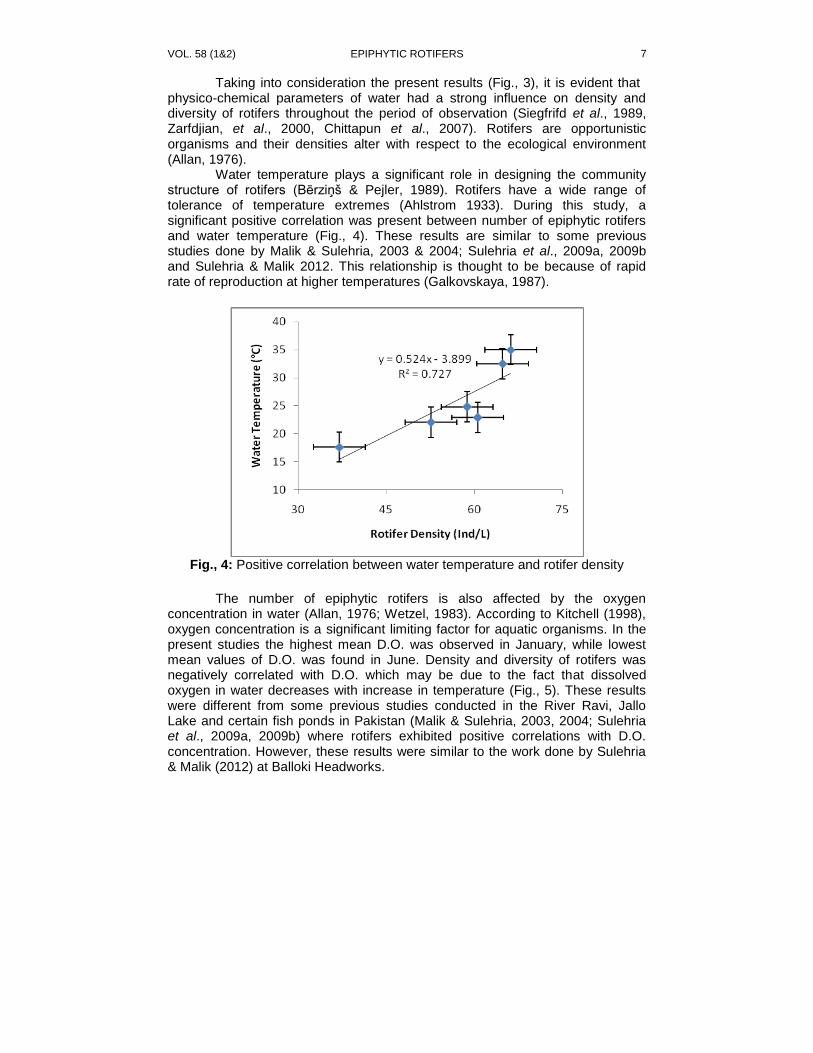
Water temperature plays a significant role in designing the community structure of rotifers (Bērziņš & Pejler, 1989). Rotifers have a wide range of tolerance of temperature extremes (Ahlstrom 1933). During this study, a significant positive correlation was present between number of epiphytic rotifers and water temperature (Fig., 4). These results are similar to some previous studies done by Malik & Sulehria, 2003 & 2004; Sulehria et al., 2009a, 2009b and Sulehria & Malik 2012. This relationship is thought to be because of rapid rate of reproduction at higher temperatures (Galkovskaya, 1987).
Fig., 4: Positive correlation between water temperature and rotifer density
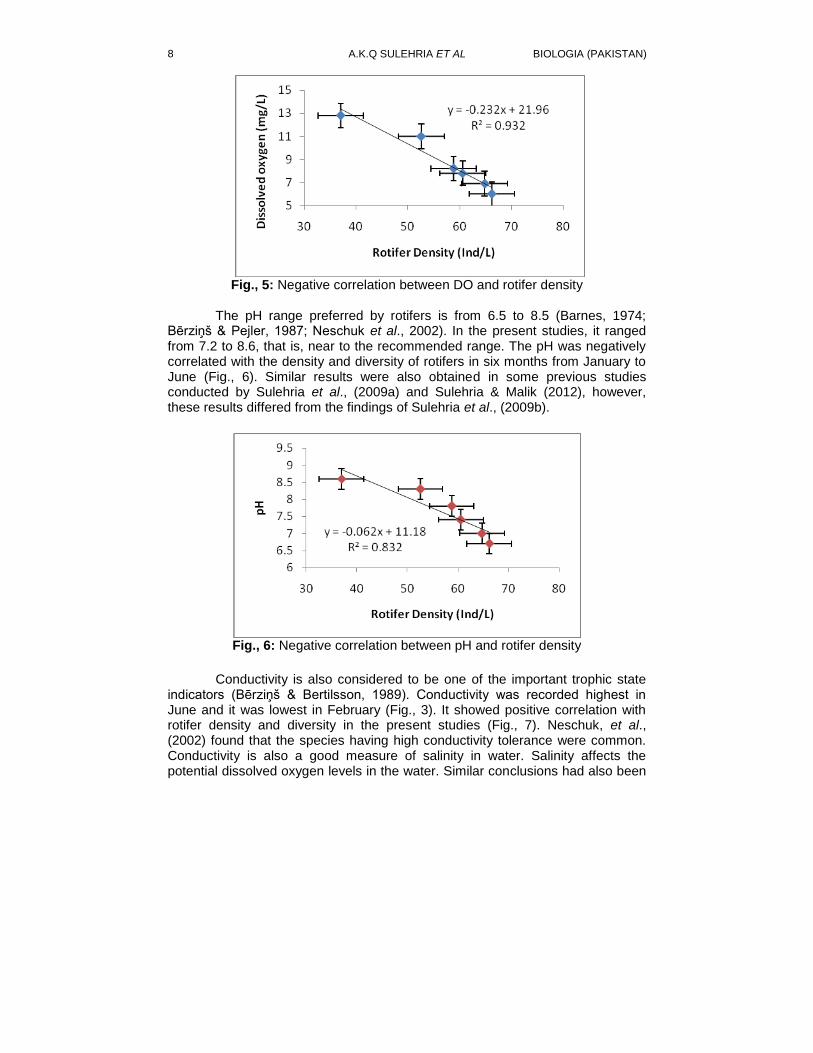
The number of epiphytic rotifers is also affected by the oxygen
concentration in water (Allan, 1976; Wetzel, 1983). According to Kitchell (1998), oxygen concentration is a significant limiting factor for aquatic organisms. In the present studies the highest mean D.O. was observed in January, while lowest mean values of D.O. was found in June. Density and diversity of rotifers was negatively correlated with D.O. which may be due to the fact that dissolved oxygen in water decreases with increase in temperature (Fig., 5). These results were different from some previous studies conducted in the River Ravi, Jallo Lake and certain fish ponds in Pakistan (Malik & Sulehria, 2003, 2004; Sulehria et al., 2009a, 2009b) where rotifers exhibited positive correlations with D.O. concentration. However, these results were similar to the work done by Sulehria & Malik (2012) at Balloki Headworks.
A.K.Q SULEHRIA ET AL BIOLOGIA (PAKISTAN) 8
Fig., 5: Negative correlation between DO and rotifer density
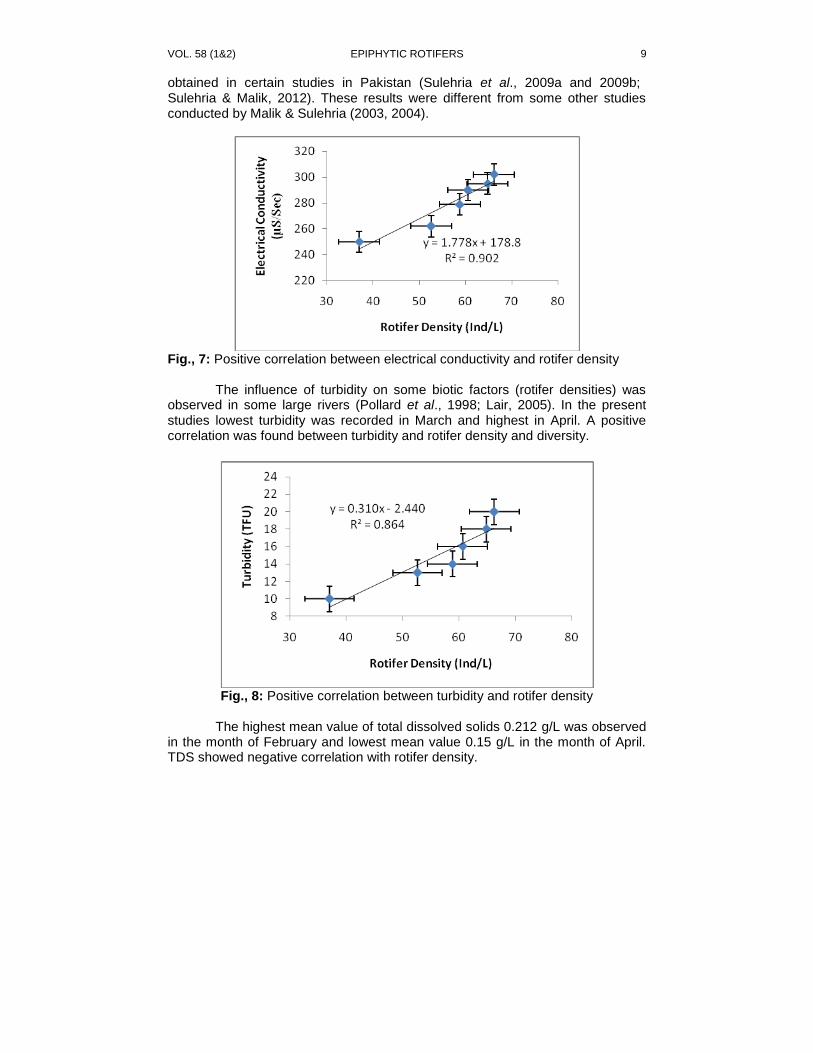
The pH range preferred by rotifers is from 6.5 to 8.5 (Barnes, 1974;
Bērziņš & Pejler, 1987; Neschuk et al., 2002). In the present studies, it ranged from 7.2 to 8.6, that is, near to the recommended range. The pH was negatively correlated with the density and diversity of rotifers in six months from January to June (Fig., 6). Similar results were also obtained in some previous studies conducted by Sulehria et al., (2009a) and Sulehria & Malik (2012), however, these results differed from the findings of Sulehria et al., (2009b).
Fig., 6: Negative correlation between pH and rotifer density
Conductivity is also considered to be one of the important trophic state
indicators (Bērziņš & Bertilsson, 1989). Conductivity was recorded highest in June and it was lowest in February (Fig., 3). It showed positive correlation with rotifer density and diversity in the present studies (Fig., 7). Neschuk, et al., (2002) found that the species having high conductivity tolerance were common. Conductivity is also a good measure of salinity in water. Salinity affects the potential dissolved oxygen levels in the water. Similar conclusions had also been
VOL. 58 (1&2) EPIPHYTIC ROTIFERS 9
obtained in certain studies in Pakistan (Sulehria et al., 2009a and 2009b; Sulehria & Malik, 2012). These results were different from some other studies conducted by Malik & Sulehria (2003, 2004).
Fig., 7: Positive correlation between electrical conductivity and rotifer density
The influence of turbidity on some biotic factors (rotifer densities) was observed in some large rivers (Pollard et al., 1998; Lair, 2005). In the present studies lowest turbidity was recorded in March and highest in April. A positive correlation was found between turbidity and rotifer density and diversity.
Fig., 8: Positive correlation between turbidity and rotifer density
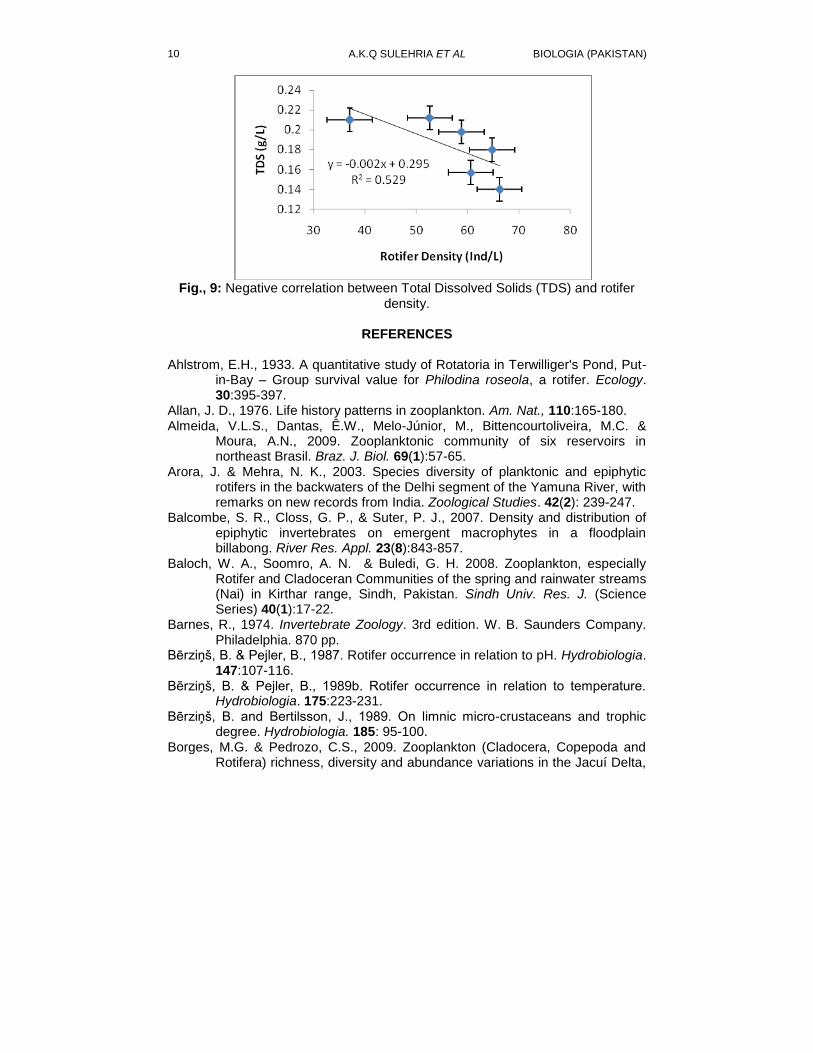
The highest mean value of total dissolved solids 0.212 g/L was observed
in the month of February and lowest mean value 0.15 g/L in the month of April. TDS showed negative correlation with rotifer density.
A.K.Q SULEHRIA ET AL BIOLOGIA (PAKISTAN) 10
Fig., 9: Negative correlation between Total Dissolved Solids (TDS) and rotifer
density.
REFERENCES
Ahlstrom, E.H., 1933. A quantitative study of Rotatoria in Terwilliger's Pond, Put-in-Bay – Group survival value for Philodina roseola, a rotifer. Ecology. 30:395-397.
Allan, J. D., 1976. Life history patterns in zooplankton. Am. Nat., 110:165-180. Almeida, V.L.S., Dantas, Ê.W., Melo-Júnior, M., Bittencourtoliveira, M.C. &
Moura, A.N., 2009. Zooplanktonic community of six reservoirs in northeast Brasil. Braz. J. Biol. 69(1):57-65.
Arora, J. & Mehra, N. K., 2003. Species diversity of planktonic and epiphytic rotifers in the backwaters of the Delhi segment of the Yamuna River, with remarks on new records from India. Zoological Studies. 42(2): 239-247.
Balcombe, S. R., Closs, G. P., & Suter, P. J., 2007. Density and distribution of epiphytic invertebrates on emergent macrophytes in a floodplain billabong. River Res. Appl. 23(8):843-857.
Baloch, W. A., Soomro, A. N. & Buledi, G. H. 2008. Zooplankton, especially Rotifer and Cladoceran Communities of the spring and rainwater streams (Nai) in Kirthar range, Sindh, Pakistan. Sindh Univ. Res. J. (Science Series) 40(1):17-22.
Barnes, R., 1974. Invertebrate Zoology. 3rd edition. W. B. Saunders Company. Philadelphia. 870 pp.
Bērziņš, B. & Pejler, B., 1987. Rotifer occurrence in relation to pH. Hydrobiologia. 147:107-116.
Bērziņš, B. & Pejler, B., 1989b. Rotifer occurrence in relation to temperature. Hydrobiologia. 175:223-231.
Bērziņš, B. and Bertilsson, J., 1989. On limnic micro-crustaceans and trophic degree. Hydrobiologia. 185: 95-100.
Borges, M.G. & Pedrozo, C.S., 2009. Zooplankton (Cladocera, Copepoda and Rotifera) richness, diversity and abundance variations in the Jacuí Delta,
VOL. 58 (1&2) EPIPHYTIC ROTIFERS 11
RS, Brazil, in response to the fluviometric level. Acta Limnol. Bras. 21(1):101-110.
Chittapun, S., Pholpunthin, P. & Segers, H., 2007. Diversity of rotifer fauna from five coastal peat swamps on Phuket Island, Southern Thailand. SouthAsia., 33:383-387.
Galkovskaya, G. A., 1987. Planktonic rotifers and temperature. Hydrobiologia. 147:307-317.
Kitchell, J. E., 1998. Physiological Ecology Tradeoffs for Individuals. pp:164-198. In: S. I. Dodson; F.H. Allen; S.R. Carpenter; A.R. Ives; R.L. Jeanne; J.F. Kichell; N.E. Langston & M.G. Turner (Eds). Ecology. Oxford University Press. 434 pp.
Koste, W., 1978. ROTATORIA. Die Rädertiere Mitteleuropas, begründet von Max Voigt. Überordnung Monogononta. Gebrüder Borntraeger, Berlin, Stuttgart. I. Text U. II. Tafelbd. (T. 234), 673 pp.
Lair, N., 2005. Abiotic vs biotic factors: lessons drawn from rotifers in the Middle Loire, a meandering river monitored from 1995 to 2002, during low flow periods. Hydrobiologia. 546:457-472.
Lansac-Tôha, F. A., Bonecker, C. C., Velho, L. F. M., Simões, N. R., Dias, J. D., Alves, G. M. & Takahashi, E. M., 2009. Biodiversity of zooplankton communities in the Upper Paraná River floodplain: interannual variation from long-term studies. Braz. J. Biol., 69(2, Suppl.): 539-549.
Mahar, M. A., Baloch, W. A. & Jafri, S. I. H., 2000. Diversity and seasonal occurrence of planktonic rotifers in Manchar Lake, Sindh, Pakistan. Pakistan J. Fish. 1(1):25-32.
Malik, M. A. & Sulehria, A. Q. K., 2003. Seasonal variation, density and diversity of planktonic rotifers in Jallo lake. Biologia (Pakistan). 49 (1&2): 77-88.
Malik, M. A. & Sulehria, A. Q. K., 2004. Seasonal variation, density and diversity of planktonic rotifers in the River Ravi. Biologia (Pakistan). 50(1): 5-17.
Martínez, J.C.C., Canesin, A. & Bonecker, C.C., 2000. Species composition of rotifers in different habitats of an artificial lake, MatoGrosso doSul State, Brazil. Acta Sci. 22(2):343-346.
Neschuk N., Claps M. & Gabellone N. 2002. Planktonic rotifers of a saline-lowland river: the Salado River (Argentina). Ann. Limnol.-Int. J. Limnol. 38(3):191-198.
Pennak, R. W., 1978. Fresh-Water Invertebrates of the United States. 2nd Ed, Wiley, New York. 803 pp.
Pollard, A. I., Gonzalez, M. J., Vanni, M. J. & Headworth, J. L., 1998. Effects of turbidity and biotic factors on the rotifer community in an Ohio reservoir. Hydrobiologia. 387/388:215-223.
Schröder, T. and Walsh, E.J., 2007. Cryptic speciation in the cosmopolitan Ephanes senta complex (Monogononta: Rotifera) with the description of new species. Hydrobiologia. 593:129-140.
Segers, H., 1995. Rotifera 2: Lecanidae. 6: 1-226. In: Dumont, H.J. & T. Nogrady (eds.) Guides to identification of the Microinvertebrates of the Continental waters of the world. SPB Academic Publishing, Amsterdam. The Netherlands. 226pp.
A.K.Q SULEHRIA ET AL BIOLOGIA (PAKISTAN) 12
Segers, H., 1995b. A reappraisal of the Scrarididae (Rotifera, Monogononta). Zool. Scr. 24: 91-100.
Segers, H., 2007. Annotated checklist of the rotifers (Phylum Rotifera), with notes on nomenclature, taxonomy and distribution. Zootaxa 1564. 104 pp
Segers, H., 2008. Global diversity of rotifers (Rotifera) in freshwater. Hydrobiologia. 595:49-59.
Segers, H., Nwadiaro, C. S., and Dumont, H. J., 1993a. Rotifera of some lakes in the floodplain of the river Niger (Imo state, Nigeria). II. Faunal composition and diversity. Hydrobiologia. 250: 63-71.
Siegfrifd, A., Jay, A. Bloomfield and James W., Sutherland, 1989. Planktonic rotifer community structure in Adirondack, New York, USA Lakes in relation to acidity, trophic status and related water quality characteristics. Hydrobiologia., 175(1):33-48.
Sulehria, A. Q. K & Malik, M. A., 2012. Population Dynamics of Planktonic Rotifers in Balloki Headworks. Pakistan J. Zool. 44(3):663-669.
Sulehria, A. Q. K., Qamar, M. F., Anjum, R. F., Ejaz, M. & Hussain, A., 2009a. Seasonal fluctuations of Rotifers in a fish pond at District Bahawalnagar, Pakistan. Biologia (Pakistan). 55(1&2):21-28.
Sulehria, A. Q. K., Qamar, M. F., Haider, S., Ejaz, M. & Hussain, A., 2009b. Water quality and Rotifer diversity in the fish pond at District Mianwali Pakistan. Biologia (Pakistan). 55(1&2):79-85.
Wallace, R. L. & Snell, T. W., 2010. Rotifera. Chapter 8. In: Thorp, J.H. and A.P. Covich, eds., Ecology and Classification of North American Freshwater Invertebrates. Elsevier. Oxford. pp. 173-235.
Wallace, R. L., Walsh, E. J, Schröder, T. Rico-Martinez and Rios-Arana, J.V., 2008. Species composition and distribution of rotifers in Chihuahuan Desert waters of Mexico: is everything everywhere? Verhandlungen Internationale Vereiningung Limnologie. 30: 73-76.
Walsh, E.J., Schröder, T. Wallacce, R.L. and Rico-Martinez, R., 2009. Cryptic speciation in Lecane bulla (Monogononta: Rotifera) in Chihuanhuan Desert waters. Verhandlungen Internationale Vereiningung Limnologie. 30:1046-1050.
Ward, H. B. & Whipple, G. C., 1959. W. T. Fresh Water Biology. 2nd
Ed. John Wiley and Sons. New York. 1248 pp.
Wetzel, R. G. 1983. Limnology. 2nd ed., Sanders College Publishing. New York. 753 pp.
Zarfdjian, M.-H., Michaloudi, E., Bobori, D. C. & Mourelatos, S., 2000. Zooplankton abundance in the Aliakmon River, Greece. Belg. J. Zool. 130(1):29-33.
BIOLOGIA (PAKISTAN) 2012, 58 (1&2), 13-19 PK ISSN 0006-3096
*Corresponding author: [email protected]; or [email protected]
Evaluation of resistance against Bifenthrin in dengue vector
from Lahore, Pakistan
NUSRAT JAHAN & AISHA SADIQ
Department of Zoology, GC University Lahore, Pakistan
ABSTRACT
In the current study, the status of resistance in Aedes aegypti was evaluated
against pyrethroids insecticide. The resistance of field collected populations against Bifenthrin 10% EC was compared with the susceptible population. A range of different concentrations (40, 20,10,5 µg/ml) of Bifenthrin was used on susceptible laboratory reared population (reference population) to find the diagnostic dose which is 20 µg /ml. The diagnostic dose was used in two field collected populations i.e.Government Islamia College for Women Cooper Road, Lahore (GICW) and Government College University, Lahore (GCU) during July to September, 2010. Adult female mosquitoes were exposed to CDC bottle bioassays in two field collected populations i.e. GICW & GCU for the evaluation of resistance. Resistance level was expressed as resistance ratio (RR) of lethal time for 50% death determined in field collected and susceptible strain. Results of bioassays indicated that Aedes aegypti field population from GICW Lahore was resistant to Bifenthrin since 100% mortality occurred post 40 minutes exposure as compared to GCU where the same mortality occurred in 30 minutes post exposure. Resistance ratio (RR) also indicated that the population from GICW cooper road Lahore was found resistant (RR LT50 = 1.97 & LT95 = 1.5). Whereas, the field collected population of Aedes aegypti from GCU was found susceptible (RR LT50 = 1.003 & LT95 = 1.06) as compared to
laboratory reared population. Key words: Aedes aegypti, resistance, Bifenthrin, CDC Bioassay.
INTRODUCTION Mosquitoes are the insects that affect the health of humans and domestic
animals worldwide. There are about 3400 species of mosquitoes belonging to 42 genera (Service, 2008). Anopheles, Culex and Aedes are the most important genera due to their role in diseases transmission.
In the last few decades Aedes mosquitoes have gained importance due to spread of DF and DHF. In many areas Ae. aegypti is considered as one of the important primary vector of dengue viruses also known as yellow fever mosquito while Ae. albopictus as secondary vector (Tewari et al., 2004, Wen & Du Liang, 1998). There are many species of Aedes and Culex which are vectors of arboviruses that infect various vertebrates, including humans. Ae. aegypti and Ae. albopictus are important vectors of dengue viruses in South East Asia (Whitehead et al., 1971; Tewari et al., 2004).
In the past, control of mosquitoes has been done by different kinds of chemicals pesticides but most of these chemicals have shown harmful effect on the environment due to long term persistence. These chemicals are also transferred through food chains in the body of living organisms causing biomagnifications. In addition, mosquito vectors are developing resistance against these chemical insecticides which is a major threat to the world for controlling these vectors (Chandre et al., 1999).
14 N. JAHAN & A. SADIQ BIOLOGIA PAKISTAN
Chemical insecticides belonging to different classes were used for the control of mosquito vectors among these organochlorides, organophosphates, carbamates and pyrethroids have been used successfully in the past 2-3 decades. The most successful insecticide used globally for the control of mosquitoes is Pyrethroids (Zaim & Guillet, 2002). Bifenthrin is a pyrethroids and it executes its role by acting on sodium gated channel target site ultimately causing the death of insects (Brown, 2006).
It is important to monitor population of vectors continuously for the susceptibility status of vector against particular insecticide (Brogdon & McAllister, 1998).The current work was aimed to evaluate bifenthrin, for the susceptibility status against dengue vectors from two different populations of Lahore, Pakistan.
MATERIALS AND METHODS
Mosquitoes rearing and maintenance
Wild collected Ae. aegypti were reared in the laboratory of Zoology department GCU according to WHO standard conditions with the temperature 27°C and 80% RH along with a photoperiod of 16:8 (light: dark) hours. Since these mosquitoes were reared in the insectary and not exposed to any insecticide from the last five years, therefore, used as a baseline reference strain in the current experiments for CDC bottle bioassays. Location
The status of resistance was evaluated in the field collected Aedes aegypti against Bifenthrin 10% EC (emulsifiable concentrate) in two different localities Government College University (GCU) and Government Islamia College for Women, Cooper Road Lahore (GICW) from July to September 2010. The distance between the two localities is up to 6-7 km. Surveillance for dengue vector
Surveys were conducted in selected localities for the collection of larvae from natural and artificial containers ( tires, plastic tubs).Larvae after collection were brought to the laboratory for identification where they were kept in the disposable cups. 4
th instar larvae were identified morphologically on the base of
short and thick siphon, black hooks on the thorax region, biforked comb rows on the last abdominal segment in Ae. aegypti while in Ae. albopictus larvae no hooks on the thorax and needle like comb rows in Ae. albopictus are the important features to identify this species of mosquito. The density of Aedes mosquitoes was found 95% as compared Culex which was only 05%. There was no Anopheles in any locality. Insecticide used for the experiment
Bifenthrin 10% EC (emulsifiable concentrate) was kindly provided by Agriculture department Lahore from FMC UNITED (Talstar). Bifenthrin 10% EC contains active ingredient (0.01gm/ ml). The CDC bottle bioassay was used to calculate percent mortalities in the populations collected from the two selected areas.
VOL. 58 (1&2) RESISTANCE AGAINST BIFENTHRIN IN DENGUE VECTOR 15
Experimental Protocol Preliminary test for diagnostic dose
To calculate the diagnostic dose on laboratory reared susceptible population tests were performed using a range of Bifenthrin concentrations 40, 20, 10, 5 µg/ml in acetone.
Diagnostic dose can be defined as an amount of insecticide needed to kill 100% susceptible population within specific time (30 min-1 hr). Tests were performed by coating the reagent bottles with 1 ml of each concentration coated in 250 ml reagent bottles .Three replicates of each concentration were used. The bottles were coated properly from one end to another end and in circular movements. The control was prepared by 1 ml of acetone with three replicates as well. The bottles were labeled properly with the lids off to evaporate the acetone .The day before testing bottles were prepared and left the coated bottles overnight to evaporate the solvent properly. Performance of bottle bioassay
Each coated reagent bottle was used to introduce the twenty unfed female mosquitoes with the help of aspirator, in order to avoid their escape the lids were placed immediately .The same number of females were also introduced in the control bottles before starting the experiment. Digital timer was started to note the time of their mortality. Healthy and Live mosquitoes were used in the experiment. Those which are unable to fly were removed from the experiment. After every 10 minutes their mortality rate was noted for each dose for about 1 hour. Alive and dead mosquitoes were counted and percent mortality was calculated accordingly. With the help of diagnostic dose, evaluation of resistance / susceptibility of field population was determined by the same procedure. Data analysis
Data obtained from all replicates were pooled and analyzed using computer software SPSS for probit regression analysis to estimate the time response against the dosage of exposed mosquito. The experiment was analyzed for the “LT50” (lethal time for 50% death) and “LT95” (lethal time for 95% death) were determined in each group. Resistance ratio for the evaluation of susceptible and resistance level was calculated by applying the formula in which “lethal time for wild strain” was divided by the “lethal time for susceptible strain”.
RESULTS AND DISCUSSION
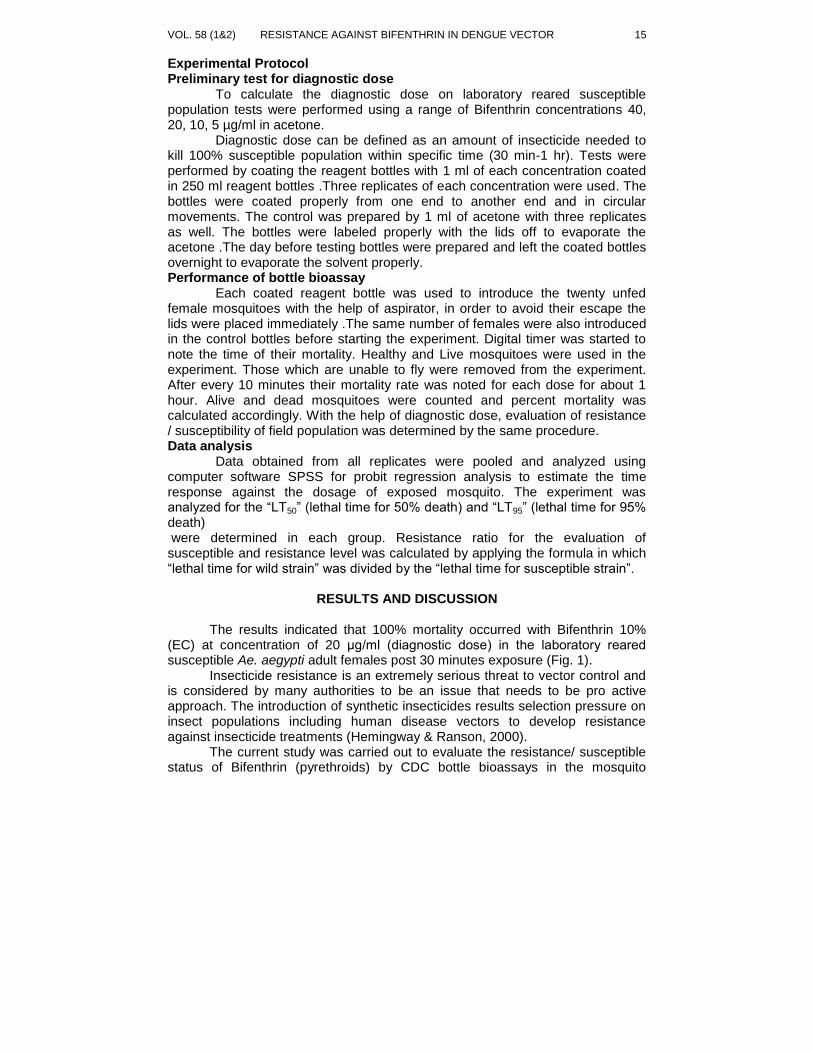
The results indicated that 100% mortality occurred with Bifenthrin 10% (EC) at concentration of 20 μg/ml (diagnostic dose) in the laboratory reared susceptible Ae. aegypti adult females post 30 minutes exposure (Fig. 1).
Insecticide resistance is an extremely serious threat to vector control and is considered by many authorities to be an issue that needs to be pro active approach. The introduction of synthetic insecticides results selection pressure on insect populations including human disease vectors to develop resistance against insecticide treatments (Hemingway & Ranson, 2000).
The current study was carried out to evaluate the resistance/ susceptible status of Bifenthrin (pyrethroids) by CDC bottle bioassays in the mosquito
16 N. JAHAN & A. SADIQ BIOLOGIA PAKISTAN
populations selected from two different localities from Lahore, Pakistan. The population of Ae. aegypti under observation were about 6 km apart from each other indicated difference in susceptibility against insecticide used (Bifenthrin 10% EC). Wild Ae. aegypti population collected from GC University Lahore was found susceptible with respect to laboratory reared Ae. aegypt. Whereas, the population obtained from GICW, Lahore indicated resistance as compared to laboratory reared (susceptible) population of Ae. aegypti. Susceptibility/ resistance status of different mosquito vectors against different insecticides have been reported by CDC bottle bioassays and WHO standard impregnated insecticide test paper (Brogdon & McAllister, 1997; Ahmed et al., 2007). However, in India bifenthrin (0.1%) ME (micro emulsion) was used as bed nets in which 10 mg / m
2 was the susceptible dose against Anopheles and Culicine
mosquitoes. In another report the susceptibility test showed 100% mortality with bifenthrin 0.1 % EM (Batra et al., 2005).
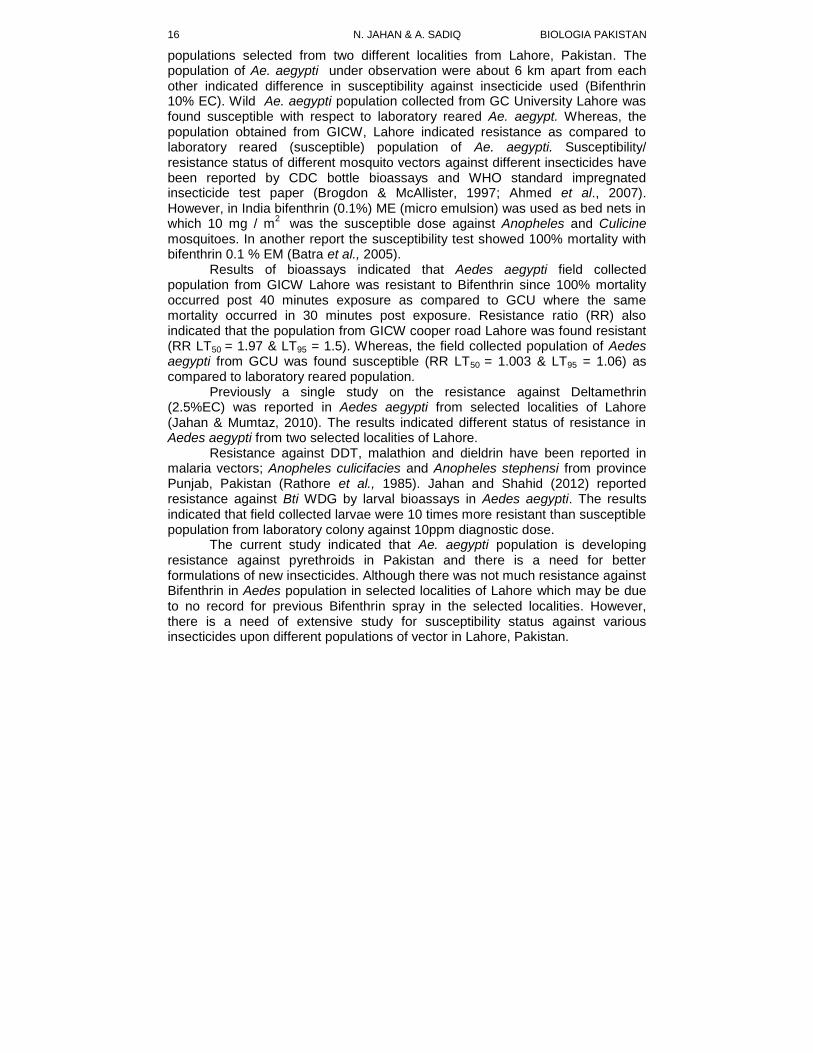
Results of bioassays indicated that Aedes aegypti field collected population from GICW Lahore was resistant to Bifenthrin since 100% mortality occurred post 40 minutes exposure as compared to GCU where the same mortality occurred in 30 minutes post exposure. Resistance ratio (RR) also indicated that the population from GICW cooper road Lahore was found resistant (RR LT50 = 1.97 & LT95 = 1.5). Whereas, the field collected population of Aedes aegypti from GCU was found susceptible (RR LT50 = 1.003 & LT95 = 1.06) as compared to laboratory reared population.
Previously a single study on the resistance against Deltamethrin (2.5%EC) was reported in Aedes aegypti from selected localities of Lahore (Jahan & Mumtaz, 2010). The results indicated different status of resistance in Aedes aegypti from two selected localities of Lahore.
Resistance against DDT, malathion and dieldrin have been reported in malaria vectors; Anopheles culicifacies and Anopheles stephensi from province Punjab, Pakistan (Rathore et al., 1985). Jahan and Shahid (2012) reported resistance against Bti WDG by larval bioassays in Aedes aegypti. The results indicated that field collected larvae were 10 times more resistant than susceptible population from laboratory colony against 10ppm diagnostic dose.
The current study indicated that Ae. aegypti population is developing resistance against pyrethroids in Pakistan and there is a need for better formulations of new insecticides. Although there was not much resistance against Bifenthrin in Aedes population in selected localities of Lahore which may be due to no record for previous Bifenthrin spray in the selected localities. However, there is a need of extensive study for susceptibility status against various insecticides upon different populations of vector in Lahore, Pakistan.
VOL. 58 (1&2) RESISTANCE AGAINST BIFENTHRIN IN DENGUE VECTOR 17
Table 1: Percent mortalities in susceptible (laboratory reared) and field collected populations against diagnostic dose (20 µg/ml) of Bifenthrin 10% EC
Time (min)
*Susceptible population
**Field population GCU
**Field population (cooper road)
Control
% mortality % mortality % mortality % mortality
10 60 65 0 0
20 90 85 65 0
30 100 100 85 0
40 100 100 100 0
50 100 100 100 0
60 100 100 100 0
*Hundred percent mortality in susceptible population in thirty minutes, ** hundred %
mortality in field collected populations (GCU & Cooper road) in thirty and forty minutes respectively
Table 2: Probit regression analysis for LT50 and LT95 of susceptible (laboratory reared) and field collected populations
Lethal time for 50% death
Susceptible population (laboratory reared)
Field collected population (GCU)
Field population (GICW)
RR of field collected population (GCU)
RR of field collected population (GICW)
LT50 10.31 10.3 20.3 1.003 1.97
LT95 20.2 21.5 31.4 1.06 1.5
18 N. JAHAN & A. SADIQ BIOLOGIA PAKISTAN
Fig., 1: Evaluation of diagnostic dose against different concentrations of
Bifenthrin 10% EC as percent mortalities in susceptible (laboratory reared) Ae. aegypti females
Fig., 2: A comparison of susceptible (laboratory reared) and field collected
populations (GCU and Government Islamia Cooper Road College, Lahore) as percent mortalities against diagnostic dose (20µg/ml) of Bifenthrin 10% EC.
VOL. 58 (1&2) RESISTANCE AGAINST BIFENTHRIN IN DENGUE VECTOR 19
REFERENCES
Ahmad, I., Astari, S. & Tan, M., 2007. Resistance of Aedes aegypti (Diptera:Culicidae) in 2006 to pyrethroid insecticides in Indonesia and its association with oxidase and esterase levels. Pakistan J. Biol Sci., 10(20):3688-3692.
Batra, C. P., Raghavendra, K., Adak, T., Singh, O. P., Mittal, P. K., Malhotra, M. S., Sharma, R. S., & Subbaro, S. K., 2005. Evaluation of Bifenthrin treated mosquitoes nets against Anopheline & Culicine mosquitoes. Indian J Med Res., 121: 55-62.
Brogdon, W.G & McAllister, J.C., 1997. Heme peroxidase activity measured in single mosquitoes identifies individuals expressing an elevated oxidase for insecticide resistance. J Am Mosq Control Assoc., 13:233-7.
Brogdon.W.G. & McAllister,J.C., 1998. Insecticide resistance and vector control.Centres for disease control and prevention, Atlanta Georgia USA. Emerg. Infect. Dis., 4 (4): 605-613
Brown, A. E., 2005. Mode of action of insecticide and related pest control chemicals for production Agriculture, oranamentals and turf. Department of entomology. College park. MD 20742. 301: 405-3913.
Chandre, F., Darrier, F. & Manga. L., 1999. Status of pyrethroid resistance in Anopheles gambiae sensu lato. Bull. WHO. 77: 230-234.
Hemingway,J. & Ranson, H., 2000.Insecticide resistance in insect vectors of human disease. Ann Rev Entomol., 45: 371-391.
Jahan, N. & Mumtaz, N., 2010. Evaluation of resistance against Deltamethrin in Aedes mosquitoes from Lahore, Pakistan, Bologia (Pakistan).,56 (1&2): 9-15.
Rathore, H.R., Toqir, G., Rashid, S., Mujtaba, S.M. & Nasir, S.M., 1985. Insecticide Resistance in Anopheline Mosquitoes of Punjab Province, Pakistan. Pak.J.Zool., 17: 35-49.
Service, M.W., 2008. Medical entomology for students. 4th edition. Cambridge
University Press, Cambridge, UK: 306 Tewari, S.C., Munirathinam, A. & Ganjanana, A., 2004. Dengue vector
prevalence and viral infection in a rural area in South India. Trop. Med. Int. Health, 4: 499-507.
Wen, J. & DuLiang, F.F., 1998. An etiological and serological study on dengue epidemic in China. Am J Trop Med Hyg 12: 165-168.
Whitehead, R. H., Yuill, T. M., Gould, D. J. & Phinit, S.,1971. Experimental infections of Aedes aegypti and Aedes albopictus with dengue viruses. Trans R Soc Trop Med Hyg 65:661-667.
Jahan, N & Shahid, A., 2012. Evaluation of resistance against Bacillus thuringiensis israelensis WDG in dengue vector from Lahore, Pakistan. Pakistan J. Zool, 44(4):945-949.
Zaim, M. & Guillet, P., 2002.Alternative insecticides: an urgent need. Trends Parasitol. , 18:161-163.
BIOLOGIA (PAKISTAN) 2012, 58 (1&2), 21-30 PK ISSN 0006 - 3096
*Corresponding author: [email protected]
A survey of ethnobotanically important trees of Central
Punjab, Pakistan
*ARIFA ZEREEN & ZAHEER-UD-DIN KHAN
Department of Botany, GC University, Lahore, Pakistan
ABSTRACT
The present study was carried out to document the ethnobotanical
knowledge of local people on wild trees of eight districts of Central Punjab, viz., Vehari, Pakpattan, Lahore, Faisalabad, Nankana Sahib, Sahiwal, Sialkot and Narowal. Regular field trips were made during 2008-09 and information was gathered by interviewing local people. The plant inventory of 48 plant species belonging to 23 families was constructed, including their utility by indigenous people of respective districts for various purposes, i.e., medicine, fodder, fuel, vegetables, fruits, timber, etc. Phenological behavior of plants was observed either from February to June or July to January but some trees (4.2 %) were found to flower throughout the year. Key words: Ethnobotany, Trees, Medicinal plants, Central Punjab.
INTRODUCTION
The second largest province of Pakistan is Punjab comprising 205,344
km2 area, next to Baluchistan and is located between latitudes 27.42º and 34.02º
N and longitudes 69.81º and 75.23º E at the northwestern edge of the geological Indian plate in South Asia. Punjab, etymologically it is the land of five rivers namely the Sutlej, Ravi, Chenab, Jhelum and the Indus (Govt. of Punjab, 1994). Four out of these five rivers are the tributaries of the Mighty Indus River. The province comprises fertile river valleys, while sparse sandy deserts are found as extensions of Rajasthan desert (India) and the Sulaiman Range (Pakistan), including the Cholistan and Thal deserts. The Indus River and its tributaries pass through the Punjab from North to South. The landscape is largely irrigated with a network of canals all over the province. Intensity of the weather is noticeable from hot and infertile southern region to cool Himalayan Mountains in the North. The variation in temperature and rain fall occur throughout the year, however, the temperature hardly exceeds the limit of 46ºC according to metrological records. All soil types, i.e., sandy, clay and loamy are found in the province (Ahmad, 1986). The population of the province has been estimated as 70 million by the Punjab-World Gazetteer (2009) and about half of the population of Pakistan is owned by Punjab consisting of diverse tribes and communities, sometimes known as castes. Punjabi is the common language of Punjab.
The science of ethnobotany, i.e., the relationship between people and plants has made tremendous progress in recent decades and now the trend is shifting from mere documentation of the indigenous knowledge to conservation
A. ZEREEN & Z. KHAN BIOLOGIA (PAKISTAN) 22
and sustainable usage of plant resources as well. Man has had close contact with plants for his survival since prehistoric time. Plants both cultivated and natural perform a vital role in the lives of rural people particularly in developing countries. The main usages of plants include: sources of food, vegetables, fruits, beverages, drinks, spices, condiments, etc. (Schutles, 1992).
Plants are also used as: insecticidal to protect the crops, wood for making implements, utensils, tools, musical instruments, boats, oars and other household goods; cordage, commercial plants, crude drugs, packaging material, agricultural implements, fuel, for religious ceremonies and ornamentation (Shah, 2005). Plants have always been centrally important for the wellbeing of human beings and will always remain so. Plants are primary producers, forming the base of food webs and support almost all other forms of life. Information, foresight and practices of local people can play their role through applied ethnobotany to identify and find solutions to the problems of sustainable development and conservation of plants (Hamilton et al., 2003).
In Pakistan the discipline of ethnobotany is at preliminary stage. Ahmad (2007) conducted ethnobotanical and ethnomedicinal study of Lahore- Islamabad motorway (M-2) and recorded 81 plant species belonging to 44 families, having medicinal value. Jan et al. (2011) gathered some ethnobotanical information on 62 plant species of Dir Kohistan Valleys. These plants were found in use by local people as medicines and for other purposes. Ahmad et al. (2010) enlisted 62 grass species that were ethnobotanically important in Salt Range area of Northern Pakistan. Khan (2009) and Ajaib et al. (2010) discussed the importance of plant species having ethnoveterinary uses in Cholistan desert of Pakistan. Sardar & Khan (2009) conducted an ethnobotanical study on flora of Tehsil Shakargarh, District Narowal, Pakistan and the indigenous knowledge of local people on 102 plant species of 62 families was documented.
MATERIALS AND METHODS
The data was collected by regular visits to the study area, comprising
eight districts of central Punjab, during the year 2008-09. The ethnobotanical uses were documented by interviewing the local people including common plant collectors, herbal practitioners/Hakims, etc. A semi structured questionnaire was used for interviewing people to collect ethnobotanical information. It was crosschecked with existing literature on ethnobotany. The plant species were collected, pressed and identified with the help of Flora of Pakistan (Nasir & Ali, 1970-1989; Ali & Nasir, 1990-1992; Nasir & Rafiq, 1995; Ali & Qaisar, 1992-2010).
RESULTS AND DISCUSSION
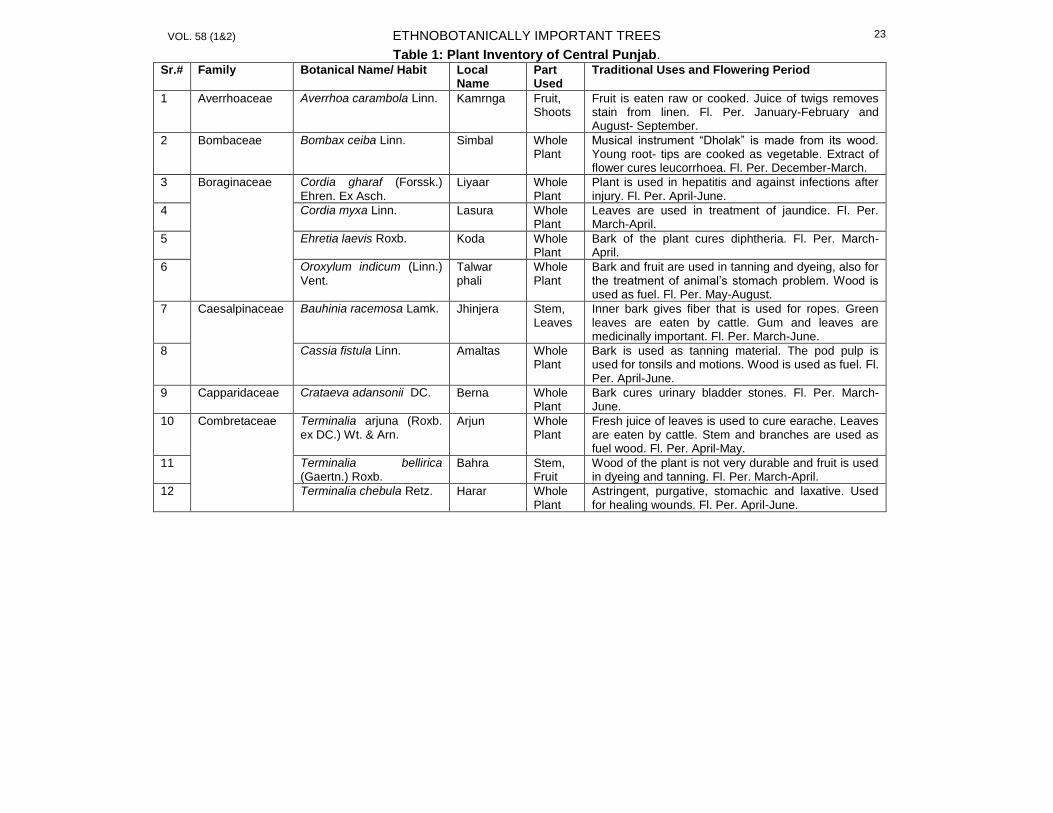
The data collected was arranged in alphabetical order of family name, botanical name, local name, part used, traditional uses with flowering period (Table:1).
VOL. 58 (1&2) ETHNOBOTANICALLY IMPORTANT TREES
23
Table 1: Plant Inventory of Central Punjab. Sr.# Family Botanical Name/ Habit Local
Name Part Used
Traditional Uses and Flowering Period
1 Averrhoaceae Averrhoa carambola Linn. Kamrnga Fruit, Shoots
Fruit is eaten raw or cooked. Juice of twigs removes stain from linen. Fl. Per. January-February and August- September.
2 Bombaceae Bombax ceiba Linn. Simbal Whole Plant
Musical instrument “Dholak” is made from its wood. Young root- tips are cooked as vegetable. Extract of flower cures leucorrhoea. Fl. Per. December-March.
3 Boraginaceae Cordia gharaf (Forssk.)
Ehren. Ex Asch. Liyaar
Whole Plant
Plant is used in hepatitis and against infections after injury. Fl. Per. April-June.
4 Cordia myxa Linn. Lasura Whole Plant
Leaves are used in treatment of jaundice. Fl. Per. March-April.
5 Ehretia laevis Roxb. Koda Whole Plant
Bark of the plant cures diphtheria. Fl. Per. March-April.
6 Oroxylum indicum (Linn.)
Vent. Talwar phali
Whole Plant
Bark and fruit are used in tanning and dyeing, also for the treatment of animal’s stomach problem. Wood is used as fuel. Fl. Per. May-August.
7 Caesalpinaceae Bauhinia racemosa Lamk. Jhinjera Stem, Leaves
Inner bark gives fiber that is used for ropes. Green leaves are eaten by cattle. Gum and leaves are medicinally important. Fl. Per. March-June.
8 Cassia fistula Linn.
Amaltas
Whole Plant
Bark is used as tanning material. The pod pulp is used for tonsils and motions. Wood is used as fuel. Fl. Per. April-June.
9 Capparidaceae Crataeva adansonii DC. Berna Whole Plant
Bark cures urinary bladder stones. Fl. Per. March-June.
10 Combretaceae
Terminalia arjuna (Roxb. ex DC.) Wt. & Arn.
Arjun
Whole Plant
Fresh juice of leaves is used to cure earache. Leaves are eaten by cattle. Stem and branches are used as fuel wood. Fl. Per. April-May.
11 Terminalia bellirica (Gaertn.) Roxb.
Bahra Stem, Fruit
Wood of the plant is not very durable and fruit is used in dyeing and tanning. Fl. Per. March-April.
12 Terminalia chebula Retz. Harar Whole Plant
Astringent, purgative, stomachic and laxative. Used for healing wounds. Fl. Per. April-June.
A. ZEREEN & Z. KHAN BIOLOGIA (PAKISTAN) 24
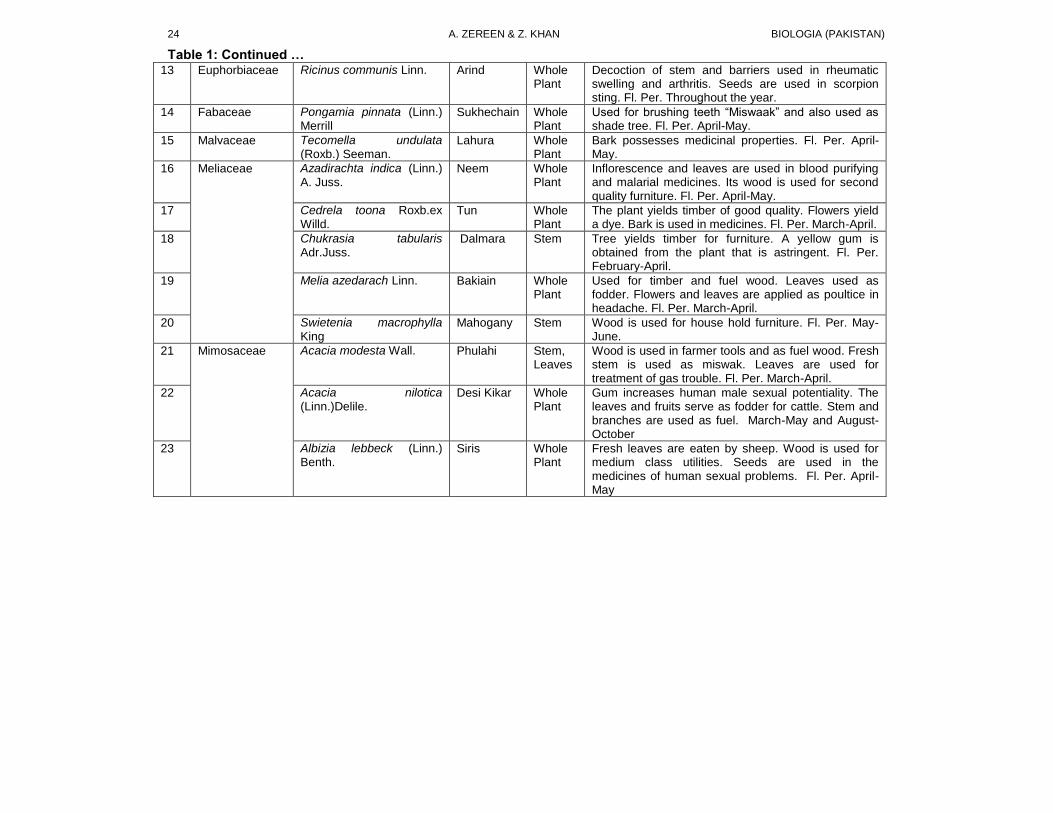
Table 1: Continued … 13 Euphorbiaceae Ricinus communis Linn. Arind Whole
Plant
Decoction of stem and barriers used in rheumatic swelling and arthritis. Seeds are used in scorpion sting. Fl. Per. Throughout the year.
14 Fabaceae Pongamia pinnata (Linn.) Merrill
Sukhechain Whole Plant
Used for brushing teeth “Miswaak” and also used as shade tree. Fl. Per. April-May.
15 Malvaceae Tecomella undulata (Roxb.) Seeman.
Lahura Whole Plant
Bark possesses medicinal properties. Fl. Per. April-May.
16 Meliaceae Azadirachta indica (Linn.) A. Juss.
Neem Whole Plant
Inflorescence and leaves are used in blood purifying and malarial medicines. Its wood is used for second quality furniture. Fl. Per. April-May.
17 Cedrela toona Roxb.ex Willd.
Tun
Whole Plant
The plant yields timber of good quality. Flowers yield a dye. Bark is used in medicines. Fl. Per. March-April.
18 Chukrasia tabularis Adr.Juss.
Dalmara Stem
Tree yields timber for furniture. A yellow gum is obtained from the plant that is astringent. Fl. Per. February-April.
19 Melia azedarach Linn. Bakiain Whole Plant
Used for timber and fuel wood. Leaves used as fodder. Flowers and leaves are applied as poultice in headache. Fl. Per. March-April.
20 Swietenia macrophylla King
Mahogany Stem
Wood is used for house hold furniture. Fl. Per. May-June.
21 Mimosaceae
Acacia modesta Wall. Phulahi
Stem, Leaves
Wood is used in farmer tools and as fuel wood. Fresh stem is used as miswak. Leaves are used for treatment of gas trouble. Fl. Per. March-April.
22 Acacia nilotica (Linn.)Delile.
Desi Kikar Whole Plant
Gum increases human male sexual potentiality. The leaves and fruits serve as fodder for cattle. Stem and branches are used as fuel. March-May and August-October
23 Albizia lebbeck (Linn.) Benth.
Siris Whole Plant
Fresh leaves are eaten by sheep. Wood is used for medium class utilities. Seeds are used in the medicines of human sexual problems. Fl. Per. April-May
VOL. 58 (1&2) ETHNOBOTANICALLY IMPORTANT TREES
25
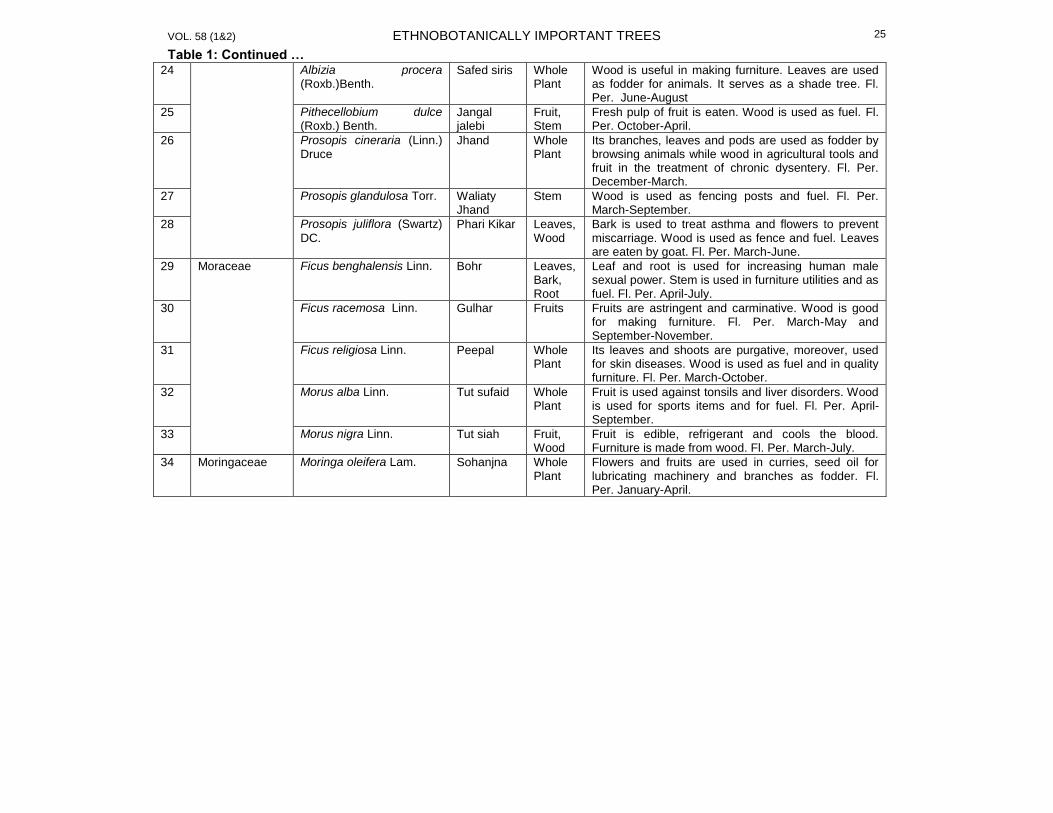
Table 1: Continued … 24 Albizia procera
(Roxb.)Benth. Safed siris Whole
Plant Wood is useful in making furniture. Leaves are used as fodder for animals. It serves as a shade tree. Fl. Per. June-August
25 Pithecellobium dulce (Roxb.) Benth.
Jangal jalebi
Fruit, Stem
Fresh pulp of fruit is eaten. Wood is used as fuel. Fl. Per. October-April.
26 Prosopis cineraria (Linn.) Druce
Jhand Whole Plant
Its branches, leaves and pods are used as fodder by browsing animals while wood in agricultural tools and fruit in the treatment of chronic dysentery. Fl. Per. December-March.
27 Prosopis glandulosa Torr. Waliaty Jhand
Stem Wood is used as fencing posts and fuel. Fl. Per. March-September.
28 Prosopis juliflora (Swartz)
DC. Phari Kikar Leaves,
Wood Bark is used to treat asthma and flowers to prevent miscarriage. Wood is used as fence and fuel. Leaves are eaten by goat. Fl. Per. March-June.
29 Moraceae Ficus benghalensis Linn. Bohr Leaves, Bark, Root
Leaf and root is used for increasing human male sexual power. Stem is used in furniture utilities and as fuel. Fl. Per. April-July.
30 Ficus racemosa Linn. Gulhar Fruits Fruits are astringent and carminative. Wood is good for making furniture. Fl. Per. March-May and September-November.
31 Ficus religiosa Linn. Peepal Whole Plant
Its leaves and shoots are purgative, moreover, used for skin diseases. Wood is used as fuel and in quality furniture. Fl. Per. March-October.
32 Morus alba Linn. Tut sufaid Whole Plant
Fruit is used against tonsils and liver disorders. Wood is used for sports items and for fuel. Fl. Per. April-September.
33 Morus nigra Linn. Tut siah
Fruit, Wood
Fruit is edible, refrigerant and cools the blood. Furniture is made from wood. Fl. Per. March-July.
34 Moringaceae Moringa oleifera Lam. Sohanjna Whole Plant
Flowers and fruits are used in curries, seed oil for lubricating machinery and branches as fodder. Fl. Per. January-April.
A. ZEREEN & Z. KHAN BIOLOGIA (PAKISTAN) 26
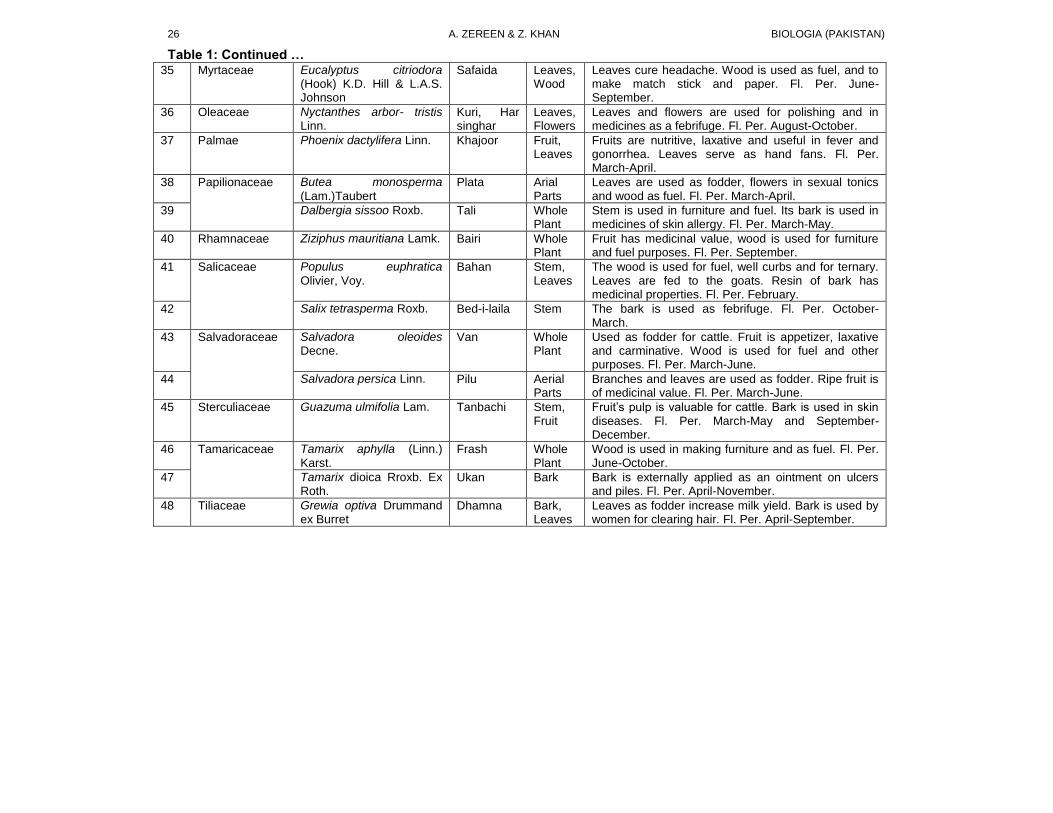
Table 1: Continued … 35 Myrtaceae Eucalyptus citriodora
(Hook) K.D. Hill & L.A.S. Johnson
Safaida
Leaves, Wood
Leaves cure headache. Wood is used as fuel, and to make match stick and paper. Fl. Per. June-September.
36 Oleaceae Nyctanthes arbor- tristis Linn.
Kuri, Har singhar
Leaves, Flowers
Leaves and flowers are used for polishing and in medicines as a febrifuge. Fl. Per. August-October.
37 Palmae Phoenix dactylifera Linn. Khajoor
Fruit, Leaves
Fruits are nutritive, laxative and useful in fever and gonorrhea. Leaves serve as hand fans. Fl. Per. March-April.
38 Papilionaceae Butea monosperma
(Lam.)Taubert Plata Arial
Parts Leaves are used as fodder, flowers in sexual tonics and wood as fuel. Fl. Per. March-April.
39 Dalbergia sissoo Roxb. Tali Whole Plant
Stem is used in furniture and fuel. Its bark is used in medicines of skin allergy. Fl. Per. March-May.
40 Rhamnaceae Ziziphus mauritiana Lamk. Bairi
Whole Plant
Fruit has medicinal value, wood is used for furniture and fuel purposes. Fl. Per. September.
41 Salicaceae
Populus euphratica
Olivier, Voy. Bahan Stem,
Leaves
The wood is used for fuel, well curbs and for ternary. Leaves are fed to the goats. Resin of bark has medicinal properties. Fl. Per. February.
42 Salix tetrasperma Roxb. Bed-i-laila Stem
The bark is used as febrifuge. Fl. Per. October- March.
43 Salvadoraceae Salvadora oleoides Decne.
Van Whole Plant
Used as fodder for cattle. Fruit is appetizer, laxative and carminative. Wood is used for fuel and other purposes. Fl. Per. March-June.
44 Salvadora persica Linn. Pilu
Aerial Parts
Branches and leaves are used as fodder. Ripe fruit is of medicinal value. Fl. Per. March-June.
45 Sterculiaceae
Guazuma ulmifolia Lam. Tanbachi Stem, Fruit
Fruit’s pulp is valuable for cattle. Bark is used in skin diseases. Fl. Per. March-May and September-December.
46 Tamaricaceae Tamarix aphylla (Linn.)
Karst. Frash Whole
Plant Wood is used in making furniture and as fuel. Fl. Per. June-October.
47 Tamarix dioica Rroxb. Ex Roth.
Ukan Bark Bark is externally applied as an ointment on ulcers and piles. Fl. Per. April-November.
48 Tiliaceae Grewia optiva Drummand ex Burret
Dhamna Bark, Leaves
Leaves as fodder increase milk yield. Bark is used by women for clearing hair. Fl. Per. April-September.
VOL. 58 (1&2) ETHNOBOTANICALLY IMPORTANT TREES
27
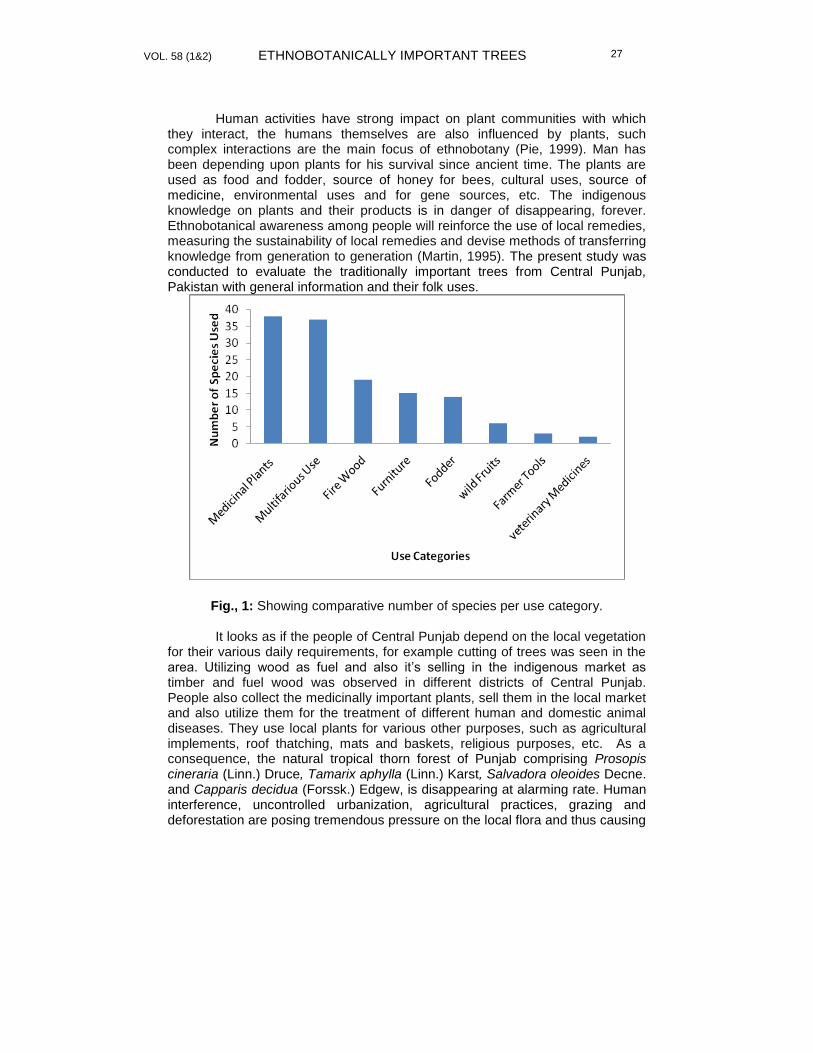
Human activities have strong impact on plant communities with which they interact, the humans themselves are also influenced by plants, such complex interactions are the main focus of ethnobotany (Pie, 1999). Man has been depending upon plants for his survival since ancient time. The plants are used as food and fodder, source of honey for bees, cultural uses, source of medicine, environmental uses and for gene sources, etc. The indigenous knowledge on plants and their products is in danger of disappearing, forever. Ethnobotanical awareness among people will reinforce the use of local remedies, measuring the sustainability of local remedies and devise methods of transferring knowledge from generation to generation (Martin, 1995). The present study was conducted to evaluate the traditionally important trees from Central Punjab, Pakistan with general information and their folk uses.
Fig., 1: Showing comparative number of species per use category.
It looks as if the people of Central Punjab depend on the local vegetation for their various daily requirements, for example cutting of trees was seen in the area. Utilizing wood as fuel and also it’s selling in the indigenous market as timber and fuel wood was observed in different districts of Central Punjab. People also collect the medicinally important plants, sell them in the local market and also utilize them for the treatment of different human and domestic animal diseases. They use local plants for various other purposes, such as agricultural implements, roof thatching, mats and baskets, religious purposes, etc. As a consequence, the natural tropical thorn forest of Punjab comprising Prosopis cineraria (Linn.) Druce, Tamarix aphylla (Linn.) Karst, Salvadora oleoides Decne. and Capparis decidua (Forssk.) Edgew, is disappearing at alarming rate. Human interference, uncontrolled urbanization, agricultural practices, grazing and deforestation are posing tremendous pressure on the local flora and thus causing
A. ZEREEN & Z. KHAN BIOLOGIA (PAKISTAN) 28
environmental deterioration. During ethnobotanical studies of the Central Punjab, a total of 48 species belonging to 23 families were documented. A range of parts of these plants were found in use e.g., roots (01 species), shoots (12 species), flowers (01 species), fruit (07 species), wood (16 species) and whole plants (26 species), for various purposes. Most of the species are reported to have multipurpose uses by the inhabitants of the respective areas e.g., Acacia modesta, Acacia nilotica and Albizia lebbeck. These plants were reported in use by the local inhabitants for medicinal purposes (38 species), fodder (14 species), wild fruits (06 species), multifarious use (37 species), veterinary medicines (02 species), fire wood (19 species), farmer tools (03 species), furniture (15 species), etc. (Fig.1).
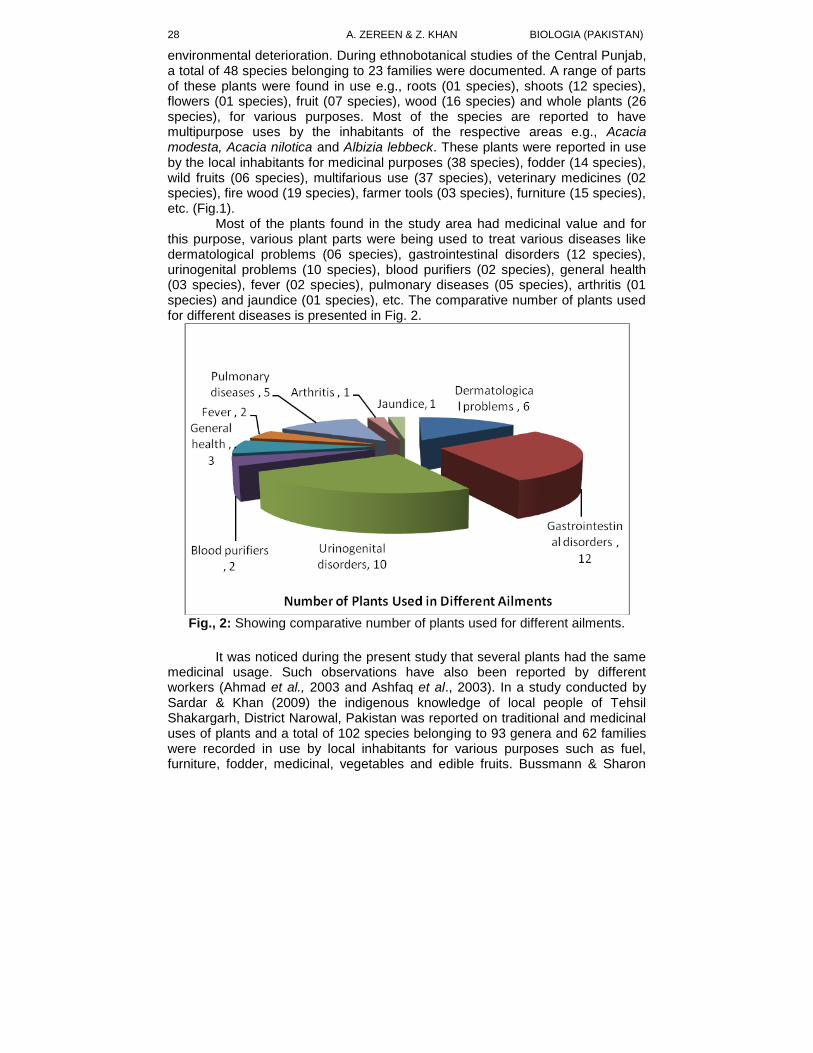
Most of the plants found in the study area had medicinal value and for this purpose, various plant parts were being used to treat various diseases like dermatological problems (06 species), gastrointestinal disorders (12 species), urinogenital problems (10 species), blood purifiers (02 species), general health (03 species), fever (02 species), pulmonary diseases (05 species), arthritis (01 species) and jaundice (01 species), etc. The comparative number of plants used for different diseases is presented in Fig. 2.
Fig., 2: Showing comparative number of plants used for different ailments.
It was noticed during the present study that several plants had the same
medicinal usage. Such observations have also been reported by different workers (Ahmad et al., 2003 and Ashfaq et al., 2003). In a study conducted by Sardar & Khan (2009) the indigenous knowledge of local people of Tehsil Shakargarh, District Narowal, Pakistan was reported on traditional and medicinal uses of plants and a total of 102 species belonging to 93 genera and 62 families were recorded in use by local inhabitants for various purposes such as fuel, furniture, fodder, medicinal, vegetables and edible fruits. Bussmann & Sharon
VOL. 58 (1&2) ETHNOBOTANICALLY IMPORTANT TREES
29
(2006) studied the use of medicinal plants in North Peru and about 510 plant species belonging to 250 genera and 126 families were collected that were found in use for medicinal purposes. Uprety et al. (2012) published the traditional uses of medicinal plants in the boreal forest of Canada and also suggested the future research perspectives. Mahmood & Shah (2012) conducted an ethnomedicinal survey to collect data from traditional healers about the use of medicinal plants in Poonch, District of Jammu and Kashmir. A total of 65 species distributed across 32 families were recorded in use to cure various diseases.
REFERENCES
Ahmad, F., Khan, M. A., Ahmad, M., Zafar, M., Mahmood, T., Jabeen, A. &
Marwat, S.K., 2010. Ethnomedicinal uses of grasses in Salt Range Region of Northern Pakistan. J. of Med. Plants Res., 4(5): 362-369.
Ahmad, M., 1986. Soils of Pakistan. In: Proc. xii international forum on soil taxnonomy and agrotechnology technology transfer. Soil Survey of Pakistan, Lahore. I: 58-73.
Ahmad, S.S., 2007. Medicinal wild plants knowledge from Lahore- Islambad Motorway, (M-2). Pak. J. Bot., 39(2): 355- 377.
Ahmad, M., Khan, M.A. & Qureshi, R.A., 2003. Ethnobotanical study of some cultivated plants of Chhuchh Region (District Attock). Hamdard Medicus., 46(3): 15-19.
Ajaib, M., Khan, Z., Khan, N. & Wahab, M., 2010. Ethnobotanical studies on useful shrubs of District Kotli, Azad Jammu & Kashmir, Pakistan. Pak. J. Bot., 42(3): 1407-1415.
Ali, S.I. & Qaisar, M., 1992-2010. Flora of Pakistan. Department of Botany, University of Karachi and National Herbarium, PARC, Islamabad. Nos. 194-208.
Ali, S.I. & Nasir, Y.J., 1990-92. Flora of Pakistan. Department of Botany, University of Karachi and National Herbarium, PARC, Islamabad. Nos. 191-193.
Ashfaq, S., Ahmad, M. & Arshad, M., 2003. Ethnomedicinal observations of medicinally important plants of Tehsil Fateh Jang, District Attock. Pak. J. Arid. Agric., 7(1): 25-33.
Bussmann, R.W. & Sharon, D., 2006. Traditional plant use in Northern Peru: Tracking two thousand years of health culture. J. Ethnobiol.& Ethnomed., 2: 47.
Government of Pakistan., 1994. Declaration of some wilderness areas as national parks in northern areas, Islamabad. Kashmir Affairs and Northern Areas Affairs Division, pp. 30-32.
Hamilton, A.C., Pie, S.J., Kessey, A.A., Khan, S., Lagos, W. & Shinwari, Z.K., 2003. The purpose and teaching of applied ethnobotany. People and Plants Working Paper, pp. 1- 76.
Jan, G., Khan, M.A., Farhatullah., Jan, F.G., Ahmad, M., Jan, M. & Zafar, M., 2011. Ethnobotanical studies on some useful plants of Dir Kohistan Valleys, KPK, Pakistan. Pak. J. Bot., 43(4): 1849-1852.
A. ZEREEN & Z. KHAN BIOLOGIA (PAKISTAN) 30
Khan, F.M., 2009. Ethno- veterinary medicinal usage of Flora of Greater Cholistan Desert (Pakistan). Pak. Vet. J., 29 (2): 75-80.
Mahmood, T. & Shah, A., 2012. Medicinal plants used by traditional healers in Poonch District of Jammu and Kashmir. J. Life Sci. Leaflets, 5: 53-60. ISS
Martin, G. J., 1995. Ethnobotany: A Methods manual. Chapman and Hall. London.
Nasir, E. & Ali, S.I., 1970- 1989. Flora of Pakistan. National Herbarium, PARC, Islamabad and Department of Botany, University of Karachi, Karachi, Pakistan. Nos. 1- 190.
Nasir, Y.J., & Rafiq, A.R., 1995. Wild flowers of Pakistan. Oxford University Press, Karachi, Pakistan.
Pie, S.J., 1999. Ethnobotany and sustainable use of plant resource in HKH mountain region. Planning workshop on ethnobotany and its application to conservation and community development in Hindukush Himalayan region, Nepal. Biol. Conser., 63(3): 205-210.
Punjab-World Gazetteer.2009. Govt. of Punjab. Sardar, A.A. & Khan, Z., 2009. Ethnomedicinal studies on plant resources of
Tehsil Shakargrah, District Narowal, Pakistan. Pak. J. Bot., 41(1): 11-18.
Schultes, R.E., 1992. Ethnobotany and technology in the Northwest Amazon: A Partnership In: Sustainable harvest and marketing of rain forest products. Plotkin and Famolare (Eds.), Island Press, C.A, 45- 76.
Shah, N.C., 2005. Ethnobotany and indigenous knowledge in India Context. Ethnobot., 17 (1& 2): 64-70.
Uprety, Y., Asselin, H., Dhakal, D. & Julien, N., 2012. Traditional use of medicinal plants in the boreal forest of Canada: Review and perspectives. J. Ethnobiol. & Ethnomed., 8:7.
BIOLOGIA (PAKISTAN) 2012, 58 (1&2), 31-39 PK ISSN 0006 - 3096
*Corresponding author: [email protected]
Current status of fisheries in the Mangla Reservoir,
Pakistan
*ZAHID SHARIF MIRZA1, MUHAMMAD SAJID NADEEM
2, MIRZA AZHAR
BEG3, ABDUL QAYYUM KHAN SULEHRIA
4, SYED ISRAR SHAH
5
1Fisheries Research & Training Institute, P.O. Batapur , Lahore, Pakistan.
2,3,5Department of Zoology, PMAS Arid Agriculture University, Rawalpindi, Pakistan
4 Department of Zoology, GC University, Lahore, Pakistan
ABSTRACT
The present study was conducted to assess the current status of fisheries in the
Mangla Reservoir based on the seasonal variation in species composition and annual catches. Data on commercial catch was obtained by stratified random sampling at two landing sites in the reservoir from Jan 2009 to Dec 2010. Catch rate and effort estimates from the landing sites were used to estimate the total catch. The data obtained was tabulated and summarized in different groups based on the percentage of each species in the landing. The results showed that the total commercial fish production from the reservoir during the two years varied widely with average total catch of 441.26 mt. The catches for the year 2010 were 130 mt higher as compared with the catches during the previous year. The four commercial fishes (Cyprinus carpio, Gibelion catla, Sperata sarwari and Wallago attu) contributed 83.4 per cent (52.0 percent by Cyprinids + 31.4
percent by Silurids) of the average catch for the two years. Amongst catch of four commercial fishes, the two Cyprinids contributed 62 percent and the rest was added by two Silurids. On the whole the contribution of the exotic fishes in total catches was 24.08 mt (5.46 per cent). The results further show that during the months when the water level is near the dead supply level, there is a trend of increasing by catch and tilapia. During January 2009, highest quantities of tilapia (2.79 mt) were recorded from the catches. Keywords: Commercial fishes, Mangla Dam, Cyprinids, Silurids
INTRODUCTION Anicuts across the major rivers have existed in Indian subcontinent for
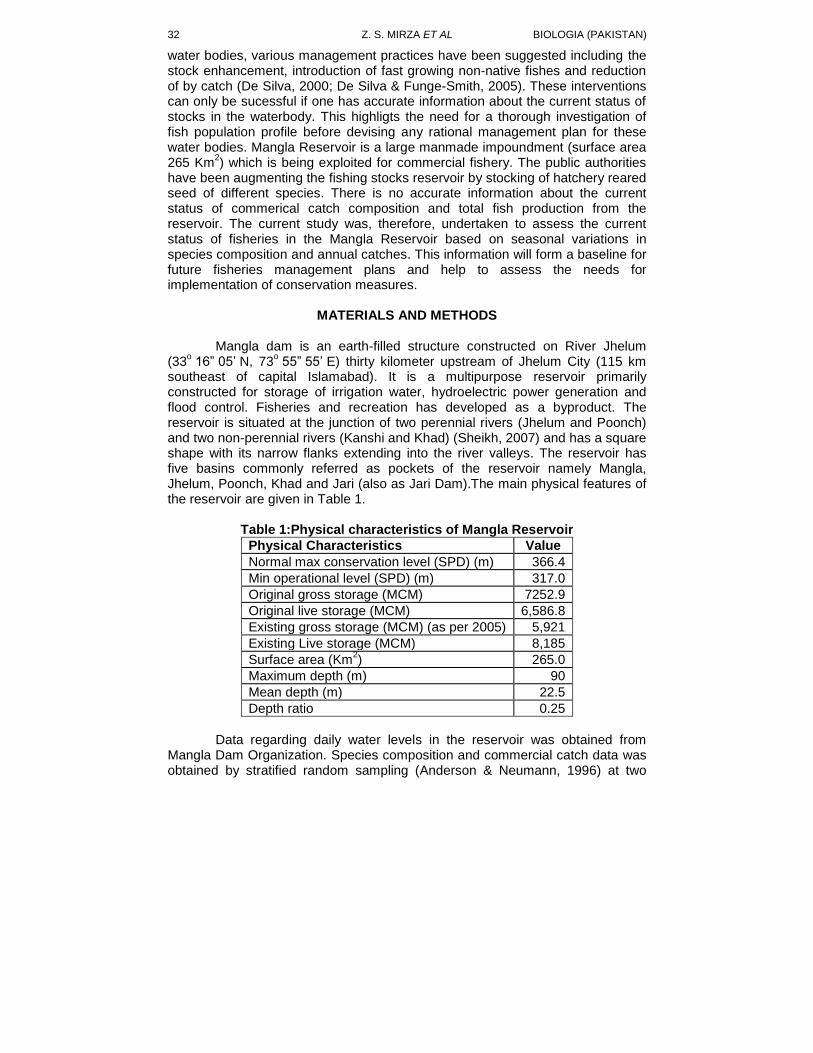
several centuries (Panikkar, 1955). These human engineered aquatic habitats were traditionally utilized for water conservation to use for domestic consumption, irrigation and fish culture (Petrere Jr, 1996). In the recent era, a large number of manmade reservoirs have been created by damming the major rivers. These impoundments are complex ecosystems having the characteristics of riverine as well as lacustrine environments (Margalef, 1975; Tundisi, 1996). The important features of a reservoir are watershed pattern, morphometry, and hydrological cycle which determine the productivity levels of these water bodies (Burford et al., 2007). An important feature of large reservoirs is formation of longitudinal gradient of different zones characterized by their physico-chemical as well other limnological characterstics (Serafim et al., 2006; Sthapit et al., 2008; Tundisi & Straskraba, 1999) harboring their own distinct biota (Friedl & Wüest, 2002).
Recently manmade reservoirs have been subjected to overfishing due to unchecked commercial exploitations (Allan et al., 2005).To rehabilitate these
Z. S. MIRZA ET AL BIOLOGIA (PAKISTAN)
32
water bodies, various management practices have been suggested including the stock enhancement, introduction of fast growing non-native fishes and reduction of by catch (De Silva, 2000; De Silva & Funge-Smith, 2005). These interventions can only be sucessful if one has accurate information about the current status of stocks in the waterbody. This highligts the need for a thorough investigation of fish population profile before devising any rational management plan for these water bodies. Mangla Reservoir is a large manmade impoundment (surface area 265 Km
2) which is being exploited for commercial fishery. The public authorities
have been augmenting the fishing stocks reservoir by stocking of hatchery reared seed of different species. There is no accurate information about the current status of commerical catch composition and total fish production from the reservoir. The current study was, therefore, undertaken to assess the current status of fisheries in the Mangla Reservoir based on seasonal variations in species composition and annual catches. This information will form a baseline for future fisheries management plans and help to assess the needs for implementation of conservation measures.
MATERIALS AND METHODS
Mangla dam is an earth-filled structure constructed on River Jhelum
(33o 16” 05’ N, 73
o 55” 55’ E) thirty kilometer upstream of Jhelum City (115 km
southeast of capital Islamabad). It is a multipurpose reservoir primarily constructed for storage of irrigation water, hydroelectric power generation and flood control. Fisheries and recreation has developed as a byproduct. The reservoir is situated at the junction of two perennial rivers (Jhelum and Poonch) and two non-perennial rivers (Kanshi and Khad) (Sheikh, 2007) and has a square shape with its narrow flanks extending into the river valleys. The reservoir has five basins commonly referred as pockets of the reservoir namely Mangla, Jhelum, Poonch, Khad and Jari (also as Jari Dam).The main physical features of the reservoir are given in Table 1.
Table 1:Physical characteristics of Mangla Reservoir
Physical Characteristics Value
Normal max conservation level (SPD) (m) 366.4
Min operational level (SPD) (m) 317.0
Original gross storage (MCM) 7252.9
Original live storage (MCM) 6,586.8
Existing gross storage (MCM) (as per 2005) 5,921
Existing Live storage (MCM) 8,185
Surface area (Km2) 265.0
Maximum depth (m) 90
Mean depth (m) 22.5
Depth ratio 0.25
Data regarding daily water levels in the reservoir was obtained from
Mangla Dam Organization. Species composition and commercial catch data was obtained by stratified random sampling (Anderson & Neumann, 1996) at two
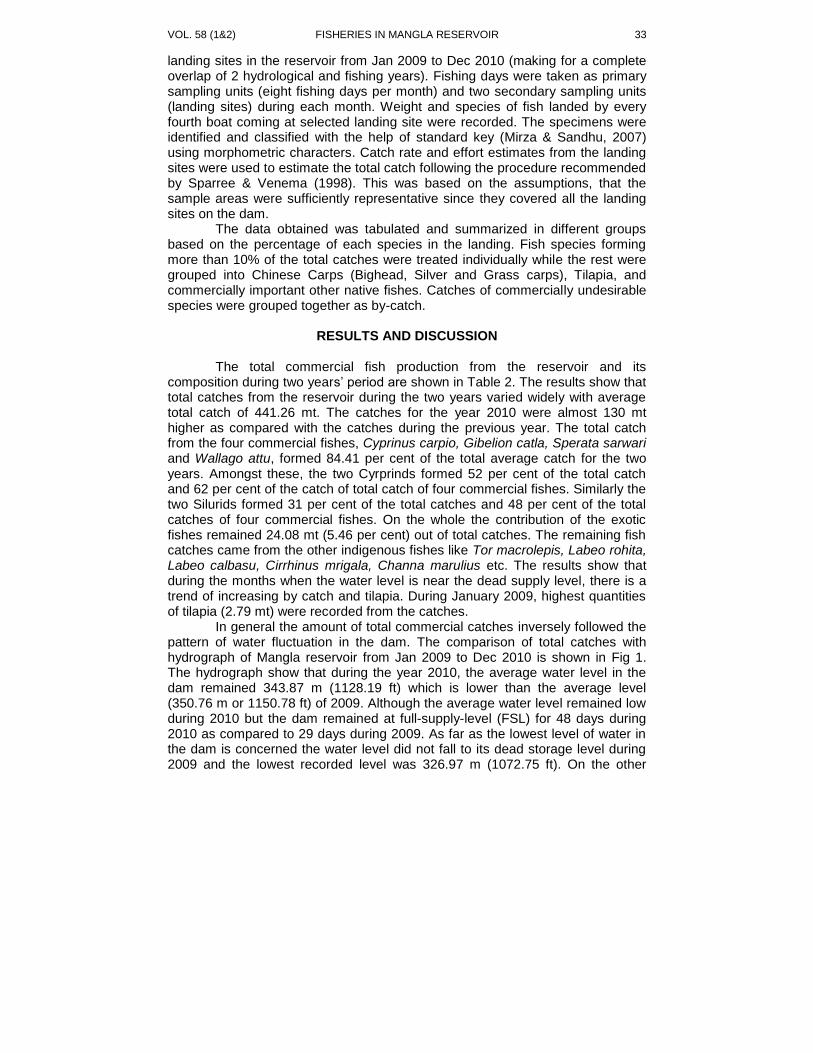
VOL. 58 (1&2) FISHERIES IN MANGLA RESERVOIR
33
landing sites in the reservoir from Jan 2009 to Dec 2010 (making for a complete overlap of 2 hydrological and fishing years). Fishing days were taken as primary sampling units (eight fishing days per month) and two secondary sampling units (landing sites) during each month. Weight and species of fish landed by every fourth boat coming at selected landing site were recorded. The specimens were identified and classified with the help of standard key (Mirza & Sandhu, 2007) using morphometric characters. Catch rate and effort estimates from the landing sites were used to estimate the total catch following the procedure recommended by Sparree & Venema (1998). This was based on the assumptions, that the sample areas were sufficiently representative since they covered all the landing sites on the dam.
The data obtained was tabulated and summarized in different groups based on the percentage of each species in the landing. Fish species forming more than 10% of the total catches were treated individually while the rest were grouped into Chinese Carps (Bighead, Silver and Grass carps), Tilapia, and commercially important other native fishes. Catches of commercially undesirable species were grouped together as by-catch.
RESULTS AND DISCUSSION The total commercial fish production from the reservoir and its
composition during two years’ period are shown in Table 2. The results show that total catches from the reservoir during the two years varied widely with average total catch of 441.26 mt. The catches for the year 2010 were almost 130 mt higher as compared with the catches during the previous year. The total catch from the four commercial fishes, Cyprinus carpio, Gibelion catla, Sperata sarwari and Wallago attu, formed 84.41 per cent of the total average catch for the two years. Amongst these, the two Cyrprinds formed 52 per cent of the total catch and 62 per cent of the catch of total catch of four commercial fishes. Similarly the two Silurids formed 31 per cent of the total catches and 48 per cent of the total catches of four commercial fishes. On the whole the contribution of the exotic fishes remained 24.08 mt (5.46 per cent) out of total catches. The remaining fish catches came from the other indigenous fishes like Tor macrolepis, Labeo rohita, Labeo calbasu, Cirrhinus mrigala, Channa marulius etc. The results show that during the months when the water level is near the dead supply level, there is a trend of increasing by catch and tilapia. During January 2009, highest quantities of tilapia (2.79 mt) were recorded from the catches.
In general the amount of total commercial catches inversely followed the pattern of water fluctuation in the dam. The comparison of total catches with hydrograph of Mangla reservoir from Jan 2009 to Dec 2010 is shown in Fig 1. The hydrograph show that during the year 2010, the average water level in the dam remained 343.87 m (1128.19 ft) which is lower than the average level (350.76 m or 1150.78 ft) of 2009. Although the average water level remained low during 2010 but the dam remained at full-supply-level (FSL) for 48 days during 2010 as compared to 29 days during 2009. As far as the lowest level of water in the dam is concerned the water level did not fall to its dead storage level during 2009 and the lowest recorded level was 326.97 m (1072.75 ft). On the other
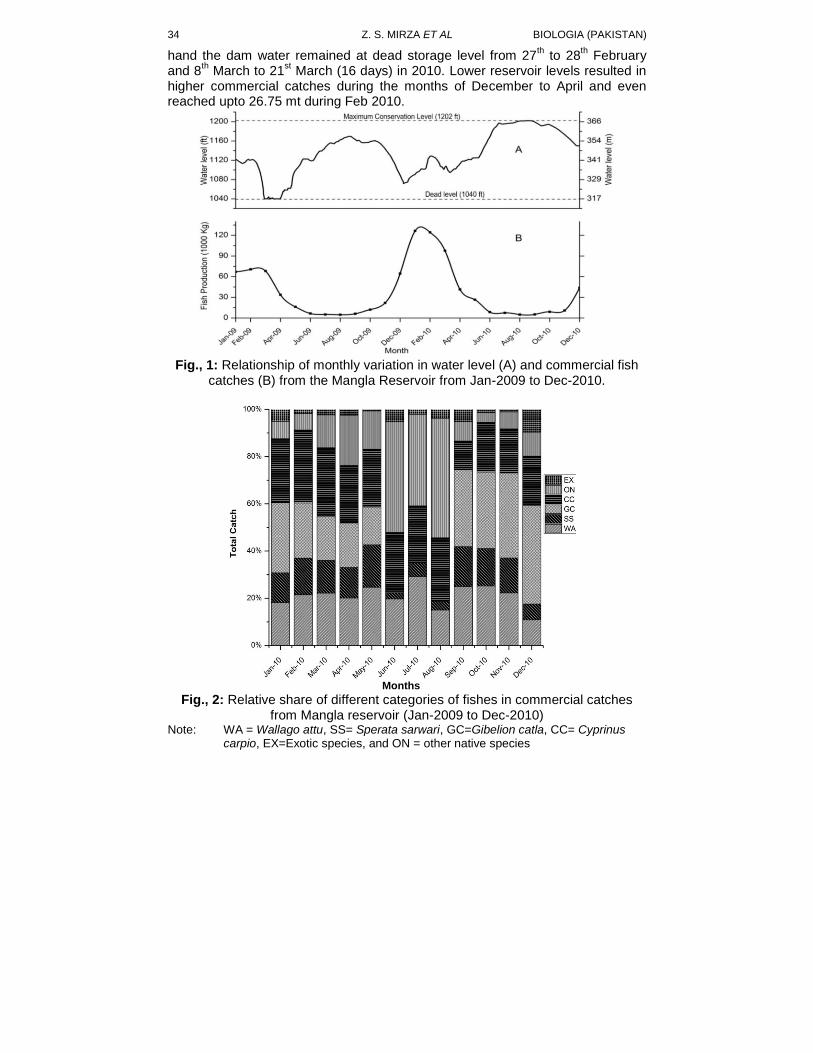
Z. S. MIRZA ET AL BIOLOGIA (PAKISTAN)
34
hand the dam water remained at dead storage level from 27th to 28
th February
and 8th March to 21
st March (16 days) in 2010. Lower reservoir levels resulted in
higher commercial catches during the months of December to April and even reached upto 26.75 mt during Feb 2010.
Fig., 1: Relationship of monthly variation in water level (A) and commercial fish
catches (B) from the Mangla Reservoir from Jan-2009 to Dec-2010.
Months
Fig., 2: Relative share of different categories of fishes in commercial catches from Mangla reservoir (Jan-2009 to Dec-2010)
Note: WA = Wallago attu, SS= Sperata sarwari, GC=Gibelion catla, CC= Cyprinus carpio, EX=Exotic species, and ON = other native species
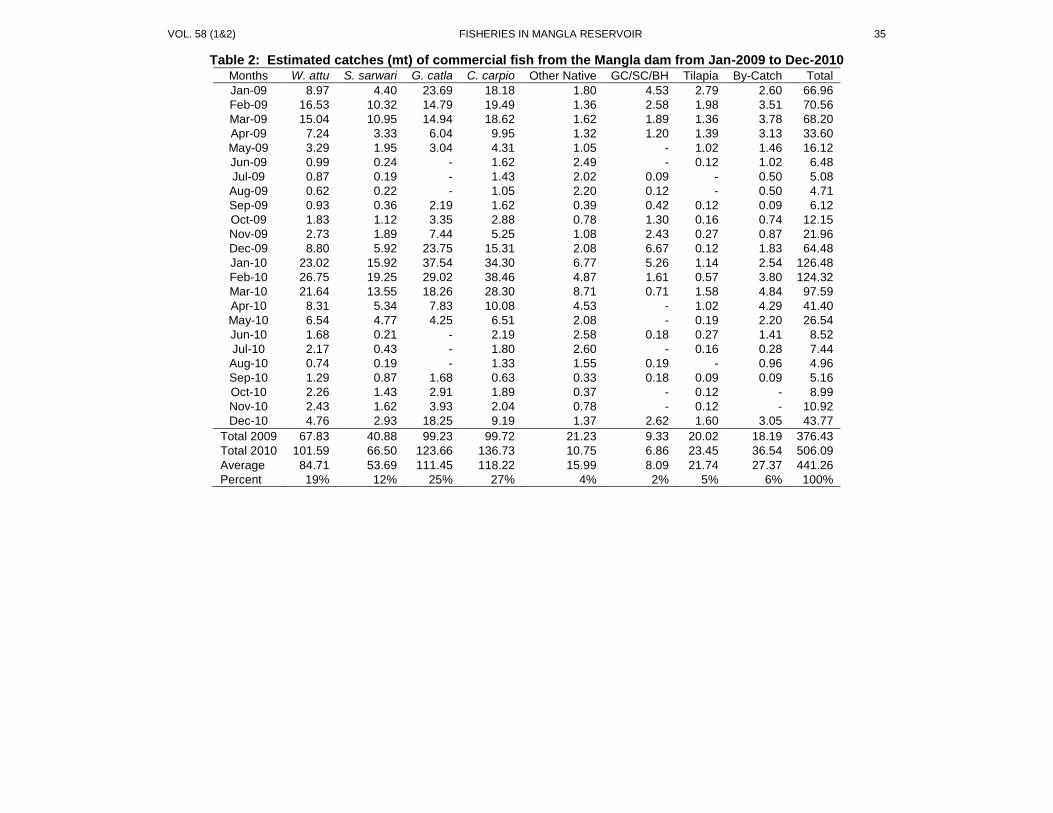
VOL. 58 (1&2) FISHERIES IN MANGLA RESERVOIR
35
Table 2: Estimated catches (mt) of commercial fish from the Mangla dam from Jan-2009 to Dec-2010 Months W. attu S. sarwari G. catla C. carpio Other Native GC/SC/BH Tilapia By-Catch Total
Jan-09 8.97 4.40 23.69 18.18 1.80 4.53 2.79 2.60 66.96
Feb-09 16.53 10.32 14.79 19.49 1.36 2.58 1.98 3.51 70.56
Mar-09 15.04 10.95 14.94 18.62 1.62 1.89 1.36 3.78 68.20
Apr-09 7.24 3.33 6.04 9.95 1.32 1.20 1.39 3.13 33.60
May-09 3.29 1.95 3.04 4.31 1.05 - 1.02 1.46 16.12
Jun-09 0.99 0.24 - 1.62 2.49 - 0.12 1.02 6.48
Jul-09 0.87 0.19 - 1.43 2.02 0.09 - 0.50 5.08
Aug-09 0.62 0.22 - 1.05 2.20 0.12 - 0.50 4.71
Sep-09 0.93 0.36 2.19 1.62 0.39 0.42 0.12 0.09 6.12
Oct-09 1.83 1.12 3.35 2.88 0.78 1.30 0.16 0.74 12.15
Nov-09 2.73 1.89 7.44 5.25 1.08 2.43 0.27 0.87 21.96
Dec-09 8.80 5.92 23.75 15.31 2.08 6.67 0.12 1.83 64.48
Jan-10 23.02 15.92 37.54 34.30 6.77 5.26 1.14 2.54 126.48
Feb-10 26.75 19.25 29.02 38.46 4.87 1.61 0.57 3.80 124.32
Mar-10 21.64 13.55 18.26 28.30 8.71 0.71 1.58 4.84 97.59
Apr-10 8.31 5.34 7.83 10.08 4.53 - 1.02 4.29 41.40
May-10 6.54 4.77 4.25 6.51 2.08 - 0.19 2.20 26.54
Jun-10 1.68 0.21 - 2.19 2.58 0.18 0.27 1.41 8.52
Jul-10 2.17 0.43 - 1.80 2.60 - 0.16 0.28 7.44
Aug-10 0.74 0.19 - 1.33 1.55 0.19 - 0.96 4.96
Sep-10 1.29 0.87 1.68 0.63 0.33 0.18 0.09 0.09 5.16
Oct-10 2.26 1.43 2.91 1.89 0.37 - 0.12 - 8.99
Nov-10 2.43 1.62 3.93 2.04 0.78 - 0.12 - 10.92
Dec-10 4.76 2.93 18.25 9.19 1.37 2.62 1.60 3.05 43.77
Total 2009 67.83 40.88 99.23 99.72 21.23 9.33 20.02 18.19 376.43
Total 2010 101.59 66.50 123.66 136.73 10.75 6.86 23.45 36.54 506.09
Average 84.71 53.69 111.45 118.22 15.99 8.09 21.74 27.37 441.26
Percent 19% 12% 25% 27% 4% 2% 5% 6% 100%
Z. S. MIRZA ET AL BIOLOGIA (PAKISTAN)
36
Relative share of different categories of fishes in the monthly catches is also shown in Fig., 2. The results show that the contribution of two Silurids in total catches was higher from February to May which then decreased. During these months, water level in the dam is at or near its dead storage levels. On the other hand the contribution of two Cyprinids was higher from September to December when the dam was at its full supply level (FSL). The decrease in catches of the Cyprinids was accompanied by the corresponding increase in the Silurids. Similarly, the contribution of exotic fishes increased during the months of January to May. The proportion of by catch increased during the months in which the dam was near its dead storage level.
Mirza et al. (1989) published a checklist of 52 species recorded from the Mangla reservoir out of which at least 12 (Shah, 1996) are used as food fish. The ichthyofauna of the reservoir is similar to that of River Jhelum downstream (Mirza & Ahmad, 1987; Mirza, 2006).The current study showed that the main catches from the reservoir consisted of four species (two Cyprinids and two Silurids). Additionally the proportion of exotic Chinese carps has also increased significantly. On the other hand the catches of traditionally important commercial fishes like Labeo rohita, Labeo calbasu, Tor macrolepis, Channa orientalis etc. have decreased and total catches from these fishes hardly reached 8 mt. Traditionally Mahseer (Tor macrolepis) and Soul (Channa orientalis) have been the popular game fish in the reservoir. Discussions with fishermen revealed that the population of these game fishes have drastically declined during the last decade or so. When the total fish catches from the dam were converted to catches per hectare per year, the results showed that the figures varied widely between the two years. The average fish catches from the dam remained 16.65 kg ha
-1 yr
-1 with a value of 14.20 kg ha
-1 yr
-1 during 2009 and 19.10 kg ha
-1 yr
-1
during 2010. Historically fish production from Mangla reservoir has been fairly low with average being 12-18 kg/ha/year during past decade (MFD, 2002). On the other hand the potential yield estimates of productive Asian reservoirs have been estimated from 34 to 84 kg ha
-1 (Sukumaran & Das, 2005). This shows that
the commercial fish production from Mangla reservoir is far below those of similar reservoirs in the region.
The percentage of different groups in the composition of fish fauna of a reservoir varies according to the evolutionary history which is closely related to the geological history of the river basin and niche availability (Petrere Jr, 1996). The ecology of Mangla dam has undergone changes especially resulting from high sedimentation rates (Butt et al., 2010; Izhar-ul-Haq & Abbas, 2007) and changes in precipitation pattern in catchment basin (Archer, 2003; Archer & Fowler, 2004). Seasonally the flows are the lowest during winter (October to January) and touch the highest level usually from the May to June. Rainfall plays a significant role in Mangla catchment. The hydrological cycles of the lake starts in August with a rise in the water level and a filling that takes place quickly, the maximum level being reached by November. Then the level begins to fall slowly in December and faster from April to June, when the electricity demand is at its peak along with the discharges for the summer crops. Additionally a number of other factors also played their role in the alteration of ecological conditions of the dam during the last two decades. These include the increased sewerage/ pollution, sedimentation, overfishing and introduction of exotic species in the
VOL. 58 (1&2) FISHERIES IN MANGLA RESERVOIR
37
dam. Apparently, these factors individually or in composite manner may have caused the changes in ecology of the dam resulting in the changes in fish fauna and resulting commercial catches.
The fishery development and management of the dam is under the control of the Directorate of Wildlife and Fisheries, under the Department of Forestry, Government of the Azad Jammu and Kashmir (AJK). Legislative guidance for the state of AJK is provided by the “West Pakistan Fisheries Ordinance of 1961”. The document includes the specifics on the leasing of water bodies, restriction on destructive fishing practice, licensing, gear restrictions, and on fishing close seasons. In addition to the fisheries ordinance, more specific regulations are provided in the “West Pakistan Fisheries Rules of 1965”.Currently, the fishing rights of the dam are leased out by the AJK government for a period of three year through open bid system during the month of August. The fishing contractor is solely responsible for the exploitation of the fisheries resources of the water body for the period leased out. It was observed that in order to maximize his profits, the fishing contractor tries to scoop maximum quantities of fish during the last year of his lease period which also increases the by catch. On paper the fisheries department overview the whole process of exploitation. On ground with the shortage of manpower and limited resources of the department, it is very difficult to control the indiscriminate and unjustified fishing practices taking place in the vast stretches of the reservoir. Current management activities are limited to periodic stocking of the Mangla dam, primarily the Major or Chinese carps, and the periodic lease of fishing rights of the water body. Both Major carps and Chinese carp species are stocked at the fry or fingerling stage with stocking size less than 5 cm. Increasing human population and urbanization processes along with industrialization are continuously imposing threats to the already fragile fisheries resources. These threats include overfishing, electro fishing, poisoning, use of explosives, degradation of spawning grounds, and water pollution. The present study also concluded that the commercial catch composition has changed over the last two decades. It is recommended that studies should be carried out to model the potential fish production from the reservoir.
REFERENCES
Allan, J., Abell, R., Hogan, Z., Revenga, C., Taylor, B., Welcomme, R., &
Winemiller, K., 2005. Overfishing of inland waters. Bioscience, 55(12): 1041-1051.
Anderson, R. O., & Neumann, R. M., 1996. Length, weight, and associated structural indices. Fisheries techniques, 2nd edition. American Fisheries Society, Bethesda, Maryland, 5: 447-482.
Archer, D., 2003. Contrasting hydrological regimes in the upper Indus Basin. Journal of Hydrology, 274(1-4): 198-210.
Archer, D. R., & Fowler, H. J., 2004. Spatial and temporal variations in precipitation in the Upper Indus Basin, global teleconnections and hydrological implications. Hydrology and Earth System Sciences, 8(1): 47-61.
Z. S. MIRZA ET AL BIOLOGIA (PAKISTAN)
38
Burford, M. A., Johnson, S. A., Cook, A. J., Packer, T. V., Taylor, B. M., & Townsley, E. R., 2007. Correlations between watershed and reservoir characteristics, and algal blooms in subtropical reservoirs. Water Res., 41(18): 4105-4114.
Butt, M., Waqas, A., & Mahmood, R., 2010. The combined effect of vegetation and soil erosion in the water resource management. Water Resources Management, 24(13): 3701-3714.
De Silva, S. S., 2000. Reservoir fisheries: broad strategies for enhancing yields. . In: Reservoir and culture-based fisheries: biology and management. (eds S. S. De Silva), pp. 7-16: ACIAR Proceedings No. 98. Canberra.
De Silva, S. S., & Funge-Smith, S. J. (2005) A review of stock enhancement practices in the inland water fisheries of Asia RAP Publication No. 2005/12. RAP Publication No. 2005/12 (pp. 93). Bangkok, Thailand: Asia-Pacific Fishery Commission.
Friedl, G., & Wüest, A., 2002. Disrupting biogeochemical cycles - Consequences of damming. Aquatic Sciences - Research Across Boundaries, 64(1): 55-65.
Izhar-ul-Haq, & Abbas, S. T., 2007. Sedimentation of Terbela & Mangla reservoirs. Paper presented at the Pak. Eng. Cong., 70th Ann. Ses. Proc.
Margalef, R., 1975. Typology of reservoirs. Verh. Internat. Verein. Limnol., 19: 1841-1848.
MFD, 2002. Handbook of fisheries statistics of Pakistan. Vol. 18. Marine Fisheries Department (MFD), Government of Pakistan, Fish Harbour West Warf. Karachi.
Mirza, M. R., & Ahmad, I., 1987. Fishes of River Jhelum in Sargodha District. Biologia, 33: 253-263.
Mirza, M. R., Saeed, T. B., & Hussain, S., 1989. A checklist of the fishes of Mangla Lake, Pakistan. Sci. Khyber, 2: 287-292.
Mirza, M. R., & Sandhu, I. A., 2007. Fishes of the Punjab, Pakistan. Polymer Publications, Pakistan.
Mirza, Z. S. (2006). Systematics, ecology and distribution of the fishes of the River Jhelum from Mangla Dam to Jalalpur. (M.Phill), Department of Zoology GC University, Lahore, Pakistan.
Panikkar, N. K., 1955. Fish and fisheries. In: Progress of science in India 1938-1950. (Nat. Inst. of Sci. India), Section 7 Zoology Sub Section 3 pp. 60. New Delhi: National Institute of Sciences of India.
Petrere Jr, M., 1996. Fisheries in large tropical reservoirs in South America. Lakes & Reservoirs: Research & Management, 2(1-2): 111-133.
Serafim, A., Morais, M., Guilherme, P., Sarmento, P., Ruivo, M., & Magriço, A., 2006. Spatial and temporal heterogeneity in the Alqueva reservoir, Guadiana river, Portugal. Limnetica, 25(3): 771-786.
Shah, I. H., 1996. Fish and fisheries of Mangla Reservoir: A review. Biologia, 42(1&2): 37-42.
Sheikh, M. S., 2007. Resettelment aspects of Mangla Dam raising. Paper presented at the Pakistan Engineering Congress, 70th Annual Session Proceedigns.

VOL. 58 (1&2) FISHERIES IN MANGLA RESERVOIR
39
Sparre, P., & Venema, S. C. (1998) Introduction to tropical fish stock assessment. Part 1. Manual. FAO Fish. Tech. Pap. No. 306.1, Rev. 2. Rome: FAO.
Sthapit, E., Ochs, C., & Zimba, P., 2008. Spatial and temporal variation in phytoplankton community structure in a southeastern U.S. reservoir determined by HPLC and light microscopy. Hydrobiologia, 600(1): 215-228.
Sukumaran, P. K., & Das, A. K., 2005. Limnology and fish production efficiencies of selected reservoirs of Karnataka. Indian J. Fish., 52(1): 47-53.
Tundisi, J. G., 1996. Reservoirs as complex systems. Ciênc. cult.(Säo Paulo), 48(5/6): 383-387.
Tundisi, J. G., & Straskraba, M., 1999. Theoretical reservoir ecology and its applications. Brazilian Acad. of Sciences.
BIOLOGIA (PAKISTAN) 2012, 58 (1&2), 41-46 PK ISSN 0006 - 3096
*Corresponding author: Cell: +92-333-4211100; Email: [email protected]
In vitro studies in Tagetes erecta (marigold) under auxins
(IAA, NAA) and cytokinins (BAP, Kinetin) effect for callus
formation by different explants
*ATHAR HUSSAIN1 & MAIDA LATIF
2
1,2,
Department of Botany, Govt. College University Lahore
ABSTRACT
Culture establishment depends on its physical and chemical environment.
Different ex-plants of Tagetes erecta were subjected to different concentration of auxin (IAA, NAA) and cytokinin (BAP, Kinetin) to observe their response towards callus formation. Best callus formation was seen in loose cells of leaf blade as compared to arranged cells of nodes. Key words Tagetes erecta; callus formation; Auxins, Cytokinin
INTRODUCTION
The family Asteraceae or Compositae is the largest family of flowering plants in terms of number of species. According to the Royal Botanic Gardens of Kew, the family comprises more than 1,600 genera and 23,000 species, mostly herbs, but some shrubs, trees and climbers do exist (McKenzie et al., 2005).
The family includes commercially important plants for food, Lactuca sativa (lettuce), Helianthus annuus (sunflower), beverages, medicinal tea, Echinacea (Echinacea purpurea), poultry feed (Tagetes patula) and weeds (Senecio jacobaea, Senecio vulgaris and Taraxacum (dandelion). It also contains nector producers (Centaurea (knapweed), Helianthus annuus (domestic sunflower), and some species of Solidago. They are also commonly featured in medical and phytochemical journals because of their sesquiterpene lactone compounds. The genus Tagetes of family Asteraceae includes the popular garden flower marigold, Tagetes erecta L. Other members of the genus are equally easy to cultivate, and have a long history of human use as beverages, condiments, ornamentals, as medicinal decoctions, and in rituals (Soule, 1993).
Culture is affected by both physical and chemical conditions. This study was undertaken to understand the chemical conditions to promote micropropagation of Tagetes sp. Different workers have been using different methods including meristem tip culture, axillary bud/shoot proliferation, adventitious bud/shoot induction, organogenesis and somatic embryogenesis etc.
MATERIALS AND METHODS
Tagetes erecta L. was selected as study material. MS medium
(Murashige & Skoog, 1962) was used throughout the study supplemented with different growth hormones. MS medium was prepared by following general scheme of Tasaki (1985) as they are easy to handle. Sucrose was dissolved at
A. HUSSAIN & M. LATIF BIOLOGIA (PAKISTAN)
42
the rate of 3.0% (w/v), pH of the medium was adjusted at 5.8 with 0.1 N KOH or HCl. The medium was solidified with 0.6% agar (Bio Life). The cooked hot medium was dispensed in appropriate volumes into jars, culture tubes and flasks of 125ml. All the vessels were plugged and wrapped with tin foil and autoclaved under 15 lbs/inch
2 pressure for 15 minutes.
Explants selected for inoculation were leaf, internode, node, petiole and root. Leaf was excised (2cm long), under aseptic conditions in laminar air flow cabinet, with the help of scalpel and forceps. During excision process the instruments were kept in ethanol and periodically sterilized on flame. Internode, node and petiole excised were 5mm long each, while roots were excised 1cm long for use as explants. Hormones used were Auxins (IAA, NAA; 2,4-D) and Cytokinin, (BAP, Kinetin) ranging from 0.1 to 1.0mg/L with an interval of 0.1mg/L.
All the explants were transferred after surface sterilization with 2% commercial calcium hypochlorite. After three washings explants were transferred to respective vessels on sterilized media. All this process was carried out in laminar air flow cabinet under aseptic conditions and vessels were placed at a temperature of 25˚C and 85% relative humidity under cool fluorescent tube light.
RESULTS
The study was designed to evaluate the comparative effect of IAA, NAA,
BAP & Kinetin on callus formation in Tagetes erecta. (marigold). Strength of hormones was maintained at 0.1 to 1.0 mg/L in all cases. Explants used were petiole, leaf blade, internode, node and root.
Callus development with three parameters were studied i.e. callus initiation (in days), callus colour and callus texture (Table 1). Callus formation was observed in all explants except roots under all experimental conditions.
In IAA explants responded by initiating callus in all IAA concentrations except 1mg/L. In 1mg/L only petiole and leaf developed callus whereas internode and node did not respond. Maximum explants initiated callus formation in 20 day. The callus initiation process decreased when time period was increased or decreased from 20 days. Minimum days recorded were 17 days when leaf blade developed callus whereas maximum days consumed for callus initiation were taken by node were 24. In all explants callus colour was green or shades of green. Mostly it was green (14 readings) followed by yellow green (4 readings) light green (3 readings) and bright green (1 readings only). Texture of the callus was explant oriented. Under all IAA concentrations, explants petiole and leaf, produced granular callus whereas internodes and nodes produced compact callus.
At all NAA strengths all explants initiated callus formation except internode which did not respond at NAA 0.9mg/L. Minimum time taken for callus initiation was 20 days by leaf blade while maximum time was 27 days taken by nodes. In all callus, colour was green or shades of green as in IAA. Mostly it was green (14 readings) followed by light green (7 readings) and yellow green (3 readings). Texture of the callus was again based on explant used. Petiole and leaf produced granular callus whereas internodes and nodes produced mostly compact callus.
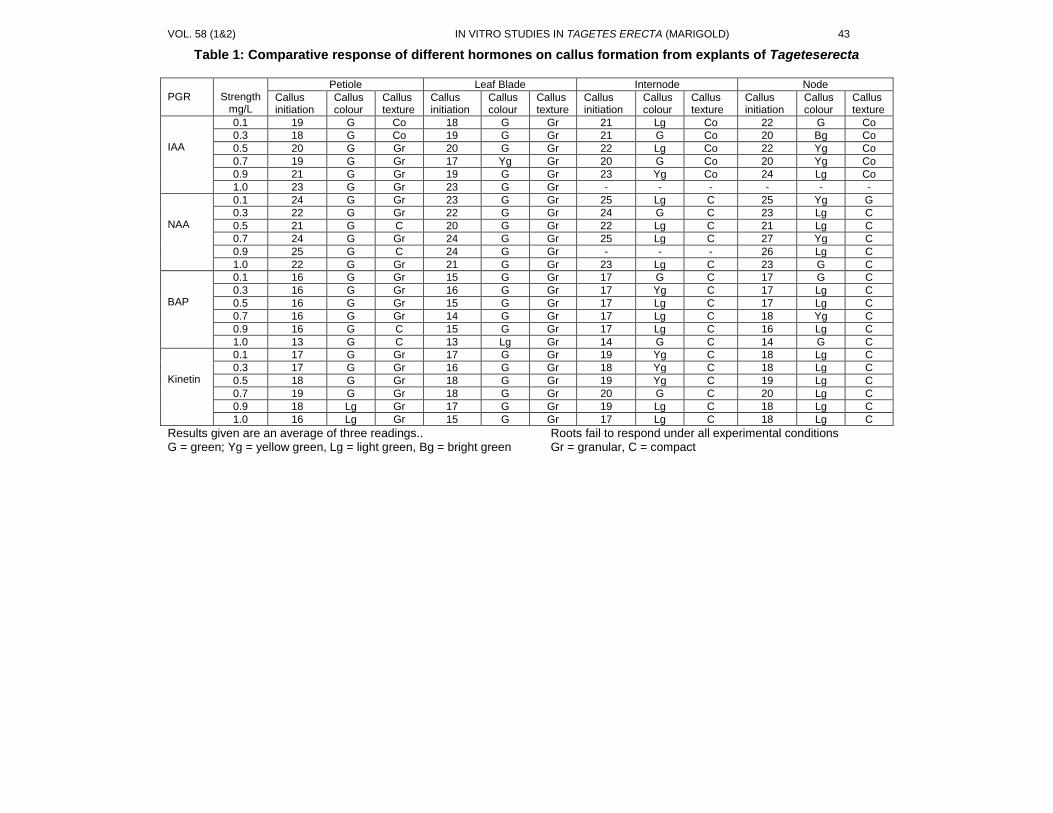
VOL. 58 (1&2) IN VITRO STUDIES IN TAGETES ERECTA (MARIGOLD) 43
Table 1: Comparative response of different hormones on callus formation from explants of Tageteserecta
Results given are an average of three readings.. Roots fail to respond under all experimental conditions G = green; Yg = yellow green, Lg = light green, Bg = bright green Gr = granular, C = compact
PGR
Strength
mg/L
Petiole Leaf Blade Internode Node
Callus initiation
Callus colour
Callus texture
Callus initiation
Callus colour
Callus texture
Callus initiation
Callus colour
Callus texture
Callus initiation
Callus colour
Callus texture
IAA
0.1 19 G Co 18 G Gr 21 Lg Co 22 G Co
0.3 18 G Co 19 G Gr 21 G Co 20 Bg Co
0.5 20 G Gr 20 G Gr 22 Lg Co 22 Yg Co
0.7 19 G Gr 17 Yg Gr 20 G Co 20 Yg Co
0.9 21 G Gr 19 G Gr 23 Yg Co 24 Lg Co
1.0 23 G Gr 23 G Gr - - - - - -
NAA
0.1 24 G Gr 23 G Gr 25 Lg C 25 Yg G
0.3 22 G Gr 22 G Gr 24 G C 23 Lg C
0.5 21 G C 20 G Gr 22 Lg C 21 Lg C
0.7 24 G Gr 24 G Gr 25 Lg C 27 Yg C
0.9 25 G C 24 G Gr - - - 26 Lg C
1.0 22 G Gr 21 G Gr 23 Lg C 23 G C
BAP
0.1 16 G Gr 15 G Gr 17 G C 17 G C
0.3 16 G Gr 16 G Gr 17 Yg C 17 Lg C
0.5 16 G Gr 15 G Gr 17 Lg C 17 Lg C
0.7 16 G Gr 14 G Gr 17 Lg C 18 Yg C
0.9 16 G C 15 G Gr 17 Lg C 16 Lg C
1.0 13 G C 13 Lg Gr 14 G C 14 G C
Kinetin
0.1 17 G Gr 17 G Gr 19 Yg C 18 Lg C
0.3 17 G Gr 16 G Gr 18 Yg C 18 Lg C
0.5 18 G Gr 18 G Gr 19 Yg C 19 Lg C
0.7 19 G Gr 18 G Gr 20 G C 20 Lg C
0.9 18 Lg Gr 17 G Gr 19 Lg C 18 Lg C
1.0 16 Lg Gr 15 G Gr 17 Lg C 18 Lg C
46 A. HUSSAIN & M. LATIF BIOLOGIA (PAKISTAN)
In all strengths of BAP all explants develop callus. Maximum explants response was observed in 16 and 17 day after inoculation. The callus initiation response decreased on either side of this figure either by increasing or decreasing the time factor. Minimum days recorded were 13 days where leaf blade and petiole whereas maximum days consumed for callus initiation were 18 days by explant node. Callus colour was governed by the explant used. In leaf, petiole and blade, it was green (11 out of 12 cases). In node and internode it was yellow green (2) to light green (6) and green (4). Texture of the callus was again explant oriented. Under all BAP concentrations, explants petiole and leaf, mostly produced granular callus whereas internodes and nodes produced compact callus.
In all strengths of Kinetin all explants developed callus though varying in amount. Maximum explants response was observed in 18 day after inoculation. Minimum days recorded were 15 days whereas maximum days consumed for callus initiation were 20. Leaf developed callus in minimum (15 days) time while node developed callus in maximum time (20 days). Callus colour was again found to be governed by the explant used. In leaf, petiole and blade, it was green in all explants. In node and internode it was yellow green (3 readings) to light green (8 readings) and green (1 readings). Texture of the callus was again explant oriented. Under all Kinetin concentrations applied explants, petiole and leaf produced 100% granular callus whereas internodes and nodes produced 100% compact callus.
DISCUSSION
Different explants responded differently to the hormones applied. In IAA concentrations leaf blade response was best while node response was worst. Best results for IAA were observed in 0.7mg/L, IAA. Misra & Datta (2001) reported that auxin at higher levels, causes cell proliferation of explants forming callus mass. Leaf explants of Tagetes had a tendency to form callus which is enhanced in the presence of auxin. In leaf segments of white marigold, differentiation of shoots through callus formation was achieved in presence of IAA (2.85 μM). Vanegas et al., (2002) also quoted that leaf segments producing best results of regeneration using 17.1 μM IAA. Roots also developed in MS medium having 0.1mg/L IAA in 7 days when nurturing of isolated shoots was done in MS medium supplemented with 10mg/l adenine sulphate (AdS) (Misra 2000). Short et al., (1981) got root initiation of Rosa arvensis and Rosa cooperi with 1mg/l IAA. In present study both media were applied but roots failed to respond. It could be because MS medium was not supplemented with AdS in former and plant tissue was different in later study.
In NAA good callus formation was observed in 0.5mg/L NAA. Callus formation was observed in 20 days again in leave blade. A tendency to callusing is observed if the auxin concentration is increased. Brar et al., (1998) established the somatic calli from different explants of Gossypium spp and found that best media for callus initiation in diploids was MS medium having auxins. Results of their study speak high level of auxin. Rajasegar et al., (1996) observed the high frequency of callus induction on MS medium containing various concentrations of different auxins among various explants of Gossypium sp. Ozyquit et al., (2002) also quoted the same results. They established plant tissue culture systems of
VOL. 58 (1&2) IN VITRO STUDIES IN TAGETES ERECTA (MARIGOLD) 45
five different Helianthus annuus genotype on MS medium and supplemented with various plant growth regulators using hypocotyls and cotyledon explants. They noted the highest shoot regeneration in one of the genotype whose hypocotyls explants on MS media was supplemented with 0.5mg/L NAA. Dash & Singhsamant, (1990) regenerated Petunia hybrida from shoot tips. 0.5mg/L NAA proved most effective in producing root. But in our work, roots were not produced in the said concentration. This may be because of different plant variety as Punia & Bohorova (1992) also got different results in six wild species of Helianthus annuus and in different explants. So in our study, it may also be because of difference in variety that roots failed to respond.
Best results were obtained in leaf explants at 1.0mg/L BAP. Callus induction took less time in 1.0mg/L BAP concentration as compared to other concentrations. Misra, (2000) also reported the increase in callus formation in shoot tips and single node stem segments of Tagetes F1 hybrid as the concentration of BAP was increased to 1.0mg/L. Similar results were also quoted by Dhaka & Kothari, (2004) who standardized protocol for mass propagation of Eclipta alba L., nodal segments and shoots gave best results on MS medium supplemented with 1.0mg/L BAP. Punia & Bohorova (1992) cultured four explants, stem, leaf, bud and cotyledons of Helianthus annuus on different media for callus formation. They found that calli were regenerated on MS medium supplemented with 1.0mg/L BAP.
Best results were obtained in 1.0mg/L Kinetin in leaf explants. Ozel et al., (2006) found that stem node of Mediterranean knapweed (Centaurea tchihatcheffii) showed no results but immature zygotic embryo gave best results in 1.0mg/L Kinetin. Uranbey (2005) also quoted that high concentration of Kinetin (15 µM) promoted massive microtubers in potato as compared to BA at the same concentration. Aslam et al., (2005) observed that best media for callus induction, shoot and root regeneration was MS media supplemented with 2.0mg/L Kinetin and 1.5mg/L IAA. They investigated that with increasing Kinetin concentration up to 2.0mg/L, shoot formation was enhanced. In our study, high level of Kinetin also gave best results.
Different explants behaved differently under the influence of hormones as expected. Best response was observed in leaf blade for callus formation. Lead blade is composed of least specialized cells, parenchyma cells, whereas rest of the explants, petiole, internodes and nodes are composed of comparatively specialized cells. Least specialized cells respond better to hormones.
REFERENCES
Aslam, M., Iqbal, N., Iqbal, M.M., Haq M.A. & Zafar Y., 2005. Standardization of
Tissue Culture Technology suitable for inducing genetic transformations through microinjection in the locally adopted Cotton genotypes. Asian J. of Plant Sci., 4(3): 249-254.
Brar, K. S., Sandhu B. S. & Gosal, S. S., 1998. Tissue culture responses of wild and cultivated cotton species. Crop improvement, 25(1): 59-65.
46 A. HUSSAIN & M. LATIF BIOLOGIA (PAKISTAN)
Dash, S. N. & Singhsamant K. P. K., 1990. Introduction of plantlets and callus from shoot tips of Petunia hybrida cultures in vitro. Orissa Hort., 18: 65-69.
Dhaka, N. & Kothari, S. L., 2004. Micropropagation of Eclipta alba (L.) Hassk- an important medicinal plant. In Vitro Cell Dev. Biol. Plant, Article: PP. 658–661.
McKenzie, R. J., Samuel, J., Muller, E. M. A., Skinner, K. W. & Barker, N. P., 2005. Morphology of Cypselae In Subtribe Arctotidinae (Compositae–Arctotideae) and its taxonomic implications. Annals of the Missouri Botanical Garden, 92 (4): 569–594.
Misra, P., 2000. In vitro maintenance of F1 hybrid. Current Science, 78(4): 383-384.
Misra, P. & Datta, S. K., 2001. Direct differentiation of shoot buds in leaf segments of white marigold (Tagetes erecta L.). In Vitro Cell Dev. Biol. Plant, 37: 466-470.
Murashige, T. & Skoog, F., 1962. A revised medium for rapid growth and-bioassays with tobacco tissue cultures. J. Physiol., 15: 473-497.
Ozel, C. A., Khawar, K.M., Mirici, S., Ozcan, S. & Arslan, O., 2006. Factors affecting in vitro plant regeneration of the critically endangered Mediterranean knapweed (Centaurea tchihatcheffii Fisch et. Mey). Naturwissenschaften, 93(10): 511-7.
Ozyquit, I. I., Bajrovic, K., Gozukiirmizi, N. & Semiz, B. D., 2002. Direct plant regeneration from hypocotyls and cotyledon explants of five different sunflower genotypes from Turkey. Biotechnology and Biotechnological Equipment, 16(1):8-11.
Punia, M. S. & Bohorova, N. E., 1992. Callus development and plant regeneration from different explants of six wild species of sunflower (Helianthus annuus). Plant Sci., 87(1):79-83.
Rajasegar, G., Sree Rangasamy, S. R., Venkatachalam P. & Rao, G. R., 1996. Callus induction, somatic embryoid formation and plant regeneration in cotton (Gossypium hirsutum L.). J. Phytol., 9(2):145-147.
Short, K. C., Price, L. & Roberts, A. V., 1981. Micropropagation of rose. In: J. Harkness (Ed). The rose annual rnrs, St. Albans, U.K. PP 138-144.
Soule, J. A., 1993. Tagetes minuta: A potential new herb from South America In: J. Janick and J.E. Simon (Eds.), New Crops. Wiley, New York, Pp. 649-654.
Tasaki, S., 1985. Isolation of explants and culture of shoot apex of strawberry and potato vegetables course, TIATIC.
Uranbey, S., 2005. Comparison of Kinetin and 6-benzyladnine (BA) on in vitro microtuberization of Potato under short days conditions. J. Agric. Sci., 15(1):39-41.
Vanegas, P.E., Hernandez, A. C., Valverde M. E. & Lopez, O. P., 2002. Plant regeneration via organogenesis in marigold. Plant Cell, Tissue and Organ Culture, 69(3):279-283.
BIOLOGIA (PAKISTAN) 2012, 58 (1&2), 47-52 PK ISSN 0006 - 3096
*Corresponding author: [email protected]
Prevalence of Hepatitis B virus infection among population
of factory workers in Gujranwala (Punjab) Pakistan
MUHAMMAD ILYAS1, MUHAMMAD IFTIKHAR
1, USMAN RASHEED
2 &
SHAZIA YASMIN3
1Department of Zoology, Govt. College Gujranwala, Pakistan
2University of Veterinary and Animal Sciences (UVAS) Jhang Campus
3Department of Rural Sociology, University of Agriculture Faisalabad
ABSTRACT
Present study is aimed at assessing the prevalence of Hepatitis B virus infection
among factory workers of Gujranwala district of Punjab province (Pakistan) as there is insufficient published literature on this subject. HBsAg screening was done in factory workers of various industries of district Gujranwala who presented themselves as voluntary blood donors. A total of 852 male subjects were screened for hepatitis-B, 612 subjects between ages 17 to 25 years, 167 subjects between 26 to 35 years and 73 subjects with average age of more than 35 years. The total prevalence of hepatitis-B among factory workers was found to be 3.99% (34/852). The prevalence of hepatitis-B in subjects having age between 17 to 25 years was found to be 3.76% (23/612). Highest prevalence was found among subjects having age between 26 to 35 years which was 5.39% (9/167). The prevalence of hepatitis-B in subjects having age more than 35 years was found to be 2.82% (2/73). The prevalence of Hepatitis-B in the normal healthy population among male subjects working in various industries of Gujranwala district was found to be 3.99%. Compared to general populations of Pakistan, the seroprevalence of Hepatitis B is high in the population of male subjects working in industries of Gujranwala. It is concluded that these working class populations perhaps are at higher risk of contacting hepatitis-B infections as compared to other populations.
Key Words: Hepatitis B, Factory workers, Prevalence, Hepatitis B, Gujranwala, Pakistan.
INTRODUCTION
Hepatitis is known as an infection causing swelling and inflammation of the liver. Its chronic form may lead to cirrhosis or cancer. People, sometimes contact hepatitis with limited or no symptoms but usually it leads to jaundice, anorexia, poor appetite and diarrhea. Causative agents of hepatitis include; alcohol, poison, drugs and autoimmunity but most cases of hepatitis are reported to be by viruses. Hepatitis B is a major health problem worldwide especially in Asia, Africa, southern Europe and Latin America (Previsani & Lavanchy, 2002). Hepatitis B virus is transmitted through blood and blood products, sexual contacts. Intrafamilial transmission is also reported. There are about 350 million people with chronic hepatitis B virus (HBV) infection worldwide (Previsani & Lavanchy, 2002). Pakistan is one of the worst affected countries with hepatitis B. A number of studies have been conducted to find the prevalence of HCV and HBV in different areas of Pakistan (Ali et al., 2009; Waheed et al., 2009; PMRC 2009). There are very few population based studies to estimate the exact incidence of hepatitis in different areas (Waheed et al., 2009). This is also
M. ILYAS ET AL BIOLOGIA (PAKISTAN) 48
because mostly the epidemiological studies concerning the prevalence of HBV and HCV are restricted to the hospitalized patients (Koulentaki et al., 2001; Choudhary et al., 2005). A country wide survey conducted from July 2007 to May 2008 by Pakistan Medical Research Council (PMRC, 2009) reveals that prevalence of hepatitis B is 2.5% in general population of Pakistan. Gender-wise analysis showed its slight preponderance in males all over Pakistan (PMRC, 2009). Intraprovince prevalence of the hepatitis B was very high in Balochistan (4.3%) while it was 2.5% in Sindh, 2.4% in Punjab and 1.3% in Khyber Pakhtoonkhwa. The overall HBsAg prevalence in Punjab province was 2.4%. High prevalence of HBV and HCV are seen in Vehari, Okara, Jhang, Islamabad, Attock, Rahim Yar Khan, Mandi Bhauddin, Gujranwala and Mianwali districts of Punjab province. People inhabiting the polluted areas may have higher frequency of viral hepatitis (Jordan, 2010; Sohail et al., 2010). Gujranwala an industrial city of Punjab (Pakistan) is located at 32.16° North, 74.18° East and is 226 meters (744 feet) above sea-level. There are 6500 small and medium entrepreneurs (SME’s) and 25000 Cottage industry of diverse nature including manufacturers of industrial machinery, fan industry, motor pumps industry, washing machine industry, electric goods, poultry feed, soap, ball point, rubber tube, metal utensils, melamine utensils, cutlery, kitchen ware, ceramics tiles, sanitary wares, sanitary fittings, agriculture appliances, woolen textiles and steel pipe industries etc. (GBC, 2013). Because of unregulated discharge of industrial wastes in the environment, the levels of pollution are also higher in some regions as compared to international standards (Rahman, 2002). Least information is available at population level showing the prevalence of hepatitis B in Gujranwala. It appears that people working in different industrial units are at high risk of contacting this viral infection as they are exposed to multiple risk factors. Little is known about the prevalence of Hepatitis B virus infection in factory workers. The objective of present study was to assess the perceived incidence of hepatitis B in population of people working in different industries of Gujranwala.
MATERIALS AND METHODS
Blood Sampling A hepatitis-B screening study was conducted among the apparently
healthy male population of factory workers who presented them as volunteers for blood donation during blood donation camps held in different industrial units located in Gujranwala, Pakistan during last few years. The blood was collected by authorized technician and the sera were separated from the coagulated blood by centrifugation at 5000 rpm for 10min. at room 4
oC and stored at -20
oC for
further use. The HBV screening was based on the detection of antibodies against the related virus in the sera using enzyme immunoassays. All procedures were carried out with informed consent according to institutional guidelines. Enzyme immunoassay for detection or confirmation of hepatitis B surface antigens
The HBsAg kit (DS-EIA-HBsAg, DSI S.r.I. Italy) was used for detection of hepatitis B surface antigen in blood serum (plasma), leukocyte interferon, human immunoglobulin and other blood preparations. Kit sensitivity is 0.1 IU/ml (“Second International Standard for HBsAg, subtype adw2, genotype A”, NIBSC Code; 00/588) when HBsAg detecting. For detection of hepatitis B surface
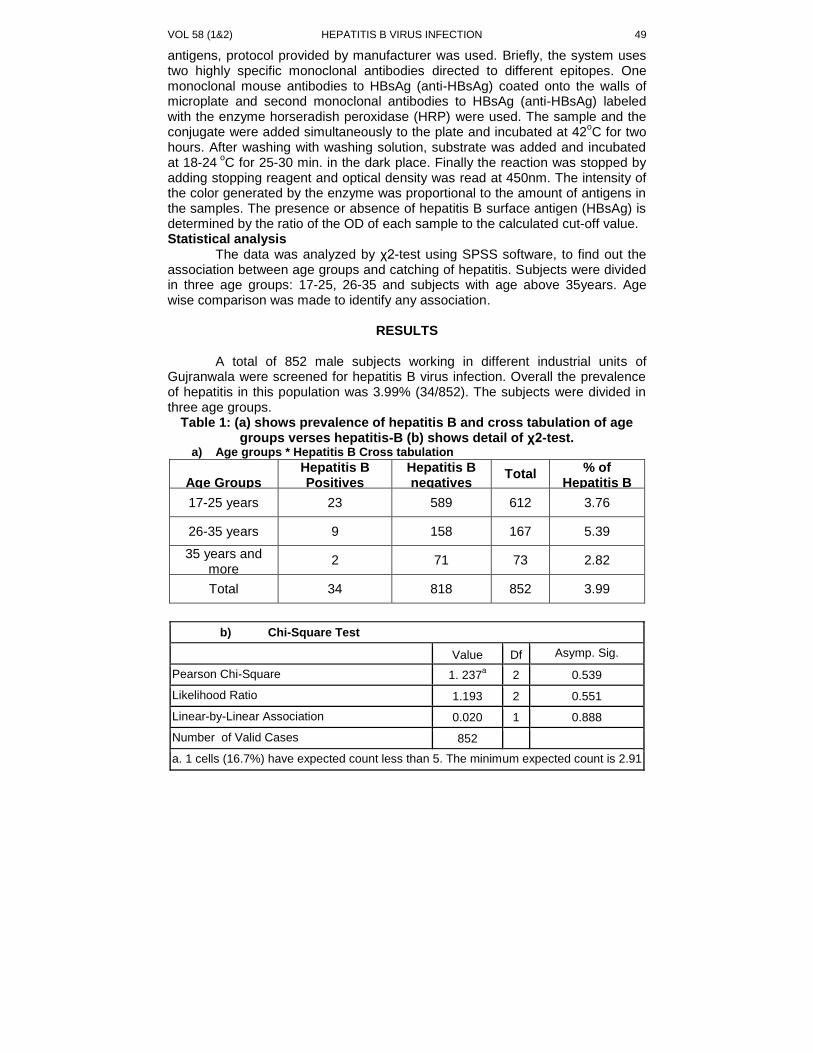
VOL 58 (1&2) HEPATITIS B VIRUS INFECTION 49
antigens, protocol provided by manufacturer was used. Briefly, the system uses two highly specific monoclonal antibodies directed to different epitopes. One monoclonal mouse antibodies to HBsAg (anti-HBsAg) coated onto the walls of microplate and second monoclonal antibodies to HBsAg (anti-HBsAg) labeled with the enzyme horseradish peroxidase (HRP) were used. The sample and the conjugate were added simultaneously to the plate and incubated at 42
oC for two
hours. After washing with washing solution, substrate was added and incubated at 18-24
oC for 25-30 min. in the dark place. Finally the reaction was stopped by
adding stopping reagent and optical density was read at 450nm. The intensity of the color generated by the enzyme was proportional to the amount of antigens in the samples. The presence or absence of hepatitis B surface antigen (HBsAg) is determined by the ratio of the OD of each sample to the calculated cut-off value. Statistical analysis
The data was analyzed by χ2-test using SPSS software, to find out the association between age groups and catching of hepatitis. Subjects were divided in three age groups: 17-25, 26-35 and subjects with age above 35years. Age wise comparison was made to identify any association.
RESULTS
A total of 852 male subjects working in different industrial units of
Gujranwala were screened for hepatitis B virus infection. Overall the prevalence of hepatitis in this population was 3.99% (34/852). The subjects were divided in three age groups.
Table 1: (a) shows prevalence of hepatitis B and cross tabulation of age groups verses hepatitis-B (b) shows detail of χ2-test.
a) Age groups * Hepatitis B Cross tabulation
Age Groups
Hepatitis B Positives
Hepatitis B negatives
Total % of
Hepatitis B positives 17-25 years 23 589 612 3.76
26-35 years 9 158 167 5.39
35 years and more
2 71 73 2.82
Total 34 818 852 3.99
b) Chi-Square Test
Value Df Asymp. Sig. (2-sided)
Pearson Chi-Square 1. 237a 2 0.539
Likelihood Ratio 1.193 2 0.551
Linear-by-Linear Association 0.020 1 0.888
Number of Valid Cases 852
a. 1 cells (16.7%) have expected count less than 5. The minimum expected count is 2.91
M. ILYAS ET AL BIOLOGIA (PAKISTAN) 50
The prevalence in subjects with age between 17-25years was 3.76. Highest prevalence (5.39%) was found in second age group (26-35years). In subjects having age more than 35years, the prevalence of hepatitis B infection was 2.82. Data was analyzed statistically using SPSS. χ2-test was performed. The p-value indicates there is no association between age groups and catching hepatitis B (Table 1).
DISCUSSION Hepatitis B virus (HBV) infection is a transmittable global health problem
(Idrees et al., 2004; Zhu et al., 2008) with about 2 billion infected persons worldwide (Paraskevis et al., 2002; Zhu et al., 2008; Li et al., 2010). There are about 400 million people suffering from chronic HBV infection (Alam et al., 2007). A lot of work has been published about the prevalence of hepatitis in different regions of Pakistan. Most of the studies are based on clinical or hospital patients or from the volunteer blood donors. However studies about the prevalence of hepatitis in Gujranwala district are very limited and no previous study has been found about the occurrence of these infections in populations of factory workers in this region. According to official figures, overall prevalence of hepatitis-B was reported as 2.5% in general populations of Pakistan. The frequency of hepatitis-B in province Punjab was 2.4% varying from 0.7% to 5.7% in different regions of province, indicating pockets of infection. The prevalence of hepatitis-B in Gujranwala was reported to be 2.9% (27/926) indicating that about 112,000 persons are affected from this disease (PMRC 2009). The prevalence of hepatitis-B in Gujranwala is higher as compared to nearby districts/regions like Sialkot (2.2%), Hafiz Abad (2.2%), Narowal (2.1%), Sheikupura (1.6%), Lahore (1.4%), and Gujrat (0.8%) (PMRC 2009). Mujeeb et al., (2000) has studied the seroprevalence of HBV and HCV infections among college going students and found that 2.21% were HbsAg. Khan et al., (2006) have reported that in Liaqatpur, among 1426 blood donors studied, the prevalence for hepatitis B was 5.96%. Bangash et al., (2009) found 5% of the healthy blood donors at Kurram Agency, Northern Areas, Pakistan, positive for hepatitis B surface antigen (HBsAg). In another study, the total prevalence of Hepatitis B and Hepatitis C was found to be 12.99% (Ahmad et al., 2006). The total prevalence of both Hepatitis-B and Hepatitis-C in population of college students was found to be 4.08% with 1.76% for hepatitis-B which is less in comparison to general population of the Gujranwala district which is 2.9% (Ilyas et al., 2011; PMRC 2009).Overall frequency of hepatitis in factory workers is 4% which is higher as compared to general population of the city which is 2.9% (PMRC, 2009). The prevalence is much higher in factory workers as compared to 1.76% of college going students of the region. This might reflect a difference of awareness in these two populations based on education. At national level, the frequency of hepatitis B positive for male subjects between the ages of 20 to 29 years and 30 to 39 years has been reported as 2.4% and 3.7%, respectively. The frequency for the same age groups in Punjab province was 3.2% and 4.2% respectively (PMRC 2009). In the present study the prevalence of HBV among factory workers between the age 17-25years and 26 to 35years is 3.8% and 5.4%, respectively which is apparently higher as compared to figures at national and
VOL 58 (1&2) HEPATITIS B VIRUS INFECTION 51
provincial levels. This is an indication that people working in factories are more prone/exposed to these transmittable viruses. In order to identify the social habits which enhance the risk of infection by working in a specific environment of industry, the observation of culture and daily life routine seems to be extremely important. Seiji et al., (1991a) studied prevalence of HBsAg positive cases in the sera of 428 factory workers in coastal city of Yantsi (China) and found highest prevalence in china. However in another study, the infection rate of hepatitis B among factory workers was found lower than the values reported early in the 1980s for Beijing populations or the values for populations in other parts of China (Seiji et al., 1991b). The present study is the first report of a community based study on the prevalence of HBV among male subjects working in factories of Gujranwala. However the study has several limitations. Firstly, although the study is based on a good sample size, yet there is a need to conduct study on still larger scale involving socio demographic data of the subjects. Secondly the sample size should be large enough to analyze prevalence according to the nature of industry. In spite of these limitations, however, findings of the present study have important public health implications for hepatitis intervention programs. Our results and others indicate that there is an urgent need to undertake such studies in other populations so that populations with higher prevalence can be identified and ways can be devised for the prevention and cure of these viral infections.
REFERENCES
Ahmad, I., Khan, S.B., Rehman, H.U., Khan, M.H. & Anwar, S. 2006. Frequency
of Hepatitis B and Hepatitis C among cataract patients. Gomal Journal of Medical Sciences., 4: 2-9.
Alam, M.M., Zaidi, S.Z., Malik, S.A., Naeem, A., Shaukat, S., Sharif, S., Angez, M., Khan, A. & Butt, J.A. 2007. Serology based disease status of Pakistani population infected with Hepatitis B virus. BMC Infect. Dis., 7: 64-69.
Ali, S.A., Donahue, R.M., Qureshi, H. & Vermund, S.H. 2009. Hepatitis B and hepatitis C in Pakistan: Prevalence and risk factors. Int. J. Infect. Dis., 13: 9-19.
Bangash, M.H., Bangash, T.H. & Alam, S. 2009. Prevalence of hepatitis B and
hepatitis C among healthy blood donors at Kurram Agency. J. Postgrad.
Med. Inst., 23: 140–145.
Choudhary, I.A., Khan, S.A. & Samiullah. 2005. Should we do Hepatitis-B and C
screening on each patient before surgery. Pak J Med Sci., 21: 278–80. GBC (Gujranwala Business Centre) 2013. availablea at
http://gbc.org.pk/index.php?option=com_content&view=article&id=49&Itemid=18)
Idrees, M., Khan, S. & Riazuddin, S. 2004. Common genotypes of hepatitis B virus. J. Coll. Phy. Sur. Pak., 14: 344-347.
Ilyas M., Iftikhar M., & Rasheed U. 2011. Prevalence of Hepatitis B and Hepatitis C in populations of college students in Gujranwala. Biologia-Pakistan, 57 (1&2):89-95.
M. ILYAS ET AL BIOLOGIA (PAKISTAN) 52
Jordan, J., 2010. Help for hepatitis sufferers. Available at
http://www.puristat.com/livercleansing/hepatitis.aspx Accessed 19th
February 2010.
Khan, M. A., Rehman, A., Ashraf, M., Ashraf, M., Ali, A. & Ditta, A. 2006.
Prevalence of HBV, HCV and HIV in blood donors at Liaquetpur.
Professional Med. J., 13(1): 23-26.
Koulentaki, M., Ergazaki, M., Moschandrea, J., Spanoudakis, S., Tzagarakis, N.,
Drandakis, P.E., Spandidos, D.A. & Kouroumalis, E.A. 2001. Prevalence
of Hepatitis–B and C Markers in high risk hospitalized patients in Crete.
A 5-year observational study. BMC Public Health., 1:1-8.
Li, G., Li, W., Guo, F., Xuc, S., Zhaod, N., Chena, S. & Liu, L. 2010. A novel real-
time PCR assay for determination of viral loads in person infected with
hepatitis B virus. J. Virol. Meth., 165: 9-14. Mujeeb, S.A., Aamir, K. & Mehmood, K. 2000. Seroprevalence of HBV, HCV and
HIV infections among college going first time voluntary blood donors. J. Pak. Med. Assoc., 50(8): 269-70.
Paraskevis, D., Haida, C., Tassopoulos, N., Raptopoulou, M., Tsantoulas, D., Papachristou, H., Sypsa, V. & Hatzakis, A. 2002. Development and assessment of a novel real-time PCR assay for quantitation of HBV DNA. J. Virol. Meth., 103: 201-212.
PMRC National Survey on Prevalence of Hepatitis B & C in General Population of
Pakistan (2007-2009). Pakistan Medical Research Council, Shahrah-e-
Jamhuriat, Sector G-5/2, Islamabad.
Previsani, N. & Lavanchy, D. 2002. WHO/CDS/CSR/LYO/2002.2:Hepatitis B.
Geneva: World Health Organization. Rahman, M., Akhtar, G.N. & Lodhi, Y. 2002. Seroprevalence of Hepatitis-C
antibodies in blood donors. Pak. J. Med. Sci., 18(3): 193-196. Seiji K., Takahashi M., Inoue O., Cai S., Huang M., Watanabe T., Kawai T.,
Yasugi T., Qu J., and Ikeda M., 1991(a). Prevalence of Hepatitis B Virus infection markers among a working population in a coastal city of Yantai, China. J Epidemiol, 1:11-17.
Seiji K, Inoue O, Liu SJ, Xu XP, Jin C, Cai SX, Nakatsuka H, Watanabe T, Uchida Y, Ikeda M. 1991(b). Prevalence of hepatitis B virus infection markers among factory workers in Beijing, China. Asia Pac J Public Health. 5(4):345-9.
Sohail M. I., Mughal M. S., Arshad N and Arshad M. 2010. Incidence of Hepatitis B and C in Industrial Areas of Sheikhupura and Kasur. Pakistan J. Zool., vol. 42(6): 673-677.
Waheed, Y., Shafi, T., Safi, S.Z. & Qadri, I. 2009. Hepatitis C virus in Pakistan: a
systematic review of prevalence, genotypes and risk factors. World J.
Gastroenterol., 15: 5647-5653.
Zhu, R., Zhang, H., Yu, H., Lim H., Ling, Y.Q., Hu, X.Q. & Zhu, H.G. 2008.
Hepatitis B virus mutations associated with in situ expression of hepatitis
B core antigen, viral load and prognosis in chronic hepatitis B patients.
Pathol. Res. Pract., 204: 731-742.
BIOLOGIA (PAKISTAN) 2012, 58 (1&2) 53-60 PK ISSN 0006 - 3096
*Corresponding author: [email protected]
Isolation of indigenous bacteria and consortia development
for decolorization of textile dyes
RASHID MAHMOOD1, FAIZA SHARIF
2, SIKANDER ALI
3,
*MUHAMMAD UMAR HAYYAT
4, TANZEEM AKBAR CHEEMA
5
1,2,4Sustainable Development Study Centre GC University Lahore,
3Institute of Industrial Biotechnology GC University Lahore,
5 Department of Botany, GC University Lahore
ABSTRACT
Twenty one bacterial isolates were obtained from textile affected soil, sludge and
textile effluent. All the isolates were screened at 50, 100, 150 and 200ppm of red, green, yellow and black textile dyes. The Isolates 1, 3, 5, 7, 9, and 20 were screened on the basis of ability to degrade the dyes efficiently more than 60%, within 24h at 50, 100, 150 and 200ppm of red, green, yellow and black dyes. Four consortia were developed using combinations of these bacterial isolates. Among them consortium BMP1/SDSC-01 had maximum decolorization ability. It was 84% for green and red textile dyes while 85% for black and yellow. This study will help to establish low cost treatment of textile effluents in Pakistan by applying bioremediation. Key words: Bioremediation, Microbes, Wastewater, Textile industry.
INTRODUCTION
Textile industries use large quantities of water (1 kg of fabric requires
about 150 liters of water) for different processes. Textile effluents colour the drains and ultimately water bodies diminish the water quality. These effluents contain considerable amount of suspended solids, additives, detergents, surfactants, carcinogenic amines, formaldehyde, heavy metals, and dyes. Fluctuating pH, high temperature, COD and complex coloration are main characters of textile effluent; it poses serious environmental threats to receiving water bodies (Saratale et al., 2009; Jadhav et al., 2010). Physico-chemical methods (adsorption, ion exchange, membrane filtration, ozonation, photooxidation and reverse osmosis) are used for color removal from textile effluents (Daneshvar et al., 2004). These methods have high operational cost and produce much more sludge and waste (Kumar et al., 2006).
The reuse of industrial effluents can be an attractive option for meeting the increasing demand of water. For this purpose biological method using bacteria has been shown to be efficient, ecofriendly and more cost-effective (Phugare et al., 2011). The bacteria show very promising ability to decolor, degrade, detoxify and metabolize a number of compounds in various biological treatment processes. Due to ubiquitous nature of bacteria, they can be used as invaluable tools for the biological treatment of textile effluent. As a preliminary step in the development of biological treatment for textile effluent, there is a need to isolate bacterial strains with a potential to decolorize and degrade textile dyes
R. MAHMOOD ET AL BIOLOGIA (PAKISTAN) 54
and remove other pollution parameters (Olukanni et al., 2006). A number of bacterial species belonging to genera Bacillus, Micrococcus, Proteus, Pseudomonas, Sphingomonas and Staphylococcus were reported to have been isolated for bio-treatment of textile dyes (Ali et al., 2009; Zhang et al., 2010; Ayed et al., 2011; Chen et al., 2011).
The removal of textile carcinogenic pollutants is the major task of the bioremediation. A simple single step process is not possible because a sequence of biological transformations is needed to eliminate such pollutants. Genetically modified bacteria can be used to solve this problem constructing a strain with an enhanced expression of enzymatic system transformations. But the introduction of such strain in the natural environment needs to ensure two things; first, the genetically modified bacteria must have the ability to co-exist with indigenous flora and fauna without disturbing their ecology, second, before release the genetically modified organisms must fulfill all rules and regulations set by WHO (Drobnõk, 1999). However the removal of textile carcinogenic pollutants can be made possible by developing a microbial community called consortium comprising populations with particular bio-transformation activities. Therefore, isolation of indigenous bacteria can be preferred over genetically modified bacteria. For this purpose, new indigenous bacterial strains were explored by isolating them from textile wastewater, sludge and affected soils and then consortia were developed.
MATERIALS AND METHODS
Sample Collection and Isolation of Bacteria
Wastewater (Textile effluents), sludge and affected soil samples were collected from Hudiara drain near Nishat Mills Limited 5Km Off - 22Km Ferozepur Road Lahore, Pakistan. One sample of effluent affected soil, four sludge samples were collected from source, 5, 500 and 1000 meters away from source (Sludge I, Sludge II, Sludge III and Sludge IV) where as four wastewater samples were collected from main textile effluent; at source, 5, 500 and 1000 meters away from source (Wastewater I, Wastewater II, Wastewater III and Wastewater IV). They were transferred to sterile containers and brought to laboratory (APHA, 2005). The isolation of textile dyes decolorizing, degrading and detoxifying indigenous bacteria was carried out through serial dilution method (Jadhav et al., 2010). Screening and Culture Maintenance
Isolated bacterial strains were screened out by incubating them on nutrient agar medium containing red (Carmine) green (Light Green) black (Erichrome Black T) and yellow (Metanil Yellow) dyes 50, 100, 150 and 200ppm of each. The stock cultures of screened bacterial isolates were maintained routinely on the nutrient agar medium and stored at 4
oC (Kaur et al., 2010)
Identification The screened bacterial strains were identified on morphological,
biochemical and physiological properties using the protocol given in Bergey’s Manual of Determinative Bacteriology (Holt et al., 1994).
VOL. 58 (1&2) ISOLATION OF INDIGENOUS BACTERIA 55
Development of bacterial consortia The isolates for the consortium development were selected based on
criteria: ability to degrade and decolorize the dyes efficiently above 60%, at least within 3 days and also with ability to degrade decolorize red, green, black and yellow dyes. A loopful of the selected isolates was individually inoculated for 24 h to form a consortium (Tony et al., 2009). Decolorization of textile dyes
Decolorization ability of bacterial consortia was assayed by using spectrophotometer (SpectroScan 80D UV–VIS) at optimum wavelength 510 nm for red and black while 410 nm for yellow and 340 nm for green dyes. The decolorization experiments were performed in triplicates on nutrient broth by taking 200ppm of each dye at 37
0C and pH 6.5 to 7.5. The decolorization activity
was expressed in terms of percentage decolorization using following formula (Silveira et al., 2009).
x 100 Where; At0 = initial absorbance Atf = absorbance at incubation time
RESULTS Isolation and Screening of Dye Decolorizing Isolated Indigenous Bacteria
Morphologically distinct colonies were observed it was found that 21 showed growth (50 ppm of red, green, black and yellow dyes) out of total 76 colonies. All the 21 morphological distinct colonies were screened at 50, 100, 150 and 200ppm of red, green, yellow and black dyes (Table 1). The Isolates 1, 3, 5, 7, 9, and 20 were screened on the basis of ability to degrade the dyes efficiently more than 60%, within 24h at 50, 100, 150 and 200ppm of red, green, yellow and black dyes. These isolates also had ability to degrade mixture of red, green, black and yellow dyes, because they showed growth at 800ppm mixture of all the four dyes (200 ppm each). Identification of Dye Decolorizing Isolated Indigenous Bacteria
The isolates were identified as Bacillus subtilus (Isolate 20), Bacillus cereus (Isolate 3), Bacillus mycoides (Isolate 1), Bacillus sp. (Isolate 5), Pseudomonas sp. (Isolate 9) and Micrococcus sp. (Isolate 7) by standard physiological, morphological and biochemical tests (Table 2). Development of Consortia
The consortia were developed from bacteria, those were isolated from three sources i.e. textile effluent, sludge, and affected soil. They worked together and gave better results. Following four consortia were developed using combinations of bacterial isolates.
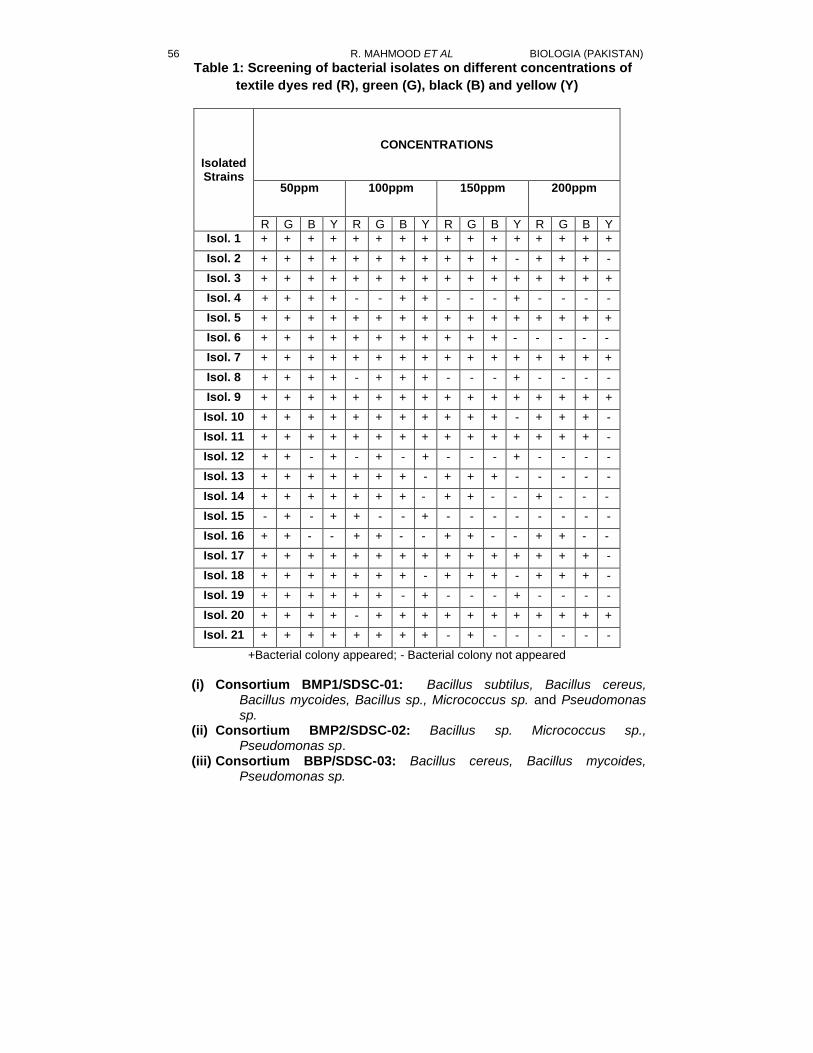
R. MAHMOOD ET AL BIOLOGIA (PAKISTAN) 56
Table 1: Screening of bacterial isolates on different concentrations of
textile dyes red (R), green (G), black (B) and yellow (Y)
Isolated Strains
CONCENTRATIONS
50ppm 100ppm 150ppm 200ppm
R G B Y R G B Y R G B Y R G B Y
Isol. 1 + + + + + + + + + + + + + + + +
Isol. 2 + + + + + + + + + + + - + + + -
Isol. 3 + + + + + + + + + + + + + + + +
Isol. 4 + + + + - - + + - - - + - - - -
Isol. 5 + + + + + + + + + + + + + + + +
Isol. 6 + + + + + + + + + + + - - - - -
Isol. 7 + + + + + + + + + + + + + + + +
Isol. 8 + + + + - + + + - - - + - - - -
Isol. 9 + + + + + + + + + + + + + + + +
Isol. 10 + + + + + + + + + + + - + + + -
Isol. 11 + + + + + + + + + + + + + + + -
Isol. 12 + + - + - + - + - - - + - - - -
Isol. 13 + + + + + + + - + + + - - - - -
Isol. 14 + + + + + + + - + + - - + - - -
Isol. 15 - + - + + - - + - - - - - - - -
Isol. 16 + + - - + + - - + + - - + + - -
Isol. 17 + + + + + + + + + + + + + + + -
Isol. 18 + + + + + + + - + + + - + + + -
Isol. 19 + + + + + + - + - - - + - - - -
Isol. 20 + + + + - + + + + + + + + + + +
Isol. 21 + + + + + + + + - + - - - - - -
+Bacterial colony appeared; - Bacterial colony not appeared
(i) Consortium BMP1/SDSC-01: Bacillus subtilus, Bacillus cereus,
Bacillus mycoides, Bacillus sp., Micrococcus sp. and Pseudomonas sp.
(ii) Consortium BMP2/SDSC-02: Bacillus sp. Micrococcus sp., Pseudomonas sp.
(iii) Consortium BBP/SDSC-03: Bacillus cereus, Bacillus mycoides, Pseudomonas sp.
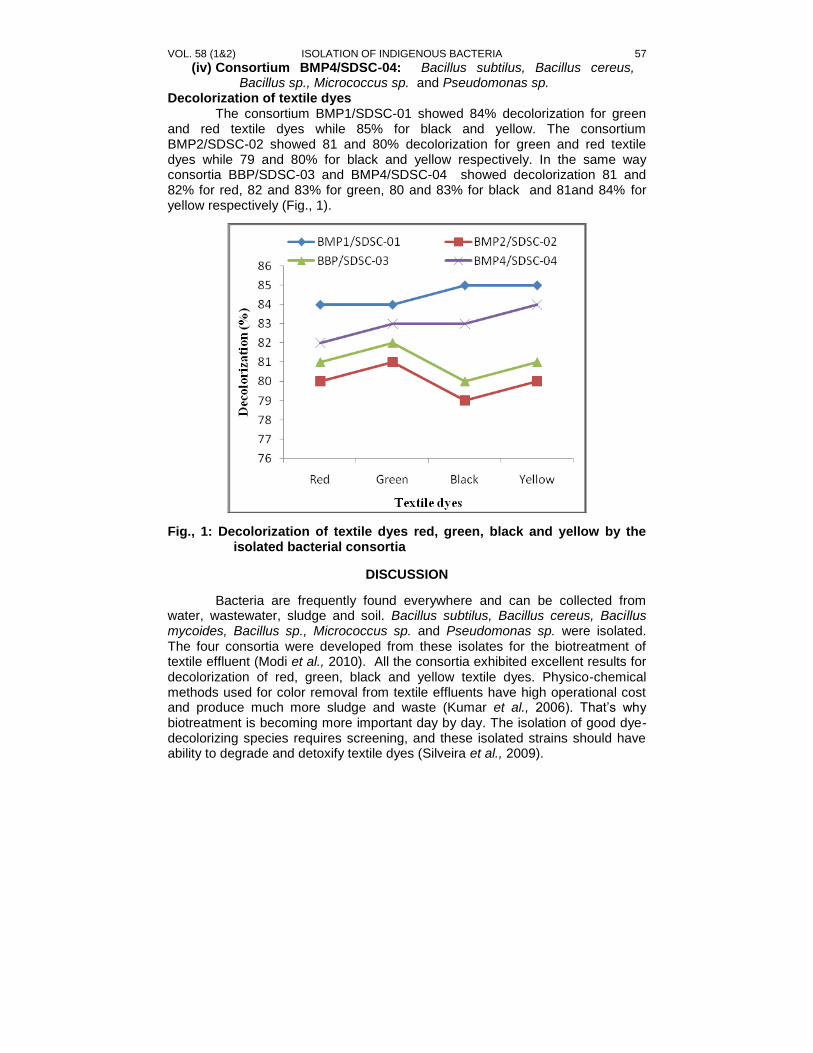
VOL. 58 (1&2) ISOLATION OF INDIGENOUS BACTERIA 57
(iv) Consortium BMP4/SDSC-04: Bacillus subtilus, Bacillus cereus, Bacillus sp., Micrococcus sp. and Pseudomonas sp.
Decolorization of textile dyes The consortium BMP1/SDSC-01 showed 84% decolorization for green
and red textile dyes while 85% for black and yellow. The consortium BMP2/SDSC-02 showed 81 and 80% decolorization for green and red textile dyes while 79 and 80% for black and yellow respectively. In the same way consortia BBP/SDSC-03 and BMP4/SDSC-04 showed decolorization 81 and 82% for red, 82 and 83% for green, 80 and 83% for black and 81and 84% for yellow respectively (Fig., 1).
Fig., 1: Decolorization of textile dyes red, green, black and yellow by the isolated bacterial consortia
DISCUSSION
Bacteria are frequently found everywhere and can be collected from water, wastewater, sludge and soil. Bacillus subtilus, Bacillus cereus, Bacillus mycoides, Bacillus sp., Micrococcus sp. and Pseudomonas sp. were isolated. The four consortia were developed from these isolates for the biotreatment of textile effluent (Modi et al., 2010). All the consortia exhibited excellent results for decolorization of red, green, black and yellow textile dyes. Physico-chemical methods used for color removal from textile effluents have high operational cost and produce much more sludge and waste (Kumar et al., 2006). That’s why biotreatment is becoming more important day by day. The isolation of good dye-decolorizing species requires screening, and these isolated strains should have ability to degrade and detoxify textile dyes (Silveira et al., 2009).
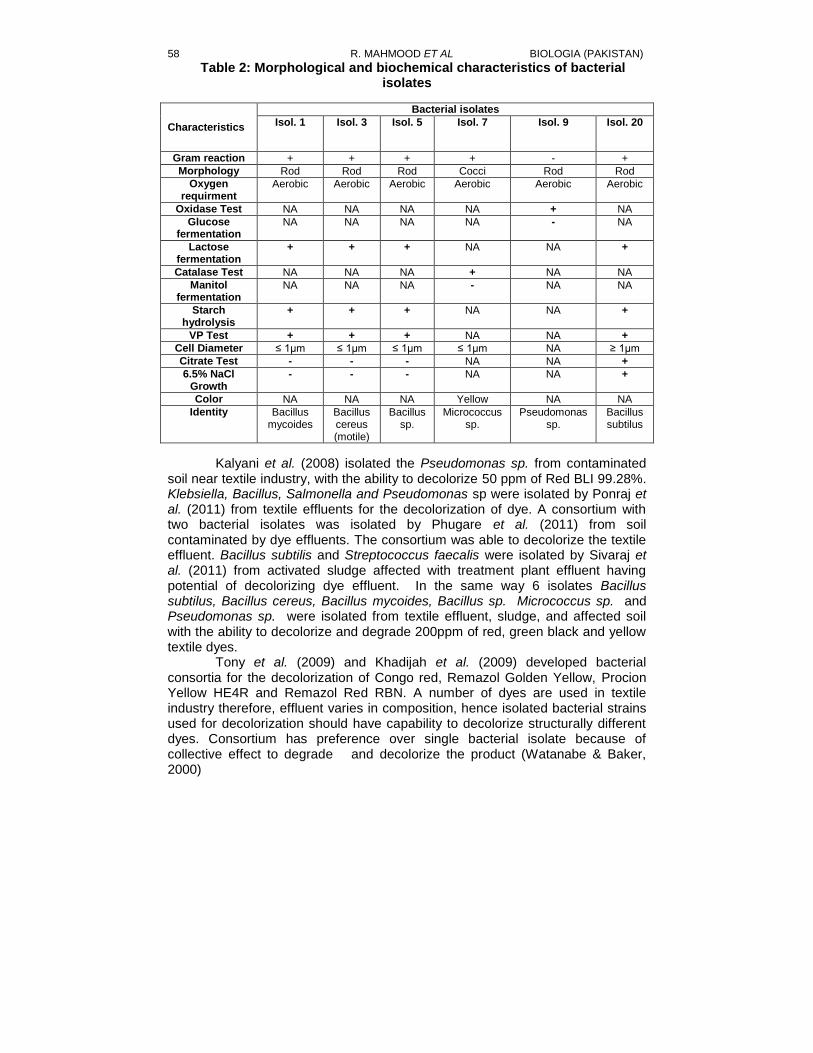
R. MAHMOOD ET AL BIOLOGIA (PAKISTAN) 58
Table 2: Morphological and biochemical characteristics of bacterial isolates
Characteristics
Bacterial isolates Isol. 1 Isol. 3 Isol. 5 Isol. 7 Isol. 9 Isol. 20
Gram reaction + + + + - + Morphology Rod Rod Rod Cocci Rod Rod
Oxygen requirment
Aerobic Aerobic Aerobic Aerobic Aerobic Aerobic
Oxidase Test NA NA NA NA + NA Glucose
fermentation NA NA NA NA - NA
Lactose fermentation
+ + + NA NA +
Catalase Test NA NA NA + NA NA Manitol
fermentation NA NA NA - NA NA
Starch hydrolysis
+ + + NA NA +
VP Test + + + NA NA + Cell Diameter ≤ 1µm ≤ 1µm ≤ 1µm ≤ 1µm NA ≥ 1µm Citrate Test - - - NA NA + 6.5% NaCl
Growth - - - NA NA +
Color NA NA NA Yellow NA NA Identity Bacillus
mycoides Bacillus cereus (motile)
Bacillus sp.
Micrococcus sp.
Pseudomonas sp.
Bacillus subtilus
Kalyani et al. (2008) isolated the Pseudomonas sp. from contaminated soil near textile industry, with the ability to decolorize 50 ppm of Red BLI 99.28%. Klebsiella, Bacillus, Salmonella and Pseudomonas sp were isolated by Ponraj et al. (2011) from textile effluents for the decolorization of dye. A consortium with two bacterial isolates was isolated by Phugare et al. (2011) from soil contaminated by dye effluents. The consortium was able to decolorize the textile effluent. Bacillus subtilis and Streptococcus faecalis were isolated by Sivaraj et al. (2011) from activated sludge affected with treatment plant effluent having potential of decolorizing dye effluent. In the same way 6 isolates Bacillus subtilus, Bacillus cereus, Bacillus mycoides, Bacillus sp. Micrococcus sp. and Pseudomonas sp. were isolated from textile effluent, sludge, and affected soil with the ability to decolorize and degrade 200ppm of red, green black and yellow textile dyes.
Tony et al. (2009) and Khadijah et al. (2009) developed bacterial consortia for the decolorization of Congo red, Remazol Golden Yellow, Procion Yellow HE4R and Remazol Red RBN. A number of dyes are used in textile industry therefore, effluent varies in composition, hence isolated bacterial strains used for decolorization should have capability to decolorize structurally different dyes. Consortium has preference over single bacterial isolate because of collective effect to degrade and decolorize the product (Watanabe & Baker, 2000)
VOL. 58 (1&2) ISOLATION OF INDIGENOUS BACTERIA 59
Bioremediation has excellent potential to remove the textile dyes. This task is also carried out by genetically modified bacteria (GMB). But their frequent use is hindered by two basic problems. First one is the ability of GMB co-existence with indigenous flora and fauna without troubling the ecology of natural communities. Secondly, before release of GMB all rules and regulations given by World Health Organization must be fulfilled (Drobnõk, 1999). While the removal of textile dyes is also possible by developing consortium. Therefore, isolation of indigenous bacteria is preferred to formulate consortium over genetically modified bacteria to overcome the above mentioned two basic problems. For these reasons new indigenous bacterial strains were isolated and then consortia were formulated. Conclusion
The textile dyes undoubtedly impart high load of carcinogenic pollutants, conventional physico-chemical methods are not enough to remove them. Bioremediation by native bacteria being ecofriendly is preferred over these methods. Four consortia were formulated using combinations of six selected bacteria among twenty one bacterial isolates. Consortium BMP1/SDSC-01 consisting of Bacillus subtilus, Bacillus cereus, Bacillus mycoides, Bacillus sp., Micrococcus sp. and Pseudomonas sp. had greater potential to treat textile dyes present in effluent. Acknowledgements
The work was carried out and completed at Environmental Microbiology & Biotechnology Lab, Sustainable Development Study Centre (SDSC), at GC University Lahore. We gratefully acknowledge the centre for providing the necessary funding to carry out this research.
REFERENCES
Ali, N., Hameed, A. & Ahmed, S., 2009. Physicochemical characterization and bioremediation perspective of textile effluent, dyes and metals by indigenous bacteria. J. Hazard. Mater. 164: 322–328.
APHA (American Public Health Association). 2005. Standard Methods for the Examination of Water and Wastewater. American Public Health Association. Washington, D. C., USA.1-874.
Ayed, L., Mahdhi, A., Cheref, A. & Bakhrouf, A., 2011. Decolorization and degradation of azo dye Methyl Red by an isolated Sphingomonas paucimobilis: Biotoxicity and metabolites characterization. Desalination, 274: 272–277.
Chen, B., Hsueh, C., Chen, W. & Li, W., 2011. Exploring decolorization and halotolerance characteristics by indigenous acclimatized bacteria: Chemical structure of azo dyes and dose–response assessment. J. Taiwan Inst. Chem. E. 42: 816–825.
Daneshvar, N., Salari, D. & Khataee , A. R., 2004. Photocatalytic degradation of azo dye acid red 14 in water on ZnO as an alternative catalyst to TiO2. J. Photochem. Photobiol. A. 162: 317–322.
Drobnõk, J., 1999. Genetically modified organisms (GMO) in bioremediation and Legislation. Int. Biodeterior. Biodegrad. 44: 3-6.
R. MAHMOOD ET AL BIOLOGIA (PAKISTAN) 60
Holt, J. G., Krieg, N. R., Sneath, P. H., Staley J. T. & Williams, S. T., 1994. Bergey’s Manual of Determinative Bacteriology. MD Williams and Wilkins, Baltimore, Maryland. USA.1-787.
Jadhav, J. P., Phugare, S. S., Dhanve, R. S. & Jadhav, S. B., 2010. Rapid biodegradation and decolorization of direct orange 39 (orange TGLL) by an isolated bacterium Pseudomonas aeruginosa strain BCH. Biodegradation, 21: 453–463.
Kalyani, D. C., Patil, P. S., Jadhav, J. P. & Govindwar., S. P., 2008. Biodegradation of reactive textile dye Red BLI by an isolated bacterium Pseudomonas sp. SUK1. Bioresource Technol. 99: 4635–4641.
Kaur, A., Vats, S., Rekhi, S., Bhardwaj, A., Goel, A., Tanwar, R. S. & Gaur, K. K., 2010. Physico-chemical analysis of the industrial effluents and their impact on the soil microflora. Procedia Environ. Sci. 2: 595–599.
Khadijah, O., Lee K. K., Mohd Faiz F. & Abdullah., 2009. Isolation, screening and development of local bacterial consortia with azo dyes decolourising capability. Mal. J. Microbiol. 5(1): 25-32.
Kumar, K. V., Ramamurthi, V. & Sivanesan, S., 2006. Biosorption of malachite a green cationic dye onto Pithophora sp., a fresh water algae. Dyes Pigments, 69: 74–79.
Modi, H. A., Rajput, G. & Ambasana, C., 2010. Decolorization of water soluble azo dyes by bacterial cultures, isolated from dye house effluent. Bioresource Technol. 101: 6580–6583.
Olukanni O. D., Osuntoki, A. A. & Gbenle, G. O., 2006. Textile effluent biodegradation potentials of textile effluent-adapted and non-adapted bacteria. Afr. J. Biotechnol. 5 (20): 1980-1984.
Phugare, S. S., Kalyani, D.C., Surwase, S. N. & Jadhav, J. P., 2011. Ecofriendly degradation, decolorization and detoxification of textile effluent by a developed bacterial consortium. Ecotox. Environ. Safe. 74: 1288–96.
Ponraj, M., Gokila, K. & Zambare, V., 2011. Bacterial decolorization of textile dye Orange 3R. I. J. A. Biotechnol. Res. 2(1): 168-177.
Saratale, R. G., Saratale, G. D., Kalyani, D. C., Chang, J. S. & Govindwar, S. P., 2009. Enhanced decolorization and biodegradation of textile azo dye Scarlet R by using developed microbial consortium-GR. Bioresource Technol, 100: 2493–2500.
Silveira, E., Marques, P. P., Silva, S. S., Lima-Filho, J. L., Porto, A. L. F. & Tambourgi, E. B., 2009.Selection of Pseudomonas for industrial textile dyes decolourization. Int. Biodeterior. Biodegrad. 63: 230–235.
Sivaraj, R., Dorthy C. A. M. & Venckatesh, R., 2011. Isolation, characterization and growth kinetics of bacteria metabolizing textile effluent. J. Biosci. Technol. 2(4): 324-330.
Tony, B. D., Goyal, D. & Khanna, S., 2009. Decolorization of textile azo dyes by aerobic bacterial consortium. Int. Biodeterior. Biodegrad. 63: 462–469.
Watanabe, K. & Baker, P. W., 2000.Environmentally relevant microorganisms. J. Biosci. Bioeng. 89: 1-11.
Zhang, M., Chen, W., Chen, B., Chang, C., Hsueh, C., Ding, Y., Lin, K. & Xu, H., 2010. Comparative study on characteristics of azo dye decolorization by indigenous decolorizers. Bioresource Technol. 101: 2651–2656.
BIOLOGIA (PAKISTAN) 2012, 58 (1&2), 61-64 PK ISSN 0006 - 3096
*Corresponding author [email protected]
Effect of Sex over Normal Physiology of E. coli Antiserum
K99 Infected Buffalo Neonates
SYED MUZAFFAR HUSSAIN BUKHARI1, GHULAM MURTAZA ARSHAD
2,
MUHAMMAD ATHAR KHAN3& *MUHAMMAD FIAZ QAMAR
4
1Assistant Disease Investigation Officer, District Diagnostic Laboratory, Hafizabad
2Veterinary Officer, District Diagnostic Laboratory, Hafizabad
3Head of the Department of Epidemiology and Public Heath, University of Veterinary
and Animal Sciences, Lahore 4Assistant Professor, Department of Zoology, GC University, Lahore
ABSTRACT
The purpose of study was to evaluate the effect of sex over normal physiology of
buffalo neonates against induced E. coli antiserum K99 infection. In this study thirty calves were divided into three groups i.e., Group A; the male neonates; Group B; the female neonates and Group C; the control group. Physiological data gathered within first 24 hours, next 12 hours and still next to 28 days of birth. The study revealed significant increase in monosytes and lymphocytes (P<0.05) within 24 hours to 36 hours and 36 hours to 28 days regardless of sex. PCV found significantly increased in female neonates rather than male neonates. The sex plays non-significant role in neonatal buffalo calf immunity against E. coli K99 antiserum induced passively. Key Words: Buffalo, Diarrhoea, Neonate Physiology, k99, Eschersiasis.
INTRODUCTION Neonatal buffalo calf diarrhoea is the most common disease complex (Hanif et al., 1996). It has been estimated that 75% of early calf mortality in dairy herds is caused by acute diarrhea in pre-weaning period (Roderick and Hovi, 1999), as the calves are bornagammaglobulinemic so the danger of infection is increased in the calves, (Khan & Khan, 1996). Among the infectious agents no more potent pathogen is known than a virulent form coliform organism (Kahn, 2010). Diarrhea due to K99 antiserum of E. coli is seen in calves <3-5 days old. Verotoxic E. coli associated with human diseases can also be isolated from the faeces of healthy cattle and buffalo (Kahn, 2010). In diarrhoeic calves, dehydration is seen due to which there is negative fluid balance, lower level of circulating blood volume and tissue fluid decreases, (Amalendu, 2003). Hence physiological phenomenon lowers in dairhoeic calves (Mohaiuddin, 1994). Sign and symptoms for diarrhea include profuse watery diarrhea, progressive dehydration, acidosis and finally death within a few days (Aly et al., 1993). Common pathological lesions are dehydration, emaciation and a fluid filled intestinal tract with no other gross lesions (Brenner et al., 1995).
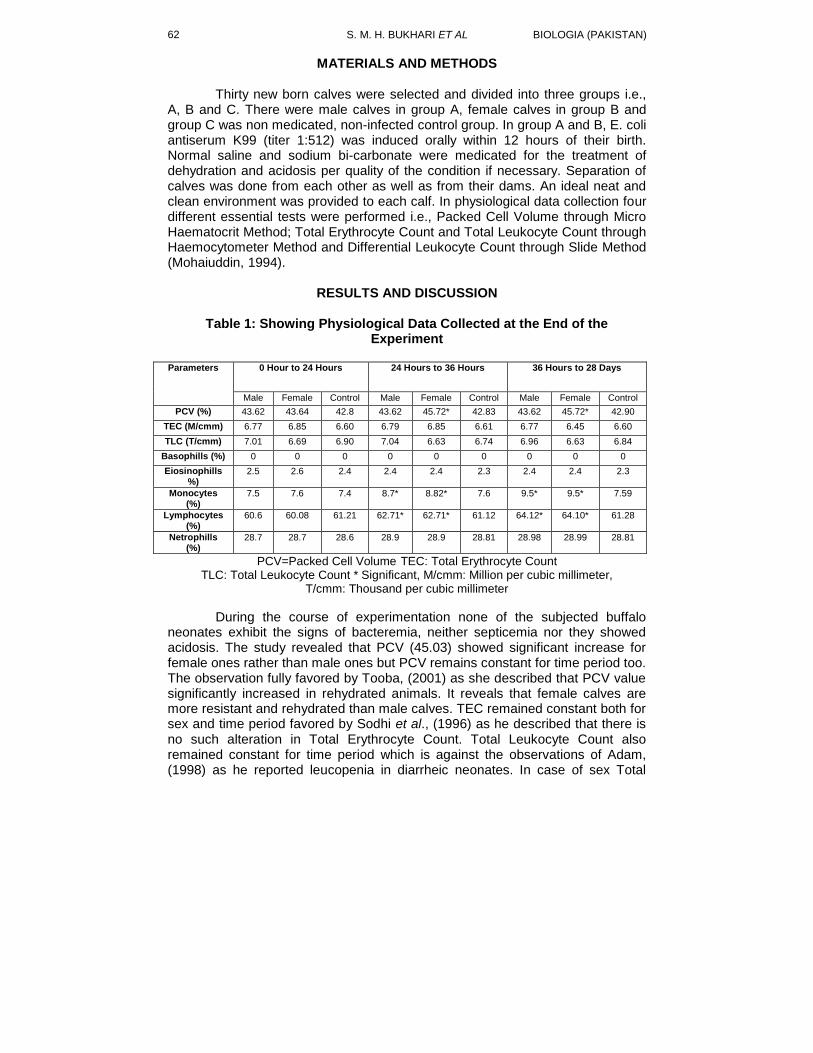
S. M. H. BUKHARI ET AL BIOLOGIA (PAKISTAN)
62
MATERIALS AND METHODS
Thirty new born calves were selected and divided into three groups i.e., A, B and C. There were male calves in group A, female calves in group B and group C was non medicated, non-infected control group. In group A and B, E. coli antiserum K99 (titer 1:512) was induced orally within 12 hours of their birth. Normal saline and sodium bi-carbonate were medicated for the treatment of dehydration and acidosis per quality of the condition if necessary. Separation of calves was done from each other as well as from their dams. An ideal neat and clean environment was provided to each calf. In physiological data collection four different essential tests were performed i.e., Packed Cell Volume through Micro Haematocrit Method; Total Erythrocyte Count and Total Leukocyte Count through Haemocytometer Method and Differential Leukocyte Count through Slide Method (Mohaiuddin, 1994).
RESULTS AND DISCUSSION
Table 1: Showing Physiological Data Collected at the End of the
Experiment
Parameters 0 Hour to 24 Hours 24 Hours to 36 Hours 36 Hours to 28 Days
Male Female Control Male Female Control Male Female Control
PCV (%) 43.62 43.64 42.8 43.62 45.72* 42.83 43.62 45.72* 42.90
TEC (M/cmm) 6.77 6.85 6.60 6.79 6.85 6.61 6.77 6.45 6.60
TLC (T/cmm) 7.01 6.69 6.90 7.04 6.63 6.74 6.96 6.63 6.84
Basophills (%) 0 0 0 0 0 0 0 0 0
Eiosinophills %)
2.5 2.6 2.4 2.4 2.4 2.3 2.4 2.4 2.3
Monocytes (%)
7.5 7.6 7.4 8.7* 8.82* 7.6 9.5* 9.5* 7.59
Lymphocytes (%)
60.6 60.08 61.21 62.71* 62.71* 61.12 64.12* 64.10* 61.28
Netrophills (%)
28.7 28.7 28.6 28.9 28.9 28.81 28.98 28.99 28.81
PCV=Packed Cell Volume TEC: Total Erythrocyte Count TLC: Total Leukocyte Count * Significant, M/cmm: Million per cubic millimeter,
T/cmm: Thousand per cubic millimeter
During the course of experimentation none of the subjected buffalo neonates exhibit the signs of bacteremia, neither septicemia nor they showed acidosis. The study revealed that PCV (45.03) showed significant increase for female ones rather than male ones but PCV remains constant for time period too. The observation fully favored by Tooba, (2001) as she described that PCV value significantly increased in rehydrated animals. It reveals that female calves are more resistant and rehydrated than male calves. TEC remained constant both for sex and time period favored by Sodhi et al., (1996) as he described that there is no such alteration in Total Erythrocyte Count. Total Leukocyte Count also remained constant for time period which is against the observations of Adam, (1998) as he reported leucopenia in diarrheic neonates. In case of sex Total
VOL. 58 (1&2) EFFECT OF SEX 63
Leukocyte Count found constant. This is against the observations of Bukhari, (2003) as he described that TLC can never be constant at any condition. This difference may be due to use of verotoxic strain which may alter the observation. For time period lymphocytes (62.4) and monocytes (8.57) showed significant increase while showed non-significant for sex. These observations are against the observations of Tooba, (2001). The reason for that difference is that she used rehydration as a key factor while here rehydration is excluded. For sex there is non-significant difference which is fully favored by Tooba, (2001). It is well established phenomenon that K99 antiserum, induced immunity in buffalo neonates to combat the hardships of diarrhea. These observations are fully supported by the observations of Bukhari, (2002). So in the light of the present study it can be demonstrated that there is non-significant role of sex towards neonatal buffalo calf immunity against E. coli K99 antiserum induced passively.
REFERENCES
Adam, S. E. T., 1998. Toxicity of RhazzyaStricta to Sheep.Vet. & Human Toxicol.40:2 68-69.
Aly, A. O. Z., Abd-El-Wahed, H., Kahilo, K. & El-Shaikh, A. R., 1993. Some Studies On Clinical Hematological and Biochemical Changes Diarrheic Buffalo Calves With Reference To Hygienic Conditions. Assiut Vet. Med. J.,35:91-104
Amalendu, C., 2003. Textbook of Clinical Veterinary Medicine 2nd
Ed. 80: 572 -573.
Brenner, J. D., Elad, H. M., Markovic, A., Perl, S. & Van, H. M., 1995. Microbiological Findings in Young Calves Suffering From Neonatal Diseases.Israel J. Vet. Med.,50:21-24
Bukhari, S. M. H., 2002. Chemo Prophylactic Trials against Neonatal Calf Diarrhea and the Study of relevant Hematological and Serological Parameters. On Line J. Bio. Sci., 569-572
Bukhari, S. M. H., 2003. Effect of Chemoprophylaction against Neonatal Buffalo Calf Diarrhea over Normal Physiology of Buffalo Neonates.On Line J. Bio. Sci., 282-286.
Kahn, C. M., 2010.The Merck Veterinary Manual.Ed. Scott Line. 10th Ed.
Whitehouse Station, Nj: Merck, 223. Hanif, M. K., Khalil, M. A., Rafiq, M., Saleem, M. & Anees, M., 1996.Goat
Farming, 14. Khan, A. & Khan, M. Z., 1996. Neonatal Calf Mortality in Pakistan Ii:
Hematological Indices in Healthy and Disease Buffalo and Cow Neonates. Buff. J.,12:231-242.
Mohaiuddin, S. H., 1994. A Handbook of Veterinary Clinical Pathology. Roderick, S. & Hovi, M., 1999. Animal Health and Welfare in Organic Livestock
Systems: Identification of Constraints and Priorities. A Report to MAFF.University of Reading.
Tooba Z., 2001. Clinicopathological and Serum Biochemical Changes in Induced Buffalo Neonatal Calf Diarrhea and Its Trials. Thesis From University Of Agriculture Faisalabad.

S. M. H. BUKHARI ET AL BIOLOGIA (PAKISTAN)
64
Sodhi M. P. S., Khanna, R. N. S., Sadhna, J. R. & Chand, P., 1996. Experimental Abisidia Corymlifera Infection in Rabbits: Clinicopathological Studies. Mycopathologica, 134:7-11
BIOLOGIA (PAKISTAN) 2012, 58 (1&2), 65-71 PK ISSN 0006 - 3096
†Corresponding author: [email protected]
Dipotassium hydrogen phosphate improves lipase
production at a neutral pH of phosphate buffer by
Rhizopous oligosporous
SIKANDER ALI1†
, UMER FAROOQ AWAN2 & WAJID JAVED
3
1Institute of Industrial Biotechnology, GC University Lahore, Pakistan
2University of Science & Technology, Hefei, PR China 3University of Darwin, Northern Territory, Australia
ABSTRACT
In the present study, lipase production by wild-culture (IIBt-4) and mutant strain (ISU
uv-16) of Rhizopus oligosporus was investigated by solid state fermentation technique.
The mutant strain exhibited 9.3 U/g enzyme activity in 48 h with 139 mg/ml extracellular protein while wild-type gave only 3.5 U/g with 56 mg/ml protein content in 60-72 h after incubation. Therefore ISU
uv-16 was selected for optimization. Among various agricultural
by-products, the maximum enzyme activity (9.5 U/g) was observed with the 10 g of almond meal. However, the most notable finding was the addition of 0.5 g/l K2HPO4 which strongly influenced enzyme production (47 U/g) at a neutral pH (7) of phosphate buffer,
which is highly significant (HS, p0.05). Key words: Rhizopus oligosporus, lipase, microbial fermentation, solid wastes.
INTRODUCTION
Lipases (triacylglycerols acylglycerols, EC 3.1.1.3) are enzymes that hydrolyze fatty acyl ester bonds of glycerols at the interface between oil and water. In organic medium lipases are able to catalyze reactions of synthesis and transesterification of glycerides and phosphoglycerides, as well as variety of non-glycerides, ester bonds (Hamed, 1997). These enzymes are the most versatile biocatalysts and bring about a range of bioconversion reactions such as hydrolysis, inter esterification, esterification, alcoholysis, acidolysis and aminolysis. The pivotal role of lipases in the processes and products of the food and flourings industry are well marked. The panorama of lipases in the manufacture of the fine chemicals is depicted with special emphasis on pharmaceuticals pesticides, cosmetics, biosensors and detergents (Abramic et al., 1999; Bezbradica et al., 2007). Microbial lipases are both extracellular and intercellular enzymes, which are produced by various fungi (Fickers et al., 2011). Mould lipases have got attention due to their particular properties. They constitute lipases of high catalytic power and stability. Among different fungi Rhizopus oligosporous, have shown higher productivity of lipases (Toshihiko et al., 1989). The fermentation processes became fermentation technology of the day being cheaper and capable of fulfilling increased demands (Bucke 1988). Lipases can be produced by submerged fermentation and solid fermentation (Haung et al., 1995). Previously the yield of lipases obtained from solid state and submerged fermentation has been compared and it was concluded that solid
S. ALI ET AL BIOLOGIA (PAKISTAN) 66
state fermentation gave maximum lipase production. It was found that lipase production was highly sensitive to pH changes during fermentation (Pandey, 1992; Rekha et al., 2012). The present study concerns with the effect of phosphate ion concentration and different pH of the phosphate buffer (as diluent) for lipase production by Rhizopus oligosporus.
MATERIALS AND METHODS
Organism, Improvement and Maintenance Wild-culture (IIBt-4) and mutant strain (ISU
uv-16) of Rhizopous
oligosporus obtained from the fungal culture collection, Dept. of Botany, GC Lahore were used in present study. The mutant was developed by treating the wild with 1.2×10
6 J/S/cm
2 dose of ultraviolet radiations (UV~255nm) for 30 min.
The cultures were maintained on agar malt medium (pH 4.8) and stored at 4ºC in a cold-cabinet. Inoculum Preparation Ten millilitres of 0.05% (w/v) dioctyl ester of sodium sulfosuccinic acid (monoxal OT) was added to a 4-6 day old slant culture of R. oligosporus. The spores were scratched with a sterilized inoculating needle and tube was shaken gently. A hemocytometer was used for spore counting and found to be 2.75×10
6
CFU/ml. Fermentation Technique
The production of fungal lipase was studied by solid state fermentation technique. Different agricultural by products were evaluated such as almond meal, sunflower meal, wheat bran, rice husk and soybean meal. Ten grams of the substrate (almond meal found optimal) with 7 ml of distilled water as a diluent was added in separate 250 ml conical flasks and cotton plugged. The flasks were autoclaved at 15lb/in
2 pressure (121ºC) for 15 min and cooled at room
temperature (20 ºC). One millilitre of the spore suspension was aseptically transferred to each flask and flasks were placed in a cooled incubator at 30°C for 48 h. The flasks were run parallel in a set of triplicate. Lipase Assay
Lipase activity in the fermented meal was determined titrimetically on the basis of olive oil hydrolysis (Kundu & Pal, 1970). One millilitre of culture supernatant was added to the reaction mixture and the liberated fatty acid was titrated with 0.1N NaOH using phenolphthalein as an indicator. The end point was the appearance of pink colour. Lipase Unit
A unit lipase is defined as the amount of enzyme which releases one micromole fatty acid per minute under specified assay conditions (Ciafardini et al., 2005). The extracellular lipase activity was expressed as unit per gram (U/g). The units were calculated by the following formula,
Lipase activity (U/g) = V x NV(sample)
× 100060
Where V = V2 – V1, V1 = Volume of NaOH used against central flask, V2 = Volume of NaOH used against experimental flask, N = Normality of
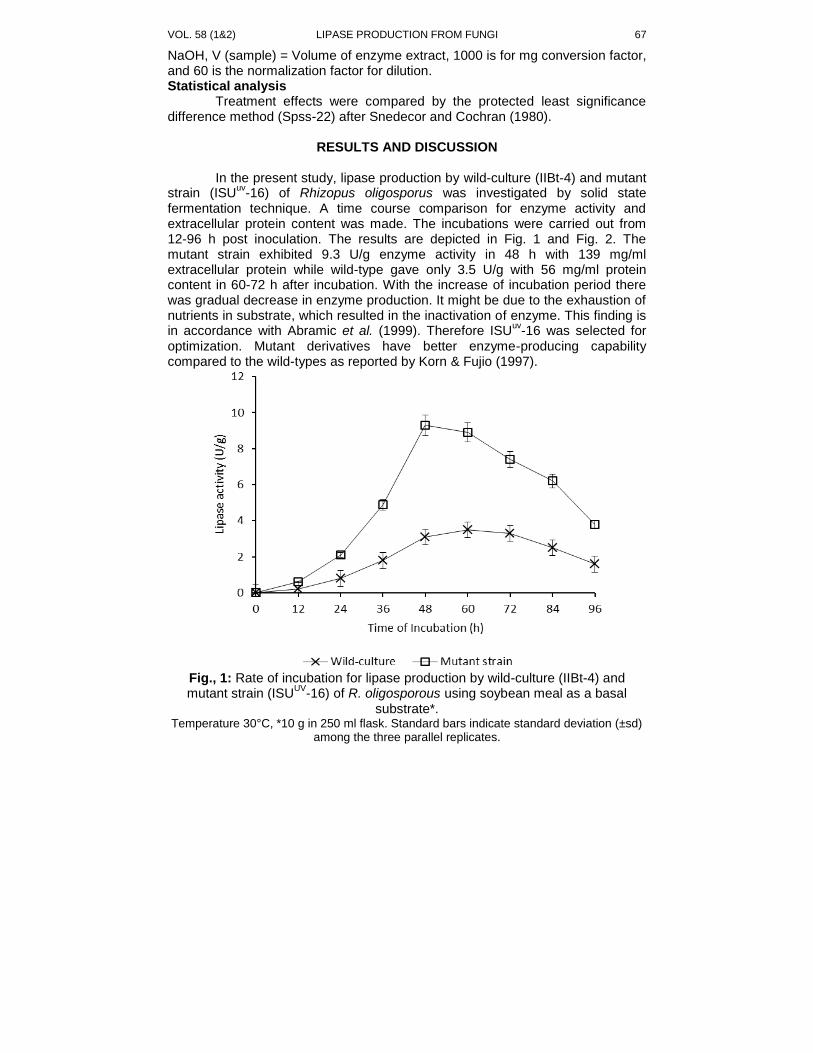
VOL. 58 (1&2) LIPASE PRODUCTION FROM FUNGI 67
NaOH, V (sample) = Volume of enzyme extract, 1000 is for mg conversion factor, and 60 is the normalization factor for dilution. Statistical analysis
Treatment effects were compared by the protected least significance difference method (Spss-22) after Snedecor and Cochran (1980).
RESULTS AND DISCUSSION
In the present study, lipase production by wild-culture (IIBt-4) and mutant strain (ISU
uv-16) of Rhizopus oligosporus was investigated by solid state
fermentation technique. A time course comparison for enzyme activity and extracellular protein content was made. The incubations were carried out from 12-96 h post inoculation. The results are depicted in Fig. 1 and Fig. 2. The mutant strain exhibited 9.3 U/g enzyme activity in 48 h with 139 mg/ml extracellular protein while wild-type gave only 3.5 U/g with 56 mg/ml protein content in 60-72 h after incubation. With the increase of incubation period there was gradual decrease in enzyme production. It might be due to the exhaustion of nutrients in substrate, which resulted in the inactivation of enzyme. This finding is in accordance with Abramic et al. (1999). Therefore ISU
uv-16 was selected for
optimization. Mutant derivatives have better enzyme-producing capability compared to the wild-types as reported by Korn & Fujio (1997).
Fig., 1: Rate of incubation for lipase production by wild-culture (IIBt-4) and mutant strain (ISU
UV-16) of R. oligosporous using soybean meal as a basal
substrate*. Temperature 30°C, *10 g in 250 ml flask. Standard bars indicate standard deviation (±sd)
among the three parallel replicates.
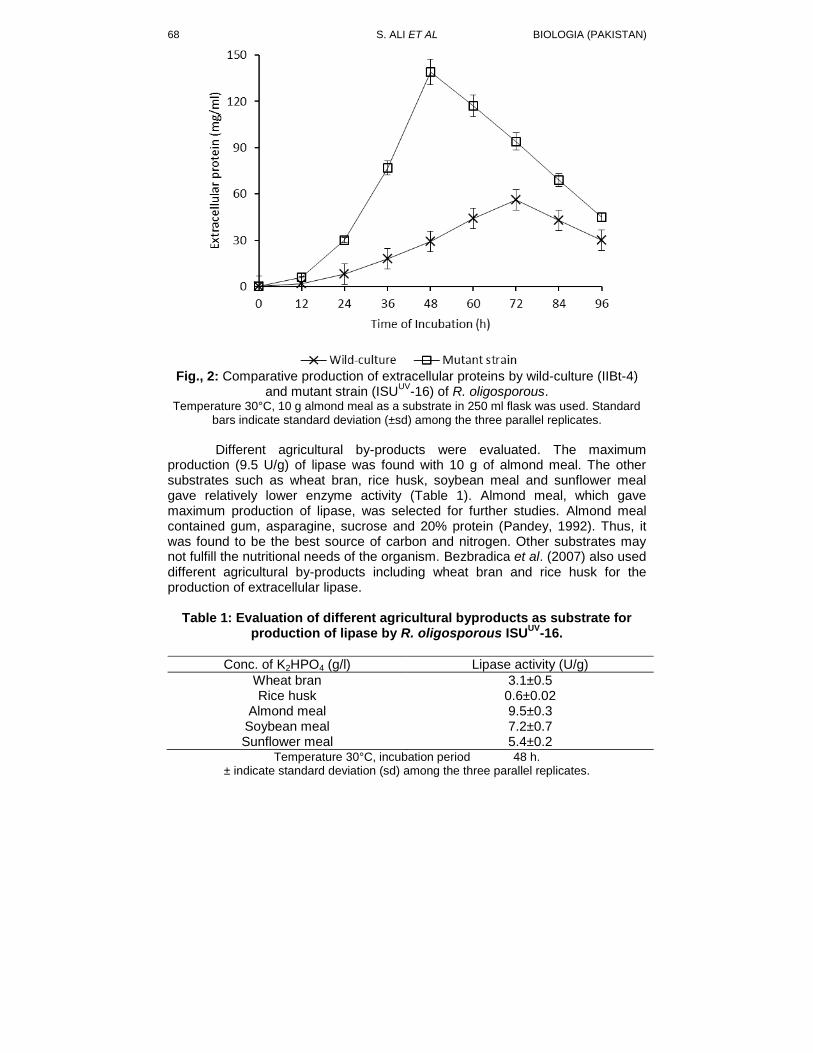
S. ALI ET AL BIOLOGIA (PAKISTAN) 68
Fig., 2: Comparative production of extracellular proteins by wild-culture (IIBt-4)
and mutant strain (ISUUV
-16) of R. oligosporous. Temperature 30°C, 10 g almond meal as a substrate in 250 ml flask was used. Standard
bars indicate standard deviation (±sd) among the three parallel replicates.
Different agricultural by-products were evaluated. The maximum production (9.5 U/g) of lipase was found with 10 g of almond meal. The other substrates such as wheat bran, rice husk, soybean meal and sunflower meal gave relatively lower enzyme activity (Table 1). Almond meal, which gave maximum production of lipase, was selected for further studies. Almond meal contained gum, asparagine, sucrose and 20% protein (Pandey, 1992). Thus, it was found to be the best source of carbon and nitrogen. Other substrates may not fulfill the nutritional needs of the organism. Bezbradica et al. (2007) also used different agricultural by-products including wheat bran and rice husk for the production of extracellular lipase.
Table 1: Evaluation of different agricultural byproducts as substrate for production of lipase by R. oligosporous ISU
UV-16.
Conc. of K2HPO4 (g/l) Lipase activity (U/g)
Wheat bran Rice husk
Almond meal Soybean meal Sunflower meal
3.1±0.5 0.6±0.02 9.5±0.3 7.2±0.7 5.4±0.2
Temperature 30°C, incubation period 48 h. ± indicate standard deviation (sd) among the three parallel replicates.
VOL. 58 (1&2) LIPASE PRODUCTION FROM FUNGI 69
The phosphorous as phosphate is essential for all metabolic activities of the cell (Ozer et al., 2000). Various phosphate sources such as K2HPO4, KH2PO4
and Na2HPO4 were evaluated for lipase production by the UV derived mutant strain of R. oligosporus ISU
uv-16. These were compared with the control at a
level of 0.3 g/l (Table 2a). Later, the effect of different concentrations of K2HPO4 as a phosphorous source on enzyme production was investigated (Table 2b). The concentrations were 0.2, 0.3, 0.4, 0.5, 0.6 and 0.7 g/l. The enzyme activity was recorded to be 12.2, 20.8, 25.3, 33.2, 32.1 and 28.1 U/g, respectively. The fungal growth and enzyme activity was increased by the addition of K2HPO4 up to 0.5 g/l. Further increase in the concentration of inorganic phosphate was not effective. The maximum enzyme activity (33.2 U/g) was observed at the concentration of 0.5 g/l of K2HPO4 as reported by Dominguez et al. (2003). Some growth and almost negligible enzyme activity was observed even when no inorganic phosphate was added to the medium. Similar kind of findings have also been reported by Graminha et al. (2008).
Table 2a: Effect of different phosphate sources on the production of lipase
by R. oligosporous ISUUV
-16.
Phosphate sources* Lipase activity (U/g)
Control K2HPO4 KH2PO4
Na2HPO4
9.3±0.3 21.1±1.3 12.8±1 5.4±0.2
Temperature 30°C, incubation period 48 h, substrate 10 g almond meal in 250 ml flask.
*Added at a level of 0.3 g/l. ± indicate standard deviation (sd) among the three parallel replicates.
Table 2b: Effect of K2HPO4 concentration on the production of lipase by R.
oligosporous ISUUV
-16.
Conc. of K2HPO4 (g/l) Lipase activity (U/g)
0.2 0.3 0.4 0.5 0.6 0.7
12.2±0.2 20.8±0.6 25.3±0.5 36.2±1.6 32.1±1.2 28.1±1.8
Temperature 30°C, incubation period 48 h, substrate 10 g almond meal in 250 ml flask.
± indicate standard deviation (sd) among the three parallel replicates.
Lipase production is highly sensitive to pH changes during fermentation (Colen et al., 2006). The production of enzyme at different pH of phosphate buffer (as a diluent) was carried out by R. oligosporous ISU
UV-16 (Table 3). The
pH of the diluent was adjusted at 6-8. The enzyme activity was found to be maximum (47 U/g) when the pH of phosphate buffer was maintained at 7.
S. ALI ET AL BIOLOGIA (PAKISTAN) 70
Phosphate buffer of pH 6 and 8 gave 30.3 and 43.4 U/g activity, respectively. The findings were substantiated with the results obtained by Colla et al. (2010). Hence, phosphate buffer of pH 7 was optimized for maximum enzyme activity.
Table 3: Effect of different pH of diluent on the production of lipase by R. oligosporous ISU
UV-16.
pH of Diluent Lipase activity (U/g)
5 6 7 8
18.5±0.5 30.3±1.5 47±1.3
43.3±2.1
Temperature 30°C, incubation period 48 h, substrate 10 g almond meal in 250 ml flask.
± indicate standard deviation (sd) among the three parallel replicates.
Conclusion The mutant strain (ISU
uv-16) of Rhizopus oligosporus exhibited better
lipase activity in 48 h which was 2.5 fold higher than the wild-type using almond meal as a basal substrate. However, the most notable finding was the addition of 0.5 g/l K2HPO4 which strongly influenced enzyme production (47 U/g) at a neutral
pH (7) of phosphate buffer, which is highly significant (HS, p0.05) indicating a potential viability of the culture used.
REFERENCES
Abramic, M., Lesic, I., Korica, T., Vitale, L., Saenger, W. & Pigac, J., 1999. Purification and properties of extracellular lipase from Streptomyces rimosus. Enz. Microbial Technol., 25: 522-529.
Bucke, C., 1988. Lipases, In Principles of Biotechnology, 2nd
Ed, Surrey University Press, New York, USA, p. 143.
Bezbradica, D.I., Suzana, D.B., Sanja, G., Zorica, K. & Slavica, S.M., 2007. Effect of fermentation conditions on lipase production by Candida utilis. J. Serbian Chem. Soc., 72: 757-765.
Ciafardini, G., Zullo, B.A. & Iride, A., 2005. Lipase production by yeast from extra virgin olive oil. Food Microbiol., 23: 60-67.
Colen, G., Junqueira, R.G. & Santos, T.M., 2006. Isolation and screening of alkaline lipase-producing fungi from Brazilian savanna soil. World J. Microbiol. Biotechnol., 22: 881-885.
Colla, L.M., Rizzardi, J., Pinto, M.H., Reinehr, C.O., Bertolin, T.E. & J.A.V. Costa., 2010. Simultaneous production of lipases and biosurfactants by submerged and solid-state bioprocesses. Bioresour. Technol., 101: 8308-8314.
Dominguez, A., Costas, M., Longo, M.A. & Sanroman, A., 2003. A novel application of solid state culture: production of lipases by Yarrowia lipolytica. Biotechnol. Lett., 25: 1225-1229.
VOL. 58 (1&2) LIPASE PRODUCTION FROM FUNGI 71
Fickers, P., Marty, A. & Nicaud, J.M., 2011. The lipases from Yarrowia lipolytica: Genetics, production, regulation, biochemical characterization and biotechnological applications. Biotechnol. Adv., 29: 632-644.
Graminha, E.B.N., Goncalves, A.Z.L., Pirota, R.D.P.B., Balsalobre, M.A.A., Silva, R.D. & Gomes, E., 2008. Enzyme production by solid-state fermentation: application to animal nutrition. Animal Feed Sci. Technol., 144: 1-22.
Hamed, N.A., 1997. Production of lipase by certain fungal strains and effect of some additives to the growth medium. J. Microbiol., 31: 139-154.
Huang, J., Shi, Q., Zhcng, Y. & Wu, S., 1995. Alkaline-mesophiled liapses II. Production of lipase from Penicillium expansum PF 868. Coll. Biol., 25: 10-14.
Korn, M.S. & Fujio, Y., 1997. Effect on the degree of maceration of soybean fermented by Rhizopus strains. J. Fac. Agr., 41: 231-237
Kundu, A.K. & Pal, N., 1970. Isolation of lipolytic fungi from the soil. J. Pharm. Ind., 32: 96-97.
Ozer, D. & Elibol, P., 2000. Effect of some factors on lipase production by Rhizopous arrhizusus. J. Dairy Sci., 37: 661-664.
Pandey, A., 1992. Recent process development in solid state fermentation. Proc. Biochem., 27: 109-117.
Rekha, K.S.S., Lakshmi, M.V.V.C., Sridevi, V. & Manasa, M., 2012. An overview of microbial lipases. J. Chem. Bio., 2: 1379-1389.
Snedecor, G.W. & Cochran, W.G., 1980. Statistical Methods, 7th Edition, Iowa
State University, Iowa, USA. pp. 32-43. Toshihiko, K., Mari, T., Ishii, T., Hoth, Y., Kirimura, K. & Usami, S., 1989.
Production of lipase by Rhizopus oligosporous a newly isolated fungus. J. Hokoku Waseda., 50: 61-66.
BIOLOGIA (PAKISTAN) 2012, 58 (1&2), 73-78 PK ISSN 0006 - 3096
*Corresponding author:[email protected]
Effect of sub-lethal dose of Cadmium Chloride on
biochemical profile and catalase activity in fresh water fish
Oreochromis niloticus
*MEHWISH FAHEEM, ABDUAL QAYYUM KHAN SULEHRIA, MEHRAB
TARIQ, IRAM KHADIJA, AYESHA FIAZ & MALEEHA SAEED
Department of Zoology, GC University, Kachery Road, Lahore, Pakistan
ABSTRACT
In aquatic ecosystems, heavy metals have received considerable attention due to their toxicity and accumulation. The increase in industrial activities as well as in the use of chemical fertilizers and pesticides in the agricultural practice during the past few decades led to the marked rise of heavy metals in the environment. The present study was designed to evaluate the effect of cadmium on non-commercial fish Oreochromis niloticus.
Alteration in fish protein, glycogen and anti-oxidant enzyme i.e., catalase concentration was measured in tissues exposed to sublethel concentration of cadmium chloride for 10 days. LC50 was measured and found to be 35.848 mg/l. protein concentration tend to decrease in different tissues of fish in order of Liver> Heart>Gills>Muscles. Glycogen concentration also showed marked decrease in order of Liver>Heart>Muscles>Gills. Catalase activity decreased in order of Liver>Heart>Muscle>Gill. Keywords: Oreochromis niloticus,LC 50 , Antioxidant enzymes, Protein, Glycogen,
Glucose
INTRODUCTION
Freshwater gets contaminated with a wide range of pollutants and it has become a matter of major concern around the globe (Voegborlo et al., 1999; Vutukuruet al., 2005; Rauf et al., 2009). Among pollutants, metals are of special concern because of their diversified effects and the range of concentrations that could cause toxic effects to fish (Rauf et al., 2009). These metals are introduced into the aquatic ecosystem through different routes such as industrial effluents and wastes, agricultural pesticide runoff, domestic garbage dumps and mining activities (Merian, 1991).
In an aquatic ecosystem, fish are considered as heavy metal indicator because heavy metal readily accumulates in the fish body (Gernhofer et al., 2001). Among the aquatic organisms, these pollutants have a very adverse effect on the fishes, and because of this reason fishes are considered to be the most relevant organism for assessing the pollution in the aquatic ecosystems (Van der Oost et al., 2003). Many studies are available that demonstrate heavy metal toxicity in fish (Jagadeesan et al., 2001; Francis et al., 2002).
Cadmium is considered as one of the most uncertain environmental pollutants and it is toxic for living organisms. It is mostly used in manufacturing of batteries, pigments and also in plastic industries (ATSDR, 1997). Cadmium is toxic at low level it may induce kidney, liver, gill and heart malfunctioning. It badly influences blood parameters in living organism and lead to hematological
M. FAHEEM ET AL BIOLOGIA (PAKISTAN) 74
disorders and cause oxidative stress (McCluggage, 1991; European Union, 2002; Young, 2005).
Recent evidences have suggested that Labeo rohita and Catla catla can accumulate high levels of cadmium in polluted waters in Pakistan. It is interesting to note that in these waters the concentration of Cd accumulated in non-edible fishes is lesser in comparison to that of edible fishes (Nawaz et al., 2010).
The aim of the present study was to determine the LC50 value of cadmium in Oreochromis niloticusand to evaluate the effect of cadmium on oxidative enzyme (catalase) and biochemical profile.
MATERIALS AND METHODS
The fish, Nile tilapia (Oreochromis niloticus), were obtained from Fisheries Research and Training Institute, Manawan. Fish were acclimatized for one week in fish ponds at Zoology Department, GC University, Lahore.
Following Physico-Chemical parameters were measured in pond, at the time of sampling and in laboratory glass aquaria:Atmospheric temperature, water temperature with thermometer to the nearest 1
oC;pH by a portable laboratory pH
meter and Dissolved Oxygen of pond water by a portable D.O. Meter (YSI-Model-57). Metal acute toxicity assays
Acute cadmium chloride toxicity tests in terms of 96-hr LC50 were conducted with Oreochromis niloticus according to APHA guidelines (APHA, 2005). These tests were performed in fifteen glass aquaria containing 70-liter water. Ten fish per group were tested against various concentrations of Cd with three replications for each test dose. Extra pure compound of Cd (CdCl2) was dissolved in deionized water and stock solution prepared for required metal concentrations. The exposure concentration of Cd for each fish species was started from zero (with an increment of 10mg/l) to 50 mg/l. LC50 (conc., in which 50% of fish die) was calculated by probit analysisusing SPSS 15 (Finny, 1971). Sub-lethal studies
For sub-lethal studies, 60 fish of both sexes were randomly selected and divided into 3 groups, of 20 fishes each. Asub-lethal dose of 3.58 mg/l (approximately 4 mg/l and 18 mg/l (1/10
th, and ½ of LC50) were selected and fish
were exposed to these concentrations for 96 hours. At the end of 96 hours of exposure, fish were randomly selected from control and experiment aquaria for the protein, glycogen and enzyme analyses. Biochemical and anti-oxidant analysis Protein was measured by Lowery method with folin phenol reagent (Lowery et al., 1951). Glycogen was measured through calorimetric method by Kemp & Mayers (1954).CAT activity was assayed using the method of Claiborne(1985).
RESULTS AND DISCUSSION
The percentage mortalities for different exposure periods at different concentrations of cadmium chloride are shown in fig 1. LC50 value of cadmium chloride for the fish Oreochromis niloticus was determined by Probit-regression
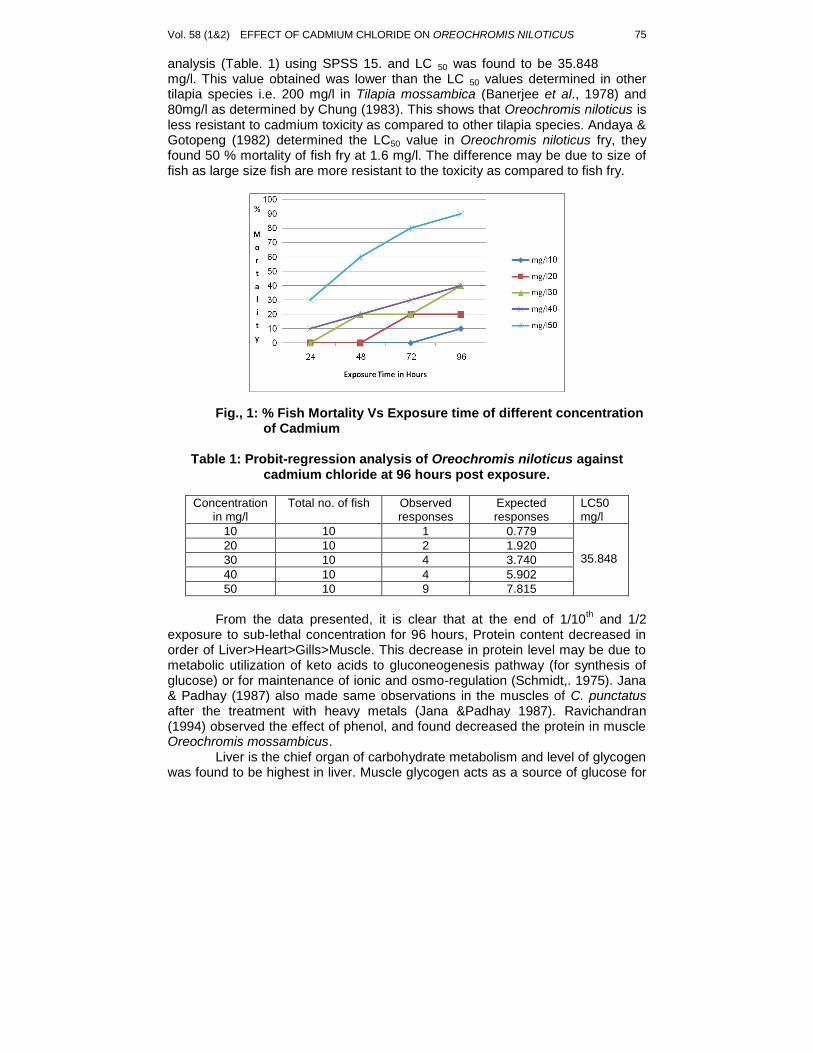
Vol. 58 (1&2) EFFECT OF CADMIUM CHLORIDE ON OREOCHROMIS NILOTICUS 75
analysis (Table. 1) using SPSS 15. and LC 50 was found to be 35.848 mg/l. This value obtained was lower than the LC 50 values determined in other tilapia species i.e. 200 mg/l in Tilapia mossambica (Banerjee et al., 1978) and 80mg/l as determined by Chung (1983). This shows that Oreochromis niloticus is less resistant to cadmium toxicity as compared to other tilapia species. Andaya & Gotopeng (1982) determined the LC50 value in Oreochromis niloticus fry, they found 50 % mortality of fish fry at 1.6 mg/l. The difference may be due to size of fish as large size fish are more resistant to the toxicity as compared to fish fry.
Fig., 1: % Fish Mortality Vs Exposure time of different concentration of Cadmium
Table 1: Probit-regression analysis of Oreochromis niloticus against
cadmium chloride at 96 hours post exposure.
Concentration in mg/l
Total no. of fish Observed responses
Expected responses
LC50 mg/l
10 10 1 0.779 35.848
20 10 2 1.920
30 10 4 3.740
40 10 4 5.902
50 10 9 7.815
From the data presented, it is clear that at the end of 1/10
th and 1/2
exposure to sub-lethal concentration for 96 hours, Protein content decreased in order of Liver>Heart>Gills>Muscle. This decrease in protein level may be due to metabolic utilization of keto acids to gluconeogenesis pathway (for synthesis of glucose) or for maintenance of ionic and osmo-regulation (Schmidt,. 1975). Jana & Padhay (1987) also made same observations in the muscles of C. punctatus after the treatment with heavy metals (Jana &Padhay 1987). Ravichandran (1994) observed the effect of phenol, and found decreased the protein in muscle Oreochromis mossambicus. Liver is the chief organ of carbohydrate metabolism and level of glycogen was found to be highest in liver. Muscle glycogen acts as a source of glucose for
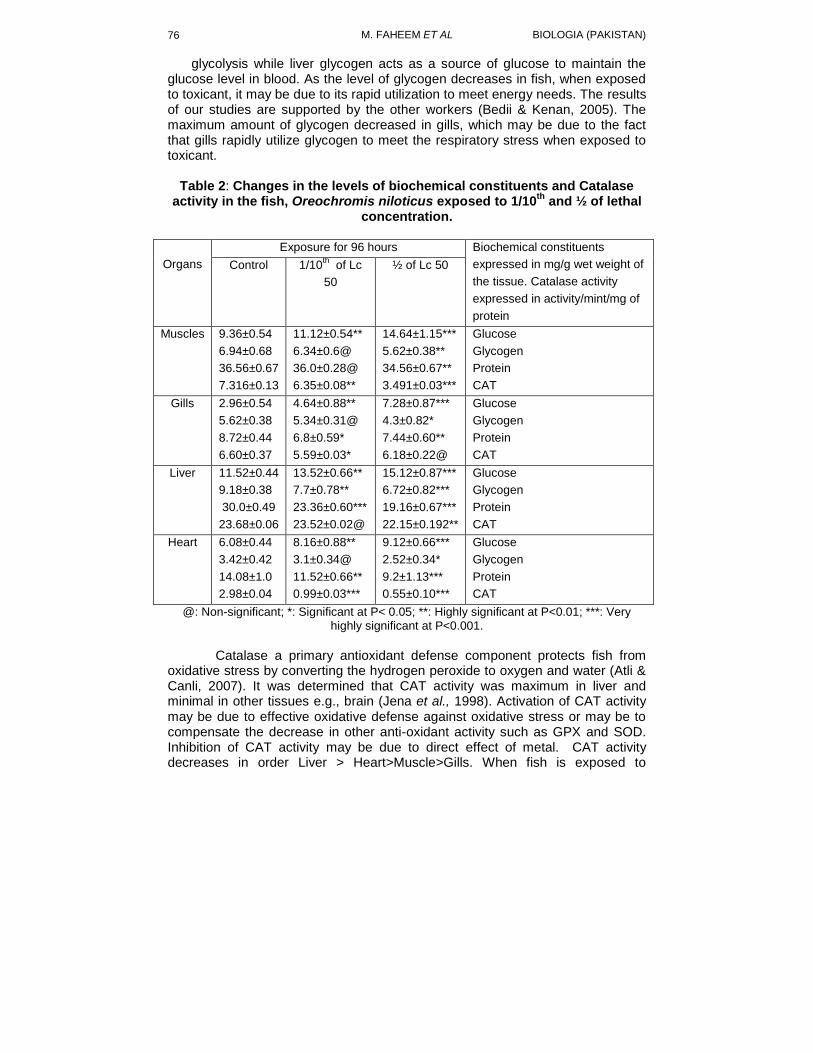
M. FAHEEM ET AL BIOLOGIA (PAKISTAN) 76
glycolysis while liver glycogen acts as a source of glucose to maintain the glucose level in blood. As the level of glycogen decreases in fish, when exposed to toxicant, it may be due to its rapid utilization to meet energy needs. The results of our studies are supported by the other workers (Bedii & Kenan, 2005). The maximum amount of glycogen decreased in gills, which may be due to the fact that gills rapidly utilize glycogen to meet the respiratory stress when exposed to toxicant.
Table 2: Changes in the levels of biochemical constituents and Catalase activity in the fish, Oreochromis niloticus exposed to 1/10
th and ½ of lethal
concentration.
Organs
Exposure for 96 hours Biochemical constituents
expressed in mg/g wet weight of
the tissue. Catalase activity
expressed in activity/mint/mg of
protein
Control 1/10th
of Lc
50
½ of Lc 50
Muscles 9.36±0.54
6.94±0.68
36.56±0.67
7.316±0.13
11.12±0.54**
6.34±0.6@
36.0±0.28@
6.35±0.08**
14.64±1.15***
5.62±0.38**
34.56±0.67**
3.491±0.03***
Glucose
Glycogen
Protein
CAT
Gills 2.96±0.54
5.62±0.38
8.72±0.44
6.60±0.37
4.64±0.88**
5.34±0.31@
6.8±0.59*
5.59±0.03*
7.28±0.87***
4.3±0.82*
7.44±0.60**
6.18±0.22@
Glucose
Glycogen
Protein
CAT
Liver 11.52±0.44
9.18±0.38
30.0±0.49
23.68±0.06
13.52±0.66**
7.7±0.78**
23.36±0.60***
23.52±0.02@
15.12±0.87***
6.72±0.82***
19.16±0.67***
22.15±0.192**
Glucose
Glycogen
Protein
CAT
Heart 6.08±0.44
3.42±0.42
14.08±1.0
2.98±0.04
8.16±0.88**
3.1±0.34@
11.52±0.66**
0.99±0.03***
9.12±0.66***
2.52±0.34*
9.2±1.13***
0.55±0.10***
Glucose
Glycogen
Protein
CAT
@: Non-significant; *: Significant at P< 0.05; **: Highly significant at P<0.01; ***: Very highly significant at P<0.001.
Catalase a primary antioxidant defense component protects fish from oxidative stress by converting the hydrogen peroxide to oxygen and water (Atli & Canli, 2007). It was determined that CAT activity was maximum in liver and minimal in other tissues e.g., brain (Jena et al., 1998). Activation of CAT activity may be due to effective oxidative defense against oxidative stress or may be to compensate the decrease in other anti-oxidant activity such as GPX and SOD. Inhibition of CAT activity may be due to direct effect of metal. CAT activity decreases in order Liver > Heart>Muscle>Gills. When fish is exposed to
Vol. 58 (1&2) EFFECT OF CADMIUM CHLORIDE ON OREOCHROMIS NILOTICUS 77
cadmium, gills are affected first. There was no significant change in CAT activity in liver. This was also supported by work of Radii &Matkovics (1998), they suggested that no change in catalase activity may be due to increased activity of other anti-oxidant enzymes. In order to evaluate the role of cadmium as a cause of oxidative stress, there is need to estimate other oxidant and anti-oxidant enzymes.
REFERENCES
APHA., AWWA., WPCP. 2005. Standard methods for the examination of water
and wastewater. 21st ed. American Public Health Association, Washington, DC.
ATSDR (Agency for Toxic Substances and Disease Registry), 1997. Toxicological profile for Cadmium. US Department of Health and Human Services, Atlanta, GA.
Atli G. & Canli M .,2007. Enzymatic responses to metal exposures in a freshwater fish Oreochromis niloticus. Comp. Biochem. Physiol., 145: 282-287.
Andaya, A. A. & Gotopeng, E. U., 1982. Cadmium toxicity and uptake in Tilapia nilotica. Kalikasan. 11(2-3):309-318.
Banerjee, .K., Dastdar, S. G., Mukhopadhya, P. K. & Dehadrai , P. V., 1978. Toxicity of cadmium: A Comparative study in the air-breathing fish, Clarias batrachus (Linn) and in the non air-breathing, Tilapia mossambica (peters). Indian J. Exp. Biol., 16(2):1274-1277.
Bedii ,C. & Kenan, E., 2005. The effects of Cadmium on levels of glucose in serum and glycogen reserves in the liver and muscle tissues of Cyprinus carpio(L.,1758); Turk. J. Vet. Anim. Sci., 29:113-117.
Claiborne A., 1985. Catalase activity. In Greenwald RA ed. CRC handbook of methods in oxygen radical research. BocaRaton: CRC Press. 283 -84.
Chung, S., 1983. Lethal effects of cadmium in tropica. Bull. Jpn. Soc. Sci., 49(10):1565-1568.
European Union., 2002. Heavy metals in wastes, European Commission on Environment. Finney, DT., 1971. Probit Analysis. 3rd ed. Cambridge University Press. London.
Francis S., Mohan, K. G. & Oommen, V., 2002. Influence of steroid hormones on plasma proteins in fresh water Tilapia Oreochromis mossambicus. Indian J. Exper. Biol. 40: 1206–1208.
Gernhofer, M., Pawet, M., Schramm, M., Muller, E. & Triebskorn. R., 2001. Ultrastructural biomarkers as tools to characterize the health status of fish in contaminated streams. J. Aquat. Ecosystem, Stress andRecovery, 8:241- 260.
Jagadeesan, G., Jebanesan, A. & Mathivanan, A., 2001. In vivo recovery of organic constituents in gill tissue of Labo rohita after exposure to sublethal concentrations of mercury. J. Exp. India., 3: 22–29.
Jana, S. & Padhyay., 1987. Effect of heavy metals on some biochemical parameters in the freshwater fish Channa punctatus. Environ., 5(3):488-493.
M. FAHEEM ET AL BIOLOGIA (PAKISTAN) 78
Jena, B., Nayak, S. B. & Patniak, B.K., 1998. Age related changes in catalase
activity and its inhibition by manganese (II) chloride in brain of two species of poikilothermic vertebrates. Arch, Gerontos,geriatr., 6:119-129.
Kemp, A & Myers, D.K., 1954. A Calorimetric Micro-method for the determination of glycogen in tissue. Acta. physiol. pharmacol.neerl., 2:280.
Lowry, O. H, Rosenbrough, N. J., Farr, A. L. & Randall, R. J., 1951. Protein measurement with Folin phenol reagent. J. Biol. Chem., 193:265-275.
McCluggage, D., 1991. Heavy Metal Poisoning, NCS Magazine, Published by The Bird Hospital, CO, U.S.A.
Merian, E. 1991, Metals and their compounds in the environment: Occurrence, Analysis and Biological Relevance. VCH Publishers: New York, New York.
Nawaz,S., Nagra, S. A., Saleem, Y. & Priydarshi, A., 2010. Determination of heavy metals in fresh water fish species of the River Ravi, Pakistan compared to farmed fish varieties. Environmental Monitoring and Assessment.,164(1-4):461-471.
Rauf, A. Javed, M. Ubaidullah, M. & Abdullah, S., 2009. Heavy metal levels in three major carps (Catla catla, Labeo rohita, Cirrhina mrigala) from the river Ravi, Pakistan. Pak Vet J, 29:24-26.
Radi, A. A. R. & Matkovics, B., 1998. Effects of metal ions on the antioxidant enzyme activity, protein content and peroxidation of carp tissues. Comp. Biochem. Physiol., 90:69-72.
Ravichandran., 1994. Impact of phenol metabolism in the fresh water fish Oreochromis mossambicus. J.Exotoxicol. Environ. Monit., 4(1): 33-37.
Schmidt, N. B., 1975. Osmoregulation: Effect of salinity and heavy metal. Fed. Proc., 33:2137-2146
Voegborlo, R. B., Methnani, A. M. E. & Abedin, M. Z., 1999. Mercury, cadmium and lead content of cannedTuna fish. Food Chem., 67(4):341 – 345.
Van dar Oost, R., Beyer, J. & Vermeulen, N. P. E., 2003. Fish bioaccumulation and biomarkers in environment risk assessment : A Review. Environ. Toxicol. Pharmacol., 13:57-149.
Vutukuru, S. S., Suma, C., Madhavi, K. R., Pauleena, J. S., Rao, J. V. & Anjaneyulu, Y., 2005. Studies on the development of potential biomarkers for rapid assessment of copper toxicity to freshwater fish using Esomus danricus as model. Int. J. Environ. Res. Public. Health, 2:63-73.
Young, R. A., 2005. Toxicity Profiles: Toxicity Summary for Cadmium, Risk Assessment Information System, RAIS, University of Tennessee.
BIOLOGIA (PAKISTAN) 2012, 58 (1&2), 79-84 PK ISSN 0006 - 3096
*Corresponding author: [email protected]
Cocculus laurifolius, Ficus natalensis subsp. leprieurii and Diospyros montana: New record to the Flora of Pakistan
* MUHAMMAD AJAIB & ZAHEER-UD-DIN KHAN
Department of Botany, GC University Lahore, Pakistan
ABSTRACT
During the field survey of Lahore district three species were found growing in Botanic Garden GC University Lahore and Bagh-e-Jinnah Lahore. They were identified as Cocculus laurifolius DC. “Laurel-leaved Snail Tree” of family Menispermaceae, Ficus natalensis subsp. leprieurii (Miq.) C.C. Berg “Triangle Fig” of family Moraceae and Diospyros montana Roxb. “Mountain Persimmon” of family Ebenaceae. These plant
species have not been reported in Flora of Pakistan, hence the present new record is an addition to it. Key words: Cocculus laurifolius, Ficus natalensis subsp. leprieurii, Diospyros montana
INTRODUCTION
The principal objective of the Flora is to enlist the plants growing in a
particular geographical area. This is usually accompanied by identification keys and botanical descriptions. A well documented flora is one which is expected to provide a work that can be used for proper identification of all plant wealth, so that its utilization could be taken up on a scientific and systematic basis (Ali, 2008). It was during the field survey of Lahore district Flora that three plant species, i.e. Cocculus laurifolius DC., Ficus natalensis subsp. leprieurii (Miq.) C.C. Berg and Diospyros montana Roxb. belonging to Family Menispermaceae, Moraceae and Ebenaceae respectively were found growing in Botanic Garden GC University Lahore and Bagh-e-Jinnah Lahore. Family Menispermaceae commonly called Moonseed family consists of 65 genera and 350 species, mostly occurring in tropical and sub-tropical regions of the world. In Pakistan it is represented by 4 genera and 5 species. Among 35 species of genus Cocculus DC. only two have been reported in Pakistan by Siddiqi (1974). Cocculus laurifolius DC. is distributed in Shrublands and open forests of NW Hunan, Taiwan, Xizang (Gyirong), Indonesia, Japan, Laos, Malaysia, Myanmar, Thailand, Nepal, India (Tamil Nadu) & South East Asia (Ji, 2008; Kottaimuthu, et al. 2008). Family Moraceae commonly called Mulberry family or Fig family is a large family of 40 genera and 1400 species including 5 genera and 32 species in Pakistan. Genus Ficus L. consisting of 1000 species and having distribution in tropics and sub-tropics, usually Indo-Malaysia and Polynesia, is represented by 24 species in Pakistan including 11 native species (Ghafoor, 1985). Ficus natalensis subsp. leprieurii having distribution from Senegal to S. Sudan and southwards to E. Zaire and to N. Angola with range in altitude upto 1200m in Forest, often along rivers and streams (Berg, 1991). Family Ebenaceae is a tropical family of 6 genera and 500 species, including Diospyros montana commonly called Bistendu, and having wide distribution in India and sub-
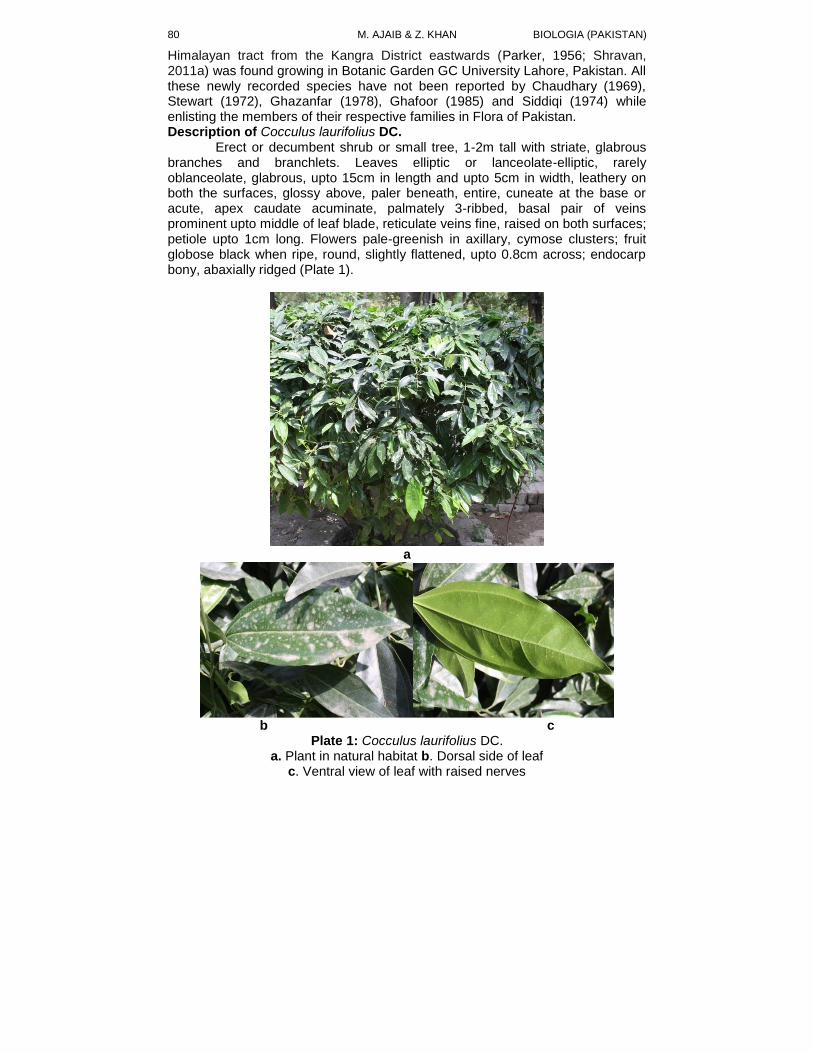
M. AJAIB & Z. KHAN BIOLOGIA (PAKISTAN) 80
Himalayan tract from the Kangra District eastwards (Parker, 1956; Shravan, 2011a) was found growing in Botanic Garden GC University Lahore, Pakistan. All these newly recorded species have not been reported by Chaudhary (1969), Stewart (1972), Ghazanfar (1978), Ghafoor (1985) and Siddiqi (1974) while enlisting the members of their respective families in Flora of Pakistan. Description of Cocculus laurifolius DC.
Erect or decumbent shrub or small tree, 1-2m tall with striate, glabrous branches and branchlets. Leaves elliptic or lanceolate-elliptic, rarely oblanceolate, glabrous, upto 15cm in length and upto 5cm in width, leathery on both the surfaces, glossy above, paler beneath, entire, cuneate at the base or acute, apex caudate acuminate, palmately 3-ribbed, basal pair of veins prominent upto middle of leaf blade, reticulate veins fine, raised on both surfaces; petiole upto 1cm long. Flowers pale-greenish in axillary, cymose clusters; fruit globose black when ripe, round, slightly flattened, upto 0.8cm across; endocarp bony, abaxially ridged (Plate 1).
a
b c
Plate 1: Cocculus laurifolius DC. a. Plant in natural habitat b. Dorsal side of leaf
c. Ventral view of leaf with raised nerves
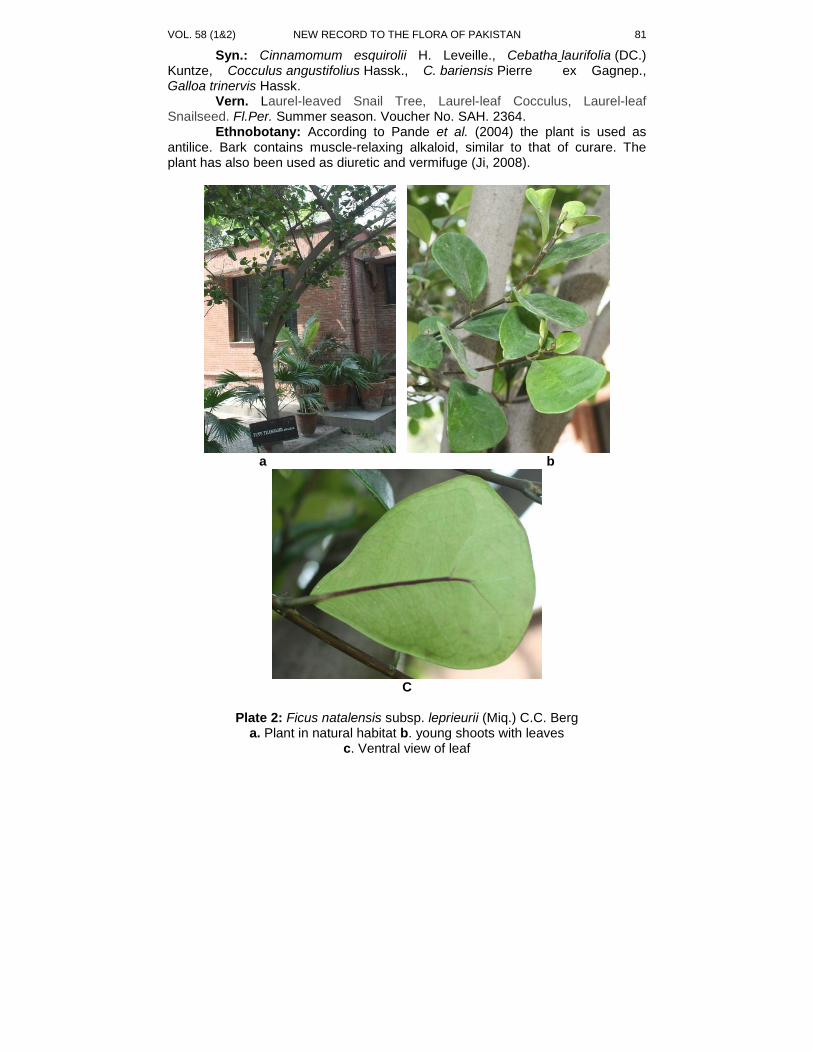
VOL. 58 (1&2) NEW RECORD TO THE FLORA OF PAKISTAN 81
Syn.: Cinnamomum esquirolii H. Leveille., Cebatha laurifolia (DC.) Kuntze, Cocculus angustifolius Hassk., C. bariensis Pierre ex Gagnep., Galloa trinervis Hassk. Vern. Laurel-leaved Snail Tree, Laurel-leaf Cocculus, Laurel-leaf Snailseed. Fl.Per. Summer season. Voucher No. SAH. 2364.
Ethnobotany: According to Pande et al. (2004) the plant is used as antilice. Bark contains muscle-relaxing alkaloid, similar to that of curare. The plant has also been used as diuretic and vermifuge (Ji, 2008).
a b
C
Plate 2: Ficus natalensis subsp. leprieurii (Miq.) C.C. Berg a. Plant in natural habitat b. young shoots with leaves
c. Ventral view of leaf
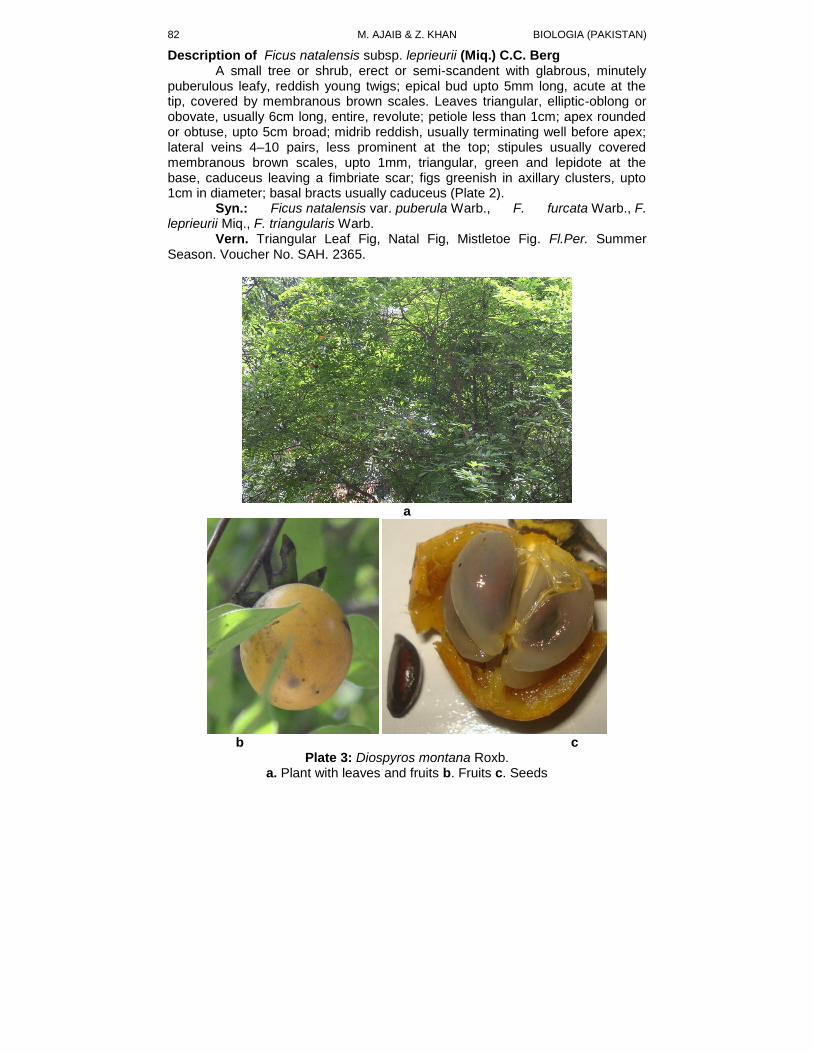
M. AJAIB & Z. KHAN BIOLOGIA (PAKISTAN) 82
Description of Ficus natalensis subsp. leprieurii (Miq.) C.C. Berg A small tree or shrub, erect or semi-scandent with glabrous, minutely
puberulous leafy, reddish young twigs; epical bud upto 5mm long, acute at the tip, covered by membranous brown scales. Leaves triangular, elliptic-oblong or obovate, usually 6cm long, entire, revolute; petiole less than 1cm; apex rounded or obtuse, upto 5cm broad; midrib reddish, usually terminating well before apex; lateral veins 4–10 pairs, less prominent at the top; stipules usually covered membranous brown scales, upto 1mm, triangular, green and lepidote at the base, caduceus leaving a fimbriate scar; figs greenish in axillary clusters, upto 1cm in diameter; basal bracts usually caduceus (Plate 2).
Syn.: Ficus natalensis var. puberula Warb., F. furcata Warb., F. leprieurii Miq., F. triangularis Warb.
Vern. Triangular Leaf Fig, Natal Fig, Mistletoe Fig. Fl.Per. Summer Season. Voucher No. SAH. 2365.
a
b c
Plate 3: Diospyros montana Roxb. a. Plant with leaves and fruits b. Fruits c. Seeds
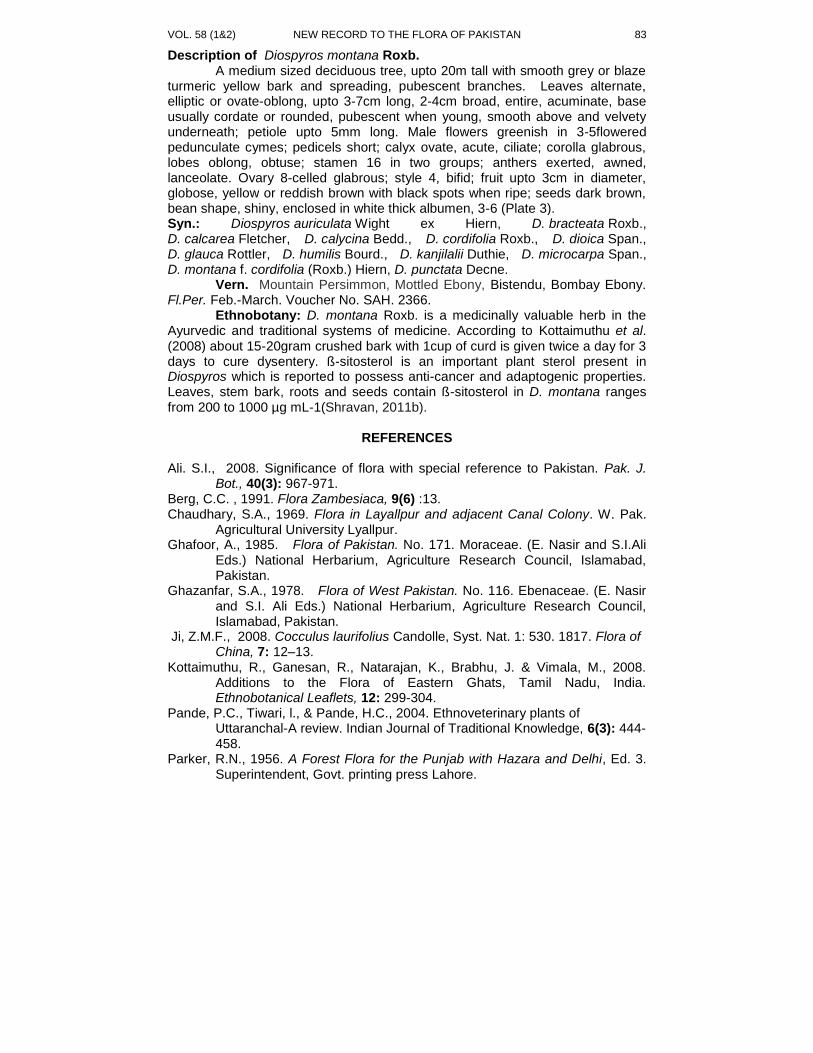
VOL. 58 (1&2) NEW RECORD TO THE FLORA OF PAKISTAN 83
Description of Diospyros montana Roxb. A medium sized deciduous tree, upto 20m tall with smooth grey or blaze turmeric yellow bark and spreading, pubescent branches. Leaves alternate, elliptic or ovate-oblong, upto 3-7cm long, 2-4cm broad, entire, acuminate, base usually cordate or rounded, pubescent when young, smooth above and velvety underneath; petiole upto 5mm long. Male flowers greenish in 3-5flowered pedunculate cymes; pedicels short; calyx ovate, acute, ciliate; corolla glabrous, lobes oblong, obtuse; stamen 16 in two groups; anthers exerted, awned, lanceolate. Ovary 8-celled glabrous; style 4, bifid; fruit upto 3cm in diameter, globose, yellow or reddish brown with black spots when ripe; seeds dark brown, bean shape, shiny, enclosed in white thick albumen, 3-6 (Plate 3). Syn.: Diospyros auriculata Wight ex Hiern, D. bracteata Roxb., D. calcarea Fletcher, D. calycina Bedd., D. cordifolia Roxb., D. dioica Span., D. glauca Rottler, D. humilis Bourd., D. kanjilalii Duthie, D. microcarpa Span., D. montana f. cordifolia (Roxb.) Hiern, D. punctata Decne.
Vern. Mountain Persimmon, Mottled Ebony, Bistendu, Bombay Ebony. Fl.Per. Feb.-March. Voucher No. SAH. 2366.
Ethnobotany: D. montana Roxb. is a medicinally valuable herb in the Ayurvedic and traditional systems of medicine. According to Kottaimuthu et al. (2008) about 15-20gram crushed bark with 1cup of curd is given twice a day for 3 days to cure dysentery. ß-sitosterol is an important plant sterol present in Diospyros which is reported to possess anti-cancer and adaptogenic properties. Leaves, stem bark, roots and seeds contain ß-sitosterol in D. montana ranges from 200 to 1000 µg mL-1(Shravan, 2011b).
REFERENCES
Ali. S.I., 2008. Significance of flora with special reference to Pakistan. Pak. J.
Bot., 40(3): 967-971. Berg, C.C. , 1991. Flora Zambesiaca, 9(6) :13. Chaudhary, S.A., 1969. Flora in Layallpur and adjacent Canal Colony. W. Pak.
Agricultural University Lyallpur. Ghafoor, A., 1985. Flora of Pakistan. No. 171. Moraceae. (E. Nasir and S.I.Ali
Eds.) National Herbarium, Agriculture Research Council, Islamabad, Pakistan.
Ghazanfar, S.A., 1978. Flora of West Pakistan. No. 116. Ebenaceae. (E. Nasir and S.I. Ali Eds.) National Herbarium, Agriculture Research Council, Islamabad, Pakistan.
Ji, Z.M.F., 2008. Cocculus laurifolius Candolle, Syst. Nat. 1: 530. 1817. Flora of China, 7: 12–13.
Kottaimuthu, R., Ganesan, R., Natarajan, K., Brabhu, J. & Vimala, M., 2008. Additions to the Flora of Eastern Ghats, Tamil Nadu, India. Ethnobotanical Leaflets, 12: 299-304.
Pande, P.C., Tiwari, l., & Pande, H.C., 2004. Ethnoveterinary plants of Uttaranchal-A review. Indian Journal of Traditional Knowledge, 6(3): 444-458.
Parker, R.N., 1956. A Forest Flora for the Punjab with Hazara and Delhi, Ed. 3. Superintendent, Govt. printing press Lahore.

M. AJAIB & Z. KHAN BIOLOGIA (PAKISTAN) 84
Shravan, K., Sakshi, S., Hafsa, A., Rajiv, G. & Shubhini, S., 2011a. Pharmacognostic and HPTLC studies on Diospyros montana (Ebenaceae). J. Pharmacognosy, 3 (25): 52.
Shravan, K., Sakshi, S., Hafsa, A., Rajiv, G. & Shubhini, S., 2011b. Detection and quantitation of ß-Sitosterol in Diospyros montana Roxb. by HPTLC .Int. J. of Pharma and Bio Sciences, 2 (4): 519-527.
Siddiqi, M.A., 1974. Flora of West Pakistan. No. 74. Menispermaceae. (E. Nasir and S.I.Ali Eds.) Botany Department, Gordon College, Rawalpindi, Pakistan.
Stewart, R.R., 1972. An Annotated Catalogue of the Vascular Plants of West Pakistan and Kashmir. Flora of West Pakistan. E. Nasir and S.I. Ali, (eds.) Fakhri Printing Press, Karachi.
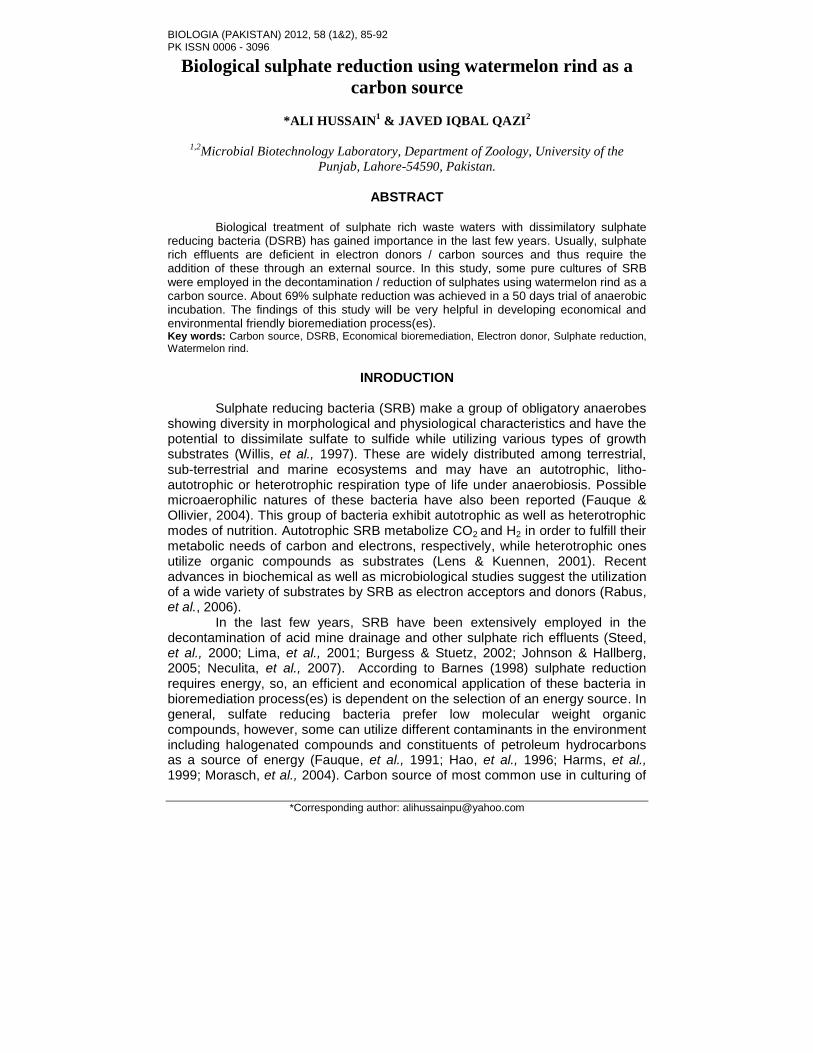
BIOLOGIA (PAKISTAN) 2012, 58 (1&2), 85-92 PK ISSN 0006 - 3096
*Corresponding author: [email protected]
Biological sulphate reduction using watermelon rind as a
carbon source
*ALI HUSSAIN1 & JAVED IQBAL QAZI
2
1,2Microbial Biotechnology Laboratory, Department of Zoology, University of the
Punjab, Lahore-54590, Pakistan.
ABSTRACT
Biological treatment of sulphate rich waste waters with dissimilatory sulphate
reducing bacteria (DSRB) has gained importance in the last few years. Usually, sulphate rich effluents are deficient in electron donors / carbon sources and thus require the addition of these through an external source. In this study, some pure cultures of SRB were employed in the decontamination / reduction of sulphates using watermelon rind as a carbon source. About 69% sulphate reduction was achieved in a 50 days trial of anaerobic incubation. The findings of this study will be very helpful in developing economical and environmental friendly bioremediation process(es). Key words: Carbon source, DSRB, Economical bioremediation, Electron donor, Sulphate reduction, Watermelon rind.
INRODUCTION
Sulphate reducing bacteria (SRB) make a group of obligatory anaerobes
showing diversity in morphological and physiological characteristics and have the potential to dissimilate sulfate to sulfide while utilizing various types of growth substrates (Willis, et al., 1997). These are widely distributed among terrestrial, sub-terrestrial and marine ecosystems and may have an autotrophic, litho-autotrophic or heterotrophic respiration type of life under anaerobiosis. Possible microaerophilic natures of these bacteria have also been reported (Fauque & Ollivier, 2004). This group of bacteria exhibit autotrophic as well as heterotrophic modes of nutrition. Autotrophic SRB metabolize CO2 and H2 in order to fulfill their metabolic needs of carbon and electrons, respectively, while heterotrophic ones utilize organic compounds as substrates (Lens & Kuennen, 2001). Recent advances in biochemical as well as microbiological studies suggest the utilization of a wide variety of substrates by SRB as electron acceptors and donors (Rabus, et al., 2006).
In the last few years, SRB have been extensively employed in the decontamination of acid mine drainage and other sulphate rich effluents (Steed, et al., 2000; Lima, et al., 2001; Burgess & Stuetz, 2002; Johnson & Hallberg, 2005; Neculita, et al., 2007). According to Barnes (1998) sulphate reduction requires energy, so, an efficient and economical application of these bacteria in bioremediation process(es) is dependent on the selection of an energy source. In general, sulfate reducing bacteria prefer low molecular weight organic compounds, however, some can utilize different contaminants in the environment including halogenated compounds and constituents of petroleum hydrocarbons as a source of energy (Fauque, et al., 1991; Hao, et al., 1996; Harms, et al., 1999; Morasch, et al., 2004). Carbon source of most common use in culturing of
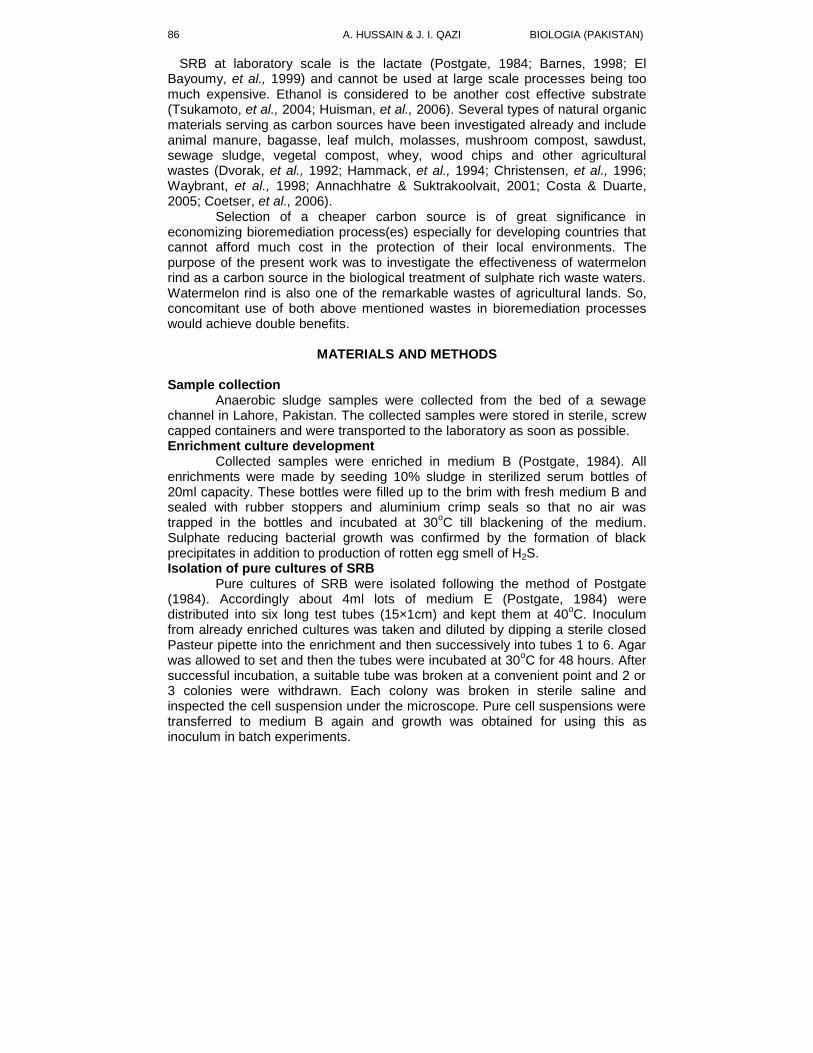
A. HUSSAIN & J. I. QAZI BIOLOGIA (PAKISTAN) 86
SRB at laboratory scale is the lactate (Postgate, 1984; Barnes, 1998; El Bayoumy, et al., 1999) and cannot be used at large scale processes being too much expensive. Ethanol is considered to be another cost effective substrate (Tsukamoto, et al., 2004; Huisman, et al., 2006). Several types of natural organic materials serving as carbon sources have been investigated already and include animal manure, bagasse, leaf mulch, molasses, mushroom compost, sawdust, sewage sludge, vegetal compost, whey, wood chips and other agricultural wastes (Dvorak, et al., 1992; Hammack, et al., 1994; Christensen, et al., 1996; Waybrant, et al., 1998; Annachhatre & Suktrakoolvait, 2001; Costa & Duarte, 2005; Coetser, et al., 2006).
Selection of a cheaper carbon source is of great significance in economizing bioremediation process(es) especially for developing countries that cannot afford much cost in the protection of their local environments. The purpose of the present work was to investigate the effectiveness of watermelon rind as a carbon source in the biological treatment of sulphate rich waste waters. Watermelon rind is also one of the remarkable wastes of agricultural lands. So, concomitant use of both above mentioned wastes in bioremediation processes would achieve double benefits.
MATERIALS AND METHODS
Sample collection
Anaerobic sludge samples were collected from the bed of a sewage channel in Lahore, Pakistan. The collected samples were stored in sterile, screw capped containers and were transported to the laboratory as soon as possible. Enrichment culture development
Collected samples were enriched in medium B (Postgate, 1984). All enrichments were made by seeding 10% sludge in sterilized serum bottles of 20ml capacity. These bottles were filled up to the brim with fresh medium B and sealed with rubber stoppers and aluminium crimp seals so that no air was trapped in the bottles and incubated at 30
oC till blackening of the medium.
Sulphate reducing bacterial growth was confirmed by the formation of black precipitates in addition to production of rotten egg smell of H2S. Isolation of pure cultures of SRB
Pure cultures of SRB were isolated following the method of Postgate (1984). Accordingly about 4ml lots of medium E (Postgate, 1984) were distributed into six long test tubes (15×1cm) and kept them at 40
oC. Inoculum
from already enriched cultures was taken and diluted by dipping a sterile closed Pasteur pipette into the enrichment and then successively into tubes 1 to 6. Agar was allowed to set and then the tubes were incubated at 30
oC for 48 hours. After
successful incubation, a suitable tube was broken at a convenient point and 2 or 3 colonies were withdrawn. Each colony was broken in sterile saline and inspected the cell suspension under the microscope. Pure cell suspensions were transferred to medium B again and growth was obtained for using this as inoculum in batch experiments.
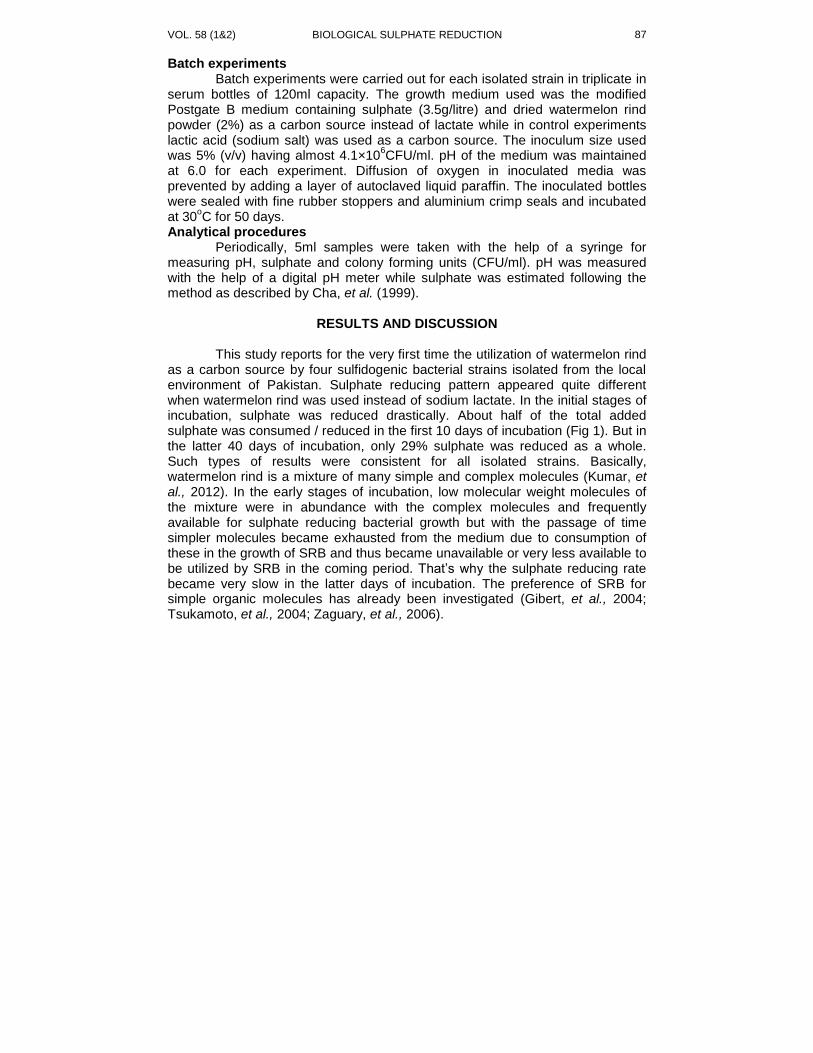
VOL. 58 (1&2) BIOLOGICAL SULPHATE REDUCTION
87
Batch experiments Batch experiments were carried out for each isolated strain in triplicate in
serum bottles of 120ml capacity. The growth medium used was the modified Postgate B medium containing sulphate (3.5g/litre) and dried watermelon rind powder (2%) as a carbon source instead of lactate while in control experiments lactic acid (sodium salt) was used as a carbon source. The inoculum size used was 5% (v/v) having almost 4.1×10
6CFU/ml. pH of the medium was maintained
at 6.0 for each experiment. Diffusion of oxygen in inoculated media was prevented by adding a layer of autoclaved liquid paraffin. The inoculated bottles were sealed with fine rubber stoppers and aluminium crimp seals and incubated at 30
oC for 50 days.
Analytical procedures Periodically, 5ml samples were taken with the help of a syringe for
measuring pH, sulphate and colony forming units (CFU/ml). pH was measured with the help of a digital pH meter while sulphate was estimated following the method as described by Cha, et al. (1999).
RESULTS AND DISCUSSION
This study reports for the very first time the utilization of watermelon rind
as a carbon source by four sulfidogenic bacterial strains isolated from the local environment of Pakistan. Sulphate reducing pattern appeared quite different when watermelon rind was used instead of sodium lactate. In the initial stages of incubation, sulphate was reduced drastically. About half of the total added sulphate was consumed / reduced in the first 10 days of incubation (Fig 1). But in the latter 40 days of incubation, only 29% sulphate was reduced as a whole. Such types of results were consistent for all isolated strains. Basically, watermelon rind is a mixture of many simple and complex molecules (Kumar, et al., 2012). In the early stages of incubation, low molecular weight molecules of the mixture were in abundance with the complex molecules and frequently available for sulphate reducing bacterial growth but with the passage of time simpler molecules became exhausted from the medium due to consumption of these in the growth of SRB and thus became unavailable or very less available to be utilized by SRB in the coming period. That’s why the sulphate reducing rate became very slow in the latter days of incubation. The preference of SRB for simple organic molecules has already been investigated (Gibert, et al., 2004; Tsukamoto, et al., 2004; Zaguary, et al., 2006).
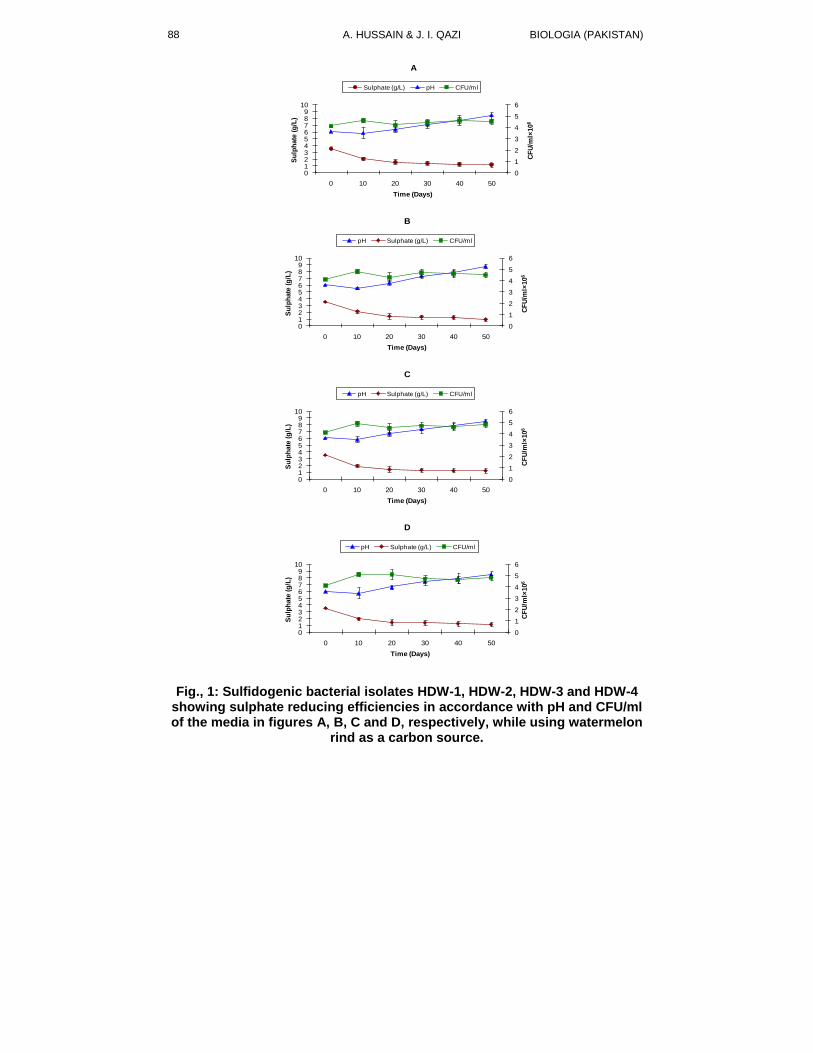
A. HUSSAIN & J. I. QAZI BIOLOGIA (PAKISTAN) 88
0
1
2
3
4
5
6
0123456789
10
0 10 20 30 40 50
CF
U/m
l×10
6
Su
lph
ate
(g
/L)
Time (Days)
A
Sulphate (g/L) pH CFU/ml
0
1
2
3
4
5
6
0123456789
10
0 10 20 30 40 50
CF
U/m
l×10
6
Su
lph
ate
(g
/L)
Time (Days)
B
pH Sulphate (g/L) CFU/ml
0
1
2
3
4
5
6
0123456789
10
0 10 20 30 40 50
CF
U/m
l×10
6
Su
lph
ate
(g
/L)
Time (Days)
C
pH Sulphate (g/L) CFU/ml
0
1
2
3
4
5
6
0123456789
10
0 10 20 30 40 50
CF
U/m
l×10
6
Su
lph
ate
(g
/L)
Time (Days)
D
pH Sulphate (g/L) CFU/ml
Fig., 1: Sulfidogenic bacterial isolates HDW-1, HDW-2, HDW-3 and HDW-4 showing sulphate reducing efficiencies in accordance with pH and CFU/ml of the media in figures A, B, C and D, respectively, while using watermelon
rind as a carbon source.
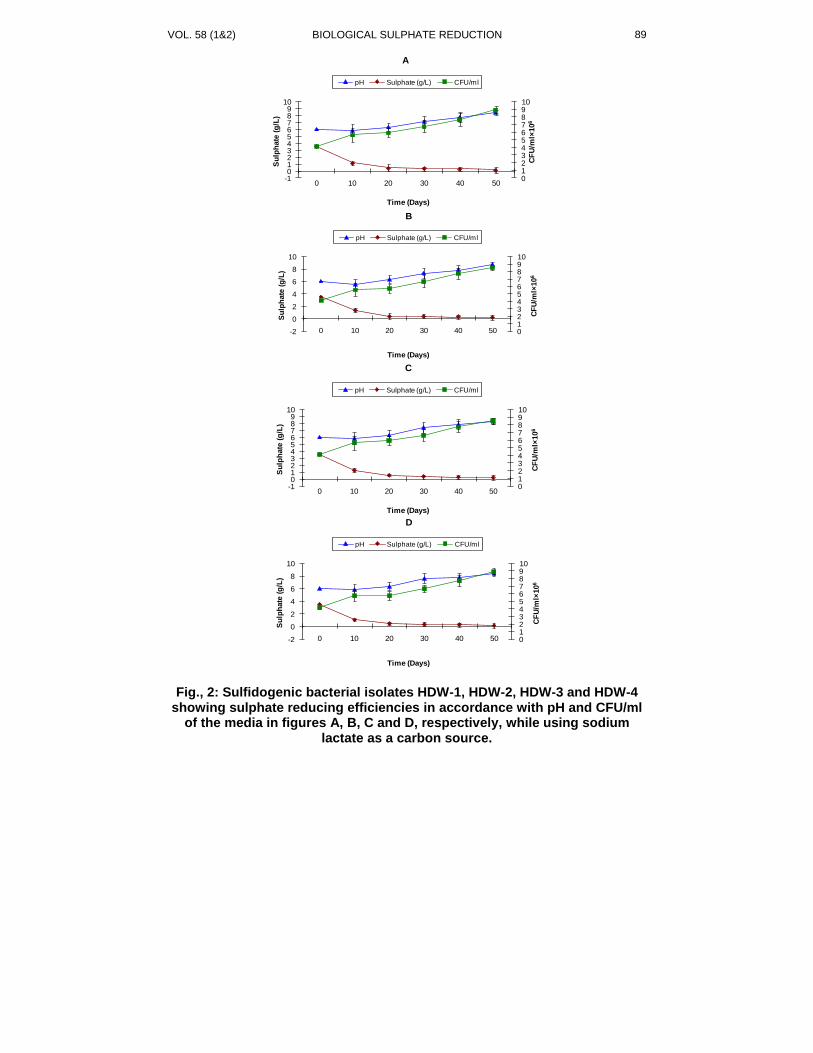
VOL. 58 (1&2) BIOLOGICAL SULPHATE REDUCTION
89
012345678910
-10123456789
10
0 10 20 30 40 50
CF
U/m
l×10
6
Su
lph
ate
(g
/L)
Time (Days)
A
pH Sulphate (g/L) CFU/ml
012345678910
-2
0
2
4
6
8
10
0 10 20 30 40 50
CF
U/m
l×10
6
Su
lph
ate
(g
/L)
Time (Days)
B
pH Sulphate (g/L) CFU/ml
012345678910
-10123456789
10
0 10 20 30 40 50
CF
U/m
l×10
6
Su
lph
ate
(g
/L)
Time (Days)
C
pH Sulphate (g/L) CFU/ml
012345678910
-2
0
2
4
6
8
10
0 10 20 30 40 50
CF
U/m
l×10
6
Su
lph
ate
(g
/L)
Time (Days)
D
pH Sulphate (g/L) CFU/ml
Fig., 2: Sulfidogenic bacterial isolates HDW-1, HDW-2, HDW-3 and HDW-4 showing sulphate reducing efficiencies in accordance with pH and CFU/ml
of the media in figures A, B, C and D, respectively, while using sodium lactate as a carbon source.
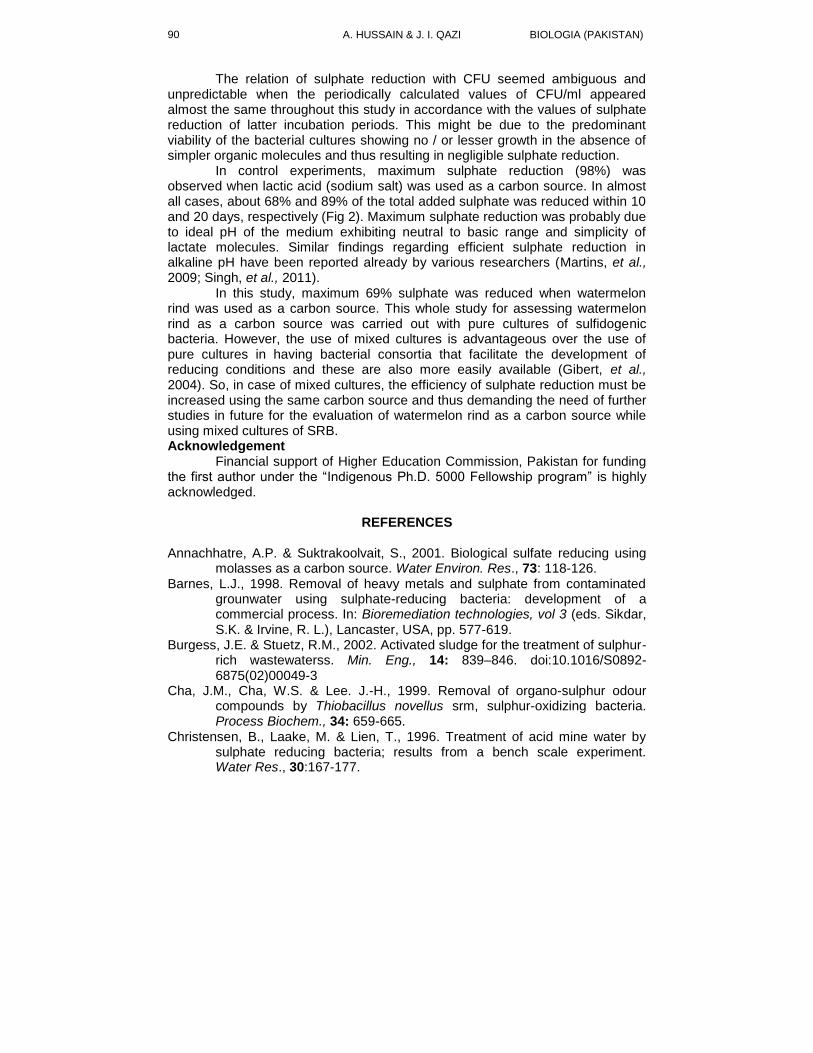
A. HUSSAIN & J. I. QAZI BIOLOGIA (PAKISTAN) 90
The relation of sulphate reduction with CFU seemed ambiguous and
unpredictable when the periodically calculated values of CFU/ml appeared almost the same throughout this study in accordance with the values of sulphate reduction of latter incubation periods. This might be due to the predominant viability of the bacterial cultures showing no / or lesser growth in the absence of simpler organic molecules and thus resulting in negligible sulphate reduction.
In control experiments, maximum sulphate reduction (98%) was observed when lactic acid (sodium salt) was used as a carbon source. In almost all cases, about 68% and 89% of the total added sulphate was reduced within 10 and 20 days, respectively (Fig 2). Maximum sulphate reduction was probably due to ideal pH of the medium exhibiting neutral to basic range and simplicity of lactate molecules. Similar findings regarding efficient sulphate reduction in alkaline pH have been reported already by various researchers (Martins, et al., 2009; Singh, et al., 2011).
In this study, maximum 69% sulphate was reduced when watermelon rind was used as a carbon source. This whole study for assessing watermelon rind as a carbon source was carried out with pure cultures of sulfidogenic bacteria. However, the use of mixed cultures is advantageous over the use of pure cultures in having bacterial consortia that facilitate the development of reducing conditions and these are also more easily available (Gibert, et al., 2004). So, in case of mixed cultures, the efficiency of sulphate reduction must be increased using the same carbon source and thus demanding the need of further studies in future for the evaluation of watermelon rind as a carbon source while using mixed cultures of SRB. Acknowledgement
Financial support of Higher Education Commission, Pakistan for funding the first author under the “Indigenous Ph.D. 5000 Fellowship program” is highly acknowledged.
REFERENCES
Annachhatre, A.P. & Suktrakoolvait, S., 2001. Biological sulfate reducing using
molasses as a carbon source. Water Environ. Res., 73: 118-126. Barnes, L.J., 1998. Removal of heavy metals and sulphate from contaminated
grounwater using sulphate-reducing bacteria: development of a commercial process. In: Bioremediation technologies, vol 3 (eds. Sikdar, S.K. & Irvine, R. L.), Lancaster, USA, pp. 577-619.
Burgess, J.E. & Stuetz, R.M., 2002. Activated sludge for the treatment of sulphur-rich wastewaterss. Min. Eng., 14: 839–846. doi:10.1016/S0892-6875(02)00049-3
Cha, J.M., Cha, W.S. & Lee. J.-H., 1999. Removal of organo-sulphur odour compounds by Thiobacillus novellus srm, sulphur-oxidizing bacteria. Process Biochem., 34: 659-665.
Christensen, B., Laake, M. & Lien, T., 1996. Treatment of acid mine water by sulphate reducing bacteria; results from a bench scale experiment. Water Res., 30:167-177.
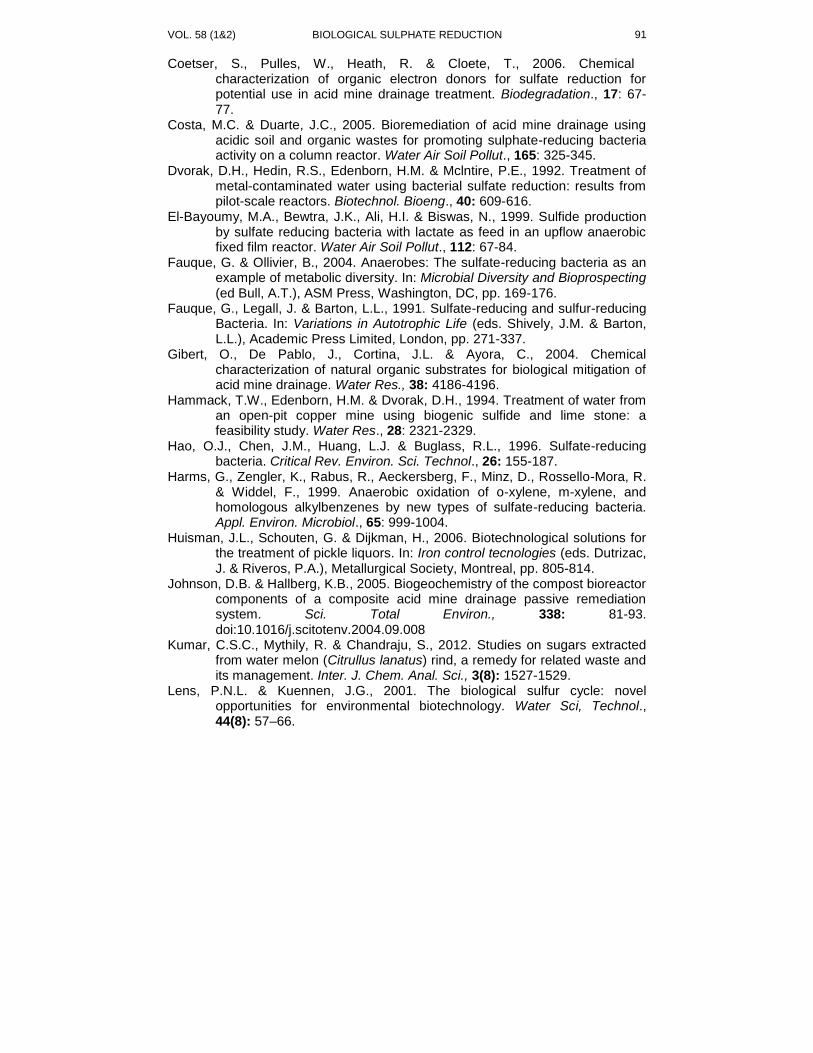
VOL. 58 (1&2) BIOLOGICAL SULPHATE REDUCTION
91
Coetser, S., Pulles, W., Heath, R. & Cloete, T., 2006. Chemical characterization of organic electron donors for sulfate reduction for potential use in acid mine drainage treatment. Biodegradation., 17: 67-77.
Costa, M.C. & Duarte, J.C., 2005. Bioremediation of acid mine drainage using acidic soil and organic wastes for promoting sulphate-reducing bacteria activity on a column reactor. Water Air Soil Pollut., 165: 325-345.
Dvorak, D.H., Hedin, R.S., Edenborn, H.M. & Mclntire, P.E., 1992. Treatment of metal-contaminated water using bacterial sulfate reduction: results from pilot-scale reactors. Biotechnol. Bioeng., 40: 609-616.
El-Bayoumy, M.A., Bewtra, J.K., Ali, H.I. & Biswas, N., 1999. Sulfide production by sulfate reducing bacteria with lactate as feed in an upflow anaerobic fixed film reactor. Water Air Soil Pollut., 112: 67-84.
Fauque, G. & Ollivier, B., 2004. Anaerobes: The sulfate-reducing bacteria as an example of metabolic diversity. In: Microbial Diversity and Bioprospecting (ed Bull, A.T.), ASM Press, Washington, DC, pp. 169-176.
Fauque, G., Legall, J. & Barton, L.L., 1991. Sulfate-reducing and sulfur-reducing Bacteria. In: Variations in Autotrophic Life (eds. Shively, J.M. & Barton, L.L.), Academic Press Limited, London, pp. 271-337.
Gibert, O., De Pablo, J., Cortina, J.L. & Ayora, C., 2004. Chemical characterization of natural organic substrates for biological mitigation of acid mine drainage. Water Res., 38: 4186-4196.
Hammack, T.W., Edenborn, H.M. & Dvorak, D.H., 1994. Treatment of water from an open-pit copper mine using biogenic sulfide and lime stone: a feasibility study. Water Res., 28: 2321-2329.
Hao, O.J., Chen, J.M., Huang, L.J. & Buglass, R.L., 1996. Sulfate-reducing bacteria. Critical Rev. Environ. Sci. Technol., 26: 155-187.
Harms, G., Zengler, K., Rabus, R., Aeckersberg, F., Minz, D., Rossello-Mora, R. & Widdel, F., 1999. Anaerobic oxidation of o-xylene, m-xylene, and homologous alkylbenzenes by new types of sulfate-reducing bacteria. Appl. Environ. Microbiol., 65: 999-1004.
Huisman, J.L., Schouten, G. & Dijkman, H., 2006. Biotechnological solutions for the treatment of pickle liquors. In: Iron control tecnologies (eds. Dutrizac, J. & Riveros, P.A.), Metallurgical Society, Montreal, pp. 805-814.
Johnson, D.B. & Hallberg, K.B., 2005. Biogeochemistry of the compost bioreactor components of a composite acid mine drainage passive remediation system. Sci. Total Environ., 338: 81-93. doi:10.1016/j.scitotenv.2004.09.008
Kumar, C.S.C., Mythily, R. & Chandraju, S., 2012. Studies on sugars extracted from water melon (Citrullus lanatus) rind, a remedy for related waste and its management. Inter. J. Chem. Anal. Sci., 3(8): 1527-1529.
Lens, P.N.L. & Kuennen, J.G., 2001. The biological sulfur cycle: novel opportunities for environmental biotechnology. Water Sci, Technol., 44(8): 57–66.
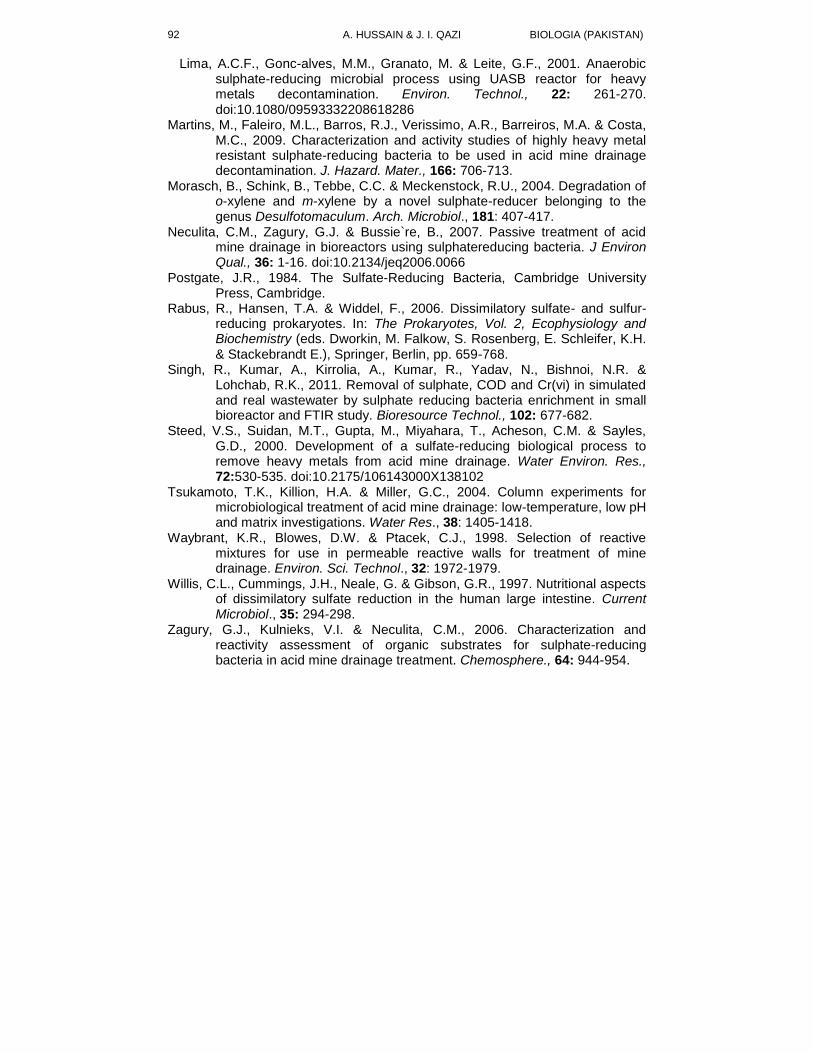
A. HUSSAIN & J. I. QAZI BIOLOGIA (PAKISTAN) 92
Lima, A.C.F., Gonc-alves, M.M., Granato, M. & Leite, G.F., 2001. Anaerobic sulphate-reducing microbial process using UASB reactor for heavy metals decontamination. Environ. Technol., 22: 261-270. doi:10.1080/09593332208618286
Martins, M., Faleiro, M.L., Barros, R.J., Verissimo, A.R., Barreiros, M.A. & Costa, M.C., 2009. Characterization and activity studies of highly heavy metal resistant sulphate-reducing bacteria to be used in acid mine drainage decontamination. J. Hazard. Mater., 166: 706-713.
Morasch, B., Schink, B., Tebbe, C.C. & Meckenstock, R.U., 2004. Degradation of o-xylene and m-xylene by a novel sulphate-reducer belonging to the genus Desulfotomaculum. Arch. Microbiol., 181: 407-417.
Neculita, C.M., Zagury, G.J. & Bussie`re, B., 2007. Passive treatment of acid mine drainage in bioreactors using sulphatereducing bacteria. J Environ Qual., 36: 1-16. doi:10.2134/jeq2006.0066
Postgate, J.R., 1984. The Sulfate-Reducing Bacteria, Cambridge University Press, Cambridge.
Rabus, R., Hansen, T.A. & Widdel, F., 2006. Dissimilatory sulfate- and sulfur-reducing prokaryotes. In: The Prokaryotes, Vol. 2, Ecophysiology and Biochemistry (eds. Dworkin, M. Falkow, S. Rosenberg, E. Schleifer, K.H. & Stackebrandt E.), Springer, Berlin, pp. 659-768.
Singh, R., Kumar, A., Kirrolia, A., Kumar, R., Yadav, N., Bishnoi, N.R. & Lohchab, R.K., 2011. Removal of sulphate, COD and Cr(vi) in simulated and real wastewater by sulphate reducing bacteria enrichment in small bioreactor and FTIR study. Bioresource Technol., 102: 677-682.
Steed, V.S., Suidan, M.T., Gupta, M., Miyahara, T., Acheson, C.M. & Sayles, G.D., 2000. Development of a sulfate-reducing biological process to remove heavy metals from acid mine drainage. Water Environ. Res., 72:530-535. doi:10.2175/106143000X138102
Tsukamoto, T.K., Killion, H.A. & Miller, G.C., 2004. Column experiments for microbiological treatment of acid mine drainage: low-temperature, low pH and matrix investigations. Water Res., 38: 1405-1418.
Waybrant, K.R., Blowes, D.W. & Ptacek, C.J., 1998. Selection of reactive mixtures for use in permeable reactive walls for treatment of mine drainage. Environ. Sci. Technol., 32: 1972-1979.
Willis, C.L., Cummings, J.H., Neale, G. & Gibson, G.R., 1997. Nutritional aspects of dissimilatory sulfate reduction in the human large intestine. Current Microbiol., 35: 294-298.
Zagury, G.J., Kulnieks, V.I. & Neculita, C.M., 2006. Characterization and reactivity assessment of organic substrates for sulphate-reducing bacteria in acid mine drainage treatment. Chemosphere., 64: 944-954.
BIOLOGIA (PAKISTAN) 2012, 58 (1&2), 93-100 PK ISSN 0006 - 3096
*Corresponding author: [email protected]
Estimation of Biomass and Carrying Capacity of Scrub Rangelands in Ucchali Wetland Complex, Soon Valley
SHAHID ABBAS1, AAMIR SALEEM2, ZAHID SHARIF MIRZA3 &
SARWAT N. MIRZA4
1,2,4Department of Forestry & Range Management, PMAS-Arid Agriculture
University Rawalpindi. 3Fisheries Research & Training Institute, P.O. Batapur , Lahore, Pakistan.
ABSTRACT
Quantitative biomass assessment of Ucchali Wetland Complex, Soon Valley,
Pakistan was conducted to determine the productive potential and carrying capacity during summer, winter and spring seasons, Three sites were selected using stratified sampling with quadrate method. Overall, average biomass production was 1113 kg ha
-1 in
the area. The maximum biomass production (1196 kg ha-1
) was observed in Khabaki lake which was followed by (1081 kg ha
-1) Jhalar lake. Ucchali lake recorded the minimum
biomass production (1061 kg ha-1
). The area was found in fair condition with overall carrying capacity 5.82 ha AU
-1year
-1. The maximum carrying capacity (5.42 ha AU
-1year
-1)
was observed in Khabaki lake which was followed by (5.99 ha AU-1
year-1
) Jhalar lake. The minimum carrying capacity (6.1ha) was determined in Ucchali lake. Results obtained in this study provide the information to the manager of the wetland complex to manage area according to its carrying capacity and vegetation availability in various seasons. Key Words: Rangeland, Ucchali wetland complex, carrying capacity, biomass production
INTRODUCTION
Rangelands are those areas of the world which by reason of certain
physical characteristics (Low and variable precipitation, uneven topography, poor drainage, or cold temperature) are inappropriate for cultivation but are a source of wood products, water and forage for livestock (Miller, 1997). Livestock forms an important source of livelihoods in rangelands. The increasing human population has raised the demand for livestock production. It in turn has exerted pressure on rangeland resources resulting in degradation and depletion of vegetation (Ahmed et al., 2006). Vegetation cover is a source of rangeland forage. Carrying capacity has widely been used as tool in range management (Bonham, 1989; Tewari & Arya, 2004; Walker, 1995). It is supportable population of an organism given the food, habitat and other necessities available within an ecosystem for that organism (Sayre, 2008; Young, 1998). Carrying capacity depends upon certain factors, such as climatic factor, rain, sunshine and social activities. This includes rainfall, vegetation accessibility and distribution, seasonality, range improvement and grazing management. Because of so many variables, there is so simple way to quantitatively determine carrying capacity. It may vary from year to year on the same area due to fluctuating forage production (Christian, 1998).
Pakistan has an area of 87.98 million hectare (mha), out of which 45.2 million ha (51.4 %) consists of rangelands (Mohammad & Naz, 1985;
S. ABBAS ET AL BIOLOGIA (PAKISTAN) 94
Muhammad, 1989). The contribution of range resources in Pakistan are only 10-50 % of their actual potential whereas it can be used to feed the increasing human and livestock population. Due to overgrazing, mismanagement in utilization of water resources and deforestation the palatable forage species are decreasing. The current annual production from rangelands is about 21 mt DM (Dry matter) that could be increased to at least three times (Muhammad & Naqvi, 1987; Sultana et al., 2000).
The Ucchali Wetlands Complex is an important Ramsar Site in Punjab, Pakistan. The three lakes forming the Wetland complex are located in a cup-shaped catchment area called the Soon valley and having an area of about 1233 hectares (WWF, 1994).Scrub rangelands of Ucchali Wetlands Complex, is present in District Khushab. Non uniform grazing and increasing number of livestock in the area is posing a threat to the biomass production and can lead towards the degradation of rangeland. No information is available on the carrying capacity and biomass production of the area The present study was conducted to determine the biomass production and carrying capacity of scrub rangelands in Ucchali Wetland Complex, Soon Valle.
MATERIALS AND METHODS
Description of Study Area
The study was conducted in scrub rangelands of Ucchalli Wetland Complex, Soon Valley (32º 25’ to 32º 45’ N and 72º 00’ to 72º 30’ E). The Ucchalli Wetland Complex comprises of Ucchali, Khabaki and Jhalar Lakes and covers an area of 35 km in length and 9 km in breadth and with an average elevation of 762 m. The complex is located in the Soon Valley of the Potowar Plateau approximately 250 kilometers from Rawalpindi. The area receives relatively low annual rainfall 500 mm or less, with average minimum temperature of 10C
o (January) and average maximum temperature (36 C
o) as in June
(Hussain, 2002). Sampling Sites The whole area was divided into three sites namely Ucchali, Khabaki and Jhalar Lake and sampling sites were selected on the basis of this division. The total land area of Ucchali Wetland Complex is 1233 ha out of this 2.5 % area was used as sample as per standard sampling procedure. There were overall 30 plots having an area of 1 ha each. The plot to plot distance was 547 m. Each site was treated as separate block. The representative sampling sites from each lake were selected randomly after visiting the target area. From each lake 10 plots were selected randomly and from each plot, 5 quadrate were taken at a distance of 20 m. These quadrates were taken from Ucchali, Khabaki and Jhalar lakes. In total 150 quadrates (50 Ucchali, 50 Khabaki and 50 from Jhalar) were taken from the whole study area and the data was collected during summer, winter and spring season during 2010-11. Estimation of Carrying Capacity and Biomass Production
Sampling was carried out during summer, winter and spring season during 2010-11.Intotal 450 samples were taken during the three seasons for measuring forage biomass in 30 plots. To determine the carrying capacity of study area 1m
2 quadrate was used. Quadrate was thrown in sampling plot and
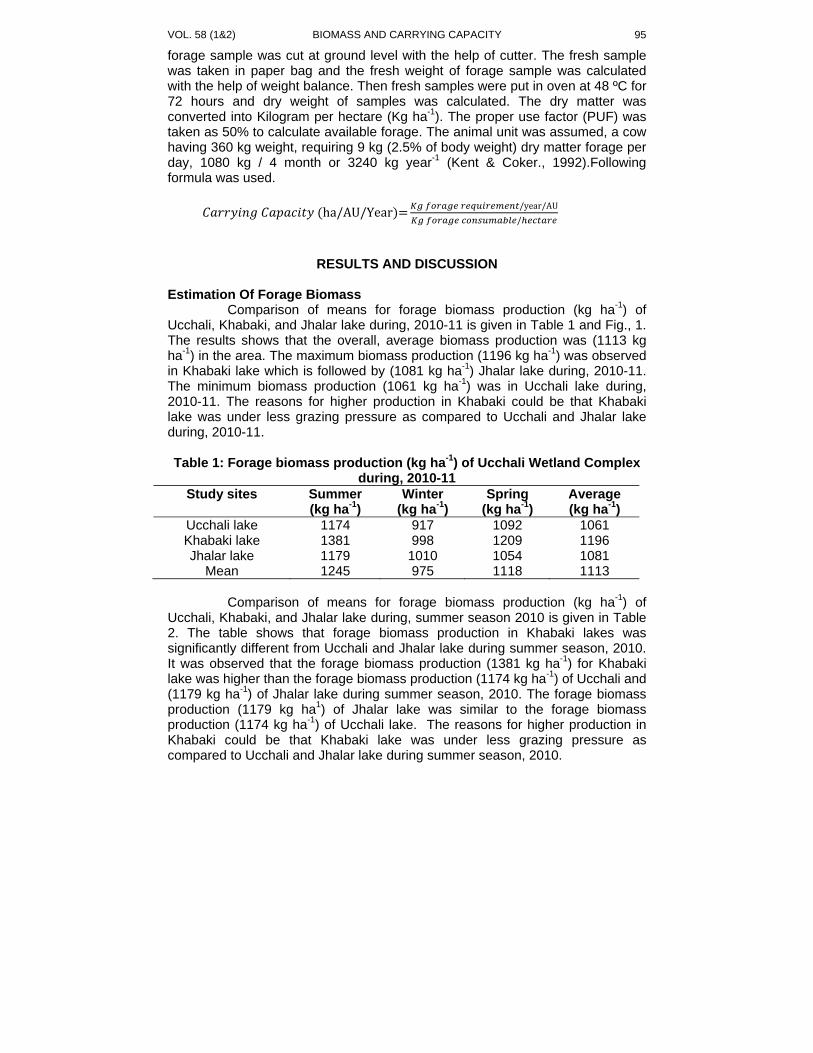
VOL. 58 (1&2) BIOMASS AND CARRYING CAPACITY
95
forage sample was cut at ground level with the help of cutter. The fresh sample was taken in paper bag and the fresh weight of forage sample was calculated with the help of weight balance. Then fresh samples were put in oven at 48 ºC for 72 hours and dry weight of samples was calculated. The dry matter was converted into Kilogram per hectare (Kg ha
-1). The proper use factor (PUF) was
taken as 50% to calculate available forage. The animal unit was assumed, a cow having 360 kg weight, requiring 9 kg (2.5% of body weight) dry matter forage per day, 1080 kg / 4 month or 3240 kg year
-1 (Kent & Coker., 1992).Following
formula was used.
ha/AU/Year /year/AU
/
RESULTS AND DISCUSSION
Estimation Of Forage Biomass Comparison of means for forage biomass production (kg ha
-1) of
Ucchali, Khabaki, and Jhalar lake during, 2010-11 is given in Table 1 and Fig., 1. The results shows that the overall, average biomass production was (1113 kg ha
-1) in the area. The maximum biomass production (1196 kg ha
-1) was observed
in Khabaki lake which is followed by (1081 kg ha-1
) Jhalar lake during, 2010-11. The minimum biomass production (1061 kg ha
-1) was in Ucchali lake during,
2010-11. The reasons for higher production in Khabaki could be that Khabaki lake was under less grazing pressure as compared to Ucchali and Jhalar lake during, 2010-11.
Table 1: Forage biomass production (kg ha-1) of Ucchali Wetland Complex
during, 2010-11 Study sites Summer
(kg ha-1) Winter
(kg ha-1) Spring
(kg ha-1) Average (kg ha-1)
Ucchali lake 1174 917 1092 1061 Khabaki lake 1381 998 1209 1196 Jhalar lake 1179 1010 1054 1081
Mean 1245 975 1118 1113
Comparison of means for forage biomass production (kg ha
-1) of
Ucchali, Khabaki, and Jhalar lake during, summer season 2010 is given in Table 2. The table shows that forage biomass production in Khabaki lakes was significantly different from Ucchali and Jhalar lake during summer season, 2010. It was observed that the forage biomass production (1381 kg ha
-1) for Khabaki
lake was higher than the forage biomass production (1174 kg ha-1
) of Ucchali and (1179 kg ha
-1) of Jhalar lake during summer season, 2010. The forage biomass
production (1179 kg ha1) of Jhalar lake was similar to the forage biomass
production (1174 kg ha-1
) of Ucchali lake. The reasons for higher production in Khabaki could be that Khabaki lake was under less grazing pressure as compared to Ucchali and Jhalar lake during summer season, 2010.
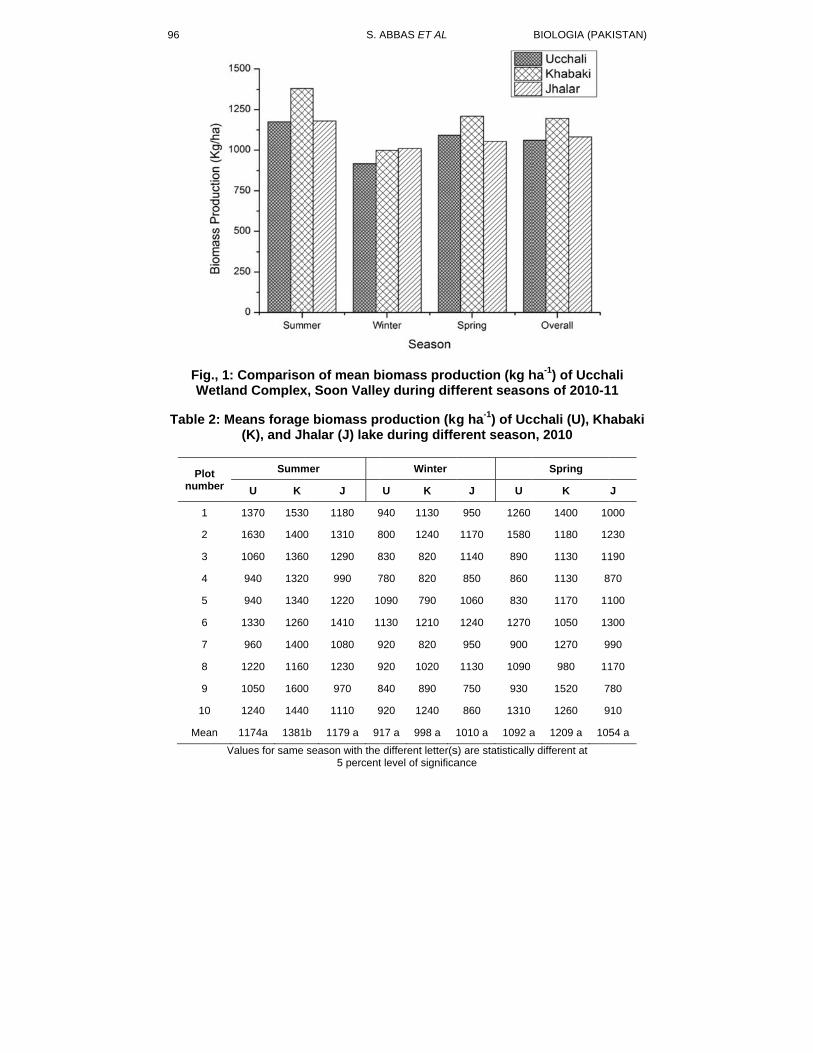
96
Fig., 1Wetla
Table 2: M
Plot number
1
2
3
4
5
6
7
8
9
10
Mean
V
: Comparisoand Complex
Means forage(K), and Jh
Summ
U K
1370 1530
1630 1400
1060 1360
940 1320
940 1340
1330 1260
960 1400
1220 1160
1050 1600
1240 1440
1174a 1381
Values for same
S. A
on of mean bx, Soon Valle
e biomass prhalar (J) lake
mer
J
0 1180 9
0 1310 8
0 1290 8
0 990 7
0 1220 1
0 1410 1
0 1080 9
0 1230 9
0 970 8
0 1110 9
b 1179 a 91
season with the5 percent
ABBAS ET AL
biomass prodey during diff
roduction (kge during diffe
Winter
U K
940 1130
800 1240
830 820
780 820
090 790
130 1210
920 820
920 1020
840 890
920 1240
17 a 998 a 1
different letter(st level of significa
duction (kg hferent seaso
g ha-1) of Ucerent season
J U
950 1260
1170 1580
1140 890
850 860
1060 830
1240 1270
950 900
1130 1090
750 930
860 1310
1010 a 1092 a
s) are statisticallyance
BIOLOGIA (PAK
ha-1) of Ucchons of 2010-1
cchali (U), Khn, 2010
Spring
K
1400 10
1180 12
1130 11
1130 8
1170 11
1050 13
1270 9
980 11
1520 7
1260 9
a 1209 a 10
y different at
KISTAN)
ali 11
habaki
J
000
230
190
870
100
300
990
170
780
910
54 a
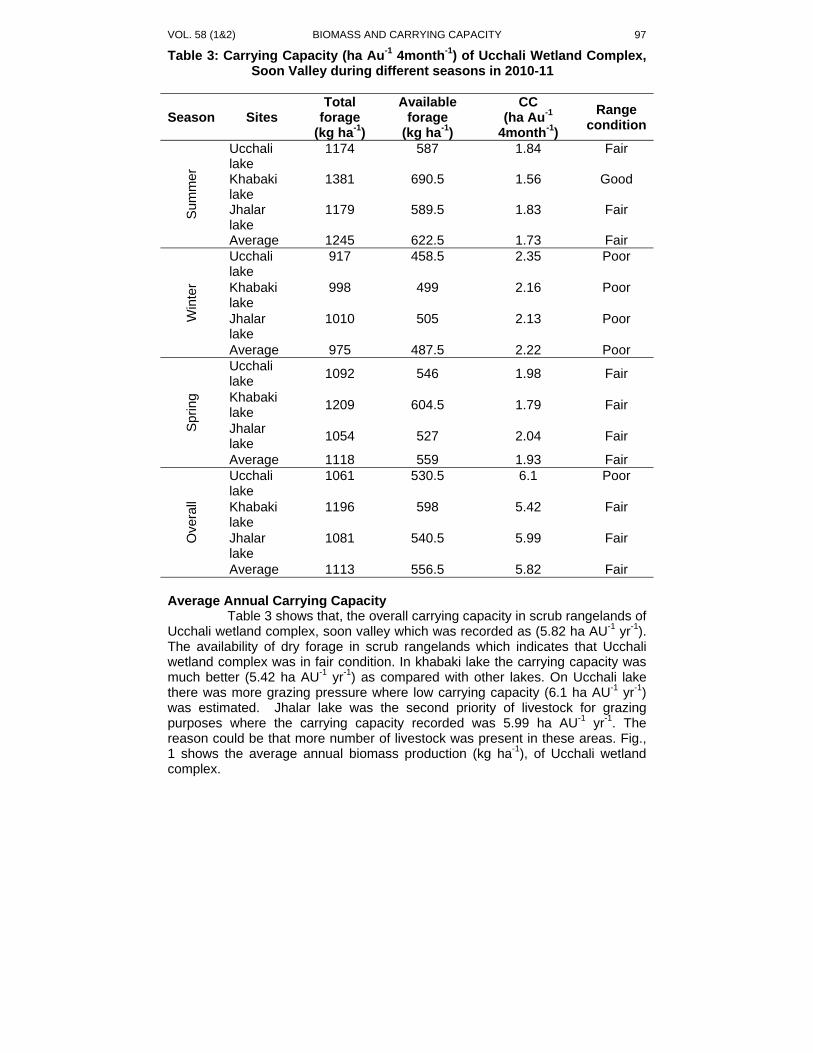
VOL. 58 (1&2) BIOMASS AND CARRYING CAPACITY
97
Table 3: Carrying Capacity (ha Au-1 4month-1) of Ucchali Wetland Complex, Soon Valley during different seasons in 2010-11
Season Sites Total
forage (kg ha-1)
Available forage
(kg ha-1)
CC (ha Au-1
4month-1)
Range condition
Sum
mer
Ucchali lake
1174 587 1.84 Fair
Khabaki lake
1381 690.5 1.56 Good
Jhalar lake
1179 589.5 1.83 Fair
Average 1245 622.5 1.73 Fair
Win
ter
Ucchali lake
917 458.5 2.35 Poor
Khabaki lake
998 499 2.16 Poor
Jhalar lake
1010 505 2.13 Poor
Average 975 487.5 2.22 Poor
Spring
Ucchali lake
1092 546 1.98 Fair
Khabaki lake
1209 604.5 1.79 Fair
Jhalar lake
1054 527 2.04 Fair
Average 1118 559 1.93 Fair
Overa
ll
Ucchali lake
1061 530.5 6.1 Poor
Khabaki lake
1196 598 5.42 Fair
Jhalar lake
1081 540.5 5.99 Fair
Average 1113 556.5 5.82 Fair
Average Annual Carrying Capacity
Table 3 shows that, the overall carrying capacity in scrub rangelands of Ucchali wetland complex, soon valley which was recorded as (5.82 ha AU
-1 yr
-1).
The availability of dry forage in scrub rangelands which indicates that Ucchali wetland complex was in fair condition. In khabaki lake the carrying capacity was much better (5.42 ha AU
-1 yr
-1) as compared with other lakes. On Ucchali lake
there was more grazing pressure where low carrying capacity (6.1 ha AU-1
yr-1
) was estimated. Jhalar lake was the second priority of livestock for grazing purposes where the carrying capacity recorded was 5.99 ha AU
-1 yr
-1. The
reason could be that more number of livestock was present in these areas. Fig., 1 shows the average annual biomass production (kg ha
-1), of Ucchali wetland
complex.
S. ABBAS ET AL BIOLOGIA (PAKISTAN) 98
Seasonal Carrying Capacity i) Summer season carrying capacity
Table 3 shows the overall carrying capacity (1.73 ha AU-1
4 months-1
) in summer season, which indicates that in summer season 2010, Ucchali wetland complex, was in fair condition according to availability of forage biomass. On khabaki lake the carrying capacity was good (1.56 ha AU
-1 4month
-1) while on
Ucchali lake the carrying capacity was fair (1.84 ha AU-1
4month-1
). On Jhalar lake the carrying capacity was also fair 1.83 ha AU
-1 4month
-1 during summer
season, 2010. Fig., 1 shows the summer season biomass production (kg ha-1
) of Ucchali wetland complex.
ii) Winter season carrying capacity Table 3 shows the overall carrying capacity (2.22 ha AU
-1 4month
-1), in
winter season, which indicates that in winter season 2010-11, Ucchali wetland complex, was in poor condition due to availability of low forage biomass. On Jhalar lake the carrying capacity was poor (2.13 ha AU
-1 4month
-1) while on
khabaki lake the carrying capacity was (2.16 ha AU-1
4month-1
). On Jhalar lake the carrying capacity was also poor 2.35 ha AU-1 4month-1 during winter season, 2010-11. Figure 1 shows the winter season biomass production (kg ha
-1)
of Ucchali wetland complex. iii) Spring season carrying capacity
Table 3 shows the overall carrying capacity of scrub rangelands in Ucchali wetland complex, which was calculated as (1.93 ha AU
-1 4month
-1) which
indicates that in spring season 2011, Ucchali wetland complex, was in fair condition on the basis of forage biomass availability. In khabaki lake the carrying capacity was much better (1.79 ha AU
-1 4month
-1) as compared to other lakes. In
Ucchali lake the carrying capacity (1.98 ha Au-1 4month-1), was fair, while in Jhalar lake the carrying capacity was also fair 2.04 ha AU
-1 4month
-1 during
spring season, 2011. Figure 1 shows the spring season biomass production (kg ha
-1) of Ucchali wetland complex.
The maximum biomass production (1196 kg ha-1
) was observed in Khabaki lake which was far below the value of 4350 Kg ha
-1 recorded in some
high potential sites of Pothwar tract protected for 2 years, which is equivalent to 2 ha per animal unit/ annum. Similar estimates have been made on moderate and depleted sites as 7 and 56 ha per animal unit per annum respectively (Quraishi et al., 1993).On the other hand maximum carrying capacity (5.42 ha AU
-1year
-1)
was observed during this study was in Khabaki lake which is far less than that for the high potential sites. Most the sites during the present study had lower values of biomass production and carrying capacity. For example, Ucchali lake recorded the minimum biomass production (1061 kg ha
-1)overall carrying capacity 5.82 ha
AU-1
year-1
. Range condition is the present state of vegetation of a range site in relation to the climax plant community for that site. Excellent or good range condition represents climax and poor range condition represents deviation from climax (Dyksterhuis, 1958).In Pindigheb, area of Attock district where two ecological zones are established, the unprotected over grazed areas showed about 2.5-7.0 times decline in forage production. The unprotected over grazed areas have 147% and 638% development potential in each ecological zone for carrying capacity in animal units per hectare per year, if protected from open grazing and improved by system of grazing management (Raza & Ahmad,
VOL. 58 (1&2) BIOMASS AND CARRYING CAPACITY
99
1990).The soil characteristics of the wetland complex supporting the plant communities are similar, therefore, the carrying capacity and biomass production were also similar. The only difference was the proximity to villages which probably enhanced the grazing pressure which was responsible for the differences in values.
Haider et al. (2011)had found that in in open grazing system, the dry forage yield in Pabbi Hills of Kharian Range had declined from 550 Kg ha
-1 in
2000-2001 to 220 Kg ha-1
in 2003-04. They recommended 6-month seasonal deferred grazing to be practiced in this region. Similarly for Mari Reserve Forest of Pothwartract, Chaudhry et al. (2010)had found that reseeded area produced about 16 times (7733 kg ha
-1) more forage than the untreated area (491 kg ha
-1)
with carrying capacity of 0.07 and 1.18 Animal Units per ha per year in untreated and treated areas respectively. It is, therefore, concluded that the biomass production and resulting carrying capacity of the wetland complex can be substantially improved by proper system of grazing management.
REFERENCES
Ahmed, M., Raza, F. A., Masud, J., & Ali, I., 2006. Ecological assessment of production potential for rangeland vegetation in Southern Attock, Pakistan. International Journal of Agriculture and Biology, 2: 212-215.
Bonham, C. D., 1989. Measurements for terrestrial vegetation. John Wiley and Sons. New York.
Chaudhry, A. A., Haider, M. S., Ahsan, J., & Fazal, S., 2010. Determining carrying capacity of untreated and treated areas of Mari Reserve forest of Pothwar Rangelands, after reseeding with Cenchrus ciliaris. J. Animal & Plant Sciences, 20(2): 103-106.
Christian, C. Y., 1998. Defining the range: The Development of Carrying Capacity in Management Practices. J. Hist. Biol., 31: 61-83.
Dyksterhuis, E. J., 1958. Ecological principles in range evaluation. Bot. Rev., 24: 253-272.
Haider, M. S., Maclaurin, A., Chaudhary, A. A., & Mushtaque, M., 2011. Effect of grazing systems on range condition in Pubbi Hills Reserve Forest, Kharian, Punjab, Pakistan. Chilean Journal of Agricultural Research, 71(4): 560-565.
Hussain, M. (2002). Expolaration of legume diversity endemic to Salt Range in the Punjab: Report submitted to University of Agriculture, Faisalabad, Pakistan.
Kent, M., & Coker., P., 1992. Vegetation description and analysis. A practical approach. CRC press Boca Raton Ann Arbor and Belhaven press Londan.
Miller, D., 1997. Rangelands and Range management. Newsletter No. 27, ICIMOD, Nepal.
Mohammad, N., & Naz, M. S., 1985. Range management and forage research in Pakistan. Progressive Farming, 5: 44-51.
Muhammad, N., 1989. Range management in Pakistan. ICMOD. Katmandu, Nepal.
Muhammad, N., & Naqvi, A. H., 1987. Dry matter yield of promising grasses in
S. ABBAS ET AL BIOLOGIA (PAKISTAN) 100
tropical and rangelands of Sindh, Pakistan. Tropical Agriculture, 64: 70-71.
Quraishi, M. A. A., Khan, G. S., & Yaqoob, M. S., 1993. Range Management in Pakistan. Qazi Publications. Lahore.
Raza, F. A., & Ahmad, M., 1990. Rangeland vegetation degradation and development potential of Pindigheb area Pothwar. Pakistan Journal of Agricultural Research, 11(1): 35-46.
Sayre, N. F., 2008. The genesis, history, and limits of carrying capacity. Annals of the Association of American Geographers, 98(1): 120-134.
Sultana, F., Qamar, I. A., Sultani, M., Ali, A., & Arshad, M., 2000. Determination of carrying capacity of a sown pasture in the pothwar plateau of Pakistan. Pak. J. Biol. Sci, 3: 2077-2078.
Tewari, V. P., & Arya, R., 2004. Degradation of arid rangelands in Thar Desert, India: A review. Arid Land Research and Management, 19(1): 1-12.
Walker, J. W., 1995. Viewpoint: grazing management and research now and in the next millennium. Journal of Range Management, 48: 350-357.
WWF. (1994). Report on the Participatory Rural Appraisal (PRA) training workshop organized in the Ucchali Complex by the Punjab Wildlife Department of the Government of Pakistan and the World Wide Fund For Nature (WWF). Karachi, Pakistan.
Young, C. C., 1998. Defining the range: The development of carrying capacity in management practice. Journal of the History of Biology, 31(1): 61-83.
BIOLOGIA (PAKISTAN) 2012, 58 (1&2), 101-121 PK ISSN 0006 - 3096
*Corresponding author:Cell: +92-333-4211100; email: [email protected]
Micro-propagation Studies in Juvenile Tissues of
Pistacia vera L.
ATHAR HUSSAIN
Department of Botany, Govt. College University, Lahore. Pakistan
ABSTRACT
Both physical and chemical factors were investigated for their effect on in vitro
growth of Pistacia vera seedling. Physical factors, light, vessel type and desiccation conditions, whereas chemical factors, PGR and sucrose, were investigated for better development of shoot, leaf and root of P. vera. Common phenomenon of shoot tip necrosis was observed throughout the study which was properly handled. Hardening process for shifting seedling to soil was also addressed. The study established potential use of juvenile tissue for micro-propagation of Pistacia vera. Key words. Pistacia vera, juvenile tissue, micropropagation, hormonal effect
INTRODUCTION
Pistacia vera L. is a deciduous, dioecious medium size tree belonging to the family Anacardiaceae. Family includes commercially important crops like Mango, Poison ivy and Cashew nuts. Genus Pistachio is also important for its role in agro-forestry, timber production and carpentry. Pistacia vera is an established crop in the Asia Minor and Mediterranean countries for centuries but now it has become a commercial crop world over. Traditionally Iran, Afghanistan, Turkey and Syria were the main producers of P. Vera. After integration of technology leading countries are Iran, Turkey, USA, China and Syria (Namil & Emine 2007).
Successful plantation of P. vera requires long and dry summer with a winter temperature of 5°C or lower. Latitudes 36°-37° are considered suitable areas for its growth. P. vera is a hard and drought resistant tree. It can be grown even on rocks and stony soils without any irrigation as they have very deep tap root system, however irrigation and good agricultural practices result in more yield and good quality fruit as compared to the non-irrigated trees (Rashid et al., 1989). Balochistan is the largest province of Pakistan extended over an area of 342,416 Sq. Kms. forming 43.6% of the total area of the country. Physically, Balochistan is an extensive plateau of rough terrain. The upper high lands rise as high as 3,700 meters, with the valley floors about 1,500 meters above sea level. Climatic conditions are as varied as the topography. In the plains and lower highlands, summers are very hot, and winters mild. In the upper highlands winters are cold and summer temperature relatively low. As the province lies outside the influence of the monsoon, rainfall is scanty and uncertain with very low humidity (Kureshy 1986). Balochistan with its traditional wild crop of Pistacia khinjuk can be exploited as an area suitable for Pistacia vera cultivation on commercial basis.
A. HUSSAIN BIOLOGIA (PAKISTAN) 102
The conventional method of Pistacia vera propagation is T-budding. The desired variety is budded to the compatible root stock. This method has many limitations, major being its restriction to specific season (Rashid et al., 1989) and low success percentage. The bud culture is a unique tool to develop true to type clones. The orchard developed can remain productive for 100 years justifying the use of bud culture technology. Keeping the difficulties and limitations in view the present study aims to activate buds to increase the number of shoots and rooting of in vitro shoot to increase the number of true to type plants.
MATERIALS AND METHODS
Preparation of plant materials Seeds of Pistacia vera were obtained from Balochistan Agriculture Department Quetta and stored at 4°C in air tight jars for aseptic seed germination. Aseptic seedlings were obtained by growing five surface sterilised seeds per 4 inch Petri plate under aseptic conditions. Seedling growth was studied in conical flasks of 125 and 250 ml and 50ml culture tubes. All vessels were plugged with cotton wool and covered with brown paper with the help of rubber bands. Plant growth regulators applied were BAP, Kin, IAA, NAA, IBA. For all the experiments MS salts with 3% sucrose was used. Fluorescent light was adjusted at 16 hours photoperiod at 3000 lux except where mentioned otherwise. Temperature was adjusted to 25±2°C throughout the investigations, except where mentioned otherwise. Surface sterilization of plant material Seeds of P. vera were washed thoroughly with tap water and surface sterilized with 90 % ethanol for one minute before their treatment with 0.1% HgCl2 for 15 minutes. Few drops of tween 20 were added as emulsifying agent. The plant material was rinsed 3-5 times with sterile double distilled water before inoculation, besides HgCl2, NaOCl or Ca(OCl)2 were also used. Culture medium MS medium (Murashige & Skoog 1962) was prepared in accordance with Tasaki (1985) and kept in refrigerator at 4°C. MS full, half, one fourth, one eighth and one sixteenth strength medium were prepared by mixing, full, half, one fourth, one eighth and one sixteenth of macro inorganic salts respectively. Micro inorganic salts and organic compounds were used in full strength. Plant growth regulators used BAP, Kinetin, Adenine sulphate, IAA, NAA and IBA. Rooting medium was supplemented with MS half strength macro-salts and full strength micro-salts. Sucrose concentration used was from 0.5 to 3%. The media was solidified with 0.6 % agar (Biolife). These were poured in 50 ml culture tubes, or 125 ml / 250 ml conical flasks in accordance with the need of the experiment. Before the addition of sucrose and agar pH of media were adjusted as required, with 0.1N KOH/HCl. Stomata study Stomata study was made by microscopic examination of detached lower epidermis. Compound light microscope, with an eye piece of 15x with objective piece of 10, 40 and 100x, was used. Ocular meter and stage micrometer were used for the measurements of stomata.
VOL. 58 (1&2) MICROPROPAGATION OF PISTACIA VERA L. 103
Hardening Hardening process was carried out in two steps. In the first step plugs were removed and water layer of 1 cm was applied while keeping the cultures under same physical conditions. In the second step after 48 hours of water layer treatment the seedling was removed from the tube along with the media and transferred to green house in the sandy loam soil. Plants were properly covered with wet transparent polythene bags for 7 days. The humidity of the bags was reduced gradually from day one onward by increasing number of pores per bag. Statistics Statistical analysis was performed by using software "MSTAT-C". Experiments were conducted in triplicates to record the results.
RESULTS
Proper plant growth is the result of both physical and chemical factors. In micro-propagation studies both factors were considered. A. Effect of physical conditions 1) Effect of light Intensity and quality of light was investigated for its effect on the seedling growth (Table 1). Exposure of Pistacia vera seedling to 1000 lux fluorescent light resulted in the appearance of 5±1.364 cm long shoot with 5±2.412 leaves without bud or root initiation. An increase in fluorescent light to 2000 lux had no marked effect on the seedling whereas exposure to 4000 lux fluorescent light resulted in reduction in shoot length to 4±2.513 cm, with increased number of leaves. A few buds and roots activation was also observed. The combined effect of fluorescent and incandescent light at 1000 and 2000 lux behaved similarly, but 4000 lux decreased the shoot length to 4 cm with an increase in leave number to 15±2.612. All buds under 4000 lux combined light intensity were activated without any change in the root length. Table 1: Effect of fluorescent and incandescent light intensity on seedling
(Lux) Characters Studied
Fluorescent Fluorescent + Incandescent
1000 2000 4000 1000 2000 4000
Shoot length 5 ± 1.364
5 ± 1.261 4 ± 2.513
5 ± 2.317
5 ± 1.712 4 ± 2.891
Leave number
5 ± 2.412
5 ± 3.124 10 ± 2.412
5 ± 1.967
5 ± 1.623 15 ± 2.612
Bud active nil nil few nil nil all
Root length nil nil 2 cm nil nil 2 cm
Length in cm
2) Effect of vessel.
Different types of containers were used to study their effect on seedling growth. Culture tubes of 50 ml and flasks of 125 ml with uniform mouth were used (Table 2). In culture tubes roots attained a length of 17.5±1.235 cm after four weeks, while in flasks gain in root length was only 6.3±1.591cm in the same time period. Similarly an increase of 15.5cm in shoot length was observed in
A. HUSSAIN BIOLOGIA (PAKISTAN) 104
culture tubes, while it was only 4.0±2.123 cm long in flasks. Shoots did not branch in culture tubes while in flasks branching was observed. Leave number was 15±2.657 in culture tube, while it was only 6±3.213 in flasks. Number and size of the leave were also affected by the vessel type, in culture tube they were more in number and large in size, while in flask they were less in number and small in size.
Table 2: Effect of vessel on seedling growth after 4 weeks Characters studied Culture tube
50ml Flasks 125ml
Root length thickness branching colour
17.5 ± 1.235 0.1 ± 0.715
5.00 ± 2.251 black
6.3 ± 1.591 0.1 ± 0.412 3.0 ± 1.210
black
Shoot length thickness branching nodes
15.5 ± 2.341 00.2 ± 0.256
nil 7 ± 2.175
4.0 ± 2.123 0.2 ± 0.120 2.0 ± 2.142
2 ± 2.124
Leaf number size
15 ± 2.657 1 × 2
6 3.± 213 0.5 × 1
All measurements in cm 3) Effect of Desiccation
i. Seedling growth Maximum root length (14.15±0.27 cm) was observed in control, followed by silica gel treatment (13.38±0.308 cm), while minimum root length (3.025±0.334 cm) was recorded in lanolin + silica gel treatment (Table 3). Shoot length was maximum (5.25±0.363 cm) in control conditions followed by lanolin treatment (4.1±0.178 cm). Minimum shoot length was examined when lanolin and silica gel combination was used. Leave number was maximum in silica gel (15±0.707) while minimum (5.500±1.118) in lanolin and silica gel combination. For root length and leaf number silica gel gave maximum results while lanolin proved good for only shoot length.
Table 3: Effect of Desiccation conditions on the growth of seedling Ch. Studied Control Lan. lay Sil. gel Lan. Lay + Sil. Gel
Root length 14.150 ± 0.270 4.600 ± 0.224 13.380 ± 0.308
3.025 ± 0.354
Shoot length
5.250 ± 0.363 4.100 ± 0.178 2.450 ± 0.369 1.075 ± 0.149
Leaf number
12.750 ± 0.829 12.000± 0.707 15.000 ± 0.707
5.500 ± 1.118
Lan. lay = lanolin layer Sil.gel = silica gel ch. = character
ii. Stomata development
Modified atmosphere in glassware showed modifications in stomata size and percentage development (Table 4). Size of stomata was 0.163µ
2 in
controlled conditions, which increased to (0.495µ2) when lanolin and silica gel
were used simultaneously and was minimum (0.150µ2) when lanolin was used
alone. Under controlled conditions open stomata were 57%. Desiccating conditions (lanolin + silica gel) decreased opening of stomata to 26.8%, while in
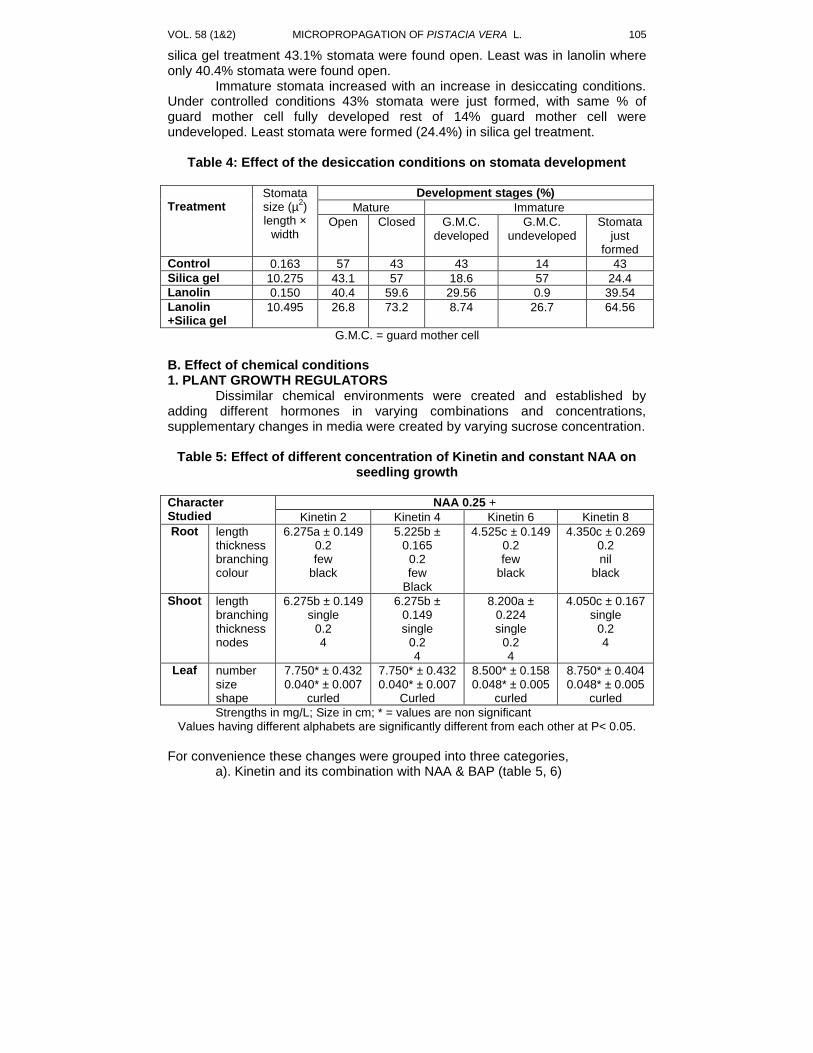
VOL. 58 (1&2) MICROPROPAGATION OF PISTACIA VERA L. 105
silica gel treatment 43.1% stomata were found open. Least was in lanolin where only 40.4% stomata were found open. Immature stomata increased with an increase in desiccating conditions. Under controlled conditions 43% stomata were just formed, with same % of guard mother cell fully developed rest of 14% guard mother cell were undeveloped. Least stomata were formed (24.4%) in silica gel treatment.
Table 4: Effect of the desiccation conditions on stomata development
Treatment
Stomata size (µ
2)
length × width
Development stages (%)
Mature Immature
Open Closed
G.M.C. developed
G.M.C. undeveloped
Stomata just
formed
Control 0.163 57 43 43 14 43
Silica gel 10.275 43.1 57 18.6 57 24.4
Lanolin 0.150 40.4 59.6 29.56 0.9 39.54
Lanolin +Silica gel
10.495 26.8 73.2 8.74 26.7 64.56
G.M.C. = guard mother cell
B. Effect of chemical conditions 1. PLANT GROWTH REGULATORS
Dissimilar chemical environments were created and established by adding different hormones in varying combinations and concentrations, supplementary changes in media were created by varying sucrose concentration.
Table 5: Effect of different concentration of Kinetin and constant NAA on
seedling growth
Character Studied
NAA 0.25 +
Kinetin 2 Kinetin 4 Kinetin 6 Kinetin 8
Root
length thickness branching colour
6.275a ± 0.149 0.2 few
black
5.225b ± 0.165
0.2 few
Black
4.525c ± 0.149 0.2 few
black
4.350c ± 0.269 0.2 nil
black
Shoot
length branching thickness nodes
6.275b ± 0.149 single
0.2 4
6.275b ± 0.149 single
0.2 4
8.200a ± 0.224 single
0.2 4
4.050c ± 0.167 single
0.2 4
Leaf
number size shape
7.750* ± 0.432 0.040* ± 0.007
curled
7.750* ± 0.432 0.040* ± 0.007
Curled
8.500* ± 0.158 0.048* ± 0.005
curled
8.750* ± 0.404 0.048* ± 0.005
curled
Strengths in mg/L; Size in cm; * = values are non significant Values having different alphabets are significantly different from each other at P< 0.05.
For convenience these changes were grouped into three categories,
a). Kinetin and its combination with NAA & BAP (table 5, 6)
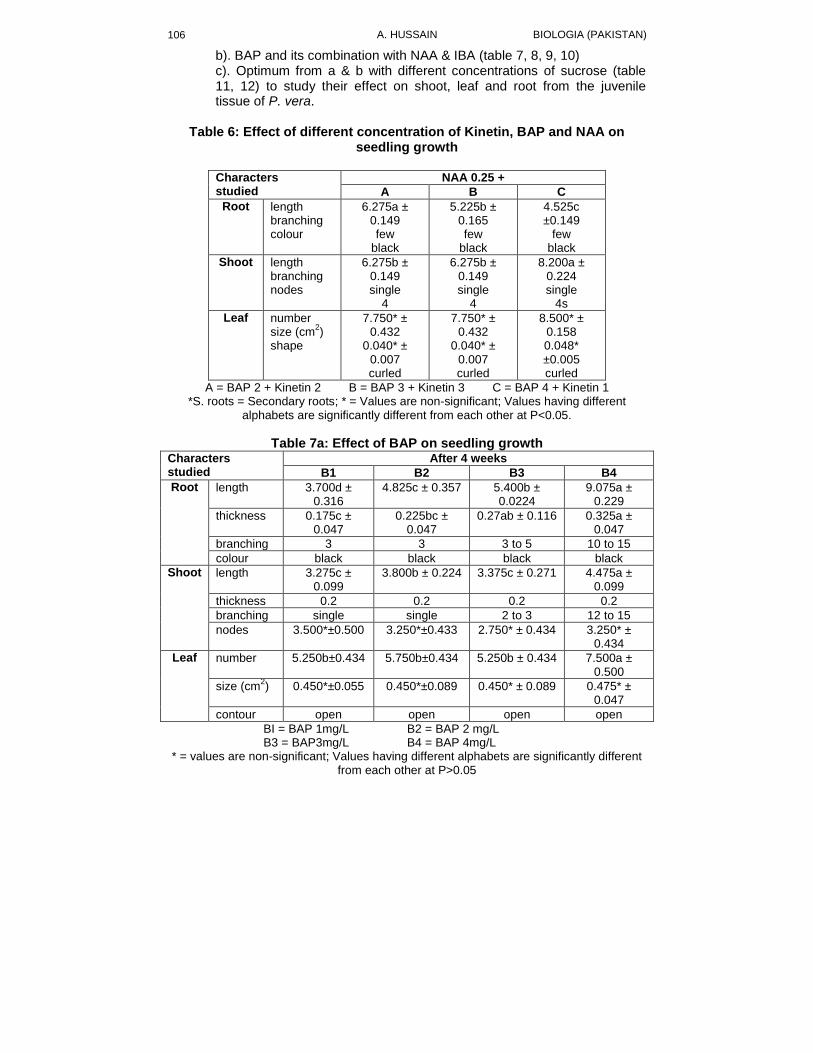
A. HUSSAIN BIOLOGIA (PAKISTAN) 106
b). BAP and its combination with NAA & IBA (table 7, 8, 9, 10) c). Optimum from a & b with different concentrations of sucrose (table 11, 12) to study their effect on shoot, leaf and root from the juvenile tissue of P. vera.
Table 6: Effect of different concentration of Kinetin, BAP and NAA on
seedling growth
Characters studied
NAA 0.25 +
A B C
Root
length branching colour
6.275a ± 0.149 few
black
5.225b ± 0.165 few
black
4.525c ±0.149
few black
Shoot
length branching nodes
6.275b ± 0.149 single
4
6.275b ± 0.149 single
4
8.200a ± 0.224 single
4s
Leaf
number size (cm
2)
shape
7.750* ± 0.432
0.040* ± 0.007 curled
7.750* ± 0.432
0.040* ± 0.007 curled
8.500* ± 0.158 0.048* ±0.005 curled
A = BAP 2 + Kinetin 2 B = BAP 3 + Kinetin 3 C = BAP 4 + Kinetin 1 *S. roots = Secondary roots; * = Values are non-significant; Values having different
alphabets are significantly different from each other at P<0.05.
Table 7a: Effect of BAP on seedling growth Characters studied
After 4 weeks
B1 B2 B3 B4
Root length 3.700d ± 0.316
4.825c ± 0.357 5.400b ± 0.0224
9.075a ± 0.229
thickness 0.175c ± 0.047
0.225bc ± 0.047
0.27ab ± 0.116 0.325a ± 0.047
branching 3 3 3 to 5 10 to 15
colour black black black black
Shoot length 3.275c ± 0.099
3.800b ± 0.224 3.375c ± 0.271 4.475a ± 0.099
thickness 0.2 0.2 0.2 0.2
branching single single 2 to 3 12 to 15
nodes 3.500*±0.500 3.250*±0.433 2.750* ± 0.434 3.250* ± 0.434
Leaf number 5.250b±0.434 5.750b±0.434 5.250b ± 0.434 7.500a ± 0.500
size (cm2) 0.450*±0.055 0.450*±0.089 0.450* ± 0.089 0.475* ±
0.047
contour open open open open
BI = BAP 1mg/L B2 = BAP 2 mg/L B3 = BAP3mg/L B4 = BAP 4mg/L
* = values are non-significant; Values having different alphabets are significantly different from each other at P>0.05
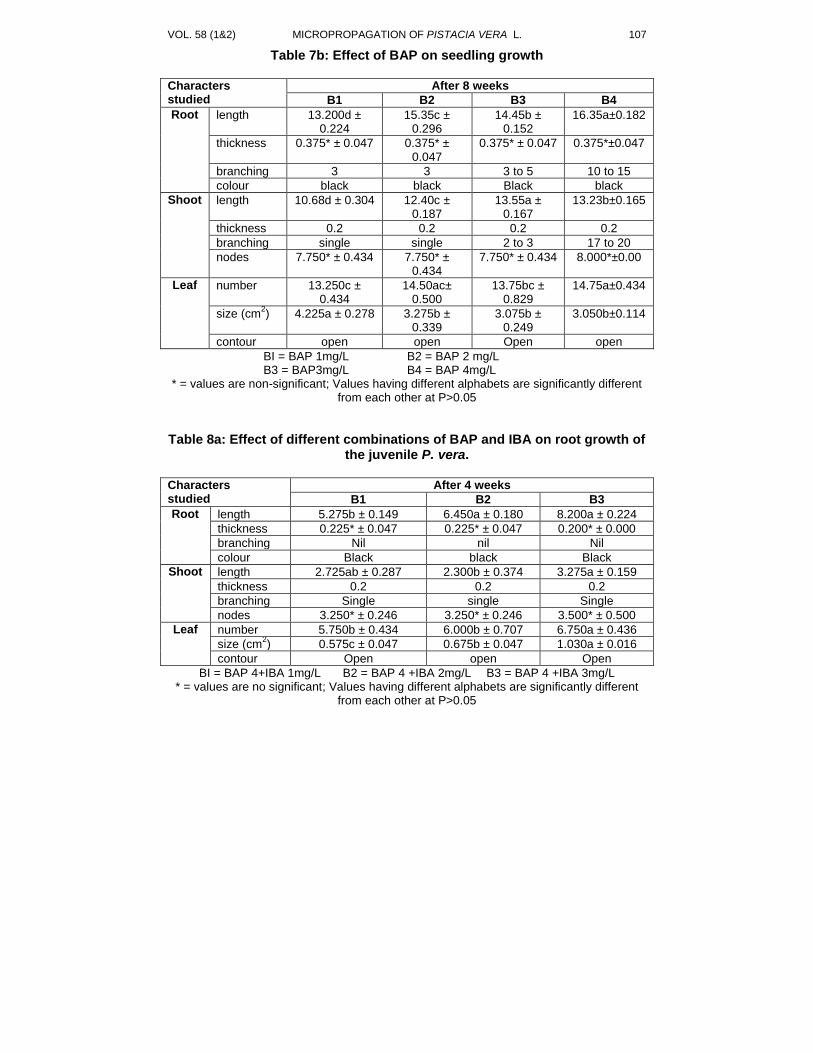
VOL. 58 (1&2) MICROPROPAGATION OF PISTACIA VERA L. 107
Table 7b: Effect of BAP on seedling growth
Characters studied
After 8 weeks
B1 B2 B3 B4
Root length 13.200d ± 0.224
15.35c ± 0.296
14.45b ± 0.152
16.35a±0.182
thickness 0.375* ± 0.047 0.375* ± 0.047
0.375* ± 0.047 0.375*±0.047
branching 3 3 3 to 5 10 to 15
colour black black Black black
Shoot length 10.68d ± 0.304 12.40c ± 0.187
13.55a ± 0.167
13.23b±0.165
thickness 0.2 0.2 0.2 0.2
branching single single 2 to 3 17 to 20
nodes 7.750* ± 0.434 7.750* ± 0.434
7.750* ± 0.434 8.000*±0.00
Leaf number 13.250c ± 0.434
14.50ac± 0.500
13.75bc ± 0.829
14.75a±0.434
size (cm2) 4.225a ± 0.278 3.275b ±
0.339 3.075b ±
0.249 3.050b±0.114
contour open open Open open
BI = BAP 1mg/L B2 = BAP 2 mg/L B3 = BAP3mg/L B4 = BAP 4mg/L
* = values are non-significant; Values having different alphabets are significantly different from each other at P>0.05
Table 8a: Effect of different combinations of BAP and IBA on root growth of the juvenile P. vera.
Characters studied
After 4 weeks
B1 B2 B3
Root length 5.275b ± 0.149 6.450a ± 0.180 8.200a ± 0.224
thickness 0.225* ± 0.047 0.225* ± 0.047 0.200* ± 0.000
branching Nil nil Nil
colour Black black Black
Shoot length 2.725ab ± 0.287 2.300b ± 0.374 3.275a ± 0.159
thickness 0.2 0.2 0.2
branching Single single Single
nodes 3.250* ± 0.246 3.250* ± 0.246 3.500* ± 0.500
Leaf number 5.750b ± 0.434 6.000b ± 0.707 6.750a ± 0.436
size (cm2) 0.575c ± 0.047 0.675b ± 0.047 1.030a ± 0.016
contour Open open Open
BI = BAP 4+IBA 1mg/L B2 = BAP 4 +IBA 2mg/L B3 = BAP 4 +IBA 3mg/L * = values are no significant; Values having different alphabets are significantly different
from each other at P>0.05
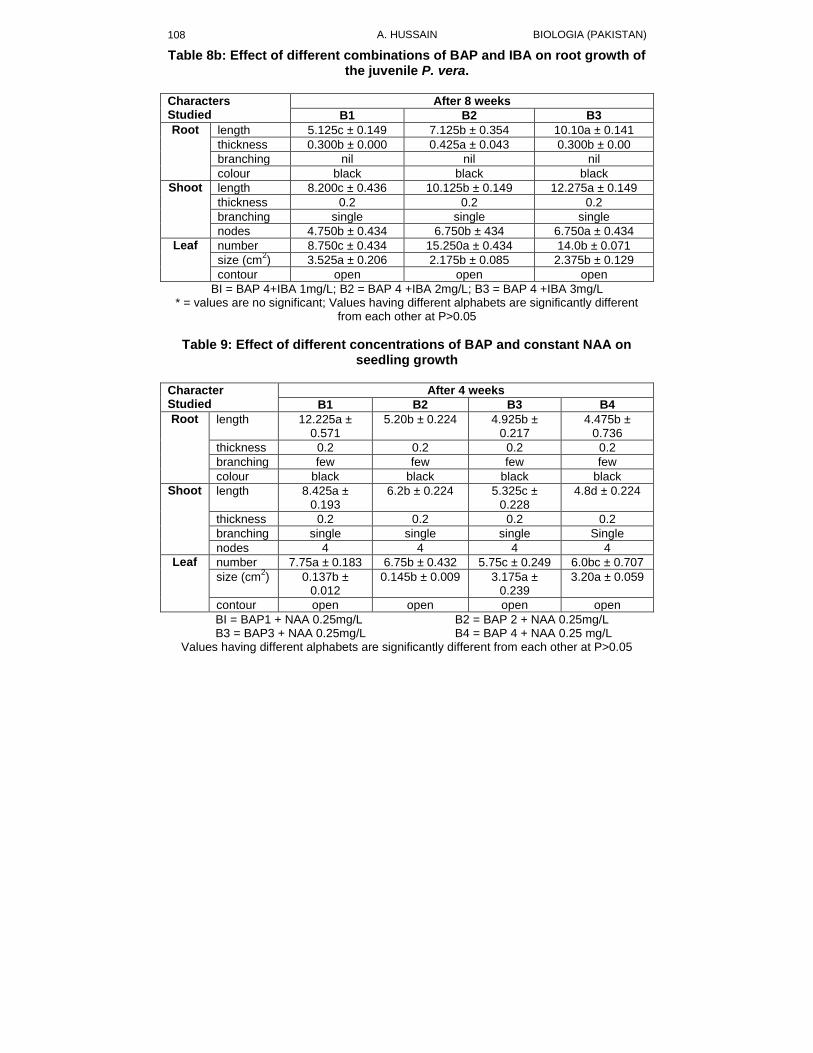
A. HUSSAIN BIOLOGIA (PAKISTAN) 108
Table 8b: Effect of different combinations of BAP and IBA on root growth of the juvenile P. vera.
Characters Studied
After 8 weeks
B1 B2 B3
Root length 5.125c ± 0.149 7.125b ± 0.354 10.10a ± 0.141
thickness 0.300b ± 0.000 0.425a ± 0.043 0.300b ± 0.00
branching nil nil nil
colour black black black
Shoot length 8.200c ± 0.436 10.125b ± 0.149 12.275a ± 0.149
thickness 0.2 0.2 0.2
branching single single single
nodes 4.750b ± 0.434 6.750b ± 434 6.750a ± 0.434
Leaf number 8.750c ± 0.434 15.250a ± 0.434 14.0b ± 0.071
size (cm2) 3.525a ± 0.206 2.175b ± 0.085 2.375b ± 0.129
contour open open open
BI = BAP 4+IBA 1mg/L; B2 = BAP 4 +IBA 2mg/L; B3 = BAP 4 +IBA 3mg/L * = values are no significant; Values having different alphabets are significantly different
from each other at P>0.05
Table 9: Effect of different concentrations of BAP and constant NAA on seedling growth
Character Studied
After 4 weeks
B1 B2 B3 B4
Root length 12.225a ± 0.571
5.20b ± 0.224 4.925b ± 0.217
4.475b ± 0.736
thickness 0.2 0.2 0.2 0.2
branching few few few few
colour black black black black
Shoot length 8.425a ± 0.193
6.2b ± 0.224 5.325c ± 0.228
4.8d ± 0.224
thickness 0.2 0.2 0.2 0.2
branching single single single Single
nodes 4 4 4 4
Leaf number 7.75a ± 0.183 6.75b ± 0.432 5.75c ± 0.249 6.0bc ± 0.707
size (cm2) 0.137b ±
0.012 0.145b ± 0.009 3.175a ±
0.239 3.20a ± 0.059
contour open open open open
BI = BAP1 + NAA 0.25mg/L B2 = BAP 2 + NAA 0.25mg/L B3 = BAP3 + NAA 0.25mg/L B4 = BAP 4 + NAA 0.25 mg/L
Values having different alphabets are significantly different from each other at P>0.05
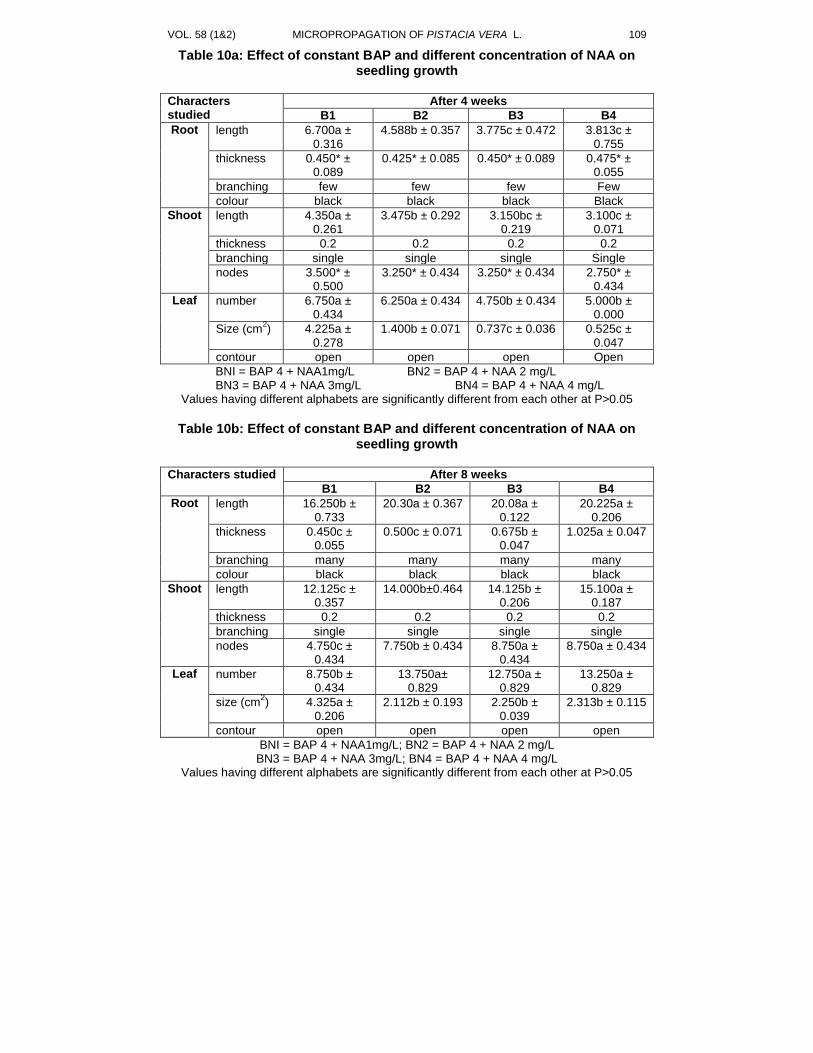
VOL. 58 (1&2) MICROPROPAGATION OF PISTACIA VERA L. 109
Table 10a: Effect of constant BAP and different concentration of NAA on seedling growth
Characters studied
After 4 weeks
B1 B2 B3 B4
Root length 6.700a ± 0.316
4.588b ± 0.357 3.775c ± 0.472 3.813c ± 0.755
thickness 0.450* ± 0.089
0.425* ± 0.085 0.450* ± 0.089 0.475* ± 0.055
branching few few few Few
colour black black black Black
Shoot length 4.350a ± 0.261
3.475b ± 0.292 3.150bc ± 0.219
3.100c ± 0.071
thickness 0.2 0.2 0.2 0.2
branching single single single Single
nodes 3.500* ± 0.500
3.250* ± 0.434 3.250* ± 0.434 2.750* ± 0.434
Leaf number 6.750a ± 0.434
6.250a ± 0.434 4.750b ± 0.434 5.000b ± 0.000
Size (cm2) 4.225a ±
0.278 1.400b ± 0.071 0.737c ± 0.036 0.525c ±
0.047
contour open open open Open
BNI = BAP 4 + NAA1mg/L BN2 = BAP 4 + NAA 2 mg/L BN3 = BAP 4 + NAA 3mg/L BN4 = BAP 4 + NAA 4 mg/L
Values having different alphabets are significantly different from each other at P>0.05
Table 10b: Effect of constant BAP and different concentration of NAA on
seedling growth
Characters studied After 8 weeks
B1 B2 B3 B4
Root length 16.250b ± 0.733
20.30a ± 0.367 20.08a ± 0.122
20.225a ± 0.206
thickness 0.450c ± 0.055
0.500c ± 0.071 0.675b ± 0.047
1.025a ± 0.047
branching many many many many
colour black black black black
Shoot length 12.125c ± 0.357
14.000b±0.464 14.125b ± 0.206
15.100a ± 0.187
thickness 0.2 0.2 0.2 0.2
branching single single single single
nodes 4.750c ± 0.434
7.750b ± 0.434 8.750a ± 0.434
8.750a ± 0.434
Leaf number 8.750b ± 0.434
13.750a± 0.829
12.750a ± 0.829
13.250a ± 0.829
size (cm2) 4.325a ±
0.206 2.112b ± 0.193 2.250b ±
0.039 2.313b ± 0.115
contour open open open open
BNI = BAP 4 + NAA1mg/L; BN2 = BAP 4 + NAA 2 mg/L BN3 = BAP 4 + NAA 3mg/L; BN4 = BAP 4 + NAA 4 mg/L
Values having different alphabets are significantly different from each other at P>0.05
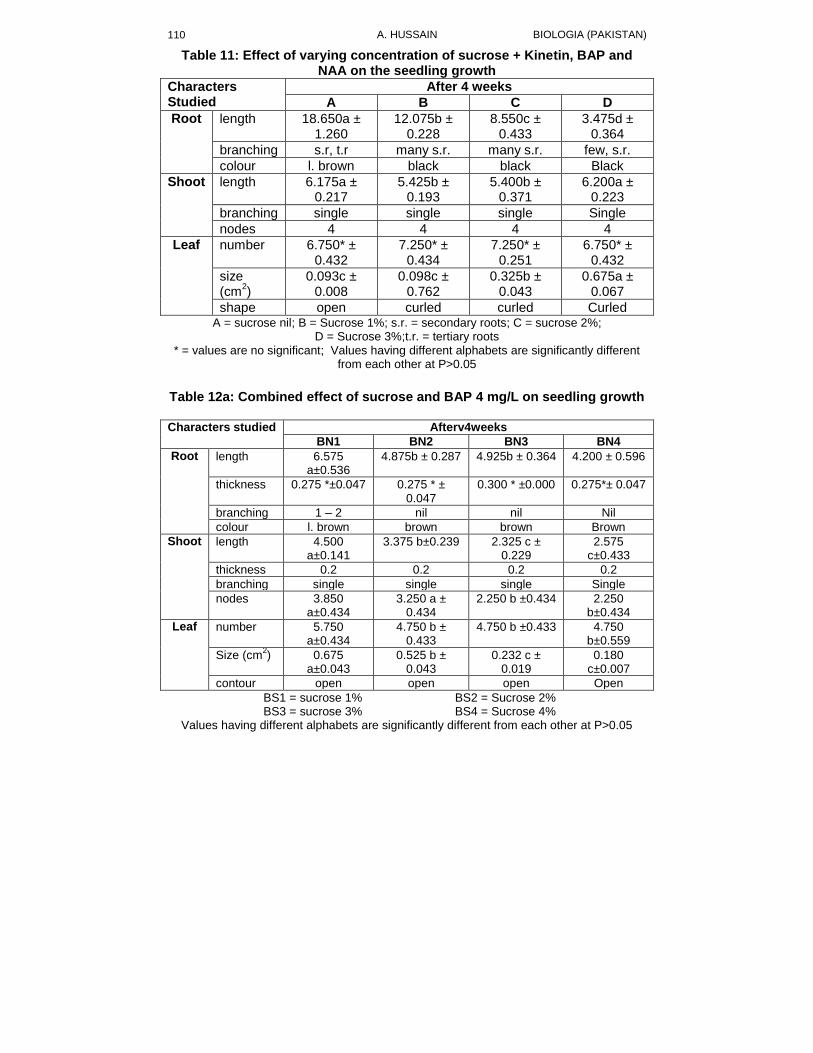
A. HUSSAIN BIOLOGIA (PAKISTAN) 110
Table 11: Effect of varying concentration of sucrose + Kinetin, BAP and NAA on the seedling growth
Characters Studied
After 4 weeks
A B C D
Root length 18.650a ± 1.260
12.075b ± 0.228
8.550c ± 0.433
3.475d ± 0.364
branching s.r, t.r many s.r. many s.r. few, s.r.
colour l. brown black black Black
Shoot
length 6.175a ± 0.217
5.425b ± 0.193
5.400b ± 0.371
6.200a ± 0.223
branching single single single Single
nodes 4 4 4 4
Leaf number 6.750* ± 0.432
7.250* ± 0.434
7.250* ± 0.251
6.750* ± 0.432
size (cm
2)
0.093c ± 0.008
0.098c ± 0.762
0.325b ± 0.043
0.675a ± 0.067
shape open curled curled Curled A = sucrose nil; B = Sucrose 1%; s.r. = secondary roots; C = sucrose 2%;
D = Sucrose 3%;t.r. = tertiary roots * = values are no significant; Values having different alphabets are significantly different
from each other at P>0.05
Table 12a: Combined effect of sucrose and BAP 4 mg/L on seedling growth
Characters studied Afterv4weeks
BN1 BN2 BN3 BN4
Root length 6.575 a±0.536
4.875b ± 0.287 4.925b ± 0.364 4.200 ± 0.596
thickness 0.275 *±0.047 0.275 * ± 0.047
0.300 * ±0.000 0.275*± 0.047
branching 1 – 2 nil nil Nil
colour l. brown brown brown Brown
Shoot length 4.500 a±0.141
3.375 b±0.239 2.325 c ± 0.229
2.575 c±0.433
thickness 0.2 0.2 0.2 0.2
branching single single single Single
nodes 3.850 a±0.434
3.250 a ± 0.434
2.250 b ±0.434 2.250 b±0.434
Leaf number 5.750 a±0.434
4.750 b ± 0.433
4.750 b ±0.433 4.750 b±0.559
Size (cm2) 0.675
a±0.043 0.525 b ±
0.043 0.232 c ±
0.019 0.180
c±0.007
contour open open open Open
BS1 = sucrose 1% BS2 = Sucrose 2% BS3 = sucrose 3% BS4 = Sucrose 4%
Values having different alphabets are significantly different from each other at P>0.05
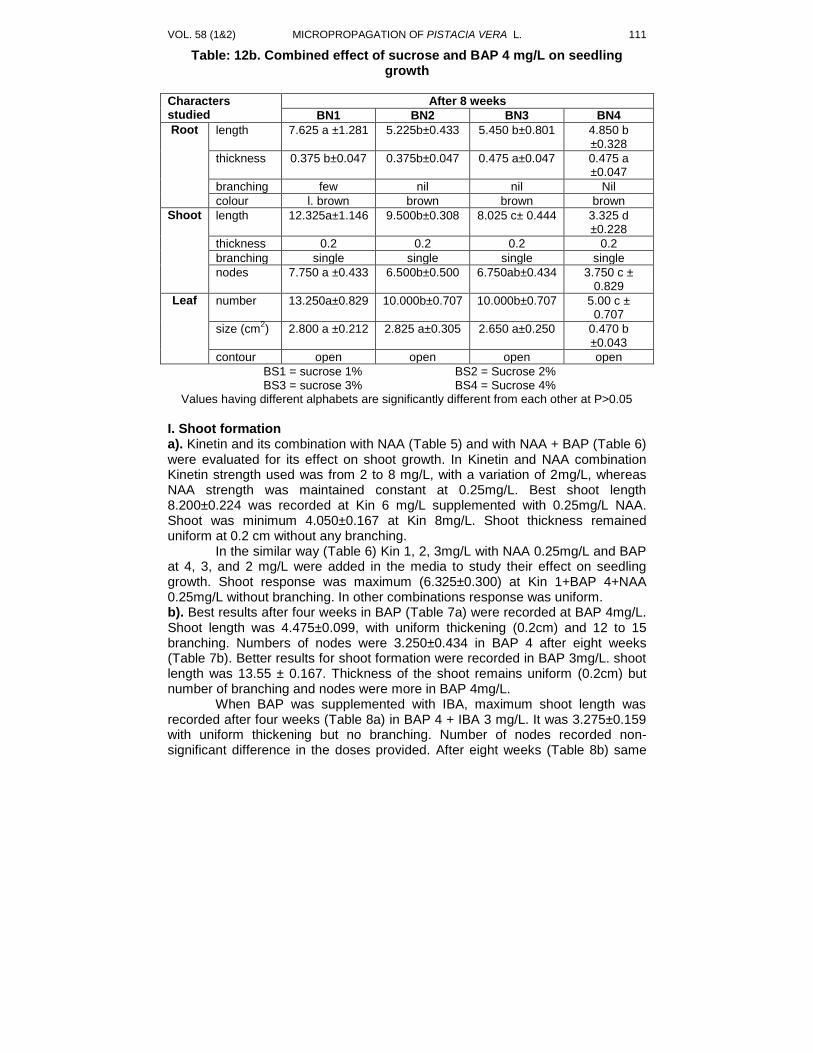
VOL. 58 (1&2) MICROPROPAGATION OF PISTACIA VERA L. 111
Table: 12b. Combined effect of sucrose and BAP 4 mg/L on seedling growth
Characters studied
After 8 weeks
BN1 BN2 BN3 BN4
Root length 7.625 a ±1.281 5.225b±0.433 5.450 b±0.801 4.850 b ±0.328
thickness 0.375 b±0.047 0.375b±0.047 0.475 a±0.047 0.475 a ±0.047
branching few nil nil Nil
colour l. brown brown brown brown
Shoot length 12.325a±1.146 9.500b±0.308 8.025 c± 0.444 3.325 d ±0.228
thickness 0.2 0.2 0.2 0.2
branching single single single single
nodes 7.750 a ±0.433 6.500b±0.500 6.750ab±0.434 3.750 c ± 0.829
Leaf number 13.250a±0.829 10.000b±0.707 10.000b±0.707 5.00 c ± 0.707
size (cm2) 2.800 a ±0.212 2.825 a±0.305 2.650 a±0.250 0.470 b
±0.043
contour open open open open
BS1 = sucrose 1% BS2 = Sucrose 2% BS3 = sucrose 3% BS4 = Sucrose 4%
Values having different alphabets are significantly different from each other at P>0.05
I. Shoot formation a). Kinetin and its combination with NAA (Table 5) and with NAA + BAP (Table 6) were evaluated for its effect on shoot growth. In Kinetin and NAA combination Kinetin strength used was from 2 to 8 mg/L, with a variation of 2mg/L, whereas NAA strength was maintained constant at 0.25mg/L. Best shoot length 8.200±0.224 was recorded at Kin 6 mg/L supplemented with 0.25mg/L NAA. Shoot was minimum 4.050±0.167 at Kin 8mg/L. Shoot thickness remained uniform at 0.2 cm without any branching. In the similar way (Table 6) Kin 1, 2, 3mg/L with NAA 0.25mg/L and BAP at 4, 3, and 2 mg/L were added in the media to study their effect on seedling growth. Shoot response was maximum (6.325±0.300) at Kin 1+BAP 4+NAA 0.25mg/L without branching. In other combinations response was uniform. b). Best results after four weeks in BAP (Table 7a) were recorded at BAP 4mg/L. Shoot length was 4.475±0.099, with uniform thickening (0.2cm) and 12 to 15 branching. Numbers of nodes were 3.250±0.434 in BAP 4 after eight weeks (Table 7b). Better results for shoot formation were recorded in BAP 3mg/L. shoot length was 13.55 ± 0.167. Thickness of the shoot remains uniform (0.2cm) but number of branching and nodes were more in BAP 4mg/L. When BAP was supplemented with IBA, maximum shoot length was recorded after four weeks (Table 8a) in BAP 4 + IBA 3 mg/L. It was 3.275±0.159 with uniform thickening but no branching. Number of nodes recorded non-significant difference in the doses provided. After eight weeks (Table 8b) same
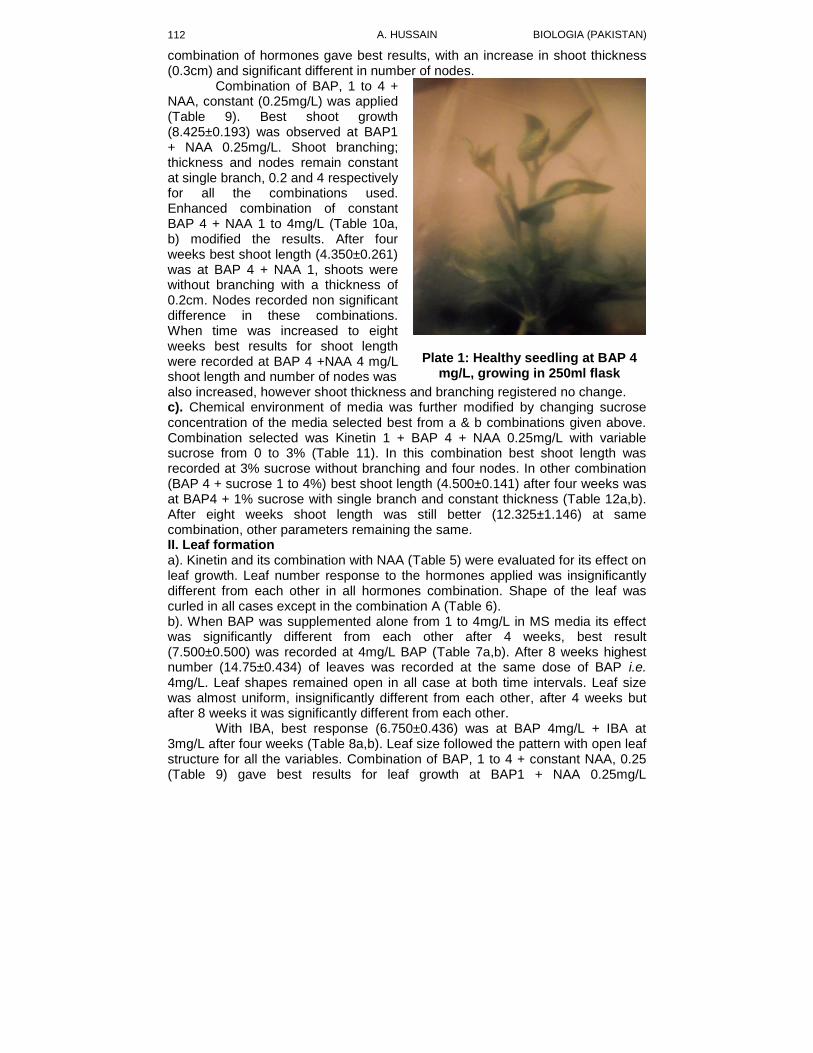
A. HUSSAIN BIOLOGIA (PAKISTAN) 112
combination of hormones gave best results, with an increase in shoot thickness (0.3cm) and significant different in number of nodes. Combination of BAP, 1 to 4 + NAA, constant (0.25mg/L) was applied (Table 9). Best shoot growth (8.425±0.193) was observed at BAP1 + NAA 0.25mg/L. Shoot branching; thickness and nodes remain constant at single branch, 0.2 and 4 respectively for all the combinations used. Enhanced combination of constant BAP 4 + NAA 1 to 4mg/L (Table 10a, b) modified the results. After four weeks best shoot length (4.350±0.261) was at BAP 4 + NAA 1, shoots were without branching with a thickness of 0.2cm. Nodes recorded non significant difference in these combinations. When time was increased to eight weeks best results for shoot length were recorded at BAP 4 +NAA 4 mg/L shoot length and number of nodes was
Plate 1: Healthy seedling at BAP 4 mg/L, growing in 250ml flask
also increased, however shoot thickness and branching registered no change. c). Chemical environment of media was further modified by changing sucrose concentration of the media selected best from a & b combinations given above. Combination selected was Kinetin 1 + BAP 4 + NAA 0.25mg/L with variable sucrose from 0 to 3% (Table 11). In this combination best shoot length was recorded at 3% sucrose without branching and four nodes. In other combination (BAP 4 + sucrose 1 to 4%) best shoot length (4.500±0.141) after four weeks was at BAP4 + 1% sucrose with single branch and constant thickness (Table 12a,b). After eight weeks shoot length was still better (12.325±1.146) at same combination, other parameters remaining the same. II. Leaf formation a). Kinetin and its combination with NAA (Table 5) were evaluated for its effect on leaf growth. Leaf number response to the hormones applied was insignificantly different from each other in all hormones combination. Shape of the leaf was curled in all cases except in the combination A (Table 6). b). When BAP was supplemented alone from 1 to 4mg/L in MS media its effect was significantly different from each other after 4 weeks, best result (7.500±0.500) was recorded at 4mg/L BAP (Table 7a,b). After 8 weeks highest number (14.75±0.434) of leaves was recorded at the same dose of BAP i.e. 4mg/L. Leaf shapes remained open in all case at both time intervals. Leaf size was almost uniform, insignificantly different from each other, after 4 weeks but after 8 weeks it was significantly different from each other.
With IBA, best response (6.750±0.436) was at BAP 4mg/L + IBA at 3mg/L after four weeks (Table 8a,b). Leaf size followed the pattern with open leaf structure for all the variables. Combination of BAP, 1 to 4 + constant NAA, 0.25 (Table 9) gave best results for leaf growth at BAP1 + NAA 0.25mg/L
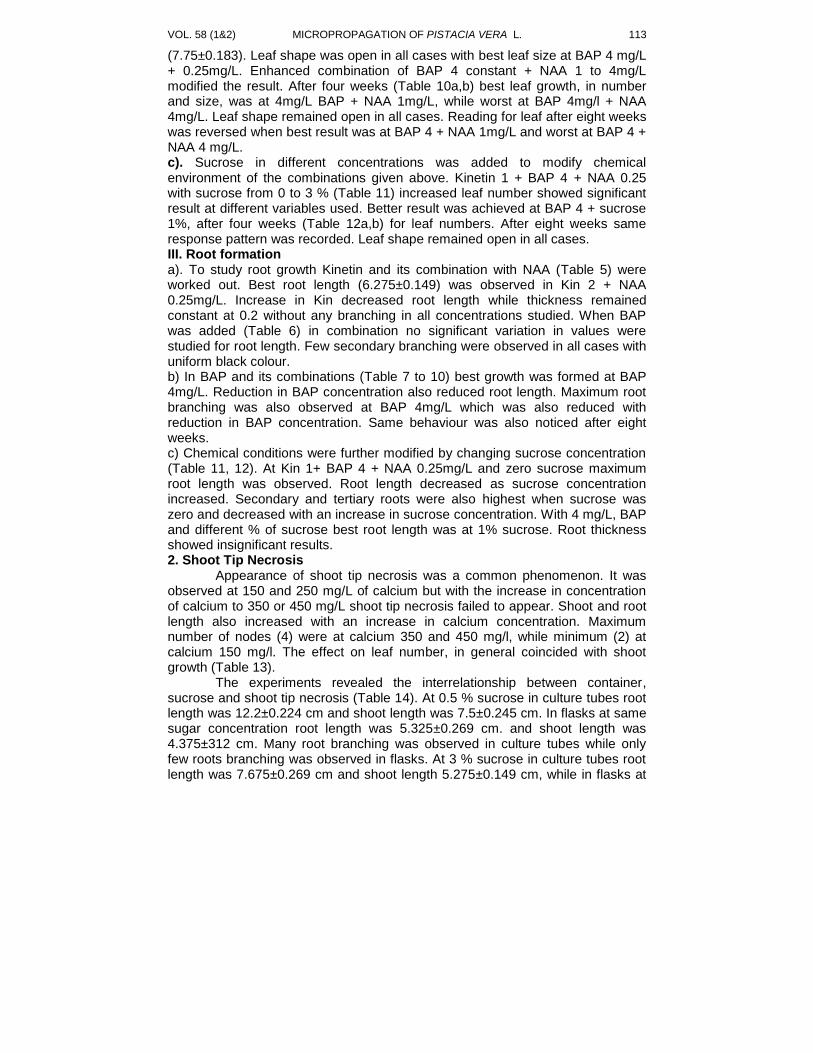
VOL. 58 (1&2) MICROPROPAGATION OF PISTACIA VERA L. 113
(7.75±0.183). Leaf shape was open in all cases with best leaf size at BAP 4 mg/L + 0.25mg/L. Enhanced combination of BAP 4 constant + NAA 1 to 4mg/L modified the result. After four weeks (Table 10a,b) best leaf growth, in number and size, was at 4mg/L BAP + NAA 1mg/L, while worst at BAP 4mg/l + NAA 4mg/L. Leaf shape remained open in all cases. Reading for leaf after eight weeks was reversed when best result was at BAP 4 + NAA 1mg/L and worst at BAP 4 + NAA 4 mg/L. c). Sucrose in different concentrations was added to modify chemical environment of the combinations given above. Kinetin 1 + BAP 4 + NAA 0.25 with sucrose from 0 to 3 % (Table 11) increased leaf number showed significant result at different variables used. Better result was achieved at BAP 4 + sucrose 1%, after four weeks (Table 12a,b) for leaf numbers. After eight weeks same response pattern was recorded. Leaf shape remained open in all cases. III. Root formation a). To study root growth Kinetin and its combination with NAA (Table 5) were worked out. Best root length (6.275±0.149) was observed in Kin 2 + NAA 0.25mg/L. Increase in Kin decreased root length while thickness remained constant at 0.2 without any branching in all concentrations studied. When BAP was added (Table 6) in combination no significant variation in values were studied for root length. Few secondary branching were observed in all cases with uniform black colour. b) In BAP and its combinations (Table 7 to 10) best growth was formed at BAP 4mg/L. Reduction in BAP concentration also reduced root length. Maximum root branching was also observed at BAP 4mg/L which was also reduced with reduction in BAP concentration. Same behaviour was also noticed after eight weeks. c) Chemical conditions were further modified by changing sucrose concentration (Table 11, 12). At Kin 1+ BAP 4 + NAA 0.25mg/L and zero sucrose maximum root length was observed. Root length decreased as sucrose concentration increased. Secondary and tertiary roots were also highest when sucrose was zero and decreased with an increase in sucrose concentration. With 4 mg/L, BAP and different % of sucrose best root length was at 1% sucrose. Root thickness showed insignificant results. 2. Shoot Tip Necrosis Appearance of shoot tip necrosis was a common phenomenon. It was observed at 150 and 250 mg/L of calcium but with the increase in concentration of calcium to 350 or 450 mg/L shoot tip necrosis failed to appear. Shoot and root length also increased with an increase in calcium concentration. Maximum number of nodes (4) were at calcium 350 and 450 mg/l, while minimum (2) at calcium 150 mg/l. The effect on leaf number, in general coincided with shoot growth (Table 13). The experiments revealed the interrelationship between container, sucrose and shoot tip necrosis (Table 14). At 0.5 % sucrose in culture tubes root length was 12.2±0.224 cm and shoot length was 7.5±0.245 cm. In flasks at same sugar concentration root length was 5.325±0.269 cm. and shoot length was 4.375±312 cm. Many root branching was observed in culture tubes while only few roots branching was observed in flasks. At 3 % sucrose in culture tubes root length was 7.675±0.269 cm and shoot length 5.275±0.149 cm, while in flasks at
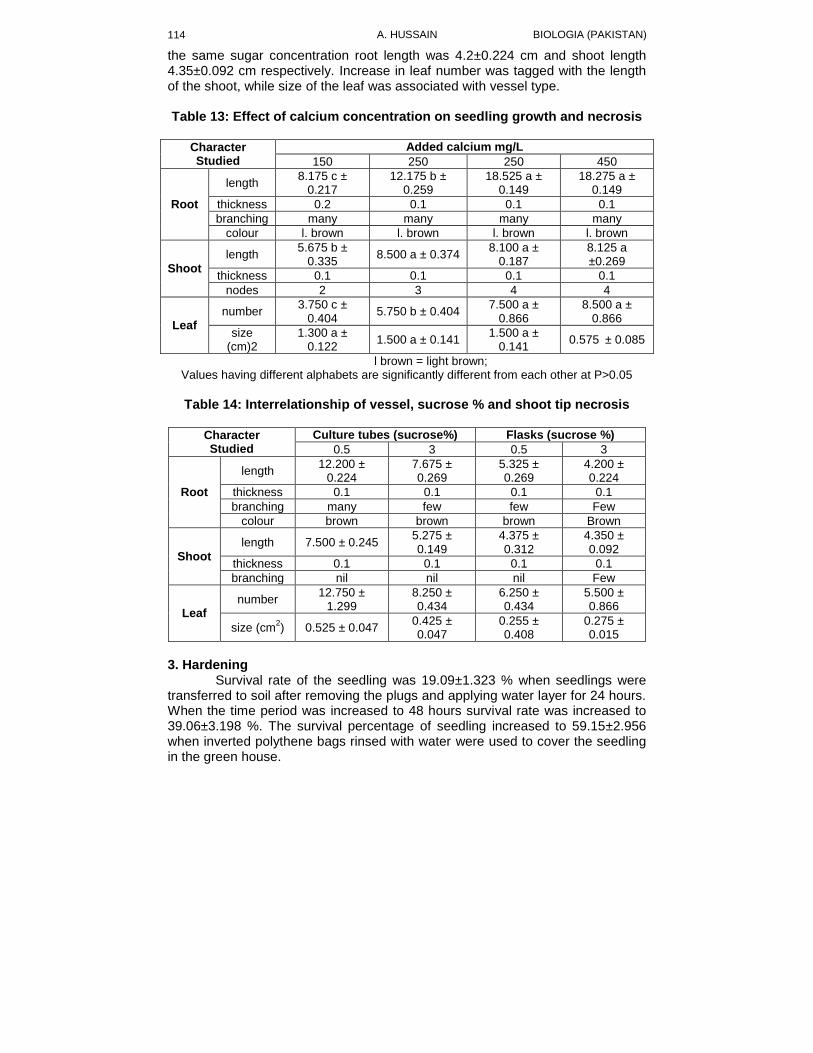
A. HUSSAIN BIOLOGIA (PAKISTAN) 114
the same sugar concentration root length was 4.2±0.224 cm and shoot length 4.35±0.092 cm respectively. Increase in leaf number was tagged with the length of the shoot, while size of the leaf was associated with vessel type. Table 13: Effect of calcium concentration on seedling growth and necrosis
Character Studied
Added calcium mg/L
150 250 250 450
Root
length 8.175 c ±
0.217 12.175 b ±
0.259 18.525 a ±
0.149 18.275 a ±
0.149
thickness 0.2 0.1 0.1 0.1
branching many many many many
colour l. brown l. brown l. brown l. brown
Shoot
length 5.675 b ±
0.335 8.500 a ± 0.374
8.100 a ± 0.187
8.125 a ±0.269
thickness 0.1 0.1 0.1 0.1
nodes 2 3 4 4
Leaf number
3.750 c ± 0.404
5.750 b ± 0.404 7.500 a ±
0.866 8.500 a ±
0.866
size (cm)2
1.300 a ± 0.122
1.500 a ± 0.141 1.500 a ±
0.141 0.575 ± 0.085
l brown = light brown; Values having different alphabets are significantly different from each other at P>0.05
Table 14: Interrelationship of vessel, sucrose % and shoot tip necrosis
Character Studied
Culture tubes (sucrose%) Flasks (sucrose %)
0.5 3 0.5 3
Root
length 12.200 ±
0.224 7.675 ± 0.269
5.325 ± 0.269
4.200 ± 0.224
thickness 0.1 0.1 0.1 0.1
branching many few few Few
colour brown brown brown Brown
Shoot
length 7.500 ± 0.245 5.275 ± 0.149
4.375 ± 0.312
4.350 ± 0.092
thickness 0.1 0.1 0.1 0.1
branching nil nil nil Few
Leaf number
12.750 ± 1.299
8.250 ± 0.434
6.250 ± 0.434
5.500 ± 0.866
size (cm2) 0.525 ± 0.047
0.425 ± 0.047
0.255 ± 0.408
0.275 ± 0.015
3. Hardening Survival rate of the seedling was 19.09±1.323 % when seedlings were transferred to soil after removing the plugs and applying water layer for 24 hours. When the time period was increased to 48 hours survival rate was increased to 39.06±3.198 %. The survival percentage of seedling increased to 59.15±2.956 when inverted polythene bags rinsed with water were used to cover the seedling in the green house.
VOL. 58 (1&2) MICROPROPAGATION OF PISTACIA VERA L. 115
DISCUSSION
Preservation of genetic characters is maintained through vegetative propagation. Buds are activated in vitro to produce shoots which are subjected to rooting to develop plantlets. A. Physical conditions, Light In vivo studies indicates that light signals can regulate changes in structure and form, such as seed germination, leaf expansion, stem elongation, flower initiation and pigment synthesis (Aphalo, 2006). In vitro increase in light intensity from 2000 lux to 4000 lux reduced the shoot length when light used was of single nature or a combination of different natures of lights (Table 1). It seems that high intensity of light is more important than the low intensity of light. Farmer (1975) also proved that it is not the duration of light but the amount of light received which is more important. In this study it was observed that both quality and quantity of light have their specific role to play. Leaf number increased (10) with an increase in the intensity of fluorescent light at 4000 lux. The combination of fluorescent and incandescent light at the same intensity (4000 lux) developed still more leaves (15) with activation of all buds. Fluorescent light is predominantly of low wave length, orange and blue regime, while incandescent light is predominantly of high wave length, predominantly red regime. Takagi & Qo (1997) used far red light to induce bulb formation in in vitro grown Allium sativum L. It has been shown that light intensity is important in the growth of shoots of woody plants in vitro (Pierik 1987). Herrigton & McPherson (1993) reported that red/far red light increases the number of branches in explain of Spirea nipponica. Muleo & Thomas (1997) showed the effect of light quality on the bud activation. Vessel type Flasks were better choice for the branching of the shoot. This was also observed by Dolcet-Sanjuan & Elisabet (1995). While working with Pistacia vera they observed that shoot multiplication was not achieved by increasing BAP concentration to 20 µM as suggested by Barghchi & Alderson (1989). The difference in the results was attributed to the selection of the vessel type. They used flasks whereas Dolcet-Sanjuan & Elisabet (1995) used culture tubes for their respective cultures. Shoots of Pistacia vera do not undergo shoot multiplication in culture tubes where as they profusely branch in flasks. In a similar study while working with adult micropropagation of Castanea sativa and Castanea sativa × Castanea crenata used test tube for shoot growth (not multiplication) while jar for the root formation. Similarly Young & Schmidt (1992) also proved that vessel types do affect the adventitious shoot in Prunus avium. Desiccation conditions Effect of desiccation studies showed a reduction in growth parameters (root length, shoot length and leaf number) as compared to control, moreover erratic behaviour of stomata was observed. The desiccating conditions created by lanolin showed a reduction in the stomata aperture. However, an increase was observed in the stomata aperture under silica gel condition and a further increase under Lanolin + silica gel conditions (Table 3).
A. HUSSAIN BIOLOGIA (PAKISTAN) 116
Barghchi & Alderson (1996) used lanolin layer and observed reduction in the stomatal aperture as was found in this study. When the magnitude of desiccating conditions was increased an increase in the stomata aperture was observed. The results given in this study do not fully agree with them. They used only lanolin layer to create desiccating conditions and reported a reduction in the stomata aperture. In lanolin layer stomata aperture was decreased. However in other two conditions when the magnitude of desiccation was increased stomata aperture showed an increase. The behaviour of stomata under different desiccating conditions could be attributed to the stomata response under different magnitude of same factor as described by Satoo (1955). He proved that stomata start opening under slow moving air but if the speed of the air is increased stomata gradually start closing. B. Effect of Chemical Conditions 1. Effect of Hormones Shoot Shoot formation studies revealed striking results at BAP 4 mg/L when a maximum of 17 to 20 branchings were observed in a single culture (Table 7b). In P. vera maximum work has been done on juvenile shoot growth and its proliferation. MS (1962) salt medium (Barghchi & Alderson 1996; Parfitt & Almehdi 1994; Onay et al., 1996). Gonzalez & Frutos (1990) believed that WPM is better for the growth of seedling as well as adult explant culture of P. vera. They rejected M.S. (1962) salts medium on appearance of browning in P. vera cultures, whereas Yaung & Ludders (1993) believed that there is no significant difference in the media used for the different parameters. This study supported the idea of Franclet (1991) that the suitability of different basal media depends on genotype, age and type of explant used for cultural studies. Manipulation of plant growth regulators indicated BAP 4 mg/l as best for the shoot multiplication (Barghchi & Alderson 1985; Gonzalez & Frutos 1990), BAP 2.2 mg/L in addition to Thidiazuron by Prfitt & Almehdi (1994). Use of Thidiazuron was found not effective with P. vera, whereas it was used effectively by other workers for the improvement of mass propagation of other plants. Lakshmanan et al, (1997) used it for Ixora coccinea L. Konan et al, (1997) for Manihot esculenta Crantz, and Young & Read 1997 for Acanthopanax sieboldianus. Common factor among all these studies was the use of BAP as indicated in this study. The only variation we find is in the studies of Onay et al., (1991). They used Kinetin 4 mg/l and achieved 25 to 30 units of bud from epicotyl region. Whereas Barghchi & Alderson (1985) concluded that no shoot multiplication was observed on the media containing Kinetin. Present study also supported Barghchi & Aldersons (1983) results as no shoot multiplication was observed on the media containing Kinetin. The difference in the explants response could be because of the difference in exposure of explants to light intensity and duration. In the experiments performed by Barghchi & Alderson (1985) light intensity was adjusted to 1000 lux of cool fluorescent light for 16 hours light period whereas Onay et al., (1991) used an intensity of 3500 lux for 24 hours light period for two months. This could have induced activation of some plant hormones, which leed
VOL. 58 (1&2) MICROPROPAGATION OF PISTACIA VERA L. 117
to the shoot multiplication in his study. Moreover the study was prolonged to two months as compared to the study of four weeks conducted by Barghchi & Alderson (1985). In the present study we also observed that an intensity of 4000 lux of fluorescent and incandescent light activated all buds. Thus the multiplication observed at Kin 4 mg/l could be the result of high intensity of light (3500 lux) for 24 hour light period for two months and not exclusively by Kinetin. Leaf
Leaf numbers were maximum (8.75±0.404) at Kinetin 8 mg/l and NAA 0.25 mg/L and minimum (4.75±0.434) at BAP 4 and NAA 3 mg/L, whereas its maximum size (4.225±0.278 cm
2) was recorded at BAP4 mg/L and NAA 1 mg/L.
It was minimum (0.40±0.007) at Kinetin 2mg/l and NAA 0.25 mg/l. Shape of the leaf remained open throughout the study except when Kinetin was used. In all the Kinetin doses leaf shape was curled. Root Of all the plant growth regulator studied in vitro maximum root length (12.225±0.571 cm) was recorded at BAP 1 mg/l and NAA 0.25 mg/l. Root length was minimum (3.775±0.472 cm) at BAP 4 mg/l. Root thickening was almost uniform (0.2 cm) in all the combinations studied. An increase in thickness (0.475 cm) was recorded when NAA 4mg/l was used. Root branching was few in all the combinations with uniform black colour in the presence of sucrose. In the absence of sucrose the root were light brown in colour and were profusely branched. Light brown colour indicates the tendency of roots to branch. Barghchi (1986a) also found that elimination of sucrose enhances rooting in P. vera. Mostly auxin effect is demonstrated on the stem and it has been found similar to that in roots (Devlin & Jackson 1961). In this study it was found that supplementation of NAA greatly influenced the root system. With an increase of NAA from 1 to 4 mg/l an increase in the root branching and thickness was observed. 2. Effect of Sugar Effect of sugar concentration was studied along with the plant growth regulators. Parameters studied (root length, root branching, shoot length, number of nodes) showed a gradual decrease in all studies except size of leaf, which increased with an increase in sugar concentration. Colour of the root was light brown in the zero sucrose, but black in its presence. Lack of sugar resulted in the development of lot of secondary and even tertiary roots (Perfitt & Almedhi, 1994). Leaf number increased slightly (from 6.75±0.432 to 7.25±0.251) while its size increased substantially i.e. 0.093±0.008 cm2 to 6.675±0.067 cm2 when sugar was raised from zero to 3%. A plant with large healthy leaves has more survival chances as compared to a plant with small and few leaves. 3. Shoot Tip Necrosis Shoot tip necrosis, in Pistacia vera was controlled by the application of additional calcium and boron (Barghchi & Alderson, 1989). They also observed that with the addition of boron a decrease in shoot multiplication was observed while addition of calcium controlled the necrosis without effecting the shoot multiplication. In this study similar results were obtained when the concentration of calcium was increased to 350 mg/L. The shoot tip necrosis was also checked when culture tubes were used instead of flasks at a medium containing 0.5 % sucrose. This reduction in
A. HUSSAIN BIOLOGIA (PAKISTAN) 118
sucrose percentage increased root system thus more nutrients are absorbed. In an attempt to control shoot tip necrosis Barghchi & Alderson (1996) used lanolin layer on medium to reduce humidity, assuming that a reduction in humidity could enhance the nutritional uptake through increased transpiration stream (Kramer 1956) thus could prevent shoot tip necrosis. The desired results were not achieved because of reduced stomatal aperture and increased wax on the leaf surface. The results given in this study do not fully agree with the conclusion drawn by Barghchi & Alderson (1996). The desiccating conditions created by lanolin show a reduction in the stomata aperture (0.160±2 against 0.163±2 under control) as pointed out by them. This study indicated an increase in the stomata aperture, 0.275±2 under silica gel and 0.495±2 under Lanolin + silica gel conditions, when the magnitude of the effect was enhanced. In spite of an increase in the stomata aperture there was no increase in the total transpiration rate. An increase in the transpiration rate was not achieved because of the decrease in the number of open stomata (26.8 against 57 in control) and increase in the number of closed stomatal (73.2 against 43 in controls). The change in aeration was also studied by Yang & Schmidt (1992). They reported that cultures of Prunus avium in petri dishes partially covered with paraffin turned soft and brown and did not regenerate shoots, but when they were cultured in 500 ml glass jars with loosely fitting lids shoots did appear. However attempts to increase aeration of the culture jars did not have any significant effect on shoot tip necrosis in P. vera, (Barchghi & Alderson, 1996). Application of calcium was found to be the most effective way of controlling the shoot tip necrosis however care should be taken while selecting calcium salt. Barghchi & Alderson (1996) supported the use of calcium chloride as it does not have any inhibitory effect on shoot elongation and multiplication, although increase in calcium must have increased the chloride level in the media. Sepaskhah & Maftoun (1982) have shown the flexibility of Pistachio for chloride concentration, but for the use of calcium chloride one has to be very careful because of chloride concentration. In this study calcium nitrite tetrahydrate Ca(NO3)2 4H2O was used as calcium source and was found very effective. Study revealed that the seedlings with well developed root system do not develop necrosis. This was also supported by Barghchi & Alderson (1983). Necrosis was suppressed or checked by reduction in the sucrose concentration, increasing the calcium concentration coupled with the use of culture tube of 50 ml (2.5 × 15 cm). Large secondary roots increased the area for calcium uptake thus necrosis was delayed and mostly suppressed. Appearance of shoot tip necrosis could be attributed to the metabolic disorder initiated by the abnormal distribution of the plant growth regulators. It was observed that medium containing BAP had more shoot tip necrosis in the presence of 0.25 mg/l NAA as compared when NAA was absent. No shoot tip necrosis was observed in the culture containing Kinetin with or without NAA (Barghchi & Alderson 1985). In this study shoot tip necrosis was observed in culture tubes but only once, whereas in flask shoot tip necrosis repeatedly appeared. Close observation of the plant revealed that root system developed very effectively in culture tubes
VOL. 58 (1&2) MICROPROPAGATION OF PISTACIA VERA L. 119
as compared to flasks. Moreover single shoot is found in the culture tube as compared to many in the flasks. Increase in calcium promotes root system. It is the increase in root system which checks the shoot tip necrosis by increasing the uptake of calcium. Besides calcium uptake root system might be producing certain plant hormones which controlled the shoot tip necrosis. This is also supported by the formation of the witch broom. If it is due to the calcium deficiency, the speedy growth of lateral buds is not possible, moreover it always strikes when shoots attains minimum length of 10 mm after 4-6 weeks, subsequently small shoots also develop shoot tip necrosis (Barghchi, 1986a). Shoot tip necrosis does not develop even in flasks when proper root system has developed. 4. Hardening Tissue culture conditions often results in the formation of abnormal leaf morphology, altered mesophyll structure, poor photosynthetic activity, malfunctioning stomata and a marked decrease in the cuticular waxes (Ziv 1986). Thus the plant has to undergo the process of hardening prior to its in vivo transplantation (Murashige 1974). In carnation plants stomatal functioning was improved after 4-5 days exposure to low humidity. Dami & Hughes (1997) used polyethylene glycol, which resulted in the deposition of epicuticular wax thus increased the chances of in vivo survival rate. In this study rate of successful transplantation % increased to 73.75±2.956 when subjected to wet polythene bag treatment. Humidity was gradually reduced in the polythene bags by increasing number of holes every alternate day. Similar results were observed by Kim & Chung (1992). They observed that by decreasing humidity step wise, 100% Alnus hirsuta plants can survive the transfer to soil. Conclusion
Both physical and chemical environment has their share in proper growth of juvenile tissue of Pistachio vera. Necrosis a common problem in woody plants which also appears in Pistachio vera can be controlled effectively to harvest the benefits of in vitro propagation of Pistachio vera.
REFERENCES
Aphalo, P.J., 2006. Light signals and the growth and development of plants — a
gentle introduction. The Plant Photobiology Notes 1, Department of Biological and Environmental Sciences Plant Biology University of Helsinki, Finland
Barghchi, M. & Alderson P. G., 1983. In vitro propagation of Pistacia vera L. from seedling tissues. J. Hort. Sci. 58(3) 435-445.
Barghchi, M. & Alderson P.G., 1985. In vitro propagation of Pistacia vera L. of the commercial cultivars, Ohadi and Kalleghochi. J. Hort. Sci. 60: 423-430.
Barghchi, M. & Alderson P.G., 1989. Pistachio (Pistacia vera L.) IN: Biotechnology in Agriculture and Forestry, Trees II. Vol. 5, Y. P. S. Bajaj (Ed.) Springer-Verlag, Berlin. 69-97
Barghchi, M. & Alderson P.G., 1996. The control of shoot tip necrosis in Pistacia vera L. in vitro. Plant Growth Regulation 20, 31-35.
A. HUSSAIN BIOLOGIA (PAKISTAN) 120
Barghchi, M., 1986a. In vitro culture of mature commercial varieties of Pistacia vera L. Proc. Int. Plant propagators Soc. 35, 334-337.
Dami, I. & Hughes, H.G., 1997. Effects of PEG-induced water stress on in vitro hardening of ―Valiant‖ grape. Plant Cell, Tissue and Organ Culture, 47, 97-101.
Devlin, R.M. & Jackson, W.T., 1961. Effect of p-chlorophenoxylisobutryric acid on rate of elongation of root hairs of Agrostis alba L. Physiol Plant, 14-40.
Dolcet-Sanjuan & Elisabet, C., 1995. Improved shoot tip micropropagation of Pistacia vera L. and the beneficial effect of Methyl Jasmonate. J. Amer. Soc. Hort. Sci. 120(6), 938-942.
Farmer, R. E. Jnr. (1975). Growth and assimilation rate of jirvanib northern red oak: effects of photosynthesis. Ann Rev. Plant Physiol. 9,1.
Franclet, A., 1991. Biotechnology in rejuvenation: Hope for the micropropagation of difficult woody plants. Acta Horticulturae 289, 273-282.
Gonzalez, A. & Frutos, D., 1990. In vitro culture of Pistacia vera L. Embryos and Aged tree explants. NATO ASI Series-A, Life Sciences 186, 335-338.
Herrington, H. & McPherson, J. C., 1993. Light quality and growth promotion of Spiraea nipponica IN: The influence of low photon fluency rate and transfer time to a higher fluency rate. Plant Cell, Tissue and Organ Culture, 32, 161-7.
Kim K. H. & Chung, S. A., 1992. Effect of mineral media, carbon sucrose and phytohormones on micropropagation of Alnus hirsute. Sikmul hakhoe chi 35(2):135-142.
Konan, N. K., Schopke, C., Carcamo, R., Beachy, R. N. & Fauquet, C., 1997. An efficient mass propagation system for cassava (Manihot esculenta Crantz) based on modal explants and axillary bud-derived meristems. Plant cell reports 16, 444-449.
Kramer P. J., 1956. Relative amount of mineral absorption through various regions of root. U.S. Atomic energy commission Report TID- 7512, 287.
Kureshy, K.U., 1986. Balochistan IN: Geography of Pakistan. National Book Service (Lahore). 201-206.
Lakshmanan P, Lee C.L., & Goh C.J., 1997. An efficient in vitro method for mass propagation of a woody ornamental Ixora coccinea L. Plant Cell Reports, 16, 572-577.
Muleo. R. & Thomas, B., 1997. Effect of light quality on shoot proliferation of Prunus cerasifera in vitro are the result of differential effects on bud induction and apical dominance. J. Hot. Sci. 72(3) 483-491.
Murashige, T., 1974. Plant propagation through tissue culture. Ann. Rev. Plant. Physiol. 25, 135-136.
Murashige, T. & Skoog, F., 1962. A revised medium for rapid growth and bioassays with tobacco cultures. Physiol. Plant. 15,473.
Namil, S. & Emine, A., 2007. Influence of different cytokinine used in in vitro culture on the stomata morphology of Pistachio. African J. of Biotecnology., 6(5)561-563.
Onay, A., Colak, G. & Basaran. D., 1991. The research of obtaining micropropagation from Pistacia vera L. apical bud and nodal bud. Acta Hortic, 289, 167-168.
VOL. 58 (1&2) MICROPROPAGATION OF PISTACIA VERA L. 121
Onay, A., Jeffree, C.E. & Yeoman, M.M., 1996. Plant regulation from encapsulated embryoids and an embryogenic mass of Pistachio, Pistacia vera L. Plant Cell report 15, 723-726.
Parfitt, D. E. & Almehdi, A. A., 1994. Use of high CO2 atmosphere and medium modification for the successful micropropagation of Pistchio. Scientia Horticulturrae. 56, 321-329.
Pierik, R.L.M., 1987. In vitro cultures of higher plants. Dordrecht. Boston. Lancaster: Martinus Nijhoff publishers.
Rashid, M. T., Aslam M. K. & Ibrahim M. M., 1989. Pistachio IN: Report on the Training course on the nut propagation and production. Dept. Hort. Fac. Agric. Univ. Cukurova Turkey.
Satoo, T., 1955. The influence of wind on transpiration of some conifers. Bull Tokyo Univer. Forests 50, 27.
Sepaskhah, A. R. & Maftoun, M., (1982). Growth and chemical composition of pistachio seedling as influenced by irrigation regimes and salinity levels of irrigation water. II. Chemical composition, J. Hort.Sci, 57, 469-476.
Takagi, H. & Qo, Y., 1997. Effect of light quality, photoperiod and cold treatment on in vitro bulbing of Garlic shoot tip. Acta Hort. 393.
Tasaki, S. (1985). Isolation of explants and culture of shoot apex of strawberry and potato. Vegetable course, TIATIC.
Yang, H. Y. & Schmidt, H., 1992. Investigation into the regeneration of adventitious shoot in vitro in cherries. Gartenbauwissenschaft 57(1) 7-10.
Young, Z. & Ludders, P., 1993. In vitro propagation of Pistachio (Pistacia vera) Gartenbauwissenschaft 59(1):30-34.
Ziv, M., 1986. In vitro hardening and acclimatisation of tissue culture plants IN: Plant Tissue Culture and its Agricultural applications. LA Withers and PG Alderson (Eds.) Butterworth London. 187-196.
BIOLOGIA (PAKISTAN) 2012, 58 (1&2), 123-133 PK ISSN 0006 - 3096
*Corresponding author: [email protected]
Phytosociological Studies of the vegetation of Sarsawa Hills
District Kotli, Azad Jammu & Kashmir
*ASHFAQ NAZIR1, RIFFAT NASEEM MALIK
2 & MUHAMAMD AJAIB
3
1,2Department of Environmental Sciences, Quaid-i-Azam University, Islamabad, Pakistan
3Department of Botany, GC University Lahore, Pakistan
ABSTRACT
Patterns of species composition and diversity in the lesser Himalayan subtropical
forests of Kashmir were studied in relation to environmental variables and underlying anthropogenic influence. Pinus-Poa-Maytenus, Myrsine-Themeda, Pinus, Colebrookia-Themeda-Dodonaea, Themeda-Carissa-Adhatoda, Themeda-Dodonaea-Eriophorum, Adhtoda-Themeda, Carissa-Myrsine-Themeda, Carissa-Themeda-Dodonaea, Dodonaea-Carissa-Pinus communities were identified at different altitudinal ranges. Soil pH varied
from 6.80 to 7.33, organic matter varied from zero to 4.30, Potassium (K) varied from 40 ppm to 80 ppm and Phosphorus (P) varied from 1.25 ppm to 11.25 ppm. Severe erosion and grazing intensity was observed at all the study sites. A very low species richness varying from 10 to 17 was recorded indicating degraded forest structure. Comprehensive forest conservation policy with practical implementations is utmost necessity in order to conserve the rapidly depleting forest resources of the area. Keywords: Himalayan forests, species richness, anthropogenic influence
INTRODUCTION
Himalayan Siwalik Hills are biodiversity hotspots harboring subtropical
broad leaved vegetation (Shaheen et al., 2011a). Tree diversity in Siwalik subtropical forests is fundamental to total forest diversity being the key stone-umbrella species, ensuring and regulating the survival of associated flora (Kharakwal & Rawat, 2010). These forests are mainly dominated by Pinus roxburgii and Quercus species in an altitudinal range of 700-1800m (Ahmad et al., 2010). The forest community structure and diversity pattern is influenced by environmental factors like altitude, precipitation aspect; as well as anthropogenic disturbance stimuli including tree felling, overgrazing and forest fires (Meijard et al., 2005; Asner et al., 2006). Due to poor socio-economics, exponentially increasing population, lack of infrastructure, unavailability of alternate fuel and energy sources, Himalayan forests are subjected to severe depletion (Kunwar & Sharma, 2004; Gairola et al., 2008). Forest species are main sources of fuel wood, timber, fodder and resins for the local communities. The ever increasing demand of forest products synchronized with the increasing population has created immense pressure on these subtropical forest stands, resulting in loss of species diversity as well as disturbed community structure (Gairola et al., 2008; Timilsina et al., 2007). More than 60% of Himalayan forests have been removed during the last century (Todoria et al., 2010). Pakistan, having less than 4% of its area covered by forest is further threatened by an annual deforestation rate of 3%. More than 25% of Pakistani forests have been lost in last 3 decades (Shaheen & Shinwari, 2012; Ahmad et al., 2010). A similar 27% decrease (821 x
A. NAZIR ET AL BIOLOGIA (PAKISTAN) 124
10³ ha) in forests of Kashmir has been revealed through satellite imagery from 1970 to 2000 (Oza, 2003; Valdiya, 2002). Sustainability of forest resources is of utmost importance in the life of local communities as well as prevailing environmental conditions. Quantitative species data helps in understanding the status, degree of usefulness and intensity of the anthropogenic pressure on each species (Cronin & Pandya, 2009). This phytosociological information about each individual tree species is essential for understanding their ecology and establishing conservation management policies for these under pressure forests (Kharakwal, 2009). Phytosociology of Himalayan forests has been subject to extensive research (Ahmed et al., 2006; Valdiya, 2002; Gairola et al., 2008; Timilsina et al., 2007; Nayar & Sastry, 1990; Myers, 1986; Joshi et al., 2001). Although much work has been conducted in Eastern and Western moist temperate Himalayan forests, the Kashmir Siwaliks have not been given proper attention due to remoteness, lack of infrastructure and danger, being at India-Pakistan border (Shaheen et al., 2011b). The present study was conducted with the aim to investigate the Phytosociology of Chir Pine forests in Kotli District of Azad Jammu and Kashmir, Pakistan.
MATERIALS AND METHODS
Kotli district is situated in Azad Jammu and Kashmir state, Pakistan.
Area lies in Siwalik Hills of Pir-Panjal sub range of Himalayas between longitude 73
o 6to 74
o 7, Latitude 33
o 20 to 33
o 40 and an Average altitude of 1100m.
Average winter and summer temperature are 130C and 29
0C respectively. The
average annual rain fall is 86.76mm whereas %age humidity is 52 (Ajaib 2008, 2010 & 2012). Ten study sites were selected in Sarsawa hills for phytosociological investigations. The sites were selected on the basis of Physiognomy, to get an accurate image of vegetation of whole area.
Expeditions were conducted to 10 subtropical forest sites in summers of 2010-2011 following standard locality procedures (Cox, 1967). Sampling was carried out systematically using Quadrat method. Quadrat size of 10 x 10 m was used for trees, 5 x 5 m for shrubs and 1 x 1 m for grasses and herbs respectively. Sampling was started at the initial forest margins and quadrats were laid onward after every 100 m distance. Species data, including cover, frequency and density was recorded from the sites following Curtis (1959) and Oosting (1956). Co-ordinates of the studied sites were recorded using Global Positioning System (GPS). Grazing intensity was recorded by using visual indicators including hoof marks, browsed vegetation, trampling and animal droppings. Erosion intensity was determined by direct observations and sites were classified into severe, mild and un-eroded accordingly (Shaheen et al., 2011b) Composite soil samples were taken from all quadrats of each study site and physicochemical analyses were conducted in Soil Sciences laboratory, Agricultural research Institute Muzaffarabad. The soil parameters analyzed included organic matter, pH, saturation, texture, Phosphorus (ppm) and Potassium (ppm).
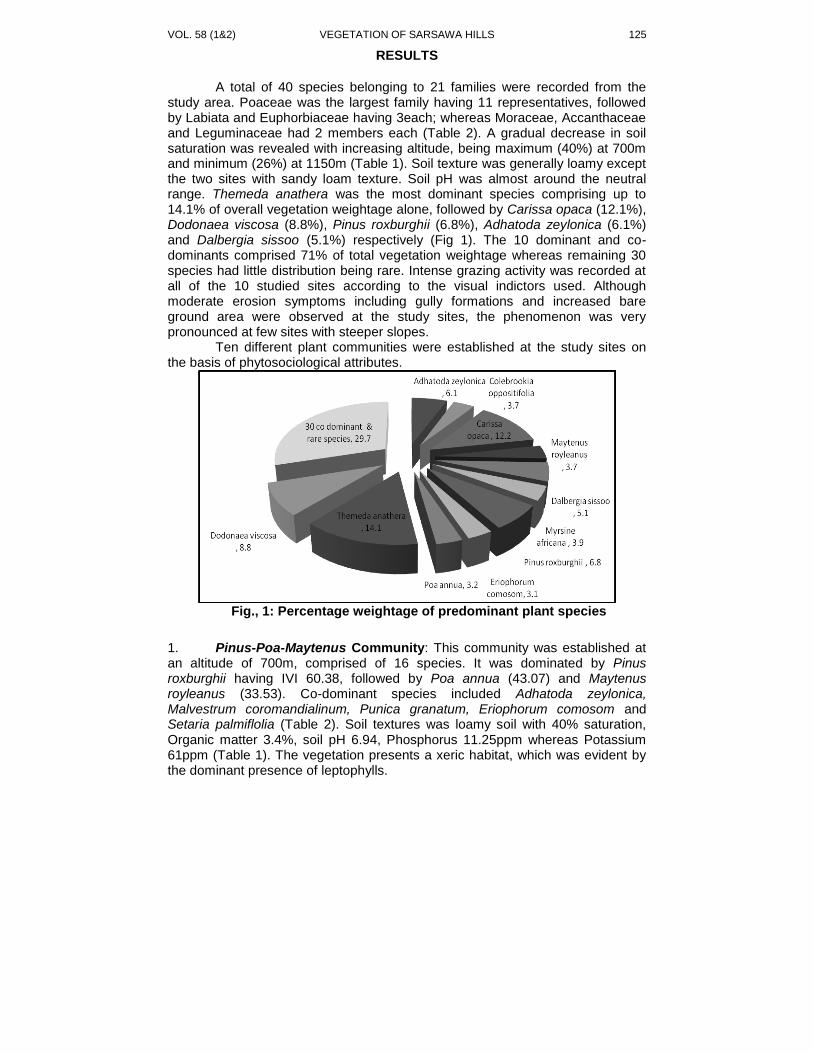
VOL. 58 (1&2) VEGETATION OF SARSAWA HILLS 125
RESULTS
A total of 40 species belonging to 21 families were recorded from the study area. Poaceae was the largest family having 11 representatives, followed by Labiata and Euphorbiaceae having 3each; whereas Moraceae, Accanthaceae and Leguminaceae had 2 members each (Table 2). A gradual decrease in soil saturation was revealed with increasing altitude, being maximum (40%) at 700m and minimum (26%) at 1150m (Table 1). Soil texture was generally loamy except the two sites with sandy loam texture. Soil pH was almost around the neutral range. Themeda anathera was the most dominant species comprising up to 14.1% of overall vegetation weightage alone, followed by Carissa opaca (12.1%), Dodonaea viscosa (8.8%), Pinus roxburghii (6.8%), Adhatoda zeylonica (6.1%) and Dalbergia sissoo (5.1%) respectively (Fig 1). The 10 dominant and co-dominants comprised 71% of total vegetation weightage whereas remaining 30 species had little distribution being rare. Intense grazing activity was recorded at all of the 10 studied sites according to the visual indictors used. Although moderate erosion symptoms including gully formations and increased bare ground area were observed at the study sites, the phenomenon was very pronounced at few sites with steeper slopes.
Ten different plant communities were established at the study sites on the basis of phytosociological attributes.
Fig., 1: Percentage weightage of predominant plant species
1. Pinus-Poa-Maytenus Community: This community was established at an altitude of 700m, comprised of 16 species. It was dominated by Pinus roxburghii having IVI 60.38, followed by Poa annua (43.07) and Maytenus royleanus (33.53). Co-dominant species included Adhatoda zeylonica, Malvestrum coromandialinum, Punica granatum, Eriophorum comosom and Setaria palmiflolia (Table 2). Soil textures was loamy soil with 40% saturation, Organic matter 3.4%, soil pH 6.94, Phosphorus 11.25ppm whereas Potassium 61ppm (Table 1). The vegetation presents a xeric habitat, which was evident by the dominant presence of leptophylls.
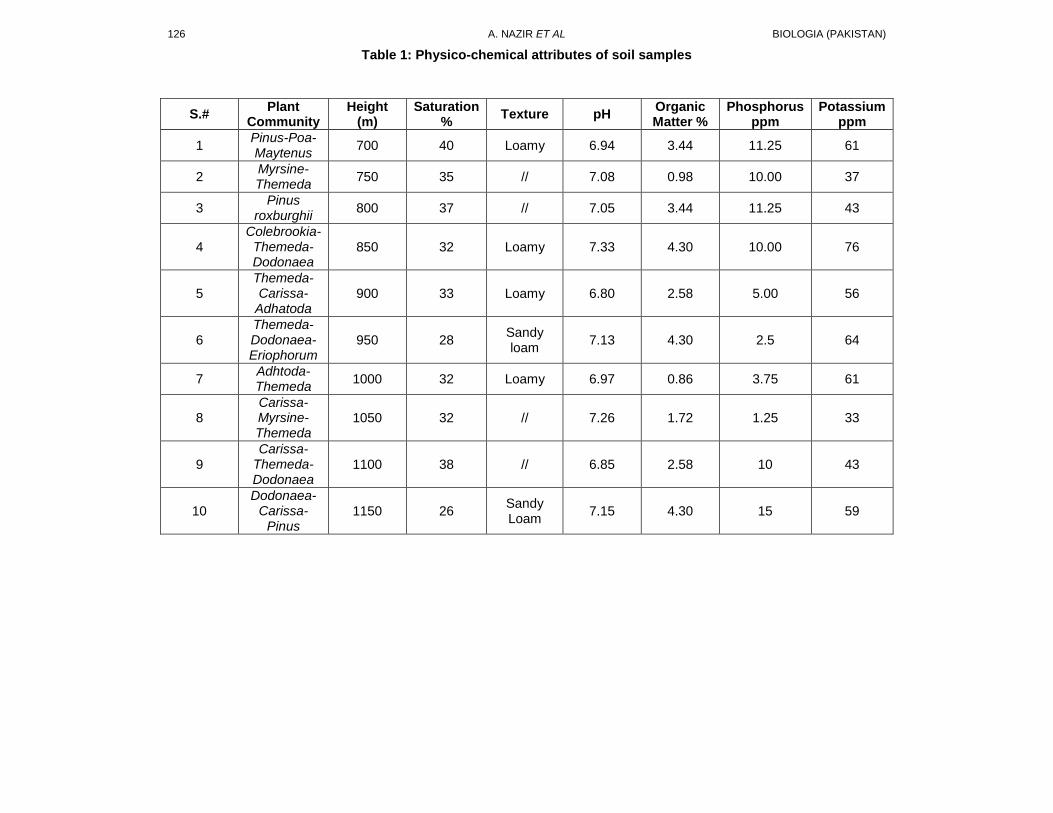
126 A. NAZIR ET AL BIOLOGIA (PAKISTAN)
Table 1: Physico-chemical attributes of soil samples
S.# Plant
Community Height
(m) Saturation
% Texture pH
Organic Matter %
Phosphorus ppm
Potassium ppm
1 Pinus-Poa-Maytenus
700 40 Loamy 6.94 3.44 11.25 61
2 Myrsine-Themeda
750 35 // 7.08 0.98 10.00 37
3 Pinus
roxburghii 800 37 // 7.05 3.44 11.25 43
4 Colebrookia-Themeda-Dodonaea
850 32 Loamy 7.33 4.30 10.00 76
5 Themeda-Carissa-
Adhatoda 900 33 Loamy 6.80 2.58 5.00 56
6 Themeda-Dodonaea-Eriophorum
950 28 Sandy loam
7.13 4.30 2.5 64
7 Adhtoda-Themeda
1000 32 Loamy 6.97 0.86 3.75 61
8 Carissa-Myrsine-Themeda
1050 32 // 7.26 1.72 1.25 33
9 Carissa-
Themeda-Dodonaea
1100 38 // 6.85 2.58 10 43
10 Dodonaea-
Carissa-Pinus
1150 26 Sandy Loam
7.15 4.30 15 59
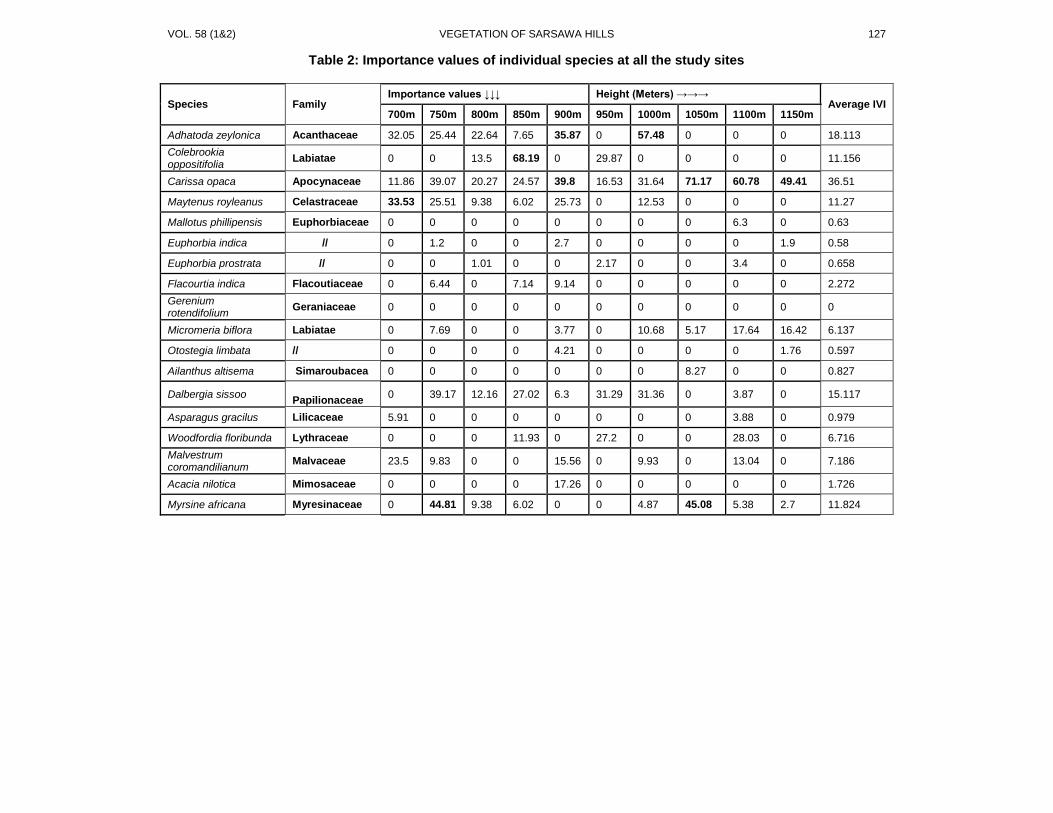
VOL. 58 (1&2) VEGETATION OF SARSAWA HILLS
127
Table 2: Importance values of individual species at all the study sites
Species Family Importance values ↓↓↓ Height (Meters) →→→
Average IVI 700m 750m 800m 850m 900m 950m 1000m 1050m 1100m 1150m
Adhatoda zeylonica Acanthaceae 32.05 25.44 22.64 7.65 35.87 0 57.48 0 0 0 18.113
Colebrookia oppositifolia
Labiatae 0 0 13.5 68.19 0 29.87 0 0 0 0 11.156
Carissa opaca Apocynaceae 11.86 39.07 20.27 24.57 39.8 16.53 31.64 71.17 60.78 49.41 36.51
Maytenus royleanus Celastraceae 33.53 25.51 9.38 6.02 25.73 0 12.53 0 0 0 11.27
Mallotus phillipensis Euphorbiaceae 0 0 0 0 0 0 0 0 6.3 0 0.63
Euphorbia indica // 0 1.2 0 0 2.7 0 0 0 0 1.9 0.58
Euphorbia prostrata // 0 0 1.01 0 0 2.17 0 0 3.4 0 0.658
Flacourtia indica Flacoutiaceae 0 6.44 0 7.14 9.14 0 0 0 0 0 2.272
Gerenium rotendifolium
Geraniaceae 0 0 0 0 0 0 0 0 0 0 0
Micromeria biflora Labiatae 0 7.69 0 0 3.77 0 10.68 5.17 17.64 16.42 6.137
Otostegia limbata // 0 0 0 0 4.21 0 0 0 0 1.76 0.597
Ailanthus altisema Simaroubacea 0 0 0 0 0 0 0 8.27 0 0 0.827
Dalbergia sissoo Papilionaceae
0 39.17 12.16 27.02 6.3 31.29 31.36 0 3.87 0 15.117
Asparagus gracilus Lilicaceae 5.91 0 0 0 0 0 0 0 3.88 0 0.979
Woodfordia floribunda Lythraceae 0 0 0 11.93 0 27.2 0 0 28.03 0 6.716
Malvestrum coromandilianum
Malvaceae 23.5 9.83 0 0 15.56 0 9.93 0 13.04 0 7.186
Acacia nilotica Mimosaceae 0 0 0 0 17.26 0 0 0 0 0 1.726
Myrsine africana Myresinaceae 0 44.81 9.38 6.02 0 0 4.87 45.08 5.38 2.7 11.824
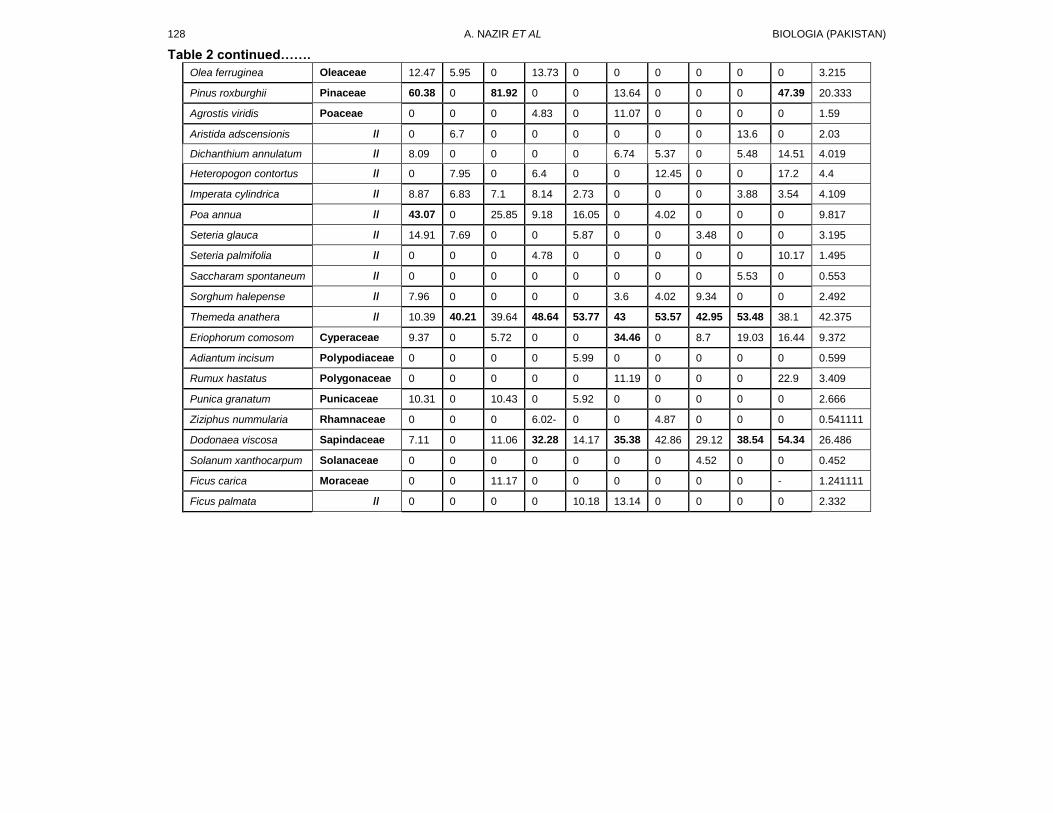
A. NAZIR ET AL BIOLOGIA (PAKISTAN) 128
Table 2 continued…….
Olea ferruginea Oleaceae 12.47 5.95 0 13.73 0 0 0 0 0 0 3.215
Pinus roxburghii Pinaceae 60.38 0 81.92 0 0 13.64 0 0 0 47.39 20.333
Agrostis viridis Poaceae 0 0 0 4.83 0 11.07 0 0 0 0 1.59
Aristida adscensionis // 0 6.7 0 0 0 0 0 0 13.6 0 2.03
Dichanthium annulatum // 8.09 0 0 0 0 6.74 5.37 0 5.48 14.51 4.019
Heteropogon contortus // 0 7.95 0 6.4 0 0 12.45 0 0 17.2 4.4
Imperata cylindrica // 8.87 6.83 7.1 8.14 2.73 0 0 0 3.88 3.54 4.109
Poa annua // 43.07 0 25.85 9.18 16.05 0 4.02 0 0 0 9.817
Seteria glauca // 14.91 7.69 0 0 5.87 0 0 3.48 0 0 3.195
Seteria palmifolia // 0 0 0 4.78 0 0 0 0 0 10.17 1.495
Saccharam spontaneum // 0 0 0 0 0 0 0 0 5.53 0 0.553
Sorghum halepense // 7.96 0 0 0 0 3.6 4.02 9.34 0 0 2.492
Themeda anathera // 10.39 40.21 39.64 48.64 53.77 43 53.57 42.95 53.48 38.1 42.375
Eriophorum comosom Cyperaceae 9.37 0 5.72 0 0 34.46 0 8.7 19.03 16.44 9.372
Adiantum incisum Polypodiaceae 0 0 0 0 5.99 0 0 0 0 0 0.599
Rumux hastatus Polygonaceae 0 0 0 0 0 11.19 0 0 0 22.9 3.409
Punica granatum Punicaceae 10.31 0 10.43 0 5.92 0 0 0 0 0 2.666
Ziziphus nummularia Rhamnaceae 0 0 0 6.02- 0 0 4.87 0 0 0 0.541111
Dodonaea viscosa Sapindaceae 7.11 0 11.06 32.28 14.17 35.38 42.86 29.12 38.54 54.34 26.486
Solanum xanthocarpum Solanaceae 0 0 0 0 0 0 0 4.52 0 0 0.452
Ficus carica Moraceae 0 0 11.17 0 0 0 0 0 0 - 1.241111
Ficus palmata // 0 0 0 0 10.18 13.14 0 0 0 0 2.332
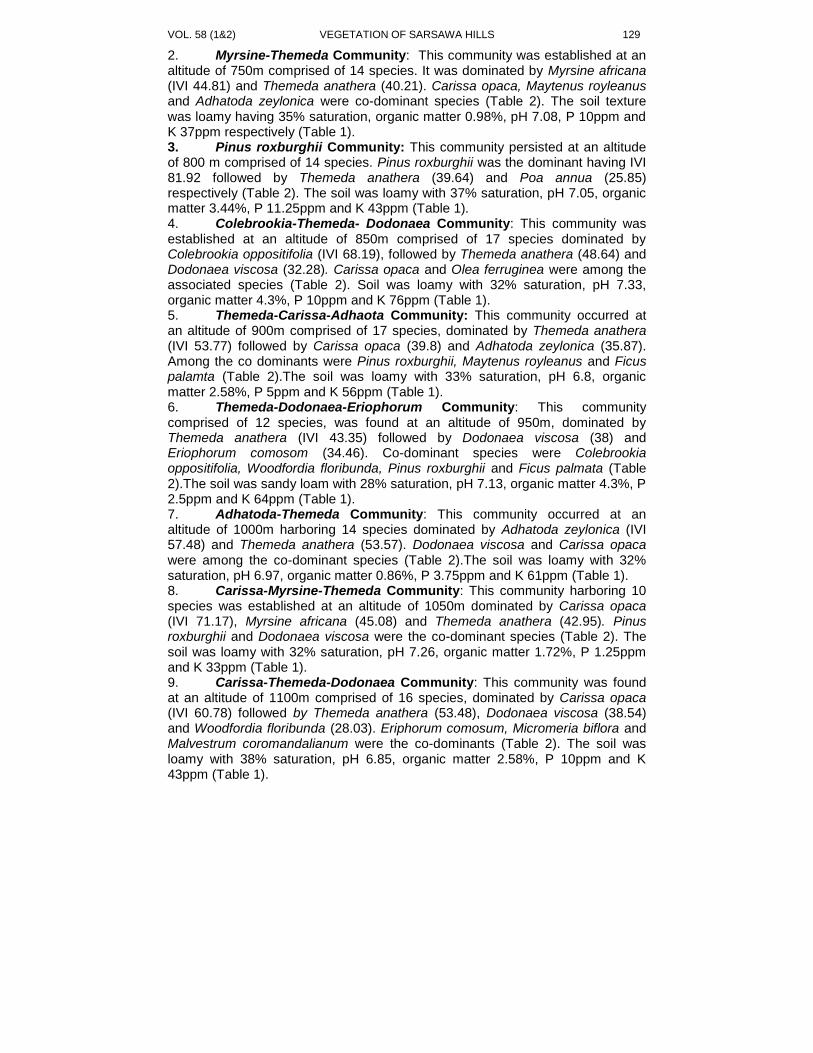
VOL. 58 (1&2) VEGETATION OF SARSAWA HILLS 129
2. Myrsine-Themeda Community: This community was established at an altitude of 750m comprised of 14 species. It was dominated by Myrsine africana (IVI 44.81) and Themeda anathera (40.21). Carissa opaca, Maytenus royleanus and Adhatoda zeylonica were co-dominant species (Table 2). The soil texture was loamy having 35% saturation, organic matter 0.98%, pH 7.08, P 10ppm and K 37ppm respectively (Table 1). 3. Pinus roxburghii Community: This community persisted at an altitude of 800 m comprised of 14 species. Pinus roxburghii was the dominant having IVI 81.92 followed by Themeda anathera (39.64) and Poa annua (25.85) respectively (Table 2). The soil was loamy with 37% saturation, pH 7.05, organic matter 3.44%, P 11.25ppm and K 43ppm (Table 1). 4. Colebrookia-Themeda- Dodonaea Community: This community was established at an altitude of 850m comprised of 17 species dominated by Colebrookia oppositifolia (IVI 68.19), followed by Themeda anathera (48.64) and Dodonaea viscosa (32.28). Carissa opaca and Olea ferruginea were among the associated species (Table 2). Soil was loamy with 32% saturation, pH 7.33, organic matter 4.3%, P 10ppm and K 76ppm (Table 1). 5. Themeda-Carissa-Adhaota Community: This community occurred at an altitude of 900m comprised of 17 species, dominated by Themeda anathera (IVI 53.77) followed by Carissa opaca (39.8) and Adhatoda zeylonica (35.87). Among the co dominants were Pinus roxburghii, Maytenus royleanus and Ficus palamta (Table 2).The soil was loamy with 33% saturation, pH 6.8, organic matter 2.58%, P 5ppm and K 56ppm (Table 1). 6. Themeda-Dodonaea-Eriophorum Community: This community comprised of 12 species, was found at an altitude of 950m, dominated by Themeda anathera (IVI 43.35) followed by Dodonaea viscosa (38) and Eriophorum comosom (34.46). Co-dominant species were Colebrookia oppositifolia, Woodfordia floribunda, Pinus roxburghii and Ficus palmata (Table 2).The soil was sandy loam with 28% saturation, pH 7.13, organic matter 4.3%, P 2.5ppm and K 64ppm (Table 1). 7. Adhatoda-Themeda Community: This community occurred at an altitude of 1000m harboring 14 species dominated by Adhatoda zeylonica (IVI 57.48) and Themeda anathera (53.57). Dodonaea viscosa and Carissa opaca were among the co-dominant species (Table 2).The soil was loamy with 32% saturation, pH 6.97, organic matter 0.86%, P 3.75ppm and K 61ppm (Table 1). 8. Carissa-Myrsine-Themeda Community: This community harboring 10 species was established at an altitude of 1050m dominated by Carissa opaca (IVI 71.17), Myrsine africana (45.08) and Themeda anathera (42.95). Pinus roxburghii and Dodonaea viscosa were the co-dominant species (Table 2). The soil was loamy with 32% saturation, pH 7.26, organic matter 1.72%, P 1.25ppm and K 33ppm (Table 1). 9. Carissa-Themeda-Dodonaea Community: This community was found at an altitude of 1100m comprised of 16 species, dominated by Carissa opaca (IVI 60.78) followed by Themeda anathera (53.48), Dodonaea viscosa (38.54) and Woodfordia floribunda (28.03). Eriphorum comosum, Micromeria biflora and Malvestrum coromandalianum were the co-dominants (Table 2). The soil was loamy with 38% saturation, pH 6.85, organic matter 2.58%, P 10ppm and K 43ppm (Table 1).
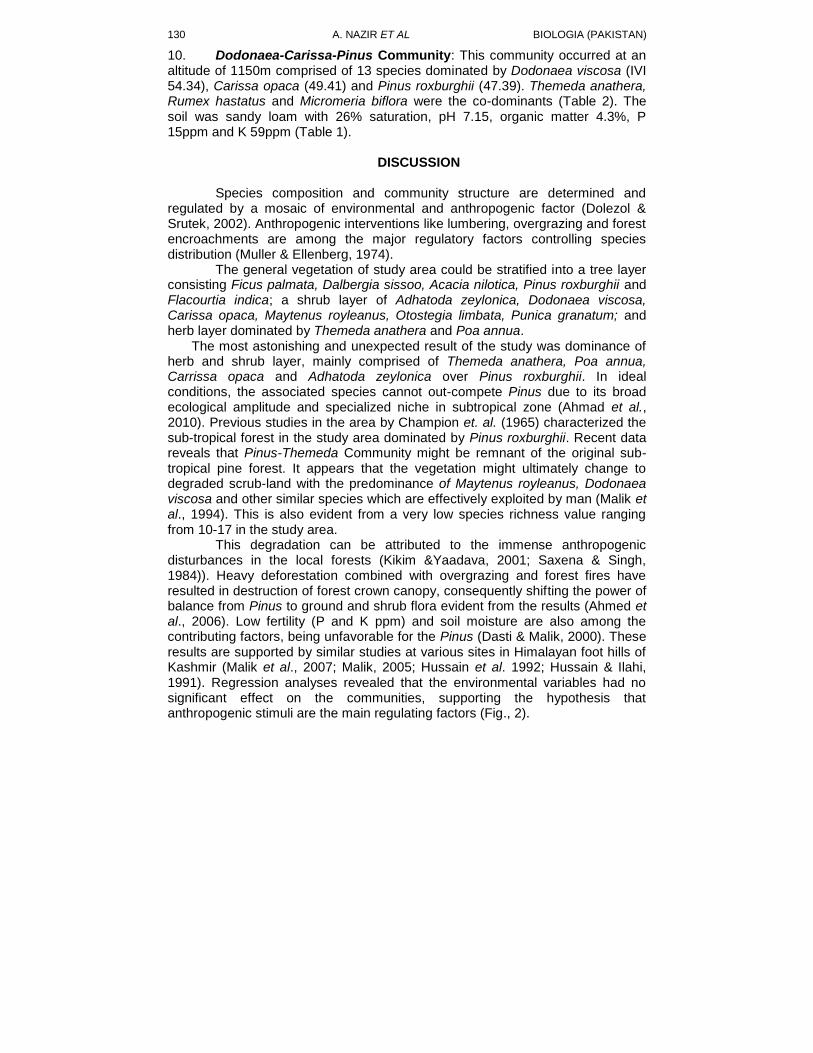
A. NAZIR ET AL BIOLOGIA (PAKISTAN) 130
10. Dodonaea-Carissa-Pinus Community: This community occurred at an altitude of 1150m comprised of 13 species dominated by Dodonaea viscosa (IVI 54.34), Carissa opaca (49.41) and Pinus roxburghii (47.39). Themeda anathera, Rumex hastatus and Micromeria biflora were the co-dominants (Table 2). The soil was sandy loam with 26% saturation, pH 7.15, organic matter 4.3%, P 15ppm and K 59ppm (Table 1).
DISCUSSION
Species composition and community structure are determined and
regulated by a mosaic of environmental and anthropogenic factor (Dolezol & Srutek, 2002). Anthropogenic interventions like lumbering, overgrazing and forest encroachments are among the major regulatory factors controlling species distribution (Muller & Ellenberg, 1974).
The general vegetation of study area could be stratified into a tree layer consisting Ficus palmata, Dalbergia sissoo, Acacia nilotica, Pinus roxburghii and Flacourtia indica; a shrub layer of Adhatoda zeylonica, Dodonaea viscosa, Carissa opaca, Maytenus royleanus, Otostegia limbata, Punica granatum; and herb layer dominated by Themeda anathera and Poa annua.
The most astonishing and unexpected result of the study was dominance of herb and shrub layer, mainly comprised of Themeda anathera, Poa annua, Carrissa opaca and Adhatoda zeylonica over Pinus roxburghii. In ideal conditions, the associated species cannot out-compete Pinus due to its broad ecological amplitude and specialized niche in subtropical zone (Ahmad et al., 2010). Previous studies in the area by Champion et. al. (1965) characterized the sub-tropical forest in the study area dominated by Pinus roxburghii. Recent data reveals that Pinus-Themeda Community might be remnant of the original sub-tropical pine forest. It appears that the vegetation might ultimately change to degraded scrub-land with the predominance of Maytenus royleanus, Dodonaea viscosa and other similar species which are effectively exploited by man (Malik et al., 1994). This is also evident from a very low species richness value ranging from 10-17 in the study area.
This degradation can be attributed to the immense anthropogenic disturbances in the local forests (Kikim &Yaadava, 2001; Saxena & Singh, 1984)). Heavy deforestation combined with overgrazing and forest fires have resulted in destruction of forest crown canopy, consequently shifting the power of balance from Pinus to ground and shrub flora evident from the results (Ahmed et al., 2006). Low fertility (P and K ppm) and soil moisture are also among the contributing factors, being unfavorable for the Pinus (Dasti & Malik, 2000). These results are supported by similar studies at various sites in Himalayan foot hills of Kashmir (Malik et al., 2007; Malik, 2005; Hussain et al. 1992; Hussain & Ilahi, 1991). Regression analyses revealed that the environmental variables had no significant effect on the communities, supporting the hypothesis that anthropogenic stimuli are the main regulating factors (Fig., 2).
VOL. 58 (1&2) VEGETATION OF SARSAWA HILLS 131
Fig., 2: Screen plot showing the soil characters and altitude It is concluded that area overall represents degraded forest vegetation,
low species richness and prominent anthropogenic disturbances. These rapidly depleting subtropical forests of Himalayan Siwaliks demand immediate attention of regulatory authorities for the conservation management of these vital ecosystems.
REFERENCES
Ahmad, I., Ahmad, M.S.A., Hussain, M, Ashraf, M., Ashraf, M.Y. & Hameed, M.,
2010. Spatiotemporal aspects of plant community structure in open scrub rangelands of submountainous Himalayan plateaus. Pak. J. Bot., 42(5):
3431- 3440.
Ahmed, M., Husain, T., Heikh, A.H.S., Hussain, S.S. & Siddiqui, M., 2006. Phytosociology and structure of Himalayan forests from different climatic zones of Pakistan. Pak. J. Bot., 38(2): 361-383
Ajaib, M., Khan, Z. & Siddiqui, F.M., 2012. Ethnobotanical Study of Useful Climbers/twiners of District Kotli, Azad Jammu & Kashmir. Int. J. Biol. & Biotech., 9(4): 421-427.
Ajaib, M., Khan, Z., Khan, N. & Wahab, M., 2010. Ethnobotanical Studies on useful Shrubs of District Kotli, Azad Jammu & Kashmir, Pakistan. Pak. J. Bot., 42(3):1407-1415.
A. NAZIR ET AL BIOLOGIA (PAKISTAN) 132
Ajaib, M., Khan, Z., Muhammad, S. & Mahmood, R., 2008. Biological Spectra of Saney Baney Hills District Kotli Azad Jammu & Kashmir. Pak. J. Science, 60(1-2): 53-58.
Asner, G.P., Broadbent, E.N., Oliveira, P.J.C., Keller, M., Knapp, D.E. & Silva, J.N.M., 2006. Condition and fate of logged forests in the Brazilian Amazon. Proc. Nat. Acad. Sci. USA., 103: 12947- 12950.
Champion, H. G., Seth, S. K. & Khattack, G. H., 1965. Forest type of Pakistan. Pakistan Forest Institute Peshawar.
Cox, W.G., 1967. Laboratory Manual of General Ecology. WMC Brown Co. Dubuque, IA.
Cronin, R. & Pandya, A., 2009. Eds, exploiting naturalre sources, growth, instability, and conflict in the Middle East and Asia. The Henry L. Stimson Center.
Curtis, J.T., 1959. The vegetation of Wisconsin. An Ordination of Plant Communities. The University of Wisconsin Press, Madison, Wisconsin.
Dasti, A.A. & Malik, S.A., 2000. A transect of vegetation and soils on the Indus Valley Slope, Pakistan. Pakistan J. Pl. Sci., 4: 73–84
Dolezal, J. & Srutek, M., 2002. Altitudinal changes in composition and structure of mountain temperate: A case study from the western Carpathians. Springer Netherlands, 158: 201–21.
Gairola, S., Rawal, R.S. & Todaria, N.P., 2008. Forest vegetation patterns along an altitudinal gradient in sub-alpine zone of west Himalaya, India. African Journal of Plant Science, 2(6): 042-048.
Hussain, F. & Ilahi, I., 1991. Ecology and Vegetation of Lesser Himalayas, pp. 96–112. Pakistan. Jadoon Printing Press, Peshawar.
Hussain, F., Shah, A., Illahi, I. & Rehman, A., 1992, Phytosociology of the vanishing sub tropical vegetation of Swat with special reference to Docut Hills II: Spring aspect. Sarhad J. Agri., 8: 185–91
Joshi, P.K., Singh, S., Agarwal, S. & Roy, P.S., 2001. Forest cover assessment in western Himalayas, Himachal Pradesh using IRS 1C/1D WiFS data. Curr Sci., 80: 941-947.
Kharkwal, G. & Rawat, Y.S., 2010. Structure and composition of vegetation in subtropical forest of Kumaun Himalaya. African Journal of Plant Science, 4(4): 116-121.
Kharkwal, G., 2009. Qualitative analysis of tree species in evergreen forests of Kumaun Himalaya, Uttarakhand, India. African Journal of Plant Science, 3(3): 049-052.
Kikim, A. & Yaadava, P.S., 2001. Phenology of tree species in sub tropical forests of Manipur in North eastren India. Trop. Ecol., 42: 269–76
Kunwar, R.M. & Sharma, S.P., 2004. Quantitative analysis oftree species in two community forests of Dolpa district, mid-west Nepal. Him. J. Sci., 2(3): 23-28.
Malik N. Z, Arshad, M. & Mirza, S.N., 2007. Phytosociological Attributes of Different Plant Communities of Pir-Chinasi Hills of Azad Jammu and Kashmir. Int. J. Agri. Biol., 9(4):569–574
VOL. 58 (1&2) VEGETATION OF SARSAWA HILLS 133
Malik, Z.H., 2005. Comparative study on the vegetation of Ganga Chotti and Bedori hills District Bagh, Azad Jammu and Kashmir with special reference to Range conditions. PhD Thesis, University of Peshawar.
Malik, Z.H., Ahmed, S. & Hussain, F., 1994. Present status of sub tropical chir-pine vegetation of Samani Hills, Azad Kashmir. Sci. Khyber, 7: 51–8
Meijard, E., Sheil,D., Nasi, R., Augeri, D., Rosenbaum, B., Iskandar, D., Setyawati, T., Lammertink, M., Rachmatika, I., Wong, A., Soehartono, T. & Brien, T. O., 2005. Life after logging: reconciling wildlife conservation and production forestry in Indonesian Borneo. Bogor, Indonesia: Center for International Forestry Research.
Mueller, D.B. & Ellenberg, H., 1974. Aims and Method of vegetation Ecology, pp. 200. John Wiley and Sons, Inc., New York.
Myers, N., 1986. Environmental repercussions of deforestation in the Himalayas. J. World Forest Resource Management, 2: 63-72.
Nayar, M.P. & Sastry, A.R.K., 1990. Red data book of Indian plants. vol. III. Botanical Survey of India, Calcutta.
Oosting, H.J., 1956. The Study of Plant Communities: An Introduction to Plant Ecology. 2nd ed., W.H. Freeman Company, San Francisco.
Oza, G.M., 2003. Destruction of Forests and Wildlife in the Kashmir Wilderness. The Environmentalist, 23: 189-192.
Saxena, A.K. & Singh, J.S., 1984. Tree population structure of certain Himalayan forests and implications concerning the future composition. Vegetatio, 58: 61-69.
Shaheen H & Shinwari, Z.K., 2012, Phytodiversity and Endemic richness of Karambar lake vegetation from Chitral, Hindukush-Himalayas. Pak. J. Botany, 44(1): 15-20
Shaheen H, Qureshi, R.A. & Shinwari, Z.K., 2011, Forest structure, vegetation dynamics and anthropogenic impact on lesser Himalayan Subtropical forests in Bagh District, Kashmir. Pak. J. Bot., 43(4): 1861-1866.
Shaheen H, Qureshi, R.A., Zahid Ullah & Ahmad, T., 2011, Anthropogenic Pressure on the Western Himalayan moist temperate forests of Bagh, Azad Jammu & Kashmir. Pak. J. Bot., 43(1): 695-703.
Timilsina, N., Ross M.S., & Heinen, J.T., 2007. A community analysis of sal (Shorearo busta) forests in the western Terai of Nepal. Forest Ecology and Management, 241: 223-234.
Todaria, N.P., Pokhriyal, P., Uniyal, P. & Chauhan, D.S., 2010. Regeneration status of tree species in forest of Phakot and Pathri Rao watersheds in Garhwal Himalaya. Current Science, 98(2): 171-175.
Valdiya, K.S., 2002. Emergence and evolution of Himalaya: reconstructing history in the light of recent studies. Prog. Phys. Geogr., 26: 360-399.
BIOLOGIA (PAKISTAN) 2012, 58 (1&2), 135-147 PK ISSN 0006 - 3096
* Corresponding author: [email protected]
Anatomic, morphometric and histopathological
derangements in fetal craniofacial structures in mice on co-
gestational exposure of Chlorpyrifos
*KHAWAJA RAEES AHMAD
1, ASMATULLAH
2, TAHIR ABBAS
3, KAUSAR
RAEES4 AND SHAHZAD AHMAD MUFTI
5
Assistant Professor of Zoology, Department of Biological Sciences, university of
Sargodha; Sargodha Associate Professor of Zoology Department of Zoology, University of the Punjab;
Lahore PhD Scholars, Department of Zoology, University of the Punjab; Lahore
Principal, Government college for women Farooq colony, Sargodha Advisor Bio-sciences COMSATS, Islamabad
ABSTRACT
Chlorpyrifos (CPF) was tested for feto-toxicological manifestations on craniofacial
anatomy in mice at 4 maternally sub-toxic oral doses (identified as experimental groups) i.e. 0, 18, 36 and 72mg/kg. Each group was further divided into: single {on gestation day (GD) 6}; pulsatile (on GD6, 9, 12) and chronic exposure (on GD6 -12) sub groups (categories). Dams in 0mg/kg group were treated with vehicle (corn oil) only. Fetuses were exteriorized on GD18.
In comparison with 0mg/kg group average litter size decreased dose and exposure dependently in 18, 36 and 72mg/kg groups. Statistical analysis showed significant decline in mean (per-litter) values of fetal weight and circumferences of fetal head and eyes at all exposure levels.
Various anatomic and histopathological abnormalities in craniofacial structure were observed in fetuses exposed to CPF in pulsatile and chronic treatment only. Hydrocephaly, enlarged cerebral ventricles and meningoencephalocoele. Vacuolations were seen in the medullary region of diencephalon and cerebellum. Cortical lesions in the metencephalon along with enlarged meningoencephalocoele were also observed. In the eyes defects of lens and retina were obvious. Pharyngeal and jaw musculature was atrophied. Craniofacial bones defects included cleft palate and nasal septal defects. Key Words: Chlorpyrifos, Teratogenesis, Developmental Neurotoxicity, Fetal
microanatomy
INTRODUCTION
Chlorpyrifos [O, O-diethyl-O-(3, 5, 6-trichloro-2-pyridyl) -
phosphorothioate] is a broad-spectrum organophosphorus pesticide used extensively in agricultural and domestic pest control (Tian et al., 2005). Due to its exposure risks in children its use in domestic sector was restricted in 2000 by environmental protection agency in U.S. (US. EPA. 2000); however, it is still registered in more than 98 countries worldwide and is being used indiscriminately both in agricultural and domestic sectors (Dowagro, 2006). Chlorpyrifos is metabolized, in vivo, into chlorpyrifos-oxon- a very potent cholinesterase inhibitor (Cometa et al., 2007). It has been seen that young animals are deficient in
K. R. AHMAD ET AL BIOLOGIA (PAKISTAN)
136
metabolism of CPF thus CPF-oxon accumulate in higher concentrations in liver and brain of preweanling rats than the adults (Timchalk et al., 2007). Organophosphorus insecticides and their oxons particularly affect astroglial cell proliferation (Guizzetti et al., 2005) so it seems that CPF exhibit greater accumulative toxicity during development than in adulthood. In this context Whitney et al. (1995) pointed out that repeated sub-toxic low dose exposures to CPF target the developing brain during the critical period of cell division leading to the abnormalities at cellular and synaptic levels.
Particularly from the standpoint of teratology Farag et al., (2003) claimed for CPF to be fetotoxic and dysmorphogenic in rats on maternally toxic oral chronic exposure i.e. 25mg/kg CPF on GD6-15; whereas Tian et al. (2005) described CPF to be teratogenic and embryotoxic in mice at maternally sub-toxic intra-peritoneal single dose injection i.e. 80mg/kg body weight. Uggini et al. (2012) found various skeletal malformations and decreased hatchability in developing chick on chlopyrifos + cypermethrin treatment. The pattern of CPF exposure in these studies was either confined to a single maternally sub-toxic high dose (Tian et al., 2005) or to a low dose chronic gestational treatment (Farag et al., 2003), Whereas Uggini et al. (2010) used a mixture of CPF and cypermethrin.
In light of the above literature it was decided to evaluate the fetotoxicological potentials of CPF in mice in a wide range of dose profile (0, 18, 36, 72mg/kg) with a dose regime comprising on single (GD6), pulsatile (GD6, 9, 12) and chronic (GD6-12) gestational treatments.
MATERIALS AND METHODS
Animals: A total of 120 Swiss Webster albino laboratory mice (Mus
musculus) {10 in each subgroup (category) thus 30 in each group) were used in this research work. They were kept in 12” × 18” × 12” wire-mesh covered steel cages under 12 hr-12 hr light-dark cycles. Fine wood shavings were provided for
bedding. Room temperature was maintained at 252 0C. Dams were given free
access to food and drinking water through out this study. Males, having proven fertility, were encaged with estrus females for 2-3 hours at the beginning of the light period. The presence of vaginal plug and/or presence of sperms in the vaginal smear were used as confirmational sign for successful mating and it was considered as day 0 of gestation.
Drug preparation and administration: Required doses were delivered orally to the experimental animals by gavages. Firstly 7.2, 3.6 and 1.8% solutions (named as stock solutions 1, 2 and 3 respectively) of CPF were prepared by adding corn oil for appropriate dilutions. Every animal was weighed on a digital balance just before dosing. Body weighs of the dams (in all 4 groups) ranged between 27-38g on their specific dates of treatments. Dose volume of the treatment solution was kept constant (i.e., 0.1ml) while the amount of active ingredient (chlorpyrifos) was adjusted by adding corn oil in the relevant stock solutions according to the body weight of each animal.
Experimental groups and dose regimen: Pregnant females were divided into 4 groups of 30 animals each named as 0, 18, 36 and 72mg/kg
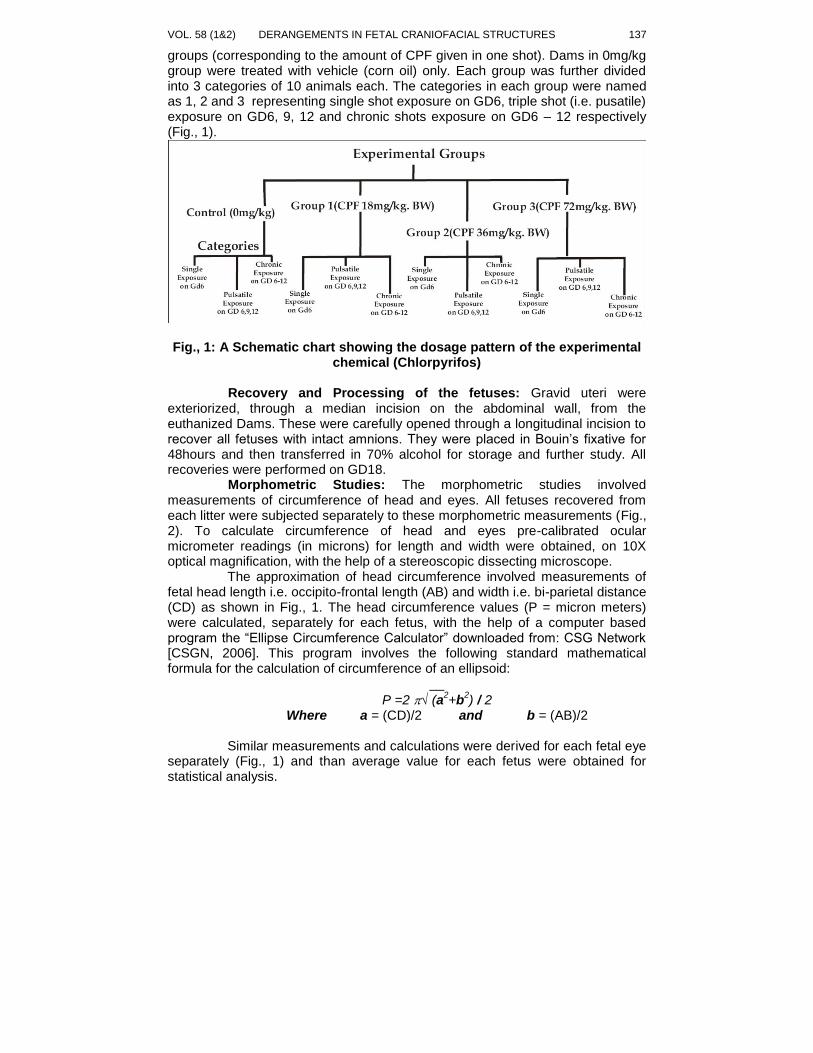
VOL. 58 (1&2) DERANGEMENTS IN FETAL CRANIOFACIAL STRUCTURES 137
groups (corresponding to the amount of CPF given in one shot). Dams in 0mg/kg group were treated with vehicle (corn oil) only. Each group was further divided into 3 categories of 10 animals each. The categories in each group were named as 1, 2 and 3 representing single shot exposure on GD6, triple shot (i.e. pusatile) exposure on GD6, 9, 12 and chronic shots exposure on GD6 – 12 respectively (Fig., 1).
Fig., 1: A Schematic chart showing the dosage pattern of the experimental
chemical (Chlorpyrifos)
Recovery and Processing of the fetuses: Gravid uteri were exteriorized, through a median incision on the abdominal wall, from the euthanized Dams. These were carefully opened through a longitudinal incision to recover all fetuses with intact amnions. They were placed in Bouin’s fixative for 48hours and then transferred in 70% alcohol for storage and further study. All recoveries were performed on GD18.
Morphometric Studies: The morphometric studies involved measurements of circumference of head and eyes. All fetuses recovered from each litter were subjected separately to these morphometric measurements (Fig., 2). To calculate circumference of head and eyes pre-calibrated ocular micrometer readings (in microns) for length and width were obtained, on 10X optical magnification, with the help of a stereoscopic dissecting microscope.
The approximation of head circumference involved measurements of fetal head length i.e. occipito-frontal length (AB) and width i.e. bi-parietal distance (CD) as shown in Fig., 1. The head circumference values (P = micron meters) were calculated, separately for each fetus, with the help of a computer based program the “Ellipse Circumference Calculator” downloaded from: CSG Network [CSGN, 2006]. This program involves the following standard mathematical formula for the calculation of circumference of an ellipsoid:
__
P =2 √ (a2+b
2) / 2
Where a = (CD)/2 and b = (AB)/2
Similar measurements and calculations were derived for each fetal eye separately (Fig., 1) and than average value for each fetus were obtained for statistical analysis.
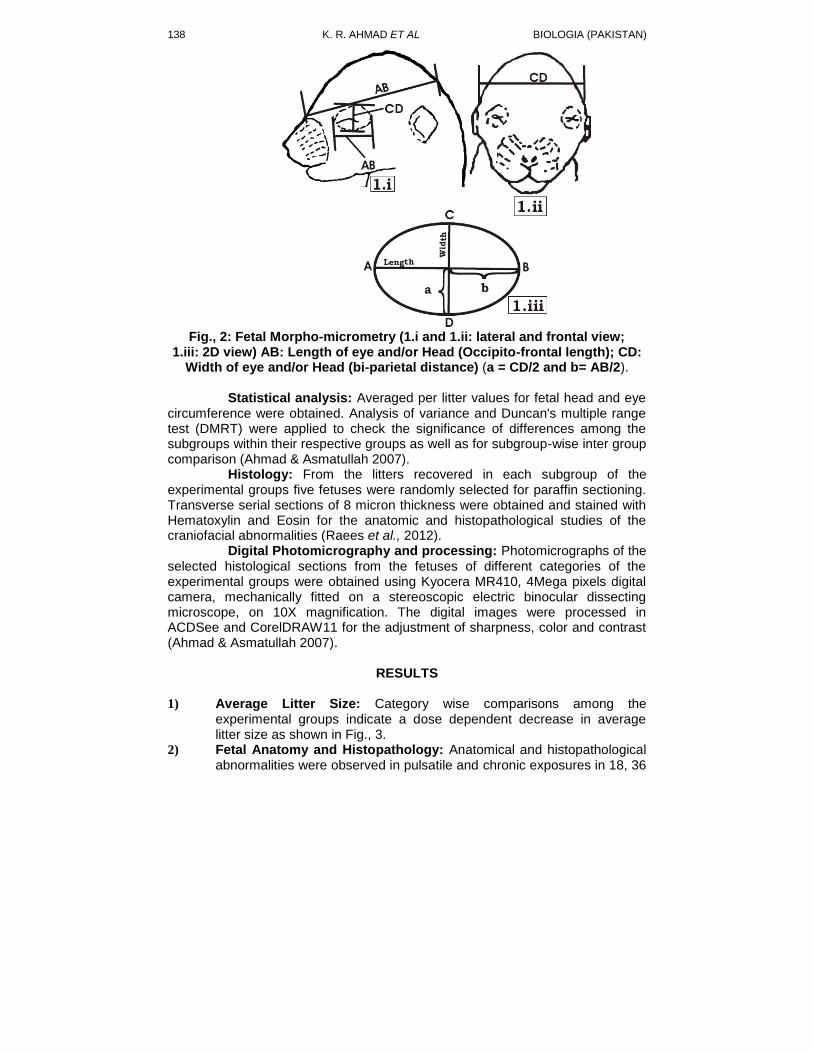
K. R. AHMAD ET AL BIOLOGIA (PAKISTAN)
138
Fig., 2: Fetal Morpho-micrometry (1.i and 1.ii: lateral and frontal view;
1.iii: 2D view) AB: Length of eye and/or Head (Occipito-frontal length); CD: Width of eye and/or Head (bi-parietal distance) (a = CD/2 and b= AB/2).
Statistical analysis: Averaged per litter values for fetal head and eye
circumference were obtained. Analysis of variance and Duncan's multiple range test (DMRT) were applied to check the significance of differences among the subgroups within their respective groups as well as for subgroup-wise inter group comparison (Ahmad & Asmatullah 2007).
Histology: From the litters recovered in each subgroup of the experimental groups five fetuses were randomly selected for paraffin sectioning. Transverse serial sections of 8 micron thickness were obtained and stained with Hematoxylin and Eosin for the anatomic and histopathological studies of the craniofacial abnormalities (Raees et al., 2012).
Digital Photomicrography and processing: Photomicrographs of the selected histological sections from the fetuses of different categories of the experimental groups were obtained using Kyocera MR410, 4Mega pixels digital camera, mechanically fitted on a stereoscopic electric binocular dissecting microscope, on 10X magnification. The digital images were processed in ACDSee and CorelDRAW11 for the adjustment of sharpness, color and contrast (Ahmad & Asmatullah 2007).
RESULTS
1) Average Litter Size: Category wise comparisons among the
experimental groups indicate a dose dependent decrease in average litter size as shown in Fig., 3.
2) Fetal Anatomy and Histopathology: Anatomical and histopathological abnormalities were observed in pulsatile and chronic exposures in 18, 36
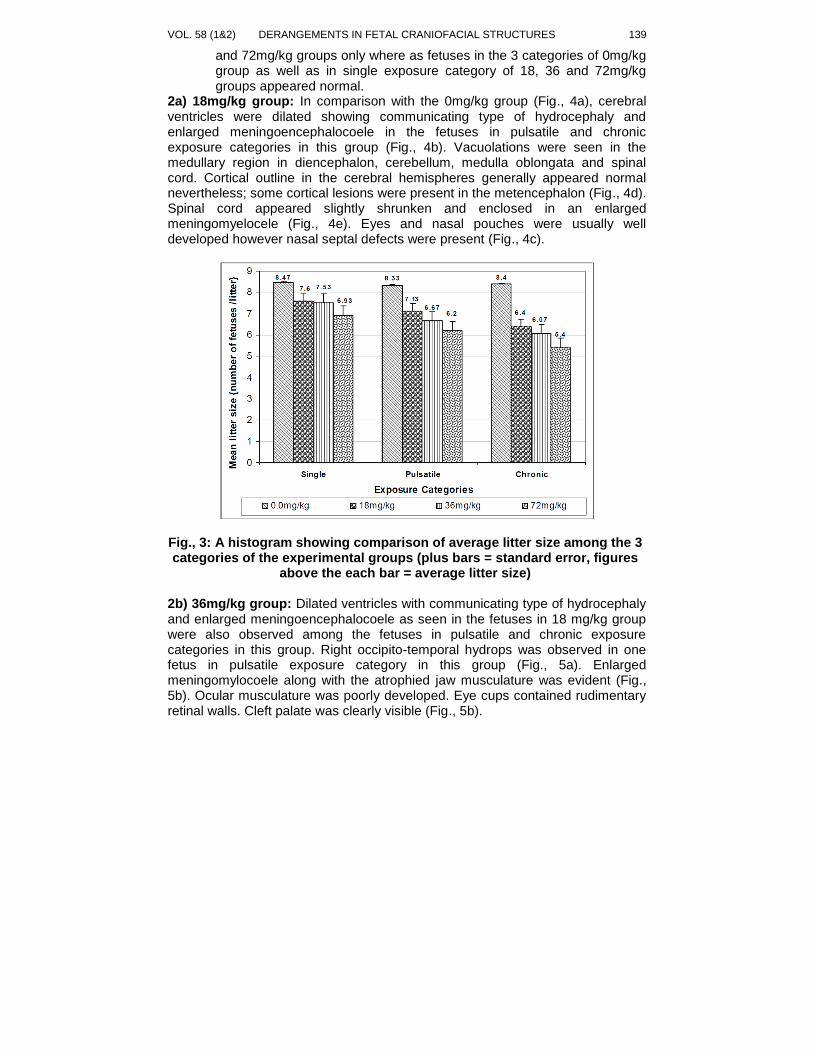
VOL. 58 (1&2) DERANGEMENTS IN FETAL CRANIOFACIAL STRUCTURES 139
and 72mg/kg groups only where as fetuses in the 3 categories of 0mg/kg group as well as in single exposure category of 18, 36 and 72mg/kg groups appeared normal.
2a) 18mg/kg group: In comparison with the 0mg/kg group (Fig., 4a), cerebral ventricles were dilated showing communicating type of hydrocephaly and enlarged meningoencephalocoele in the fetuses in pulsatile and chronic exposure categories in this group (Fig., 4b). Vacuolations were seen in the medullary region in diencephalon, cerebellum, medulla oblongata and spinal cord. Cortical outline in the cerebral hemispheres generally appeared normal nevertheless; some cortical lesions were present in the metencephalon (Fig., 4d). Spinal cord appeared slightly shrunken and enclosed in an enlarged meningomyelocele (Fig., 4e). Eyes and nasal pouches were usually well developed however nasal septal defects were present (Fig., 4c).
Fig., 3: A histogram showing comparison of average litter size among the 3 categories of the experimental groups (plus bars = standard error, figures
above the each bar = average litter size)
2b) 36mg/kg group: Dilated ventricles with communicating type of hydrocephaly and enlarged meningoencephalocoele as seen in the fetuses in 18 mg/kg group were also observed among the fetuses in pulsatile and chronic exposure categories in this group. Right occipito-temporal hydrops was observed in one fetus in pulsatile exposure category in this group (Fig., 5a). Enlarged meningomylocoele along with the atrophied jaw musculature was evident (Fig., 5b). Ocular musculature was poorly developed. Eye cups contained rudimentary retinal walls. Cleft palate was clearly visible (Fig., 5b).
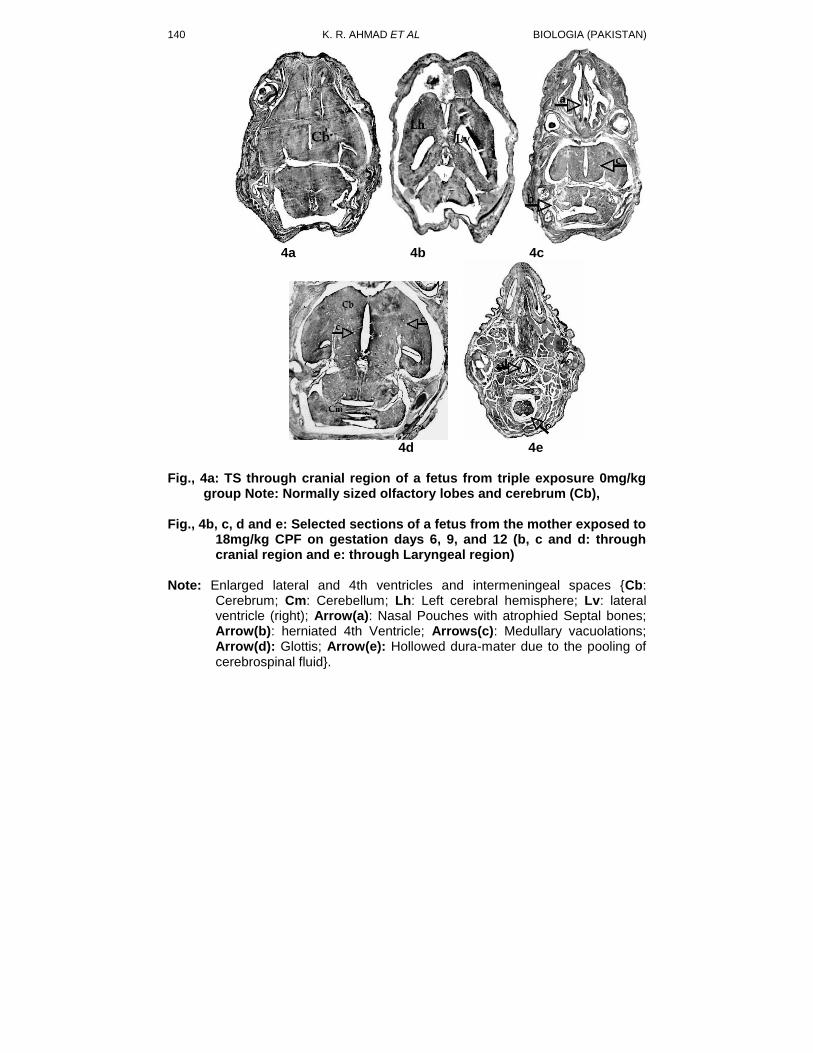
K. R. AHMAD ET AL BIOLOGIA (PAKISTAN)
140
4a 4b 4c
4d 4e
Fig., 4a: TS through cranial region of a fetus from triple exposure 0mg/kg
group Note: Normally sized olfactory lobes and cerebrum (Cb), Fig., 4b, c, d and e: Selected sections of a fetus from the mother exposed to
18mg/kg CPF on gestation days 6, 9, and 12 (b, c and d: through cranial region and e: through Laryngeal region)
Note: Enlarged lateral and 4th ventricles and intermeningeal spaces {Cb:
Cerebrum; Cm: Cerebellum; Lh: Left cerebral hemisphere; Lv: lateral ventricle (right); Arrow(a): Nasal Pouches with atrophied Septal bones; Arrow(b): herniated 4th Ventricle; Arrows(c): Medullary vacuolations; Arrow(d): Glottis; Arrow(e): Hollowed dura-mater due to the pooling of cerebrospinal fluid}.
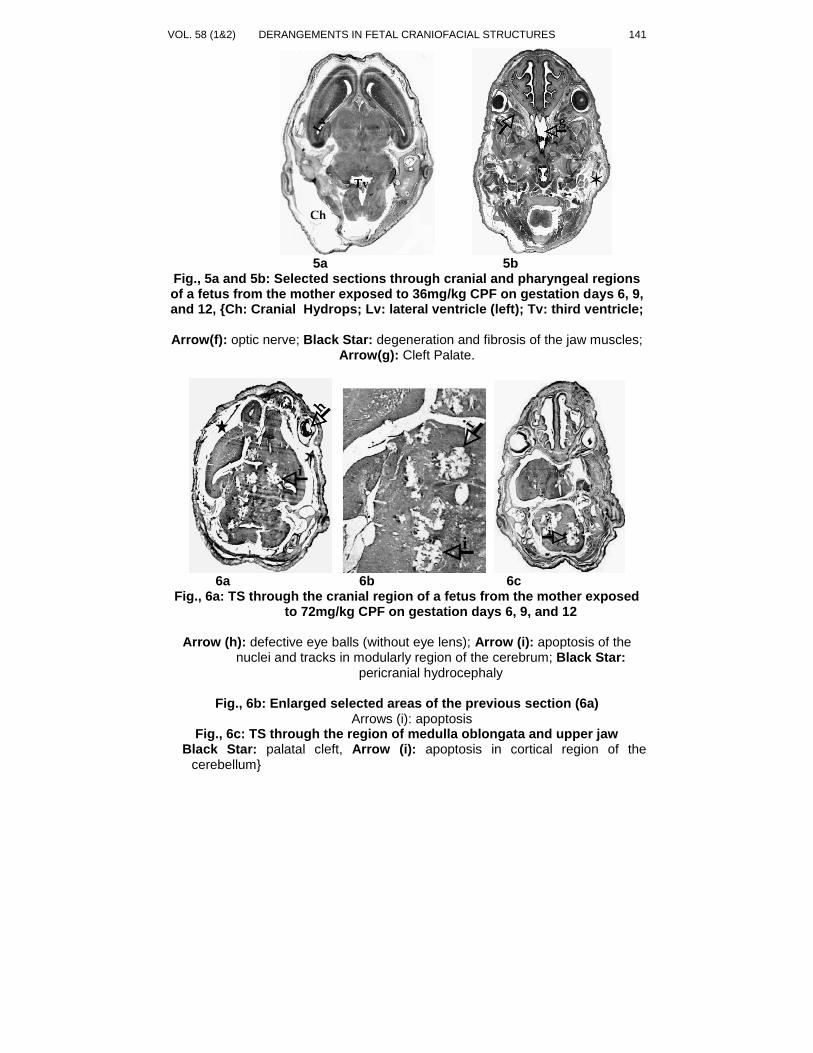
VOL. 58 (1&2) DERANGEMENTS IN FETAL CRANIOFACIAL STRUCTURES 141
5a 5b
Fig., 5a and 5b: Selected sections through cranial and pharyngeal regions of a fetus from the mother exposed to 36mg/kg CPF on gestation days 6, 9, and 12, {Ch: Cranial Hydrops; Lv: lateral ventricle (left); Tv: third ventricle;
Arrow(f): optic nerve; Black Star: degeneration and fibrosis of the jaw muscles;
Arrow(g): Cleft Palate.
6a 6b 6c Fig., 6a: TS through the cranial region of a fetus from the mother exposed
to 72mg/kg CPF on gestation days 6, 9, and 12
Arrow (h): defective eye balls (without eye lens); Arrow (i): apoptosis of the nuclei and tracks in modularly region of the cerebrum; Black Star:
pericranial hydrocephaly
Fig., 6b: Enlarged selected areas of the previous section (6a) Arrows (i): apoptosis
Fig., 6c: TS through the region of medulla oblongata and upper jaw Black Star: palatal cleft, Arrow (i): apoptosis in cortical region of the
cerebellum}
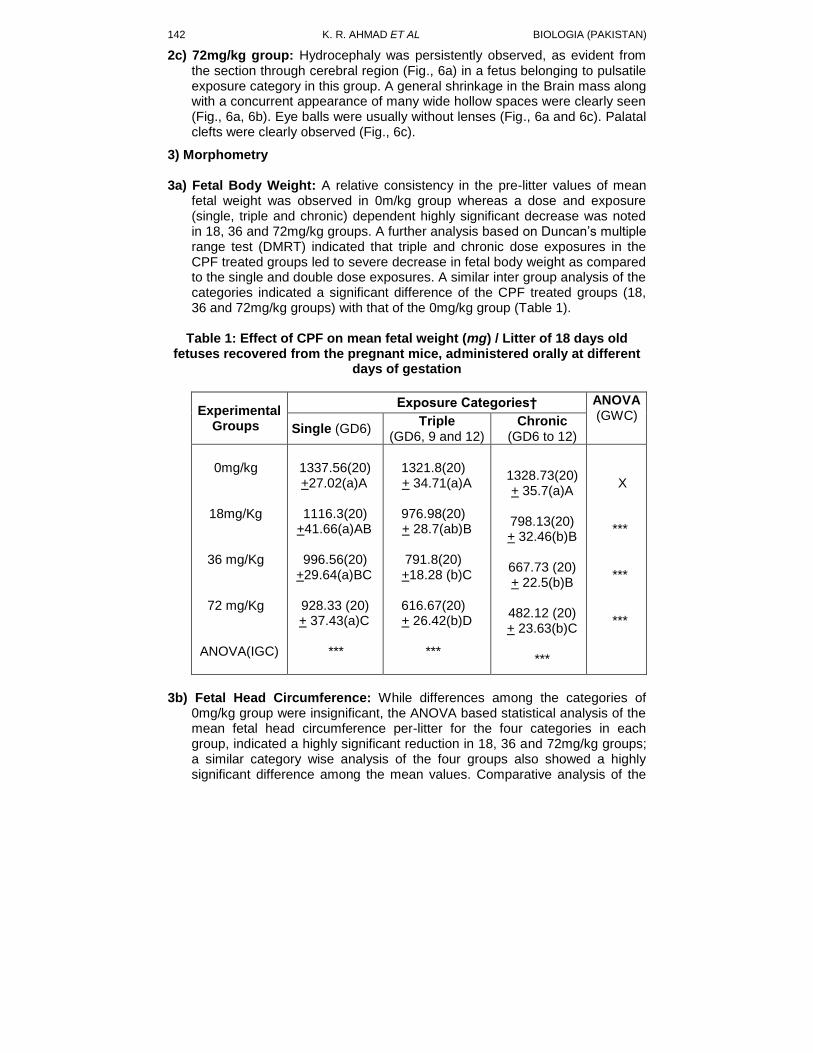
K. R. AHMAD ET AL BIOLOGIA (PAKISTAN)
142
2c) 72mg/kg group: Hydrocephaly was persistently observed, as evident from the section through cerebral region (Fig., 6a) in a fetus belonging to pulsatile exposure category in this group. A general shrinkage in the Brain mass along with a concurrent appearance of many wide hollow spaces were clearly seen (Fig., 6a, 6b). Eye balls were usually without lenses (Fig., 6a and 6c). Palatal clefts were clearly observed (Fig., 6c).
3) Morphometry 3a) Fetal Body Weight: A relative consistency in the pre-litter values of mean
fetal weight was observed in 0m/kg group whereas a dose and exposure (single, triple and chronic) dependent highly significant decrease was noted in 18, 36 and 72mg/kg groups. A further analysis based on Duncan’s multiple range test (DMRT) indicated that triple and chronic dose exposures in the CPF treated groups led to severe decrease in fetal body weight as compared to the single and double dose exposures. A similar inter group analysis of the categories indicated a significant difference of the CPF treated groups (18, 36 and 72mg/kg groups) with that of the 0mg/kg group (Table 1).
Table 1: Effect of CPF on mean fetal weight (mg) / Litter of 18 days old
fetuses recovered from the pregnant mice, administered orally at different days of gestation
Experimental Groups
Exposure Categories† ANOVA (GWC)
Single (GD6) Triple
(GD6, 9 and 12) Chronic
(GD6 to 12)
0mg/kg
18mg/Kg
36 mg/Kg
72 mg/Kg
ANOVA(IGC)
1337.56(20) +27.02(a)A
1116.3(20)
+41.66(a)AB
996.56(20) +29.64(a)BC
928.33 (20) + 37.43(a)C
***
1321.8(20) + 34.71(a)A
976.98(20) + 28.7(ab)B
791.8(20) +18.28 (b)C
616.67(20) + 26.42(b)D
***
1328.73(20) + 35.7(a)A
798.13(20) + 32.46(b)B
667.73 (20) + 22.5(b)B
482.12 (20) + 23.63(b)C
***
X
***
***
***
3b) Fetal Head Circumference: While differences among the categories of
0mg/kg group were insignificant, the ANOVA based statistical analysis of the mean fetal head circumference per-litter for the four categories in each group, indicated a highly significant reduction in 18, 36 and 72mg/kg groups; a similar category wise analysis of the four groups also showed a highly significant difference among the mean values. Comparative analysis of the
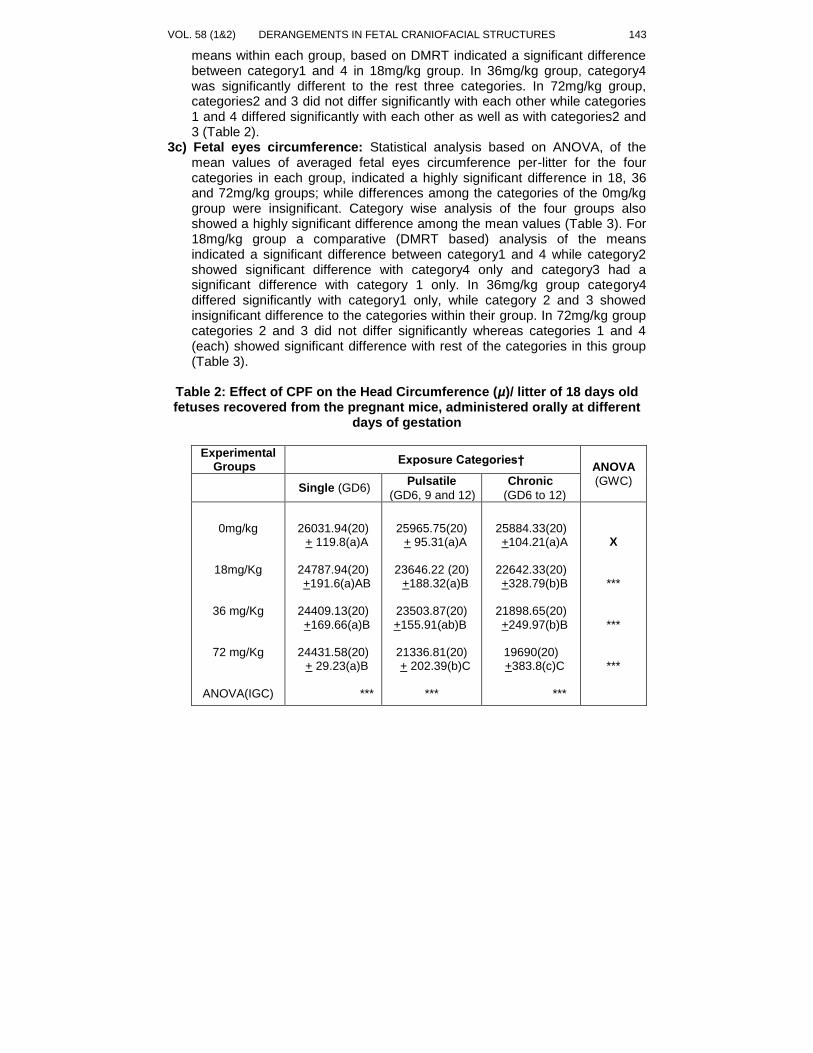
VOL. 58 (1&2) DERANGEMENTS IN FETAL CRANIOFACIAL STRUCTURES 143
means within each group, based on DMRT indicated a significant difference between category1 and 4 in 18mg/kg group. In 36mg/kg group, category4 was significantly different to the rest three categories. In 72mg/kg group, categories2 and 3 did not differ significantly with each other while categories 1 and 4 differed significantly with each other as well as with categories2 and 3 (Table 2).
3c) Fetal eyes circumference: Statistical analysis based on ANOVA, of the mean values of averaged fetal eyes circumference per-litter for the four categories in each group, indicated a highly significant difference in 18, 36 and 72mg/kg groups; while differences among the categories of the 0mg/kg group were insignificant. Category wise analysis of the four groups also showed a highly significant difference among the mean values (Table 3). For 18mg/kg group a comparative (DMRT based) analysis of the means indicated a significant difference between category1 and 4 while category2 showed significant difference with category4 only and category3 had a significant difference with category 1 only. In 36mg/kg group category4 differed significantly with category1 only, while category 2 and 3 showed insignificant difference to the categories within their group. In 72mg/kg group categories 2 and 3 did not differ significantly whereas categories 1 and 4 (each) showed significant difference with rest of the categories in this group (Table 3).
Table 2: Effect of CPF on the Head Circumference (µ)/ litter of 18 days old fetuses recovered from the pregnant mice, administered orally at different
days of gestation
Experimental Groups
Exposure Categories† ANOVA
(GWC) Single (GD6)
Pulsatile
(GD6, 9 and 12)
Chronic
(GD6 to 12)
0mg/kg
18mg/Kg
36 mg/Kg
72 mg/Kg
ANOVA(IGC)
26031.94(20)
+ 119.8(a)A
24787.94(20) +191.6(a)AB
24409.13(20) +169.66(a)B
24431.58(20)
+ 29.23(a)B
***
25965.75(20)
+ 95.31(a)A
23646.22 (20) +188.32(a)B
23503.87(20) +155.91(ab)B
21336.81(20) + 202.39(b)C
***
25884.33(20) +104.21(a)A
22642.33(20) +328.79(b)B
21898.65(20) +249.97(b)B
19690(20) +383.8(c)C
***
X
***
***
***
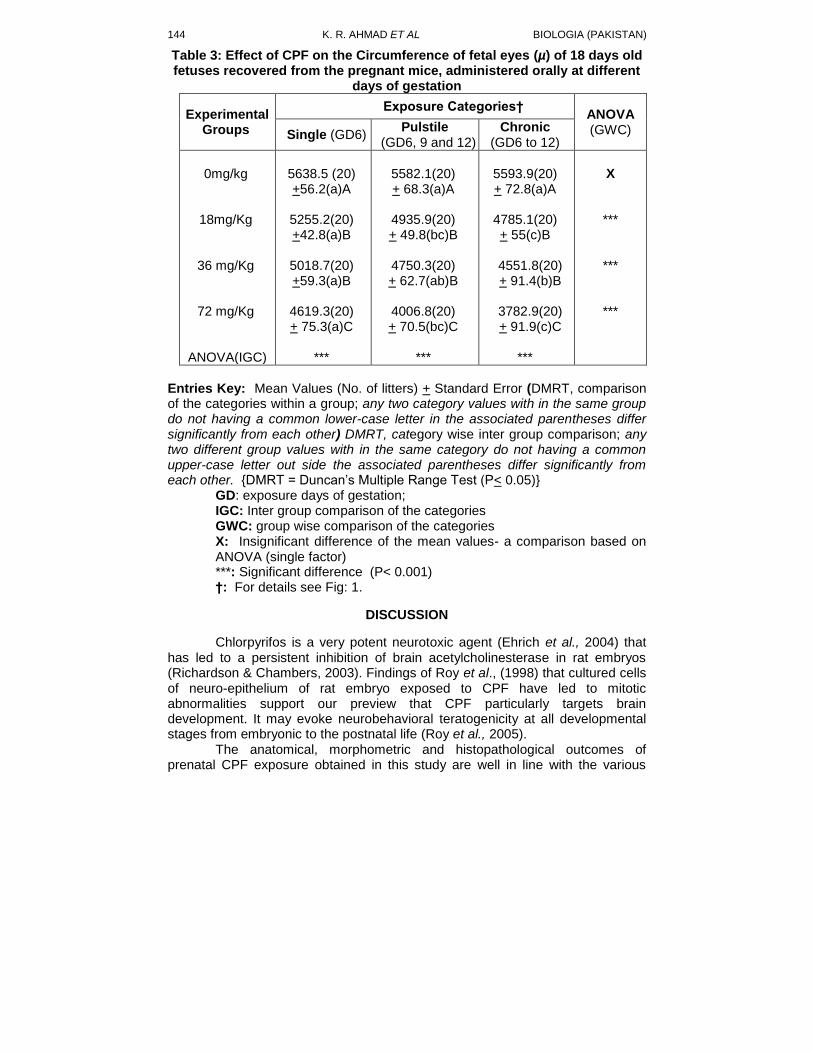
K. R. AHMAD ET AL BIOLOGIA (PAKISTAN)
144
Table 3: Effect of CPF on the Circumference of fetal eyes (µ) of 18 days old fetuses recovered from the pregnant mice, administered orally at different
days of gestation
Experimental Groups
Exposure Categories† ANOVA (GWC) Single (GD6)
Pulstile (GD6, 9 and 12)
Chronic (GD6 to 12)
0mg/kg
18mg/Kg
36 mg/Kg
72 mg/Kg
ANOVA(IGC)
5638.5 (20) +56.2(a)A
5255.2(20) +42.8(a)B
5018.7(20) +59.3(a)B
4619.3(20) + 75.3(a)C
***
5582.1(20) + 68.3(a)A
4935.9(20) + 49.8(bc)B
4750.3(20) + 62.7(ab)B
4006.8(20) + 70.5(bc)C
***
5593.9(20) + 72.8(a)A
4785.1(20) + 55(c)B
4551.8(20) + 91.4(b)B
3782.9(20) + 91.9(c)C
***
X
***
***
***
Entries Key: Mean Values (No. of litters) + Standard Error (DMRT, comparison of the categories within a group; any two category values with in the same group do not having a common lower-case letter in the associated parentheses differ significantly from each other) DMRT, category wise inter group comparison; any two different group values with in the same category do not having a common upper-case letter out side the associated parentheses differ significantly from each other. {DMRT = Duncan’s Multiple Range Test (P< 0.05)}
GD: exposure days of gestation; IGC: Inter group comparison of the categories GWC: group wise comparison of the categories X: Insignificant difference of the mean values- a comparison based on ANOVA (single factor) ***: Significant difference (P< 0.001) †: For details see Fig: 1.
DISCUSSION
Chlorpyrifos is a very potent neurotoxic agent (Ehrich et al., 2004) that has led to a persistent inhibition of brain acetylcholinesterase in rat embryos (Richardson & Chambers, 2003). Findings of Roy et al., (1998) that cultured cells of neuro-epithelium of rat embryo exposed to CPF have led to mitotic abnormalities support our preview that CPF particularly targets brain development. It may evoke neurobehavioral teratogenicity at all developmental stages from embryonic to the postnatal life (Roy et al., 2005).
The anatomical, morphometric and histopathological outcomes of prenatal CPF exposure obtained in this study are well in line with the various
VOL. 58 (1&2) DERANGEMENTS IN FETAL CRANIOFACIAL STRUCTURES 145
toxicological studies. For instance in a study on pregnant minority women in New York city it was indicated that levels of CPF in umbilical cord plasma were inversely associated with neonatal length and birth weight (Whyatt et al., 2004). The ability of CPF to interfere in the critical cellular processes such as cell division (mediated through inhibition of DNA replication), differentiation, gene expression and regulation are now well documented (Qiao et al., 2001). CPF inhibited DNA synthesis within a few hours of systemic administration to neonatal rats (Whitney et al., 1995), prolonged administration of CPF to neonatal rats elicited a shortfall in cell numbers throughout the brain, accompanied by delayed deterioration of synaptic signaling process (Slotkin, 1999). CPF also interfere in the development of axonal projections thus logically affecting cell differentiation (Das & Barone, 1999; Li & Casida, 1998). The most critical effects involve the ability of CPF to interfere with the functioning of nuclear transcription factors that control cell fate, including their expression, phosphorylation and ability to bind to their DNA promoter recognition sites (Crumpton et al., 2000; Garcia et al., 2001). In this context Buratti et al., (2006) indicated that organophosphorothionate pesticides such as CPF induced neuro-developmental effects may be due to in situ bioactivation by fetal enzymes. Caughlan et al., (2004) had pointed out that, independently to its proven neurotoxic effects mediated through inhibition of cholinesterase, CPF exposure may lead to apoptosis in the nervous system. In the same context Slotkin & Seidler, (2007) have pointed out that CPF elicit major transcriptional changes in genes involved in neural cell growth along with development of glia and myelin, transcriptional factors involved in neural cell differentiation, cAMP-related cell signaling, oxidative stress, excitotoxicity and apoptosis. Seen together with these previous studies the vacuolations in the developing brains seen in the present study are the signs of the neuroglial cells apoptosis (Fig., 3b) and medullary wide hollow spaces contained in a shrunken brain mass are the indications of gross apoptosis in the differentiating cerebral nuclei and tracks (Fig., 5a, 5b).
Because of the dearth of available literature particularly on the fetal cranio-facial anatomy and histopathology the abnormalities observed in this study are not comparable with any previous study. However these abnormalities mainly seem to be the logical outcomes of the above sited broad range of developmental toxic effects of CPF. Thus on the basis of the results obtained in this study it is concluded that the developmental exposure of CPF, along with several neuro-histo-pathological changes, leads to a variety of defects in cranio-facial anatomy; while the general growth retardation in the fetuses under CPF exposure seams to be mainly responsible for significantly decreased fetal weight along with decreased optic and cranial circumferences.
REFERENCES
Ahmad, K. R. & Asmatullah. 2007. Teratological effects of chlorpyrifos in mice.
Iran. J. Toxicol., 1(2): 91-99. Buratti, F. M., Leoni, C. & Testai, E. 2006. Foetal and adult human CYP3A
isoforms in the bioactivation of organophosphorothionate insecticides. Toxicol. Lett., 167: 245- 255.
K. R. AHMAD ET AL BIOLOGIA (PAKISTAN)
146
Caughlan, A., Newhouse, K. & Xia, Z. 2004. Chlorpyrifos induces apoptosis in rat cortical neurons that is regulated by a balance between p38 and ERK/JNK MAP kinases. Toxicol. Sci.,78(1): 125-134.
Cometa, M. F., Buratti, F. M., Fortuna, S., Lorenzini, P., Volpe, M. T., Parisi, L., Testai, E. & Meneguz, A. 2007. Cholinesterase inhibition and alterations of hepatic metabolism by oral acute and repeated chlorpyrifos administration to mice. Toxicology, 234(1-2): 90-102.
Crumpton, T. L., Seidler, F. J. & Slotkin, T. A. 2000. Developmental neurotoxicity of chlorpyrifos in vivo and in vitro: effects on nuclear transcription factor involved in cell replication and differentiation. Brain Res., 857: 87- 98.
CSGN (2006). http://www.csgnetwork.com/glossaryc.html#calculator Das, K. P. & Barone, S. 1999. Neuronal differentiation in PC12 cells is inhibited
by chlorpyrifos and itsmetabolites: is acetylcholinesterase inhibition the site of action? Toxicol. Appl. Pharmacol.,160: 217-230.
Dowagro (2006). http://www.dowagro.com/chlorp/ap/about/index.htm Ehrich, M., Hancock, S., Ward. D., Holladay. S., Pung. T., Flory, L., Hinckley, J.
& Jortner, B. S. 2004. Neurologic and immunologic effects of exposure to corticosterone, chlorpyrifos, and multiple doses of tri-ortho-tolyl phosphate over a 28-day period in rats. J. Toxicol. Environ. Health Part A., 67(5): 431-457.
Farag, A. T., El-Okazy, A. M. & El-Aswed, A. F. 2003. Developmental toxicity study of chlorpyrifos in rats. Reprod Toxicol., 17(2): 203-208.
Garcia, S. J., Seidler, F. J., Crumpton, T. L. & Slotkin, T. A. 2001. Does the developmental neurotoxicity of chlorpyrifos involve glial targets? Macromolecule synthesis, adenylyl cyclase signaling, nuclear transcription factors, and formation of reactive oxygen in C6 glioma cells. Brain Res., 891: 54- 68.
Guizzetti, M., Pathak, S., Giordano. G & Costa, L. G. 2005. Effect of organophosphorus insecticides and their metabolites on astroglial cell proliferation. Toxicology, 215(3): 182-90.
Li, W. W. & Casida, J. E. 1998. Organophosphorus neuropathy target esterase inhibitors selectively block outgrowth of neurite-like and cell processes in cultured cells. Toxicol. Lett., 98: 139-46.
Qiao, D., Seidler, F. J. & Slotkin, T. A. 2001. Developmental neurotoxicity of chlorpyrifos modeled in vitro: comparative effects of metabolites and other cholinesterase inhibitors on DNA synthesis in PC12 and C6 cells. Environ. Health Perspect., 109: 909-913.
Raees. K., Ullah, A., Abbas, T., Mukhtar, M. K., Arshad, M., Khan, S. Y., Tahir, H. M. & Ahmad, K. R. 2012. Fetal neurohistopathology of chloropyrifos in mice. Afr. J. Biotechnol., 11(29): 7565-7569
Richardson, J. & Chambers, J. 2003. Effects of gestational exposure to chlorpyrifos on postnatal central and peripheral cholinergic neurochemistry. J. Toxicol. Environ. Health Part A, 66(3): 275-289.
Roy, T. S., Andrews, J. E., Seidler, F. J. & Slotkin, T. A. 1998. Chlorpyrifos elicits mitotic abnormalities and apoptosis in neuroepithelium of cultured rat embryos. Teratology, 58: 62-68.
Roy, T. S., Sharma, V., Seidler, F. J. & Slotkin, T. A. 2005. Quantitative morphological assessment reveals neuronal and glial deficits in
VOL. 58 (1&2) DERANGEMENTS IN FETAL CRANIOFACIAL STRUCTURES 147
hippocampus after a brief subtoxic exposure to chlorpyrifos in neonatal rats. Dev. Brain Res., 155(1): 71-80.
Slotkin, T. A. & Seidler, F. J. 2007. Comparative developmental neurotoxicity of organophosphates in vivo: Transcriptional responses of pathways for brain cell development, cell signaling, cytotoxicity and neurotransmitter systems. Brain Res. Bull., 72(4-6): 232-274.
Slotkin, T. A. 1999. Developmental cholinotoxicants: nicotine and chlorpyrifos. Environ. Health Perspect., 107:71-80.
Tian, Y., Ishikawa, H., Yamaguchi, T., Yamauchi, T. & Yokoyama. K. 2005. Teratogenicity and developmental toxicity of chlorpyrifos. Maternal exposure during organogenesis in mice. Rep. Toxicol., 20(2): 267-270.
Timchalk, C., Kousba, A. A. & Poet, T. S. 2007. An age-dependent physiologically based pharmacokinetic/pharmacodynamic model for the organophosphorus insecticide chlorpyrifos in the preweanling rat. Toxicol Sci., 98(2): 348-365.
Uggini, G. K., Patel, P. V. & Balakrishnan. S. 2012. Embryotoxic and Teratogenic Effects of Pesticides in Chick Embryos: A Comparative Study Using Two Commercial Formulations. Environ. Toxicol., 27(3): 166-174.
US. EPA. (2000). www.epa.gov/pesticide/ops/chlorpyrifos/summary. Html. Whitney, K. D., Seidler, F. J. & Slotkin, T. A. 1995. Developmental neurotoxicity
of chlorpyrifos: cellular mechanisms. Toxicol. Appl. Pharmacol., 134: 53–62.
Whyatt, R. M., Rauh, V., Barr, D. B., Camann, D. E., Andrews, H. F., Garfinkel, R., Hoepner, L. A., Diaz, D., Dietrich, J., Reyes, A., Tang, D., Kinney, P. L. & Perera, F. P. 2004. Prenatal insecticide exposures and birth weight and length among an urban minority cohort. Environ. Health Perspect., 112: 1125-1132.
BIOLOGIA (PAKISTAN) 2012, 58 (1&2), 149-154 PK ISSN 0006 - 3096
*Corresponding author: [email protected]
Paleoecology of Hipparion sp. (Equidae-Hipparionini) from
latest Miocene of Padhri, northern Pakistan
*MUHAMMAD TARIQ1, & NUSRAT JAHAN
2
1,2Department of Zoology, Government College University, Lahore, Pakistan
ABSTRACT
The broad geo-chronologic ranges with dietary and habitat preferences of
Hipparion sp. (in hipparion remains) can provide significant biostratigraphic and paleoecological information. Paleoecology of Hipparion sp. (Equidae-Hipparionini), an extinct Hipparionine horse from Padhri deposits, has been investigated applying biometric method. The hypsodonty index for Hipparion sp. is 3.43 that categorizes it within the
dietary spectrums of mixed feeders to hypsodont grazers. The ecomorphic information of Hipparion sp. depicts the change from closed to semi-closed vegetation followed by open one, humid to warm and seasonal paleoclimatic regimes leading to reconstruction of paleoecological mosaics ranging from closed woodlands to wooded-grassy savannas and grasslands. Key words: Siwaliks, hypsodonty, late Miocene, Hipparion, biostratigraphy, paleoecology.
INTRODUCTION
The broad geo-chronologic ranges with diverse dietary and habitat
preferences of Hipparion remains can provide significant biostratigraphic and paleoecological information. The studied material attributed to the genus Hipparion was collected from Padhri, a locality near village Padhri, district Jhelum (Fig. 1). The Hipparion chronologically ranges from late Miocene to early
Pliocene. The Padhri village is located (32 52 009 N: 73 18 297 E) at 57 km south west of the Jhelum city in Potwar Siwaliks of Pakistan (Bhatti et al., 2012). Topography of the locality displays water channels, paleosols, levees, ponds and swamps with different frequency of occurrence (Barry et al., 2002). The mammalian remains have been recovered from the locality situated at the southeast of the Padhri village (Fig. 1). The Padhri outcrops are part of Hasnot composite belonging to upper part of Dhok Pathan Formation (late Miocene to early Pliocene) of the Middle Siwaliks. This chronology is consistent with Late Turolian age (ca. MN 13) of Europe, ranging from 7 to 5 Ma (Barry et al., 2002; Bhatti et al., 2012). The Dhok Pathan Formation is comprised of sand stones alternating with clay with minor layers of conglomerates in lower while more thick layer of conglomerates along with red brown clay and sandstone in upper part (Badgley et al., 2005). The lithologic setting is comprised of well-cemented, light gray sandstone, orange red clay stone and section of small conglomerates in the upper horizon. The fluvial system of fossiliferous deposits probably led to the
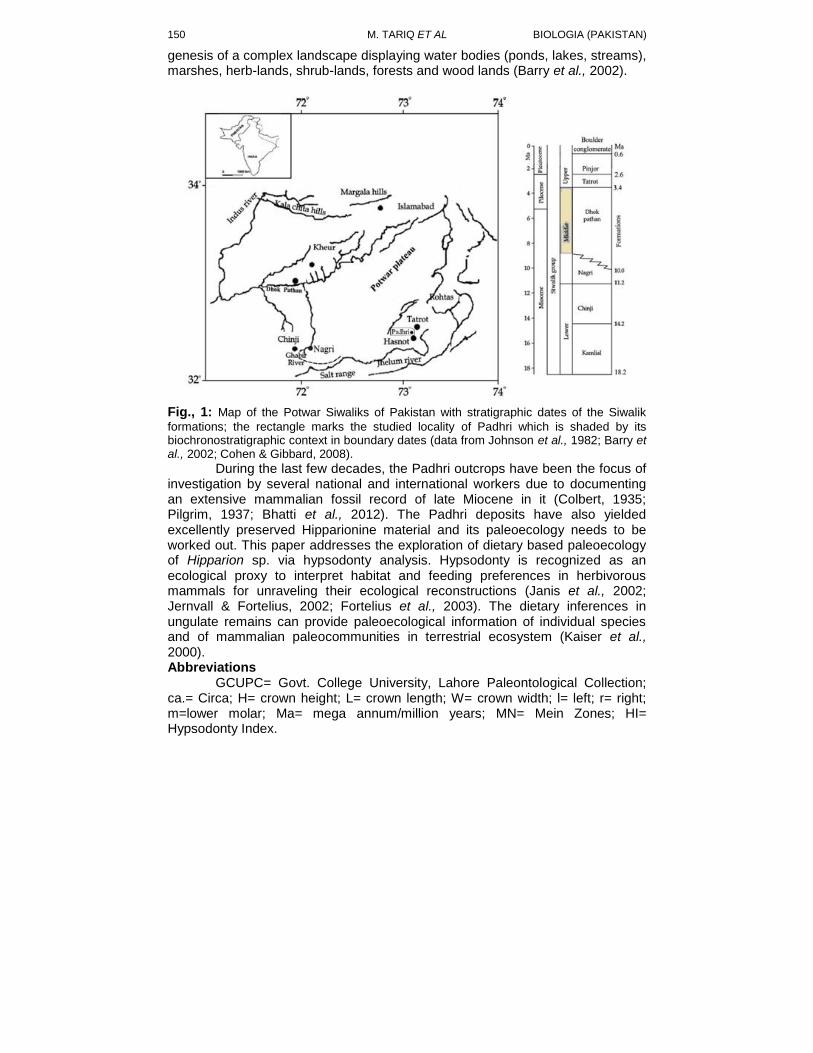
M. TARIQ ET AL BIOLOGIA (PAKISTAN) 150
genesis of a complex landscape displaying water bodies (ponds, lakes, streams), marshes, herb-lands, shrub-lands, forests and wood lands (Barry et al., 2002).
Fig., 1: Map of the Potwar Siwaliks of Pakistan with stratigraphic dates of the Siwalik
formations; the rectangle marks the studied locality of Padhri which is shaded by its biochronostratigraphic context in boundary dates (data from Johnson et al., 1982; Barry et al., 2002; Cohen & Gibbard, 2008).
During the last few decades, the Padhri outcrops have been the focus of investigation by several national and international workers due to documenting an extensive mammalian fossil record of late Miocene in it (Colbert, 1935; Pilgrim, 1937; Bhatti et al., 2012). The Padhri deposits have also yielded excellently preserved Hipparionine material and its paleoecology needs to be worked out. This paper addresses the exploration of dietary based paleoecology of Hipparion sp. via hypsodonty analysis. Hypsodonty is recognized as an ecological proxy to interpret habitat and feeding preferences in herbivorous mammals for unraveling their ecological reconstructions (Janis et al., 2002; Jernvall & Fortelius, 2002; Fortelius et al., 2003). The dietary inferences in ungulate remains can provide paleoecological information of individual species and of mammalian paleocommunities in terrestrial ecosystem (Kaiser et al., 2000). Abbreviations
GCUPC= Govt. College University, Lahore Paleontological Collection; ca.= Circa; H= crown height; L= crown length; W= crown width; l= left; r= right; m=lower molar; Ma= mega annum/million years; MN= Mein Zones; HI= Hypsodonty Index.
VOL. 58 (1&2) PALEOECOLOGY OF HIPPARION SP. 151
MATERIALS AND METHODS
Mammalian remains were collected from Padhri deposits as a result of extensive field work. Four taxonomically resolved specimens of Hipparion sp. were selected from the collected material, for investigation. Metrics of specimens such as dental crown height (H), length (L) and width (W) were calculated (in mm) with the help of vernier callipers. Ecomorphic (diet and habitat etc.) characterization of Hipparion sp. was done on the basis of degrees of Hypsodonty. The HI was calculated by considering metrics of unworn m2s. We followed HI scheme of Janis (1988), Damuth & Janis (2011) where HI m2 tooth crown height/m2 tooth crown width. Hypsodonty based dietary niche characterization was considered as baseline for exploration of paleoecology of Hipparion sp. The HI for Hipparion sp. and its extant analogues versus body weight are represented in bivariate plot (Fig., 2). Catalogue numbers along with tooth occlusal height and width measurements are listed in the Table 1.
RESULTS AND DISCUSSION
Hypsodonty index shows that Hipparion sp. is hypsodont. The
Hypsodonty Index (HI) for Hipparion sp. calculated here is 3.10 (n=4). The purpose of hypsodonty analysis is to evaluate the metrical data by comparing with extant analogues for drawing ecomorphic information. Considering Janis (1988), Damuth & Janis (2011) hypsodonty interpretations, Hipparion sp. may also be categorized within the dietary spectrums ranging from both types of mixed feeders (MFC, MFO) to grazers. Ecomorphology of studied taxon may be comparable to a living Boselaphine; Boselaphus tragocamelus which is mixed feeder in closed habitat (MFC). Hipparion sp. also shows affinities with a living mixed feeder in open habitat (MFO); Budorcas taxicolor (Bovidae-Rupicaprini).
Table 1: Metrics (in mm) of Hipparion sp. recovered from Padhri
Catalogue # Description H W L H/W Index
GCUPC 1125/09
rm2 55.11 15.56 31.24 3.54
GCUPC 1117/09
lm2 53.35 16.09 29.02 3.31
GCUPC 1104/09
lm2 55.22 15.99 28.90 3.45
GCUPC 1114/09
lm2 48.84 14.20 25.19 3.43
Mean Hypsodonty Index: 3.43
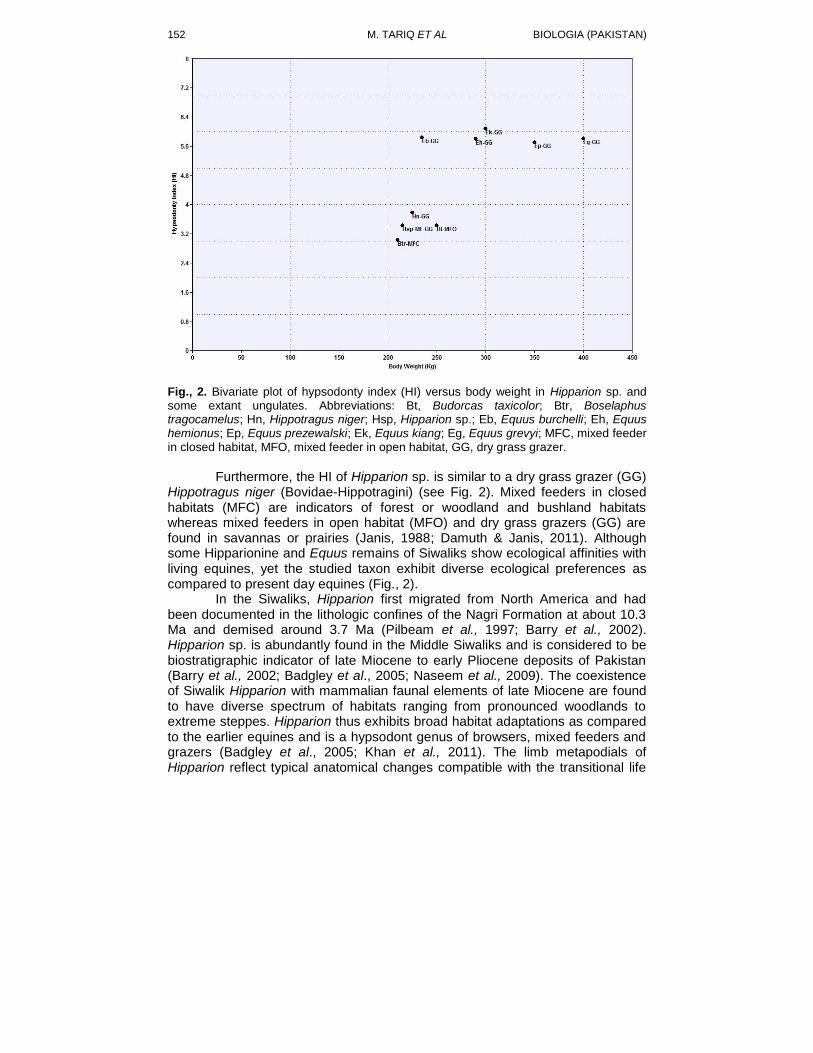
M. TARIQ ET AL BIOLOGIA (PAKISTAN) 152
Fig., 2. Bivariate plot of hypsodonty index (HI) versus body weight in Hipparion sp. and some extant ungulates. Abbreviations: Bt, Budorcas taxicolor; Btr, Boselaphus tragocamelus; Hn, Hippotragus niger; Hsp, Hipparion sp.; Eb, Equus burchelli; Eh, Equus hemionus; Ep, Equus prezewalski; Ek, Equus kiang; Eg, Equus grevyi; MFC, mixed feeder in closed habitat, MFO, mixed feeder in open habitat, GG, dry grass grazer.
Furthermore, the HI of Hipparion sp. is similar to a dry grass grazer (GG)
Hippotragus niger (Bovidae-Hippotragini) (see Fig. 2). Mixed feeders in closed habitats (MFC) are indicators of forest or woodland and bushland habitats whereas mixed feeders in open habitat (MFO) and dry grass grazers (GG) are found in savannas or prairies (Janis, 1988; Damuth & Janis, 2011). Although some Hipparionine and Equus remains of Siwaliks show ecological affinities with living equines, yet the studied taxon exhibit diverse ecological preferences as compared to present day equines (Fig., 2).
In the Siwaliks, Hipparion first migrated from North America and had been documented in the lithologic confines of the Nagri Formation at about 10.3 Ma and demised around 3.7 Ma (Pilbeam et al., 1997; Barry et al., 2002). Hipparion sp. is abundantly found in the Middle Siwaliks and is considered to be biostratigraphic indicator of late Miocene to early Pliocene deposits of Pakistan (Barry et al., 2002; Badgley et al., 2005; Naseem et al., 2009). The coexistence of Siwalik Hipparion with mammalian faunal elements of late Miocene are found to have diverse spectrum of habitats ranging from pronounced woodlands to extreme steppes. Hipparion thus exhibits broad habitat adaptations as compared to the earlier equines and is a hypsodont genus of browsers, mixed feeders and grazers (Badgley et al., 2005; Khan et al., 2011). The limb metapodials of Hipparion reflect typical anatomical changes compatible with the transitional life
VOL. 58 (1&2) PALEOECOLOGY OF HIPPARION SP. 153
mainly from forest to steppe (Khan et al., 2011). Hipparion preferred more open and drier mosaics of the vegetation as revealed by the most enriched carbon and oxygen isotopic values of its specimens at latest Miocene (Badgley et al., 2005; Nelson, 2005). Conclusions
The Hipparion sp. is biostratigraphic indicator of late Miocene to early Pliocene (10.3-3.7 Ma). The ecomorphic information (diet, habitat etc.) of the studied taxon depicts the change from closed vegetation to semi-closed vegetation followed by open one, humid to warm and seasonal paleoclimatic regimes leading to evolution of paleoecological mosaics ranging from closed woodlands to wooded-grassy savannas and grasslands. Its diverse dietary and habitat adaptations reveal varying ecological preferences as compared to of present day equines. Acknowledgments
We are grateful to Raja Jan and Raja Tahir Mehmood from Dhok Mori Mothan (Padhri) for immense help in field work and hospitality during our stay at Padhri. This study was funded by Higher Education Commission (HEC) of Pakistan.
REFERENCES
Badgley, C., Nelson, S., Barry, J. C., Behrensmeyer, A. K. & Cerling, T.E., 2005. In Interpreting the Past: Essays on Human, Primate, and Mammal Evolution, eds Lieberman DE, Smith RH, Kelley J (Brill, Boston), pp 29–46.
Barry, J., Morgan, M., Flynn, L., Pilbeam, D., Behrensmeyer, A. K., Raza, S., Khan, I., Badgely, C., Hicks, J. & Kelley, J., 2002. Faunal and Environmental change in the Late Miocene Siwaliks of Northern Pakistan. Paleobiology., 28: 1-72.
Bhatti, Z. H., Khan, M. A., Akhtar, M., Khan, A. M., Ghaffar, A., Iqbal, M. & Siddiq, M. K., 2012. Giraffa punjabiensis (Giraffidae: Mammalia) from Middle Siwaliks of Pakistan. Pakistan. J. Zool., 44 (6): 1689-1695.
Cohen, K. M. & Gibbard, P. L., 2008. Global chronostratigraphical correlation table for the last 2.7 million years. Episodes, 31: 243-247.
Colbert, E. H., 1935. Siwalik mammals in the American Museum of Natural History.Trans. Am. phil. Soc., n.s., 26: 1-401.
Damuth, J. & Janis, C. M., 2011. On the relationship between hypsodonty and feeding ecology in ungulate mammals, and its utility in palaeoecology. Biol. Rev., Camb. Phill. Soc., 86: 733-758.
Fortelius, M., Eronen, J., Liu, L. P., Pushkina, D., Tesakov, A., Vislobokova, I. & Zhang, Z. Q., 2003. tinental scale hypsodonty patterns, climatic paleobiogeography and dispersal of Eurasian Neogene large mammal herbivores. In: Reumer JWF, Wessels W, editors. Distribution and migration of tertiary mammals in Eurasia. Deinsea., 10:1–11.
Janis, C. M. & Fortelius, M., 1988. On the means whereby mammals achieve increased functional durability of their dentitions with special reference to limiting factors. Biol. Rev. Camb. Phill. Soc., 63:197- 230.
M. TARIQ ET AL BIOLOGIA (PAKISTAN) 154
Janis, C. M., Damuth, J. & Theodor, J. M., 2002. The origins and evolution of the North American grassland biome: the story from the hoofed mammals. Palaeogeogr. Palaeoclimatol. Palaeoecol., 177: 183–198.
Jernvall, J. & Fortelius, M., 2002. Common mammals drive the evolutionary increase of hypsodonty in the Neogene. Nature., 417: 538-540.
Johnson, G. D., Zeitler, P., Naeser, C. W., Johnson, N. M., Summers, D. M., Frost, C. D., Opdyke, N. D. & Tahirkheli, R. A. K., 1982. The occurrence and fission-track ages of Late Neogene and Quaternary volcanic sediments, Siwalik group, northern. Pakistan. Palaeogeogr. Palaeoclimat. Palaeoecol., 37: 63-93.
Kaiser, T. M., Solounias, N., Fortelius, M., Bernor, R. L. & Schrenk, F., 2000. Tooth mesowear analysis on Hippotherium primigenium from the Vallesian Dinotheriensande (Germany)-A blind test study. Carolinea., 58: 103-114.
Khan, M. A., Manzoor, F., Ali, M., Bhatti, Z. H. & Akhtar, M., 2011. A new collection of hipparionine from the type locality of the Dhok Pathan Formation of the Middle Siwaliks. J. Anim. Pl. Sci., 21: 83-89.
Naseem, L., Khan, M. A., Akhtar, M., Iqbal, M., Khan, A. M., & Farooq, U., 2009. Hipparion from the Nagri type locality of the Nagri Formation, Middle Siwaliks, Pakistan: Systematics. J. Natural. Sci., 7(1-2): 18-29.
Nelson, S. V., 2005. Paleoseasonality inferred from equid teeth and intra-tooth isotopic variability. Paleogeogr. Paleoclimatol. Paleoecol., 222:122–144.
Pilbeam, D., Morgan, M., Barry, J. C., & Flynn, L. 1997. Eurpean MN units and the Siwalik faunal sequence of Pakistan. Pp. 96-105 in R. L. Bernor, V. Fahlbusch, and H-W. Mittmann, eds. The evolution of Western Eurasian Neogene mammal faunas. Columbia University Press., New York.
Pilgrim, G.E., 1937. Siwalik antelopes and oxen in the American Museum of Natural History. Bull. Am. Mus. nat. Hist., 72: 729-874.
BIOLOGIA (PAKISTAN) 2012, 58 (1&2), 155-160 PK ISSN 0006 - 3096
*Corresponding author: [email protected]
Epidemiological, serological and molecular analysis of
hepatitis C virus infection in different risk groups
ASIF MEHMOOD QURESHI1,
*SAIRA AZMET
2, MARIUM FAIZ
3 & FAHEEM
NAWAZ4
1,2,4
Zoology Department Govt. College of Science College, Wahdat Road Lahore. 3INMOL Hospital Lahore.
ABSTRACT
Hepatitis C is an infectious disease of liver caused by the hepatitis C virus (HCV). This study was to examine the epidemiological, serological and molecular analysis of hepatitis C virus infection in different risk groups. Fifty patients were selected in which thirty two were females and eighteen were males. All patients were tested by different methods such as immunochromatographic method, ELISA and PCR. Among them, 23 females (71%) & 9 males (50%) were HCV infected. It was also determined that patients at the age of 31-40 years of age group had high risk of HCV infection. Keywords: HCV Infections, Epidemiological, Serological, Molecular Analysis.
INTRODUCTION
Hepatitis is an inflammation of the liver, most commonly caused by a
viral infection. There are five main types of hepatitis viruse, referred to as types A, B, C, D and E (Wasley & Alter, 2000). Hepatitis C is an infectious disease affecting the liver, caused by the hepatitis C virus (HCV) (Sherris, 2004).
The
infection is often asymptomatic, however, once established, chronic infection can progress to scarring of the liver (fibrosis). Acute hepatitis C refers to HCV infection during the first 6 months (Kamal., 2008). Symptoms of acute hepatitis C infection include decreased appetite, fatigue, abdominal pain, jaundice, itching, and flu-like symptoms (Caruntu & Benea, 2006). Chronic hepatitis C is defined as infection with the hepatitis C virus persisting for more than six months. Generalized signs and symptoms associated with chronic hepatitis C include fatigue, flu-like symptoms, joint pains, itching, sleep disturbances, appetite changes, nausea and depression. It is estimated that Hepatitis C has infected nearly 200 million people worldwide, and infects 3 -4 million more people per year. It is currently a leading cause of cirrhosis, a common cause of hepato-cellular carcinoma, and as a result of these conditions, it is the leading reason for liver transplantation. The Hepatitis C Virus particle consists of core of genetic material (RNA), surrounded by an icosahedral protective shell of protein which is further encased in a lipid (fatty) envelope of cellular origin. Two viral envelope glycoprotiens E1 and E2 are embedded in the lipid envelope (DeBeeck & Dubuisson, 2003).
The viral genomic RNA is single- stranded, approximately 9379 nucleotides and is further divided into the core, envelope and along with at least four nonstructural (NS) proteins. This property of the virus particularly indicates its relationship to flaviviridae (Family of HCV). Structural proteins are coded by
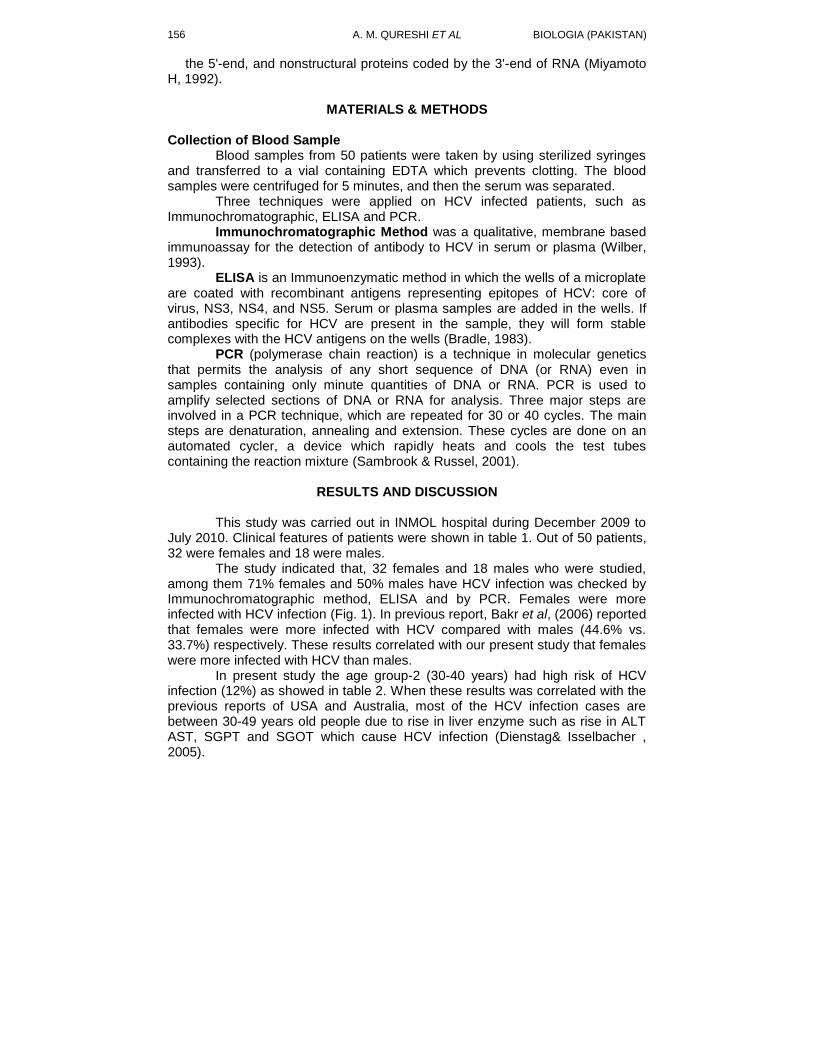
A. M. QURESHI ET AL BIOLOGIA (PAKISTAN)
156
the 5'-end, and nonstructural proteins coded by the 3'-end of RNA (Miyamoto H, 1992).
MATERIALS & METHODS
Collection of Blood Sample
Blood samples from 50 patients were taken by using sterilized syringes and transferred to a vial containing EDTA which prevents clotting. The blood samples were centrifuged for 5 minutes, and then the serum was separated.
Three techniques were applied on HCV infected patients, such as Immunochromatographic, ELISA and PCR.
Immunochromatographic Method was a qualitative, membrane based immunoassay for the detection of antibody to HCV in serum or plasma (Wilber, 1993).
ELISA is an Immunoenzymatic method in which the wells of a microplate are coated with recombinant antigens representing epitopes of HCV: core of virus, NS3, NS4, and NS5. Serum or plasma samples are added in the wells. If antibodies specific for HCV are present in the sample, they will form stable complexes with the HCV antigens on the wells (Bradle, 1983).
PCR (polymerase chain reaction) is a technique in molecular genetics that permits the analysis of any short sequence of DNA (or RNA) even in samples containing only minute quantities of DNA or RNA. PCR is used to amplify selected sections of DNA or RNA for analysis. Three major steps are involved in a PCR technique, which are repeated for 30 or 40 cycles. The main steps are denaturation, annealing and extension. These cycles are done on an automated cycler, a device which rapidly heats and cools the test tubes containing the reaction mixture (Sambrook & Russel, 2001).
RESULTS AND DISCUSSION
This study was carried out in INMOL hospital during December 2009 to
July 2010. Clinical features of patients were shown in table 1. Out of 50 patients, 32 were females and 18 were males.
The study indicated that, 32 females and 18 males who were studied, among them 71% females and 50% males have HCV infection was checked by Immunochromatographic method, ELISA and by PCR. Females were more infected with HCV infection (Fig. 1). In previous report, Bakr et al, (2006) reported that females were more infected with HCV compared with males (44.6% vs. 33.7%) respectively. These results correlated with our present study that females were more infected with HCV than males.
In present study the age group-2 (30-40 years) had high risk of HCV infection (12%) as showed in table 2. When these results was correlated with the previous reports of USA and Australia, most of the HCV infection cases are between 30-49 years old people due to rise in liver enzyme such as rise in ALT AST, SGPT and SGOT which cause HCV infection (Dienstag& Isselbacher , 2005).
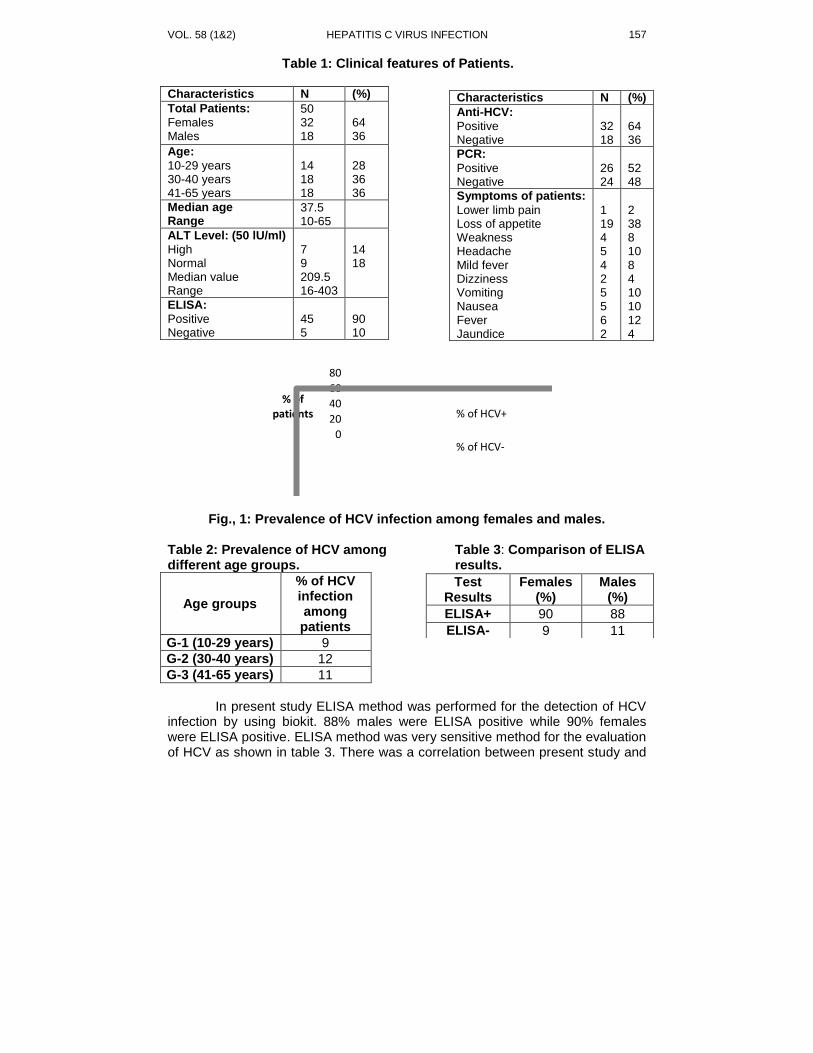
VOL. 58 (1&2) HEPATITIS C VIRUS INFECTION
157
Table 1: Clinical features of Patients.
Characteristics N (%)
Total Patients:
Females Males
50 32 18
64 36
Age:
10-29 years 30-40 years 41-65 years
14 18 18
28 36 36
Median age Range
37.5 10-65
ALT Level: (50 lU/ml)
High Normal Median value Range
7 9 209.5 16-403
14 18
ELISA:
Positive Negative
45 5
90 10
0
20
40
60
80
% of patients % of HCV+
% of HCV-
Fig., 1: Prevalence of HCV infection among females and males. Table 2: Prevalence of HCV among Table 3: Comparison of ELISA different age groups. results.
Age groups
% of HCV infection among patients
G-1 (10-29 years) 9
G-2 (30-40 years) 12
G-3 (41-65 years) 11
In present study ELISA method was performed for the detection of HCV
infection by using biokit. 88% males were ELISA positive while 90% females were ELISA positive. ELISA method was very sensitive method for the evaluation of HCV as shown in table 3. There was a correlation between present study and
Characteristics N (%)
Anti-HCV:
Positive Negative
32 18
64 36
PCR:
Positive Negative
26 24
52 48
Symptoms of patients:
Lower limb pain Loss of appetite Weakness Headache Mild fever Dizziness Vomiting Nausea Fever Jaundice
1 19 4 5 4 2 5 5 6 2
2 38 8 10 8 4 10 10 12 4
Test Results
Females (%)
Males (%)
ELISA+ 90 88
ELISA- 9 11
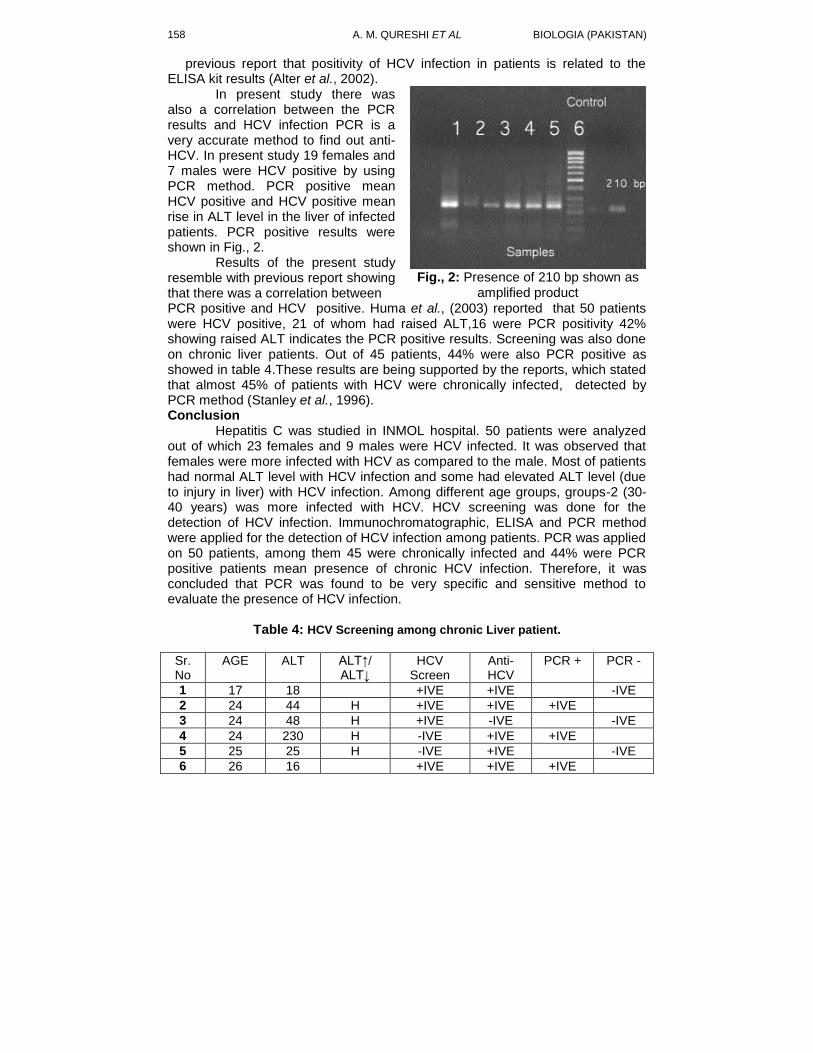
A. M. QURESHI ET AL BIOLOGIA (PAKISTAN)
158
previous report that positivity of HCV infection in patients is related to the ELISA kit results (Alter et al., 2002).
In present study there was also a correlation between the PCR results and HCV infection PCR is a very accurate method to find out anti- HCV. In present study 19 females and 7 males were HCV positive by using PCR method. PCR positive mean HCV positive and HCV positive mean rise in ALT level in the liver of infected patients. PCR positive results were shown in Fig., 2.
Results of the present study resemble with previous report showing that there was a correlation between
Fig., 2: Presence of 210 bp shown as
amplified product
PCR positive and HCV positive. Huma et al., (2003) reported that 50 patients were HCV positive, 21 of whom had raised ALT,16 were PCR positivity 42% showing raised ALT indicates the PCR positive results. Screening was also done on chronic liver patients. Out of 45 patients, 44% were also PCR positive as showed in table 4.These results are being supported by the reports, which stated that almost 45% of patients with HCV were chronically infected, detected by PCR method (Stanley et al., 1996). Conclusion
Hepatitis C was studied in INMOL hospital. 50 patients were analyzed out of which 23 females and 9 males were HCV infected. It was observed that females were more infected with HCV as compared to the male. Most of patients had normal ALT level with HCV infection and some had elevated ALT level (due to injury in liver) with HCV infection. Among different age groups, groups-2 (30-40 years) was more infected with HCV. HCV screening was done for the detection of HCV infection. Immunochromatographic, ELISA and PCR method were applied for the detection of HCV infection among patients. PCR was applied on 50 patients, among them 45 were chronically infected and 44% were PCR positive patients mean presence of chronic HCV infection. Therefore, it was concluded that PCR was found to be very specific and sensitive method to evaluate the presence of HCV infection.
Table 4: HCV Screening among chronic Liver patient.
Sr. No
AGE ALT ALT↑/ ALT↓
HCV Screen
Anti-HCV
PCR + PCR -
1 17 18 +IVE +IVE -IVE
2 24 44 H +IVE +IVE +IVE
3 24 48 H +IVE -IVE -IVE
4 24 230 H -IVE +IVE +IVE
5 25 25 H -IVE +IVE -IVE
6 26 16 +IVE +IVE +IVE
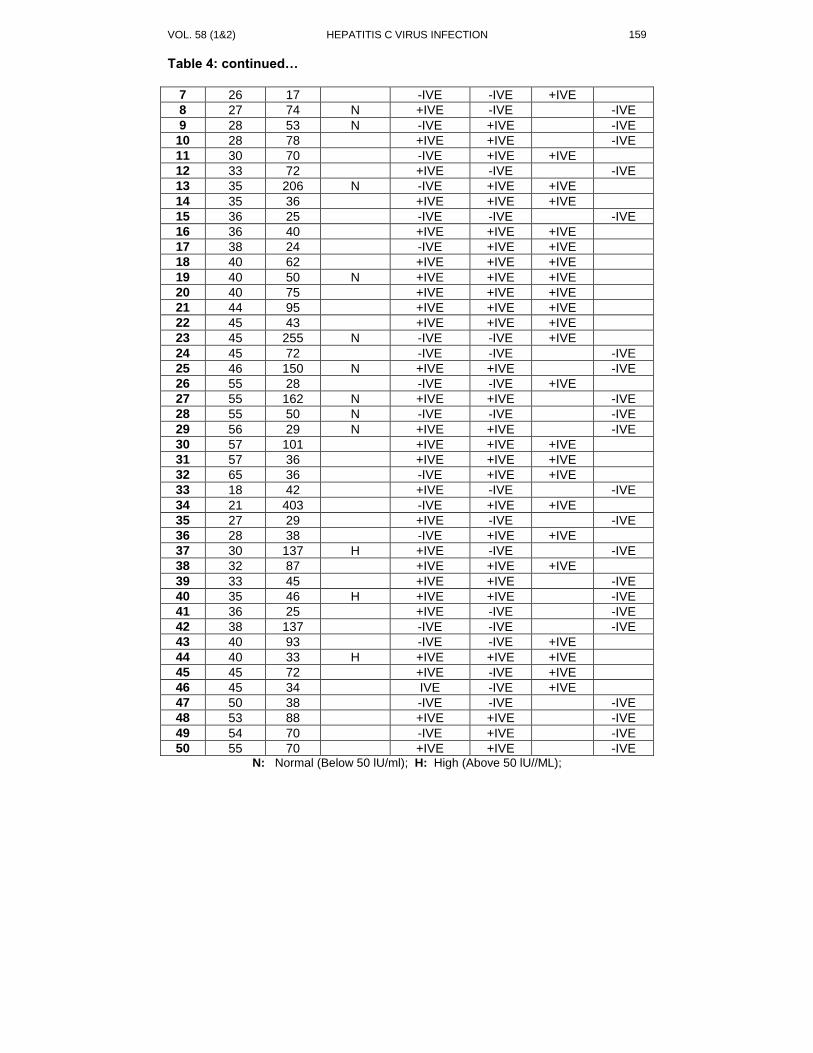
VOL. 58 (1&2) HEPATITIS C VIRUS INFECTION
159
Table 4: continued…
7 26 17 -IVE -IVE +IVE
8 27 74 N +IVE -IVE -IVE
9 28 53 N -IVE +IVE -IVE
10 28 78 +IVE +IVE -IVE
11 30 70 -IVE +IVE +IVE
12 33 72 +IVE -IVE -IVE
13 35 206 N -IVE +IVE +IVE
14 35 36 +IVE +IVE +IVE
15 36 25 -IVE -IVE -IVE
16 36 40 +IVE +IVE +IVE
17 38 24 -IVE +IVE +IVE
18 40 62 +IVE +IVE +IVE
19 40 50 N +IVE +IVE +IVE
20 40 75 +IVE +IVE +IVE
21 44 95 +IVE +IVE +IVE
22 45 43 +IVE +IVE +IVE
23 45 255 N -IVE -IVE +IVE
24 45 72 -IVE -IVE -IVE
25 46 150 N +IVE +IVE -IVE
26 55 28 -IVE -IVE +IVE
27 55 162 N +IVE +IVE -IVE
28 55 50 N -IVE -IVE -IVE
29 56 29 N +IVE +IVE -IVE
30 57 101 +IVE +IVE +IVE
31 57 36 +IVE +IVE +IVE
32 65 36 -IVE +IVE +IVE
33 18 42 +IVE -IVE -IVE
34 21 403 -IVE +IVE +IVE
35 27 29 +IVE -IVE -IVE
36 28 38 -IVE +IVE +IVE
37 30 137 H +IVE -IVE -IVE
38 32 87 +IVE +IVE +IVE
39 33 45 +IVE +IVE -IVE
40 35 46 H +IVE +IVE -IVE
41 36 25 +IVE -IVE -IVE
42 38 137 -IVE -IVE -IVE
43 40 93 -IVE -IVE +IVE
44 40 33 H +IVE +IVE +IVE
45 45 72 +IVE -IVE +IVE
46 45 34 IVE -IVE +IVE
47 50 38 -IVE -IVE -IVE
48 53 88 +IVE +IVE -IVE
49 54 70 -IVE +IVE -IVE
50 55 70 +IVE +IVE -IVE N: Normal (Below 50 lU/ml); H: High (Above 50 lU//ML);
A. M. QURESHI ET AL BIOLOGIA (PAKISTAN)
160
REFERENCES
Alter, M.J. Hutin, Y.J. & Armestrong, G.L., 2002. Epidemiology of hepatitis C. In: Liang, TL. Hoofnagle, JH. eds. Biomedical Research Reports of Hepatitis C. 1st Ed. New York: Academic Press. pp:169-183.
Bakr, I., Rekacewicz, C., Hosseiny, M., Ismai, l. S., Daly, M., Kafrawy, S., Esmat, G., Hamid, M.A. & Mohamed, M.K., 2006. Higher clearance of hepatitis C virus infection in females compared with males. J. Gast., 55: 1183-1187.
Bradle, D.W., Maynard, J.E., Popper, H., Cook, E.H., Ebert, J.W., McCaustland, K.A., Schable, C.A. & Fields, H.A., 1983. Post transfusion Non-A, Non-B hepatitis: Physiochemical properties of two distinct agents. J. infects. Dis., 148(2): 254-265.
Caruntu, FA. & Benea, L., 2006. Acute hepatitis C virus infection: Diagnosis, Pathogenesis, treatment. J. Gastrointestinal and Liver Disease, 15(3): 249-256.
DeBeeck, A. & Dubuisson J., 2003. Topology of Hepatitis C virus envelope glycoprotein. Rev. Med. Virol., 13 (4): 233-241.
Dienstag, J.L. & Isselbacher, K.J., 2005. Chronic hepatitis. In: Kasper, DL. Braunwald, E. Fauci, AS. eds. Harrison's Principles of Internal Medicine. 16th Ed. New York: Mc Graw-Hill. 1844-1855.
Huma, Q. Ambreen, A. Waquaruddin, A. & Ejaz, A S., 2003. HCV exposure in spouses of the index cases. J. Pak. Med. Association. 102(2): 79-85.
Kamal, R., 2008. Acute hepatitis C a Sysmatic Review. Am. J. Gastroenterology, 103(5), 1283-97.
Miyamoto, H., 1992. Extraordinary low density of Hepatitis C virus estimated by Sucrose density gradient centrifugation and the polymerase chain reaction. J. G. Virol., 73: 715-718.
Sambrook, J. & Russel, D.W., 2001. Molecular cloning a laboratory manual. 3
rd Ed. Cold Spring Harbour Labs, 2342-2344.
Sherris, 2004. Medical Microbiology. 4th Ed. McGraw Hill. pp:551-552.
Stanley, A.J., Haydon, G.H., Piris, J., Jarvis, L.M. & Hayes, P.C., 1996. Assessment of liver histology in patients with hepatitis C and normal transaminase levels. Eur. J. Gastroenterology Hepatol., 8: 869-872.
Wasley, A. & Alter, M., 2000. Geographic difference and temporal trends, Semin Liver Dis. J. Epidmol hepatitis C., 20 (1): 1-16.
Wilber, J. C., 1993. Development and use of laboratory test for hepatitis C infection: a review. J. Clin. Immunoassay, 16: 204.- 210
BIOLOGIA (PAKISTAN) 2012, 58 (1&2), 161-166 PK ISSN 0006 - 3096
Correspondence; [email protected]
Determination of skin irritancy by essential oils from some
members of Family Rutaceae of Pakistan
FERHAT MEHMOOD & ZAHEER UD DIN KHAN
Department of Botany GC University, Lahore, Pakistan.
ABSTRACT
In this study essential oils from some members of family Rutaceae were tested
for their possible potential to cause dermatitis on human skin using Patch test. Essential oils from root of Boenninghausinia albiflora showed maximum positive results regarding Irritant Contact Dermatitis (ICD) i.e. 71.42% while essential oils from Zanthoxylum armatum leaves exhibited minimum i.e. 21.42%. The essential oils from other plant
species showed weak positive while some even negative results. Gender based results indicated variations, as females of 12-16 years age group 25.57%, 20-22 years age group 31.5% and above 40 years 46.6% positive results. Among males, 12-16 years age group 39.84%, 20 years age group 33.2% and above 40 years 37.7% positive results. The results can help the manufacturers of sundry products using essential oils, for human use. Key words: Essential oils; Rutaceae; Patch test; Boenninghausinia albiflora; Zanthoxylum armatum
INTRODUCTION
Skin reactions due to plants are common, as plants are ubiquitous and exhibit a number of physical and chemical properties that may result in harmful effects. These reactions are of two types, i.e. Irritant Contact Dermatitis (ICD) and Allergic Contact Dermatitis (ACD). In ICD localized rash or irritation of the skin occurs (Lovell, 1993; Gunjan et al., 2009), while ACD represents a delayed-type hypersensitivity reaction (Type IV hypersensitivity). The ICD comprises 80% of all contact dermatitis reactions. Severe acute toxic reactions with necrosis may be seen following exposure to potent alkaloids from plant sap (Lovell, 1997; Morris et al., 2002). In type IV reactions, an allergen easily penetrates the stratum corneum and covalently binds to keratinocytes in the stratum spinosum below and elicits an immune response that is remembered on subsequent allergen exposures (Yunginger, 2003; Yiannias, 2004; Cohen & Heidary, 2004). Irritation and its severity depend on the functional integrity of the individual's skin, the potency and amount of irritant to which one is exposed, and the duration of irritant exposure. According to Cavani & Luca (2010), chemical irritants are responsible for chemical ICD (CICD). Diterpene esters are among the most irritant of plant-derived chemicals (Hughes et al., 2002; Asilian & Faghihi, 2004). The skin and eyes are particularly susceptible to ICD (Raison et al., 2003; Cappiello & Shadow, 2005).
Family Rutaceae has genera, many of which produce edible fruits and essential oils are obtained from many species, which are used for medicinal purposes, aroma-therapy, perfume industry, flavor and fragrance (Sawamura, 2011). Apart from the useful effects some of essential oils can cause irritation or provoke an allergic reaction (Heskel et al., 1983).
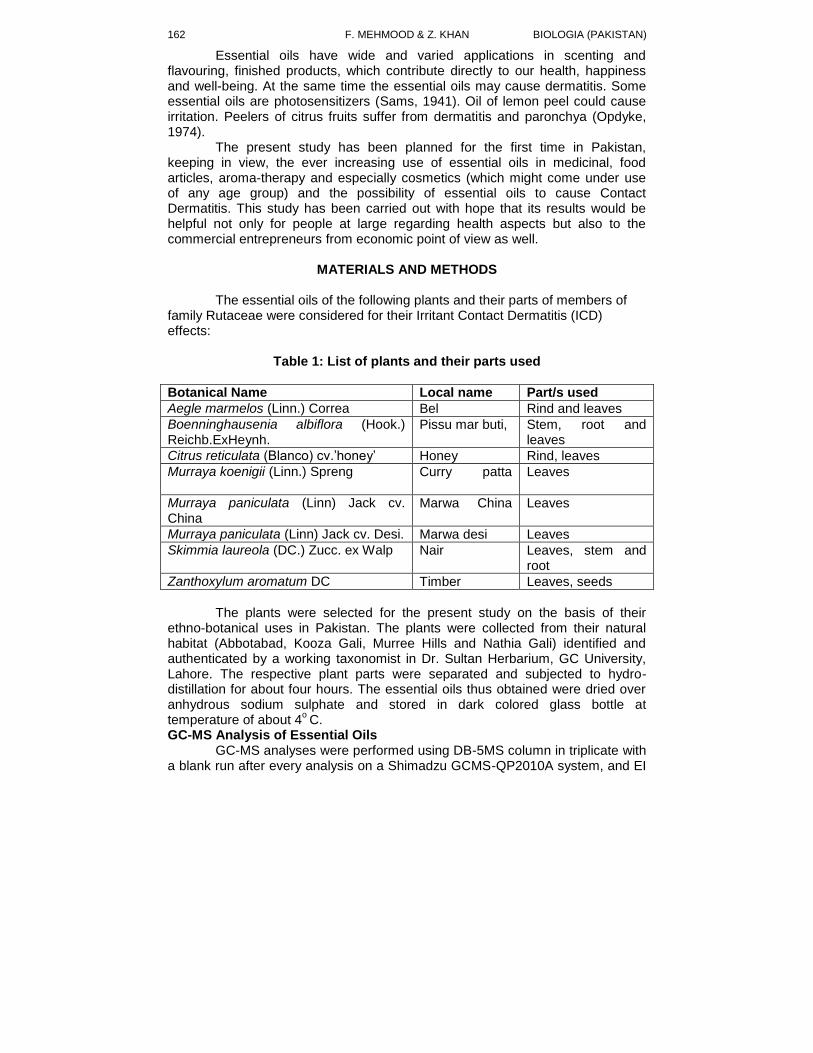
F. MEHMOOD & Z. KHAN BIOLOGIA (PAKISTAN)
162
Essential oils have wide and varied applications in scenting and flavouring, finished products, which contribute directly to our health, happiness and well-being. At the same time the essential oils may cause dermatitis. Some essential oils are photosensitizers (Sams, 1941). Oil of lemon peel could cause irritation. Peelers of citrus fruits suffer from dermatitis and paronchya (Opdyke, 1974).
The present study has been planned for the first time in Pakistan, keeping in view, the ever increasing use of essential oils in medicinal, food articles, aroma-therapy and especially cosmetics (which might come under use of any age group) and the possibility of essential oils to cause Contact Dermatitis. This study has been carried out with hope that its results would be helpful not only for people at large regarding health aspects but also to the commercial entrepreneurs from economic point of view as well.
MATERIALS AND METHODS
The essential oils of the following plants and their parts of members of
family Rutaceae were considered for their Irritant Contact Dermatitis (ICD) effects:
Table 1: List of plants and their parts used
Botanical Name Local name Part/s used
Aegle marmelos (Linn.) Correa Bel Rind and leaves
Boenninghausenia albiflora (Hook.) Reichb.ExHeynh.
Pissu mar buti, Stem, root and leaves
Citrus reticulata (Blanco) cv.’honey’ Honey Rind, leaves
Murraya koenigii (Linn.) Spreng Curry patta
Leaves
Murraya paniculata (Linn) Jack cv. China
Marwa China
Leaves
Murraya paniculata (Linn) Jack cv. Desi. Marwa desi Leaves
Skimmia laureola (DC.) Zucc. ex Walp Nair Leaves, stem and root
Zanthoxylum aromatum DC Timber Leaves, seeds
The plants were selected for the present study on the basis of their
ethno-botanical uses in Pakistan. The plants were collected from their natural habitat (Abbotabad, Kooza Gali, Murree Hills and Nathia Gali) identified and authenticated by a working taxonomist in Dr. Sultan Herbarium, GC University, Lahore. The respective plant parts were separated and subjected to hydro-distillation for about four hours. The essential oils thus obtained were dried over anhydrous sodium sulphate and stored in dark colored glass bottle at temperature of about 4
o C.
GC-MS Analysis of Essential Oils GC-MS analyses were performed using DB-5MS column in triplicate with
a blank run after every analysis on a Shimadzu GCMS-QP2010A system, and EI
VOL. 58 (1&2) SKIN IRRITANCY BY ESSENTIAL OILS
163
mode (70eV) equipped with injector at 250oC. The data thus obtained was
processed using Shimadzu Lab Solution GCMS Post run Analysis software. Comparing the mass fragmentation pattern of the reported data and NIST 147 and NIST 27 libraries, the components of essential oils were identified. Patch Test
Patch test (Seidenari et al., 1990) was performed in collaboration with Department of Dermatology, KEMC University, Lahore, after taking permission (NOC) from Vice Chancellor, King Edward Medical College University, Lahore. One hundred (100) normal volunteers, of either sex, ranging from 10-45 yrs of age from different walks of life and professions e.g. Government servants, Private job personals, students, family members, house maids, peons etc., were enrolled after getting the consent form signed by them. Test Procedure
It was made sure that skin of volunteers was clean, healthy and free of ointments, lotions, powders, acne, dermatitis, scars, hair or any other condition that might interfere the effect of samples of essential oils. Moreover it was ensured that none of the volunteer was taking any sort of anti-allergic drug.
i. About a drop of each sample (in petrolatum 5% w/w) was applied on about 1 cm diameter dark colored food grade plastic disc.
ii. The disc (with the applied sample side) was placed on the palm side skin of forearm in vicinity of elbow and fixed with the help of cellophane tape. At a time two to three samples were applied. Sample number was written on the tape.
iii. Samples were kept applied on the skin for 48 hours. Results were taken after 15-20 minutes of removal of the discs, for better observations.
iv. An individual showing any positive result was given treatment as per prescription of consultant dermatologist and Patch testing was done again after complete subsidence of signs and symptoms and withdrawal of the drugs.
Results were interpreted according to International Contact Dermatitis Research Group Scale (Fregert, 1981 & Foussereau et al., 1982)
given in Table
2. The Chi-Square test was applied to analyze the results statistically, using STATA version 10, statistical software.
RESULTS AND DISCUSSION
GC-MS analyses revealed Limonene as the highest percentage
compound in essential oils from leaves and rind Aegle marmelos. This has already been reported by Suvimol & Pranee (2008).
. Ketones dominated in essential oil from leaves of Zanthoxylum armatum while Limonene, cymene and linalool dominated in EO from its seeds.
EO from leaves of Murraya koenigii had -Cymene and Linalool in agreement with Rees et al.,(1989). Germacerene and Caryophylline were in high
concentration in leaves of M. paniculata cv. China and Nerodilol and -Cubebene in leaves of M. paniculata cv. Desi. In Citrus reticulata, Blanco cv. Honey leaf and rind essential oil showed Limonene in high percentage, which was also reported by Al-Sheikh & Gad el-Rab (1996). The essential oils from
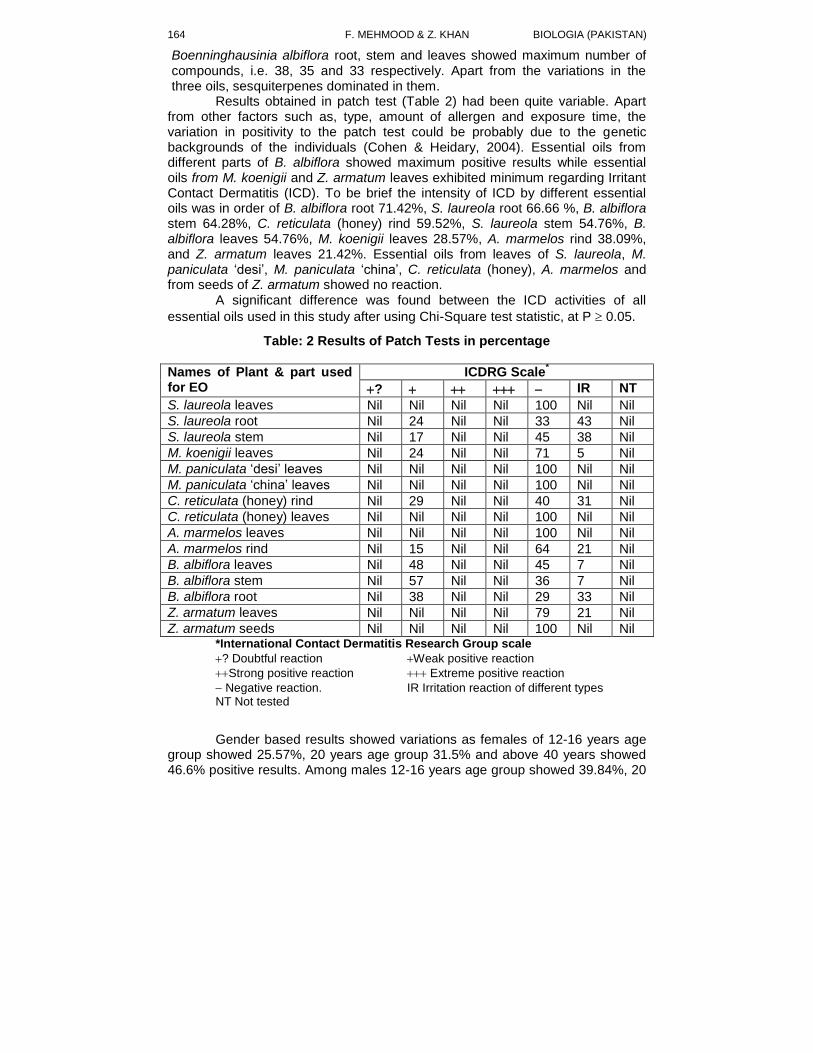
F. MEHMOOD & Z. KHAN BIOLOGIA (PAKISTAN)
164
Boenninghausinia albiflora root, stem and leaves showed maximum number of compounds, i.e. 38, 35 and 33 respectively. Apart from the variations in the three oils, sesquiterpenes dominated in them.
Results obtained in patch test (Table 2) had been quite variable. Apart from other factors such as, type, amount of allergen and exposure time, the variation in positivity to the patch test could be probably due to the genetic backgrounds of the individuals (Cohen & Heidary, 2004). Essential oils from different parts of B. albiflora showed maximum positive results while essential oils from M. koenigii and Z. armatum leaves exhibited minimum regarding Irritant Contact Dermatitis (ICD). To be brief the intensity of ICD by different essential oils was in order of B. albiflora root 71.42%, S. laureola root 66.66 %, B. albiflora stem 64.28%, C. reticulata (honey) rind 59.52%, S. laureola stem 54.76%, B. albiflora leaves 54.76%, M. koenigii leaves 28.57%, A. marmelos rind 38.09%, and Z. armatum leaves 21.42%. Essential oils from leaves of S. laureola, M. paniculata ‘desi’, M. paniculata ‘china’, C. reticulata (honey), A. marmelos and from seeds of Z. armatum showed no reaction.
A significant difference was found between the ICD activities of all
essential oils used in this study after using Chi-Square test statistic, at P 0.05.
Table: 2 Results of Patch Tests in percentage
Names of Plant & part used for EO
ICDRG Scale*
? IR NT
S. laureola leaves Nil Nil Nil Nil 100 Nil Nil
S. laureola root Nil 24 Nil Nil 33 43 Nil
S. laureola stem Nil 17 Nil Nil 45 38 Nil
M. koenigii leaves Nil 24 Nil Nil 71 5 Nil
M. paniculata ‘desi’ leaves Nil Nil Nil Nil 100 Nil Nil
M. paniculata ‘china’ leaves Nil Nil Nil Nil 100 Nil Nil
C. reticulata (honey) rind Nil 29 Nil Nil 40 31 Nil
C. reticulata (honey) leaves Nil Nil Nil Nil 100 Nil Nil
A. marmelos leaves Nil Nil Nil Nil 100 Nil Nil
A. marmelos rind Nil 15 Nil Nil 64 21 Nil
B. albiflora leaves Nil 48 Nil Nil 45 7 Nil
B. albiflora stem Nil 57 Nil Nil 36 7 Nil
B. albiflora root Nil 38 Nil Nil 29 33 Nil
Z. armatum leaves Nil Nil Nil Nil 79 21 Nil
Z. armatum seeds Nil Nil Nil Nil 100 Nil Nil *International Contact Dermatitis Research Group scale
? Doubtful reaction Weak positive reaction
Strong positive reaction Extreme positive reaction
Negative reaction. IR Irritation reaction of different types NT Not tested
Gender based results showed variations as females of 12-16 years age group showed 25.57%, 20 years age group 31.5% and above 40 years showed 46.6% positive results. Among males 12-16 years age group showed 39.84%, 20
VOL. 58 (1&2) SKIN IRRITANCY BY ESSENTIAL OILS
165
years age group 33.2% and above 40 years exhibited 37.7% positive results. These results are in contrast to Rees et al., (1989) and Al-Sheikh & Gad el-Rab, (1996) which showed that females exhibited a larger response in the development of contact sensitivity induced by dinitrochlorobenzene (DNCB) at all challenge doses studied, and the slope of the log-dose response curve was significantly steeper in females.
Essential oils under study were found composed of variety of chemical components. Among these, Limonene and its oxidation products are skin and
respiratory irritants (Anonymous, 1999). -cymene is also skin irritant as determined by Bennett et al., 1982. As per study of Kanikkannan & Singh, 2002 undecanol is irritant to rabbit but not to human. Sax & Lewis (1989) found glycidol as an irritant of the skin, eyes, mucous membranes, and upper respiratory tract. Moreover exposure to glycidol may also cause central nervous system depression, followed by central nervous system stimulation. The possible mechanism of irritant reaction is due to easy penetration of these substances to the stratum corneum that covalently bind to keratinocytes in the stratum spinosum below (Cavani & Luca, 2010; El-Azhary & Yiannias, 2004; Cohen & Heidary, 2004). Only the superficial regions of the skin are affected in contact dermatitis (Morris et al., 2002). Conclusion
Essential oils from some members of family Rutaceae tested in this study for contact dermatitis can provide information for direct preventive measures such as exposure reduction to prevent sensitization as well as elicitation of contact dermatitis as suggested by Nielsen & Menne (1992) and Nielsen et al., (2002).
REFERENCES
Al-Sheikh, O.A. & Gad el-Rab. M.O., 1996. Allergic contact dermatitis: Clinical
features and profile of sensitizing allergens in Riyadh, Saudi Arabia. Int. J. Dermatol., 35:493-497.
Anonymous., 1999. WHO, International Agency for Research on Cancer. pp: 307.
Asilian, A. & Faghihi, G., 2004. Severe irritant contact dermatitis from cypress spurge. Cont. Dermat., 51: 37-39.
Bennett, M.A., Huang, T.N., Matheson, T.W. & Smith, A. K., 1982. (h 6-Hexamethylbenzene)ruthenium complexes. Inorg. Synth., 21: 74–78.
Cappiello, P. & Shadow, D. D., 2005. The genus Cornus, Timber Press, Portland, pp. 78-83.
Cavani, A. & Luca, D., 2010. Anastasia Allergic Contact Dermatitis: Novel Mechanisms and Therapeutic Perspectives: Current Drug Metabolism, Bentham Science Publishers, USA, pp. 228-233.
Cohen, D.E. & Heidary, N., 2004. Treatment of irritant and allergic contact dermatitis. Dermatol. Ther., 17: 334-40.
El-Azhary, R.A. & Yiannias, J.A., 2004. A new patient education approach in contact allergic dermatitis: The Contact Allergen Replacement database (CARD). Int. J. Dermatol., 43: 278-80.
F. MEHMOOD & Z. KHAN BIOLOGIA (PAKISTAN)
166
Foussereau, J., Herve-Bazin, B. Meynadier,J., Reuter,G. & Cavelier, C., 1982. Allergic contact dermatitis to plastic table cloth and phenyl indole. Cont. Dermat., 8: 73-75.
Fregert, S., 1981. Contact allergy to phenoplastics.Contact Cont. Dermat., 7: 170-73.
Gunjan, M., Modi, C.B., Doherty, R.K. & Orengo, I.F., 2009. Irritant Contact Dermatitis from Plants. Dermatitis, 20: 63-68.
Heskel, N.S., Amon, R.B., Storrs, F.J. & White, C.R., 1983. Phytophotodermatitis due to Ruta graveolens. Cont. Dermat., 9: 278-80.
Hughes, T.M., Varma, S. & Stone, N.M., 2002. Occupational contact dermatitis from a garlic and herb mixture. Cont. Dermat., 47: 48-50.
Kanikkannan, N. & Singh, M., 2002. Skin permeation enhancement effect and skin irritation of saturated fatty alcohols. Int. J. Pharm., 248: 219-28.
Lovell, C.R., 1993. Plants and the skin. Blackwell Scientific Publications. Oxford and Boston, pp. 125-26.
Lovell, C.R., 1997. Phytodermatitis. Clin. Dermatol., 15: 607-13. Morris, J.R., Robertson, S.J. & Ross, J.S., 2002. Dermatitis caused by physical
irritants. Br. J. Dermatol., 147: 270-75. Nielsen, N.H. & Menne, T., 1992. Allergic contact sensitization in an unselected
Danish population. The Glostrup Allergy Study, Denmark. Acta. Derm. Venereol., 72: 456-60.
Nielsen, N.H., Linneberg, A., Menne.T, Madsen, F., Frolund, L. & Dirksen, A., 2002. Incidence of allergic contact sensitization in Danish adults between 1990 and 1998: The Copenhagen Allergy Study, Denmark. Br. J. Dermatol., 147: 487-92.
Opdyke, D.L.J., 1974. Monographs on fragrance raw materials. F. Comset. Toxicol., 12: 725-66.
Raison, P.N., Roulet, A., Guillot, B. & Guilhou, J. J., 2003. Bromelain: an unusual cause of allergic contact cheilitis. Cont. Dermat., 49: 218-29.
Rees, J.L., Friedmann, P.S. & Mathews, J.N., 1989. Sex differences in susceptibility to development of contact hypersensitivity to dinitrochlorobenzene (DNCB). Br. J. Dermatol., 120: 371-74.
Sams, W.M., 1941 Photodynamic action of lime oil (Citrus aurantifolia). Arch. derm. Syph., 44: 571-77.
Sawamura, M., 2011. Citrus essential oils: Flavour and Fragrance. John Wiley and Sons, Inc. Hobken, New Jersey, pp. 180-90.
Sax, N.I. & Lewis, R.J., 1989. Dangerous properties of industrial materials. 7th ed. Van Nostrand Reinhold Company New York, pp. 240-51.
Seidenari, S., Manzini, B.M., Danese, P. & Motolese, N., 1990. A. Patch and prick test study of 593 healthy subjects. Cont. Dermat., 23: 162-67.
Suvimol, C & Pranee, A., 2008. Bioactive Compounds and Volatile Compounds of Thai Bael Fruit (Aegel Marmelos (L.) Correa) as a Valuable Source for Functional Food Ingredients. Internat. Food Res. J., 15 (3): 287-295.
Yunginger, J.W., 2003. Natural rubber latex allergy: Middleton's allergy principles and practice. Elsevier. Philadelphia, pp. 110-117.
Yiannias, J.A., 2004. The Principles and Practice of Contact and Occupational Dermatology in the Asia-Pacific Region. Internat. J. Dermatol., 43: 229-31.
BIOLOGIA (PAKISTAN) 2012, 58 (1&2), 167-173 PK ISSN 0006 - 3096
*Corresponding author: [email protected]
Antibacterial activity of crude extracts of different parts of
Butea monosperma (Lamk.) Taub.
*MIAN SHAHZADA ZIA AHMAD & ZAHEER-UD-DIN KHAN
Department of Botany, GC University, Lahore.
ABSTRACT
The antibacterial activity of leaves, bark, flowers and seeds extract of Butea
monosperma (Lamk.) Taub. is a medicinal plant of Indo-Pak Subcontinent were investigated against five strains of bacteria viz; Staphylococcus aureus, Klebsiella pneumonia, Pseudomonas aeruginosa, Bacillus subtilis, Escherichia coli using the hole plate method. Two methods were employed for the extraction of crude extracts, the maceration and the Soxhlet methods. The crude extracts in petroleum ether, chloroform, methanol and water of different parts of plants showed significant differences. The results obtained were encouraging as the methanol and aqueous extracts of different parts of plants exhibited comparatively higher antibacterial activity but less than one exhibited by standard antibacterial discs. The methanolic extract of flowers exhibited slightly better action against most of the microorganisms tested. The MIC values of the extracts against microorganisms tested were ranging from 6 mg/ml to 2 mg/ml. Keywords: Antimicrobial activity, crude extracts, Butea monosperma, zone of inhibition,
minimum inhibitory concentration
INTRODUCTION
The traditional uses of plants as medicine for the treatment of microbial
infections are very effective. Medicinal plants show antimicrobial activity (Chan et al., 2008). Now the use of traditional medicines has expanded globally and become popular. Continuously the use of plants for primary healthcare in underprivileged countries has increased (Tadeg et al., 2005). About 80% of world’s population, especially the people in the rural area rely upon herbal medicine for the remedy of their ailments (WHO, 2001). The continuous search for the source of new antibiotics is needed to face the problem of increasing resistant strains of bacteria (Gibbons, 1992). There has been a renaissance of attention in the development of drugs from plant sources. The substances derived from plants could be found in their parts like roots, leaves, shoots, bark, flower and seeds of plants. Many plants are used to form crude extracts to treat common infections (Noumi & Youmi, 2001).The plant selected for the present study was B. monosperma an ethnobotanically important plant of Pakistan which is used locally in the treatment of various diseases.
MATERIALS AND METHODS
Plant material
Fresh parts of B. mmonosperma were obtained from the natural vegetation of tehsil Shakargarh, District Narowal, Punjab.
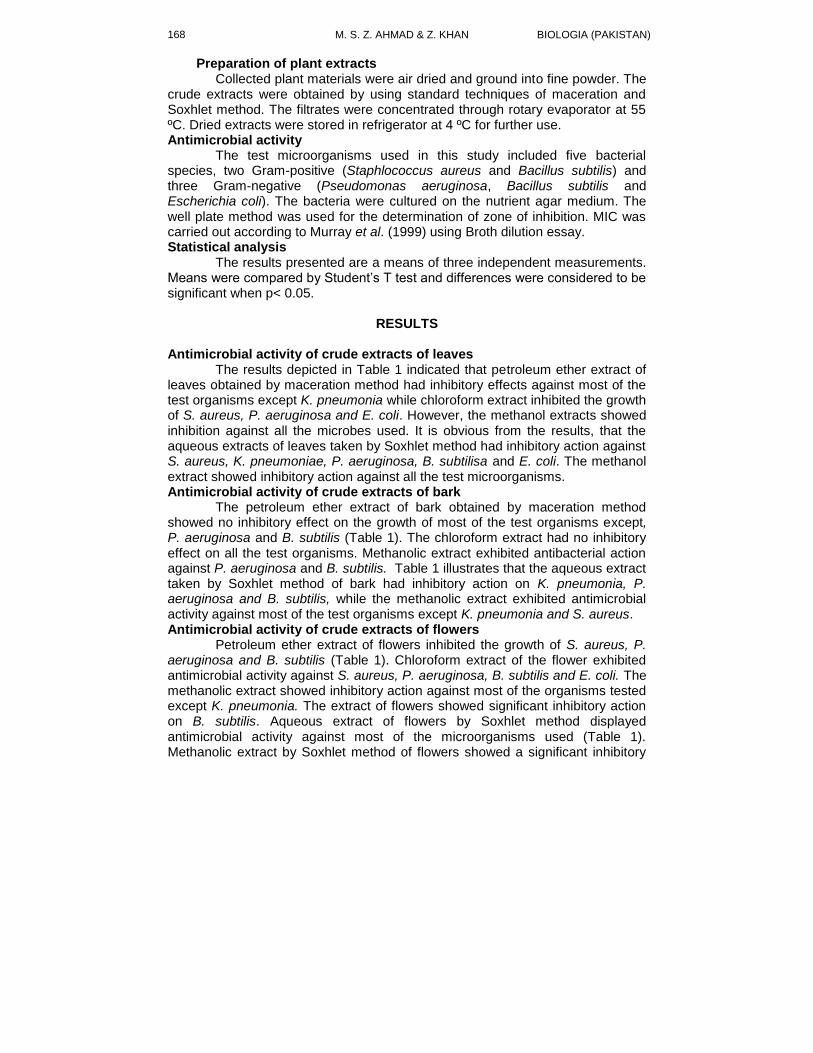
M. S. Z. AHMAD & Z. KHAN BIOLOGIA (PAKISTAN) 168
Preparation of plant extracts Collected plant materials were air dried and ground into fine powder. The
crude extracts were obtained by using standard techniques of maceration and Soxhlet method. The filtrates were concentrated through rotary evaporator at 55 ºC. Dried extracts were stored in refrigerator at 4 ºC for further use. Antimicrobial activity
The test microorganisms used in this study included five bacterial species, two Gram-positive (Staphlococcus aureus and Bacillus subtilis) and three Gram-negative (Pseudomonas aeruginosa, Bacillus subtilis and Escherichia coli). The bacteria were cultured on the nutrient agar medium. The well plate method was used for the determination of zone of inhibition. MIC was carried out according to Murray et al. (1999) using Broth dilution essay. Statistical analysis
The results presented are a means of three independent measurements. Means were compared by Student’s T test and differences were considered to be significant when p< 0.05.
RESULTS
Antimicrobial activity of crude extracts of leaves
The results depicted in Table 1 indicated that petroleum ether extract of leaves obtained by maceration method had inhibitory effects against most of the test organisms except K. pneumonia while chloroform extract inhibited the growth of S. aureus, P. aeruginosa and E. coli. However, the methanol extracts showed inhibition against all the microbes used. It is obvious from the results, that the aqueous extracts of leaves taken by Soxhlet method had inhibitory action against S. aureus, K. pneumoniae, P. aeruginosa, B. subtilisa and E. coli. The methanol extract showed inhibitory action against all the test microorganisms. Antimicrobial activity of crude extracts of bark
The petroleum ether extract of bark obtained by maceration method showed no inhibitory effect on the growth of most of the test organisms except, P. aeruginosa and B. subtilis (Table 1). The chloroform extract had no inhibitory effect on all the test organisms. Methanolic extract exhibited antibacterial action against P. aeruginosa and B. subtilis. Table 1 illustrates that the aqueous extract taken by Soxhlet method of bark had inhibitory action on K. pneumonia, P. aeruginosa and B. subtilis, while the methanolic extract exhibited antimicrobial activity against most of the test organisms except K. pneumonia and S. aureus. Antimicrobial activity of crude extracts of flowers
Petroleum ether extract of flowers inhibited the growth of S. aureus, P. aeruginosa and B. subtilis (Table 1). Chloroform extract of the flower exhibited antimicrobial activity against S. aureus, P. aeruginosa, B. subtilis and E. coli. The methanolic extract showed inhibitory action against most of the organisms tested except K. pneumonia. The extract of flowers showed significant inhibitory action on B. subtilis. Aqueous extract of flowers by Soxhlet method displayed antimicrobial activity against most of the microorganisms used (Table 1). Methanolic extract by Soxhlet method of flowers showed a significant inhibitory
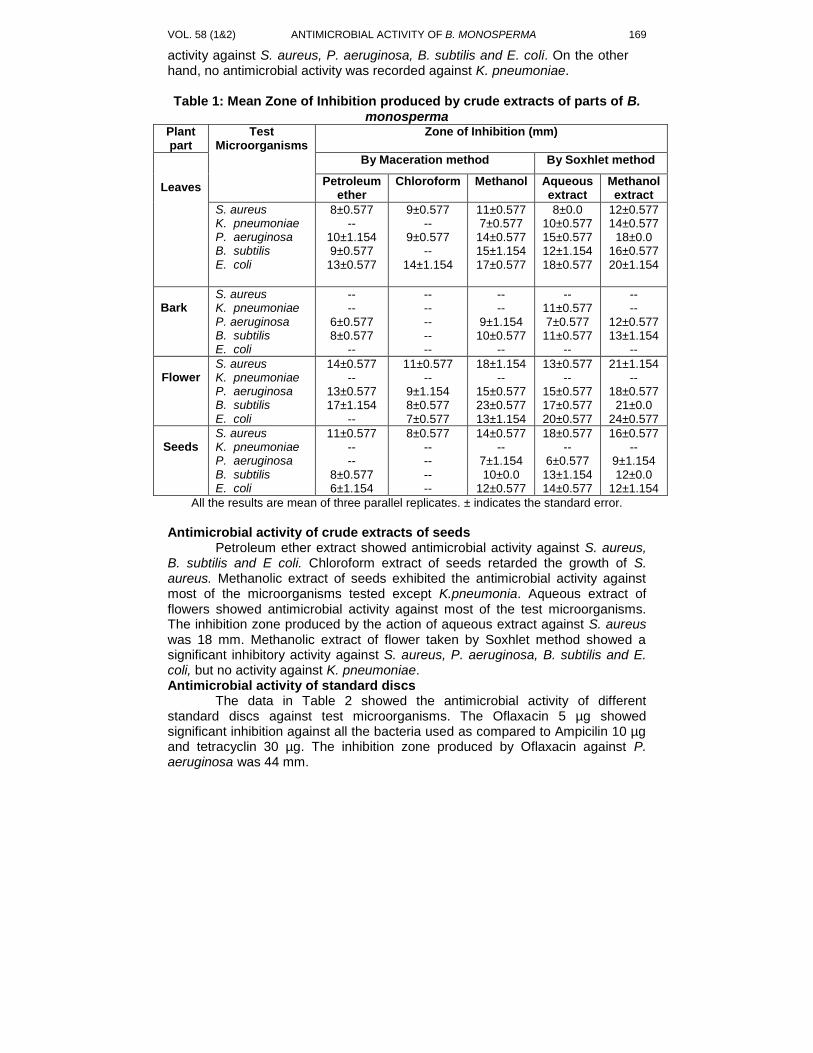
VOL. 58 (1&2) ANTIMICROBIAL ACTIVITY OF B. MONOSPERMA 169
activity against S. aureus, P. aeruginosa, B. subtilis and E. coli. On the other hand, no antimicrobial activity was recorded against K. pneumoniae. Table 1: Mean Zone of Inhibition produced by crude extracts of parts of B.
monosperma Plant part
Test Microorganisms
Zone of Inhibition (mm)
Leaves
By Maceration method By Soxhlet method
Petroleum ether
Chloroform Methanol Aqueous extract
Methanol extract
S. aureus K. pneumoniae P. aeruginosa B. subtilis E. coli
8±0.577 --
10±1.154 9±0.577
13±0.577
9±0.577 --
9±0.577 --
14±1.154
11±0.577 7±0.577
14±0.577 15±1.154 17±0.577
8±0.0 10±0.577 15±0.577 12±1.154 18±0.577
12±0.577 14±0.577
18±0.0 16±0.577 20±1.154
Bark
S. aureus K. pneumoniae P. aeruginosa B. subtilis E. coli
-- --
6±0.577 8±0.577
--
-- -- -- -- --
-- --
9±1.154 10±0.577
--
-- 11±0.577 7±0.577
11±0.577 --
-- --
12±0.577 13±1.154
--
Flower
S. aureus K. pneumoniae P. aeruginosa B. subtilis E. coli
14±0.577 --
13±0.577 17±1.154
--
11±0.577 --
9±1.154 8±0.577 7±0.577
18±1.154 --
15±0.577 23±0.577 13±1.154
13±0.577 --
15±0.577 17±0.577 20±0.577
21±1.154 --
18±0.577 21±0.0
24±0.577
Seeds
S. aureus K. pneumoniae P. aeruginosa B. subtilis E. coli
11±0.577 -- --
8±0.577 6±1.154
8±0.577 -- -- -- --
14±0.577 --
7±1.154 10±0.0
12±0.577
18±0.577 --
6±0.577 13±1.154 14±0.577
16±0.577 --
9±1.154 12±0.0
12±1.154
All the results are mean of three parallel replicates. ± indicates the standard error.
Antimicrobial activity of crude extracts of seeds
Petroleum ether extract showed antimicrobial activity against S. aureus, B. subtilis and E coli. Chloroform extract of seeds retarded the growth of S. aureus. Methanolic extract of seeds exhibited the antimicrobial activity against most of the microorganisms tested except K.pneumonia. Aqueous extract of flowers showed antimicrobial activity against most of the test microorganisms. The inhibition zone produced by the action of aqueous extract against S. aureus was 18 mm. Methanolic extract of flower taken by Soxhlet method showed a significant inhibitory activity against S. aureus, P. aeruginosa, B. subtilis and E. coli, but no activity against K. pneumoniae. Antimicrobial activity of standard discs
The data in Table 2 showed the antimicrobial activity of different standard discs against test microorganisms. The Oflaxacin 5 µg showed significant inhibition against all the bacteria used as compared to Ampicilin 10 µg and tetracyclin 30 µg. The inhibition zone produced by Oflaxacin against P. aeruginosa was 44 mm.
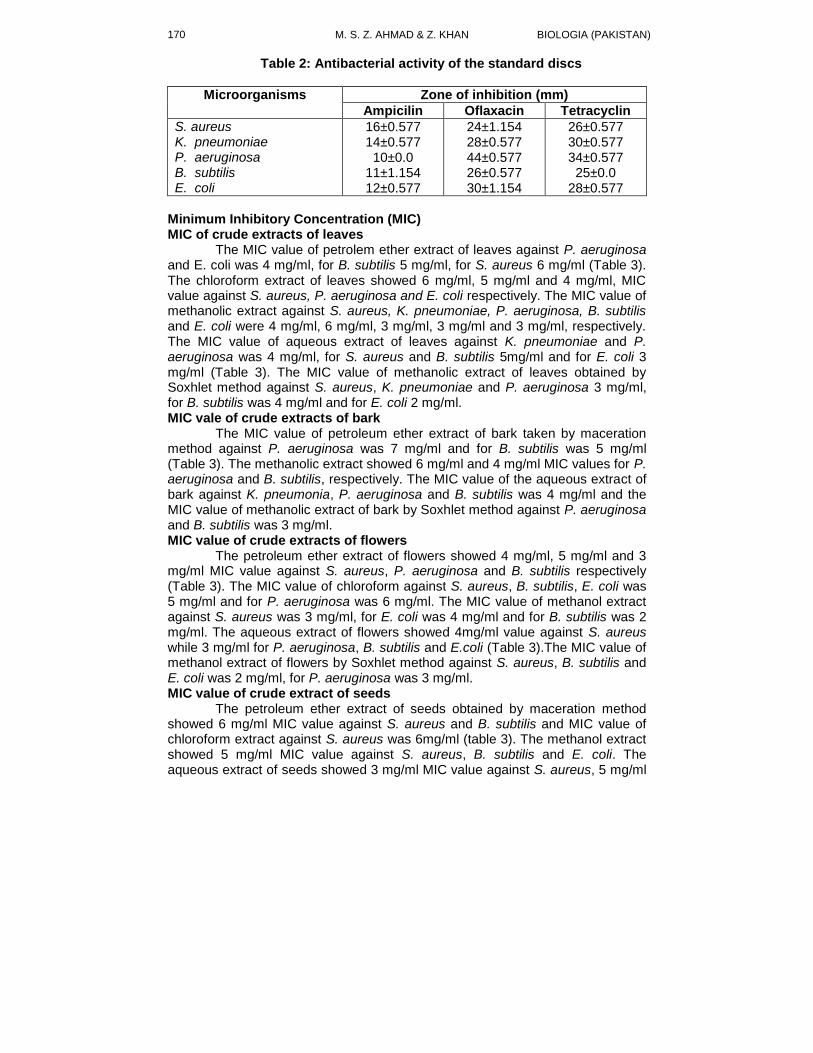
M. S. Z. AHMAD & Z. KHAN BIOLOGIA (PAKISTAN) 170
Table 2: Antibacterial activity of the standard discs
Microorganisms Zone of inhibition (mm)
Ampicilin Oflaxacin Tetracyclin
S. aureus K. pneumoniae P. aeruginosa B. subtilis E. coli
16±0.577 14±0.577 10±0.0
11±1.154 12±0.577
24±1.154 28±0.577 44±0.577 26±0.577 30±1.154
26±0.577 30±0.577 34±0.577 25±0.0
28±0.577
Minimum Inhibitory Concentration (MIC) MIC of crude extracts of leaves
The MIC value of petrolem ether extract of leaves against P. aeruginosa and E. coli was 4 mg/ml, for B. subtilis 5 mg/ml, for S. aureus 6 mg/ml (Table 3). The chloroform extract of leaves showed 6 mg/ml, 5 mg/ml and 4 mg/ml, MIC value against S. aureus, P. aeruginosa and E. coli respectively. The MIC value of methanolic extract against S. aureus, K. pneumoniae, P. aeruginosa, B. subtilis and E. coli were 4 mg/ml, 6 mg/ml, 3 mg/ml, 3 mg/ml and 3 mg/ml, respectively. The MIC value of aqueous extract of leaves against K. pneumoniae and P. aeruginosa was 4 mg/ml, for S. aureus and B. subtilis 5mg/ml and for E. coli 3 mg/ml (Table 3). The MIC value of methanolic extract of leaves obtained by Soxhlet method against S. aureus, K. pneumoniae and P. aeruginosa 3 mg/ml, for B. subtilis was 4 mg/ml and for E. coli 2 mg/ml. MIC vale of crude extracts of bark
The MIC value of petroleum ether extract of bark taken by maceration method against P. aeruginosa was 7 mg/ml and for B. subtilis was 5 mg/ml (Table 3). The methanolic extract showed 6 mg/ml and 4 mg/ml MIC values for P. aeruginosa and B. subtilis, respectively. The MIC value of the aqueous extract of bark against K. pneumonia, P. aeruginosa and B. subtilis was 4 mg/ml and the MIC value of methanolic extract of bark by Soxhlet method against P. aeruginosa and B. subtilis was 3 mg/ml. MIC value of crude extracts of flowers
The petroleum ether extract of flowers showed 4 mg/ml, 5 mg/ml and 3 mg/ml MIC value against S. aureus, P. aeruginosa and B. subtilis respectively (Table 3). The MIC value of chloroform against S. aureus, B. subtilis, E. coli was 5 mg/ml and for P. aeruginosa was 6 mg/ml. The MIC value of methanol extract against S. aureus was 3 mg/ml, for E. coli was 4 mg/ml and for B. subtilis was 2 mg/ml. The aqueous extract of flowers showed 4mg/ml value against S. aureus while 3 mg/ml for P. aeruginosa, B. subtilis and E.coli (Table 3).The MIC value of methanol extract of flowers by Soxhlet method against S. aureus, B. subtilis and E. coli was 2 mg/ml, for P. aeruginosa was 3 mg/ml. MIC value of crude extract of seeds
The petroleum ether extract of seeds obtained by maceration method showed 6 mg/ml MIC value against S. aureus and B. subtilis and MIC value of chloroform extract against S. aureus was 6mg/ml (table 3). The methanol extract showed 5 mg/ml MIC value against S. aureus, B. subtilis and E. coli. The aqueous extract of seeds showed 3 mg/ml MIC value against S. aureus, 5 mg/ml
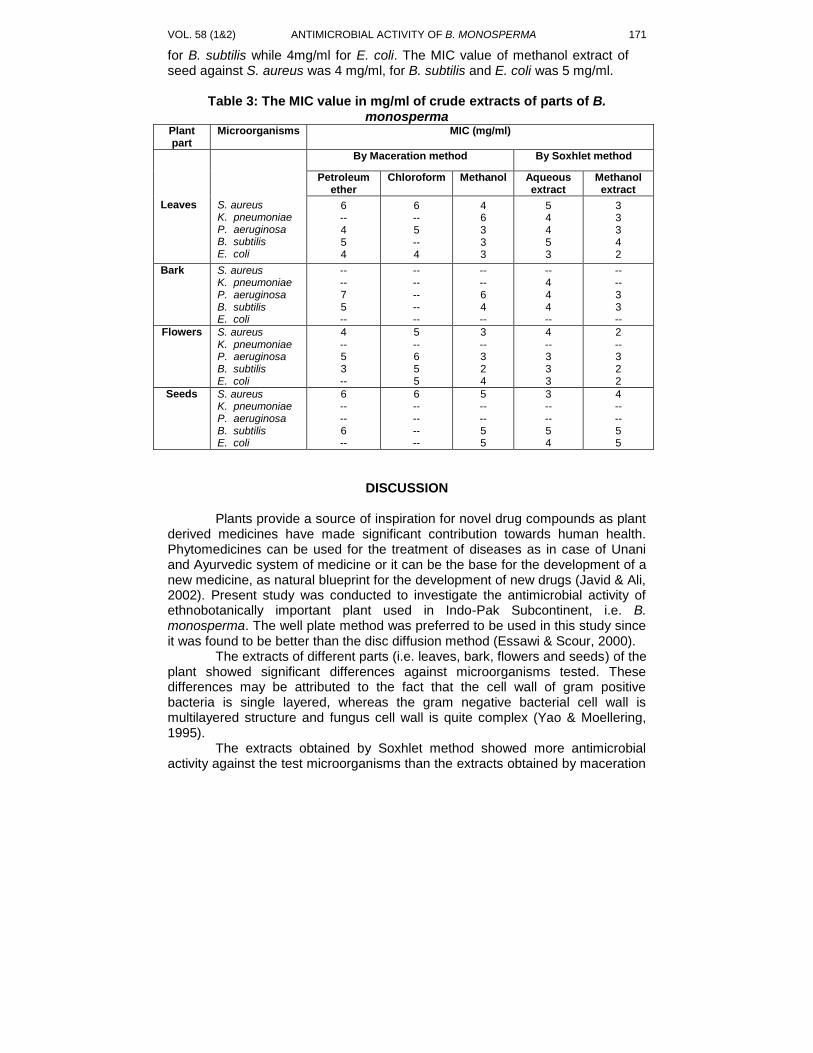
VOL. 58 (1&2) ANTIMICROBIAL ACTIVITY OF B. MONOSPERMA 171
for B. subtilis while 4mg/ml for E. coli. The MIC value of methanol extract of seed against S. aureus was 4 mg/ml, for B. subtilis and E. coli was 5 mg/ml.
Table 3: The MIC value in mg/ml of crude extracts of parts of B.
monosperma Plant part
Microorganisms MIC (mg/ml)
Leaves
S. aureus K. pneumoniae P. aeruginosa B. subtilis E. coli
By Maceration method By Soxhlet method
Petroleum ether
Chloroform Methanol Aqueous extract
Methanol extract
6 -- 4 5 4
6 -- 5 -- 4
4 6 3 3 3
5 4 4 5 3
3 3 3 4 2
Bark S. aureus K. pneumoniae P. aeruginosa B. subtilis E. coli
-- -- 7 5 --
-- -- -- -- --
-- -- 6 4 --
-- 4 4 4 --
-- -- 3 3 --
Flowers S. aureus K. pneumoniae P. aeruginosa B. subtilis E. coli
4 -- 5 3 --
5 -- 6 5 5
3 -- 3 2 4
4 -- 3 3 3
2 -- 3 2 2
Seeds S. aureus K. pneumoniae P. aeruginosa B. subtilis E. coli
6 -- -- 6 --
6 -- -- -- --
5 -- -- 5 5
3 -- -- 5 4
4 -- -- 5 5
DISCUSSION
Plants provide a source of inspiration for novel drug compounds as plant derived medicines have made significant contribution towards human health. Phytomedicines can be used for the treatment of diseases as in case of Unani and Ayurvedic system of medicine or it can be the base for the development of a new medicine, as natural blueprint for the development of new drugs (Javid & Ali, 2002). Present study was conducted to investigate the antimicrobial activity of ethnobotanically important plant used in Indo-Pak Subcontinent, i.e. B. monosperma. The well plate method was preferred to be used in this study since it was found to be better than the disc diffusion method (Essawi & Scour, 2000).
The extracts of different parts (i.e. leaves, bark, flowers and seeds) of the plant showed significant differences against microorganisms tested. These differences may be attributed to the fact that the cell wall of gram positive bacteria is single layered, whereas the gram negative bacterial cell wall is multilayered structure and fungus cell wall is quite complex (Yao & Moellering, 1995).
The extracts obtained by Soxhlet method showed more antimicrobial activity against the test microorganisms than the extracts obtained by maceration
M. S. Z. AHMAD & Z. KHAN BIOLOGIA (PAKISTAN) 172
method. Therefore, it can be concluded that the Soxhlet method of extraction was found more reliable as compared to the maceration method. The results obtained were encouraging as the methanolic extract and aqueous extracts of different parts of plant showed considerable antimicrobial activity. The reason of broad antimicrobial activity of methanol extracts could be that all of the identified components of plants, active against microorganisms are aromatic and may be containing saturated organic compounds are most often obtained through methanol or ethanol extraction (Cowan, 1999).
The comprehensive antimicrobial action of the B. monosperma against the microorganisms tested could be ascribed to the anionic components such as thiocynate, nitrate, chloride and sulphates besides other water soluble components which are naturally occurring in most plant materials as has been already reported by Darout et al. (2002).
The petroleum ether and chloroform extracts of different parts of B. monosperma showed mild antimicrobial action, may be due to little diffusion properties of these extracts in the agar. The methanolic extract of flowers exhibited slightly better inhibitory action against most of the microorganisms tested than the methanolic extracts of the other parts. On the other hand, the aqueous extracts of leaves and flowers showed better results for the growth inhibition of the microorganisms tested.
S. aureus was found more susceptible to all the types of extracts of different plant parts except that of the bark. Moreover, gram-positive bacteria were found to be more susceptible than gram-negative bacteria. This could be due to the fact that gram-positive bacteria lack the natural sieve effect against large molecules due to the effect against large molecules due to small pores in their cell envelops (Gould & Booker, 2000).
The MIC values of extracts were in mg/ml range, while the MIC of the standard discs as evaluated by Dulger & Gonuz (2004) was in µg/ml. Thus, the extracts of all parts of plants were active against microorganisms tested although the activity was much lower than the standard discs. The activity of plant extracts against bacteria may be indicative of the presence of antibacterial compounds or simple general metabolic toxins in the plant material. After the characterization of the active ingredients in these plants, new chemical classes of antimicrobial agents as new medicine for the maintenance of human health can be developed.
REFERENCES
Chan, L.W., Cheah, E.L.C., Saw, C.L.L., Weng, W. & Heng, P.W.S., 2008.
Antimicrobial and antioxidant activities of Cortex Magnoliae offcianalis and some other medicinal plants used in South-East Asia. Chinese Med., 3:15.
Cowan, M.M., 1999. Plant products as antimicrobial agents. Clinic Microbiol. Rev., 12: 564-82.
Darout, I., Cristy, A., Skaug, N. & Egeberg, P., 2002. Identification and quantification of some potentially antimicrobial anionic components in Miswak extract. Ind. J. Pharm., 32:11-14.
VOL. 58 (1&2) ANTIMICROBIAL ACTIVITY OF B. MONOSPERMA 173
Dulger, B. and Gonuz, A., 2004. Antibacterial activity of certain plants used in Turkish traditional medicines. Asian J. Plant Sci., 3(1): 104-107.
Essawi, T. & Srour, M., 2000. Screening of some Palestinian medicinal plants for antimicrobial activity. J. Ethnopharm., 70:343-349.
Gibbons, A., 1992. Exploring new strategies to fight drug resistant microbes. Science, 257: 1036-1038.
Gould, D. & Booker, C., 2000. Applied Microbiology for Nurses. Aardvak Editorial, Mcndham, Suffolk, pp: 75-94.
Javid, S. & Ali, M., 2002. Antimicrobial activity of higher plants. Hamdard Medicus, XLV (3): 71-74.
Murray, P.R., Baron, E.J., Pfaller, M.A., Tenover, F.C. & Yolke. R.H., 1999. Manual for Clinical Microbiology. 7
th Ed. Washington: ASM, 1527-39.
Noumi, E. & Youmi, A., 2001. Medicinal plants used for intestinal diseases in Mbalmyo region. Cameroon, 72: 246-254.
Tadeg, H., Mohammed, E., Asres, K. & Gebre-Mariam, T., 2005. Antimicrobial activities of some selected traditional Ethiopian medicinal plants used in the treatment of skin disorders. J. Ethnopharm., 100: 168-175.
World Health Organization, 2001. General guidelines for methodologies on research and evaluation of traditional medicine.WHO, Geneva, Switzerland, p.1.
Yao, J. & Moellering, R., 1995. Antibacterial agents. In Murray, P.R., Baron, E.J., Pfaller, M.A., Tenover, F.C. & Yolke. R.H., 1999. Manual Clinical Microbiol., 7
th Ed. Washington: ASM, 1281-90.
BIOLOGIA (PAKISTAN) 2012, 58 (1&2), 175-178 PK ISSN 0006 - 3096
Corresponding author: [email protected]
Racoma ramzani, A New Snow Carp (Teleostei: Cyprinidae:
Schizothoracinae) From Pakistan
1MUHAMMAD NAEEM JAVED ,
2AZIZULLAH &
3KHALID PERVAIZ
1,2
Department of Zoology, Govt. College University Lahore 3Department of Fisheries, Punjab, Lahore
ABSTRACT
Snow carps of Pakistan were represented by eleven species belonging to four tribes of subfamily schizothoracinae of family cyprinidae. A new species Racoma ramzani
has now been described from the river Indus, near Manser, five kilometers upstream of Kabul – Indus confluence. The new species is easily distinguishable from the related species in shape and structure of lower lip, number and position of serrations, structure of dorsal spine and number of lateral line scales.
Key words: Snow carps, Schizothoracinae, Pakistan, Kashmir.
INTRODUCTION
The fishes of the subfamily schizothoracinae of family cyprinidae are commonly found in mountain streams of Pakistan and Kashmir. These are of great economic importance as food and game fishes. Earlier, they were known as snow trouts and mountain barbells but now popularly known as snow carps as suggested by Mirza (1990). Previously eleven species of subfamily schizothoracinae described from Pakistan has been classified in four tribes by Mirza & Afridi (2002), which are Schizothoracinae Schizocyprini Diptychini and Schizopygopsini Genus Racoma was represented by only one species and Racoma ramzani is an addition to it. It is distinguishable from Racoma labiata in the shape and structure of lower lip and number of lateral line scales. It differs from another closely related fish Schizothorax fedtschenkoi Kesler, as described by Berg (1964), in the structure of dorsal spine and number and position of serrations.
MATERIALS AND METHODS
The description of new species is based on a 345 mm SL specimen collected from the river Indus, five km upstream of Kabul – Indus confluence near Mansar, Punjab, Pakistan. It was fixed in 10 % commercial formalin and later preserved in 70 % alcohol. Measuremente were made with the help of mm ruler and vernier caliper having accuracy of 1/10
th of a mm. Hand lens of 2X, 4X and
dissecting microscope was used for minute features. Photographs were taken with the help of 10 Megapixil, digital Sanyo camera. Measurement procedures follow Jayaram (1999)
176 M. N. JAVED ET. AL BIOLOGIA (PAKISTAN)
RESULTS
Racoma ramzani, new species Holotype: 345 mm S L, 412mm TL, deposited in Museum of Natural History, Department of Zoology, Government College University, Lahore, Pakistan D. I, 8; P, 15; V. 9; A. I, 5; C.19; L1. 90; 29/20 Body from: A medium sized fish with strong, well built, muscular, typically streamlined body which is somewhat ideal for living in swift waters. Dorsal profile rises steeply from the tip of snout to the posterior part of head then slightly up to the middle of the distance between the tip of snout to the origin of dorsal fin, becomes almost flat to the dorsal origin, then slops down gently to the base of caudal fin; ventral profile slightly arched uniformly between the tip of snout to the base of caudal fin. Body deepest in front of dorsal fin; 18.33% of total length, 22.65% of standard length and 96.25% of head length. Lateral line complete with relatively larger and prominent scales. Head: Head acutely triangular from lateral and dorsal view; longer than high and higher than broad, longer than maximum body depth; its length 19.05% of total length and 23.53% of standard length; its height 70% of its length, 13.33% of total length, 16.47% of standard length and 72.73 % of body depth; its breadth 82.14% of its height, 10.95% of total length and 13.93% of standard length. Snout: Acute and somewhat pointed with pairs of nostrils very close to the eye; nasal flap very well developed; a small area in front of each nostril slightly depressed (or sunken); a patch of very fine tubercles present between the nostril and eye of each side at dorsolateral position; relatively larger and prominent tubercles starting from below the nostril of each side, concentrated on lateral and anterior side of snout; its length 7.98% of total length, 9.85% of standard length and 41.86% of head length. Eyes: Prominent, dorsolateral in position, nearer to the tip of snout than to the posterior margin of head; only a small bulged out part visible from the ventral side; its diameter 2.94% of standard length, 12.5 % of head length, 29.85 % of snout length and 35.09 % of interorbital space. Interorbital space slightly convex, a little shorter than the snout length; its width 6.78% of total length and 8.38% of standard length.
Mouth ventral in position, gape of mouth arched and somewhat horse shoe shaped. Lips fleshy and continuous across the angles of mouth. Upper lip in the form of a thick broad flap rolled on itself forming a fleshy rostral fold along the anterior as well as lateral sides, extending up to a vertical from the anterior margin of nostril; lower lip in the form of two broad ventral flaps connected anteriorly having very prominent muscular ridges in the posterior half which may help the fish in sticking to the stones and rocks in fast moving water; two pairs of moderately developed barbels, a rostral and a maxillary pair, almost equal in length; longer than eye diameter; rostral reaching the nostril and maxillary reaching the posterior margin of eye. Fins: Three median (dorsal, anal and caudal) and two paired (pectoral and pelvic) fins present. Dorsal fin commences slightly in the posterior half of standard length; nearer to the caudal fin base than to the tip of snout, its height shorter than the head length, caudal fin length and maximum body depth; length of dorsal fin 19.12% of standard length and 15.48% of total length, predorsal distance
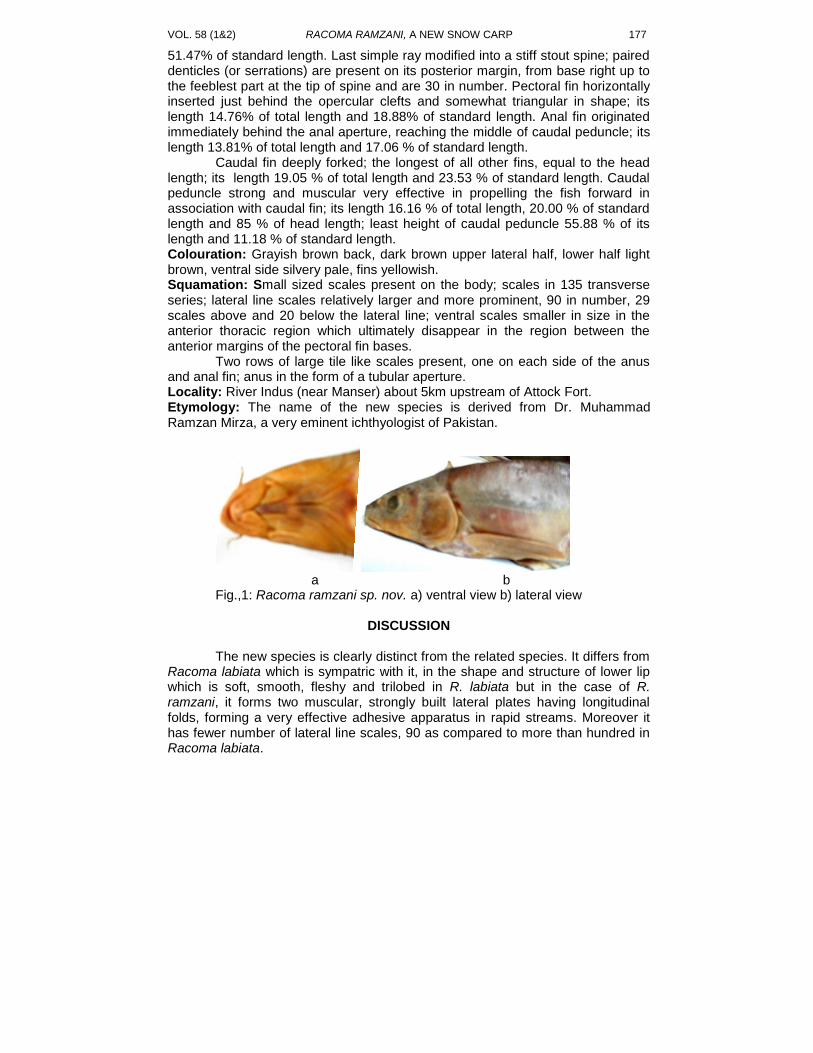
VOL. 58 (1&2) RACOMA RAMZANI, A NEW SNOW CARP 177
51.47% of standard length. Last simple ray modified into a stiff stout spine; paired denticles (or serrations) are present on its posterior margin, from base right up to the feeblest part at the tip of spine and are 30 in number. Pectoral fin horizontally inserted just behind the opercular clefts and somewhat triangular in shape; its length 14.76% of total length and 18.88% of standard length. Anal fin originated immediately behind the anal aperture, reaching the middle of caudal peduncle; its length 13.81% of total length and 17.06 % of standard length. Caudal fin deeply forked; the longest of all other fins, equal to the head length; its length 19.05 % of total length and 23.53 % of standard length. Caudal peduncle strong and muscular very effective in propelling the fish forward in association with caudal fin; its length 16.16 % of total length, 20.00 % of standard length and 85 % of head length; least height of caudal peduncle 55.88 % of its length and 11.18 % of standard length. Colouration: Grayish brown back, dark brown upper lateral half, lower half light brown, ventral side silvery pale, fins yellowish. Squamation: Small sized scales present on the body; scales in 135 transverse series; lateral line scales relatively larger and more prominent, 90 in number, 29 scales above and 20 below the lateral line; ventral scales smaller in size in the anterior thoracic region which ultimately disappear in the region between the anterior margins of the pectoral fin bases. Two rows of large tile like scales present, one on each side of the anus and anal fin; anus in the form of a tubular aperture. Locality: River Indus (near Manser) about 5km upstream of Attock Fort. Etymology: The name of the new species is derived from Dr. Muhammad Ramzan Mirza, a very eminent ichthyologist of Pakistan.
a b Fig.,1: Racoma ramzani sp. nov. a) ventral view b) lateral view
DISCUSSION The new species is clearly distinct from the related species. It differs from
Racoma labiata which is sympatric with it, in the shape and structure of lower lip which is soft, smooth, fleshy and trilobed in R. labiata but in the case of R. ramzani, it forms two muscular, strongly built lateral plates having longitudinal folds, forming a very effective adhesive apparatus in rapid streams. Moreover it has fewer number of lateral line scales, 90 as compared to more than hundred in Racoma labiata.
178 M. N. JAVED ET. AL BIOLOGIA (PAKISTAN)
Another related species discussed by Berg (1949) is Schizothorax fedtschenkoi Kessler recorded from the river Amur and the Samarkand region. Here the dorsal spine is feeble with 10 to 22 serrations up to the middle, while in R. ramzani, spine is strong with 30 serrations spread all over up to the tip of the spine.
It can be differentiated from Schizothorax plagiostomus which has transverse papillated plate, with sharp cutting edge. This plate is absent in R. ramzani.
REFERENCES Berg, L. S., 1949. Freshwater fishes of the USSR and Adjacent Countries.
Academy of Sciences of the USSR Zoological Institute. Jayaram, K. C., 1999. The freshwater fishes of the Indian region. Delhi: Narendra
Publishing House, India. Mirza, M. R., 1990. Freshwater Fishes in Pakistan. Urdu Science Board, Lahore,
Pakistan. Mirza, M. R. & Afridi, R., 2002. A note on the distribution of the snow carps
(Pisces: Cyprinidae: Schizothoracinae) in Pakistan and Kashmir. Pak. J. Zool., 34(2):171 – 173.
BIOLOGIA (PAKISTAN) 2012, 58 (1&2), 179-183 PK ISSN 0006 - 3096
*Corresponding author: [email protected]
Bischofia javanica: A new record to the Flora of Pakistan
*MUHAMMAD AJAIB1 & ZAHEER-UD-DIN KHAN
2
1,2
Department of Botany, GC University Lahore, Pakistan
ABSTRACT
A pretty tree growing in the main campus GC University Lahore was identified as Bischofia javanica Blume (Bishopwood Tree) of family Euphorbiaceae. The tree is
characterized by red sap and bark and trifoliate leaves. The voucher plant specimen was preserved in Dr. Sultan Ahmad Herbarium, GCU Lahore, Pakistan for further reference. This tree species has not been reported in Flora of Pakistan; therefore, the present report is a new record in the same. Key words: Bischofia javanica, Bishopwood Tree, Family Euphorbiaceae, Flora of
Pakistan
INTRODUCTION
Family Euphorbiaceae commonly called Spurge family is a large family of flowering plants containing 300 genera and 500 species and is the sixth largest family among anthophyta. It is a sub-cosmopolitan family with strong representation in humid tropics and sub-tropics. In Pakistan this family is represented by many exotic species (Radcliffe-Smith, 1986).
The genus Bischofia was named after the name of G.W. Bischoff, a botanist and entomologist in Royal Academy Amsterdam (Parker, 1956). The genus was first described by Blume (1826–1827) in Bijdr. 1168 and representing only two species, Bischofia javanica Blume and B. polycarpa (H. Léveillé) Airy Shaw (Shu et al., 2008). Currently this genus has been placed in family Phyllanthaceae, which is split apart from Euphorbiaceae and consisting of Phyllanthus, Antidesma, Glochidion, Bridelia, Cleistanthus, etc. Phyllanthaceae having various growth forms is mainly identified by the finely-cracking bark, absence of latex, usually 2-ranked and pinnately-veined leaves lacking glands, and dehiscent fruit with persistent columella and two ovules in each carpel. Bischofia javanica is widely distributed in the Pacific Islands, Malesia, SE Asia, Southern China, possibly also in Tonga and Samoa including Taiwan, Southern Japan, Myanmar, and India. It is well-known in New Caledonia, Tonga, Rarotonga, Fiji, Niue, Vanuatu, and Samoa and is usually a dominant tree in some forests in Cook Islands of Rarotonga (Whistler, 1991; Smith, 1981).
B. javanica is native to the Chinese provinces of Kwangtung, Fukien, Kweichow, Yunnan and Hupeh and may also be to Burma, India, the Andaman Islands, tropical Australia, Malaysia and Polynesia. In India, tigers are found clearing their claws by digging them into the soft, astringent bark of the Bishopwood Tree. Throughout its natural range it occurs from sea-level to an altitude of 5,000 ft and is often associated with teak (Morton, 1984).
Naturally B. javanica found in Myristica lowland rain forest begins at the landward edge of the coastal forest Eua Island, Tonga and is leading dominant
M. AJAIB & Z. KHAN BIOLOGIA (PAKISTAN)
180
with Dendrocnide harveyi (Drake et al., 1996). B. javanica is also found in alluvial plains semi-evergreen forests along with other deciduous species, i.e. Aglaia spectabilis, Ailanthus integrifolia, Artocarpus chalasha, Canarium strictum, Castanopsis indica, Chukrasia tabularis, Duabanga grandiflora, Dysoxylum gobara, Harpulia arborea, Phoebe hainsiana, Terminalia myriocarpa, etc. in India and Lahore, Pakistan comprised mainly the flat alluvial Plains of Indus covering the major part of Punjab having hot dry summers and mild winters with maximum daily temperature in summer, 41-46
oc (Jalali & Jamzad, 1999; Nasir & Rafiq
1995). B. javanica was introduced as an ornamental tree in main campus GC
University Lahore, Pakistan in 1991 and since then it is thriving very well, producing flowers and fruits. This tree species has not been reported by Chaudhary (1969), Stewart (1972) and Radcliffe-Smith (1986) while documenting the Flora of Pakistan.
Description of Bischofia javanica Blume
An evergreen, fast growing tree, upto 35m tall with cylindrical trunk and light-brown to grayish, shallowly and narrowly fissured bark. Stem straight with red to dark brown heartwood and glabrous branchlets. Leaves usually palmately 3-foliate rarely 5-foliate; stipules caducous, membranous, lanceolate, upto 0.5cm long; petiole 8–20cm long, pulvinate; terminal petiolule 1–5cm long, lateral petiolules 0.5–2cm; leaflet ovate, elliptic, obovate, or elliptic-oblong, papery, minutely pubescent on nerves, glabrescent, base broadly cuneate to obtuse, 7–15 × 4–8 cm in size; crenate with 2 or 3 teeth per cm, apex acute or acuminate; lateral nerves 6-8 pairs. Flowers green in axillary, paniculate clusters; Male flowers 2.5mm in diameter; sepals membranous, ladle-shaped, semi-orbicular, adaxially concave, abaxially pubescent outside; petals 0; stamen 5; filaments short; pistillode short, broad, peltate, pubescent; anthers large, dehiscing lengthwise; peduncle upto 13cm, pubescent to glabrous; Female flowers with sepals similar to male but oblong-ovate, margins membranous; ovary smooth, glabrous, exerted, tri-locular; styles 3, linear, entire; peduncle 15–27cm long. Fruits globose or subglobose, smooth, upto 1cm in diam., brownish. Seeds oblong, brown to black, smooth, shining, upto 5mm in length (Plate 1).
Syn.: Bischofia trifoliata (Roxb.) Hooker; B. leptopoda Muller Argoviensis; B. oblongifolia Decaisne; B. cumingiana Decaisne; B. roeperiana Decaisne; B. toui Decaisne; Andrachne trifoliata Roxb.; Microelus roeperianus (Decaisne) Wight & Arnott; Stylodiscus trifoliatus (Roxb.) Bennett.
Vern.: Bishopwood, Javawood, Java Cedar (English), Paniola (India), Koka (Polynesia), Tuai (Philippines) and ’o’a (Samoa). Flowering period: April–May; fruiting period: August–October; Voucher No. SAH. 2214 Ethnobtany
Economically the plant is very useful and can yield: 1. Useful timber
According to Morton (1984) the main asset value of the bishopwood tree is because of its source of useful timber-wood in India, Burma, Taiwan, East Africa and South Africa which somewhat resembles walnut tree (Juglans regia)
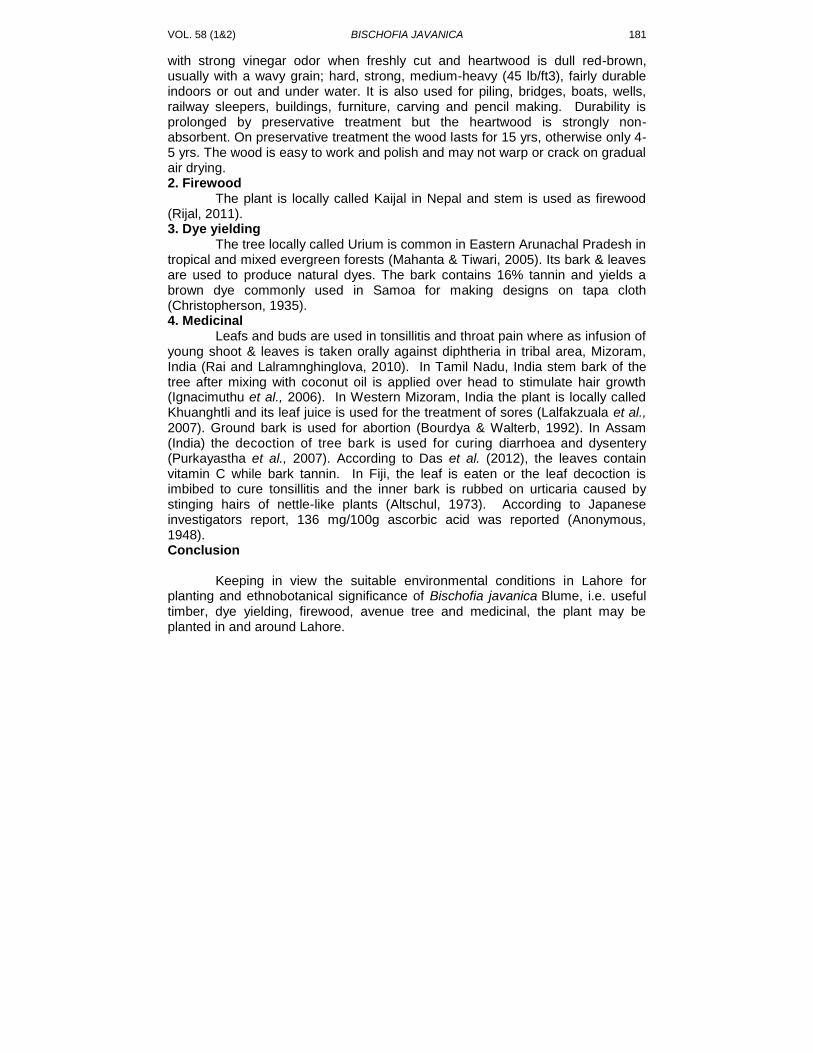
VOL. 58 (1&2) BISCHOFIA JAVANICA
181
with strong vinegar odor when freshly cut and heartwood is dull red-brown, usually with a wavy grain; hard, strong, medium-heavy (45 lb/ft3), fairly durable indoors or out and under water. It is also used for piling, bridges, boats, wells, railway sleepers, buildings, furniture, carving and pencil making. Durability is prolonged by preservative treatment but the heartwood is strongly non-absorbent. On preservative treatment the wood lasts for 15 yrs, otherwise only 4-5 yrs. The wood is easy to work and polish and may not warp or crack on gradual air drying. 2. Firewood
The plant is locally called Kaijal in Nepal and stem is used as firewood (Rijal, 2011). 3. Dye yielding
The tree locally called Urium is common in Eastern Arunachal Pradesh in tropical and mixed evergreen forests (Mahanta & Tiwari, 2005). Its bark & leaves are used to produce natural dyes. The bark contains 16% tannin and yields a brown dye commonly used in Samoa for making designs on tapa cloth (Christopherson, 1935). 4. Medicinal
Leafs and buds are used in tonsillitis and throat pain where as infusion of young shoot & leaves is taken orally against diphtheria in tribal area, Mizoram, India (Rai and Lalramnghinglova, 2010). In Tamil Nadu, India stem bark of the tree after mixing with coconut oil is applied over head to stimulate hair growth (Ignacimuthu et al., 2006). In Western Mizoram, India the plant is locally called Khuanghtli and its leaf juice is used for the treatment of sores (Lalfakzuala et al., 2007). Ground bark is used for abortion (Bourdya & Walterb, 1992). In Assam (India) the decoction of tree bark is used for curing diarrhoea and dysentery (Purkayastha et al., 2007). According to Das et al. (2012), the leaves contain vitamin C while bark tannin. In Fiji, the leaf is eaten or the leaf decoction is imbibed to cure tonsillitis and the inner bark is rubbed on urticaria caused by stinging hairs of nettle-like plants (Altschul, 1973). According to Japanese investigators report, 136 mg/100g ascorbic acid was reported (Anonymous, 1948). Conclusion
Keeping in view the suitable environmental conditions in Lahore for
planting and ethnobotanical significance of Bischofia javanica Blume, i.e. useful timber, dye yielding, firewood, avenue tree and medicinal, the plant may be planted in and around Lahore.
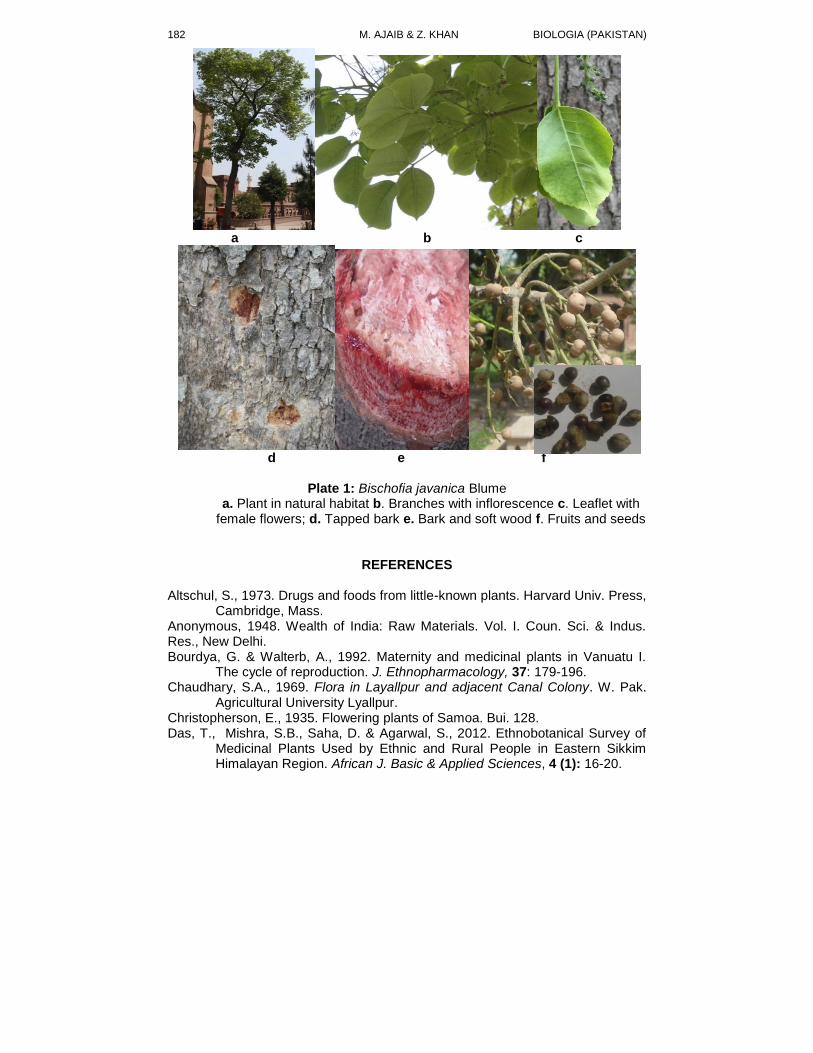
M. AJAIB & Z. KHAN BIOLOGIA (PAKISTAN)
182
a b c
d e f
Plate 1: Bischofia javanica Blume
a. Plant in natural habitat b. Branches with inflorescence c. Leaflet with female flowers; d. Tapped bark e. Bark and soft wood f. Fruits and seeds
REFERENCES
Altschul, S., 1973. Drugs and foods from little-known plants. Harvard Univ. Press, Cambridge, Mass.
Anonymous, 1948. Wealth of India: Raw Materials. Vol. I. Coun. Sci. & Indus. Res., New Delhi. Bourdya, G. & Walterb, A., 1992. Maternity and medicinal plants in Vanuatu I.
The cycle of reproduction. J. Ethnopharmacology, 37: 179-196. Chaudhary, S.A., 1969. Flora in Layallpur and adjacent Canal Colony. W. Pak.
Agricultural University Lyallpur. Christopherson, E., 1935. Flowering plants of Samoa. Bui. 128. Das, T., Mishra, S.B., Saha, D. & Agarwal, S., 2012. Ethnobotanical Survey of
Medicinal Plants Used by Ethnic and Rural People in Eastern Sikkim Himalayan Region. African J. Basic & Applied Sciences, 4 (1): 16-20.
VOL. 58 (1&2) BISCHOFIA JAVANICA
183
Drake, D.R., Whistler, W.A., Motley, .J. & Imada, C.T., 1996. Rain forest vegetation of Eua Island, Kingdom of Tonga. New Zealand J. Botany, 34: 65-77.
Ignacimuthu, S., Ayyanar, M. & Sivaraman S., 2006. Ethnobotanical investigations among tribes in Madurai District of Tamil Nadu (India). 2: 1-7.
Jalali, A., & Jamzad, Z., 1999. Red Data Book of Iran. Research Institute of Forests and Rangelands (RIFR). pp: 1-4.
Lalfakzuala, R., Lalramnghinglova, H. & Kayang, H., 2007. Ethnobotanical Usages of Plants in Western Mizoram. Indian J. Traditional Knowledge, 6 (3): 486-493.
Mahanta, D. & Tiwari, S.C., 2005. Natural dye-yielding plants and indigenous knowledge on dye preparation in Arunachal Pradesh, Northeast India. Current Science, 88 (9): 1474-1482.
Morton, J.F., 1984. Nobody Loves the Bischofia Anymore. Proc. Fla. State Hort. Soc. 97:241-244.
Nasir, Y.J. & Rafiq, R.A., 1995. Wild Flowers of Pakistan. Oxford University Press, Karachi.
Parker, R.N., 1956. A Forest Flora for the Punjab with Hazara and Delhi, Ed. 3. Superintendent, Govt. printing press Lahore.
Purkayastha, J., Dutta, M. & Nath, S.C., 2007. Ethnomedicinal plants from Dibru-Saikhowa biosphere reserve, Assam. Indian J. Traditional Knowledge, 6 (3): 477-480.
Radcliffe-Smith, A., 1986. Flora of Pakistan. No. 172. Euphorbiaceae. E. Nasir and S.I.Ali (eds.) Department of Botany, University of Karachi, Karachi.
Rai1, P.K. & Lalramnghinglova, H., 2010. Ethnomedicinal Plant Resources of Mizoram, India: Implication of Traditional Knowledge in Health Care System. Ethnobotanical Leaflets, 14: 274-305.
Rijal, A., 2011. Surviving on Knowledge: Ethnobotany of Chepang community from midhills of Nepal. Ethnobotany Research & Applications, 9:181-215.
Shu, Q. F., Bingtao, L., Gilbert, M.G., 2008. Flora of China. Bischofia Blume. 11: 217–218.
Smith, A. C. 1981. Flora Vitiensis Nova. Vol. 2. Pacific Tropical Botanical Gardens, Lawai, Kauai, Hawaii.
Stewart, R.R., 1972. An Annotated Catalogue of the Vascular Plants of West Pakistan and Kashmir. Flora of West Pakistan. E. Nasir and S.I. Ali, (eds.) Fakhri Printing Press, Karachi.
Whistler, W. A., 1991. Polynesian plant introduction. In Cox, P. A.; Banack, S. A. (eds.), Islands, plants and Polynesians. An introduction to Polynesian ethnobotany. Dioscorides Press, Portland, Oregon: pp. 41-66.