Embed Size (px)
Citation preview

Af
AJa
b
c
d
a
ARA
KMISN3
1
(2wvea
1olMa
0h
Postharvest Biology and Technology 86 (2013) 125–133
Contents lists available at SciVerse ScienceDirect
Postharvest Biology and Technology
jou rn al h om epage: www.elsev ier .com/ locate /postharvbio
ssessment of watercore development in apples with MRI: Effect ofruit location in the canopy
ngela Melado-Herrerosa,∗, Miguel-A. Munoz-Garcíab, Alvaro Blancoc,esús Valc, Ma Encarnación Fernández-Valled, Pilar Barreiroa
LPF-TAGRALIA, ETSI Agrónomos, CEI-MONCLOA, Avda. Complutense s/n, 28040 Madrid, SpainLPF-TAGRALIA, EUIT Agrícolas, CEI-MONCLOA, Avda. Complutense s/n, 28040 Madrid, SpainEstación Experimental de AulaDei (CSIC), Avda. Montanana, 1005-50059 Zaragoza, SpainCAI of Nuclear Magnetic Resonance, Universidad Complutense de Madrid, CEI-MONCLOA, Avda. Juan XXIII, 1, 28040 Madrid, Spain
r t i c l e i n f o
rticle history:eceived 25 February 2013ccepted 16 June 2013
eywords:RI
nternal fruit qualityugar contenton-destructiveD segmentation
a b s t r a c t
Watercore distribution inside apple fruit (block or radial), and its incidence (% of tissue) were relatedto the effect of solar radiation inside the canopy as measured by a set of low-cost irradiation sensors.221 samples were harvested in two seasons from the top and the bottom of the canopy and submittedto the non-invasive and non-destructive technique of magnetic resonance imaging (MRI) in order toobtain 20 inner tomography slices from each fruit and analyze the damaged areas using an interactive3D segmentation method. The number of fruit corresponding to each type of damage and the relevantpercentage were calculated and it was found that apples from the top of the tree were mainly of the radialtype (84%) and had more watercore (approx. 5% more) than apples from the bottom (65% radial). From theimage segmentation, the Euler number, a morphometric parameter, was extracted from the segmentedimages and related to the type of watercore symptoms. Apples with block watercore were grouped in
Euler numbers between −400 and 400 with a small evolution. For apples with radial development, theEuler number was highly negative: up to −1439. Significant differences were also found regarding sugarcomposition, with higher fructose and total sugar contents in apples from the upper canopy, compared tothose in the lower canopy location. In the seasons studied (2011 and 2012), significantly higher sorbitoland lower sucrose and fructose contents were found in watercore-affected tissue compared to the healthytissue of affected apples and also compared to healthy apples.. Introduction
Watercore is a physiological disorder affecting apples and pearsKajiura et al., 1976; Yamaki et al., 1976, 1977; Inomata and Suzuki,001), involving the appearance of fluid-filled intercellular spacesith elevated sorbitol rates (Marlow and Loescher, 1985). In some
arieties and in some parts of the world, such as Japan, it is consid-red as an indicator of full ripeness and they are called ‘honeyedpples’ (Kasai and Arakawa, 2010).
Although this disorder was described a long time ago (Evans,909; Faust and Williams, 1969), its physiological mechanism is
nly partially understood. Several authors have described physio-ogical and biochemical factors affecting watercore: for example,arlow and Loescher (1985) found that sorbitol dehydrogenasectivity increased during maturation but no relationship was found
∗ Corresponding author. Tel.: +34 913365862.E-mail address: [email protected] (A. Melado-Herreros).
925-5214/$ – see front matter © 2013 Elsevier B.V. All rights reserved.ttp://dx.doi.org/10.1016/j.postharvbio.2013.06.030
© 2013 Elsevier B.V. All rights reserved.
between the susceptibility of watercore development and the activ-ity of this enzyme. Wang and Faust (1992a) determined that applesaffected by watercore produce more ethylene and had highercontents of polyamine compounds. Wang and Faust (1992b) statedthat fruit with watercore had more glycolipids, and that the mem-brane lipids were altered in watercore-affected fruit. Bowen andWatkins (1997) found higher internal ethylene concentrations, sol-uble solid content and dry matter, sorbitol and sucrose and lowercontents of glucose and fructose in apples with higher watercoresymptoms. Flesh firmness, starch and calcium concentrations werealso lower in slight watercore incidences but increased again inmoderate to severe watercore cases. Gao et al. (2005) proposedthat sorbitol accumulation in the intercellular space is related toa decrease in the ability to transport sorbitol into parenchyma tis-sues in late watercore apples. Nevertheless, Yamada and Kobayashi(1999) found no links between watercore and sorbitol or maturity
indices (such as ethylene), membrane permeability and flesh firm-ness in affected and non-affected apples induced by preharvest fruittemperature. Kweon et al. (2012) linked watercore disorder to fruitmaturity.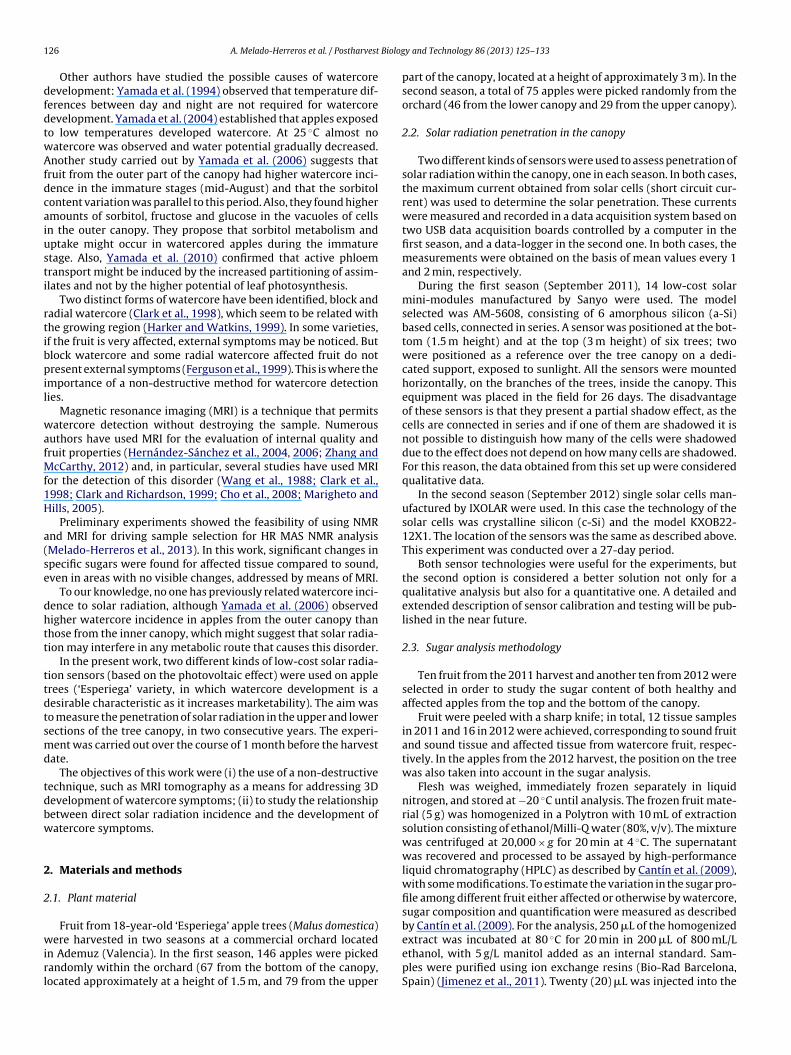
1 Biolog
dfdtwAfdcaiusti
rtibpil
wafMf1H
a(se
dhtt
ttdtsmd
tdbw
2
2
wirl
26 A. Melado-Herreros et al. / Postharvest
Other authors have studied the possible causes of watercoreevelopment: Yamada et al. (1994) observed that temperature dif-erences between day and night are not required for watercoreevelopment. Yamada et al. (2004) established that apples exposedo low temperatures developed watercore. At 25 ◦C almost noatercore was observed and water potential gradually decreased.nother study carried out by Yamada et al. (2006) suggests that
ruit from the outer part of the canopy had higher watercore inci-ence in the immature stages (mid-August) and that the sorbitolontent variation was parallel to this period. Also, they found highermounts of sorbitol, fructose and glucose in the vacuoles of cellsn the outer canopy. They propose that sorbitol metabolism andptake might occur in watercored apples during the immaturetage. Also, Yamada et al. (2010) confirmed that active phloemransport might be induced by the increased partitioning of assim-lates and not by the higher potential of leaf photosynthesis.
Two distinct forms of watercore have been identified, block andadial watercore (Clark et al., 1998), which seem to be related withhe growing region (Harker and Watkins, 1999). In some varieties,f the fruit is very affected, external symptoms may be noticed. Butlock watercore and some radial watercore affected fruit do notresent external symptoms (Ferguson et al., 1999). This is where the
mportance of a non-destructive method for watercore detectionies.
Magnetic resonance imaging (MRI) is a technique that permitsatercore detection without destroying the sample. Numerous
uthors have used MRI for the evaluation of internal quality andruit properties (Hernández-Sánchez et al., 2004, 2006; Zhang and
cCarthy, 2012) and, in particular, several studies have used MRIor the detection of this disorder (Wang et al., 1988; Clark et al.,998; Clark and Richardson, 1999; Cho et al., 2008; Marigheto andills, 2005).
Preliminary experiments showed the feasibility of using NMRnd MRI for driving sample selection for HR MAS NMR analysisMelado-Herreros et al., 2013). In this work, significant changes inpecific sugars were found for affected tissue compared to sound,ven in areas with no visible changes, addressed by means of MRI.
To our knowledge, no one has previously related watercore inci-ence to solar radiation, although Yamada et al. (2006) observedigher watercore incidence in apples from the outer canopy thanhose from the inner canopy, which might suggest that solar radia-ion may interfere in any metabolic route that causes this disorder.
In the present work, two different kinds of low-cost solar radia-ion sensors (based on the photovoltaic effect) were used on applerees (‘Esperiega’ variety, in which watercore development is aesirable characteristic as it increases marketability). The aim waso measure the penetration of solar radiation in the upper and lowerections of the tree canopy, in two consecutive years. The experi-ent was carried out over the course of 1 month before the harvest
ate.The objectives of this work were (i) the use of a non-destructive
echnique, such as MRI tomography as a means for addressing 3Development of watercore symptoms; (ii) to study the relationshipetween direct solar radiation incidence and the development ofatercore symptoms.
. Materials and methods
.1. Plant material
Fruit from 18-year-old ‘Esperiega’ apple trees (Malus domestica)
ere harvested in two seasons at a commercial orchard locatedn Ademuz (Valencia). In the first season, 146 apples were pickedandomly within the orchard (67 from the bottom of the canopy,ocated approximately at a height of 1.5 m, and 79 from the upper
y and Technology 86 (2013) 125–133
part of the canopy, located at a height of approximately 3 m). In thesecond season, a total of 75 apples were picked randomly from theorchard (46 from the lower canopy and 29 from the upper canopy).
2.2. Solar radiation penetration in the canopy
Two different kinds of sensors were used to assess penetration ofsolar radiation within the canopy, one in each season. In both cases,the maximum current obtained from solar cells (short circuit cur-rent) was used to determine the solar penetration. These currentswere measured and recorded in a data acquisition system based ontwo USB data acquisition boards controlled by a computer in thefirst season, and a data-logger in the second one. In both cases, themeasurements were obtained on the basis of mean values every 1and 2 min, respectively.
During the first season (September 2011), 14 low-cost solarmini-modules manufactured by Sanyo were used. The modelselected was AM-5608, consisting of 6 amorphous silicon (a-Si)based cells, connected in series. A sensor was positioned at the bot-tom (1.5 m height) and at the top (3 m height) of six trees; twowere positioned as a reference over the tree canopy on a dedi-cated support, exposed to sunlight. All the sensors were mountedhorizontally, on the branches of the trees, inside the canopy. Thisequipment was placed in the field for 26 days. The disadvantageof these sensors is that they present a partial shadow effect, as thecells are connected in series and if one of them are shadowed it isnot possible to distinguish how many of the cells were shadoweddue to the effect does not depend on how many cells are shadowed.For this reason, the data obtained from this set up were consideredqualitative data.
In the second season (September 2012) single solar cells man-ufactured by IXOLAR were used. In this case the technology of thesolar cells was crystalline silicon (c-Si) and the model KXOB22-12X1. The location of the sensors was the same as described above.This experiment was conducted over a 27-day period.
Both sensor technologies were useful for the experiments, butthe second option is considered a better solution not only for aqualitative analysis but also for a quantitative one. A detailed andextended description of sensor calibration and testing will be pub-lished in the near future.
2.3. Sugar analysis methodology
Ten fruit from the 2011 harvest and another ten from 2012 wereselected in order to study the sugar content of both healthy andaffected apples from the top and the bottom of the canopy.
Fruit were peeled with a sharp knife; in total, 12 tissue samplesin 2011 and 16 in 2012 were achieved, corresponding to sound fruitand sound tissue and affected tissue from watercore fruit, respec-tively. In the apples from the 2012 harvest, the position on the treewas also taken into account in the sugar analysis.
Flesh was weighed, immediately frozen separately in liquidnitrogen, and stored at −20 ◦C until analysis. The frozen fruit mate-rial (5 g) was homogenized in a Polytron with 10 mL of extractionsolution consisting of ethanol/Milli-Q water (80%, v/v). The mixturewas centrifuged at 20,000 × g for 20 min at 4 ◦C. The supernatantwas recovered and processed to be assayed by high-performanceliquid chromatography (HPLC) as described by Cantín et al. (2009),with some modifications. To estimate the variation in the sugar pro-file among different fruit either affected or otherwise by watercore,sugar composition and quantification were measured as describedby Cantín et al. (2009). For the analysis, 250 �L of the homogenized
extract was incubated at 80 ◦C for 20 min in 200 �L of 800 mL/Lethanol, with 5 g/L manitol added as an internal standard. Sam-ples were purified using ion exchange resins (Bio-Rad Barcelona,Spain) (Jimenez et al., 2011). Twenty (20) �L was injected into the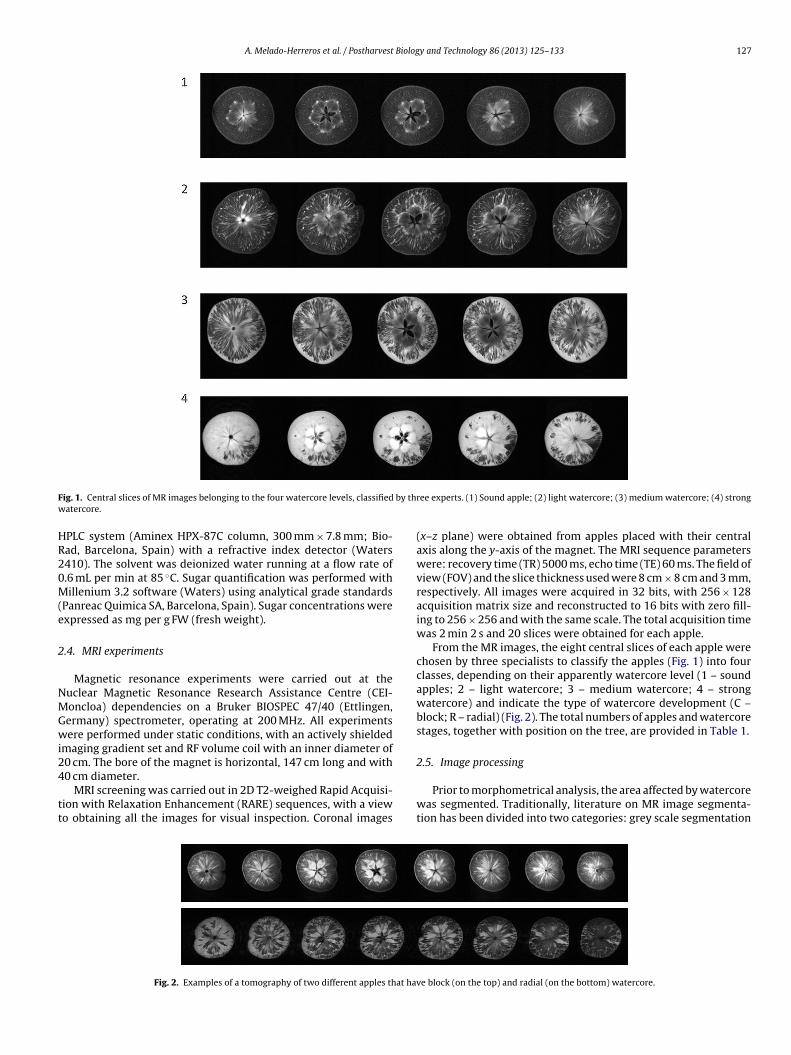
A. Melado-Herreros et al. / Postharvest Biology and Technology 86 (2013) 125–133 127
F by thw
HR20M(e
2
NMGwi24
tt
ig. 1. Central slices of MR images belonging to the four watercore levels, classifiedatercore.
PLC system (Aminex HPX-87C column, 300 mm × 7.8 mm; Bio-ad, Barcelona, Spain) with a refractive index detector (Waters410). The solvent was deionized water running at a flow rate of.6 mL per min at 85 ◦C. Sugar quantification was performed withillenium 3.2 software (Waters) using analytical grade standards
Panreac Quimica SA, Barcelona, Spain). Sugar concentrations werexpressed as mg per g FW (fresh weight).
.4. MRI experiments
Magnetic resonance experiments were carried out at theuclear Magnetic Resonance Research Assistance Centre (CEI-oncloa) dependencies on a Bruker BIOSPEC 47/40 (Ettlingen,ermany) spectrometer, operating at 200 MHz. All experimentsere performed under static conditions, with an actively shielded
maging gradient set and RF volume coil with an inner diameter of0 cm. The bore of the magnet is horizontal, 147 cm long and with
0 cm diameter.MRI screening was carried out in 2D T2-weighed Rapid Acquisi-ion with Relaxation Enhancement (RARE) sequences, with a viewo obtaining all the images for visual inspection. Coronal images
Fig. 2. Examples of a tomography of two different apples that hav
ree experts. (1) Sound apple; (2) light watercore; (3) medium watercore; (4) strong
(x–z plane) were obtained from apples placed with their centralaxis along the y-axis of the magnet. The MRI sequence parameterswere: recovery time (TR) 5000 ms, echo time (TE) 60 ms. The field ofview (FOV) and the slice thickness used were 8 cm × 8 cm and 3 mm,respectively. All images were acquired in 32 bits, with 256 × 128acquisition matrix size and reconstructed to 16 bits with zero fill-ing to 256 × 256 and with the same scale. The total acquisition timewas 2 min 2 s and 20 slices were obtained for each apple.
From the MR images, the eight central slices of each apple werechosen by three specialists to classify the apples (Fig. 1) into fourclasses, depending on their apparently watercore level (1 – soundapples; 2 – light watercore; 3 – medium watercore; 4 – strongwatercore) and indicate the type of watercore development (C –block; R – radial) (Fig. 2). The total numbers of apples and watercorestages, together with position on the tree, are provided in Table 1.
2.5. Image processing
Prior to morphometrical analysis, the area affected by watercorewas segmented. Traditionally, literature on MR image segmenta-tion has been divided into two categories: grey scale segmentation
e block (on the top) and radial (on the bottom) watercore.
128 A. Melado-Herreros et al. / Postharvest Biology and Technology 86 (2013) 125–133
Table 1Number of apples classified by their watercore level (sound, light, medium, strong),type of watercore development (C – block watercore; R – radial watercore) andposition on the tree (top and bottom).
Position Sound Light Medium Strong Total
– C R C R C R
Top 23 5 26 1 34 8 11 108Bottom 22 12 31 7 28 12 1 113
(boiv(fwettwsasomsaF
atatil2(fitfitecppmcs
2
airc
sttCa
Fig. 3. Comparison of the percentage of global irradiation (�), sensors on the bottom(�) and sensors on the top ( ) of the tree for the two kinds of solar cells on both
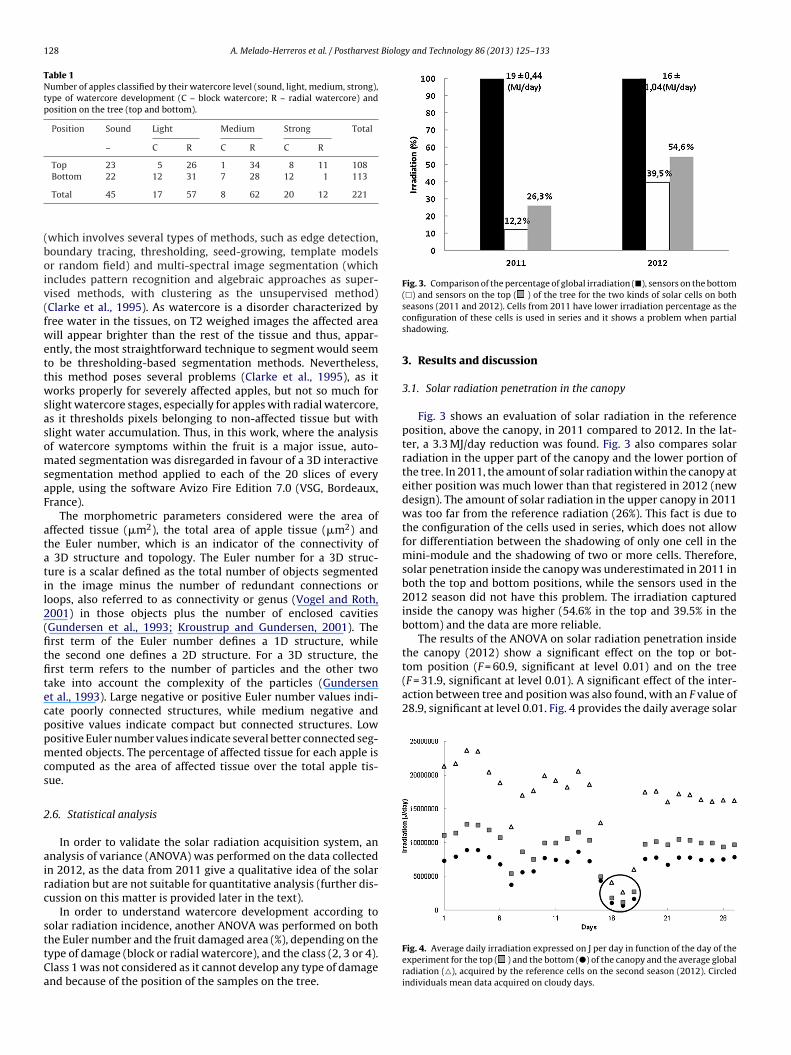
tom position (F = 60.9, significant at level 0.01) and on the tree(F = 31.9, significant at level 0.01). A significant effect of the inter-action between tree and position was also found, with an F value of28.9, significant at level 0.01. Fig. 4 provides the daily average solar
Total 45 17 57 8 62 20 12 221
which involves several types of methods, such as edge detection,oundary tracing, thresholding, seed-growing, template modelsr random field) and multi-spectral image segmentation (whichncludes pattern recognition and algebraic approaches as super-ised methods, with clustering as the unsupervised method)Clarke et al., 1995). As watercore is a disorder characterized byree water in the tissues, on T2 weighed images the affected areaill appear brighter than the rest of the tissue and thus, appar-
ntly, the most straightforward technique to segment would seemo be thresholding-based segmentation methods. Nevertheless,his method poses several problems (Clarke et al., 1995), as itorks properly for severely affected apples, but not so much for
light watercore stages, especially for apples with radial watercore,s it thresholds pixels belonging to non-affected tissue but withlight water accumulation. Thus, in this work, where the analysisf watercore symptoms within the fruit is a major issue, auto-ated segmentation was disregarded in favour of a 3D interactive
egmentation method applied to each of the 20 slices of everypple, using the software Avizo Fire Edition 7.0 (VSG, Bordeaux,rance).
The morphometric parameters considered were the area offfected tissue (�m2), the total area of apple tissue (�m2) andhe Euler number, which is an indicator of the connectivity of
3D structure and topology. The Euler number for a 3D struc-ure is a scalar defined as the total number of objects segmentedn the image minus the number of redundant connections oroops, also referred to as connectivity or genus (Vogel and Roth,001) in those objects plus the number of enclosed cavitiesGundersen et al., 1993; Kroustrup and Gundersen, 2001). Therst term of the Euler number defines a 1D structure, whilehe second one defines a 2D structure. For a 3D structure, therst term refers to the number of particles and the other twoake into account the complexity of the particles (Gundersent al., 1993). Large negative or positive Euler number values indi-ate poorly connected structures, while medium negative andositive values indicate compact but connected structures. Lowositive Euler number values indicate several better connected seg-ented objects. The percentage of affected tissue for each apple is
omputed as the area of affected tissue over the total apple tis-ue.
.6. Statistical analysis
In order to validate the solar radiation acquisition system, annalysis of variance (ANOVA) was performed on the data collectedn 2012, as the data from 2011 give a qualitative idea of the solaradiation but are not suitable for quantitative analysis (further dis-ussion on this matter is provided later in the text).
In order to understand watercore development according to
olar radiation incidence, another ANOVA was performed on bothhe Euler number and the fruit damaged area (%), depending on theype of damage (block or radial watercore), and the class (2, 3 or 4).lass 1 was not considered as it cannot develop any type of damagend because of the position of the samples on the tree.seasons (2011 and 2012). Cells from 2011 have lower irradiation percentage as theconfiguration of these cells is used in series and it shows a problem when partialshadowing.
3. Results and discussion
3.1. Solar radiation penetration in the canopy
Fig. 3 shows an evaluation of solar radiation in the referenceposition, above the canopy, in 2011 compared to 2012. In the lat-ter, a 3.3 MJ/day reduction was found. Fig. 3 also compares solarradiation in the upper part of the canopy and the lower portion ofthe tree. In 2011, the amount of solar radiation within the canopy ateither position was much lower than that registered in 2012 (newdesign). The amount of solar radiation in the upper canopy in 2011was too far from the reference radiation (26%). This fact is due tothe configuration of the cells used in series, which does not allowfor differentiation between the shadowing of only one cell in themini-module and the shadowing of two or more cells. Therefore,solar penetration inside the canopy was underestimated in 2011 inboth the top and bottom positions, while the sensors used in the2012 season did not have this problem. The irradiation capturedinside the canopy was higher (54.6% in the top and 39.5% in thebottom) and the data are more reliable.
The results of the ANOVA on solar radiation penetration insidethe canopy (2012) show a significant effect on the top or bot-
Fig. 4. Average daily irradiation expressed on J per day in function of the day of theexperiment for the top ( ) and the bottom (�) of the canopy and the average globalradiation (�), acquired by the reference cells on the second season (2012). Circledindividuals mean data acquired on cloudy days.
A. Melado-Herreros et al. / Postharvest Biology and Technology 86 (2013) 125–133 129
Table 2Mean sugar concentrations, on 12 tissue samples in apples from 2011 season. Comparisons at 0.05 and 0.01 level are indicated by * and **, respectively. No significantdifferences are expressed by ns. By rows, consecutive values of the same letter (a, b) are no significant at 0.05 level.
Sugar content (mg sugar/g FW) Healthy apple Watercored apple F
Healthy tissue Healthy tissue Watercored tissue
Fructose 72.0a 69.2a 63.1b 4.2*Sucrose 28.0a 31.8a 15.0b 19.1**Glucose 15.1b 19.5ab 21.7a 5.1*Sorbitol 8.0b 14.9b 29.3a 21.4**
Total sugar content 123.2 135.2 129.3 ns
FW, fresh weight.
Table 3ANOVA on sugar concentrations for each sample. Comparisons significant at the 0.05 level are indicated by *. No significant differences are expressed by ns.
Sugar content (mg sugar/g FW) F Sum of squares total Sum of squares error Degrees of freedom
Class Position Class × position
Fructose 14.4* 11.0* ns 818.7 148.4 15Sucrose 9.2* ns ns 1509.5 421.2 15Glucose ns ns ns 202.7 143.1 15
1346.3 458.5 15
3272.0 1535.8 15
ro
3
sa
s2t12rtchpdeawbfcp
d2
TMb
Sorbitol 5.1* ns ns
Total sugar content ns 6.7* ns
adiation during the 27-day period before harvesting. There werenly 3 cloudy days (11% of days).
.2. Sugar analysis
The ANOVA results of the mean sugar concentrations from eachample for 2011 and 2012 are shown in Tables 2 and 3, respectively,nd the mean values in Table 4.
Fructose and sucrose had lower levels in affected tis-ues compared to sound apples in both the years 2011 and012, with a decrease of over 10 mg/g FW. In 2011, a fruc-ose content of 63.13 ± 1.03 mg/g FW and a sucrose content of5.04 ± 3.88 mg/g FW were found for affected tissues, while in012, 56.90 ± 1.67 mg/g FW and 18.03 ± 2.81 mg/g FW were found,espectively. Bowen and Watkins (1997) found lower levels of fruc-ose in affected tissues compared to sound, but higher sucroseontent. In contrast to these results, Yamada et al. (2006) foundigher fructose and lower sucrose content in affected tissues com-ared to sound. General agreement was only found in terms of theecrease in sucrose content for watercore affected tissue. Yamadat al. (2006) also indicated significant higher fructose content inpples from the outer part of the canopy compared to the inside,hile no significant differences in sucrose content were found
etween the canopy positions. In our study, a significantly higherructose content was found in apples from the upper part of theanopy (68.2 ± 1.5 mg/g FW) compared to apples from the lower
art of the canopy (61.0 ± 1.4 mg/g FW).As regards the total amount of sugar, there were no significantifferences between tissues (affected and healthy) in 2011 or in012, although in 2012 it was significantly higher in the case of
able 4ean values of sugar content for 2012 season, according to the type of tissue and the pos
) are no significant at 0.05 level.
Fructose (mg/g FW) Sucrose (mg/g FW) Glu
Type of tissueHealthy 69.0 ± 2.2a 38.1 ± 3.7a 17.Healthy in affected 67.9 ± 1.6a 28.2 ± 2.8a 17.Affected 56.9 ± 1.6b 18.3 ± 2.8b 17.
PositionTop 68.2 ± 1.5a 27.3 ± 2.6a 19.Bottom 61.0 ± 1.4b 28.6 ± 2.5a 15.
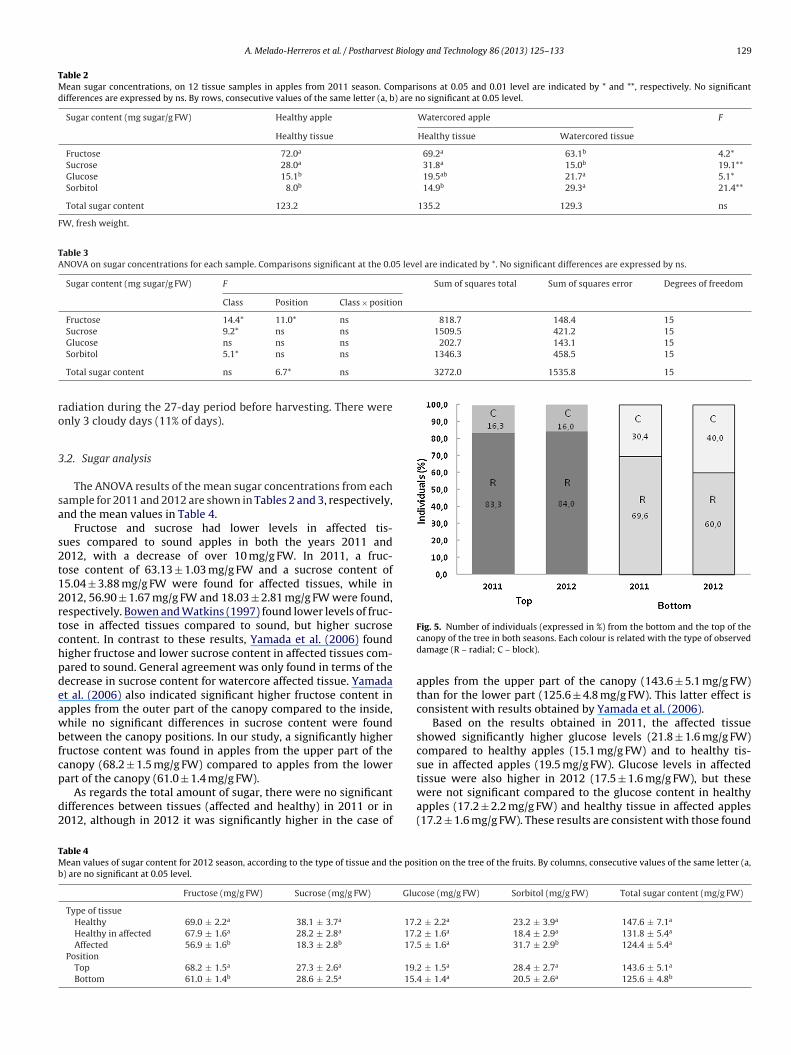
Fig. 5. Number of individuals (expressed in %) from the bottom and the top of thecanopy of the tree in both seasons. Each colour is related with the type of observeddamage (R – radial; C – block).
apples from the upper part of the canopy (143.6 ± 5.1 mg/g FW)than for the lower part (125.6 ± 4.8 mg/g FW). This latter effect isconsistent with results obtained by Yamada et al. (2006).
Based on the results obtained in 2011, the affected tissueshowed significantly higher glucose levels (21.8 ± 1.6 mg/g FW)compared to healthy apples (15.1 mg/g FW) and to healthy tis-sue in affected apples (19.5 mg/g FW). Glucose levels in affected
tissue were also higher in 2012 (17.5 ± 1.6 mg/g FW), but thesewere not significant compared to the glucose content in healthyapples (17.2 ± 2.2 mg/g FW) and healthy tissue in affected apples(17.2 ± 1.6 mg/g FW). These results are consistent with those foundition on the tree of the fruits. By columns, consecutive values of the same letter (a,
cose (mg/g FW) Sorbitol (mg/g FW) Total sugar content (mg/g FW)
2 ± 2.2a 23.2 ± 3.9a 147.6 ± 7.1a
2 ± 1.6a 18.4 ± 2.9a 131.8 ± 5.4a
5 ± 1.6a 31.7 ± 2.9b 124.4 ± 5.4a
2 ± 1.5a 28.4 ± 2.7a 143.6 ± 5.1a
4 ± 1.4a 20.5 ± 2.6a 125.6 ± 4.8b
130 A. Melado-Herreros et al. / Postharvest Biology and Technology 86 (2013) 125–133
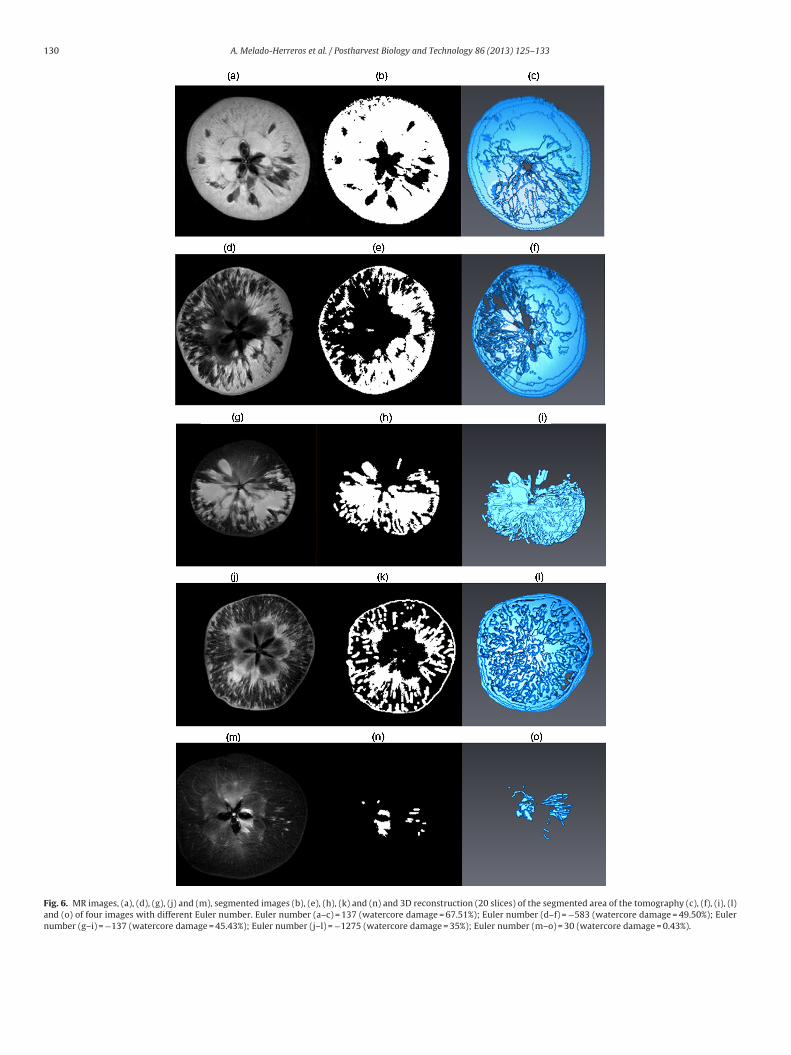
Fig. 6. MR images, (a), (d), (g), (j) and (m), segmented images (b), (e), (h), (k) and (n) and 3D reconstruction (20 slices) of the segmented area of the tomography (c), (f), (i), (l)and (o) of four images with different Euler number. Euler number (a–c) = 137 (watercore damage = 67.51%); Euler number (d–f) = −583 (watercore damage = 49.50%); Eulernumber (g–i) = −137 (watercore damage = 45.43%); Euler number (j–l) = −1275 (watercore damage = 35%); Euler number (m–o) = 30 (watercore damage = 0.43%).
Biology and Technology 86 (2013) 125–133 131
befccf((n
a(th2waiiva(baoht
3
(tttlaa
3
ta4−wraa
al3pb
ot4ffhtaw
Table 5Mean values of damaged tissue. Values marked by letter a are significant for visualcategorization (Class) at level 0.05. Values marked by letter b are significant accord-ing to the position on the tree at level 0.05.
Class Position on the tree Average amount of damage (%)
2 Top 17.40 ± 1.90a b
3 Top 47.14 ± 1.90a b
4 Top 74.53 ± 2.53a b
2 Bottom 10.5 ± 1.70a b
visual classification by the experts. As a whole, apples affected byradial watercore appear on a wider range of both Euler number(from 400 to −1439) and percentage damage (from 0.3% to 89.2%).
A. Melado-Herreros et al. / Postharvest
y Yamada et al. (2006), who detected higher glucose levels invery cellular compartment, especially in the vacuoles. They alsoound that apples from the outer canopy, which were more sus-eptible to watercore development than apples from the inneranopy, had a higher glucose content. Our study reveals that applesrom the top of the canopy also had a higher glucose content19.2 ± 1.5 mg/g FW) than apples from the bottom of the canopy15.4 ± 1.4 mg/g FW), although these latter differences are not sig-ificant.
Most of the authors who have studied watercore, such as Bowennd Watkins (1997), Yamada and Kobayashi (1999), Yamada et al.2006), among others, have found higher sorbitol levels in affectedissues than in non-affected. In our study, sorbitol contents wereigher in both seasons in affected tissues with 29.3 ± 2.3 mg/g FW in011 and 31.7 ± 2.9 mg/g FW in 2012, compared to healthy apples,hich had 8.0 mg/g FW in 2011 and 23.2 ± 3.9 mg/g FW in 2012,
nd also compared to healthy tissue in affected apples, contain-ng 14.9 mg/g FW in 2011 and 18.4 ± 2.9 mg/g FW in 2012. It isnteresting to point out that our sorbitol levels far exceeded anyalues reported in the cited literature (approx. 7 mg/g FW in Bowennd Watkins (1997), approx. 6 mg/g FW in Yamada and Kobayashi1999) and approx. 12 mg/g FW in Yamada et al. (2006)). It shoulde noted that in our analysis, watercore is considered to be andded value and not an indicator of lack of quality. Moreover, inur study, the total sugar content (around 130 mg/g FW) was muchigher than reported by Bowen (approx. 75 mg/g FW) but similaro Yamada et al. (2006), approx. 150 mg/g FW.
.3. Visual classification
In both seasons there were more individual apples with radialR) rather than block (C) watercore. Nevertheless, a higher propor-ion of radial watercore was found in samples from the top of theree: 83.3% and 84.0% of apples with radial damage from the top ofhe tree in 2011 and 2012, respectively, and 69.6% and 60.0% in theower part of the canopy for both seasons, respectively (Fig. 5). Also,
slightly higher proportion of severely affected apples was foundt the top of the canopy (17%) compared to the bottom (12%).
.4. Image processing
Fig. 6 provides examples of the result of the interactive segmen-ation procedure, together with a 3D reconstruction of the affectedreas. The corresponding values of affected tissue (67.51%, 49.50%,5.43%, 35% and 0.43%) and the Euler number (137, −583, −137,1275 and 30) are also included. Positive Euler numbers are foundhen segmented objects are unconnected which, in this case, cor-
esponds to a slightly affected fruit. Large negative Euler numbersre found for complex segmented shapes with highly connectedreas.
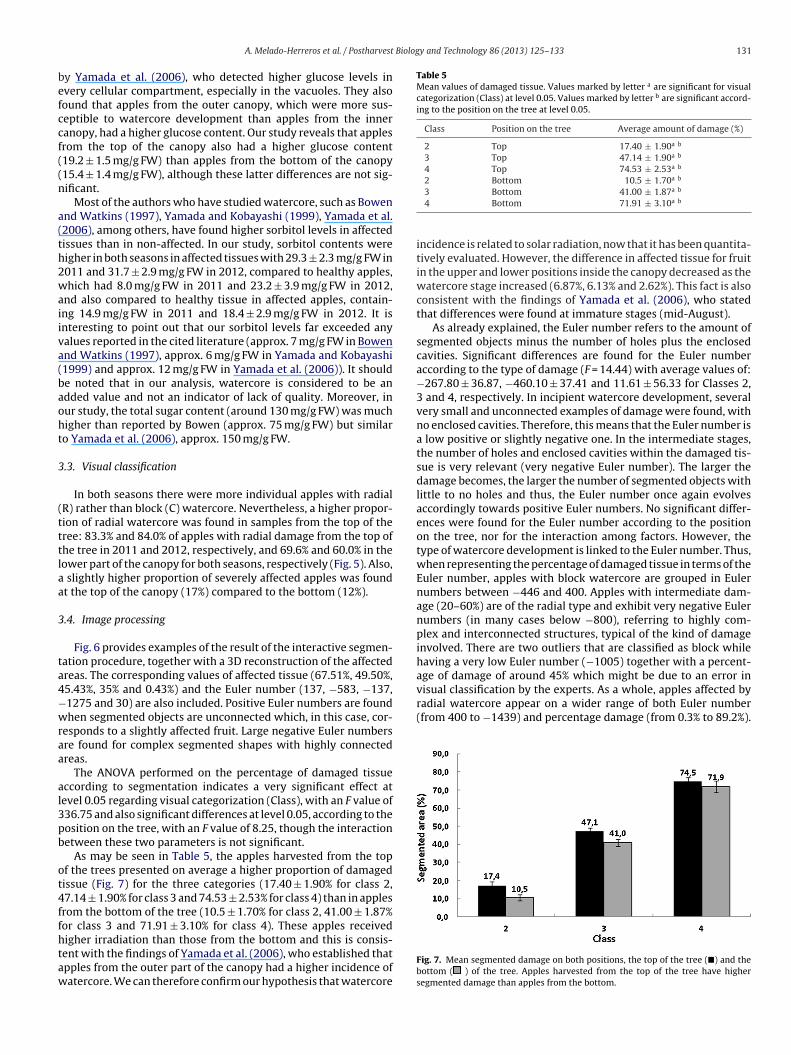
The ANOVA performed on the percentage of damaged tissueccording to segmentation indicates a very significant effect atevel 0.05 regarding visual categorization (Class), with an F value of36.75 and also significant differences at level 0.05, according to theosition on the tree, with an F value of 8.25, though the interactionetween these two parameters is not significant.
As may be seen in Table 5, the apples harvested from the topf the trees presented on average a higher proportion of damagedissue (Fig. 7) for the three categories (17.40 ± 1.90% for class 2,7.14 ± 1.90% for class 3 and 74.53 ± 2.53% for class 4) than in applesrom the bottom of the tree (10.5 ± 1.70% for class 2, 41.00 ± 1.87%or class 3 and 71.91 ± 3.10% for class 4). These apples received
igher irradiation than those from the bottom and this is consis-ent with the findings of Yamada et al. (2006), who established thatpples from the outer part of the canopy had a higher incidence ofatercore. We can therefore confirm our hypothesis that watercore3 Bottom 41.00 ± 1.87a b
4 Bottom 71.91 ± 3.10a b
incidence is related to solar radiation, now that it has been quantita-tively evaluated. However, the difference in affected tissue for fruitin the upper and lower positions inside the canopy decreased as thewatercore stage increased (6.87%, 6.13% and 2.62%). This fact is alsoconsistent with the findings of Yamada et al. (2006), who statedthat differences were found at immature stages (mid-August).
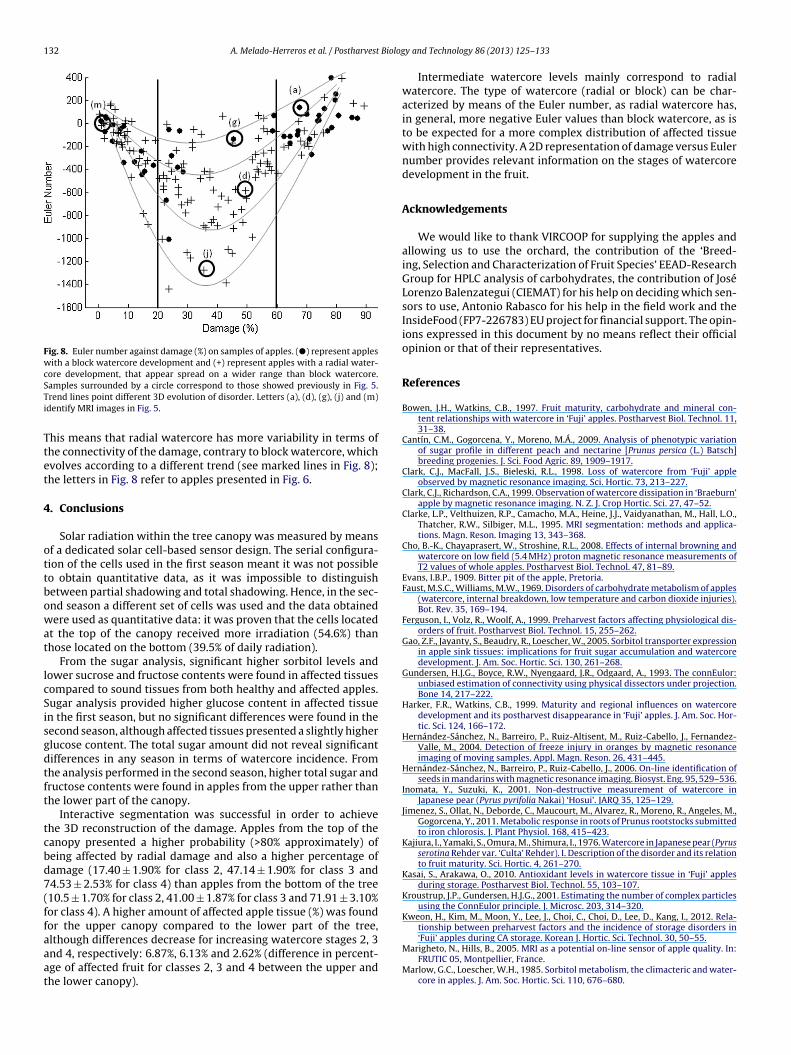
As already explained, the Euler number refers to the amount ofsegmented objects minus the number of holes plus the enclosedcavities. Significant differences are found for the Euler numberaccording to the type of damage (F = 14.44) with average values of:−267.80 ± 36.87, −460.10 ± 37.41 and 11.61 ± 56.33 for Classes 2,3 and 4, respectively. In incipient watercore development, severalvery small and unconnected examples of damage were found, withno enclosed cavities. Therefore, this means that the Euler number isa low positive or slightly negative one. In the intermediate stages,the number of holes and enclosed cavities within the damaged tis-sue is very relevant (very negative Euler number). The larger thedamage becomes, the larger the number of segmented objects withlittle to no holes and thus, the Euler number once again evolvesaccordingly towards positive Euler numbers. No significant differ-ences were found for the Euler number according to the positionon the tree, nor for the interaction among factors. However, thetype of watercore development is linked to the Euler number. Thus,when representing the percentage of damaged tissue in terms of theEuler number, apples with block watercore are grouped in Eulernumbers between −446 and 400. Apples with intermediate dam-age (20–60%) are of the radial type and exhibit very negative Eulernumbers (in many cases below −800), referring to highly com-plex and interconnected structures, typical of the kind of damageinvolved. There are two outliers that are classified as block whilehaving a very low Euler number (−1005) together with a percent-age of damage of around 45% which might be due to an error in
Fig. 7. Mean segmented damage on both positions, the top of the tree (�) and thebottom ( ) of the tree. Apples harvested from the top of the tree have highersegmented damage than apples from the bottom.
132 A. Melado-Herreros et al. / Postharvest Biolog
Fig. 8. Euler number against damage (%) on samples of apples. (�) represent appleswith a block watercore development and (+) represent apples with a radial water-core development, that appear spread on a wider range than block watercore.STi
Ttet
4
ottbowat
lcSisgdtft
tcbd7(ffaaat
amples surrounded by a circle correspond to those showed previously in Fig. 5.rend lines point different 3D evolution of disorder. Letters (a), (d), (g), (j) and (m)dentify MRI images in Fig. 5.
his means that radial watercore has more variability in terms ofhe connectivity of the damage, contrary to block watercore, whichvolves according to a different trend (see marked lines in Fig. 8);he letters in Fig. 8 refer to apples presented in Fig. 6.
. Conclusions
Solar radiation within the tree canopy was measured by meansf a dedicated solar cell-based sensor design. The serial configura-ion of the cells used in the first season meant it was not possibleo obtain quantitative data, as it was impossible to distinguishetween partial shadowing and total shadowing. Hence, in the sec-nd season a different set of cells was used and the data obtainedere used as quantitative data: it was proven that the cells located
t the top of the canopy received more irradiation (54.6%) thanhose located on the bottom (39.5% of daily radiation).
From the sugar analysis, significant higher sorbitol levels andower sucrose and fructose contents were found in affected tissuesompared to sound tissues from both healthy and affected apples.ugar analysis provided higher glucose content in affected tissuen the first season, but no significant differences were found in theecond season, although affected tissues presented a slightly higherlucose content. The total sugar amount did not reveal significantifferences in any season in terms of watercore incidence. Fromhe analysis performed in the second season, higher total sugar andructose contents were found in apples from the upper rather thanhe lower part of the canopy.
Interactive segmentation was successful in order to achievehe 3D reconstruction of the damage. Apples from the top of theanopy presented a higher probability (>80% approximately) ofeing affected by radial damage and also a higher percentage ofamage (17.40 ± 1.90% for class 2, 47.14 ± 1.90% for class 3 and4.53 ± 2.53% for class 4) than apples from the bottom of the tree10.5 ± 1.70% for class 2, 41.00 ± 1.87% for class 3 and 71.91 ± 3.10%or class 4). A higher amount of affected apple tissue (%) was foundor the upper canopy compared to the lower part of the tree,
lthough differences decrease for increasing watercore stages 2, 3nd 4, respectively: 6.87%, 6.13% and 2.62% (difference in percent-ge of affected fruit for classes 2, 3 and 4 between the upper andhe lower canopy).y and Technology 86 (2013) 125–133
Intermediate watercore levels mainly correspond to radialwatercore. The type of watercore (radial or block) can be char-acterized by means of the Euler number, as radial watercore has,in general, more negative Euler values than block watercore, as isto be expected for a more complex distribution of affected tissuewith high connectivity. A 2D representation of damage versus Eulernumber provides relevant information on the stages of watercoredevelopment in the fruit.
Acknowledgements
We would like to thank VIRCOOP for supplying the apples andallowing us to use the orchard, the contribution of the ‘Breed-ing, Selection and Characterization of Fruit Species’ EEAD-ResearchGroup for HPLC analysis of carbohydrates, the contribution of JoséLorenzo Balenzategui (CIEMAT) for his help on deciding which sen-sors to use, Antonio Rabasco for his help in the field work and theInsideFood (FP7-226783) EU project for financial support. The opin-ions expressed in this document by no means reflect their officialopinion or that of their representatives.
References
Bowen, J.H., Watkins, C.B., 1997. Fruit maturity, carbohydrate and mineral con-tent relationships with watercore in ‘Fuji’ apples. Postharvest Biol. Technol. 11,31–38.
Cantín, C.M., Gogorcena, Y., Moreno, M.Á., 2009. Analysis of phenotypic variationof sugar profile in different peach and nectarine [Prunus persica (L.) Batsch]breeding progenies. J. Sci. Food Agric. 89, 1909–1917.
Clark, C.J., MacFall, J.S., Bieleski, R.L., 1998. Loss of watercore from ‘Fuji’ appleobserved by magnetic resonance imaging. Sci. Hortic. 73, 213–227.
Clark, C.J., Richardson, C.A., 1999. Observation of watercore dissipation in ‘Braeburn’apple by magnetic resonance imaging. N. Z. J. Crop Hortic. Sci. 27, 47–52.
Clarke, L.P., Velthuizen, R.P., Camacho, M.A., Heine, J.J., Vaidyanathan, M., Hall, L.O.,Thatcher, R.W., Silbiger, M.L., 1995. MRI segmentation: methods and applica-tions. Magn. Reson. Imaging 13, 343–368.
Cho, B.-K., Chayaprasert, W., Stroshine, R.L., 2008. Effects of internal browning andwatercore on low field (5.4 MHz) proton magnetic resonance measurements ofT2 values of whole apples. Postharvest Biol. Technol. 47, 81–89.
Evans, I.B.P., 1909. Bitter pit of the apple, Pretoria.Faust, M.S.C., Williams, M.W., 1969. Disorders of carbohydrate metabolism of apples
(watercore, internal breakdown, low temperature and carbon dioxide injuries).Bot. Rev. 35, 169–194.
Ferguson, I., Volz, R., Woolf, A., 1999. Preharvest factors affecting physiological dis-orders of fruit. Postharvest Biol. Technol. 15, 255–262.
Gao, Z.F., Jayanty, S., Beaudry, R., Loescher, W., 2005. Sorbitol transporter expressionin apple sink tissues: implications for fruit sugar accumulation and watercoredevelopment. J. Am. Soc. Hortic. Sci. 130, 261–268.
Gundersen, H.J.G., Boyce, R.W., Nyengaard, J.R., Odgaard, A., 1993. The connEulor:unbiased estimation of connectivity using physical dissectors under projection.Bone 14, 217–222.
Harker, F.R., Watkins, C.B., 1999. Maturity and regional influences on watercoredevelopment and its postharvest disappearance in ‘Fuji’ apples. J. Am. Soc. Hor-tic. Sci. 124, 166–172.
Hernández-Sánchez, N., Barreiro, P., Ruiz-Altisent, M., Ruiz-Cabello, J., Fernandez-Valle, M., 2004. Detection of freeze injury in oranges by magnetic resonanceimaging of moving samples. Appl. Magn. Reson. 26, 431–445.
Hernández-Sánchez, N., Barreiro, P., Ruiz-Cabello, J., 2006. On-line identification ofseeds in mandarins with magnetic resonance imaging. Biosyst. Eng. 95, 529–536.
Inomata, Y., Suzuki, K., 2001. Non-destructive measurement of watercore inJapanese pear (Pyrus pyrifolia Nakai) ‘Hosui’. JARQ 35, 125–129.
Jimenez, S., Ollat, N., Deborde, C., Maucourt, M., Alvarez, R., Moreno, R., Angeles, M.,Gogorcena, Y., 2011. Metabolic response in roots of Prunus rootstocks submittedto iron chlorosis. J. Plant Physiol. 168, 415–423.
Kajiura, I., Yamaki, S., Omura, M., Shimura, I., 1976. Watercore in Japanese pear (Pyrusserotina Rehder var. ‘Culta’ Rehder). I. Description of the disorder and its relationto fruit maturity. Sci. Hortic. 4, 261–270.
Kasai, S., Arakawa, O., 2010. Antioxidant levels in watercore tissue in ‘Fuji’ applesduring storage. Postharvest Biol. Technol. 55, 103–107.
Kroustrup, J.P., Gundersen, H.J.G., 2001. Estimating the number of complex particlesusing the ConnEulor principle. J. Microsc. 203, 314–320.
Kweon, H., Kim, M., Moon, Y., Lee, J., Choi, C., Choi, D., Lee, D., Kang, I., 2012. Rela-tionship between preharvest factors and the incidence of storage disorders in
‘Fuji’ apples during CA storage. Korean J. Hortic. Sci. Technol. 30, 50–55.Marigheto, N., Hills, B., 2005. MRI as a potential on-line sensor of apple quality. In:FRUTIC 05, Montpellier, France.
Marlow, G.C., Loescher, W.H., 1985. Sorbitol metabolism, the climacteric and water-core in apples. J. Am. Soc. Hortic. Sci. 110, 676–680.

Biolog
M
V
W
W
W
Y
Y
Yamaki, S., Kajiura, I., Omura, M., Matsuda, K., 1977. Watercore in Japanese pear.
A. Melado-Herreros et al. / Postharvest
elado-Herreros, A., Barreiro, P., Villa-Valverde, P., Fernández-Valle, M.E., Humpfer,E., 2013. 1H HR MAS NMR metabolomic and non-destructive 2D NMR relaxo-metry to assess internal quality in apples. In: InsideFood Symposium, Leuven,Belgium.
ogel, H.J., Roth, K., 2001. Quantitative morphology and network representation ofsoil pore structure. Adv. Water Resour. 24, 233–242.
ang, S.Y., Faust, M., 1992a. Ethylene biosynthesis and polyamine accumulation inapples with watercore. J. Am. Soc. Hortic. Sci. 117, 133–138.
ang, S.Y., Faust, M., 1992b. Variation in lipid-composition of apples in relation towatercore. J. Am. Soc. Hortic. Sci. 117, 829–833.
ang, S.Y., Wang, P.C., Faust, M., 1988. Non-destructive detection of watercore inapple with nuclear magnetic resonance imaging. Sci. Hortic. 35, 227–234.
amada, H., Kaga, Y., Amano, S., 2006. Cellular compartmentation and membrane
permeability to sugars in relation to early or high temperature-induced water-core in apples. Sci. Hortic. 108, 29–34.amada, H., Kobayashi, S., 1999. Relationship between watercore and maturityor sorbitol in apples affected by preharvest fruit temperature. Sci. Hortic. 80,189–202.
y and Technology 86 (2013) 125–133 133
Yamada, H.O.H., Arai, C., Terui, M., 1994. Effect of preharvest fruit temperature onripening, sugars, and watercore occurrence in apples. J. Am. Soc. Hortic. Sci. 119,1208–1214.
Yamada, H., Takechi, K., Hoshi, A., Amano, S., 2004. Comparison of water relations inwatercored and non-watercored apples induced by fruit temperature treatment.Sci. Hortic. 99, 309–318.
Yamada, H., Teramoto, K., Amano, S., 2010. Relationship between early watercoredevelopment and leaf photosynthesis or partitioning of photosynthates in apple.Sci. Hortic. 125, 337–341.
Yamaki, S., Kajiura, I., Omura, M., Matsuda, K., 1976. Watercore in Japanese pear(Pyrus serotina Rehder var. ‘Culta’ Rehder). II. Chemical changes in watercoredtissue. Sci. Hortic. 4, 271–277.
III. Changes in the activities of some enzymes relating to the degradation of cellwalls and the accumulation of sugar. Sci. Hortic. 6, 45–53.
Zhang, L., McCarthy, M.J., 2012. Measurement and evaluation of tomato maturityusing magnetic resonance imaging. Postharvest Biol. Technol. 67, 37–43.