Embed Size (px)
Citation preview
Assessing spatiotemporal changes in tiger habitatacross different land management regimes
NEIL H. CARTER,1,5,� BHIM GURUNG,2 ANDRES VINA,1 HENRY CAMPA III,3 JHAMAK B. KARKI,4 AND JIANGUO LIU1
1Center for Systems Integration and Sustainability, Department of Fisheries and Wildlife, Michigan State University,115 Manly Miles Building, East Lansing, Michigan 48823 USA
2Nepal Tiger Trust, Meghauly, Chitwan, Nepal3Department of Fisheries and Wildlife, Michigan State University, Natural Resources Building,
East Lansing, Michigan 48824 USA4Department of National Parks and Wildlife Conservation, Ministry of Forests and Soil Conservation, Government of Nepal,
G.P.O. Box 860, Babarmahal, Kathmandu, Nepal
Citation: Carter, N. H., B. Gurung, A. Vina, H. Campa III, J. B. Karki, and J. Liu. 2013. Assessing spatiotemporal changes
in tiger habitat across different land management regimes. Ecosphere 4(10):124. http://dx.doi.org/10.1890/ES13-00191.1
Abstract. Human-induced habitat loss and degradation are increasing the extinction probability of
many wildlife species worldwide, thus protecting habitat is crucial. The habitat of thousands of imperiled
wildlife species occurs in a variety of land management regimes (e.g., protected areas, multiple-use areas),
each exerting differing effects. We used the globally endangered tiger (Panthera tigris) to examine the
relationships between habitat change and land management in Nepal’s Chitwan district, a global
biodiversity hotspot. We evaluated the effects of environmental and human factors on tiger habitat based
on data acquired by motion-detecting cameras and space-borne imaging sensors. Spatiotemporal habitat
dynamics in Chitwan National Park and a multiple-use area outside the park were then evaluated in three
time periods (1989, 1999, and 2009). Our results indicate that tigers preferred areas with more grasslands
and higher landscape connectivity. The area of highly suitable habitat decreased inside the park over the
entire 20 year interval, while outside the park habitat suitability increased, especially from 1999 to 2009.
The loss of highly suitable habitat inside the park may be associated with an increasing trend of
unauthorized resource extraction by a rapidly growing human population, coupled with natural processes
such as flooding and forest succession. In contrast, community-based management of natural resources
and the prohibition of livestock grazing since the late 1990s likely improved tiger habitat suitability outside
the park. Results of this study are useful for evaluating habitat change and guiding conservation actions
across the tiger range, which spans 13 countries. Moreover, quantitatively assessing habitat change across
different land management regimes in human-dominated areas provides insights for conserving habitat of
other imperiled wildlife species around the world.
Key words: camera trap; community-based management; habitat change; N-mixture; Panthera tigris; protected areas;
tiger.
Received 7 June 2013; revised 19 August 2013; accepted 29 August 2013; final version received 23 September 2013;
published 18 October 2013. Corresponding Editor: S. Kefi.
Copyright: � 2013 Carter et al. This is an open-access article distributed under the terms of the Creative Commons
Attribution License, which permits unrestricted use, distribution, and reproduction in any medium, provided the
original author and source are credited. http://creativecommons.org/licenses/by/3.0/5 Present address: National Socio-Environmental Synthesis Center, 1 Park Place, Suite 300, Annapolis, Maryland 21401
USA.
� E-mail: [email protected]
v www.esajournals.org 1 October 2013 v Volume 4(10) v Article 124
INTRODUCTION
Human demand for natural resources hastransformed much of the earth’s land surface(Sanderson et al. 2002), and between 10 and 20%of the world’s remaining natural grasslands andforests are expected to be converted to agricul-ture, urban, and infrastructure by 2050 (MEA2005). This conversion of natural ecosystems toareas used intensively by humans is consideredthe main cause of the current global decline inbiodiversity and, by removing vast amounts ofwildlife habitat, has put many wildlife speciesand communities at a greater risk of extinction(Liu et al. 2001, Sanderson et al. 2002, Vina et al.2007).
Over 170,000 protected areas currently cover-ing 12.7% of the world’s land area have been setaside ‘‘to achieve the long term conservation ofnature’’ and are considered a core part of thehabitat conservation programs for many wildlifespecies (Bertzky et al. 2012). However, humanactivities within and adjacent to protected areas(e.g., development, collection of natural resourc-es, livestock grazing, and poaching) are perva-sive and threaten the conservation effectivenessof such areas (DeFries et al. 2005, Linkie et al.2006, Western et al. 2009, Liu and Raven 2010).Furthermore, the current global protected areanetwork covers small or no portions of the rangesof many imperiled wildlife species (Margulesand Pressey 2000, Rodrigues et al. 2004). Forexample, 89% (3,467) of all imperiled wildlifespecies analyzed by Rodrigues et al. (2004) hadeither none or only part of their ranges coveredby protected areas. Consequently, the habitat ofmany imperiled species is located on human-dominated multiple-use areas (Xu et al. 2006,Lepczyk et al. 2008), which typically allow formore extractive activities than in protected areas(Garcıa-Fernandez et al. 2008). Thus, strategiesthat mitigate human impacts on wildlife habitatacross different land management regimes, suchas protected areas and multiple-use areas outsidethem, are important for realizing conservationgoals (Bearer et al. 2008, Hull et al. 2011).
In this study, we examined the relationshipsbetween different land management regimes andhabitat of the tiger (Panthera tigris), a globallyendangered and widely valued species (Carter etal. 2012a). We chose tigers because their large
space requirements necessitates landscape-scaleapproaches to habitat protection that encompassstrictly protected and multiple-use areas, wherenearly 80% of the tiger’s remaining range occurs(Linkie et al. 2008, Forrest et al. 2011, Wikrama-nayake et al. 2011). Our two objectives were to:(1) evaluate changes in tiger habitat suitabilityfrom 1989 to 2009 on a section of ChitwanNational Park and a nearby multiple-use areaoutside the park; and (2) assess the potentialinfluence of resource management policies andpractices inside and outside the park on observedchanges in tiger habitat suitability.
Land management regimes in Chitwan, NepalChitwan National Park (;100,000 ha) was
established in 1973 to protect the biodiversity ofthe Himalayan lowlands, a globally importantregion for tigers (Sanderson et al. 2006). Since1975, a contingent of the Nepal Army has beenstationed inside the park with the task ofpatrolling the park to deter illegal activities suchas wildlife hunting, logging, and collection ofother natural resources (Martin 1992). Theseexclusion policies of the park created resentmentamong local people who felt that access tonatural resources they relied on, such as fodderfor livestock, thatch and timber for householdconstruction, and fuelwood for cooking andheating, was denied without their consent (Nepaland Weber 1995a). To reduce park-people con-flicts, a ‘grass-cutting’ program was initiated in1976 to allow local residents to enter the park forseveral days (ranging from 20 days at thebeginning of the program to 3 days in 2010)annually to legally collect thatch grass, reeds,rope bark, and rope grass (Stræde and Helles2000). However, this concession only marginallyoffsets local demand for natural resources; thus,local residents also illegally collect variousnatural resources throughout the year (Nepaland Weber 1995b, Stræde and Treue 2006).Although illegal use of natural resources in thepark does not automatically lead to wildlifehabitat loss, the resource demands of the humanpopulation adjacent to the park, which hastripled from 1971 to 2011 (CBS 2012), may bedegrading wildlife habitat inside the park,particularly tiger habitat.
To mitigate human pressure on Chitwan’snatural resources, a buffer zone (75,000 ha)
v www.esajournals.org 2 October 2013 v Volume 4(10) v Article 124
CARTER ET AL.
surrounding the park was established in 1996with the dual purpose of restoring ecosystemintegrity and improving human livelihoods. Forinstance, livestock grazing was prohibited fromthe multiple-use areas outside the park asecosystem degradation due to overgrazing hadbecome a major concern (Sharma 1990, Gurunget al. 2009). To offset this imposition, 30–50% ofthe park’s annual revenue must be invested intothe surrounding buffer zone to support commu-nity development programs, including alterna-tive income opportunities and infrastructureimprovement (GoN 1993). In addition, forestedareas in the buffer zone adjacent to humansettlements, which previously were part of theState-controlled national forest system, werehanded over to local user-group committees ascommunity forests. Thus, user-group committeeshave had a considerable degree of managementresponsibility and control over resource use, forexample, by dictating the amount and times ofyear when local people can collect fuelwood,timber, and fodder from the community forests(Nagendra et al. 2005). Previous research indi-cates that community-based resource manage-ment and restrictions on livestock grazing may
be reversing deforestation and fragmentationoutside the park (Gurung et al. 2008, Nagendraet al. 2008).
MATERIALS AND METHODS
Study siteSituated in south central Nepal, our study site
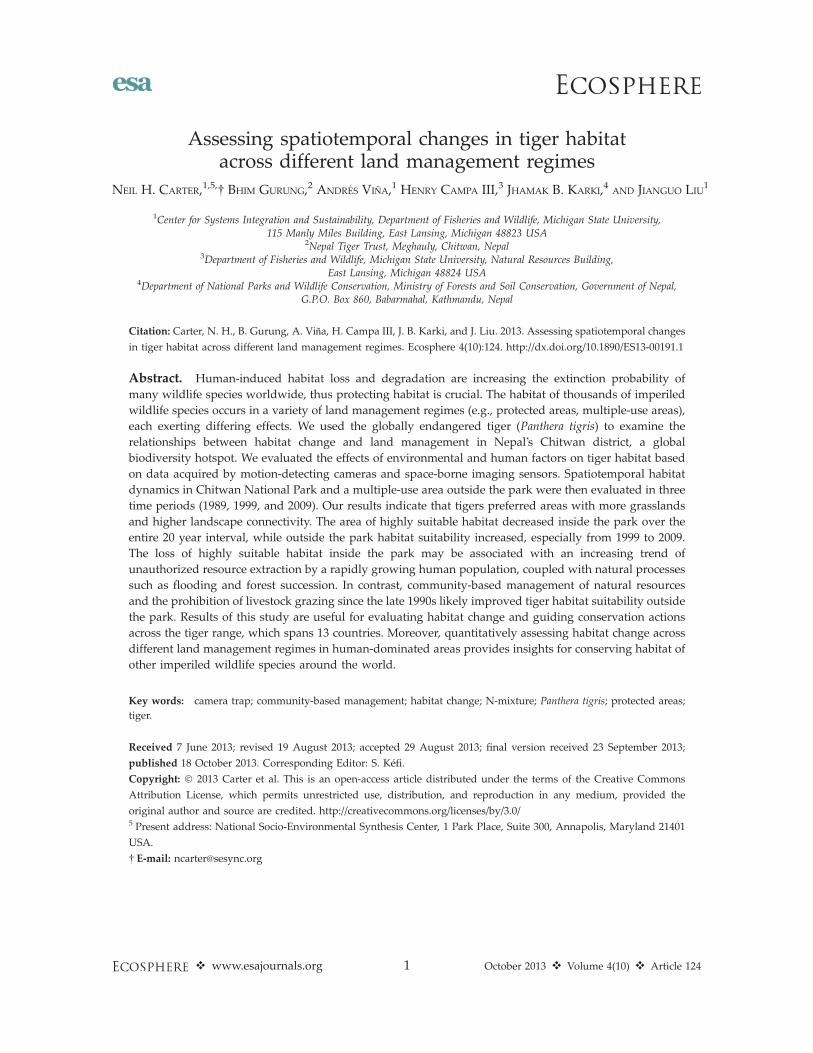
(Fig. 1) was located in a river valley basin alongthe flood plains of the Rapti, Reu, and Narayanirivers with an elevational range of 150 m to 815m. Climate in Chitwan is subtropical with asummer monsoon from mid-June to late-Septem-ber, and a cool dry winter. Mean annual rainfallis 240 cm, 90% of which falls during the monsoonfrom June to September. Temperatures arehighest (maximum 388C) during the monsoonand drop to a minimum of 68C in the post-monsoon period (October to January; Laurie1982). The park and multiple-use area outsidethe park have retained the unique naturalvegetation communities distinctive of the Hima-layan lowlands, including Sal (Shorea robusta)forest, khair (Acacia catechu) and sissoo (Dalbergiasissoo) riverine forests, and grasslands dominatedby species of the genera Saccharum, Themeda, andImperata (Chaudhary 1998). As of 2011, human
Fig. 1. Study site in Chitwan district, Nepal, where camera trap data on tigers were collected in 2010.
v www.esajournals.org 3 October 2013 v Volume 4(10) v Article 124
CARTER ET AL.

population in the areas adjacent to our study site(26,100 ha) was approximately 275,000 distribut-ed in approximately 68,000 households (CBS2012). The household number increased fasterthan population size during 1991 to 2011, similarto the global trend (Liu et al. 2003).
Tiger detection dataFrom January to April (i.e., the dry season
before monsoon) in 2010, we assessed tigeroccurrence using 19 pairs of digital ReconyxRM45 passive infrared motion detecting cameras(Reconyx Inc., WI, USA). Motion detectingcameras have been used to effectively measurewildlife activity in numerous sites (O’Connell etal. 2010). We established four adjoining sampleblocks that covered naturally vegetated areasinside and outside the park. These sample blockswere roughly oriented parallel to the humansettled area. Each block was then subdivided intoa grid with nineteen 100 ha cells. To maximizethe probability of detecting tigers across thespatial extent of our study site, a camera pair(hereafter a ‘camera trap’) was located at or closeto the center of each grid cell along the nearestroad, path, or animal trail. Thus, we set thecamera traps at a total of 76 locations, 46 ofwhich were inside the park and 30 outside. Thegrid size and sample block design were chosen tomaximize the likelihood that all tigers in the areawere detected, given female tiger home-rangesizes in this region of approximately 1,500 ha(Sunquist 1981). Two cameras facing each otherwere used in each camera trap to simultaneouslyphotograph both sides of an animal, thusincreasing the probability of identifying individ-ual tigers. We used a handheld Garmin eTrex(Garmin International Inc., KS, USA) globalpositioning system (GPS) receiver to record thelocation of each camera trap. The cameras weremounted on trees at approximately 1–1.5 m fromthe ground, angled downward and set to operate24 h/day with no more than the minimummechanical delay between sequential pictures.
We sampled the first block in the westernmostportion of the study site for 20 days and thenmoved eastward to sample the next blocks insuccession, each for 20 days. We defined thecamera trap as our sampling unit and one day(i.e., noon to noon the following day) as oursampling occasion. Therefore, cameras were set
for a total of 1,510 trap-days, with 920 trap-daysinside the park and 590 outside (one camera trapwas damaged for 10 trap-days). We created atrap-by-occasion matrix, with rows i representingthe camera trap sampling units and columns trepresenting the one-day sampling occasions. Weidentified individual tigers from the picturesusing their unique stripe patterns (Karanth andNichols 2002), and recorded the number ofindividual tigers for occasion t at trap i in thematrix.
Tiger habitat dataEnvironmental factors.—As longitudinal data on
prey density across our study site did not exist,we chose to use land-cover composition andspatial configuration as factors in our modelsbecause previous studies show that those factorsinfluence tiger dispersal, acquisition of prey, andtiger prey density (Seidensticker and McDougal1993, Smith 1993, Shrestha 2004). In addition,these factors can be measured across space andthrough time using remotely sensed imagery,thus enabling assessment of habitat change.
We obtained a cloud-free, multi-spectral Land-sat TM image (Path 142, row 41 WRS-2;resolution: 28.5 m 3 28.5 m) for October 2009 tobe consistent with the time period in which wecollected tiger detection data (i.e., 2010). Theimage was obtained from the United StatesGeological Survey (USGS; http://glovis.usgs.gov) and was received geometrically corrected(i.e., level-1G product). Image processing wasperformed using ERDAS IMAGINE 9.3 (LeicaGeosystems). We used an improved dark objectsubtraction method to radiometrically and atmo-spherically correct the image (Chavez 1996). Anunsupervised classification algorithm using theISODATA technique (Jensen 1996) was thenapplied to the image to produce 100 spectralclasses. We used high-resolution Google Earthimages (http://www.earth.google.com) and ourknowledge of the area to merge the 100 spectralclasses into six land-cover classes potentiallyrelated to tiger habitat: open water, grassland,Sal dominated forest, low density Sal, riverineforest, and barren (e.g., floodplain) (Shrestha2004). Although the image was acquired in adifferent month (i.e., October) than when thetiger detection data was collected (i.e., January toApril), the six land-cover classes derived from the
v www.esajournals.org 4 October 2013 v Volume 4(10) v Article 124
CARTER ET AL.
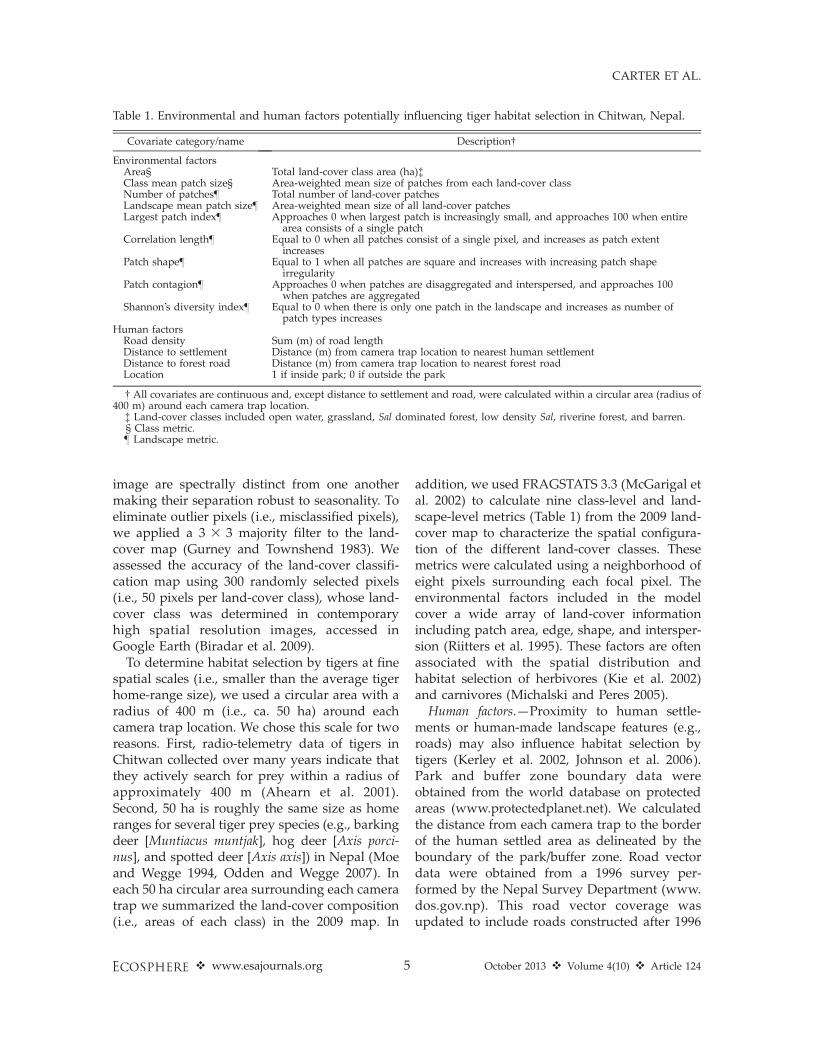
image are spectrally distinct from one anothermaking their separation robust to seasonality. Toeliminate outlier pixels (i.e., misclassified pixels),we applied a 3 3 3 majority filter to the land-cover map (Gurney and Townshend 1983). Weassessed the accuracy of the land-cover classifi-cation map using 300 randomly selected pixels(i.e., 50 pixels per land-cover class), whose land-cover class was determined in contemporaryhigh spatial resolution images, accessed inGoogle Earth (Biradar et al. 2009).
To determine habitat selection by tigers at finespatial scales (i.e., smaller than the average tigerhome-range size), we used a circular area with aradius of 400 m (i.e., ca. 50 ha) around eachcamera trap location. We chose this scale for tworeasons. First, radio-telemetry data of tigers inChitwan collected over many years indicate thatthey actively search for prey within a radius ofapproximately 400 m (Ahearn et al. 2001).Second, 50 ha is roughly the same size as homeranges for several tiger prey species (e.g., barkingdeer [Muntiacus muntjak], hog deer [Axis porci-nus], and spotted deer [Axis axis]) in Nepal (Moeand Wegge 1994, Odden and Wegge 2007). Ineach 50 ha circular area surrounding each cameratrap we summarized the land-cover composition(i.e., areas of each class) in the 2009 map. In
addition, we used FRAGSTATS 3.3 (McGarigal etal. 2002) to calculate nine class-level and land-scape-level metrics (Table 1) from the 2009 land-cover map to characterize the spatial configura-tion of the different land-cover classes. Thesemetrics were calculated using a neighborhood ofeight pixels surrounding each focal pixel. Theenvironmental factors included in the modelcover a wide array of land-cover informationincluding patch area, edge, shape, and intersper-sion (Riitters et al. 1995). These factors are oftenassociated with the spatial distribution andhabitat selection of herbivores (Kie et al. 2002)and carnivores (Michalski and Peres 2005).
Human factors.—Proximity to human settle-ments or human-made landscape features (e.g.,roads) may also influence habitat selection bytigers (Kerley et al. 2002, Johnson et al. 2006).Park and buffer zone boundary data wereobtained from the world database on protectedareas (www.protectedplanet.net). We calculatedthe distance from each camera trap to the borderof the human settled area as delineated by theboundary of the park/buffer zone. Road vectordata were obtained from a 1996 survey per-formed by the Nepal Survey Department (www.dos.gov.np). This road vector coverage wasupdated to include roads constructed after 1996
Table 1. Environmental and human factors potentially influencing tiger habitat selection in Chitwan, Nepal.
Covariate category/name Description�
Environmental factorsArea§ Total land-cover class area (ha)�Class mean patch size§ Area-weighted mean size of patches from each land-cover classNumber of patches} Total number of land-cover patchesLandscape mean patch size} Area-weighted mean size of all land-cover patchesLargest patch index} Approaches 0 when largest patch is increasingly small, and approaches 100 when entire
area consists of a single patchCorrelation length} Equal to 0 when all patches consist of a single pixel, and increases as patch extent
increasesPatch shape} Equal to 1 when all patches are square and increases with increasing patch shape
irregularityPatch contagion} Approaches 0 when patches are disaggregated and interspersed, and approaches 100
when patches are aggregatedShannon’s diversity index} Equal to 0 when there is only one patch in the landscape and increases as number of
patch types increasesHuman factors
Road density Sum (m) of road lengthDistance to settlement Distance (m) from camera trap location to nearest human settlementDistance to forest road Distance (m) from camera trap location to nearest forest roadLocation 1 if inside park; 0 if outside the park
� All covariates are continuous and, except distance to settlement and road, were calculated within a circular area (radius of400 m) around each camera trap location.
� Land-cover classes included open water, grassland, Sal dominated forest, low density Sal, riverine forest, and barren.§ Class metric.} Landscape metric.
v www.esajournals.org 5 October 2013 v Volume 4(10) v Article 124
CARTER ET AL.
by digitizing roads visible in high resolutionimagery accessed through Google Earth. Allroads within the study site were minor unpavedroads, except for two unpaved roads (one insideand one outside the park) that were usedcomparatively more often by local people totravel across the forest. Using the updated roadvector layer, we calculated the distance from eachcamera trap to the nearest road. We alsocalculated the road density within the 50 hacircular area surrounding each camera traplocation. Lastly, we created a dummy variablethat indicated whether the camera trap wasinside or outside the park (Table 1).
Modeling tiger habitat selectionWe used N-mixture models (Royle 2004) to
estimate the relative effect of environmental(derived from the 2009 image) and human factors(Table 1) on the spatial variability of tigerabundance from the 2010 camera trap data.Using model results we predicted location-specific tiger ‘‘abundance.’’ The abundance indexindicated whether a location is more or less likelyto be visited by tigers (Linkie et al. 2010). Thus,the abundance index was used as a surrogate oftiger habitat suitability based on the assumptionthat habitat conditions in a location are directlyrelated to the number of times it is visited by thetarget species (Boyce and McDonald 1999).
We let nit denote the number of individualtigers detected at trap i (¼1, 2, . . . , R) andoccasion t (¼1, 2, . . . , T ). We assumed that thetiger population being sampled was demograph-ically closed so that the number of detectedindividuals may be viewed as independent andidentically distributed binomial random vari-ables:
nit ; Binomial ðNi; pÞ
where Ni is tiger abundance at trap i and p is thedetection probability. The Ni were regarded asrandom effects with a Poisson distribution withmean k. We chose a Poisson variant of the N-mixture model because it has been shown togenerate more ecologically realistic parameterestimates than the negative binomial and zeroinflated negative binomial variants (Joseph et al.2009). Mean trap abundance, ki, was allowed tovary in response to all environmental and humanfactor covariates by adopting a log-linear model:
logðkiÞ ¼ b0 þXK
k¼1
xikbk ð1Þ
where xik; k ¼ 1, 2, . . . , K are the K measurablecovariates and b is a K-dimensional vector ofcovariate parameters for trap i. Detection prob-ability, p, can vary with time in addition to trap-specific covariates (i.e., environmental and hu-man factors) (MacKenzie et al. 2002). To create atime-specific covariate, we calculated the Juliandate (Hein et al. 2009) for each day that the trapswere operational. Detection probability wasallowed to vary in response to time and trap-specific covariates using a logistic regressionmodel:
logitðpiÞ ¼ a0 þXK
k¼1
xikak ð2Þ
where pi is the probability that a tiger will bedetected at trap i and a is a K-dimensional vectorof covariate parameters. The integrated likeli-hood from all R traps was established as:
Lðp; kj nitf gÞ
¼YR
i¼1
X‘
Ni¼maxtnit
�YT
t¼1
Binðnit; Ni; pÞ�
f ðNi; kÞ( )
:
Conventional maximum likelihood was used toestimate parameters from this integrated likeli-hood.
Models were ranked according to their second-order Akaike’s information criterion (AICc), withhigher-ranked models having lower AICc values(Burnham and Anderson 1998). Because severalmodels with different combinations of covariatesperformed comparatively well (i.e., DAICc , 4),we averaged model results (i.e., covariate coeffi-cients) from the top-ranked models using multi-model inference (Anderson 2007). Model-averaged coefficient estimates were consideredsignificant if their unconditional 95% CIs did notinclude zero.
We used parametric bootstrapping to evaluatethe goodness-of-fit of the top-ranked models. Wesimulated 100 data sets from each of the top-ranked models and fit the models to the datausing the Freeman-Tukey fit statistic. We thencompared the value of the Freeman-Tukey fitstatistic of the observed data set to the fitstatistics of the simulated data sets. A model
v www.esajournals.org 6 October 2013 v Volume 4(10) v Article 124
CARTER ET AL.
was considered to adequately fit the observeddata if the observed fit statistic value did notexceed the 0.05 percentile of the distribution ofthe fit statistics calculated from the simulateddata sets (Sillett et al. 2012). Model specification,parameter estimation, averaging, and goodness-of-fit were performed using the ‘unmarked’ and‘AICcmodavg’ packages in the R software (Fiskeand Chandler 2011).
Mapping tiger habitat suitabilityWe processed Landsat TM and ETMþ images
from November 1989 and December 1999 usingthe same procedures we used to process the 2009image. Accuracy of the land-cover maps obtainedfor 1989 and 1999 was not evaluated due tounavailability of reference data covering thesetime periods. Nevertheless, accuracy of thesemaps was expected to be similar to that of the2009 land-cover map, since map productionfollowed the same procedures (including imagepre-processing to account for atmospheric ef-fects).
The three time periods comprised intervals oftime roughly prior to (i.e., 1989–1999), and after(i.e., 1999–2009) the implementation of bufferzone policies in the multiple-use area outside thepark. Restrictions on livestock grazing outsidethe park did not take effect until communityforest user groups were organized. This hap-pened about a couple of years after the bufferzone was established in 1996 (N. M. B. Pradhan,personal communication).
For 1989, 1999, and 2009 we combinedcovariate GIS layers and the model-averagedparameter estimates to assign a tiger ‘‘abun-dance’’ value to pixels on a grid with a spatialresolution equal to that of the Landsat imagery(i.e., 28.5 m 3 28.5 m). First, covariate GIS layersfor each time period were produced usingArcGIS 10 and FRAGSTATS, wherein a circularwindow with a 400 m radius was passed overeach pixel in the grid and metrics at the class orlandscape level were calculated at the focal pixel.Then, using the covariate GIS layers and param-eter estimates as input, we took the exponent ofthe right-hand side of Eq. 1 to estimate per-pixeltiger abundances (i.e., per-pixel estimates of k )for all three time periods.
To avoid over-extrapolation, the maps of tigerhabitat suitability obtained were restricted to the
areas accessible to tigers detected by the cameras.Habitat suitability outside the park was mappedin the naturally vegetated area south of the ‘East-West’ highway, which delineates the northernboundary of the buffer zone (Fig. 1). Within-parkhabitat suitability was mapped in an areadelineated by the Churia hills to the west, thepark border to the north, and one-half the meanmaximum distance traveled (MMDM/2) by thetigers in the southern and eastern boundaries ofthe park. MMDM/2 was determined as thedistance between the two farthest capture loca-tions for all individual tigers, and is often used todelineate the effective sample area for populationdensity estimates (Karanth and Nichols 1998).Maps of habitat change from 1989 to 1999 and1999 to 2009 were created by calculating the per-pixel difference in tiger habitat suitability be-tween the respective time periods. Changes in thearea of different habitat suitability categorieswere assessed for each land management regimeacross time. Mean change and 95% confidenceintervals in habitat suitability were calculated at100 m intervals away from the human settledarea up to 3,000 m. We chose 3,000 m becauselocal people do not usually travel farther tocollect natural resources.
RESULTS
Tiger detectionsWe obtained a total of 131 adult tiger detec-
tions, with 92 and 39 detections inside andoutside the park, respectively. We identified 17individual adult tigers across all camera traps.Twelve adults were detected inside the park and6 were detected outside the park, with one tigerbeing photographed in both areas. Across ourstudy site, 75% (57/76) of all camera traps weretriggered by tigers. A larger percentage ofcameras outside the park (83%) were triggeredby tigers than inside the park (70%). The numberof tiger detections at each camera trap rangedfrom 0 to 9 inside the park (�x ¼ 2), and 0–4outside the park (�x¼ 1.3). MMDM/2 was 2,371 m.
Changes in land coverOverall accuracy of the 2009 land-cover map
was 85.3% suggesting that the classificationprocedure adequately represented the land-coverclasses in the study area (Congalton 1991). Land-
v www.esajournals.org 7 October 2013 v Volume 4(10) v Article 124
CARTER ET AL.
cover classifications for all three time periodsrevealed that from 1989 to 2009 grassland areadecreased (�323 ha) inside the park and in-creased (192 ha) outside the park (Table 2). Incontrast, barren land-cover, which mostly con-sisted of sandy floodplain, increased (451 ha)inside the park and decreased (�106 ha) outsidethe park. Sal forest decreased both inside (�910ha) and outside the park (�411 ha) while riverineforest increased both inside (786 ha) and outside(327 ha) the park over the 20 year period (Table2).
Predictors of detection probabilityand tiger habitat
We ran approximately 200 models with differ-ent combinations of variables. Model AICc valuesranged from 892.35 to 873.05. The bootstrap Pvalues for the top-ranked models (Table 3) basedon the Freeman-Tukey fit statistic were 0.45, 0.46,0.51, and 0.47, suggesting the models fit the data
adequately. Model-averaging indicated that tigerabundance was positively associated with corre-lation length (b ¼ 0.32, 95% CI: 0.06–0.57) andgrassland area (b ¼ 0.23, 95% CI: 0.04–0.42),suggesting that tigers selected areas consisting ofmore connected land-cover patches and withmore grassland. Detection probability was neg-atively associated with riverine forest area (b ¼�0.37, 95% CI:�0.69 to�0.06) and Julian date (b¼�0.44, 95% CI:�0.75 to�0.12), suggesting thattigers were less likely to be detected in areas withmore riverine forest and later in the samplingperiod. With the covariates set to zero (i.e.,mean), detection probability was 0.02 (SE ¼0.008) across all traps in the study site.
Tiger habitat suitability and its changesTiger habitat suitability, as measured using a
per-pixel abundance index, ranged from 1.64 to11.07 (�x¼4.38), 1.53 to 11.08 (�x¼4.38), and 0.63 to11.73 (�x ¼ 4.36) for 1989, 1999, and 2009,respectively. The habitat suitability index (HSI)in all three time periods was the most heteroge-neous along the Rapti River and in areas adjacentto human settlements, whereas relatively homog-enous and moderate habitat suitability tended tooccur within the core of the inside study site (Fig.2). The mean tiger HSI was higher inside (1989:4.54, 1999: 4.54, 2009: 4.46) than outside the park(1989: 4.09, 1999: 4.1, 2009: 4.23) at all three timeperiods, although the difference in mean HSIinside and outside the park diminished throughtime (i.e., 10.98%, 10.55%, and 5.35% in 1989,1999, and 2009, respectively).
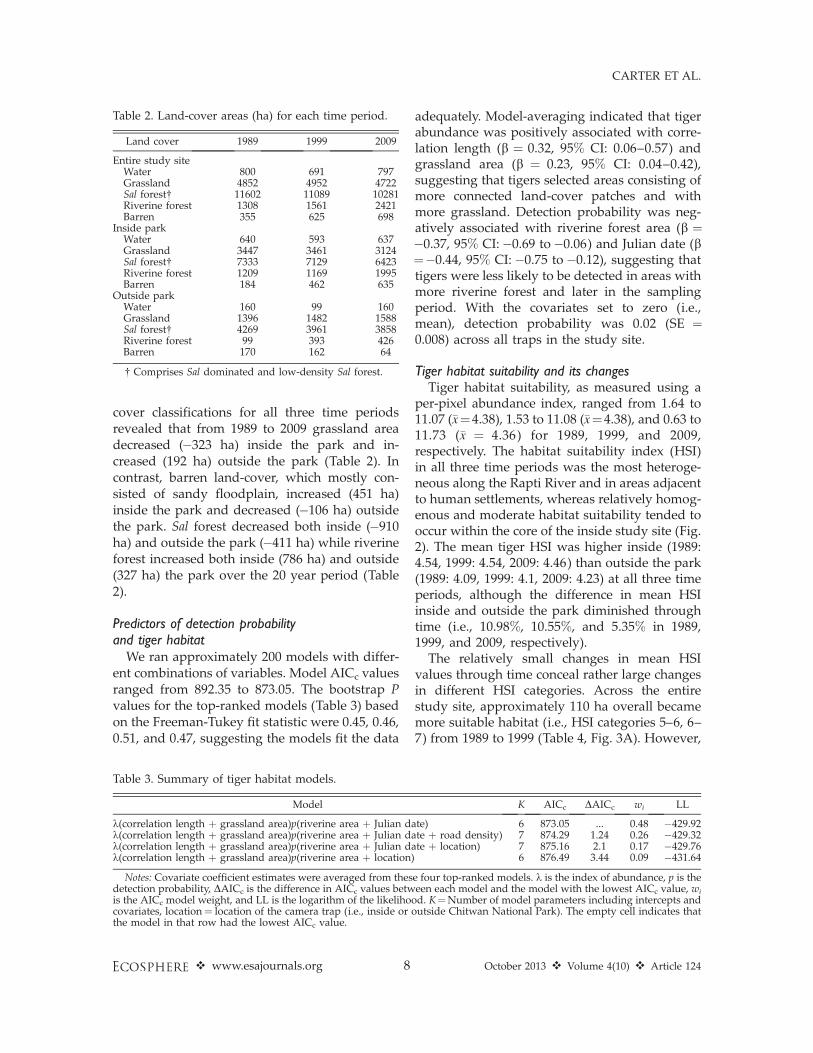
The relatively small changes in mean HSIvalues through time conceal rather large changesin different HSI categories. Across the entirestudy site, approximately 110 ha overall becamemore suitable habitat (i.e., HSI categories 5–6, 6–7) from 1989 to 1999 (Table 4, Fig. 3A). However,
Table 2. Land-cover areas (ha) for each time period.
Land cover 1989 1999 2009
Entire study siteWater 800 691 797Grassland 4852 4952 4722Sal forest� 11602 11089 10281Riverine forest 1308 1561 2421Barren 355 625 698
Inside parkWater 640 593 637Grassland 3447 3461 3124Sal forest� 7333 7129 6423Riverine forest 1209 1169 1995Barren 184 462 635
Outside parkWater 160 99 160Grassland 1396 1482 1588Sal forest� 4269 3961 3858Riverine forest 99 393 426Barren 170 162 64
� Comprises Sal dominated and low-density Sal forest.
Table 3. Summary of tiger habitat models.
Model K AICc DAICc wi LL
k(correlation length þ grassland area)p(riverine area þ Julian date) 6 873.05 ... 0.48 �429.92k(correlation length þ grassland area)p(riverine area þ Julian date þ road density) 7 874.29 1.24 0.26 �429.32k(correlation length þ grassland area)p(riverine area þ Julian date þ location) 7 875.16 2.1 0.17 �429.76k(correlation length þ grassland area)p(riverine area þ location) 6 876.49 3.44 0.09 �431.64
Notes: Covariate coefficient estimates were averaged from these four top-ranked models. k is the index of abundance, p is thedetection probability, DAICc is the difference in AICc values between each model and the model with the lowest AICc value, wi
is the AICc model weight, and LL is the logarithm of the likelihood. K¼Number of model parameters including intercepts andcovariates, location¼ location of the camera trap (i.e., inside or outside Chitwan National Park). The empty cell indicates thatthe model in that row had the lowest AICc value.
v www.esajournals.org 8 October 2013 v Volume 4(10) v Article 124
CARTER ET AL.

from 1999 to 2009, approximately 350 ha of
habitat in the three highest HSI categories (12 to
17% of each category) downgraded to lower HSI
categories (i.e., 3–4 and 4–5). Inside the park,
approximately 100 ha became more suitable
habitat (i.e., HSI categories 5–6, 6–7) from 1989
to 1999, although the lowest HSI category
increased by 275 ha (17%, Table 4, Fig. 3B).
Moreover, from 1999 to 2009, approximately 410
ha of habitat in the three highest HSI categories
(17 to 24% of each category) downgraded tolower categories (i.e., 3–4, 4–5), resulting in a netdecline in habitat suitability inside the park overthat time. In contrast, outside the park, over 400ha in the lowest HSI category upgraded to moresuitable habitat over the 20 year interval (Table 4,Fig. 3C). The highest HSI category increased by52 ha (50%) from 1999 to 2009, contributing to anet increase in the HSI outside the park over thattime.
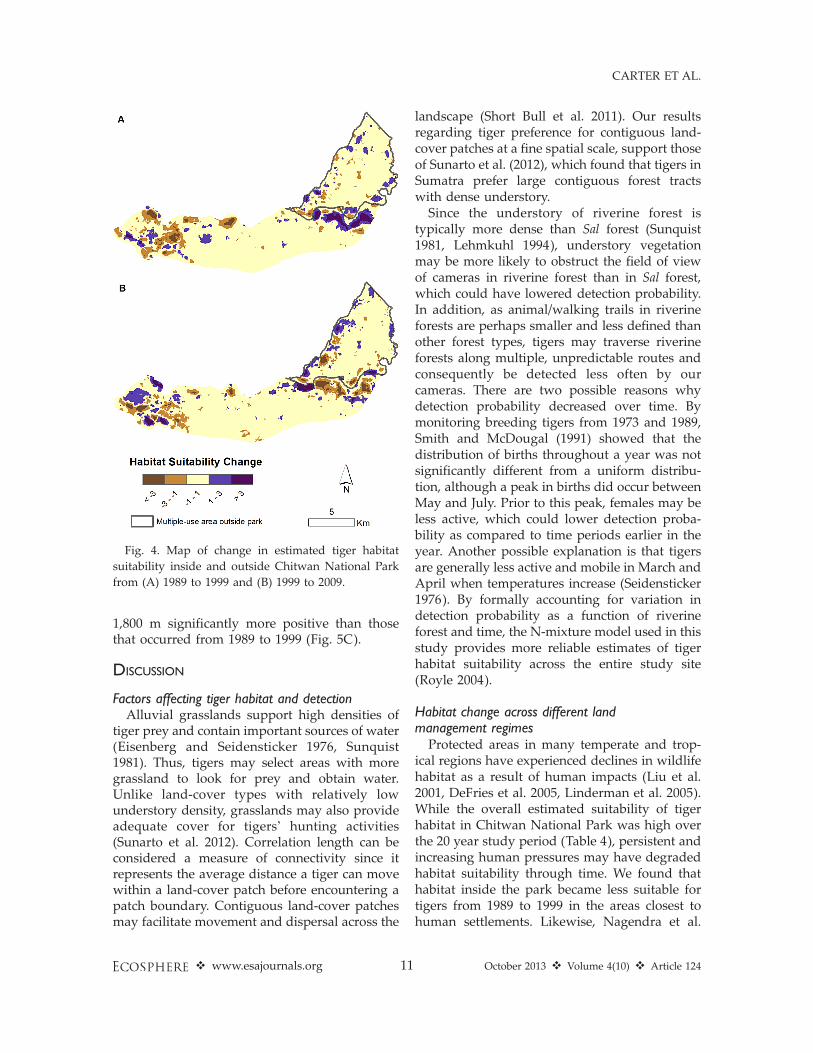
Per-pixel change in tiger habitat suitabilityfrom 1989 to 1999 and 1999 to 2009 ranged from�7.56 to 7.37 and �7.59 to 8.34, respectively.Negative values are associated with habitatbecoming ‘less suitable’ over time, while positivevalues are associated with habitat becoming‘more suitable’ over time (Fig. 4). Habitatsuitability inside the park changed the mostalong the Rapti River and in the large grassland/riverine complexes to the west and east. Habitatsuitability outside the park changed the mostalong the border with the human settled area(Fig. 4).
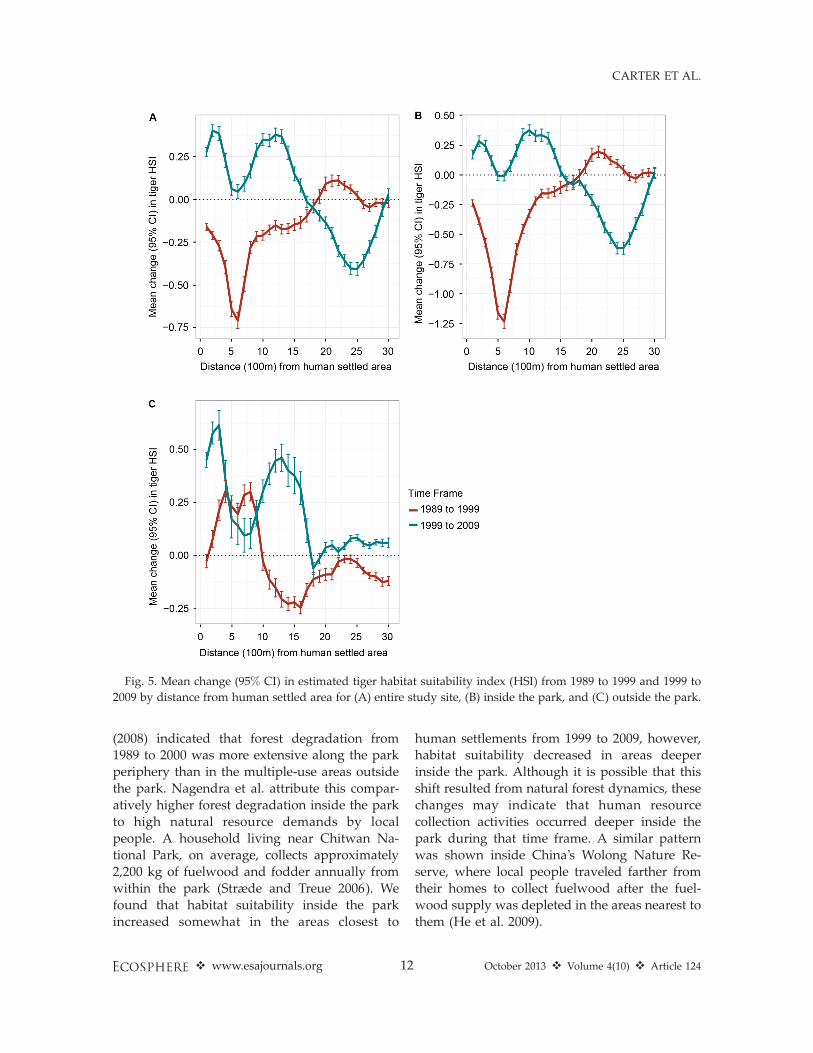
From 1989 to 1999, the mean change in thetiger habitat suitability across the entire studysite was negative at distances of 100 to 1,800 maway from the human settled area, with the lowpoint (�0.7 in HSI) occurring at about 600 m fromthe human settled area (Fig. 5A). From 1999 to
Fig. 2. Map of estimated tiger habitat suitability
inside and outside Chitwan National Park in three
time periods: (A) 1989, (B) 1999, and (C) 2009.
Table 4. Areas (ha) of different tiger habitat suitability
index (HSI) categories for each time period.
HSI category 1989 1999 2009
Entire study site, 3 2798 2817 25303–4 4189 4081 44594–5 9616 9590 98475–6 825 897 7866–7 489 532 453. 7 1001 998 834
Inside park, 3 1622 1897 17733–4 2737 2343 27404–5 6560 6573 67055–6 601 672 5606–7 382 430 348. 7 911 893 676
Outside park, 3 1176 920 7583–4 1452 1738 17194–5 3057 3016 31435–6 224 225 2256–7 107 102 104. 7 90 105 157
v www.esajournals.org 9 October 2013 v Volume 4(10) v Article 124
CARTER ET AL.
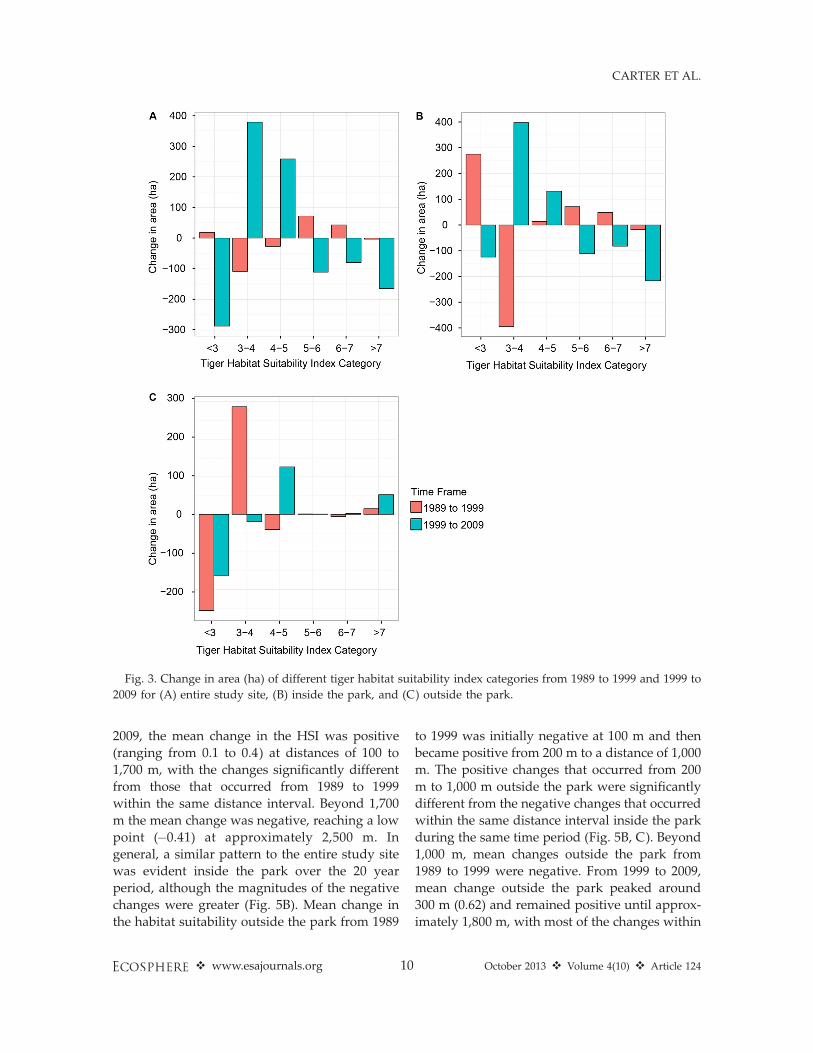
2009, the mean change in the HSI was positive
(ranging from 0.1 to 0.4) at distances of 100 to
1,700 m, with the changes significantly different
from those that occurred from 1989 to 1999
within the same distance interval. Beyond 1,700
m the mean change was negative, reaching a low
point (�0.41) at approximately 2,500 m. In
general, a similar pattern to the entire study site
was evident inside the park over the 20 year
period, although the magnitudes of the negative
changes were greater (Fig. 5B). Mean change in
the habitat suitability outside the park from 1989
to 1999 was initially negative at 100 m and then
became positive from 200 m to a distance of 1,000
m. The positive changes that occurred from 200
m to 1,000 m outside the park were significantly
different from the negative changes that occurred
within the same distance interval inside the park
during the same time period (Fig. 5B, C). Beyond
1,000 m, mean changes outside the park from
1989 to 1999 were negative. From 1999 to 2009,
mean change outside the park peaked around
300 m (0.62) and remained positive until approx-
imately 1,800 m, with most of the changes within
Fig. 3. Change in area (ha) of different tiger habitat suitability index categories from 1989 to 1999 and 1999 to
2009 for (A) entire study site, (B) inside the park, and (C) outside the park.
v www.esajournals.org 10 October 2013 v Volume 4(10) v Article 124
CARTER ET AL.
1,800 m significantly more positive than thosethat occurred from 1989 to 1999 (Fig. 5C).
DISCUSSION
Factors affecting tiger habitat and detectionAlluvial grasslands support high densities of
tiger prey and contain important sources of water(Eisenberg and Seidensticker 1976, Sunquist1981). Thus, tigers may select areas with moregrassland to look for prey and obtain water.Unlike land-cover types with relatively lowunderstory density, grasslands may also provideadequate cover for tigers’ hunting activities(Sunarto et al. 2012). Correlation length can beconsidered a measure of connectivity since itrepresents the average distance a tiger can movewithin a land-cover patch before encountering apatch boundary. Contiguous land-cover patchesmay facilitate movement and dispersal across the
landscape (Short Bull et al. 2011). Our resultsregarding tiger preference for contiguous land-cover patches at a fine spatial scale, support thoseof Sunarto et al. (2012), which found that tigers inSumatra prefer large contiguous forest tractswith dense understory.
Since the understory of riverine forest istypically more dense than Sal forest (Sunquist1981, Lehmkuhl 1994), understory vegetationmay be more likely to obstruct the field of viewof cameras in riverine forest than in Sal forest,which could have lowered detection probability.In addition, as animal/walking trails in riverineforests are perhaps smaller and less defined thanother forest types, tigers may traverse riverineforests along multiple, unpredictable routes andconsequently be detected less often by ourcameras. There are two possible reasons whydetection probability decreased over time. Bymonitoring breeding tigers from 1973 and 1989,Smith and McDougal (1991) showed that thedistribution of births throughout a year was notsignificantly different from a uniform distribu-tion, although a peak in births did occur betweenMay and July. Prior to this peak, females may beless active, which could lower detection proba-bility as compared to time periods earlier in theyear. Another possible explanation is that tigersare generally less active and mobile in March andApril when temperatures increase (Seidensticker1976). By formally accounting for variation indetection probability as a function of riverineforest and time, the N-mixture model used in thisstudy provides more reliable estimates of tigerhabitat suitability across the entire study site(Royle 2004).
Habitat change across different landmanagement regimes
Protected areas in many temperate and trop-ical regions have experienced declines in wildlifehabitat as a result of human impacts (Liu et al.2001, DeFries et al. 2005, Linderman et al. 2005).While the overall estimated suitability of tigerhabitat in Chitwan National Park was high overthe 20 year study period (Table 4), persistent andincreasing human pressures may have degradedhabitat suitability through time. We found thathabitat inside the park became less suitable fortigers from 1989 to 1999 in the areas closest tohuman settlements. Likewise, Nagendra et al.
Fig. 4. Map of change in estimated tiger habitat
suitability inside and outside Chitwan National Park
from (A) 1989 to 1999 and (B) 1999 to 2009.
v www.esajournals.org 11 October 2013 v Volume 4(10) v Article 124
CARTER ET AL.
(2008) indicated that forest degradation from1989 to 2000 was more extensive along the parkperiphery than in the multiple-use areas outsidethe park. Nagendra et al. attribute this compar-atively higher forest degradation inside the parkto high natural resource demands by localpeople. A household living near Chitwan Na-tional Park, on average, collects approximately2,200 kg of fuelwood and fodder annually fromwithin the park (Stræde and Treue 2006). Wefound that habitat suitability inside the parkincreased somewhat in the areas closest to
human settlements from 1999 to 2009, however,habitat suitability decreased in areas deeperinside the park. Although it is possible that thisshift resulted from natural forest dynamics, thesechanges may indicate that human resourcecollection activities occurred deeper inside thepark during that time frame. A similar patternwas shown inside China’s Wolong Nature Re-serve, where local people traveled farther fromtheir homes to collect fuelwood after the fuel-wood supply was depleted in the areas nearest tothem (He et al. 2009).
Fig. 5. Mean change (95% CI) in estimated tiger habitat suitability index (HSI) from 1989 to 1999 and 1999 to
2009 by distance from human settled area for (A) entire study site, (B) inside the park, and (C) outside the park.
v www.esajournals.org 12 October 2013 v Volume 4(10) v Article 124
CARTER ET AL.
Stræde and Treue (2006) indicated that house-holds living near Chitwan National Park onaverage collect 6%, 5%, and 17.8% of their annualtimber, fuelwood, and fodder needs, respectively,from inside the park. The majority of timber andfuelwood collected from inside the park was Sal(Stræde et al. 2002), which is considered the mostvaluable (thus most exploited) tree species in theregion (Nagendra 2003). Removal of forestunderstory and woody biomass from the parkmay have reduced hiding cover for tigers(Sunarto et al. 2012) and induced land coverfragmentation (Gasparri and Grau 2009). Inaddition, Stræde and Helles (2000) noted thatdemand for park resources, especially grasses, bylocal people has been steadily increasing. There-fore, the decline in grassland area inside the park,and consequential loss of highly suitable tigerhabitat, may be partially attributed to substantialanthropogenic pressure (Peet et al. 1999, Strædeand Helles 2000).
Other disturbances such as flooding and firealso likely affected tiger habitat suitability. Theheterogeneity in habitat suitability along thenorthern boundary of the park is likely due, inpart, to the movement of the Rapti River, whichconstantly erodes, deposits alluvium, and chang-es course across the floodplain (Peet et al. 1999).When the river changes course some areasbecome inundated while other areas where theriver once was are rapidly colonized by S.spontaneum grasses (Peet et al. 1999). In addition,fire, naturally or human caused, delays thesuccession from grasslands to riverine forest.However, fire cannot prevent succession entirelybecause of variations in fire intensity andoccurrence (Lehmkuhl 1994). Thus, decreasinggrasslands and Sal forest and the correspondingincrease in riverine areas observed inside thepark over the 20 year period may be due to acombination of human and natural disturbances.Despite the degradation of highly suitable areasinside the park, especially from 1999 to 2009,tiger numbers inside the park appear to be stable(Carter et al. 2012b). This is perhaps because thechange in habitat suitability to date is not large orextensive enough to induce a substantial changein tiger numbers. Alternatively, a time-lag mayexist between changes in habitat suitability andtiger numbers.
As the area outside the park was considered
heavily degraded prior to its establishment as thebuffer zone (Sharma 1990), resource collectorslikely had to travel relatively far into themultiple-use area to find adequate supplies ofhigh-quality resources. Extracting natural re-sources from deeper inside the multiple-use areamay have induced the average decrease inestimated tiger habitat suitability from 1989 to1999 within 1.5 km from human settlements. Theprohibition of livestock grazing and institution-alization of community-based resource manage-ment outside the park shortly after the bufferzone was established in 1996 substantially alteredresource consumption patterns. For example, theremoval of domestic livestock likely enabled thearea outside the park to support a greater densityof wild prey animals (Gurung et al. 2008) andprovide better hiding cover for tigers. The controlof overharvesting of shared natural resources incommunity forests in the buffer zone may alsohave improved tiger habitat outside the park.This is supported by improvements in estimatedhabitat suitability occurring mostly in areasadjacent to human settlements that are designat-ed as community forests. In addition, as resourceextraction policies and practices influence thespatial distribution of human activities, these, inturn, affect the spatial configuration of the landcover. As such, before the buffer zone wasestablished, uncontrolled open-access resourceextraction likely fragmented the land cover. Incontrast, the coordinated management of foresttracts by user-group committees after the bufferzone was established may have helped reversethis fragmentation (Nagendra et al. 2008), andthus improved tiger habitat suitability.
The improvement of estimated tiger habitatsuitability outside the park is independentlysupported by an increasing frequency of tigersightings over the last decade (DNPWC 2007).While searching for tiger tracks and kills from1999 to 2003, Gurung et al. (2006) did not findany evidence of breeding females (i.e., adultfemale tracks with cub tracks) in the multiple-usearea outside the park. From our 2010 camera trapdata, we identified a female tiger living com-pletely outside the park and accompanied bythree of her cubs, suggesting that the habitatoutside the park has improved over the lastdecade. Currently, tiger densities inside andoutside the park in our study site seem to be
v www.esajournals.org 13 October 2013 v Volume 4(10) v Article 124
CARTER ET AL.

comparable (Carter et al. 2012b). Attacks onpeople outside the park have also increased sincethe late 1990s (Gurung et al. 2008), thus efforts tomitigate human-tiger conflicts (Carter et al. 2013)are vital to fostering coexistence in Chitwan. Themain purpose of community forests is to sustain-ably provide natural resources to local commu-nities; however, their formation does notautomatically lead to the protection and/orimprovement of tiger habitat. Moreover, thedemands, practices, and compositions of thecommunity forest user groups are constantlychanging, and consequently, tiger habitat maydegrade in the future in areas where it iscurrently improving. Therefore, coupled withefforts to mitigate human-tiger conflicts, wesuggest that tiger habitat suitability be monitoredregularly inside and outside the park (usingprocedures similar to those reported here) toensure that the land continues to support tigers.
Land management policies and practices in-side and outside the park and their impacts ontiger habitat are not mutually exclusive. Thesetwo land management regimes adjoin each otherin space, with the effects of one likely havingdirect and/or indirect effects on the other. Forinstance, while local people legally extractnatural resources from the buffer zone outsidethe park, it appears that the products obtained donot fully substitute those collected inside thepark (Stræde and Treue 2006). Therefore, givenprojected human population growth and currentper-capita resource demands in Chitwan (Strædeand Treue 2006, CBS 2012), protecting tigerhabitat will become increasingly difficult overtime. As such, policies that reduce humanreliance on local natural resources (e.g., encour-aging the use of non-wood fuel sources andimproved livestock breeds) and actively manag-ing tiger habitat are urgently needed (Hjortsø etal. 2006, Gurung et al. 2009, Thornton 2010).Furthermore, participatory-based managementof ecosystems in and around the park, whereinlocal people are partners in designing, imple-menting, and enforcing resource managementactions, may also foster sustainable conservationof tiger habitat over the long-term (Agrawal andOstrom 2001). Such institutional arrangements,for instance, may enable the creation andmaintenance of grasslands and early successionalvegetation types in Chitwan through coordinated
management efforts, including tree thinning andgrassland cutting and burning (Brown 2003, Smit2004).
Methodological considerationsIn this study we assumed that tigers within the
Chitwan ecosystem remained closed to demo-graphic change for 89 days, which may beappropriate in this context as tigers are long-lived and Chitwan has relatively long seasons(O’Brien and Kinnaird 2011). We also assumedthat the determinants of tiger habitat suitabilityremained unchanged from 1989 to 2009, whichmay be appropriate as tiger-habitat relationshipscharacterize fundamental interactions betweentigers and their environment (Morrison et al.2006). However, tigers may have adjusted theirspace use over the 20 year period as a result ofchanges in the composition and distribution ofprey, the density of tigers, and/or humandisturbances. For example, although tigers maybe habituated to the road network that currentlyoccurs in the study site, the construction of roadsin the past may have strongly disturbed tigerspace use and consequently decreased habitatsuitability of areas surrounding the roads forextended periods of time.
Our results on habitat suitability only refer tothe dry season (i.e., January to April). Yet, tigersmay select areas differently at different times ofthe year. For example, the use of grasslands bytigers may decrease in the wet season because thegrasslands are periodically inundated, whichforces prey animals to move to drier ground inupland forests (Sunquist 1981). Nevertheless, ourfindings are likely valid across seasons becausethe factors influencing habitat suitability identi-fied in this study are similar to those from severalother studies that spanned different seasons(Seidensticker 1976, Sunquist 1981, Smith et al.1998). Collecting longitudinal (i.e., annual) tigeroccurrence data across different seasons inconjunction with data on environmental andhuman factors in future studies will eliminateconfounding issues of temporal variation in tigerhabitat selection. Integrating such informationwith detailed data on individual-level tigerbehaviors (e.g., from GPS collars) would explic-itly link individual and population-level process-es, and potentially allow for the design ofadaptive models of habitat suitability that better
v www.esajournals.org 14 October 2013 v Volume 4(10) v Article 124
CARTER ET AL.
capture temporal dynamics in habitat selection(Persson and De Roos 2003).
Although wildlife abundance is generallycorrelated with habitat suitability (Boyce andMcDonald 1999), in some cases it is possible tofind low or no relation between wildlife abun-dance and habitat selection (Liu et al. 2011). Forinstance, occurrences in suitable habitat may below due to hunting or disease or to lack ofcolonization due to dispersal barriers. Converse-ly, animal occurrences in low quality habitat maybe high, because less competitive juveniles arerelegated to those areas (Van Horne 1983), oranimals use those areas as travel corridors.However, circumstances such as these seem tobe uncommon in our study site as tiger poachingin Chitwan has been relatively low since the endof the civil war in Nepal in 2006. Furthermore,tigers seem to have colonized the entire study sitebefore the study was performed, and with theexception of the Rapti River, no obvious barriersto tiger movement (e.g., expanses of cultivated orurban developed land) are conspicuous.
Explicitly linking habitat conditions to tigersurvival and reproduction would potentiallyenable evaluating changes in tiger populationsize in areas under different management re-gimes. However, with the data collected in thisstudy we were unable to quantitatively relatechanges in tiger habitat suitability to tigerpopulation dynamics and persistence. As aresult, it is still unclear how the changes observedaffect tiger population viability in the area.
CONCLUSIONS
Our first study objective (i.e., evaluate changesin tiger habitat suitability from 1989 to 2009) wasaddressed through the integration of data ob-tained from camera traps and remotely-sensedimagery. Our results indicated that the estimatedhabitat suitability was higher inside the parkthan outside; however, over the 20-year studyperiod a gradual decline in habitat suitability wasobserved inside the park while a gradualimprovement was observed outside the park.Our second study objective (i.e., assess thepotential influence of resource managementpolicies and practices on observed changes intiger habitat suitability) was addressed using athorough literature review combined with per-
sonal knowledge of the study site. This analysissuggested that the top-down, exclusion policiesof the National Park have not adequatelystopped the natural resource collection activitiesof a growing human population from impactingtiger habitat inside the park. In contrast, habitatimprovement outside the park occurred afterpolicies that involved local people in the man-agement of local natural resources (e.g., prevent-ing livestock grazing) were implemented.
Degradation of highly suitable habitat insidethe park is concerning and warrants assiduousmonitoring to ascertain whether or not this trendis continuing, and if so, actions to reverse thetrend should be pursued (e.g., actively managinggrasslands, creating and maintaining communalgrasslands outside park, encouraging the use ofnon-wood fuels). Expanding the involvement oflocal people in the management of local naturalresources may help improve tiger habitat suit-ability in Chitwan and in important multiple-useareas that link tiger source populations inprotected areas (Wikramanayake et al. 2004).However, the costs to local people (e.g., tigerattacks on people and livestock) must be care-fully addressed for the long-term conservation oftigers and their habitat.
In addition to Chitwan, our study methodsand analyses can be applied to protected areasdistributed throughout the tiger’s range todetermine if habitat suitability has decreased,remained stable, or increased therein. Further-more, by extending the evaluation of habitatchange beyond protected areas to multiple-useareas, both of which are integral components oflandscape-scale conservation initiatives, re-searchers can also assess how effective are aplethora of management practices and policies(e.g., integrated conservation and developmentprojects, community-based natural resourcemanagement, etc.) at maintaining or expandingtiger habitat throughout their range. Effectivetiger habitat conservation strategies will alsopromote the conservation of thousands of otherimperiled animal and plant species that use thesame ecosystems as tigers, such as the Indianelephant (Elephas maximus indicus), the Indianrhino (Rhinoceros unicornis), the sloth bear (Ursusursinus), the dhole (Cuon alpinus), and the gaur(Bos gaurus) (Joshi et al. 1995, Karanth andSunquist 1995, Wikramanayake et al. 1998,
v www.esajournals.org 15 October 2013 v Volume 4(10) v Article 124
CARTER ET AL.
Nyhus and Tilson 2004). Information on how(e.g., dynamics in key habitat determinants) andwhere (e.g., specific locations and regions)habitat is changing will ultimately help guideconservation actions in human-dominated re-gions, which prevail throughout the ranges ofmany if not all of these and other imperiledspecies.
ACKNOWLEDGMENTS
Thanks to W. Axinn, D. Ghimire, M. Cotton, D. B.Tamang, and the International Trust for NatureConservation (UK) for their support throughout thisproject; R. Kumal, B. Mahato, I. Kumal, and the TigerTops Jungle Lodge for field support; the Institute forSocial and Environmental Research-Nepal for logisticalsupport; J. A. Royle and R. Malcolm for their assistancewith analyses; and the Nepal Department of NationalParks and Wildlife Conservation for permission tocollect data inside Chitwan National Park. Fundingwas provided by the United States Fish and WildlifeService Rhinoceros and Tiger Conservation Fund, theNational Science Foundation (Partnerships in Interna-tional Research and Education, Dynamics of CoupledNatural and Human Systems Program), MichiganState University, and National Aeronautics and SpaceAdministration’s Earth and Space Science program. Wethank two anonymous reviewers and the subject-matter editor for helpful comments on earlier drafts ofthis manuscript.
LITERATURE CITED
Agrawal, A. and E. Ostrom. 2001. Collective action,property rights, and decentralization in resourceuse in India and Nepal. Politics & Society 29:485–514.
Ahearn, S. C., J. L. D. Smith, A. R. Joshi, and J. Ding.2001. TIGMOD: an individual-based spatiallyexplicit model for simulating tiger/human interac-tion in multiple use forests. Ecological Modelling140:81–97.
Anderson, D. R. 2007. Model based inference in the lifesciences: a primer on evidence. Springer, NewYork, New York, USA.
Bearer, S., M. Linderman, J. Huang, L. An, G. He, andJ. Liu. 2008. Effects of fuelwood collection andtimber harvesting on giant panda habitat use.Biological Conservation 141:385–393.
Bertzky, B., C. Corrigan, J. Kemsey, S. Kenney, C.Ravilious, C. Besancon, and N. Burgess. 2012.Protected planet report 2012: tracking progresstowards global targets for protected areas. IUCN,Gland, Switzerland and UNEP-WCMC, Cam-bridge, UK.
Biradar, C. M., P. S. Thenkabail, P. Noojipady, Y. Li, V.Dheeravath, H. Turral, M. Velpuri, M. K. Gumma,O. R. P. Gangalakunta, and X. L. Cai. 2009. A globalmap of rainfed cropland areas (GMRCA) at the endof last millennium using remote sensing. Interna-tional Journal of Applied Earth Observation andGeoinformation 11:114–129.
Boyce, M. S. and L. L. McDonald. 1999. Relatingpopulations to habitats using resource selectionfunctions. Trends in Ecology & Evolution 14:268–272.
Brown, K. 2003. Integrating conservation and devel-opment: a case of institutional misfit. Frontiers inEcology and the Environment 1:479–487.
Burnham, K. P. and D. R. Anderson. 1998. Modelselection and inference: a practical information-theoretic approach. Springer, New York, NewYork, USA.
Carter, N. H., S. J. Riley, and J. Liu. 2012a. Utility of apsychological framework for carnivore conserva-tion. Oryx 46:525–535.
Carter, N. H., S. J. Riley, A. Shortridge, B. K. Shrestha,and J. Liu. 2013. Spatial assessment of attitudestoward tigers in Nepal. Ambio doi: 10.1007/s13280-13013-10421-13287
Carter, N. H., B. K. Shrestha, J. B. Karki, N. M. B.Pradhan, and J. Liu. 2012b. Coexistence betweenwildlife and humans at fine spatial scales. Proceed-ings of the National Academy of Sciences109:15360–15365.
CBS. 2012. Central Bureau of Statistics, NationalPlanning Commission Secretariat, Government ofNepal. http://cbs.gov.np/
Chaudhary, R. P. 1998. Biodiversity in Nepal: statusand conservation. Tecpress Books, Saharanpur,India.
Chavez, P. S. 1996. Image-based atmospheric correc-tions-revisited and improved. PhotogrammetricEngineering and Remote Sensing 62:1025–1035.
Congalton, R. G. 1991. A review of assessing theaccuracy of classifications of remotely sensed data.Remote Sensing of Environment 37:35–46.
DeFries, R., A. Hansen, A. C. Newton, and M. C.Hansen. 2005. Increasing isolation of protectedareas in tropical forests over the past twenty years.Ecological Applications 15:19–26.
DNPWC. 2007. Tiger conservation action plan forNepal 2008-2012. Department of National Parksand Wildlife Conservation, Ministry of Forests andSoil Conservation, Government of Nepal.
Eisenberg, J. F. and J. Seidensticker. 1976. Ungulates insouthern Asia: a consideration of biomass estimatesfor selected habitats. Biological Conservation10:293–308.
Fiske, I. and R. Chandler. 2011. Unmarked: an Rpackage for fitting hierarchical models of wildlifeoccurrence and abundance. Journal of Statistical
v www.esajournals.org 16 October 2013 v Volume 4(10) v Article 124
CARTER ET AL.
Software 43:1–23.Forrest, J. L., B. Bomhard, A. Budiman, L. Coad, N.
Cox, E. Dinerstein, D. Hammer, C. Huang, K. Huy,and R. Kraft. 2011. Single species conservation in amultiple use landscape: current protection of thetiger range. Animal Conservation 14:283–294.
Garcıa-Fernandez, C., M. Ruiz-Perez, and S. Wunder.2008. Is multiple-use forest management widelyimplementable in the tropics? Forest Ecology andManagement 256:1468–1476.
Gasparri, N. I. and H. R. Grau. 2009. Deforestation andfragmentation of Chaco dry forest in NW Argenti-na (1972-2007). Forest Ecology and Management258:913–921.
GoN. 1993. Government of Nepal. Fourth amendmentto the national parks and wildlife conservation act(2029). Nepal Gazette 43 (Supplement).
Gurney, C. M. and J. R. G. Townshend. 1983. The use ofcontextual information in the classification ofremotely sensed data. Photogrammetric Engineer-ing and Remote Sensing 49:55–64.
Gurung, B., L. James, and M. Shrestha. 2006. Using a‘‘Bagh Heralu’’ network to map the metapopula-tion structure of tigers in Nepal. Pages 214–231 inJ. A. McNeely, T. M. McCarthy, A. Smith, L. Olsvig-Whittaker, and E. D. Wikramanayake, editors.Conservation biology in Asia. Society for Conser-vation Biology Asia Section and Resources Hima-laya, Kathmandu, Nepal.
Gurung, B., K. C. Nelson, and J. L. D. Smith. 2009.Impact of grazing restrictions on livestock compo-sition and husbandry practices in Madi Valley,Chitwan National Park, Nepal. EnvironmentalConservation 36:338–347.
Gurung, B., J. L. D. Smith, C. McDougal, J. B. Karki,and A. Barlow. 2008. Factors associated withhuman-killing tigers in Chitwan National Park,Nepal. Biological Conservation 141:3069–3078.
He, G., X. Chen, S. Beaer, M. Colunga, A. Mertig, L.An, S. Zhou, M. Linderman, Z. Ouyang, and S.Gage. 2009. Spatial and temporal patterns offuelwood collection in Wolong Nature Reserve:Implications for panda conservation. Landscapeand Urban Planning 92:1–9.
Hein, C. D., S. B. Castleberry, and K. V. Miller. 2009.Site-occupancy of bats in relation to forestedcorridors. Forest Ecology and Management257:1200–1207.
Hjortsø, C. N., S. Stræde, and F. Helles. 2006. Applyingmulti-criteria decision-making to protected areasand buffer zone management: A case study in theRoyal Chitwan National Park, Nepal. Journal ofForest Economics 12:91–108.
Hull, V., W. Xu, W. Liu, S. Zhou, A. Vina, J. Zhang,M. N. Tuanmu, J. Huang, M. Linderman, and X.Chen. 2011. Evaluating the efficacy of zoningdesignations for protected area management. Bio-
logical Conservation 144:3028–3037.Jensen, J. R. 1996. Introductory digital image process-
ing: a remote sensing perspective. Second edition.Prentice-Hall, Upper Saddle River, New Jersey,USA.
Johnson, A., C. Vongkhamheng, M. Hedemark, and T.Saithongdam. 2006. Effects of human-carnivoreconflict on tiger (Panthera tigris) and prey popu-lations in Lao PDR. Animal Conservation 9:421–430.
Joseph, L. N., C. Elkin, T. G. Martin, and H. P.Possingham. 2009. Modeling abundance using N-mixture models: the importance of consideringecological mechanisms. Ecological Applications19:631–642.
Joshi, A. R., D. L. Garshelis, and J. L. Smith. 1995.Home ranges of sloth bears in Nepal: implicationsfor conservation. Journal of Wildlife Management59:204–214.
Karanth, K. U. and J. D. Nichols. 1998. Estimation oftiger densities in India using photographic capturesand recaptures. Ecology 79:2852–2862.
Karanth, K. U. and J. D. Nichols. 2002. Monitoringtigers and their prey: a manual for researchers,managers and conservationists in Tropical Asia.Centre for Wildlife Studies.
Karanth, K. U. and M. E. Sunquist. 1995. Prey selectionby tiger, leopard and dhole in tropical forests.Journal of Animal Ecology 64:439–450.
Kerley, L. L., J. M. Goodrich, D. G. Miquelle, E. N.Smirnov, H. B. Quigley, and M. G. Hornocker. 2002.Effects of roads and human disturbance on Amurtigers. Conservation Biology 16:97–108.
Kie, J. G., R. T. Bowyer, M. C. Nicholson, B. B. Boroski,and E. R. Loft. 2002. Landscape heterogeneity atdiffering scales: effects on spatial distribution ofmule deer. Ecology 83:530–544.
Laurie, A. 1982. Behavioural ecology of the greater onehorned rhinoceros (Rhinoceros unicornis). Journalof Zoology 196:307–341.
Lehmkuhl, J. F. 1994. A classification of subtropicalriverine grassland and forest in Chitwan NationalPark, Nepal. Plant Ecology 111:29–43.
Lepczyk, C. A., C. H. Flather, V. C. Radeloff, A. M.Pidgeon, R. B. Hammer, and J. Liu. 2008. Humanimpacts on regional avian diversity and abun-dance. Conservation Biology 22:405–416.
Linderman, M. A., L. An, S. Bearer, G. He, Z. Ouyang,and J. Liu. 2005. Modeling the spatio-temporaldynamics and interactions of households, land-scapes, and giant panda habitat. Ecological Mod-elling 183:47–65.
Linkie, M., G. Chapron, D. J. Martyr, J. Holden, and N.Leader-Williams. 2006. Assessing the viability oftiger subpopulations in a fragmented landscape.Journal of Applied Ecology 43:576–586.
Linkie, M., G. Guillera-Arroita, J. Smith, and D. M.
v www.esajournals.org 17 October 2013 v Volume 4(10) v Article 124
CARTER ET AL.
Rayan. 2010. Monitoring tigers with confidence.Integrative Zoology 5:342–350.
Linkie, M., I. A. Haidir, A. Nugroho, and Y. Dinata.2008. Conserving tigers Panthera tigris in selective-ly logged Sumatran forests. Biological Conserva-tion 141:2410–2415.
Liu, J., G. C. Daily, P. R. Ehrlich, and G. W. Luck. 2003.Effects of household dynamics on resource con-sumption and biodiversity. Nature 421:530–533.
Liu, J., V. Hull, A. T. Morzillo, and J. A. Wiens, editors.2011. Sources, Sinks and Sustainability. CambridgeUniversity Press, New York, New York, USA.
Liu, J., M. Linderman, Z. Ouyang, L. An, J. Yang, andH. Zhang. 2001. Ecological degradation in protect-ed areas: the case of Wolong Nature Reserve forgiant pandas. Science 292:98–101.
Liu, J. and P. H. Raven. 2010. China’s environmentalchallenges and implications for the world. CriticalReviews in Environmental Science and Technology40:823–851.
MacKenzie, D. I., J. D. Nichols, G. B. Lachman, S.Droege, J. Andrew Royle, and C. A. Langtimm.2002. Estimating site occupancy rates when detec-tion probabilities are less than one. Ecology83:2248–2255.
Margules, C. R. and R. L. Pressey. 2000. Systematicconservation planning. Nature 405:243–253.
Martin, E. B. 1992. The poisoning of rhinos and tigersin Nepal. Oryx 26:82–86.
McGarigal, K., S. A. Cushman, M. C. Neel, and E. Ene.2002. FRAGSTATS: Spatial pattern analysis pro-gram for categorical maps. University of Massa-chusetts, Amherst, Massachusetts, USA.
MEA. 2005. Millennium ecosystem assessment. IslandPress, Washington, D.C., USA.
Michalski, F. and C. A. Peres. 2005. Anthropogenicdeterminants of primate and carnivore local ex-tinctions in a fragmented forest landscape ofsouthern Amazonia. Biological Conservation124:383–396.
Moe, S. R. and P. Wegge. 1994. Spacing behaviour andhabitat use of axis deer (Axis axis) in lowlandNepal. Canadian Journal of Zoology 72:1735–1744.
Morrison, M. L., B. G. Marcot, and R. W. Mannan.2006. Wildlife-habitat relationships: concepts andapplications. Island Press, Washington, D.C., USA.
Nagendra, H. 2003. Tenure and forest conditions:community forestry in the Nepal Terai. Environ-mental Conservation 29:530–539.
Nagendra, H., M. Karmacharya, and B. Karna. 2005.Evaluating forest management in Nepal: viewsacross space and time. Ecology and Society 10:24.
Nagendra, H., S. Pareeth, B. Sharma, C. M. Schweik,and K. R. Adhikari. 2008. Forest fragmentation andregrowth in an institutional mosaic of community,government and private ownership in Nepal.Landscape Ecology 23:41–54.
Nepal, S. K. and K. E. Weber. 1995a. Prospects forcoexistence: wildlife and local people. Ambio24:238–245.
Nepal, S. K. and K. E. Weber. 1995b. The quandary oflocal people-Park relations in Nepal’s Royal Chit-wan National Park. Environmental Management19:853–866.
Nyhus, P. and R. Tilson. 2004. Agroforestry, elephants,and tigers: balancing conservation theory andpractice in human-dominated landscapes of South-east Asia. Agriculture, Ecosystems & Environment104:87–97.
O’Brien, T. G. and M. F. Kinnaird. 2011. Densityestimation of sympatric carnivores using spatiallyexplicit capture-recapture methods and standardtrapping grid. Ecological Applications 21:2908–2916.
O’Connell, A. F., J. D. Nichols, and K. U. Karanth.2010. Camera traps in animal ecology: methodsand analyses. Springer, New York, New York,USA.
Odden, M. and P. Wegge. 2007. Predicting spacingbehavior and mating systems of solitary cervids: astudy of hog deer and Indian muntjac. Zoology110:261–270.
Peet, N. B., A. R. Watkinson, D. J. Bell, and B. J. Kattel.1999. Plant diversity in the threatened sub-tropicalgrasslands of Nepal. Biological Conservation88:193–206.
Persson, L. and A. M. De Roos. 2003. Adaptive habitatuse in size-structured populations: linking individ-ual behavior to population processes. Ecology84:1129–1139.
Riitters, K. H., R. V. O’Neill, C. T. Hunsaker, J. D.Wickham, D. H. Yankee, S. P. Timmins, K. B. Jones,and B. L. Jackson. 1995. A factor analysis oflandscape pattern and structure metrics. LandscapeEcology 10:23–39.
Rodrigues, A. S. L., H. R. Akcakaya, S. J. Andelman,M. I. Bakarr, L. Boitani, T. M. Brooks, J. S. Chanson,L. D. C. Fishpool, G. A. B. Da Fonseca, and K. J.Gaston. 2004. Global gap analysis: priority regionsfor expanding the global protected-area network.BioScience 54:1092–1100.
Royle, J. A. 2004. N-mixture models for estimatingpopulation size from spatially replicated counts.Biometrics 60:108–115.
Sanderson, E., J. Forrest, C. Loucks, J. Ginsberg, E.Dinerstein, J. Seidensticker, P. Leimgruber, M.Songer, A. Heydlauff, and T. O’Brien. 2006. Settingpriorities for the conservation and recovery of wildtigers: 2005–2015. The technical assessment. WCS,WWF, Smithsonian, and NFWFSTF, New York,New York, USA.
Sanderson, E. W., M. Jaiteh, M. A. Levy, K. H. Redford,A. V. Wannebo, and G. Woolmer. 2002. The humanfootprint and the last of the wild. BioScience
v www.esajournals.org 18 October 2013 v Volume 4(10) v Article 124
CARTER ET AL.
52:891–904.Seidensticker, J. 1976. On the ecological separation
between tigers and leopards. Biotropica 8:225–234.Seidensticker, J. and C. McDougal. 1993. Tiger pred-
atory behaviour, ecology and conservation. Sym-posia of the Zoological Society of London 65:105–125.
Sharma, U. R. 1990. An overview of park-peopleinteractions in Royal Chitwan National Park,Nepal. Landscape and Urban Planning 19:133–144.
Short Bull, R. A., S. A. Cushman, R. Mace, T. Chilton,K. C. Kendall, E. L. Landguth, M. K. Schwartz, K.McKelvey, F. W. Allendorf, and G. Luikart. 2011.Why replication is important in landscape genetics:American black bear in the Rocky Mountains.Molecular Ecology 20:1092–1107.
Shrestha, M. K. 2004. Relative ungulate abundance in afragmented landscape: Implications for tiger con-servation. Dissertation. University of Minnesota,Minneapolis, Minnesota, USA.
Sillett, S., R. B. Chandler, J. A. Royle, M. Kery, and S. A.Morrison. 2012. Hierarchical distance samplingmodels to estimate population size and habitat-specific abundance of an island endemic. Ecolog-ical Applications 22:1997–2006.
Smit, G. N. 2004. An approach to tree thinning tostructure southern African savannas for long-termrestoration from bush encroachment. Journal ofEnvironmental Management 71:179–191.
Smith, J. L. D. 1993. The role of dispersal in structuringthe Chitwan tiger population. Behaviour 124:165–195.
Smith, J. L. D., S. C. Ahearn, and C. McDougal. 1998.Landscape analysis of tiger distribution and habitatquality in Nepal. Conservation Biology 12:1338–1346.
Smith, J. L. D. and C. McDougal. 1991. The contribu-tion of variance in lifetime reproduction to effectivepopulation size in tigers. Conservation Biology5:484–490.
Stræde, S. and F. Helles. 2000. Park-people conflictresolution in Royal Chitwan National Park, Nepal:buying time at high cost? Environmental Conser-vation 27:368–381.
Stræde, S., G. Nebel, and A. Rijal. 2002. Structure andfloristic composition of community forests andtheir compatibility with villagers’ traditional needsfor forest products. Biodiversity & Conservation11:487–508.
Stræde, S. and T. Treue. 2006. Beyond buffer zone
protection: A comparative study of park and bufferzone products’ importance to villagers living insideRoyal Chitwan National Park and to villagersliving in its buffer zone. Journal of EnvironmentalManagement 78:251–267.
Sunarto, S., M. J. Kelly, K. Parakkasi, S. Klenzendorf, E.Septayuda, and H. Kurniawan. 2012. Tigers needcover: multi-scale occupancy study of the big cat inSumatran forest and plantation landscapes. PloSONE 7:e30859.
Sunquist, M. E. 1981. The social organization of tigers(Panthera tigris) in Royal Chitawan National Park,Nepal. Smithsonian Contributions to Zoology336:1–98.
Thornton, P. K. 2010. Livestock production: recenttrends, future prospects. Philosophical Transac-tions of the Royal Society B 365:2853–2867.
Van Horne, B. 1983. Density as a misleading indicatorof habitat quality. Journal of Wildlife Management893–901.
Vina, A., S. Bearer, X. Chen, G. He, M. Linderman, L.An, H. Zhang, Z. Ouyang, and J. Liu. 2007.Temporal changes in giant panda habitat connec-tivity across boundaries of Wolong Nature Reserve,China. Ecological Applications 17:1019–1030.
Western, D., S. Russell, and I. Cuthill. 2009. The statusof wildlife in protected areas compared to non-protected areas of Kenya. PloS ONE 4:e6140.
Wikramanayake, E., E. Dinerstein, J. Seidensticker, S.Lumpkin, B. Pandav, M. Shrestha, H. Mishra, J.Ballou, A. J. T. Johnsingh, and I. Chestin. 2011. Alandscape based conservation strategy to doublethe wild tiger population. Conservation Letters4:219–227.
Wikramanayake, E. D., E. Dinerstein, J. G. Robinson,U. Karanth, A. Rabinowitz, D. Olson, T. Mathew, P.Hedao, M. Conner, and G. Hemley. 1998. Anecology-based method for defining priorities forlarge mammal conservation: the tiger as case study.Conservation Biology 12:865–878.
Wikramanayake, E. E., M. McKnight, E. Dinerstein, A.Joshi, B. Gurung, and D. Smith. 2004. Designing aconservation landscape for tigers in human-domi-nated environments. Conservation Biology 18:839–844.
Xu, W., Z. Ouyang, A. Vina, H. Zheng, J. Liu, and Y.Xiao. 2006. Designing a conservation plan forprotecting the habitat for giant pandas in theQionglai mountain range, China. Diversity andDistributions 12:610–619.
v www.esajournals.org 19 October 2013 v Volume 4(10) v Article 124
CARTER ET AL.