Embed Size (px)
Citation preview
Assessing Coral Reefs on a Pacific-Wide Scale Using theMicrobialization Score
Tracey McDole1*, James Nulton2, Katie L. Barott1, Ben Felts2, Carol Hand2, Mark Hatay1, Hochul Lee2,
Marc O. Nadon5,6, Bahador Nosrat1, Peter Salamon2, Barbara Bailey2, Stuart A. Sandin4,
Bernardo Vargas-Angel3, Merry Youle1, Brian J. Zgliczynski4, Russell E. Brainard3, Forest Rohwer1
1 Biology Department, San Diego State University, San Diego, California, United States of America, 2Department of Math and Computer Sciences, San Diego State
University, San Diego, California, United States of America, 3 Pacific Islands Fisheries Science Center, NOAA Fisheries, Honolulu, Hawaii, United States of America, 4 Scripps
Institution of Oceanography, University of California San Diego, La Jolla, California, United States of America, 5 Rosenstiel School of Marine and Atmospheric Science,
University of Miami, Miami, Florida, United States of America, 6 Joint Institute for Marine and Atmospheric Research, University of Hawai’i at Manoa, Honolulu, Hawaii,
United States of America
Abstract
The majority of the world’s coral reefs are in various stages of decline. While a suite of disturbances (overfishing,eutrophication, and global climate change) have been identified, the mechanism(s) of reef system decline remain elusive.Increased microbial and viral loading with higher percentages of opportunistic and specific microbial pathogens have beenidentified as potentially unifying features of coral reefs in decline. Due to their relative size and high per cell activity, a smallchange in microbial biomass may signal a large reallocation of available energy in an ecosystem; that is the microbialization
of the coral reef. Our hypothesis was that human activities alter the energy budget of the reef system, specifically by alteringthe allocation of metabolic energy between microbes and macrobes. To determine if this is occurring on a regional scale, wecalculated the basal metabolic rates for the fish and microbial communities at 99 sites on twenty-nine coral islandsthroughout the Pacific Ocean using previously established scaling relationships. From these metabolic rate predictions, wederived a new metric for assessing and comparing reef health called the microbialization score. The microbialization scorerepresents the percentage of the combined fish and microbial predicted metabolic rate that is microbial. Our resultsdemonstrate a strong positive correlation between reef microbialization scores and human impact. In contrast,microbialization scores did not significantly correlate with ocean net primary production, local chla concentrations, orthe combined metabolic rate of the fish and microbial communities. These findings support the hypothesis that humanactivities are shifting energy to the microbes, at the expense of the macrobes. Regardless of oceanographic context, themicrobialization score is a powerful metric for assessing the level of human impact a reef system is experiencing.
Citation:McDole T, Nulton J, Barott KL, Felts B, Hand C, et al. (2012) Assessing Coral Reefs on a Pacific-Wide Scale Using the Microbialization Score. PLoS ONE 7(9):e43233. doi:10.1371/journal.pone.0043233
Editor: Sebastian C. A. Ferse, Leibniz Center for Tropical Marine Ecology, Germany
Received January 20, 2012; Accepted July 18, 2012; Published September 7, 2012
Copyright: � 2012 McDole et al. This is an open-access article distributed under the terms of the Creative Commons Attribution License, which permitsunrestricted use, distribution, and reproduction in any medium, provided the original author and source are credited.
Funding: This work was supported by National Science Foundation (NSF) (OCE-0927415) and a grant from CIFAR (LTRDTD62207). The funders had no role instudy design, data collection and analysis, decision to publish, or preparation of the manuscript.
Competing Interests: The authors have declared that no competing interests exist.
* E-mail: [email protected]
Introduction
The relationship between increasing human activity and
decreasing fish biomass is well-established in coral reef systems
[1–3]. Although herbivore reduction due to overfishing probably
facilitates coral to algal transitions, the mechanistic link between
overfishing and coral mortality is not clear [4]. Much uncertainty
about the mechanisms of reef decline linked to eutrophication and
climate change also still exists [5–6]. In addition to increasing algal
cover relative to hard coral cover, other effects of anthropogeni-
cally-driven disturbances include disease outbreaks, fewer links in
trophic webs, and loss of physical structure and habitat complexity
[7–9]. Reef-associated microbial communities have been shown to
respond to all of the above disturbances (overfishing, nutrient
enrichment, thermal stress) by becoming less beneficial and more
pathogenic, i.e. the proportion of sequences related to known
pathogens typically increases [10–17].
Despite the epidemiological evidence linking the microbial
ecology of coral reef systems to human activity, the largest study of
coral reef microbial communities included only four coral atolls in
the Line Islands, all clustered within one oceanographic region
[14]. In this island chain a 10-fold increase in microbial and viral
abundances in the overlying reef-water correlated with increasing
human disturbance and was accompanied by decreased fish
biomass [1,14]. Further, a large proportion of the microbial 16S
rDNA sequence similarities on the most disturbed reefs were most
closely related to known pathogens [14]. These reefs also had the
highest incidences of coral disease and the lowest percent coral
cover. Other studies have also suggested that the total carbon flow
through microbial pathways via detritus is inversely related to
coral cover [18–19].
Ecosystems exhibit higher-level properties resulting from lower-
level phenomena [20]. The energy available to a higher trophic
level, for example, is reduced by the amount required to support
the individual organisms in the lower level. The Metabolic Theory
PLOS ONE | www.plosone.org 1 September 2012 | Volume 7 | Issue 9 | e43233
of Ecology (MTE) predicts the metabolic rate of individual
organisms based on the observation that most variation in an
individual’s metabolic rate can be explained by body size and
temperature [21,22]. Whole organism metabolic rate (I), defined
as the amount of energy per unit time that an individual organism
requires, is calculated using Equation 1:
I~i0Mae{E=kT ð1Þ
Where i0 is the mass-independent normalization constant, M is
the wet weight of the organism in grams, and a is the scaling
exponent. The effects of temperature on metabolic rate are
accounted for by e{E=kT [21,23] where E is the activation energy,
k is Boltzmann’s constant (8.6261025 eV K21), and T is the water
temperature at the site at the time of collection (in Kelvin). Distinct
scaling exponents have been derived for different physiological
states and evolutionary groups [21,24–25].
The process of replacing macroorganisms with microbes has
been termed microbialization [26]. In this study, Equation 1 was
used to predict metabolic rates for all individual fish and microbes
present in a 10 m3 volume of reef water. Microbialization refers to
an increase in the percentage of the combined fish and microbial
predicted metabolic rate that is microbial. Island-level micro-
bialization scores were derived for 29 islands (99 sites) within four
oceanographic regions of the Pacific Ocean. Our data show a
strong significant positive correlation between microbialization
scores and the NCEAS cumulative human impact scores at each
island. In comparison, microbialization scores did not correlate
with the net primary production values. These findings support the
hypothesis that human activities rather than variation in ocean-
ographic conditions are causing microbialization of coral reefs and
that the microbialization score is a powerful metric for assessing
and comparing reef health.
Materials and Methods
Site descriptionsThe twenty-nine islands included in this study were surveyed
following the National Oceanic and Atmospheric Association
(NOAA) ’s Rapid Ecological Assessment (REA) protocol as part of
the Coral Reef Ecosystem Division (CRED) and Pacific Reef
Assessment and Monitoring Program (Pacific RAMP) [27].
Multiple coral reef sites (average depth: 10 m) were sampled at
each island in four broad regional groups: the Main Hawaiian
Islands (MHI), Guam and the Mariana Islands (MARIANA), the
American Samoa region (SAMOA), and the Pacific Remote Island
Areas (PRIA) (Fig. 1, Table 1). Microbial samples were collected
during the 2008–2010 Pacific RAMP monitoring cruises: MHI
(2008), MARIANAS (2009), SAMOA (2010), PRIA (2010). For
fish, belt survey data from 2001–2009 was used for all islands.
Because the REA survey protocol switched to the Stationary Point
Count (SPC) method in 2009, 2010 fish data was not included.
Microbial and fish data collection sites at each island are not
necessarily co-located. Due to the variability inherent with
observational fish data, the standard approach for estimating
island means for fish abundance requires a large sample size. To
have an adequate sample size, this fish data was pooled from all
sites and years. Island-level averages and standard errors for fish
and microbial biomass are provided in Table S2 and Fig. S2.
Microbial metabolic rates were calculated per site then averaged
by island. Island-level averages for fish and microbial predicted
metabolic rates were used to calculate one microbialization score
for each island.
Collection of microbial dataAt each site, 4 replicate 2 l seawater samples were collected
,1 m above the benthos using polycarbonate Niskin bottles.
Microscopy grade glutaraldehyde was added to a final concentra-
tion of 0.3% v/v. Microbial cells were collected from each sample
by filtration using a 0.2 mm Anodisc filter (Whatman) and then
stained with 5 mg ml21 DAPI (Molecular Probes, Invitrogen)
within 2 hours of collection [28–30]. Filters were mounted on
microscope slides and stored at 220uC. For each site, 10 fields of
view (5 fields for each of 2 replicate filters, ,200 cells per field)
were examined by epifluorescence microscopy (excitation/emis-
sion: 358/461 nm) at 6006 magnification. Cell counts and
dimensions were collected using ImagePro Software (Media
Cybernetics) set for a size range of 0.00001–10 mm for both
length and width. Cell volume (V) was calculated by considering all
cells to be cylinders with hemispherical caps using Equation 2:
V~p
�
4|w2 l{w=3ð Þ ð2Þ
where l is length and w is width [31]. No correction was made for
possible cell shrinkage as a result of fixation. Individual microbial
cell volumes V (mm3) were converted to mass in wet weight (g)
using previously established size-dependent relationships for
marine microbial communities [32]. Each cell volume V was next
converted to dry weight using the linear relationship derived from
data reported in Simon and Azam (1989) and shown in Equation
3:
log yð Þ~1:72 log xð Þ{12:63 ð3Þ
where x is cell dry weight and y is cell volume (r2=0.99). Then cell
wet weight (z) was calculated using the linear relation shown in
Equation 4 [32] (r2=0.99):
log zð Þ~1:63 log xð Þ{2:0 ð4Þ
Collection of fish dataThis study includes fish data from all surveys performed at REA
sites during the years 2001–2009. The number of REA sites
surveyed over this time period is provided for each island in Table
S2. Visual surveys provided a census of the reef fish community
[33]. Surveys were restricted to shallow-to-moderate depths along
the forereef between 10–15 m with a majority of surveys
completed along the 10 m isobaths. At each site, a total of three
25 m long belt transect surveys were conducted by two different
divers. For each survey, the diver made two passes: during the first
pass, all fish.20 cm in length were recorded in adjacent 4 m wide
belts; during the second pass all fish#20 cm were recorded in 2 m
wide belts. Lengths were recorded to the nearest cm for fish
,5 cm and in 5 cm bins for all others [34]. Species-specific mass
values for individual fish were calculated from length-weight
relationships using FishBase [35–36]. The fish data was provided
for each family as mean biomass (g m22) and mean abundance (#
individuals m22), from which the mean mass per individual (g) was
calculated. Because surveys were carried out at an average water
depth of 10 m and surveyors counted all fish in the water column
up to the surface, the mean abundances (individuals per m2)
represented the total number present in a 10 m3 water column.
Microbialization of Pacific Coral Reefs
PLOS ONE | www.plosone.org 2 September 2012 | Volume 7 | Issue 9 | e43233
Metabolic rate calculationsAt each REA site, community-level metabolic rates were
calculated by summing the individual metabolic rates (I) for all
fish or microbes present in a standard volume of water (10 m3).
Individual metabolic rates (I) in watts were calculated using
Equation 1.
The mass independent normalization constant for fish, i0,
(ln[i0] = 18.47) was extracted from the plots in Brown et al. [21],
while those for basal and active microbial states (4.6161016 and
1.0861021, respectively) were calculated from previously reported
individual prokaryote metabolic rate values [25]. The predicted
scaling exponents (a) used for microbes were 1.72 (basal) and 1.96
(active) [25], while 0.71 was used for fish [21]. The activation
energies (E) used were 0.61 eV for microbes [25] and 0.69 eV for
fish [21].
Quantification of human impactThe level of human impact was assessed from the cumulative
global human impact map generated by the National Center for
Ecological Analysis and Synthesis (NCEAS; http://www.nceas.
ucsb.edu/globalmarine/impacts). Using ArcGIS 9.3, ‘‘NoData’’
pixels corresponding to the land mass of each island were
identified and converted into polygon format. A 10 km zone was
then calculated for each of these polygons, representing the
immediate 10 km of sea surface around the border of each island
in the study. Using these zones, statistics were then performed on
the NCEAS human impact raster in order to calculate the mean
impact score. These scores incorporate data related to: artisanal
fishing; demersal destructive fishing; demersal non-destructive,
high-bycatch fishing; demersal non-destructive low-bycatch fish-
ing; inorganic pollution; invasive species; nutrient input; ocean
acidification; benthic structures (e.g., oil rigs); organic pollution;
pelagic high-bycatch fishing; pelagic low-bycatch fishing; popula-
tion pressure; commercial activity (e.g., shipping); and anomalies
in sea surface temperature and ultraviolet insolation.
Other indicators of reef system health were also considered in
this study using benthic survey data collected at the same time as
the microbial data. Benthic surveys were performed using the
survey methodology described in Vargas-Angel [37–38]. A
principal components analysis was carried out using R on the
following initial variables: coral disease prevalence, prevalence of
coral colonies with compromised health (unidentified sub-lethal
lesions including algal and cyanophyte interactions, and barnacle
and tubeworm infestations), percent crustose corraline algae cover,
percent coral cover, and the microbialization score [39,40]. Raw
data sets were rescaled to give mean 0 and standard deviation of 1.
As a supplement to PCA analysis, k-means clustering was also
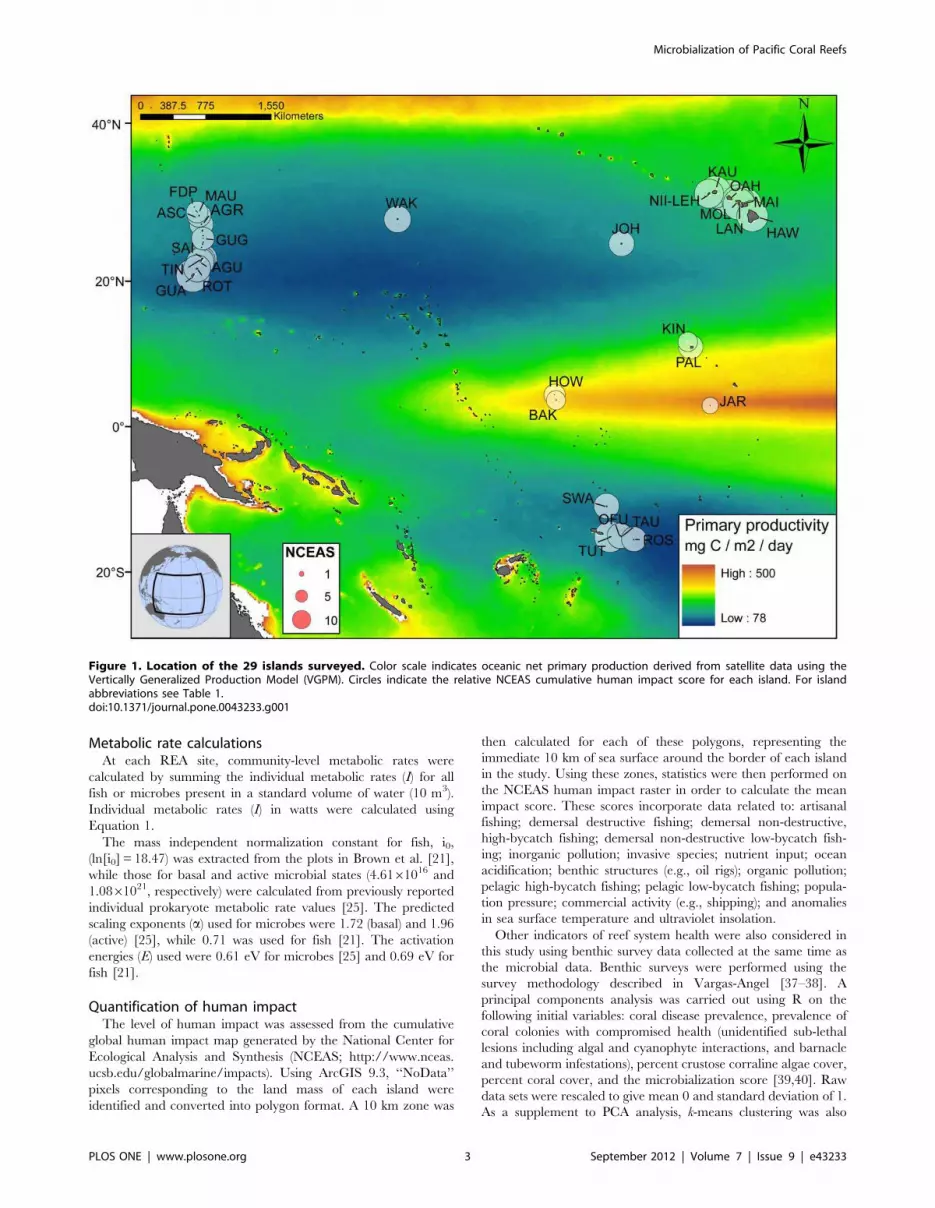
Figure 1. Location of the 29 islands surveyed. Color scale indicates oceanic net primary production derived from satellite data using theVertically Generalized Production Model (VGPM). Circles indicate the relative NCEAS cumulative human impact score for each island. For islandabbreviations see Table 1.doi:10.1371/journal.pone.0043233.g001
Microbialization of Pacific Coral Reefs
PLOS ONE | www.plosone.org 3 September 2012 | Volume 7 | Issue 9 | e43233

Table 1. Survey data and calculated values for 29 islands in the Pacific, grouped by region.
REGION MICROBIAL COMMUNITY FISH COMMUNITY OTHER
Code Island Abundance x 105 Total Biomass
Predicted
Metabolic Rate Total Biomass
Predicted
Metabolic Rate NPP ChlaNCEAS
Score
cells ml21 g 10 m23 W 10 m23 g 10 m23 W 10 m23 mg C m22 yr21mg l21
GUAM & MARIANA ISLANDS (orange)
AGR Agrihan 2.6 0.22 0.005 84.54 0.007 155 0.11 7.7
AGU Aguijan 2.3 0.16 0.006 41.5 0.005 125 0.34 9.9
ASC Asuncion 2.7 0.15 0.002 182.54 0.011 159 0.11 7.6
FDP Farallon de Pajaros 2.7 0.2 0.003 103.18 0.007 165 0.06 6.8
GUA Guam 2.8 0.27 0.012 17.98 0.002 126 0.17 13.7
GUG Guguan 3.5 0.27 0.002 145.03 0.012 153 0.1 7.1
MAU Maug 3 0.24 0.003 70.95 0.005 159 0.22 6.7
ROT Rota 2.3 0.17 0.003 36.9 0.004 125 0.07 9.4
SAI Saipan 2.1 0.21 0.017 23.31 0.003 143 0.1 11.2
TIN Tinian 1.8 0.17 0.004 31.19 0.003 143 0.05 10.3
MAIN HAWAIIAN ISLANDS (MHI, blue)
HAW Hawaii 4.7 0.81 0.012 51.24 0.004 248 0.12 12.2
KAU Kauai 2.8 0.69 0.024 33.39 0.002 262 0.34 13
LAN Lanai 3.3 0.4 0.007 33.44 0.002 264 0.15 12.7
MAI Maui 3 0.56 0.019 40.16 0.003 258 0.21 14.2
MOL Molokai 2.1 0.32 0.006 24.8 0.002 270 0.1 12.8
NII/LEH Niihau & Lehua 4.1 1.29 0.05 54.49 0.003 234 0.22 10.7
OAH Oahu 3.7 1.53 0.076 23.99 0.002 270 0.19 15.6
PACIFIC REMOTE ISLANDS & ATOLLS (PRIA, pink)
BAK Baker 3.8 0.33 0.004 228.18 0.011 380 0.1 5.3
HOW Howland 4.5 0.49 0.014 195.37 0.022 380 0.06 6.3
JAR Jarvis 5.8 0.46 0.005 408.75 0.026 445 0.08 4
JOH Johnston 3.5 0.72 0.024 91.6 0.005 196 0.09 8.5
KIN Kingman 1.7 0.18 0.002 514.84 0.015 282 0.11 5.5
PAL Palmyra 3.7 0.22 0.002 229.08 0.01 307 0.16 8
WAK Wake 2.2 0.12 0.001 161.4 0.008 147 0.06 9.5
SAMOA REGION (green)
OFU/OLO Ofu & Olosega 2.9 0.19 0.003 57.83 0.004 139 0.07 8.4
ROS Rose 3.2 0.14 0.002 82.98 0.007 130 0.04 8.2
SWA Swains 3.1 0.26 0.004 85.17 0.005 148 0.04 8.6
TAU Tau 3.3 0.23 0.004 44.77 0.004 139 0.06 8.6
Micro
bializatio
nofPacific
Coral
Reefs
PLO
SONE|www.plosone.org
4September2012
|Volume7
|Issu
e9
|e43233

performed on the same data matrix for k=2–8 (100 iterations); the
dissimilarity matrix was calculated using Gower’s standardization
[41].
Estimation of net primary productionProductivity estimations for net primary productivity (NPP)
(mg C m22 day21) were derived from Moderate Resolution
Imaging Spectroradiometer (MODIS) satellite data using the
Vertically Generalized Production Model (VGPM; http://www.
science.oregonstate.edu/ocean.productivity/standard.product.
php). This model, based on an algorithm by Behrenfeld and
Falkowski (1997) calculates net primary production from satellite-
based measurements of surface chla concentrations, while also
taking into account sea surface temperature, daily photosynthet-
ically active radiation, and a temperature-dependent photosyn-
thetic efficiency factor [42]. Because these satellite data sets are less
accurate for near-shore measurements, the satellite-based NPP
values used here were estimated from the data for a 50 km radius
ring surrounding each island, with the first 10 km around each
island removed. The nearshore chla concentrations (mg l21) used
in this study were obtained using fluorometric analysis [43]. The
chla samples were collected in conjunction with the microbial
samples at each site.
Results and Discussion
Predicted metabolic rates for the fish and microbesField surveys carried out at 99 coral reef sites at 29 Pacific
islands (Fig. 1) were used to calculate the biomass (g per 10 m3)
and basal metabolic rate (W per 10 m3) for both the water
column-associated microbial and fish communities (Table 1). The
high and low values for microbial biomass occurred on the islands
of Oahu (1.53 g per 10 m3) and Wake Atoll (0.12 g per 10 m3),
respectively. This difference in microbial biomass equates to a 76-
fold increase in the rate of energy flux (W per 10 m3 or J sec21
10 m23) on Oahu (0.076 W per 10 m3) relative to Wake Atoll
(0.001 W per 10 m3). The highest fish biomass was found on
Kingman (514.84 g per 10 m3) and the lowest on Guam (17.98 g
per 10 m3). The metabolic requirements predicted for the fish
communities on Kingman and Guam were 0.015 and 0.002 W
per 10 m3, respectively. This difference equates to a 7.5-fold
reduction in the metabolic requirements of the fish community.
The largest differences in the predicted metabolic rates between
each island represent a 100-fold change for the microbes, as
compared to a 14-fold change for the fish (Table 1).
Microbialization scores versus the NCEAS human impactscoreBased on the predicted metabolic rates for fish and microbes
(Table 1), we are proposing a separate metric called the
microbialization score, which represents the microbial share of the
total predicted metabolic rate. The microbialization score is the
percentage of the combined fish and microbial predicted
metabolic rate that is microbial:
W 10 m3microbes
� ��
W 10 m3microbeszW 10 m3
fish
� �
|100 ð5Þ
Although both increased microbial biomass and decreased fish
biomass affect microbialization scores, microbial biomass has a
proportionately greater impact on the combined predicted
metabolic rate. For example, on Oahu, the fish are responsible
for only 3% of the combined predicted metabolic rate, but account
Table
1.Cont.
REGIO
NMICROBIA
LCOMMUNITY
FISH
COMMUNITY
OTHER
Code
Island
Abundancex105
TotalBiomass
Predicted
MetabolicRate
TotalBiomass
Predicted
MetabolicRate
NPP
Chla
NCEAS
Score
cellsml2
1g10m23
W10m23
g10m23
W10m23
mgCm22yr2
1mgl2
1
TUT
Tutuila
3.5
0.25
0.006
33.11
0.003
151
0.15
12.4
Predictedmetabolic
ratesarebasal
rates.NPP=netprimaryproduction.Colors
identify
eachislandgroupin
thefigures.
doi:10.1371/journal.pone.0043233.t001
Microbialization of Pacific Coral Reefs
PLOS ONE | www.plosone.org 5 September 2012 | Volume 7 | Issue 9 | e43233

for 94% of the total biomass. Even on Kingman where we
observed the highest fish biomass and microbial biomass
represented less than 0.03% of the total biomass, the microbes
still account for 13% of the combined predicted metabolic rate.
Recently, the NCEAS human impact score has been proposed
as a cumulative metric of different anthropogenic stressors ranging
from overfishing to predicted climate change events [44]. As
shown in Fig. 2, the microbialization score is positively correlated
with the NCEAS score (linear regression, r2=0.68; Fig. 2). The
microbialization scores ranged from 8% at remote and relatively
pristine Wake Island to 75–98% in the heavily-impacted main
Hawaiian Islands (MHI). Oahu, with the highest microbialization
score (98%) also had the highest NCEAS score (15.59).
Johnston Atoll in the PRIA group appears to be an exception to
the overall trend in that it has a high microbialization score (82%)
but a relatively low NCEAS score (8.48). In actuality, Johnston is
heavily impacted by factors not reflected in the NCEAS scores
including the addition of two artificial islands with paved runways
formed by coral dredging, usage for both above-ground and
underground nuclear tests in the 1950s and 1960s, and service as a
chemical weapons depot until 2000. The microbialization score
appears to be a better indicator of these stressors than the NCEAS
index of human impact.
A principal components analysis was carried out with the goal of
visualizing how the microbialization score related to other
indicators of reef health, including coral disease prevalence,
prevalence of coral colonies with other signs of compromised
health, percent crustose corraline algae cover, and percent coral
cover (Fig. S1). The first two components accounted for 66% of
the variation. The first component (PC1) accounted for 46% of the
variation and was driven in the positive direction (relative to 0) by
coral disease incidence, other visible signs of compromised coral
health, and microbialization score (Fig. S1). A complete table of
PCA loadings is provided in Table S3. By comparison, variables
which typically correlate positively with reef system health (%
crustose coralline algal cover and % coral cover) were represented
as vectors moving in the negative direction (relative to 0). The
separation by vector sign along PC1 supports the hypothesis that
the microbialization score is a useful measure of reef system
decline. Because the PCA analysis indicated that there was
separation in the data, we used k-means clustering as a
supplementary analysis to determine how many groups there
were. K-means is a classical variance-based clustering method that
defines n data points in d dimensions, into k clusters, so that the
within clusters sun-of-squares is minimized [41]. The within group
sum of squares plotted against the number of clusters (k) indicated
k = 3 to be the optimal number (for k=2–8). The 11 islands
contained in cluster two (within-cluster sum of squares = 1.47)
were negative for PC1 (Fig. S1), while the 16 islands contained in
cluster 3 were all positive on PC1 (within-cluster sum of
squares = 2.06). The two islands in the first k-means cluster were
Lanai (LAN) and Guam (GUA) (within cluster sum-of-
squares = 0.32).
Microbialization scores versus combined metabolic rateThe metabolic rates predicted for the combined microbial and
fish communities at the 29 islands ranged by approximately one
order of magnitude, from a low of 0.007 W per 10 m3 on Rota
Island (MARIANA) to a high of 0.077 W per 10 m3 on Oahu
(MHI) (Fig. 3, x-axis). The combined predicted metabolic rate was
not correlated with the microbialization score, which also varied
widely among the islands, ranging from a low of 8% at Wake to a
high of 97% at Oahu (Fig. 3, y-axis). At the low end of this scale,
increased microbalization scores were explained by reduced
metabolic contribution from the fish. However, higher micro-
bialization scores were associated with a sharp rise in combined
predicted metabolic rate driven primarily by increasing microbial
metabolic rates. This break-point may reflect the release of the
microbes from some resource limitation.
Predicted metabolic rates of fish and microbes versusprimary productionNet primary production (NPP) might be expected to be a
significant factor driving variation in community metabolic rates.
Previous small-scale inter-island studies that correlated differences
in microbial communities with varying local human impacts could
not conclusively rule out inter-island variations in oceanographic
conditions as a possible driving factor [14]. To address this issue,
we surveyed net primary production (NPP) at islands in four
oceanographic regions throughout the Pacific Basin (Table 1).
Estimated net primary production (NPP; mg C m22 day21)
derived from satellite data is shown in Fig. 1. NPP ranged from
125 mg C m22 day21 at Aguijan to 445 mg C m22 day21 at Jarvis
(Table 1). This predicted NPP was not a strong predictor of the
combined fish + microbial metabolic rate at the island-level (non-
linear regression, R2=0.21; Fig. 4A). Likewise, when the predicted
NPP values were compared against the metabolic rates of the fish
and microbial communities separately, R2 values were 0.20 for fish
and 0.054 for microbes (Table 1). Large differences in NPP were
observed between the geographic regions surveyed, but relatively
little variation within each one (Fig. 4A, C). Since the satellite data
used for the above predictions omitted a 10 km ring around each
island, nearshore chla concentrations were also measured as an
alternative proxy for NPP. These samples were collected with the
microbial samples at each site. The nearshore chla concentrations
(mg l21) explained even less of the inter-island variation in
combined predicted metabolic rate (non-linear regression,
R2=0.08; Fig. 4B). For the individual communities, R2 values
were 0.13 and 0.15 for fish and microbes, respectively (Table 1).
Figure 2. Linear regression analysis of microbialization scoresversus NCEAS cumulative human impact values (y =8.19 x –26.10; r2=0.68). The microbialization score is the percentage of thecombined fish and microbial predicted metabolic rate that is microbial.Color denotes oceanographic region: Guam and the Mariana Islands(orange circles), the Main Hawaiian Islands (blue circles), Pacific RemoteIslands and Atolls (pink circles), and the Samoa region (green circles).For island abbreviations see Table 1.doi:10.1371/journal.pone.0043233.g002
Microbialization of Pacific Coral Reefs
PLOS ONE | www.plosone.org 6 September 2012 | Volume 7 | Issue 9 | e43233

Microbialization scores and primary productionThe island microbialization scores did not correlate with
predicted oceanic NPP values (Fig. 4C, R2=0.004) or nearshore
chla concentrations (Fig. 4D; R2=0.22). However, higher near-
shore chla concentrations associated with microbialization scores
above a certain threshold (,70%) are suggestive of eutrophication
processes linked to human impact (Fig. 4D) [45]. These analyses
demonstrate that estimated reef primary production is not a
significant driver of variation in either community metabolic rates
or microbialization scores.
To further examine whether or not accounting for oceano-
graphic context would improve our ability to predict reef
microbialization, multiple linear regression analysis was per-
formed. In addition to the NCEAS score, satellite-based estimates
of net primary production (NPP) and nearshore [chla] were
included as variables. This resulted in 4 models of interest:
microbialization score =b0+b1(NCEAS), y= b0+b1(NCEAS)+b2(-
chla), y = b0+b1(NCEAS)+b2(NPP), y = b0+b1(NCEAS)+b2(-
chla)+b3(NPP). Given that the NCEAS score was in the model,
the p-values for chla and NPP were not significant by the t-test in
the second and third models (p-value.0.1). The only variable that
was significant was the NCEAS score, having a highly significant
p-value in all of the models (p-value,0.0001). The model which
included both chla and NPP as variables (y = b0+b1(NCEAS)+b2(-
chla)+b3(NPP)) gave a multiple R2 value of 0.706, which was not a
significant improvement over the simplest model
(y = b0+b1(NCEAS)) which explained 68.4% of the variability of
the microbialization score.
Next, Akaike’s Information Criterion (AIC) was used for model
selection between the 4 different statistical models. AIC is the most
widely known and used model selection criterion which consists of
a ‘‘goodness-of-fit’’ term and a ‘‘penalty’’ term for increased
number of model parameters [46]. The model with the lowest AIC
value is selected as the best model. The model having the smallest
AIC was the model which did not include additional variables
(y = b0+b1(NCEAS)). Although the exact mechanism(s) underlying
the process of microbialization remain unclear, these analyses
support the hypothesis that human activities alter the energy
budget of the reef system, specifically by altering the allocation of
metabolic energy between microbes and macrobes.
The finding that microbialization scores did not significantly
correlate with ocean net primary production, local chla concen-
trations, or the combined metabolic rate of the fish and microbial
communities suggests that the microbialization score may be a
powerful metric for comparing and assessing reef degredation,
particularly at large spatial scales. Other measures of reef
degredation which are more heavily influenced by oceanographic
context (i.e. percent coral cover, percent algal cover) may be more
easily confounded by non-human factors and are subsequently
harder to interpret across large spatial scales.
Other considerationsIn this study, surveys of microbial and fish sizes were used to
predict whole organism metabolic rates. Ideally, the energetic
requirements per unit time for fish and microbial communities
would be measured empirically. However, this is not practical over
this large region. To evaluate whether or not the MTE-based
approach is a reasonable alternative to quantifying energy flux, the
mean predicted metabolic rates for microbial communities were
compared against experimental values reported from other studies
(Table S1). The means for both the predicted basal metabolic rates
used in our analyses and the corresponding predicted active
metabolic rates fall within the same range as the empirically-based
measurements.
Similarly, differences in temperature at the time of sampling
explained a small proportion of the variation in metabolic rate
between islands. Water temperature at the time of sampling
ranged from 25–30uC. For the microbial community-level
metabolic rates, the standard deviation in the 29 island data set
was 0.16 at the actual temperatures and 0.01 when all locations
were corrected to the same temperature (20uC); for the fish
community-level metabolic rates, the standard deviations were
Figure 3. Microbialization scores plotted against the combined fish + microbes predicted metabolic rates for each of the 29 islandssurveyed. Colors are as in Fig. 2. For island abbreviations see Table 1.doi:10.1371/journal.pone.0043233.g003
Microbialization of Pacific Coral Reefs
PLOS ONE | www.plosone.org 7 September 2012 | Volume 7 | Issue 9 | e43233

0.006 and 0.003, respectively. Temperature correction increased
the r2 value for the regression analysis of community-level
metabolic rate as a function of biomass by only 0.01% and
0.05% for fish and microbes, respectively. Therefore, inter-island
variation in temperature does not account for our observed trends.
Conclusions
Overfishing, eutrophication, and global climate change are
important drivers of the global loss of coral reefs. However, the
precise mechanism(s) by which these perturbations lead to coral
decline have remained elusive. We and others have previously
argued that human activities are favoring the coral reef-associated
microbes at the expense of the macrobes, a process called
microbialization. The data presented here supports this hypothesis
over a wide swath of Pacific coral reefs and suggests that
microbialization is a general process of reef decline. Although
the exact mechanism(s) driving the process of microbialization
remain unclear, the microbialization score provides a way to
diagnose the degree of microbialization that has occurred on reefs.
Fish were the primary movers of energy in the most pristine
locations (i.e. fish were responsible for 97 and 87% of the total
predicted metabolic rate on Wake (PRIA) and Kingman (PRIA),
respectively) but made up only 3% of the total predicted metabolic
rate on Oahu (MHI). Microbialization scores reflect both
increased microbial biomass and decreased fish biomass; however
microbial biomass has a proportionately greater impact on
metabolic rate. This means that even a minor increase in the
microbial load results in a substantial shift in community energy
use; up to a 100-fold increase in the metabolic requirements of the
microbes in the most heavily impacted reef systems. This study has
significant implications for the protection of coral reefs. The
degree of microbialization a reef is experiencing may be important
for predicting its response to perturbation. On Pacific coral reefs,
microbialization may be set in motion by an increase in the percent
cover of turf algae resulting from the loss of herbivorous fish. Turf
algae release large amounts of dissolved organic carbon (DOC)
into the water column, a source of energy almost exclusively
available to the microbes [47]. Consequently, the process of
microbialization is likely to have stabilization effects in the system
once a castastophic regime shift to an algal-dominated state has
occurred.
Figure 4. Measures of energy use versus metrics of primary production. (a) Non-linear regression analysis of the combined fish + microbespredicted metabolic rate versus net primary production (NPP) for the 29 surveyed islands. NPP was derived from satellite data using the VerticallyGeneralized Production Model (VGPM). (y = 0.00008x+0.0012; R2= 0.21) (b) Non-linear regression analysis of the combined fish + microbes predictedmetabolic rate versus nearshore chla concentrations at the 29 surveyed islands (y = 0.54x+0.01; R2=0.08) (c) Microbialization scores versus NPPderived from satellite data using the VGPM for the 29 surveyed islands. (d) Microbialization scores versus nearshore chla concentrations at the 29surveyed islands (y = 171.5x+29.7; R2=0.22). Colors are as in Fig. 2. For island abbreviations see Table 1.doi:10.1371/journal.pone.0043233.g004
Microbialization of Pacific Coral Reefs
PLOS ONE | www.plosone.org 8 September 2012 | Volume 7 | Issue 9 | e43233

Supporting Information
Figure S1 Principal components analysis of reef system
properties related to reef health. The first two principal
components account for 66% of the variability in the dataset
(PC1= 46%, PC2= 20%). Arrow length reflects the relative
contribution of a variable to a PC axis. MS=microbialization
score; CCA=% crustose coralline algae cover; DZ=% coral
disease prevalence; CO=% coral cover; CH=% coral with other
indications of compromised health. Symbol denotes oceanograph-
ic region: Guam and the Mariana Islands (*), the Main Hawaiian
Islands (‘), Pacific Remote Islands and Atolls (#), and the Samoa
region (+). Two groups of islands identified from k-means cluster
analysis are divided along PC1 by the dotted line; the third group
is circled (Lanai and Guam). For island abbreviations, see Table 1.
(TIF)
Figure S2 Mean microbial and fish biomass. (a) Mean
microbial biomass with standard error. Total number of sites
where microbial data was collected = 99. (b) Mean fish biomass
with standard error. Total number of sites where fish data was
collected = 791. The number of REA sites included is given in
parentheses next to three-letter island code.
(TIF)
Table S1 Comparison of mean MTE-based microbial
metabolic rate predictions from this study with exper-
imental measurements from marine systems1–5. Rates of
photosynthesis were converted from units of gross carbon
production (Pg) to units of power (W) using 39,444 J g21 C, the
standard free energy change from the synthesis of glucose from
CO2 and H2O during photosynthesis at STP6. For conversion
between rates of oxygen consumption or production in volume or
mass units, we assumed that 1 ml O2 per second= 1.43 mg O2 per
second24. To convert between units of power (W) and rates of
respiration we assumed that 1W=0.05 ml O2 per second24.
Metabolic rates in W per 10 m3 were derived after calculating
total daily energy use: Pg (from sunrise to sunset) + Respiration
(over a 24 hour period). In studies where only dark incubation
experiments were performed, total daily energy use was calculated
assuming Pg/R24 hrs=1. When two measurements are listed for
the same sample and conditions, they indicate high and low values.
B =predicted basal metabolic rate; A= predicted active metabolic
rate.
(XLSX)
Table S2 Summary table showing the number of REA
sites where microbial or fish data (belt transect method
only) was collected, time period of sampling, and
standard error for biomass and abundance of the fish
and microbial communities at each island.
(XLS)
Table S3 Summary table for Figure S1. The importance of
each component and the contribution (loadings) of each variable is
shown. MS=microbialization score; CCA=% crustose coralline
algae cover; DZ=% coral disease prevalence; CO=% coral
cover; CH=% coral with other indications of compromised
health.
(XLS)
Acknowledgments
NOAA’s Coral Reef Ecosystem Division (CRED) and Pacific Reef
Assessment and Monitoring Program (Pacific RAMP) helped support this
work. We thank G. West and J.P. DeLong for helpful discussions.
Author Contributions
Conceived and designed the experiments: FR TM MH SS. Performed the
experiments: TM. Analyzed the data: TM MN BN BB. Contributed
reagents/materials/analysis tools: RB. Wrote the paper: TM FR MY.
Collected microbial data: TM KB MH. Collected and supplied benthic
data: BVA. Collected and supplied fish data: BZ. Oversaw metabolic
calculations: JN BF CH HL PS.
References
1. Sandin SA, Smith JE, DeMartini EE, Dinsdale EA, Donner SD, et al. (2008)
Baselines and degradation of coral reefs in the Northern Line Islands. PLoS
ONE 3: e1548.
2. Knowlton N, Jackson JBC (2008) Shifting Baselines, Local Impacts, and Global
Change on Coral Reefs. PLoS Biol 6: e54.
3. DeMartini EE, Friedlander AM, Sandin SA, Sala E (2008) Differences in fish-
assemblage structure between fished and unfished atolls in the northern Line
Islands, central Pacific. Mar Ecol Prog Ser 365: 199–215.
4. Maliao RJ, Turingan RG, Lin J (2008) Phase-shift in coral reef communities in
the Florida Keys National Marine Sanctuary (FKNMS), USA. Mar Biol 154:
841–853.
5. Bourne DG, Garren M, Work TM, Rosenberg E, Smith GW, et al. (2009)
Microbial disease and the coral holobiont. Trends Microbiol 17: 554–562.
6. Sokolow S (2009) Effects of a changing climate on the dynamics of coral
infectious disease: a review of the evidence. Dis Aquat Org 87: 5–18.
7. Essington TE, Beaudreau AH, Wiedenmann J (2006) Fishing through marine
food webs. Proc Natl Acad Sci USA 103: 3171–3175.
8. Greenstein BJ, Curran HA, Pandolfi JM (1998) Shifting ecological baselines and
the demise of Acropora cervicornis in the western North Atlantic and Caribbean
Province: a Pleistocene perspective. Coral Reefs 17: 249–261.
9. McCormick M (1994) Comparison of field methods for measuring surface
topography and their association with a tropical reef fish community. Mar Ecol
Prog Ser 112: 87–96.
10. Thurber RLV, Barott KL, Hall D, Liu H, Rodriguez-Mueller B, et al (2008)
Metagenomic analysis indicates that stressors induce production of herpes-like
viruses in the coral Porites compressa. Proc Natl Acad Sci USA 105: 18413–18418.
11. Bruno JF, Petes LE, Harvell DC, Hettinger A (2003) Nutrient enrichment can
increase the severity of coral diseases. Ecol Lett 6: 1056–1061.
12. Bruno JF, Selig ER, Casey KS, Page CA, Willis BL, et al. (2007) Thermal stress
and coral cover as drivers of coral disease outbreaks. PLoS Biol 5:e124.
13. Kuntz NF, Kline DI, Sandin SA, Rohwer F (2005) Pathologies and mortality
rates caused by organic carbon and nutrient stressors in three Caribbean coral
species. Mar Ecol Prog Ser 294: 173–180.
14. Dinsdale E, Pantos O, Smriga S, Edwards RA, Angly F, et al. (2008) Microbial
ecology of four coral atolls in the Northern Line Islands. PLoS ONE 3: e1584.
15. Mao-Jones J, Ritchie KB, Jones LE, Ellner SP (2010) How Microbial
Community Composition Regulates Coral Disease Development. PLoS Biol 8:
e1000345.
16. Mouchka ME, Hewson I, Harvell CD (2010) Coral-Associated Bacterial
Assemblages: Current Knowledge and the Potential for Climate-Driven Impacts.
Int Comp Biol 50: 662–674.
17. Kelly LW, Barott KL, Dinsdale E, Friedlander AM, Nosrat B, et al. (2011) Black
reefs: iron-induced phase shifts on coral reefs. ISME J. Available: [http://dx.doi.
org/10.1038/ismej.2011.114]. Accessed 2011 Dec 21.
18. Johnson C, Klumpp D, Field J, Bradbury R (1995) Carbon flux on coral reefs:
effects of large shifts in community structure. Mar Ecol Prog Ser 126: 123–143.
19. Arias-Gonzalez J, Delesalle B, Salvat B, Galzin R (1997) Trophic functioning of
the Tiahura reef sector, Moorea Island, French Polynesia. Coral Reefs 16: 231–
246.
20. Ernest SKM, Enquist BJ, Brown JH, Charnov EL, Gillooly JF, et al. (2003)
Thermodynamic and metabolic effects on the scaling of production and
population energy use. Ecol Lett 6: 990–995.
21. Brown JH, Gillooly JF, Allen AP, Savage VM, West GB (2004) Toward a
metabolic theory of ecology. Ecology 85: 1771–1789.
22. Gillooly JF, Brown JH, West GB, Savage VM, Charnov EL (2001) Effects of size
and temperature on metabolic rate. Science 293: 2248.
23. Atkins PW (2007) Four laws that drive the universe. New York: Oxford
University Press.
24. Peters RH (1986) The ecological implications of body size. New York:
Cambridge University Press.
25. DeLong JP, Okie JG, Moses ME, Sibly RM, Brown JH (2010) Shifts in
metabolic scaling, production, and efficiency across major evolutionary
transitions of life. Proc Natl Acad Sci USA 107: 12941.
26. Jackson JBC, Kirby MX, Berger WH, Bjorndal KA, Botsford LW, et al. (2001)
Historical overfishing and the recent collapse of coastal ecosystems. Science 293:
629.
Microbialization of Pacific Coral Reefs
PLOS ONE | www.plosone.org 9 September 2012 | Volume 7 | Issue 9 | e43233

27. Turgeon DD (2008) The state of coral reef ecosystems of the United States and
Pacific Freely Associated States. US Dept. of Commerce, National Oceanic and
Atmospheric Administration, National Ocean Service, National Centers for
Coastal Ocean Science.
28. Hobbie JE, Daley RJ, Jasper S (1977) Use of nuclepore filters for counting
bacteria by fluorescence microscopy. Appl Environ Microbiol 33: 1225.
29. Porter KG, Feig YS (1980) The use of DAPI for identifying and counting aquatic
microflora. Limnol Oceanogr 25: 943–948.
30. Noble RT, Fuhrman JA (1998) Use of SYBR Green I for rapid epifluorescence
counts of marine viruses and bacteria. Aquat Microb Ecol 14: 113–118.
31. Bjornsen PK (1986) Automatic determination of bacterioplankton biomass by
image analysis. Appl Environ Microbiol 51: 1199.
32. Simon M, Azam F (1989) Protein content and protein synthesis rates of
planktonic marine bacteria. Mar Ecol Prog Ser 51: 201–213.
33. Brock RE (1982) A critique of the visual census method for assessing coral reef
fish populations. Bull Mar Sci 32: 269–276.
34. Williams ID, Walsh WJ, Schroeder RE, Friedlander AM, Richards BL, et al.
(2008) Assessing the importance of fishing impacts on Hawaiian coral reef fish
assemblages along regional-scale human population gradients. Environ Conserv
35: 261–272.
35. Froese R, Pauly D (1994) Fishbase as a tool for comparing the life history
patterns of flatfish. Neth J Sea Res 32: 235–239.
36. Kulbicki M, Guillemot N, Amand M (2005) A general approach to length-
weight relationships for New Caledonian lagoon fishes. Cybium 29: 235–252.
37. Vargas-Angel B (2009) Coral health and disease assessment in the US PacificRemote Island Areas. Bull Mar Sci 84: 211–227.
38. Vargas-Angel B, Looney EE, Vetter OJ, Coccagna EF (2011) Severe,widespread El Nino associated coral bleaching in the US Phoenix Islands. BullMar Sci 87: 623–638.
39. The R Project for Statistical Computing website. Available: http://www.R-project.org/. Accessed 2012 Aug 1.
40. Jolliffe IT (2002) Principal Component Analysis. New York: Springer.41. MacQueen JB (1967) Some methods for classification and Analysis of
Multivariate Observations. Proceedings of 5th Berkeley Symposium onMathematical Statistics and Probability. University of California Press. 281–297.
42. Behrenfeld MJ, Falkowski PG (1997) A consumer’s guide to phytoplanktonprimary productivity models. Limnol Oceanogr 42: 1479–1491.
43. Strickland JDH, Parsons TR (1965) A manual of sea water analysis: with specialreference to the more common micronutrients and to particulate organicmaterial. Fish Res Board Can 125.
44. Halpern BS, Walbridge S, Selkoe KA, Kappel CV, Micheli F, et al. (2008) AGlobal Map of Human Impact on Marine Ecosystems. Science 319: 948–952.
45. Smith VH (2006) Responses of estuarine and coastal marine phytoplankton tonitrogen and phosphorus enrichment. Limnol Oceanogr 51: 377–384.
46. Akaike H (1974) A new look at the statistical model identification. IEEETransactions on Automatic Control 19(6): 716–723.
47. Haas AF, Nelson CE, Wegley-Kelly L, Carlson CA, Rohwer F, et al. (2011)Effects of Coral Reef Benthic Primary Producers on Dissolved Organic Carbonand Microbial Activity. PLoS ONE 6: e27973.
Microbialization of Pacific Coral Reefs
PLOS ONE | www.plosone.org 10 September 2012 | Volume 7 | Issue 9 | e43233


