Embed Size (px)
Citation preview

892
Conservation Biology, Pages 892–902Volume 15, No. 4, August 2001
Landsat Thematic Mapper: Detection of Shifts in Community Composition of Coral Reefs
PHILLIP DUSTAN,* ERIC DOBSON, AND GEORGE NELSON
Department of Biology, University of Charleston, Charleston, SC 29424, U.S.A.
Abstract:
We assembled a time series of 20 Landsat thematic mapper images from 1982 to 1996 for KeyLargo, Florida, to ascertain whether satellite imagery can detect temporal changes in coral reef communities.Selected reef and control areas were examined for changes in brightness, spectral reflectance, band ratios,spatial texture, and temporal texture ( pixel-to-pixel change over time). We compared the data to knownchanges in the reef ecosystem of Carysfort Reef and terrestrial sample sites. Changes in image brightness andspectral-band ratios were suggestive of shifts from coral- to algal-dominated community structure, but thetrends were not statistically significant. The spatial heterogeneity of the reef community decreased in theearly 1980s at scales consistent with known ecological changes to the coral community on Carysfort Reef. Ananalysis of pixel-scale variation through time, termed temporal texture, revealed that the shallow reef areasare the most variable in regions of the reef that have experienced significant ecological decline. Thus, the pro-cess of reef degradation, which alters both the spatial patterning and variability of pixel brightness, can beidentified in unclassified thematic mapper images.
Mapeador Temático Landsat: Detección de Desplazamientos en la Composición de Comunidades en Arrecifes de Coral
Resumen:
Ensamblamos una serie de tiempo de 200 imágenes del mapeador temático Landsat de 1982 a1996 para Cayo Largo, Florida para determinar si las imágenes de satélite pueden detectar cambios tempo-rales en las comunidades de arrecifes de coral. Los arrecifes de coral y las áreas control fueron examinadospara cambios en resplandor, reflectancia espacial, proporciones de las bandas, textura espacial y texturatemporal (cambios pixel a pixel a través del tiempo). Comparamos los datos de cambios conocidos en el eco-sistema de arrecife de Carysfort y en muestras de sitios terrestres. Cambios en el resplandor de la imagen y enlas proporciones de las bandas espectrales sugirieron desplazamientos en la estructura comunitaria domi-nante de coral a algas; sin embargo, las tendencias no fueron estadísticamente significativas. La heteroge-neidad espacial de la comunidad de arrecifes disminuyó en los inicios de los años 1980s en escalas consis-tentes con cambios ecológicos conocidos en la comunidad de coral del arrecife Carysfort. El análisis de lavariación a nivel de pixel a través del tiempo, e identificado como textura temporal, reveló que las áreas dearrecifes bajos son las más variables en regiones donde el arrecife ha experimentado disminuciones ecológi-cas significativas. Por lo tanto, el proceso de degradación, que altera tanto los patrones espaciales como la
variabilidad del resplandor de pixeles, puede ser identificado en el Mapeador Temático sin clasificar.
Introduction
Remote sensing offers the potential to observe the re-sponses of coral reef ecosystems to perturbations on a geo-graphical scale not previously accessible. But coral reef en-
vironments are optically, spatially, and temporally complexenvironments that present difficult challenges for extract-ing meaningful information about the ecology and vitalityof coral reef communities. One of the keys to using remotesensing to assess coral reef “health” is the development ofa methodology, reef bio-optics, that relates the remotelysensed satellite signal to the optical signal generated bycoral reef environments. Using a bio-optical approach, itmay be feasible to remotely map benthic habitats.
*
email [email protected] submitted April 5, 2000; revised manuscript accepted Febru-ary 7, 2001.

Conservation BiologyVolume 15, No. 4, August 2001
Dustan et al. Detecting Coral Reef Change with Landsat TM
893
Traditional marine science has always utilized in situmonitoring to detect community change, but the archi-val record of satellite-based information contains synop-tic mesoscale information that could also be tapped toexamine long-term environmental change in the coralreef ecosystems. This approach becomes more attrac-tive when one considers the remoteness of most reefsand the expense of expeditionary travel. Space-basedobservations are probably the most cost-effective way tomap remote reefs (Mumby et al. 1998) and, using changeanalysis, to observe temporal changes in coral communi-ties. Simply stated, the question becomes whether re-mote sensing can be used to follow changes in coral reefbiodiversity.
We explored the utility imagery from operational satel-lites for detecting and mapping gross change in coral reefcommunities to provide estimates of coral reef health andchange over time. As a test case, we chose to evaluate theutility of Landsat thematic mapper (TM) imagery to detectgross changes in coral reef communities that resultedfrom the mass mortality of the spiny black sea urchin (
Di-adema antillarum
) in 1983–1984 (Lessios et al. 1984).This basin-wide mass mortality dramatically lowered ratesof herbivory on virtually all Caribbean reefs. Subsequently,algal populations flourished and overgrew large areas ofsubstrate, including coral, sponges, sessile gorgonians, redcrustose algae, and other members of the benthic reefcommunity (Dustan 1987, 1999; Curran et al. 1994;Hughes 1994). Approximately 16 years after the initial massmortality event,
D. antillarum
populations are showingonly slight signs of potential recovery (Lessios 1995).
Scientists do not yet know definitively what is causingthe decline of some of the reefs in the Caribbean. It issuspected by many researchers that multiple stressors,including direct and indirect anthropogenic effects suchas land-based sources of pollution and overfishing, are atthe root of the problem (Rogers 1985; Tomascik &Sander 1987; Dustan 1999; Hay 1999). Furthermore, inthe Florida Keys we seem to be observing environmen-tal effects cascading through multiple ecosystems. TheFlorida Reef Tract is at the downstream end of the hy-drology of south Florida, a system that has experiencedexplosive human population and agricultural growthover the last 50 years. In addition, the Gulf Stream,which washes over the seaward margin of the reef tract,carries materials from elsewhere in the Caribbean andGulf of Mexico, including the Mississippi River basin.Materials from watersheds as distant as the Amazon andOrinoco Rivers of South America and from atmospherictransport of African agricultural dust could contributeadditional stress to the reef system (Shinn et al. 2000).
Remote-Sensing Imagery
We used Landsat TM imagery to investigate community-scale reef change from 1982 through 1996. The TM sen-
sor has a spatial resolution of 30 m and three visiblebroad-spectrum bands (red, green, and blue) (Markham& Barker 1985). The Landsat TM and the System Pourl’Observation de la Terre (SPOT) provide the best opera-tional remote-sensing platforms for locating reefs andmapping their general zonation patterns and dominantbenthic communities (coral, seagrasses, sand) (Biña etal. 1978; Maniere & Jaubert 1985; Jupp 1986; Kuchler etal. 1988; Bour & Pichon 1997; Mumby et al. 1998;Dustan et al. 2000). The blue band of TM probably givesit a slight performance edge (Mumby et al. 1997). Thefirst TM instrument was launched aboard Landsat 3 inJuly of 1982 and began capturing images shortly afterlaunch. Control of the spacecraft and image archival wastransferred from the National Aeronautics and Space Ad-ministration to the EROS Data Center in 1984. The datastream has been maintained through a series of Landsatsensors, most recently Landsat 7, which was launchedon 15 April 1999.
Reefs of the Florida Marine Sanctuary
Coral reefs throughout the Florida Keys have undergonecatastrophic ecological degradation over the last 25 years.Carysfort is the only reef for which this long-term changehas been documented with quantitative line-transect stud-ies. Carysfort is the richest and most diverse reef in thenorthern Florida Keys (Dustan 1985
a
) and lies at the north-ern seaward edge of the Florida Keys National MarineSanctuary (Fig. 1). The reef community was first quanti-tatively surveyed in 1974 from the reef flat to the deepestdepth of coral (20 m) on the inner reef terrace (Dustan1985
b
). The second survey occurred in 1982–1983 (Dustan& Halas 1987), and the site has been included in otherreef-monitoring projects, principally a series of multi-method surveys featuring photostation analysis (Porter& Meier 1992). Since 1996, Carysfort Reef has been sam-pled annually by the U.S. Environmental Protection AgencyCoral Reef Monitoring Project (Dustan 2000; Porter et al.2001).
In 1975 the shallow seaward reef zones of CarysfortReef were dominated by populations of elkhorn coral(
Acropora palmata
), which formed large monotypicstands typical of Caribbean coral reefs (Goreau 1959).
A.palmata
was the “signature coral” of the shallow-waterreefs of the Florida Keys. The highest living coral coveron Carysfort Reef occurred on the seaward side of theshallow reef flat in the
A. palmata
zone.Since 1975, most of the
A. palmata
colonies have died,and the species has recently been considered a possiblecandidate for inclusion on the Endangered Species List.Living coral coverage, estimated at 40% of the total coverin 1975, increased to a surveyed 60% in 1982–1983 andthen began to fall. The increase between 1975 and 1983was due principally to physical breakage. Large, three-dimensional colonies were broken and lay strewn about

894
Detecting Coral Reef Change with Landsat TM Dustan et al.
Conservation BiologyVolume 15, No. 4, August 2001
the reef substrate, which effectively increased coral cov-erage while decreasing mean colony size (Dustan &Halas 1987). The mass mortality of
D. antillarum
oc-curred in Florida during August of 1984, which furtherexacerbated conditions on Carysfort Reef through a dra-matic reduction in grazing pressure (Hughes 1994). Algalturf communities began to form in large areas of the shal-low reef that were encrusted with highly reflective crus-tose coralline algae. By 1985, many of the coral frag-ments had died and many regions of the former
A.palmata
zone were covered with algal turf communi-ties. High rates of mortality were documented between1984 and 1991 (Porter & Meier 1992). Then, in 1996,mortality rates increased again with the outbreak of aseemingly new virulent form of white plague diseasetermed white pox. This disease specifically attacks
A.palmata
, killing large colonies within months ( J. Porter,personal communication). The present coverage by
A.palmata
on Carysfort Reef is estimated at less than 5%percent (Dustan 2000). Living coral cover has also de-creased dramatically in the deeper areas of the reef, al-though these are not visible in satellite imagery.
Coral Reef Bio-optics
The formidable task for remote sensing is to relate theoptical signal received in space above the atmosphere tothe reef substrate, living or dead. Coral reefs develop to
their greatest extent in clear oligotrophic tropical seaswhere light intensities are high and nutrients tend to bethe limiting factor. Because a large portion of the habitatis composed of living organisms, much of the upwellingreef signal is a function of the bio-optical state of thecommunity. The high species diversity of coral reefs isreflected in the wide array of optical signatures emanat-ing from the living reef substrate. Most of the importantoptical properties of the reef are related to photosyn-thetic pigments fixed in the benthic organisms, but thereother pigments add both active and passive “color” tothe reef (Mazel 1995; Meyers et al. 1999). Alterations ofphysical and ecological parameters (wave action, watertemperature, nutrient loading, herbivory) can result inadditional shifts in the community composition and thusthe optical properties of the reef.
The upwelling optical signal is a blend of many com-plex spectral signatures caused by the spectral and spa-tial complexity of the habitat, reef geomorphology, andthe optical properties of the overlying water column. Asone moves away from the small scale of individual or-ganisms, the signal becomes the product of a mixture ofindividual active and passive optical spectra. The basereef rock, calcium carbonate, is a bright white reflectivesubstrate that rapidly becomes less reflective as it be-comes covered with living organisms. The upwellingspectral signatures of reef zones are, for the most part,attributable to combinations of photosynthetic pigmentscontained in the dominant community members. Stony
Figure 1. Location map of south Flor-ida and the Florida Keys showingstudy sites for coral reefs, RodriguezKey, and the Key Largo habitats.

Conservation BiologyVolume 15, No. 4, August 2001
Dustan et al. Detecting Coral Reef Change with Landsat TM
895
and soft corals tend to be yellow-brown due to the light-harvesting peridinin-chlorophyll-protein complex of theirzooxanthellae, green algae and seagrass derive their colorfrom chlorophyll, and red calcareous algae are highly re-flective in a broad band between 500 and 600 nm (Meyerset al. 1999; Dustan et al. 2000).
Methods
Satellite Image Time Series
An image time series of the Florida Keys was assembledfrom the archives at the Jet Propulsion Laboratory ( JPL)and the U.S. Geological Survey (USGS) Center of CoastalStudies, St. Petersburg, Florida, via the Florida MarineResearch Institute and purchased from the EROS DataCenter. A time series of 22 images was subsequently as-sembled for the northern Florida Keys from 1982 to1996. The earliest image, 1982, was captured shortly af-ter launch but before TM became operational. We ob-tained copies of it from the EROS Data Center ScroungeFile and from JPL. Unfortunately, neither copy possessedephemeris data in its header file, so we could not cor-rect the data to reflectance values. This precluded usfrom using its information when reflectance data wererequired, but we could use it when uncalibrated datawere appropriate, as in band ratios and spatial-textureanalysis. The other images, 1984–1996, were georefer-enced and atmospherically corrected by the USGS (Raabe& Stumpf 1997). We used Erdas Imagine (version 8.3)for all subsequent image processing.
Selection of Study Sites
We located reefs from a classified SPOT satellite imageof the former Key Largo National Marine Sanctuary, nowFlorida Keys National Marine Sanctuary, which had beengeoreferenced to standard navigational charts of the Na-tional Oceanic and Atmospheric Administration. A hy-brid, supervised–unsupervised classification using bothpanchromatic and multispectral images was used to de-lineate shallow benthic habitats, including reefs withinthe sanctuary boundaries (Dustan et al. 2000). Althoughthe reef classes contained no information with respectto their within-habitat condition (i.e., coral vs. algalcover), their positions had been verified by sanctuarypersonnel as shallow reef areas under
�
1–2 m of water.Focusing on these areas provided the “cleanest” reef sig-nals because the shallow depths would have minimalsignal distortion due to water-column attenuation (in-cluding tidal depth), which can alter the spectral shapeand magnitude of the upwelling benthic signal.
Using the classified SPOT image as a template, we sub-set areas of interest (AOI) from the TM image time series
to provide a set of cloud-free experimental and refer-ence samples for investigating the magnitude and phe-nology of change. Each AOI of a time series was then ac-curately coregistered and precisely matched to providea “best fit” image-to-image registration. Molasses andCarysfort Reefs were the principal focus of the study.Rodriguez Key, a small mangrove island, is a natural, un-developed vegetated terrestrial habitat. A portion of theKey Largo mainland is an urbanized area that haschanged dramatically from 1982 to the present, with theexception of a mangrove forest located near the south-ern end of the AOI. We also selected two sandy areas inshallow water, White Banks, to represent a high-reflec-tive-end member that should not change much overtime. An offshore AOI was selected in the axis of theFlorida Current to represent the bottomless ocean as alow-reflective-end member that should also be relativelyinvariant in TM imagery.
Image Analysis
The pixels from each selected habitat AOI were subset,and the mean pixel brightness values (BV) for each band(blue, green, and red) were compared between cloud-freeimages. Such data form the basis of mapping habitatswith cluster and principal components analysis ( Jensen1996; Holden & Ledrew 1998). We also examined changesin spectral-band ratios because they are normalized mea-sures that are less sensitive to atmospheric conditions,preprocessing, and calibration drift in satellite sensors.Also, band-ratio calculations form the basis of terrestrialvegetation indices (NVDI) and marine bio-optics (Smith& Baker 1978; Baker & Smith 1982).
Because reefs exhibit distinct patterns of zonation, wethought that a measure of spatial patchiness might re-flect the distribution of reef zones and some indicationof their variability over time. In two dimensions, textureis a measure of spatial heterogeneity used to identify ob-jects or regions of interest within remotely sensed aerialphotographs, airborne digital images, or satellite images(Haralick et al. 1973; Jensen 1996). In this context, tex-ture is an index of similarity within a connected set ofpixels, or neighborhood. Texture has traditionally beencalculated as a function of the frequency of a particularpixel brightness (BV) from an odd-numbered pixel win-dow (3
�
3, 5
�
5, etc.), or kernel, in two-dimensionalimagery (Hsu & Burright 1980; Jensen 1996). In ecologi-cal terms, texture may be a proxy measure of habitatheterogeneity to the extent that pixel brightness reflectshabitat differences.
Texture analysis can also be applied to the temporaldomain to examine change over time at the scale of indi-vidual pixels, each representing the same geographicpoint on the earth. The spatial (x, y) dimension is heldconstant across the time series, and a sample statistic(i.e., standard error of the mean) is calculated for each

896
Detecting Coral Reef Change with Landsat TM Dustan et al.
Conservation BiologyVolume 15, No. 4, August 2001
pixel location of each specific band (Dobson 1998).Great care must be used to precisely coregister the im-ages so as not to introduce error from misregistration.These data can be visualized as a three-dimensional im-age in which the x, y dimensions represent geographicpoints and variability over time as the z dimension. Hightemporal texture is a measure of heterogeneity (changein pixel brightness over time), whereas areas with lowtemporal texture signify little or no change. The outputis an image of the individual pixel-to-pixel variabilityover time.
We calculated temporal texture indices as the stan-dard deviation of pixels brightness over time at each x, ylocation in the blue, green, and red bands of all thecloud-free images in each AOI image set (Dobson 1998).We also computed the coefficient of variation (COV)from the standard deviation to allow us to compare thevariability of pixels independent of the magnitude ofpixel brightness (Sokal & Rohlf 1995): COV
�
STD/mean * 100, where STD is the temporal texture (stan-dard deviation of pixel brightness [BV] at each pixel x,y, for the cloud-free image observation data set) andmean is the mean at pixel x, y for the cloud-free imageobservation data set.
Results
Spectral Reflectance and Bank Ratios
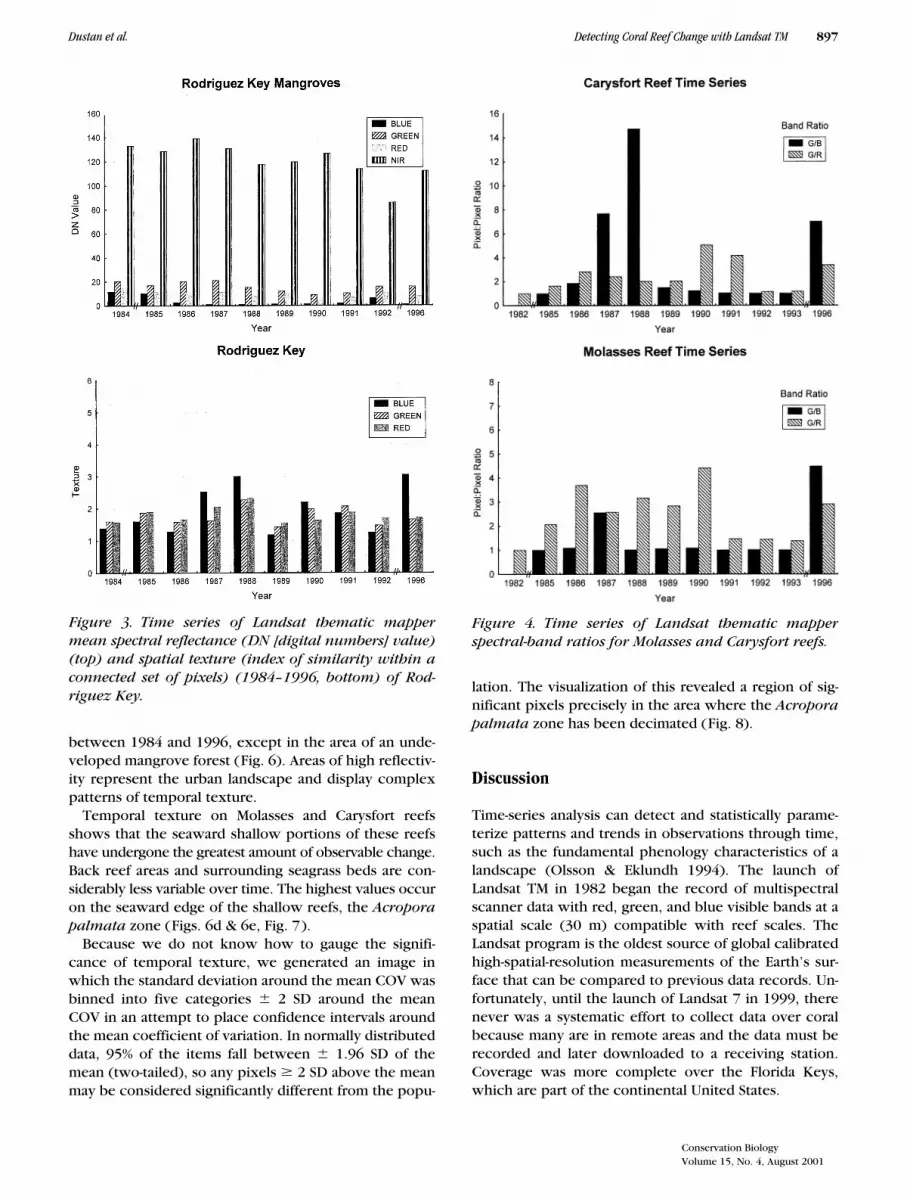
A cluster analysis of all sites using the mean pixel bright-ness of the red, green, and blue bands of each AOI sitedivided the AOIs into three quasi-distinct clusters: terres-trial habitat, sand, reef, and offshore habitat (raw dataavailable from authors upon request). The offshore wa-ters of the Gulf Stream displayed the least variation andthe terrestrial urbanized environment the greatest. Anexamination of reflectance over time revealed no statisti-cally significant trends between 1985 and 1996 for ei-ther Molasses or Carysfort reefs (Fig. 2). Both reefs ex-hibited high blue reflectance in 1982, which thendropped over time to a minimum in 1988. One mustbear in mind that the 1982 data may be flawed. OnCarysfort values then rose slightly through 1993 andthen dropped in 1996. Red BV values parallel blue val-ues. Discounting 1982, green BV values rose from 1985through 1988 and then dipped and rose slightly through1993. Molasses Reef was more variable than Carysfort.Although no clear patterns are evident on either reef,the reefs did appear to change color slightly over time.Spectral shifts were not as evident in terrestrial imageryof Rodriguez Key, a mangrove island (Fig. 3).
TM spectral-band ratios for Carysfort Reef increasedfrom 1985 to 1988 and then decreased through 1993(Fig. 4). The shifts at Carysfort Reef seem to parallel thetemporal trends in pixel brightness, suggesting that
changes occurred in both reef color and albedo (sub-strate reflectivity). The reef became almost 50% brighterin the green region of the spectrum. Molasses Reef ex-hibited more variability in the green/red ratio and less inthe blue/green ratio. But neither of these data sets dem-onstrate any statistically significant trends over the en-tire time series.
Texture Analysis
An examination of spatial variability for Rodriguez Keyyielded values ranging from 1 to 3 SD with no apparentsignificant trends over time (Fig. 3). Molasses and Carys-fort reefs exhibited higher spatial texture than Rod-riguez Key, values ranging from 1.5 to almost 8 (Fig. 5).Texture on Carysfort Reef did not display clear trends,whereas Molasses Reef displayed more pronounced vari-ability, with apparent peaks in 1985, 1991, and 1996.
Temporal texture calculated for imagery of RodriguezKey revealed that the terrestrial vegetation was less vari-able than the shallow-water zones surrounding the is-land (Fig. 6). Temporal textural analysis of a portion ofthe Key Largo mainland revealed a pronounced change
Figure 2. Time series of Landsat thematic mapper meanspectral reflectance (DN [digital numbers] value).
Conservation BiologyVolume 15, No. 4, August 2001
Dustan et al. Detecting Coral Reef Change with Landsat TM
897
between 1984 and 1996, except in the area of an unde-veloped mangrove forest (Fig. 6). Areas of high reflectiv-ity represent the urban landscape and display complexpatterns of temporal texture.
Temporal texture on Molasses and Carysfort reefsshows that the seaward shallow portions of these reefshave undergone the greatest amount of observable change.Back reef areas and surrounding seagrass beds are con-siderably less variable over time. The highest values occuron the seaward edge of the shallow reefs, the
Acroporapalmata
zone (Figs. 6d & 6e, Fig. 7).Because we do not know how to gauge the signifi-
cance of temporal texture, we generated an image inwhich the standard deviation around the mean COV wasbinned into five categories
�
2 SD around the meanCOV in an attempt to place confidence intervals aroundthe mean coefficient of variation. In normally distributeddata, 95% of the items fall between
�
1.96 SD of themean (two-tailed), so any pixels
�
2 SD above the meanmay be considered significantly different from the popu-
lation. The visualization of this revealed a region of sig-nificant pixels precisely in the area where the
Acroporapalmata
zone has been decimated (Fig. 8).
Discussion
Time-series analysis can detect and statistically parame-terize patterns and trends in observations through time,such as the fundamental phenology characteristics of alandscape (Olsson & Eklundh 1994). The launch ofLandsat TM in 1982 began the record of multispectralscanner data with red, green, and blue visible bands at aspatial scale (30 m) compatible with reef scales. TheLandsat program is the oldest source of global calibratedhigh-spatial-resolution measurements of the Earth’s sur-face that can be compared to previous data records. Un-fortunately, until the launch of Landsat 7 in 1999, therenever was a systematic effort to collect data over coralbecause many are in remote areas and the data must berecorded and later downloaded to a receiving station.Coverage was more complete over the Florida Keys,which are part of the continental United States.
Figure 3. Time series of Landsat thematic mappermean spectral reflectance (DN [digital numbers] value)(top) and spatial texture (index of similarity within aconnected set of pixels) (1984–1996, bottom) of Rod-riguez Key.
Figure 4. Time series of Landsat thematic mapperspectral-band ratios for Molasses and Carysfort reefs.

898
Detecting Coral Reef Change with Landsat TM Dustan et al.
Conservation BiologyVolume 15, No. 4, August 2001
Interpreting coral community change through an ex-amination of spectral reflectance required some infor-mation on the optical properties of the reef community.In situ optical spectra suggest that reef corals can be dis-tinguished from green and red algae on the basis of spec-tral reflectance and albedo (Holden & Ledrew 1998;Meyers et al. 1999). Likewise, reef habitats possess dif-ferent spectral reflectances that can be used to generatehabitat classifications and distinguish reefs from theirsurrounding substrates. But this may not always be pos-sible with broad-band, multispectral imagery because in-formation is lost when the fine-scale radiometer mea-surements are summed into the broad TM bands. Recentmodeling studies on radiative transfer of these signalssuggest that the blue and green wavelengths propagatethrough the water column and atmosphere more effi-ciently than longer red wavelengths (Lubin et al. 2001).The temporal patterns of reef reflectance we gleanedfrom TM satellite data hint that the substrate becamegreener over time and, at the same time, reef albedo de-creased. Such shifts in optical signatures are consistentwith the hypothesis of increasing algal populations,
which would be greener and darker than corals. Thispoint is verified by in situ observations showing that thereef community has changed from a coral-dominatedsubstrate to one with increasing fleshy algal coverage(Dustan 1999).
Although it is speculative to attach a biological mean-ing to texture analysis of AOIs, the heterogeneity couldbe generated by habitat patchiness or annual phenology(seasonal change). On the reefs, clear trends in decreas-ing patchiness would be consistent with the observedloss of corals and subsequent overgrowth of the sub-strate by algae. Shallow-water corals tend to be distrib-uted in zones and patches within areas that may actuallybe supercolonies produced through breakage and subse-quent recovery. If these patches were to die and then, inturn, be replaced with algae, the spatial heterogeneity of
Figure 5. Time series of spatial texture (index of simi-larity) within a connected set of pixels for Carysfortand Molasses reefs, 1982–1996.
Figure 6. Three-dimensional visualization of habitatvariability as depicted by temporal texture. (a) A two-dimensional Landsat thematic mapper image for KeyLargo. Temporal texture for (b) Key Largo and (c) Rod-riguez Key. Temporal texture is the vertical axis in thesethree-dimensional models of change. Rodriguez Keyshows little change, whereas the Key Largo mainlandhas undergone considerable alteration. Note the rela-tively “flat” region in southeast Key Largo. Althoughmuch of the island has been developed, the mangrovesare protected. (d) Molasses Reef shown in an aerialphotograph. (e) Temporal texture in which a modifiedtrue-color version of the image subset area of interestis draped over the “wire frame” to show the generalhabitat features. The shallow reef, bright yellow, showsthe seaward edge of the reef. The spur-and-groove zonelies seaward (right) of the shallow reef.

Conservation BiologyVolume 15, No. 4, August 2001
Dustan et al. Detecting Coral Reef Change with Landsat TM
899
the reef substrate would increase at first as the coralsdied and then decrease over time as the algae overgrewthe dead skeletons.
Computations of temporal texture revealed patternsof habitat variability and rendered three-dimensional rep-resentations of change for the terrestrial and submergedsites. Although we focused on reefs, the other sites pro-vided information that helped us interpret temporal tex-ture. The highly reflective sand of White Banks and theoffshore ocean, which represented areas at the high andlow ends of the spectrum, showed little or no change intemporal texture analysis in any spectral bands. Theseareas are different from each other, but they are both rel-atively stable and should not show significant changeover the length of the time-series analysis.
The visible blue band (TM band 1) discriminated thechanges in the urbanized system for terrestrial sites (KeyLargo and Rodriguez Key) most efficiently. We had ex-pected that the infrared band (TM band 4) would bemost efficient at discriminating change but realized thatthe mode of change for the urbanized area is from vege-tation to impervious surface and bare carbonate sands.The blue visible band showed the greatest difference be-
tween vegetation (blue is absorbed) and highly reflec-tive impervious surface (concrete) and carbonate sand.
Temporal texture revealed that the terrestrial vegeta-tion of Rodriguez Key has been relatively invariant,whereas the shallow-water zones surrounding the islandhave been more dynamic. The island is a protected andundeveloped mangrove ecosystem that is located justoutside the boundary of John Pennekamp Coral ReefState Park. The island is close to the mainland of KeyLargo, however, and its shallow-water habitat is exposedto increased nutrients and land-based pollutants charac-teristic of urbanization, and to the normal perturbationsof a nearshore environment.
The mainland of Key Largo showed pronounced changebetween 1984 and 1996, except in the area of an unde-veloped mangrove forest. During the period, Key Largounderwent extensive residential and commercial devel-opment. The high variability results from land clearing,followed by construction and subsequent landscaping.This occurred on a parcel-by-parcel basis, with the aver-age residential lot being just slightly larger than the sizeof a TM pixel, 30
�
30 m. Change along the path of U.S.Route 1, a major highway, is revealed as a linear feature
Figure 7. A three-dimensional visual-ization of habitat variability on Carys-fort Reef as depicted by temporal tex-ture. (a) A digital scan of a NAPPhigh-altitude aerial photograph show-ing the general reef features. Shallowareas are bright yellow, and brownareas are the reef flat and the sea-ward edge of the shallow reef. Thelighthouse and its shadow can beseen above and to the left of the ar-row tip. The arrow points to the A.palmata zone, which can be seen (b)underwater in a pair of photographstaken from the same vantage point 10years apart. (c) A three-dimensionalvisualization of reef change withstandard deviation of pixel bright-ness as the vertical axis.

900
Detecting Coral Reef Change with Landsat TM Dustan et al.
Conservation BiologyVolume 15, No. 4, August 2001
that runs the length of the Key Largo AOI. The roadsideunderwent extensive commercial development duringthe time period of the study. In all these analyses, thehighly variable sites were places that had been affectedby human processes, whereas the natural ecosystemswere less variable.
The greatest change in the reef habitats (i.e., in areasknown to have changed from in situ field observations)was revealed by the red visible band (TM band 3). Waterpenetration is most efficient between the visible blueand green wavelengths around 485 nm, but the red por-tion of the spectrum showed the greatest variation. Be-cause the dominant mode of change over the reef wasfrom coral (which is yellow brown) to algae (which isblue green), the shift from the red to blue wavelengthsappears to be an environmental signal identifying shiftsin coral reef community from coral to algae. White sandenvironments (at the same depth) and deep water,which represent the high and low ends of the specturm,showed little change in the visible red. This reinforcedthe notion that a shift in community structure (coral- toalgal-dominated) influenced the bio-optical properties ofthe reef.
Temporal texture on Molasses and Carysfort reefs re-vealed that the shallow reefs have been more variableover time than their surrounding habitats. This may bedue, in part, to the fact that water depths are deeper onthe seaward sides, whereas the shallow waters behind
the reefs are principally seagrass beds, which may beless sensitive to change. Within the boundaries of thetwo reefs, the greatest amount of observable changeoccurred on the seaward edge of the reef crest, the
Acropora palmata
zone.The changes we have observed in TM time series are
in agreement with what is known about change in theFlorida Keys. The process of urbanization has changedthe mainland, and temporal texture has accurately de-picted this process. Rodriguez Key has been relativelyundisturbed, and estimates of temporal texture are low.Measures of reef spectral reflectance from space suggestthat Molasses and Carysfort reefs have become greenerand their albedo has decreased. Although both observa-tions are consistent with increased algal growth, thetrends are not significant. Finally, measures of temporaltexture on these reefs suggest that change has beengreatest where significant loss of coral has been re-corded. On Carysfort Reef, temporal texture analysis re-vealed that the greatest rates of change occurred in hab-itats that have experienced near-catastrophic ecologicalchange. The once dominant corals have died, and thesubstrates are overgrown by turf algae. Satellite data sug-gest that similar changes have occurred on MolassesReef. Although underwater visual observations verifythis analysis, there are no quantitative in situ time-seriesdata to corroborate the findings.
To the best of our knowledge, this is the first time-se-ries analysis of coral reef ecosystem variability based onsatellite imagery. Our results demonstrate that thematicmapper images contain information that can be used todistinguish areas of long-term stability from areas ofchange in both terrestrial and benthic environmentswithout the necessity of accurate target identification. Itmay be prudent, however, to invoke some caution inthe interpretation of these patterns. Although spectraland albedo shifts were suggested, we have not been ableto positively identify the type of change, only estimateits magnitude. The time series of satellite imagery weused is, in reality, a glimpse over time, and more imagesare needed to generate a more definitive, smoother timeseries. With additional information, the statistical powerof the time-series analysis will greatly increase. It mayeven be possible to separate seasonal and long-termtrends. Then we may be able to more fully relate the ob-served spectral patterns to changes in the coral reefcommunity.
Our work suggests that temporal texture analysis cancapture the spectral and textural variability of coral reefcommunities through time and space. The fact that tem-poral texture reveals change that is not readily apparentfrom optical properties suggests that the optical proper-ties of ecological change may be more complex thanpreviously considered. It also raises the possibility thatmeasures of variability may be diagnostic without need-ing to generate a precise classification. This opens the
Figure 8. Spatial distribution of the standard devia-tion of the mean coefficient of variation for the tempo-ral texture of Carysfort Reef.

Conservation BiologyVolume 15, No. 4, August 2001
Dustan et al. Detecting Coral Reef Change with Landsat TM
901
possibility that currently orbiting technology may beused to examine large areas of a reef tract for change. Ifchanges are detected, more directed field studies andhigher-precision remote sensing from aircraft or “next-generation” high-resolution orbiting sensors could be fo-cused on these critical areas. Of equal or perhaps greaterinterest might be known reefs that do not show greatchange. Such natural experiments may be important inthe design of nested-scale global coral reef monitoring.
Acknowledgments
This work was accomplished with the help of many peo-ple. R. Stumpf and E. Raabe of the U.S. Geological Sur-vey and P. Huohoulis of the Florida Marine Research In-stitute graciously provided imagery. L. Stuart, of theNational Aeronautics and Space Administration (NASA)/GSFC, provided the “keys” to the Scrounge File at EDC,and T. Logan, of NASA/Jet Propulsion Laboratory helpedlocate early Landsat thematic mapper imagery. We thankM. Brill, V. Kosmynin, J. Leard, Q. Schuyler, and espe-cially Erdas, Inc., for advice and technical expertise.Funding was provided by NASA (NAG8–1413) throughthe Center for Marine Conservation and the Jeanette andLafayette Montgomery Foundation.
Literature Cited
Baker, K. S., and R. C. Smith. 1982. Bio-optical classification and modelof natural waters 2. Limnology and Oceanography
27:
500–509.Biña, R. T., K. Carpenter, W. Zacher, R. Jara, and J. B. Lim. 1978. Coral
reef mapping using Landsat data, follow-up studies. Proceedings ofthe International Symposium on Remote Sensing of Environment
12:
2051–2070.Bour, W., and M. Pichon 1997. Discrimination of Scleractinian-domi-
nated from other reef communities using remote sensing. Proceed-ings of the International Coral Reef Symposium
8:
1487–1490.Curran, H. A., D. P. Smith, L. C. Meigs, A. E. Pufall, and M. L. Greer.
1994. The health and short-term change of two coral patch reefs,Fernandez Bay, San Salvador Island, Bahamas. R. N. Ginsburg, com-piler. Proceedings of the colloquium on global aspects of coralreefs: health, hazards and history. Rosenstiel School of Marine andAtmospheric Science, University of Miami, Miami.
Dobson, E. L. 1998. Spatial and temporal autocorrelation in the analy-sis of Landsat thematic mapper digital satellite imagery. Ph.D. dis-sertation. University of South Carolina, Columbia.
Dustan, P. 1982
a
. Community structure of reef-building corals in theFlorida Keys: Carysfort Reef, Key Largo and Long Key Reef, DryTortugas. Atoll Research Bulletin 288.
Dustan, P. 1982
b
. The bio-optics of coral reefs. In M. L. Reaka, editor.The ecology of coral reefs. NOAA Symposium Series on UnderseaResearch, Volume 3, pages 189–197. National Oceanographic andAtmospheric Administration, Rockville, Maryland.
Dustan, P. 1987. Preliminary observations on the vitality of reef corals inSan Salvador, Bahamas. Pages 57–65 in H. A. Curran, editor. Proceed-ings of the third symposium on the geology of the Bahamas. Centerfor the Finger Lakes Bahamian Field Station. Fort Lauderdale, Florida.
Dustan, P. 1999 Coral reefs under stress: sources of mortality in theFlorida Keys. United Nations Forum
23:
147–155.
Dustan, P. 2000. Florida Keys. Seas at the millennium: an environmen-tal evaluation. Volume 1. Pages 405–414 in C. R. C. Sheppard, edi-tor. Elsevier Science, Amsterdam.
Dustan, P., and J. C. Halas. 1987. Changes in the reef-coral community ofCarysfort Reef, Key Largo, Florida: 1974 to 1982. Coral Reefs
6:
91–106.Dustan, P., S. Chakrabarti, and A. Alling. 2000. Mapping and monitor-
ing the health and vitality of coral reefs from satellite: a biosphericapproach. Life Support and Biosphere Science
7:
149–159.Goreau, T. F. 1959. The ecology of Jamaican coral reefs. Ecology
40:
67–90.Haralick, R. M., K. Shanmagam, and J. Dinstein. 1973. Textural features
for image classification. Institute of Electrical and Electronic Engi-neers Transactions on System Man, and Cybernetics
6:
610–621.Hay, M. E. 1999. Basic processes structuring coral reefs: do we know
what to monitor and why? Page 41 in International conference onscientific aspects of coral reef assessment and restoration. NationalCoral Reef Institute, Ft. Lauderdale, Florida.
Holden, H., and E. Ledrew. 1998. Spectral discrimination of healthyand non-healthy corals based on cluster analysis, principal compo-nents analysis and derivative spectroscopy. Remote Sensing of En-vironment
65:
217–224.Hsu, S. J., and R. G. Burright. 1980. Texture perception and the RADC/
HSU texture feature extractor. Photogrammetric Engineering andRemote Sensing
46:
1051–1058.Hughes, T. P. 1994. Catastrophic phase shifts and large-scale degrada-
tion of a Caribbean coral reef. Science
265:
1547–1551.Jensen, J. R. 1996. Introductory digital image processing, a remote
sensing perspective. Prentice-Hall, Englewod Cliffs, New Jersey.Jupp, D. L. B. 1986. The application and potential of remote sensing in
the Great Barrier Reef region. Research publication. Great BarrierReef Marine Park Authority, Townsville, Australia.
Kuchler, D. A., R. T. Biña, and D. van R. Claasen. 1988. Status of high-technology remote sensing for mapping and monitoring coral reefenvironments. Proceedings of the International Coral Reef Sympo-sium
6:
97–101.Lessios, H. A. 1995.
Diadema antillarum
ten years after mass mortal-ity, still rare, despite help from a competitor. Proceedings of theRoyal Society B
259:
331–337Lessios, H. A., D. R. Robertson, and J. D. Cubit. 1984. Spread of mass
Diadema
mortality through the Caribbean. Science
226:
335–337.Lubin, D., W. Li, P. Dustan, C. H. Mazel, and K. Stamnes. 2001. Spectral
signatures of coral reefs: features from space. Remote Sensing ofthe Environment
75:
127–137.Maniere, R., and J. Jaubert. 1985. Traitements dimage et cartographie de
récifs coralliens en Mer Rouge (Golfe d’Aqaba). Oceanologica Acta
8:
321–330.Markham, B. L., and J. L. Barker. 1985. Spectral characterization of the
Landsat-D multispectral scanner subsystems. International Journalof Remote Sensing
6:
697–716.Mazel, C. H. 1995. Spectral measurements of fluorescence emission in
Caribbean cnidarians. Marine Ecology Progress Series
120:
185–191.Meyers, M., J. Hardy, C. Mazel, and P. Dustan. 1999. Optical spectra
and pigmentation of Caribbean reef corals and macroalgae. CoralReefs
18:
179–186.Mumby, P. J., E. P. Green, C. D. Clark, and A. J. Edwards. 1997. Coral
reef habitat mapping: how much detail can remote sensing pro-vide? Marine Biology
130:
193–202.Mumby, P. J., E. P Green, C. D. Clark, and A. J. Edwards. 1998. Digital
analysis of multispectral airborne imagery of coral reefs. CoralReefs
17:
59–69.Olsson, L., and L. Eklundh. 1994. Fourier series for analysis of temporal
sequences of satellite sensor imagery. International Journal of Re-mote Sensing
15:
3735–3741.Porter, J. W., and O. W. Meier. 1992. Quantification of loss and change
in Floridian reef coral populations. American Zoologist
32:
625–640.Porter, J. W., W. C. Jaap, J. L. Wheaton, V. Kosmynin, C. P. Tsokos, G.
Yanev, K. Hackett, K. L. Paterson, D. M. Marcinek, J. Dotten, D.

902
Detecting Coral Reef Change with Landsat TM Dustan et al.
Conservation BiologyVolume 15, No. 4, August 2001
Eaken, M. Brill, M. Lybolt, M. Patterson, O. W. Meyer, K. G. Porter,and P. Dustan. 2001. Detection of coral reef change by the FloridaKeys Coral Reef Monitoring Project. Pages 915–936 in J. W. Porterand K. G. Porter, editors. Linkages between ecosystems in the southFlorida hydroscape: the river of grass continues. CRC Press, BocaRaton, Florida.
Raabe, E. A., and R. P. Stumpf. 1997. Image processing methods. Re-port 97–28. U.S. Geological Survey, St. Petersburg, Florida.
Rogers, C.S. 1985. Degradation of Caribbean and western Atlanticcoral reefs and decline of associated fisheries. Proceedings of theInternational Coral Reef Symposium
5:
491–496.
Shinn, E. A., G. W. Smith, J. P. Prospero, P. Beltzer, M. L. Hayes, V. Gar-rison, and R. T. Barber. 2000. African dust and the demise of Carib-bean coral reefs. Geophysical Research Letters
27:
3029–3032.Smith, R. C., and K. S. Baker, 1978. The bio-optical state of ocean
waters and remote sensing. Limnology and Oceanography
23:
247–259.Sokal, R. R., and F. J. Rohlf. 1995. Biometry. W. H. Freeman, New
York.Tomascik, T., and F. Sander. 1987. Effects of eutrophication on reef-
building corals. II. Structure of scleractinian coral communities onfringing reefs, Barbados, West Indies. Marine Biology
94:
3–75.


