Embed Size (px)
Citation preview
Volume 38, Number 10, October 2013
Posted online in April 2014
Cleveland (Aleutian Isl.) Dome growth and destruction during 2012-2013
Karymsky (Kamchatka) Seismicity and ash plumes, September 2010-December 2013
Alaid (Kuril Isl.) Minor ash plumes on 17 and 23 October and 8 November 2012
Rabaul (Papua New Guinea) Variable but often modest eruptions during mid-2011 through 2013
Apoyeque (Nicaragua) Seismic swarms in 2009 and 2012
Cerro Negro (Nicaragua) Seismic swarm in 2013
Barren Island (India) Ash plume drifted up to 220 km SW in February 2013
---------------------------------------------------
Editors: Rick Wunderman, Julie Herrick, Sally Kuhn Sennert, and Benjamin Andrews
Volunteer Staff: Angus R. Chen, Bruce Millar, Melissa Naugle, Robert Andrews, Paul S.
Berger, Kenneth Brown, and Jacquelyn Gluck
Global Volcanism Program, National Museum of Natural History, Room E-421, PO Box 37012,
Washington, DC 20013-7012 USA; Telephone: (202) 633-1800; Fax: (202) 357-2476; Email:
[email protected]; URL: http://www.volcano.si.edu/
Cleveland
Aleutian Islands
52.825°N, 169.944°W; summit elev. 1,730 m
All times are local (= UTC - 8 hours)
Dome growth and destruction during 2012-2013
In the previous Bulletin report (BGVN 37:01) we discussed a cycle of lava-dome growth
within the summit crater from late 2011 through early 2012. That cycle of extrusion and
destruction of domes continued into 2013. The lava dome observed on 30 January 2013 persisted
to the end of this reporting period, September 2013. The dynamic conditions at Cleveland caused
the Alaska Volcano Observatory (AVO) to report numerous changes in the Aviation Color Code
and Alert Level, fluctuating between Yellow/Advisory and Orange/Watch throughout this time
period (table 1).
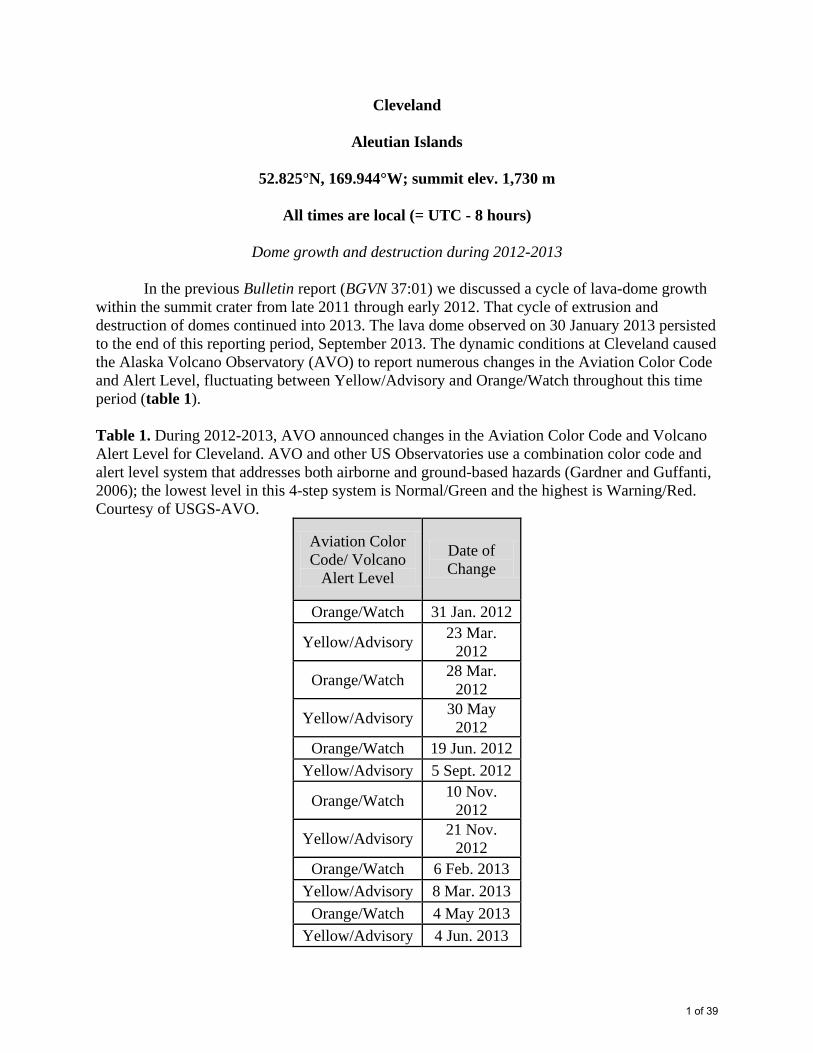
Table 1. During 2012-2013, AVO announced changes in the Aviation Color Code and Volcano
Alert Level for Cleveland. AVO and other US Observatories use a combination color code and
alert level system that addresses both airborne and ground-based hazards (Gardner and Guffanti,
2006); the lowest level in this 4-step system is Normal/Green and the highest is Warning/Red.
Courtesy of USGS-AVO.
Aviation Color
Code/ Volcano
Alert Level
Date of
Change
Orange/Watch 31 Jan. 2012
Yellow/Advisory 23 Mar.
2012
Orange/Watch 28 Mar.
2012
Yellow/Advisory 30 May
2012
Orange/Watch 19 Jun. 2012
Yellow/Advisory 5 Sept. 2012
Orange/Watch 10 Nov.
2012
Yellow/Advisory 21 Nov.
2012
Orange/Watch 6 Feb. 2013
Yellow/Advisory 8 Mar. 2013
Orange/Watch 4 May 2013
Yellow/Advisory 4 Jun. 2013
1 of 39
Continued explosions during 2012-2013. Cleveland has a history of frequent, minor ash
emissions particularly during 2005-2009 (McGimsey and others, 2007; Neal and others, 2011)
and with more frequency during 2011-2013 (Guffanti and Miller, 2013; De Angelis and others,
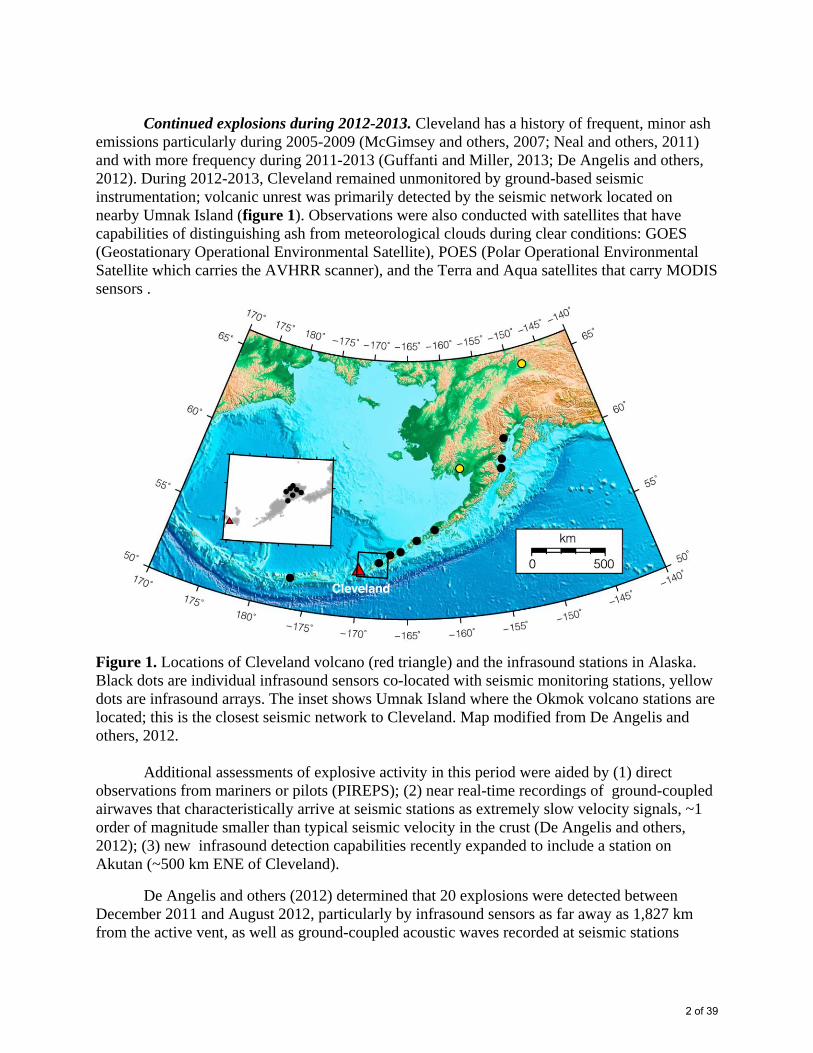
2012). During 2012-2013, Cleveland remained unmonitored by ground-based seismic
instrumentation; volcanic unrest was primarily detected by the seismic network located on
nearby Umnak Island (figure 1). Observations were also conducted with satellites that have
capabilities of distinguishing ash from meteorological clouds during clear conditions: GOES
(Geostationary Operational Environmental Satellite), POES (Polar Operational Environmental
Satellite which carries the AVHRR scanner), and the Terra and Aqua satellites that carry MODIS
sensors .
Figure 1. Locations of Cleveland volcano (red triangle) and the infrasound stations in Alaska.
Black dots are individual infrasound sensors co-located with seismic monitoring stations, yellow
dots are infrasound arrays. The inset shows Umnak Island where the Okmok volcano stations are
located; this is the closest seismic network to Cleveland. Map modified from De Angelis and
others, 2012.
Additional assessments of explosive activity in this period were aided by (1) direct
observations from mariners or pilots (PIREPS); (2) near real-time recordings of ground-coupled
airwaves that characteristically arrive at seismic stations as extremely slow velocity signals, ~1
order of magnitude smaller than typical seismic velocity in the crust (De Angelis and others,
2012); (3) new infrasound detection capabilities recently expanded to include a station on
Akutan (~500 km ENE of Cleveland).
De Angelis and others (2012) determined that 20 explosions were detected between
December 2011 and August 2012, particularly by infrasound sensors as far away as 1,827 km
from the active vent, as well as ground-coupled acoustic waves recorded at seismic stations
2 of 39
across the Aleutian Arc. By retrospectively examining the record of airwaves from Cleveland,
those authors determined that many explosions had gone unnoticed in satellite images, likely
because of poor weather conditions that obscured the signal or because these explosions were
brief, small, and lofted little ash.
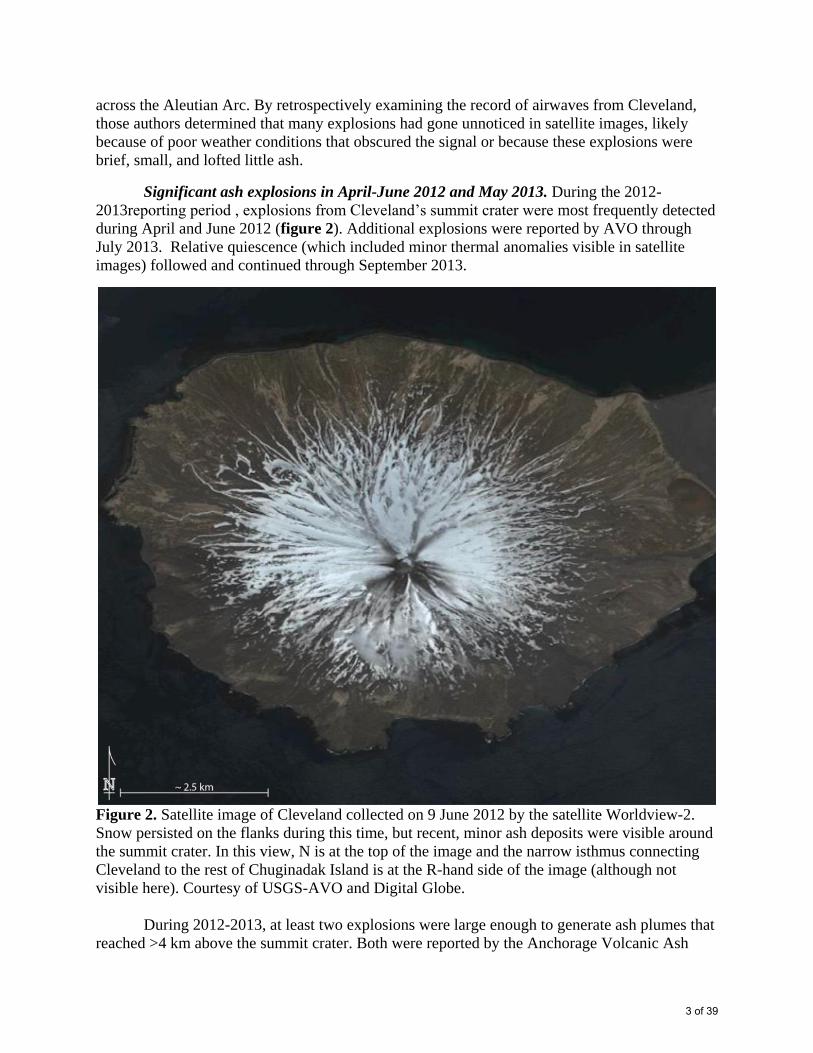
Significant ash explosions in April-June 2012 and May 2013. During the 2012-
2013reporting period , explosions from Cleveland’s summit crater were most frequently detected
during April and June 2012 (figure 2). Additional explosions were reported by AVO through
July 2013. Relative quiescence (which included minor thermal anomalies visible in satellite
images) followed and continued through September 2013.
Figure 2. Satellite image of Cleveland collected on 9 June 2012 by the satellite Worldview-2.
Snow persisted on the flanks during this time, but recent, minor ash deposits were visible around
the summit crater. In this view, N is at the top of the image and the narrow isthmus connecting
Cleveland to the rest of Chuginadak Island is at the R-hand side of the image (although not
visible here). Courtesy of USGS-AVO and Digital Globe.
During 2012-2013, at least two explosions were large enough to generate ash plumes that
reached >4 km above the summit crater. Both were reported by the Anchorage Volcanic Ash
3 of 39
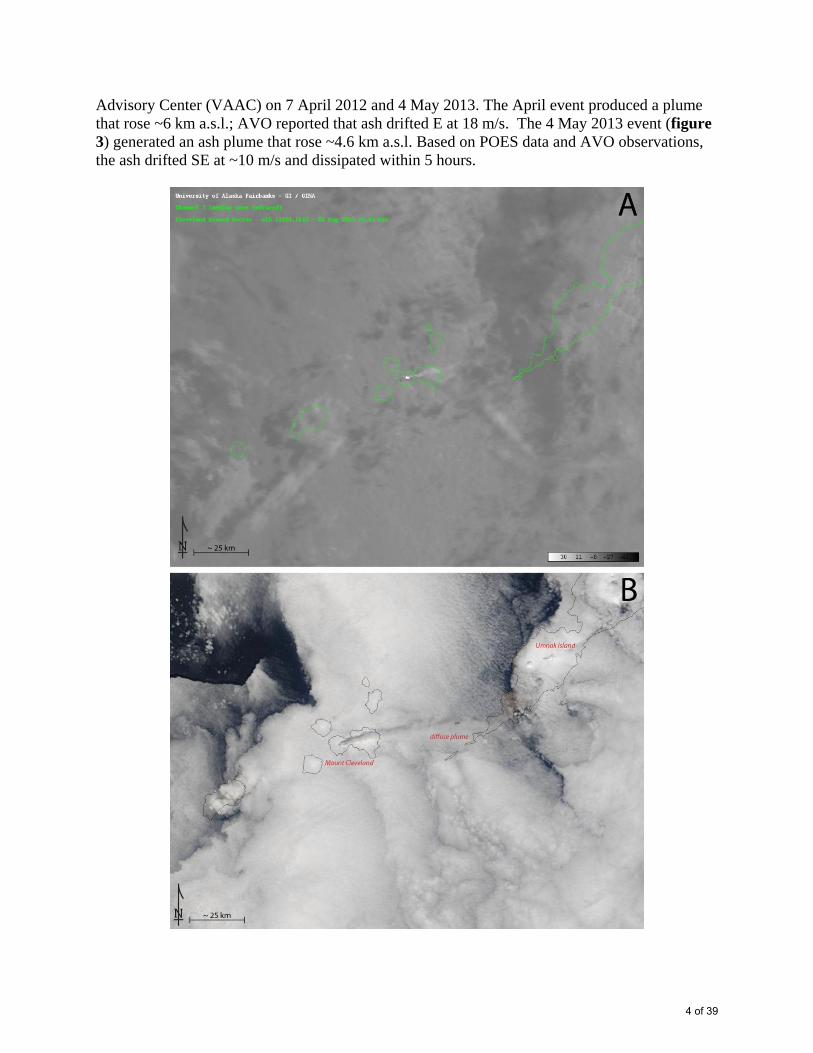
Advisory Center (VAAC) on 7 April 2012 and 4 May 2013. The April event produced a plume
that rose ~6 km a.s.l.; AVO reported that ash drifted E at 18 m/s. The 4 May 2013 event (figure
3) generated an ash plume that rose ~4.6 km a.s.l. Based on POES data and AVO observations,
the ash drifted SE at ~10 m/s and dissipated within 5 hours.
4 of 39
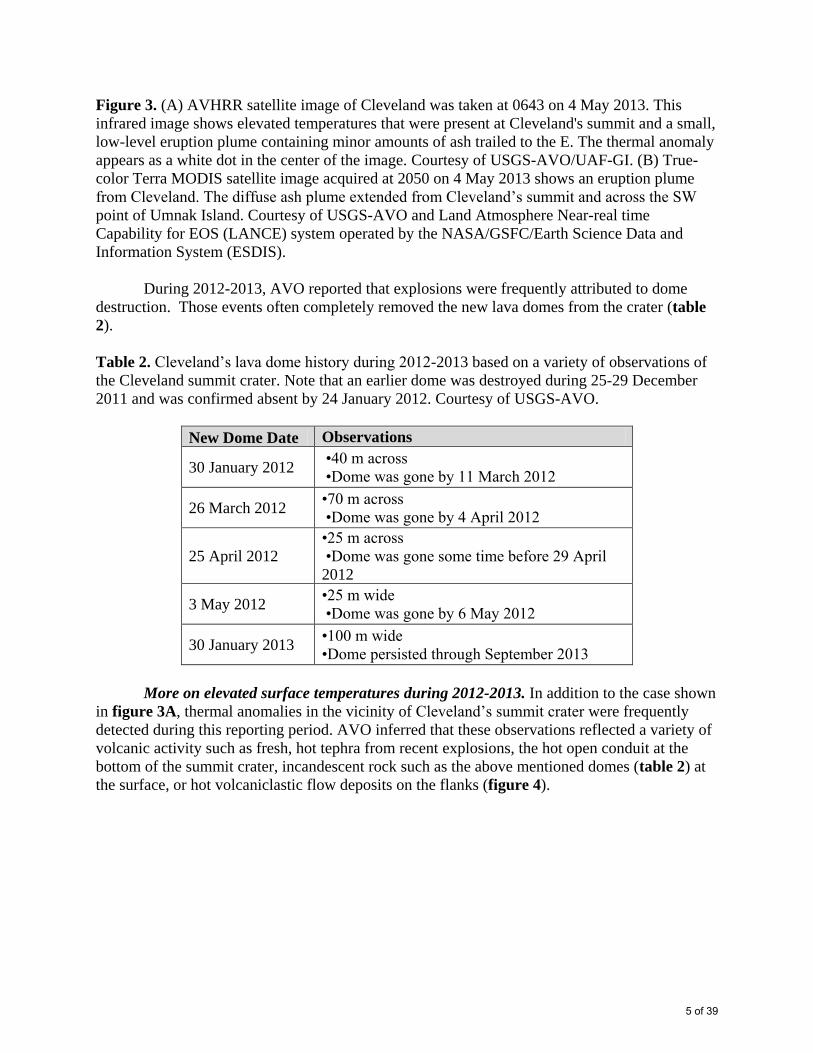
Figure 3. (A) AVHRR satellite image of Cleveland was taken at 0643 on 4 May 2013. This
infrared image shows elevated temperatures that were present at Cleveland's summit and a small,
low-level eruption plume containing minor amounts of ash trailed to the E. The thermal anomaly
appears as a white dot in the center of the image. Courtesy of USGS-AVO/UAF-GI. (B) True-
color Terra MODIS satellite image acquired at 2050 on 4 May 2013 shows an eruption plume
from Cleveland. The diffuse ash plume extended from Cleveland’s summit and across the SW
point of Umnak Island. Courtesy of USGS-AVO and Land Atmosphere Near-real time
Capability for EOS (LANCE) system operated by the NASA/GSFC/Earth Science Data and
Information System (ESDIS).
During 2012-2013, AVO reported that explosions were frequently attributed to dome
destruction. Those events often completely removed the new lava domes from the crater (table
2).
Table 2. Cleveland’s lava dome history during 2012-2013 based on a variety of observations of
the Cleveland summit crater. Note that an earlier dome was destroyed during 25-29 December
2011 and was confirmed absent by 24 January 2012. Courtesy of USGS-AVO.
New Dome Date Observations
30 January 2012 •40 m across
•Dome was gone by 11 March 2012
26 March 2012 •70 m across
•Dome was gone by 4 April 2012
25 April 2012
•25 m across
•Dome was gone some time before 29 April
2012
3 May 2012 •25 m wide
•Dome was gone by 6 May 2012
30 January 2013 •100 m wide
•Dome persisted through September 2013
More on elevated surface temperatures during 2012-2013. In addition to the case shown
in figure 3A, thermal anomalies in the vicinity of Cleveland’s summit crater were frequently
detected during this reporting period. AVO inferred that these observations reflected a variety of
volcanic activity such as fresh, hot tephra from recent explosions, the hot open conduit at the
bottom of the summit crater, incandescent rock such as the above mentioned domes (table 2) at
the surface, or hot volcaniclastic flow deposits on the flanks (figure 4).
5 of 39
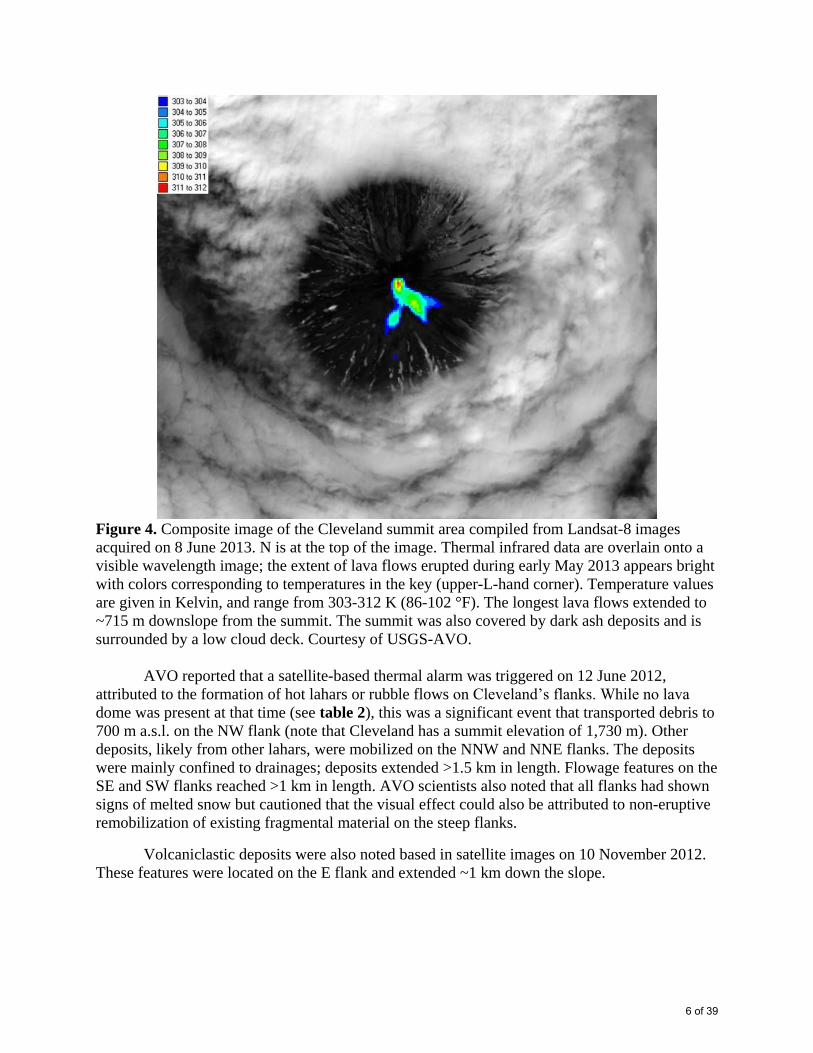
Figure 4. Composite image of the Cleveland summit area compiled from Landsat-8 images
acquired on 8 June 2013. N is at the top of the image. Thermal infrared data are overlain onto a
visible wavelength image; the extent of lava flows erupted during early May 2013 appears bright
with colors corresponding to temperatures in the key (upper-L-hand corner). Temperature values
are given in Kelvin, and range from 303-312 K (86-102 °F). The longest lava flows extended to
~715 m downslope from the summit. The summit was also covered by dark ash deposits and is
surrounded by a low cloud deck. Courtesy of USGS-AVO.
AVO reported that a satellite-based thermal alarm was triggered on 12 June 2012,
attributed to the formation of hot lahars or rubble flows on Cleveland’s flanks. While no lava
dome was present at that time (see table 2), this was a significant event that transported debris to
700 m a.s.l. on the NW flank (note that Cleveland has a summit elevation of 1,730 m). Other
deposits, likely from other lahars, were mobilized on the NNW and NNE flanks. The deposits
were mainly confined to drainages; deposits extended >1.5 km in length. Flowage features on the
SE and SW flanks reached >1 km in length. AVO scientists also noted that all flanks had shown
signs of melted snow but cautioned that the visual effect could also be attributed to non-eruptive
remobilization of existing fragmental material on the steep flanks.
Volcaniclastic deposits were also noted based in satellite images on 10 November 2012.
These features were located on the E flank and extended ~1 km down the slope.
6 of 39
References: De Angelis, S., Fee, D., Haney, M., and Schneider, D., 2012. Detecting
hidden volcanic explosions from Mt. Cleveland Volcano, Alaska with infrasound and ground-
coupled airwaves, Geophysical Research Letters, 39, L21312, doi:10.1029/2012GL053635.
Gardner, C.A. and Guffanti, M.C., 2006. U.S. Geological Survey’s Alert Notification
System for Volcanic Activity, USGS Fact Sheet 2006-3139.
Guffanti, M., and Miller, T., 2013. A volcanic activity alert-level system for aviation:
review of its development and application in Alaska: Natural Hazards, 15 p., doi:0.1007/s11069-
013-0761-4.
McGimsey, R.G., Neal, C.A., Dixon, J.P., and Ushakov, Sergey, 2007. 2005 Volcanic
activity in Alaska, Kamchatka, and the Kurile Islands: Summary of events and response of the
Alaska Volcano Observatory: U.S. Geological Survey Scientific Investigations Report 2007-
5269, 94 p., available at http://pubs.usgs.gov/sir/2007/5269/ .
Neal, C.A., McGimsey, R.G., Dixon, J.P., Cameron, C.E., Nuzhaev, A.A., and Chibisova,
Marina, 2011. 2008 Volcanic activity in Alaska, Kamchatka, and the Kurile Islands: Summary of
events and response of the Alaska Volcano Observatory: U.S. Geological Survey Scientific
Investigations Report 2010-5243, 94 p., available at http://pubs.usgs.gov/sir/2010/5243 .
Geologic Summary. Beautifully symmetrical Mount Cleveland stratovolcano is situated
at the western end of the uninhabited, dumbbell-shaped Chuginadak Island. It lies SE across
Carlisle Pass strait from Carlisle volcano and NE across Chuginadak Pass strait from Herbert
volcano. Cleveland is joined to the rest of Chuginadak Island by a low isthmus. The 1,730-m-
high Mount Cleveland is the highest of the Islands of the Four Mountains group and is one of the
most active of the Aleutian Islands. The native name for Mount Cleveland, Chuginadak, refers to
the Aleut goddess of fire, who was thought to reside on the volcano. Numerous large lava flows
descend the steep-sided flanks of the volcano. It is possible that some 18th-to-19th century
eruptions attributed to Carlisle should be ascribed to Cleveland (Miller et al., 1998). In 1944
Cleveland produced the only known fatality from an Aleutian eruption. Recent eruptions from
Mount Cleveland have been characterized by short-lived explosive ash emissions, at times
accompanied by lava fountaining and lava flows down the flanks.
Information Contacts: Alaska Volcano Observatory (AVO), a cooperative program of a)
U.S. Geological Survey, 4200 University Drive, Anchorage, AK 99508-4667, USA (URL:
http://www.avo.alaska.edu/ ), b) Geophysical Institute, University of Alaska, PO Box 757320,
Fairbanks, AK 99775-7320, USA (URL: http://www.gi.alaska.edu/ ), and c) Alaska Division of
Geological & Geophysical Surveys, 794 University Ave., Suite 200, Fairbanks, AK 99709, USA
(URL: http://www.dggs.alaska.gov/ ); and Anchorage Volcanic Ash Advisory Center (VAAC),
6930 Sand Lake Road, Anchorage, AK 99502, USA (URL:
http://vaac.arh.noaa.gov/list_vaas.php ).
7 of 39
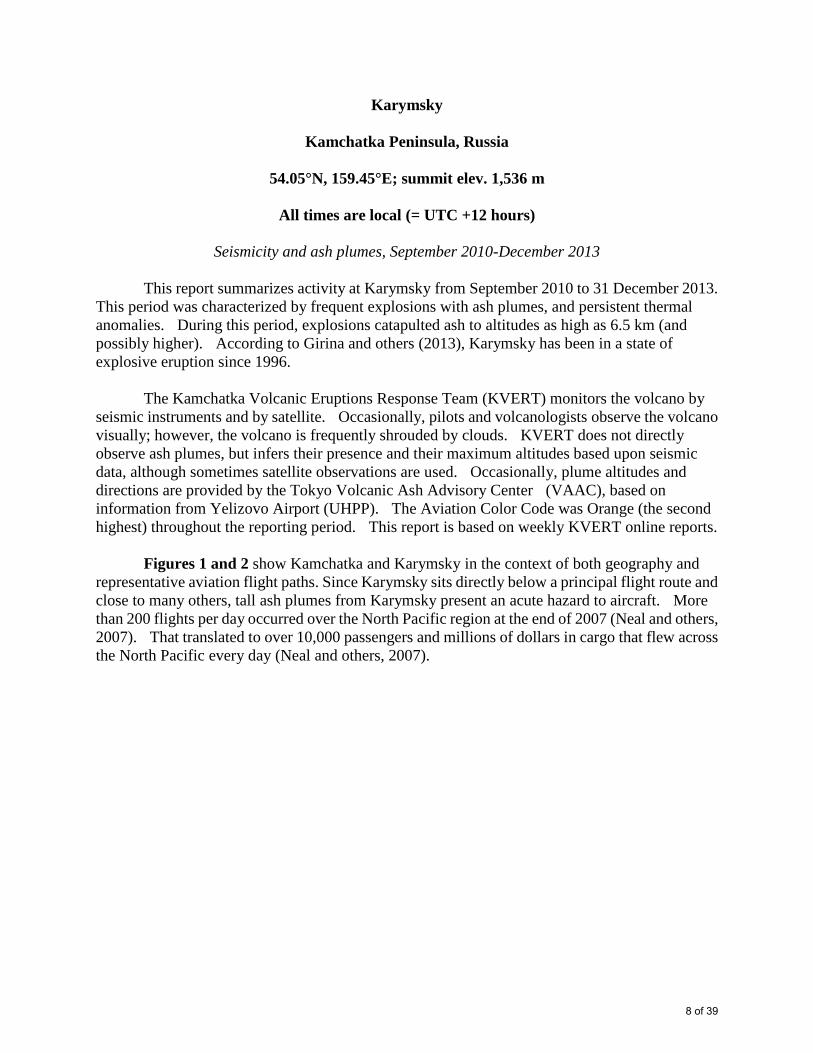
Karymsky
Kamchatka Peninsula, Russia
54.05°N, 159.45°E; summit elev. 1,536 m
All times are local (= UTC +12 hours)
Seismicity and ash plumes, September 2010-December 2013
This report summarizes activity at Karymsky from September 2010 to 31 December 2013.
This period was characterized by frequent explosions with ash plumes, and persistent thermal
anomalies. During this period, explosions catapulted ash to altitudes as high as 6.5 km (and
possibly higher). According to Girina and others (2013), Karymsky has been in a state of
explosive eruption since 1996.
The Kamchatka Volcanic Eruptions Response Team (KVERT) monitors the volcano by
seismic instruments and by satellite. Occasionally, pilots and volcanologists observe the volcano
visually; however, the volcano is frequently shrouded by clouds. KVERT does not directly
observe ash plumes, but infers their presence and their maximum altitudes based upon seismic
data, although sometimes satellite observations are used. Occasionally, plume altitudes and
directions are provided by the Tokyo Volcanic Ash Advisory Center (VAAC), based on
information from Yelizovo Airport (UHPP). The Aviation Color Code was Orange (the second
highest) throughout the reporting period. This report is based on weekly KVERT online reports.
Figures 1 and 2 show Kamchatka and Karymsky in the context of both geography and
representative aviation flight paths. Since Karymsky sits directly below a principal flight route and
close to many others, tall ash plumes from Karymsky present an acute hazard to aircraft. More
than 200 flights per day occurred over the North Pacific region at the end of 2007 (Neal and others,
2007). That translated to over 10,000 passengers and millions of dollars in cargo that flew across
the North Pacific every day (Neal and others, 2007).
8 of 39
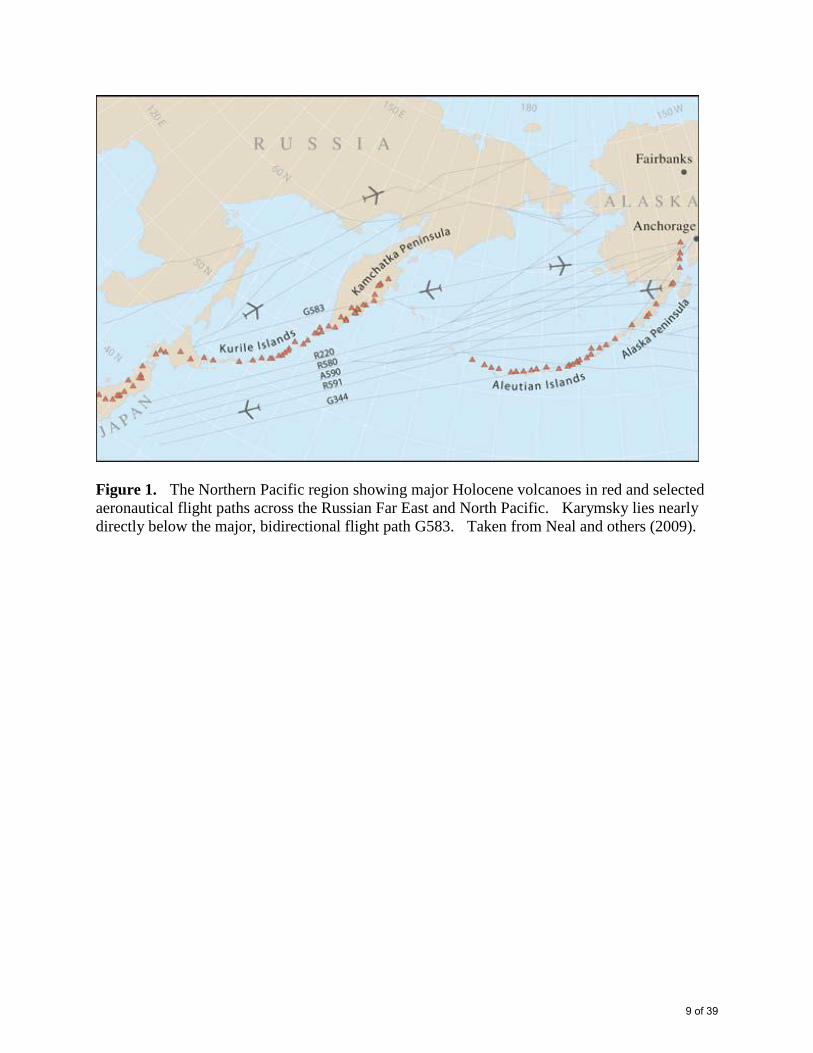
Figure 1. The Northern Pacific region showing major Holocene volcanoes in red and selected
aeronautical flight paths across the Russian Far East and North Pacific. Karymsky lies nearly
directly below the major, bidirectional flight path G583. Taken from Neal and others (2009).
9 of 39
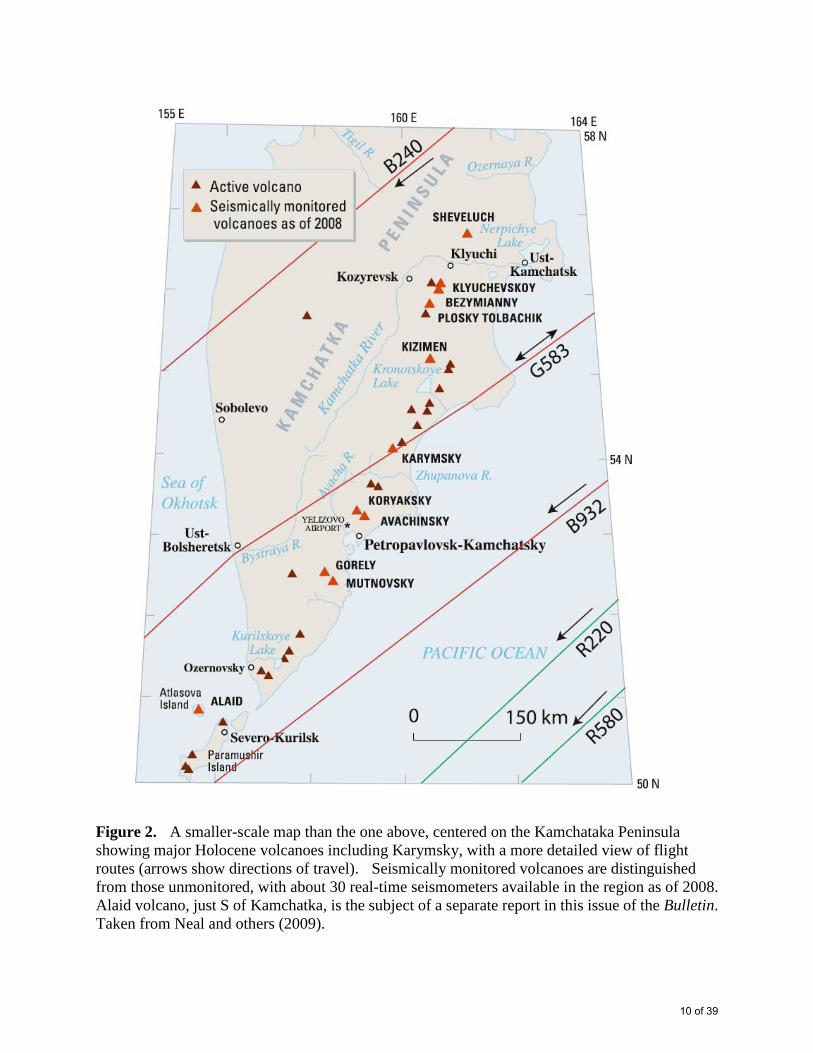
Figure 2. A smaller-scale map than the one above, centered on the Kamchataka Peninsula
showing major Holocene volcanoes including Karymsky, with a more detailed view of flight
routes (arrows show directions of travel). Seismically monitored volcanoes are distinguished
from those unmonitored, with about 30 real-time seismometers available in the region as of 2008.
Alaid volcano, just S of Kamchatka, is the subject of a separate report in this issue of the Bulletin.
Taken from Neal and others (2009).
10 of 39
September 2010-December 2012 activity. During September 2010-December 2010,
KVERT weekly reports stated that seismic activity was at or above background levels. During
January 2011-December 2012, most reports characterized the seismic activity as moderate.
However, KVERT stated that activity was weak and moderate between 23 August-20 September
2012, during the week before 25 October 2012, and during all of December 2012. Activity was
weak during the first week of July 2012.
According to KVERT, one or more ash explosions occurred weekly, and ash plumes rose
to altitudes of 2-6.5 km, with most weekly values in the altitude range of 2.5-5 km. Explosive
activity apparently weakened slightly during April and May 2012, with plume altitudes decreasing
to 1.8-2.5 km, and apparently weakened further between mid-July and mid-August 2012, when
KVERT did not report any ash plumes.
Figure 3 shows an image captured the MODIS instrument during May 2011. A plume is
discernable to the edge of the image, ~140 km ESE. Radiating from the volcano is a pattern of
recent ash fall deposits contrasting with broad snow cover.
11 of 39
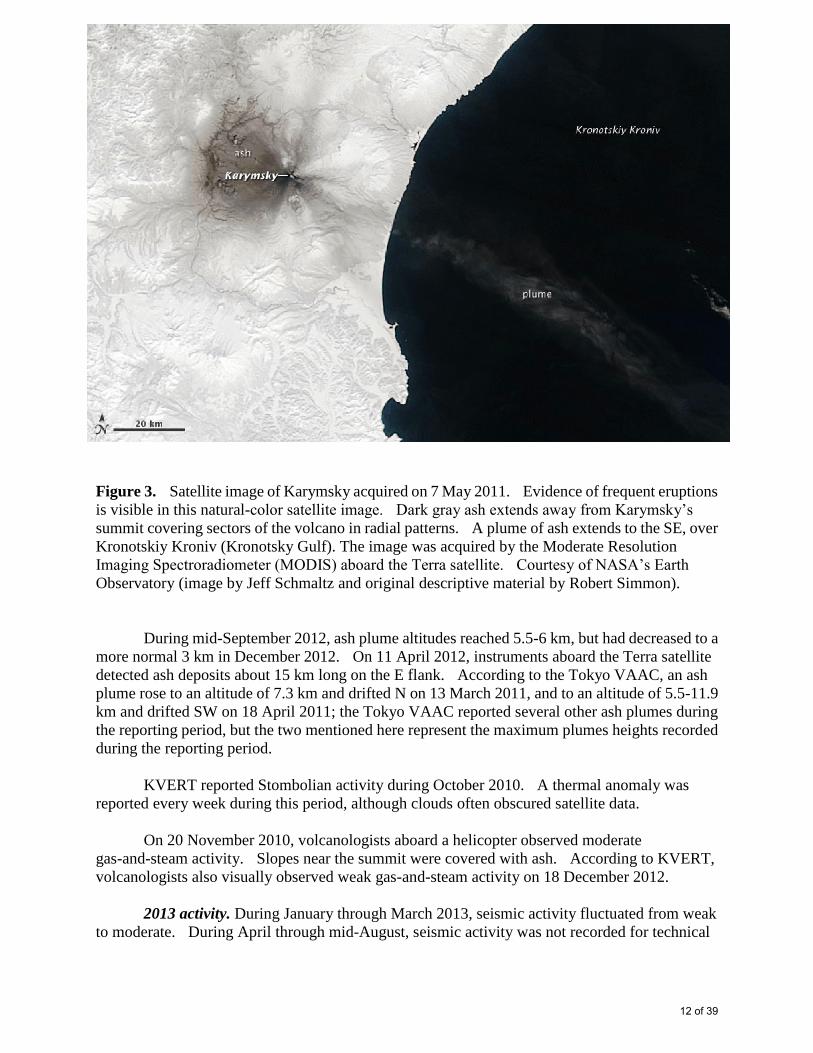
Figure 3. Satellite image of Karymsky acquired on 7 May 2011. Evidence of frequent eruptions
is visible in this natural-color satellite image. Dark gray ash extends away from Karymsky’s
summit covering sectors of the volcano in radial patterns. A plume of ash extends to the SE, over
Kronotskiy Kroniv (Kronotsky Gulf). The image was acquired by the Moderate Resolution
Imaging Spectroradiometer (MODIS) aboard the Terra satellite. Courtesy of NASA’s Earth
Observatory (image by Jeff Schmaltz and original descriptive material by Robert Simmon).
During mid-September 2012, ash plume altitudes reached 5.5-6 km, but had decreased to a
more normal 3 km in December 2012. On 11 April 2012, instruments aboard the Terra satellite
detected ash deposits about 15 km long on the E flank. According to the Tokyo VAAC, an ash
plume rose to an altitude of 7.3 km and drifted N on 13 March 2011, and to an altitude of 5.5-11.9
km and drifted SW on 18 April 2011; the Tokyo VAAC reported several other ash plumes during
the reporting period, but the two mentioned here represent the maximum plumes heights recorded
during the reporting period.
KVERT reported Stombolian activity during October 2010. A thermal anomaly was
reported every week during this period, although clouds often obscured satellite data.
On 20 November 2010, volcanologists aboard a helicopter observed moderate
gas-and-steam activity. Slopes near the summit were covered with ash. According to KVERT,
volcanologists also visually observed weak gas-and-steam activity on 18 December 2012.
2013 activity. During January through March 2013, seismic activity fluctuated from weak
to moderate. During April through mid-August, seismic activity was not recorded for technical
12 of 39
reasons. From mid-August through the end of 2013, activity was moderate. When satellite data
was included in 2013 KVERT weekly reports (6, 14 March; 11, 18 July; 5, 12, 19 September; 3
October), the volcano was either quiet or obscured by clouds.
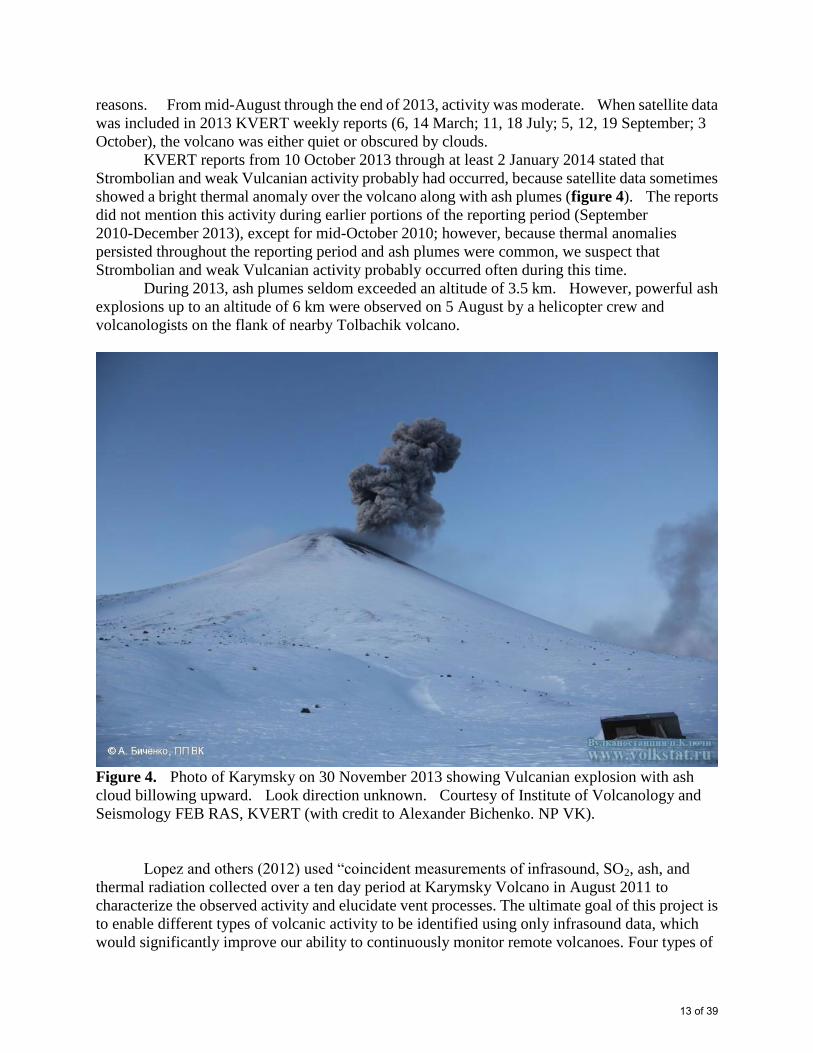
KVERT reports from 10 October 2013 through at least 2 January 2014 stated that
Strombolian and weak Vulcanian activity probably had occurred, because satellite data sometimes
showed a bright thermal anomaly over the volcano along with ash plumes (figure 4). The reports
did not mention this activity during earlier portions of the reporting period (September
2010-December 2013), except for mid-October 2010; however, because thermal anomalies
persisted throughout the reporting period and ash plumes were common, we suspect that
Strombolian and weak Vulcanian activity probably occurred often during this time.
During 2013, ash plumes seldom exceeded an altitude of 3.5 km. However, powerful ash
explosions up to an altitude of 6 km were observed on 5 August by a helicopter crew and
volcanologists on the flank of nearby Tolbachik volcano.
Figure 4. Photo of Karymsky on 30 November 2013 showing Vulcanian explosion with ash
cloud billowing upward. Look direction unknown. Courtesy of Institute of Volcanology and
Seismology FEB RAS, KVERT (with credit to Alexander Bichenko. NP VK).
Lopez and others (2012) used “coincident measurements of infrasound, SO2, ash, and
thermal radiation collected over a ten day period at Karymsky Volcano in August 2011 to
characterize the observed activity and elucidate vent processes. The ultimate goal of this project is
to enable different types of volcanic activity to be identified using only infrasound data, which
would significantly improve our ability to continuously monitor remote volcanoes. Four types of
13 of 39
activity were observed. Type 1 activity is characterized by discrete ash emissions occurring every
1- 5 minutes that either jet or roil out of the vent, by plumes from 500-1500 m (above vent)
altitudes, and by impulsive infrasonic onsets. Type 2 activity is characterized by periodic pulses of
gas emission, little or no ash, low altitude (100 - 200 m) plumes, and strong audible jetting or
roaring. Type 3 activity is characterized by sustained emissions of ash and gas, with multiple
pulses lasting from ~1-3 minutes, and by plumes from 300-1500 m. Type 4 activity is
characterized by periods of relatively long duration (~30 minutes to >1 hour) quiescence, no
visible plume and weak SO2 emissions at or near the detection limit, followed by an explosive,
magmatic eruption, producing ash-rich plumes to >2000 m, and centimeter to meter (or greater)
sized pyroclastic bombs that roll down the flanks of the edifice. Eruption onset is accompanied by
high-amplitude infrasound and occasionally visible shock-waves, indicating high vent
overpressure.”
The above meeting abstract ultimately led to the paper Lopez and others (2013). In the
abstract for that work, the authors characterized the four types of activity as: (1) ash explosions, (2)
pulsatory degassing, (3) gas jetting, and (4) explosive eruption.
Ongoing eruptions, often on a near daily basis, prevailed during January-March 2014, with
thermal anomalies on satellite data, ash plumes hundreds of meters over the ~1.5 km summit’s
elevation. The plumes were visible in imagery for over 100 km downwind (often in the sector
NE-E-SE).
References: Girina, O., Manevich, A., Melnikov, D., Nuzhdaev, A., Demyanchuk, Y.,
and Petrova, E., 2013, Explosive Eruptions of Kamchatkan Volcanoes in 2012 and Danger to
Aviation, Geophysical Research Abstracts, Vol. 15, EGU General Assembly 2013 held 7-12
April, 2013 in Vienna, Austria, id. EGU2013-6760.
Lopez, T., Fee, D, and Prata, F., 2012, Characterization of volcanic activity using
observations of infrasound, volcanic emissions, and thermal imagery at Karymsky Volcano,
Kamchatka, Russia,
Geophysical Research Abstracts, Vol. 14, EGU General Assembly 2012, held 22-27 April, 2012
in Vienna, Austria., p.13076.
Lopez, T., D. Fee, F. Prata, and J. Dehn, 2013, Characterization and interpretation of
volcanic activity at Karymsky Volcano, Kamchatka, Russia, using observations of infrasound,
volcanic emissions, and thermal imagery, Geochem. Geophys. Geosyst., 14, 5106–5127,
doi:10.1002/2013GC004817
Neal C, Girina O, Senyukov S, Rybin A, Osiensky J, Izbekov P, Ferguson G, 2009,
Russian eruption warning systems for aviation. Natural Hazards, 51(2), p. 245-262
Neal, C, Girina, O, Senyukov, S, Rybin, A, Osiensky, J, Hall, T, Nelson, K, and Izbekov, P,
2007, Eruption Warning Systems for Aviation in Russia: A 2007 Status Report, World
Meteorological Organization (WMO), in close collaboration with the International Civil Aviation
Organization (ICAO) and the Civil Aviation Authority Of New Zealand, paper at the Fourth
International Workshop On Volcanic Ash, Rotorua, New Zealand, 26-30 March 2007 [VAWS/4
14 of 39
WP/03-01] (URL:
http://www.caem.wmo.int/moodle/file.php?file=/1/VWS/6_VAWS4WP0301_1_.pdf )
Geologic Summary. Karymsky, the most active volcano of Kamchatka's eastern volcanic
zone, is a symmetrical stratovolcano constructed within a 5-km-wide caldera that formed during
the early Holocene. The caldera cuts the south side of the Pleistocene Dvor volcano and is located
outside the north margin of the large mid-Pleistocene Polovinka caldera, which contains the
smaller Akademia Nauk and Odnoboky calderas. Most seismicity preceding Karymsky eruptions
originated beneath Akademia Nauk caldera, which is located immediately south of Karymsky
volcano. The caldera enclosing Karymsky volcano formed about 7600-7700 radiocarbon years
ago; construction of the Karymsky stratovolcano began about 2000 years later. The latest eruptive
period began about 500 years ago, following a 2300-year quiescence. Much of the cone is mantled
by lava flows less than 200 years old. Historical eruptions have been vulcanian or
vulcanian-strombolian with moderate explosive activity and occasional lava flows from the
summit crater.
Information Contacts: Kamchatka Volcanic Eruptions Response Team (KVERT), Far
East Division, Russian Academy of Sciences, 9 Piip Blvd., Petropavlovsk-Kamchatsky, 683006,
Russia (Email: [email protected], URL: http://www.kscnet.ru/ivs/); Tokyo Volcanic Ash Advisory
Center (VAAC), Tokyo, Japan (URL: http://ds.data.jma.go.jp/svd/vaac/data/); Kamchatka Branch
of Geophysical Survey of RAS (KB GS RAS)(URL:
ftp://hazards.cr.usgs.gov/LAHR/iaspei/europe/russia/russia_four/gs_ras.htm); Jeff Schmaltz and
Robert Simmon, NASA Earth Observatory (URL: http://earthobservatory.nasa.gov).
15 of 39

Alaid
Kuril Islands, Russia
50.858°N, 155.55°E; summit elev. 2339 m
All times are local (= UTC +11 hours)
Minor ash plumes on 17 and 23 October and 8 November 2012
Our previous report noted weak seismicity from Alaid during November 2003, although
seismologists determined it was not related to volcanic activity (BGVN 28:11). This report discusses
activity from December 2003 to January 2014. Emissions were observed in May 2010 and October 2012,
but ash was not detected in the plumes until 23 October 2012. The last thermal anomaly was detected in
December 2012.
Alaid volcano is located on Atlasova island off the southern tip of Russia’s Kamchatka peninsula
and represents the northernmost Holocene volcano in the Kuril Islands (figures 1 and 2). Other names for
the volcano and island include Araido, Atlasova, Oyakoba, and Uyakhuzhach (Ukviggen, 2013). Despite
the islands small size, its summit (2,339 m elevation) is the highest in the Kuriles. The volcano also plays
a large and colorful role in the region’s folklore (Ukviggen, 2013; Svalova, 1999).
16 of 39
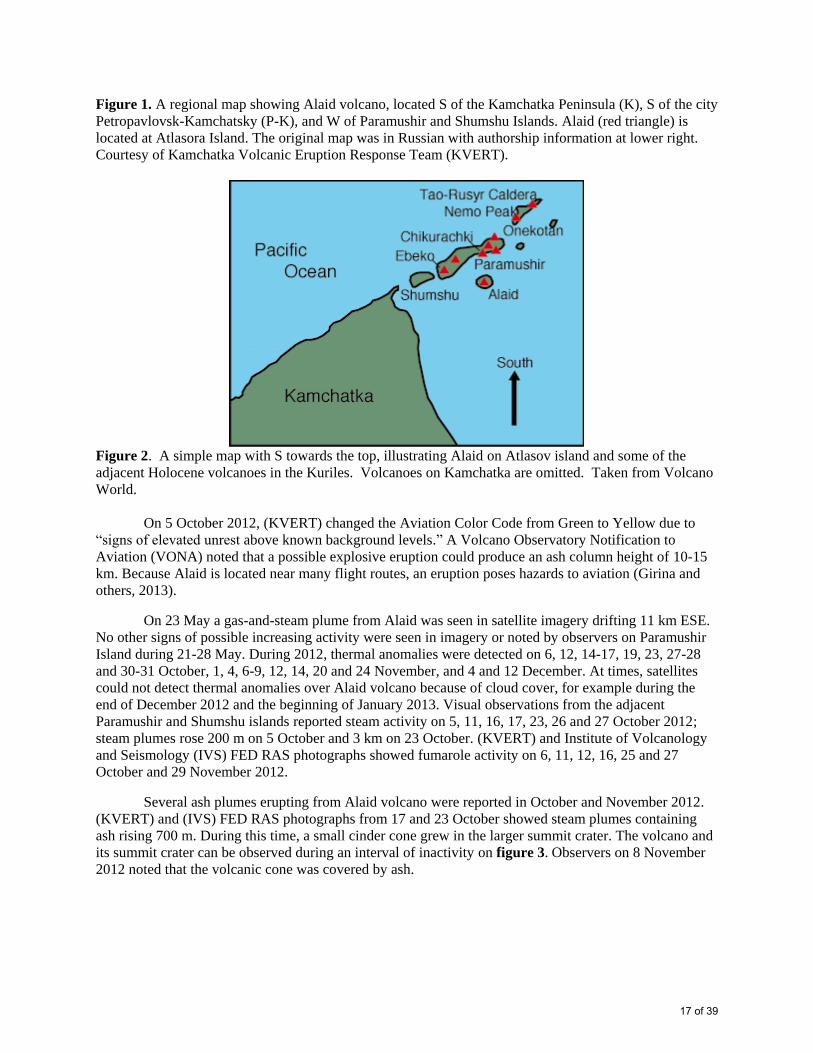
Figure 1. A regional map showing Alaid volcano, located S of the Kamchatka Peninsula (K), S of the city
Petropavlovsk-Kamchatsky (P-K), and W of Paramushir and Shumshu Islands. Alaid (red triangle) is
located at Atlasora Island. The original map was in Russian with authorship information at lower right.
Courtesy of Kamchatka Volcanic Eruption Response Team (KVERT).
Figure 2. A simple map with S towards the top, illustrating Alaid on Atlasov island and some of the
adjacent Holocene volcanoes in the Kuriles. Volcanoes on Kamchatka are omitted. Taken from Volcano
World.
On 5 October 2012, (KVERT) changed the Aviation Color Code from Green to Yellow due to
“signs of elevated unrest above known background levels.” A Volcano Observatory Notification to
Aviation (VONA) noted that a possible explosive eruption could produce an ash column height of 10-15
km. Because Alaid is located near many flight routes, an eruption poses hazards to aviation (Girina and
others, 2013).
On 23 May a gas-and-steam plume from Alaid was seen in satellite imagery drifting 11 km ESE.
No other signs of possible increasing activity were seen in imagery or noted by observers on Paramushir
Island during 21-28 May. During 2012, thermal anomalies were detected on 6, 12, 14-17, 19, 23, 27-28
and 30-31 October, 1, 4, 6-9, 12, 14, 20 and 24 November, and 4 and 12 December. At times, satellites
could not detect thermal anomalies over Alaid volcano because of cloud cover, for example during the
end of December 2012 and the beginning of January 2013. Visual observations from the adjacent
Paramushir and Shumshu islands reported steam activity on 5, 11, 16, 17, 23, 26 and 27 October 2012;
steam plumes rose 200 m on 5 October and 3 km on 23 October. (KVERT) and Institute of Volcanology
and Seismology (IVS) FED RAS photographs showed fumarole activity on 6, 11, 12, 16, 25 and 27
October and 29 November 2012.
Several ash plumes erupting from Alaid volcano were reported in October and November 2012.
(KVERT) and (IVS) FED RAS photographs from 17 and 23 October showed steam plumes containing
ash rising 700 m. During this time, a small cinder cone grew in the larger summit crater. The volcano and
its summit crater can be observed during an interval of inactivity on figure 3. Observers on 8 November
2012 noted that the volcanic cone was covered by ash.
17 of 39
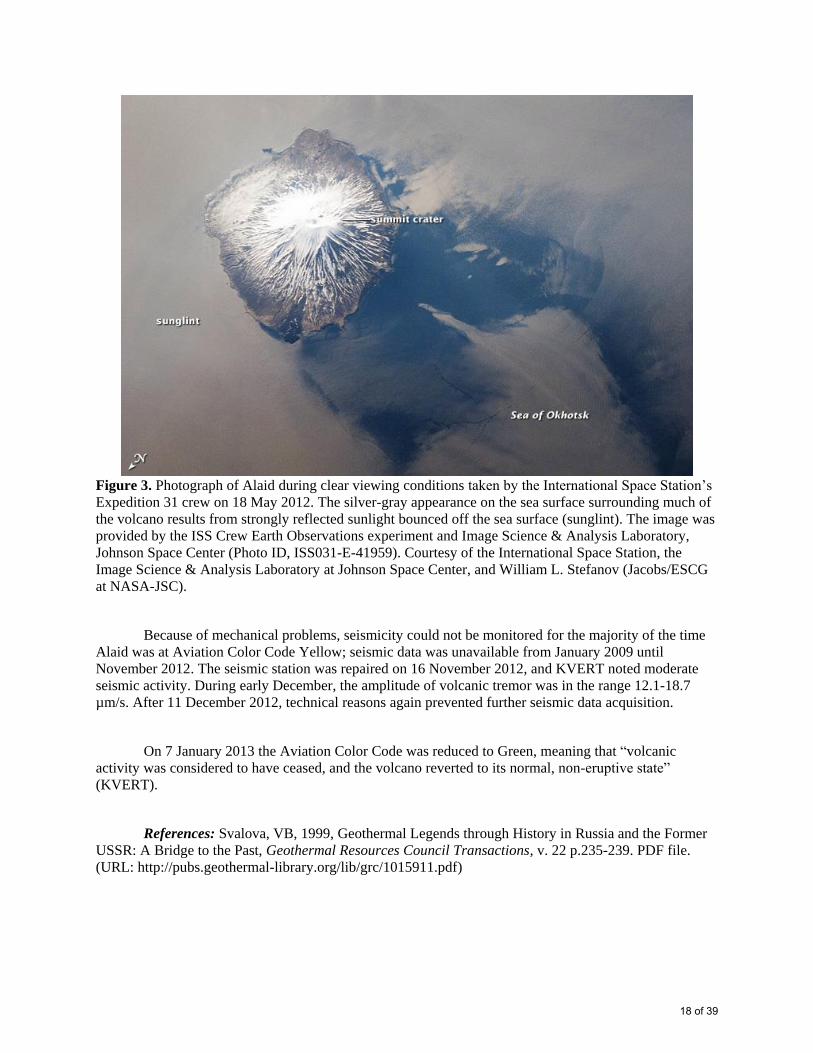
Figure 3. Photograph of Alaid during clear viewing conditions taken by the International Space Station’s
Expedition 31 crew on 18 May 2012. The silver-gray appearance on the sea surface surrounding much of
the volcano results from strongly reflected sunlight bounced off the sea surface (sunglint). The image was
provided by the ISS Crew Earth Observations experiment and Image Science & Analysis Laboratory,
Johnson Space Center (Photo ID, ISS031-E-41959). Courtesy of the International Space Station, the
Image Science & Analysis Laboratory at Johnson Space Center, and William L. Stefanov (Jacobs/ESCG
at NASA-JSC).
Because of mechanical problems, seismicity could not be monitored for the majority of the time
Alaid was at Aviation Color Code Yellow; seismic data was unavailable from January 2009 until
November 2012. The seismic station was repaired on 16 November 2012, and KVERT noted moderate
seismic activity. During early December, the amplitude of volcanic tremor was in the range 12.1-18.7
µm/s. After 11 December 2012, technical reasons again prevented further seismic data acquisition.
On 7 January 2013 the Aviation Color Code was reduced to Green, meaning that “volcanic
activity was considered to have ceased, and the volcano reverted to its normal, non-eruptive state”
(KVERT).
References: Svalova, VB, 1999, Geothermal Legends through History in Russia and the Former
USSR: A Bridge to the Past, Geothermal Resources Council Transactions, v. 22 p.235-239. PDF file.
(URL: http://pubs.geothermal-library.org/lib/grc/1015911.pdf)
18 of 39
Ukviggen, 2013, Alaid: Part 1–the Banished Beauty, Volcano Cafe, 24 April 2013. Accessed
online 13 January 2014. (URL: http://volcanocafe.wordpress.com/2013/04/24/alaid-part-1-the-banished-
beauty/)
Girina,O., Manevich, A., Melnikov, D., Nuzhdaev,A., Demyanchuk, Y., and Petrova, E., 2013,
Explosive Eruptions of Kamchatkan Volcanoes in 2012 and Danger to Aviation, EGU General Assembly, (abstract), 2013 meeting in Vienna, Austria. (URL:
http://adsabs.harvard.edu/abs/2013EGUGA..15.6760G ).
Geologic Summary: The highest and northernmost volcano of the Kuril Islands, 2339-m-high
Alaid is a symmetrical stratovolcano when viewed from the north, but has a 1.5-km-wide summit crater
that is breached widely to the south. Alaid is the northernmost of a chain of volcanoes constructed west of
the main Kuril archipelago and rises 3000 m from the floor of the Sea of Okhotsk. Numerous pyroclastic
cones dot the lower flanks of basaltic to basaltic-andesite Alaid volcano, particularly on the NW and SE
sides, including an offshore cone formed during the 1933-34 eruption. Strong explosive eruptions have
occurred from the summit crater beginning in the 18th century. Reports of eruptions in 1770, 1789, 1821,
1829, 1843, 1848, and 1858 were considered incorrect by Gorshkov (1970). Explosive eruptions at Alaid
in 1790 and 1981 were among the largest in the Kuril Islands during historical time.
Information Contacts: Olga Girina, Kamchatka Volcanic Eruptions Response Team (KVERT), a
cooperative program of the Institute of Volcanic Geology and Geochemistry, Far East Division, Russian
Academy of Sciences, Piip Ave. 9, Petropavlovsk-Kamchatsky, 683006, Russia; Volcano World
(http://volcano.oregonstate.edu/alaid); and International Space Station, the Image Science & Analysis
Laboratory at Nasa’s Johnson Space Center, and William L. Stefanov (Jacobs Technology).
19 of 39
Rabaul
New Britain, SW Pacific
4.271°S, 152.203°E; summit elev. 688 m
All times are local (= UTC +10 hours)
Variable but often modest eruptions during mid-2011 through 2013
The last Bulletin report on Rabaul Caldera (BGVN 36:07) recorded dozens of explosions
in the first week of August 2011. The explosions produced ash-rich clouds that drifted NW and
deposited ash in areas from Rabaul Town (3-5 km NW) to Nonga Village (10 km NW) (figure
1). This report covers activity from the end of August 2011 to December 2013, using data
primarily compiled from the Rabaul Volcano Observatory (RVO) and the Darwin Volcanic Ash
Advisory Center (VAAC). During this time, hundreds of small earthquakes were detected,
almost all of which occurred congruently with ash emissions or explosions. One notable
development occurred in July 2013, when a new lava dome formed on Tavurvur in the middle of
a long period of eruptive activity running from April to September of the same year. Shortly after
the dome’s formation, strong venting of ash at Tavurvur gave way to explosions on 10 July that
continued until 5 September, 2013. A second period of explosive activity began on 13
November, 2013, and terminated at the end of November.
20 of 39
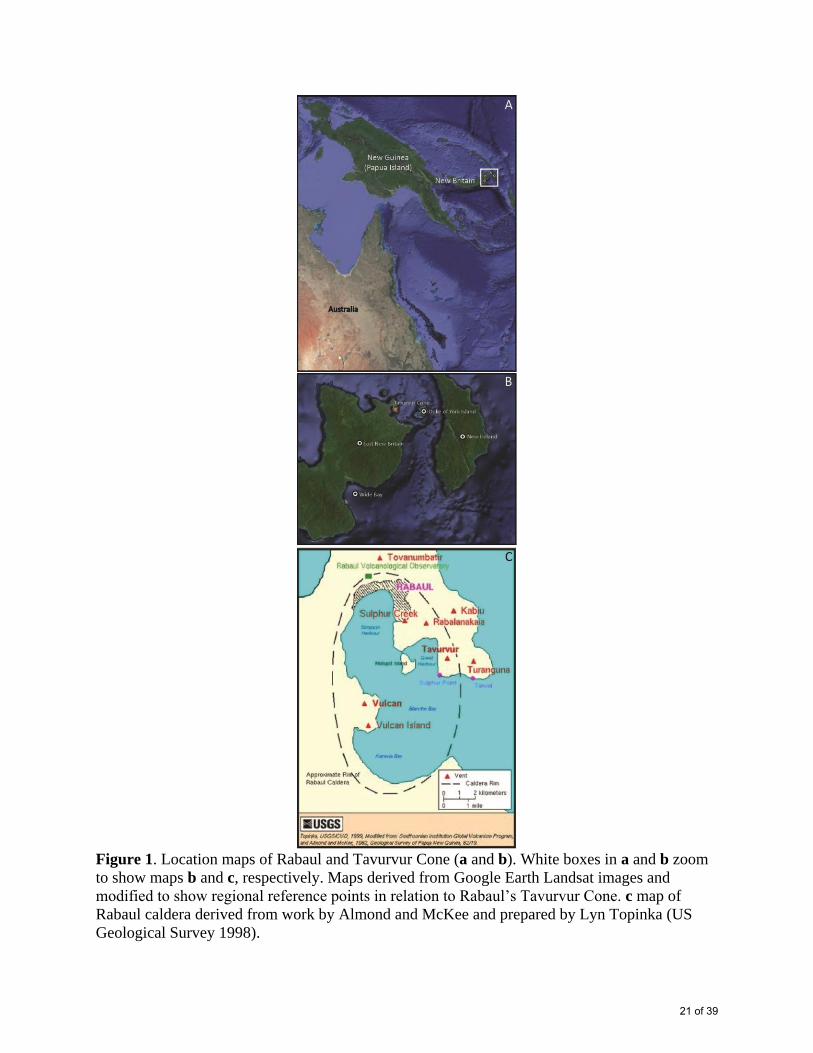
Figure 1. Location maps of Rabaul and Tavurvur Cone (a and b). White boxes in a and b zoom
to show maps b and c, respectively. Maps derived from Google Earth Landsat images and
modified to show regional reference points in relation to Rabaul’s Tavurvur Cone. c map of
Rabaul caldera derived from work by Almond and McKee and prepared by Lyn Topinka (US
Geological Survey 1998).
21 of 39
August 2011 to November 2012. Rabaul Caldera was generally tranquil from 12 August
2011 to November 2012. During this time, only emissions of white vapor were seen rising from
the cone, which became denser with the rain and humidity or periods of cool temperatures.
Seismicity was low although several high frequency earthquakes NE of Tavurvur were recorded
on 6 June 2012. GPS instruments recorded at least 2 cm of inflation (greater than the long-term
decadal trend in inflation) and sub-continuous tremor was recorded by four local seismic stations
17-20 September 2011. Diffuse SO2 emissions recorded in late November 2012.
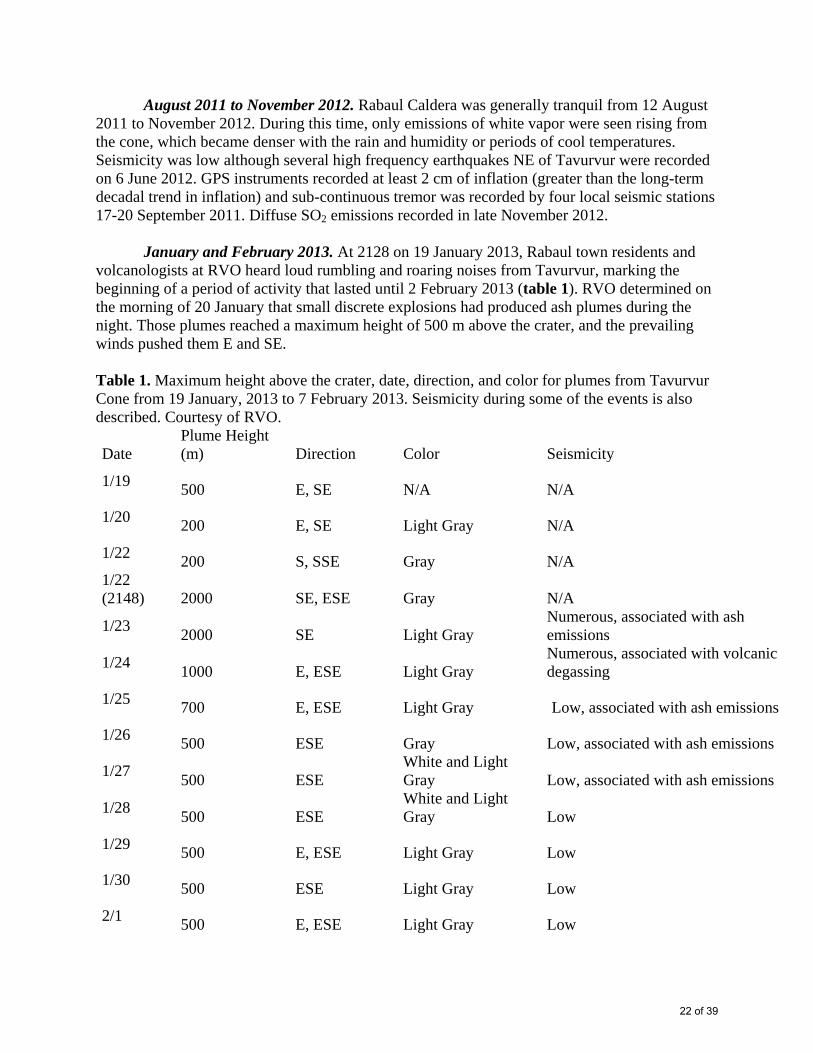
January and February 2013. At 2128 on 19 January 2013, Rabaul town residents and
volcanologists at RVO heard loud rumbling and roaring noises from Tavurvur, marking the
beginning of a period of activity that lasted until 2 February 2013 (table 1). RVO determined on
the morning of 20 January that small discrete explosions had produced ash plumes during the
night. Those plumes reached a maximum height of 500 m above the crater, and the prevailing
winds pushed them E and SE.
Table 1. Maximum height above the crater, date, direction, and color for plumes from Tavurvur
Cone from 19 January, 2013 to 7 February 2013. Seismicity during some of the events is also
described. Courtesy of RVO.
Date
Plume Height
(m) Direction Color Seismicity
1/19 500 E, SE N/A N/A
1/20 200 E, SE Light Gray N/A
1/22 200 S, SSE Gray N/A
1/22
(2148) 2000 SE, ESE Gray N/A
1/23 2000 SE Light Gray
Numerous, associated with ash
emissions
1/24 1000 E, ESE Light Gray
Numerous, associated with volcanic
degassing
1/25 700 E, ESE Light Gray Low, associated with ash emissions
1/26 500 ESE Gray Low, associated with ash emissions
1/27 500 ESE
White and Light
Gray Low, associated with ash emissions
1/28 500 ESE
White and Light
Gray Low
1/29 500 E, ESE Light Gray Low
1/30 500 ESE Light Gray Low
2/1 500 E, ESE Light Gray Low
22 of 39
2/2 500 E, ESE Light Gray Low
2/3 2000 E, NE Dark Gray Low, associated with ash emissions
2/4 2000 E, SE Light Gray Low, associated with ash emissions
2/5 2688 E, ENE Pale Gray Low, associated with ash emissions
2/6 2000 NW Pale Gray Low, associated with ash emissions
2/7 2000 NW Pale Gray Low, associated with ash emissions
On 21 January at 0930, RVO noted an increase in emissions from Tavurvur consisting of
mostly water vapor and low volumes of ash that created a plume ranging in color from white to
light gray. The plume rose to a maximum height of 200 m and drifted SW. These conditions
remained constant for the next 24 hours, except for a loud explosion and several minutes of
roaring and rumbling at 2335 that night. The vegetation on the north side of South Daughter
(also known as Turangunan, see figure 1) turned brown, suggesting the release of SO2 from the
volcano.
Further increase in emissions was noted at 0930 on 22 January, and plumes rose to a
maximum height of 200m drifting to the SE. That night at 2147 a large explosion ejected both a
light gray plume low in ash content and small amounts of incandescent spatter. Explosive noises
were heard throughout the night and continued through 23 January. Both diffuse and dense ash
plumes drifted SE. RVO remarked that calm meteorological conditions allowed the plume to
ascend to a maximum altitude of 2,000 m. Activity at Tavurvur through 7 February was
characterized by small-to-moderate explosions producing light-to-dark-gray ash clouds of low
ash content and variable plume heights, constant white vapor, and low-to-moderate levels of
roaring and rumbling. Ash affected areas downwind; ABC Australia Network News reported that
the ash shut down New Britain airports until 31 January.
On 5 February, the Darwin VAAC reported a pale gray plume that rose to 2,000 m a.s.l.
and drifted E and ENE.
Ash fell on Turangunan on 3 February. Very fine ash fell in Rabaul Town on 6 and 7
February due to a southeasterly wind blowing the plume NW from Tavurvur. There were no
other affected areas.
March 2013. RVO recorded increased ash emissions on 3 March. Those emissions were
brown and continued until 7 March. Volcanologists at RVO reported that the emissions increased
over time throughout the latter part of 3 March and by 6 March were occurring nearly every
minute. At the same time, many small earthquakes associated with ash emissions were detected.
Four regional earthquakes were felt on 5 March at 1358, 1606, and 1621, and on 6 March at
1953. These earthquakes ranged from a magnitude of 5.1 to 5.4, originating SSE from Rabaul to
the east of Wide Bay (see figure 1 for reference) at depths of 50-60 km. They were felt in Rabaul
23 of 39
Town with intensities III – IV. RVO did not report any change in volcanic activity at this time.
Earthquakes on 7 March occurred with instances of ash emissions, which had declined in
frequency to once every few hours.
Tavurvur remained quiet until 12 March, when an explosion at 1108 expelled a dark
gray-to-black billowing ash column for 40 minutes. Afterwards, emissions changed to billowing
white ash clouds that rose 300 m and drifted SE.
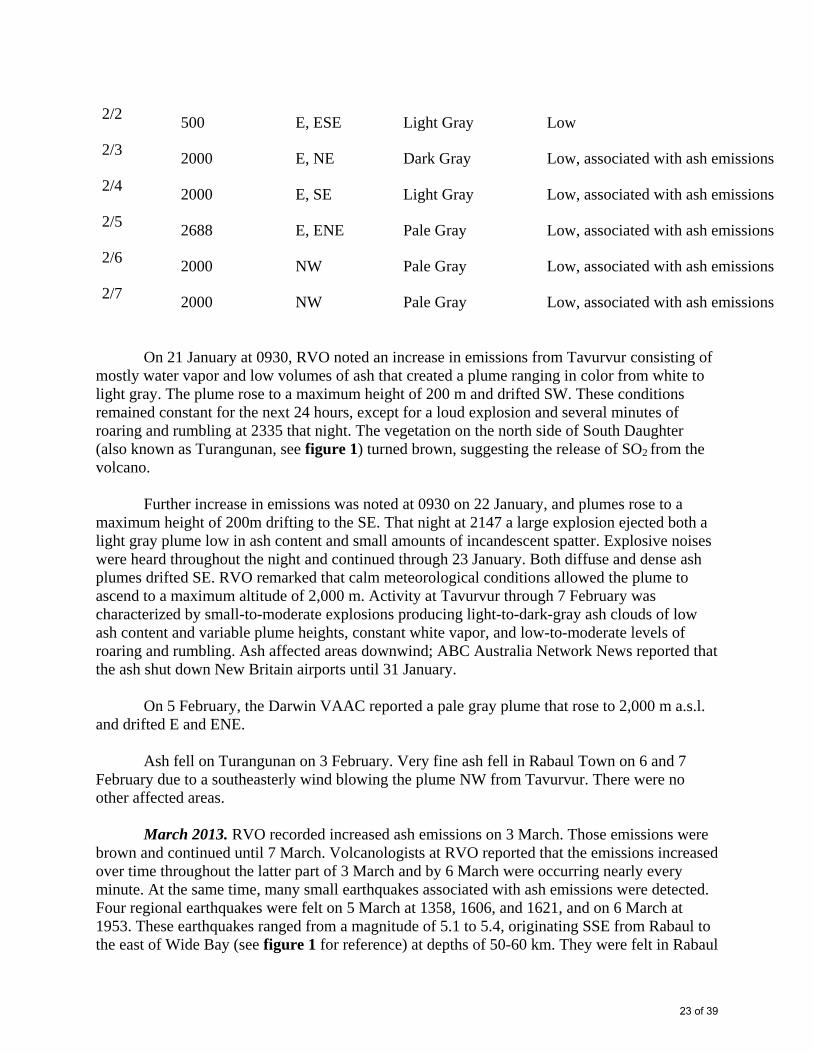
April 2013 to September 2013. Activity at Tavurvur from 14 April until 9 July was
characterized by ongoing roaring, rumbling, and diffuse to dense white plumes, including some
occasionally laden with fine ash particles (table 2). Throughout the period, some low intensity
earthquakes and some explosions were detected, which ejected ash clouds to variable heights.
Many ash plumes were blown to the SE until 30 April, when the wind began blowing to the NW.
As a result, downwind areas including Rabaul town experienced ashfall from 30 April to 9
September.
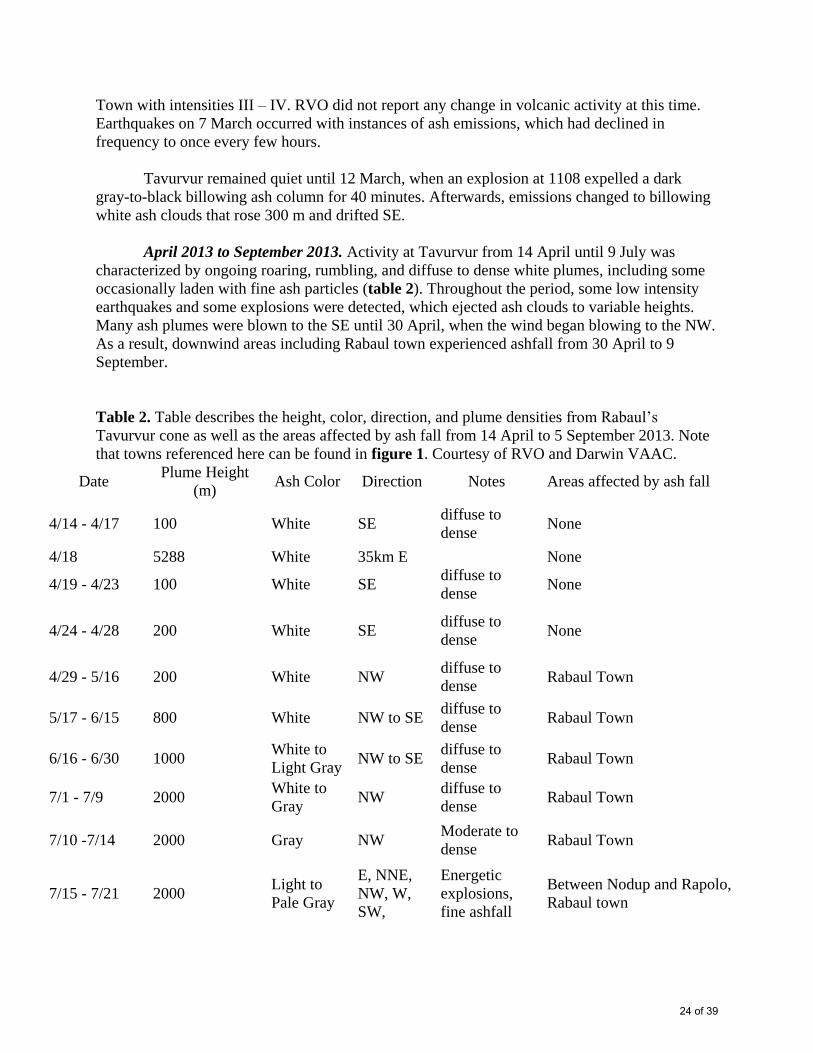
Table 2. Table describes the height, color, direction, and plume densities from Rabaul’s
Tavurvur cone as well as the areas affected by ash fall from 14 April to 5 September 2013. Note
that towns referenced here can be found in figure 1. Courtesy of RVO and Darwin VAAC.
Date Plume Height
(m) Ash Color Direction Notes Areas affected by ash fall
4/14 - 4/17 100 White SE diffuse to
dense None
4/18 5288 White 35km E
None
4/19 - 4/23 100 White SE diffuse to
dense None
4/24 - 4/28 200 White SE diffuse to
dense None
4/29 - 5/16 200 White NW diffuse to
dense Rabaul Town
5/17 - 6/15 800 White NW to SE diffuse to
dense Rabaul Town
6/16 - 6/30 1000 White to
Light Gray NW to SE
diffuse to
dense Rabaul Town
7/1 - 7/9 2000 White to
Gray NW
diffuse to
dense Rabaul Town
7/10 -7/14 2000 Gray NW Moderate to
dense Rabaul Town
7/15 - 7/21 2000 Light to
Pale Gray
E, NNE,
NW, W,
SW,
Energetic
explosions,
fine ashfall
Between Nodup and Rapolo,
Rabaul town
24 of 39
7/22 - 7/31 2000 Light to
Pale Gray
E, NNE,
NW, W,
SW,
Energetic
explosions,
fine ashfall
Between Namanula and
Malaguna No. 1, Rabaul
Town, Malaguna No. 2,
Vulcan Area
8/1 - 8/24 1000 Pale Gray NW Forceful
emissions
east Old Rabaul, Namanula
Hill, Nonga Area, Rabaul
Town, Malaguna No. 1
8/29 1800 Pale Gray 150 km
NW
Forceful
emissions
east Old Rabaul, Namanula
Hill, Nonga Area, Rabaul
Town, Malaguna No. 2
8/26 - 8/28 1000 Pale Gray NW Forceful
emissions
east Old Rabaul, Namanula
Hill, Nonga Area, Rabaul
Town, Malaguna No. 3
8/29 2100 Pale Gray 40 km
NW
Forceful
emissions
east Old Rabaul, Namanula
Hill, Nonga Area, Rabaul
Town, Malaguna No. 4
8/30 - 8/31 1000 Pale Gray NW Forceful
emissions
east Old Rabaul, Namanula
Hill, Nonga Area, Rabaul
Town, Malaguna No. 5
9/1 - 9/5 50 Pale Gray NW
Strong winds
re-suspended
old ash
Rabaul Town, exposure low -
moderate
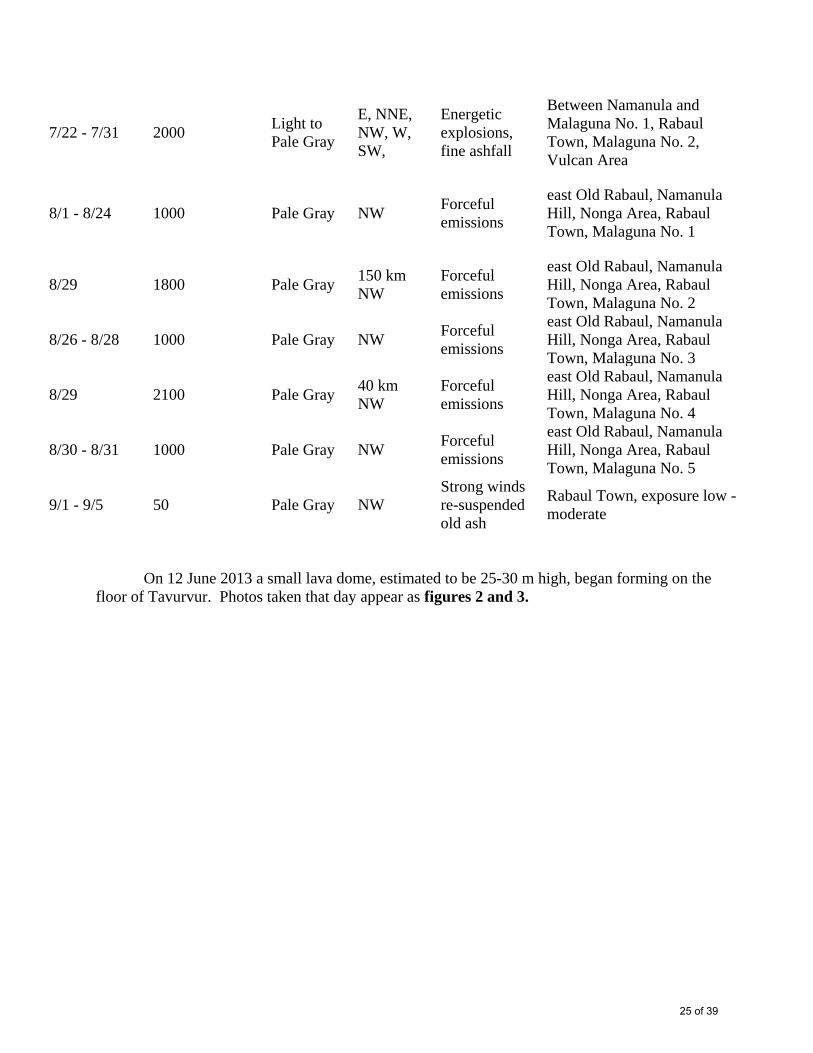
On 12 June 2013 a small lava dome, estimated to be 25-30 m high, began forming on the
floor of Tavurvur. Photos taken that day appear as figures 2 and 3.
25 of 39
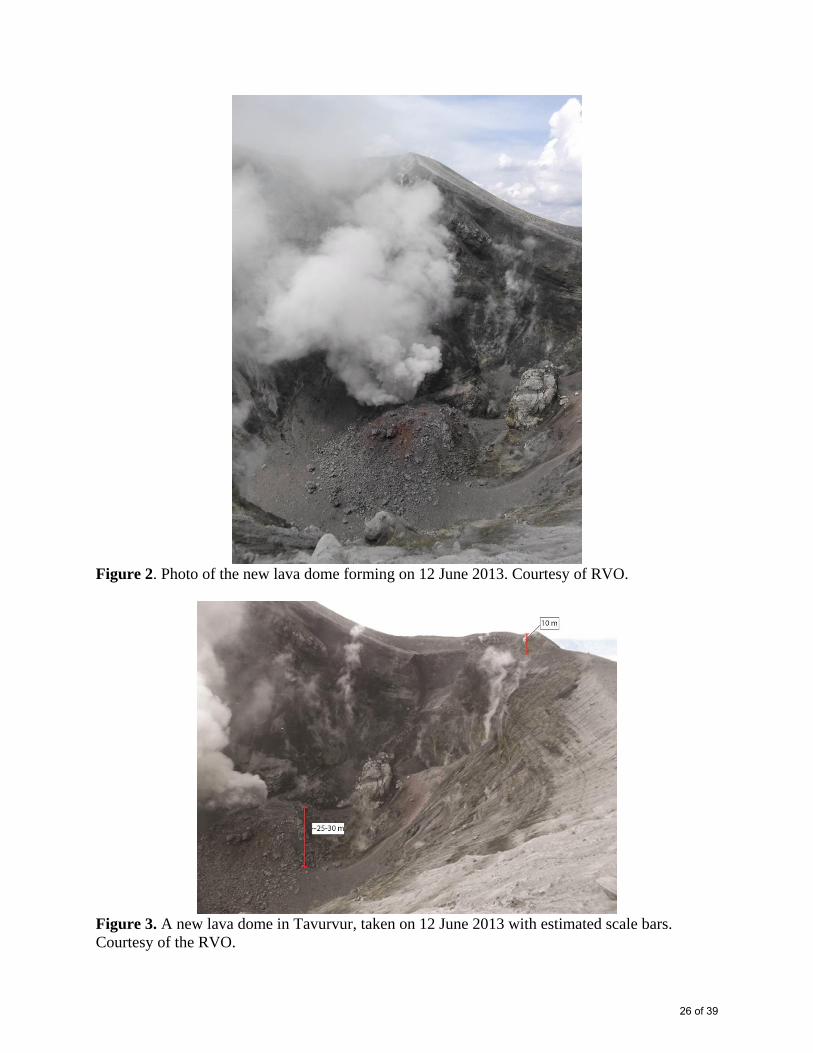
Figure 2. Photo of the new lava dome forming on 12 June 2013. Courtesy of RVO.
Figure 3. A new lava dome in Tavurvur, taken on 12 June 2013 with estimated scale bars.
Courtesy of the RVO.
26 of 39
On 26 June, incandescence was observed at a vent on the dome and was associated with
strong venting of steam and ash, which continued to 14 July.
A few discrete explosions occurred on 10 July, producing moderate to dense gray ash
clouds. This low level eruptive activity persisted until 9 September, with energetic explosions
producing mostly light-to-pale-gray ash clouds that drifted NW and affected areas downwind.
The eruptions occurred at a varying range of intervals from ten’s of seconds to hours.
From 14 April to 14 July, several small low-frequency earthquakes occurred. The
majority of these were too small to be located, but time series data suggest that they originated
near Tavurvur. In early July, a recently restored seismic station near Tavurvur confirmed that
earthquakes were occurring beneath Tavurvur volcano. The station also detected smaller
earthquakes that other seismic stations had not recorded. On 15 July, the level of seismicity
increased, with events concurrent with ash emissions. On 1 August, seismicity increased and
remained elevated until 9 September; seismic events continued to be associated with ash
emissions.
Ground deformation during this entire period remained relatively stable, reflecting the
long-term trend of uplift. On 11 May, the base station antenna broke, resulting in a loss of GPS
data. Ground measurements using water tube tilt meters showed a slight inflation recorded at
Matupit Island (see figure 1). Throughout the entire month of August, ground measurements
showed slight deflation, but the long term inflation trend resumed beginning on 1 September.
During 1-5 September, RVO stated that “people in Rabaul town reported an odor
reflective of chlorine. The substance that caused the odor is normal output of volcanic processes
but an uncommon one. Its presence does not represent anything unusual or increase in volcanic
activity.”
27 of 39
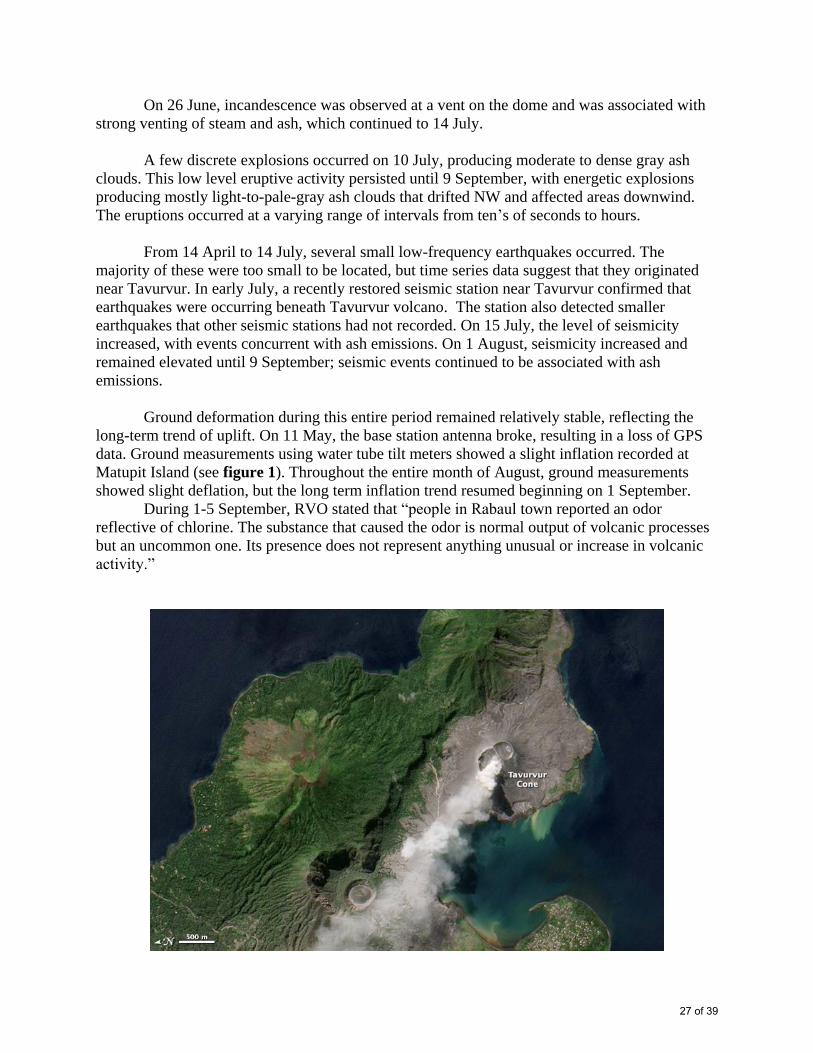
Figure 4. This natural color image of Tavurvur Cone emitting an ash plume on 6 August 2013
was acquired by the Advanced Land Imager (ALI) on the Earth Observing-1 (EO-1) satellite,
and posted on the NASA Earth Observatory website. Note scale and N arrow at far left. Courtesy
of Jesse Allen and Robert Simmon (Nasa Earth Observatory).
September to November 2013. The Darwin VAAC observed one ash plume on 27
September 2013. The plume rose to an altitude of 2,400 m a.s.l. and drifted 110 km NE and NW.
No other activity was recorded until mid- November.
On 13 November 2013, a moderate explosion at Tavurvur produced a dense, gray
billowing plume of ash which rose 1000 m and blew NW. More explosions followed at irregular
intervals, and continued until 18 November. Ash plumes from those explosions were blown E,
SE, and NW at lower altitudes and rose to a maximum height of 1000 m. Between explosions,
wisps of white vapor rose from the volcano. Large explosions occurred at 0738, 0851, 1308, and
1903 on 13 November, and the next day at 2044. RVO reported minor inflation at the center of
the caldera. There was some roaring and rumbling, but seismicity was low with small low-
frequency earthquakes occurring with explosions.
During 19-30 November, Tavurvur produced fewer explosions, accompanied by white to
light gray emissions, and small traces of diffuse to dense white vapors were occasionally
observed. Those plumes drifted E, SE, and NW at a maximum height of 1000 m above the crater
summit. Two small, high-frequency volcano-tectonic earthquakes were detected during 23-27
November and located NE of Tavurvur.
December 2013. Little activity occurred at Rabaul during December. Minor emissions of
mainly diffuse, though occasionally dense, white vapor occurred. A blue tint to the emissions
was reported on some days during the reporting periodThere were no audible noises except for
two two moderate explosions at 1850 on 15 December and 0732 on 22 December. Neither
explosion was ash rich. RVO noted a weak fluctuating glow visible at night on 31 December.
Geologic Summary. The low-lying Rabaul caldera on the tip of the Gazelle Peninsula at
the NE end of New Britain forms a broad sheltered harbor utilized by what was the island's
largest city prior to a major eruption in 1994. The outer flanks of the 688-m-high asymmetrical
pyroclastic shield volcano are formed by thick pyroclastic-flow deposits. The 8 x 14 km caldera
is widely breached on the east, where its floor is flooded by Blanche Bay and was formed about
1400 years ago. An earlier caldera-forming eruption about 7,100 years ago is now considered to
have originated from Tavui caldera, offshore to the north. Three small stratovolcanoes lie outside
the northern and NE caldera rims of Rabaul. Post-caldera eruptions built basaltic-to-dacitic
pyroclastic cones on the caldera floor near the NE and western caldera walls. Several of these,
including Vulcan cone, which was formed during a large eruption in 1878, have produced major
explosive activity during historical time. A powerful explosive eruption in 1994 occurred
simultaneously from Vulcan and Tavurvur volcanoes and forced the temporary abandonment of
Rabaul city.
28 of 39

Information Contacts: Rabaul Volcano Observatory, Department of Mineral Policy and
Geohazards Management, Volcanological Observatory Geohazards Management Division, P.O.
Box 386, Kokopo, East New Britain Province, Papua New Guinea (email: [email protected]
); and Darwin Volcanic Ash Advisory Centre (VAAC) (URL: http://www.bom.gov.au/info/vaac/
), Nasa Earth Observatory (URL: http://earthobservatory.nasa.gov); ABC Australia Network
News (URL: http://www.abc.net.au/news-01-31/an-png-airport-reopens-after-volcano-forces-
closure/4492838).
29 of 39
Apoyeque
Nicaragua
12.242°N, 86.342°W; summit elev. 518 m
All times are local (= UTC - 6 hours)
Seismic swarms in 2009 and 2012
Within the last five years, Instituto Nicaragüense de Estudios Territoriales (INETER)
reported at least two seismic swarms at Apoyeque, and between the Chiltepe Peninsula and the
city of Managua (~15 km SE) (figure 1). Our last report also highlighted swarms which lasted
several hours and days in 2001 and 2007 (BGVN 34:04). Intermittent seismicity was reported
within the region during 2009-2012, but events were rarely larger than M 2.5.
30 of 39
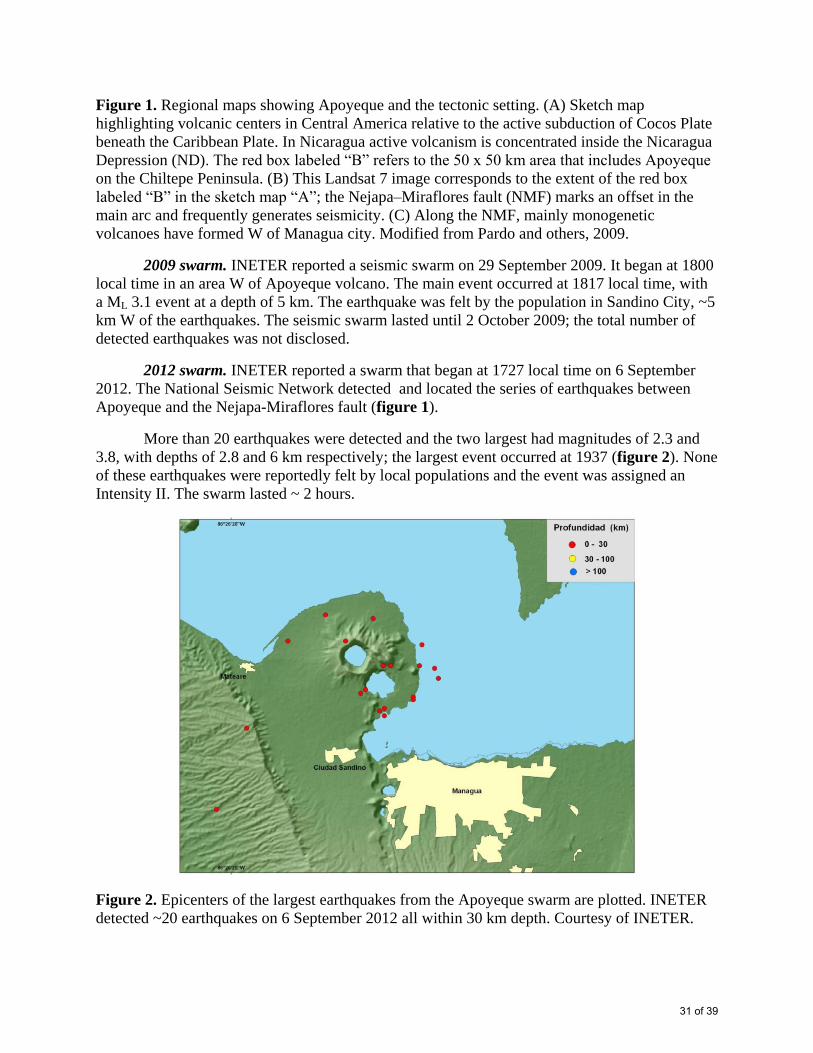
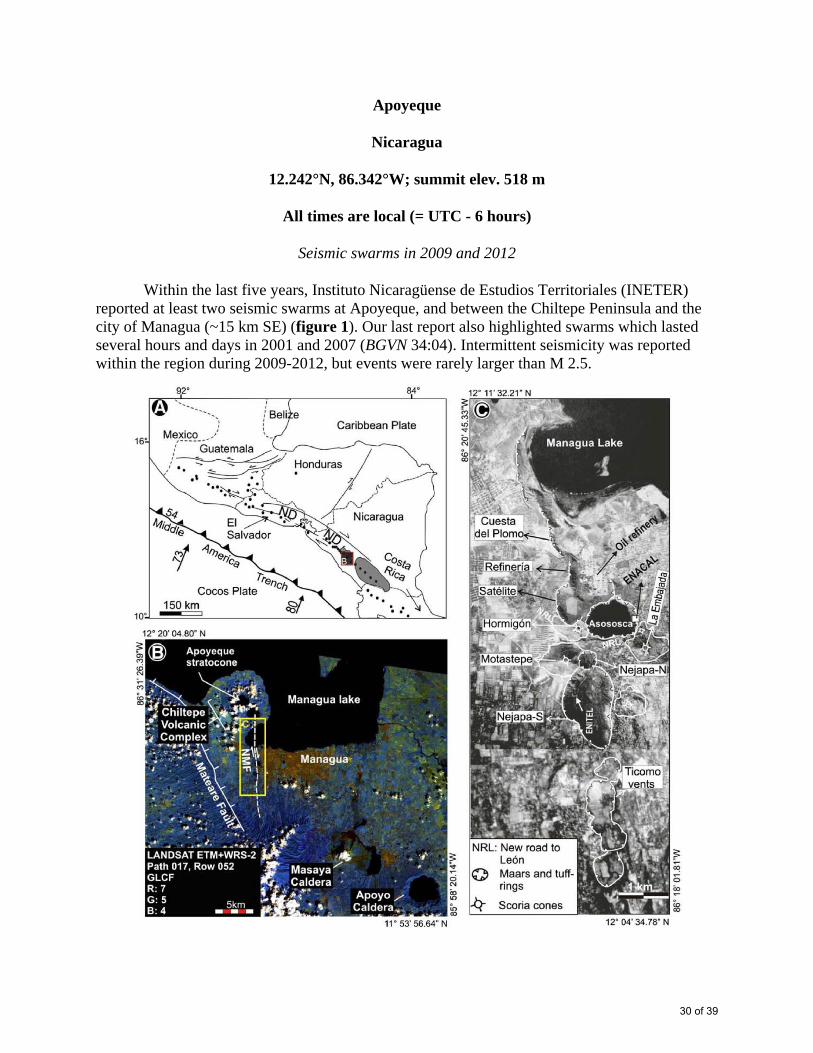
Figure 1. Regional maps showing Apoyeque and the tectonic setting. (A) Sketch map
highlighting volcanic centers in Central America relative to the active subduction of Cocos Plate
beneath the Caribbean Plate. In Nicaragua active volcanism is concentrated inside the Nicaragua
Depression (ND). The red box labeled “B” refers to the 50 x 50 km area that includes Apoyeque
on the Chiltepe Peninsula. (B) This Landsat 7 image corresponds to the extent of the red box
labeled “B” in the sketch map “A”; the Nejapa–Miraflores fault (NMF) marks an offset in the
main arc and frequently generates seismicity. (C) Along the NMF, mainly monogenetic
volcanoes have formed W of Managua city. Modified from Pardo and others, 2009.
2009 swarm. INETER reported a seismic swarm on 29 September 2009. It began at 1800
local time in an area W of Apoyeque volcano. The main event occurred at 1817 local time, with
a ML 3.1 event at a depth of 5 km. The earthquake was felt by the population in Sandino City, ~5
km W of the earthquakes. The seismic swarm lasted until 2 October 2009; the total number of
detected earthquakes was not disclosed.
2012 swarm. INETER reported a swarm that began at 1727 local time on 6 September
2012. The National Seismic Network detected and located the series of earthquakes between
Apoyeque and the Nejapa-Miraflores fault (figure 1).
More than 20 earthquakes were detected and the two largest had magnitudes of 2.3 and
3.8, with depths of 2.8 and 6 km respectively; the largest event occurred at 1937 (figure 2). None
of these earthquakes were reportedly felt by local populations and the event was assigned an
Intensity II. The swarm lasted ~ 2 hours.
Figure 2. Epicenters of the largest earthquakes from the Apoyeque swarm are plotted. INETER
detected ~20 earthquakes on 6 September 2012 all within 30 km depth. Courtesy of INETER.
31 of 39
Avellán and others (2012) described the polygenetic Apoyeque volcano as belonging to
the Nejapa volcanic field (figure 1), which is bound by the Nejapa fault system. There were 23
eruptions from the field within the last ~30 ka; 13 of these events were explosive (VEI 2). The
most recent eruption was dated between 2,130 ± 40 and 1,245 ± 120 years BP. With respect to
hazards implications, clear vent migration patterns were seemingly absent for this volcanic field.
The authors concluded that there is a high probability of future, similar eruptions, particularly
phreatomagmatic ones, within this area of Nicaragua.
References: Avellán, D.R., Macías, J.L., Pardo, N., Scolamacchia, T., and Rodriguez, D.,
2012, Stratigraphy, geomorphology, geochemistry and hazard implications of the Nejapa
Volcanic Field, western Managua, Nicaragua, Journal of Volcanology and Geothermal
Research, 213-214: 51-71.
Pardo, N., Macías, J.L., Giordano, G., Cianfarra, P., Avellán, D.R., and Bellatreccia, F.,
2009, The ~1245 yr BP Asososca maar eruption: The youngest event along the Nejapa–
Miraflores volcanic fault, Western Managua, Nicaragua, Journal of Volcanology and
Geothermal Research, 184: 292-312.
Geologic Summary. The Apoyeque volcanic complex occupies the broad Chiltepe
Peninsula, which extends into south-central Lake Managua. The peninsula is part of the Chiltepe
pyroclastic shield volcano, one of three large ignimbrite shields on the Nicaraguan volcanic
front. A 2.8-km wide, 400-m-deep, lake-filled caldera whose floor lies near sea level truncates
the low Apoyeque volcano, which rises only about 500 m above the lake shore. The caldera was
the source of a thick mantle of dacitic pumice that blankets the surrounding area. The 2.5 x 3 km
wide lake-filled Xiloá (Jiloá) maar, is located immediately SE of Apoyeque. The Talpetatl lava
dome was constructed between Laguna Xiloá and Lake Managua. Pumiceous pyroclastic flows
from Laguna Xiloá were erupted about 6100 years ago and overlie deposits of comparable age
from the Masaya plinian eruption.
Information Contact: Instituto Nicaragüense de Estudios Territoriales (INETER),
Apartado Postal 2110, Managua, Nicaragua (URL: http://www.ineter.gob.ni/geofisica/).
32 of 39
Cerro Negro
Nicaragua
12.506°N, 86.702°W; summit elev. 728 m
All times are local (= UTC - 6 hours)
Seismic swarm in 2013
Since our last report (BGVN 37:01), Instituto Nicaragüense de Estudios Territoriales
(INETER) continued to conduct fieldwork at Cerro Negro during 2012-2013 and reported that
stable conditions prevailed except for a small seismic swarm detected in 2013.
INETER reported that from Cerro Negro’s activity during 2012 was considered normal.
Several significant landslides occurred that year, particularly from the S-SW interior rim of the
primary crater. Seismicity was variable throughout the year with some interruptions of the signal
(table 1).
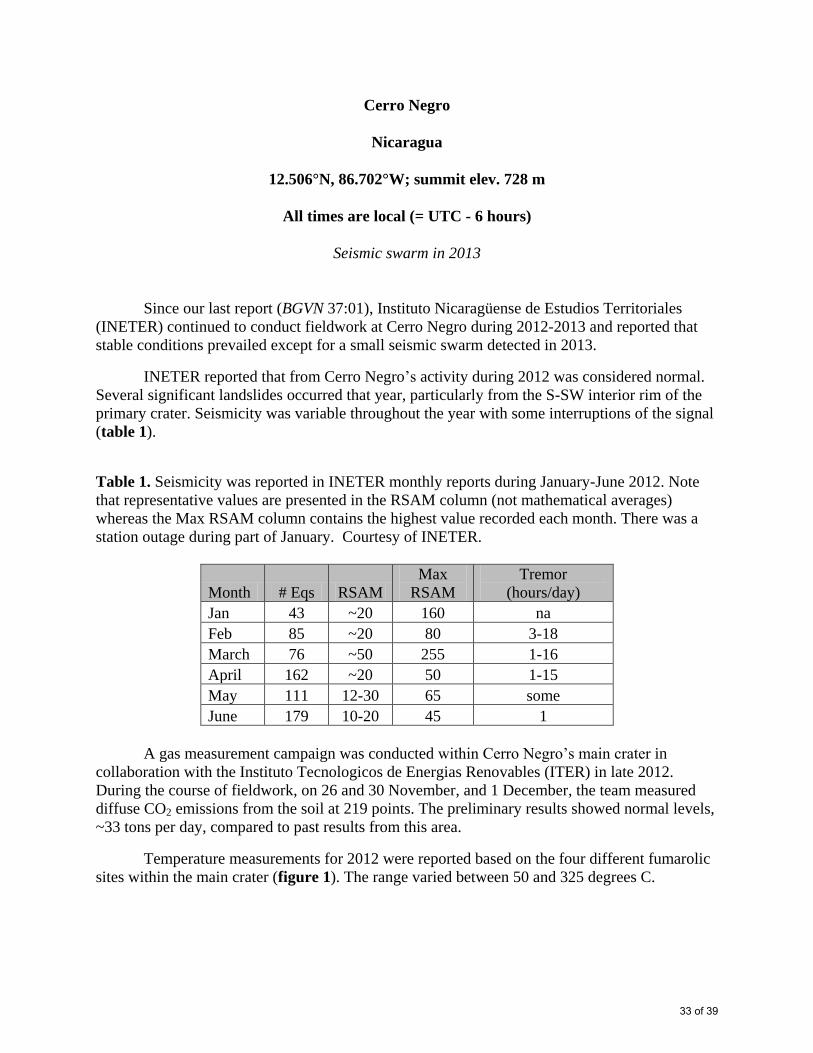
Table 1. Seismicity was reported in INETER monthly reports during January-June 2012. Note
that representative values are presented in the RSAM column (not mathematical averages)
whereas the Max RSAM column contains the highest value recorded each month. There was a
station outage during part of January. Courtesy of INETER.
Month # Eqs RSAM
Max
RSAM
Tremor
(hours/day)
Jan 43 ~20 160 na
Feb 85 ~20 80 3-18
March 76 ~50 255 1-16
April 162 ~20 50 1-15
May 111 12-30 65 some
June 179 10-20 45 1
A gas measurement campaign was conducted within Cerro Negro’s main crater in
collaboration with the Instituto Tecnologicos de Energias Renovables (ITER) in late 2012.
During the course of fieldwork, on 26 and 30 November, and 1 December, the team measured
diffuse CO2 emissions from the soil at 219 points. The preliminary results showed normal levels,
~33 tons per day, compared to past results from this area.
Temperature measurements for 2012 were reported based on the four different fumarolic
sites within the main crater (figure 1). The range varied between 50 and 325 degrees C.
33 of 39
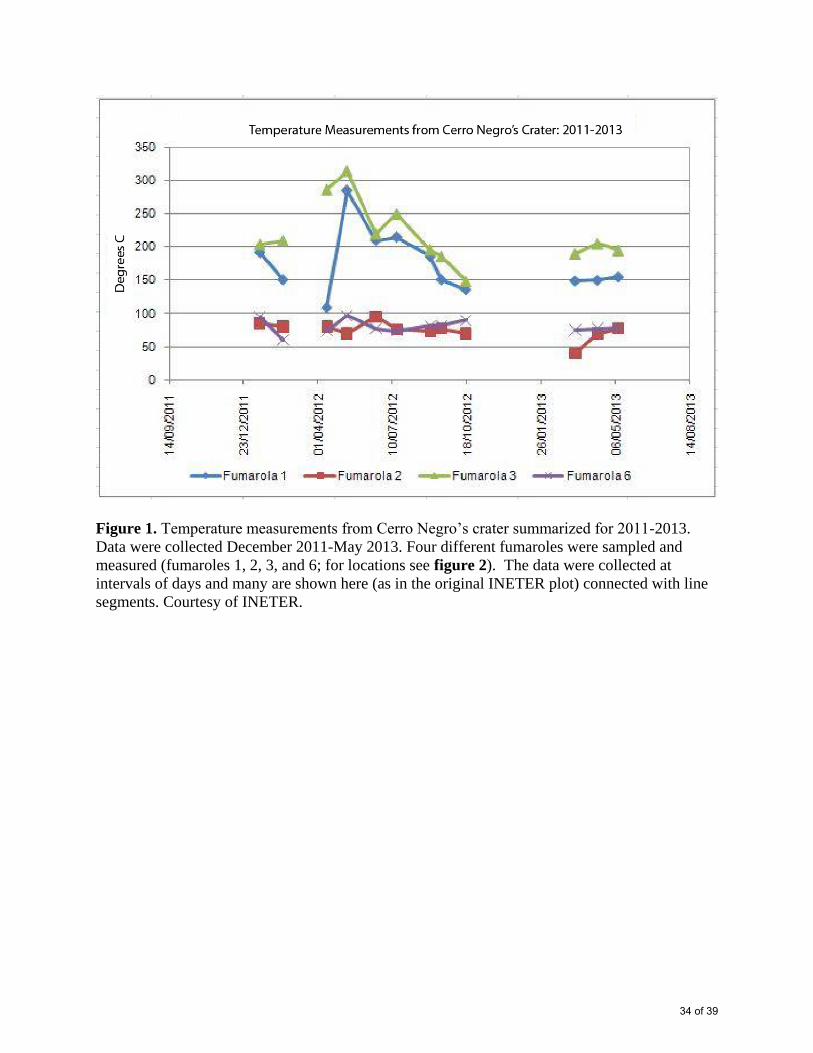
Figure 1. Temperature measurements from Cerro Negro’s crater summarized for 2011-2013.
Data were collected December 2011-May 2013. Four different fumaroles were sampled and
measured (fumaroles 1, 2, 3, and 6; for locations see figure 2). The data were collected at
intervals of days and many are shown here (as in the original INETER plot) connected with line
segments. Courtesy of INETER.
34 of 39
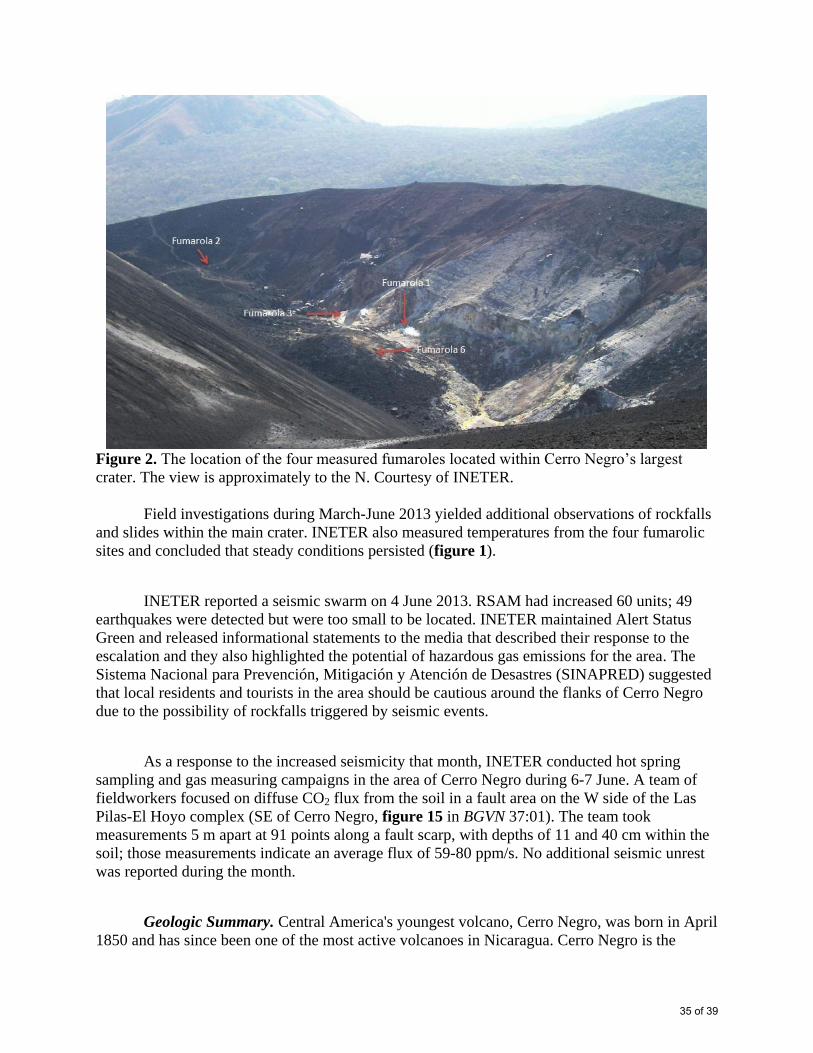
Figure 2. The location of the four measured fumaroles located within Cerro Negro’s largest
crater. The view is approximately to the N. Courtesy of INETER.
Field investigations during March-June 2013 yielded additional observations of rockfalls
and slides within the main crater. INETER also measured temperatures from the four fumarolic
sites and concluded that steady conditions persisted (figure 1).
INETER reported a seismic swarm on 4 June 2013. RSAM had increased 60 units; 49
earthquakes were detected but were too small to be located. INETER maintained Alert Status
Green and released informational statements to the media that described their response to the
escalation and they also highlighted the potential of hazardous gas emissions for the area. The
Sistema Nacional para Prevención, Mitigación y Atención de Desastres (SINAPRED) suggested
that local residents and tourists in the area should be cautious around the flanks of Cerro Negro
due to the possibility of rockfalls triggered by seismic events.
As a response to the increased seismicity that month, INETER conducted hot spring
sampling and gas measuring campaigns in the area of Cerro Negro during 6-7 June. A team of
fieldworkers focused on diffuse CO2 flux from the soil in a fault area on the W side of the Las
Pilas-El Hoyo complex (SE of Cerro Negro, figure 15 in BGVN 37:01). The team took
measurements 5 m apart at 91 points along a fault scarp, with depths of 11 and 40 cm within the
soil; those measurements indicate an average flux of 59-80 ppm/s. No additional seismic unrest
was reported during the month.
Geologic Summary. Central America's youngest volcano, Cerro Negro, was born in April
1850 and has since been one of the most active volcanoes in Nicaragua. Cerro Negro is the
35 of 39
largest, southernmost, and most recent of a group of four youthful cinder cones constructed along
a NNW-SSE-trending line in the central Marrabios Range 5 km NW of Las Pilas volcano.
Strombolian-to-subplinian eruptions at Cerro Negro at intervals of a few years to several decades
have constructed a roughly 250-m-high basaltic cone and an associated lava field that is
constrained by topography to extend primarily to the NE and SW. Cone and crater morphology
at Cerro Negro have varied significantly during its eruptive history. Although Cerro Negro lies in
a relatively unpopulated area, its occasional heavy ashfalls have caused damage to crops and
buildings in populated regions of the Nicaraguan depression.
Information Contacts: Instituto Nicaragüense de Estudios Territoriales (INETER),
Apartado Postal 2110, Managua, Nicaragua (URL: http://www.ineter.gob.ni/geofisica/ );
Instituto Tecnológico y de Energías Renovables (ITER), 38611 Granadilla, Tenerife, Canary
Islands, Spain (URL: http://www.iter.es/); Hoy: El Periodico que yo quiero, Managua, Nicaragua
(URL: http://www.hoy.com.ni/2013/06/05/vigilan-al-volc%C3%A1n-cerro-negro/) ; and Sistema
Nacional para Prevención, Mitigación y Atención de Desastres (SINAPRED), Managua,
Nicaragua (URL: http://www.sinapred.gob.ni/ ).
36 of 39
Barren Island
Andaman Islands, Indian Ocean
12.278°N, 93.858°E; summit elev. 354 m
All times are local (= UTC + 5 hours)
Ash plume drifted up to 220 km SW in February 2013
Our last Bulletin report (BGVN 36:06) noted that Barren Island was still erupting during
2011. This report both discusses an April 2010 ash plume that recently came to our attention and
reports on activity as late as October 2013. A regional map appears in the last section.
On 19 April 2010, based on analysis of satellite imagery, the Darwin Volcanic Ash
Advisory Centre (VAAC) reported that a plume from Barren Island rose to an altitude of 2.4 km
and drifted 55 km N. Ash, however, could not be identified from the satellite data.
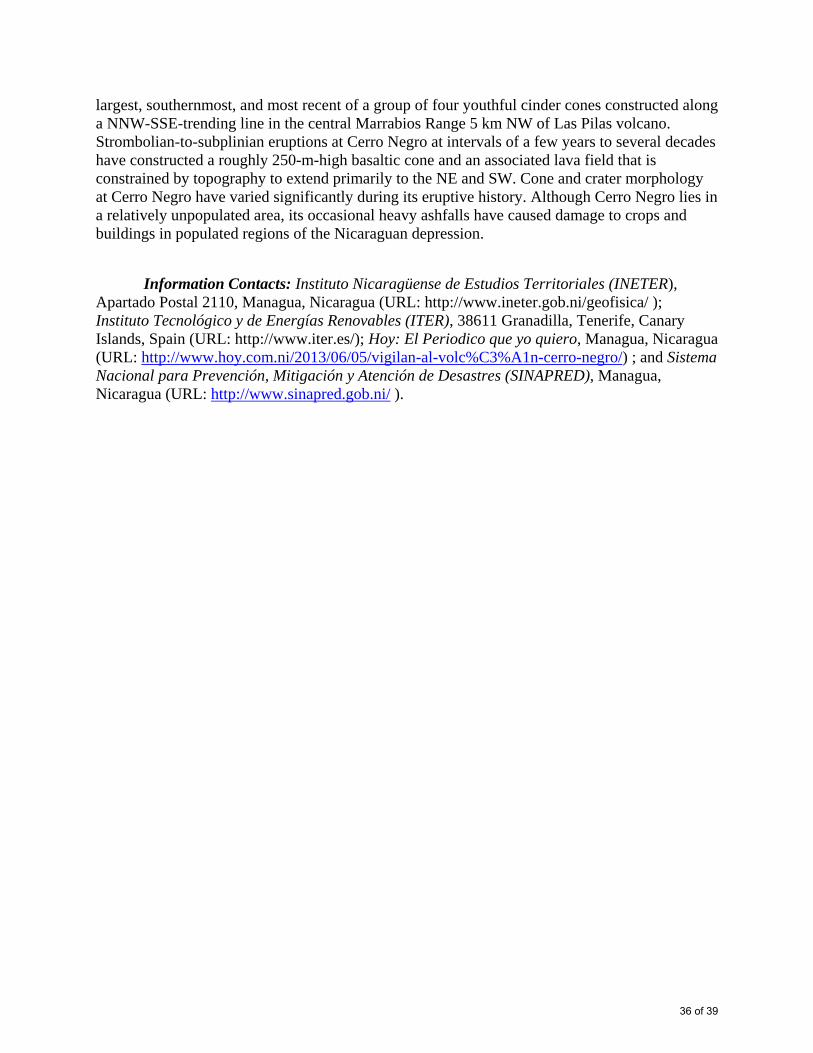
A Twitter posting included the photo in figure 1, an image apparently acquired in
December 2010. The Indian Navy (via Twitter) reported seeing "smoke" and lava was also seen
on the island from a surveillance plane on 16 October 2013. A large hot spot is visible on recent
MODIS satellite data.
37 of 39
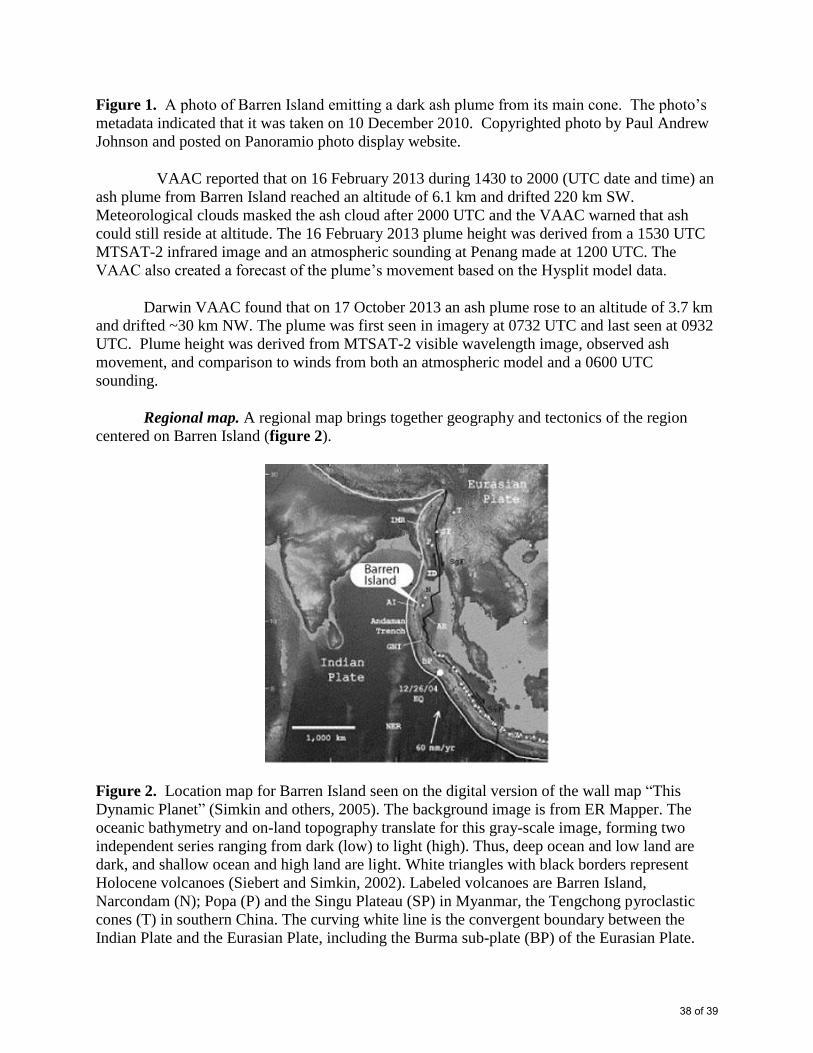
Figure 1. A photo of Barren Island emitting a dark ash plume from its main cone. The photo’s
metadata indicated that it was taken on 10 December 2010. Copyrighted photo by Paul Andrew
Johnson and posted on Panoramio photo display website.
VAAC reported that on 16 February 2013 during 1430 to 2000 (UTC date and time) an
ash plume from Barren Island reached an altitude of 6.1 km and drifted 220 km SW.
Meteorological clouds masked the ash cloud after 2000 UTC and the VAAC warned that ash
could still reside at altitude. The 16 February 2013 plume height was derived from a 1530 UTC
MTSAT-2 infrared image and an atmospheric sounding at Penang made at 1200 UTC. The
VAAC also created a forecast of the plume’s movement based on the Hysplit model data.
Darwin VAAC found that on 17 October 2013 an ash plume rose to an altitude of 3.7 km
and drifted ~30 km NW. The plume was first seen in imagery at 0732 UTC and last seen at 0932
UTC. Plume height was derived from MTSAT-2 visible wavelength image, observed ash
movement, and comparison to winds from both an atmospheric model and a 0600 UTC
sounding.
Regional map. A regional map brings together geography and tectonics of the region
centered on Barren Island (figure 2).
Figure 2. Location map for Barren Island seen on the digital version of the wall map “This
Dynamic Planet” (Simkin and others, 2005). The background image is from ER Mapper. The
oceanic bathymetry and on-land topography translate for this gray-scale image, forming two
independent series ranging from dark (low) to light (high). Thus, deep ocean and low land are
dark, and shallow ocean and high land are light. White triangles with black borders represent
Holocene volcanoes (Siebert and Simkin, 2002). Labeled volcanoes are Barren Island,
Narcondam (N); Popa (P) and the Singu Plateau (SP) in Myanmar, the Tengchong pyroclastic
cones (T) in southern China. The curving white line is the convergent boundary between the
Indian Plate and the Eurasian Plate, including the Burma sub-plate (BP) of the Eurasian Plate.
38 of 39
At Barren Island’s latitude, the convergent boundary is the subduction zone named the
Andaman trench; to the S is the Sumatran trench, and to the N is the continental-collision zone
marked by the Indo–Myanmar ranges (IMR) and still farther N and W, the Himalayan front. The
large white arrow shows the NNE relative-motion vector of ∼60 mm/yr for the Indian Plate and
the Eurasian PlateW of Sumatra. The 26 December 2004 Sumatran earthquake (Mw 9.3) is
marked by a white dot. Taken from Sanjeev Raghav (2011).
References: Luhr, J. F. and Haldar, D., 2006, Barren Island volcano (NE Indian Ocean):
island-arc high-alumina basalts produced by troctolite contamination; J. Volcanol. Geotherm.
Res., vol. 149, pp. 177–212.
Ray, J.S, Pande K., Awasthi, N. 2013, A minimum age for the active Barren Island
volcano, Andaman Sea, Current Science; Special Section: Earth Sciences, Vol. 104, No. 7, 10
April 2013.
Sanjeev, R. 2011, Barren Volcano- A Pictorial Journey From Recorded Past To Observed
Recent Part-I Earth Science India, Open Access e-Journal, Popular Issue, IV (III), July, 2011;
(URL: www.earthscienceindia.info ).
Siebert, L. and Simkin, T.,2002, Volcanoes of the world: an illustrated catalog of
Holocene volcanoes and their eruptions, Smithsonian Institution Global Volcanism Program,
Digital Information Series, GVP-3.
Simkin, T., Tilling, R.I., Vogt, P.R., Kirby, S., Kimberly, P., and Stewart, D.B. This
Dynamic Planet: World Map of Volcanoes, Earthquakes, Impact Craters, and Plate Tectonics
U.S. Geological Survey (2005).
Geologic Summary. Barren Island, a possession of India in the Andaman Sea about 135
km NE of Port Blair in the Andaman Islands, is the only historically active volcano along the N-
S-trending volcanic arc extending between Sumatra and Burma (Myanmar). The 354-m-high
island is the emergent summit of a volcano that rises from a depth of about 2,250 m. The small,
uninhabited 3-km-wide island contains a roughly 2-km-wide caldera with walls 250-350 m high.
The caldera, which is open to the sea on the west, was created during a major explosive eruption
in the late Pleistocene that produced pyroclastic-flow and -surge deposits. The morphology of a
fresh pyroclastic cone that was constructed in the center of the caldera has varied during the
course of historical eruptions. Lava flows fill much of the caldera floor and have reached the sea
along the western coast during historical eruptions.
Information Contacts: Darwin Volcanic Ash Advisory Centre (VAAC), Bureau of
Meteorology, Northern Territory Regional Office, PO Box 40050, Casuarina Northern Territory
0811 Australia; Twitter (URL:https://twitter.com/twitter); and VolcanoDiscovery (URL:
http://www.volcanodiscovery.com/).
39 of 39