Embed Size (px)
Citation preview

Table of Contents
UNITED STATESSECURITIES AND EXCHANGE COMMISSION
WASHINGTON, D.C. 20549
Form 10-K
(Mark One)
x ANNUAL REPORT PURSUANT TO SECTION 13 OR 15(d) OF THE SECURITIES EXCHANGE ACT OF1934
FOR THE FISCAL YEAR ENDED DECEMBER 31, 2015 OR
¨ TRANSITION REPORT PURSUANT TO SECTION 13 OR 15(d) OF THE SECURITIES EXCHANGE ACT OF1934
FOR THE TRANSITION PERIOD FROM TO Commission File Number: 001-35107
APOLLO GLOBAL MANAGEMENT, LLC(Exact name of Registrant as specified in its charter)
Delaware 20-8880053
(State or other jurisdiction of incorporation or organization) (I.R.S. Employer Identification No.)9 West 57th Street, 43rd Floor
New York, New York 10019(Address of principal executive offices) (Zip Code)
(212) 515-3200(Registrant’s telephone number, including area code)
Securities registered pursuant to Section 12(b) of the Act:
Title of each class Name of each exchange on which registeredClass A shares representing limited liability company interests New York Stock Exchange
Securities registered pursuant to Section 12(g) of the Act: None
Indicate by check mark if the Registrant is a well-known seasoned issuer, as defined in Rule 405 of the Securities. Yes x No ¨Indicate by check mark if the Registrant is not required to file reports pursuant to Section 13 or Section 15(d) of the Act. Yes ̈ No xIndicate by check mark whether the Registrant (1) has filed all reports required to be filed by Section 13 or 15(d) of the Securities Exchange Act of
1934 during the preceding 12 months (or for such shorter period that the Registrant was required to file such reports), and (2) has been subject to such filingrequirements for the past 90 days. Yes x No ¨
Indicate by check mark whether the registrant has submitted electronically and posted on its corporate Web site, if any, every Interactive Data Filerequired to be submitted and posted pursuant to Rule 405 of Regulation S-T (§232.405 of this chapter) during the preceding 12 months (or for such shorterperiod that the registrant was required to submit and post such files). Yes x No ¨
Indicate by check mark if disclosure of delinquent filers pursuant to Item 405 of Regulation S-K (§229.405 of this chapter) is not contained herein andwill not be contained, to the best of the Registrant’s knowledge, in definitive proxy or information statements incorporated by reference in Part III of thisForm 10-K or any amendment to this Form 10-K. x
Indicate by check mark whether the Registrant is a large accelerated filer, an accelerated filer, a non-accelerated filer or a smaller reporting company.See the definitions of “large accelerated filer”, “accelerated filer” and “smaller reporting company” in Rule 12b-2 of the Exchange Act.
Large accelerated filer T Accelerated filer ¨Non-accelerated filer o (Do not check if a smaller reporting company) Smaller reporting company ¨
Indicate by check mark whether the Registrant is a shell company (as defined in Rule 12b-2 of the Exchange Act). Yes ̈ No TThe aggregate market value of the Class A shares of the Registrant held by non-affiliates as of June 30, 2015 was approximately $3,787.7 million,
which includes non-voting Class A shares with a value of approximately $996.8 million.
As of February 26, 2016 there were 183,517,438 Class A shares and 1 Class B share outstanding.


Table of Contents
TABLE OF CONTENTS PagePART I ITEM 1. BUSINESS 8 ITEM 1A. RISK FACTORS 25 ITEM 1B. UNRESOLVED STAFF COMMENTS 71 ITEM 2. PROPERTIES 71 ITEM 3. LEGAL PROCEEDINGS 71 ITEM 4. MINE SAFETY DISCLOSURES 71 PART II ITEM 5. MARKET FOR REGISTRANT’S COMMON EQUITY, RELATED STOCKHOLDER MATTERS AND ISSUER PURCHASES OF
EQUITY SECURITIES72
ITEM 6. SELECTED FINANCIAL DATA 73 ITEM 7. MANAGEMENT’S DISCUSSION AND ANALYSIS OF FINANCIAL CONDITION AND RESULTS OF OPERATIONS 75 ITEM 7A. QUANTITATIVE AND QUALITATIVE DISCLOSURES ABOUT MARKET RISK 130 ITEM 8. FINANCIAL STATEMENTS AND SUPPLEMENTARY DATA 134 ITEM 8A. UNAUDITED SUPPLEMENTAL PRESENTATION OF STATEMENTS OF FINANCIAL CONDITION 212 ITEM 9. CHANGES AND DISAGREEMENTS WITH ACCOUNTANTS ON ACCOUNTING AND FINANCIAL DISCLOSURE 214 ITEM 9A. CONTROLS AND PROCEDURES 214 ITEM 9B. OTHER INFORMATION 215 PART III ITEM 10. DIRECTORS, EXECUTIVE OFFICERS AND CORPORATE GOVERNANCE 215 ITEM 11. EXECUTIVE COMPENSATION 220 ITEM 12. SECURITY OWNERSHIP OF CERTAIN BENEFICIAL OWNERS AND MANAGEMENT AND RELATED STOCKHOLDER
MATTERS228
ITEM 13. CERTAIN RELATIONSHIPS AND RELATED TRANSACTIONS 231 ITEM 14. PRINCIPAL ACCOUNTING FEES AND SERVICES 238 PART IV ITEM 15. EXHIBITS, FINANCIAL STATEMENT SCHEDULES 239 SIGNATURES 246
- 2-

Table of Contents
Forward-Looking StatementsThis report may contain forward-looking statements that are within the meaning of Section 27A of the Securities Act of 1933, as amended (the “SecuritiesAct”), and Section 21E of the Securities Exchange Act of 1934, as amended (the “Exchange Act”). These statements include, but are not limited to,discussions related to Apollo’s expectations regarding the performance of its business, liquidity and capital resources and the other non-historical statementsin the discussion and analysis. These forward-looking statements are based on management’s beliefs, as well as assumptions made by, and informationcurrently available to, management. When used in this report, the words “believe,” “anticipate,” “estimate,” “expect,” “intend” and similar expressions areintended to identify forward-looking statements. Although management believes that the expectations reflected in these forward-looking statements arereasonable, it can give no assurance that these expectations will prove to have been correct. These statements are subject to certain risks, uncertainties andassumptions, including risks relating to our dependence on certain key personnel, our ability to raise new private equity, credit or real estate funds, marketconditions generally, our ability to manage our growth, fund performance, changes in our regulatory environment and tax status, the variability of ourrevenues, net income and cash flow, our use of leverage to finance our businesses and investments by our funds and litigation risks, among others. We believethese factors include but are not limited to those described under the section entitled “Risk Factors” in this report; as such factors may be updated from timeto time in our periodic filings with the United States Securities and Exchange Commission (the “SEC”), which are accessible on the SEC’s website atwww.sec.gov. These factors should not be construed as exhaustive and should be read in conjunction with the other cautionary statements that are includedin this report and in our other filings. We undertake no obligation to publicly update or review any forward-looking statements, whether as a result of newinformation, future developments or otherwise, except as required by applicable law.
Terms Used in This ReportIn this report, references to “Apollo,” “we,” “us,” “our” and the “Company” refer collectively to Apollo Global Management, LLC, a Delaware limitedliability company, and its subsidiaries, including the Apollo Operating Group and all of its subsidiaries, or as the context may otherwise require;
“AMH” refers to Apollo Management Holdings, L.P., a Delaware limited partnership, that is an indirect subsidiary of Apollo Global Management, LLC;
“Apollo funds”, “our funds” and references to the “funds” we manage, refer to the funds (including the parallel funds and alternative investment vehicles ofsuch funds), partnerships, accounts, including strategic investment accounts or “SIAs,” alternative asset companies and other entities for which subsidiaries ofthe Apollo Operating Group provide investment management or advisory services;
“Apollo Operating Group” refers to (i) the limited partnerships through which our Managing Partners currently operate our businesses and (ii) one or morelimited partnerships formed for the purpose of, among other activities, holding certain of our gains or losses on our principal investments in the funds, whichwe refer to as our “principal investments”;
“Assets Under Management”, or “AUM”, refers to the assets we manage or advise for the funds, partnerships and accounts to which we provide investmentmanagement or advisory services, including, without limitation, capital that such funds, partnerships and accounts have the right to call from investorspursuant to capital commitments. Our AUM equals the sum of:
(i) the fair value of the investments of the private equity funds, partnerships and accounts we manage or advise plus thecapital that such funds, partnerships and accounts are entitled to call from investors pursuant to capital commitments;
(ii) the net asset value, or “NAV,” of the credit funds, partnerships and accounts for which we provide investmentmanagement or advisory services, other than certain collateralized loan obligations (“CLOs”) and collateralized debtobligations (“CDOs”), which have a fee-generating basis other than the mark-to-market value of the underlyingassets, plus used or available leverage and/or capital commitments;
(iii) the gross asset value or net asset value of the real estate funds, partnerships and accounts we manage, and thestructured portfolio company investments of the funds, partnerships and accounts we manage or advise, whichincludes the leverage used by such structured portfolio company investments;
(iv) the incremental value associated with the reinsurance investments of the portfolio company assets we manage oradvise; and
(v) the fair value of any other assets that we manage or advise for the funds, partnerships and accounts to which weprovide investment management or advisory services, plus unused
- 3-

Table of Contents
credit facilities, including capital commitments to such funds, partnerships and accounts for investments that mayrequire pre-qualification before investment plus any other capital commitments to such funds, partnerships andaccounts available for investment that are not otherwise included in the clauses above.
Our AUM measure includes Assets Under Management for which we charge either no or nominal fees. In addition our AUM measure includes certain assetsfor which we do not have investment discretion. Our definition of AUM is not based on any definition of Assets Under Management contained in ouroperating agreement or in any of our Apollo fund management agreements. We consider multiple factors for determining what should be included in ourdefinition of AUM. Such factors include but are not limited to (1) our ability to influence the investment decisions for existing and available assets; (2) ourability to generate income from the underlying assets in our funds; and (3) the AUM measures that we use internally or believe are used by other investmentmanagers. Given the differences in the investment strategies and structures among other alternative investment managers, our calculation of AUM may differfrom the calculations employed by other investment managers and, as a result, this measure may not be directly comparable to similar measures presented byother investment managers. Our calculation also differs from the manner in which our affiliates registered with the SEC report “Regulatory Assets UnderManagement” on Form ADV and Form PF in various ways;
“Fee-Generating AUM” consists of assets we manage or advise for the funds, partnerships and accounts to which we provide investment management oradvisory services and on which we earn management fees, monitoring fees pursuant to management or other fee agreements on a basis that varies among theApollo funds, partnerships and accounts we manage or advise. Management fees are normally based on “net asset value,” “gross assets,” “adjusted par assetvalue,” “adjusted cost of all unrealized portfolio investments,” “capital commitments,” “adjusted assets,” “stockholders’ equity,” “invested capital” or“capital contributions,” each as defined in the applicable management agreement. Monitoring fees, also referred to as advisory fees, with respect to thestructured portfolio company investments of the funds, partnerships and accounts we manage or advise, are generally based on the total value of suchstructured portfolio company investments, which normally includes leverage, less any portion of such total value that is already considered in Fee-Generating AUM.
“Non-Fee-Generating AUM” refers to AUM that does not produce management fees or monitoring fees. This measure generally includes the following:
(i) fair value above invested capital for those funds that earn management fees based on invested capital;
(ii) net asset values related to general partner and co-investment interests;
(iii) unused credit facilities;
(iv) available commitments on those funds that generate management fees on invested capital;
(v) structured portfolio company investments that do not generate monitoring fees; and
(vi) the difference between gross asset and net asset value for those funds that earn management fees based on net assetvalue.
“Carry-Eligible AUM” refers to the AUM that may eventually produce carried interest income. All funds for which we areentitled to receive a carried interest income allocation are included in Carry-Eligible AUM, which consists of the following:
(i) “Carry-Generating AUM”, which refers to invested capital of the funds, partnerships, and accounts we manage or advise, that iscurrently above its hurdle rate or preferred return, and profit of such funds, partnerships and accounts is beingallocated to the general partner in accordance with the applicable limited partnership agreements or other governingagreements;
(ii) “AUM Not Currently Generating Carry”, which refers to invested capital of the funds, partnerships and accounts wemanage or advise that is currently below its hurdle rate or preferred return; and
(iii) “Uninvested Carry-Eligible AUM”, which refers to capital of the funds, partnerships and accounts we manage oradvise that is available for investment or reinvestment subject to the provisions of applicable limited partnershipagreements or other governing agreements, which capital is not currently part of the NAV or fair value ofinvestments that may eventually produce carried interest income allocable to the general partner.
- 4-

Table of Contents
“AUM with Future Management Fee Potential” refers to the committed uninvested capital portion of total AUM notcurrently earning management fees. The amount depends on the specific terms and conditions of each fund.
We use Non-Fee-Generating AUM combined with Fee-Generating AUM as a performance measure of our funds’ investment activities, as well as to monitorfund size in relation to professional resource and infrastructure needs. Non-Fee-Generating AUM includes assets on which we could earn carried interestincome;
“capital deployed” or “deployment” is the aggregate amount of capital that has been invested during a given period (which may, in certain cases, includeleverage) by (i) our drawdown funds, (ii) SIAs that have a defined maturity date and (iii) funds and SIAs in our real estate debt strategy;
“carried interest”, “carried interest income” and “incentive income” refer to interests granted to Apollo by an Apollo fund that entitle Apollo to receiveallocations, distributions or fees which are based on the performance of such fund or its underlying investments;
“Contributing Partners” refer to those of our partners and their related parties (other than our Managing Partners) who indirectly beneficially own (throughHoldings) Apollo Operating Group units;
“drawdown” refers to commitment-based funds and certain SIAs in which investors make a commitment to provide capital at the formation of such funds andSIAs and deliver capital when called as investment opportunities become available. It includes assets of Athene Holding Ltd. (“Athene Holding”) and itssubsidiaries (collectively “Athene”) managed by Athene Asset Management, L.P. (“Athene Asset Management”) that are invested in commitment-basedfunds;
“gross IRR” of a private equity fund represents the cumulative investment-related cash flows in the fund itself (and not any one investor in the fund) on thebasis of the actual timing of investment inflows and outflows (for unrealized investments assuming disposition on December 31, 2015 or other date specified)aggregated on a gross basis quarterly, and the return is annualized and compounded before management fees, carried interest and certain other fund expenses(including interest incurred by the fund itself) and measures the returns on the fund’s investments as a whole without regard to whether all of the returnswould, if distributed, be payable to the fund’s investors;
“gross IRR” of a credit fund represents the annualized return of a fund based on the actual timing of all cumulative fund cash flows before management fees,carried interest income allocated to the general partner and certain other fund expenses. Calculations may include certain investors that do not pay fees. Theterminal value is the net asset value as of the reporting date. Non-U.S. dollar denominated (“USD”) fund cash flows and residual values are converted to USDusing the spot rate as of the reporting date;
“gross IRR” of a real estate fund represents the cumulative investment-related cash flows in the fund itself (and not any one investor in the fund), on the basisof the actual timing of cash inflows and outflows (for unrealized investments assuming disposition on December 31, 2015 or other date specified) starting onthe date that each investment closes, and the return is annualized and compounded before management fees, carried interest, and certain other fund expenses(including interest incurred by the fund itself) and measures the returns on the fund’s investments as a whole without regard to whether all of the returnswould, if distributed, be payable to the fund’s investors. Non-USD fund cash flows and residual values are converted to USD using the spot rate as of thereporting date;
“gross return” of a credit or real estate fund is the monthly or quarterly time-weighted return that is equal to the percentage change in the value of a fund’sportfolio, adjusted for all contributions and withdrawals (cash flows) before the effects of management fees, incentive fees allocated to the general partner, orother fees and expenses. Returns of Athene sub-advised portfolios and CLOs represent the gross returns on invested assets, which exclude cash. Returns overmultiple periods are calculated by geometrically linking each period’s return over time;
“Holdings” means AP Professional Holdings, L.P., a Cayman Islands exempted limited partnership through which our Managing Partners and ContributingPartners indirectly beneficially own their interests in the Apollo Operating Group units;
“inflows” represents (i) at the individual segment level, subscriptions, commitments, and other increases in available capital, such as acquisitions or leverage,net of inter-segment transfers, and (ii) on an aggregate basis, the sum of inflows across the private equity, credit and real estate segments;
“IRS” refers to the Internal Revenue Service;
“liquid/performing” includes CLOs and other performing credit vehicles, hedge fund style credit funds, structured credit funds and SIAs, as well as sub-advised managed accounts owned by or related to Athene. Certain commitment-based SIAs are included as the underlying assets are liquid;
- 5-

Table of Contents
“Managing Partners” refer to Messrs. Leon Black, Joshua Harris and Marc Rowan collectively and, when used in reference to holdings of interests in Apolloor Holdings, includes certain related parties of such individuals;
“net IRR” of a private equity fund means the gross IRR, including returns for related parties which may not pay fees or carried interest, net of managementfees, certain fund expenses (including interest incurred by the fund itself) and realized carried interest all offset to the extent of interest income, and measuresreturns on amounts that, if distributed, would be paid to investors of the fund. To the extent that an Apollo private equity fund exceeds all requirementsdetailed within the applicable fund agreement, the estimated unrealized value is adjusted such that a percentage of up to 20.0% of the unrealized gain isallocated to the general partner of the fund, thereby reducing the balance attributable to fund investors. Net IRR does not represent the return to any fundinvestor;
“net IRR” of a credit fund represents the annualized return of a fund after management fees, carried interest income allocated to the general partner andcertain other fund expenses, calculated on investors that pay such fees. The terminal value is the net asset value as of the reporting date. Non-USD fund cashflows and residual values are converted to USD using the spot rate as of the reporting date;
“net IRR” of a real estate fund represents the cumulative cash flows in the fund (and not any one investor in the fund), on the basis of the actual timing ofcash inflows received from and outflows paid to investors of the fund (assuming the ending net asset value as of December 31, 2015 or other date specified ispaid to investors), excluding certain non-fee and non-carry bearing parties, and the return is annualized and compounded after management fees, carriedinterest, and certain other expenses (including interest incurred by the fund itself) and measures the returns to investors of the fund as a whole. Non-USD fundcash flows and residual values are converted to USD using the spot rate as of the reporting date;
“net return” of a credit or real estate fund represents the gross return after management fees, incentive fees allocated to the general partner, or other fees andexpenses. Returns of Athene sub-advised portfolios and CLOs represent the gross or net returns on invested assets, which exclude cash. Returns over multipleperiods are calculated by geometrically linking each period’s return over time;
“our manager” means AGM Management, LLC, a Delaware limited liability company that is controlled by our Managing Partners;
“permanent capital vehicles” refers to (a) assets that are managed by Athene Asset Management and Athene Deutschland and its subsidiaries (“AtheneGermany”), (b) assets that are owned by or related to MidCap FinCo Limited (“MidCap”) and managed by Apollo Capital Management, L.P., (c) assets ofpublicly traded vehicles managed by Apollo such as AP Alternative Assets, L.P. (“AAA”), Apollo Investment Corporation (“AINV”), Apollo CommercialReal Estate Finance, Inc. (“ARI”), Apollo Residential Mortgage, Inc. (“AMTG”), Apollo Tactical Income Fund Inc. (“AIF”), and Apollo Senior Floating RateFund Inc. (“AFT”), in each case that do not have redemption provisions or a requirement to return capital to investors upon exiting the investments madewith such capital, except as required by applicable law and (d) a non-traded business development company sub-advised by Apollo. The investmentmanagement arrangements of AINV, AIF and AFT have one year terms, are reviewed annually and remain in effect only if approved by the boards of directorsof such companies or by the affirmative vote of the holders of a majority of the outstanding voting shares of such companies, including in either case,approval by a majority of the directors who are not “interested persons” as defined in the Investment Company Act of 1940. In addition, the investmentmanagement arrangements of AINV, AIF and AFT may be terminated in certain circumstances upon 60 days’ written notice. The investment managementarrangements of ARI and AMTG have one year terms and are reviewed annually by each company’s board of directors and may be terminated under certaincircumstances by an affirmative vote of at least two-thirds of such company’s independent directors. The investment management arrangements betweenMidCap and Apollo Capital Management, L.P. and Athene and Athene Asset Management, may also be terminated under certain circumstances;
“private equity investments” refer to (i) direct or indirect investments in existing and future private equity funds managed or sponsored by Apollo, (ii) director indirect co-investments with existing and future private equity funds managed or sponsored by Apollo, (iii) direct or indirect investments in securitieswhich are not immediately capable of resale in a public market that Apollo identifies but does not pursue through its private equity funds, and(iv) investments of the type described in (i) through (iii) above made by Apollo funds;
“Realized Value” refers to all cash investment proceeds received by the relevant Apollo fund, including interest and dividends, but does not give effect tomanagement fees, expenses, incentive compensation or carried interest to be paid by such Apollo fund;
“Remaining Cost” represents the initial investment of the general partner and limited partner investors in a fund, reduced for any return of capital distributedto date, excluding management fees, expenses, and any accrued preferred return;
“Strategic Investors” refer to the California Public Employees’ Retirement System, or “CalPERS,” and an affiliate of the Abu Dhabi Investment Authority, or“ADIA”;
- 6-

Table of Contents
“Total Invested Capital” refers to the aggregate cash invested by the relevant Apollo fund and includes capitalized costs relating to investment activities, ifany, but does not give effect to cash pending investment or available for reserves;
“Total Value” represents the sum of the total Realized Value and Unrealized Value of investments;
“traditional private equity fund appreciation (depreciation)” refers to gain (loss) and income for the traditional private equity funds (i.e., Funds I-VIII, each asdefined in the notes to the consolidated financial statements) for the periods presented on a total return basis before giving effect to fees and expenses. Theperformance percentage is determined by dividing (a) the change in the fair value of investments over the period presented, minus the change in investedcapital over the period presented, plus the realized income for the period presented, by (b) the beginning unrealized value for the period presented plus thechange in invested capital for the period presented; and
“Unrealized Value” refers to the fair value consistent with valuations determined in accordance with generally accepted accounting principles in the UnitedStates of America (“U.S. GAAP”), for investments not yet realized and may include pay in kind, accrued interest and dividends receivable, if any. In addition,amounts include committed and funded amounts for certain investments.
- 7-

Table of Contents
PART I.
ITEM 1. BUSINESSOverview
Founded in 1990, Apollo is a leading global alternative investment manager. We are a contrarian, value-oriented investment manager in privateequity, credit and real estate, with significant distressed investment expertise. We have a flexible mandate in many of the funds we manage which enables ourfunds to invest opportunistically across a company’s capital structure. We raise, invest and manage funds on behalf of some of the world’s most prominentpension, endowment and sovereign wealth funds, as well as other institutional and individual investors. As of December 31, 2015, we had total AUM of $170billion, including approximately $38 billion in private equity, $121 billion in credit and $11 billion in real estate. We have consistently produced attractivelong-term investment returns in our private equity funds, generating a 39% gross IRR and a 25% net IRR on a compound annual basis from inceptionthrough December 31, 2015.
Apollo is led by our Managing Partners, Leon Black, Joshua Harris and Marc Rowan, who have worked together for more than 25 years and lead ateam of 945 employees, including 353 investment professionals, as of December 31, 2015. This team possesses a broad range of transaction, financial,managerial and investment skills. We have offices in New York, Los Angeles, Houston, Chicago, Bethesda, Toronto, London, Frankfurt, Madrid,Luxembourg, Mumbai, Delhi, Singapore, Hong Kong and Shanghai. We operate our private equity, credit and real estate investment management businessesin a highly integrated manner, which we believe distinguishes us from other alternative investment managers. Our investment professionals frequentlycollaborate across disciplines. We believe that this collaboration, including market insight, management, banking and consultant contacts, and investmentopportunities, enables the funds we manage to more successfully invest across a company’s capital structure. This platform and the depth and experience ofour investment team have enabled us to deliver strong long-term investment performance for our funds throughout a range of economic cycles.
Our objective is to achieve superior long-term risk-adjusted returns for our fund investors. The majority of the investment funds we manage aredesigned to invest capital over periods of seven or more years from inception, thereby allowing us to generate attractive long-term returns throughouteconomic cycles. Our investment approach is value-oriented, focusing on nine core industries in which we have considerable knowledge and experience, andemphasizing downside protection and the preservation of capital. Our core industry sectors include chemicals, natural resources, consumer and retail,distribution and transportation, financial and business services, manufacturing and industrial, media and cable and leisure, packaging and materials and thesatellite and wireless industries. Our contrarian investment management approach is reflected in a number of ways, including:
• our willingness to pursue investments in industries that our competitors typically avoid;• the often complex structures employed in some of the investments of our funds, including our willingness to pursue difficult corporate carve-out
transactions;• our experience investing during periods of uncertainty or distress in the economy or financial markets when many of our competitors simply
reduce their investment activity;• our orientation towards sole sponsored transactions when other firms have opted to partner with others; and• our willingness to undertake transactions that have substantial business, regulatory or legal complexity.
We have applied this investment philosophy to identify what we believe are attractive investment opportunities, deploy capital across the balancesheet of industry leading, or “franchise,” businesses and create value throughout economic cycles.
We rely on our deep industry, credit and financial structuring experience, coupled with our strengths as a value-oriented, distressed investmentmanager, to deploy significant amounts of new capital within challenging economic environments. Our approach towards investing in distressed situationsoften requires our funds to purchase particular debt securities as prices are declining, since this allows us both to reduce our funds’ average cost andaccumulate sizable positions which may enhance our ability to influence any restructuring plans and maximize the value of our funds’ distressedinvestments. As a result, our investment approach may produce negative short-term unrealized returns in certain of the funds we manage. However, weconcentrate on generating attractive, long-term, risk-adjusted realized returns for our fund investors, and we therefore do not overly depend on short-termresults and quarterly fluctuations in the unrealized fair value of the holdings in our funds.
In addition to deploying capital in new investments, we seek to enhance value in the investment portfolios of the funds we manage. We have reliedon our transaction, restructuring and credit experience to work proactively with our private equity funds’ portfolio company management teams to identifyand execute strategic acquisitions, joint ventures, and other transactions, generate cost and working capital savings, reduce capital expenditures, andoptimize capital structures through several means such as debt exchange offers and the purchase of portfolio company debt at discounts to par value.
- 8-

•
•••
•••
•
•
•
Table of Contents
We have grown our total AUM at a 23% compound annual growth rate from December 31, 2005 to December 31, 2015. In addition, we benefit frommandates with long-term capital commitments in our private equity, credit and real estate businesses. Our long-lived capital base allows us to invest ourfunds' assets with a long-term focus, which is an important component in generating attractive returns for our fund investors. We believe the long-term capitalwe manage also leaves us well-positioned during economic downturns, when the fundraising environment for alternative assets has historically been morechallenging than during periods of economic expansion. As of December 31, 2015, more than 90% of our AUM was in funds with a contractual life atinception of seven years or more, and 49% of our AUM was in permanent capital vehicles.
We expect our growth in AUM to continue over time by seeking to create value in our funds’ existing private equity, credit and real estateinvestments, continuing to deploy our funds’ available capital in what we believe are attractive investment opportunities, and raising new funds andinvestment vehicles as market opportunities present themselves. See “Item 1A. Risk Factors—Risks Related to Our Businesses—We may not be successful inraising new funds or in raising more capital for certain of our funds and may face pressure on carried interest and fee arrangements of our future funds.”
Our financial results are highly variable, since carried interest (which generally constitutes a large portion of the income that we receive from thefunds we manage), and the transaction and advisory fees that we receive, can vary significantly from quarter to quarter and year to year. We manage ourbusiness and monitor our performance with a focus on long-term performance, an approach that is generally consistent with the investment horizons of thefunds we manage and is driven by the investment returns of our funds.
Our Businesses
We have three business segments: private equity, credit and real estate. The diagram below summarizes our current businesses:
Apollo Global Management, LLC(1)
Private Equity Credit Real Estate
Distressed Buyouts, Debt andOther Investments Corporate Carve-outs Opportunistic Buyouts Natural Resources
Liquid/Performing Drawdown Permanent Capital Vehicles exAthene-Non-Sub-Advised Athene Non-Sub-Advised
Opportunistic equity investing inreal estate assets, portfolios,companies and platforms Commercial real estate debtinvestments including First Mortgageand Mezzanine Loans andCommercial Mortgage BackedSecurities
AUM: $37.5 billion(2) AUM: $121.4 billion(2)(3) AUM: $11.3 billion(2)(3)(4)
Strategic Investment AccountsGenerally invests in or alongside certain Apollo funds
and other Apollo-sponsored transactions
(1) All data is as of December 31, 2015.(2) See Item 7. "Management's Discussion and Analysis of Financial Condition and Results of Operations" for additional information.(3) Includes funds that are denominated in Euros and translated into U.S. dollars at an exchange rate of €1.00 to $1.09 as of December 31, 2015.(4) Includes funds that are denominated in pound sterling and translated into U.S. dollars at an exchange rate of £1.00 to $1.47 as of December 31, 2015.
- 9-

Table of Contents
Private EquityAs a result of our long history of private equity investing across market cycles, we believe we have developed a unique set of skills on which we rely
to make new investments and to maximize the value of our existing investments. As an example, through our experience with traditional private equitybuyouts, which we also refer to herein as buyout equity, we apply a highly disciplined approach towards structuring and executing transactions, the keytenets of which include seeking to acquire companies at below industry average purchase price multiples, and establishing flexible capital structures withlong-term debt maturities and few, if any, financial maintenance covenants.
We believe we have a demonstrated ability to adapt quickly to changing market environments and capitalize on market dislocations through ourtraditional, distressed and corporate buyout approach. In prior periods of strained financial liquidity and economic recession, our private equity funds havemade attractive investments by buying the debt of quality businesses (which we refer to as “classic” distressed debt), converting that debt to equity, seekingto create value through active participation with management and ultimately monetizing the investment. This combination of traditional and corporatebuyout investing with a “distressed option” has been deployed through prior economic cycles and has allowed our funds to achieve attractive long-term ratesof return in different economic and market environments. In addition, during prior economic downturns we have relied on our restructuring experience andworked closely with our funds’ portfolio companies to seek to maximize the value of our funds’ investments.
We seek to focus on investment opportunities where competition is limited or non-existent. We believe we are often sought out early in theinvestment process because of our industry expertise, sizable amounts of available long-term capital, willingness to pursue investments in complicatedsituations and ability to provide value-added advice to portfolio companies regarding operational improvements, acquisitions and strategic direction. Wegenerally prefer sole sponsored transactions and since inception through December 31, 2015, approximately 75% of the investments made by our privateequity funds have been proprietary in nature. We believe that by emphasizing our proprietary sources of deal flow, our private equity funds will be able toacquire businesses at more compelling valuations which will ultimately create a more attractive risk/reward proposition. As of December 31, 2015, ourprivate equity segment had total and Fee-Generating AUM of approximately $37.5 billion and $29.3 billion, respectively.
Distressed Buyouts, Debt and Other InvestmentsDuring periods of market dislocation and volatility, we rely on our credit and capital markets expertise to build positions in distressed debt. We
target assets with what we believe are high-quality operating businesses but low-quality balance sheets, consistent with our traditional buyout strategies. Thedistressed securities our funds purchase include bank debt, public high-yield debt and privately held instruments, often with significant downside protectionin the form of a senior position in the capital structure, and in certain situations our funds also provide debtor-in-possession financing to companies inbankruptcy. Our investment professionals generate these distressed buyout and debt investment opportunities based on their many years of experience in thedebt markets, and as such they are generally proprietary in nature.
We believe distressed buyouts and debt investments represent a highly attractive risk/reward profile. Our funds’ investments in debt securities havegenerally resulted in two outcomes. The first and preferred potential outcome, which we refer to as a distressed for control investment, is when our funds aresuccessful in taking control of a company through its investment in the distressed debt. By working proactively through the restructuring process, we areoften able to equitize the debt position of our funds to create a well-financed buyout which would then typically be held by the fund for a three-to-five yearperiod, similar to other traditional leveraged buyout transactions. The second potential outcome, which we refer to as a non-control distressed investment iswhen our funds do not gain control of the company. This typically occurs as a result of an increase in the price of the debt investments to levels which arehigher than what we consider to be an attractive acquisition valuation. In these instances, we may forgo seeking control, and instead our funds may seek tosell the debt investments over time, typically generating a higher short-term IRR with a lower multiple of invested capital than in the case of a typicaldistressed for control transaction. We believe that we are a market leader in distressed investing and that this is one of the key areas that differentiates us fromour peers.
We also maintain the flexibility to deploy capital of our private equity funds in other types of investments such as the creation of new companies,which allows us to leverage our deep industry and distressed expertise and collaborate with experienced management teams to seek to capitalize on marketopportunities that we have identified, particularly in asset-intensive industries that are in distress. In these types of situations, we have the ability to establishnew entities that can acquire distressed assets at what we believe are attractive valuations without the burden of managing an existing portfolio of legacyassets. Other investments, such as the creation of new companies, historically have not represented a large portion of our overall investment activities,although our private equity funds do make these types of investments selectively.
- 10-

Table of Contents
Corporate Carve-outs
Corporate Carve-outs are less market-dependent than distressed investing, but are equally complicated. In these transactions, Apollo funds seek toextract a business that is highly integrated within a larger corporate parent to create a stand-alone business. These are labor-intensive transactions, which webelieve require deep industry knowledge, patience and creativity, to unlock value that has largely been overlooked or undermanaged. Importantly, becauseof the highly negotiated nature of many of these transactions, Apollo believes it is often difficult for the seller to run a competitive process, which ultimatelyallows Apollo funds to achieve compelling purchase prices.
Opportunistic Buyouts
We have extensive experience completing leveraged buyouts across various market cycles. We take an opportunistic and disciplined approach tothese transactions, generally avoiding highly competitive situations in favor of proprietary transactions where there may be opportunities to purchase acompany at a discount to prevailing market averages. Oftentimes, we will focus on complex situations such as out-of-favor industries or “broken” (ordiscontinued) sales processes where the inherent value may be less obvious to potential acquirers. In the case of more conventional buyouts, we seekinvestment opportunities where we believe our focus on complexity and sector expertise will provide us with a significant competitive advantage, wherebywe can leverage our knowledge and experience from the nine core industries in which our investment professionals have historically invested private equitycapital. We believe such knowledge and experience can result in our ability to find attractive opportunities for our funds to acquire portfolio companyinvestments at lower purchase price multiples.
To further alter the risk/reward profile in our funds’ favor, we often focus on certain types of buyouts such as physical asset acquisitions andinvestments in non-correlated assets where underlying values tend to change in a manner that is independent of broader market movements In the case ofphysical asset acquisitions, our private equity funds seek to acquire physical assets at discounts to where those assets trade in the financial markets, and tolock in that value arbitrage through comprehensive hedging and structural enhancements.
We believe buyouts of non-correlated assets or businesses also represent attractive investments since they are generally less correlated to the broadereconomy and provide an element of diversification to our funds' overall portfolio of private equity investments.
Natural Resources
In addition to our traditional private equity funds which pursue opportunities in nine core industries, one of which is natural resources, we have twodedicated private equity natural resources funds. In 2011, we established our first dedicated private equity natural resources fund, Apollo Natural ResourcesPartners, L.P. (together with its alternative investment vehicles, “ANRP I”) and assembled a team of dedicated investment professionals to capitalize onprivate equity investment opportunities in the natural resources industry, principally in the metals and mining, energy and select other natural resourcessectors. In 2015, we launched our second natural resources fund, Apollo Natural Resources II, L.P. (together with its alternative investment vehicles, “ANRPII”). We believe we can source and execute compelling, value-oriented investment opportunities for our funds irrespective of the commodity priceenvironment.
AP Alternative Assets, L.P.
We also manage AAA, a publicly listed permanent capital vehicle. The sole investment held by AAA is its investment in AAA Investments, L.P.(“AAA Investments”). AAA Investments is the largest equity holder of Athene Holding.
AAA is a Guernsey limited partnership whose partners are comprised of (i) AAA Guernsey Limited (“AAA Guernsey”), which holds 100% of thegeneral partner interests in AAA, and (ii) the holders of common units representing limited partner interests in AAA. The common units are non-voting andare listed on NYSE Euronext in Amsterdam under the symbol “AAA”. AAA Guernsey is a Guernsey limited company and is owned 55% by an individual whois not an affiliate of Apollo and 45% by Apollo Principal Holdings III, L.P., an indirect subsidiary of Apollo. AAA Guernsey is responsible for managing thebusiness and affairs of AAA. AAA generally makes all of its investments through AAA Investments, of which AAA is the sole limited partner. Athene Holdingis AAA Investments’ only investment.
- 11-

Table of Contents
Building Value in Portfolio Companies
We are a “hands-on” investor organized around nine core industries where we believe we have significant knowledge and expertise, and we remainactively engaged with the management teams of the portfolio companies of our private equity funds. We have established relationships with operatingexecutives that assist in the diligence review of new opportunities and provide strategic and operational oversight for portfolio investments. We activelywork with the management of each of the portfolio companies of the funds we manage to maximize the underlying value of the business. To achieve this, wetake a holistic approach to value-creation, concentrating on both the asset side and liability side of the balance sheet of a company. On the asset side of thebalance sheet, Apollo works with management of the portfolio companies to enhance the operations of such companies. Our investment professionals assistportfolio companies in rationalizing non-core and underperforming assets, generating cost and working capital savings, and maximizing liquidity. On theliability side of the balance sheet, Apollo relies on its deep credit structuring experience and works with management of the portfolio companies to helpoptimize the capital structure of such companies through proactive restructuring of the balance sheet to address near-term debt maturities. The companies inwhich our private equity funds invest also seek to capture discounts on publicly traded debt securities through exchange offers and potential debt buybacks.In addition, we have established a group purchasing program to help our funds' portfolio companies leverage the combined corporate spending amongApollo and portfolio companies of the funds it manages in order to seek to reduce costs, optimize payment terms and improve service levels for all programparticipants.
Exiting InvestmentsThe value of the investments that have been made by our funds are typically realized through either an initial public offering of common stock on a
nationally recognized exchange or through the private sale of the companies in which our funds have invested. We believe the advantage of having long-lived funds and investment discretion is that we are able to time our funds’ exit to maximize value.
Private Equity Fund HoldingsThe following table presents a list of certain significant portfolio companies of our private equity funds as of December 31, 2015:
- 12-

Table of Contents
Company Year of Initial
Investment Fund(s) Buyout Type Industry Region
Amissima 2015 Fund VIII Corporate Carve-Out Financial & Business
Services Western Europe
CH2M Hill 2015 Fund VIII Opportunistic Buyout Financial & Business
Services North America
Presidio 2015 Fund VIII Opportunistic Buyout Financial & Business
Services North America
Protection 1 2015 Fund VIII Opportunistic Buyout Manufacturing &
Industrial North America
RegionalCare 2015 Fund VIII Opportunistic Buyout Consumer & Retail North America
Tranquilidade 2015 Fund VIII Opportunistic Buyout Financial & Business
Services Western Europe
Vectra 2015 Fund VIII Corporate Carve-Out Manufacturing &
Industrial North America
Ventia 2015 Fund VIII Opportunistic Buyout Financial & Business
Services Australia
Verallia 2015 Fund VIII Corporate Carve-Out Manufacturing &
Industrial Western Europe
CEC Entertainment 2014 Fund VIII Opportunistic Buyout Media, Cable &
Leisure North America
Caelus Energy Alaska 2014 Fund VIII / ANRP Corporate Carve-Out Natural Resources North America
Double Eagle II 2014 ANRP /ANRP II Opportunistic Buyout Natural Resources North America
Express Energy Services 2014 Fund VIII / ANRP Opportunistic Buyout Natural Resources North America
Jupiter Resources 2014 Fund VIII / ANRP Corporate Carve-out Natural Resources North America
American Gaming Systems 2013 Fund VIII Opportunistic Buyout Media, Cable &
Leisure North America
Aurum 2013 Fund VII Opportunistic Buyout Consumer & Retail Western Europe
Hostess 2013 Fund VII Corporate Carve-out Consumer & Retail North America
McGraw-Hill Education 2013 Fund VII Corporate Carve-out Media, Cable &
Leisure North America
EP Energy 2012 Fund VII & ANRP Corporate Carve-out Natural Resources North America
Pinnacle 2012 Fund VII & ANRP Opportunistic Buyout Natural Resources North America
Talos 2012 Fund VII & ANRP Opportunistic Buyout Natural Resources North America
Endemol Shine 2011 Fund VII Distressed Buyout Media, Cable &
Leisure Global
Welspun 2011 Fund VII & ANRP Opportunistic Buyout Natural Resources India
Gala Coral Group 2010 Fund VII & VI Distressed Buyout Media, Cable &
Leisure Western Europe
Caesars Entertainment (1) 2008 Fund VI Opportunistic Buyout Media, Cable &
Leisure North America
Norwegian Cruise Line 2008 Fund VII / VI Opportunistic Buyout Media, Cable &
Leisure North America
Claire’s 2007 Fund VI Opportunistic Buyout Consumer & Retail Global
CEVA Logistics 2006 Fund VI Corporate Carve-out Distribution &Transportation Western Europe
Momentive PerformanceMaterials 2006 Fund VI Corporate Carve-out Chemicals North America
Hexion Various Fund IV & V Corporate Carve-out Chemicals North America
Debt Investment Vehicles Various Various Debt Investments Various Various
- 13-

Table of Contents
Note: The table above includes portfolio companies of Apollo Investment Fund IV, L.P. (together with its parallel funds, “Fund IV”), Apollo InvestmentFund V, L.P. (together with is parallel funds and alternative investment vehicles, “Fund V”), Apollo Investment Fund VI L.P. (together with its parallel fundsand alternative investment vehicles, “Fund VI”), Apollo Investment Fund VII, L.P. (together with is parallel funds and alternative investment vehicles, “FundVII”), Apollo Investment Fund VIII, L.P. (together with is parallel funds and alternative investment vehicles, “Fund VIII”) and ANRP I, ANRP II and AIONCapital Partners Limited (“AION”) with a remaining value greater than $100 million, excluding the value associated with any portion of such private equityfunds' portfolio company investments held by co-investment vehicles.
(1) Includes investment in Caesars Entertainment Corp. and Caesars Acquisition Company.
CreditSince Apollo’s founding in 1990, we believe our expertise in credit has served as an integral component of our company’s growth and success. Our
credit-oriented approach to investing commenced in 1990 with the management of a high-yield bond and leveraged loan portfolio. Since that time, our creditactivities have grown significantly, through both organic growth and strategic acquisitions. As of December 31, 2015, Apollo’s credit segment had totalAUM and Fee-Generating AUM of $121.4 billion and $101.5 billion, respectively, across a diverse range of credit-oriented investments that utilize the samedisciplined, value-oriented investment philosophy that we employ with respect to our private equity funds. Apollo’s broad credit platform, which we believeis adaptable to evolving market conditions and different risk tolerances, is categorized as follows:
Credit AUM as of December 31, 2015(in billions)
Liquid/Performing
Our liquid/performing category within the credit segment generally includes funds and accounts where the underlying assets are liquid in natureand/or have some form of periodic redemption right. Liquid/performing includes a variety of hedge funds, CLOs and SIAs that utilize a range of investmentstrategies including performing credit, structured credit, and liquid opportunistic credit. Performing credit strategies focus on income-oriented, senior loanand bond investment strategies that target issuers primarily domiciled in the U.S. and in Europe. Structured credit strategies target multiple tranches ofstructured securities with favorable and protective lending terms, predictable payment schedules, well diversified portfolios and low default rates. Liquidopportunistic strategies primarily focus on credit investments that are generally liquid in nature and that utilize a similar value-oriented investmentphilosophy as our private equity business. This includes investments by our credit funds in a broad array of primary and secondary opportunitiesencompassing stressed and distressed public and private securities primarily within corporate credit, including senior loans (secured and unsecured), highyield, mezzanine, derivative securities, debtor in possession financings, rescue or bridge financings, and other debt investments. In aggregate, our AUM andFee-Generating AUM within the liquid/performing category totaled $37.2 billion and $30.6 billion, respectively, as of December 31, 2015.
- 14-

Table of Contents
Hedge Funds
Hedge Funds includes Apollo Credit Strategies Master Fund Ltd., Apollo Credit Master Fund Ltd., Apollo Credit Short Opportunities Fund andApollo Value Strategic Fund, L.P. Collectively, our credit hedge fund AUM and Fee-Generating AUM totaled $7.1 billion and $2.6 billion, respectively, asof December 31, 2015. Our credit hedge funds may utilize a mix of the investment strategies outlined above. Investments in these funds may be made on along or short basis and employ leverage to finance the acquisition of various credit investments. Accordingly, the difference between AUM and Fee-Generating AUM for hedge funds is driven by non-fee paying leverage.
CLOs
CLOs includes more than 20 internally managed CLOs focused within the U.S. and Europe. In aggregate, our AUM and Fee-Generating AUM inCLOs totaled $13.4 billion as of December 31, 2015. Through their lifecycle, CLOs employ structured credit and performing credit strategies with the goal ofproviding investors with competitive yields achieved through highly diversified pools of historically low defaulting assets.
SIAs / Other
SIAs / Other includes a diverse group of separately managed accounts and certain commitment-based funds where the underlying assets are liquidand generally employ a mix of performing credit, structured credit, and liquid opportunistic credit investment strategies. In aggregate, our AUM and Fee-Generating in SIAs and other accounts totaled $16.7 billion and $14.6 billion as of December 31, 2015, respectively. The managed accounts comprising themajority of AUM and Fee-Generating AUM within this subcategory are customized according to an investor’s specified risk and target return preferences.
Drawdown
Our drawdown category within the credit segment generally includes commitment-based funds and certain SIAs in which investors make acommitment to provide capital at the formation of such funds and deliver capital when called as investment opportunities become available. Drawdowncomprises our fund series’ including Credit Opportunity Funds, European Principal Finance Funds, and Structured Credit Funds, including Financial CreditInvestment Funds and Structured Credit Recovery Funds, as well as other commitment-based funds not included within a series of funds and certain SIAs.Drawdown funds and SIAs utilize a range of investment strategies including illiquid opportunistic, principal finance, and structured credit strategies. Inaggregate, our AUM and Fee-Generating AUM within the drawdown category totaled $19.1 billion and $11.1 billion, respectively, as of December 31, 2015.
Credit Opportunity Funds (“COF”)
The Credit Opportunity Fund series primarily employs our illiquid opportunistic investment strategy, which focuses on credit investments that areless liquid in nature and that utilize a similar value-oriented investment philosophy as our private equity business. This includes investments in a broad arrayof primary and secondary opportunities encompassing stressed and distressed public and private securities primarily within corporate credit, including seniorloans (secured and unsecured), high yield, mezzanine, debtor in possession financings, rescue or bridge financings, and other debt investments. Additionally,for certain illiquid opportunistic investments our underwriting process may result in selective and at times concentrated investments by the funds in thevarious industries on which we focus. In certain cases, leverage can be employed in connection with this strategy by having fund subsidiaries or special-purpose vehicles incur debt or by entering into credit facilities or other debt transactions to finance the acquisition of various credit investments. Our AUMand Fee-Generating AUM within the Credit Opportunity Funds totaled $3.5 billion and $2.3 billion, respectively, as of December 31, 2015.
European Principal Finance Funds (“EPF”)
The European Principal Finance Fund series primarily employs our principal finance investment strategy, which is utilized to invest in Europeancommercial and residential real estate, performing loans, non-performing loans, and unsecured consumer loans, as well as acquiring assets as a result ofdistressed market situations. Certain of the EPF investment vehicles we manage own captive pan-European financial institutions, loan servicing and propertymanagement platforms. These entities perform banking and lending activities and manage and service consumer credit receivables and loans secured bycommercial and residential properties. In aggregate, these financial institutions, loan servicing, and property management platforms operate in five Europeancountries and employed approximately 1,600 individuals as of December 31, 2015. We believe the post-investment loan servicing and real estate assetmanagement requirements, combined with the illiquid nature of these investments, limits participation by traditional long-only investors, hedge funds, andprivate equity funds, resulting in what we believe to be an opportunity for our credit business. Our AUM and Fee-Generating AUM within the EuropeanPrincipal Finance Funds totaled $4.3 billion and $3.3 billion, respectively, as of December 31, 2015.
- 15-

Table of Contents
Structured Credit Funds - FCI and SCRF
Our Structured Credit Funds include the Financial Credit Investment Fund series (“FCI”) and the Structured Credit Recovery Fund series (“SCRF”).Collectively, the Structured Credit Funds employ our structured credit investing strategy, which targets multiple tranches of less liquid structured securitieswith favorable and protective lending terms, predictable payment schedules, well-diversified portfolios and low default rates. Our AUM and Fee-GeneratingAUM within Structured Credit Funds totaled $4.2 billion and $2.4 billion, respectively, as of December 31, 2015.
Permanent Capital Vehicles - Credit
Our permanent capital vehicles category within the credit segment generally includes pools of assets which are not subject to redemption and aregenerally associated with long term asset management or advisory contracts. This category is comprised of (a) Athene Asset Management and an affiliate ofApollo which provides advisory services to Athene Germany; (b) assets that are owned by or related to Midcap and managed by Apollo Capital Management,L.P.; (c) assets of certain publicly traded vehicles managed by Apollo such as AINV, AMTG, AIF, and AFT and (d) a non-traded business developmentcompany sub-advised by Apollo. The permanent capital vehicles within credit utilize a range of investment strategies including performing credit andstructured credit as described previously, as well as directly originated credit. Direct origination generally relates to the sourcing of senior credit assets, bothsecured and unsecured, including asset-backed loans, leveraged loans, mezzanine debt, real estate loans, re-discount loans and venture loans. Directlyoriginated credit is primarily employed by Midcap, AINV, and a non-traded business development company sub-advised by Apollo. In aggregate, our AUMand Fee-Generating AUM within our credit permanent capital vehicles totaled $65.0 billion and $60.0 billion, respectively, as of December 31, 2015.
Permanent Capital Vehicles excluding Athene Non-Sub-Advised Assets
This category includes all permanent capital vehicles within the credit segment described above except for the portion of Athene Asset Managementthat is not sub-advised by Apollo or invested in Apollo funds as of December 31, 2015. The AUM and Fee-Generating AUM we managed within thepermanent capital vehicles excluding Athene Non-Sub-Advised category totaled $15.1 billion and $9.8 billion, respectively, as of December 31, 2015.
Athene Non-Sub-Advised Assets
This category includes (i) the assets which are managed by Athene Asset Management but not sub-advised by Apollo nor invested in Apollo fundsor Investment Vehicles and (ii) assets related to Athene Germany for which an affiliate of Apollo provides advisory services. We refer to these assetscollectively as “Athene Non-Sub-Advised Assets”. Our AUM and Fee-Generating AUM within the Athene Non-Sub-Advised category totaled $50.0 billion asof December 31, 2015. For additional information, please refer to “—Athene” below
Athene
As discussed in the preceding section, permanent capital vehicles within the credit segment includes Athene Asset Management and an affiliate ofApollo which provides advisory services to Athene Germany. As of December 31, 2015, we managed total AUM of $64.5 billion, all of which was Fee-Generating AUM, with respect to Athene Asset Management and Athene Germany. This amount includes $14.6 billion of AUM that was either sub-advisedby Apollo or invested in funds and investment vehicles managed by Apollo within the credit, real estate, and private equity business segments.
Athene Holding was founded in 2009 to capitalize on favorable market conditions in the dislocated life insurance sector. Athene Holding is theultimate parent of various insurance company operating subsidiaries. Through its subsidiaries, Athene Holding provides insurance products focusedprimarily on the retirement market and its business centers primarily on issuing or reinsuring fixed and equity-indexed annuities. Athene is currently one ofthe largest fixed annuity companies in the United States.
Apollo, through its consolidated subsidiary, Athene Asset Management, provides asset management services to Athene, including asset allocationand portfolio management strategies, and receives fees from Athene Holding for providing such services. As of December 31, 2015, Athene AssetManagement managed Athene Holding’s entire investment portfolio, except with respect to the assets of Athene Germany, for which a different Apolloaffiliate provides investment advisory services. Athene Asset Management had $59.5 billion of AUM as of December 31, 2015 in accounts owned by orrelated to Athene (the “Athene Accounts”), of which approximately $14.6 billion, or approximately 24.5%, was either sub-advised by Apollo or invested inApollo funds and investment vehicles. The vast majority of sub-advised assets are in managed accounts that invest in high grade credit asset classes such asCLO debt, commercial mortgage backed securities and insurance-linked securities. We currently expect this percentage to increase over time provided thatAthene Asset Management continues to perform successfully in providing asset management services to Athene. Athene Asset Management receives a grossmanagement fee equal to 0.40% per annum on all AUM in the Athene Accounts, with certain limited exceptions for all of the services which Athene AssetManagement provides to Athene.
- 16-

Table of Contents
An affiliate of Apollo provides advisory services to Athene Germany including asset allocation and portfolio management strategies. AtheneGermany provides life insurance products to the German market and was acquired by Athene Holding on October 1, 2015. Apollo and its subsidiaries advisedAthene with respect to $5.1 billion of AUM as of December 31, 2015 related to Athene Germany, all of which was Fee-Generating AUM.
Real Estate
Our real estate group has a dedicated team of multi-disciplinary real estate professionals whose investment activities are integrated and coordinatedwith our private equity and credit business segments. We take a broad view of markets and property types in targeting debt and equity investmentopportunities, including the acquisition and recapitalization of real estate portfolios, platforms and operating companies and distressed for control situations.As of December 31, 2015, our real estate business had total and fee generating AUM of approximately $11.3 billion and $7.3 billion, respectively, through acombination of investment funds, SIAs and Apollo Commercial Real Estate Finance, Inc. (“ARI”), a publicly-traded, commercial mortgage real estateinvestment trust managed by Apollo.
Real Estate AUM as of December 31, 2015(in billions)
With respect to our real estate funds' equity investments, we take a value-oriented approach and our funds will invest in assets located in primary,secondary and tertiary markets across the United States. The funds we manage pursue opportunistic investments in various real estate asset classes,which historically have included hospitality, office, industrial, retail, healthcare, residential and non-performing loans. Our real estate equity funds undermanagement currently include AGRE U.S. Real Estate Fund, L.P. (“U.S. RE Fund I”) and Apollo U.S. Real Estate Fund II, L.P. (“U.S. RE Fund II”), our U.S.focused, opportunistic funds, and our legacy Citi Property Investors (“CPI”) business, the real estate investment management business we acquired fromCitigroup in November 2010. In 2015, we expanded our real estate equity strategy through the acquisition of Venator Real Estate Capital Partners(“Venator”), an Asian focused real estate investment manager. In connection with the transaction, we now manage the Trophy Property Development Fund, aChina-focused investment fund.
With respect to our real estate debt activities, our real estate funds and accounts offer financing across a broad spectrum of property types and atvarious points within a property’s capital structure, including first mortgage and mezzanine financing and preferred equity. In addition to ARI, we alsomanage strategic accounts focused on investing in commercial mortgage-backed securities and other commercial real estate loans.
- 17-

Table of Contents
Strategic Investment Accounts
We manage several SIAs established to facilitate investments by third-party investors directly in Apollo funds and other securities. Institutionalinvestors are expressing increasing levels of interest in SIAs since these accounts can provide investors with greater levels of transparency, liquidity andcontrol over their investments as compared to more traditional investment funds. Based on the trends we are currently witnessing among a select group oflarge institutional investors, we expect our AUM that is managed through SIAs to continue to grow over time. As of December 31, 2015, approximately $17billion of our total AUM was managed through SIAs.
Fundraising and Investor Relations
We believe our performance track record across our funds and our focus on client service have resulted in strong relationships with our fundinvestors. Our fund investors include many of the world’s most prominent pension and sovereign wealth funds, university endowments and financialinstitutions, as well as individuals. We maintain an internal team dedicated to investor relations across our private equity, credit and real estate businesses.
In our private equity business, fundraising activities for new funds begin once the investor capital commitments for the current fund are largelyinvested or committed to be invested. The investor base of our private equity funds includes both investors from prior funds and new investors. In manyinstances, investors in our private equity funds have increased their commitments to subsequent funds as our private equity funds have increased in size.During the fundraising effort for Fund VIII, investors representing over 92% of Fund VII’s capital committed to Fund VIII. In addition, many of ourinvestment professionals commit their own capital to each private equity fund. The single largest unaffiliated investor in Fund VIII represents 5% of FundVIII's commitments.
During the management of a private equity fund, we maintain an active dialogue with the fund's investors. We host quarterly webcasts that are led bymembers of our senior management team and we provide quarterly reports to the investors detailing recent performance by investment. We also organize anannual meeting for our private equity funds' investors that consists of detailed presentations by the senior management teams of many of our funds' currentinvestments. From time to time, we also hold meetings for the advisory board members of our private equity funds.
In our credit business, we have raised private capital from prominent institutional investors and have also raised capital from public marketinvestors, as in the case of AINV, AFT, AIF and AMTG. AINV is listed on the NASDAQ Global Select Market and complies with the reporting requirements ofthat exchange. AFT, AIF and AMTG are listed on the NYSE and comply with the reporting requirements of that exchange.
In our real estate business, we have raised capital from prominent institutional investors and we have also raised capital from public marketinvestors, as in the case of ARI. ARI is listed on the NYSE and complies with the reporting requirements of that exchange.
Investment Process
We maintain a rigorous investment process and a comprehensive due diligence approach across all of our funds. We have developed policies andprocedures, the adequacy of which are reviewed annually, that govern the investment practices of our funds. Moreover, each fund is subject to certaininvestment criteria set forth in its governing documents that generally contain requirements and limitations for investments, such as limitations relating tothe amount that will be invested in any one company and the geographic regions in which the fund will invest. Our investment professionals are familiar withour investment policies and procedures and the investment criteria applicable to the funds that they manage. Our investment professionals interact frequentlyacross our businesses on a formal and informal basis.
We have in place certain procedures to allocate investment opportunities among our funds. These procedures are meant to ensure that each fund istreated fairly and that transactions are allocated in a way that is equitable, fair and in the best interests of each fund, subject to the terms of the governingagreements of such funds.
Private Equity Investment ProcessOur private equity investment professionals are responsible for selecting, evaluating, structuring, due diligence, negotiating, executing, monitoring
and exiting investments for our traditional private equity funds, as well as pursuing operational improvements in our funds’ portfolio companies throughmanagement consulting arrangements. These investment professionals perform significant research into each prospective investment, including a review ofthe company’s financial statements, comparisons with other public and private companies and relevant industry data. The due diligence effort will alsotypically include:
- 18-

Table of Contents
• on-site visits;• interviews with management, employees, customers and vendors of the potential portfolio company;• research relating to the company’s management, industry, markets, products and services, and competitors; and• background checks.
After an initial selection, evaluation and diligence process, the relevant team of investment professionals will prepare a detailed analysis of theinvestment opportunity for our private equity investment committee. Our private equity investment committee generally meets weekly to review theinvestment activity and performance of our private equity funds.
After discussing the proposed transaction with the deal team, the investment committee will decide whether to give its preliminary approval to thedeal team to continue the selection, evaluation, diligence and negotiation process. The investment committee will typically conduct several meetings toconsider a particular investment before finally approving that investment and its terms. Both at such meetings and in other discussions with the deal team,our Managing Partners and other investment professionals will provide guidance to the deal team on strategy, process and other pertinent considerations.Every private equity investment requires the approval of our Managing Partners.
Our private equity investment professionals are responsible for monitoring an investment once it is made and for making recommendations withrespect to exiting an investment. Disposition decisions made on behalf of our private equity funds are subject to review and approval by the private equityinvestment committee, including our Managing Partners.
Credit and Real Estate Investment ProcessOur credit and real estate investment professionals are responsible for selecting, evaluating, structuring, due diligence, negotiating, executing,
monitoring and exiting investments for our credit funds and real estate funds, respectively. The investment professionals perform significant research into anddue diligence of each prospective investment, and prepare analyses of recommended investments for the investment committee of the relevant fund.
Investment decisions are scrutinized by the investment committees where applicable, who review potential transactions, provide input regarding thescope of due diligence and approve recommended investments and dispositions. Close attention is given to how well a proposed investment is aligned withthe distinct investment objectives of the fund in question, which in many cases have specific geographic or other focuses. The investment committee of eachof our credit funds and real estate funds generally is provided with a summary of the investment activity and performance of the relevant funds on at least amonthly basis.
Overview of Fund OperationsInvestors in our private equity funds and certain of our credit and real estate funds make commitments to provide capital at the outset of a fund and
deliver capital when called by us as investment opportunities become available. We determine the amount of initial capital commitments for such funds bytaking into account current market opportunities and conditions, as well as investor expectations. The general partner’s capital commitment is determinedthrough negotiation with the fund’s underlying investor base. The commitments are generally available for approximately six years during what we call theinvestment period. We have typically invested the capital committed to such funds over a three to four year period. Generally, as each investment is realized,these funds first return the capital and expenses related to that investment and any previously realized investments to fund investors and then distribute anyprofits. These profits are typically shared 80% to the investors in our private equity funds and 20% to us so long as the investors receive at least an 8%compounded annual return on their investment, which we refer to as a “preferred return” or “hurdle.” Allocation of profits between fund investors and us, aswell as the amount of the preferred return, among other provisions, varies for our real estate equity and many of our credit funds. Our private equity fundstypically terminate ten years after the final closing, subject to the potential for two one-year extensions. Dissolution of those funds can be accelerated upon amajority vote of investors not affiliated with us and, in any case, all of our funds also may be terminated upon the occurrence of certain other events.Ownership interests in our private equity funds and certain of our credit and real estate funds are not, however, subject to redemption prior to termination ofthe funds.
The processes by which our credit and real estate funds receive and invest capital vary by type of fund. As noted above, certain of our credit and realestate funds have drawdown structures where investors made a commitment to provide capital at the formation of such funds and deliver capital when calledby us as investment opportunities become available. In addition, we have several permanent capital vehicles with unlimited duration. Each of these publiclytraded vehicles raises capital by selling shares in the public markets and these vehicles can also issue debt. We also have several credit funds whichcontinuously offer and sell shares or limited partner interests via private placements through monthly subscriptions, which are payable in full upon a fund’sacceptance of an investor’s subscription. These hedge fund style credit funds have customary redemption rights (in many cases subject to the expiration of aninitial lock-up period), and are generally structured as limited partnerships, the terms of which are determined through negotiation with the funds' underlyinginvestor base. Management fees and incentive fees (whether in the form
- 19-

Table of Contents
of carried interest income or incentive allocation) that we earn for management of these credit funds and from their performance as well as the termsgoverning their operation vary across our credit funds.
We conduct the management of our private equity, credit and real estate funds primarily through a partnership structure, in which partnershipsorganized by us accept commitments and/or funds for investment from investors. Funds are generally organized as limited partnerships with respect to privateequity funds and other U.S. domiciled vehicles and limited partnership and limited liability (and other similar) companies with respect to non-U.S. domiciledvehicles. Typically, each fund has an investment adviser registered under the Investment Advisers Act of 1940, as amended (the “Investment Advisers Act”).Responsibility for the day-to-day operations of the funds is typically delegated to the funds’ respective investment managers pursuant to an investmentmanagement (or similar) agreement. Generally, the material terms of our investment management agreements relate to the scope of services to be rendered bythe investment manager to the applicable funds, certain rights of termination in respect of our investment management agreements and, generally, withrespect to certain of our credit and real estate funds (as these matters are covered in the limited partnership agreements of the private equity funds), thecalculation of management fees to be borne by investors in such funds, as well as the calculation of the manner and extent to which other fees received by theinvestment manager from fund portfolio companies serve to offset or reduce the management fees payable by investors in our funds. The funds themselvesgenerally do not register as investment companies under the Investment Company Act of 1940, as amended (the “Investment Company Act”), generally inreliance on Section 3(c)(7) or Section 7(d) thereof or, typically in the case of funds formed prior to 1997, Section 3(c)(1) thereof. Section 3(c)(7) of theInvestment Company Act excepts from its registration requirements funds privately placed in the United States whose securities are owned exclusively bypersons who, at the time of acquisition of such securities, are “qualified purchasers” or “knowledgeable employees” for purposes of the Investment CompanyAct. Section 3(c)(1) of the Investment Company Act exempts from its registration requirements privately placed funds whose securities are beneficiallyowned by not more than 100 persons. In addition, under current interpretations of the SEC, Section 7(d) of the Investment Company Act exempts fromregistration any non-U.S. fund all of whose outstanding securities are beneficially owned either by non-U.S. residents or by U.S. residents that are qualifiedpurchasers.
In addition to having an investment manager, each fund that is a limited partnership also has a general partner that makes all policy and investmentdecisions relating to the conduct of the fund’s business. The general partner is responsible for all decisions concerning the making, monitoring and disposingof investments, but such responsibilities are typically delegated to the fund’s investment manager pursuant to an investment management (or similar)agreement. The limited partners of the funds take no part in the conduct or control of the business of the funds, have no right or authority to act for or bind thefunds and have no influence over the voting or disposition of the securities or other assets held by the funds. These decisions are made by the fund’s generalpartner in its sole discretion, subject to the investment limitations set forth in the agreements governing each fund. The limited partners often have the rightto remove the general partner or investment manager for cause or cause an early dissolution by a simple majority vote. In connection with the private offeringtransactions that occurred in 2007 pursuant to which we sold shares of Apollo Global Management, LLC to certain initial purchasers and accredited investorsin transactions exempt from the registration requirements of the Securities Act (“Private Offering Transactions”) and the reorganization of the Company’spredecessor business (the “2007 Reorganization”), we deconsolidated certain of our private equity and credit funds that have historically been consolidatedin our financial statements and amended the governing agreements of those funds to provide that a simple majority of a fund’s investors have the right toaccelerate the dissolution date of the fund. Additionally, Apollo adopted new U.S. GAAP consolidation guidance during the year ended December 31, 2015,which resulted in the deconsolidation of certain funds and variable interest entities (“VIEs”) as of January 1, 2015.
In addition, the governing agreements of our private equity funds and certain of our credit and real estate funds enable the limited partners holding aspecified percentage of the interests entitled to vote, to elect not to continue the limited partners’ capital commitments for new portfolio investments in theevent certain of our Managing Partners do not devote the requisite time to managing the fund or in connection with certain triggering events (as defined inthe applicable governing agreements). In addition to having a significant, immeasurable negative impact on our revenue, net income and cash flow, theoccurrence of such an event with respect to any of our funds would likely result in significant reputational damage to us. The loss of the services of any of ourManaging Partners would have a material adverse effect on us, including our ability to retain and attract investors and raise new funds, and the performanceof our funds. We do not carry any “key man” insurance that would provide us with proceeds in the event of the death or disability of any of our ManagingPartners.
Fees and Carried Interest
Our revenues and other income consist principally of (i) management fees, which may be based upon a percentage of the committed or investedcapital, adjusted assets, gross invested capital, fund net asset value, stockholders' equity or the capital accounts of the limited partners of the funds, and maybe subject to offset as discussed in note 2 to the consolidated financial statements, (ii) advisory and transaction fees, net relating to certain actual andpotential private equity, credit and real estate investments as more fully discussed in note 2 to the consolidated financial statements, (iii) income based on theperformance of our funds, which consists of allocations, distributions or fees from our private equity, credit and real estate funds, and (iv) investment
- 20-

Table of Contents
income from our investments as general partner and other direct investments primarily in the form of net gains from investment activities as well as interestand dividend income.
The composition of our revenues will vary based on market conditions and the cyclicality of the different businesses in which we operate. Our funds’returns are driven by investment opportunities and general market conditions, including the availability of debt capital on attractive terms and theavailability of distressed debt opportunities. Our funds initially record fund investments at cost and then such investments are subsequently recorded at fairvalue. Fair values are affected by changes in the fundamentals of the underlying portfolio company investments of the funds, the industries in which theportfolio companies operate, the overall economy as well as other market conditions.
General Partner and Professionals Investments and Co-InvestmentsGeneral Partner Investments
Certain of our management companies, general partners and co-invest vehicles are committed to contribute to our funds and affiliates. As a limitedpartner, general partner and manager of the Apollo funds, Apollo had unfunded capital commitments as of December 31, 2015 of $566.3 million.
Apollo has an ongoing obligation, subject to certain stipulations, to acquire additional common units of AAA in an amount equal to 25% of theaggregate after-tax cash distributions, if any, that are made by AAA to Apollo's affiliates pursuant to the carried interest distribution rights that are applicableto investments made through AAA Investments.
Managing Partners and Other Professionals InvestmentsTo further align our interests with those of investors in our funds, our Managing Partners and other professionals have invested their own capital in
our funds. Our Managing Partners and other professionals will either re-invest their carried interest to fund these investments or use cash on hand or fundsborrowed from third parties. We generally have not historically charged management fees or carried interest on capital invested by our Managing Partnersand other professionals directly in our private equity, credit, and real estate funds.
Co-InvestmentsInvestors in many of our funds, as well as certain other investors, may have the opportunity to make co-investments with the funds. Co-investments
are investments in portfolio companies or other fund assets generally on the same terms and conditions as those to which the applicable fund is subject.
CompetitionThe investment management industry is intensely competitive, and we expect it to remain so. We compete globally and on a regional, industry and
niche basis.
We face competition both in the pursuit of outside investors for our funds and in our funds acquiring investments in attractive portfolio companiesand making other fund investments. We compete for outside investors for our funds based on a variety of factors, including:
• investment performance;• investor perception of investment managers’ drive, focus and alignment of interest;• quality of service provided to and duration of relationship with investors;• business reputation; and• the level of fees and expenses charged for services.
Competition is also intense for the attraction and retention of qualified employees. Our ability to continue to compete effectively in our businesseswill depend upon our ability to attract new employees and retain and motivate our existing employees.
For additional information concerning the competitive risks that we face, see “Item 1A. Risk Factors—Risks Related to Our Businesses—Theinvestment management business is intensely competitive, which could have a material adverse impact on us.”
Regulatory and Compliance Matters
Our businesses, as well as the financial services industry generally, are subject to extensive regulation in the United States and elsewhere. All of theinvestment advisers of our funds are registered as investment advisers either directly or as a "relying
- 21-

Table of Contents
adviser" with the SEC. A “relying adviser” is an investment adviser that relies on the investment adviser registration of a directly registered investmentadviser pursuant to the SEC’s Division of Investment Management staff guidance dated January 18, 2012, issued in a no-action letter in response to theAmerican Bar Association’s request for interpretative guidance (the “ABA No-Action Letter”). Registered investment advisers are subject to the requirementsand regulations of the Investment Advisers Act. Such requirements relate to, among other things, fiduciary duties to clients, maintaining an effectivecompliance program, managing conflicts of interest and general anti-fraud prohibitions. Pursuant to the ABA No-Action letter, each “relying adviser” is aninvestment adviser registered with the SEC and, as such, is required to comply with all of the provisions of the Investment Advisers Act and the rulesthereunder that apply to registered advisers.
Each of AFT and AIF is a registered management investment company under the Investment Company Act. AINV is an investment company that haselected to be treated as a business development company under the Investment Company Act. Each of AFT, AIF and AINV has elected for U.S. Federal taxpurposes to be treated as a regulated investment company under Subchapter M of the Internal Revenue Code of 1986, as amended (the “Internal RevenueCode”). As such, each of AFT, AIF and AINV is required to distribute during each taxable year at least 90% of its ordinary income and realized, net short-termcapital gains in excess of realized net long-term capital losses, if any, to its shareholders. In addition, in order to avoid excise tax, each needs to distributeduring each calendar year at least 98% of its ordinary income and 98.2% of its capital gains net income for the one-year period ended on October 31st of suchcalendar year, plus any shortfalls from any prior year's distribution, which would take into account short-term and long-term capital gains and losses. Inaddition, as a business development company, AINV must not acquire any assets other than “qualifying assets” specified in the Investment Company Actunless, at the time the acquisition is made, at least 70% of AINV’s total assets are qualifying assets (with certain limited exceptions).
ARI and AMTG have each elected to be taxed as a real estate investment trust, or REIT, under the Internal Revenue Code. To maintain theirqualification as REITs, ARI and AMTG must distribute at least 90% of their taxable income to their shareholders and meet, on a continuing basis, certainother complex requirements under the Internal Revenue Code.
In addition, Apollo Global Securities, LLC (“AGS”) is a registered broker dealer with the SEC and is a member of the Financial Industry RegulatoryAuthority, Inc. From time to time, this entity is involved in transactions with affiliates of Apollo, including portfolio companies of the funds we manage,whereby AGS will earn fees for its services.
Broker-dealers are subject to regulations that cover all aspects of the securities business. In particular, as a registered broker-dealer and member of aself regulatory organization, we are subject to the SEC’s uniform net capital rule, Rule 15c3-1. Rule 15c3-1 specifies the minimum level of net capital abroker-dealer must maintain and also requires that a significant part of a broker-dealer’s assets be kept in relatively liquid form. The SEC and various self-regulatory organizations impose rules that require notification when net capital falls below certain predefined criteria, limit the ratio of subordinated debt toequity in the regulatory capital composition of a broker-dealer and constrain the ability of a broker-dealer to expand its business under certain circumstances.Additionally, the SEC’s uniform net capital rule imposes certain requirements that may have the effect of prohibiting a broker-dealer from distributing orwithdrawing capital and requiring prior notice to the SEC for certain withdrawals of capital.
As the ultimate parent of the general partner or manager of certain shareholders of Athene Holding, we are subject to insurance holding companysystem laws and regulations in Delaware, Iowa and New York, which are the states in which the insurance company subsidiaries of Athene Holding aredomiciled. These regulations generally require each insurance company subsidiary to register with the insurance department in its state of domicile and tofurnish financial and other information about the operations of companies within its holding company system. These regulations also impose restrictions andlimitations on the ability of an insurance company subsidiary to pay dividends and make other distributions to its parent company. In addition, transactionsbetween an insurance company and other companies within its holding company system, including sales, loans, investments, reinsurance agreements,management agreements and service agreements, must be on terms that are fair and reasonable and, if material or within a specified category, require priornotice and approval or non-disapproval by the applicable domiciliary insurance department.
The insurance laws of each of Delaware, Iowa and New York prohibit any person from acquiring control of a domestic insurance company or itsparent company unless that person has filed a notification with specified information with that state’s Commissioner or Superintendent of Insurance (the“Commissioner”) and has obtained the Commissioner’s prior approval. Under applicable Delaware, Iowa and New York statutes, the acquisition of 10% ormore of the voting securities of an insurance company or its parent company is presumptively considered an acquisition of control of the insurance company,although such presumption may be rebutted. Accordingly, any person or entity that acquires, directly or indirectly, 10% or more of the voting securities ofApollo without the requisite prior approvals will be in violation of these laws and may be subject to injunctive action requiring the disposition or seizure ofthose securities or prohibiting the voting of those securities, or to other actions that may be taken by the applicable state insurance regulators.
- 22-

Table of Contents
In addition, many U.S. state insurance laws require prior notification to state insurance departments of an acquisition of control of a non-domiciliaryinsurance company doing business in that state if the acquisition would result in specified levels of market concentration. While these pre-notificationstatutes do not authorize the state insurance departments to disapprove the acquisition of control, they authorize regulatory action in the affected state,including requiring the insurance company to cease and desist from doing certain types of business in the affected state or denying a license to do business inthe affected state, if particular conditions exist, such as substantially lessening competition in any line of business in such state. Any transactions that wouldconstitute an acquisition of control of Apollo may require prior notification in those states that have adopted pre-acquisition notification laws. These lawsmay discourage potential acquisition proposals and may delay, deter or prevent an acquisition of control of Apollo (in particular through an unsolicitedtransaction), even if Apollo might consider such transaction to be desirable for its shareholders.
Currently, there are proposals to increase the scope of regulation of insurance holding companies in both the United States and internationally. Inthe United States, the NAIC has promulgated amendments to its insurance holding company system model law and regulations for consideration by thevarious states that would provide for more extensive informational reporting regarding parents and other affiliates of insurance companies, with the purposeof protecting domestic insurers from enterprise risk, including requiring an annual enterprise risk report by the ultimate controlling person identifying thematerial risks within the insurance holding company system that could pose enterprise risk to domestic insurers. Changes to existing NAIC model laws orregulations must be adopted by individual states or foreign jurisdictions before they will become effective. To date, each of Delaware, Iowa and New Yorkhas enacted laws to adopt such amendments.
Internationally, the International Association of Insurance Supervisors is in the process of adopting a framework for the “group wide” supervision ofinternationally active insurance groups. The NAIC has also promulgated additional amendments to its insurance holding company system model law thataddress “group wide” supervision of internationally active insurance groups. To date, Delaware has enacted laws to adopt a form of these amendments, andIowa has adopted similar provisions under a predecessor statute. We cannot predict with any degree of certainty the additional capital requirements,compliance costs or other burdens these requirements may impose on us and our insurance company affiliates.
In addition, state insurance departments also have broad administrative powers over the insurance business of our insurance company affiliates,including insurance company licensing and examination, agent licensing, establishment of reserve requirements and solvency standards, premium rateregulation, admissibility of assets, policy form approval, unfair trade and claims practices and other matters. State regulators regularly review and updatethese and other requirements.
Although the federal government does not directly regulate the insurance business, federal legislation and administrative policies in several areas,including pension regulation, age and sex discrimination, financial services regulation, securities regulation and federal taxation, can significantly affect theinsurance business. The Dodd-Frank Wall Street Reform and Consumer Protection Act created the FIO within the Department of Treasury headed by aDirector appointed by the Treasury Secretary. The FIO is designed principally to exercise a monitoring and information gathering role, rather than aregulatory role. In that capacity, the FIO has been charged with providing reports to the U.S. Congress on (i) modernization of U.S. insurance regulation(provided in December 2013) and (ii) the U.S. and global reinsurance market (provided in November 2013 and January 2015, respectively). Such reportscould ultimately lead to changes in the regulation of insurers and reinsurers in the U.S.
We are subject to the jurisdiction of the Federal Energy Regulatory Commission as a result of certain of the funds we manage directly or indirectlyowning, controlling or holding, with power to vote, 10% or more of the voting securities in a “public-utility company” or a “holding company” of a public-utility company (as those terms are defined in the U.S. Public Utility Holding Company Act of 2005). See “Item 1A. Risk Factors—Risks Related to OurBusinesses—We are a holding company subject to the jurisdiction of the Federal Energy Regulatory Commission (the “FERC”). An acquirer of our Class Ashares may be required to obtain prior approval from the FERC and make other filings with the FERC.”
Apollo Management International LLP (“AMI”) is authorized and regulated by the U.K. Financial Conduct Authority in the United Kingdom, underthe Financial Services and Markets Act 2000 (“FSMA”) and the rules promulgated thereunder. AMI has permission to engage in certain specified regulatedactivities, including dealing as agent and arranging deals in relation to certain type of investments. Most aspects of AMI’s investment business are governedby the FSMA and related rules, including sales, research, trading practices, provision of investment advice, corporate finance, regulatory capital, recordkeeping, approval standards for individuals, anti-money laundering and period reporting and settlement procedures. The U.K. Financial Conduct Authority isresponsible for administering these requirements and our compliance with the relevant the FSMA and related rules.
AAA is regulated under the Authorized Closed-ended Investment Scheme Rules 2008 issued by the Guernsey Financial Services Commission(“GFSC”) with effect from December 15, 2008 under The Protection of Investors (Bailiwick of Guernsey) Law 1987, as amended (the “New Rules”). AAA isdeemed to be an authorized closed-ended investment scheme under the New Rules.
- 23-

Table of Contents
Apollo Advisors (Mauritius) Ltd (“Apollo Mauritius”), one of our subsidiaries, and AION Capital Management Limited (“AION Manager”), one ofour joint venture investments, are licensed providers of investment management services in the Republic of Mauritius and are subject to applicable Mauritiansecurities laws and the oversight of the Financial Services Commission (Mauritius) (the “FSC”). Each of Apollo Mauritius and AION Manager is subject tolimited regulatory requirements under the Mauritian Securities Act 2005, Mauritian Financial Services Act 2007 and relevant ancillary regulations,including, ongoing reporting and record keeping requirements, anti-money laundering obligations, obligations to ensure that it and its directors, key officersand representatives are fit and proper and requirements to maintain positive shareholders’ equity. The FSC is responsible for administering these requirementsand ensuring the compliance of Apollo Mauritius and AION Manager with them. If Apollo Mauritius or AION Manager contravenes any such requirements,such entities and/or their officers or representatives may be subject to a fine, reprimand, prohibition order or other regulatory sanctions.
AGM India Advisors Private Limited is regulated by the Company Law Board (also known as the Ministry of Company Affairs) through theCompanies Act of 1956 in India. Additionally since there are foreign investments in the company, AGM India Advisors Private Limited is also subject to therules and regulations applicable under the Foreign Exchange Management Act of 1999 which falls within the purview of Reserve Bank of India.
Apollo Management Singapore Pte Ltd. was granted a Capital Markets Service License with the Monetary Authority of Singapore in October 2013.In addition, Apollo Capital Management, L.P. is registered with the Securities and Exchange Board of India as a foreign institutional investor.
Certain of our businesses are subject to compliance with laws and regulations of U.S. Federal and state governments, non-U.S. governments, theirrespective agencies and/or various self-regulatory organizations or exchanges relating to, among other things, the privacy of client information, and anyfailure to comply with these regulations could expose us to liability and/or reputational damage. Our businesses have operated for many years within a legalframework that requires our being able to monitor and comply with a broad range of legal and regulatory developments that affect our activities.
However, additional legislation, changes in rules promulgated by self-regulatory organizations or changes in the interpretation or enforcement ofexisting laws and rules, either in the United States or elsewhere, may directly affect our mode of operation and profitability. For additional informationconcerning the regulatory environment in which we operate, see “Item 1A. Risk Factors—Risks Related To Our Businesses—Extensive regulation of ourbusinesses affects our activities and creates the potential for significant liabilities and penalties. The possibility of increased regulatory focus could result inadditional burdens on our businesses. Changes in taxation or law and other legislative or regulatory changes could adversely affect us.”
Rigorous legal and compliance analysis of our businesses and investments is important to our culture. We strive to maintain a culture of compliancethrough the use of policies and procedures, such as our code of ethics, compliance systems, communication of compliance guidance and employee educationand training. We have a compliance group that monitors our compliance with the regulatory requirements to which we are subject and manages ourcompliance policies and procedures. Our Chief Compliance Officer supervises our compliance group, which is responsible for addressing all regulatory andcompliance matters that affect our activities. Our compliance policies and procedures address a variety of regulatory and compliance risks such as thehandling of material non-public information, personal securities trading, valuation of investments on a fund-specific basis, document retention, potentialconflicts of interest and the allocation of investment opportunities.
We generally operate without information barriers between our businesses. In an effort to manage possible risks resulting from our decision not toimplement these barriers, our compliance personnel maintain a list of issuers for which we have access to material, non-public information and for whosesecurities our funds and investment professionals are not permitted to trade. We could in the future decide that it is advisable to establish information barriers,particularly as our business expands and diversifies. In such event our ability to operate as an integrated platform will be restricted. See “Item 1A. RiskFactors—Risks Related to Our Businesses—Possession of material, non-public information could prevent Apollo funds from undertaking advantageoustransactions; our internal controls could fail, or we could establish information barriers, all of which could adversely affect our business.”
Available Information
Our Annual Reports on Form 10-K, Quarterly Reports on Form 10-Q, Current Reports on Form 8-K and amendments to reports filed or furnishedpursuant to Section 13(a) of the Exchange Act are made available free of charge on or through our website at www.agm.com as soon as reasonably practicableafter such reports are filed with, or furnished to, the SEC. The information on our website is not, and shall not be deemed to be, part of this report orincorporated into any other filings we make with the SEC. You may also read and copy any document we file at the SEC's public reference room located at100 F Street, N.E., Washington, DC 20549. Please call the SEC at 1-800-SEC-0330 for further information on the public reference room. In addition thesereports and the other documents we file with the SEC are available on the SEC’s website at www.sec.gov.
- 24-

Table of Contents
From time to time, we may use our website as a channel of distribution of material information. Financial and other material information regardingthe Company is routinely posted on and accessible at www.agm.com. ITEM 1A. RISK FACTORS
Risks Related to Our Businesses
Poor performance of our funds would cause a decline in our revenue and results of operations, may obligate us to repay incentive income previously paidto us and would adversely affect our ability to raise capital for future funds.
We derive revenues in part from:
• management fees, which are based generally on the amount of capital committed or invested in our funds;• transaction and advisory fees relating to the investments our funds make;• incentive income, based on the performance of our funds; and• investment income from our investments as general partner.
If a fund performs poorly, we will receive little or no incentive income with regard to the fund and little income or possibly losses from any principalinvestment in the fund. Furthermore, if, as a result of poor performance of later investments in a fund’s life, the fund does not achieve total investment returnsthat exceed a specified investment return threshold for the life of the fund, we may be obligated to repay the amount by which incentive income that waspreviously distributed to us exceeds amounts to which we are ultimately entitled. Our fund investors and potential fund investors continually assess ourfunds’ performance and our ability to raise capital. Accordingly, poor fund performance may deter future investment in our funds and thereby decrease thecapital committed or invested in our funds and ultimately, our management fee income.
We depend on Leon Black, Joshua Harris and Marc Rowan, and the loss of their services would have a material adverse effect on us.
The success of our businesses depends on the efforts, judgment and personal reputations of our Managing Partners, Leon Black, Joshua Harris andMarc Rowan. Their reputations, expertise in investing, relationships with our fund investors and relationships with members of the business community onwhom our funds depend for investment opportunities and financing are each critical elements in operating and expanding our businesses. We believe ourperformance is strongly correlated to the performance of these individuals. Accordingly, our retention of our Managing Partners is crucial to our success. OurManaging Partners may resign, join our competitors or form a competing firm at any time. If our Managing Partners were to join or form a competitor, some ofour investors could choose to invest with that competitor, another competitor or not at all, rather than in our funds. The loss of the services of our ManagingPartners would have a material adverse effect on us, including our ability to retain and attract investors and raise new funds, and the performance of our funds.We do not carry any “key man” insurance that would provide us with proceeds in the event of the death or disability of any of our Managing Partners. Inaddition, the loss of two or more of our Managing Partners may result in the termination of our role as general partner of certain of our funds and thetermination of the commitment periods of certain of our funds. See “-If two or more of our Managing Partners or certain other investment professionals leaveour company, the commitment periods of certain of our funds may be terminated, and we may be in default under the governing documents of certain of ourfunds and our credit agreement.”
Changes in the debt financing markets may negatively impact the ability of our funds and their portfolio companies to obtain attractive financing for theirinvestments and may increase the cost of such financing if it is obtained, which could lead to lower-yielding investments and potentially decreasing our netincome.
In the event that our funds are unable to obtain committed debt financing for potential acquisitions or can only obtain debt at an increased interestrate or on unfavorable terms, our funds may have difficulty completing otherwise profitable acquisitions or may generate profits that are lower than wouldotherwise be the case, either of which could lead to a decrease in the investment income earned by us. Any failure by lenders to provide previouslycommitted financing can also expose us to potential claims by sellers of businesses which we may have contracted to purchase. Our funds’ portfoliocompanies regularly utilize the corporate debt markets in order to obtain financing for their operations. Similarly, certain of our credit funds rely on theavailability of attractive financing for their investments. To the extent that the current credit markets have rendered such financing difficult to obtain or moreexpensive, this may negatively impact the operating performance of such portfolio companies and credit funds, and lead to lower-yielding investments withrespect to such funds and, therefore, the investment returns on our funds. In addition, to the extent that the current markets make it difficult or impossible torefinance debt that is maturing in the near term, a relevant
- 25-

Table of Contents
portfolio company may face substantial doubt as to its status as a going concern (which may result in an event of default under various agreements) or beunable to repay such debt at maturity and may be forced to sell assets, undergo a recapitalization or seek bankruptcy protection.
Difficult market or economic conditions may adversely affect our businesses in many ways, including by reducing the value or hampering the performanceof the investments made by our funds or reducing the ability of our funds to raise or deploy capital, each of which could materially reduce our revenue, netincome and cash flow and adversely affect our financial prospects and condition.
Our businesses are materially affected by conditions in the global financial markets and economic conditions throughout the world, such as interestrates, availability of credit, inflation rates, economic uncertainty, changes in laws (including laws relating to taxation), trade barriers, commodity prices,currency exchange rates and controls and national and international political circumstances (including wars, terrorist acts or security operations). Thesefactors are outside our control and may affect the level and volatility of securities prices and the liquidity and the value of investments, and we may not beable to or may choose not to manage our exposure to these conditions. Global financial markets have experienced considerable volatility in the valuations ofequity and debt securities, a contraction in the availability of credit and an increase in the cost of financing. Volatility in the financial markets can materiallyhinder the initiation of new, large-sized transactions for our private equity segment and, together with volatility in valuations of equity and debt securities,may adversely impact our operating results. If market conditions deteriorate, our businesses could be affected in different ways. In addition, these events andgeneral economic trends are likely to impact the performance of portfolio companies in many industries, particularly industries that are more affected bychanges in consumer demand, such as the packaging, manufacturing, chemical and refining industries, as well as travel and leisure, gaming and real estateindustries. The performance of our funds and our performance may be adversely affected to the extent our fund portfolio companies in these industriesexperience adverse performance or additional pressure due to downward trends. Our profitability may also be adversely affected by our fixed costs and thepossibility that we would be unable to scale back other costs, within a time frame sufficient to match any further decreases in net income or increases in netlosses relating to changes in market and economic conditions.
A financial downturn could adversely affect our operating results in a number of ways, and if the economy were to re-enter a recessionary orinflationary period, it may cause our revenue and results of operations to decline by causing:
• our AUM to decrease, lowering management fees and other income from our funds;• increases in costs of financial instruments;• adverse conditions for our portfolio companies (e.g., decreased revenues, liquidity pressures, increased difficulty in obtaining
access to financing and complying with the terms of existing financings as well as increased financing costs);• lower investment returns, reducing incentive income;• higher interest rates, which could increase the cost of the debt capital we use to acquire companies in our private equity business;
and• material reductions in the value of our fund investments, affecting our ability to realize carried interest from these investments.
Lower investment returns and such material reductions in value may result because, among other reasons, during periods of difficult marketconditions or slowdowns (which may be across one or more industries, sectors or geographies), companies in which our funds invest may experiencedecreased revenues, financial losses, difficulty in obtaining access to financing and increased funding costs. During such periods, these companies may alsohave difficulty in expanding their businesses and operations and be unable to meet their debt service obligations or other expenses as they become due,including expenses payable to us. In addition, during periods of adverse economic conditions, our funds and their portfolio companies may have difficultyaccessing financial markets, which could make it more difficult or impossible to obtain funding for additional investments and harm our AUM and operatingresults. Furthermore, such conditions would also increase the risk of default with respect to our funds that have significant debt investments, such as ourcredit funds. Our funds may be affected by reduced opportunities to exit and realize value from their investments, by lower than expected returns oninvestments made prior to the deterioration of the credit markets, and by the fact that we may not be able to find suitable investments for the funds toeffectively deploy capital, which could adversely affect our ability to raise new funds and thus adversely impact our prospects for future growth.
While the adverse effects of the unprecedented turmoil in global financial markets in 2008 and 2009 have abated to a certain degree, markets haverecently experienced significant volatility. In addition, while conditions in the U.S. economy have somewhat improved since the credit crisis, many othereconomies continue to experience weakness, tighter credit conditions and a decreased availability of foreign capital. Further, there is concern that thefavorability of conditions in certain markets may be dependent on continued monetary policy accommodation from central banks, especially the Board ofGovernors of the Federal
- 26-

Table of Contents
Reserve System (the “Federal Reserve”). Although interest rates have been at historically low levels for the last few years, the Federal Reserve could begin tosharply raise interest rates, which could have an adverse impact on our business.
A decline in the pace of investment in our funds, an increase in the pace of sales of investments in our funds, or an increase in the amount of transactionand advisory fees we share with our fund investors would result in our receiving less revenue from transaction and advisory fees.
A variety of fees that we earn, such as transaction and advisory fees, are driven in part by the pace at which our funds make investments. Manyfactors could cause a decline in the pace of investment, including the inability of our investment professionals to identify attractive investmentopportunities, competition for such opportunities among other potential acquirers, decreased availability of capital on attractive terms and our failure toconsummate identified investment opportunities because of business, regulatory or legal complexities and adverse developments in the U.S. or globaleconomy or financial markets. Any decline in the pace at which our funds make investments would reduce our transaction and advisory fees and could makeit more difficult for us to raise capital. Likewise, during attractive selling environments, our funds may capitalize on increased opportunities to exitinvestments. Any increase in the pace at which our funds exit investments would reduce transaction and advisory fees. In addition, some of our fund investorshave requested, and we expect to continue to receive requests from fund investors, that we share with them a larger portion, or all, of the transaction andadvisory fees generated by our funds’ investments. To the extent we accommodate such requests, it would result in a decrease in the amount of fee revenue wecould earn. For example, in Fund VIII we have agreed that 100% of certain transaction and advisory fees will be shared with the investors in the fund througha management fee offset mechanism, whereas the percentage was 68% in Fund VII.
If two or more of our Managing Partners or certain other investment professionals leave our company, the commitment periods of certain of our funds maybe terminated, and we may be in default under the governing documents of certain of our funds and our credit agreement.
The governing agreements of certain of our funds provide that in the event certain “key persons” (such as two or more of Messrs. Black, Harris andRowan and/or certain other of our investment professionals) fail to devote the requisite time to our business, the commitment period will terminate if a certainpercentage in interest of the investors do not vote to continue the commitment period or may terminate for a variety of other reasons. This is true of Fund VI,Fund VII and Fund VIII, on which our near- to medium-term performance will heavily depend. Apollo Credit Opportunity Fund III, L.P. (“COF III”), ApolloEuropean Principal Finance Fund II, L.P. (“EPF II”), Financial Credit Investment Credit Facilities II, L.P. (“FCI II”) and certain other credit funds have similarprovisions. Furthermore, the 2013 AMH Credit Facilities described in Note 12 to our consolidated financial statements provide that an event of default mayoccur if such “key persons” no longer own a majority of the voting power represented by our issued and outstanding equity and a majority of our economicinterests. In addition to having a significant negative impact on our revenue, net income and cash flow, the occurrence of such an event with respect to any ofour funds or the 2013 AMH Credit Facilities would likely result in significant reputational damage to us.
Messrs. Black, Harris and Rowan may terminate their employment with us at any time.
We may not be successful in raising new funds or in raising more capital for certain of our funds and may face pressure on carried interest and feearrangements of our future funds.
Our funds may not be successful in consummating their current capital-raising efforts or others that they may undertake, or they may consummatethem at investment levels far lower than those currently anticipated. Any capital raising that our funds undertake may be on terms that are unfavorable to usor that are otherwise different from the terms that we have been able to obtain in the past. These risks could occur for reasons beyond our control, includinggeneral economic or market conditions, regulatory changes or increased competition.
As a result of the global economic downturn during 2008 and 2009, a large number of institutional investors that invest in alternative assets andhave historically invested in our funds experienced negative pressure across their investment portfolios, which may affect our ability to raise capital fromthem. These institutional investors experienced, among other things, a significant decline in the value of their public equity and debt holdings and a lack ofrealizations from their existing private equity portfolios. Consequently, many of these investors were left with disproportionately outsized remainingcommitments to a number of private equity funds, and were restricted from making new commitments to third-party managed private equity funds such asthose managed by us. To the extent economic conditions remain volatile or these issues reoccur, we may be unable to raise sufficient amounts of capital tosupport the investment activities of our future funds.
- 27-

Table of Contents
In addition, certain institutional investors have publicly criticized certain fund fee and expense structures, including management, transaction andadvisory fees. In September 2009, the Institutional Limited Partners Association, or “ILPA,” published a set of Private Equity Principles, or the “Principles,”which were revised in January 2011. The Principles were developed in order to encourage discussion between limited partners and general partners regardingprivate equity fund partnership terms. Certain of the Principles call for enhanced “alignment of interests” between general partners and limited partnersthrough modifications of some of the terms of fund arrangements, including proposed guidelines for fees and carried interest structures. We provided ILPAour endorsement of the Principles, representing an indication of our general support for the efforts of ILPA. Although we have no obligation to modify any ofour fees with respect to our existing funds, we may experience pressure to do so.
In addition, certain institutional investors, including sovereign wealth funds and public pension funds, have demonstrated an increased preferencefor alternatives to the traditional investment fund structure, such as managed accounts, specialized funds and co-investment vehicles. We also have enteredinto strategic partnerships with individual investors whereby we manage that investor’s capital across a variety of our products on separately negotiatedterms. There can be no assurance that such alternatives will be as profitable to us as traditional investment fund structures, and the impact such a trend couldhave on our results of operations, if widely implemented, is unclear. Moreover, certain institutional investors are demonstrating a preference to in-source theirown investment professionals and to make direct investments in alternative assets without the assistance of investment advisors like us. Such institutionalinvestors may become our competitors and could cease to be our clients.
The failure of our funds to raise capital in sufficient amounts and on satisfactory terms could result in a decrease in AUM, carried interest,management fee, transaction fee and advisory revenue or could result in us being unable to achieve an increase in AUM, carried interest and management fee,transaction fee and advisory fee revenue, and could have a material adverse effect on our financial condition and results of operations. Similarly, anymodification of our existing fee arrangements or the fee structures for new funds could adversely affect our results of operations.
Third-party investors in our funds with commitment-based structures may not satisfy their contractual obligation to fund capital calls when requested byus, which could adversely affect a fund’s operations and performance.
Investors in all of our private equity and certain of our credit and real estate funds make capital commitments to those funds that we are entitled tocall from those investors at any time during prescribed periods. We depend on investors fulfilling their commitments when we call capital from them in orderfor those funds to consummate investments and otherwise pay their obligations when due. Any investor that does not fund a capital call would be subject toseveral possible penalties, including having a significant amount of its existing investment forfeited in that fund. However, the impact of the penalty isdirectly correlated to the amount of capital previously invested by the investor in the fund and if an investor has invested little or no capital, for instanceearly in the life of the fund, then the forfeiture penalty may not be as meaningful. If investors were to fail to satisfy a significant amount of capital calls forany particular fund or funds, the operation and performance of those funds could be materially and adversely affected.
We may not have sufficient cash to satisfy general partner obligations to return carried interest income if and when they are triggered under the governingagreements with our fund investors.
Carried interest income from our private equity funds and certain of our credit and real estate funds is subject to contingent repayment by the generalpartner if, upon the final distribution, the relevant fund’s general partner has received cumulative carried interest on individual portfolio investments inexcess of the amount of carried interest it would be entitled to from the profits calculated for all portfolio investments in the aggregate. The ManagingPartners, Contributing Partners and certain other investment professionals have personally guaranteed, subject to certain limitations, our obligations inrespect of these general partner obligations. We have agreed to indemnify the Managing Partners and certain Contributing Partners against all amounts thatthey pay pursuant to any of these personal guarantees in favor of certain funds that we manage (including costs and expenses related to investigating thebasis for or objecting to any claims made in respect of the guarantees) for all interests that the Managing Partners and Contributing Partners have contributedor sold to the Apollo Operating Group. To the extent one or more such general partner obligations were to occur, we might not have available cash at the timesuch obligation is triggered to repay the carried interest and satisfy such obligation, or if applicable, to reimburse the Managing Partners and certainContributing Partners for the indemnifiable percentage of amounts that they are required to pay in connection with such general partner obligation. If wewere unable to repay such carried interest, we would be in breach of the governing agreements with our investors and could be subject to liability.
- 28-

Table of Contents
The historical returns attributable to our funds should not be considered as indicative of the future results of our funds or of our future results or of anyreturns expected on an investment in our Class A shares.
We have presented in this report the returns relating to the historical performance of our private equity, credit and real estate funds. The returns arerelevant to us primarily insofar as they are indicative of incentive income we have earned in the past and may earn in the future, our reputation and our abilityto raise new funds. The returns of the funds we manage are not, however, directly linked to returns on our Class A shares. Therefore, you should not concludethat continued positive performance of the funds we manage will necessarily result in positive returns on an investment in Class A shares. However, poorperformance of the funds we manage will cause a decline in our revenue from such funds, and would therefore have a negative effect on our performance andthe value of our Class A shares. An investment in our Class A shares is not an investment in any of the Apollo funds.
Moreover, the historical returns of our funds should not be considered indicative of the future returns of these or from any future funds we may raise,in part because:
• market conditions during previous periods may have been significantly more favorable for generating positive performance,particularly in our private equity business, than the market conditions we may experience in the future;
• our private equity funds’ rates of return, which are calculated on the basis of net asset value of the funds’ investments, reflectunrealized gains, which may never be realized;
• our funds’ returns have benefited from investment opportunities and general market conditions that may not repeat themselves,including the availability of debt capital on attractive terms and the availability of distressed debt opportunities, and we may notbe able to achieve the same returns or secure the same profitable investment opportunities or deploy capital as quickly;
• the historical returns that we present in this report derive largely from the performance of our current private equity funds, whereasfuture fund returns will depend increasingly on the performance of our newer funds or funds not yet formed, which may have littleor no realized investment track record;
• Fund VII and Fund VIII are larger private equity funds, and this capital may not be deployed as profitably as other funds;• the attractive returns of certain of our funds have been driven by the rapid return of invested capital, which has not occurred with
respect to all of our funds and we believe is less likely to occur in the future;• our track record with respect to our credit funds and real estate funds is relatively short as compared to our private equity funds;• in recent years, there has been increased competition for private equity investment opportunities resulting from the increased
amount of capital invested in private equity funds and high liquidity in debt markets; and• our newly established funds may generate lower returns during the period that they take to deploy their capital.
Finally, our private equity IRRs have historically varied greatly from fund to fund. Accordingly, you should realize that the IRR going forward forany current or future fund may vary considerably from the historical IRR generated by any particular fund, or for our private equity funds as a whole. Futurereturns will also be affected by the risks described elsewhere in this report and risks of the industries and businesses in which a particular fund invests. See“Item 7. Management’s Discussion and Analysis of Financial Condition and Results of Operations-The Historical Investment Performance of Our Funds.”
Our funds’ reported net asset values, rates of return and the incentive income we receive from affiliates are subject to a number of factors beyond ourcontrol and are based in large part upon estimates of the fair value of our funds’ investments, which are based on subjective standards that may prove to beincorrect.
A large number of investments held by our funds are illiquid and thus have no readily ascertainable market prices. We value these investments basedon our estimate of their fair value as of the date of determination. We estimate the fair value of our funds’ investments based on third-party models, or modelsdeveloped by us, which include discounted cash flow analyses and other techniques and may be based, at least in part, on independently sourced marketparameters. The material estimates and assumptions used in these models include the timing and expected amount of cash flows, the appropriateness ofdiscount rates used, and, in some cases, the ability to execute, the timing of and the estimated proceeds from expected financings. The actual results related toany particular investment often vary materially as a result of the inaccuracy of these estimates and assumptions. In addition, because many of the illiquidinvestments held by our funds are in industries or sectors that are unstable, in distress, or undergoing some uncertainty, such investments are subject to rapidchanges in value caused by sudden company-specific or industry-wide developments.
- 29-

Table of Contents
We include the fair value of illiquid assets in the calculations of net asset values, returns of our funds and our AUM. Furthermore, we recognizeincentive income from affiliates based in part on these estimated fair values. Because these valuations are inherently uncertain, they may fluctuate greatlyfrom period to period. Also, they may vary greatly from the prices that would be obtained if the assets were to be liquidated on the date of the valuation andoften do vary greatly from the prices we eventually realize. See Note 2 to our consolidated financial statements for more detail.
In addition, the values of our funds’ investments in publicly traded assets are subject to significant volatility, including due to a number of factorsbeyond our control. These include actual or anticipated fluctuations in the quarterly and annual results of these companies or other companies in theirindustries, market perceptions concerning the availability of additional securities for sale, general economic, social or political developments, changes inindustry conditions or government regulations, changes in management or capital structure and significant acquisitions and dispositions. Because the marketprices of these securities can be volatile, the valuation of these assets will change from period to period, and the valuation for any particular period may notbe realized at the time of disposition. In addition, because our private equity funds often hold very large amounts of the securities of their portfoliocompanies, the disposition of these securities often takes place over a long period of time, which can further expose us to volatility risk. Even if our fundshold a quantity of public securities that may be difficult to sell in a single transaction, we do not discount the market price of the security for purposes of ourvaluations.
If a fund realizes value on an investment that is significantly lower than the value at which it was reflected in a fund’s net asset values, the fundwould suffer losses. This could in turn lead to a decline in our asset management fees and a loss equal to the portion of the incentive income from affiliatesreported in prior periods that was not realized upon disposition. These effects could become applicable to a large number of our investments if our funds’estimates and assumptions used in estimating their fair values differ from future valuations due to market developments or other factors that are beyond ourcontrol. See “Item 7. Management’s Discussion and Analysis of Financial Condition and Results of Operations-Segment Analysis” for information related tofund activity that is no longer consolidated. If asset values turn out to be materially different than values reflected in fund net asset values, fund investorscould lose confidence which could, in turn, result in redemptions from our funds that permit redemptions or difficulties in raising additional capital.
We have experienced rapid growth, which may be difficult to sustain and which may place significant demands on our administrative, operational andfinancial resources.
Our AUM has grown significantly in the past and we are pursuing further growth in the near future. Our rapid growth has caused, and plannedgrowth, if successful, will continue to cause, significant demands on our legal, regulatory, accounting and operational infrastructure, and increased expenses.The complexity of these demands, and the expense required to address them, is a function not simply of the amount by which our AUM has grown, but also ofthe growth in the variety, including the differences in strategy among, and complexity of, our different funds. In addition, we are required to continuouslydevelop our systems and infrastructure in response to the increasing complexity of the investment management market and legal, accounting, regulatory andtax developments.
Our future growth will depend in part on our ability to maintain an operating platform and management system sufficient to address our growth andwill require us to incur significant additional expenses and to commit additional senior management and operational resources. As a result, we facesignificant challenges:
• in maintaining adequate financial, regulatory and business controls;• in implementing new or updated information and financial systems and procedures; and• in training, managing and appropriately sizing our work force and other components of our businesses on a timely and cost-
effective basis.
We may not be able to manage our expanding operations effectively or be able to continue to grow, and any failure to do so could adversely affectour ability to generate revenue and control our expenses.
Extensive regulation of our businesses affects our activities and creates the potential for significant liabilities and penalties. The possibility of increasedregulatory focus could result in additional burdens on our businesses. Changes in taxation or law and other legislative or regulatory changes couldadversely affect us.
Overview of Our Regulatory Environment. We are subject to extensive regulation, including periodic examinations, by governmental and self-regulatory organizations in the jurisdictions in which we operate around the world. Many of these regulators, including U.S. and foreign governmentagencies and self-regulatory organizations, as well as state securities commissions in the United States, are empowered to conduct investigations andadministrative proceedings that can result in fines, suspensions of personnel or other sanctions, including censure, the issuance of cease-and-desist orders orthe suspension or expulsion of an
- 30-

Table of Contents
investment advisor from registration or memberships. Even if an investigation or proceeding did not result in a sanction or the sanction imposed against us orour personnel by a regulator were small in monetary amount, the adverse publicity relating to the investigation, proceeding or imposition of these sanctionscould harm our reputation and cause us to lose existing investors or fail to gain new investors. The requirements imposed by our regulators are designedprimarily to ensure the integrity of the financial markets and to protect investors in our funds and may not necessarily be designed to protect ourshareholders. Consequently, these regulations often serve to limit our activities. For example, in 2014 federal bank regulatory agencies issued leveragedlending guidance covering transactions characterized by a degree of financial leverage. Such guidance has limited the amount and may increase the cost offinancing our funds are able to obtain for transactions, which may lead to a negative impact on the returns on our funds’ investments.
Our business may be adversely affected as a result of new or revised legislation or regulations imposed by the SEC or other U.S. governmentalregulatory authorities or self-regulatory organizations that supervise the financial markets. We also may be adversely affected by changes in theinterpretation or enforcement of existing laws and rules by these governmental authorities and self-regulatory organizations. For example, senior officials atthe SEC have recently emphasized their intention to implement a “broken windows” policy, meaning that the SEC will pursue even the most minorviolations on the theory that publicly pursuing smaller matters will reduce the prevalence of larger matters. The Director of the SEC’s Division ofEnforcement has described “broken windows” as a zero tolerance policy.
Regulatory changes could adversely affect our business. As a result of highly publicized financial scandals, investors have exhibited concerns overthe integrity of the financial markets and the regulatory environment in which we operate both in the United States and outside the United States is likely tobe subject to further regulation. There have been active debates both nationally and internationally over the appropriate extent of regulation and oversight ina number of areas which are or may be relevant to us, including private investment funds and their managers and the so-called “shadow banking” sector.
The regulatory and legal requirements that apply to our activities are subject to change from time to time and may become more restrictive, whichmay impose additional expenses on us, make compliance with applicable requirements more difficult, require attention of senior management, or otherwiserestrict our ability to conduct our business activities in the manner in which they are now conducted. They also may result in fines or other sanctions if we orany of our funds are deemed to have violated any law or regulations. Changes in applicable regulatory and legal requirements, including changes in theirenforcement, could materially and adversely affect our business and our financial condition and results of operations.
Investment advisors have come under increased scrutiny from regulators, including the SEC and other government and self-regulatory organizations,with a particular focus on fees, allocation of expenses to funds, valuation practices, and related disclosures to fund investors. Public statements by regulators,in particular the SEC, indicate increased enforcement attention will continue to be focused on investment advisors, which has the potential to affect us. Wealso may be adversely affected by changes in the interpretation or enforcement of existing laws and rules by these governmental authorities and self-regulatory organizations.
The Dodd-Frank Wall Street Reform and Consumer Protection Act, or the “Dodd-Frank Act,” continues to impose significant new regulations onalmost every aspect of the U.S. financial services industry, including aspects of our business and the markets in which we operate. Among other things, theDodd-Frank Act includes the following provisions that could have an adverse impact on our ability to continue to operate our businesses.
• The Dodd-Frank Act established the Financial Stability Oversight Council (the “FSOC”), which is comprised of representatives of all themajor U.S. financial regulators, to act as the financial system’s systemic risk regulator with the authority to review the activities of non-bankfinancial companies predominantly engaged in financial activities that are designated as “systemically important.” Such designation isapplicable to companies where material financial distress could pose risk to the financial stability of the United States. On April 3, 2012,the FSOC issued a final rule and interpretive guidance regarding the process by which it will designate nonbank financial companies assystemically important. The final rule and interpretive guidance detail a three-stage process, with the level of scrutiny increasing at eachstage. Initially, the FSOC will apply a broad set of uniform quantitative metrics to screen out financial companies that do not warrantadditional review. The FSOC will consider whether a company has at least $50 billion in total consolidated assets and whether it meetsother thresholds relating to credit default swaps outstanding, derivative liabilities, total debt outstanding, a minimum leverage ratio of totalconsolidated assets (excluding separate accounts) to total equity of 15 to 1, and a short-term debt ratio of debt (with maturities of less than12 months) to total consolidated assets (excluding separate accounts) of 10%. A company that meets or exceeds both the asset thresholdand one of the other thresholds will be subject to additional review. The review criteria could, and are expected to, evolve over time. Whilewe believe it to be unlikely that we would be designated as systemically important, if such designation were to occur, we
- 31-

Table of Contents
would be subject to significantly increased levels of regulation, which includes, without limitation, a requirement to adopt heightenedstandards relating to capital, leverage, liquidity, risk management, credit exposure reporting and concentration limits, restrictions onacquisitions and being subject to annual stress tests by the Board of Governors of the Federal Reserve System (the “Federal Reserve”). Todate, the FSOC has designated a few non-bank financial institutions for Federal Reserve supervision.
• In connection with the work of the FSOC, on October 31, 2011, the SEC and the Commodity Futures Trading Commission issued a jointfinal rule on systemic risk reporting designed to assist the FSOC in gathering information from many sectors of the financial system formonitoring risks. The final rule requires large private equity fund advisors, such as Apollo, to submit reports on Form PF focusing primarilyon the extent of leverage incurred by their funds’ portfolio companies, the use of bridge financing in their funds’ investments in financialinstitutions.
• On December 18, 2014, the FSOC released a notice seeking public comment on the potential risks posed by aspects of the assetmanagement industry, including whether asset management products and activities pose potential risks to the U.S. financial system in theareas of liquidity and redemptions, leverage, operational functions, and resolution, or in other areas.
• The Dodd-Frank Act, under what has become known as the “Volcker Rule,” generally prohibits depository institution holding companies(including certain foreign banks with U.S. branches and insurance companies with U.S. depository institution subsidiaries), insureddepository institutions and subsidiaries and affiliates of such entities (collectively, “banking entities”) from investing in, sponsoring orhaving certain other relationships with “covered funds,” which include private equity funds or hedge funds. The final Volcker Rule becameeffective on April 1, 2014 and is subject to a conformance period (ending July 21, 2016). The Volcker Rule adversely affects our ability toraise funds from banking entities. Furthermore, divestitures by banking entities of interests in covered funds to comply with the VolckerRule may lead to lower prices in the secondary market for our fund interests, which could have adverse implications for our ability to raisefunds from investors who may have considered the availability of secondary market liquidity as a factor in determining whether to invest.
• The Dodd-Frank Act requires many private equity and hedge fund advisers to register with the SEC under the Investment Advisers Act, tomaintain extensive records and to file reports if deemed necessary for purposes of systemic risk assessment by certain governmental bodies.As described elsewhere in this Form 10-K, all of the investment advisers of our investment funds operated in the U.S. are registered asinvestment advisers with the SEC.
• The Dodd-Frank Act authorizes U.S. federal regulatory agencies to review and, in certain cases, prohibit compensation arrangements atfinancial institutions that give employees incentives to engage in conduct deemed to encourage inappropriate risk taking by coveredfinancial institutions. Such restrictions could limit our ability to recruit and retain investment professionals and senior managementexecutives.
• Rules and regulations required under the Dodd-Frank Act have become effective and comprehensively regulate the “over the counter”(“OTC”) derivatives markets for the first time. The Dodd-Frank Act and the regulations promulgated thereunder require mandatory clearingand exchange or swap execution facility trading of certain swaps and derivative transactions (including formerly unregulated over-the-counter derivatives). The Commodity Futures Trading Commission (the “CFTC”) currently requires that certain interest rate and creditdefault index swaps be centrally cleared and the requirement to execute those contracts through a swap execution facility is now effective. Additional standardized swap contracts are expected to be subject to new clearing and execution requirements in the future. OTC tradessubmitted for clearing will be subject to minimum initial and variation margin requirements set by the relevant clearinghouse, as well aspossible margin requirements imposed by the clearing brokers. For swaps that are cleared through a clearinghouse, the funds will face theclearinghouse as legal counterparty and will be subject to clearinghouse performance and credit risk. Clearinghouse collateralrequirements may differ from and be greater than the collateral terms negotiated with derivatives counterparties in the OTC market. Thismay increase a fund’s cost in entering into these products and impact a fund’s ability to pursue certain investment strategies. OTCderivative dealers are also required to post margin to the clearinghouses through which they clear their customers’ trades instead of usingsuch margin in their operations for cleared derivatives, as is currently permitted for uncleared trades. This will increase the OTC derivativedealers’ costs and these increased costs are expected to be passed through to other market participants in the
- 32-

Table of Contents
form of higher upfront and mark-to-market margin, less favorable trade pricing, and possible new or increased fees.
OTC trades not cleared through a registered clearinghouse may not be subject to the protections afforded to participants in cleared swaps(for example, centralized counterparty, customer asset segregation and mandatory margin requirements). As of December 16, 2015 theregulators have finalized margin requirements for non-cleared OTC derivatives, but these regulations are not yet in effect. Although theDodd-Frank Act includes limited exemptions from the clearing and margin requirements for so-called “end-users,” our funds and portfoliocompanies may not be able to rely on such exemptions.
The Dodd-Frank Act also creates new categories of regulated market participants, such as “swap-dealers,” “security-based swap dealers,”“major swap participants” and “major security-based swap participants” who will be subject to significant new capital, registration,recordkeeping, reporting, disclosure, business conduct and other regulatory requirements, which will give rise to new administrative costs.Even if certain new requirements are not directly applicable to us, they may still increase our costs of entering into transactions with theparties to whom the requirements are directly applicable.
Position limits imposed by various regulators, self-regulatory organizations or trading facilities on derivatives may also limit our ability toeffect desired trades. Position limits are the maximum amounts of net long or net short positions that any one person or entity may own orcontrol in a particular financial instrument. For example, the CFTC, on December 12, 2013, re-proposed rules that would establish specificlimits on positions in 28 physical commodity futures and option contracts as well as swaps that are economically equivalent to suchcontracts. In addition, the Dodd-Frank Act requires the SEC to set position limits on security-based swaps. If such proposed rules areadopted, we may be required to aggregate the positions of our various investment funds and the positions of our funds’ portfoliocompanies. It is possible that trading decisions may have to be modified and that positions held may have to be liquidated in order to avoidexceeding such limits. Such modification or liquidation, if required, could adversely affect our operations and profitability.
• Effective for CLOs on December 24, 2016, “risk retention” rules promulgated by U.S. federal regulators under the Dodd-Frank Act willrequire a “securitizer” or “sponsor” (which in the case of a CLO is considered the collateral manager) to retain directly or through amajority-owned affiliate (including an entity that is considered a majority-owned affiliate based on the holding of a controlling financialinterest in such entity as determined under U.S. generally accepted accounting practices), at least 5% of the credit risk of the securitizedassets (the “U.S. Risk Retention Rules”). The European Union already has similar 5% risk retention rules (the “EU Risk Retention Rules”and together with the U.S. Risk Retention Rules, the “Risk Retention Rules”) in place that apply to certain EU investors such as creditinstitutions (including banks), investment firms, authorized investment fund managers and insurance and reorganization undertakings. Ininstances in which any such entities subject to the EU Risk Retention Rules invest in a CLO (as a noteholder or otherwise), such investorsmust ensure that the CLO is required to satisfy the EU Risk Retention Rules.
To the extent the EU Risk Retention Rules are to be satisfied through the EU “sponsor” option, it is expected that the holder of the EUretention interest will be authorized by the UK Financial Conduct Authority under the Financial Services and Markets Act 2000 (“FSMA”)and capitalized (with regulatory capital and other required resources) in a manner necessary or advisable to enable it to satisfy therequirements of FSMA and the EU Markets in Financial Instruments Directive (Directive 2004/39/EC) (“MiFID”). In addition, such“sponsor” holding the EU retention interest would be required to demonstrate that: (a) it is a CRR investment firm, (b) it is authorized to,and does, carry on a business of providing investment management services and activities listed in paragraph (7) of Section A of Annex 1 ofDirective 2004/39/EC (placing of financial instruments without a firm commitment basis), and (c) it is a “sponsor” for the purposes ofArticle 405 of the CRR. For purposes of these requirements, “CRR” means Regulation No 575/2013 of the European Parliament and of theCouncil (as amended from time to time and as implemented by Member States of the European Union) together with any implemented ordelegated regulations, technical standards and guidance related thereto. Whether a collateral manager of a CLO qualifies as an EU“sponsor” under the CRR will depend upon the MiFID authorizations (or permissions) the collateral manager holds from its EU homecountry supervisor.
Certain of the CLOs currently being managed by one of our affiliates have been designed to comply with the EU Risk Retention Rules viathe “sponsor” approach. For these CLOs, Apollo Management International LLP (“AMI”), one of our asset-management affiliates with therequired MiFID permissions to act as the “sponsor”
- 33-

Table of Contents
of CLOs, has undertaken to hold the EU retention interest for four CLOs to date. In the future, certain other newly-formed affiliates mayserve as “sponsor” and holder of the EU retention interest on CLO investments.
The EU Retention Rules may also be satisfied if the “originator” holds the EU retention interest. Article 4(1)(13) of the CRR defines“Originator” as either (1) an entity that itself or through related entities, directly or indirectly, was involved in the original agreement whichcreated the obligations or potential obligations of the debtor or potential debtor giving rise to the exposure being securitised or (2) anentity that purchases a third party’s exposures for its own account and then securitises them. In the future, certain newly-formed affiliatesmay serve as “originator” and holder of the EU retention interest on CLO investments.
Certain of our affiliates will be required from time to time in connection with the CLOs to execute one or more letter or other agreements,the exact form and nature of which will vary and in the case of the U.S. Risk Retention Rules is not known at this time (the “Risk RetentionUndertakings”), under which such affiliate will agree to certain undertakings designed to ensure that the CLOs comply with the RiskRetention Rules. Such Risk Retention Undertakings are expected to include a variety of representations, warranties, covenants and otherindemnities, each of which may run to various transaction parties. At present, such Risk Retention Undertakings typically includerequirements to, among other things, make certain representations, warranties and undertakings (i) in relation to its acquisition andretention (or any of our affiliate’s acquisition and retention) of the Retention Interest for the life of the CLO, and (ii) in the case of the“originator” approach under EU Risk Retention Rules, regarding its agreement (or an agreement of one of our affiliates) to acquire, hold forthe required retention period (which period will vary and during which it will be exposed to the credit risk on such loans) and sell a certainpercentage of loans to the relevant CLO. AMI has already undertaken various Risk Retention Undertakings in connection with CLOs forwhich it acts as “sponsor” under the EU Risk Retention Rules. If AMI or any affiliate breaches any such Risk Retention Undertakings, we orsuch affiliate will be exposed to claims by the other parties thereto, including for any losses incurred as a result of such breach. Such claimsmay reduce, or entirely diminish any cash or assets that would otherwise be used to make distributions to you.
The EU Risk Retention Rules are in the process of being modified, and any such EU Risk Retention Rules and/or U.S. Risk Retention Rulesmay be amended, supplemented or revoked at any time or from time to time. Moreover, while the U.S. Risk Retention Rules are notcurrently effective as to the CLOs, no assurance can be given that the CLOs outstanding prior to the effective date of such U.S. RiskRetention Rules will be, or will continue to be, grandfathered. Such Risk Retention Rules are also subject to varying interpretations, andone or more agencies or governmental officials could take positions regarding such matters that differ from the approach taken or embodiedin the Risk Retention Undertakings, which position could be informed by varying regulatory considerations as well as differing legalanalyses. Available interpretive authority to date addressing the Risk Retention Rules applicable to CLOs is limited, and there is nojudicial decisional authority or applicable agency interpretation that has directly addressed any of the risk retention approaches taken inthe CLOs. Accordingly, no assurance can be made that the currently applicable rules and regulations will not be interpreted differently inthe future by any applicable authority, or that there will not be a change in applicable law or rules and regulations in the future that couldadversely affect us or the CLOs we manage.
The U.S. Risk Retention Rules are not yet in effect, but when such U.S. Risk Retention Rules become effective, any CLO we manage issuedafter such date will be expected to satisfy the U.S. Risk Retention Rules and any existing CLO which we manage may be expected to satisfythe U.S. Risk Retention Rules in connection with any refinancing, re-pricing or material amendment of such existing CLO.
No assurance can be given as to whether the Risk Retention Rules will have a future material adverse effect on our CLO managementbusiness. Although the impact of the rule on CLO managers is generally uncertain, it is possible that the necessity of any of our affiliatedentities to raise capital to retain risk (or to utilize capital provided by its majority-owned affiliates) may reduce the number of CLOs that weare able to manage in the future. Currently, although various options are under consideration, we have not formulated a definitive plan forsatisfying the requirements of U.S. Risk Retention Rules once they become effective. To the extent a plan for satisfying U.S. Risk Retentionis implemented, such a plan may create various conflicts of interest among us and certain of our affiliates or the CLOs we manage and mayentail a deployment of capital that is less efficient than the current use of such capital.
While the impact of the Risk Retention Rules on the loan securitization market and the leveraged loan market generally is uncertain, theRisk Retention Rules may impact our ability or desire to manage CLOs in the future.
- 34-

Table of Contents
The Risk Retention Rules also may have an adverse affect on the leveraged loan market generally, which may adversely affect our CLOmanagement business.
• The Dodd-Frank Act requires public companies to adopt and disclose policies requiring, in the event the company is required to issue anaccounting restatement, the recoupment of related incentive compensation from current and former executive officers.
• The Dodd-Frank Act amends the Exchange Act to compensate and protect whistleblowers who voluntarily provide original information tothe SEC and establishes a fund to be used to pay whistleblowers who will be entitled to receive a payment equal to between 10% and 30%of certain monetary sanctions imposed in a successful government action resulting from the information provided by the whistleblower. Weexpect that these provisions will result in a significant increase in whistleblower claims across our industry, and investigating such claimscould generate significant expenses and take up significant management time, even for frivolous and non-meritorious claims.
Many of these provisions are subject to further rulemaking and to the discretion of regulatory bodies, such as the FSOC, the Federal Reserve and theSEC.
In June 2010, the SEC adopted a “pay-to-play” rule that restricts politically active investment advisors from managing state pension funds. The ruleprohibits, among other things, a covered investment advisor from receiving compensation for advisory services provided to a government entity (such as astate pension fund) for a two-year period after the advisor, certain covered employees of the advisor or any covered political action committee controlled bythe advisor or its employees makes a political contribution to certain government officials. In addition, a covered investment advisor is prohibited fromengaging in political fundraising activities for certain elected officials or candidates in jurisdictions where such advisor is providing or seekinggovernmental business. This rule complicates and increases the compliance burden for our investment advisors. It will be imperative for a covered investmentadvisor to adopt an effective compliance program in light of the substantial penalties associated with the rule.
The Financial Industry Regulatory Authority (“FINRA” recently proposed its own set of “pay to play” regulations that are similar to the SEC’sregulations. If enacted, the FINRA rule effectively prohibits the receipt of compensation from state or local government agencies for solicitation anddistribution activities within two years of a prohibited contribution by a broker-dealer or one of its covered associates. In December 2015, FINRA submittedrevised proposals to the SEC for adoption and we are awaiting the release of the final regulations. There have also been similar laws, rules and regulationsand/or policies adopted by a number of states and municipal pension plans, which prohibit, restrict or require disclosure of payments to (and/or certaincontracts with) state officials by individuals and entities seeking to do business with state entities, including investment by public retirement funds.
It is impossible to determine the full extent of the impact on us of the Dodd-Frank Act or any other new laws, regulations or initiatives that may beproposed or whether any of the proposals will become law. Any changes in the regulatory framework applicable to our business, including the changesdescribed above, may impose additional costs on us, require the attention of our senior management or result in limitations on the manner in which weconduct our business. Moreover, as calls for additional regulation have increased, there may be a related increase in regulatory investigations of the tradingand other investment activities of alternative asset management funds, including our funds. Complying with any new laws or regulations could be moredifficult and expensive, affect the manner in which we conduct our business and adversely affect our profitability.
Exemptions from Certain Laws. We regularly rely on exemptions from various requirements of law or regulation, including the Securities Act, theExchange Act, the Investment Company Act, CFTC regulations, the Commodity Exchange Act of 1936, as amended, and the Employment RetirementIncome Security Act of 1974, as amended and the laws and regulations of other jurisdictions in conducting our activities. These exemptions are sometimeshighly complex and may in certain circumstances depend on compliance by third parties whom we do not control. For example, in raising new funds, wetypically rely on private placement exemptions from registration under the Securities Act and similar exemptions under the securities laws of other countries.
These exemptions include Regulation D, which was amended in 2013 to prohibit issuers (including our funds) from relying on certain of theexemptions from registration if the fund or any of its “covered persons” (including certain officers and directors, but also including certain third partiesincluding, among others, promoters, placement agents and beneficial owners of 20% of outstanding voting securities of the fund) has been the subject of a“disqualifying event,” or constitutes a “bad actor,” which can result from a variety of criminal, regulatory and civil matters. If any of the covered personsassociated with our funds is subject to a disqualifying event, one or more of our funds could lose the ability to raise capital in a Rule 506 private offering fora significant period of time, which could significantly impair our ability to raise new funds, and, therefore, could materially
- 35-

Table of Contents
adversely affect our business, financial condition and results of operations. In addition, if certain of our employees or any potential significant fund investorhas been the subject of a disqualifying event, we could be required to reassign or terminate such an employee or we could be required to refuse theinvestment of such an investor, which could impair our relationships with investors, harm our reputation, or make it more difficult to raise new funds. If forany reason any of these exemptions were to become unavailable to us, we could become subject to regulatory action, third-party claims or be required toregister under certain regulatory regimes, and our businesses could be materially and adversely affected. See, for example, “-Risks Related to OurOrganization and Structure-If we were deemed an investment company under the Investment Company Act, applicable restrictions could make it impracticalfor us to continue our businesses as contemplated and could have a material adverse effect on our businesses and the price of our Class A shares.”
These exemptions also include the so-called “de minimis” exemption from commodity pool operator registration, codified in CFTC Rule 4.13(a)(3).If any of our funds cease to qualify for this (or another applicable) exemption, certain Apollo entities associated with and/or affiliated with those funds will berequired to register with the CFTC as commodity pool operators. Registration as a commodity pool operator entails several potentially costly and time-consuming requirements, including, without limitation, membership with the National Futures Association, a self-regulatory organization for the U.S.derivatives industry, and compliance with the regulatory framework applicable to registered commodity pool operators. In 2015, one of our investmentmanagement entities was required to register as a commodity pool operator. The increased costs associated with such registration may affect the manner inwhich the funds managed by such investment management entity conducts its business and may adversely affect such fund’s profitability.
Fund Regulatory Environment. The regulatory environment in which our funds operate may affect our businesses. For example, changes in antitrustlaws or the enforcement of antitrust laws could affect the level of mergers and acquisitions activity, and changes in state laws may limit investment activitiesof state pension plans. See “Item 1. Business-Regulatory and Compliance Matters” for a further discussion of the regulatory environment in which weconduct our businesses.
Certain of the funds and accounts we manage that engage in originating, lending and/or servicing loans may be subject to state and federalregulation, borrower disclosure requirements, limits on fees and interest rates on some loans, state lender licensing requirements and other regulatoryrequirements in the conduct of their business. These funds and accounts may also be subject to consumer disclosures and substantive requirements onconsumer loan terms and other federal regulatory requirements applicable to consumer lending that are administered by the Consumer Financial ProtectionBureau. These state and federal regulatory programs are designed to protect borrowers.
State and federal regulators and other governmental entities have authority to bring administrative enforcement actions or litigation to enforcecompliance with applicable lending or consumer protection laws, with remedies that can include fines and monetary penalties, restitution of borrowers,injunctions to conform to law, or limitation or revocation of licenses and other remedies and penalties. In addition, lenders and servicers may be subject tolitigation brought by or on behalf of borrowers for violations of laws or unfair or deceptive practices. Failure to conform to applicable regulatory and legalrequirements could be costly and have a detrimental impact on certain of our funds and ultimately on Apollo.
Portfolio Company Regulatory Environment. The regulatory environment in which our funds’ portfolio companies operate may affect our business.For example, certain of our funds may invest in the natural resources industry where environmental laws, regulations and regulatory initiatives play asignificant role and can have a substantial effect on investments in the industry. See for additional examples “-Insurance Regulation” and “-We are a holdingcompany subject to the jurisdiction of the Federal Energy Regulatory Commission (the “FERC”). An acquirer of our Class A shares may be required to obtainprior approval from the FERC and make other filings with FERC.” Additionally, we or certain of our investment funds potentially could be held liable underERISA for the pension obligations of one or more of our funds' portfolio companies if we or the investment fund were determined to be engaged in a “trade orbusiness” and deemed part of the same “controlled group” as the portfolio company, and the pension obligations of any particular portfolio company couldbe material. In a 2013 decision of a federal appellate court (Sun Capital Partners III LP v. New England Teamsters & Trucking Indus. Pension Fund ), aprivate equity fund was held to be engaged in a “trade or business” under ERISA. In addition, regulators may scrutinize, investigate or take action against usas a result of actions or inactions by portfolio companies operating in a regulated industry if such a regulator were to deem, or potentially deem, suchportfolio company to be under our control. For example, based on positions taken by European governmental authorities, we or certain of our investmentfunds potentially could be liable for fines if portfolio companies deemed to be under our control are found to have violated European antitrust laws. Suchpotential, or future, liability may materially affect our business.
Future Regulation. We may be adversely affected as a result of new or revised legislation or regulations imposed in the U.S. or elsewhere. As callsfor additional regulation have increased, there may be a related increase in regulatory investigations of the trading and other investment activities ofalternative asset management funds, including our funds. Such investigations may
- 36-

Table of Contents
impose additional expenses on us, may require the attention of senior management and may result in fines or other sanctions if any of our funds are deemed tohave violated any regulations.
We also may be adversely affected by changes in the interpretation or enforcement of existing laws and rules. New laws or regulations could makecompliance more difficult and expensive and affect the manner in which we conduct business and divert significant management and operational resourcesand attention from our business.
Apollo provides investment management services through registered investment advisors. Investment advisors are subject to extensive regulation inthe United States and in the other countries in which our investment activities occur. The SEC oversees the activities of our registered investment advisorsunder the Investment Advisers Act. In the United Kingdom, we are subject to regulation by the U.K. Financial Conduct Authority. Our other Europeanoperations, and our investment activities around the globe, are subject to a variety of regulatory regimes that vary country by country. A failure to complywith the obligations imposed by the regulatory regimes to which we are subject, including the Investment Advisers Act, could result in investigations,sanctions and reputational damage.
The European Union Alternative Investment Fund Managers Directive (“AIFMD”) came into force on July 22, 2013 and was required to betransposed into the laws of the member states (“EEA Member States”) of the European Economic Area (the “EEA”) (in the case of EEA Member States that arenot member states of the European Union (“EU”), subject to AIFMD being incorporated into the EEA Agreement) by no later than July 22, 2013 (althoughsome EEA Member States still have not met this deadline). The AIFMD imposes significant regulatory requirements on investment managers operatingwithin the EEA, including with respect to conduct of business, regulatory capital, valuations, disclosures and marketing, and rules on the structure ofremuneration for certain personnel. Alternative investment funds (i) organized outside of the EU and those of the additional EEA member states that haveimplemented AIFMD and (ii) in which interests are marketed under AIFMD within the EEA, are subject to significant conditions on their operations. In theimmediate future, such funds may be marketed only in certain EEA jurisdictions and in compliance with requirements to register the fund for marketing ineach relevant jurisdiction and to undertake periodic investor and regulatory reporting. In some countries, additional obligations are imposed: for example, inGermany, marketing of a non-EEA fund also requires the appointment of one or more depositaries (with cost implications for the fund). In the longer term(mid 2016 at the earliest) non-EEA managers of non-EEA funds may be able to register under the AIFMD. Where Apollo registers under the AIFMD, Apollowill have more freedom to promote relevant funds in the EEA, although this will be subject to full compliance with all the requirements of the AIFMD, whichinclude (among other things) satisfying the competent authority of the robustness of internal arrangements with respect to risk management, in particularliquidity risks and additional operational and counterparty risks associated with short selling; the management and disclosure of conflicts of interest; the fairvaluation of assets; and the security of depository/custodial arrangements. Additional requirements and restrictions apply where funds invest in an EEAportfolio company, including restrictions that may impose limits on certain investment and realization strategies, such as dividend recapitalizations andreorganizations. Such rules could potentially impose significant additional costs on the operation of our business or investments in the EEA and could limitour operating flexibility within the relevant jurisdictions.
The European Parliament has adopted the Regulation on OTC derivatives, central counterparties and trade repositories, known as “EMIR.” EMIRcomes into force in stages and implements requirements similar to, but not the same as, those in Title VII of Dodd Frank, in particular requiring reporting ofall derivative transactions, risk mitigation (in particular initial and variation margin) for OTC derivative transactions and central clearing of certain OTCderivative contracts. EMIR does not have a material impact on the Apollo funds at present but is likely to apply more fully as additional implementationstages are reached. Compliance with the requirements is likely to increase the burdens and costs of doing business.
Additional laws and regulations will come into force in the EEA in coming years. These are expected to have an impact on Apollo including thecosts of, risk to and manner of conducting its business; the markets in which Apollo operates; the assets managed or advised by Apollo; Apollo’s ability toraise capital from investors; and ultimately there may be an impact on the returns which can be achieved. Examples include the revisions to the Markets inFinancial Instruments Directive; the new regulation relating to Securities Financing Transactions; further changes to or reviews of the extent andinterpretation of pay regulation (which may have an impact on the retention and recruitment of key personnel); a proposed new regulation governingsecuritization arrangements; tentative proposals for enhanced regulation of loan origination; and significant focus on entities considered to be “shadowbanks.” Regulations affecting specific investor types, such as insurance companies, may impact their businesses; their ability to invest and the assets inwhich they are permitted to invest; and the requirements which their investments place on us, such as extensive disclosure and reporting obligations. Theregulation of some institutions has an effect on their ability and willingness to extend credit and the costs of credit. This has, and is likely to continue tohave, an impact on the price and availability of credit. Changes to the regulation of benchmarks, such as the London Interbank Offered Rate, may affect theway in which those benchmarks are calculated, with commercial implications, including on the stability of the benchmark and returns.
- 37-

Table of Contents
In Germany, legislative amendments have been adopted which may limit deductibility of interest and other financing expenses in companies inwhich our funds have invested or may invest in the future. According to the German interest barrier rule, the tax deduction available to a company in respectof a net interest expense (interest expense less interest income) is limited to 30% of its tax earnings before interest, taxes, depreciation and amortization(“EBITDA”). For existing investments, this may reduce overall returns for our funds. Annual net interest expense that does not exceed the threshold of €3million can be deducted without any limitations for income tax purposes. Interest expense in excess of the interest deduction limitation may be carriedforward indefinitely (subject to change in ownership restrictions) and used in future periods against all profits and gains. In respect of a tax group, interestpaid by the German tax group entities to non-tax group parties (e.g. interest on bank debt, capex facility and working capital facility debt) will be restrictedto 30% of the tax group’s tax EBITDA. However, the interest barrier rule may not apply where German company’s gearing under International FinancialReporting Standards (“IFRS”) accounting principles is at maximum of 2% higher than the overall group’s leverage ratio at the level of the very top levelentity which would be subject to IFRS consolidation (the “escape clause test”). This test is failed where any worldwide company of the entire group paysmore than 10% of its net interest expense on debt to substantial (i.e. greater than 25%) shareholders, related parties of such shareholders (that are not membersof the group) or secured third parties (although security granted by group members should not be harmful). If the group does not apply IFRS accountingprinciples, EU member countries’ generally accepted accounting principles or U.S. GAAP may also be accepted for the purpose of the escape clause test. Itshould be noted that for trade tax purposes, there is principally a 25% add back on all deductible interest paid or accrued by any German entity after theconsideration of a tax exempt amount €100 which is applied to the sum of all add back amounts. For trade tax purposes interest payments within a Germantax group will not be considered. Our businesses are subject to the risk that similar measures might be introduced in other countries in which our fundscurrently have investments or plan to invest in the future, or that other legislative or regulatory measures might be promulgated in any of the countries inwhich we operate that adversely affect our businesses.
On October 5, 2015, the Organization for Economic Co-Operation and Development (“OECD”) published 13 final reports and an explanatorystatement outlining consensus actions under the base erosion and profit shifting (BEPS) project. This project calls for a coordinated multi-jurisdictionalapproach to “aggressive tax planning” by multinational companies. The final reports of October 5, 2015 consolidated the first seven reports endorsed by theG20 Leaders at the Brisbane Summit in 2014 and the final package was endorsed by the G20 Leaders during their summit in November, 2015 in Antalya,Turkey. Implementation may not be uniform across the participating states; certain actions give states options for implementation, certain actions arerecommendations only and other jurisdictions may elect to only partially implement rules where it is in the state’s interest. Countries including various EUcountries have been moving forward on the BEPS agenda independent of agreement and finalization of the BEPS action items and currently are in theprocess of adapting and introducing the necessary legislation. The EU may implement minimum standards and best practices across 28 member states, whichmay go further than the OECD plans. As a result, significant uncertainty remains around the impact for the investments of our funds.
Any changes to international tax laws or foreign domestic tax laws, including new definitions of “permanent establishment” and the standardizedcountry by country (“CbC”) reporting requirements for transfer pricing documentation, could impact the tax treatment of our foreign earnings and adverselyimpact the investment returns of our funds. For example, in line with the recommendations of the BEPS Action Plan 6, Preventing the Granting of TreatyBenefits in Inappropriate Circumstances, the latest Tax Treaties signed by Spain include a limitation on benefits clause. The final draft of the BEPS ActionPlan 4. Limiting Base Erosion Involving Interest Deductions and Other Financial Payments introduced the definition of “related parties” which includescollective investment vehicles (“CIV”). The CIVs that are engaged in structured arrangements are specifically recommended for targeted rules to counteractthe deductibility of interest. Additional legislative changes to limit the deductibility of certain interest deductions in the OECD countries may impact theinvestment returns of our funds. In addition, with more information available to tax authorities through CbC and the Common Reporting Standard (“CRS”),which is formally referred to as the Standard for Automatic Exchange of Financial Account Information, there is an increased risk of scrutiny and tax auditsfrom various tax authorities. Many tax authorities are unfamiliar with asset management businesses and dealing with challenges from such tax authoritiescould reduce returns for our funds due to additional taxes paid and increased compliance costs.
Insurance Regulation. State insurance departments have broad administrative powers over the insurance business of our insurance companyaffiliates, including insurance company licensing and examination, agent licensing, establishment of reserve requirements and solvency standards, premiumrate regulation, admissibility of assets, policy form approval, unfair trade and claims practices, payment of dividends and distributions to shareholders, reviewand/or approval of transactions with affiliates and other matters. State regulators regularly review and update these and other requirements.
Currently, there are proposals to increase the scope of regulation of insurance holding companies in both the United States and internationally. Inthe United States, the NAIC has promulgated amendments to its insurance holding company system model law and regulations for consideration by thevarious states that would provide for more extensive informational reporting regarding parents and other affiliates of insurance companies, with the purposeof protecting domestic insurers from enterprise risk, including
- 38-

Table of Contents
requiring an annual enterprise risk report by the ultimate controlling person identifying the material risks within the insurance holding company system thatcould pose enterprise risk to domestic insurers. Changes to existing NAIC model laws or regulations must be adopted by individual states or foreignjurisdictions before they will become effective. To date, each of Delaware, Iowa and New York has enacted laws to adopt such amendments. Internationally,the International Association of Insurance Supervisors is in the process of adopting a framework for the “group wide” supervision of internationally activeinsurance groups. The NAIC has also promulgated additional amendments to its insurance holding company system model law that address “group wide”supervision of internationally active insurance groups. To date, Delaware has enacted laws to adopt a form of these amendments, and Iowa has adoptedsimilar provisions under a predecessor statute. We cannot predict with any degree of certainty the additional capital requirements, compliance costs or otherburdens these requirements may impose on us and our insurance company affiliates.
The Dodd-Frank Act created the Federal Insurance Office (the “FIO”) within the Department of Treasury headed by a Director appointed by theTreasury Secretary. The FIO is designed principally to exercise a monitoring and information gathering role, rather than a regulatory role. In that capacity, theFIO has been charged with providing reports to the U.S. Congress on (i) modernization of U.S. insurance regulation (provided in December 2013) and (ii) theU.S. and global reinsurance market (provided in November 2013 and January 2015, respectively). Such reports could ultimately lead to changes in theregulation of insurers and reinsurers in the U.S.
There can be no assurance that we or our affiliates will avoid regulatory examination and possibly enforcement actions. Recent SEC enforcementactions and settlements involving U.S.-based private fund advisors have involved a number of issues, including the undisclosed allocation of the fees, costsand expenses related to unconsummated co-investment transactions (i.e., the allocation of broken deal expenses), undisclosed legal fee arrangementsaffording the applicable advisor with greater discounts than those afforded to funds advised by such advisor and the undisclosed acceleration of certainspecial fees. With respect to the acceleration of certain special fees, we provided information about this topic to the staff of the SEC in connection with theSEC’s periodic examination of us in 2013. As previously disclosed, we received an informal request for additional information from the staff of the SEC. Wecontinue to fully and voluntarily cooperate with the informal request. Although we believe the foregoing practices to have been common historicallyamongst private fund advisors within the United States, if the SEC or any other governmental authority, regulatory agency or similar body takes issue withour past practices or any of our affiliates as they pertain to any of the foregoing, we and/or such affiliates will be at risk for regulatory sanction. Even if aninvestigation or proceeding did not result in a sanction or the sanction imposed against us and/or our affiliates was small in monetary amount, the adversepublicity relating to the investigation, proceeding or imposition of these sanctions could harm us and/or our respective affiliates’ reputations which mayadversely affect our results of operations. There is also a material risk that regulatory agencies in the United States and beyond will continue to adoptburdensome new laws or regulations (including tax laws or regulations), or change existing laws or regulations, or enhance the interpretation or enforcementof existing laws and regulations. If any such events or changes were to occur they may adversely affect us and our ability to operate and/or pursue ourmanagement strategies. Such risks are often difficult or impossible to predict, avoid or mitigate in advance.
Federal, state and foreign anti-corruption and sanctions laws applicable to us and our funds and portfolio companies create the potential for significantliabilities and penalties and reputational harm.
We are subject to a number of laws and regulations governing payments and contributions to political persons or other third parties, includingrestrictions imposed by the U.S. Foreign Corrupt Practices Act (“FCPA”), as well as trade sanctions and export control laws administered by the Office ofForeign Assets Control, or OFAC, the U.S. Department of Commerce and the U.S. Department of State. The FCPA is intended to prohibit bribery of foreigngovernments and their officials and political parties, and requires public companies in the United States to keep books and records that accurately and fairlyreflect their transactions. OFAC, the U.S. Department of Commerce and the U.S. Department of State administer and enforce various export control laws andregulations, including economic and trade sanctions based on U.S. foreign policy and national security goals against targeted foreign states, organizationsand individuals. These laws and regulations relate to a number of aspects of our business, including servicing existing fund investors, finding new fundinvestors, and sourcing new investments, as well as activities by the portfolio companies in our investment portfolio or other controlled investments. Inrecent years, the U.S. Department of Justice and the SEC have devoted greater resources to enforcement of the FCPA. In addition, the United Kingdom hassignificantly expanded the reach of its anti-bribery laws. While we have developed and implemented policies and procedures designed to ensure complianceby us and our personnel with the FCPA and other applicable anticorruption and anti-bribery laws, such policies and procedures may not be effective in allinstances to prevent violations. Any determination that we have violated the FCPA or other applicable anticorruption laws or anti-bribery laws could subjectus to, among other things, civil and criminal penalties, material fines, profit disgorgement, injunctions on future conduct, securities litigation and a generalloss of investor confidence, any one of which could adversely affect our business prospects and/or financial position.
- 39-

Table of Contents
The Iran Threat Reduction and Syrian Human Rights Act of 2012 (“ITRA”) expands the scope of U.S. sanctions against Iran. Notably, ITRAgenerally prohibits foreign entities that are majority owned or controlled by U.S. persons from engaging in transactions with Iran. In addition, Section 219 ofthe ITRA amended the Exchange Act to require public reporting companies to disclose in their annual or quarterly reports certain dealings or transactions thecompany or its affiliates engaged in during the previous reporting period involving Iran or other individuals and entities targeted by certain OFAC sanctions.In some cases, ITRA requires companies to disclose these types of transactions even if they were permissible under U.S. law or were conducted outside of theUnited States by a non-U.S. entity. Companies that may be considered our affiliates have publicly filed and/or provided to us the disclosures reproduced ineach of the Company’s Annual Reports on Form 10-K filed on March 3, 2014 and March 1, 2013 and the Company’s Quarterly Report on Form 10-Q filed onNovember 12, 2013. We have not independently verified or participated in the preparation of these disclosures. We are required to separately file,concurrently with this annual report, a notice that such activities have been disclosed in this annual report. The SEC is required to post this notice ofdisclosure on its website and send the report to the U.S. President and certain U.S. Congressional committees. The U.S. President thereafter is required toinitiate an investigation and, within 180 days of initiating such an investigation, to determine whether sanctions should be imposed. Disclosure of suchactivity, even if such activity is not subject to sanctions under applicable law, and any sanctions actually imposed on us or our affiliates as a result of theseactivities, could harm our reputation and have a negative impact on our business.
Similar laws in non-U.S. jurisdictions, such as EU sanctions or the U.K. Bribery Act, as well as other applicable anti-bribery, anti-corruption, anti-money laundering, or sanction or other export control laws in the U.S. and abroad, may also impose stricter or more onerous requirements than the FCPA,OFAC, the U.S. Department of Commerce and the U.S. Department of State, and implementing them may disrupt our business or cause us to incursignificantly more costs to comply with those laws. Different laws may also contain conflicting provisions, making compliance with all laws more difficult. Ifwe fail to comply with these laws and regulations, we could be exposed to claims for damages, civil or criminal financial penalties, reputational harm,incarceration of our employees, restrictions on our operations and other liabilities, which could negatively affect our business, operating results and financialcondition. In addition, we may be subject to successor liability for FCPA violations or other acts of bribery, or violations of applicable sanctions or otherexport control laws committed by companies in which we or our funds invest or which we or our funds acquire.
We are a holding company subject to the jurisdiction of the Federal Energy Regulatory Commission (the “FERC”). An acquirer of our Class A shares maybe required to obtain prior approval from the FERC and make other filings with the FERC.
We are a holding company subject to the jurisdiction of the FERC as a result of certain of the funds we manage directly or indirectly owning,controlling or holding, with power to vote, 10% or more of the voting securities in a “public-utility company” or a “holding company” of a public-utilitycompany (as those terms are defined in the U.S. Public Utility Holding Company Act of 2005, or “PUHCA”). Absent an exemption to or waiver from theFERC’s regulations implementing PUHCA, we and any affiliate, associate company and subsidiary company (as those terms are defined in PUHCA), wouldbe required to maintain and make available to FERC, such books, accounts, memoranda and other records of transactions as the FERC may deem relevant toelectric or natural gas rates subject to the FERC’s jurisdiction. We have submitted a notification of holding company status and a notification of waiver ofthe accounting, record retention and reporting requirements to the FERC. The notification of waiver became effective when FERC took no action within 60days of filing, as provided in FERC’s regulations. An acquirer of securities representing 10% or more of the total voting power of Apollo GlobalManagement, LLC likewise would be required to submit similar filings to the FERC under PUHCA.
We are a holding company with subsidiaries that are the general partner and manager of certain funds that have an investment in entities that are“public utilities” (as defined in the Federal Power Act (the “FPA”)) and, therefore, subject to FERC’s jurisdiction under the FPA. An acquirer of our Class Ashares that (i) is, or is affiliated with, a “holding company” of a public-utility company, or (ii) is itself a public utility under the FPA, may have its ownindependent obligation to obtain prior approval from, or make other filings with, FERC with respect to an acquisition of 10% or more of the total votingpower of Apollo Global Management, LLC.
Our revenue, net income and cash flow are all highly variable, which may make it difficult for us to achieve steady earnings growth on a quarterly basis,and we do not intend to provide earnings guidance, each of which may cause the price of our Class A shares to be volatile.
Our revenue, net income and cash flow are all highly variable, primarily due to the fact that carried interest from our private equity funds and certainof our credit and real estate funds, which constitutes the largest portion of income from our combined businesses, and the transaction and advisory fees thatwe receive, can vary significantly from quarter to quarter and year to year. In addition, the investment returns of most of our funds are volatile. We may alsoexperience fluctuations in our results
- 40-

Table of Contents
from quarter to quarter and year to year due to a number of other factors, including changes in the values of our funds’ investments, changes in the amount ofdistributions, dividends or interest paid in respect of investments, changes in our operating expenses, the degree to which we encounter competition andgeneral economic and market conditions. Our future results will also be significantly dependent on the success of our larger funds (e.g., Fund VIII), changes inthe value of which may result in fluctuations in our results. In addition, carried interest income from our private equity funds and certain of our credit and realestate funds is subject to contingent repayment by the general partner if, upon the final distribution, the relevant fund’s general partner has receivedcumulative carried interest on individual portfolio investments in excess of the amount of carried interest it would be entitled to from the profits calculatedfor all portfolio investments in the aggregate. See “-Poor performance of our funds would cause a decline in our revenue and results of operations, mayobligate us to repay incentive income previously paid to us and would adversely affect our ability to raise capital for future funds.” Such variability may leadto volatility in the trading price of our Class A shares and cause our results for a particular period not to be indicative of our performance in a future period. Itmay be difficult for us to achieve steady growth in net income and cash flow on a quarterly basis, which could in turn lead to large adverse movements in theprice of our Class A shares or increased volatility in our Class A share price generally.
The timing of carried interest generated by our funds is uncertain and will contribute to the volatility of our results. Carried interest depends on ourfunds’ performance. It takes a substantial period of time to identify attractive investment opportunities, to raise all the funds needed to make an investmentand then to realize the cash value or other proceeds of an investment through a sale, public offering, recapitalization or other exit. Even if an investmentproves to be profitable, it may be several years before any profits can be realized in cash or other proceeds. We cannot predict when, or if, any realization ofinvestments will occur. Generally, with respect to our private equity funds, although we recognize carried interest income on an accrual basis, we receiveprivate equity carried interest payments only upon disposition of an investment by the relevant fund, which contributes to the volatility of our cash flow. Ifwe were to have a realization event in a particular quarter or year, it may have a significant impact on our results for that particular quarter or year that maynot be replicated in subsequent periods. We recognize revenue on investments in our funds based on our allocable share of realized and unrealized gains (orlosses) reported by such funds, and a decline in realized or unrealized gains, or an increase in realized or unrealized losses, would adversely affect ourrevenue, which could further increase the volatility of our results. With respect to a number of our credit funds, our incentive income is generally paidannually, semi-annually or quarterly, and the varying frequency of these payments will contribute to the volatility of our revenues and cash flow.Furthermore, we earn this incentive income only if the net asset value of a fund has increased or, in the case of certain funds, increased beyond a particularthreshold. The general partners of certain of our credit funds accrue carried interest when the fair value of investments exceeds the cost basis of the individualinvestor’s investments in the fund, including any allocable share of expenses incurred in connection with such investment, which is referred to as a “highwater mark.” These high water marks are applied on an individual investor basis. If the high water mark for a particular investor is not surpassed, we wouldnot earn incentive income with respect to such investor during a particular period even though such investor had positive returns in such period as a result oflosses in prior periods. If such an investor experiences losses, we will not be able to earn incentive income from such investor until it surpasses the previoushigh water mark. The incentive income we earn is therefore dependent on the net asset value of investors’ investments in the fund, which could lead tosignificant volatility in our results.
Because our revenue, net income and cash flow can be highly variable from quarter to quarter and year to year, we plan not to provide any guidanceregarding our expected quarterly and annual operating results. The lack of guidance may affect the expectations of public market analysts and could causeincreased volatility in our Class A share price.
The investment management business is intensely competitive, which could have a material adverse impact on us.
The investment management business is intensely competitive. We face competition both in the pursuit of outside investors for our funds and inacquiring investments in attractive portfolio companies and making other investments. It is possible that it will become increasingly difficult for our funds toraise capital as funds compete for investments from a limited number of qualified investors. As a result of the global economic downturn during 2008 and2009 and generally poor returns in alternative asset investment businesses during the crisis, institutional investors suffered from decreasing returns, liquiditypressure, increased volatility and difficulty maintaining targeted asset allocations, and a significant number of investors materially decreased or temporarilystopped making new fund investments during this period. In an improved economy, such investors may elect to reduce their overall portfolio allocations toalternative investments such as private equity and hedge funds, resulting in a smaller overall pool of available capital in our industry. Even if such investorscontinue to invest at historic levels, they may seek to negotiate reduced fee structures or other modifications to fund structures as a condition to investing.
In the event all or part of this analysis proves true, when trying to raise new capital we will be competing for fewer total available assets in anincreasingly competitive environment which could lead to fee reductions and redemptions as well as difficulty in raising new capital. Such changes wouldadversely affect our revenues and profitability.
- 41-

Table of Contents
Competition among funds is based on a variety of factors, including:
• investment performance;• investor liquidity and willingness to invest;• investor perception of investment managers’ drive, focus and alignment of interest;• quality of service provided to and duration of relationship with investors;• business reputation; and• the level of fees and expenses charged for services.
We compete in all aspects of our businesses with a large number of investment management firms, private equity, credit and real estate fund sponsorsand other financial institutions. A number of factors serve to increase our competitive risks:
• fund investors may develop concerns that we will allow a business to grow to the detriment of its performance;• investors may reduce their investments in our funds or not make additional investments in our funds based upon current market
conditions, their available capital or their perception of the health of our businesses;• some of our competitors have greater capital, lower targeted returns or greater sector or investment strategy-specific expertise than
we do, which creates competitive disadvantages with respect to investment opportunities;• some of our competitors may also have a lower cost of capital and access to funding sources that are not available to us, which may
create competitive disadvantages for us with respect to investment opportunities;• some of our competitors may perceive risk differently than we do, which could allow them either to outbid us for investments in
particular sectors or, generally, to consider a wider variety of investments;• some of our funds may not perform as well as competitors’ funds or other available investment products;• our competitors that are corporate buyers may be able to achieve synergistic cost savings in respect of an investment, which may
provide them with a competitive advantage in bidding for an investment;• some fund investors may prefer to invest with an investment manager that is not publicly traded;• the successful efforts of new entrants into our various businesses, including former “star” portfolio managers at large diversified
financial institutions as well as such institutions themselves, may result in increased competition;• there are relatively few barriers to entry impeding other alternative investment management firms from implementing an integrated
platform similar to ours or the strategies that we deploy at our funds, such as distressed investing, which we believe are ourcompetitive strengths, except that our competitors would need to hire professionals with the investment expertise or grow itinternally; and
• other industry participants continuously seek to recruit our investment professionals away from us.
These and other factors could reduce our earnings and revenues and have a material adverse effect on our businesses. In addition, if we are forced tocompete with other alternative investment managers on the basis of price, we may not be able to maintain our current management fee and incentive incomestructures. We have historically competed primarily on the performance of our funds, and not on the level of our fees or incentive income relative to those ofour competitors. However, there is a risk that fees and incentive income in the alternative investment management industry will decline, without regard to thehistorical performance of a manager. Fee or incentive income reductions on existing or future funds, without corresponding decreases in our cost structure,would adversely affect our revenues and profitability.
Our ability to retain our investment professionals is critical to our success and our ability to grow depends on our ability to attract additional keypersonnel.
Our success depends on our ability to retain our investment professionals and recruit additional qualified personnel. We anticipate that it will benecessary for us to add investment professionals as we pursue our growth strategy. However, we may not succeed in recruiting additional personnel orretaining current personnel, as the market for qualified investment professionals is extremely competitive. Our investment professionals possess substantialexperience and expertise in investing, are responsible for locating and executing our funds’ investments, have significant relationships with the institutionsthat are the source of many of our funds’ investment opportunities, and in certain cases have key relationships with our fund investors. Therefore, if ourinvestment professionals join competitors or form competing companies it could result in the loss of significant investment opportunities and certain existingfund investors. Legislation has been proposed in the U.S. Congress to treat portions of carried interest as ordinary income rather than as capital gain for U.S.Federal income tax purposes. In addition, the United Kingdom proposed legislation in
- 42-

Table of Contents
April 2015 that could change the scope and tax rate for carried interest. Because we compensate our investment professionals in large part by giving them anequity interest in our business or a right to receive carried interest, if such legislation were passed in the U.S. or the United Kingdom, it could adversely affectour ability to recruit, retain and motivate our current and future investment professionals. See “—Risks Related to Taxation—Our structure involves complexprovisions of U.S. Federal income tax law for which no clear precedent or authority may be available. Our structure is also subject to potential legislative,judicial or administrative change and differing interpretations, possibly on a retroactive basis.” Many of our investment professionals are also entitled toreceive carried interest or incentive income, and fluctuations in the distributions generated from such sources could also impair our ability to attract andretain qualified personnel. The loss of even a small number of our investment professionals could jeopardize the performance of our funds, which would havea material adverse effect on our results of operations. Efforts to retain or attract investment professionals may result in significant additional expenses, whichcould adversely affect our profitability.
We strive to maintain a work environment that promotes our culture of collaboration, motivation and alignment of interests with our fund investorsand shareholders. If we do not continue to develop and implement effective processes and tools to manage growth and reinforce this vision, our ability tocompete successfully and achieve our business objectives could be impaired, which could negatively impact our business, financial condition and results ofoperations.
We may not be successful in expanding into new investment strategies, markets and businesses.
We actively consider the opportunistic expansion of our businesses, both geographically and into complementary new investment strategies. Wemay not be successful in any such attempted expansion. Attempts to expand our businesses involve a number of special risks, including some or all of thefollowing:
• the diversion of management’s attention from our core businesses;• the disruption of our ongoing businesses;• entry into markets or businesses in which we may have limited or no experience;• increasing demands on our operational systems;• potential increase in investor concentration; and• the broadening of our geographic footprint, increasing the risks associated with conducting operations in foreign jurisdictions.
Additionally, any expansion of our businesses could result in significant increases in our outstanding indebtedness and debt service requirements,which would increase the risks in investing in our Class A shares and may adversely impact our results of operations and financial condition.
We also may not be successful in identifying new investment strategies or geographic markets that increase our profitability, or in identifying andacquiring new businesses that increase our profitability. Because we have not yet identified these potential new investment strategies, geographic markets orbusinesses, we cannot identify for you all the risks we may face and the potential adverse consequences on us and your investment that may result from ourattempted expansion. We also do not know how long it may take for us to expand, if we do so at all. We have also entered into strategic partnerships andseparately managed accounts, which lack the scale of our traditional funds and are more costly to administer. The prevalence of these accounts may alsopresent conflicts and introduce complexity in the deployment of capital. We have total discretion, at the direction of our manager, without needing to seekapproval from our board of directors or shareholders, to enter into new investment strategies, geographic markets and businesses, other than expansionsinvolving transactions with affiliates which may require board approval.
Many of our funds invest in relatively high-risk, illiquid assets and we may fail to realize any profits from these activities for a considerable period of timeor lose some or all of the principal amount we invest in these activities.
Many of our funds invest in securities that are not publicly traded. In many cases, our funds may be prohibited by contract or by applicablesecurities laws from selling such securities for a period of time. Our funds will generally not be able to sell these securities publicly unless their sale isregistered under applicable securities laws, or unless an exemption from such registration requirements is available. The ability of many of our funds,particularly our private equity funds, to dispose of investments is heavily dependent on the public equity markets, inasmuch as the ability to realize valuefrom an investment may depend upon the ability to complete an IPO of the portfolio company in which such investment is held. Furthermore, large holdingseven of publicly traded equity securities can often be disposed of only over a substantial period of time, exposing the investment returns to risks ofdownward movement in market prices during the disposition period. Accordingly, our funds may be forced, under certain conditions, to sell securities at aloss.
- 43-

Table of Contents
Dependence on significant leverage in investments by our funds could adversely affect our ability to achieve attractive rates of return on those investments.
Because certain of our funds’ investments rely heavily on the use of leverage, our ability to achieve attractive rates of return on investments willdepend on our continued ability to access sufficient sources of indebtedness at attractive rates. For example, in many of our private equity fund investments,indebtedness may constitute 70% or more of a portfolio company’s total debt and equity capitalization, including debt that may be incurred in connectionwith the investment, and a portfolio company’s leverage may increase as a result of recapitalization transactions subsequent to the company’s acquisition bya private equity fund. The absence of available sources of senior debt financing for extended periods of time could therefore materially and adversely affectour funds. An increase in either the general levels of interest rates or in the risk spread demanded by sources of indebtedness would make it more expensive tofinance those investments. Increases in interest rates could also make it more difficult to locate and consummate private equity investments because otherpotential buyers, including operating companies acting as strategic buyers, may be able to bid for an asset at a higher price due to a lower overall cost ofcapital. In addition, a portion of the indebtedness used to finance certain of our fund investments often includes high-yield debt securities. Availability ofcapital from the high-yield debt markets is subject to significant volatility, and there may be times when we might not be able to access those markets atattractive rates, or at all. For example, the dislocation in the credit markets which we believe began in July 2007 and the record backlog of supply in the debtmarkets resulting from such dislocation materially affected the ability and willingness of banks to underwrite new high-yield debt securities for an extendedperiod. While the debt markets have recovered in recent years, volatility in these markets has recently increased, and the availability of debt facilities hasbeen limited to some degree as a result of guidance issued to banks in March 2013 by the Federal Reserve, Office of the Comptroller of the Currency and theFederal Deposit Insurance Corp. relating to loans to highly leveraged companies, and reported recent statements by the Federal Reserve and Office of theComptroller of the Currency reaffirming their position on such loans.
Investments in highly leveraged entities are inherently more sensitive to declines in revenues, increases in expenses and interest rates and adverseeconomic, market and industry developments. The incurrence of a significant amount of indebtedness by an entity could, among other things:
• give rise to an obligation to make mandatory prepayments of debt using excess cash flow, which might limit the entity’s ability torespond to changing industry conditions to the extent additional cash is needed for the response, to make unplanned but necessarycapital expenditures or to take advantage of growth opportunities;
• allow even moderate reductions in operating cash flow to render it unable to service its indebtedness, leading to a bankruptcy or otherreorganization of the entity and a loss of part or all of the equity investment in it;
• limit the entity’s ability to adjust to changing market conditions, thereby placing it at a competitive disadvantage compared to itscompetitors who have relatively less debt;
• limit the entity’s ability to engage in strategic acquisitions that might be necessary to generate attractive returns or further growth; and• limit the entity’s ability to obtain additional financing or increase the cost of obtaining such financing, including for capital
expenditures, working capital or general corporate purposes.
As a result, the risk of loss associated with a leveraged entity is generally greater than for companies with comparatively less debt. For example,many investments consummated by private equity sponsors during 2005, 2006 and 2007 that utilized significant amounts of leverage subsequentlyexperienced severe economic stress and in certain cases defaulted on their debt obligations due to a decrease in revenues and cash flow precipitated by theeconomic downturn.
When certain of our funds’ existing portfolio investments reach the point when debt incurred to finance those investments matures in significantamounts and must be either repaid or refinanced, those investments may materially suffer if they have generated insufficient cash flow to repay maturing debtand there is insufficient capacity and availability in the financing markets to permit them to refinance maturing debt on satisfactory terms, or at all. If alimited availability of financing for such purposes were to persist for an extended period of time, when significant amounts of the debt incurred to financethese funds’ existing portfolio investments came due, these funds could be materially and adversely affected. Additionally, if such limited availability offinancing persists, our funds may also not be able to recoup their investments, as issuers of debt become unable to repay their borrowings.
Our credit funds may choose to use leverage as part of their respective investment programs and regularly borrow a substantial amount of theircapital. The use of leverage poses a significant degree of risk and enhances the possibility of a significant loss in the value of the investment portfolio. Thecredit funds may borrow money from time to time to purchase or carry securities. The interest expense and other costs incurred in connection with suchborrowing may not be recovered by appreciation in the securities purchased or carried, and will be lost—and the timing and magnitude of such losses may beaccelerated or exacerbated—in the event of a decline in the market value of such securities. Gains realized with borrowed funds may cause the fund’s net
- 44-
Table of Contents
asset value to increase at a faster rate than would be the case without borrowings. However, if investment results fail to cover the cost of borrowings, thefund’s net asset value could also decrease faster than if there had been no borrowings.
In addition, as a business development company under the Investment Company Act, AINV is permitted to issue senior securities in amounts suchthat its asset coverage ratio equals at least 200% after each issuance of senior securities. Further, AFT and AIF, as registered investment companies, arepermitted to (i) issue preferred shares in amounts such that their respective asset coverage equals at least 200% after issuance and (ii) incur indebtedness,including through the issuance of debt securities, so long as immediately thereafter the fund will have an asset coverage of at least 300% after issuance. Theability of each of AFT, AIF and AINV to pay dividends will be restricted if its asset coverage ratio falls below 200% and any amounts that it uses to service itsindebtedness are not available for dividends to its common shareholders. An increase in interest rates could also decrease the value of fixed-rate debtinvestments that our funds make. Any of the foregoing circumstances could have a material adverse effect on our financial condition, results of operationsand cash flow.
Certain of our investment funds may invest in high-yield, below investment grade or unrated debt, or securities of companies that are experiencingsignificant financial or business difficulties, including companies involved in bankruptcy or other reorganization and liquidation proceedings. Suchinvestments are subject to a greater risk of poor performance or loss.
Certain of our investment funds, especially our credit funds, may invest in below investment grade or unrated debt, including corporate loans andbonds, each of which generally involves a higher degree of risk than investment grade rated debt, and may be less liquid. Issuers of high yield or unrated debtmay be highly leveraged, and their relatively high debt-to-equity ratios create increased risks that their operations might not generate sufficient cash flow toservice their debt obligations. As a result, high yield or unrated debt is often less liquid than investment grade rated debt. Also, investments may be made inloans and other forms of debt that are not marketable securities and therefore are not liquid. In the absence of hedging measures, changes in interest ratesgenerally will also cause the value of debt investments to vary inversely to such changes. The obligor of a debt security or instrument may not be able orwilling to pay interest or to repay principal when due in accordance with the terms of the associated agreement and collateral may not be available orsufficient to cover such liabilities. Commercial bank lenders and other creditors may be able to contest payments to the holders of other debt obligations ofthe same obligor in the event of default under their commercial bank loan agreements. Sub-participation interests in syndicated debt may be subject tocertain risks as a result of having no direct contractual relationship with underlying borrowers. Debt securities and instruments may be rated belowinvestment grade by recognized rating agencies or unrated and face ongoing uncertainties and exposure to adverse business, financial or economicconditions and the issuer’s failure to make timely interest and principal payments.
Certain of our investment funds, especially our credit funds, may invest in business enterprises that are or may become involved in work-outs,liquidations, spin-offs, reorganizations, bankruptcies and similar transactions, and may purchase non-performing loans or other high-risk receivables. Aninvestment in such a business enterprise entails the risk that the transaction in which such business enterprise is involved either will be unsuccessful, willtake considerable time or will result in a distribution of cash or a new security the value of which will be less than the purchase price to the fund of thesecurity or other financial instrument in respect of which such distribution is received. In addition, if an anticipated transaction does not in fact occur, thefund may be required to sell its investment at a loss. Investments in troubled companies may also be adversely affected by U.S. federal and state laws relatingto, among other things, fraudulent conveyances, voidable preferences, lender liability and a bankruptcy court’s discretionary power to disallow, subordinateor disenfranchise particular claims. Investments in securities and private claims of troubled companies made in connection with an attempt to influence arestructuring proposal or plan of reorganization in a bankruptcy case may also involve substantial litigation. Because there is substantial uncertaintyconcerning the outcome of transactions involving financially troubled companies, there is a potential risk of loss by a fund of its entire investment in suchcompany. Moreover, a major economic recession could have a materially adverse impact on the value of such securities.
Adverse publicity and investor perceptions, whether or not based on fundamental analysis, may also decrease the value and liquidity of securitiesrated below investment grade or otherwise adversely affect our reputation. For example, certain of our investment funds, especially our credit funds, mayreceive equity in exchange for debt securities of troubled companies in which they have invested, and thus become equity owners of business enterprises thathave not been subject to the same level or kind of due diligence investigation that our funds would typically conduct in connection with an equityinvestment. This could result in adverse publicity, reputational harm, and possibly control person liability in certain circumstances depending on the size ofthe funds’ equity stake and other factors.
- 45-

Table of Contents
The operational risk we face from errors made in the execution, confirmation or settlement of transactions and our dependence on our headquarters inNew York City and third-party providers may have an adverse impact on our ability to continue to operate our businesses without interruption which couldresult in losses to us or limit our growth.
We face operational risk from errors made in the execution, confirmation or settlement of transactions. We also face operational risk fromtransactions not being properly recorded, evaluated or accounted for in our funds. In particular, our credit business is highly dependent on our ability toprocess and evaluate, on a daily basis, transactions across markets and geographies in a time-sensitive, efficient and accurate manner. Consequently, we relyheavily on our financial, accounting and other data processing systems. New investment products we may introduce could create a significant risk that ourexisting systems may not be adequate to identify or control the relevant risks in the investment strategies employed by such new investment products. Inaddition, our information systems and technology might not be able to accommodate our growth, and the cost of maintaining such systems might increasefrom its current level. These risks could cause us to suffer financial loss, a disruption of our businesses, liability to our funds, regulatory intervention andreputational damage.
Furthermore, we depend on our headquarters, which is located in New York City, for the operation of many of our businesses. A disaster or adisruption in the infrastructure that supports our businesses, including a disruption involving electronic communications or other services used by us or thirdparties with whom we conduct business, or directly affecting our headquarters, may have an adverse impact on our ability to continue to operate ourbusinesses without interruption which could have a material adverse effect on us. Although we have disaster recovery programs in place, these may not besufficient to mitigate the harm that may result from such a disaster or disruption. In addition, insurance and other safeguards might only partially reimburse usfor our losses.
Finally, we rely on third-party service providers for certain aspects of our businesses, including for certain information systems, technology andadministration of our funds and compliance matters. Any interruption or deterioration in the performance of these third parties could impair the quality of thefunds’ operations and could impact our reputation, adversely affect our businesses and limit our ability to grow.
We rely on our information systems to conduct our business, and failure to protect these systems against security breaches could adversely affect ourbusiness and results of operations. Additionally, if these systems fail or become unavailable for any significant period of time, our business could beharmed.
The efficient operation of our business is dependent on computer hardware and software systems. Information systems are vulnerable to securitybreaches by computer hackers and cyber terrorists. We rely on industry accepted security measures and technology to securely maintain confidential andproprietary information maintained on our information systems. However, these measures and technology may not adequately prevent security breaches. Inaddition, the unavailability of the information systems or the failure of these systems to perform as anticipated for any reason could disrupt our business andcould result in decreased performance and increased operating costs, causing our business and results of operations to suffer. Any significant interruption orfailure of our information systems or any significant breach of security could adversely affect our business and results of operations.
Our funds' portfolio companies also rely on data processing systems and the secure processing, storage and transmission of information, includingpayment and health information. A disruption or compromise of these systems could have a material adverse effect on the value of these businesses.
We derive a substantial portion of our revenues from funds managed pursuant to management agreements that may be terminated or fund partnershipagreements that permit fund investors to request liquidation of investments in our funds on short notice.
The terms of our funds generally give either the general partner of the fund, the fund’s board of directors or the third-party advisor the right toterminate our investment management agreement with the fund. However, insofar as we control the general partner of our funds that are limited partnerships,the risk of termination of investment management agreement for such funds is limited, subject to our fiduciary or contractual duties as general partner. Thisrisk is more significant for certain of our funds which have independent boards of directors.
With respect to our funds that are subject to the Investment Company Act, following the initial two years of operation each fund’s investmentmanagement agreement must be approved annually by such fund’s board of directors or by the vote of a majority of the shareholders and the majority of theindependent members of such fund’s board of directors. Each investment management agreement for such funds can also be terminated by the majority of theshareholders. Currently, AFT and AIF,
- 46-

Table of Contents
management investment companies under the Investment Company Act, and AINV, a management investment company that has elected to be treated as abusiness development company under the Investment Company Act, are subject to these provisions of the Investment Company Act. We have also beenengaged as a sub-advisor for funds that are subject to Investment Company Act, and those sub-advisory agreements contain, among other things, renewal andtermination provisions that are substantially similar to the investment management agreements for each of AFT, AIF and AINV. Termination of theseagreements would reduce the fees we earn from the relevant funds, which could have a material adverse effect on our results of operations.
The governing documents of certain of our funds provide that a simple majority of a fund’s unaffiliated investors have the right to liquidate thatfund, which would cause management fees and incentive income to terminate. Our ability to realize incentive income from such funds also would beadversely affected if we are required to liquidate fund investments at a time when market conditions result in our obtaining less for investments than could beobtained at later times. We do not know whether, and under what circumstances, the investors in our funds are likely to exercise such right.
In addition, the management agreements of our funds would terminate if we were to experience a change of control without obtaining investorconsent. Such a change of control could be deemed to occur in the event our Managing Partners exchange enough of their interests in the Apollo OperatingGroup into our Class A shares such that our Managing Partners no longer own a controlling interest in us. We cannot be certain that consents required for theassignment of our management agreements will be obtained if such a deemed change of control occurs. Termination of these agreements would affect the feeswe earn from the relevant funds and the transaction and advisory fees we earn from the underlying portfolio companies, which could have a material adverseeffect on our results of operations.
Our use of leverage to finance our businesses will expose us to substantial risks, which are exacerbated by our funds’ use of leverage to financeinvestments.
We have senior notes outstanding and loans outstanding and an undrawn revolving credit facility under the 2013 AMH Credit Facilities describedin note 12 to our consolidated financial statements. We may choose to finance our business operations through further borrowings. Our existing and futureindebtedness exposes us to the typical risks associated with the use of leverage, including those discussed above under “-Dependence on significant leveragein investments by our funds could adversely affect our ability to achieve attractive rates of return on those investments.” These risks are exacerbated bycertain of our funds’ use of leverage to finance investments and, if they were to occur, could cause us to suffer a decline in the credit ratings assigned to ourdebt by rating agencies, if any, which might result in an increase in our borrowing costs or result in other material adverse effects on our businesses.
As these borrowings, notes and other indebtedness mature (or are otherwise repaid prior to their scheduled maturities), we may be required to eitherrefinance them by entering into new facilities or issuing new notes, which could result in higher borrowing costs, or issuing equity, which would diluteexisting shareholders. We could also repay them by using cash on hand or cash from the sale of our assets. We could have difficulty entering into newfacilities, issuing new notes or issuing equity in the future on attractive terms, or at all.
We are subject to third-party litigation from time to time that could result in significant liabilities and reputational harm, which could have a materialadverse effect on our results of operations, financial condition and liquidity.
In general, we will be exposed to risk of litigation by our investors if our management of any fund is alleged to constitute bad faith, grossnegligence, willful misconduct, fraud, willful or reckless disregard for our duties to the fund or other forms of misconduct. Investors could sue us to recoveramounts lost by our funds due to our alleged misconduct, up to the entire amount of loss. Further, we may be subject to litigation arising from investordissatisfaction with the performance of our funds or from third-party allegations that we (i) improperly exercised control or influence over companies inwhich our funds have large investments or (ii) are liable for actions or inactions taken by portfolio companies that such third parties argue we control. By wayof example, we, our funds and certain of our employees are each exposed to the risks of litigation relating to investment activities in our funds and actionstaken by the officers and directors (some of whom may be Apollo employees) of portfolio companies, such as the risk of shareholder litigation by othershareholders of public companies in which our funds have large investments. As an additional example, we are sometimes listed as a co-defendant in actionsagainst portfolio companies on the theory that we control such portfolio companies. We are also exposed to risks of litigation or investigation relating totransactions that presented conflicts of interest that were not properly addressed. See “—Our failure to deal appropriately with conflicts of interest coulddamage our reputation and adversely affect our businesses.” In addition, our rights to indemnification by the funds we manage may not be upheld ifchallenged, and our indemnification rights generally do not cover bad faith, gross negligence, willful misconduct, fraud, willful or reckless disregard for ourduties to the fund or other forms of misconduct. If we are required to incur
- 47-

Table of Contents
all or a portion of the costs arising out of litigation or investigations as a result of inadequate insurance proceeds or failure to obtain indemnification from ourfunds, our results of operations, financial condition and liquidity would be materially adversely affected.
In addition, with a workforce that includes many very highly paid investment professionals, we face the risk of lawsuits relating to claims forcompensation, which may individually or in the aggregate be significant in amount. Such claims are more likely to occur in the current environment whereindividual employees may experience significant volatility in their year-to-year compensation due to trading performance or other issues and in situationswhere previously highly compensated employees were terminated for performance or efficiency reasons. The cost of settling such claims could adverselyaffect our results of operations.
If any civil or criminal lawsuits brought against us were to result in a finding of substantial legal liability or culpability, the lawsuit could, inaddition to any financial damage, cause significant reputational harm to us, which could seriously harm our business. We depend to a large extent on ourbusiness relationships and our reputation for integrity and high-caliber professional services to attract and retain investors and qualified professionals and topursue investment opportunities for our funds. As a result, allegations of improper conduct by private litigants or regulators, whether the ultimate outcome isfavorable or unfavorable to us, as well as negative publicity and press speculation about us, our investment activities or the private equity industry ingeneral, whether or not valid, may harm our reputation, which may be more damaging to our business than to other types of businesses. See “Item 3. LegalProceedings.”
Our failure to deal appropriately with conflicts of interest could damage our reputation and adversely affect our businesses.
As we have expanded and as we continue to expand the number and scope of our businesses, we increasingly confront potential conflicts of interestrelating to our funds’ investment activities. Certain of our funds have overlapping investment objectives, including funds that have different fee structures,and potential conflicts may arise with respect to our decisions regarding how to allocate investment opportunities among those funds. For example, adecision to acquire material non-public information about a company while pursuing an investment opportunity for a particular fund gives rise to a potentialconflict of interest when it results in our having to restrict the ability of other funds to take any action. In addition, fund investors (or holders of Class Ashares) may perceive conflicts of interest regarding investment decisions for funds in which our Managing Partners, who have and may continue to makesignificant personal investments in a variety of Apollo funds, are personally invested. Similarly, conflicts of interest may exist in the valuation of ourinvestments and regarding decisions about the allocation of specific investment opportunities among us and our funds and the allocation of fees and costsamong us, our funds and their portfolio companies.
Investing throughout the corporate capital structure. Our funds invest in a broad range of asset classes throughout the corporate capital structure.These investments include investments in corporate loans and debt securities, preferred equity securities and common equity securities. In certain cases, wemay manage separate funds that invest in different parts of the same company’s capital structure. For example, our credit funds may invest in different classesof the same company’s debt. In those cases, the interests of our funds may not always be aligned, which could create actual or potential conflicts of interest orthe appearance of such conflicts. For example, one of our private equity funds could have an interest in pursuing an acquisition, divestiture or othertransaction that, in its judgment, could enhance the value of the private equity investment, even though the proposed transaction would subject one of ourcredit fund’s debt investments to additional or increased risks.
Potential conflicts of interest with our Managing Partners or our directors. Pursuant to the terms of our operating agreement, whenever a potentialconflict of interest exists or arises between any of the Managing Partners, one or more directors or their respective affiliates, on the one hand, and us, any ofour subsidiaries or any shareholder other than a Managing Partner, on the other, any resolution or course of action by our board of directors shall be permittedand deemed approved by all shareholders if the resolution or course of action (i) has been specifically approved by a majority of the voting power of ouroutstanding voting shares (excluding voting shares owned by our manager or its affiliates) or by a conflicts committee of the board of directors composedentirely of one or more independent directors, (ii) is on terms no less favorable to us or our shareholders (other than a Managing Partner) than those generallybeing provided to or available from unrelated third parties or (iii) it is fair and reasonable to us and our shareholders taking into account the totality of therelationships between the parties involved. All conflicts of interest described in this report will be deemed to have been specifically approved by allshareholders. Notwithstanding the foregoing, it is possible that potential or perceived conflicts could give rise to investor dissatisfaction or litigation orregulatory enforcement actions. Appropriately dealing with conflicts of interest is complex and difficult and our reputation could be damaged if we fail, orappear to fail, to deal appropriately with one or more potential or actual conflicts of interest. Regulatory scrutiny of, or litigation in connection with, conflictsof interest would have a material adverse effect on our reputation which would materially adversely affect our businesses in a number of ways, including as aresult of redemptions by our investors from our funds, an inability to raise additional funds and a reluctance of counterparties to do business with us. See “-Extensive regulation of our businesses affects our activities and creates the potential for significant liabilities and penalties. The possibility of increasedregulatory focus
- 48-

Table of Contents
could result in additional burdens on our businesses. Changes in taxation or law and other legislative or regulatory changes could adversely affect us.”
Our organizational documents do not limit our ability to enter into new lines of businesses, and we may expand into new investment strategies, geographicmarkets and businesses, each of which may result in additional risks and uncertainties in our businesses.
We intend, to the extent that market conditions warrant, to grow our businesses by increasing AUM in existing businesses and expanding into newinvestment strategies, geographic markets and businesses. Our organizational documents, however, do not limit us to the investment management business.Accordingly, we may pursue growth through acquisitions of other investment management companies, acquisitions of critical business partners or otherstrategic initiatives, which may include entering into new lines of business, such as the insurance, broker-dealer or financial advisory industries. In addition,we expect opportunities will arise to acquire other alternative or traditional asset managers. To the extent we make strategic investments or acquisitions,undertake other strategic initiatives or enter into a new line of business, we will face numerous risks and uncertainties, including risks associated with (i) therequired investment of capital and other resources, (ii) the possibility that we have insufficient expertise to engage in such activities profitably or withoutincurring inappropriate amounts of risk, (iii) combining or integrating operational and management systems and controls and (iv) the broadening of ourgeographic footprint, including the risks associated with conducting operations in foreign jurisdictions. Entry into certain lines of business may subject us tonew laws and regulations with which we are not familiar, or from which we are currently exempt, and may lead to increased litigation and regulatory risk. Forexample, our planned business initiatives include offering additional registered investment products and creating investment products open to retailinvestors. These products may have different economic structures than our traditional investment funds and may require a different marketing approach.These activities also will impose additional compliance burdens on us, subject us to enhanced regulatory scrutiny and expose us to greater reputation andlitigation risk. Further, these activities may give rise to conflicts of interest, related party transaction risks and may lead to litigation or regulatory scrutiny. Ifa new business generates insufficient revenues or if we are unable to efficiently manage our expanded operations, our results of operations will be adverselyaffected. Our strategic initiatives may include joint ventures, in which case we will be subject to additional risks and uncertainties in that we may bedependent upon, and subject to liability, losses or reputational damage relating to, systems, controls and personnel that are not under our control.
Employee misconduct could harm us by impairing our ability to attract and retain investors and by subjecting us to significant legal liability, regulatoryscrutiny and reputational harm. Fraud and other deceptive practices or other misconduct at our portfolio companies could similarly subject us to liabilityand reputational damage and also harm our performance.
Our reputation is critical to maintaining and developing relationships with the investors in our funds, potential fund investors and third parties withwhom we do business. In recent years, there have been a number of highly publicized cases involving fraud, conflicts of interest or other misconduct byindividuals in the financial services industry. There is a risk that our employees could engage in misconduct that adversely affects our businesses. Forexample, if an employee were to engage in illegal or suspicious activities, we could be subject to regulatory sanctions and suffer serious harm to ourreputation, financial position, investor relationships and ability to attract future investors. It is not always possible to deter employee misconduct, and theprecautions we take to detect and prevent this activity may not be effective in all cases. Misconduct by our employees, or the employees of our portfoliocompanies, or even unsubstantiated allegations, could result in a material adverse effect on our reputation and our businesses.
In addition, we could also be adversely affected if there is misconduct by individuals associated with portfolio companies in which our funds invest.For example, failures by personnel, or individuals acting on behalf, of our funds’ portfolio companies to comply with anti-bribery, trade sanctions or otherlegal and regulatory requirements could adversely affect our business and reputation. There are a number of grounds upon which such misconduct at aportfolio company could subject us to criminal and/or civil liability, including on the basis of actual knowledge, willful blindness, or control personliability. Such misconduct might also undermine our funds’ due diligence efforts with respect to such companies and could negatively affect the valuation ofa fund’s investments.
Underwriting activities expose us to risks.
AGS, a subsidiary of ours, may act as an underwriter in securities offerings. We may incur losses and be subject to reputational harm to the extentthat, for any reason, we are unable to sell securities or indebtedness we purchased as an underwriter at the anticipated price levels. As an underwriter, we alsoare subject to potential liability for material misstatements or omissions in prospectuses and other offering documents relating to offerings we underwrite.
- 49-

Table of Contents
AGS primarily provides these services for our funds’ portfolio companies. The relationship between the managers of our funds, their affiliates andAGS may give rise to conflicts of interest between the managers of the funds and the funds with respect to whom AGS provides services or the funds who havean interest in any portfolio companies or investment vehicles to whom AGS provides services.
While AGS’s services are primarily provided to our funds, it is possible that in the future, AGS may also provide services (including financing,capital market and advisory services) to third parties, including third parties that are our competitors or one or more of their affiliates or any portfoliocompanies. In the event that AGS provides services to third parties, it may not take into consideration the interests of our funds or our funds’ portfoliocompanies.
The due diligence process that we undertake in connection with investments by our funds may not reveal all facts that may be relevant in connection withan investment.
Before making fund investments we conduct due diligence that we deem reasonable and appropriate based on the facts and circumstances applicableto each investment. When conducting due diligence, we may be required to evaluate important and complex business, financial, tax, accounting,environmental and legal issues. Outside consultants, legal advisors, accountants and investment banks may be involved in the due diligence process invarying degrees depending on the type of investment. Nevertheless, when conducting due diligence and making an assessment regarding an investment, werely on the resources available to us, including information provided by the target of the investment and, in some circumstances, third-party investigations.The due diligence investigation that we will carry out with respect to any investment opportunity may not reveal or highlight all relevant facts that may benecessary or helpful in evaluating such investment opportunity. Moreover, such an investigation will not necessarily result in the investment beingsuccessful.
Certain of our funds utilize special situation and distressed debt investment strategies that involve significant risks.
Our funds often invest in obligors and issuers with weak financial conditions, poor operating results, substantial financial needs, negative net worthand/or special competitive problems. These funds also invest in obligors and issuers that are involved in bankruptcy or reorganization proceedings. In suchsituations, it may be difficult to obtain full information as to the exact financial and operating conditions of these obligors and issuers. Additionally, the fairvalues of such investments are subject to abrupt and erratic market movements and significant price volatility if they are publicly traded securities, and aresubject to significant uncertainty in general if they are not publicly traded securities. Furthermore, some of our funds’ distressed investments may not bewidely traded or may have no recognized market. A fund’s exposure to such investments may be substantial in relation to the market for those investments,and the assets are likely to be illiquid and difficult to sell or transfer. As a result, it may take a number of years for the market value of such investments toultimately reflect their intrinsic value as perceived by us.
A central feature of our distressed investment strategy is our ability to successfully predict the occurrence of certain corporate events, such as debtand/or equity offerings, restructurings, reorganizations, mergers, takeover offers and other transactions, that we believe will improve the condition of thebusiness. If the corporate event we predict is delayed, changed or never completed, the market price and value of the applicable fund’s investment coulddecline sharply.
In addition, these investments could subject us to certain potential additional liabilities that may exceed the value of our original investment. Undercertain circumstances, payments or distributions on certain investments may be reclaimed if any such payment or distribution is later determined to havebeen a fraudulent conveyance, a preferential payment or similar transaction under applicable bankruptcy and insolvency laws. In addition, under certaincircumstances, a lender that has inappropriately exercised control of the management and policies of a debtor may have its claims subordinated ordisallowed, or may be found liable for damages suffered by parties as a result of such actions. In the case where the investment in securities of troubledcompanies is made in connection with an attempt to influence a restructuring proposal or plan of reorganization in bankruptcy, our funds may becomeinvolved in substantial litigation.
Risk management activities may adversely affect the return on our funds’ investments.
When managing our exposure to market risks, we may (on our own behalf or on behalf of our funds) from time to time use forward contracts, options,swaps, caps, collars and floors or pursue other strategies or use other forms of derivative instruments to limit our exposure to changes in the relative values ofinvestments that may result from market developments, including changes in prevailing interest rates, currency exchange rates and commodity prices. Thescope of risk management activities undertaken by us varies based on the level and volatility of interest rates, prevailing foreign currency exchange rates, thetypes of investments that are made and other changing market conditions. The use of hedging transactions and other derivative instruments to reduce theeffects of a decline in the value of a position does not eliminate the possibility of fluctuations in the value of the position or
- 50-

Table of Contents
prevent losses if the value of the position declines. Such transactions may also limit the opportunity for gain if the value of a position increases. Moreover, itmay not be possible to limit the exposure to a market development that is so generally anticipated that a hedging or other derivative transaction cannot beentered into at an acceptable price. The success of any hedging or other derivative transaction generally will depend on our ability to correctly predict marketchanges, the degree of correlation between price movements of a derivative instrument and the position being hedged, the creditworthiness of thecounterparty and other factors. As a result, while we may enter into such a transaction in order to reduce our exposure to market risks, the transaction mayresult in poorer overall investment performance than if it had not been executed. Such transactions may also limit the opportunity for gain if the value of ahedged position increases.
While such hedging arrangements may reduce certain risks, such arrangements themselves may entail certain other risks. These arrangements mayrequire the posting of cash collateral at a time when a fund has insufficient cash or illiquid assets such that the posting of the cash is either impossible orrequires the sale of assets at prices that do not reflect their underlying value. Moreover, these hedging arrangements may generate significant transactioncosts, including potential tax costs, that reduce the returns generated by a fund. Finally, the CFTC has made several public statements that it may soon issue aproposal for certain foreign exchange products to be subject to mandatory clearing, which could increase the cost of entering into currency hedges.
We often pursue investment opportunities that involve business, regulatory, legal or other complexities.
As an element of our investment style, we often pursue unusually complex investment opportunities. This can often take the form of substantialbusiness, regulatory or legal complexity that would deter other investment managers. Our tolerance for complexity presents risks, as such transactions can bemore difficult, expensive and time-consuming to finance and execute; it can be more difficult to manage or realize value from the assets acquired in suchtransactions; and such transactions sometimes entail a higher level of regulatory scrutiny or a greater risk of contingent liabilities. Any of these risks couldharm the performance of our funds.
Funds we manage may invest in assets denominated in currencies that differ from the currency in which the fund is denominated.
When our investment funds invest in assets denominated in currencies that differ from the currency that the relevant fund is denominated in,fluctuations in currency rates could impact the performance of the investment funds. We also have a number of investment funds which are denominated inU.S. Dollars but invest primarily or exclusively in assets denominated in foreign currencies and therefore whose performance can be negatively impacted bystrengthening of the U.S. Dollar even if the underlying investments perform well in local currency.
Our funds may employ hedging techniques to minimize these risks, but we can offer no assurance that such strategies will be effective or tax-efficient. If our funds engage in hedging transactions, we may be exposed to additional risks associated with such transactions.
Certain of our funds make investments in companies that we do not control.
Investments by certain of our funds will include debt instruments, equity securities, and other financial instruments of companies that our funds donot control. Such instruments and securities may be acquired by our funds through trading activities or through purchases of securities or other financialinstruments from the issuer. In addition, in the future, our funds may seek to acquire minority equity interests more frequently and may also dispose of aportion of their majority equity investments in portfolio companies over time in a manner that results in the funds retaining a minority investment. Thoseinvestments will be subject to the risk that the company in which the investment is made may make business, financial or management decisions with whichwe do not agree or that the majority stakeholders or the management of the company may take risks or otherwise act in a manner that does not serve ourfunds’ interests. If any of the foregoing were to occur, the values of investments by our funds could decrease and our financial condition, results of operationsand cash flow could suffer as a result.
Our funds may face risks relating to undiversified investments.
While diversification is generally an objective of many of our funds, we cannot give assurance as to the degree of diversification that will actuallybe achieved in any fund investments. For example, we manage AAA, and Athene Holding is AAA’s only material investment. Because a significant portion orall of a fund’s capital may be invested in a single investment or portfolio company, a loss with respect to such an investment or portfolio company couldhave a significant adverse impact on such fund’s capital. Accordingly, a lack of diversification on the part of a fund could adversely affect its performance,which could have a material adverse effect on our business, financial condition and results of operations.
- 51-

Table of Contents
Some of our funds invest in foreign countries and securities of issuers located outside of the United States, which may involve foreign exchange, political,social, economic and tax uncertainties and risks.
Some of our funds invest all or a portion of their assets in the equity, debt, loans or other securities of issuers located outside the United States,including Germany, China, India, Australia, Russia, Singapore, Portugal, Italy and France, as well as a number of jurisdictions commonly referred to asemerging markets. In addition to business uncertainties, such investments may be affected by changes in exchange values as well as political, social andeconomic uncertainty affecting a country or region. Many financial markets are not as developed or as efficient as those in the United States, and as a result,liquidity may be reduced and price volatility may be higher. The legal and regulatory environment may also be different, particularly with respect tobankruptcy and reorganization. Financial accounting standards and practices may differ, and there may be less publicly available information in respect ofsuch companies.
Restrictions imposed or actions taken by foreign governments may adversely impact the value of our funds’ investments. Such restrictions or actionscould include exchange controls, seizure or nationalization of foreign deposits or other assets and adoption of other governmental restrictions that adverselyaffect the prices of securities or the ability to repatriate profits on investments or the capital invested itself. Income received by our funds from sources insome countries may be reduced by withholding and other taxes. Any such taxes paid by a fund will reduce the net income or return from such investments.Our fund investments could also expose us to risks associated with trade and economic sanctions prohibitions or other restrictions imposed by the UnitedStates or other governments or organizations, including the United Nations, the EU and its member countries, such as the sanctions against certain Russianentities and individuals. While our funds will take these factors into consideration in making investment decisions, including when hedging positions, ourfunds may not be able to fully avoid these risks or generate targeted risk-adjusted returns.
In addition, as a result of the complexity of, and lack of clear precedent or authority with respect to, the application of various income tax laws to ourstructures, the application of rules governing how transactions and structures should be reported is also subject to differing interpretations. For example,certain jurisdictions such as Australia, Canada, China, India, Spain, Portugal, Italy, France and Hong Kong, where our funds have made investments, havesought to tax investment gains (including those from real estate) derived by nonresident investors, including private equity funds, from the disposition of theequity in companies operating in those jurisdictions. In some cases this development is the result of new legislation or changes in the interpretation ofexisting legislation and local authority assertions that investors have a local taxable presence or are holding companies for trading purposes rather than forcapital purposes, or are not otherwise entitled to treaty benefits. In addition, the tax authorities in certain jurisdictions have sought to deny the benefits ofincome tax treaties for withholding taxes on interest and dividends of nonresident entities, if the entity is not the beneficial owner of the income but rather amere conduit company inserted primarily to access treaty benefits.
For example, under the laws of Hong Kong, profits arising in or derived from Hong Kong from a trade, profession or business carried on by a personor an agent acting on the person’s behalf in Hong Kong (excluding profits arising from the sale of capital assets) are subject to Hong Kong profits tax ingeneral. The current profits tax rate is generally 16.5% for corporations and 15% for unincorporated businesses. Although Hong Kong provides a profits taxexemption for offshore funds on profits derived from certain transactions, under the current tax law, transactions in securities of a private company do notbenefit from this exemption unless they satisfy certain conditions. Therefore, offshore funds that make use of services of a fund manager, investment advisoror any other person acting on their behalf in Hong Kong to derive profits from transactions in securities of private companies may be subject to Hong Kongprofits tax, if the prescribed conditions are not satisfied. There is no assurance that any investments under our structures will be exempt from profits tax underHong Kong’s tax law. It should be noted that offshore fund structures have been subject to scrutiny in recent tax audits by Hong Kong’s Inland RevenueDepartment.
With respect to India, in 2012 the Supreme Court of India held in favor of a taxpayer finding that the sale of a foreign company that indirectly heldIndian assets was not subject to Indian tax. However, the tax laws were amended in 2012 to subject such gains to Indian tax with retroactive effect. Further, ageneral anti-avoidance rule was also introduced that would provide a basis for the tax authorities to subject other sales and investments through intermediateholding jurisdictions such as Mauritius to Indian tax. The Finance Act 2015 deferred the applicability of these general anti-avoidance rules until the tax yearbeginning on April 1, 2017 onwards. Further, given that the rules governing the treatment of capital gains in connection with indirect sale of an Indiancompany have not yet been finalized, there are several grey areas which could potentially result in protracted tax litigation. Accordingly, Indian taxation ofthe capital gains of a foreign investor, upon a direct or indirect sale of an Indian company, remains uncertain.
The U.K. has also enacted legislation that may affect our funds’ investments. The U.K. Diverted Profits Tax (“DPT”) regime was introduced witheffect from April 1, 2015 as a new tax separate from the U.K.’s existing Corporate Income Tax regime.
- 52-

Table of Contents
DPT charges a rate of 25% on profits that, under the terms of the legislation, are considered to have been eroded from the U.K. tax base. The DPT legislation isintended to counteract and deter arrangements used by multinational corporate groups which, it is argued, have resulted in the erosion of the U.K. tax base.DPT operates through two main rules: (i) the first rule aims to prevent U.K. tax resident companies, or U.K. PEs, from creating tax advantages throughtransacting with entities that lack economic substance; and (ii) the second rule aims to counteract arrangements by which foreign companies sell into the U.K.without creating a U.K. PE. Under the legislation, if it is ”reasonable to assume” a U.K. company is party to an arrangement that lacks economic substanceand which results in a tax advantage in the U.K., or it is “reasonable to assume” the activity of the involved parties is designed in such a way as to avoid thecreation of a U.K. PE, DPT could apply. Further, the U.K. released draft anti-hybrid legislation for consultation on December 9, 2015. The rules would replacethe existing U.K. arbitrage rules as from January 1, 2017. The U.K. tax authorities published examples of the application of the rules in December 2015. Thedraft U.K. legislation closely follows the recommendations of the OECD’s BEPS Action 2. Neutralizing the Effects of Hybrid Mismatch Arrangements and itspublication should provide more clarity in this area. However, uncertainty remains around what, if anything, other countries outside the U.K. will do, and itmay be necessary to consider various scenarios when applying the imported mismatch rules. In addition, the U.K. released draft Tax Transparency legislationon December 9, 2015. This legislation requires many large businesses to publish their U.K. tax strategies on their websites before the end of each financialyear for accounting periods beginning on or after the date of Royal Assent to the Finance Bill which is expected sometime in July 2016. The scoperequirements, which are relatively complex, have extended beyond those of the Senior Accounting Officer regime to include new taxes, new entity types andto interact with the OECD’s country by country reporting regime. This will likely result in additional compliance obligations, which may be costly andultimately adversely affect our profitability.
Third-party investors in our funds have the right under certain circumstances to terminate commitment periods or to dissolve the funds, and investors insome of our credit funds may redeem their investments in such funds at any time after an initial holding period. These events would lead to a decrease inour revenues, which could be substantial.
The governing agreements of certain of our funds allow the investors of those funds to, among other things, (i) terminate the commitment period ofthe fund in the event that certain “key persons” (for example, one or more of our Managing Partners and/or certain other investment professionals) fail todevote the requisite time to managing the fund, (ii) (depending on the fund) terminate the commitment period, dissolve the fund or remove the generalpartner if we, as general partner or manager, or certain key persons engage in certain forms of misconduct, or (iii) dissolve the fund or terminate thecommitment period upon the affirmative vote of a specified percentage of limited partner interests entitled to vote. Each of Fund VI, Fund VII and Fund VIII,on which our near- to medium-term performance will heavily depend, include a number of such provisions. COF III, EPF II and certain other credit funds havesimilar provisions. Also, after undergoing the 2007 Reorganization, subsequent to which we deconsolidated certain funds that had historically beenconsolidated in our financial statements, we amended the governing documents of our funds at that time to provide that a simple majority of a fund’sunaffiliated investors have the right to liquidate that fund. In addition to having a significant negative impact on our revenue, net income and cash flow, theoccurrence of such an event with respect to any of our funds would likely result in significant reputational damage to us.
Investors in some of our credit funds may also generally redeem their investments on an annual, semiannual or quarterly basis following theexpiration of a specified period of time when capital may not be redeemed (typically between one and five years). Fund investors may decide to move theircapital away from us to other investments for any number of reasons in addition to poor investment performance. Factors which could result in investorsleaving our funds include changes in interest rates that make other investments more attractive, poor investment performance, changes in investor perceptionregarding our focus or alignment of interest, unhappiness with changes in or broadening of a fund’s investment strategy, changes in our reputation anddepartures or changes in responsibilities of key investment professionals. In a declining market, the pace of redemptions and consequent reduction in ourAUM could accelerate. The decrease in revenues that would result from significant redemptions in these funds could have a material adverse effect on ourbusinesses, revenues, net income and cash flows.
In addition, the management agreements of all of our funds would be terminated upon an “assignment,” without the requisite consent, of theseagreements, which may be deemed to occur in the event the investment advisors of our funds were to experience a change of control. We cannot be certainthat consents required to assign our investment management agreements will be obtained if a change of control occurs. In addition, with respect to ourpublicly traded closed-end funds, each fund’s investment management agreement must be approved annually by the independent members of such fund’sboard of directors and, in certain cases, by its shareholders, as required by law. Termination of these agreements would cause us to lose the fees we earn fromsuch funds.
- 53-

Table of Contents
Our financial projections for portfolio companies and other fund investments could prove inaccurate.
Our funds generally establish the capital structure of portfolio companies and certain other fund investments, including real estate investments, onthe basis of financial projections for such investments. These projected operating results will normally be based primarily on management judgments. In allcases, projections are only estimates of future results that are based upon assumptions made at the time that the projections are developed. General economicconditions, which are not predictable, along with other factors may cause actual performance to fall short of the financial projections we used to establish agiven investment’s capital structure. Because of the leverage we typically employ in our fund investments, this could cause a substantial decrease in thevalue of our equity holdings in such investments. The inaccuracy of financial projections could thus cause our funds’ performance to fall short of ourexpectations.
Our private equity funds’ performance, and our performance, may be adversely affected by the financial performance of our funds’ portfolio companiesand the industries in which our funds invest.
Our performance and the performance of our private equity funds is significantly affected by the value of the companies in which our funds haveinvested. Our funds invest in companies in many different industries, each of which is subject to volatility based upon a variety of facts, including economicand market factors. The credit crisis caused significant fluctuations in the value of securities held by our funds and the global economic recession had asignificant impact in overall performance activity and the demands for many of the goods and services provided by portfolio companies of the funds wemanage. Although the U.S. economy has improved, conditions in economies outside the U.S. have generally improved at a less rapid pace (and in some caseshave deteriorated), and there remain many obstacles to continued growth in the economy such as global geopolitical events, risks of inflation and highdeficit levels for governments in the U.S. and abroad. These factors and other general economic trends may impact the performance of portfolio companies inmany industries and in particular, industries that are more impacted by changes in consumer demand, such as the packaging, manufacturing, energy, chemicaland refining industries, as well as travel and leisure, gaming, financial services and real estate industries. The performance of our private equity funds, and ourperformance, may be adversely affected to the extent our fund portfolio companies in these industries experience adverse performance or additional pressuredue to downward trends. For example, the performance of certain of our portfolio companies in the packaging, manufacturing, energy chemical and refiningindustries is subject to the cyclical and volatile nature of the supply-demand balance in these industries. These industries historically have experiencedalternating periods of capacity shortages leading to tight supply conditions, causing prices and profit margins to increase, followed by periods whensubstantial capacity is added, resulting in oversupply, declining capacity utilization rates and declining prices and profit margins. In addition to changes inthe supply and demand for products, the volatility these industries experience occurs as a result of changes in energy prices, costs of raw materials andchanges in various other economic conditions around the world.
The performance of our funds’ investments in the commodities markets is also subject to a high degree of business and market risk, as it issubstantially dependent upon prevailing prices of oil and natural gas. Certain of our funds have investments in businesses involved in oil and gasexploration and development, which can be a speculative business involving a high degree of risk, including: the volatility of oil and natural gas prices; theuse of new technologies; reliance on estimates of oil and gas reserves in the evaluation of available geological, geophysical, engineering and economic data;and encountering unexpected formations or pressures, premature declines of reservoirs, blow-outs, equipment failures and other accidents in completing wellsand otherwise, cratering, sour gas releases, uncontrollable flows of oil, natural gas or well fluids, adverse weather conditions, pollution, fires, spills and otherenvironmental risks. Prices for oil and natural gas have decreased significantly during the latter part of 2014 and throughout 2015, and there can be noassurance that prices will recover. If prices remain at their current level for an extended period of time, there could be an adverse impact on the performance ofcertain of our funds, and this impact may be material. These prices are also subject to wide fluctuation in response to relatively minor changes in the supplyand demand for oil and natural gas, market uncertainty and a variety of additional factors that are beyond our control, such as level of consumer productdemand, the refining capacity of oil purchasers, weather conditions, government regulations, the price and availability of alternative fuels, politicalconditions, foreign supply of such commodities and overall economic conditions. It is common in making investments in the commodities markets to deployhedging strategies to protect against pricing fluctuations but such strategies may or may not be employed by us or our funds’ portfolio companies, and evenwhen they are employed they may not protect our funds’ investments.
Our funds’ investments in companies in the financial services sector are subject to a variety of factors, such as market uncertainty, additionalgovernment regulations, disclosure requirements, limits on fees, increasing borrowing costs or limits on the terms or availability of credit to such portfoliocompanies, and other regulatory requirements each of which may impact the conduct of such portfolio companies. Compliance with changing regulatoryrequirements will likely impose staffing, legal, compliance and other costs and administrative burdens upon our funds’ investments in financial services.Various sectors of the global financial markets have been experiencing an extended period of adverse conditions. Market uncertainty has increased
- 54-
Table of Contents
dramatically, particularly in the United States and Europe, and adverse market conditions have expanded to other markets. These conditions have resulted indisruption of the global credit markets, periods of reduced liquidity, greater volatility, general widening of credit spreads, an acute contraction in theavailability of credit and a lack of price transparency. These difficult global credit market conditions have adversely affected the market values of equity,fixed income and other securities and these circumstances may continue or even deteriorate further.
In respect of real estate, even though the U.S. residential real estate market has stabilized from a lengthy and deep downturn, various factors couldhalt or limit a recovery in the housing market and have an adverse effect on the performance of certain of our funds’ investments, including, but not limitedto, rising mortgage interest rates and a low level of consumer confidence in the economy and/or the residential real estate market.
In addition, our funds’ investments in commercial mortgage loans and other commercial real-estate related loans are subject to risks of delinquencyand foreclosure, and risks of loss that are greater than similar risks associated with mortgage loans made on the security of residential properties. If the netoperating income of the commercial property is reduced, the borrower’s ability to repay the loan may be impaired. Net operating income of a commercialproperty can be affected by various factors, such as success of tenant businesses, property management decisions, competition from comparable types ofproperties and declines in regional or local real estate values and rental or occupancy rates.
Our credit funds are subject to numerous additional risks.
Our credit funds are subject to numerous additional risks, including the risks set forth below.
• Generally, there may be few limitations on the execution of these funds’ investment strategies, which are in many cases subject to thesole discretion of the management company or the general partner of such funds, or there may be numerous investment limitations orrestrictions that require monitoring, compliance and maintenance.
• While we monitor the concentration of the portfolios of our credit funds, concentration in any one borrower or other issuer, productcategory, industry, region or country may arise from time to time.
• Given the flexibility and overlapping nature of the mandates and investment strategies of our credit funds, situations arise wherecertain of these funds hold (including outright positions in issuers and exposure to such issuers derived through any synthetic and/orderivative instrument) in multiple tranches of securities of an issuer (or other interests of an issuer) or multiple funds having interests inthe same tranche of an issuer.
• Certain of these funds may engage in short-selling, which is subject to a theoretically unlimited risk of loss.• These funds are exposed to the risk that a counterparty will not settle a transaction in accordance with its terms and conditions because
of a dispute over the terms of the contract (whether or not bona fide) or because of a credit or liquidity problem, thus causing the fundto suffer a loss.
• Credit risk may arise through a default by one of several large institutions that are dependent on one another to meet their respectiveliquidity or operational needs, so that a default by one institution causes a series of defaults by the other institutions.
• The efficacy of the investment and trading strategies of certain credit funds may depend largely on the ability to establish and maintainan overall market position in a combination of different financial instruments, which can be difficult to execute.
• These funds may make investments or hold trading positions in markets that are volatile and which are or may become illiquid.• Certain of these funds may seek to originate loans, including, but not limited to, secured and unsecured notes, senior and second lien
loans, mezzanine loans, and other similar investments.• These funds’ investments are subject to risks relating to investments in commodities, futures, options and other derivatives, the prices
of which are highly volatile and may be subject to a theoretically unlimited risk of loss in certain circumstances.
Fraud and other deceptive practices could harm fund performance.
Instances of bribery, fraud and other deceptive practices committed by senior management of portfolio companies in which an Apollo fund investsmay undermine our due diligence efforts with respect to such companies, and if such fraud is discovered, negatively affect the valuation of a fund’sinvestments. Fraud or other deceptive practices by our own employees or advisors could have a similar effect. In addition, when discovered, financial fraudmay contribute to reputational harm and overall
- 55-

Table of Contents
market volatility that can negatively impact an Apollo fund’s investment program. As a result, instances of bribery, fraud and other deceptive practices couldresult in fund performance that is poorer than expected.
Contingent liabilities could harm fund performance.
We may cause our funds to acquire an investment that is subject to contingent liabilities. Such contingent liabilities could be unknown to us at thetime of acquisition or, if they are known to us, we may not accurately assess or protect against the risks that they present. Acquired contingent liabilitiescould thus result in unforeseen losses for our funds. In addition, in connection with the disposition of an investment in a portfolio company, a fund may berequired to make representations about the business and financial affairs of such portfolio company typical of those made in connection with the sale of abusiness. A fund may also be required to indemnify the purchasers of such investment to the extent that any such representations are inaccurate. Thesearrangements may result in the incurrence of contingent liabilities by a fund, even after the disposition of an investment. Accordingly, the inaccuracy ofrepresentations and warranties made by a fund could harm such fund’s performance.
Our funds may be forced to dispose of investments at a disadvantageous time.
Our funds may make investments that they do not advantageously dispose of prior to the date the applicable fund is dissolved, either by expirationof such fund’s term or otherwise. Although we generally expect that investments will be disposed of prior to dissolution or be suitable for in-kind distributionat dissolution, and the general partners of the funds generally have a limited ability to extend the term of the fund with the consent of fund investors or theadvisory board of the fund, as applicable, our funds may have to sell, distribute or otherwise dispose of investments at a disadvantageous time as a result ofdissolution. This would result in a lower than expected return on the investments and, perhaps, on the fund itself.
Possession of material, non-public information could prevent Apollo funds from undertaking advantageous transactions, our internal controls could fail,or we could establish information barriers, all of which could adversely affect our business.
Our Managing Partners, investment professionals or other employees may acquire confidential or material non-public information and, as a result, berestricted from initiating transactions in certain securities. This risk affects us more than it does many other investment managers, as we generally do not useinformation barriers that many firms implement to separate persons who make investment decisions from others who might possess material, non-publicinformation that could influence such decisions. Our decision not to implement these barriers could prevent our investment professionals from undertakingadvantageous investments or dispositions that would be permissible for them otherwise.
In order to manage possible risks resulting from our decision not to implement information barriers, our compliance personnel maintain a list ofrestricted securities as to which we have access to material, non-public information and in which our funds and investment professionals are not permitted totrade. This internal control relating to the management of material non-public information could fail with the result that we, or one of our investmentprofessionals, might trade when at least constructively in possession of material non-public information. Inadvertent trading on material non-publicinformation could have adverse effects on our reputation, result in the imposition of regulatory or financial sanctions and as a consequence, negativelyimpact our financial condition.
In addition, we could in the future decide that it is advisable to establish information barriers, particularly as our business expands and diversifies. Insuch event, our ability to operate as an integrated platform would be restricted. The establishment of such information barriers might also lead to operationaldisruptions and result in restructuring costs, including costs related to hiring additional personnel as existing investment professionals are allocated to eitherside of such barriers, which could adversely affect our business.
Regulations governing AINV’s operation as a business development company affect its ability to raise, and the way in which it raises, additional capital.
As a business development company under the Investment Company Act, AINV may issue debt securities or preferred stock and borrow money frombanks or other financial institutions, which we refer to collectively as “senior securities,” up to the maximum amount permitted by the Investment CompanyAct. Under the provisions of the Investment Company Act, AINV is permitted to issue senior securities only in amounts such that its asset coverage, asdefined in the Investment Company Act, equals at least 200% after each issuance of senior securities. If the value of its assets declines, it may be unable tosatisfy this test. If that happens, it may be required to sell a portion of its investments and, depending on the nature of its leverage, repay a portion of itsindebtedness at a time when such sales may be disadvantageous.
- 56-

Table of Contents
Business development companies may issue and sell common stock at a price below net asset value per share only in limited circumstances, one ofwhich is during the one-year period after shareholder approval. AINV’s shareholders have, in the past, approved a plan so that during the subsequent 12-month period, AINV may, in one or more public or private offerings of its common stock, sell or otherwise issue shares of its common stock at a price belowthe then current net asset value per share, subject to certain conditions including parameters on the level of permissible dilution, approval of the sale by amajority of its independent directors and a requirement that the sale price be not less than approximately the market price of the shares of its common stock atspecified times, less the expenses of the sale. AINV may ask its shareholders for additional approvals from year to year. There is no assurance such approvalswill be obtained.
Regulations governing AFT’s and AIF’s operation affect their ability to raise, and the way in which they raise, additional capital.
As registered investment companies under the Investment Company Act, each of AFT and AIF may issue debt securities or preferred stock andborrow money from banks or other financial institutions, up to the maximum amount permitted by the Investment Company Act. Under the provisions of theInvestment Company Act, each of AFT and AIF is permitted to (i) issue preferred shares in amounts such that their respective asset coverage equals at least200% after issuance and (ii) incur indebtedness, including through the issuance of debt securities, so long as immediately thereafter the fund will have anasset coverage of at least 300% after issuance. If the value of its assets declines, such fund may be unable to satisfy this test. If that happens, such fund may berequired to sell a portion of its investments and, depending on the nature of its leverage, repay a portion of its indebtedness at a time when such sales may bedisadvantageous. Further, each of AFT and AIF may raise capital by issuing common shares, however, the offering price per common share must equal orexceed the net asset value per share, exclusive of any underwriting commissions or discounts, of the funds’ shares.
Risks Related to Our Class A Shares
The market price and trading volume of our Class A shares may be volatile, which could result in rapid and substantial losses for our shareholders.
The market price of our Class A shares may be highly volatile and could be subject to wide fluctuations. In addition, the trading volume in our ClassA shares may fluctuate and cause significant price variations to occur. You may be unable to resell your Class A shares at or above your purchase price, if atall. The market price of our Class A shares may fluctuate or decline significantly in the future. Some of the factors that could negatively affect the price of ourClass A shares or result in fluctuations in the price or trading volume of our Class A shares include:
• variations in our quarterly operating results or distributions, which variations we expect will be substantial;• our policy of taking a long-term perspective on making investment, operational and strategic decisions, which is expected to result in
significant and unpredictable variations in our quarterly returns;• failure to meet analysts’ earnings estimates;• publication of research reports about us or the investment management industry or the failure of securities analysts to cover our Class A
shares;• additions or departures of our Managing Partners and other key management personnel;• adverse market reaction to any indebtedness we may incur or securities we may issue in the future;• actions by shareholders;• changes in market valuations of similar companies;• speculation in the press or investment community;• changes or proposed changes in laws or regulations or differing interpretations thereof affecting our businesses or enforcement of these
laws and regulations, or announcements relating to these matters;• a lack of liquidity in the trading of our Class A shares;• adverse publicity about the investment management industry generally or individual scandals, specifically; and• general market and economic conditions.
In addition, from time to time, management may also declare special quarterly distributions based on investment realizations. Volatility in themarket price of our Class A shares may be heightened at or around times of investment realizations as well as following such realizations, as a result ofspeculation as to whether such a distribution may be declared.
- 57-

Table of Contents
An investment in Class A shares is not an investment in any of our funds, and the assets and revenues of our funds are not directly available to us.
Class A shares are securities of Apollo Global Management, LLC only. While our historical consolidated and combined financial informationincludes financial information, including assets and revenues of certain Apollo funds on a consolidated basis, and our future financial information willcontinue to consolidate certain of these funds, such assets and revenues are available to the fund and not to us except through management fees, incentiveincome, distributions and other proceeds arising from agreements with funds, as discussed in more detail in this report.
Our Class A share price may decline due to the large number of shares eligible for future sale and for exchange into Class A shares.
The market price of our Class A shares could decline as a result of sales of a large number of our Class A shares or the perception that such salescould occur. These sales, or the possibility that these sales may occur, also might make it more difficult for us to sell equity securities in the future at a timeand price that we deem appropriate. As of December 31, 2015, we had 181,078,937 Class A shares outstanding. The Class A shares reserved under our equityincentive plan are increased on the first day of each fiscal year by (i) the amount (if any) by which (a) 15% of the number of outstanding Class A shares andApollo Operating Group units (“AOG Units”) exchangeable for Class A shares on a fully converted and diluted basis on the last day of the immediatelypreceding fiscal year exceeds (b) the number of shares then reserved and available for issuance under the Equity Plan, or (ii) such lesser amount by which theadministrator may decide to increase the number of Class A shares. Taking into account grants of restricted share units (“RSUs”) and options made throughDecember 31, 2015, 37,315,502 Class A shares remained available for future grant under our equity incentive plan. In addition, as of December 31, 2015,Holdings could at any time exchange its AOG Units for up to 216,169,856 Class A shares on behalf of our Managing Partners and Contributing Partnerssubject to the Amended and Restated Exchange Agreement. See “Item 13. Certain Relationships and Related Party Transactions-Amended and RestatedExchange Agreement.” We may also elect to sell additional Class A shares in one or more future primary offerings.
Our Managing Partners and Contributing Partners, through their partnership interests in Holdings, owned an aggregate of 54.4% of the AOG Units asof December 31, 2015. Subject to certain procedures and restrictions (including any transfer restrictions and lock-up agreements applicable to our ManagingPartners and Contributing Partners), each Managing Partner and Contributing Partner has the right, upon 60 days’ notice prior to a designated quarterly date,to exchange the AOG Units for Class A shares. These Class A shares are eligible for resale from time to time, subject to certain contractual restrictions andSecurities Act limitations.
Our Managing Partners and Contributing Partners (through Holdings) have the ability to cause us to register the Class A shares they acquire uponexchange of their AOG Units, as was done in connection with the Company’s Secondary Offering in May 2013. See “Item 13. Certain Relationships andRelated Party Transactions-Managing Partner Shareholders Agreement- Registration Rights.”
The Strategic Investors have the ability to cause us to register any of their non-voting Class A shares, as was done in connection with the Company’sSecondary Offering in May 2013. See “Item 13. Certain Relationships and Related Party Transactions-Lenders Rights Agreement.”
We have on file with the SEC a registration statement on Form S-8 covering the shares issuable under our equity incentive plan. Subject to vestingand contractual lock-up arrangements, such shares will be freely tradable.
We cannot assure you that our intended quarterly distributions will be paid each quarter or at all.
Our intention is to distribute to our Class A shareholders on a quarterly basis substantially all of our net after-tax cash flow from operations in excessof amounts determined by our manager to be necessary or appropriate to provide for the conduct of our businesses, to make appropriate investments in ourbusinesses and our funds, to comply with applicable laws and regulations, to service our indebtedness or to provide for future distributions to our Class Ashareholders for any ensuing quarter. The declaration, payment and determination of the amount of our quarterly dividend, if any, will be at the solediscretion of our manager, who may change our dividend policy at any time. We cannot assure you that any distributions, whether quarterly or otherwise, willor can be paid. In making decisions regarding our quarterly dividend, our manager considers general economic and business conditions, our strategic plansand prospects, our businesses and investment opportunities, our financial condition and operating results, working capital requirements and anticipated cashneeds, contractual restrictions and obligations, legal, tax, regulatory and other restrictions that may have implications on the payment of distributions by usto our common shareholders or by our subsidiaries to us, and such other factors as our manager may deem relevant.
- 58-

Table of Contents
Our Managing Partners’ beneficial ownership of interests in the Class B share that we have issued to BRH Holdings GP, Ltd. (“BRH”), the controlexercised by our manager and anti-takeover provisions in our charter documents and Delaware law could delay or prevent a change in control.
Our Managing Partners, through their ownership of BRH, beneficially own the Class B share that we have issued to BRH. The Managing Partnersinterests in such Class B share represented 61.4% of the total combined voting power of our shares entitled to vote as of December 31, 2015. As a result, theyare able to exercise control over all matters requiring the approval of shareholders and are able to prevent a change in control of our company. In addition,our operating agreement provides that so long as the Apollo control condition (as described in “Item 10. Directors, Executive Officers and CorporateGovernance-Our Manager”) is satisfied, our manager, which is owned and controlled by our Managing Partners, manages all of our operations and activities.The control of our manager will make it more difficult for a potential acquirer to assume control of our Company. Other provisions in our operatingagreement may also make it more difficult and expensive for a third party to acquire control of us even if a change of control would be beneficial to theinterests of our shareholders. For example, our operating agreement requires advance notice for proposals by shareholders and nominations, places limitationson convening shareholder meetings, and authorizes the issuance of preferred shares that could be issued by our board of directors to thwart a takeoverattempt. In addition, certain provisions of Delaware law give us the ability to delay or prevent a transaction that could cause a change in our control. Themarket price of our Class A shares could be adversely affected to the extent that our Managing Partners’ control over our Company, the control exercised byour manager as well as provisions of our operating agreement discourage potential takeover attempts that our shareholders may favor.
We are a Delaware limited liability company, and there are certain provisions in our operating agreement regarding exculpation and indemnification ofour officers and directors that differ from the Delaware General Corporation Law (DGCL) in a manner that may be less protective of the interests of ourClass A shareholders.
Our operating agreement provides that to the fullest extent permitted by applicable law our directors or officers will not be liable to us. However,under the DGCL, a director or officer would be liable to us for (i) breach of duty of loyalty to us or our shareholders, (ii) intentional misconduct or knowingviolations of the law that are not done in good faith, (iii) improper redemption of shares or declaration of dividend, or (iv) a transaction from which thedirector derived an improper personal benefit. In addition, our operating agreement provides that we indemnify our directors and officers for acts or omissionsto the fullest extent provided by law. However, under the DGCL, a corporation can indemnify directors and officers for acts or omissions only if the directoror officer acted in good faith, in a manner he reasonably believed to be in the best interests of the corporation, and, in criminal action, if the officer or directorhad no reasonable cause to believe his conduct was unlawful. Accordingly, our operating agreement may be less protective of the interests of our Class Ashareholders, when compared to the DGCL, insofar as it relates to the exculpation and indemnification of our officers and directors.
Awards of our Class A shares may increase shareholder dilution and reduce profitability.
We grant Class A restricted share units to certain of our investment professionals, both when hired and as a portion of the discretionary annualcompensation they may receive. We require that a portion of the incentive income distributions payable by the general partners of certain of the funds wemanage be used by the recipients of those distributions to purchase restricted Class A shares issued under our equity incentive plan. While this practicepromotes alignment with shareholders and encourages investment professionals to maximize the success of the Company as a whole, these equity awards, iffulfilled by issuances of new shares by us rather than by open market purchases (which do not cause any dilution), may increase personnel-related shareholderdilution. In addition, volatility in the price of our Class A shares could adversely affect our ability to attract and retain our investment professionals. Torecruit and retain existing and future investment professionals, we may need to increase the level of compensation that we pay to them, which may cause ahigher percentage of our revenue to be paid out in the form of compensation, which would have an adverse impact on our profit margins.
Purchases of our Class A shares pursuant to our share repurchase program may affect the value of our Class A shares, and there can be no assurance thatour share repurchase program will enhance shareholder value.
Pursuant to our publicly announced share repurchase program, we are authorized to repurchase up to $250 million in the aggregate of our Class Ashares, including up to $150 million in the aggregate of our outstanding Class A shares through a share repurchase program and up to $100 million through areduction of Class A shares to be issued to employees to satisfy associated tax obligations in connection with the settlement of equity-based awards grantedunder the our equity incentive plan. The timing and amount of any share repurchases will be determined based on market conditions, share price and otherfactors. This activity could increase (or reduce the size of any decrease in) the market price of our Class A shares at that time. Additionally, repurchases underour share repurchase program have and will continue to diminish our cash reserves, which could impact our ability to pursue
- 59-

Table of Contents
possible strategic opportunities and acquisitions and could result in lower overall returns on our cash balances. There can be no assurance that any sharerepurchases will enhance shareholder value because the market price of our Class A shares could decline. Although our share repurchase program is intendedto enhance long-term shareholder value, short-term share price fluctuations could reduce the program’s effectiveness.
Risks Related to Our Organization and Structure
Although not enacted, the U.S. Congress has considered legislation that would have: (i) in some cases after a ten-year transition period, precluded us fromqualifying as a partnership or required us to hold carried interest through taxable corporations; and (ii) taxed certain income and gains at increased rates.If similar legislation were to be enacted and apply to us, the value of our Class A shares could be adversely affected.
The U.S. Congress, the IRS and the U.S. Treasury Department have over the past several years examined the U.S. Federal income tax treatment ofprivate equity funds, hedge funds and other kinds of investment partnerships. The present U.S. Federal income tax treatment of a holder of Class A sharesand/or our own taxation may be adversely affected by any new legislation, new regulations or revised interpretations of existing tax law that arise as a resultof such examinations. In May 2010, the U.S. House of Representatives passed legislation (the “May 2010 House Bill”) that would have, in general, treatedincome and gains, including gain on sale, attributable to an interest in an investment services partnership interest (“ISPI”) as income subject to a new blendedtax rate that is higher than under current law, except to the extent such ISPI would have been considered under the legislation to be a qualified capitalinterest. The interests of Class A shareholders and our interests in the Apollo Operating Group that are entitled to receive carried interest may be classified asISPIs for purposes of this legislation. The United States Senate considered, but did not pass, similar legislation. On February 14, 2012, Representative Levin(D-MI) introduced similar legislation that would have taxed carried interest at ordinary income rates (which would be higher than the proposed blended ratein the May 2010 House Bill). On June 25, 2015. Representative Levin introduced a slightly modified version of his 2012 bill (together with the 2012 bill, the“Levin Bills”). It is unclear whether or when the U.S. Congress will pass similar legislation or what provisions would be included in any legislation, ifenacted.
The May 2010 House Bill and both Levin Bills provide that, for taxable years beginning ten years after the date of enactment, income derived withrespect to an ISPI that is not a qualified capital interest and that is treated as ordinary income under the rules discussed above would not meet the qualifyingincome requirements under the publicly traded partnership rules. Therefore, if similar legislation were to be enacted, following such ten-year period, wewould be precluded from qualifying as a partnership for U.S. Federal income tax purposes or be required to hold all such ISPIs through corporations, possiblyU.S. corporations. If we were taxed as a U.S. corporation or required to hold all ISPIs through corporations, our effective tax rate would increase significantly.The federal statutory rate for corporations is currently 35%. In addition, we could be subject to increased state and local taxes. Furthermore, holders of ClassA shares could be subject to tax on our conversion into a corporation or any restructuring required in order for us to hold our ISPIs through a corporation.
On September 12, 2011, the Obama administration submitted similar legislation to Congress in the American Jobs Act that would have taxed incomeand gain that was treated as capital gains, including gain on disposition of interests attributable to an ISPI, at rates higher than the capital gains rateapplicable to such income under then-current law, with an exception for certain qualified capital interests. The proposed legislation also would havecharacterized certain income and gain in respect of ISPIs as non-qualifying income under the publicly traded partnership rules after a ten-year transitionperiod from the effective date, with an exception for certain qualified capital interests. This proposed legislation followed several prior statements by theObama administration in support of changing the taxation of carried interest. In its published revenue proposal for 2016, the Obama administration proposedthat the current law regarding treatment of carried interest be changed to subject such income to ordinary income tax. The Obama administration’s publishedrevenue proposals for 2010, 2011, 2012, 2013, 2014 and 2015 contained similar proposals.
States and other jurisdictions have also considered legislation to increase taxes with respect to carried interest. For example, New York hasperiodically considered legislation under which non-residents of New York could be subject to New York state income tax on income in respect of our ClassA shares as a result of certain activities of our affiliates in New York, although it is unclear when or whether such legislation would be enacted.
On February 26, 2014, Representative Dave Camp, who at the time was chairman of the House Ways and Means Committee, unveiled a detailedcomprehensive tax reform proposal that would, among other things significantly limit the ability of publicly traded partnerships (PTPs) to avoid taxation ascorporations. Under Representative Camp’s proposal, only mining and natural resource PTPs would continue to be taxed on a flow-through basis.Representative Camp’s proposal also called for a
- 60-

Table of Contents
formulary approach to the taxation of carried interests. Under the formula, a portion of the gain recognized by partners providing services to certaininvestment partnerships would have been recharacterized as ordinary income. Representative Camp’s carried interest proposal was limited in scope. Forinstance, it would not have applied to partners engaged in a real property trade or business. Although relatively clear in concept, the proposed legislative textcontained ambiguities that could have significantly impacted the reach of the chairman’s proposal. Representative Camp has since retired from Congress andhis proposal was never taken up on the House floor; however, it is nonetheless significant in that it could serve as a model for a future Congress andpresidential administration as they attempt to move forward on comprehensive tax reform legislation. For additional discussion about the potential impact oftax reform on our business, see “Federal tax reform efforts will continue, which may involve uncertainties and risks,” below.
Our shareholders do not elect our manager or vote and have limited ability to influence decisions regarding our businesses.
So long as the Apollo control condition is satisfied, our manager, AGM Management, LLC, which is owned and controlled by our ManagingPartners, will manage all of our operations and activities. AGM Management, LLC is managed by BRH, a Cayman entity owned by our Managing Partnersand managed by an executive committee composed of our Managing Partners. Our shareholders do not elect our manager, its manager or its manager’sexecutive committee and, unlike the holders of common stock in a corporation, have only limited voting rights on matters affecting our businesses andtherefore limited ability to influence decisions regarding our businesses. Furthermore, if our shareholders are dissatisfied with the performance of ourmanager, they will have little ability to remove our manager. As discussed below, the Managing Partners collectively had 61.5% of the voting power ofApollo Global Management, LLC as of December 31, 2015. Therefore, they have the ability to control any shareholder vote that occurs, including any voteregarding the removal of our manager.
Our board of directors has no authority over our operations other than that which our manager has chosen to delegate to it.
For so long as the Apollo control condition is satisfied, our manager, which is owned and controlled by our Managing Partners, manages all of ouroperations and activities, and our board of directors has no authority other than that which our manager chooses to delegate to it. In the event that the Apollocontrol condition is not satisfied, our board of directors will manage all of our operations and activities.
For so long as the Apollo control condition is satisfied, our manager (i) nominates and elects all directors to our board of directors, (ii) sets thenumber of directors of our board of directors and (iii) fills any vacancies on our board of directors. After the Apollo control condition is no longer satisfied,each of our directors will be elected by the vote of a plurality of our shares entitled to vote, voting as a single class, to serve until his or her successor is dulyelected or appointed and qualified or until his or her earlier death, retirement, disqualification, resignation or removal.
Control by our Managing Partners of the combined voting power of our shares and holding their economic interests through the Apollo Operating Groupmay give rise to conflicts of interests.
Our Managing Partners controlled 61.5% of the combined voting power of our shares entitled to vote as of December 31, 2015. Accordingly, ourManaging Partners have the ability to control our management and affairs to the extent not controlled by our manager. In addition, they are able to determinethe outcome of all matters requiring shareholder approval (such as a proposed sale of all or substantially of our assets, the approval of a merger orconsolidation involving the company, and an election by our manager to dissolve the company) and are able to cause or prevent a change of control of ourcompany and could preclude any unsolicited acquisition of our company. The control of voting power by our Managing Partners could deprive Class Ashareholders of an opportunity to receive a premium for their Class A shares as part of a sale of our company, and might ultimately affect the market price ofthe Class A shares.
In addition, our Managing Partners and Contributing Partners, through their partnership interests in Holdings, were entitled to 54.4% of ApolloOperating Group’s economic returns through the AOG Units owned by Holdings as of December 31, 2015. Because they hold their economic interest in ourbusinesses directly through the Apollo Operating Group, rather than through the issuer of the Class A shares, our Managing Partners and ContributingPartners may have conflicting interests with holders of Class A shares. For example, our Managing Partners and Contributing Partners may have different taxpositions from us, which could influence their decisions regarding whether and when to dispose of assets, and whether and when to incur new or refinanceexisting indebtedness, especially in light of the existence of the tax receivable agreement. For a description of the tax receivable agreement, see “Item 13.Certain Relationships and Related Party Transactions-Amended and Restated Tax Receivable Agreement.” In addition, the structuring of future transactionsmay take into consideration the Managing Partners’ and Contributing Partners’ tax considerations even where no similar benefit would accrue to us.
- 61-

Table of Contents
We qualify for, and rely on, exceptions from certain corporate governance and other requirements under the rules of the NYSE.
We qualify for exceptions from certain corporate governance and other requirements under the rules of the NYSE. Pursuant to these exceptions, wemay elect not to comply with certain corporate governance requirements of the NYSE, including the requirements (i) that a majority of our board of directorsconsist of independent directors, (ii) that we have a nominating/corporate governance committee that is composed entirely of independent directors and (iii)that we have a compensation committee that is composed entirely of independent directors. In addition, we are not required to hold annual meetings of ourshareholders. Pursuant to the exceptions available to a controlled company under the rules of the NYSE, we have elected not to have a nominating andcorporate governance committee comprised entirely of independent directors, nor a compensation committee comprised entirely of independent directors.Although we currently have a board of directors comprised of a majority of independent directors, we plan to continue to avail ourselves of these exceptions.Accordingly, you will not have the same protections afforded to equity holders of entities that are subject to all of the corporate governance requirements ofthe NYSE.
Potential conflicts of interest may arise among our manager, on the one hand, and us and our shareholders on the other hand. Our manager and itsaffiliates have limited fiduciary duties to us and our shareholders, which may permit them to favor their own interests to the detriment of us and ourshareholders.
Conflicts of interest may arise among our manager, on the one hand, and us and our shareholders, on the other hand. As a result of these conflicts, ourmanager may favor its own interests and the interests of its affiliates over the interests of us and our shareholders. These conflicts include, among others, theconflicts described below.
• Our manager determines the amount and timing of our investments and dispositions, indebtedness, issuances of additional stock andamounts of reserves, each of which can affect the amount of cash that is available for distribution to you.
• Our manager is allowed to take into account the interests of parties other than us in resolving conflicts of interest, which has the effectof limiting its duties (including fiduciary duties) to our shareholders; for example, our affiliates that serve as general partners of ourfunds have fiduciary and contractual obligations to our fund investors, and such obligations may cause such affiliates to regularly takeactions that might adversely affect our near-term results of operations or cash flow; our manager has no obligation to intervene in, or tonotify our shareholders of, such actions by such affiliates.
• Because our Managing Partners and Contributing Partners hold their AOG Units through entities that are not subject to corporateincome taxation and Apollo Global Management, LLC holds the AOG Units in part through a wholly-owned subsidiary that is subjectto corporate income taxation, conflicts may arise between our Managing Partners and Contributing Partners, on the one hand, andApollo Global Management, LLC, on the other hand, relating to the selection, structuring, and disposition of investments. Forexample, the earlier taxable disposition of assets following an exchange transaction by a Managing Partner or Contributing Partnermay accelerate payments under the tax receivable agreement and increase the present value of such payments, and the taxabledisposition of assets before an exchange or transaction by a Managing Partner or Contributing Partner may increase the tax liability ofa Managing Partner or Contributing Partner without giving rise to any rights to such Managing Partner or Contributing Partner toreceive payments under the tax receivable agreement.
• Other than as provided in the non-competition, non-solicitation and confidentiality obligations to which our Managing Partners andother professionals are subject, which may not be enforceable, affiliates of our manager and existing and former personnel employed byour manager are not prohibited from engaging in other businesses or activities, including those that might be in direct competitionwith us.
• Our manager has limited its liability and reduced or eliminated its duties (including fiduciary duties) under our operating agreement,while also restricting the remedies available to our shareholders for actions that, without these limitations, might constitute breaches ofduty (including fiduciary duty). In addition, we have agreed to indemnify our manager and its affiliates to the fullest extent permittedby law, except with respect to conduct involving bad faith, fraud or willful misconduct. By purchasing our Class A shares, you willhave agreed and consented to the provisions set forth in our operating agreement, including the provisions regarding conflicts ofinterest situations that, in the absence of such provisions, might constitute a breach of fiduciary or other duties under applicable statelaw.
• Our operating agreement does not restrict our manager from causing us to pay it or its affiliates for any services rendered, or fromentering into additional contractual arrangements with any of these entities on our behalf, so long as the terms of any such additionalcontractual arrangements are fair and reasonable to us as determined under the operating agreement.
- 62-

Table of Contents
• Our manager determines how much debt we incur and that decision may adversely affect our credit ratings.• Our manager determines which costs incurred by it and its affiliates are reimbursable by us.• Our manager controls the enforcement of obligations owed to us by it and its affiliates.
Our manager decides whether to retain separate counsel, accountants or others to perform services for us. See “Item 13. Certain Relationships andRelated Party Transactions” for a more detailed discussion of these conflicts.
Our operating agreement contains provisions that reduce or eliminate duties (including fiduciary duties) of our manager and limit remedies available toshareholders for actions that might otherwise constitute a breach of duty. It would be difficult for a shareholder to challenge a resolution of a conflict ofinterest by our manager or by our conflicts committee.
Our operating agreement contains provisions that waive or consent to conduct by our manager and its affiliates that might otherwise raise issuesabout compliance with fiduciary duties or applicable law. For example, our operating agreement provides that when our manager is acting in its individualcapacity, as opposed to in its capacity as our manager, it may act without any fiduciary obligations to us or our shareholders whatsoever. When our manager,in its capacity as our manager, is permitted to or required to make a decision in its “sole discretion” or “discretion” or that it deems “necessary or appropriate”or “necessary or advisable,” then our manager will be entitled to consider only such interests and factors as it desires, including its own interests, and willhave no duty or obligation (fiduciary or otherwise) to give any consideration to any interest of or factors affecting us or any of our shareholders and will notbe subject to any different standards imposed by our operating agreement, the Delaware Limited Liability Company Act or under any other law, rule orregulation or in equity.
Whenever a potential conflict of interest exists between us and our manager, our manager shall resolve such conflict of interest. If our managerdetermines that its resolution of the conflict of interest is on terms no less favorable to us than those generally being provided to or available from unrelatedthird parties or is fair and reasonable to us, taking into account the totality of the relationships between us and our manager, then it will be presumed that inmaking this determination, our manager acted in good faith. A shareholder seeking to challenge this resolution of the conflict of interest would bear theburden of overcoming such presumption. This is different from the situation with Delaware corporations, where a conflict resolution by an interested partywould be presumed to be unfair and the interested party would have the burden of demonstrating that the resolution was fair.
The above modifications of fiduciary duties are expressly permitted by Delaware law. Hence, we and our shareholders would have recourse and beable to seek remedies against our manager only if our manager breaches its obligations pursuant to our operating agreement. Unless our manager breaches itsobligations pursuant to our operating agreement, we and our unitholders would not have any recourse against our manager even if our manager were to act ina manner that was inconsistent with traditional fiduciary duties. Furthermore, even if there has been a breach of the obligations set forth in our operatingagreement, our operating agreement provides that our manager and its officers and directors would not be liable to us or our shareholders for errors ofjudgment or for any acts or omissions unless there has been a final and non-appealable judgment by a court of competent jurisdiction determining that themanager or its officers and directors acted in bad faith or engaged in fraud or willful misconduct. These provisions are detrimental to the shareholders becausethey restrict the remedies available to them for actions that without those limitations might constitute breaches of duty, including fiduciary duties.
Also, if our manager obtains the approval of the conflicts committee of the Company’s board of directors, the resolution will be conclusivelydeemed to be fair and reasonable to us and not a breach by our manager of any duties it may owe to us or our shareholders. This is different from the situationwith Delaware corporations, where a conflict resolution by a committee consisting solely of independent directors may, in certain circumstances, merely shiftthe burden of demonstrating unfairness to the plaintiff. If you purchase a Class A share, you will be treated as having consented to the provisions set forth inthe operating agreement, including provisions regarding conflicts of interest situations that, in the absence of such provisions, might be considered a breachof fiduciary or other duties under applicable state law. As a result, shareholders will, as a practical matter, not be able to successfully challenge an informeddecision by the conflicts committee.
The control of our manager may be transferred to a third party without shareholder consent.
Our manager may transfer its manager interest to a third party in a merger or consolidation or in a transfer of all or substantially all of its assetswithout the consent of our shareholders. Furthermore, at any time, the members of our manager may sell or transfer all or part of their membership interests inour manager without the approval of the shareholders, subject to certain restrictions as described elsewhere in this report. A new manager may not be willingor able to form new funds and could form funds that have investment objectives and governing terms that differ materially from those of our current funds. Anew owner could also have a different investment philosophy, employ investment professionals who are less experienced, be unsuccessful in identifyinginvestment opportunities or have a track record that is not as successful as Apollo’s track record. If any of the foregoing
- 63-

Table of Contents
were to occur, our funds could experience difficulty in making new investments, and the value of our funds’ existing investments, our businesses, our resultsof operations and our financial condition could materially suffer.
Our ability to pay regular distributions may be limited by our holding company structure. We are dependent on distributions from the Apollo OperatingGroup to pay distributions, taxes and other expenses.
As a holding company, our ability to pay distributions will be subject to the ability of our subsidiaries to provide cash to us. We intend to makequarterly distributions to our Class A shareholders. Accordingly, we expect to cause the Apollo Operating Group to make distributions to its unitholders(Holdings, which is 100% owned, directly and indirectly, by our Managing Partners and our Contributing Partners, and the three intermediate holdingcompanies, which are 100% owned by us), pro rata in an amount sufficient to enable us to pay such distributions to our Class A shareholders; however, suchdistributions may not be made. In addition, our manager can reduce or eliminate our distributions at any time, in its discretion.
There may be circumstances under which we are restricted from paying distributions under applicable law or regulation (for example, due toDelaware limited partnership or limited liability company act limitations on making distributions if liabilities of the entity after the distribution wouldexceed the value of the entity’s assets).
Tax consequences to our Managing Partners and Contributing Partners may give rise to conflicts of interests.
As a result of unrealized built-in gain attributable to the value of our assets held by the Apollo Operating Group entities at the time of the PrivateOffering Transactions, upon the sale, refinancing or disposition of such assets, our Managing Partners and Contributing Partners may incur different andgreater tax liabilities as a result of the disproportionately greater allocations of items of taxable income and gain to the Managing Partners and ContributingPartners upon a realization event. As the Managing Partners and Contributing Partners will not receive a correspondingly greater distribution of cashproceeds, they may, subject to applicable fiduciary or contractual duties, have different objectives regarding the appropriate pricing, timing and othermaterial terms of any sale, refinancing, or disposition, or whether to sell such assets at all. Decisions made with respect to an acceleration or deferral of incomeor the sale or disposition of assets with unrealized built-in gains may also influence the timing and amount of payments that are received by an exchanging orselling Managing Partner or Contributing Partner under the tax receivable agreement. All other factors being equal, earlier disposition of assets withunrealized built-in gains following such exchange will tend to accelerate such payments and increase the present value of the tax receivable agreement, anddisposition of assets with unrealized built-in gains before an exchange will increase a Managing Partner’s or Contributing Partner’s tax liability withoutgiving rise to any rights to receive payments under the tax receivable agreement (although other offsetting benefits would arise). Decisions made regarding achange of control also could have a material influence on the timing and amount of payments received by our Managing Partners and Contributing Partnerspursuant to the tax receivable agreement.
We are required to pay our Managing Partners and Contributing Partners for most of the actual tax benefits we realize as a result of the tax basis step-upwe receive in connection with our acquisitions of units from our Managing Partners and Contributing Partners.
Subject to certain restrictions, each Managing Partner and Contributing Partner has the right to exchange the AOG Units that he holds through hispartnership interest in Holdings for our Class A shares in a taxable transaction. These exchanges, as well as our acquisitions of units from our ManagingPartners or Contributing Partners, may result in increases in the tax basis of the intangible assets of the Apollo Operating Group that otherwise would nothave been available. Any such increases may reduce the amount of tax that APO Corp., a wholly owned subsidiary of Apollo Global Management, LLC,would otherwise be required to pay in the future.
We have entered into a tax receivable agreement with our Managing Partners and Contributing Partners that provides for the payment by APO Corp.,to our Managing Partners and Contributing Partners of 85% of the amount of actual tax savings, if any, that APO Corp. realizes (or is deemed to realize in thecase of an early termination payment by APO Corp. or a change of control, as discussed below) as a result of these increases in tax deductions and tax basisand certain other tax benefits, including imputed interest expense, related to entering into the tax receivable agreement. In April 2015 and April 2014, theApollo Operating Group made a distribution of $48.4 million and $32.0 million, respectively, to APO Corp. and APO Corp. made a payment to satisfy theliability under the tax receivable agreement to the Managing Partners and Contributing Partners from a realized tax benefit for the tax years 2014 and 2013.Future payments that APO Corp. may make to our Managing Partners and Contributing Partners could be material in amount. In the event that any other ofour current or future U.S. subsidiaries become taxable as corporations and acquire AOG Units in the future, or if we become taxable as a corporation for U.S.Federal income tax purposes, we expect, and have agreed that, each U.S corporation will become subject to a tax receivable agreement with substantiallysimilar terms.
- 64-

Table of Contents
The IRS could challenge our claim to any increase in the tax basis of the assets owned by the Apollo Operating Group that results from theexchanges entered into by the Managing Partners or Contributing Partners. The IRS could also challenge any additional tax depreciation and amortizationdeductions or other tax benefits (including deductions for imputed interest expense associated with payments made under the tax receivable agreement) weclaim as a result of, or in connection with, such increases in the tax basis of such assets. If the IRS were to successfully challenge a tax basis increase or taxbenefits we previously claimed from a tax basis increase, Holdings would not be obligated under the tax receivable agreement to reimburse APO Corp. forany payments previously made to them (although any future payments would be adjusted to reflect the result of such challenge). As a result, in certaincircumstances, payments could be made to our Managing Partners and Contributing Partners under the tax receivable agreement in excess of 85% of theactual aggregate cash tax savings of APO Corp. APO Corp.’s ability to achieve benefits from any tax basis increase and the payments to be made under thisagreement will depend upon a number of factors, including the timing and amount of its future income.
In addition, the tax receivable agreement provides that, upon a merger, asset sale or other form of business combination or certain other changes ofcontrol, APO Corp.’s (or its successor’s) obligations with respect to exchanged or acquired units (whether exchanged or acquired before or after such changeof control) would be based on certain assumptions, including that APO Corp. would have sufficient taxable income to fully utilize the deductions arisingfrom the increased tax deductions and tax basis and other benefits related to entering into the tax receivable agreement. See “Item 13. Certain Relationshipsand Related Party Transactions-Amended and Restated Tax Receivable Agreement.”
If we were deemed an investment company under the Investment Company Act, applicable restrictions could make it impractical for us to continue ourbusinesses as contemplated and could have a material adverse effect on our businesses and the price of our Class A shares.
We do not believe that we are an “investment company” under the Investment Company Act because the nature of our assets and the income derivedfrom those assets allow us to rely on the exception provided by Rule 3a-1 issued under the Investment Company Act. In addition, we believe we are not aninvestment company under Section 3(b)(1) of the Investment Company Act because we are primarily engaged in non-investment company businesses. Weintend to conduct our operations so that we will not be deemed an investment company. However, if we were to be deemed an investment company, wewould be taxed as a corporation and other restrictions imposed by the Investment Company Act, including limitations on our capital structure and our abilityto transact with affiliates that apply to us, could make it impractical for us to continue our businesses as contemplated and would have a material adverseeffect on our businesses and the price of our Class A shares.
Risks Related to Taxation
You may be subject to U.S. Federal income tax on your share of our taxable income, regardless of whether you receive any cash distributions from us.
Under current law, so long as we are not required to register as an investment company under the Investment Company Act and 90% of our grossincome for each taxable year constitutes “qualifying income” within the meaning of the Internal Revenue Code on a continuing basis, we will be treated, forU.S. Federal income tax purposes, as a partnership and not as an association or a publicly traded partnership taxable as a corporation. You may be subject toU.S. Federal, state, local and possibly, in some cases, foreign income taxation on your allocable share of our items of income, gain, loss, deduction and creditfor each of our taxable years ending with or within your taxable year, regardless of whether or not you receive cash distributions from us. Accordingly, youmay be required to make tax payments in connection with your ownership of Class A shares that significantly exceed your cash distributions in any specificyear.
If we are treated as a corporation for U.S. Federal income tax purposes, the value of the Class A shares would be adversely affected.
The value of your investment will depend in part on our company being treated as a partnership for U.S. Federal income tax purposes, which requiresthat 90% or more of our gross income for every taxable year consist of qualifying income, as defined in Section 7704 of the Internal Revenue Code, and thatwe are not required to register as an investment company under the Investment Company Act and related rules. Although we intend to manage our affairs sothat our partnership will meet the 90% test described above in each taxable year, we may not meet these requirements or, as discussed below, current law maychange so as to cause, in either event, our partnership to be treated as a corporation for U.S. Federal income tax purposes. If we were treated as a corporationfor U.S. Federal income tax purposes, (i) we would become subject to corporate income tax and (ii) distributions to shareholders would be taxable asdividends for U.S. Federal income tax purposes to the extent of our earnings and profits.
- 65-

Table of Contents
Current law may change, causing us to be treated as a corporation for U.S. Federal or state income tax purposes or otherwise subjecting us to entitylevel taxation. See “-Risks Related to Our Organization and Structure-Although not enacted, the U.S. Congress has considered legislation that would have: (i)in some cases after a ten-year transition period, precluded us from qualifying as a partnership or required us to hold carried interest through taxablecorporations and (ii) taxed certain income and gains at increased rates. If similar legislation were to be enacted and apply to us, the value of our Class Ashares could be adversely affected.” Because of widespread state budget deficits, several states are evaluating ways to subject partnerships to entity leveltaxation through the imposition of state income, franchise or other forms of taxation. If any state were to impose a tax upon us as an entity, our distributionsto you would be reduced.
Our structure involves complex provisions of U.S. Federal income tax law for which no clear precedent or authority may be available. Our structure is alsosubject to potential legislative, judicial or administrative change and differing interpretations, possibly on a retroactive basis.
The U.S. Federal income tax treatment of holders of Class A shares depends in some instances on determinations of fact and interpretations ofcomplex provisions of U.S. Federal income tax law for which no clear precedent or authority may be available. You should be aware that the U.S. Federalincome tax rules are constantly under review by persons involved in the legislative process, the IRS and the U.S. Treasury Department, frequently resulting inrevised interpretations of established concepts, statutory changes, revisions to regulations and other modifications and interpretations. The IRS pays closeattention to the proper application of tax laws to partnerships and entities taxed as partnerships. The present U.S. Federal income tax treatment of aninvestment in our Class A shares may be modified by administrative, legislative or judicial interpretation at any time, and any such action may affectinvestments and commitments previously made. Changes to the U.S. Federal income tax laws and interpretations thereof could make it more difficult orimpossible to meet the exception for us to be treated as a partnership for U.S. Federal income tax purposes that is not taxable as a corporation, affect or causeus to change our investments and commitments, affect the tax considerations of an investment in us, change the character or treatment of portions of ourincome (including, for instance, the treatment of carried interest as ordinary income rather than capital gain) and adversely affect an investment in our Class Ashares. For example, as discussed above under “-Risks Related to Our Organization and Structure-Although not enacted, the U.S. Congress has consideredlegislation that would have: (i) in some cases after a ten-year transition period, precluded us from qualifying as a partnership or required us to hold carriedinterest through taxable corporations; and (ii) taxed certain income and gains at increased rates. If similar legislation were to be enacted and apply to us, thevalue of our Class A shares could be adversely affected,” the U.S. Congress has considered various legislative proposals to treat all or part of the capital gainand dividend income that is recognized by an investment partnership and allocable to a partner affiliated with the sponsor of the partnership (i.e., a portion ofthe carried interest) as ordinary income to such partner for U.S. Federal income tax purposes.
Our operating agreement permits our manager to modify our operating agreement from time to time, without the consent of the holders of Class Ashares, to address certain changes in U.S. Federal income tax regulations, legislation or interpretation. In some circumstances, such revisions could have amaterial adverse impact on some or all holders of Class A shares. For instance, our manager could elect at some point to treat us as an association taxable as acorporation for U.S. Federal (and applicable state) income tax purposes. If our manager were to do this, the U.S. Federal income tax consequences of owningour Class A shares would be materially different. Moreover, we will apply certain assumptions and conventions in an attempt to comply with applicable rulesand to report income, gain, deduction, loss and credit to holders of Class A shares in a manner that reflects such beneficial ownership of items by holders ofClass A shares, taking into account variation in ownership interests during each taxable year because of trading activity. However, those assumptions andconventions may not be in compliance with all aspects of applicable tax requirements. It is possible that the IRS will assert successfully that the conventionsand assumptions used by us do not satisfy the technical requirements of the Internal Revenue Code and/or Treasury regulations and could require that itemsof income, gain, deductions, loss or credit, including interest deductions, be adjusted, reallocated or disallowed in a manner that adversely affects holders ofClass A shares.
Our interests in certain of our businesses are held through entities that are treated as corporations for U.S. Federal income tax purposes; such corporationsmay be liable for significant taxes and may create other adverse tax consequences, which could potentially adversely affect the value of your investment.
In light of the publicly traded partnership rules under U.S. Federal income tax law and other requirements, we hold our interests in certain of ourbusinesses through entities that are treated as corporations for U.S. Federal income tax purposes. Each such corporation could be liable for significant U.S.Federal income taxes and applicable state, local and other taxes that would not otherwise be incurred, which could adversely affect the value of yourinvestment. Furthermore, it is possible that the IRS could challenge the manner in which such corporation’s taxable income is computed by us.
- 66-

Table of Contents
Changes in U.S. tax law could adversely affect our ability to raise funds from certain foreign investors.
Under the Foreign Account Tax Compliance Act, or FATCA, certain U.S. withholding agents, or USWAs, foreign financial institutions, or FFIs, andnon-financial foreign entities, or NFFEs, are required to report information about offshore accounts and investments to the U.S. or their local taxingauthorities annually. In response to this legislation, various foreign governments have entered into Intergovernmental Agreements, or IGAs, with the U.S.Government and some have enacted similar legislation.
In order to meet these regulatory obligations, Apollo is required to register FFIs with the IRS, evaluate internal FATCA procedures, expand thereview of investor Anti-Money Laundering/Know Your Customer and tax forms, evaluate the FATCA offerings by third party administrators and ensure thatApollo is prepared for the new global tax and information reporting requirements created under the U.S. and Non U.S. FATCA regimes.
Further, FATCA as well as Chapters 3 and 61 of the Internal Revenue Code, require Apollo to collect new IRS Tax Forms (W-9 and W-8 series),UK/Cayman Self-Certifications and other supporting documentation from their investors. Apollo has undertaken efforts to re-paper their existing investors.
Failure to meet these regulatory requirements could expose Apollo and/or its investors to a punitive withholding tax of 30% on certain U.S.payments (and beginning in 2019, a 30% withholding tax on gross proceeds from the sale of U.S. stocks and securities), and possibly limit their ability toopen bank accounts and secure funding the global capital markets. The reporting obligations imposed under FATCA require FFIs to comply with agreementswith the IRS to obtain and disclose information about certain investors to the IRS. The administrative and economic costs of compliance with FATCA maydiscourage some foreign investors from investing in U.S. funds, which could adversely affect our ability to raise funds from these investors.
Federal tax reform efforts will continue which may involve tax uncertainties and risks.
It is anticipated that the U.S. Congress will continue examining proposals that would provide for a comprehensive overhaul of U.S. Federal incometax laws, which could result in sweeping changes to many longstanding tax rules. Reform efforts could result in lower statutory tax rates, but those ratereductions could be offset by tax changes intended to broaden the tax base. As noted above in the discussion of “Risks Related to Our Organization andStructure,” tax reform legislation could require many entities currently operating as partnerships to be taxed as corporations and could cause income fromcarried interests to be taxed as ordinary income.
In addition, tax reform could include other base-broadening provisions spanning a variety of industry sectors, which also could adversely affect ourbusiness. For example, proposals affecting financial institutions and products may include changing the tax treatment of executive compensation, includingbonuses, as well as the tax treatment of derivatives and other financial instruments. Other changes could include limiting or eliminating certain tax benefitscurrently available to cash value life insurance and deferred annuity products. Enactment of these or similar changes could adversely affect new sales, andpossibly funding, of existing cash value life insurance and deferred annuity products.
Other proposals likely to emerge in the context of fundamental tax reform include: changes to the accelerated cost recovery system, mandatoryamortization of certain advertising expenditures, repeal of the domestic production deduction, reforms to the subpart F rules, repeal of the last-in/first-outaccounting rules, repeal of incentives currently available to oil and natural gas exploration and production companies, and limitations on the net operatingloss deduction. The tax reform debate also may encompass proposals to move the United States toward a territorial system for taxing foreign-source income ofUnited States multinationals and the possibility of a one-time transition tax on previously untaxed foreign earnings. Many of these proposals were includedin the tax reform discussion draft that then-House Ways and Means Committee Chairman Dave Camp released in 2014; others were included in variousbudget proposals President Obama has released during his presidency. It is not possible to predict when tax reform will be enacted and what impact taxreform, if enacted, would have on our funds and our business, but there is the potential for significant changes in U.S. federal laws related to the tax treatmentof products and services provided by Apollo and investments made by our funds.
We may hold or acquire certain investments through an entity classified as a PFIC or CFC for U.S. Federal income tax purposes.
Certain of our investments may be in foreign corporations or may be acquired through foreign subsidiaries that would be classified as corporationsfor U.S. Federal income tax purposes. Such entities may be passive foreign investment companies, or “PFICs,” or controlled foreign corporations, or “CFCs,”for U.S. Federal income tax purposes. For example, APO (FC), LLC and APO (FC II), LLC are considered to be CFCs for U.S. Federal income tax purposes.Class A shareholders indirectly owning an interest in a PFIC or a CFC may experience adverse U.S. tax consequences, including the recognition of taxableincome prior
- 67-

Table of Contents
to the receipt of cash relating to such income. In addition, gain on the sale of a PFIC or CFC may be taxable at ordinary income tax rates.
Complying with certain tax-related requirements may cause us to forego otherwise attractive business or investment opportunities or enter intoacquisitions, borrowings, financings or arrangements we may not have otherwise entered into.
In order for us to be treated as a partnership for U.S. Federal income tax purposes, and not as an association or publicly traded partnership taxable asa corporation, we must meet the qualifying income exception discussed above on a continuing basis and we must not be required to register as an investmentcompany under the Investment Company Act. In order to effect such treatment we (or our subsidiaries) may be required to invest through foreign or domesticcorporations, forego attractive business or investment opportunities or enter into borrowings or financings we may not have otherwise entered into. This maycause us to incur additional tax liability and/or adversely affect our ability to operate solely to maximize our cash flow. Our structure also may impede ourability to engage in certain corporate acquisitive transactions because we generally intend to hold all of our assets through the Apollo Operating Group. Inaddition, we may be unable to participate in certain corporate reorganization transactions that would be tax free to our holders if we were a corporation. Tothe extent we hold assets other than through the Apollo Operating Group, we will make appropriate adjustments to the Apollo Operating Group agreementsso that distributions to Holdings and us would be the same as if such assets were held at that level. Moreover, we are precluded by a contract with one of theStrategic Investors from acquiring assets in a manner that would cause that Strategic Investor to be engaged in a commercial activity within the meaning ofSection 892 of the Internal Revenue Code.
Tax gain or loss on disposition of our Class A shares could be more or less than expected.
If you sell your Class A shares, you will recognize a gain or loss equal to the difference between the amount realized and your adjusted tax basisallocated to those Class A shares. Prior distributions to you in excess of the total net taxable income allocated to you will have decreased the tax basis in yourClass A shares. Therefore, such excess distributions will increase your taxable gain, or decrease your taxable loss, when the Class A shares are sold and mayresult in a taxable gain even if the sale price is less than the original cost. A portion of the amount realized, whether or not representing gain, may be ordinaryincome to you.
We cannot match transferors and transferees of Class A shares, and we have therefore adopted certain income tax accounting conventions that may notconform with all aspects of applicable tax requirements. The IRS may challenge this treatment, which could adversely affect the value of our Class Ashares.
Because we cannot match transferors and transferees of Class A shares, we have adopted depreciation, amortization and other tax accountingpositions that may not conform with all aspects of existing Treasury regulations. A successful IRS challenge to those positions could adversely affect theamount of tax benefits available to holders of Class A shares. It also could affect the timing of these tax benefits or the amount of gain on the sale of Class Ashares and could have a negative impact on the value of Class A shares or result in audits of and adjustments to the tax returns of holders of Class A shares.
In addition, our taxable income and losses will be determined and apportioned among investors using conventions we regard as consistent withapplicable law. As a result, if you transfer your Class A shares, you may be allocated income, gain, loss and deduction realized by us after the date of transfer.Similarly, a transferee may be allocated income, gain, loss and deduction realized by us prior to the date of the transferee’s acquisition of our Class A shares.A transferee may also bear the cost of withholding tax imposed with respect to income allocated to a transferor through a reduction in the cash distributed tothe transferee.
The sale or exchange of 50% or more of our capital and profit interests will result in the termination of our partnership for U.S. Federal income taxpurposes. We will be considered to have been terminated for U.S. Federal income tax purposes if there is a sale or exchange of 50% or more of the totalinterests in our capital and profits within a twelve-month period. Our termination would, among other things, result in the closing of our taxable year for allholders of Class A shares and could result in a deferral of depreciation deductions allowable in computing our taxable income.
Non-U.S. persons face unique U.S. tax issues from owning Class A shares that may result in adverse tax consequences to them.
In light of our investment activities, we may be, or may become, engaged in a U.S. trade or business for U.S. Federal income tax purposes, in whichcase some portion of our income would be treated as effectively connected income with respect to non-U.S. holders of our Class A shares, or “ECI.” Moreover,dividends paid by an investment that we make in a real estate investment trust, or “REIT,” that are attributable to gains from the sale of U.S. real propertyinterests and sales of certain investments in interests in U.S. real property, including stock of certain U.S. corporations owning significant U.S. real property,may be treated as ECI with respect to non-U.S. holders of our Class A shares. In addition, certain income of non-U.S. holders from U.S. sources
- 68-

Table of Contents
not connected to any U.S. trade or business conducted by us could be treated as ECI. To the extent our income is treated as ECI, each non-U.S. holdergenerally would be subject to withholding tax on its allocable share of such income, would be required to file a U.S. Federal income tax return for such yearreporting its allocable share of income effectively connected with such trade or business and any other income treated as ECI, and would be subject to U.S.Federal income tax at regular U.S. tax rates on any such income (state and local income taxes and filings may also apply in that event). Non-U.S. holders thatare corporations may also be subject to a 30% branch profits tax on their allocable share of such income. In addition, certain income from U.S. sources that isnot ECI allocable to non-U.S. holders may be reduced by withholding taxes imposed at the highest effective applicable tax rate.
An investment in Class A shares will give rise to UBTI to certain tax-exempt holders.
We will not make investments through taxable U.S. corporations solely for the purpose of limiting unrelated business taxable income (“UBTI”) from“debt-financed” property and, thus, an investment in Class A shares will give rise to UBTI to tax-exempt holders of Class A shares. For example, APO AssetCo., LLC will hold interests in entities treated as partnerships, or otherwise subject to tax on a flow-through basis, that will incur indebtedness. Moreover, ifthe IRS successfully asserts that we are engaged in a trade or business, then additional amounts of income could be treated as UBTI.
We do not intend to make, or cause to be made, an election under Section 754 of the Internal Revenue Code to adjust our asset basis or the asset basis ofcertain of the Apollo Operating Group Partnerships. Thus, a holder of Class A shares could be allocated more taxable income in respect of those Class Ashares prior to disposition than if such an election were made.
We did not make and currently do not intend to make, or cause to be made, an election to adjust asset basis under Section 754 of the InternalRevenue Code with respect to Apollo Principal Holdings I, L.P., Apollo Principal Holdings II, L.P., Apollo Principal Holdings III, L.P., Apollo PrincipalHoldings IV, L.P., Apollo Principal Holdings V, L.P., Apollo Principal Holdings VI, L.P., Apollo Principal Holdings VII, L.P., Apollo Principal Holdings VIII,L.P., Apollo Principal Holdings IX, L.P. and Apollo Principal Holdings X, L.P. If no such election is made, there will generally be no adjustment for atransferee of Class A shares even if the purchase price of those Class A shares is higher than the Class A shares’ share of the aggregate tax basis of our assetsimmediately prior to the transfer. In that case, on a sale of an asset, gain allocable to a transferee could include built-in gain allocable to the transferor at thetime of the transfer, which built-in gain would otherwise generally be eliminated if a Section 754 election had been made.Class A shareholders may be subject to state and local taxes and return filing requirements as a result of investing in our Class A shares.
In addition to U.S. Federal income taxes, our Class A shareholders may be subject to other taxes, including state and local taxes, unincorporatedbusiness taxes and estate, inheritance or intangible taxes that are imposed by the various jurisdictions in which we do business or own property now or in thefuture, even if our Class A shareholders do not reside in any of those jurisdictions. Our Class A shareholders may also be required to file state and localincome tax returns and pay state and local income taxes in some or all of these jurisdictions. Further, Class A shareholders may be subject to penalties forfailure to comply with those requirements. It is the responsibility of each Class A shareholder to file all U.S. Federal, state and local tax returns that may berequired of such Class A shareholder.
We may not be able to furnish to each Class A shareholder specific tax information within 90 days after the close of each calendar year, which means thatholders of Class A shares who are U.S. taxpayers should anticipate the need to file annually a request for an extension of the due date of their income taxreturn. In addition, it is possible that Class A shareholders may be required to file amended income tax returns.
As a publicly traded partnership, our operating results, including distributions of income, dividends, gains, losses or deductions and adjustments tocarrying basis, will be reported on Schedule K-1 and distributed to each Class A shareholder annually. It may require longer than 90 days after the end of ourfiscal year to obtain the requisite information from all lower-tier entities so that K-1s may be prepared for us. For this reason, Class A shareholders who areU.S. taxpayers should anticipate the need to file annually with the IRS (and certain states) a request for an extension past April 15 or the otherwise applicabledue date of their income tax return for the taxable year.
In addition, it is possible that a Class A shareholder will be required to file amended income tax returns as a result of adjustments to items on thecorresponding income tax returns of the partnership. Any obligation for a Class A shareholder to file amended income tax returns for that or any other reason,including any costs incurred in the preparation or filing of such returns, are the responsibility of each Class A shareholder.
- 69-

Table of Contents
You may be subject to an additional U.S. Federal income tax on net investment income allocated to you by us and on gain on the sale of the Class A shares.
As of 2013, individuals, estates and trusts are subject to an additional 3.8% tax on “net investment income” (or undistributed “net investmentincome,” in the case of estates and trusts) for each taxable year, with such tax applying to the lesser of such income or the excess of such person’s adjustedgross income (with certain adjustments) over a specified amount. Net investment income includes net income from interest, dividends, annuities, royaltiesand rents and net gain attributable to the disposition of investment property. It is anticipated that net income and gain attributable to an investment in us willbe included in a holder of the Class A share’s “net investment income” subject to this additional tax.
We may be liable for adjustments to our tax returns as a result of recently enacted legislation.
Legislation was recently enacted that significantly changes the rules for U.S. Federal income tax audits of partnerships. Such audits will continue tobe conducted at the partnership level, but with respect to tax returns for taxable years beginning after December 31, 2017, any adjustments to the amount oftax due (including interest and penalties) will be payable by the partnership rather than the partners of such partnership unless the partnership qualifies forand affirmatively elects an alternative procedure. In general, under the default procedures, taxes imposed on us would be assessed at the highest rate of taxapplicable for the reviewed year and determined without regard to the character of the income or gain, the tax status of our shareholders or the benefit of anyshareholder-level tax attributes (that could otherwise reduce any tax due).
Under the elective alternative procedure, we would issue information returns to persons who were shareholders in the audited year, who would thenbe required to take the adjustments into account in calculating their own tax liability, and we would not be liable for the adjustments to the amount of taxdue (including interest and penalties). The mechanics of the elective alternative procedure are not clear in a number of respects and will likely be clarified byfuture guidance. Our manager has discretion whether or not to make use of this elective alternative procedure and has not determined whether or to whatextent the election will be available or appropriate.
- 70-

Table of Contents
ITEM 1B. UNRESOLVED STAFF COMMENTS
None.
ITEM 2. PROPERTIES
Our principal executive offices are located in leased office space at 9 West 57th Street, New York, New York 10019. We also lease the space for ouroffices in New York, Los Angeles, Houston, Chicago, Bethesda, Toronto, London, Frankfurt, Madrid, Luxembourg, Mumbai, Delhi, Singapore, Hong Kongand Shanghai. We do not own any real property. We consider these facilities to be suitable and adequate for the management and operation of our businesses.
ITEM 3. LEGAL PROCEEDINGS
See note 16 to our consolidated financial statements for a summary of the Company’s legal proceedings.
ITEM 4. MINE SAFETY DISCLOSURES
Not applicable.
- 71-

Table of Contents
PART II—OTHER INFORMATION ITEM 5. MARKETS FOR REGISTRANT'S COMMON EQUITY, RELATED STOCKHOLDER MATTERS AND ISSUER PURCHASES OF
EQUITY SECURITIES
Our Class A shares are traded on the NYSE under the symbol “APO.” Our Class A shares began trading on the NYSE on March 30, 2011.
The number of holders of record of our Class A shares as of February 26, 2016 was 21. This does not include the number of shareholders that holdshares in “street name” through banks or broker-dealers. As of February 26, 2016, there was 1 holder of our Class B share.
The following table sets forth the high and low intra-day sales prices per unit of our Class A shares, for the periods indicated, as reported by theNYSE:
Sales Price
2015 High Low
First Quarter $ 25.80 $ 20.96Second Quarter 23.33 20.78Third Quarter 22.61 15.35Fourth Quarter 19.18 14.15
Sales Price
2014 High Low
First Quarter $ 36.51 $ 29.91Second Quarter 32.44 24.06Third Quarter 28.18 22.41Fourth Quarter 25.18 20.02
Cash Distribution Policy
The following table sets forth the cash distributions paid to our Class A shareholders for the fiscal years ended December 31, 2015 and 2014.
Distribution Payment Date Distribution Per Class A
Share AmountFebruary 26, 2014 $ 1.08May 30, 2014 0.84August 29, 2014 0.46November 21, 2014 0.73Total 2014 distribution $ 3.11
February 27, 2015 $ 0.86May 29, 2015 0.33August 31, 2015 0.42November 30, 2015 0.35Total 2015 distribution $ 1.96
We have declared an additional cash distribution of $0.28 per Class A share in respect of the fourth quarter of 2015 which will be paid onFebruary 29, 2016 to holders of record of Class A shares at the close of business on February 19, 2016.
Distributable Earnings (“DE”), as well as DE After Taxes and Related Payables are derived from our segment reported results, and are supplementalnon-U.S. GAAP measures to assess performance and amounts available for distribution to Class A shareholders, holders of RSUs that participate indistributions and holders of AOG Units. DE represents the amount of net realizedearnings without the effects of the consolidation of any of the affiliated funds. DE, which is a component of EI, is the sum across all segments of (i) totalmanagement fees and advisory and transaction fees, excluding monitoring fees received from Athene based on its capital and surplus (as defined in Apollo’stransaction advisory services agreement with Athene), (ii) other income (loss), excluding the gains (losses) arising from the reversal of a portion of the taxreceivable agreement liability (iii) realized carried interest income, and (iv) realized investment income, less (x) compensation expense, excluding theexpense related to equity-based awards, (y) realized profit sharing expense, and (z) non-compensation expenses, excluding depreciation and amortizationexpense. DE After Taxes and Related Payables represents DE less estimated current corporate, local and non-U.S. taxes as well as the payable under Apollo’stax receivable agreement.
Our current intention is to distribute to our Class A shareholders on a quarterly basis substantially all of our Distributable Earnings attributable toClass A shareholders, in excess of amounts determined by our manager to be necessary or appropriate to provide for the conduct of our businesses, to makeappropriate investments in our businesses and our funds, to comply with applicable law, any of our debt instruments or other agreements, or to provide forfuture distributions to our Class A shareholders for any ensuing quarter. Because we will not know what our actual available cash flow from operations will befor any year until sometime after the end of such year, our fourth quarter distribution may be adjusted to take into account actual net after-tax cash flow fromoperations for that year.
The declaration, payment and determination of the amount of our quarterly distribution will be at the sole discretion of our manager, which may

change our cash distribution policy at any time. We cannot assure you that any distributions, whether quarterly or otherwise, will or can be paid. In makingdecisions regarding our quarterly distribution, our manager will take into account general economic and business conditions, our strategic plans andprospects, our businesses and investment opportunities, our financial condition and operating results, working capital requirements and anticipated cashneeds, contractual restrictions and obligations, legal, tax and regulatory restrictions, restrictions and other implications on the payment of distributions by usto our common shareholders or by our subsidiaries to us and such other factors as our manager may deem relevant.
Because we are a holding company that owns intermediate holding companies, the funding of each distribution, if declared, will occur in three steps,as follows.
• First, we will cause one or more entities in the Apollo Operating Group to make a distribution to all of its partners, including ourwholly-owned subsidiaries APO Corp., APO Asset Co., LLC, APO (FC), LLC, APO (FC II), LLC and APO UK (FC), LLC (asapplicable), and Holdings, on a pro rata basis;
• Second, we will cause our intermediate holding companies, APO Corp., APO Asset Co., LLC, APO (FC), LLC, APO (FC II), LLC andAPO UK (FC), LLC (as applicable), to distribute to us, from their net after-tax proceeds, amounts equal to the aggregate distributionwe have declared; and
• Third, we will distribute the proceeds received by us to our Class A shareholders on a pro rata basis.
Payments that any of our intermediate holding companies make under the tax receivable agreement will reduce amounts that would otherwise beavailable for distribution by us on our Class A shares. See note 15 to our consolidated financial statements.
Under Delaware law we are prohibited from making a distribution to the extent that our liabilities, after such distribution, exceed the fair value of ourassets. Our operating agreement does not contain any restrictions on our ability to make distributions, except that we may only distribute Class A shares toholders of Class A shares. The debt arrangements, as described in note 12 to our consolidated financial statements, do not contain restrictions on our or oursubsidiaries' ability to pay distributions; however, instruments governing indebtedness that we or our subsidiaries incur in the future may contain restrictionson our or our subsidiaries' ability to pay distributions or make other cash distributions to equity holders.
In addition, the Apollo Operating Group’s cash flow from operations may be insufficient to enable it to make tax distributions to its partners, inwhich case the Apollo Operating Group may have to borrow funds or sell assets, and thus our liquidity and financial condition could be materially adverselyaffected. Furthermore, by paying cash distributions rather than investing that cash in our businesses, we might risk slowing the pace of our growth, or nothaving a sufficient amount of cash to fund our operations, new investments or unanticipated capital expenditures, should the need arise.
Our cash distribution policy has certain risks and limitations, particularly with respect to liquidity. Although we expect to pay distributionsaccording to our cash distribution policy, we may not pay distributions according to our policy, or at all, if, among other things, we do not have the cashnecessary to pay the intended distributions.
As of December 31, 2015, approximately 12.5 million RSUs granted to Apollo employees (net of forfeited awards) were entitled to distributionequivalents, which are paid in cash.
- 72-

Table of Contents
Securities Authorized for Issuance Under Equity Compensation PlansSee the table under “Securities Authorized for Issuance Under Equity Compensation Plans” set forth in “Item 12. Security Ownership of Certain
Beneficial Owners and Management and Related Stockholder Matters.”
Unregistered Sale of Equity Securities
On October 9, 2015, November 3, 2015, November 12, 2015 and December 10, 2015 we issued 518,849, 1,523,155, 782 and 549 Class A shares,respectively, net of taxes to Apollo Management Holdings, L.P., a subsidiary of Apollo Global Management, LLC, in connection with deliveries of shares toparticipants in our 2007 equity incentive plan for an aggregate purchase price of $9,681,722, $28,635,314, $14,256 and $10,321, respectively. The issuanceswere exempt from registration under the Securities Act in accordance with Section 4(a)(2) and Rule 506(b) thereof, as transactions by the issuer not involvinga public offering. We determined that the purchaser of Class A shares in the transactions, Apollo Management Holdings, L.P., was an accredited investor.
Class A Shares Repurchases in the Fourth Quarter of 2015
The following table sets forth purchases of our Class A shares made by us or on our behalf in the fourth quarter of the year ended December 31, 2015.
Period Total Number of Class A Shares
Purchased(1) Average Price Paid per Share
October 1, 2015 through October 31, 2015 — —November 1, 2015 through November 30, 2015 3,865 $ 18.19December 1, 2015 through December 31, 2015 — —
Total 3,865
(1) During the fourth quarter of the year ended December 31, 2015, we repurchased a number of our Class A shares equal to the number of Class A restrictedshares issued under our equity incentive plan during the quarter. All such repurchases were made in open-market transactions and not pursuant to apublicly-announced repurchase plan or program.
ITEM 6. SELECTED FINANCIAL DATA
The following selected historical consolidated and combined financial and other data of Apollo Global Management, LLC should be read togetherwith “Item 7. Management’s Discussion and Analysis of Financial Condition and Results of Operations” and the historical financial statements and relatednotes included in “Item 8. Financial Statements and Supplementary Data.”
The selected historical consolidated statements of operations data of Apollo Global Management, LLC for each of the years ended December 31,2015, 2014 and 2013 and the selected historical consolidated statements of financial condition data as of December 31, 2015 and 2014 have been derivedfrom our audited consolidated financial statements which are included in “Item 8. Financial Statements and Supplementary Data.”
We derived the selected historical consolidated statements of operations data of Apollo Global Management, LLC for the years ended December 31,2012 and 2011 and the selected consolidated statements of financial condition data as of December 31, 2013, 2012 and 2011 from our audited consolidatedfinancial statements which are not included in this report.
- 73-

Table of Contents
Year Ended December 31,
2015(3) 2014 2013 2012 2011 (dollars in thousands, except per share amounts)Statement of Operations Data Revenues:
Advisory and transaction fees from affiliates, net $ 14,186 $ 315,587 $ 196,562 $ 149,544 $ 81,953
Management fees from affiliates 930,194 850,441 674,634 580,603 487,559
Carried interest income (loss) from affiliates 97,290 394,055 2,862,375 2,129,818 (397,880)
Total Revenues 1,041,670 1,560,083 3,733,571 2,859,965 171,632
Expenses: Compensation and benefits:
Salary, bonus and benefits 354,524 338,049 294,753 274,574 251,095
Equity-based compensation 97,676 126,320 126,227 598,654 1,149,753
Profit sharing expense 85,229 276,190 1,173,255 872,133 (60,070)
Total Compensation and Benefits 537,429 740,559 1,594,235 1,745,361 1,340,778
Interest expense 30,071 22,393 29,260 37,116 40,850
General, administrative and other 102,255 97,663 98,202 87,961 75,558
Professional fees 68,113 82,030 83,407 64,682 59,277
Occupancy 40,219 40,427 39,946 37,218 35,816
Placement fees 8,414 15,422 42,424 22,271 3,911
Depreciation and amortization 44,474 45,069 54,241 53,236 26,260
Total Expenses 830,975 1,043,563 1,941,715 2,047,845 1,582,450
Other Income: Net gains (losses) from investment activities 121,723 213,243 330,235 288,244 (129,827)Net gains (losses) from investment activities of consolidatedvariable interest entities 19,050 22,564 199,742 (71,704) 24,201
Income from equity method investments 14,855 53,856 107,350 110,173 13,923
Interest income 3,232 10,392 12,266 9,693 4,731
Other income, net 7,673 60,592 40,114 1,964,679 205,520
Total Other Income 166,533 360,647 689,707 2,301,085 118,548
Income (loss) before income tax provision 377,228 877,167 2,481,563 3,113,205 (1,292,270)
Income tax provision (26,733) (147,245) (107,569) (65,410) (11,929)
Net Income (Loss) 350,495 729,922 2,373,994 3,047,795 (1,304,199)
Net (income) loss attributable to Non-controlling Interests(1)(2) (215,998) (561,693) (1,714,603) (2,736,838) 835,373Net Income (Loss) Attributable to Apollo GlobalManagement, LLC $ 134,497 $ 168,229 $ 659,391 $ 310,957 $ (468,826)
Distributions Declared per Class A Share $ 1.96 $ 3.11 $ 3.95 $ 1.35 $ 0.83
Net Income (Loss) Available to Class A Share – Basic $ 0.61 $ 0.62 $ 4.06 $ 2.06 $ (4.18)
Net Income (Loss) Available to Class A Share –Diluted $ 0.61 $ 0.62 $ 4.03 $ 2.06 $ (4.18)
Year Ended December 31,
2015(3) 2014 2013 2012 2011
(in thousands)
Statement of Financial Condition Data Total assets $ 4,559,808 $ 23,172,788 $ 22,474,674 $ 20,634,810 $ 7,973,314
Debt (excluding obligations of consolidated variable interest entities) 1,025,255 1,027,965 746,693 735,771 935,957
Debt obligations of consolidated variable interest entities 801,270 14,123,100 12,423,962 11,834,955 3,189,837
Total shareholders’ equity 1,388,981 5,943,461 6,688,722 5,703,383 2,648,321
Total Non-controlling Interests 739,476 4,156,979 4,051,453 3,036,565 1,921,920
(1) Reflects Non-controlling Interests attributable to AAA (for all periods prior to January 1, 2015), consolidated variable interest entities and the remaining interests held bycertain individuals who receive an allocation of income from certain of our credit management companies.
- 74-

Table of Contents
(2) Reflects the Non-Controlling Interests in the net (income) loss of the Apollo Operating Group relating to the AOG Units held by our Managing Partners and ContributingPartners which is calculated by applying the ownership percentage of Holdings in the Apollo Operating Group. Holdings' ownership interest in the Apollo OperatingGroup was impacted by the Company’s initial public offering in April 2011, issuances of Class A shares in settlement of vested RSUs in each of the periods presented, andexchanges of certain AOG Units. See “Item 8. Financial Statements and Supplementary Data” for details of the ownership percentage in Holdings.
(3) Apollo adopted new U.S. GAAP consolidation and collateralized financing entity (“CFE”) guidance during the year ended December 31, 2015 which resulted in thedeconsolidation of certain funds and VIEs as of January 1, 2015 and a measurement alternative of the financial assets and liabilities of the remaining consolidated CLOs.The adoption did not impact net income attributable to Apollo Global Management, LLC, but did impact various line items within the statements of operations and financialcondition. See note 2 to the consolidated financial statements for details regarding the Company’s adoption of the new consolidation and CFE guidance.
ITEM 7. MANAGEMENT’S DISCUSSION AND ANALYSIS OF FINANCIAL CONDITION AND RESULTS OF OPERATIONSThe following discussion should be read in conjunction with Apollo Global Management, LLC’s consolidated financial statements and the related notes asof December 31, 2015 and 2014 and for the years ended December 31, 2015, 2014 and 2013. This discussion contains forward-looking statements that aresubject to known and unknown risks and uncertainties. Actual results and the timing of events may differ significantly from those expressed or implied insuch forward-looking statements due to a number of factors, including those included in the section of this report entitled “Item 1A. Risk Factors.” Thehighlights listed below have had significant effects on many items within our consolidated financial statements and affect the comparison of the currentperiod’s activity with those of prior periods.
GeneralOur Businesses
Founded in 1990, Apollo is a leading global alternative investment manager. We are a contrarian, value-oriented investment manager in privateequity, credit and real estate with significant distressed expertise and a flexible mandate in the majority of our funds which enables our funds to investopportunistically across a company’s capital structure. We raise, invest and manage funds on behalf of some of the world’s most prominent pension,endowment and sovereign wealth funds as well as other institutional and individual investors. Apollo is led by our Managing Partners, Leon Black, JoshuaHarris and Marc Rowan, who have worked together for more than 25 years and lead a team of 945 employees, including 353 investment professionals, as ofDecember 31, 2015.
Apollo conducts its management and incentive businesses primarily in the United States and substantially all of its revenues are generateddomestically. These businesses are conducted through the following three reportable segments:
(i) Private equity—primarily invests in control equity and related debt instruments, convertible securities and distresseddebt instruments;
(ii) Credit—primarily invests in non-control corporate and structured debt instruments including performing, stressed anddistressed instruments across the capital structure; and
(iii) Real estate—primarily invests in real estate equity for the acquisition and recapitalization of real estate assets, portfolios,platforms and operating companies, and real estate debt including first mortgage and mezzanine loans, preferred equityand commercial mortgage backed securities.
These business segments are differentiated based on the varying investment strategies. The performance is measured by management on anunconsolidated basis because management makes operating decisions and assesses the performance of each of Apollo’s business segments based on financialand operating metrics and data that exclude the effects of consolidation of any of the managed funds.
Our financial results vary since carried interest, which generally constitutes a large portion of the income we receive from the funds that wemanage, as well as the transaction and advisory fees that we receive, can vary significantly from quarter to quarter and year to year. As a result, we emphasizelong-term financial growth and profitability to manage our business.
In addition, the growth in our Fee-Generating AUM during the last year has primarily been in our credit segment. The average management feerate for these new credit products is at market rates for such products and in certain cases is below our historical rates. Also, due to the complexity of thesenew product offerings, the Company has incurred and will continue to incur additional costs associated with managing these products. To date, theseadditional costs have been offset by realized economies of scale and ongoing cost management.
- 75-

Table of Contents
As of December 31, 2015, we had total AUM of $170.1 billion across all of our businesses. More than 90% of our total AUM was in funds with acontractual life at inception of seven years or more, and 49% of such AUM was in permanent capital vehicles. On December 31, 2013, Fund VIII held a finalclosing raising a total of $17.5 billion in third-party capital and approximately $880 million of additional capital from Apollo and affiliated investors, and aso f December 31, 2015, Fund VIII had $13.0 billion of uncalled commitments remaining. Additionally, Fund VII held a final closing in December 2008,raising a total of $14.7 billion, and as of December 31, 2015, Fund VII had $2.5 billion of uncalled commitments remaining. We have consistently producedattractive long-term investment returns in our traditional private equity funds, generating a 39% gross IRR and a 25% net IRR on a compound annual basisfrom inception through December 31, 2015. Apollo’s traditional private equity funds’ depreciation was (0.2)% for the year ended December 31, 2015.
For our credit segment, total gross and net returns, excluding assets managed by Athene Asset Management that are not directly invested inApollo funds and investment vehicles or sub-advised by Apollo, were 1.3% and 0.3%, respectively, for the year ended December 31, 2015.
For our real estate segment, total gross and net returns for U.S. RE Fund I including co-investment capital were 16.3% and 12.0%, respectively,for the year ended December 31, 2015.
For further detail related to fund performance metrics across all of our businesses, see “—The Historical Investment Performance of Our Funds.”
Holding Company Structure
The diagram below depicts our current organizational structure:
Note: The organizational structure chart above depicts a simplified version of the Apollo structure. It does not include all legal entities in the structure. Ownership percentages are asof the date of the filing of this Annual Report on Form 10-K.
(1) The Strategic Investors hold 24.50% of the Class A shares outstanding and 11.25% of the economic interests in the Apollo Operating Group. The Class A shares heldby investors other than the Strategic Investors represent 39.08% of the total voting power of our shares entitled to vote and 34.68% of the economic interests in theApollo Operating Group. Class A shares held by the Strategic Investors do not have voting rights. However, such Class A shares will become entitled to vote upontransfers by a Strategic Investor in accordance with the agreements entered into in connection with the investments made by the Strategic Investors.
- 76-

Table of Contents
(2) Our Managing Partners own BRH Holdings GP, Ltd., which in turn holds our only outstanding Class B share. The Class B share represents 60.92% of the totalvoting power of our shares entitled to vote but no economic interest in Apollo Global Management, LLC. Our Managing Partners’ economic interests are insteadrepresented by their indirect beneficial ownership, through Holdings, of 48.12% of the limited partner interests in the Apollo Operating Group.
(3) Through BRH Holdings, L.P., our Managing Partners indirectly beneficially own through estate planning vehicles, limited partner interests in Holdings.(4) Holdings owns 54.07% of the limited partner interests in each Apollo Operating Group entity (“AOG Units”). The AOG Units held by Holdings are exchangeable for
Class A shares. Our Managing Partners, through their interests in BRH and Holdings, beneficially own 48.12% of the AOG Units. Our Contributing Partners,through their ownership interests in Holdings, beneficially own 5.95% of the AOG Units.
(5) BRH Holdings GP, Ltd. is the sole member of AGM Management, LLC, our manager. The management of Apollo Global Management, LLC is vested in our manageras provided in our operating agreement.
(6) Represents 45.93% of the limited partner interests in each Apollo Operating Group entity, held through intermediate holding companies. Apollo Global Management,LLC, also indirectly owns 100% of the general partner interests in each Apollo Operating Group entity.
Each of the Apollo Operating Group partnerships holds interests in different businesses or entities organized in different jurisdictions.
Our structure is designed to accomplish a number of objectives, the most important of which are as follows:
• We are a holding company that is qualified as a partnership for U.S. federal income tax purposes. Our intermediate holdingcompanies enable us to maintain our partnership status and to meet the qualifying income exception.
• We have historically used multiple management companies to segregate operations for business, financial and other reasons.Going forward, we may increase or decrease the number of our management companies or partnerships within the ApolloOperating Group based on our views regarding the appropriate balance between (a) administrative convenience and(b) continued business, financial, tax and other optimization.
Business Environment
As a global investment manager, we are affected by numerous factors, including the condition of financial markets and the economy. Pricefluctuations within equity, credit, commodity, foreign exchange markets, as well as interest rates, which may be volatile and mixed across geographies, cansignificantly impact the valuation of our funds' portfolio companies and related income we may recognize.
In terms of equity markets, 2015 was a more challenging year compared to the mixed backdrop in 2014. In the U.S., the S&P 500 Index declined0.7% during 2015 following an increase of 11.4% in 2014. Outside the U.S., global equity markets fell for the second consecutive year as measured by theMSCI All Country World ex USA Index, which declined 2.6% during 2015 after falling 3.9% in 2014.
Conditions in the credit markets also have a significant impact on our business, and in 2015, many indices reversed course from the gains seen in2014. The BofAML HY Master II Index declined 4.6% in 2015 following an increase of 2.5% in 2014. In addition, the S&P/LSTA Leveraged Loan Index fell0.7% in 2015 following an increase of 1.6% in 2014. Benchmark interest rates finished the year slightly up following the first increase in the federal fundsrate by the Federal Reserve in nearly a decade. As a result, the U.S. 10-year Treasury yield rallied 23 basis points in the fourth quarter to finish the year up 10basis points at 2.27%.
Foreign exchange rates can materially impact the valuations of our funds’ investments that are denominated in currencies other than the U.S.dollar. For example, relative to the U.S. dollar, the Euro depreciated 10.2% in 2015 after depreciating 12.0% in 2014, while the British pound depreciated5.4% in 2015 after depreciating 5.9% in 2014. Commodities generally saw price declines in 2015 after a particularly weak fourth quarter that was driven bydepreciation in oil. The price of crude oil declined 17.9% during the fourth quarter and 30.5% for the full year primarily due to oversupply dynamics.
In terms of economic conditions in the U.S., the Bureau of Economic Analysis reported real GDP increased at an annual rate of 2.4%, the samelevel growth observed in 2014. As of January 2016, The International Monetary Fund estimated that the U.S. economy will expand by 2.6% in 2016.Additionally, the U.S. unemployment rate continued to decline and stood at 5.0% as of December 31, 2015, compared to 5.1% as of September 30, 2015,marking the lowest level since April 2008.
- 77-

Table of Contents
Despite a more challenging equity and credit market backdrop in 2015 versus 2014, Apollo continued to generate realizations for fund investors.Apollo returned $1.9 billion and $8.5 billion of capital and realized gains to the investors in the funds it manages during the fourth quarter of 2015 and fullyear ended December 31, 2015, respectively. In general, institutional investors continue to allocate capital towards alternative investment managers for moreattractive risk-adjusted returns in a low interest rate environment, and we believe the business environment remains generally accommodative to launch newproducts and pursue attractive strategic growth opportunities. As such, Apollo had $12.3 billion and $23.7 billion of capital inflows during the fourth quarterof 2015 and full year ended December 31, 2015, respectively.
Regardless of the market or economic environment at any given time, Apollo relies on its contrarian, value-oriented approach to consistentlyinvest capital on behalf of its fund investors by focusing on opportunities that management believes are often overlooked by other investors. Apollo had $4.1billion and $13.1 billion of dollars invested during the fourth quarter of 2015 and full year ended December 31, 2015, respectively. We believe Apollo’sexpertise in credit and its focus on nine core industry sectors, combined with 25 years of investment experience, has allowed Apollo to respond quickly tochanging environments. Apollo’s core industry sectors include chemicals, natural resources, consumer and retail, distribution and transportation, financialand business services, manufacturing and industrial, media and cable and leisure, packaging and materials and the satellite and wireless industries. Apollobelieves that these attributes have contributed to the success of its private equity funds investing in buyouts and credit opportunities during bothexpansionary and recessionary economic periods.
Managing Business Performance
We believe that the presentation of Economic Income (Loss) (previously referred to as Economic Net Income), or “EI”, supplements a reader’sunderstanding of the economic operating performance of each of our segments.
Economic Income (Loss)
EI has certain limitations in that it does not take into account certain items included under U.S. GAAP. EI represents segment income (loss) beforeincome tax provision excluding transaction-related charges arising from the 2007 private placement, and any acquisitions. Transaction-related chargesinclude equity-based compensation charges, the amortization of intangible assets, contingent consideration and certain other charges associated withacquisitions. In addition, segment data excludes non-cash revenue and expense related to equity awards granted by unconsolidated affiliates to employees ofthe Company, as well as the assets, liabilities and operating results of the funds and VIEs that are included in the consolidated financial statements. Webelieve the exclusion of the non-cash charges related to the 2007 Reorganization for equity-based compensation provides investors with a meaningfulindication of our performance because these charges relate to the equity portion of our capital structure and not our core operating performance. EconomicNet Income (Loss) (previously referred to as ENI After Taxes), or “ENI”, represents EI adjusted to reflect income tax provision on EI that has been calculatedassuming that all income is allocated to Apollo Global Management, LLC, which would occur following an exchange of all AOG Units for Class A shares ofApollo Global Management, LLC. The economic assumptions and methodologies that impact the implied income tax provision are similar to thosemethodologies and certain assumptions used in calculating the income tax provision for Apollo’s consolidated statements of operations under U.S. GAAP.
We further evaluate EI based on what we refer to as our “management business” and “incentive business”. Our management business is generallycharacterized by the predictability of its financial metrics, including revenues and expenses. The management business includes management fee revenues,advisory and transaction fee revenues, carried interest income from one of our opportunistic credit funds and expenses, each of which we believe are morestable in nature. The financial performance of our incentive business is partially dependent upon quarterly mark-to-market unrealized valuations inaccordance with U.S. GAAP guidance applicable to fair value measurements. The incentive business includes carried interest income, income from equitymethod investments and profit sharing expense that are associated with our general partner interests in the Apollo funds, which are generally less predictableand more volatile in nature.
We believe that EI is helpful for an understanding of our business and that investors should review the same supplemental financial measure thatmanagement uses to analyze our segment performance. This measure supplements and should be considered in addition to and not in lieu of the results ofoperations discussed below in “—Overview of Results of Operations” that have been prepared in accordance with U.S. GAAP. See note 18 to the consolidatedfinancial statements for more details regarding management’s consideration of EI.
EI may not be comparable to similarly titled measures used by other companies and is not a measure of performance calculated in accordancewith U.S. GAAP. We use EI as a measure of operating performance, not as a measure of liquidity. EI should not be considered in isolation or as a substitute foroperating income, net income, operating cash flows, investing and
- 78-

Table of Contents
financing activities, or other income or cash flow statement data prepared in accordance with U.S. GAAP. The use of EI without consideration of related U.S.GAAP measures is not adequate due to the adjustments described above. Management compensates for these limitations by using EI as a supplementalmeasure to U.S. GAAP results, to provide a more complete understanding of our performance as management measures it. A reconciliation of EI to its mostdirectly comparable U.S. GAAP measure of income (loss) before income tax provision can be found in the notes to our financial statements.
During the first quarter of 2015, the Company redefined EI to exclude transaction-related charges related to contingent consideration associatedwith acquisitions, resulting in the following impact to our credit segment for the years ended December 31, 2014 and 2013:
Impact of Revised Definition on
Economic Income (Loss)(1)
Total EI as
Previously Reported Impact of Revised
Definition Total EI After
Revised DefinitionFor the Year Ended December 31, 2014 $ 755,546 $ (495) $ 755,051For the Year Ended December 31, 2013 2,127,651 61,449 2,189,100
(1) See note 18 to our consolidated financial statements for further detail regarding the impact of the revised definition on Economic Income (Loss).
Additionally, interest expense, net of interest income (“net interest expense”) was reallocated from the management business to the incentivebusiness to align with the earnings from our investments which are principally funded by our outstanding debt. This reallocation resulted in an increase inmanagement business EI and a corresponding decrease in incentive business EI for the years ended December 31, 2014 and 2013 in the amounts listed below:
Net Interest Expense Reclassification
Private Equity
Segment Credit Segment Real Estate
Segment Total Combined
SegmentsFor the Year Ended December 31, 2014 $ 7,883 $ 9,275 $ 1,941 $ 19,099For the Year Ended December 31, 2013 10,702 9,685 2,804 23,191
As it relates to the reclassification of net interest expense described above, the impact to the combined segments total Economic Income (Loss)for all periods presented was zero.
These changes have been made to prior period financial data to conform to the current period presentation.
Distributable Earnings
Distributable Earnings (“DE”), as well as DE After Taxes and Related Payables are derived from our segment reported results, and aresupplemental non-U.S. GAAP measures to assess performance and amounts available for distribution to Class A shareholders, holders of RSUs that participatein distributions and holders of AOG Units. DE represents the amount of net realized earnings without the effects of the consolidation of any of the affiliatedfunds. DE, which is a component of EI, is the sum across all segments of (i) total management fees and advisory and transaction fees, excluding monitoringfees received from Athene based on its capital and surplus (as defined in Apollo’s transaction advisory services agreement with Athene), (ii) other income(loss), excluding the gains (losses) arising from the reversal of a portion of the tax receivable agreement liability (iii) realized carried interest income, and (iv)realized investment income, less (x) compensation expense, excluding the expense related to equity-based awards, (y) realized profit sharing expense, and (z)non-compensation expenses, excluding depreciation and amortization expense. DE After Taxes and Related Payables represents DE less estimated currentcorporate, local and non-U.S. taxes as well as the payable under Apollo’s tax receivable agreement.
Fee-Related EBITDA
Fee-related EBITDA is a non-U.S. GAAP measure derived from our segment reported results and is used to assess the performance of ouroperations as well as our ability to service current and future borrowings. Fee-related EBITDA represents management business economic income (“EI”) plusamounts for equity-based compensation and depreciation and amortization. “Fee-related EBITDA +100% of net realized carried interest” represents fee-related EBITDA plus realized carried interest less realized profit sharing, combining operating results of the management business and incentive business.
- 79-

Table of Contents
Operating Metrics
We monitor certain operating metrics that are common to the alternative investment management industry. These operating metrics includeAssets Under Management, capital deployed and uncalled commitments.
Assets Under Management
Prior period AUM amounts previously not reported within Apollo’s three reporting segments have been recast based on expected deploymentacross each respective segment.
The table below presents Fee-Generating and Non-Fee-Generating AUM by segment as of December 31, 2015 and 2014:
As of December 31, 2015 2014
PrivateEquity Credit Real Estate Total
PrivateEquity Credit Real Estate Total
(in millions)Fee-Generating $ 29,258 $ 101,522 $ 7,317 $ 138,097 $ 30,285 $ 92,192 $ 6,237 $ 128,714Non-Fee-Generating 8,244 19,839 3,943 32,026 11,014 16,767 3,301 31,082
Total Assets Under Management $ 37,502 $ 121,361 $ 11,260 $ 170,123 $ 41,299 $ 108,959 $ 9,538 $ 159,796
The table below presents AUM with Future Management Fee Potential, which is a component of Non-Fee-Generating AUM, for each of Apollo’sthree segments as of December 31, 2015 and 2014.
As of December 31, 2015 2014 (in millions) Private Equity $ 2,093 $ 2,265Credit 5,763 5,118Real Estate 986 729
Total AUM with Future Management Fee Potential $ 8,842 $ 8,112
The following table presents the components of Carry-Eligible AUM for each of Apollo’s three segments as of December 31, 2015 and 2014:
As of December 31, 2015 2014
PrivateEquity Credit Real Estate Total
PrivateEquity Credit Real Estate Total
(in millions)Carry-Generating AUM $ 9,461 $ 16,923 $ 516 $ 26,900 $ 14,463 $ 16,218 $ 828 $ 31,509AUM Not Currently Generating Carry 6,793 21,583 865 29,241 2,500 14,243 965 17,708Uninvested Carry-Eligible AUM 16,528 8,701 1,059 26,288 19,413 8,552 821 28,786
Total Carry-Eligible AUM $ 32,782 $ 47,207 $ 2,440 $ 82,429 $ 36,376 $ 39,013 $ 2,614 $ 78,003
- 80-

Table of Contents
The following table presents AUM Not Currently Generating Carry for funds that have commenced investing capital for more than 24 months asof December 31, 2015 and the corresponding appreciation required to reach the preferred return or high watermark in order to generate carried interest:
Category / Fund
Invested AUM NotCurrently Generating
Carry Investment PeriodActive > 24 Months
Appreciation Requiredto Achieve Carry(1)
(in millions) Private Equity:
Fund VIII $ 5,001 $ 5,001 10%Other PE 1,792 $ 1,275 21%Total Private Equity 6,793 6,276 12%
Credit: Drawdown 5,181 4,070 25%
Liquid/Performing
16,402
1,257 < 250bps6,488 250-500bps1,175 > 500bps
Permanent capital vehicles ex Athene Non-Sub-Advised — — NMTotal Credit 21,583 12,990 11%
Real Estate: Total Real Estate 865 734 > 500bps
Total $ 29,241 $ 20,000
(1) All investors in a given fund are considered in aggregate when calculating the appreciation required to achieve carry presented above. Appreciation required to achievecarry may vary by individual investor.
The components of Fee-Generating AUM by segment as of December 31, 2015 and 2014 are presented below:
As of December 31, 2015
PrivateEquity Credit
RealEstate Total
(in millions)Fee-Generating AUM based on capital commitments $ 20,315 $ 5,787 $ 376 $ 26,478Fee-Generating AUM based on invested capital 8,094 3,860 4,180 16,134Fee-Generating AUM based on gross/adjusted assets 506 83,728 2,671 86,905Fee-Generating AUM based on NAV 343 8,147 90 8,580
Total Fee-Generating AUM $ 29,258 (1) $ 101,522 $ 7,317 $ 138,097 (1) The weighted average remaining life of the private equity funds excluding permanent capital vehicles at December 31, 2015
was 73 months.
As of December 31, 2014
PrivateEquity Credit
RealEstate Total
(in millions)Fee-Generating AUM based on capital commitments $ 20,080 $ 6,191 $ 173 $ 26,444Fee-Generating AUM based on invested capital 9,368 3,100 3,968 16,436Fee-Generating AUM based on gross/adjusted assets 837 75,585 1,961 78,383Fee-Generating AUM based on NAV — 7,316 135 7,451
Total Fee-Generating AUM $ 30,285 (1) $ 92,192 $ 6,237 $ 128,714
(1) The weighted average remaining life of the private equity funds excluding permanent capital vehicles at December 31, 2014was 72 months.
- 81-
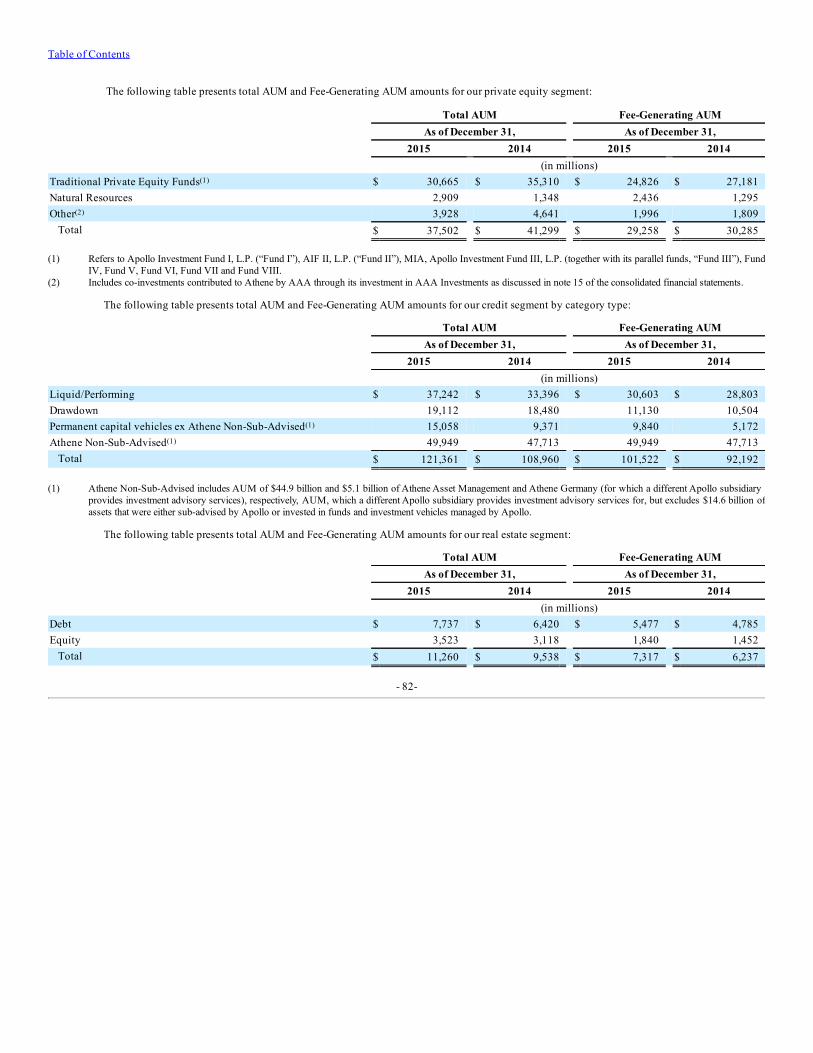
Table of Contents
The following table presents total AUM and Fee-Generating AUM amounts for our private equity segment:
Total AUM Fee-Generating AUM As of December 31, As of December 31, 2015 2014 2015 2014 (in millions)Traditional Private Equity Funds(1) $ 30,665 $ 35,310 $ 24,826 $ 27,181Natural Resources 2,909 1,348 2,436 1,295Other(2) 3,928 4,641 1,996 1,809
Total $ 37,502 $ 41,299 $ 29,258 $ 30,285 (1) Refers to Apollo Investment Fund I, L.P. (“Fund I”), AIF II, L.P. (“Fund II”), MIA, Apollo Investment Fund III, L.P. (together with its parallel funds, “Fund III”), Fund
IV, Fund V, Fund VI, Fund VII and Fund VIII.(2) Includes co-investments contributed to Athene by AAA through its investment in AAA Investments as discussed in note 15 of the consolidated financial statements.
The following table presents total AUM and Fee-Generating AUM amounts for our credit segment by category type:
Total AUM Fee-Generating AUM As of December 31, As of December 31, 2015 2014 2015 2014 (in millions)Liquid/Performing $ 37,242 $ 33,396 $ 30,603 $ 28,803Drawdown 19,112 18,480 11,130 10,504Permanent capital vehicles ex Athene Non-Sub-Advised(1) 15,058 9,371 9,840 5,172Athene Non-Sub-Advised(1) 49,949 47,713 49,949 47,713
Total $ 121,361 $ 108,960 $ 101,522 $ 92,192
(1) Athene Non-Sub-Advised includes AUM of $44.9 billion and $5.1 billion of Athene Asset Management and Athene Germany (for which a different Apollo subsidiaryprovides investment advisory services), respectively, AUM, which a different Apollo subsidiary provides investment advisory services for, but excludes $14.6 billion ofassets that were either sub-advised by Apollo or invested in funds and investment vehicles managed by Apollo.
The following table presents total AUM and Fee-Generating AUM amounts for our real estate segment:
Total AUM Fee-Generating AUM As of December 31, As of December 31, 2015 2014 2015 2014 (in millions)Debt $ 7,737 $ 6,420 $ 5,477 $ 4,785Equity 3,523 3,118 1,840 1,452
Total $ 11,260 $ 9,538 $ 7,317 $ 6,237
- 82-

Table of Contents
During the first quarter of 2015, the Company changed the presentation of the components of total AUM and Fee-Generating AUM to inflows,outflows, net flows, realizations and market activity as noted below. As such, prior periods were reclassified to conform with the current period presentation.The following tables summarize changes in total AUM for each of Apollo’s three segments for the years ended December 31, 2015 and 2014:
For the Years Ended December 31,
2015 2014
Private Equity Credit Real Estate Total PrivateEquity Credit Real Estate Total
(in millions)Change in Total AUM(1): Beginning of Period $ 41,299 $ 108,960 $ 9,538 $ 159,797 $ 50,158 $ 101,580 $ 9,439 $ 161,177
Inflows 2,299 18,201 3,188 23,688 4,078 11,676 2,067 17,821Outflows(2) (812) (3,769) (71) (4,652) (2,126) (2,507) (659) (5,292)
Net Flows 1,487 14,432 3,117 19,036 1,952 9,169 1,408 12,529Realizations (4,711) (2,182) (1,656) (8,549) (11,372) (3,457) (1,553) (16,382)Market Activity(3)(4) (573) 151 261 (161) 561 1,668 244 2,473
End of Period $ 37,502 $ 121,361 $ 11,260 $ 170,123 $ 41,299 $ 108,960 $ 9,538 $ 159,797
(1) At the individual segment level, inflows include new subscriptions, commitments, capital raised, other increases in available capital, purchases and acquisitions. Outflowsrepresent redemptions and other decreases in available capital. Realizations represent fund distributions of realized proceeds. Market activity represents gains (losses), the impactof foreign exchange rate fluctuations and other income.
(2) Outflows for Total AUM include redemptions of $626.8 million and $718.6 million during the years ended December 31, 2015 and 2014, respectively.(3) Includes foreign exchange impacts of $(162.4) million, $(403.7) million and $(136.1) million for private equity, credit and real estate, respectively, during the year ended
December 31, 2015.(4) Includes foreign exchange impacts of $(146.6) million, $(648.1) million and $(206.7) million for private equity, credit and real estate, respectively, during the year ended
December 31, 2014.
Assets Under Management
Total AUM was $170.1 billion at December 31, 2015, an increase of $10.3 billion, or 6.5%, compared to $159.8 billion at December 31, 2014.The net increase was primarily due to:
Net inflows of $19.0 billion primarily related to:• a $14.4 billion increase related to funds we manage in the credit segment primarily consisting of subscriptions of $6.0 billion, acquisitions of $7.4
billion primarily attributable to the acquisition of Delta Lloyd Deutschland by Athene Holding of $5.1 billion, and a net change in leverage of $2.0billion;
• a $1.5 billion increase related to funds we manage in the private equity segment consisting of subscriptions of $1.9 billion, driven by subscriptionsattributable to ANRP II of $1.5 billion, offset by net segment transfers of $0.2 billion and a change in leverage of $0.3 billion; and
• a $3.1 billion increase related to funds we manage in the real estate segment primarily consisting of subscriptions of $1.2 billion, net segmenttransfers of $1.0 billion and a change in leverage of $0.4 billion.
Offsetting these increases were:
Realizations of $8.5 billion primarily related to:• $4.7 billion related to funds we manage in the private equity segment primarily consisting of distributions of $4.1 billion attributable to certain
traditional private equity funds;• $2.2 billion related to funds we manage in the credit segment primarily consisting of distributions of $1.1 billion and $0.8 billion in
liquid/performing and drawdown funds, respectively; and• $1.7 billion related to funds we manage in the real estate segment primarily consisting of distributions of $0.9 billion from our real estate debt funds
and $0.3 billion related to the CPI funds.
Market activity of $0.2 billion related to:• $0.6 billion of depreciation in the funds we manage in the private equity segment;• $0.3 billion of appreciation in the funds we manage in the real estate segment; and• $0.2 billion of appreciation in the funds we manage in the credit segment
- 83-

Table of Contents
Total AUM was $159.8 billion at December 31, 2014, a decrease of $1.4 billion or 0.9%, compared to $161.2 billion at December 31, 2013. Thenet decrease was due to:
Realizations of $16.4 billion primarily related to:• $11.4 billion related to funds we manage in the private equity segment primarily consisting of distributions of $10.1 billion attributable to certain
traditional private equity funds;• $3.5 billion related to funds we manage in the credit segment consisting of distributions of $1.7 billion attributable to certain drawdown funds; and• $1.6 billion related to funds we manage in the real estate segment consisting of distributions of $0.7 billion from our real estate debt funds and $0.4
billion related to the CPI funds.
Offsetting these decreases were:
Net inflows of $12.5 billion primarily related to:• a $9.2 billion increase related to funds we manage in the credit segment primarily consisting of subscriptions of $6.1 billion and a net change in
leverage of $3.5 billion;• a $2.0 billion increase related to funds we manage in the private equity segment consisting of subscriptions of $3.0 billion, offset by net segment
transfers of $1.2 billion; and• a $1.4 billion increase related to funds we manage in the real estate segment primarily consisting of net segment transfers of $1.1 billion and
subscriptions of $0.7 billion, offset by a net change in leverage of $0.2 billion.
Market activity of $2.5 billion related to:• $1.7 billion of appreciation in the funds we manage in the credit segment;• $0.6 billion of appreciation in the funds we manage in the private equity segment; and• $0.2 billion of appreciation in the funds we manage in the real estate segment.
The following tables summarize changes in Fee-Generating AUM for each of Apollo’s three segments for the years ended December 31, 2015 and2014:
For the Years Ended December 31,
2015 2014
PrivateEquity Credit Real Estate Total
PrivateEquity Credit Real Estate Total
(in millions)Change in Fee-Generating AUM(1): Beginning of Period $ 30,285 $ 92,192 $ 6,237 $ 128,714 $ 34,173 $ 88,249 $ 5,946 $ 128,368
Inflows 2,610 14,702 2,639 19,951 498 7,967 1,816 10,281Outflows(2) (794) (4,328) (249) (5,371) (1,928) (2,143) (30) (4,101)
Net Flows 1,816 10,374 2,390 14,580 (1,430) 5,824 1,786 6,180Realizations(3) (2,839) (1,664) (1,328) (5,831) (2,457) (2,258) (1,470) (6,185)Market Activity(4) (4) 620 18 634 (1) 377 (25) 351
End of Period $ 29,258 $ 101,522 $ 7,317 $ 138,097 $ 30,285 $ 92,192 $ 6,237 $ 128,714
(1) At the individual segment level, inflows include new subscriptions, commitments, capital raised, other increases in available capital, purchases and acquisitions. Outflowsrepresent redemptions and other decreases in available capital. Realizations represent fund distributions of realized proceeds. Market activity represents gains (losses), the impactof foreign exchange rate fluctuations and other income.
(2) Outflows for Fee-Generating AUM include redemptions of $594.6 million and $474.6 million during the years ended December 31, 2015 and 2014, respectively.(3) Includes foreign exchange impacts of $(324.2) million and $(71.6) million for credit and real estate, respectively, during the year ended December 31, 2015.(4) Includes foreign exchange impacts of $(404.6) million and $(115.0) million for credit and real estate, respectively, during the year ended December 31, 2014.
Total Fee-Generating AUM was $138.1 billion at December 31, 2015, an increase of $9.4 billion or 7.3%, compared to $128.7 billion atDecember 31, 2014. The net increase was primarily due to:
Net inflows of $14.6 billion primarily related to:• a $10.4 billion increase related to funds we manage in the credit segment primarily consisting of fee-generating capital deployment of $5.1 billion,
an increase of $5.1 billion attributable to the acquisition of Delta Lloyd Deutschland by Athene
- 84-

Table of Contents
Holding and subscriptions of $1.7 billion. This was partially offset by $0.6 billion of redemptions and $1.1 billion of net segment transfers;• a $1.8 billion increase related to funds we manage in the private equity segment consisting of $1.4 billion of subscriptions attributable to ANRP II
and $0.5 billion of fee-generating capital deployment. Offsetting these increases was a change in leverage of $0.1 billion; and• a $2.4 billion increase related to funds we manage in the real estate segment consisting of $1.1 billion of fee-generating capital commitments from
the Athene Accounts, $0.6 billion of acquisitions and $0.3 billion of subscriptions.
Market activity of $0.6 billion primarily related to appreciation in the funds we manage in the credit segment.
Offsetting these increases were:
Realizations of $5.8 billion primarily related to:• $2.8 billion related to funds we manage in the private equity segment primarily driven by distributions of $2.6 billion from certain traditional
private equity funds;• $1.7 billion related to funds we manage in the credit segment primarily driven by certain of our liquid/performing funds, including returns to CLO
investors, and distributions of $0.3 billion from permanent capital vehicles; and• $1.3 billion related to funds we manage in the real estate segment primarily driven by distributions in the CPI funds and Athene Accounts of $0.3
billion and $0.4 billion, respectively.
Total Fee-Generating AUM was $128.7 billion at December 31, 2014, an increase of $0.3 billion or 0.3%, compared to $128.4 billion at December 31, 2013.The net increase was due to:
Net inflows of $6.2 billion primarily related to:• a $5.8 billion increase related to funds we manage in the credit segment primarily consisting of an increase of $2.8 billion resulting from a change in
net leverage, subscriptions of $2.3 billion and fee-generating capital deployment of $1.1 billion. This was partially offset by redemptions of $0.5billion;
• a $1.8 billion increase related to funds we manage in the real estate segment consisting of $1.1 billion of fee-generating capital commitments fromthe Athene Accounts and $0.6 billion of subscriptions; and
• a $1.4 billion decrease related to funds we manage in the private equity segment consisting of net segment transfers out of $1.3 billion attributableto traditional private equity funds.
Market activity of $0.4 billion primarily related to appreciation in the funds we manage in the credit segment.
Offsetting these increases were:
Realizations of $6.2 billion primarily related to:• $2.5 billion related to funds we manage in the private equity segment primarily driven by distributions of $2.1 billion from certain traditional
private equity funds;• $2.3 billion related to funds we manage in the credit segment primarily driven by certain of our liquid/performing funds and distributions of $0.3
billion from permanent capital vehicles; and• $1.5 billion decrease related to funds we manage in the real estate segment primarily driven by distributions in the CPI funds and Athene Accounts
of $0.6 billion and $0.4 billion, respectively.
Capital Deployed and Uncalled Commitments
Capital deployed is the aggregate amount of capital that has been invested during a given period by our drawdown funds, SIAs that have adefined maturity date and funds and SIAs in our real estate debt strategy. Uncalled commitments, by contrast, represents unfunded capital commitments thatcertain of Apollo’s funds and SIAs have received from fund investors to fund future or current fund investments and expenses.
Capital deployed and uncalled commitments are indicative of the pace and magnitude of fund capital that is deployed or will be deployed, andwhich therefore could result in future revenues that include management fees, transaction fees and incentive income to the extent fee-generating. Capitaldeployed and uncalled commitments can also give rise to future costs that are related to the hiring of additional resources to manage and account for theadditional capital that is deployed or will be deployed. Management uses capital deployed and uncalled commitments as key operating metrics since webelieve the results measure our fund’s investment activities.
- 85-

Table of Contents
Capital Deployed
The following table summarizes by segment the capital deployed for funds and SIAs with a defined maturity date and certain funds and SIAs inApollo’s real estate debt strategy during the specified reporting periods:
For the Year Ended December 31, 2015 2014 2013 (in millions)Private Equity $ 5,144 $ 2,163 $ 2,561Credit 5,531 5,174 2,865Real Estate (1) 2,458 2,686 2,534
Total capital deployed $ 13,133 $ 10,023 $ 7,960
(1) Included in capital deployed is $2,140 million, $2,320 million and $2,177 million for the years ended December 31, 2015, 2014 and 2013, respectively, related to funds inApollo’s real estate debt strategy.
Uncalled Commitments
The following table summarizes the uncalled commitments by segment during the specified reporting periods:.
As of December 31, 2015 2014 (in millions)Private Equity $ 19,487 $ 22,633Credit 8,557 9,212Real Estate 984 997Total Uncalled Commitments(1) $ 29,028 $ 32,842
(1) As of December 31, 2015 and 2014, $26.1 billion and $29.3 billion, respectively, represented the amount of capital available for investment or reinvestment subject to theprovisions of the applicable limited partnership agreements or other governing agreements of our funds.
The Historical Investment Performance of Our Funds
Below we present information relating to the historical performance of our funds, including certain legacy Apollo funds that do not have ameaningful amount of unrealized investments, and in respect of which the general partner interest has not been contributed to us.
When considering the data presented below, you should note that the historical results of our funds are not indicative of the future results thatyou should expect from such funds, from any future funds we may raise or from your investment in our Class A shares.
An investment in our Class A shares is not an investment in any of the Apollo funds, and the assets and revenues of our funds are not directlyavailable to us. The historical and potential future returns of the funds we manage are not directly linked to returns on our Class A shares. Therefore, youshould not conclude that continued positive performance of the funds we manage will necessarily result in positive returns on an investment in our Class Ashares. However, poor performance of the funds that we manage would cause a decline in our revenue from such funds, and would therefore have a negativeeffect on our performance and in all likelihood the value of our Class A shares.
Moreover, the historical returns of our funds should not be considered indicative of the future results you should expect from such funds or fromany future funds we may raise. There can be no assurance that any Apollo fund will continue to achieve the same results in the future.
- 86-

Table of Contents
Finally, our private equity IRRs have historically varied greatly from fund to fund. For example, Fund IV generated a 12% gross IRR and a 9%net IRR since its inception through December 31, 2015, while Fund V generated a 61% gross IRR and a 44% net IRR since its inception throughDecember 31, 2015. Accordingly, the IRR going forward for any current or future fund may vary considerably from the historical IRR generated by anyparticular fund, or for our private equity funds as a whole. Future returns will also be affected by the applicable risks, including risks of the industries andbusinesses in which a particular fund invests. See “Item 1A. Risk Factors—Risks Related to Our Businesses—The historical returns attributable to our fundsshould not be considered as indicative of the future results of our funds or of our future results or of any returns expected on an investment in our Class Ashares.”
Investment Record
The following table summarizes the investment record by segment of Apollo’s significant drawdown funds and SIAs that have a defined maturitydate in which investors make a commitment to provide capital at the formation of such funds and deliver capital when called as investment opportunitiesbecome available. The funds included in the investment record table below have greater than $500 million of AUM and/or form part of a flagship series offunds. The SIAs included in the investment record table below have greater than $200 million of AUM and did not predominantly invest in other Apollofunds or SIAs.
All amounts are as of December 31, 2015, unless otherwise noted:
As of
December 31, 2015
($ in millions) Vintage
Year Total AUM Committed
Capital Total Invested
Capital(1) RealizedValue(1)
RemainingCost(1)
UnrealizedValue(1) Total Value(1)
GrossIRR(1)
NetIRR(1)
Private Equity: Fund VIII 2013 $ 18,398 $ 18,377 $ 4,858 $ 151 $ 4,724 $ 5,034 $ 5,185 11 % (6)% Fund VII 2008 7,757 14,677 15,809 28,478 3,923 4,500 32,978 35 27 Fund VI 2006 4,092 10,136 12,457 17,946 3,560 3,349 21,295 12 10 Fund V 2001 373 3,742 5,192 12,681 154 114 12,795 61 44 Fund I, II, III, IV & MIA(3) Various 46 7,320 8,753 17,398 — 31 17,429 39 26
Traditional Private Equity Funds(4) $ 30,666 $ 54,252 $ 47,069 $ 76,654 $ 12,361 $ 13,028 $ 89,682 39 % 25 % AION 2013 751 826 277 89 227 173 262 14 % (4)% ANRP I 2012 1,193 1,323 917 213 773 738 951 2 (3) ANRP II(5) — 1,716 1,731 239 14 226 213 227 NM (2) NM (2)
Total Private Equity(10) $ 34,326 $ 58,132 $ 48,502 $ 76,970 $ 13,587 $ 14,152 $ 91,122 Credit:
Credit Opportunity Funds COF III 2014 $ 3,038 $ 3,426 $ 3,211 $ 711 $ 2,435 $ 1,876 $ 2,587 (17)% (18)% COF I & II 2008 439 3,068 3,787 7,349 150 154 7,503 23 20
European Principal Finance Funds EPF II(6) 2012 3,760 3,412 3,268 1,166 2,101 2,848 4,014 19 9 EPF I(6) 2007 512 1,412 1,855 2,820 25 332 3,152 23 17
Structured Credit Funds FCI II 2013 2,201 1,555 1,432 342 1,278 1,439 1,781 23 17 FCI 2012 985 559 1,089 645 768 799 1,444 16 12 SCRF III (13) 2015 1,043 1,238 1,025 189 692 813 1,002 NM (2) NM (2)
SCRF I & II (13) Various 11 222 706 871 8 11 882 27 21 Other Drawdown Funds & SIAs(7) Various 4,297 5,920 5,886 6,068 1,652 1,195 7,263 9 7
Total Credit(11) $ 16,286 $ 20,812 $ 22,259 $ 20,161 $ 9,109 $ 9,467 $ 29,628 Real Estate:
U.S. RE Fund II(5) — $ 398 $ 395 $ 251 $ 9 $ 247 $ 252 $ 261 NM (2) NM (2)
U.S. RE Fund I(8) 2012 595 640 614 461 325 411 872 18 % 14 % AGRE Debt Fund I 2011 915 1,390 1,275 796 686 665 1,461 8 7 CPI Funds(9) Various 1,183 4,927 2,494 2,483 373 206 2,689 17 13
Total Real Estate(12)
$ 3,091
$ 7,352
$ 4,634
$ 3,749
$ 1,631
$ 1,534
$ 5,283
(1) Refer to the definitions of Total Invested Capital, Realized Value, Remaining Cost, Unrealized Value, Total Value, Gross IRR and Net IRR described elsewhere in this report.(2) Returns have not been presented as the fund commenced investing capital less than 24 months prior to the period indicated and therefore such return information was deemed
not meaningful.
- 87-

Table of Contents
(3) The general partners and managers of Funds I, II and MIA, as well as the general partner of Fund III, were excluded assets in connection with the 2007 Reorganization. As aresult, Apollo did not receive the economics associated with these entities. The investment performance of these funds, combined with Fund IV, is presented to illustrate fundperformance associated with Apollo’s Managing Partners and other investment professionals.
(4) Total IRR is calculated based on total cash flows for all funds presented.(5) ANRP II and U.S. RE Fund II were launched prior to December 31, 2015 and have not established their vintage year.(6) Funds are denominated in Euros and historical figures are translated into U.S. dollars at an exchange rate of €1.00 to $1.09 as of December 31, 2015.(7) Amounts presented have been aggregated for (i) drawdown funds with AUM greater than $500 million that do not form part of a flagship series of funds and (ii) SIAs with
AUM greater than $200 million that do not predominantly invest in other Apollo funds or SIAs. Certain SIAs’ historical figures are denominated in Euros and translated intoU.S. dollars at an exchange rate of €1.00 to $1.09 as of December 31, 2015. Additionally, certain SIAs totaling $1.4 billion of AUM have been excluded from Total InvestedCapital, Realized Value, Remaining Cost, Unrealized Value and Total Value. These SIAs have an open ended life and a significant turnover in their portfolio assets due to theability to recycle capital. These SIAs had $8.3 billion of Total Invested Capital through December 31, 2015.
(8) U.S. RE Fund I, a closed-end private investment fund, has $150 million of co-investment commitments raised, which are included in the figures in the table. A co-invest entitywithin U.S. RE Fund I is denominated in GBP and translated into U.S. dollars at an exchange rate of £1.00 to $1.47 as of December 31, 2015.
(9) As part of the acquisition of Citi Property Investors (“CPI”), Apollo acquired general partner interests in fully invested funds. CPI Funds refers to CPI Capital Partners NorthAmerica, CPI Capital Partners Asia Pacific, CPI Capital Partners Europe and other CPI funds or individual investments of which Apollo is not the general partner or managerand only receives fees pursuant to either a sub-advisory agreement or an investment management and administrative agreement. For CPI Capital Partners North America, CPICapital Partners Asia Pacific and CPI Capital Partners Europe, the gross and net IRRs are presented in the investment record table since acquisition on November 12, 2010. Theaggregate net IRR for these funds from their inception to December 31, 2015 was (1)%. This net IRR was primarily achieved during a period in which Apollo did not make theinitial investment decisions and Apollo only became the general partner or manager of these funds upon completing the acquisition on November 12, 2010.
(10) Certain private equity co-investment vehicles and funds with AUM less than $500 million have been excluded. These co-investment vehicles and funds had $3.2 billion ofaggregate AUM as of December 31, 2015.
(11) Certain credit funds and SIAs with AUM less than $500 million and $200 million, respectively, have been excluded. These funds and SIAs had $2.8 billion of aggregate AUMas of December 31, 2015.
(12) Certain accounts owned by or related to Athene, certain co-investment vehicles and certain funds with AUM less than $500 million have been excluded. These accounts, co-investment vehicles and funds had $5.3 billion of aggregate AUM as of December 31, 2015.
(13) Remaining cost for certain of our credit funds may include physical cash called, invested or reserved for certain levered investments.
Private Equity
The following table summarizes the investment record for distressed investments made in our traditional private equity fund portfolios, since theCompany’s inception. All amounts are as of December 31, 2015:
Total Invested
Capital Total Value Gross IRR (in millions) Distressed for Control $ 6,778 $ 17,999 29%Non-Control Distressed 6,171 8,445 71
Total 12,949 26,444 49Corporate Carve-outs, Opportunistic Buyouts and Other Credit(1) 34,120 63,238 22
Total $ 47,069 $ 89,682 39% (1) Other Credit is defined as investments in debt securities of issuers other than portfolio companies that are not considered to be distressed.
- 88-

Table of Contents
The following tables provide additional detail on the composition of the Fund VIII, Fund VII, Fund VI and Fund V private equity portfoliosbased on investment strategy. Amounts for Fund I, II, III and IV are included in the table above but not presented below as their remaining value is less than$100 million or the fund has been liquidated. All amounts are as of December 31, 2015:
Fund VIII(1)
Total Invested
Capital Total Value (in millions)Corporate Carve-outs $ 2,189 $ 2,118Opportunistic Buyouts 2,339 2,789Distressed 330 278Total $ 4,858 $ 5,185
Fund VII(1)
Total Invested
Capital Total Value (in millions)Corporate Carve-outs $ 2,298 $ 5,466Opportunistic Buyouts 4,095 9,366Distressed/Other Credit(2) 9,416 18,146Total $ 15,809 $ 32,978
Fund VI
Total Invested
Capital Total Value (in millions)Corporate Carve-outs $ 3,216 $ 3,943Opportunistic Buyouts 6,555 12,412Distressed/Other Credit(2) 2,686 4,940Total $ 12,457 $ 21,295
Fund V
Total Invested
Capital Total Value (in millions)Corporate Carve-outs $ 1,605 $ 4,966Opportunistic Buyouts 2,165 5,332Distressed 1,422 2,497Total $ 5,192 $ 12,795
(1) Committed capital less unfunded capital commitments for Fund VIII and Fund VII was $5.4 billion and $13.7 billion, respectively, which represents capital commitments
from limited partners to invest in such funds less capital that is available for investment or reinvestment subject to the provisions of the applicable limited partnershipagreement or other governing agreements.
(2) The Distressed investment strategy includes include distressed for control, non-control distressed and other credit.
During the recovery and expansionary periods of 1994 through 2000 and late 2003 through the first half of 2007, our private equity fundsinvested or committed to invest approximately $13.7 billion primarily in traditional and corporate partner buyouts. During the recessionary periods of 1990through 1993, 2001 through late 2003 and the recessionary and post recessionary periods (beginning the second half of 2007 through December 31, 2015),our private equity funds have invested $36.3 billion, of which $18.2 billion was in distressed buyouts and debt investments when the debt securities ofquality companies traded at deep
- 89-

Table of Contents
discounts to par value. Our average entry multiple for Fund VIII, VII, VI and V was 6.1x, 6.1x, 7.7x and 6.6x, respectively, as of the date of the filing of thisAnnual Report on Form 10-K. Our average entry multiple for a private equity fund is the average of the total enterprise value over an applicable adjustedearnings before interest, taxes, depreciation and amortization (“EBITDA”) which may incorporate certain adjustments based on investment team’s estimateand we believe captures the true economics of our funds’ investments in portfolio companies.
Credit
The following table presents the AUM and gross and net returns information for Apollo’s credit segment by category type, excluding assetsmanaged by Athene Asset Management that are not directly invested in Apollo funds and investment vehicles or sub-advised by Apollo:
As of December 31, 2015 Gross Returns Net Returns
Category AUM
Fee-Generating
AUM Carry-Eligible
AUM
Carry-Generating
AUM
For the Year EndedDecember 31,
2015(1)
For the Year EndedDecember 31,
2015(1)
(in millions) Liquid/Performing $ 37,242 $ 30,603 $ 21,820 $ 3,751 1.7% 1.3%
Drawdown(2) 19,112 11,130 16,681 5,171 (1.3) (2.8)
Permanent capital vehicles ex Athene Non-Sub-Advised(3) 15,058 9,840 8,706 8,001 4.1 0.1
Athene Non-Sub-Advised(3) 49,949 49,949 — — N/A N/A
Total Credit $ 121,361 $ 101,522 $ 47,207 $ 16,923 1.3% 0.3%
(1) The gross and net returns for the year ended December 31, 2015 for total credit excludes assets managed by AAM that are not directly invested in Apollo funds and investmentvehicles or sub-advised by Apollo.
(2) As of December 31, 2015, significant drawdown funds and strategic investment accounts (“SIAs”) had inception-to-date gross and net IRRs of 16.3% and 12.5%, respectively.Significant drawdown funds and SIAs include funds and SIAs with AUM greater than $200 million that do not predominantly invest in other Apollo funds or SIAs.
(3) Athene Non-Sub-Advised includes $44.9 billion and $5.1 billion of AUM of Athene Asset Management and Athene Germany (for which a different Apollo subsidiary providesinvestment advisory services), respectively, but excludes $14.6 billion of AUM that was either sub-advised by Apollo or invested in funds and investment vehicles managed byApollo.
Liquid/PerformingThe following table summarizes the investment record for funds in the liquid/performing category within Apollo’s credit segment. The
significant funds included in the investment record table below have greater than $200 million of AUM and do not predominantly invest in other Apollofunds or SIAs.
Net Returns
Vintage
Year Total AUM For the Year EndedDecember 31, 2015
For the Year EndedDecember 31, 2014
Credit: (in millions) Hedge Funds(1) Various $ 7,109 — 3%
CLOs(2) Various 13,437 2% 2
SIAs / Other(3) Various 15,797 1 3
Total $ 36,343
(1) Hedge funds includes Apollo Credit Strategies Master Fund Ltd., Apollo Credit Master Fund Ltd., Apollo Credit Short Opportunities Fund and Apollo Value Strategic Fund,L.P.
(2) CLO returns are calculated based on gross return on invested assets, which excludes cash.(3) SIAs / Other excludes $0.9 billion of AUM related to advisory assets under management.
- 90-

Table of Contents
Permanent Capital
The following table summarizes the investment record for our permanent capital vehicles, excluding assets managed by AAA, Athene AssetManagement and Athene Germany, by segment:
Total Returns(1)
IPO Year (2) Total AUM For the Year EndedDecember 31, 2015
For the Year EndedDecember 31, 2014
Credit: (in millions) MidCap(3) N/A $ 5,233 NM (4) N/A AIF 2013 369 (4)% NM (4)
AFT 2011 413 (2) (1)% AMTG(5) 2011 3,844 (13) 19 AINV(6) 2004 5,699 (20) (4) Real Estate: ARI(7) 2009 $ 2,654 17 % 11 % Totals $ 18,212
(1) Total returns are based on the change in closing trading prices during the respective periods presented taking into account dividends and distributions, if any, as if they werereinvested without regard to commission.
(2) IPO year represents the year in which the vehicle commenced trading on a national securities exchange.(3) MidCap is not a publicly traded vehicle and therefore IPO year is not applicable.(4) Returns have not been presented as the Permanent Capital Vehicle commenced investing capital less than 24 months prior to the period indicated and therefore such return
information was deemed not meaningful.(5) All amounts are as of September 30, 2015 except for total returns. Refer to www.apolloresidentialmortgage.com for the most recent financial information on AMTG. The
information contained on AMTG’s website is not part of this report.(6) All amounts are as of September 30, 2015 except for total returns. Refer to www.apolloic.com for the most recent financial information on AINV. The information contained
on AINV’s website is not part of this report. Includes $1.4 billion of AUM related to a non-traded business development company sub-advised by Apollo. Total returns excludeperformance of the non-traded business development company.
(7) All amounts are as of September 30, 2015 except for total returns. Refer to www.apolloreit.com for the most recent financial information on ARI. The information contained onARI's website is not part of this report.
Athene and SIAs
As of December 31, 2015, Athene Asset Management had $59.5 billion of total AUM in accounts owned by or related to Athene, of whichapproximately $14.6 billion, was either sub-advised by Apollo or invested in Apollo funds and investment vehicles. Of the approximately $14.6 billion ofAUM, the vast majority were in sub-advisory managed accounts that manage high grade credit asset classes, such as CLO debt, commercial mortgage backedsecurities, and insurance-linked securities. As of December 31, 2015, Athene Germany had $5.1 billion of total AUM , for which a different Apollo subsidiaryprovides investment advisory services.
As of December 31, 2015, Apollo managed approximately $17 billion of total AUM in SIAs, which include certain SIAs in the investment recordtables above and capital deployed from certain SIAs across Apollo’s private equity, credit, and real estate funds.
Overview of Results of Operations
Revenues
Advisory and Transaction Fees from Affiliates, Net. As a result of providing advisory services with respect to actual and potential private equity,credit, and real estate investments, we are entitled to receive fees for transactions related to the acquisition and, in certain instances, disposition of portfoliocompanies as well as fees for ongoing monitoring of portfolio company operations and directors’ fees. We also receive advisory fees for advisory servicesprovided to certain credit funds. In addition, monitoring fees are generated on certain structured portfolio company investments. Under the terms of thelimited partnership agreements for certain funds, the management fee payable by the funds may be subject to a reduction based on a certain percentage ofsuch advisory and transaction fees, net of applicable broken deal costs (“Management Fee Offset”). Such amounts are presented
- 91-
Table of Contents
as a reduction to advisory and transaction fees from affiliates, net, in the consolidated statements of operations. See note 2 to our consolidated financialstatements for more detail.
The Management Fee Offsets are calculated for each fund as follows:
• 65%-100% for private equity funds, gross advisory, transaction and other special fees;
• 65%-100% for certain credit funds, gross advisory, transaction and other special fees; and
• 100% for certain real estate funds, gross advisory, transaction and other special fees.
Additionally, during the normal course of business, the Company incurs certain costs related to certain transactions that are not consummated(“broken deal costs”). These costs (e.g., research costs, due diligence costs, professional fees, legal fees and other related items) are determined to be brokendeal costs upon management’s decision to no longer pursue the transaction. In accordance with the related fund agreement, in the event the deal is deemedbroken, all of the costs are reimbursed by the funds and then included as a component of the calculation of the Management Fee Offset. If a deal issuccessfully completed, Apollo is reimbursed by the fund or fund’s portfolio company for all costs incurred and no offset is generated.
As the Company acts as an agent for the funds it manages, any transaction costs incurred and paid by the Company on behalf of the respectivefunds relating to successful or broken deals are presented net on the Company’s consolidated statements of operations, and any receivable from the respectivefunds is presented in Due from Affiliates on the consolidated statements of financial condition.
Management Fees from Affiliates. The significant growth of the assets we manage has had a positive effect on our revenues. Management feesare typically calculated based upon any of “net asset value,” “gross assets,” “adjusted par asset value,” “adjusted costs of all unrealized portfolioinvestments,” “capital commitments,” “invested capital,” “adjusted assets,” “capital contributions,” or “stockholders’ equity,” each as defined in theapplicable limited partnership agreement and/or management agreement of the unconsolidated funds.
Carried Interest Income from Affiliates. The general partners of our funds, in general, are entitled to an incentive return that can normallyamount to as much as 20% of the total returns on fund capital, depending upon performance of the underlying funds and subject to preferred returns and highwater marks, as applicable. The carried interest income from affiliates is recognized in accordance with U.S. GAAP guidance applicable to accounting forarrangement fees based on a formula. In applying the U.S. GAAP guidance, the carried interest from affiliates for any period is based upon an assumedliquidation of the funds’ assets at the reporting date, and distribution of the net proceeds in accordance with the funds’ allocation provisions.
As of December 31, 2015, approximately 60% of the value of our funds’ investments on a gross basis was determined using market-basedvaluation methods (i.e., reliance on broker or listed exchange quotes) and the remaining 40% was determined primarily by comparable company and industrymultiples or discounted cash flow models. For our private equity, credit and real estate segments, the percentage determined using market-based valuationmethods as of December 31, 2015 was 27%, 74% and 47%, respectively. See “Item 1A. Risk Factors—Risks Related to Our Businesses—Our private equityfunds’ performance, and our performance, may be adversely affected by the financial performance of our funds’ portfolio companies and the industries inwhich our funds invest” for a discussion regarding certain industry-specific risks that could affect the fair value of our private equity funds’ portfoliocompany investments.
Carried interest income fee rates can be as much as 20% for our private equity funds. In our private equity funds, the Company does not earncarried interest income until the investors in the fund have achieved cumulative investment returns on invested capital (including management fees andexpenses) in excess of an 8% hurdle rate. Additionally, certain of our credit and real estate funds have various carried interest rates and hurdle rates. Certain ofour credit and real estate funds allocate carried interest to the general partner in a similar manner as the private equity funds. In our private equity, certaincredit and real estate funds, so long as the investors achieve their priority returns, there is a catch-up formula whereby the Company earns a priority return fora portion of the return until the Company’s carried interest income equates to its incentive fee rate for that fund; thereafter, the Company participates inreturns from the fund at the carried interest income rate. Carried interest income is subject to reversal to the extent that the carried interest income distributedexceeds the amount due to the general partner based on a fund’s cumulative investment returns. The Company recognizes potential repayment of previouslyreceived carried interest income as a general partner obligation representing all amounts previously distributed to the general partner that would need to berepaid to the Apollo funds if these funds were to be liquidated based on the current fair value of the underlying funds’ investments as of the reporting date.The actual general partner obligation, however, would not become payable or realized until the end of a fund’s life or as otherwise set forth in the respectivelimited partnership agreement of the fund.
- 92-

Table of Contents
The table below presents an analysis of Apollo’s (i) carried interest receivable on an unconsolidated basis and (ii) realized and unrealized carriedinterest income (loss) for Apollo’s combined segments’ incentive business as of December 31, 2015 and 2014 and for the years ended December 31, 2015,2014 and 2013:
As of
December 31, 2015 As of December 31, 2014 For the Year Ended December 31, 2015 For the Year Ended December 31, 2014 For the Year Ended December 31, 2013
Carried Interest Receivable on an
Unconsolidated Basis
UnrealizedCarriedInterest
Income (Loss)
RealizedCarriedInterest
Income (Loss)
TotalCarriedInterest
Income (Loss)
UnrealizedCarriedInterest
Income (Loss)
RealizedCarriedInterestIncome
TotalCarriedInterest
Income (Loss)
UnrealizedCarriedInterest
Income (Loss)
RealizedCarriedInterestIncome
TotalCarriedInterest
Income (Loss)
(in thousands) Private Equity Funds:
Fund VII(1)$ 68,733 $ 288,182 $ (219,449) $ 229,679 $ 10,230 $ (602,615) $ 902,421 $ 299,806 $ (13,458) $ 1,163,399 $ 1,149,941
Fund VI(1)52,561 183,422 (130,861) 78,812 (52,049) (514,122) 401,449 (112,673) 427,281 760,345 1,187,626
Fund V— (3) 3,169 (3) (13,947) — (13,947) (39,880) 44,850 4,970 (91,202) 99,131 7,929
Fund IV6,196 5,636 560 640 1,200 (2,093) — (2,093) (3,173) 1,736 (1,437)
AAA/Other(2) 246,381 (3) 191,511 (3) 49,536 30,691 80,227 (37,383) 79,356 41,973 135,274 37,913 173,187
Total Private Equity Funds 373,871 671,920 (314,161) 339,822 25,661 (1,196,093) 1,428,076 231,983 454,722 2,062,524 2,517,246
Total Private Equity Funds, net of profitshare 254,888 431,305 (184,903) 163,992 (20,911) (693,146) 746,756 53,610 307,047 1,179,795 1,486,842
Credit Category: Drawdown
163,863 (3) 182,606 (3) (69,127) 70,970 1,843 (93,140) 216,044 122,904 (71,707) 291,676 219,969
Liquid/Performing48,933 73,679 (21,808) 27,557 5,749 (63,504) 64,990 1,486 15,139 101,662 116,801
Permanent capital vehicles ex AAM28,048 10,502 10,401 40,625 51,026 — — — — — —
Total Credit Funds240,844 266,787 (80,534) 139,152 58,618 (156,644) 281,034 124,390 (56,568) 393,338 336,770
Total Credit Funds, net of profit share75,472 80,501 (70,171) 94,405 24,234 (141,285) 181,887 40,602 (43,032) 298,525 255,493
Real Estate Funds: CPI Funds
1,379 1,521 (240) 2,496 2,256 (3,809) 640 (3,169) (5,207) 542 (4,665)
U.S. RE Fund I20,728 11,448 7,547 1,981 9,528 5,817 2,663 8,480 5,631 — 5,631
Other7,085 7,184 (153) 1,380 1,227 2,943 696 3,639 4,256 — 4,256
Total Real Estate Funds29,192 20,153 7,154 5,857 13,011 4,951 3,999 8,950 4,680 542 5,222
Total Real Estate Funds, net of profit share17,873 12,203 4,186 3,750 7,936 3,953 2,250 6,203 4,971 128 5,099
Total$ 643,907 $ 958,860 $ (387,541) $ 484,831 $ 97,290 $ (1,347,786) $ 1,713,109 $ 365,323 $ 402,834 $ 2,456,404 $ 2,859,238
Total, net of profit share$ 348,233 (4) $ 524,009 (4) $ (250,888) $ 262,147 $ 11,259 $ (830,478) $ 930,893 $ 100,415 $ 268,986 $ 1,478,448 $ 1,747,434
(1) As of December 31, 2015, the remaining investments and escrow cash of Fund VII and Fund VI were valued at 106% and 95% of the fund’s unreturned capital, respectively,which were below the required escrow ratio of 115%. As a result, these funds are required to place in escrow current and future carried interest income distributions to thegeneral partner until the specified return ratio of 115% is met (at the time of a future distribution) or upon liquidation. As of December 31, 2015, Fund VI had $167.6 millionof gross carried interest income, or $110.7 million net of profit sharing, in escrow. Of these amounts, assuming a hypothetical liquidation on December 31, 2015, $52.6 millionof gross carried interest, or $34.7 million net of profit sharing, would be paid to the general partner. As of December 31, 2015, Fund VII had no carried interest held in escrow.With respect to Fund VI, realized carried interest income currently distributed to the general partner is limited to tax distributions per the fund’s partnership agreement. As ofDecember 31, 2014, the remaining investments and escrow cash of Fund VI were valued at 104% of the funds unreturned capital, which was below the required escrow ratio of115%. As a result, Fund VI was required to place in escrow current and future carried interest income distributions to the general partner until the specified return ratio of 115%is met (at the time of a future distribution) or upon liquidation of Fund VI. As of December 31, 2014, Fund VI had $165.6 million of gross carried interest income, or $109.4million net of profit sharing, in escrow. Of these amounts, assuming a hypothetical liquidation on December 31, 2014, $183.4 million of gross carried interest, or $121.1million net of profit sharing, would be paid to the general partner.
(2) As of December 31, 2015, AAA includes $185.5 million of carried interest receivable, or $122.6 million net of profit sharing, from AAA Investments, and as of December 31,2014, AAA includes $121.5 million of carried interest receivable, or $86.6 million net of profit sharing, from AAA Investments, which will be paid in common shares ofAthene Holding (valued at the then fair market value) if there is a distribution in kind of shares of Athene Holding (unless such payment in shares would violate Section 16(b)of the U.S. Securities Exchange Act of 1934, as amended), or paid in cash if AAA sells the shares of Athene Holding. In addition, Other includes certain SIAs.
(3) As of December 31, 2015, Fund V, Apollo Asia Private Credit Fund, L.P. (“APC”), ANRP I, Apollo Credit Liquidity Fund, L.P. (“ACLF”), COF II, and certain SIAs within thecredit segment had $10.8 million, $2.1 million, $3.4 million, $25.6 million, $0.4 million, and $29.7 million, respectively, in general partner obligations to return previouslydistributed carried interest income. The fair value gain on investments and income at the fund level needed to reverse the general partner obligations in Fund V, APC, ANRP I,ACLF, COF II, and certain SIAs within the credit segment was $71.7 million, $12.3 million, $217.5 million, $64.5 million, $5.1 million, and $191.5 million, respectively, as ofDecember 31, 2015. As of December 31, 2014, Other SIAs and ACLF had $0.9 million and $2.5 million, respectively, in general partner obligations to return previouslydistributed carried interest income. The fair value gain on investments and income at the fund level needed to reverse the general partner obligations in Other SIAs and ACLFwas $2.2 million and $7.0 million, respectively, as of December 31, 2014.
(4) As of December 31, 2015 and 2014, there was a corresponding profit sharing payable of $295.7 million and $434.9 million, respectively, including profit sharing payablerelated to amounts in escrow and contingent consideration obligations of $79.6 million and $96.1 million, respectively.
The general partners of the private equity, credit and real estate funds listed in the table above were accruing carried interest income as ofDecember 31, 2015. The investment manager of AINV accrues carried interest in the management company
- 93-

Table of Contents
business as it is earned. The general partners of certain of our credit funds accrue carried interest when the fair value of investments exceeds the cost basis ofthe individual investors’ investments in the fund, including any allocable share of expenses incurred in connection with such investments, which we refer toas “high water marks.” These high water marks are applied on an individual investor basis. Certain of our credit funds have investors with various high watermarks, the achievement of which are subject to market conditions and investment performance.
Carried interest income from our private equity funds and certain credit and real estate funds is subject to contingent repayment by the generalpartner in the event of future losses to the extent that the cumulative carried interest distributed from inception to date exceeds the amount computed as dueto the general partner at the final distribution. These general partner obligations, if applicable, are included in due to affiliates on the consolidated statementsof financial condition. As of December 31, 2015 and 2014, there was $72.0 million and $3.4 million, respectively, of such general partner obligations relatedto our funds. Carried interest receivable is reported on a separate line item within the consolidated statements of financial condition.
The following table summarizes our carried interest income since inception for our combined segments through December 31, 2015:
Carried Interest Income Since Inception (1)
Undistributedby Fund andRecognized
Distributed byFund and
Recognized (2)
TotalUndistributed
andDistributed by
Fund andRecognized(3)
General PartnerObligation as of
December 31,2015(3)
Maximum CarriedInterest Income
Subject toPotential Reversal(4)
(in millions)Private Equity Funds:
Fund VII $ 68.7 $ 3,091.8 $ 3,160.5 $ — $ 611.0Fund VI 52.6 1,658.9 1,711.5 — 1,165.2Fund V — 1,455.0 1,455.0 10.8 17.1Fund IV 6.2 597.8 604.0 — 6.2AAA/Other 246.4 170.8 417.2 5.5 248.5Total Private Equity Funds 373.9 6,974.3 7,348.2 16.3 2,048.0
Credit Category(5): Drawdown 163.9 896.2 1,060.1 55.7 250.6Liquid/Performing 48.9 398.6 447.5 — 62.2Permanent capital vehicles ex AAM 10.4 — 10.4 — 10.4Total Credit Funds 223.2 1,294.8 1,518.0 55.7 323.2
Real Estate Funds: CPI Funds 1.4 8.3 9.7 — 2.5U.S. RE Fund I 20.7 2.9 23.6 — 20.7Other 7.1 1.8 8.9 — 5.8Total Real Estate Funds 29.2 13.0 42.2 — 29.0Total $ 626.3 $ 8,282.1 $ 8,908.4 $ 72.0 $ 2,400.2
(1) Certain funds are denominated in Euros and historical figures are translated into U.S. dollars at an exchange rate of €1.00 to $1.09 as of December 31, 2015.(2) Amounts in “Distributed by Fund and Recognized” for the CPI, Gulf Stream and Stone Tower funds and SIAs are presented for activity subsequent to the respective
acquisition dates.(3) Amounts were computed based on the fair value of fund investments on December 31, 2015. Carried interest income has been allocated to and recognized by the general
partner. Based on the amount of carried interest income allocated, a portion is subject to potential reversal or, to the extent applicable, has been reduced by the generalpartner obligation to return previously distributed carried interest income or fees at December 31, 2015. The actual determination and any required payment of any suchgeneral partner obligation would not take place until the final disposition of the fund’s investments based on contractual termination of the fund.
(4) Represents the amount of carried interest income that would be reversed if remaining fund investments became worthless on December 31, 2015. Amounts subject topotential reversal of carried interest income include amounts undistributed by a fund (i.e., the carried interest receivable), as well as a portion of the amounts that havebeen distributed by a fund, net of taxes not subject to a general partner obligation to return previously distributed carried interest income, except for those funds that aregross of taxes as defined in the respective funds’ management agreement.
(5) Amounts exclude AINV, as carried interest income from this entity is not subject to contingent repayment.
- 94-

Table of Contents
Expenses
Compensation and Benefits. Our most significant expense is compensation and benefits expense. This consists of fixed salary, discretionary andnon-discretionary bonuses, profit sharing expense associated with the carried interest income earned from private equity, credit and real estate funds andcompensation expense associated with the vesting of non-cash equity-based awards.
Our compensation arrangements with certain partners and employees contain a significant performance-based incentive component. Therefore, asour net revenues increase, our compensation costs also rise or can be lower when net revenues decrease. In addition, our compensation costs reflect theincreased investment in people as we expand geographically and create new funds.
In addition, certain professionals and selected other individuals have a profit sharing interest in the carried interest income earned in relation toour private equity, certain credit and real estate funds in order to better align their interests with our own and with those of the investors in these funds. Profitsharing expense is part of our compensation and benefits expense and is generally based upon a fixed percentage of private equity, credit and real estatecarried interest income on a pre-tax and a pre-consolidated basis. Profit sharing expense can reverse during periods when there is a decline in carried interestincome that was previously recognized. Profit sharing amounts are normally distributed to employees after the corresponding investment gains have beenrealized and generally before preferred returns are achieved for the investors. Therefore, changes in our unrealized gains (losses) for investments have thesame effect on our profit sharing expense. Profit sharing expense increases when unrealized gains increase. Realizations only impact profit sharing expense tothe extent that the effects on investments have not been recognized previously. If losses on other investments within a fund are subsequently realized, theprofit sharing amounts previously distributed are normally subject to a general partner obligation to return carried interest income previously distributedback to the funds. This general partner obligation due to the funds would be realized only when the fund is liquidated, which generally occurs at the end ofthe fund’s term. However, indemnification obligations also exist for pre-reorganization realized gains, which, although our Managing Partners andContributing Partners would remain personally liable, may indemnify our Managing Partners and Contributing Partners for 17.5% to 100% of the previouslydistributed profits regardless of the fund’s future performance. See note 15 to our consolidated financial statements for further discussion of indemnification.
Each Managing Partner receives $100,000 per year in base salary for services rendered to us. Additionally, our Managing Partners can receiveother forms of compensation. In connection with the 2007 Reorganization, the Managing Partners and Contributing Partners received AOG Units with avesting period of five to six years (all of which have fully vested) and certain employees were granted RSUs with a vesting period of typically six years (all ofwhich have also fully vested). Managing Partners, Contributing Partners and certain employees have also been granted AAA restricted depositary units(“RDUs”) , or incentive units that provide the right to receive AAA RDUs, which both represent common units of AAA and generally vest over three years foremployees and are fully-vested for Managing Partners and Contributing Partners on the grant date. In addition, AHL Awards (as defined in note 14 to ourconsolidated financial statements) and other equity-based compensation awards have been granted to the Company and certain employees, which amortizeover the respective vesting periods. In addition, the Company grants equity awards to certain employees, including RSUs, restricted Class A shares andoptions, that generally vest and become exercisable in quarterly installments or annual installments depending on the contract terms over a period of three tosix years. See note 14 to our consolidated financial statements for further discussion of AOG Units and other equity-based compensation.
Other Expenses. The balance of our other expenses includes interest, professional fees, placement fees, occupancy, depreciation and amortizationand other general operating expenses. Interest expense consists primarily of interest related to the 2007 AMH Credit Agreement, the 2013 AMH CreditFacilities and the 2024 Senior Notes as discussed in note 12 to our consolidated financial statements. Placement fees are incurred in connection with ourcapital raising activities. Occupancy expense represents charges related to office leases and associated expenses, such as utilities and maintenance fees.Depreciation and amortization of fixed assets is normally calculated using the straight-line method over their estimated useful lives, ranging from two tosixteen years, taking into consideration any residual value. Leasehold improvements are amortized over the shorter of the useful life of the asset or theexpected term of the lease. Intangible assets are amortized based on the future cash flows over the expected useful lives of the assets. Other general operatingexpenses normally include costs related to travel, information technology and administration.
Other Income (Loss)
Net Gains (Losses) from Investment Activities. The performance of the consolidated Apollo funds has impacted our net gains (losses) frominvestment activities. Net gains (losses) from investment activities include both realized gains and losses and the change in unrealized gains and losses in ourinvestment portfolio between the opening reporting date and the closing reporting date. Net unrealized gains (losses) are a result of changes in the fair valueof unrealized investments and reversal of unrealized gains (losses) due to dispositions of investments during the reporting period. Prior to the adoption ofnew accounting
- 95-

Table of Contents
guidance effective January 1, 2015, for results of AAA, a portion of the net gains (losses) from investment activities were attributable to Non-ControllingInterests in the consolidated statements of operations. Significant judgment and estimation goes into the assumptions that drive these models and the actualvalues realized with respect to investments could be materially different from values obtained based on the use of those models. The valuationmethodologies applied impact the reported value of investment company holdings and their underlying portfolios in our consolidated financial statements.
Net Gains (Losses) from Investment Activities of Consolidated Variable Interest Entities. Changes in the fair value of the consolidated VIEs’assets and liabilities and related interest, dividend and other income and expenses subsequent to consolidation are presented within net gains (losses) frominvestment activities of consolidated variable interest entities and are attributable to Non-Controlling Interests in the consolidated statements of operations.
Other Income (Losses), Net. Other income (losses), net includes gains (losses) arising from the remeasurement of foreign currency denominatedassets and liabilities of foreign subsidiaries, reversal of a portion of the tax receivable agreement liability (see note 15 to our consolidated financialstatements), gains (losses) arising from the remeasurement of derivative instruments associated with fees from certain of the Company’s affiliates and othermiscellaneous non-operating income and expenses.
Income Taxes . The Apollo Operating Group and its subsidiaries generally operate as partnerships for U.S. federal income tax purposes. As aresult, except as described below, the Apollo Operating Group has not been subject to U.S. income taxes. However, these entities in some cases are subject toNew York City Unincorporated Business Tax (“NYC UBT”), and non-U.S. entities, in some cases, are subject to non-U.S. corporate income taxes. In addition,APO Corp., a wholly-owned subsidiary of the Company, is subject to U.S. federal, state and local corporate income tax, and the Company’s provision forincome taxes is accounted for in accordance with U.S. GAAP.
Significant judgment is required in determining tax expense and in evaluating tax positions, including evaluating uncertainties. We recognizethe tax benefits of uncertain tax positions only where the position is “more likely than not” to be sustained upon examination, including resolutions of anyrelated appeals or litigation, based on the technical merits of the position. The tax benefit is measured as the largest amount of benefit that has a greater than50% likelihood of being realized upon ultimate settlement. If a tax position is not considered more likely than not to be sustained, then no benefits of theposition are recognized. The Company’s tax positions are reviewed and evaluated quarterly to determine whether or not we have uncertain tax positions thatrequire financial statement recognition.
Deferred tax assets and liabilities are recognized for the expected future tax consequences of differences between the carrying amount of assetsand liabilities and their respective tax basis using currently enacted tax rates. The effect on deferred tax assets and liabilities of a change in tax rates isrecognized in income in the period when the change is enacted. Deferred tax assets are reduced by a valuation allowance when it is more likely than not thatsome portion or all of the deferred tax assets will not be realized.
Non-Controlling Interests
For entities that are consolidated, but not 100% owned, a portion of the income or loss and corresponding equity is allocated to owners otherthan Apollo. The aggregate of the income or loss and corresponding equity that is not owned by the Company is included in Non-Controlling Interests in theconsolidated financial statements. The Non-Controlling Interests relating to Apollo Global Management, LLC primarily include the 54.4% and 57.7%ownership interest in the Apollo Operating Group held by the Managing Partners and Contributing Partners through their limited partner interests inHoldings as of December 31, 2015 and 2014, respectively. Non-Controlling Interests also include limited partner interests in certain consolidated funds andVIEs.
The authoritative guidance for Non-Controlling Interests in the consolidated financial statements requires reporting entities to present Non-Controlling Interest as equity and provides guidance on the accounting for transactions between an entity and Non-Controlling Interests. According to theguidance, (1) Non-Controlling Interests are presented as a separate component of shareholders’ equity on the Company’s consolidated statements of financialcondition, (2) net income (loss) includes the net income (loss) attributable to the Non-Controlling Interest holders on the Company’s consolidated statementsof operations, (3) the primary components of Non-Controlling Interest are separately presented in the Company’s consolidated statements of changes inshareholders’ equity to clearly distinguish the interests in the Apollo Operating Group and other ownership interests in the consolidated entities and(4) profits and losses are allocated to Non-Controlling Interests in proportion to their ownership interests regardless of their basis.
- 96-

Table of Contents
Results of Operations
Below is a discussion of our consolidated results of operations for the years ended December 31, 2015, 2014 and 2013. For additional analysis ofthe factors that affected our results at the segment level, see “—Segment Analysis” below:
For the Year Ended December 31, AmountChange
PercentageChange
For the Year Ended December 31, AmountChange
Percentage
Change 2015(1) 2014 2014 2013 Revenues: (in thousands) (in thousands) Advisory and transaction fees from affiliates, net $ 14,186 $ 315,587 $ (301,401) (95.5)% $ 315,587 $ 196,562 $ 119,025 60.6 %
Management fees from affiliates 930,194 850,441 79,753 9.4 % 850,441 674,634 175,807 26.1 %
Carried interest income from affiliates 97,290 394,055 (296,765) (75.3)% 394,055 2,862,375 (2,468,320) (86.2)%
Total Revenues 1,041,670 1,560,083 (518,413) (33.2)% 1,560,083 3,733,571 (2,173,488) (58.2)%
Expenses: Compensation and benefits:
Salary, bonus and benefits 354,524 338,049 16,475 4.9 % 338,049 294,753 43,296 14.7 %
Equity-based compensation 97,676 126,320 (28,644) (22.7)% 126,320 126,227 93 0.1 %
Profit sharing expense 85,229 276,190 (190,961) (69.1)% 276,190 1,173,255 (897,065) (76.5)%
Total Compensation and Benefits 537,429 740,559 (203,130) (27.4)% 740,559 1,594,235 (853,676) (53.5)%
Interest expense 30,071 22,393 7,678 34.3 % 22,393 29,260 (6,867) (23.5)%
General, administrative and other 102,255 97,663 4,592 4.7 % 97,663 98,202 (539) (0.5)%
Professional fees 68,113 82,030 (13,917) (17.0)% 82,030 83,407 (1,377) (1.7)%
Occupancy 40,219 40,427 (208) (0.5)% 40,427 39,946 481 1.2 %
Placement fees 8,414 15,422 (7,008) (45.4)% 15,422 42,424 (27,002) (63.6)%
Depreciation and amortization 44,474 45,069 (595) (1.3)% 45,069 54,241 (9,172) (16.9)%
Total Expenses 830,975 1,043,563 (212,588) (20.4)% 1,043,563 1,941,715 (898,152) (46.3)%
Other Income: Net gains from investment activities 121,723 213,243 (91,520) (42.9)% 213,243 330,235 (116,992) (35.4)%
Net gains from investment activities of consolidated variable interestentities 19,050 22,564 (3,514) (15.6)% 22,564 199,742 (177,178) (88.7)%
Income from equity method investments 14,855 53,856 (39,001) (72.4)% 53,856 107,350 (53,494) (49.8)%
Interest income 3,232 10,392 (7,160) (68.9)% 10,392 12,266 (1,874) (15.3)%
Other income, net 7,673 60,592 (52,919) (87.3)% 60,592 40,114 20,478 51.0 %
Total Other Income (Loss) 166,533 360,647 (194,114) (53.8)% 360,647 689,707 (329,060) (47.7)%
Income before income tax provision 377,228 877,167 (499,939) (57.0)% 877,167 2,481,563 (1,604,396) (64.7)%
Income tax provision (26,733) (147,245) 120,512 (81.8)% (147,245) (107,569) (39,676) 36.9 %
Net Income 350,495 729,922 (379,427) (52.0)% 729,922 2,373,994 (1,644,072) (69.3)%
Net income attributable to Non-controlling Interests (215,998) (561,693) 345,695 (61.5)% (561,693) (1,714,603) 1,152,910 (67.2)%
Net Income Attributable to Apollo GlobalManagement, LLC $ 134,497 $ 168,229 $ (33,732) (20.1)% $ 168,229 $ 659,391 $ (491,162) (74.5)%
(1) Apollo adopted new U.S. GAAP consolidation and collateralized financing entity (“CFE”) guidance during the year ended December 31, 2015 which resulted in thedeconsolidation of certain funds as of January 1, 2015 and a measurement alternative of the financial assets and liabilities of the remaining consolidated CLOs. See note 2to the consolidated financial statements for details regarding the Company’s adoption of the new consolidation and CFE guidance.
Revenues
Our revenues and other income include fixed components that result from measures of capital and asset valuations and variable components thatresult from realized and unrealized investment performance, as well as the value of successfully completed transactions.
Year Ended December 31, 2015 Compared to Year Ended December 31, 2014
Advisory and transaction fees from affiliates, net, decreased by $301.4 million for the year ended December 31, 2015 as compared to the yearended December 31, 2014. This change was primarily attributable to a decrease in monitoring fees from Athene of $224.5 million as a result of thetermination of the Athene Services Agreement (as described in note 15 to the consolidated financial statements) as of December 31, 2014, a decrease in netadvisory and transaction fees earned with respect to Fund VII of $26.6 million and a legal reserve in connection with an ongoing SEC regulatory matterrecorded during the year ended December 31, 2015.
- 97-

Table of Contents
Management fees from affiliates increased by $79.8 million for the year ended December 31, 2015 as compared to the year ended December 31,2014. This change was primarily attributable to the adoption of new consolidation guidance which led to the deconsolidation of certain funds and CLOs asof January 1, 2015 as described in notes 2 and 5 to the consolidated financial statements. As a result of the adoption of new consolidation guidance,eliminations of management fees of consolidated CLOs decreased by $59.2 million during the year ended December 31, 2015 as compared to the year endedDecember 31, 2014. The change in management fees from affiliates was also driven by an increase in management fees in relation to the AHL Awards of $7.0million granted to the Company’s employees, which are liability awards that are marked-to-market based on the valuation of Athene (see note 14 to theconsolidated financial statements).
Carried interest income from affiliates decreased by $296.8 million for the year ended December 31, 2015 as compared to the year endedDecember 31, 2014. This change was primarily attributable to decreases in carried interest income from the private equity and credit segments of $206.3million and $107.0 million, respectively, offset by an increase in carried interest income from the real estate segment of $4.1 million during the year endedDecember 31, 2015 as compared to the same period in 2014. For additional details regarding changes in carried interest income in each segment, see “—Segment Analysis” below.
Year Ended December 31, 2014 Compared to Year Ended December 31, 2013
Advisory and transaction fees from affiliates, net, increased by $119.0 million for the year ended December 31, 2014 as compared to the yearended December 31, 2013. This change was attributable to an increase in the credit segment of $140.5 million offset by a decrease in the private equitysegment of $20.1 million. The increase in the credit segment was primarily attributable to an increase in monitoring fees from Athene of $118.5 million as aresult of Athene's acquisition of U.S. annuity operations of Aviva plc (“Aviva USA”). The decrease in the private equity segment was primarily attributable tolower net advisory fees due to the realization of underlying investments, termination fees and waived fees related to debt investment vehicles, Taminco,Realogy and Caesars Entertainment that occurred during the year ended December 31, 2013 and lower net transaction fees earned for the year endedDecember 31, 2014 compared to 2013. Advisory and transaction fees are reported net of Management Fee Offsets as calculated under the terms of theapplicable limited partnership agreements. See “—Overview of Results of Operations—Revenues—Advisory and Transaction Fees from Affiliates, Net” for adescription of how the Management Fee Offsets are calculated.
Management fees from affiliates increased by $175.8 million for the year ended December 31, 2014 as compared to the year ended December 31,2013. This change was primarily attributable to an increase in management fees earned by our credit and private equity segments of $146.3 million and $30.2million, respectively. The primary driver of the increase in management fees earned from the credit funds was an increase in management fees earned fromAthene of $126.1 million during the year ended December 31, 2014 as compared to the same period in 2013 as a result of Athene's acquisition of Aviva USA.The primary driver of the increase in management fees earned from the private equity funds was an increase in management fees earned from Fund VIII in theamount of $126.4 million during the year ended December 31, 2014, partially offset by decreased management fees earned from Fund VII of $92.9 million asa result of a change in the management fee rate and basis upon which management fees are earned from capital commitments to invested capital, due to thefund coming to the end of the fund's investment period.
Carried interest income from affiliates decreased by $2.5 billion for the year ended December 31, 2014 as compared to the year ended December31, 2013. This change was primarily attributable to a decrease in carried interest loss from the private equity segment of $2.3 billion, a decrease in carriedinterest income earned from the credit segment of $208.1 million and an increase in carried interest income from the real estate segment of $3.7 millionduring the year ended December 31, 2014 as compared to the same period in 2013. For additional details regarding changes in carried interest income in eachsegment, see “—Segment Analysis” below.
Expenses
Year Ended December 31, 2015 Compared to Year Ended December 31, 2014
Compensation and benefits decreased by $203.1 million for the year ended December 31, 2015 as compared to the year ended December 31,2014. This change was primarily attributable to a decrease in profit sharing expense of $191.0 million due to lower carried interest income during the yearended December 31, 2015 as compared to the same period in 2014. In any year the blended profit sharing percentage is impacted by the respective profitsharing ratios of the funds generating carried interest in the period. Equity-based compensation decreased $28.6 million during the year ended December 31,2015 as compared to the same period in 2014 primarily due to non-cash expense of $45.6 million incurred in connection with the departure of an executiveofficer during the year ended December 31, 2014. This decrease was offset by additional expense incurred in relation to the AHL Awards granted to theCompany’s employees, which are liability awards that are marked to market based on the valuation of Athene (see note 14 to the consolidated financialstatements) during the year ended December 31, 2015. The decrease in profit sharing
- 98-

Table of Contents
expense and equity-based compensation were offset by an increase in salary, bonus and benefits of $16.5 million during the year ended December 31, 2015as a result of an increase in headcount after December 31, 2014.
Included within profit sharing expense was $62.1 million and $62.0 million related to the Incentive Pool for the years ended December 31, 2015and 2014, respectively. Included in the Incentive Pool is a fixed component which was $1.6 million and $6.5 million for the years ended December 31, 2015and 2014, respectively. The Incentive Pool is separate from the fund related profit sharing expense and may result in greater variability in compensation andhave a variable impact on the blended profit sharing percentage during a particular quarter. See “—Profit Sharing Expense” in the Critical AccountingPolicies section for an overview of the Incentive Pool.
Interest expense increased by $7.7 million for the year ended December 31, 2015 as compared to the year ended December 31, 2014 as a result ofthe issuance of the 2024 Senior Notes in May, 2014, as described in note 12 to our consolidated financial statements.
General, administrative and other fees increased by $4.6 million for the year ended December 31, 2015 as compared to the year ended December31, 2014 primarily due to a legal reserve in connection with an ongoing SEC regulatory matter recorded during the year ended December 31, 2015, offset bylower technology expenses during the year ended December 31, 2015 as compared to the same period in 2014.
Professional fees decreased by $13.9 million for the year ended December 31, 2015 as compared to the year ended December 31, 2014. Thischange was primarily attributable to lower consulting fees during the year ended December 31, 2015 as compared to the same period in 2014.
Placement fees decreased by $7.0 million for the year ended December 31, 2015 as compared to the year ended December 31, 2014. Placementfees are incurred in connection with raising capital for new and existing funds. The fees are normally payable to placement agents, who are third parties thatassist in identifying potential investors, securing commitments to invest from such potential investors, preparing or revising offering marketing materials,developing strategies for attempting to secure investments by potential investors and/or providing feedback and insight regarding issues and concerns ofpotential investors. This change was primarily attributable to placement fees with respect to COF III of $6.3 million during the year ended December 31, 2014that did not recur during the year ended December 31, 2015.
Year Ended December 31, 2014 Compared to Year Ended December 31, 2013
Compensation and benefits decreased by $853.7 million for the year ended December 31, 2014 as compared to the year ended December 31,2013. This change was primarily attributable to a decrease in profit sharing expense of $897.1 million due to lower carried interest income during the yearended December 31, 2014 as compared to the year ended December 31, 2013. In any year the blended profit sharing percentage is impacted by the respectiveprofit sharing ratios of the funds that are generating carried interest in the period. During the year ended December 31, 2014, the fair value of Fund VII’sunderlying fund investments appreciated while Fund VI's underlying fund investments depreciated, which contributed to an increased profit sharingpercentage compared to the year ended December 31, 2013. The decrease in profit sharing expense was offset by an increase in salary, bonus and benefits of$43.3 million during the year ended December 31, 2014.
Included within profit sharing expense was $62.0 million and $62.4 million related to the Incentive Pool for the years ended December 31, 2014and 2013, respectively. Included in the Incentive Pool is a fixed component which was $6.5 million and $8.0 million, for the years ended December 31, 2014and 2013, respectively. The Incentive Pool is separate from the fund related profit sharing expense and may result in greater variability in compensation andhave a variable impact on the blended profit sharing percentage during a particular quarter.
Interest expense decreased by $6.9 million for the year ended December 31, 2014 as compared to the year ended December 31, 2013. This changewas primarily attributable to a lower margin rate incurred from the 2013 AMH Credit Facilities as compared to the 2007 AMH Credit Agreement during theyear ended December 31, 2014 as compared to the same period in 2013 (see note 12 to our consolidated financial statements).
Placement fees decreased by $27.0 million for the year ended December 31, 2014 as compared to the year ended December 31, 2013. Placementfees are incurred in connection with the raising of capital for new and existing funds. The fees are normally payable to placement agents, who are third partiesthat assist in identifying potential investors, securing commitments to invest from such potential investors, preparing or revising offering marketingmaterials, developing strategies for attempting to secure investments by potential investors and/or providing feedback and insight regarding issues andconcerns of potential investors. This change was primarily attributable to decreases in placement fees with respect to EPF II and Fund VIII of $14.1 millionand $13.2 million, respectively, during the year ended December 31, 2014 as compared to the same period in 2013.
- 99-

Table of Contents
Depreciation and amortization expense decreased by $9.2 million for the year ended December 31, 2014 as compared to the year endedDecember 31, 2013. This change was primarily attributable to lower amortization of intangible assets during the year ended December 31, 2014 as comparedto the year ended December 31, 2013 as certain intangible assets were fully amortized in 2014.
Other Income (Loss)
Year Ended December 31, 2015 Compared to Year Ended December 31, 2014
Net gains from investment activities decreased by $91.5 million for the year ended December 31, 2015 as compared to the year ended December31, 2014. This change was primarily attributable to net gains from investment activities with respect to AAA of $204.6 million during the year endedDecember 31, 2014 that did not recur during the year ended December 31, 2015 as a result of the deconsolidation of AAA effective January 1, 2015. (See note2 to the consolidated financial statements for details regarding the Company’s adoption of the new consolidation guidance.) This was offset by an unrealizedgain on the Company’s investment in Athene of $122.4 million during the year ended December 31, 2015.
Income from equity method investments decreased by $39.0 million for the year ended December 31, 2015 as compared to the year endedDecember 31, 2014. This change was primarily driven by decreases in the values of investments held by certain Apollo funds and other entities in which theCompany has a direct interest, mainly with respect to Fund VII, AINV, AION, EPF I, ARI and ACLF which resulted in decreases in income from equity methodinvestments of $12.4 million, $9.3 million, $5.9 million, $3.4 million, $2.7 million and $2.0 million, respectively. These decreases were offset by an increasein the value of Apollo’s ownership interest in AAA of $10.0 million.
Interest income decreased by $7.2 million for the year ended December 31, 2015 as compared to the year ended December 31, 2014 primarily dueto payment-in-kind interest income earned during the year ended December 31, 2014 that did not recur in 2015 as a result of the sale of the Company’sinvestment in HFA during the year ended December 31, 2014.
Other income, net decreased by $52.9 million for the year ended December 31, 2015 as compared to the year ended December 31, 2014. Thischange was primarily due to (i) a gain from the reduction of the tax receivable agreement liability of $32.2 million resulting from changes in projectedincome estimates and in estimated tax rates (see note 15 to our consolidated financial statements), (ii) a $14.0 million unrealized gain on Athene-relatedderivative contracts as a result of the settlement of these derivative contracts during 2014 and (iii) a gain on extinguishment of a portion of the contingentconsideration obligation related to the acquisition of Stone Tower of $13.4 million, each of which occurred during the year ended December 31, 2014 anddid not recur in 2015.
Year Ended December 31, 2014 Compared to Year Ended December 31, 2013
Net gains from investment activities decreased by $117.0 million for the year ended December 31, 2014 as compared to the year ended December31, 2013. This change was primarily attributable to a $137.9 million decrease in net unrealized gains related to changes in the fair value of investments heldby AAA, offset by a decrease in losses on the investment in HFA Holdings Limited ("HFA") of $21.4 million (see note 4 to the consolidated financialstatements).
Net gains from investment activities of consolidated VIEs decreased by $177.2 million for the year ended December 31, 2014 as compared to theyear ended December 31, 2013. The decrease was primarily attributable to a $238.5 million net loss from investment activities for the year ended December31, 2014 as compared to a $54.2 million net gain from investment activities for the year ended December 31, 2013. The decrease was also driven by a $7.8million decrease in interest and other income and a $74.6 million increase in other expenses for the year ended December 31, 2014 as compared to the sameperiod in 2013. These changes were offset by a $102.5 million net gain from debt for the year ended December 31, 2014 as compared to a $95.4 million netloss from debt for the year ended December 31, 2013.
Income from equity method investments decreased by $53.5 million for the year ended December 31, 2014 as compared to the year endedDecember 31, 2013. This change was primarily driven by lower appreciation in the net asset value of entities in which the Company has a direct interest forthe year ended December 31, 2014 as compared to the year ended December 31, 2013. Fund VI and Fund VII had the most significant impact and togetherhad a reduction of $53.9 million of income from equity method investments during the year ended December 31, 2014 as compared to the same period in2013.
Interest income decreased by $1.9 million for the year ended December 31, 2014 as compared to the year ended December 31, 2013 primarily dueto the decrease of payment-in-kind interest income as a result of the sale of the Company's investment in HFA during July 2014 as compared to the sameperiod in 2013 (see note 4 to the consolidated financial statements).
- 100-

Table of Contents
Other income, net increased by $20.5 million for the year ended December 31, 2014 as compared to the year ended December 31, 2013. Thischange was primarily attributable to a gain from the reduction of the tax receivable agreement liability during the year ended December 31, 2014 resultingfrom changes in projected income estimates and in estimated tax rates (see note 15 to our consolidated financial statements) and a gain on extinguishment ofa portion of the contingent consideration obligation related to the acquisition of Stone Tower (see note 16 to our consolidated financial statements) duringthe period. These increases were offset by losses resulting from fluctuations in exchange rates of foreign denominated assets and liabilities of subsidiariesduring the year ended December 31, 2014.
Income Tax Provision
Year Ended December 31, 2015 Compared to Year Ended December 31, 2014
The income tax provision decreased by $120.5 million primarily due to a decrease in management business income subject to corporate-leveltax, as well as a change in the mix of earnings which are subject to corporate-level tax. The Apollo Operating Group and its subsidiaries generally operate aspartnerships for U.S. federal income tax purposes. As a result, only a portion of the income we earn is subject to corporate-level tax in the United States andforeign jurisdictions. The provision for income taxes includes federal, state and local income taxes in the United States and foreign income taxes at aneffective tax rate of 7.1% and 16.8% for the years ended December 31, 2015 and 2014, respectively. The reconciling items between our statutory tax rate andour effective tax rate were due to the following: (i) income passed through to Non-Controlling Interests; (ii) income passed through to Class A shareholders;and (iii) state and local income taxes including NYC UBT (see note 11 to the consolidated financial statements for further details regarding the Company’sincome tax provision).
Year Ended December 31, 2014 Compared to Year Ended December 31, 2013
Income tax provision increased by $39.7 million primarily due to an increase in management business income subject to corporate leveltaxation. There was also a reduction of the Company’s blended state tax rate which caused the Company to reduce its deferred tax assets and increasedincome tax expense. The provision for income taxes includes federal, state and local income taxes in the United States and foreign income taxes at aneffective tax rate of 16.8% and 4.3% for the years ended December 31, 2014 and 2013, respectively. The reconciling items between our statutory tax rate andour effective tax rate were due to the following: (i) income passed through to Non-Controlling Interests; (ii) income passed through to Class A shareholders;(iii) amortization of AOG Units that are nondeductible for income tax purposes which were fully amortized as of June 30, 2013; and (iv) state and localincome taxes including NYC UBT.
Non-Controlling InterestsNet income attributable to Non-Controlling Interests in the Apollo Operating Group consisted of the following:
For the Year Ended December 31,
2015 2014 2013 (in thousands)
Net income $ 350,495 $ 729,922 $ 2,373,994Net income attributable to Non-Controlling Interests in consolidated entities (21,364) (157,011) (456,953)Net income after Non-Controlling Interests in consolidated entities 329,131 572,911 1,917,041Adjustments:
Income tax provision(1) 26,733 147,245 107,569NYC UBT and foreign tax provision(2) (10,975) (10,995) (10,334) Net (income) loss in non-Apollo Operating Group entities 449 (31,150) (11,774)
Total adjustments 16,207 105,100 85,461Net income after adjustments 345,338 678,011 2,002,502Approximate weighted average ownership percentage of Apollo Operating Group 55.9% 57.8% 61.0%
Net income attributable to Non-Controlling Interests in Apollo Operating Group $ 194,634 $ 404,682 $ 1,257,650
- 101-

Table of Contents
(1) Reflects all taxes recorded in our consolidated statements of operations. Of this amount, U.S. federal, state, and local corporate income taxes attributable to APO Corp.are added back to income of the Apollo Operating Group before calculating Non-Controlling Interests as the income allocable to the Apollo Operating Group is notsubject to such taxes.
(2) Reflects NYC UBT and foreign taxes that are attributable to the Apollo Operating Group and its subsidiaries related to its operations in the U.S. as partnerships and innon-U.S. jurisdictions as corporations. As such, these amounts are considered in the income attributable to the Apollo Operating Group.
Segment Analysis
Discussed below are our results of operations for each of our reportable segments. They represent the segment information available and utilizedby our executive management, which consists of our Managing Partners, who operate collectively as our chief operating decision maker, to assessperformance and to allocate resources. Management divides its operations into three reportable segments: private equity, credit and real estate. Thesesegments were established based on the nature of investment activities in each underlying fund, including the specific type of investment made, thefrequency of trading, and the level of control over the investment. Segment results represent segment income (loss) before income tax provision excludingtransaction-related charges arising from the 2007 private placement, and any acquisitions. Transaction-related charges include equity-based compensationcharges, the amortization of intangible assets and contingent consideration and certain other charges associated with acquisitions. In addition, segment dataexcludes non-cash revenue and expense related to equity awards granted by unconsolidated affiliates to employees of the Company, as well as the assets,liabilities and operating results of the funds and VIEs that are included in the consolidated financial statements.
Our financial results vary, since carried interest, which generally constitutes a large portion of the income from the funds that we manage, as wellas the transaction and advisory fees that we receive, can vary significantly from quarter to quarter and year to year. As a result, we emphasize long-termfinancial growth and profitability to manage our business.
Private Equity
The following tables set forth our segment statement of operations information and our supplemental performance measure, EI, for the“management” and “incentive” businesses within our private equity segment for the years ended December 31, 2015, 2014 and 2013, respectively.
For the Year Ended December 31, 2015 For the Year Ended December 31, 2014 Management Incentive Total Management Incentive Total Total Change Percentage Change
(in thousands) Private Equity(1): Revenues: Advisory and transaction fees from affiliates, net $ (7,485) $ — $ (7,485) $ 58,241 $ — $ 58,241 $ (65,726) NM
Management fees from affiliates 295,836 — 295,836 315,069 — 315,069 (19,233) (6.1)%
Carried interest income from affiliates: Unrealized losses(2) — (314,161) (314,161) — (1,196,093) (1,196,093) 881,932 (73.7)%
Realized gains — 339,822 339,822 — 1,428,076 1,428,076 (1,088,254) (76.2)%
Total carried interest income from affiliates — 25,661 25,661 — 231,983 231,983 (206,322) (88.9)%
Total Revenues 288,351 25,661 314,012 373,310 231,983 605,293 (291,281) (48.1)%
Expenses: Compensation and benefits:
Salary, bonus and benefits 104,367 — 104,367 96,689 — 96,689 7,678 7.9 %
Equity-based compensation 31,324 — 31,324 49,526 — 49,526 (18,202) (36.8)%
Profit sharing expense — 46,572 46,572 — 178,373 178,373 (131,801) (73.9)%
Total compensation and benefits 135,691 46,572 182,263 146,215 178,373 324,588 (142,325) (43.8)%
Other expenses 80,109 — 80,109 70,286 — 70,286 9,823 14.0 %
Total Expenses 215,800 46,572 262,372 216,501 178,373 394,874 (132,502) (33.6)%
Other Income: Net interest expense — (9,878) (9,878) — (7,883) (7,883) (1,995) 25.3 %
Net gains from investment activities — 6,933 6,933 — — — 6,933 NM
Income from equity method investments — 19,125 19,125 — 30,418 30,418 (11,293) (37.1)%
Other income, net 1,988 1,160 3,148 12,410 1,617 14,027 (10,879) (77.6)%
Total Other Income 1,988 17,340 19,328 12,410 24,152 36,562 (17,234) (47.1)%
Economic Income (Loss) $ 74,539 $ (3,571) $ 70,968 $ 169,219 $ 77,762 $ 246,981 $ (176,013) (71.3)%
(1) Prior period amounts have been recast to conform to the current presentation. See note 18 to our consolidated financial statements for more detail on the
reclassifications within our three segments.
- 102-

(2) Included in unrealized carried interest losses from affiliates for the year ended December 31, 2015 was a reversal of previously realized carried interest income due tothe general partner obligation to return previously distributed carried interest income. See note 15 to our consolidated financial statements for further detail regarding thegeneral partner obligation.
For the Year Ended December 31, 2014 For the Year Ended December 31, 2013 Management Incentive Total Management Incentive Total Total Change Percentage Change
(in thousands) Private Equity(1): Revenues: Advisory and transaction fees from affiliates, net $ 58,241 $ — $ 58,241 $ 78,371 $ — $ 78,371 $ (20,130) (25.7)%
Management fees from affiliates 315,069 — 315,069 284,833 — 284,833 30,236 10.6
Carried interest income from affiliates: Unrealized gains (losses)(2) — (1,196,093) (1,196,093) — 454,722 454,722 (1,650,815) NM
Realized gains — 1,428,076 1,428,076 — 2,062,525 2,062,525 (634,449) (30.8)
Total carried interest income from affiliates — 231,983 231,983 — 2,517,247 2,517,247 (2,285,264) (90.8)
Total Revenues 373,310 231,983 605,293 363,204 2,517,247 2,880,451 (2,275,158) (79.0)
Expenses: Compensation and benefits:
Salary, bonus and benefits 96,689 — 96,689 109,761 — 109,761 (13,072) (11.9)
Equity-based compensation 49,526 — 49,526 31,967 — 31,967 17,559 54.9
Profit sharing expense — 178,373 178,373 — 1,030,404 1,030,404 (852,031) (82.7)
Total compensation and benefits 146,215 178,373 324,588 141,728 1,030,404 1,172,132 (847,544) (72.3)
Other expenses 70,286 — 70,286 100,896 — 100,896 (30,610) (30.3)
Total Expenses 216,501 178,373 394,874 242,624 1,030,404 1,273,028 (878,154) (69.0)
Other Income: Net interest expense — (7,883) (7,883) — (10,701) (10,701) 2,818 (26.3)
Income from equity method investments — 30,418 30,418 — 78,811 78,811 (48,393) (61.4)
Other income, net 12,410 1,617 14,027 12,079 1,695 13,774 253 1.8
Total Other Income 12,410 24,152 36,562 12,079 69,805 81,884 (45,322) (55.3)
Economic Income $ 169,219 $ 77,762 $ 246,981 $ 132,659 $ 1,556,648 $ 1,689,307 $ (1,442,326) NM
(1) Prior period amounts have been recast to conform to the current presentation. See note 18 to our consolidated financial statements for more detail on thereclassifications within our three segments.
(2) Included in unrealized carried interest losses from affiliates for the year ended December 31, 2014 was a reversal of previously realized carried interest income due tothe general partner obligation to return previously distributed carried interest income. See note 15 to our consolidated financial statements for further detail regarding thegeneral partner obligation.
Revenues
Year Ended December 31, 2015 Compared to Year Ended December 31, 2014
Advisory and transaction fees from affiliates, net decreased by $65.7 million for the year ended December 31, 2015 as compared to the yearended December 31, 2014. This change was primarily attributable to a change in the fee structure with respect to Fund VIII as a greater portion of the advisoryand transaction fees were shared with limited partners of the fund in 2015. In addition, there were decreases in net advisory and transaction fees earned withrespect to Fund VII and ANRP I of $26.6 million and $4.3 million, respectively, as well as a legal reserve in connection with an ongoing SEC regulatorymatter recorded during the year ended December 31, 2015.
Management fees from affiliates decreased by $19.2 million for the year ended December 31, 2015 as compared to the year ended December 31,2014. This change was primarily attributable to decreases in management fees earned with respect to Fund VI and Fund VII of $10.6 million and $10.6million, respectively, as a result of lower invested capital. In addition, this change was attributable to a decrease in management fees earned with respect toANRP I of $3.3 million resulting from a step down in fee basis from committed capital to invested capital during the year ended December 31, 2015compared to the same period in 2014. These decreases were partially offset by an increase related to ANRP II of $7.9 million which launched during 2015.
Carried interest income from affiliates decreased by $206.3 million for the year ended December 31, 2015 as compared to the year endedDecember 31, 2014. This change was primarily attributable to decreases in carried interest income earned from Fund VII and ANRP I of $289.6 million and$40.1 million, respectively, partially offset by increased carried interest income earned from AAA/Other and Fund VI of $76.2 million and $60.6 million,respectively. The decreases in carried interest income earned
- 103-

from Fund VII and ANRP I were primarily driven by depreciation in their energy-related portfolio holdings during the year ended December 31, 2015.Additionally, the decrease in carried interest income earned from Fund VII was attributable to the non-recurrence of carried interest income of approximately$299.8 million with respect to certain of the fund’s investments that were sold subsequent to December 31, 2014. The increase in carried interest incomeearned from AAA/Other as compared to the year ended December 31, 2014 was primarily driven by the appreciation on the investment in Athene. Theincrease in carried interest income earned from Fund VI for the year ended December 31, 2015 as compared to the same period in 2014 was primarily a resultof $112.7 million of carried interest loss relating to one of the fund’s public portfolio companies during the year ended December 31, 2014 that did not recurduring the year ended December 31, 2015 and an increase in carried interest income earned with respect to the fund’s public portfolio company holdingsduring the year ended December 31, 2015.
Year Ended December 31, 2014 Compared to Year Ended December 31, 2013
Advisory and transaction fees from affiliates, net, decreased by $20.1 million for the year ended December 31, 2014 as compared to the yearended December 31, 2013. This change was primarily attributable to lower net advisory fees driven by the realization of underlying investments, terminationfees and waived fees related to debt investment vehicles, EP Energy, Taminco, Realogy and Caesars Entertainment that occurred during the year endedDecember 31, 2013 and lower net transaction fees for the year ended December 31, 2014 compared to 2013.
Management fees from affiliates increased by $30.2 million for the year ended December 31, 2014 as compared to the year ended December 31,2013. This increase was primarily attributable to increased management fees earned from Fund VIII in the amount of $126.4 million during the year endedDecember 31, 2014. This increase was partially offset by decreased management fees earned from Fund VII of $92.9 million as a result of a change in themanagement fee rate and basis upon which management fees are earned from capital commitments to invested capital, due to the fund coming to the end ofthe fund's investment period.
Carried interest income from affiliates decreased by $2.3 billion for the year ended December 31, 2014 as compared to the year ended December31, 2013. This change was primarily attributable to a decrease in carried interest income earned from Fund VI, Fund VII and AAA Investments (Co-Invest VI),L.P. (“AAA Co-Invest VI”) of $1.3 billion, $850.1 million and $121.7 million, respectively, primarily driven by the depreciation of publicly markedsecurities in the funds’ portfolios. The decrease in carried interest income earned from Fund VI was also a result of the fund entering its catch-up periodduring the year ended December 31, 2013 whereby the general partner earns higher carried interest rates, resulting in $452.3 million of carried interestincome during the year ended December 31, 2013 that did not recur during the year ended December 31, 2014. In addition, the decrease in carried interestincome earned from Fund VII was attributable to the non-recurrence of net gains with respect to certain of the fund’s investments that were sold subsequent toDecember 31, 2013.
Expenses
Year Ended December 31, 2015 Compared to Year Ended December 31, 2014
Compensation and benefits expense decreased by $142.3 million for the year ended December 31, 2015 as compared to the year ended December31, 2014. This change was primarily attributable to a decrease in profit sharing expense of $131.8 million as a result of a corresponding decrease in carriedinterest income earned from Fund VII, ANRP I and Fund V as discussed above, and a decrease in equity-based compensation of $18.2 million during the yearended December 31, 2015 as compared to the year ended December 31, 2014. In any year the blended profit sharing percentage is impacted by the respectiveprofit sharing ratios of the funds that are generating carried interest in the period. Equity-based compensation was higher during the year ended December 31,2014 as a result of a non-cash expense of $17.9 million in connection with the departure of an executive officer during the year ended December 31, 2014.These decreases were offset by an increase in salary, bonus and benefits of $7.7 million due to an increase in headcount after December 31, 2014.
Included in profit sharing expense is $46.6 million and $55.5 million related to the Incentive Pool for the years ended December 31, 2015 and2014, respectively. The Incentive Pool is separate from the fund related profit sharing expense and may result in greater variability in compensation and havea variable impact on the blended profit sharing percentage during a particular quarter.
Year Ended December 31, 2014 Compared to Year Ended December 31, 2013
Compensation and benefits expense decreased by $847.5 million for the year ended December 31, 2014 as compared to the year ended December31, 2013. This change was primarily attributable to a decrease in profit sharing expense of $852.0 million, due to lower carried interest income during theyear ended December 31, 2014 as compared to the year ended December 31, 2013. In any year, the blended profit sharing percentage is impacted by therespective profit sharing ratios of the funds generating
- 104-

carried interest in the period. During the year ended December 31, 2014, the fair value of Fund VII’s underlying fund investments appreciated while Fund VI'sunderlying fund investments depreciated, which contributed to an increased profit sharing percentage compared to the year ended December 31, 2013. Thisdecrease was partially offset by increased equity-based compensation of $17.6 million, driven by non-cash expense related to equity-based compensation inconnection with the departure of an executive officer during the year ended December 31, 2014.
Included in profit sharing expense is $55.5 million and $46.0 million related to the Incentive Pool for the years ended December 31, 2014 and2013, respectively. The Incentive Pool is separate from the fund related profit sharing expense and may result in greater variability in compensation and havea variable impact on the blended profit sharing percentage during a particular quarter.
Other expenses decreased by $30.6 million for the year ended December 31, 2014 as compared to the year ended December 31, 2013. Thischange was primarily attributable to decreased organizational expenses and legal and consulting fees, as well as a reduction in placement fees relating toFund VIII.
Other Income
Year Ended December 31, 2015 Compared to Year Ended December 31, 2014
Net interest expense increased by $2.0 million for the year ended December 31, 2015 as compared to the year ended December 31, 2014 as aresult of the issuance of the 2024 Senior Notes in May, 2014, as described in note 12 to our consolidated financial statements.
Net gains from investment activities increased by $6.9 million for the year ended December 31, 2015 as compared to the year ended December31, 2014 due to an increase in mark-to-market on our investment in Athene Holding.
Income from equity method investments decreased by $11.3 million for the year ended December 31, 2015 as compared to the year endedDecember 31, 2014. This change was driven by decreases in the income from Apollo’s equity ownership interest in Fund VII and AION of $12.4 million and$5.9 million, respectively, offset by an increase in the value of Apollo’s ownership interest in AAA of $10.0 million during the year ended December 31,2015 as compared to the year ended December 31, 2014.
Other income, net decreased by $10.9 million for the year ended December 31, 2015 as compared to the year ended December 31, 2014. Thischange was primarily due to a gain of $11.8 million resulting from the reduction of the tax receivable agreement liability during the year ended December 31,2014 that did not recur in 2015.
Year Ended December 31, 2014 Compared to Year Ended December 31, 2013
Net interest expense decreased by $2.8 million for the year ended December 31, 2014 as compared to the year ended December 31, 2013. Thischange was primarily attributable to a lower margin rate incurred with respect to the 2013 AMH Credit Facilities as compared to the 2007 AMH CreditAgreement during the year ended December 31, 2014 as compared to the same period in 2013. See note 12 to our consolidated financial statements.
Income from equity method investments decreased by $48.4 million for the year ended December 31, 2014 as compared to the year endedDecember 31, 2013. This change was primarily driven by lower appreciation in the net asset value, primarily from Apollo's ownership interests in Fund VIand Fund VII, in the amounts of $4.6 million and $49.3 million, respectively, for the year ended December 31, 2014 as compared to the year ended December31, 2013, which was offset by an increase in the fair value of Apollo's ownership interest in AION in the amount of $5.8 million.
- 105-

Credit
The following tables set forth segment statement of operations information and EI for the “management” and “incentive” businesses within ourcredit segment for the years ended December 31, 2015, 2014 and 2013, respectively.
For the Year Ended December 31, 2015 For the Year Ended December 31, 2014 Management Incentive Total Management Incentive Total Total Change Percentage Change
(in thousands) Credit:(1) Revenues: Advisory and transaction fees from affiliates, net $ 17,246 $ — $ 17,246 $ 255,186 $ — $ 255,186 $ (237,940) (93.2)%
Management fees from affiliates 565,241 — 565,241 538,742 — 538,742 26,499 4.9
Carried interest income from affiliates: Unrealized losses(2) — (80,534) (80,534) — (156,644) (156,644) 76,110 (48.6)
Realized gains 40,625 98,527 139,152 41,199 281,034 322,233 (183,081) (56.8)
Total carried interest income from affiliates 40,625 17,993 58,618 41,199 124,390 165,589 (106,971) (64.6)
Total Revenues 623,112 17,993 641,105 835,127 124,390 959,517 (318,412) (33.2)
Expenses: Compensation and benefits:
Salary, bonus and benefits 213,479 — 213,479 210,546 — 210,546 2,933 1.4
Equity-based compensation 26,683 — 26,683 47,120 — 47,120 (20,437) (43.4)
Profit sharing expense — 34,384 34,384 — 83,788 83,788 (49,404) (59.0)
Total compensation and benefits 240,162 34,384 274,546 257,666 83,788 341,454 (66,908) (19.6)
Other expenses 127,767 — 127,767 151,252 — 151,252 (23,485) (15.5)
Total Expenses 367,929 34,384 402,313 408,918 83,788 492,706 (90,393) (18.3)
Other Income: Net interest expense — (13,740) (13,740) — (9,274) (9,274) (4,466) 48.2
Net gains from investment activities — 114,199 114,199 — 9,062 9,062 105,137 NM
Income (loss) from equity method investments — (6,025) (6,025) — 18,812 18,812 (24,837) NM
Other income (loss), net 4,251 (677) 3,574 25,984 9,279 35,263 (31,689) (89.9)
Total Other Income (Loss) 4,251 93,757 98,008 25,984 27,879 53,863 44,145 82.0
Non-Controlling Interests (11,684) — (11,684) (12,688) — (12,688) 1,004 (7.9)
Economic Income $ 247,750 $ 77,366 $ 325,116 $ 439,505 $ 68,481 $ 507,986 $ (182,870) (36.0)%
(1) Prior period amounts have been recast to conform to the current presentation. See note 18 to our consolidated financial statements for more detail on the
reclassifications within our three segments.(2) Included in unrealized carried interest losses from affiliates for the years ended December 31, 2015 and 2014 was a reversal of previously realized carried interest
income due to the general partner obligation to return previously distributed carried interest income. See note 15 to our consolidated financial statements for furtherdetail regarding the general partner obligation.
- 106-

For the Year Ended December 31, 2014 For the Year Ended December 31, 2013 Management Incentive Total Management Incentive Total Total Change Percentage Change
(in thousands) Credit:(1) Revenues: Advisory and transaction fees from affiliates, net $ 255,186 $ — $ 255,186 $ 114,643 $ — $ 114,643 $ 140,543 122.6 %
Management fees from affiliates 538,742 — 538,742 392,433 — 392,433 146,309 37.3
Carried interest income from affiliates: Unrealized losses(2) — (156,644) (156,644) — (56,568) (56,568) (100,076) 176.9
Realized gains 41,199 281,034 322,233 36,922 393,338 430,260 (108,027) (25.1)
Total carried interest income from affiliates 41,199 124,390 165,589 36,922 336,770 373,692 (208,103) (55.7)
Total Revenues 835,127 124,390 959,517 543,998 336,770 880,768 78,749 8.9
Expenses: Compensation and benefits:
Salary, bonus and benefits 210,546 — 210,546 153,056 — 153,056 57,490 37.6
Equity-based compensation 47,120 — 47,120 24,167 — 24,167 22,953 95.0
Profit sharing expense — 83,788 83,788 — 81,279 81,279 2,509 3.1
Total compensation and benefits 257,666 83,788 341,454 177,223 81,279 258,502 82,952 32.1
Other expenses 151,252 — 151,252 147,525 — 147,525 3,727 2.5
Total Expenses 408,918 83,788 492,706 324,748 81,279 406,027 86,679 21.3
Other Income: Net interest expense — (9,274) (9,274) — (9,686) (9,686) 412 (4.3)
Net gains (losses) from investment activities — 9,062 9,062 — (12,593) (12,593) 21,655 NM
Income from equity method investments — 18,812 18,812 — 30,678 30,678 (11,866) (38.7)
Other income (loss), net 25,984 9,279 35,263 23,685 8,508 32,193 3,070 9.5
Total Other Income 25,984 27,879 53,863 23,685 16,907 40,592 13,271 32.7
Non-Controlling Interests (12,688) — (12,688) (13,985) — (13,985) 1,297 (9.3)
Economic Income $ 439,505 $ 68,481 $ 507,986 $ 228,950 $ 272,398 $ 501,348 $ 6,638 1.3 %
(1) Prior period amounts have been recast to conform to the current presentation. See note 18 to our consolidated financial statements for more detail on thereclassifications within our three segments.
(2) Included in unrealized carried interest losses from affiliates for the years ended December 31, 2015 and 2013 was a reversal of previously realized carried interestincome due to the general partner obligation to return previously distributed carried interest income. See note 15 to our consolidated financial statements for furtherdetail regarding the general partner obligation.
Revenues
Year Ended December 31, 2015 Compared to Year Ended December 31, 2014
Advisory and transaction fees from affiliates, net, decreased by $237.9 million during the year ended December 31, 2015 as compared to the yearended December 31, 2014. The decrease was primarily driven by a decrease in monitoring fees from Athene of $224.5 million as a result of the termination ofthe Athene Services Agreement (as described in note 15 to the consolidated financial statements) as of December 31, 2014.
Management fees from affiliates increased by $26.5 million for the year ended December 31, 2015 as compared to the year ended December 31,2014. This change was primarily attributable to increases in management fees earned with respect to COF III and MidCap of $12.3 million and $8.7 million,respectively, during the year ended December 31, 2015 as compared to the same period during 2014.
Carried interest income from affiliates decreased by $107.0 million for the year ended December 31, 2015 as compared to the year endedDecember 31, 2014. This change was primarily attributable to a decrease in carried interest income earned from EPF I, EPF II, an SIA and ACLF of $57.0million, $35.8 million, $30.2 million and $19.2 million, respectively, partially offset by increased carried interest income earned from FCI II and FCI I of$26.3 million and $9.7 million, respectively, during the year ended December 31, 2015 as compared to the same period in 2014.
The decrease in carried interest income from EPF I was attributable to the non-recurrence of appreciation of investments in the consumer financesector during the year ended December 31, 2015. Carried interest income from EPF II decreased as a result of market value declines in the fund’s investmentsin the financial and shipping sectors during the year ended December 31, 2015. Carried interest income from one of the SIAs the Company manages andACLF decreased during the year ended December 31, 2015 compared to the same period in 2014 primarily due to market value declines in energy and naturalresources. These
- 107-

decreases were offset by an increase in carried interest income from FCI II and FCI I during the year ended December 31, 2015 as compared to the year endedDecember 31, 2014. The portfolios of FCI II and FCI I had unrealized market value increases in their life settlements investments, as a result of an increase inthe value of the fund’s investments based on observed market transactions. During the year ended December 31, 2014, FCI II was early in its life, and hadsizable purchases during the year ended December 31, 2015, therefore similar appreciation did not occur.
Year Ended December 31, 2014 Compared to Year Ended December 31, 2013
Advisory and transaction fees from affiliates, net, increased by $140.5 million during the year ended December 31, 2014 as compared to the yearended December 31, 2013. The increase was primarily driven by an increase in monitoring fees from Athene of $118.5 million as a result of Athene'sacquisition of Aviva USA and an increase in net transaction fees with respect to EPF II and FCI II during the year ended December 31, 2014 compared to thesame period in 2013.
Management fees from affiliates increased by $146.3 million for the year ended December 31, 2014 as compared to the year ended December 31,2013. This change was primarily attributable to increases in management fees earned from Athene (as a result of Athene's acquisition of Aviva USA) andAINV of $126.1 million and $8.4 million, respectively, during the year ended December 31, 2014 compared to the same period in 2013.
Carried interest income from affiliates decreased by $208.1 million during the year ended December 31, 2014 as compared to the year endedDecember 31, 2013. This change was primarily attributable to a decrease in carried interest income earned from COF I and COF II, certain sub-advisoryarrangements, an SIA, EPF I, certain CLOs, Apollo Offshore Credit Fund, ACLF and AIE II of $57.7 million, $42.3 million, $38.8 million, $25.7 million,$20.6 million, $18.0 million, $12.6 million and $11.3 million, respectively. These decreases in carried interest income were partially offset by increasedcarried interest income earned from EPF II of $59.4 million during the year ended December 31, 2014 as compared to the year ended December 31, 2013.
The decrease in COF I and COF II was attributable to significant gains in positions that did not recur in 2014. In addition, the funds increaseddistributions to investors which decreased the asset base resulting in decreased income on a steady basis through 2014. Sub-advisory arrangements had lessappreciation in 2014 as compared to 2013. Returns of an SIA were positive in 2014 but were decreased compared to 2013 due to unrealized losses related toenergy positions in the second half of 2014. The decrease in EPF I was driven by foreign exchange losses as a result of the decline of the Euro against the USdollar. Decreased carried interest income in certain CLOs resulted from decreased market value gains and interest in 2014 compared to 2013. Apollo OffshoreCredit Fund’s returns were positive in 2014 but did not exceed the preferred return for the majority of its investors due to decreased interest income ascompared to 2013. The decrease was also attributable to unrealized market value gains in 2013 compared to losses in 2014. ACLF had decreased carriedinterest related to unrealized losses in energy positions in the second half of 2014. AIE II’s carried interest and returns experienced smaller gains in 2014compared to 2013 as a result of significant realizations during 2013 that did not recur during 2014.
Expenses
Year Ended December 31, 2015 Compared to Year Ended December 31, 2014
Compensation and benefits expense decreased by $66.9 million for the year ended December 31, 2015 as compared to the year ended December31, 2014. This change was primarily due to decreases in profit sharing expense and equity-based compensation of $49.4 million and $20.4 million,respectively, during the year ended December 31, 2015 as compared to the year ended December 31, 2014. Profit sharing expense decreased as a result of acorresponding decrease in carried interest income as described above. In any year the blended profit sharing percentage is impacted by the respective profitsharing ratios of the funds generating carried interest in the period. Equity-based compensation was higher during the year ended December 31, 2014 ascompared to the same period in 2015 as a result of a non-cash expense of $23.2 million in connection with the departure of an executive officer during theyear ended December 31, 2014.
Included in profit sharing expense is $15.2 million and $6.3 million related to the Incentive Pool for the years ended December 31, 2015 and2014, repectively. The Incentive Pool is separate from the fund related profit sharing expense and may result in greater variability in compensation and havea variable impact on the blended profit sharing percentage during a particular quarter.
Other expenses decreased by $23.5 million during the year ended December 31, 2015, as compared to the year ended December 31, 2014. Thechange was primarily driven by a decrease in professional fees of $7.7 million primarily attributable to lower consulting fees, a decrease in placement feeswith respect to COF III of $6.3 million and a decrease in general, administrative and other expense of $7.5 million primarily attributable to lower technologyexpenses during the year ended December 31, 2015 compared to the same period in 2014.
- 108-

Year Ended December 31, 2014 Compared to Year Ended December 31, 2013
Compensation and benefits expense increased by $83.0 million for the year ended December 31, 2014 as compared to the year ended December31, 2013. This change was primarily due to an increase in salary, bonus and benefits of $57.5 million due to increased headcount and an increase in equity-based compensation of $23.0 million. The increase in equity-based compensation was driven by non-cash expense of $23.2 million related to equity-basedcompensation in connection with the departure of an executive officer during the year ended December 31, 2014 as compared to the same period in 2013.Within our credit segment, the Company is seeking to further align total compensation for investment professionals with the profitability of the creditbusiness as a whole rather than on a fund-by-fund basis. As a result, the Company incurred approximately $22.0 million of additional profit sharing expenseat the inception of the compensation plan during 2014.
Included within profit sharing expense is the Incentive Pool, which resulted in additional profit sharing expense of $6.3 million and $16.3million for the years ended December 31, 2014 and 2013, respectively. The Incentive Pool is separate from the fund related profit sharing expense and mayresult in greater variability in compensation and have a variable impact on the blended profit sharing percentage during a particular quarter.
Other Income
Year Ended December 31, 2015 Compared to Year Ended December 31, 2014
Net gains from investment activities increased by $105.1 million for the year ended December 31, 2015 as compared to the year ended December31, 2014. This change was primarily attributable to an increase in unrealized gains on the Company’s investment in Athene of $100.1 million during the yearended December 31, 2015 compared to the same period in 2014.
Income from equity method investments decreased by $24.8 million for the year ended December 31, 2015 as compared to the year endedDecember 31, 2014. This change was driven by decreases in the values of investments in certain of our credit funds, primarily from Apollo’s ownershipinterests in AINV, certain SIAs, EPF I, and EPF II of $9.3 million, $3.8 million, $3.4 million and $1.5 million, respectively, during the year ended December31, 2015 as compared to the same period in 2014. The change was also driven by a decrease in the value of our investment in Apollo Energy OpportunityFund, L.P. (“AEOF”), a fund which launched during 2015, of $2.0 million.
Other income decreased by $31.7 million for the year ended December 31, 2015 as compared to the year ended December 31, 2014. This changewas primarily due to a gain of $17.3 million resulting from the reduction of the tax receivable agreement liability during the year ended December 31, 2014that did not recur in 2015 and a $12.4 million unrealized gain on Athene-related derivative contracts during the year ended December 31, 2014 that did notrecur in 2015 as a result of settlement of these derivative contracts during 2014.
Year Ended December 31, 2014 Compared to Year Ended December 31, 2013
Net gains from investment activities of $9.1 million increased by $21.7 million for the year ended December 31, 2014 as compared to the yearended December 31, 2013 as a result of appreciation in the Company's investment in HFA during the year ended December 31, 2014 prior to the sale of theinvestment in HFA (see note 4 to the consolidated financial statements.)
Income from equity method investments decreased by $11.9 million for the year ended December 31, 2014 as compared to the year endedDecember 31, 2013. This change was driven by decreases in the fair values of investments held by certain of our credit funds, primarily COF I, EPF I, AIE II,COF III and Apollo Palmetto Strategic Partnership, L.P. which resulted in decreases in income from equity method investments of $6.1 million, $2.2 million,$1.8 million, $1.6 million and $1.1 million, respectively, during the year ended December 31, 2014 as compared to the same period in 2013.
Other income increased by $3.1 million during the year ended December 31, 2014, as compared to the year ended December 31, 2013, mainlydue to a gain from the reduction of the tax receivable agreement liability during the year ended December 31, 2014 resulting from changes in projectedincome estimates and estimated tax rates (see note 15 to our consolidated financial statements).
- 109-

Real Estate
The following tables set forth our segment statement of operations information and EI for the “management” and “incentive” businesses withinour real estate segment for the years ended December 31, 2015, 2014 and 2013, respectively.
For the Year Ended December 31, 2015 For the Year Ended December 31, 2014 Management Incentive Total Management Incentive Total Total Change Percentage Change
(in thousands) Real Estate:(1) Revenues: Advisory and transaction fees from affiliates, net $ 4,425 $ — $ 4,425 $ 2,655 $ — $ 2,655 $ 1,770 66.7 %
Management fees from affiliates 50,816 — 50,816 47,213 — 47,213 3,603 7.6 %
Carried interest income from affiliates: Unrealized gains — 7,154 7,154 — 4,951 4,951 2,203 44.5 %
Realized gains — 5,857 5,857 — 3,998 3,998 1,859 46.5 %
Total carried interest income from affiliates — 13,011 13,011 — 8,949 8,949 4,062 45.4 %
Total Revenues 55,241 13,011 68,252 49,868 8,949 58,817 9,435 16.0 %
Expenses: Compensation and benefits:
Salary, bonus and benefits 38,076 — 38,076 32,611 — 32,611 5,465 16.8 %
Equity-based compensation 4,177 — 4,177 8,849 — 8,849 (4,672) (52.8)%
Profit sharing expense — 5,075 5,075 — 2,747 2,747 2,328 84.7 %
Total compensation and benefits 42,253 5,075 47,328 41,460 2,747 44,207 3,121 7.1 %
Other expenses 22,869 — 22,869 21,669 — 21,669 1,200 5.5 %
Total Expenses 65,122 5,075 70,197 63,129 2,747 65,876 4,321 6.6 %
Other Income: Net interest expense — (2,915) (2,915) — (1,941) (1,941) (974) 50.2 %
Income from equity method investments — 2,978 2,978 — 5,675 5,675 (2,697) (47.5)%
Other income, net 1,455 — 1,455 3,409 — 3,409 (1,954) (57.3)%
Total Other Income 1,455 63 1,518 3,409 3,734 7,143 (5,625) (78.7)%
Economic Income (Loss) $ (8,426) $ 7,999 $ (427) $ (9,852) $ 9,936 $ 84 $ (511) NM
(1) Prior period amounts have been recast to conform to the current presentation. See note 18 to our consolidated financial statements for more detail on thereclassifications within our three segments.
For the Year Ended December 31, 2014 For the Year Ended December 31, 2013 Management Incentive Total Management Incentive Total Total Change Percentage Change
(in thousands) Real Estate:(1) Revenues: Advisory and transaction fees from affiliates, net $ 2,655 $ — $ 2,655 $ 3,548 $ — $ 3,548 $ (893) (25.2)%
Management fees from affiliates 47,213 — 47,213 53,436 — 53,436 (6,223) (11.6)
Carried interest income from affiliates: Unrealized gains — 4,951 4,951 — 4,681 4,681 270 5.8
Realized gains — 3,998 3,998 — 541 541 3,457 639.0
Total carried interest income from affiliates — 8,949 8,949 — 5,222 5,222 3,727 71.4
Total Revenues 49,868 8,949 58,817 56,984 5,222 62,206 (3,389) (5.4)
Expenses: Compensation and benefits:
Salary, bonus and benefits 32,611
—
32,611
31,936
—
31,936
675
2.1
Equity-based compensation 8,849 — 8,849 10,207 — 10,207 (1,358) (13.3)
Profit sharing expense — 2,747 2,747 — 123 123 2,624 2,133.3
Total compensation and benefits 41,460 2,747 44,207 42,143 123 42,266 1,941 4.6
Other expenses 21,669 — 21,669 24,528 — 24,528 (2,859) (11.7)
Total Expenses 63,129 2,747 65,876 66,671 123 66,794 (918) (1.4)
Other Income: Net interest expense — (1,941) (1,941) — (2,804) (2,804) 863 (30.8)
Income from equity method investments — 5,675 5,675 — 3,722 3,722 1,953 52.5
Other income, net 3,409 — 3,409 2,115 — 2,115 1,294 61.2

Total Other Income 3,409 3,734 7,143 2,115 918 3,033 4,110 135.5
Economic Income (Loss) $ (9,852) $ 9,936 $ 84 $ (7,572) $ 6,017 $ (1,555) $ 1,639 NM
- 110-

(1) Prior period amounts have been recast to conform to the current presentation. See note 18 to our consolidated financial statements for more detail on thereclassifications within our three segments.
Revenues
Year Ended December 31, 2015 Compared to Year Ended December 31, 2014
Advisory and transaction fees from affiliates, net, increased by $1.8 million for the year ended December 31, 2015 as compared to the year endedDecember 31, 2014. This change was primarily attributable to an increase in net advisory and transaction fees earned with respect to AGRE Debt Fund I of$1.5 million.
Management fees from affiliates increased by $3.6 million for the year ended December 31, 2015 as compared to the year ended December 31,2014. This change was primarily attributable to increases in management fees earned with respect to ARI, a China-based investment fund we manage as aresult of the Venator acquisition and U.S. RE Fund II of $4.5 million, $2.6 million and $1.7 million, respectively, which were partially offset by a decrease inmanagement fees earned related to our CPI funds of $6.1 million.
Carried interest income from affiliates increased by $4.1 million for the year ended December 31, 2015 as compared to the year ended December31, 2014. This change was primarily attributable to an increase in carried interest income earned from our CPI funds in Europe and U.S. RE Fund I of $5.5million and $0.9 million, respectively, partially offset by a decrease related to London Prime Apartments Guernsey Holdings Limited (“London PrimeApartments”) of $2.3 million. The increase in carried interest income in U.S. RE Fund I was a result of improved performance across many of the fund’sunderlying investments and higher global real estate values during the year ended December 31, 2015 as compared to the same period in 2014. The increasein carried interest income from our CPI funds in Europe was attributable to an increase in the value of a publicly traded security sold subsequent to December31, 2014. The decrease in carried interest income in London Prime Apartments was a result of an increase in the values of the underlying properties ascompared to the same period in 2014.
Year Ended December 31, 2014 Compared to Year Ended December 31, 2013
Advisory and transaction fees from affiliates, net, decreased by $0.9 million for the year ended December 31, 2014 as compared to the year endedDecember 31, 2013. This change was attributable to a decrease in capital raised and invested and the realization of underlying investments for whichtransaction fees and exit fees, respectively, were earned during the year ended December 31, 2013.
Management fees decreased by $6.2 million for the year ended December 31, 2014 as compared to the year ended December 31, 2013. Thedecrease in management fees was primarily due to decreased management fees from the CPI Funds for the year ended December 31, 2014 as compared to theyear ended December 31, 2013.
Carried interest income from affiliates increased by $3.7 million for the year ended December 31, 2014 as compared to the year ended December31, 2013. This change was primarily attributable to an increase in carried interest income earned from our CPI funds in Europe and U.S. RE Fund I of $2.9million and $2.8 million, respectively, partially offset by a decrease in carried interest income earned from our CPI funds in North America of $1.4 million.The increase in carried interest income from our CPI funds in Europe was attributable to a smaller decline in the value of a publicly marked security in thefunds’ portfolios during the year ended December 31, 2014 as compared to 2013. The increase in carried interest income for U.S. RE Fund I was primarilydriven by improved performance across many of the fund’s underlying investments and higher real estate values. The decrease in carried interest incomeearned from our CPI funds in North America was primarily the result of a non-recurring transaction that occurred in 2013.
- 111-

Expenses
Year Ended December 31, 2015 Compared to Year Ended December 31, 2014
Compensation and benefits increased by $3.1 million for the year ended December 31, 2015 as compared to the year ended December 31, 2014.This change was primarily attributable to an increase in salary, bonus and benefits of $5.5 million as a result of a higher headcount in 2015, and an increasein profit sharing expense of $2.3 million due to a corresponding increase in carried interest income earned during the year ended December 31, 2015 asdiscussed above. These increases were offset by a decrease in equity-based compensation of $4.7 million during the year ended December 31, 2015 ascompared to the year ended December 31, 2014.
Other expenses increased by $1.2 million during the year ended December 31, 2015 as compared to the year ended December 31, 2014, primarilyattributable to an increase in legal fees of $1.1 million.
Year Ended December 31, 2014 Compared to Year Ended December 31, 2013
Compensation and benefits increased by $1.9 million during the year ended December 31, 2014 as compared to the year ended December 31,2013. This change was primarily attributable to an increase of $2.6 million in profit sharing expense, driven by an increase in carried interest income earnedfrom our real estate funds, and a decrease in equity-based compensation of $1.4 million during the year ended December 31, 2014 as compared to the yearended December 31, 2013.
Other expenses decreased by $2.9 million during the year ended December 31, 2014 as compared to the year ended December 31, 2013, primarilyattributable to decreased legal fees and organizational expenses, offset by higher consulting fees and technology expenses.
Other Income
Year Ended December 31, 2015 Compared to Year Ended December 31, 2014
Income from equity method investments decreased by $2.7 million for the year ended December 31, 2015 as compared to the year endedDecember 31, 2014. This decrease is primarily attributable to a $2.7 million decrease in the income from Apollo’s ownership interest in ARI during the yearended December 31, 2015.
Other income decreased by $2.0 million for the year ended December 31, 2015 as compared to the year ended December 31, 2014. This changewas primarily due to a gain of $3.1 million resulting from the reduction of the tax receivable agreement liability during the year ended December 31, 2014that did not recur in 2015.
Year Ended December 31, 2014 Compared to Year Ended December 31, 2013
Other income increased by $4.1 million for the year ended December 31, 2014 as compared to the year ended December 31, 2013. This changewas driven by an increase in income from equity method investments of $2.0 million due to an increase in the fair values of our real estate investments held,primarily from Apollo's ownership interest in ARI, and an increase in other income, net primarily due to a gain resulting from the reduction of the taxreceivable agreement liability during the year ended December 31, 2014 as a result of a change in projected income estimates and estimated tax rates (seenote 15 to our consolidated financial statements).
- 112-

Table of Contents
Summary Combined Results
The following table combines our management and incentive businesses’ statements of operations information and EI for the years endedDecember 31, 2015, 2014 and 2013, respectively.
For the Year Ended December 31, 2015 2014 2013 (in thousands)Management Business:
Advisory and transaction fees from affiliates, net $ 14,186 $ 316,082 $ 196,562Management fees from affiliates 911,893 901,024 730,702Carried interest income from affiliates 40,625 41,199 36,922
Total Management Business Revenues 966,704 1,258,305 964,186Salary, bonus and benefits 355,922 339,846 294,753Equity-based compensation 62,184 105,495 66,341Other expenses 230,745 243,207 272,949
Total Management Business Expenses 648,851 688,548 634,043Other income, net 7,694 41,803 37,879Non-Controlling Interests (11,684) (12,688) (13,985)Management Business Economic Income $ 313,863 $ 598,872 $ 354,037Incentive Business:
Carried interest income (loss) from affiliates: Unrealized gains (losses)(1) $ (387,541) $ (1,347,786) $ 402,835Realized gains 444,206 1,713,108 2,456,404
Total Carried Interest Income 56,665 365,322 2,859,239Profit sharing expense:
Unrealized profit sharing expense (136,653) (517,308) 133,850Realized profit sharing expense 222,684 782,216 977,956
Total Profit Sharing Expense 86,031 264,908 1,111,806Other Income:
Net interest expense (26,533) (19,098) (23,191)Other income, net 483 10,896 10,203Net gains (losses) from investment activities 121,132 9,062 (12,593)Income from equity method investments 16,078 54,905 113,211
Total Other Income 111,160 55,765 87,630Incentive Business Economic Income $ 81,794 $ 156,179 $ 1,835,063Economic Income 395,657 755,051 2,189,100Income tax provision on Economic Income (10,518) (185,587) (173,679)Economic Net Income $ 385,139 $ 569,464 $ 2,015,421
(1) Included in unrealized carried interest losses from affiliates for the year ended December 31, 2015 was a reversal of previously realized carried interest income due tothe general partner obligation to return previously distributed carried interest income. See note 18 to our consolidated financial statements for further detail regarding thegeneral partner obligation.
- 113-

Table of Contents
Summary of Distributable Earnings
The following table is a summary of DE for the years ended December 31, 2015, 2014 and 2013.
For the Year Ended December 31,
2015 2014 2013 (in thousands)Management Business Economic Income $ 313,863 $ 598,872 $ 354,037
Less: Non-cash revenues(1) (5,311) (260,513) (123,170)Add back: Equity-based compensation 62,184 105,495 66,341Add back: Depreciation, amortization and other 56,476 10,182 11,046
Management Business Distributable Earnings $ 427,212 $ 454,036 $ 308,254
Incentive Business Economic Income $ 81,794 $ 156,179 $ 1,835,063Less: Non-cash carried interest income(2) (29,900) — —Add back: Net unrealized carried interest loss 250,888 830,478 (268,985)Less: Unrealized investment and other (income) loss(3) (107,173) (10,913) (3,207)
Incentive Business Distributable Earnings $ 195,609 $ 975,744 $ 1,562,871
Distributable Earnings $ 622,821 $ 1,429,780 $ 1,871,125Taxes and related payables(4) (9,715) (73,565) (41,151)
Distributable Earnings After Taxes and Related Payables $ 613,106 $ 1,356,215 $ 1,829,974
(1) Includes monitoring fees paid by Athene to Apollo by delivery of common shares of Athene Holding and gains resulting from reductions of the tax receivable agreementliability due to changes in projected income estimates and estimated tax rates.
(2) Represents realized carried interest income settled by receipt of securities.
(3) Represents unrealized gains from our general partner investments in our funds and other investments.
(4) Represents the estimated current corporate, local and non-U.S. taxes as well as the payable under Apollo’s tax receivable agreement.
The following table is a reconciliation of Distributable Earnings per share of common and equivalents(1) to net distribution per share of commonand equivalent for the years ended December 31, 2015, 2014 and 2013.
For the Year Ended December 31,
2015 2014 2013 (in thousands, except per share data)Distributable Earnings After Taxes and Related Payables $ 613,106 $ 1,356,215 $ 1,829,974
Add back: Tax and related payables attributable to common and equivalents 12 66,429 32,192Distributable Earnings before certain payables(2) 613,118 1,422,644 1,862,166 Percent to common and equivalents 47% 45% 42%Distributable Earnings before other payables attributable to common and equivalents 290,420 633,380 784,268
Less: Tax and related payables attributable to common and equivalents (12) (66,429) (32,192)
Distributable Earnings attributable to common and equivalents $ 290,408 $ 566,951 $ 752,076
Distributable Earnings per share of common and equivalent(3) $ 1.50 $ 3.13 $ 4.49Retained capital per share of common and equivalent(3)(4) (0.12) (0.24) (0.51)
Net distribution per share of common and equivalent(3) $ 1.38 $ 2.89 $ 3.98
(1) Common and equivalents refers to Class A shares outstanding and RSUs that participate in distributions.
(2) Distributable earnings before certain payables represents Distributable Earnings before the deduction for the estimated current corporate taxes and the payable underApollo’s tax receivable agreement.
(3) Per share calculations are based on end of period total Class A shares outstanding and RSUs that participate in distributions.
- 114-

Table of Contents
(4) Retained capital is withheld pro-rata from common and equivalent holders and AOG unitholders.
Summary of Non-U.S. GAAP Measures
The table below sets forth a reconciliation of our non-U.S. GAAP performance measures to net income attributable to Apollo GlobalManagement, LLC for the years ended December 31, 2015, 2014 and 2013:
For the Year Ended December 31,
2015 2014 2013
Net Income Attributable to Apollo Global Management, LLC $ 134,497 $ 168,229 $ 659,391Net income attributable to Non-Controlling Interests in consolidated entities and Appropriated Partners’Capital 21,364 157,011 456,953Net income attributable to Non-Controlling Interests in the Apollo Operating Group 194,634 404,682 1,257,650
Net Income $ 350,495 $ 729,922 $ 2,373,994Income tax provision 26,733 147,245 107,569
Income Before Income Tax Provision $ 377,228 $ 877,167 $ 2,481,563Transaction-related charges and equity-based compensation 39,793 34,895 164,490Net income attributable to Non-Controlling Interests in consolidated entities (21,364) (157,011) (456,953)
Economic Income $ 395,657 $ 755,051 $ 2,189,100Income tax provision on Economic Income (10,518) (185,587) (173,679)
Economic Net Income $ 385,139 $ 569,464 $ 2,015,421Income tax provision on Economic Income 10,518 185,587 173,679Carried interest loss from affiliates (56,665) (365,322) (2,859,239)Profit sharing expense 86,031 264,908 1,111,806Other income (111,160) (55,765) (87,630)Equity-based compensation(1) 62,184 105,495 66,341Depreciation and amortization(2) 11,476 10,182 11,046
Fee-Related EBITDA $ 387,523 $ 714,549 $ 431,424Net realized carried interest income 221,522 930,892 1,478,448
Fee-Related EBITDA + 100% of Net Realized Carried Interest $ 609,045 $ 1,645,441 $ 1,909,872Realized investment and other income 3,987 44,852 84,423Non-cash revenues (35,211) (260,513) (123,170)Other(3) 45,000 — —
Distributable Earnings $ 622,821 $ 1,429,780 $ 1,871,125Taxes and related payables (9,715) (73,565) (41,151)
Distributable Earnings After Taxes and Related Payables $ 613,106 $ 1,356,215 $ 1,829,974
(1) Includes RSUs (excluding RSUs granted in connection with the 2007 private placement) and share options. Excludes equity-based compensation expense comprisingamortization of AOG Units.
(2) Includes amortization of leasehold improvements.
(3) Includes a reserve of $45 million accrued during the year ended December 31, 2015 in connection with an ongoing SEC regulatory matter principally concerning theacceleration of fees from fund portfolio companies. See note 16 to our consolidated financial statements for further detail regarding the ongoing SEC regulatory matter.
- 115-
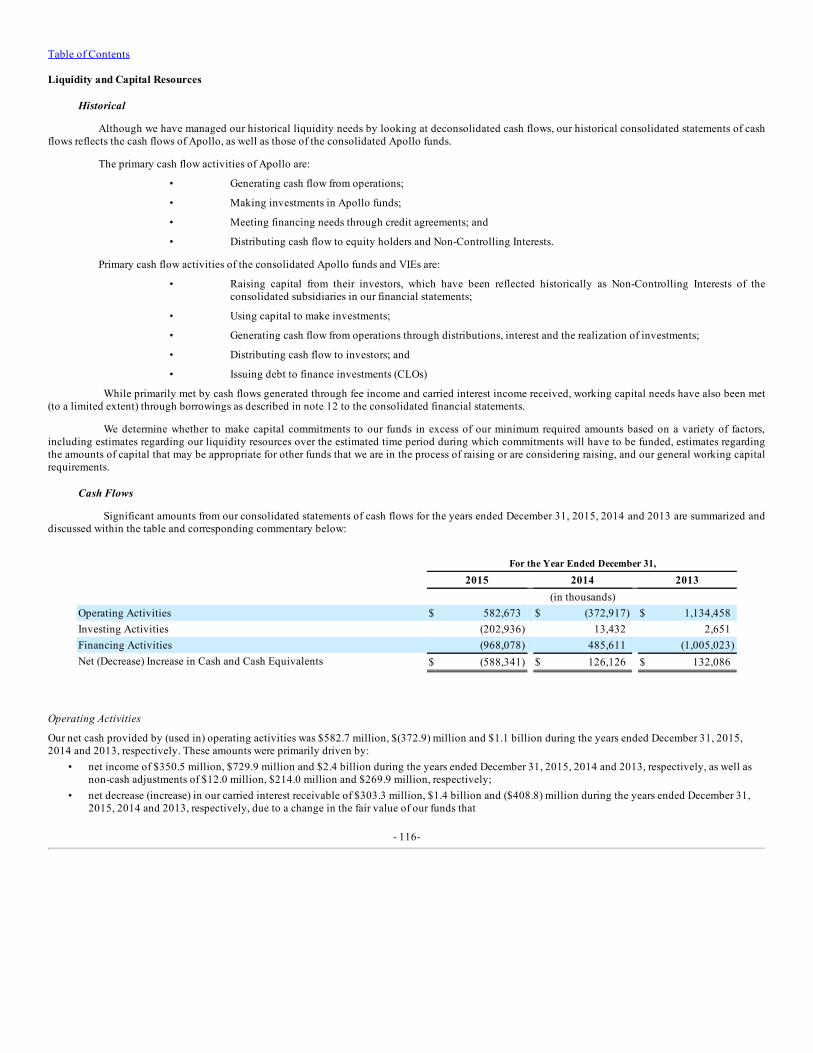
Table of Contents
Liquidity and Capital Resources
Historical
Although we have managed our historical liquidity needs by looking at deconsolidated cash flows, our historical consolidated statements of cashflows reflects the cash flows of Apollo, as well as those of the consolidated Apollo funds.
The primary cash flow activities of Apollo are:
• Generating cash flow from operations;
• Making investments in Apollo funds;
• Meeting financing needs through credit agreements; and
• Distributing cash flow to equity holders and Non-Controlling Interests.
Primary cash flow activities of the consolidated Apollo funds and VIEs are:
• Raising capital from their investors, which have been reflected historically as Non-Controlling Interests of theconsolidated subsidiaries in our financial statements;
• Using capital to make investments;
• Generating cash flow from operations through distributions, interest and the realization of investments;
• Distributing cash flow to investors; and
• Issuing debt to finance investments (CLOs)
While primarily met by cash flows generated through fee income and carried interest income received, working capital needs have also been met(to a limited extent) through borrowings as described in note 12 to the consolidated financial statements.
We determine whether to make capital commitments to our funds in excess of our minimum required amounts based on a variety of factors,including estimates regarding our liquidity resources over the estimated time period during which commitments will have to be funded, estimates regardingthe amounts of capital that may be appropriate for other funds that we are in the process of raising or are considering raising, and our general working capitalrequirements.
Cash Flows
Significant amounts from our consolidated statements of cash flows for the years ended December 31, 2015, 2014 and 2013 are summarized anddiscussed within the table and corresponding commentary below:
For the Year Ended December 31,
2015 2014 2013 (in thousands)Operating Activities $ 582,673 $ (372,917) $ 1,134,458Investing Activities (202,936) 13,432 2,651Financing Activities (968,078) 485,611 (1,005,023)Net (Decrease) Increase in Cash and Cash Equivalents $ (588,341) $ 126,126 $ 132,086
Operating Activities
Our net cash provided by (used in) operating activities was $582.7 million, $(372.9) million and $1.1 billion during the years ended December 31, 2015,2014 and 2013, respectively. These amounts were primarily driven by:
• net income of $350.5 million, $729.9 million and $2.4 billion during the years ended December 31, 2015, 2014 and 2013, respectively, as well asnon-cash adjustments of $12.0 million, $214.0 million and $269.9 million, respectively;
• net decrease (increase) in our carried interest receivable of $303.3 million, $1.4 billion and ($408.8) million during the years ended December 31,2015, 2014 and 2013, respectively, due to a change in the fair value of our funds that
- 116-

Table of Contents
generate carried interest of $181.5 million, $397.4 million and $2.8 billion during the years ended December 31, 2015, 2014 and 2013, respectively,offset by fund distributions to the Company (net of non-cash settlements) of $485.0 million, $1.8 billion and $2.4 billion during the years endedDecember 31, 2015, 2014 and 2013, respectively;
• purchases of investments held by consolidated VIEs in the amount of $521.2 million, $10.3 billion and $9.8 billion, offset by proceeds from sales ofinvestments held by consolidated VIEs in the amount of $409.2 million, $8.5 billion and $8.4 billion during the during the years endedDecember 31, 2015, 2014 and 2013, respectively; and
• net (decrease) increase in our profit sharing payable of ($122.6) million, ($518.0) million and $141.2 million during the years ended December 31,2015, 2014 and 2013, respectively, due to profit sharing expense (inclusive of the return of profit sharing distributions from employees, formeremployees and Contributing Partners that would be due if certain funds were liquidated) of $100.1 million, $276.2 million and $1.2 billion duringthe years ended December 31, 2015, 2014 and 2013, respectively, offset by payments of $239.2 million, $833.6 million and $1.0 billion during theyears ended December 31, 2015, 2014 and 2013, respectively.
Investing Activities
Our net cash (used in) provided by investing activities was $(202.9) million, $13.4 million and $2.7 million during the years ended December 31, 2015, 2014and 2013, respectively. These amounts were primarily driven by:
• net cash contributions from our equity method investments of $172.8 million and $33.6 million during the years ended December 31, 2015, and2014, respectively, and net cash distributions of $8.8 million in 2013
• proceeds from sales of investments (net of purchases of investments) in the amount of $50.0 million during the year ended December 31, 2014,respectively; and
• loans made to Apollo employees in the amount of $25.0 million during the year ended December 31, 2015.
Financing Activities
Our net cash (used in) provided by financing activities was ($968.1) million, $485.6 million and ($1.0) billion during the years ended December 31, 2015,2014 and 2013, respectively. These amounts were primarily driven by:
• issuance of debt (net of debt issuance costs and repayments of principal) in the amount of $278.5 million and $4.4 million for the years endedDecember 31, 2014 and 2013, respectively;
• payments made towards the satisfaction of our tax receivable agreement liability of $48.4 million, $32.0 million and $30.4 million during the yearsended December 31, 2015, 2014 and 2013, respectively (see note 15 for further discussion of the tax receivable agreement liability);
• cash distributions of $78.9 million and $85.9 million related to deliveries of Class A shares for RSUs for the years ended December 31, 2015 and2013, respectively;
• cash distributions paid to our Class A shareholders of $354.4 million, $506.0 million and $584.5 million during the years ended December 31, 2015,2014 and 2013, respectively;
• cash distributions paid to the Non-Controlling Interest holders in the Apollo Operating Group of $453.3 million, $816.4 million and $975.5 millionduring the years ended December 31, 2015, 2014 and 2013, respectively;
• issuance of debt (net of repayments of principal) held by consolidated VIEs in the amount of $1.9 billion and $529.0 million during the years endedDecember 31, 2014 and 2013, respectively; and
• net cash (distributions paid by) contributions to our consolidated funds and VIEs of ($3.4) million, ($263.8) million and $207.3 million during theyears ended December 31, 2015, 2014 and 2013, respectively.
Distributions
In addition to other distributions such as payments pursuant to the tax receivable agreement, see note 15 to the consolidated financial statementsfor information regarding the quarterly distributions which were made at the sole discretion of the Company’s manager during 2015, 2014 and 2013.
Future Cash Flows
Our ability to execute our business strategy, particularly our ability to increase our AUM, depends on our ability to establish new funds and toraise additional investor capital within such funds. Our liquidity will depend on a number of factors, such as our ability to project our financial performance,which is highly dependent on our funds and our ability to manage our projected costs, fund performance, our access to credit facilities, our being incompliance with existing credit agreements, as well as industry and market trends. Also during economic downturns the funds we manage might experiencecash flow issues or liquidate entirely. In these situations we might be asked to reduce or eliminate the management fee and incentive fees we charge, whichcould adversely impact our cash flow in the future.
- 117-

Table of Contents
An increase in the fair value of our funds’ investments, by contrast, could favorably impact our liquidity through higher management fees wherethe management fees are calculated based on the net asset value, gross assets and adjusted assets. Additionally, higher carried interest income not yet realizedwould generally result when investments appreciate over their cost basis which would not have an impact on the Company’s cash flow.
As of December 31, 2015, Fund VII’s and Fund VI’s remaining investments and escrow cash were valued at 106% and 95% of the fund’sunreturned capital, respectively, which was below the required escrow ratio of 115%. As a result, these funds are required to place in escrow current and futurecarried interest income distributions to the general partner until the specified return ratio of 115% is met (at the time of a future distribution) or uponliquidation.
On April 20, 2010, the Company announced that it entered into a strategic relationship agreement with CalPERS. The strategic relationshipagreement provides that Apollo will reduce fees charged to CalPERS on funds it manages, or in the future will manage, solely for CalPERS by $125 millionover a five-year period or as close a period as required to provide CalPERS with that benefit. The agreement further provides that Apollo will not use aplacement agent in connection with securing any future capital commitments from CalPERS. As of December 31, 2015, the Company had reduced feescharged to CalPERS on the funds it manages by approximately $100.7 million. Based on the Company’s current estimates, the reduction of fees will extenduntil 2017 in order for CalPERS to receive the full benefit of this arrangement.
Although we expect to pay distributions according to our distribution policy, we may not pay distributions according to our policy, or at all, if,among other things, we do not have the cash necessary to pay the intended distributions. To the extent we do not have cash on hand sufficient to paydistributions, we may have to borrow funds to pay distributions, or we may determine not to pay distributions. The declaration, payment and determination ofthe amount of our quarterly distributions are at the sole discretion of our manager.
On February 3, 2016, the Company announced its adoption of a plan to repurchase up to $250 million in the aggregate of its common shares,including up to $150 million in the aggregate of its outstanding common Class A shares through a share repurchase program and up to $100 million througha reduction of common Class A shares to be issued to employees to satisfy associated tax obligations in connection with the settlement of equity-basedawards granted under the Company’s equity incentive plan. Under the share repurchase program, shares may be repurchased from time to time in open markettransactions, in privately negotiated transactions or otherwise, with the size and timing of these repurchases depending on legal requirements, price, marketand economic conditions and other factors.
Carried interest income from our funds can be distributed to us on a current basis, but is subject to repayment by the subsidiaries of the ApolloOperating Group that act as general partner of such funds in the event that certain specified return thresholds are not ultimately achieved. The ManagingPartners, Contributing Partners and certain other investment professionals have personally guaranteed, to the extent of their ownership interest, subject tocertain limitations, the obligations of these subsidiaries in respect of this general partner obligation. Such guarantees are several and not joint and are limitedto a particular Managing Partner’s or Contributing Partner’s distributions. Pursuant to the shareholders agreement dated July 13, 2007, as amended (the“Shareholders Agreement”), we agreed to indemnify each of our Managing Partners and certain Contributing Partners against all amounts that they paypursuant to any of these personal guarantees in favor of Fund IV, Fund V and Fund VI (including costs and expenses related to investigating the basis for orobjecting to any claims made in respect of the guarantees) for all interests that our Managing Partners and Contributing Partners have contributed or sold tothe Apollo Operating Group.
Accordingly, in the event that our Managing Partners, Contributing Partners and certain investment professionals are required to pay amounts inconnection with a general partner obligation to return previously distributed carried interest income with respect to Fund IV, Fund V and Fund VI, we will beobligated to reimburse our Managing Partners and certain Contributing Partners for the indemnifiable percentage of amounts that they are required to payeven though we did not receive the distribution to which that general partner obligation related.
On November 9, 2015, Apollo announced that it mutually agreed with RCS Capital Corporation (“RCAP”) to amend the terms of the previouslyannounced sale of RCAP’s wholesale distribution business and certain related entities to Apollo. The amended purchase agreement provided for RCAP to sellits wholesale distribution business, including Realty Capital Securities and Strategic Capital, to Apollo for $6 million, subject to certain purchase priceadjustments. On December 2, 2015, RCAP announced that it had authorized plans to wind down the operations of Realty Capital Securities. On January 4,2016, RCAP announced its intent to file a voluntary petition for a prearranged Chapter 11 bankruptcy in late January 2016 and on January 31, 2016, RCAPfiled such petition. As a result of these developments, the transactions contemplated by the amended purchase agreement with RCAP will not beconsummated. Apollo is evaluating its rights with respect to these developments.
On January 14, 2016, the Company issued 529,395 Class A shares in settlement of vested RSUs. This issuance caused the Company’s ownershipinterest in the Apollo Operating Group to increase from 45.6% to 45.7%.
- 118-

Table of Contents
On February 3, 2016, the Company declared a cash distribution of $0.28 per Class A share, which will be paid on February 29, 2016 to holders ofrecord on February 19, 2016.
On February 5, 2016, the Company issued 2,745,799 Class A shares in settlement of vested RSUs. This issuance caused the Company’sownership interest in the Apollo Operating Group to increase from 45.7% to 46.0%.
Athene
Athene Holding is the ultimate parent of various insurance company operating subsidiaries. Through its subsidiaries, Athene Holding providesinsurance products focused primarily on the retirement market and its business centers primarily on issuing or reinsuring fixed indexed annuities.
Apollo, through its consolidated subsidiary, Athene Asset Management, L.P. (“Athene Asset Management”), provides asset management servicesto Athene, including asset allocation and portfolio management strategies, and receives fees from Athene for providing such services. As of December 31,2015, Athene Asset Management managed all of Athene’s portfolio assets, except with respect to the assets of Athene Germany, for which a different Apolloaffiliate provides investment advisory services. Athene Asset Management had $59.5 billion of total AUM as of December 31, 2015 in the Athene Accounts,of which approximately $14.6 billion, or approximately 24.5%, was either sub-advised by Apollo or invested in Apollo funds and investment vehicles. Thevast majority of such assets are in sub-advisory managed accounts that manage high grade credit asset classes, such as CLO debt, commercial mortgagebacked securities and insurance-linked securities. We expect this percentage to increase over time provided that Athene Asset Management continues toperform successfully in providing asset management services to Athene.
In accordance with the services agreement among AAA, AAA Investments and the other service recipients party thereto and Apollo (the “AAAServices Agreement”), AAA was obligated to pay a fee (the “Unwind Fee”) to Apollo if AAA commenced prior to December 31, 2015 a specified tender offerto all its qualified unitholders to purchase all of their equity interests in AAA in exchange for equity interests in a new carry vehicle to be managed by Apollo(the “Wind Up Tender Offer”) and thereafter distributed the common shares of Athene Holding held by AAA following the consummation of such Wind-UpTender Offer (or distributed the proceeds of any disposition of such shares). The obligation for AAA to pay the Unwind Fee terminated if the Wind Up TenderOffer was not commenced on or prior to December 31, 2015. At December 31, 2015, a Wind Up Tender Offer had not commenced. Accordingly, no UnwindFee was incurred. In addition, pursuant to the AAA limited partnership agreement, AAA was obligated to, no later than promptly following the expiration ofan initial lock-up period in respect of the Athene IPO, commence the Wind Up Tender Offer. Pursuant to the AAA limited partnership agreement, theobligation to make the Wind Up Tender Offer terminated if the Unwind Fee was no longer an obligation to Apollo. Accordingly, since the obligation to paythe Unwind Fee did not occur, there is no longer an obligation to make the Wind Up Tender Offer following the Athene IPO, and therefore no such Wind UpTender Offer will be made to AAA's shareholders.
In connection with the Athene Private Placement, Athene Holding amended its registration rights agreement to provide (i) investors who are partyto such agreement, including AAA Investments, the potential opportunity for liquidity on their shares of Athene Holding through sales in registered publicofferings over a 15 month period beginning on the date of Athene Holding’s initial public offering (the “Athene IPO”) and (ii) Athene Holding the right tocause certain investors who are party to the registration rights agreement to include in such offerings a certain percentage of their common shares of AtheneHolding subject to the terms and conditions set forth in the agreement. However, pursuant to the registration rights agreement, any shares of Athene Holdingheld by Apollo will not be subject to such arrangements and instead will be subject to a lock-up period of two years following the effective date of theregistration statement relating to the Athene IPO, but Athene Holding will not have the right to cause any shares owned by Apollo to be included in theAthene IPO or any follow-on offering.
As part of its ongoing financial integration of Aviva USA, Athene identified material weaknesses in its internal controls over financial reportingfor its U.S. GAAP and statutory financials as of December 31, 2013. A material weakness is a control deficiency, or combination of control deficiencies,such that there is a reasonable possibility that a material misstatement of the annual or interim financial statements will not be prevented, or detected andcorrected on a timely basis. If Athene fails to maintain effective internal control over financial reporting, it may not be able to accurately report its financialresults. While Athene was delayed in releasing financial statements within normal reporting periods over the past year, Athene released full year 2014 GAAPaudited consolidated financial statements on September 9, 2015 and consolidated financial statements as of and for the six months ended June 30, 2015 onOctober 6, 2015, and consolidated financial statements as of and for the nine months ended September 30, 2015 on December 17, 2015. Notwithstandingthese remediation efforts and delays in the release of its GAAP financial statements, Athene has continued to meet all regulatory filing deadlines with regardto financial statements prepared in accordance with Statutory Accounting principles and expects to do so for the quarter ended December 31, 2015.
- 119-

Table of Contents
During the year ended December 31, 2015, Apollo changed the valuation method used to value the investment in Athene Holding from theembedded value approach to the GAAP book value multiple approach. This change was driven by developments in Athene’s business as discussed in note 6to the consolidated financial statements.
Distributions to Managing Partners and Contributing Partners
The three Managing Partners who became employees of Apollo on July 13, 2007 each receive a $100,000 base salary. Additionally, ourManaging Partners can receive other forms of compensation. Any additional consideration will be paid to them in their proportional ownership interest inHoldings. Additionally, as a result of the tax receivable agreement, 85% of any tax savings APO Corp. recognizes will be paid to the Managing Partners.
Subsequent to the 2007 Reorganization, the Contributing Partners retained ownership interests in subsidiaries of the Apollo Operating Group.Therefore, any distributions that flow up to management or general partner entities in which the Contributing Partners retained ownership interests are sharedpro rata with the Contributing Partners who have a direct interest in such entities prior to flowing up to the Apollo Operating Group. These distributions areconsidered compensation expense.
The Contributing Partners are entitled to receive the following:
• Profit sharing related to private equity carried interest income, from direct ownership of advisory entities. Anychanges in fair value of the underlying fund investments would result in changes to Apollo Global Management,LLC’s profit sharing payable;
• Additional consideration based on their proportional ownership interest in Holdings; and
• As a result of the tax receivable agreement, 85% of any tax savings APO Corp. recognizes will be paid to theContributing Partners.
Potential Future Costs
We may make grants of RSUs or other equity-based awards to employees and independent directors that we appoint in the future.
Critical Accounting Policies
This Management’s Discussion and Analysis of Financial Condition and Results of Operations is based upon the consolidated financialstatements, which have been prepared in accordance with U.S. GAAP. The preparation of financial statements in accordance with U.S. GAAP requires the useof estimates and assumptions that could affect the reported amounts of assets and liabilities, the disclosure of contingent assets and liabilities and thereported amounts of revenues and expenses. Actual results could differ from these estimates. A summary of our significant accounting policies is presented innote 2 to our consolidated financial statements. The following is a summary of our accounting policies that are affected most by judgments, estimates andassumptions.
Consolidation
The types of entities with which Apollo is involved generally include subsidiaries (e.g., general partners and management companies related tothe funds the Company manages), entities that have all the attributes of an investment company (e.g., funds) and securitization vehicles (e.g., collateralizedloan obligations). Each of these entities is assessed for consolidation on a case by case basis depending on the specific facts and circumstances surroundingthat entity.
Pursuant to the new consolidation guidance adopted during the year, effective as of January 1, 2015, the Company first evaluates whether itholds a variable interest in an entity. Fees that are customary and commensurate with the level of services provided, and where the Company doesn’t holdother economic interests in the entity that would absorb more than an insignificant amount of the expected losses or returns of the entity, would not beconsidered a variable interest. Apollo factors in all economic interests including proportionate interests through related parties, to determine if fees are to beconsidered a variable interest. As Apollo’s interests in many of these entities are solely through carried interests, performance fees, and/or insignificantindirect interests through related parties, Apollo is generally not considered to have a variable interest in many of these entities under the new guidance andno further consolidation analysis is performed. Prior to adoption of the new consolidation guidance, fees received by the Company for investmentmanagement services (e.g. carried interest and performance fees) were considered variable interests. For the remaining entities where the Company hasdetermined that it does hold a variable interest, the Company performs an assessment to determine whether each of those entities qualify as a variable interestentity (“VIE”).
- 120-

Table of Contents
Entities that do not qualify as VIEs are generally assessed for consolidation as voting interest entities (“VOEs”) under the voting interest model.Under the voting interest model, Apollo consolidates those entities it controls through a majority voting interest. Apollo does not consolidate those VOEs inwhich substantive kick-out rights have been granted to the unaffiliated investors to either dissolve the fund or remove the general partner.
The consolidation assessment, including the determination as to whether an entity qualifies as a VIE depends on the facts and circumstancessurrounding each entity and therefore certain of Apollo’s funds may qualify as VIEs whereas others may qualify as VOEs. The granting of substantive kick-out rights is a key consideration in determining whether a limited partnership or similar entity is a VIE and whether or not that entity should be consolidated.For example, when the unaffiliated holders of equity investment at risk of a fund (assumed to be limited partnerships or similar entities) with sufficient equityto permit the fund to finance its activities without additional subordinated financial support are not granted substantive kick-out rights the fund isdetermined to be a VIE. Alternatively, when the unaffiliated holders of equity investment at risk are granted substantive kick-out rights, the fund is generallydetermined to be a VOE.
If the entity is determined to be a VIE, the Company assesses whether the entity should be consolidated by determining if Apollo is the primarybeneficiary of the entity. The Company is determined to be the primary beneficiary if it holds a controlling financial interest defined as possessing both(a) the power to direct the activities of a VIE that most significantly impact the VIE’s economic performance and (b) the obligation to absorb losses of the VIEor the right to receive benefits from the VIE that could potentially be significant to the VIE. When Apollo alone is not considered to have a controllingfinancial interest but Apollo and its related parties on an aggregate basis do have a controlling financial interest, Apollo is deemed to be the primarybeneficiary if substantially all the activities of the entity are performed on behalf of Apollo.
Apollo determines whether it is the primary beneficiary of a VIE at the time it becomes initially involved with the VIE and reconsiders thatconclusion continuously. Investments and redemptions (either by Apollo, affiliates of Apollo or third parties) or amendments to the governing documents ofthe respective entity may affect an entity’s status as a VIE or the determination of the primary beneficiary.
The assessment of whether an entity is a VIE and the determination of whether Apollo should consolidate such VIE requires judgment. Underboth the previous and the new guidance, those judgments include, but are not limited to: (i) determining whether the total equity investment at risk issufficient to permit the entity to finance its activities without additional subordinated financial support, (ii) evaluating whether the holders of equityinvestment at risk, as a group, can make decisions that have a significant effect on the success of the entity, (iii) determining whether the equity investorshave proportionate voting rights to their obligations to absorb losses or rights to receive the expected residual returns from an entity, and (iv) evaluating thenature of the relationship and activities of the parties involved in determining which party within a related-party group (only for those related parties withshared power or under common control under the new guidance) is most closely associated with the VIE. Judgments are also made in determining whether amember in the equity group has a controlling financial interest including power to direct activities that most significantly impact the VIEs’ economicperformance and rights to receive benefits or obligations to absorb losses that could be potentially significant to the VIE. This analysis includes intereststhrough related parties. Prior to adoption of the new guidance, where the VIEs had qualified for the deferral, judgments were made in estimating cash flows toevaluate which member within the equity group absorbed a majority of the expected losses or residual returns of the VIE.
Revenue Recognition
Carried Interest Income from Affiliates. We earn carried interest income from our funds as a result of such funds achieving specified performancecriteria. Such carried interest income generally is earned based upon a fixed percentage of realized and unrealized gains of various funds after meeting anyapplicable hurdle rate or threshold minimum. Carried interest income from certain of the funds that we manage is subject to contingent repayment and isgenerally paid to us as particular investments made by the funds are realized. If, however, upon liquidation of a fund, the aggregate amount paid to us ascarried interest exceeds the amount actually due to us based upon the aggregate performance of the fund, the excess (in certain cases net of taxes) is requiredto be returned by us to that fund. For a majority of our credit funds, once the annual carried interest income has been determined, there generally is no look-back to prior periods for a potential contingent repayment, however, carried interest income on certain other credit funds can be subject to contingentrepayment at the end of the life of the fund. We have elected to adopt Method 2 from U.S. GAAP guidance applicable to accounting for management feesbased on a formula, and under this method, we accrue carried interest income quarterly based on fair value of the underlying investments and separatelyassess if contingent repayment is necessary. The determination of carried interest income and contingent repayment considers both the terms of the respectivepartnership agreements and the current fair value of the underlying investments within the funds. Estimates and assumptions are made when determining thefair value of the underlying investments within the funds and could vary depending on the valuation methodology that is used. See “Investments, at FairValue” below for further discussion related to significant estimates and assumptions used for determining fair value of the underlying investments in ourprivate equity, credit and real estate funds.
- 121-

Table of Contents
Management Fees from Affiliates. The management fees related to our private equity funds are generally based on a fixed percentage of thecommitted capital or invested capital. The corresponding fee calculations that consider committed capital or invested capital are both objective in nature andtherefore do not require the use of significant estimates or assumptions. Management fees related to our credit funds, by contrast, can be based on net assetvalue, gross assets, adjusted cost of all unrealized portfolio investments, capital commitments, adjusted assets, capital contributions, or stockholders’ equityall as defined in the respective partnership agreements. The credit management fee calculations that consider net asset value, gross assets, adjusted cost of allunrealized portfolio investments and adjusted assets, are normally based on the terms of the respective partnership agreements and the current fair value ofthe underlying investments within the funds. Estimates and assumptions are made when determining the fair value of the underlying investments within thefunds and could vary depending on the valuation methodology that is used. The management fees related to our real estate funds are generally based on aspecific percentage of the funds’ stockholders’ equity or committed or net invested capital or the capital accounts of the limited partners. See “Investments, atFair Value” below for further discussion related to significant estimates and assumptions used for determining fair value of the underlying investments in ourprivate equity, credit and real estate funds.
Investments, at Fair Value
On a quarterly basis, Apollo utilizes valuation committees consisting of members from senior management, to review and approve the valuationresults related to the investments of the funds it manages. For certain publicly traded vehicles managed by Apollo, a review is performed by an independentboard of directors. The Company also retains independent valuation firms to provide third-party valuation consulting services to Apollo, which consist ofcertain limited procedures that management identifies and requests them to perform. The limited procedures provided by the independent valuation firmsassist management with validating their valuation results or determining fair value. The Company performs various back-testing procedures to validate theirvaluation approaches, including comparisons between expected and observed outcomes, forecast evaluations and variance analyses. However, because of theinherent uncertainty of valuation, the estimated values may differ significantly from the values that would have been used had a ready market for theinvestments existed, and the differences could be material.
Private Equity Investments. The majority of the illiquid investments within our private equity funds are valued using the market approach,which provides an indication of fair value based on a comparison of the subject company to comparable publicly traded companies and transactions in theindustry.
Market Approach. The market approach is driven by current market conditions, including actual trading levels of similar companies and, to theextent available, actual transaction data of similar companies. Judgment is required by management when assessing which companies are similar to thesubject company being valued. Consideration may also be given to any of the following factors: (1) the subject company’s historical and projected financialdata; (2) valuations given to comparable companies; (3) the size and scope of the subject company’s operations; (4) the subject company’s individualstrengths and weaknesses; (5) expectations relating to the market’s receptivity to an offering of the subject company’s securities; (6) applicable restrictionson transfer; (7) industry and market information; (8) general economic and market conditions; and (9) other factors deemed relevant. Market approachvaluation models typically employ a multiple that is based on one or more of the factors described above. Sources for gaining additional knowledge relatedto comparable companies include public filings, annual reports, analyst research reports, and press releases. Once a comparable company set is determined,we review certain aspects of the subject company’s performance and determine how its performance compares to the group and to certain individuals in thegroup. We compare certain measurements such as EBITDA margins, revenue growth over certain time periods, leverage ratios, and growth opportunities. Inaddition, we compare our entry multiple and its relation to the comparable set at the time of acquisition to understand its relation to the comparable set oneach measurement date.
Income Approach. For investments where the market approach does not provide adequate fair value information, we rely on the incomeapproach. The income approach is also used to value investments or validate the market approach within our private equity funds. The income approachprovides an indication of fair value based on the present value of cash flows that a business or security is expected to generate in the future. The most widelyused methodology for the income approach is a discounted cash flow method. Inherent in the discounted cash flow method are significant assumptionsrelated to the subject company’s expected results and a calculated discount rate, which is normally based on the subject company’s weighted average cost ofcapital, or “WACC.” The WACC represents the required rate of return on total capitalization, which is comprised of a required rate of return on equity, plusthe current tax-effected rate of return on debt, weighted by the relative percentages of equity and debt that are typical in the industry. The most critical step indetermining the appropriate WACC for each subject company is to select companies that are comparable in nature to the subject company and the creditquality of the subject company. Sources for gaining additional knowledge about the comparable companies include public filings, annual reports, analystresearch reports, and press releases. The general formula then used for calculating the WACC considers the after-tax rate of return on debt capital and the rateof return on common equity capital, which further considers the risk-free rate of return, market beta, market risk premium and small stock premium, ifapplicable. The variables used in the WACC formula are inferred from the comparable market data obtained.
- 122-

Table of Contents
The Company evaluates the comparable companies selected and concludes on WACC inputs based on the most comparable company or analyzes the rangeof data for the investment.
The value of liquid investments, where the primary market is an exchange (whether foreign or domestic), is determined using period end marketprices. Such prices are generally based on the close price on the date of determination.
Credit Investments. The majority of investments in Apollo’s credit funds are valued based on quoted market prices and valuation models.
Quoted market prices are valued based on the average of the “bid” and the “ask” quotes provided by multiple brokers wherever possible without anyadjustments. Apollo will designate certain brokers to use to value specific securities. In order to determine the designated brokers, Apollo considers thefollowing: (i) brokers with which Apollo has previously transacted, (ii) the underwriter of the security and (iii) active brokers indicating executable quotes. Inaddition, when valuing a security based on broker quotes wherever possible Apollo tests the standard deviation amongst the quotes received and the variancebetween the concluded fair value and the value provided by a pricing service. When broker quotes are not available, we use pricing service quotes or othersources to mark a position. When relying on a pricing service as a primary source, (i) Apollo analyzes how the price has moved over the measurement period(ii) reviews the number of brokers included in the pricing service’s population and (iii) validates the valuation levels with Apollo’s pricing team and traders.
Debt and equity securities that are not publicly traded or whose market prices are not readily available are valued at fair value utilizing a modelbased approach is used to determine fair value. When determining fair value when no observable market value exists, the value attributed to an investment isbased on the price that would be received to sell an asset or paid to transfer a liability in an orderly transaction between market participants at themeasurement date. Valuation approaches used to estimate the fair value of illiquid credit investments also may include the market approach and the incomeapproach, as previously described above. The valuation approaches used consider, as applicable, market risks, credit risks, counterparty risks and foreigncurrency risks.
The credit funds also enter into foreign currency exchange contracts, total return swap contracts, credit default swap contracts, and other derivativecontracts, which may include options, caps, collars and floors. Foreign currency exchange contracts are marked-to-market by recognizing the differencebetween the contract exchange rate and the current market rate as unrealized appreciation or depreciation. If securities are held at the end of this period, thechanges in value are recorded in income as unrealized. Realized gains or losses are recognized when contracts are settled. Total return swap and credit defaultswap contracts are recorded at fair value as an asset or liability, with changes in fair value recorded as unrealized appreciation or depreciation. Realized gainsor losses are recognized at the termination of the contract based on the difference between the close-out price of the total return or credit default swap contractand the original contract price. Forward contracts are valued based on market rates obtained from counterparties or prices obtained from recognized financialdata service providers.
Real Estate Investments. For the CMBS portfolio of Apollo’s funds, the estimated fair value of the CMBS portfolio is determined by reference tomarket prices provided by certain dealers who make a market in these financial instruments. Broker quotes are only indicative of fair value and may notnecessarily represent what the funds would receive in an actual trade for the applicable instrument. Additionally, the loans held-for-investment are stated atthe principal amount outstanding, net of deferred loan fees and costs. The Company evaluates its loans for possible impairment on a quarterly basis. ForApollo’s real estate funds, valuations of non-marketable underlying investments are determined using methods that include, but are not limited to(i) discounted cash flow estimates or comparable analysis prepared internally, (ii) third party appraisals or valuations by qualified real estate appraisers, and(iii) contractual sales value of investments/properties subject to bona fide purchase contracts. Methods (i) and (ii) also incorporate consideration of the use ofthe income, cost, or sales comparison approaches of estimating property values.
The fair values of the investments in our private equity, credit and real estate funds can be impacted by changes to the assumptions used in theunderlying valuation models. For further discussion on the impact of changes to valuation assumptions see “Item 7A. Quantitative and QualitativeDisclosures About Market Risk—Sensitivity” in this Annual Report on Form 10-K. There have been no material changes to the underlying valuation modelsduring the periods that our financial results are presented in this report.
Fair Value of Financial Instruments
Except for the Company’s debt obligations related to the 2013 AMH Credit Facilities and 2024 Senior Notes (each as defined in note 12 to ourconsolidated financial statements), Apollo’s financial instruments are recorded at fair value or at amounts whose carrying values approximate fair value. See“—Investments, at Fair Value” above. While Apollo’s valuations of portfolio investments are based on assumptions that Apollo believes are reasonable underthe circumstances, the actual realized gains or losses will depend on, among other factors, future operating results, the value of the assets and marketconditions at the
- 123-

Table of Contents
time of disposition, any related transaction costs and the timing and manner of sale, all of which may ultimately differ significantly from the assumptions onwhich the valuations were based. Financial instruments’ carrying values generally approximate fair value because of the short-term nature of thoseinstruments or variable interest rates related to the borrowings.
Profit Sharing Expense. Profit sharing expense is primarily a result of agreements with our Contributing Partners and employees to compensatethem based on the ownership interest they have in the general partners of the Apollo funds. Therefore, changes in the fair value of the underlying investmentsin the funds we manage and advise affect profit sharing expense. The Contributing Partners and employees are allocated approximately 30% to 50% of thetotal carried interest income which is driven primarily by changes in fair value of the underlying fund’s investments and is treated as compensation expense.Additionally, profit sharing expenses paid may be subject to clawback from employees, former employees and Contributing Partners to the extent notindemnified.
Changes in the fair value of the contingent obligations that were recognized in connection with certain Apollo acquisitions are reflected in theCompany’s consolidated statements of operations as profit sharing expense.
The Company has adopted a performance based incentive arrangement for certain Apollo partners and employees designed to more closely aligncompensation on an annual basis with the overall realized performance of the Company. This arrangement, which we refer to herein as the “Incentive Pool,”enables certain partners and employees to earn discretionary compensation based on carried interest realizations earned by the Company in a given year,which amounts are reflected in profit sharing expense in the accompanying consolidated financial statements. The Company adopted the Incentive Pool toattract and retain, and provide incentive to, partners and employees of the Company and to more closely align the overall compensation of partners andemployees with the overall realized performance of the Company. Allocations to the Incentive Pool and to its participants contain both a fixed and adiscretionary component and may vary year-to-year depending on the overall realized performance of the Company and the contributions and performance ofeach participant. There is no assurance that the Company will continue to compensate individuals through performance-based incentive arrangements in thefuture and there may be periods when the executive committee of the Company’s manager determines that allocations of realized carried interest income arenot sufficient to compensate individuals, which may result in an increase in salary, bonus and benefits.
Equity-Based Compensation. Equity-based compensation is accounted for in accordance with U.S. GAAP, which requires that the cost ofemployee services received in exchange for an award is generally measured based on the grant date fair value of the award. Equity-based awards that do notrequire future service (i.e., vested awards) are expensed immediately. Equity-based employee awards that require future service are recognized over therelevant service period. Further, as required under U.S. GAAP, the Company estimates forfeitures using industry comparables or historical trends for equity-based awards that are not expected to vest. Apollo’s equity-based awards consist of, or provide rights with respect to, AOG Units, RSUs, share options,restricted shares, AHL Awards and other equity-based compensation awards. For more information regarding Apollo’s equity-based compensation awards, seenote 14 to our consolidated financial statements. The Company’s assumptions made to determine the fair value on grant date and the estimated forfeiture rateare embodied in the calculations of compensation expense.
A significant part of our compensation expense is derived from amortization of RSUs. The fair value of all RSU grants after March 29, 2011 isbased on the grant date fair value, which considers the public share price of the Company. RSUs are comprised of Plan Grants, which generally do not paydistributions until vested and, for grants made after 2011, the underlying shares are generally issued by March 15th after the year in which they vest, andBonus Grants, which pay distributions on both vested and unvested grants and are generally issued after vesting on an approximate two-month lag. For PlanGrants, the grant date fair value is based on the public share price of the Company, and is discounted for transfer restrictions and lack of distributions untilvested. For Bonus Grants, the grant date fair value is based on the public share price of the Company, and is discounted for transfer restrictions.
We utilized the present value of a growing annuity formula to calculate a discount for the lack of pre-vesting distributions on Plan Grant RSUs.The weighted average for the inputs utilized for the shares granted during the years ended December 31, 2015, 2014 and 2013 are presented in the tablebelow for Plan Grants:
For the Year Ended December 31,
2015 2014 2013
Distribution Yield(1) 11.0% 14.3% 9.5%Discount Rate for Pre-Vesting Distributions not Accrued(2) 9.1% 12.3% 17.6%
(1) Calculated based on the historical distributions paid during the last twelve months and the Company’s Class A share price as of the measurement date of the grant on aweighted average basis.
- 124-

Table of Contents
(2) Assumes a discount rate that was equivalent to the opportunity cost of foregoing distributions on unvested Plan Grant RSUs as of the valuation date, based on theCapital Asset Pricing Model (“CAPM”). CAPM is a commonly used mathematical model for developing expected returns.
The following table summarizes the weighted average discounts for Plan Grants for the years ended December 31, 2015, 2014 and 2013:
For the Year Ended December 31,
2015 2014 2013
Plan Grants: Discount for the lack of distributions until vested(1) 26.0% 32.5% 30.5%
(1) Based on the present value of a growing annuity calculation.
We utilized the Finnerty Model to calculate a marketability discount on the Plan Grant and Bonus Grant RSUs to account for the lag betweenvesting and issuance. The Finnerty Model provides for a valuation discount reflecting the holding period restriction embedded in a restricted securitypreventing its sale over a certain period of time.
The Finnerty Model proposes to estimate a discount for lack of marketability such as transfer restrictions by using an option pricing theory. Thismodel has gained recognition through its ability to address the magnitude of the discount by considering the volatility of a company’s stock price and thelength of restriction. The concept underpinning the Finnerty Model is that a restricted security cannot be sold over a certain period of time. Furthersimplified, a restricted share of equity in a company can be viewed as having forfeited a put on the average price of the marketable equity over the restrictionperiod (also known as an “Asian Put Option”). If we price an Asian Put Option and compare this value to that of the assumed fully marketable underlyingsecurity, we can effectively estimate the marketability discount.
The inputs utilized in the Finnerty Model were (i) length of holding period, (ii) volatility and (iii) distribution yield. The weighted average forthe inputs utilized for the shares granted during the years ended December 31, 2015, 2014 and 2013 are presented in the table below for Plan Grants andBonus Grants:
For the Year Ended December 31,
2015 2014 2013
Plan Grants Holding Period Restriction (in years) 0.6 0.6 0.6Volatility(1) 25.7% 31.4% 30.4%Distribution Yield(2) 11.0% 14.3% 8.2%
Bonus Grants Holding Period Restriction (in years) 0.2 0.2 0.2Volatility(1) 22.2% 32.1% 30.0%Distribution Yield(2) 10.8% 13.7% 12.2%
(1) The Company determined the expected volatility based on the volatility of the Company’s Class A share price as of the grant date with consideration to comparablecompanies.
(2) Calculated based on the historical distributions paid during the last twelve months and the Company’s Class A share price as of the measurement date of the grant on aweighted average basis.
- 125-

Table of Contents
The following table summarizes the weighted average marketability discounts for Plan Grants and Bonus Grants for the years ended December31, 2015, 2014 and 2013:
For the Year Ended December 31,
2015 2014 2013
Plan Grants: Marketability discount for transfer restrictions(1) 4.2% 5.1% 6.0%
Bonus Grants: Marketability discount for transfer restrictions(1) 2.2% 3.2% 3.2%
(1) Based on the Finnerty Model calculation.
After the grant date fair value is determined, an estimated forfeiture rate is applied. The estimated fair value was determined and recognized overthe vesting period on a straight-line basis. A 6.0% forfeiture rate is estimated for RSUs, based on the Company’s historical attrition rate as well as industrycomparable rates. If employees are no longer associated with Apollo or if there is no turnover, we will revise our estimated compensation expense to theactual amount of expense based on the RSUs vested at the reporting date in accordance with U.S. GAAP.
Fair Value Measurements
See note 6 to our consolidated financial statements for a discussion of the Company’s fair value measurements.
Recent Accounting Pronouncements
A list of recent accounting pronouncements that are relevant to Apollo and its industry is included in note 2 to our consolidated financialstatements.
Off-Balance Sheet Arrangements
In the normal course of business, we engage in off-balance sheet arrangements, including transactions in derivatives, guarantees, commitments,indemnifications and potential contingent repayment obligations. See note 16 to our consolidated financial statements for a discussion of guarantees andcontingent obligations.
Contractual Obligations, Commitments and Contingencies
As of December 31, 2015, the Company’s material contractual obligations consisted of lease obligations, contractual commitments as part of theongoing operations of the funds and debt obligations. Fixed and determinable payments due in connection with these obligations are as follows:
2016 2017 2018 2019 2020 Thereafter Total (in thousands)Operating lease obligations(1) $ 37,812 $ 35,871 $ 31,207 $ 30,641 $ 14,159 $ 10,817 $ 160,507Other long-term obligations(2) 10,594 5,282 4,908 2,329 — — 23,1132013 AMH Credit Facilities - Term Facility(3) 8,254 8,254 8,254 500,413 — — 525,1752013 AMH Credit Facilities - Revolver Facility(4) 625 625 625 8 — — 1,8832024 Senior Notes (5) 20,000 20,000 20,000 20,000 20,000 568,333 668,3332014 AMI Term Facility I 298 298 298 14,693 — — 15,5872014 AMI Term Facility II 295 295 295 17,108 — — 17,993
Obligations as of December 31, 2015 $ 77,878 $ 70,625 $ 65,587 $ 585,192 $ 34,159 $ 579,150 $ 1,412,591 (1) The Company has entered into sublease agreements and is expected to contractually receive approximately $3.4 million over the life of the agreements.(2) Includes (i) payments on management service agreements related to certain assets and (ii) payments with respect to certain consulting agreements entered into by the
Company. Note that a significant portion of these costs are reimbursable by funds.(3) $500 million of the outstanding Term Facility matures in January 2019. The interest rate on the $500 million Term Facility as of December 31, 2015 was 1.65%. See
note 12 of the consolidated financial statements for further discussion of the 2013 AMH Credit Facilities.
- 126-

Table of Contents
(4) The commitment fee as of December 31, 2015 on the $500 million undrawn Revolver Facility was 0.125%. See note 12 of the consolidated financial statements forfurther discussion of the 2013 AMH Credit Facilities.
(5) $500 million of the 2024 Senior Notes matures in May 2024. The interest rate on the 2024 Senior Notes as of December 31, 2015 was 4.00%. See note 12 of theconsolidated financial statements for further discussion of the 2024 Senior Notes.
Note: Due to the fact that the timing of certain amounts to be paid cannot be determined or for other reasons discussed below, the following contractual commitments have notbeen presented in the table above.
(i) As noted previously, we have entered into a tax receivable agreement with our Managing Partners and Contributing Partners which requires us to pay to our ManagingPartners and Contributing Partners 85% of any tax savings received by APO Corp. from our step-up in tax basis. The tax savings achieved may not ensure that wehave sufficient cash available to pay this liability and we might be required to incur additional debt to satisfy this liability.
(ii) Debt amounts related to the consolidated VIEs are not presented in the table above as the Company is not a guarantor of these non-recourse liabilities.(iii) In connection with the Stone Tower and Gulf Stream acquisitions, the Company agreed to pay the former owners of Stone Tower and Gulf Stream a specified
percentage of any future carried interest income earned from certain of the Stone Tower and Gulf Stream funds, CLOs and strategic investment accounts. Thiscontingent consideration liability is remeasured to fair value at each reporting period until the obligations are satisfied. See note 16 for further information regarding thecontingent consideration liability.
Commitments
Certain of our management companies and general partners are committed to contribute to the funds we manage and certain affiliates. While asmall percentage of these amounts are funded by us, the majority of these amounts have historically been funded by our affiliates, including certain of ouremployees and certain Apollo funds. The table below presents the commitment and remaining commitment amounts of Apollo and its affiliates, thepercentage of total fund commitments of Apollo and its affiliates, the commitment and remaining commitment amounts of Apollo only (excluding affiliates),and the percentage of total fund commitments of Apollo only (excluding affiliates) for each private equity, credit and real estate fund as of December 31,2015 as follows ($ in millions):
Fund
Apollo andAffiliates
Commitments % of Total
FundCommitments
Apollo Only(ExcludingAffiliates)
Commitments
Apollo Only(ExcludingAffiliates)
% of Total Fund
Commitments
Apollo andAffiliates
RemainingCommitments
Apollo Only(ExcludingAffiliates)Remaining
Commitments
Private Equity: Fund IV $ 100.0 2.78% $ 0.2 0.01% $ 0.5 $ —
Fund V 100.0 2.67 0.5 0.01 6.3 —
Fund VI 246.3 2.43 6.1 0.06 9.7 0.2
Fund VII 467.2 3.18 178.0 1.21 80.9 29.6
Fund VIII 1,543.5 8.40 401.6 2.19 1,099.3 289.9
ANRP I 426.1 32.21 10.0 0.75 132.8 3.2
ANRP II 292.0 16.87 42.0 2.43 242.8 35.4
AION 151.5 18.34 50.0 6.05 106.9 35.0
APC 158.5 69.06 0.1 0.04 67.6 —
Apollo Rose, L.P. 215.7 100.00 — — 46.8 —
A.A Mortgage Opportunities, L.P. 440.0 87.44 — — 154.4 —
Champ, L.P. 74.4 100.00 19.0 25.56 11.5 2.9
Apollo Royalties Management, LLC 100.0 100.00 — — 6.3 —
Credit: ACLF 23.9 2.43 23.9 2.43 1.2 1.2
COF I 449.2 30.26 29.7 2.00 237.1 4.2
COF II 30.5 1.93 23.4 1.48 0.8 0.6
COF III 358.1 10.45 83.1 2.43 104.3 24.5
EPF I(2)292.8 20.74 19.3 1.37 48.3 4.5
EPF II(2)410.2 12.25 63.0 1.88 143.2 24.3
AIE II(2)7.1 3.15 4.4 1.94 — —
AIE III(2)9.8 2.91 9.8 2.91 6.1 6.1
Palmetto 18.0 1.19 18.0 1.19 10.9 10.9
AEC 7.3 2.50 3.2 1.08 2.5 1.1
AESI(2)3.2 0.99 3.2 0.99 0.2 0.2
AESI II 2.8 0.99 2.8 0.99 1.4 1.4
ACSP 18.8 2.44 18.8 2.44 6.7 6.7
Apollo SK Strategic Investments, L.P. 2.0 0.99 2.0 0.99 0.4 0.4
Apollo Tactical Value SPN Investments, L.P. 10.0 1.96 10.0 1.96 8.0 8.0
- 127-

Table of Contents
Franklin Fund 9.9 9.09 9.9 9.09 — —
Apollo Zeus Strategic Investments, L.P. 14.0 3.38 14.0 3.38 4.0 4.0
Apollo Lincoln Fixed Income Fund 2.5 0.99 2.5 0.99 0.6 0.6
Apollo Lincoln Private Credit Fund, L.P. 2.5 0.99 2.5 0.99 2.1 2.1
Stone Tower Structured Credit Recovery Master Fund II,Ltd. 7.8 7.47 — — — —
Apollo Structured Credit Recovery Master Fund III, Ltd. 230.2 18.59 3.6 0.29 101.2 1.6
MidCap 1,208.6 74.71 79.9 4.94 — —
AEOF 125.5 12.01 25.5 2.44 72.0 14.6
Apollo A-N Credit Fund, L.P. 7.0 1.96 7.0 1.96 2.6 2.0
Union Street Partners 4.4 2.00 4.4 2.00 3.3 3.3
FCI 95.3 17.05 — — 53.6 —
FCI II 244.6 15.72 — — 88.9 —
Apollo/Palmetto Loan Portfolio, L.P. — 100.00 — 100.00 — —
Apollo/Palmetto Short-Maturity Loan Portfolio, L.P. 300.0 100.00 — — — —
Apollo Hercules Partners, L.P. 7.5 2.44 7.5 2.44 6.4 6.4
Real Estate: U.S. RE Fund I 433.3 (1) 69.46 16.1 2.45 132.2 (1) 3.2
U.S. RE Fund II 323.8 82.04 7.4 1.89 211.6 4.9
CPI Capital Partners North America 7.6 1.27 2.1 0.35 0.6 0.2
CPI Capital Partners Europe(2)6.0 0.47 — — 0.4 —
CPI Capital Partners Asia Pacific 6.9 0.53 0.5 0.04 0.4 —
BEA/AGRE China Real Estate Fund, L.P. 0.1 1.03 0.1 1.03 — —
Apollo-IC, L.P. (Shanghai Village) 0.8 100.00 0.8 100.00 0.4 0.4
AGRE Cobb West Investor, L.P. 0.1 0.39 0.1 0.39 — —
AGRE Asia Co-Invest I Limited 50.0 100.00 — — 35.7 —
CAI Strategic European Real Estate Ltd.(2)15.8 92.13 — — 3.0 —
London Prime Apartments Guernsey Holdings Limited(London Prime Apartments)(3) 26.0 7.80 0.8 0.23 6.4 0.2
2012 CMBS I Fund, L.P. 89.5 100.00 — — — —
2012 CMBS II Fund, L.P. 96.6 100.00 — — — —
AGRE CMBS Fund, L.P. 418.8 100.00 — — — —
Apollo USREF II (Williams Square Co-Invest) L.P. 25.0 28.90 — — 4.1 —
Other: Apollo SPN Investments I, L.P. 36.7 0.91 36.7 0.91 32.5 32.5
Total $ 9,755.7 $ 1,243.5 $ 3,298.9 $ 566.3
(1) Figures for U.S. RE Fund I include base, additional, and co-investment commitments. A co-investment vehicle within U.S. RE Fund I is denominated in pound sterling
and translated into U.S. dollars at an exchange rate of £1.00 to $1.47 as of December 31, 2015.(2) Apollo’s commitment in these funds is denominated in Euros and translated into U.S. dollars at an exchange rate of €1.00 to $1.09 as of December 31, 2015.(3) Apollo’s commitment in these investments is denominated in pound sterling and translated into U.S. dollars at an exchange rate of £1.00 to $1.47 as of December 31,
2015.
As a limited partner, the general partner and manager of the Apollo private equity, credit and real estate funds, Apollo had unfunded capitalcommitments of $566.3 million at December 31, 2015.
Apollo has an ongoing obligation to acquire additional common units of AAA in an amount equal to 25% of the aggregate after-tax cashdistributions, if any, that are made by AAA to Apollo’s affiliates pursuant to the carried interest distribution rights that are applicable to investments madethrough AAA Investments. In addition, on April 30, 2015, Apollo entered into a revolving credit agreement with AAA Investments (the “AAA InvestmentsCredit Agreement”). Under the terms of the AAA Investments Credit Agreement, the Company shall make available to AAA Investments one or moreadvances at the discretion of AAA Investments in the aggregate amount not to exceed a balance of $10.0 million at an applicable rate of LIBOR plus 1.5%.The Company receives an annual commitment fee of 0.125% on the unused portion of the loan. As of December 31, 2015, no advance on the AAAInvestments Credit Agreement was made by the Company.
The 2013 AMH Credit Facilities and 2024 Senior Notes will have future impacts on our cash uses. See note 12 of our consolidated financialstatements for information regarding the Company’s debt arrangements.
- 128-

Table of Contents
In accordance with the Shareholders Agreement, we have indemnified the Managing Partners and certain Contributing Partners (at varyingpercentages) for any carried interest income distributed from Fund IV, Fund V and Fund VI that is subject to contingent repayment by the general partner. TheCompany recorded an indemnification liability of $4.6 million as of December 31, 2015 related to this obligation. As of December 31, 2014, the Companyhad not recorded an obligation for any previously made distributions.
Contingent Obligations—Carried interest income in private equity and certain credit and real estate funds is subject to reversal in the event offuture losses to the extent of the cumulative carried interest recognized in income to date. If all of the existing investments became worthless, the amount ofcumulative revenues recognized by Apollo through December 31, 2015 that would be reversed approximates $2.4 billion. Management views the possibilityof all of the investments becoming worthless as remote. Carried interest income is affected by changes in the fair values of the underlying investments in thefunds that Apollo manages. Valuations, on an unrealized basis, can be significantly affected by a variety of external factors including, but not limited to,bond yields and industry trading multiples. Movements in these items can affect valuations quarter to quarter even if the underlying business fundamentalsremain stable.
Additionally, at the end of the life of certain funds that the Company manages, there could be a payment due to a fund by the Company if theCompany as general partner has received more carried interest income than was ultimately earned. This general partner obligation amount, if any, will dependon final realized values of investments at the end of the life of each fund or as otherwise set forth in the respective limited partnership agreement or othergoverning document of the fund. As of December 31, 2015, the Company recorded a general partner obligation to return previously distributed carriedinterest income of $72.0 million. See note 15 to the consolidated statements for further information regarding the general partner obligation.
- 129-

Table of Contents
ITEM 7A. QUANTITATIVE AND QUALITATIVE DISCLOSURES ABOUT MARKET RISK
Our predominant exposure to market risk is related to our role as investment manager and general partner for our funds and the sensitivity tomovements in the fair value of their investments and resulting impact on carried interest income and management fee revenues. Our direct investments in thefunds also expose us to market risk whereby movements in the fair values of the underlying investments will increase or decrease both net gains (losses) frominvestment activities and income (loss) from equity method investments. For a discussion of the impact of market risk factors on our financial instruments see“Item 7. Management’s Discussion and Analysis of Financial Condition and Results of Operations—Critical Accounting Policies—Investments, at FairValue.”
The fair value of our financial assets and liabilities of our funds may fluctuate in response to changes in the value of investments, foreignexchange, commodities and interest rates. The net effect of these fair value changes impacts the gains and losses from investments in our consolidatedstatements of operations. However, the majority of these fair value changes are absorbed by the Non-Controlling Interests.
The Company is subject to a concentration risk related to the investors in its funds. Although there are more than 1,000 investors in Apollo’sactive private equity, credit and real estate funds, no individual investor accounts for more than 10% of the total committed capital to Apollo’s active funds.
Risks are analyzed across funds from the “bottom up” and from the “top down” with a particular focus on asymmetric risk. We gather and analyzedata, monitor investments and markets in detail, and constantly strive to better quantify, qualify and circumscribe relevant risks.
Each risk management process is subject to our overall risk tolerance and philosophy and our enterprise-wide risk management framework. Thisframework includes identifying, measuring and managing market, credit and operational risks at each segment, as well as at the fund and Company level.
Each segment runs its own investment and risk management process subject to our overall risk tolerance and philosophy:
• The investment process of our private equity funds involves a detailed analysis of potential acquisitions, and investmentmanagement teams assigned to monitor the strategic development, financing and capital deployment decisions of eachportfolio investment.
• Our credit funds continuously monitor a variety of markets for attractive trading opportunities, applying a number oftraditional and customized risk management metrics to analyze risk related to specific assets or portfolios, as well as, fund-wide risks.
At the direction of the Company’s manager, the Company has established a risk committee comprised of various members of senior managementincluding the Company’s Chief Financial Officer, Chief Legal Officer, and the Company’s Chief Risk Officer. The risk committee is tasked with assisting theCompany’s manager in monitoring and managing enterprise-wide risk. The risk committee generally meets on a monthly basis and reports to the executivecommittee of the Company’s manager at such times as the committee deems appropriate and at least on an annual basis.
On at least a monthly basis, the Company’s risk department provides a summary analysis of fund level market and credit risk to the portfoliomanagers of the Company’s funds and the heads of the various business segments. On a periodic basis, the Company’s risk department presents aconsolidated summary analysis of fund level market and credit risk to the Company’s risk committee. In addition, the Company’s Chief Risk Officer reviewsspecific investments from the perspective of risk mitigation and discusses such analysis with the Company’s risk committee and/or the executive committeeof the Company’s manager at such times as the Company’s Chief Risk Officer determines such discussions are warranted. On an annual basis, the Company’sChief Risk Officer provides the executive committee of the Company’s manager with a comprehensive overview of risk management along with an update oncurrent and future risk initiatives.
Impact on Management Fees—Our management fees are based on one of the following:
• capital commitments to an Apollo fund;
• capital invested in an Apollo fund;
• the gross, net or adjusted asset value of an Apollo fund, as defined; or
• as otherwise defined in the respective agreements.
- 130-

Table of Contents
Management fees could be impacted by changes in market risk factors and management could consider an investment permanently impaired as aresult of (i) such market risk factors causing changes in invested capital or in market values to below cost, in the case of our private equity funds and certaincredit funds, or (ii) such market risk factors causing changes in gross or net asset value, for the credit funds. The proportion of our management fees that arebased on NAV is dependent on the number and types of our funds in existence and the current stage of each fund’s life cycle.
Impact on Advisory and Transaction Fees—We earn transaction fees relating to the negotiation of private equity, credit and real estatetransactions and may obtain reimbursement for certain out-of-pocket expenses incurred. Subsequently, on a quarterly or annual basis, ongoing advisory fees,and additional transaction fees in connection with additional purchases, dispositions, or follow-on transactions, may be earned. Management Fee Offsets andany broken deal costs are reflected as a reduction to advisory and transaction fees from affiliates, net. Advisory and transaction fees will be impacted bychanges in market risk factors to the extent that they limit our opportunities to engage in private equity, credit and real estate transactions or impair ourability to consummate such transactions. The impact of changes in market risk factors on advisory and transaction fees is not readily predicted or estimated.
Impact on Carried Interest Income—We earn carried interest income from our funds as a result of such funds achieving specified performancecriteria. Our carried interest income will be impacted by changes in market risk factors. However, several major factors will influence the degree of impact:
• the performance criteria for each individual fund in relation to how that fund’s results of operations are impacted bychanges in market risk factors;
• whether such performance criteria are annual or over the life of the fund;
• to the extent applicable, the previous performance of each fund in relation to its performance criteria; and
• whether each funds’ carried interest distributions are subject to contingent repayment.
As a result, the impact of changes in market risk factors on carried interest income will vary widely from fund to fund. The impact is heavilydependent on the prior and future performance of each fund, and therefore is not readily predicted or estimated.
Market Risk—We are directly and indirectly affected by changes in market conditions. Market risk generally represents the risk that values ofassets and liabilities or revenues and expenses will be adversely affected by changes in market conditions. Market risk is inherent in each of our investmentsand activities, including equity investments, loans, short-term borrowings, long-term debt, hedging instruments, credit default swaps, and derivatives. Just afew of the market conditions that may shift from time to time, thereby exposing us to market risk, include fluctuations in interest and currency exchange rates,equity prices, changes in the implied volatility of interest rates and price deterioration. Volatility in debt and equity markets can impact our pace of capitaldeployment, the timing of receipt of transaction fee revenues, and the timing of realizations. These market conditions could have an impact on the value offund investments and rates of return. Accordingly, depending on the instruments or activities impacted, market risks can have wide ranging, complex adverseeffects on our results from operations and our overall financial condition. We monitor market risk using certain strategies and methodologies whichmanagement evaluates periodically for appropriateness. We intend to continue to monitor this risk going forward and continue to monitor our exposure to allmarket factors.
Interest Rate Risk—Interest rate risk represents exposure we and our funds have to instruments whose values vary with the change in interest rates.These instruments include, but are not limited to, loans, borrowings and derivative instruments. We may seek to mitigate risks associated with the exposuresby having our funds take offsetting positions in derivative contracts. Hedging instruments allow us to seek to mitigate risks by reducing the effect ofmovements in the level of interest rates, changes in the shape of the yield curve, as well as, changes in interest rate volatility. Hedging instruments used tomitigate these risks may include related derivatives such as options, futures and swaps.
Credit Risk—Certain of our funds are subject to certain inherent risks through their investments.
Certain of our entities invest substantially all of their excess cash in open-end money market funds and money market demand accounts, which areincluded in cash and cash equivalents. The money market funds invest primarily in government securities and other short-term, highly liquid instrumentswith a low risk of loss. We continually monitor the funds’ performance in order to manage any risk associated with these investments.
Certain of our funds hold derivative instruments that contain an element of risk in the event that the counterparties may be unable to meet theterms of such agreements. We seek to minimize our risk exposure by limiting the counterparties with which our funds enter into contracts to banks andinvestment banks who meet established credit and capital guidelines. As of December 31, 2015, we do not expect any counterparty to default on itsobligations and therefore do not expect to incur any loss due to counterparty default.
- 131-

Table of Contents
Foreign Exchange Risk—Foreign exchange risk represents exposures our funds have to changes in the values of current fund holdings and futurecash flows denominated in other currencies and investments in non-U.S. companies. The types of investments exposed to this risk include investments inforeign subsidiaries, foreign currency-denominated loans, foreign currency-denominated transactions, and various foreign exchange derivative instrumentswhose values fluctuate with changes in currency exchange rates or foreign interest rates. Instruments used to mitigate this risk are foreign exchange options,currency swaps, futures and forwards. These instruments may be used to help insulate our funds against losses that may arise due to volatile movements inforeign exchange rates and/or interest rates.
In our capacity as investment manager of the funds we manage, we continuously monitor a variety of markets for attractive opportunities formanaging risk. For example, certain of the funds we manage may put in place foreign exchange hedges or borrowings with respect to certain foreign currencydenominated investments to provide a hedge against foreign exchange exposure.
Non-U.S. Operations—We conduct business throughout the world and are continuing to expand into foreign markets. We currently have officesoutside the U.S. in Toronto, London, Frankfurt, Madrid, Luxembourg, Mumbai, Delhi, Singapore, Hong Kong and Shanghai and have been strategicallygrowing our international presence. Our fund investments and our revenues are primarily derived from our U.S. operations. With respect to our non-U.S.operations, we are subject to risk of loss from currency fluctuations, social instability, changes in governmental policies or policies of central banks,expropriation, nationalization, unfavorable political and diplomatic developments and changes in legislation relating to non-U.S. ownership. Our funds alsoinvest in the securities of companies which are located in non-U.S. jurisdictions. As we continue to expand globally, we will continue to focus on monitoringand managing these risk factors as they relate to specific non-U.S. investments.
Sensitivity
Interest Rate Risk—Apollo has debt obligations that accrue interest at variable rates. Interest rate changes may therefore affect the amount of ourinterest payments, future earnings and cash flows. Based on our debt obligations payable as of December 31, 2015 and 2014, we estimate that interestexpense would increase on an annual basis, in the event interest rates were to increase by one percentage point, by approximately $5.3 million and $5.4million, respectively.
In addition to our debt obligations, we are also subject to interest rate risk through the investments of our funds. For funds that pay managementfees based on NAV or other bases that are sensitive to market value fluctuations, we anticipate our management fees would change consistent with theincrease or decrease experienced by the underlying funds’ portfolios. In the event that interest rates were to increase by one percentage point, we estimate thatmanagement fees earned on a segment basis that were dependent upon estimated fair value would decrease by approximately $10.9 million during the yearended December 31, 2015.
Credit Risk—Similar to interest rate risk, we are also subject to credit risk through the investments of our funds. In the event that credit spreadswere to increase by one percentage point, we estimate that management fees earned on a segment basis that were dependent upon estimated fair value woulddecrease by approximately $18.3 million during the year ended December 31, 2015.
Foreign Exchange Risk—We estimate for the years ended December 31, 2015 and 2014, a 10% decline in the rate of exchange of all foreigncurrencies against the U.S. dollar would result in the following declines in management fees, carried interest income and income from equity methodinvestments:
For the Years Ended December 31, 2015 2014Management fees $ 2,717 $ 4,005Carried interest income 1,953 10,508Income from equity method investments 22 691
Net Gains From Investment Activities and Income From Equity Method Investments—Our assets and unrealized gains, and our related equityand net income are sensitive to changes in the valuations of our funds’ underlying investments and could vary materially as a result of changes in ourvaluation assumptions and estimates. See “Item 7. Management’s Discussion and Analysis of Financial Conditions and Results of Operations—CriticalAccounting Policies—Investments, at Fair Value” for details related to the valuation methods that are used and the key assumptions and estimates employedby such methods. We also quantify the Level III investments that are included on our consolidated statements of financial condition by valuationmethodology in note 6 to the consolidated financial statements. We employ a variety of valuation methods. Furthermore, the investments that we manage butare not on our consolidated statements of financial condition, and therefore impact carried interest, also employ a variety of valuation methods of which nosingle methodology is used more than any other. Changes in fair value will have the
- 132-

Table of Contents
following impacts before a reduction of profit sharing expense and Non-Controlling Interests in the Apollo Operating Group and on a pre-tax basis on ourresults of operations for the years ended December 31, 2015 and 2014:
Management Fees—Management fees from the funds in our credit segment are based on the net asset value of the relevant fund, gross assets,capital commitments or invested capital, each as defined in the respective management agreements. Changes in the fair values of the investments in creditfunds that earn management fees based on net asset value or gross assets will have a direct impact on the amount of management fees that are earned.Management fees earned from our credit segment on a segment basis that were dependent upon estimated fair value during the years ended December 31,2015 and 2014 would decrease by approximately $50.5 million and $37.7 million, respectively, if the fair values of the investments held by such funds were10% lower during the same respective periods.
Management fees for our private equity, real estate and certain credit funds, excluding AAA, generally are charged on either (a) a fixed percentageof committed capital over a stated investment period or (b) a fixed percentage of invested capital of unrealized portfolio investments. Changes in values ofinvestments could indirectly affect future management fees from private equity funds by, among other things, reducing the funds’ access to capital orliquidity and their ability to currently pay the management fees or if such change resulted in a write-down of investments below their associated investedcapital.
Carried Interest Income—Carried interest income from most of our credit, private equity and real estate funds generally is earned based onachieving specified performance criteria and is impacted directly by changes in the fair value of the funds’ investments. We anticipate that a 10% decline inthe fair values of investments held by all of the credit, private equity and real estate funds at December 31, 2015 and 2014 would decrease carried interestincome on a segment basis for the years ended December 31, 2015 and 2014 as presented in the table below:
For the Years Ended December 31, 2015 201410% Decline in Fair Value of Investments Held
Credit 140,461 160,554Private Equity 202,171 301,705Real Estate 10,865 12,617
Net Gains From Investment Activities—Net gains from investment activities related to the Company's investment in Athene Holding woulddecrease by approximately $51.0 million and $32.4 million for the years ended December 31, 2015 and 2014, respectively, if the fair value of the Company'sinvestment in Athene Holding decreased by 10% during the same respective periods.
Income From Equity Method Investments—For select Apollo funds, our share of income from equity method investments as a general partner insuch funds is derived from unrealized gains or losses on investments in funds included in the consolidated financial statements. For funds in which we havean interest, but are not included in our consolidated financial statements, our share of investment income is limited to our direct investments in the funds,which ranges from 0.001% to 9.091%.
We anticipate that a 10% decline in the fair value of investments at December 31, 2015 and 2014 would result in an approximate $63.1 millionand $37.8 million decrease in investment income at the consolidated level, respectively.
- 133-

Table of Contents
ITEM 8. FINANCIAL STATEMENTS AND SUPPLEMENTARY DATA
Index to Consolidated Financial Statements PageAudited Consolidated Financial Statements Report of Independent Registered Public Accounting Firm 135 Consolidated Statements of Financial Condition as of December 31, 2015 and 2014 136 Consolidated Statements of Operations for the Years Ended December 31, 2015, 2014, and 2013 137 Consolidated Statements of Comprehensive Income for the Years Ended December 31, 2015, 2014, and 2013 138 Consolidated Statements of Changes in Shareholders’ Equity for the Years Ended December 31, 2015, 2014, and 2013 139 Consolidated Statements of Cash Flows for the Years Ended December 31, 2015, 2014, and 2013 140 Notes to Consolidated Financial Statements 141
- 134-

Table of Contents
REPORT OF INDEPENDENT REGISTERED PUBLIC ACCOUNTING FIRM
To the Board of Directors and Shareholders ofApollo Global Management, LLCNew York, New York
We have audited the accompanying consolidated statements of financial condition of Apollo Global Management, LLC and subsidiaries (the“Company”) as of December 31, 2015 and 2014, and the related consolidated statements of operations, comprehensive income, changes in shareholders’equity and cash flows for each of the three years in the period ended December 31, 2015. We also have audited the Company’s internal control over financialreporting as of December 31, 2015, based on criteria established in Internal Control-Integrated Framework (2013) issued by the Committee of SponsoringOrganizations of the Treadway Commission. The Company’s management is responsible for these financial statements, for maintaining effective internalcontrol over financial reporting, and for its assessment of the effectiveness of internal control over financial reporting, included in the accompanyingManagement’s Report on Internal Control over Financial Reporting. Our responsibility is to express an opinion on these financial statements and an opinionon the Company’s internal control over financial reporting based on our audits.
We conducted our audits in accordance with the standards of the Public Company Accounting Oversight Board (United States). Those standardsrequire that we plan and perform the audit to obtain reasonable assurance about whether the financial statements are free of material misstatement andwhether effective internal control over financial reporting was maintained in all material respects. Our audits of the financial statements included examining,on a test basis, evidence supporting the amounts and disclosures in the financial statements, assessing the accounting principles used and significantestimates made by management, and evaluating the overall financial statement presentation. Our audit of internal control over financial reporting includedobtaining an understanding of internal control over financial reporting, assessing the risk that a material weakness exists, and testing and evaluating thedesign and operating effectiveness of internal control based on the assessed risk. Our audits also included performing such other procedures as we considerednecessary in the circumstances. We believe that our audits provide a reasonable basis for our opinions.
A company’s internal control over financial reporting is a process designed by, or under the supervision of, the company’s principal executive andprincipal financial officers, or persons performing similar functions, and effected by the company’s board of directors, management, and other personnel toprovide reasonable assurance regarding the reliability of financial reporting and the preparation of financial statements for external purposes in accordancewith generally accepted accounting principles. A company’s internal control over financial reporting includes those policies and procedures that (1) pertainto the maintenance of records that, in reasonable detail, accurately and fairly reflect the transactions and dispositions of the assets of the company;(2) provide reasonable assurance that transactions are recorded as necessary to permit preparation of financial statements in accordance with generallyaccepted accounting principles, and that receipts and expenditures of the company are being made only in accordance with authorizations of managementand directors of the company; and (3) provide reasonable assurance regarding prevention or timely detection of unauthorized acquisition, use, or dispositionof the company’s assets that could have a material effect on the financial statements.
Because of the inherent limitations of internal control over financial reporting, including the possibility of collusion or improper managementoverride of controls, material misstatements due to error or fraud may not be prevented or detected on a timely basis. Also, projections of any evaluation ofthe effectiveness of the internal control over financial reporting to future periods are subject to the risk that the controls may become inadequate because ofchanges in conditions, or that the degree of compliance with the policies or procedures may deteriorate.
In our opinion, the consolidated financial statements referred to above present fairly, in all material respects, the financial position of Apollo GlobalManagement, LLC and subsidiaries as of December 31, 2015 and 2014, and the results of their operations and their cash flows for each of the three years inthe period ended December 31, 2015, in conformity with accounting principles generally accepted in the United States of America. Also, in our opinion, theCompany maintained, in all material respects, effective internal control over financial reporting as of December 31, 2015, based on the criteria established inInternal Control-Integrated Framework (2013) issued by the Committee of Sponsoring Organizations of the Treadway Commission.
/s/ Deloitte & Touche LLPNew York, New YorkFebruary 29, 2016
- 135-

Table of Contents
APOLLO GLOBAL MANAGEMENT, LLCCONSOLIDATED STATEMENTS OF FINANCIAL CONDITION
DECEMBER 31, 2015 AND DECEMBER 31, 2014(dollars in thousands, except share data)
December 31, 2015 2014Assets:
Cash and cash equivalents $ 612,505 $ 1,204,052Cash and cash equivalents held at consolidated funds 4,817 1,611Restricted cash 5,700 6,353Investments 1,154,749 2,880,006Assets of consolidated variable interest entities:
Cash and cash equivalents 56,793 1,088,952Investments, at fair value 910,566 15,658,653Other assets 63,413 323,240
Carried interest receivable 643,907 911,666Due from affiliates 247,835 268,015Deferred tax assets 646,207 606,717Other assets 95,844 114,241Goodwill 88,852 49,243Intangible assets, net 28,620 60,039
Total Assets $ 4,559,808 $ 23,172,788
Liabilities and Shareholders’ Equity Liabilities:
Accounts payable and accrued expenses $ 92,012 $ 44,246Accrued compensation and benefits 54,836 59,278Deferred revenue 177,875 199,614Due to affiliates 594,536 565,153Profit sharing payable 295,674 434,852Debt 1,025,255 1,027,965Liabilities of consolidated variable interest entities:
Debt, at fair value 801,270 14,123,100Other liabilities 85,982 728,718
Other liabilities 43,387 46,401Total Liabilities 3,170,827 17,229,327
Commitments and Contingencies (see note 16) Shareholders’ Equity:
Apollo Global Management, LLC shareholders’ equity: Class A shares, no par value, unlimited shares authorized, 181,078,937 and 163,046,554 shares issued andoutstanding at December 31, 2015 and December 31, 2014, respectively — —Class B shares, no par value, unlimited shares authorized, 1 share issued and outstanding at December 31,2015 and December 31, 2014 — —Additional paid in capital 2,005,509 2,254,283Accumulated deficit (1,348,384) (1,400,661)Appropriated partners’ capital — 933,166Accumulated other comprehensive loss (7,620) (306)
Total Apollo Global Management, LLC shareholders’ equity 649,505 1,786,482Non-Controlling Interests in consolidated entities 86,561 3,222,195Non-Controlling Interests in Apollo Operating Group 652,915 934,784Total Shareholders’ Equity 1,388,981 5,943,461
Total Liabilities and Shareholders’ Equity $ 4,559,808 $ 23,172,788See accompanying notes to consolidated financial statements.
- 136-
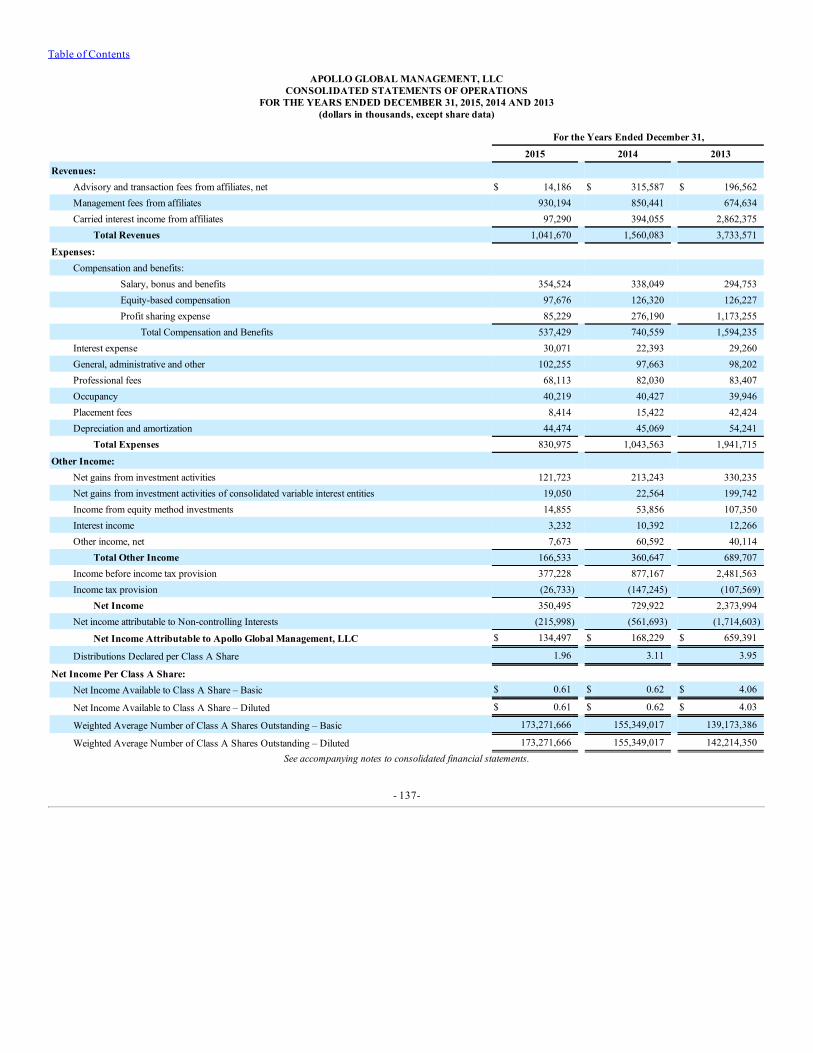
Table of Contents
APOLLO GLOBAL MANAGEMENT, LLCCONSOLIDATED STATEMENTS OF OPERATIONS
FOR THE YEARS ENDED DECEMBER 31, 2015, 2014 AND 2013(dollars in thousands, except share data)
For the Years Ended December 31,
2015 2014 2013
Revenues: Advisory and transaction fees from affiliates, net $ 14,186 $ 315,587 $ 196,562Management fees from affiliates 930,194 850,441 674,634Carried interest income from affiliates 97,290 394,055 2,862,375
Total Revenues 1,041,670 1,560,083 3,733,571
Expenses: Compensation and benefits:
Salary, bonus and benefits 354,524 338,049 294,753Equity-based compensation 97,676 126,320 126,227Profit sharing expense 85,229 276,190 1,173,255
Total Compensation and Benefits 537,429 740,559 1,594,235Interest expense 30,071 22,393 29,260General, administrative and other 102,255 97,663 98,202Professional fees 68,113 82,030 83,407Occupancy 40,219 40,427 39,946Placement fees 8,414 15,422 42,424Depreciation and amortization 44,474 45,069 54,241
Total Expenses 830,975 1,043,563 1,941,715
Other Income: Net gains from investment activities 121,723 213,243 330,235Net gains from investment activities of consolidated variable interest entities 19,050 22,564 199,742Income from equity method investments 14,855 53,856 107,350Interest income 3,232 10,392 12,266Other income, net 7,673 60,592 40,114
Total Other Income 166,533 360,647 689,707Income before income tax provision 377,228 877,167 2,481,563Income tax provision (26,733) (147,245) (107,569)
Net Income 350,495 729,922 2,373,994Net income attributable to Non-controlling Interests (215,998) (561,693) (1,714,603)
Net Income Attributable to Apollo Global Management, LLC $ 134,497 $ 168,229 $ 659,391
Distributions Declared per Class A Share 1.96 3.11 3.95
Net Income Per Class A Share: Net Income Available to Class A Share – Basic $ 0.61 $ 0.62 $ 4.06
Net Income Available to Class A Share – Diluted $ 0.61 $ 0.62 $ 4.03
Weighted Average Number of Class A Shares Outstanding – Basic 173,271,666 155,349,017 139,173,386
Weighted Average Number of Class A Shares Outstanding – Diluted 173,271,666 155,349,017 142,214,350See accompanying notes to consolidated financial statements.
- 137-

Table of Contents
APOLLO GLOBAL MANAGEMENT, LLCCONSOLIDATED STATEMENTS OF
COMPREHENSIVE INCOMEFOR THE YEARS ENDED DECEMBER 31, 2015, 2014 AND 2013
(dollars in thousands, except share data)
For the Years Ended December 31,
2015 2014 2013Net Income $ 350,495 $ 729,922 $ 2,373,994
Other Comprehensive Loss, net of tax: Allocation of currency translation adjustment of consolidated CLOs and funds (netof taxes of $0.9 million, $0.0 million and $0.0 million for Apollo GlobalManagement, LLC for the years ended December 31, 2015, 2014 and 2013,respectively, and $0.0 million, $0.0 million and $0.0 million for Non-ControllingInterests in Apollo Operating Group for the years ended December 31, 2015,2014 and 2013, respectively) (13,535) 724 —Net gain (loss) from change in fair value of cash flow hedge instruments 105 (990) —Net loss on available-for-sale securities (904) (2) (8)
Total Other Comprehensive Loss, net of tax (14,334) (268) (8)
Comprehensive Income 336,161 729,654 2,373,986Comprehensive Income attributable to Non-Controlling Interests (208,978) (631,831) (1,564,710)
Comprehensive Income Attributable to Apollo Global Management, LLC $ 127,183 $ 97,823 $ 809,276
See accompanying notes to consolidated financial statements.
- 138-

Table of Contents
APOLLO GLOBAL MANAGEMENT, LLCCONSOLIDATED STATEMENTS OF CHANGES
IN SHAREHOLDERS’ EQUITYFOR THE YEARS ENDED DECEMBER 31, 2015, 2014 AND 2013
(dollars in thousands, except share data)
Apollo Global Management, LLC Shareholders
Class AShares
Class BShares
AdditionalPaid inCapital
AccumulatedDeficit
AppropriatedPartners’
Capital
AccumulatedOther
ComprehensiveLoss
Total ApolloGlobal
Management,LLC
Shareholders’Equity
Non-ControllingInterests in
ConsolidatedEntities
Non-ControllingInterests in
ApolloOperating
Group Total
Shareholders’Equity
Balance at January 1, 2013 130,053,993 1 $ 3,043,334 $ (2,142,020) $ 1,765,360 $ 144 $ 2,666,818 $ 1,893,212 $ 1,143,353 $ 5,703,383
Dilution impact of issuance of Class A shares — — 4,865 — — — 4,865 — — 4,865
Capital increase related to equity-basedcompensation — — 104,935 — — — 104,935 — 19,163 124,098
Capital contributions — — — — — — — 689,172 — 689,172
Distributions — — (650,189) — (334,215) — (984,404) (159,573) (975,488) (2,119,465)
Distributions related to deliveries of Class A sharesfor RSUs 5,181,389 — 37,263 (85,858) — — (48,595) — — (48,595)
Purchase of AAA units — — — — — — — (62,326) — (62,326)
Net transfers of AAA ownership interest to (from)Non-Controlling Interests in consolidated entities — — (2,226) — — — (2,226) 2,226 — —
Satisfaction of liability related to AAA RDUs — — 1,205 — — — 1,205 — — 1,205
Exchange of AOG Units for Class A shares 11,045,402 — 85,395 — — — 85,395 — (62,996) 22,399
Net income — — — 659,391 149,934 — 809,325 307,019 1,257,650 2,373,994
Net gain (loss) on available-for-sale securities (fromequity method investment) — — — — — (49) (49) — 41 (8)
Balance at December 31, 2013 146,280,784 1 $ 2,624,582 $ (1,568,487) $ 1,581,079 $ 95 $ 2,637,269 $ 2,669,730 $ 1,381,723 $ 6,688,722
Dilution impact of issuance of Class A shares — — 5,267 — — — 5,267 — — 5,267
Capital increase related to equity-basedcompensation — — 108,871 — — — 108,871 — — 108,871
Capital contributions — — — — 135,356 — 135,356 936,915 — 1,072,271
Distributions — — (555,532) — (713,264) — (1,268,796) (615,301) (816,412) (2,700,509)
Distributions related to deliveries of Class A sharesfor RSUs 10,491,649 — 27,899 (403) — — 27,496 — — 27,496
Purchase of AAA units — — — — — — — (312) — (312)
Net transfers of AAA ownership interest to (from)Non-Controlling Interests in consolidated entities — — (3,423) — — — (3,423) 3,423 — —
Satisfaction of liability related to AAA RDUs — — 1,183 — — — 1,183 — — 1,183
Exchange of AOG Units for Class A shares 6,274,121 — 45,436 — — — 45,436 — (34,618) 10,818
Net income — — — 168,229 (70,729) — 97,500 227,740 404,682 729,922
Allocation of currency translation adjustment ofconsolidated CLO entities — — — — 724 — 724 — — 724
Change in cash flow hedge instruments — — — — — (399) (399) — (591) (990)
Net loss on available-for-sale securities (from equitymethod investment) — — — — — (2) (2) — — (2)
Balance at December 31, 2014 163,046,554 1 $ 2,254,283 $ (1,400,661) $ 933,166 $ (306) $ 1,786,482 $ 3,222,195 $ 934,784 $ 5,943,461
Cumulative effect adjustment from adoption ofaccounting principles — — 1,771 (3,350) (933,166) — (934,745) (3,134,518) — (4,069,263)
Dilution impact of issuance of Class A shares — — 3,588 — — — 3,588 — — 3,588
Capital increase related to equity-basedcompensation — — 67,959 — — — 67,959 — — 67,959
Capital contributions — — — — — — — 5,916 — 5,916
Distributions — — (367,894) — — — (367,894) (21,317) (453,324) (842,535)
Distributions related to deliveries of Class A sharesfor RSUs and restricted shares 11,521,762 — 6,276 (78,870) — — (72,594) — — (72,594)
Exchange of AOG Units for Class A shares 6,510,621 — 39,526 — — — 39,526 — (23,238) 16,288
Net income — — — 134,497 — — 134,497 21,364 194,634 350,495
Allocation of currency translation adjustment ofconsolidated CLOs and fund entities — — — — — (6,456) (6,456) (7,079) — (13,535)
Change in cash flow hedge instruments — — — — — 46 46 — 59 105
Net loss on available-for-sale securities (from equitymethod investment) — — — — — (904) (904) — — (904)
Balance at December 31, 2015 181,078,937 1 $ 2,005,509 $ (1,348,384) $ — $ (7,620) $ 649,505 $ 86,561 $ 652,915 $ 1,388,981
See accompanying notes to consolidated financial statements.

- 139-

Table of Contents
APOLLO GLOBAL MANAGEMENT, LLCCONSOLIDATED STATEMENTS OF CASH FLOWS
FOR THE YEARS ENDED DECEMBER 31, 2015, 2014 AND 2013(dollars in thousands, except share data)
For the Years Ended December 31,
2015 2014 2013
Cash Flows from Operating Activities: Net income $ 350,495 $ 729,922 $ 2,373,994
Adjustments to reconcile net income to net cash provided by (used in) operating activities: Equity-based compensation 97,676 126,320 126,227Non-cash management fees (27,066) (16,738) —Depreciation and amortization 44,474 45,069 54,241Unrealized (gains) losses from investment activities (122,426) (21,726) 12,962Cash distributions of earnings from equity method investments 30,931 83,656 109,076Income from equity method investments (14,855) (53,856) (107,350)Excess tax benefits from share-based payment arrangements (1,234) (27,899) (37,263)Deferred taxes, net 26,431 80,356 62,701Other non-cash amounts included in net income, net (21,912) (1,223) 49,326
Changes in assets and liabilities: Carried interest receivable 303,296 1,375,409 (408,819)Due from affiliates 1,500 (252,339) (130,525)Other assets 16,275 (24,868) 6,250Accounts payable and accrued expenses 49,403 33,986 34,034Accrued compensation and benefits (9,916) 16,185 (17,244)Deferred revenue (18,370) (79,865) 27,322Due to affiliates 12,521 (97,521) (44,223)Profit sharing payable (122,632) (518,003) 141,225Other liabilities (2,281) 6,889 (5,822)
Apollo Funds related: Net realized gains from investment activities (6,988) (79,277) (87,881)Net unrealized (gains) losses from investment activities (8,392) 113,423 (309,138)Net realized gains on debt — (101,745) (137,098)Net unrealized (gains) losses on debt (3,057) (809) 232,510Distributions from investment activities — — 66,796Change in cash held at consolidated variable interest entities 256,623 (13,813) 587,526Purchases of investments (521,205) (10,330,057) (9,841,763)Proceeds from sale of investments and liquidating distributions 409,218 8,509,361 8,422,195Change in other assets (24,428) (43,521) 19,260Change in other liabilities (111,408) 169,767 (64,061)
Net Cash Provided by (Used in) Operating Activities $ 582,673 $ (372,917) $ 1,134,458
Cash Flows from Investing Activities: Purchases of fixed assets $ (6,203) $ (5,949) $ (7,577)Proceeds from disposals of fixed assets — 115 2,282Proceeds from sale of investments 25,000 50,000 —Purchase of investments (25,000) — —
Cash contributions to equity method investments (234,382) (109,923) (98,422)
Cash distributions from equity method investments 61,576 76,343 107,208Change in restricted cash 653 2,846 (840)Issuance of employee loans (25,000) — —Other investing activities 420 — —
Net Cash (Used in) Provided by Investing Activities $ (202,936) $ 13,432 $ 2,651
Cash Flows from Financing Activities: Principal repayments of debt $ — $ (250,000) $ (737,818)Issuance of debt — 533,956 750,000Issuance costs — (5,478) (7,750)

Net loss related to cash flow hedge instruments — (1,051) —Satisfaction of tax receivable agreement (48,420) (32,032) (30,403)Satisfaction of contingent obligations (15,743) (37,271) (67,535)Purchases of equity securities (3,120) — —Distributions related to deliveries of Class A shares for RSUs (78,870) (403) (85,858)Distributions paid to Non-Controlling Interests in consolidated entities (12,102) (19,425) (12,171)Contributions from Non-Controlling Interests in consolidated entities 147 2,001 273Distributions paid (354,434) (506,043) (584,465)Distributions paid to Non-Controlling Interests in Apollo Operating Group (453,324) (816,412) (975,488)Excess tax benefits from share-based payment arrangements 1,234 27,899 37,263
Apollo Funds related: Issuance of debt — 4,225,451 2,747,033Principal repayment of debt — (2,371,499) (2,218,060)Purchase of AAA units — (312) (62,326)Distributions paid — (703,041) (334,215)Distributions paid to Non-Controlling Interests in consolidated variable interest entities (9,215) (450,419) (147,402)Contributions from Non-Controlling Interests in consolidated variable interest entities 5,769 889,690 688,899Subscriptions received in advance — — 35,000
Net Cash (Used in) Provided by Financing Activities $ (968,078) $ 485,611 $ (1,005,023)Net (Decrease) Increase in Cash and Cash Equivalents (588,341) 126,126 132,086Cash and Cash Equivalents, Beginning of Period 1,205,663 1,079,537 947,451
Cash and Cash Equivalents, End of Period $ 617,322 $ 1,205,663 $ 1,079,537
Supplemental Disclosure of Cash Flow Information: Interest paid $ 32,270 $ 22,191 $ 43,760Interest paid by consolidated variable interest entities 17,574 157,812 120,149Income taxes paid 7,922 57,276 9,233
Supplemental Disclosure of Non-Cash Investing Activities: Non-cash contributions to equity method investments $ 36,634 $ — $ —Non-cash distributions from equity method investments (7,724) (6,720) (1,303)Transfer of fixed assets held for sale — — 6,486
Supplemental Disclosure of Non-Cash Financing Activities: Declared and unpaid distributions $ (13,460) $ (49,489) $ (65,724)Non-cash distributions from Non-Controlling Interests in consolidated entities to Appropriated Partners'Capital — (135,356) —Non-cash contributions from Non-Controlling Interests in Apollo Operating Group related to equity-based compensation — — 19,163Capital increases related to equity-based compensation 67,959 108,871 104,935Other non-cash financing activities 3,559 6,448 6,021
Adjustments related to exchange of Apollo Operating Group units: Deferred tax assets $ 61,720 $ 58,696 $ 149,327
Due to affiliates (45,432) (47,878) (126,928)
Additional paid in capital (16,288) (10,818) (22,399)Non-Controlling Interest in Apollo Operating Group 23,238 34,618 62,996
Net Assets Deconsolidated from Consolidated Variable Interest Entities and Funds: Cash and cash equivalents $ 760,491 $ — $ —Investments, at fair value 16,930,227 — —Other Assets 280,428 — —Debt, at fair value (13,229,570) — —Other liabilities (529,080) — —Non-Controlling Interests in consolidated entities (3,134,518) — —Appropriated partners’ capital (929,708) — —
See accompanying notes to consolidated financial statements.
- 140-

Table of ContentsAPOLLO GLOBAL MANAGEMENT, LLC
NOTES TO CONSOLIDATEDFINANCIAL STATEMENTS
(dollars in thousands, except share data, except where noted)
1. ORGANIZATION AND BASIS OF PRESENTATION
Apollo Global Management, LLC (together with its consolidated subsidiaries, the “Company” or “Apollo”) is a global alternative investmentmanager whose predecessor was founded in 1990. Its primary business is to raise, invest and manage private equity, credit and real estate funds as well asstrategic investment accounts (“SIAs”), on behalf of pension, endowment and sovereign wealth funds, as well as other institutional and individual investors.For these investment management services, Apollo receives management fees generally related to the amount of assets managed, transaction and advisoryfees and carried interest income related to the performance of the respective funds that it manages. Apollo has three primary business segments:
• Private equity—primarily invests in control equity and related debt instruments, convertible securities and distressed debtinvestments;
• Credit—primarily invests in non-control corporate and structured debt instruments including performing, stressed and distressedinvestments across the capital structure; and
• Real estate—primarily invests in real estate equity for the acquisition and recapitalization of real estate assets, portfolios,platforms and operating companies, and real estate debt including first mortgage and mezzanine loans, preferred equity andcommercial mortgage backed securities.
Basis of Presentation
The accompanying consolidated financial statements are prepared in accordance with generally accepted accounting principles in the UnitedStates of America (“U.S. GAAP”). The consolidated financial statements include the accounts of the Company, its wholly-owned or majority-ownedsubsidiaries, the consolidated entities which are considered to be variable interest entities (“VIEs”) and for which the Company is considered the primarybeneficiary, and certain entities which are not considered VIEs but which the Company controls through a majority voting interest. Intercompany accountsand transactions have been eliminated upon consolidation.
Certain reclassifications, when applicable, have been made to the prior period’s consolidated financial statements and notes to conform to thecurrent period’s presentation and are disclosed accordingly.
Organization of the Company
The Company was formed as a Delaware limited liability company on July 3, 2007 and completed a reorganization of its predecessor businesseson July 13, 2007 (the “2007 Reorganization”). The Company is managed and operated by its manager, AGM Management, LLC, which in turn is indirectlywholly-owned and controlled by Leon Black, Joshua Harris and Marc Rowan (the “Managing Partners”).
As of December 31, 2015, the Company owned, through five intermediate holding companies that include APO Corp., a Delaware corporationthat is a domestic corporation for U.S. federal income tax purposes, APO Asset Co., LLC, a Delaware limited liability company that is a disregarded entity forU.S. federal income tax purposes, APO (FC), LLC, an Anguilla limited liability company that is treated as a corporation for U.S. federal income tax purposes,APO (FC II), LLC, an Anguilla limited liability company that is treated as a corporation for U.S. federal income tax purposes and APO UK (FC), LLC, anAnguilla limited liability company that is treated as a corporation for U.S. federal income tax purposes (collectively, the “Intermediate Holding Companies”),45.6% of the economic interests of, and operated and controlled all of the businesses and affairs of, the Apollo Operating Group through its wholly-ownedsubsidiaries.
AP Professional Holdings, L.P., a Cayman Islands exempted limited partnership (“Holdings”), is the entity through which the Managing Partnersand certain of the Company’s other partners (the “Contributing Partners”) indirectly beneficially own interests in each of the partnerships that comprise theApollo Operating Group (“AOG Units”). As of December 31, 2015, Holdings owned the remaining 54.4% of the economic interests in the Apollo OperatingGroup. The Company consolidates the financial results of the Apollo Operating Group and its consolidated subsidiaries. Holdings’ ownership interest in theApollo Operating Group is reflected as a Non-Controlling Interest in the accompanying consolidated financial statements.
Pursuant to an exchange agreement between Apollo, Holdings and the other parties thereto (as amended, the “Exchange Agreement”), the holdersof the AOG Units (and certain permitted transferees thereof) may, upon notice and subject to the applicable vesting and minimum retained ownershiprequirements, transfer restrictions and other terms of the Exchange Agreement, exchange
- 141-

Table of ContentsAPOLLO GLOBAL MANAGEMENT, LLC
NOTES TO CONSOLIDATEDFINANCIAL STATEMENTS
(dollars in thousands, except share data, except where noted)
their AOG Units for the Company’s Class A shares on a one-for-one basis a limited number of times each year, subject to customary conversion rateadjustments for splits, distributions and reclassifications. Pursuant to the Exchange Agreement, a holder of AOG Units must simultaneously exchange onepartnership unit in each of the Apollo Operating Group partnerships to effectuate an exchange for one Class A share. As a holder exchanges its AOG Units,the Company’s indirect interest in the Apollo Operating Group is correspondingly increased.
2. SUMMARY OF SIGNIFICANT ACCOUNTING POLICIES
Principles of Consolidation—The types of entities with which Apollo is involved generally include subsidiaries (e.g., general partners andmanagement companies related to the funds the Company manages), entities that have all the attributes of an investment company (e.g., funds) andsecuritization vehicles (e.g., collateralized loan obligations). Each of these entities is assessed for consolidation on a case by case basis depending on thespecific facts and circumstances surrounding that entity.
In February 2015, the Financial Accounting Standards Board (“FASB”) issued new consolidation guidance which changes the analysis that areporting entity must perform to determine whether it should consolidate certain types of legal entities. The guidance is effective for interim and annualreporting periods in fiscal years beginning after December 15, 2015. Early adoption is permitted, including adoption in an interim period, and adjustmentsshould be reflected as of the beginning of the fiscal year that includes that interim period. The Company has elected to adopt this new guidance using themodified retrospective method, which results in an effective date of adoption of January 1, 2015. Restatement of prior period results is not required. Amountspresented for the year ended December 31, 2015 in the consolidated statements of operations reflect the adoption of this accounting guidance as of January 1,2015.
Pursuant to the new consolidation guidance, the Company first evaluates whether it holds a variable interest in an entity. Fees that are customaryand commensurate with the level of services provided, and where the Company doesn’t hold other economic interests in the entity that would absorb morethan an insignificant amount of the expected losses or returns of the entity, would not be considered a variable interest. Apollo factors in all economicinterests including proportionate interests through related parties, to determine if fees are considered a variable interest. As Apollo’s interests in many of theseentities are solely through carried interests, performance fees, and/or insignificant indirect interests through related parties, Apollo is not considered to have avariable interest in many of these entities under the new guidance and no further consolidation analysis is performed. Prior to adoption of the newconsolidation guidance, fees received by the Company for investment management services (e.g. carried interests and performance fees) were consideredvariable interests. For the remaining entities where the Company has determined that it does hold a variable interest, the Company performs an assessment todetermine whether each of those entities qualify as a VIE.
An entity is considered a VIE if any one of the following conditions exist: (a) the total equity investment at risk is not sufficient to permit thelegal entity to finance its activities without additional subordinated financial support, (b) the holders of equity investment at risk (as a group) lack either thedirect or indirect ability through voting rights or similar rights to make decisions about a legal entity’s activities that have a significant effect on the successof the legal entity or the obligation to absorb the expected losses or right to receive the expected residual returns, or (c) the voting rights of some investors aredisproportionate to their obligation to absorb the expected losses of the legal entity, their rights to receive the expected residual returns of the legal entity, orboth and substantially all of the legal entity’s activities either involve or are conducted on behalf of an investor with disproportionately few voting rights.Under the new guidance, for limited partnerships and other similar entities, unaffiliated investors must be granted rights to either dissolve the fund or removethe general partner (“kick-out rights”) in order to not qualify as a VIE under condition (b) above. Entities that do not qualify as VIEs are generally assessedfor consolidation as voting interest entities (“VOEs”) under the voting interest model.
Under the voting interest model, Apollo consolidates those entities it controls through a majority voting interest. Apollo does not consolidatethose VOEs in which substantive kick-out rights have been granted to the unaffiliated investors to either dissolve the fund or remove the general partner.
As previously indicated, the consolidation assessment, including the determination as to whether an entity qualifies as a VIE depends on the factsand circumstances surrounding each entity and therefore certain of Apollo’s funds may qualify as VIEs whereas others may qualify as VOEs. The granting ofsubstantive kick-out rights is a key consideration in determining whether a limited partnership or similar entity is a VIE and whether or not that entity shouldbe consolidated. For example, when the unaffiliated holders of equity investment at risk of a fund (assumed to be limited partnerships or similar entities) withsufficient equity to permit the fund to finance its activities without additional subordinated financial support are not granted substantive kick-out rights thefund is determined to be a VIE. Alternatively, when the unaffiliated holders of equity investment at risk are
- 142-

Table of ContentsAPOLLO GLOBAL MANAGEMENT, LLC
NOTES TO CONSOLIDATEDFINANCIAL STATEMENTS
(dollars in thousands, except share data, except where noted)
granted substantive kick-out rights, the fund is generally determined to be a VOE. Prior to adoption of the new guidance, in certain cases where the Companyheld a substantive equity investment at risk in the fund, the fund may have been determined to be a VOE even though substantive kick-out rights were notgranted to the unaffiliated holders of equity investment at risk. Under the new guidance for limited partnerships or similar entities, unaffiliated investors musthave kick-out rights to be considered a VOE.
If the entity is determined to be a VIE under the conditions above, the Company assesses whether the entity should be consolidated bydetermining if Apollo is the primary beneficiary of the entity. Prior to adoption of the new consolidation guidance, this analysis differed depending on thetype of VIE being assessed and which consolidation model was applied. For VIEs that qualified for the deferral of the then amended consolidation rules (i.e.investment company entities), Apollo was determined to be the primary beneficiary when its interests, through holding interests directly or indirectly in theVIE or contractually through other variable interests (e.g., carried interest and performance fees), would be expected to absorb a majority of the VIE’sexpected losses, receive a majority of the VIE’s expected residual returns, or both. In cases where two or more Apollo related parties held a variable interest ina VIE, and the aggregate variable interest held by those parties would, if held by a single party, identify that party as the primary beneficiary, then theCompany was determined to be the primary beneficiary to the extent it was the party within the related party group that was most closely associated with theVIE.
For VIEs that did not qualify for the deferral, such as Apollo’s CLOs which applied the then amended consolidation rules, the Company wasdetermined to be the primary beneficiary if it held a controlling financial interest defined as possessing both (a) the power to direct the activities of a VIE thatmost significantly impact the VIE’s economic performance and (b) the obligation to absorb losses of the VIE or the right to receive benefits from the VIE thatcould potentially be significant to the VIE. Under the new guidance, for all VIEs including investment company entities that previously met the deferralrequirements, the Company is only determined to be the Primary Beneficiary when it has a controlling financial interest as defined above. Prior to adoptionof the new guidance, when Apollo alone was not considered to have a controlling financial interest but Apollo and its related parties on an aggregate basisdid have a controlling financial interest, an analysis regarding which party was most closely associated with the VIE was performed. Under the new guidance,determining which party is more closely associated with an entity is only performed when the related party group that has a controlling financial interest,shares power or is under common control. When the related party group holding a controlling financial interest is not under common control, then Apollowould only be deemed to be the primary beneficiary if substantially all the activities of the entity are performed on behalf of Apollo.
Apollo continues to determine whether it is the primary beneficiary of a VIE at the time it becomes initially involved with the VIE andreconsiders that conclusion continuously. Investments and redemptions (either by Apollo, affiliates of Apollo or third parties) or amendments to thegoverning documents of the respective entity may affect an entity’s status as a VIE or the determination of the primary beneficiary.
The assessment of whether an entity is a VIE and the determination of whether Apollo should consolidate such VIE requires judgment. Underboth the previous and the new guidance, those judgments include, but are not limited to: (i) determining whether the total equity investment at risk issufficient to permit the entity to finance its activities without additional subordinated financial support, (ii) evaluating whether the holders of equityinvestment at risk, as a group, can make decisions that have a significant effect on the success of the entity, (iii) determining whether the equity investorshave proportionate voting rights to their obligations to absorb losses or rights to receive the expected residual returns from an entity, and (iv) evaluating thenature of the relationship and activities of the parties involved in determining which party within a related-party group (only for those related parties withshared power or under common control under the new guidance) is most closely associated with the VIE. Judgments are also made in determining whether amember in the equity group has a controlling financial interest including power to direct activities that most significantly impact the VIEs’ economicperformance and rights to receive benefits or obligations to absorb losses that could be potentially significant to the VIE. This analysis includes intereststhrough related parties. Prior to adoption of the new guidance, where the VIEs had qualified for the deferral, judgments were made in estimating cash flows toevaluate which member within the equity group absorbed a majority of the expected losses or residual returns of the VIE.
Assets and liabilities of the consolidated VIEs are shown in separate sections within the consolidated statements of financial condition as ofDecember 31, 2015 and 2014.
For additional disclosures regarding VIEs, see note 5. Intercompany transactions and balances, if any, have been eliminated in consolidation.
Cash and Cash Equivalents—Apollo considers all highly liquid short-term investments with original maturities of 90 days or less whenpurchased to be cash equivalents. Substantially all amounts are on deposit in interest-bearing accounts with major financial institutions and exceed insuredlimits.
- 143-
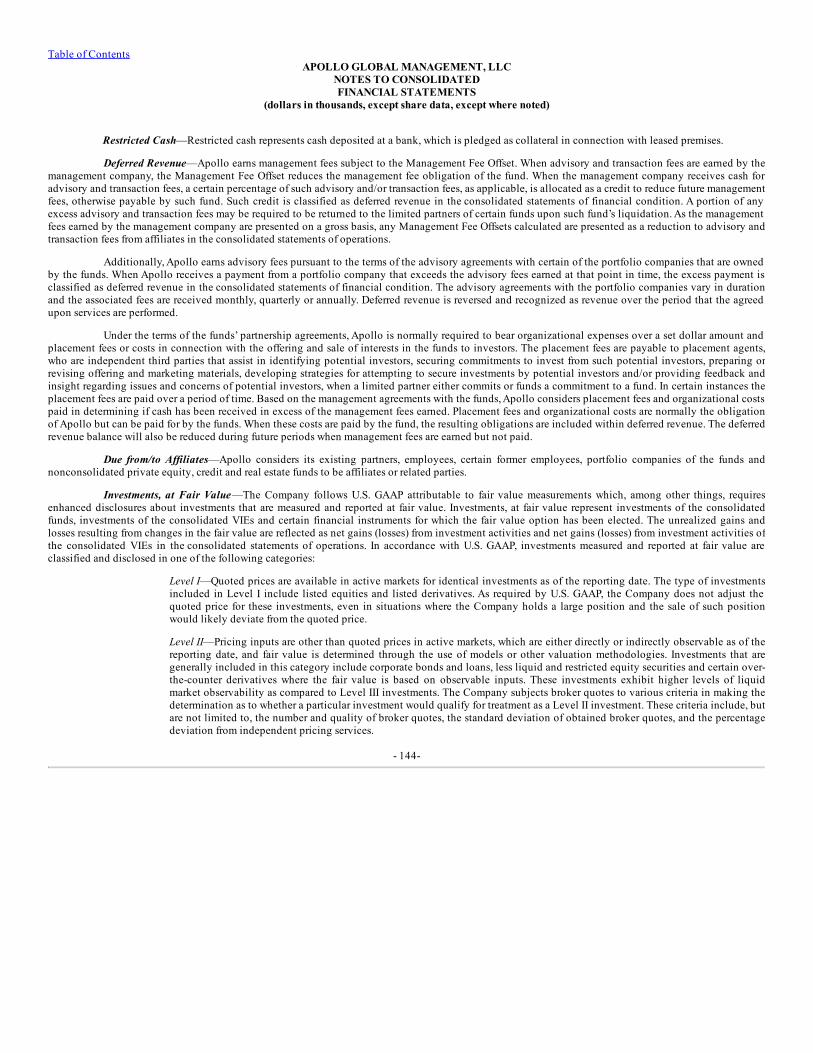
Table of ContentsAPOLLO GLOBAL MANAGEMENT, LLC
NOTES TO CONSOLIDATEDFINANCIAL STATEMENTS
(dollars in thousands, except share data, except where noted)
Restricted Cash—Restricted cash represents cash deposited at a bank, which is pledged as collateral in connection with leased premises.
Deferred Revenue—Apollo earns management fees subject to the Management Fee Offset. When advisory and transaction fees are earned by themanagement company, the Management Fee Offset reduces the management fee obligation of the fund. When the management company receives cash foradvisory and transaction fees, a certain percentage of such advisory and/or transaction fees, as applicable, is allocated as a credit to reduce future managementfees, otherwise payable by such fund. Such credit is classified as deferred revenue in the consolidated statements of financial condition. A portion of anyexcess advisory and transaction fees may be required to be returned to the limited partners of certain funds upon such fund’s liquidation. As the managementfees earned by the management company are presented on a gross basis, any Management Fee Offsets calculated are presented as a reduction to advisory andtransaction fees from affiliates in the consolidated statements of operations.
Additionally, Apollo earns advisory fees pursuant to the terms of the advisory agreements with certain of the portfolio companies that are ownedby the funds. When Apollo receives a payment from a portfolio company that exceeds the advisory fees earned at that point in time, the excess payment isclassified as deferred revenue in the consolidated statements of financial condition. The advisory agreements with the portfolio companies vary in durationand the associated fees are received monthly, quarterly or annually. Deferred revenue is reversed and recognized as revenue over the period that the agreedupon services are performed.
Under the terms of the funds’ partnership agreements, Apollo is normally required to bear organizational expenses over a set dollar amount andplacement fees or costs in connection with the offering and sale of interests in the funds to investors. The placement fees are payable to placement agents,who are independent third parties that assist in identifying potential investors, securing commitments to invest from such potential investors, preparing orrevising offering and marketing materials, developing strategies for attempting to secure investments by potential investors and/or providing feedback andinsight regarding issues and concerns of potential investors, when a limited partner either commits or funds a commitment to a fund. In certain instances theplacement fees are paid over a period of time. Based on the management agreements with the funds, Apollo considers placement fees and organizational costspaid in determining if cash has been received in excess of the management fees earned. Placement fees and organizational costs are normally the obligationof Apollo but can be paid for by the funds. When these costs are paid by the fund, the resulting obligations are included within deferred revenue. The deferredrevenue balance will also be reduced during future periods when management fees are earned but not paid.
Due from/to Affiliates—Apollo considers its existing partners, employees, certain former employees, portfolio companies of the funds andnonconsolidated private equity, credit and real estate funds to be affiliates or related parties.
Investments, at Fair Value—The Company follows U.S. GAAP attributable to fair value measurements which, among other things, requiresenhanced disclosures about investments that are measured and reported at fair value. Investments, at fair value represent investments of the consolidatedfunds, investments of the consolidated VIEs and certain financial instruments for which the fair value option has been elected. The unrealized gains andlosses resulting from changes in the fair value are reflected as net gains (losses) from investment activities and net gains (losses) from investment activities ofthe consolidated VIEs in the consolidated statements of operations. In accordance with U.S. GAAP, investments measured and reported at fair value areclassified and disclosed in one of the following categories:
Level I—Quoted prices are available in active markets for identical investments as of the reporting date. The type of investmentsincluded in Level I include listed equities and listed derivatives. As required by U.S. GAAP, the Company does not adjust thequoted price for these investments, even in situations where the Company holds a large position and the sale of such positionwould likely deviate from the quoted price.
Level II—Pricing inputs are other than quoted prices in active markets, which are either directly or indirectly observable as of thereporting date, and fair value is determined through the use of models or other valuation methodologies. Investments that aregenerally included in this category include corporate bonds and loans, less liquid and restricted equity securities and certain over-the-counter derivatives where the fair value is based on observable inputs. These investments exhibit higher levels of liquidmarket observability as compared to Level III investments. The Company subjects broker quotes to various criteria in making thedetermination as to whether a particular investment would qualify for treatment as a Level II investment. These criteria include, butare not limited to, the number and quality of broker quotes, the standard deviation of obtained broker quotes, and the percentagedeviation from independent pricing services.
- 144-

Table of ContentsAPOLLO GLOBAL MANAGEMENT, LLC
NOTES TO CONSOLIDATEDFINANCIAL STATEMENTS
(dollars in thousands, except share data, except where noted)
Level III—Pricing inputs are unobservable for the investment and includes situations where there is little observable marketactivity for the investment. The inputs into the determination of fair value may require significant management judgment orestimation. Investments that are included in this category generally include general and limited partner interests in corporateprivate equity and real estate funds, opportunistic credit funds, distressed debt and non-investment grade residual interests insecuritizations and CDOs and CLOs where the fair value is based on observable inputs as well as unobservable inputs. When asecurity is valued based on broker quotes, the Company subjects those quotes to various criteria in making the determination as towhether a particular investment would qualify for treatment as a Level II or Level III investment. These criteria include, but are notlimited to, the number and quality of the broker quotes, the standard deviations of the observed broker quotes, and the percentagedeviation from independent pricing services.
In certain cases, the inputs used to measure fair value may fall into different levels of the fair value hierarchy. In such cases, an investment’s levelwithin the fair value hierarchy is based on the lowest level of input that is significant to the fair value measurement. The Company’s assessment of thesignificance of a particular input to the fair value measurement in its entirety requires judgment and considers factors specific to the investment when the fairvalue is based on unobservable inputs.
In cases where an investment or financial instrument that is measured and reported at fair value is transferred between levels of the fair valuehierarchy, the Company accounts for the transfer as of the end of the reporting period.
On a quarterly basis, Apollo utilizes valuation committees consisting of members from senior management, to review and approve the valuationresults related to the investments of the funds it manages. For certain publicly traded vehicles, a review is performed by an independent board of directors.The Company also retains independent valuation firms to provide third-party valuation consulting services to Apollo, which consist of certain limitedprocedures that management identifies and requests them to perform. The limited procedures provided by the independent valuation firms assist managementwith validating their valuation results or determining fair value. The Company performs various back-testing procedures to validate their valuationapproaches, including comparisons between expected and observed outcomes, forecast evaluations and variance analyses. However, because of the inherentuncertainty of valuation, those estimated values may differ significantly from the values that would have been used had a ready market for the investmentsexisted, and the differences could be material.
Equity Method Investments—For investments in entities over which the Company exercises significant influence but which do not meet therequirements for consolidation and for which the Company has not elected the fair value option, the Company uses the equity method of accounting,whereby the Company records its share of the underlying income or loss of such entities. The carrying amounts of equity method investments are reflected ininvestments in the consolidated statements of financial condition. As the underlying entities that the Company manages and invests in are, for U.S. GAAPpurposes, primarily investment companies which reflect their investments at estimated fair value, the carrying value of the Company’s equity methodinvestments in such entities approximates fair value.
Private Equity Investments
The value of liquid investments, where the primary market is an exchange (whether foreign or domestic) is determined using period end marketprices. Such prices are generally based on the close price on the date of determination.
Valuation approaches used to estimate the fair value of investments that are less liquid include the market approach and the income approach.The market approach provides an indication of fair value based on a comparison of the subject company to comparable publicly traded companies andtransactions in the industry. The market approach is driven more by current market conditions, including actual trading levels of similar companies and, tothe extent available, actual transaction data of similar companies. Judgment is required by management when assessing which companies are similar to thesubject company being valued. Consideration may also be given to such factors as the Company’s historical and projected financial data, valuations given tocomparable companies, the size and scope of the Company’s operations, the Company’s strengths, weaknesses, expectations relating to the market’sreceptivity to an offering of the Company’s securities, applicable restrictions on transfer, industry and market information and assumptions, general economicand market conditions and other factors deemed relevant. The income approach provides an indication of fair value based on the present value of cash flowsthat a business or security is expected to generate in the future. The most widely used methodology in the income approach is a discounted cash flow method.Inherent in the discounted cash flow method are assumptions of expected results and a calculated discount rate.
- 145-

Table of ContentsAPOLLO GLOBAL MANAGEMENT, LLC
NOTES TO CONSOLIDATEDFINANCIAL STATEMENTS
(dollars in thousands, except share data, except where noted)
Credit Investments
The majority of investments in Apollo’s credit funds are valued based on quoted market prices and valuation models. Quoted market prices arevalued based on the average of the “bid” and the “ask” quotes provided by multiple brokers wherever possible without any adjustments. Apollo willdesignate certain brokers to use to value specific securities. In order to determine the designated brokers, Apollo considers the following: (i) brokers withwhich Apollo has previously transacted, (ii) the underwriter of the security and (iii) active brokers indicating executable quotes. In addition, when valuing asecurity based on broker quotes wherever possible Apollo tests the standard deviation amongst the quotes received and the variance between the concludedfair value and the value provided by a pricing service. When broker quotes are not available Apollo considers the use of pricing service quotes or othersources to mark a position. When relying on a pricing service as a primary source, (i) Apollo analyzes how the price has moved over the measurement period(ii) reviews the number of brokers included in the pricing service’s population and (iii) validates the valuation levels with Apollo’s pricing team and traders.
Debt and equity securities that are not publicly traded or whose market prices are not readily available are valued at fair value utilizing a modelbased approach to determine fair value. When determining fair value when no observable market value exists, the value attributed to an investment is basedon the price that would be received to sell an asset or paid to transfer a liability in an orderly transaction between market participants at the measurementdate. Valuation approaches used to estimate the fair value of illiquid credit investments also may include the market approach and the income approach, aspreviously described above. The valuation approaches used consider, as applicable, market risks, credit risks, counterparty risks and foreign currency risks.
The credit funds also enter into foreign currency exchange contracts, total return swap contracts, credit default swap contracts, and other derivativecontracts, which may include options, caps, collars and floors. Foreign currency exchange contracts are marked-to-market by recognizing the differencebetween the contract exchange rate and the current market rate as unrealized appreciation or depreciation. If securities are held at the end of this period, thechanges in value are recorded in income as unrealized. Realized gains or losses are recognized when contracts are settled. Total return swap and credit defaultswap contracts are recorded at fair value as an asset or liability with changes in fair value recorded as unrealized appreciation or depreciation. Realized gainsor losses are recognized at the termination of the contract based on the difference between the close-out price of the total return or credit default swap contractand the original contract price. Forward contracts are valued based on market rates obtained from counterparties or prices obtained from recognized financialdata service providers.
Real Estate Investments
The estimated fair value of commercial mortgage-backed securities (“CMBS”) in Apollo’s funds is determined by reference to market pricesprovided by certain dealers who make a market in these financial instruments. Broker quotes are only indicative of fair value and may not necessarilyrepresent what the funds would receive in an actual trade for the applicable instrument. Additionally, the loans held-for-investment are stated at the principalamount outstanding, net of deferred loan fees and costs for certain investments. The Company evaluates its loans for possible impairment on a quarterly basis.For Apollo’s real estate funds, valuations of non-marketable underlying investments are determined using methods that include, but are not limited to(i) discounted cash flow estimates or comparable analysis prepared internally, (ii) third party appraisals or valuations by qualified real estate appraisers, and(iii) contractual sales value of investments/properties subject to bona fide purchase contracts. Methods (i) and (ii) also incorporate consideration of the use ofthe income, cost, or sales comparison approaches of estimating property values.
Fair Value of Financial Instruments
The fair value of a financial instrument is the price that would be received to sell an asset or paid to transfer a liability in an orderly transactionbetween market participants at the measurement date.
Except for the Company’s debt obligations (as described in note 12), Apollo’s financial instruments are recorded at fair value or at amountswhose carrying values approximate fair value. See “Investments, at Fair Value” above. While Apollo’s valuations of portfolio investments are based onassumptions that Apollo believes are reasonable under the circumstances, the actual realized gains or losses will depend on, among other factors, futureoperating results, the value of the assets and market conditions at the time of disposition, any related transaction costs and the timing and manner of sale, allof which may ultimately differ significantly from the assumptions on which the valuations were based. Financial instruments’ carrying values generallyapproximate fair value because of the short-term nature of those instruments or variable interest rates related to the borrowings.
- 146-

Table of ContentsAPOLLO GLOBAL MANAGEMENT, LLC
NOTES TO CONSOLIDATEDFINANCIAL STATEMENTS
(dollars in thousands, except share data, except where noted)
Fair Value Option—Apollo has elected the fair value option for the Company’s investment in Athene Holding Ltd. (“Athene Holding” and,together with its subsidiaries, “Athene”) and for the assets and liabilities of the consolidated VIEs. Such election is irrevocable and is applied to financialinstruments on an individual basis at initial recognition. Apollo has applied the fair value option for certain corporate loans, other investments and debtobligations held by the consolidated VIEs that otherwise would not have been carried at fair value. See notes 4, 5, and 6 for further disclosure on theinvestments in Athene Holding and financial instruments of the consolidated VIEs for which the fair value option has been elected.
Financial Instruments held by Consolidated VIEs
The Company has adopted the measurement alternative included in the new collateralized financing entity (“CFE”) guidance. In applying theamendments introduced by the CFE guidance, the Company used a modified retrospective approach by recording a cumulative-effect adjustment toshareholders’ equity as of January 1, 2015. Amounts presented for the year ended December 31, 2015 in the consolidated statements of operations reflect theadoption of this accounting guidance as of January 1, 2015.
Pursuant to the new CFE guidance, the Company measures both the financial assets and financial liabilities of the consolidated collateralizedloan obligations (“CLOs”) in its consolidated financial statements using the more observable of the fair value of the financial assets and the fair value of thefinancial liabilities. The Company believes the fair value of the financial assets of the consolidated CLOs are more observable than the fair value of thefinancial liabilities of the consolidated CLOs. As a result, the financial assets of the consolidated CLOs are measured at fair value and the financial liabilitiesare measured in consolidation as: (i) the sum of the fair value of the financial assets and the carrying value of any non-financial assets that are incidental tothe operations of the CLOs less (ii) the sum of the fair value of any beneficial interests retained by the reporting entity (other than those that representcompensation for services) and the Company’s carrying value of any beneficial interests that represent compensation for services. The resulting amount isallocated to the individual financial liabilities (other than the beneficial interest retained by the Company) using a reasonable and consistent methodology.Under the measurement alternative, the Company’s consolidated net income reflects the Company’s own economic interests in the consolidated CLOsincluding (i) changes in the fair value of the beneficial interests retained by the Company and (ii) beneficial interests that represent compensation forcollateral management services.
Prior to the adoption of the new CFE guidance, the Company elected the fair value option for the assets and liabilities of the consolidated CLOs.The Company accounted for the difference between the fair value of the assets and the fair value of the liabilities of the consolidated CLOs in net gains frominvestment activities of consolidated variable interest entities in the consolidated statements of operations. This amount was attributed to the Company andother beneficial interest holders based on each beneficial holder’s residual interest in the consolidated CLOs. The amount attributed to other beneficialinterest holders was reflected in the consolidated statements of operations in net income attributable to Non-Controlling Interests and in the consolidatedstatements of financial condition in appropriated partners’ capital within shareholders’ equity. The amount was recorded as appropriated partners’ capitalsince the other holders of the CLOs’ beneficial interests, not the Company, received the benefits or absorbed the losses associated with their proportionateshare of the CLOs’ assets and liabilities.
The consolidated VIEs hold investments that could be traded over-the-counter. Investments in securities that are traded on a securities exchangeor comparable over-the-counter quotation systems are valued based on the last reported sale price at that date. If no sales of such investments are reported onsuch date, and in the case of over-the-counter securities or other investments for which the last sale date is not available, valuations are based on independentmarket quotations obtained from market participants, recognized pricing services or other sources deemed relevant, and the prices are based on the average ofthe “bid” and “ask” prices, or at ascertainable prices at the close of business on such day. Market quotations are generally based on valuation pricing modelsor market transactions of similar securities adjusted for security-specific factors such as relative capital structure priority and interest and yield risks, amongother factors. When market quotations are not available, a model based approach is used to determine fair value.
The consolidated VIEs also have debt obligations that are recorded at fair value. As previously noted, effective January 1, 2015 with theadoption of the new CFE guidance, the Company measures CLO debt obligations on the basis of the fair value of financial assets of the CLO. Prior to theadoption of the new CFE guidance, the primary valuation methodology used to determine fair value for debt obligations was market quotation. Prices werebased on the average of the “bid” and “ask” prices. In the event that market quotations were not available, a model based approach was used. The modelbased approach used to estimate the fair values of debt obligations for which market quotations were not available was the discounted cash flow method,which includes consideration of the cash flows of the debt obligation based on projected quarterly interest payments and quarterly amortization.
- 147-

Table of ContentsAPOLLO GLOBAL MANAGEMENT, LLC
NOTES TO CONSOLIDATEDFINANCIAL STATEMENTS
(dollars in thousands, except share data, except where noted)
Debt obligations were discounted based on the appropriate yield curve given the loan’s respective maturity and credit rating. Management used its discretionand judgment in considering and appraising relevant factors for determining the valuations of the consolidated VIEs’ debt obligations.
Pending Deal Costs
Pending deal costs consist of certain costs incurred (e.g. research costs, due diligence costs, professional fees, legal fees and other related items)related to private equity, credit and real estate fund transactions that the Company is pursuing but which have not yet been consummated. These costs aredeferred until such transactions are broken or successfully completed. A transaction is determined to be broken upon management’s decision to no longerpursue the transaction. In accordance with the related fund agreements, in the event the deal is broken, all of the costs are generally reimbursed by the fundsand considered in the calculation of the Management Fee Offset. These offsets are included in advisory and transaction fees from affiliates, net in theCompany’s consolidated statements of operations. If a deal is successfully completed, Apollo is reimbursed by the fund or a fund’s portfolio company for allcosts incurred.
Fixed Assets
Fixed Assets consist primarily of leasehold improvements, furniture, fixtures and equipment, computer hardware and software and are recorded atcost, net of accumulated depreciation and amortization. Depreciation and amortization is calculated using the straight-line method over the assets’ estimateduseful lives and in the case of leasehold improvements the lesser of the useful life or the term of the lease. Expenditures for repairs and maintenance arecharged to expense when incurred. The Company evaluates long-lived assets for impairment periodically and whenever events or changes in circumstancesindicate the carrying amounts of the assets may be impaired. During 2015, presentation of fixed assets was combined with other assets on the consolidatedstatements of financial condition and the prior period was adjusted to conform to the combined presentation.
Business Combinations
The Company accounts for acquisitions using the purchase method of accounting in accordance with U.S. GAAP. Under the purchase method ofaccounting, the purchase price of an acquisition is allocated to the assets acquired and liabilities assumed using the fair values determined by management asof the acquisition date.
Goodwill and Intangible Assets
Goodwill and indefinite-life intangible assets must be reviewed annually for impairment or more frequently if circumstances indicate impairmentmay have occurred. Identifiable finite-life intangible assets, by contrast, are amortized over their estimated useful lives, which are periodically re-evaluatedfor impairment or when circumstances indicate an impairment may have occurred. Apollo amortizes its identifiable finite-life intangible assets using amethod of amortization reflecting the pattern in which the economic benefits of the finite-life intangible asset are consumed or otherwise used up. If thatpattern cannot be reliably determined, Apollo uses the straight-line method of amortization.
Profit Sharing Payable
Profit sharing payable primarily represents the amounts payable to employees and former employees who are entitled to a proportionate share ofcarried interest income in one or more funds. This portion of the liability is calculated based upon the changes to realized and unrealized carried interest andis therefore not payable until the carried interest itself is realized. Profit sharing payable also includes contingent obligations that were recognized inconnection with certain Apollo acquisitions.
Debt Issuance Costs
Debt issuance costs consist of costs incurred in obtaining financing and are amortized over the term of the financing using the effective interestmethod. These costs are recorded as a direct deduction from the carrying amount of the related debt liability on the consolidated statements of financialcondition.
- 148-

Table of ContentsAPOLLO GLOBAL MANAGEMENT, LLC
NOTES TO CONSOLIDATEDFINANCIAL STATEMENTS
(dollars in thousands, except share data, except where noted)
Foreign Currency
The Company may, from time to time, hold foreign currency denominated assets and liabilities. Such assets and liabilities are translated using theexchange rates prevailing at the end of each reporting period. The functional currency of the Company’s international subsidiaries is the U.S. Dollar, as theiroperations are considered an extension of U.S. parent operations. Non-monetary assets and liabilities of the Company’s international subsidiaries areremeasured into the functional currency using historical exchange rates specific to each asset and liability. The results of the Company’s foreign operationsare normally remeasured using an average exchange rate for the respective reporting period. All currency remeasurement adjustments are included withinother income (loss), net in the consolidated statements of operations. Gains and losses on the settlement of foreign currency transactions are also includedwithin other income (loss), net in the consolidated statements of operations.
Revenues—Revenues are reported in three separate categories that include (i) advisory and transaction fees from affiliates, net, which relate to theinvestments of the funds and may include individual monitoring agreements the Company has with the portfolio companies and debt investment vehicles ofthe private equity funds and credit funds; (ii) management fees from affiliates, which are based on committed capital, invested capital, net asset value, grossassets or as otherwise defined in the respective agreements; and (iii) carried interest income (loss) from affiliates, which is normally based on the performanceof the funds subject to preferred return.
Advisory and Transaction Fees from Affiliates, Net—Advisory and transaction fees, including directors’ fees, are recognized whenthe underlying services rendered are substantially completed in accordance with the terms of the transaction and advisory agreements.Additionally, during the normal course of business, the Company incurs certain costs related to certain transactions that are not consummated(“broken deal costs”). These costs (e.g., research costs, due diligence costs, professional fees, legal fees and other related items) are determined tobe broken deal costs upon management’s decision to no longer pursue the transaction. In accordance with the related fund agreement, in theevent the deal is deemed broken, all of the costs are reimbursed by the funds and then included as a component of the calculation of theManagement Fee Offset described below. If a deal is successfully completed, Apollo is reimbursed by the fund or fund’s portfolio company for allcosts incurred and no offset is generated. As the Company acts as an agent for the funds it manages, any transaction costs incurred and paid bythe Company on behalf of the respective funds relating to successful or broken deals are presented net on the Company’s consolidated statementsof operations, and any receivable from the respective funds is presented in due from affiliates on the consolidated statements of financialcondition.
Advisory and transaction fees from affiliates, net, also includes underwriting fees. Underwriting fees include gains, losses and fees,net of syndicate expenses, arising from securities offerings in which one of the Company’s subsidiaries participates in the underwriter syndicate.Underwriting fees are recognized at the time the underwriting is completed and the income is reasonably assured and are included in theconsolidated statements of operations. Underwriting fees recognized but not received are included in other assets on the consolidated statementsof financial condition.
As a result of providing advisory services to certain private equity and credit portfolio companies, Apollo is generally entitled toreceive fees for transactions related to the acquisition, in certain cases, and disposition of portfolio companies as well as ongoing monitoring ofportfolio company operations and directors’ fees. The amounts due from portfolio companies are included in due from affiliates, which isdiscussed further in note 15. Under the terms of the limited partnership agreements for certain funds, the management fee payable by the fundsmay be subject to a reduction based on a certain percentage of such advisory and transaction fees, net of applicable broken deal costs(“Management Fee Offset”). Advisory and transaction fees from affiliates are presented net of the Management Fee Offset in the consolidatedstatements of operations.
Management Fees from Affiliates—Management fees for private equity, credit, and real estate funds are recognized in the periodduring which the related services are performed in accordance with the contractual terms of the related agreement, and are generally based upon(1) a percentage of the capital committed during the commitment period, and thereafter based on the remaining invested capital of unrealizedinvestments, or (2) net asset value, gross assets or as otherwise defined in the respective agreements.
Carried Interest Income from Affiliates—Apollo is entitled to an incentive return that can normally amount to as much as 20% ofthe total returns on a fund’s capital, depending upon performance. Performance-based fees are assessed as a percentage of the investmentperformance of the funds. The carried interest income from affiliates
- 149-

Table of ContentsAPOLLO GLOBAL MANAGEMENT, LLC
NOTES TO CONSOLIDATEDFINANCIAL STATEMENTS
(dollars in thousands, except share data, except where noted)
for any period is based upon an assumed liquidation of the fund’s net assets on the reporting date, and distribution of the net proceeds inaccordance with the fund’s income allocation provisions. Carried interest receivable is presented separately in the consolidated statements offinancial condition. The carried interest income from affiliates may be subject to reversal to the extent that the carried interest income recordedexceeds the amount due to the general partner based on a fund’s cumulative investment returns. When applicable, the accrual for potentialrepayment of previously received carried interest income, which is a component of due to affiliates, represents all amounts previously distributedto the general partner that would need to be repaid to the Apollo funds if these funds were to be liquidated based on the current fair value of theunderlying funds’ investments as of the reporting date. The actual general partner obligation, however, would not become payable or realizeduntil the end of a fund’s life.
Compensation and Benefits
Equity-Based Compensation—Equity-based awards granted to employees as compensation are measured based on the grant date fair value of theaward. Equity-based awards that do not require future service (i.e., vested awards) are expensed immediately. Equity-based employee awards that requirefuture service are expensed over the relevant service period. The Company estimates forfeitures for equity-based awards that are not expected to vest. Equity-based awards granted to non-employees for services provided to affiliates are remeasured to fair value at the end of each reporting period and expensed overthe relevant service period.
Salaries, Bonus and Benefits—Salaries, bonus and benefits include base salaries, discretionary and non-discretionary bonuses, severance andemployee benefits. Bonuses are generally accrued over the related service period.
The Company sponsors a 401(k) savings plan whereby U.S.-based employees are entitled to participate in the plan based upon satisfying certaineligibility requirements. The Company may provide discretionary contributions from time to time. No contributions relating to this plan were made by theCompany for the years ended December 31, 2015 and 2014.
Profit Sharing Expense—Profit sharing expense primarily consists of a portion of carried interest recognized in one or more funds allocated toemployees and former employees. Profit sharing expense is recognized on an accrued basis as the related carried interest income is earned. Profit sharingexpense can be reversed during periods when there is a decline in carried interest income that was previously recognized. Additionally, profit sharingamounts previously distributed may be subject to clawback from employees, former employees and Contributing Partners.
Changes in the fair value of the contingent consideration obligations that were recognized in connection with certain Apollo acquisitions arereflected in the Company’s consolidated statements of operations as profit sharing expense.
The Company has a performance based incentive arrangement for certain Apollo partners and employees designed to more closely aligncompensation on an annual basis with the overall realized performance of the Company. This arrangement enables certain partners and employees to earndiscretionary compensation based on carried interest realizations earned by the Company in a given year, which amounts are reflected in profit sharingexpense in the accompanying consolidated financial statements.
Other Income (Loss)
Net Gains (Losses) from Investment Activities—Net gains (losses) from investment activities include both realized gains and losses and thechange in unrealized gains and losses in the Company’s investment portfolio between the opening reporting date and the closing reporting date. Theconsolidated financial statements include the net realized and unrealized gains (losses) of investments, at fair value. For the years ending December 31, 2014and December 31, 2013, for the Company’s investments held by AAA (see notes 4 and 5), a portion of the net gains (losses) from investment activities areattributable to Non-Controlling Interests in the consolidated statements of operations.
Net Gains (Losses) from Investment Activities of Consolidated Variable Interest Entities—Changes in the fair value of the consolidated VIEs’assets and liabilities and related interest, dividend and other income and expenses are presented within net gains (losses) from investment activities ofconsolidated variable interest entities and are attributable to Non-Controlling Interests in the consolidated statements of operations.
Other Income (Loss), Net—Other income (loss), net includes the recognition of gains (losses) arising from the remeasurement of foreign currencydenominated assets and liabilities of foreign subsidiaries, reversal of a portion of the tax receivable agreement liability (see note 15), gains (losses) arisingfrom the remeasurement of derivative instruments associated
- 150-

Table of ContentsAPOLLO GLOBAL MANAGEMENT, LLC
NOTES TO CONSOLIDATEDFINANCIAL STATEMENTS
(dollars in thousands, except share data, except where noted)
with fees from certain of the Company’s affiliates, gains arising from extinguishment of contingent consideration obligations and other miscellaneous non-operating income and expenses.
Comprehensive Income (Loss)—U.S. GAAP guidance establishes standards for reporting comprehensive income and its components in afinancial statement that is displayed with the same prominence as other financial statements. U.S. GAAP requires that the Company classify items of OCI bytheir nature in the financial statements and display the accumulated balance of OCI separately in the shareholders’ equity section of the Company’sconsolidated statements of financial condition. Comprehensive income (loss) consists of net income (loss) and OCI. Apollo’s OCI is primarily comprised ofthe effective portion of changes in the fair value of the interest rate swap agreements discussed previously and foreign currency translation adjustmentsassociated with the Company's non-U.S. dollar denominated subsidiaries.
Income Taxes—The Apollo Operating Group and its subsidiaries generally operate as partnerships for U.S. Federal income tax purposes. As aresult, except as described below, the Apollo Operating Group has not been subject to U.S. income taxes. However, these entities in some cases are subject toNew York City unincorporated business taxes (“NYC UBT”) and non-U.S. entities, in some cases, are subject to non-U.S. corporate income taxes. In addition,APO Corp., a wholly-owned subsidiary of the Company, is subject to U.S. Federal, state and local corporate income tax, and the Company’s provision forincome taxes is accounted for in accordance with U.S. GAAP.
Significant judgment is required in determining tax expense and in evaluating tax positions, including evaluating uncertainties. The Companyrecognizes the tax benefits of uncertain tax positions only where the position is “more likely than not” to be sustained upon examination, includingresolutions of any related appeals or litigation processes, based on the technical merits of the position. The tax benefit is measured as the largest amount ofbenefit that has a greater than 50% likelihood of being realized upon ultimate settlement. If a tax position is not considered more likely than not to besustained, then no benefits of the position are recognized. The Company’s tax positions are reviewed and evaluated quarterly to determine whether or not theCompany has uncertain tax positions that require financial statement recognition.
Deferred tax assets and liabilities are recognized for the expected future tax consequences of differences between the carrying amount of assetsand liabilities and their respective tax basis using currently enacted tax rates. The effect on deferred tax assets and liabilities of a change in tax rates isrecognized in income in the period when the change is enacted. Deferred tax assets are reduced by a valuation allowance when it is more likely than not thatsome portion or all of the deferred tax assets will not be realized.
Non-Controlling Interests—For entities that are consolidated, but not 100% owned, a portion of the income or loss and corresponding equity isallocated to owners other than Apollo. The aggregate of the income or loss and corresponding equity that is not owned by the Company is included in Non-Controlling Interests in the consolidated financial statements. As of December 31, 2015, the Non-Controlling Interests relating to Apollo GlobalManagement, LLC primarily include the ownership interest in the Apollo Operating Group held by the Managing Partners and Contributing Partners throughtheir limited partner interests in Holdings and other ownership interests in consolidated entities. Non-Controlling Interests also include limited partnerinterests of Apollo managed funds in certain consolidated VIEs.
Non-Controlling Interests are presented as a separate component of shareholders’ equity on the Company’s consolidated statements of financialcondition. The primary components of Non-Controlling Interests are separately presented in the Company’s consolidated statements of changes inshareholders’ equity to clearly distinguish the interest in the Apollo Operating Group and other ownership interests in the consolidated entities. Net income(loss) includes the net income (loss) attributable to the holders of Non-Controlling Interests on the Company’s consolidated statements of operations. Profitsand losses are allocated to Non-Controlling Interests in proportion to their relative ownership interests regardless of their basis.
Net Income (Loss) Per Class A Share—As Apollo has issued participating securities, U.S. GAAP requires use of the two-class method ofcomputing earnings per share for all periods presented for each class of common stock and participating security as if all earnings for the period had beendistributed. Under the two-class method, during periods of net income, the net income is first reduced for distributions declared on all classes of securities toarrive at undistributed earnings. During periods of net losses, the net loss is reduced for distributions declared on participating securities only if the securityhas the right to participate in the earnings of the entity and an objectively determinable contractual obligation to share in net losses of the entity.Participating securities include vested and unvested RSUs that participate in distributions, as well as unvested restricted shares.
Whether during a period of net income or net loss, under the two-class method the remaining earnings are allocated to Class A shares andparticipating securities to the extent that each security shares in earnings as if all of the earnings for the
- 151-

Table of ContentsAPOLLO GLOBAL MANAGEMENT, LLC
NOTES TO CONSOLIDATEDFINANCIAL STATEMENTS
(dollars in thousands, except share data, except where noted)
period had been distributed. Earnings or losses allocated to each class of security are then divided by the applicable weighted average outstanding shares toarrive at basic earnings per share. For the diluted earnings, the denominator includes all outstanding Class A shares and includes the number of additionalClass A shares that would have been outstanding if the dilutive potential Class A shares had been issued. The numerator is adjusted for any changes inincome or loss that would result from the issuance of these potential Class A shares.
Use of Estimates—The preparation of the consolidated financial statements requires management to make estimates and assumptions that affect thereported amounts of assets and liabilities at the date of the consolidated financial statements, the disclosure of contingent assets and liabilities at the date ofthe consolidated financial statements and the reported amounts of revenues and expenses during the reporting periods. Apollo’s most significant estimatesinclude goodwill, intangible assets, income taxes, carried interest income from affiliates, contingent consideration obligations related to acquisitions, non-cash compensation, and fair value of investments and debt. Actual results could differ materially from those estimates.
Recent Accounting Pronouncements
In April 2014, the FASB issued guidance to improve the definition of discontinued operations. The new definition limits discontinued operationsreporting to disposals of components of an entity that represent strategic shifts that have (or will have) a major effect on an entity’s operations and financialresults. The guidance is effective for all disposals (or classifications as held for sale) of components of an entity and all businesses or nonprofit activities that,on acquisition, are classified as held for sale that occur within annual periods beginning on or after December 15, 2014, and interim periods within thoseyears. The adoption of this guidance did not have an impact on the Company’s consolidated financial statements.
In May 2014, the FASB issued guidance to establish a comprehensive and converged standard on revenue recognition to enable financialstatement users to better understand and consistently analyze an entity’s revenue across industries, transactions, and geographies. The core principle of thenew guidance is that an entity should recognize revenue to depict the transfer of promised goods or services to customers in an amount that reflects theconsideration to which the entity expects to be entitled in exchange for those goods or services. As such, this new guidance could impact the timing ofrevenue recognition. The new guidance also requires improved disclosures to help users of financial statements better understand the nature, amount, timing,and uncertainty of revenue that is recognized. The new guidance will apply to all entities. In August 2015, FASB issued its final standard formally amendingthe effective date of the new revenue recognition guidance. The amended guidance defers the effective date of the new guidance to interim reporting periodswithin annual reporting periods beginning after December 15, 2017. Entities are permitted to apply the new guidance early, but not before the originaleffective date (i.e., interim periods within annual periods beginning after December 15, 2016). The Company is in the process of evaluating the impact thatthis guidance will have on its consolidated financial statements, including the timing of the recognition of carried interest income.
In June 2014, the FASB issued guidance to resolve diversity in practice in the accounting for share-based payments where the terms of an awardprovide that a performance target could be achieved after the requisite service period. The new guidance requires that a performance target that affects vestingand that could be achieved after the requisite service period be treated as a performance condition and therefore should not be reflected in estimating thegrant-date fair value of the award. Compensation cost should be recognized in the period in which it becomes probable that the performance target will beachieved and should represent the compensation cost attributable to the period(s) for which the requisite service has already been rendered. The guidance iseffective for interim and annual reporting periods in fiscal years beginning after December 15, 2015. Early application is permitted. The Company adoptedthis guidance as of December 31, 2015. The early adoption of this guidance did not have an impact on the Company’s consolidated financial statements.
In August 2014, the FASB issued guidance to eliminate diversity in practice in the accounting for measurement differences in both the initialconsolidation and subsequent measurement of the financial assets and the financial liabilities of a collateralized financing entity. A reporting entity thatconsolidates a collateralized financing entity within the scope of the new guidance may elect to measure the financial assets and the financial liabilities ofthat collateralized financing entity using either the measurement alternative included in the new guidance or the existing guidance on fair valuemeasurement. When a reporting entity elects the measurement alternative included in the new guidance for a collateralized financing entity, the reportingentity should measure both the financial assets and the financial liabilities of that collateralized financing entity in its consolidated financial statementsusing the more observable of the fair value of the financial assets and the fair value of the financial liabilities. The guidance is effective for interim andannual reporting periods in fiscal years beginning after December 15, 2015. Early adoption is permitted. As noted earlier, the Company adopted thisguidance on a modified retrospective basis by recording a cumulative-effect adjustment to shareholders’ equity as of January 1, 2015.
- 152-

Table of ContentsAPOLLO GLOBAL MANAGEMENT, LLC
NOTES TO CONSOLIDATEDFINANCIAL STATEMENTS
(dollars in thousands, except share data, except where noted)
In August 2014, the FASB issued guidance regarding management’s responsibility to evaluate whether there is substantial doubt about anentity’s ability to continue as a going concern and to provide related footnote disclosures. The new guidance requires that management evaluate each annualand interim reporting period whether conditions exist that give rise to substantial doubt about the entity’s ability to continue as a going concern within oneyear from the financial statement issuance date, and if so, provide related disclosures. Substantial doubt exists when conditions and events, considered in theaggregate, indicate that it is probable that a company will be unable to meet its obligations as they become due within one year after the financial statementissuance date. The new guidance applies to all companies. The guidance is effective for interim and annual reporting periods in fiscal years beginning afterDecember 15, 2016. Early adoption is permitted. This guidance is not expected to have an impact on the consolidated financial statements of the Company.
In November 2014, the FASB issued guidance to clarify how current U.S. GAAP should be interpreted in evaluating the economic characteristicsand risks of a host contract in a hybrid financial instrument that is issued in the form of a share. Specifically, the new guidance clarifies that an entity shouldconsider all relevant terms and features-including the embedded derivative feature being evaluated for bifurcation when evaluating the nature of the hostcontract. The new guidance applies to all entities that are issuers of, or investors in, hybrid financial instruments that are issued in the form of a share. Theguidance is effective for interim and annual reporting periods in fiscal years beginning after December 15, 2015. Early adoption is permitted. The Companyadopted this guidance as of December 31, 2015. The early adoption of this guidance did not have an impact on the Company’s consolidated financialstatements.
In January 2015, the FASB issued guidance to simplify income statement presentation by eliminating the concept of extraordinary items. Thenew guidance eliminates the requirement for reporting entities to consider whether an underlying event or transaction is extraordinary. However, thepresentation and disclosure requirements under existing guidance for items that are unusual in nature or occur infrequently will be retained and will beexpanded to include items that are both unusual in nature and infrequently occurring. Under the new guidance, items that are both unusual in nature andinfrequently occurring should be presented within income from continuing operations or disclosed in the notes to the financial statements. The guidance iseffective for interim and annual reporting periods in fiscal years beginning after December 15, 2015. Early adoption is permitted provided that the guidanceis applied from the beginning of the fiscal year of adoption. The Company adopted this guidance as of December 31, 2015. The early adoption of thisguidance did not have an impact on the Company’s consolidated financial statements.
In February 2015, the FASB issued new consolidation guidance which changes the analysis that a reporting entity must perform to determinewhether it should consolidate certain types of legal entities. Existing guidance includes different requirements for performing a consolidation analysis if,among other factors, the entity under evaluation is any one of the following: (1) a legal entity that qualifies for the indefinite deferral under the amendedconsolidation rules, (2) a legal entity that is within the scope of the amended consolidation rules, or (3) a limited partnership or similar entity that isconsidered a voting interest entity. Under the new guidance, all reporting entities are within the scope of the new standard, including limited partnerships andsimilar legal entities, unless a scope exception applies. The presumption that a general partner controls a limited partnership has been eliminated. In addition,fees paid to decision makers that meet certain conditions (e.g., are both customary and commensurate with the level of effort required for the servicesprovided or where the decision maker does not hold other interests in the VIE that individually, or in the aggregate, would absorb more than an insignificantamount of the VIEs expected losses or receive more than an insignificant amount of the VIEs expected residual returns) no longer cause decision makers toconsolidate VIEs in certain instances. The new guidance places more emphasis in the consolidation evaluation on variable interests other than the feearrangements such as principal investment risk (for example, debt or equity interests), guarantees of the value of the assets or liabilities of the VIE, written putoptions on the assets of the VIE, or similar obligations, including some liquidity commitments or agreements (explicit or implicit). Additionally, the newguidance reduces the extent to which related party arrangements cause an entity to be considered a primary beneficiary. The guidance is effective for interimand annual reporting periods in fiscal years beginning after December 15, 2015. Early adoption is permitted, including adoption in an interim period, andadjustments should be reflected as of the beginning of the fiscal year that includes that interim period. A reporting entity may apply the new guidance usingeither a modified retrospective approach by recording a cumulative-effect adjustment to equity as of the beginning of the fiscal year of adoption or byapplying the amendments retrospectively. As noted in the “Summary of Significant Accounting Policies” above the Company has adopted this guidance on amodified retrospective basis. This guidance has resulted in the deconsolidation of certain investment vehicles the Company manages, as further described innote 4.
In April 2015, the FASB issued guidance to simplify the presentation of debt issuance costs. The guidance requires that debt issuance costsrelated to a recognized debt liability be presented in the balance sheet as a direct deduction from the
- 153-

Table of ContentsAPOLLO GLOBAL MANAGEMENT, LLC
NOTES TO CONSOLIDATEDFINANCIAL STATEMENTS
(dollars in thousands, except share data, except where noted)
carrying amount of that debt liability (i.e., versus being capitalized as an asset and amortized as required under existing guidance), consistent with debtdiscounts. The recognition and measurement guidance for debt issuance costs is not affected by the new guidance (i.e., debt issuance costs will continue to beamortized as an increase to interest expense). The guidance is effective for interim and annual reporting periods in fiscal years beginning after December 15,2015. Early adoption is permitted for financial statements that have not been previously issued. The Company adopted this guidance as of December 31,2015 and applied the guidance retrospectively. The early adoption of this guidance did not have a material impact on the Company’s consolidated financialstatements. See note 12 for further details regarding the presentation of debt issuance costs.
In May 2015, the FASB issued guidance to eliminate diversity in practice related to how certain investments measured at net asset value arecategorized within the fair value hierarchy. The guidance removes the requirement to categorize within the fair value hierarchy all investments for which fairvalue is measured using the net asset value per share practical expedient. The guidance is effective for interim and annual reporting periods in fiscal yearsbeginning after December 15, 2015. Pursuant to the guidance, a reporting entity should apply the amendments retrospectively to all periods presented. Theretrospective approach requires that an investment for which fair value is measured using the net asset value per share practical expedient be removed fromthe fair value hierarchy in all periods presented in an entity’s financial statements. Earlier application is permitted. The Company is in the process ofevaluating the impact that this guidance will have on its consolidated financial statements.
In September 2015, the FASB issued guidance to simplify the accounting for adjustments made to the provisional amounts recognized in abusiness combination. The guidance requires that an acquirer recognize adjustments to provisional amounts that are identified during the one year periodfollowing the acquisition date (i.e., measurement period) in the reporting period in which the adjustment amounts are determined (i.e., versus as of theacquisition date as is required by existing guidance). The guidance also requires an acquirer to present separately on the face of the income statement ordisclose in the notes the portion of the amount recorded in current-period earnings that would have been recorded in previous reporting periods if theadjustment to the provisional amounts had been recognized as of the acquisition date. The guidance is effective for interim and annual reporting periods infiscal years beginning after December 15, 2015. The guidance should be applied prospectively to adjustments to provisional amounts that occur after theeffective date of the guidance with earlier application permitted for financial statements that have not been issued. The Company adopted this guidance as ofDecember 31, 2015. The early adoption of this guidance did not have an impact on the Company’s consolidated financial statements.
In January 2016, the FASB issued guidance that revises the accounting related to the classification and measurement of investments in equitysecurities as well as the presentation for certain fair value changes in financial liabilities measured at fair value, and amends certain disclosure requirements.The guidance requires that all equity investments, except those accounted for under the equity method of accounting or those resulting in the consolidationof the investee, be accounted for at fair value with all fair value changes recognized in income. For financial liabilities measured using the fair value option,the guidance requires that any change in fair value caused by a change in instrument-specific credit risk be presented separately in other comprehensiveincome until the liability is settled or reaches maturity. The guidance is effective for interim and annual reporting periods in fiscal years beginning afterDecember 15, 2017, with early adoption permitted for certain provisions. A reporting entity would generally record a cumulative-effect adjustment tobeginning retained earnings as of the beginning of the first reporting period in which the guidance is adopted. The Company is in the process of evaluatingthe impact that this guidance will have on its consolidated financial statements.
3. GOODWILL AND INTANGIBLE ASSETS
On May 5, 2015, the Company acquired 100% of the assets and liabilities of Venator Real Estate Capital Partners (Hong Kong) Limited and itswholly-owned subsidiary, Venator Investment Management Consulting (Shanghai) Limited (together referred to as “Venator”), in exchange for restrictedshares of Apollo Global Management, LLC. The acquisition provided the Company’s real estate segment with additional real estate investment managementand related service capabilities in Asia. The transaction was accounted for as a business combination. Identifiable assets with a combined fair value of $3.0million were acquired and liabilities with a combined fair value of $2.1 million were assumed, resulting in a bargain purchase gain of $0.9 million as of theacquisition date, which was recorded in other income, net in the consolidated statement of operations.
The carrying value of goodwill was $88.9 million and $49.2 million as of December 31, 2015 and 2014, respectively. As of December 31, 2014,due to the consolidation of certain funds and CLOs, the goodwill relating to certain acquisitions was eliminated in consolidation. As a result of theCompany’s adoption of new accounting guidance as described in note 2, the Company deconsolidated certain funds and CLOs as of January 1, 2015,resulting in the goodwill balance no longer eliminating in consolidation as of December 31, 2015. At June 30, 2015 and 2014, the Company performed itsannual impairment testing, and, as the fair value of each of the Company’s reporting units was in excess of its carrying value, there was no impairment ofgoodwill.
Intangible assets, net consists of the following:
As of December 31, 2015 2014Finite-lived intangible assets/management contracts $ 242,863 $ 240,285Accumulated amortization (214,243) (180,246)Intangible assets, net $ 28,620 $ 60,039
The changes in intangible assets, net consist of the following:
For the Year Ended December 31, 2015 2014 2013Balance, beginning of year $ 60,039 $ 94,927 $ 137,856Amortization expense (33,998) (34,888) (43,194)Acquisitions 2,579 — 265

Balance, end of year $ 28,620 (1 ) $ 60,039 $ 94,927
(1) Includes $1.0 million of indefinite-life intangible assets as of December 31, 2015.
Expected amortization of these intangible assets for each of the next 5 years and thereafter is as follows:
2016 2017 2018 2019 2020 Thereafter TotalAmortization of intangible assets $ 8,655 $ 5,220 $ 3,677 $ 3,677 $ 3,677 $ 2,684 $ 27,590
There was no impairment of indefinite-life intangible assets as of December 31, 2015.
4. INVESTMENTS
The following table represents Apollo’s investments:
As of December 31, 2015 2014Investments, at fair value $ 539,080 $ 2,499,128Equity method investments 615,669 380,878
Total Investments $ 1,154,749 $ 2,880,006 Investments, at Fair Value
Investments, at fair value, consist of investments for which the fair value option has been elected and include the Company’s investment inAthene Holding, investments held by the Company’s consolidated funds and other investments held by the Company. See note 6 for further discussionregarding investments, at fair value.
- 154-

Table of ContentsAPOLLO GLOBAL MANAGEMENT, LLC
NOTES TO CONSOLIDATEDFINANCIAL STATEMENTS
(dollars in thousands, except share data, except where noted)
Net Gains (Losses) from Investment Activities
The following table presents the realized and net change in unrealized gains (losses) on investments, at fair value for the years ended December31, 2015, 2014 and 2013:
For the Year Ended December 31, 2015 2014 2013Realized gains (losses) on sales of investments $ 889 $ (12,651) $ 409Net change in unrealized gains due to changes in fair values 120,834 225,894 329,826
Net Gains from Investment Activities $ 121,723 $ 213,243 $ 330,235
Equity Method Investments
Apollo’s equity method investments include its investments in Apollo private equity, credit and real estate funds, which are not consolidated,but in which the Company exerts significant influence. Apollo’s share of operating income generated by these investments is recorded within income fromequity method investments in the consolidated statements of operations.
- 155-

Table of ContentsAPOLLO GLOBAL MANAGEMENT, LLC
NOTES TO CONSOLIDATEDFINANCIAL STATEMENTS
(dollars in thousands, except share data, except where noted)
Equity method investments, excluding those for which the fair value option was elected, as of December 31, 2015 and 2014 consisted of thefollowing:
Equity Held as of
December 31, 2015 % of
Ownership December 31, 2014 % of
Ownership Private Equity Funds:
AP Alternative Assets, L.P. ("AAA")(6) $ 65,961 2.370% $ — —% AAA Investments, L.P. (“AAA Investments”) 1,676 0.057 1,293 0.057 Apollo Investment Fund IV, L.P. (“Fund IV”) 9 0.024 8 0.022 Apollo Investment Fund V, L.P. (“Fund V”) 57 0.048 68 0.031 Apollo Investment Fund VI, L.P. (“Fund VI”) 2,369 0.119 6,173 0.114 Apollo Investment Fund VII, L.P. (“Fund VII”) 58,334 1.245 78,286 1.223 Apollo Investment Fund VIII, L.P. (“Fund VIII”) 116,443 2.223 33,099 2.241 Apollo Natural Resources Partners, L.P. (“ANRP I”) 6,246 0.836 5,608 0.807 Apollo Natural Resources Partners II, L.P. (“ANRP II”) 5,194 2.447 — — AION Capital Partners Limited (“AION”) 16,497 5.938 14,707 6.113 Apollo Asia Private Credit Fund, L.P. (“APC”) 49 0.045 47 0.044 VC Holdings, L.P. Series A (“Vantium A/B”) 15 6.450 12 6.450 VC Holdings, L.P. Series C (“Vantium C”) 63 2.071 48 2.071 VC Holdings, L.P. Series D (“Vantium D”) 169 6.345 180 6.345 Other 41 NM — —
Total Private Equity Funds(5) 273,123 139,529 Credit Funds:
Apollo Special Opportunities Managed Account, L.P. (“SOMA”) 5,992 0.816 6,997 0.841 Apollo Value Strategic Fund, L.P. (“VIF”) 39 0.084 146 0.067 Apollo Strategic Value Fund, L.P. (“SVF”) 7 0.030 10 0.033 Apollo Credit Liquidity Fund, L.P. (“ACLF”) 2,253 4.106 4,128 2.771 Apollo Credit Opportunity Fund I, L.P. (“COF I”) 1,463 1.954 2,298 1.870 Apollo Credit Opportunity Fund II, L.P. (“COF II”) 1,281 1.523 2,249 1.497 Apollo Credit Opportunity Fund III, L.P. (“COF III”) 19,612 1.052 13,102 1.061 Apollo European Principal Finance Fund, L.P. (“EPF I”) 5,195 1.372 7,647 1.449 Apollo European Principal Finance Fund II, L.P. (“EPF II”) 47,867 1.760 44,523 1.760 Apollo Investment Europe II, L.P. (“AIE II”) 2,193 3.990 3,203 1.937 Apollo Investment Europe III, L.P. (“AIE III”) 3,917 2.920 1,540 2.914 Apollo Palmetto Strategic Partnership, L.P. (“Palmetto”) 15,158 1.186 14,049 1.186 Apollo Senior Floating Rate Fund Inc. (“AFT”) 78 0.030 86 0.031 Apollo Residential Mortgage, Inc. (“AMTG”) (3) 3,997 (1) 0.707 (1) 4,263 (2) 0.593 (2)
Apollo European Credit, L.P. (“AEC”) 2,303 1.081 2,443 1.081 Apollo European Strategic Investments, L.P. (“AESI”) 2,323 0.990 3,834 0.990 Apollo European Strategic Investments II, L.P. (AESI II”) 1,224 0.990 123 0.990 Apollo Centre Street Partnership, L.P. (“ACSP”) 11,870 2.488 11,474 2.439 Apollo Investment Corporation (“AINV”) (4) 61,944 (1) 3.434 (1) 64,382 (2) 3.057 (2)
Apollo SK Strategic Investments, L.P. (“SK”) 1,152 0.990 1,693 0.990 Apollo SPN Investments I, L.P. 5,490 0.392 5,500 0.720
CION Investment Corporation (“CION”) 1,000 0.107 1,000 0.206
Apollo Tactical Income Fund Inc. (“AIF”) 73 0.031 84 0.032 Apollo Franklin Partnership, L.P. (“Franklin Fund”) 8,147 9.091 9,647 9.091 Apollo Zeus Strategic Investments, L.P. (“Zeus”) 7,764 3.398 6,404 3.392 Apollo Lincoln Fixed Income Fund, L.P. 1,941 1.041 1,398 0.993 Apollo Lincoln Private Credit Fund, L.P. 211 0.990 194 0.990 Apollo Structured Credit Recovery Master Fund III, L.P. 1,804 0.293 315 0.126 Apollo Total Return Fund L.P. 162 0.032 163 0.046 Apollo Credit Short Opportunities Fund L.P. 20 0.012 19 0.027 MidCap FinCo Limited (“MidCap”) 79,326 4.940 — —

Apollo Energy Opportunity Fund, L.P. (“AEOF”) 8,898 2.440 — —
- 156-

Table of ContentsAPOLLO GLOBAL MANAGEMENT, LLC
NOTES TO CONSOLIDATEDFINANCIAL STATEMENTS
(dollars in thousands, except share data, except where noted)
Apollo A-N Credit Fund, L.P. 4,962 1.970 — — Apollo Tactical Value SPN Investments, L.P. 1,168 1.482 — — Apollo Union Street Partners, L.P. 1,139 2.002 — — Apollo Hercules Partners L.P. 1,094 2.439 — —
Total Credit Funds(5) 313,067 212,914 Real Estate:
ARI(3) 13,845 (1) 1.043 (1) 13,989 (2) 1.495 (2)
U.S. RE Fund I 9,275 5.000 10,519 1.845 U.S. RE Fund II 2,712 1.886 38 4.761 CPI Capital Partners North America, L.P. 28 0.404 137 0.408 CPI Capital Partners Europe, L.P. 5 0.001 5 0.001 CPI Capital Partners Asia Pacific, L.P. 80 0.039 96 0.039 Apollo GSS Holding (Cayman), L.P. 3,082 4.750 3,564 4.750 BEA/AGRE China Real Estate Fund, L.P. 83 1.030 87 1.031 Apollo-IC, L.P. (Shanghai Village) 359 3.100 — — Other 10 NM — —
Total Real Estate Funds(5) 29,479 28,435 Total $ 615,669 $ 380,878
(1) Amounts are as of September 30, 2015.(2) Amounts are as of September 30, 2014.(3) Investment value includes the fair value of RSUs granted to the Company as of the grant date. These amounts are not considered in the percentage of ownership until the
RSUs are vested and issued to the Company, at which point the RSUs are converted to common stock and delivered to the Company.(4) The value of the Company’s investment in AINV was $41,833 and $53,693 based on the quoted market price as of December 31, 2015 and December 31, 2014,
respectively.(5) Certain funds invest across multiple segments. The presentation in the table above is based on the classification of the majority of such funds’ investments.(6) AAA was deconsolidated effective January 1, 2015 as a result of the Company’s adoption of new accounting guidance, as described in note 2. As a result, the Company’s
investment in AAA no longer eliminates in consolidation.
The Company’s equity method investment in Athene Holding, for which the fair value option was elected, met the significance criteria as definedby the SEC for the year ended December 31, 2015. As such, the following tables present summarized financial information of Athene Holding as ofDecember 31, 2015 and 2014, and for the years ended December 31, 2015, 2014 and 2013:
As of December 31,
2015(1) 2014 in millionsStatements of Financial Condition Investments $ 57,284 $ 59,050Assets 74,335 82,182Liabilities 68,865 77,584Equity 5,470 4,598
(1) The financial statement information for the year ended December 31, 2015 is presented a quarter in arrears and is comprised of the financial information as of September 30,2015, which represents the latest available financial information as of the date of this report.
- 157-

Table of ContentsAPOLLO GLOBAL MANAGEMENT, LLC
NOTES TO CONSOLIDATEDFINANCIAL STATEMENTS
(dollars in thousands, except share data, except where noted)
For the Year Ended December 31,
2015(1) 2014 2013 in millionsStatements of Operations Revenues $ 2,767 $ 4,133 $ 1,760Expenses 2,161 3,598 750Income before income tax provision 606 535 1,010Income tax provision (benefit) 71 40 (1)Net income 535 495 1,011Net income attributable to Non-controlling Interests (43) (12) (116)
Net income available to Athene common shareholders $ 492 $ 483 $ 895
(1) The financial statement information for the year ended December 31, 2015 is presented a quarter in arrears and is comprised of the financial information for the year endedSeptember 30, 2015, which represents the latest available financial information as of the date of this report.
The tables below present summarized aggregate financial information of the Company’s equity method investments, as of December 31, 2015and 2014, and for the years ended December 31, 2015, 2014 and 2013:
Private Equity Credit Real Estate Aggregate Totals
As of
December 31, As of
December 31, As of
December 31, As of
December 31,
Statement of Financial Condition 2015(1) 2014(1) 2015(1) 2014(1) 2015(1) 2014(1) 2015(1) 2014(1)
Investments $ 17,080,292 $ 16,082,723 $ 18,830,120 $ 17,888,199 $ 3,188,822 $ 2,584,097 $ 39,099,234 $ 36,555,019
Assets 17,970,417 16,924,291 21,255,463 20,076,656 3,484,842 2,772,857 42,710,722 39,773,804
Liabilities 37,416 128,257 7,646,492 6,216,702 1,287,051 1,028,203 8,970,959 7,373,162
Equity 17,933,001 16,796,034 13,608,971 13,859,954 2,197,791 1,744,654 33,739,763 32,400,642
Private Equity Credit Real Estate Aggregate Totals
For the Year Ended
December 31, For the Year Ended
December 31, For the Year Ended
December 31, For the Year Ended
December 31,
Statement of Operations 2015(1) 2014(1) 2013(1) 2015(1) 2014(1) 2013(1) 2015(1) 2014(1) 2013(1) 2015(1) 2014(1) 2013(1)
Revenues/Investment Income $ 408,971 $ 340,380 $ 675,844 $ 1,352,017 $ 1,954,270 $ 1,297,324 $ 120,340 $ 89,579 $ 73,429 $ 1,881,328 $ 2,384,229 $ 2,046,597
Expenses 306,044 326,126 239,750 464,610 417,967 583,410 35,340 29,022 39,153 805,994 773,115 862,313
Net Investment Income 102,927 14,254 436,094 887,407 1,536,303 713,914 85,000 60,557 34,276 1,075,334 1,611,114 1,184,284
Net Realized and Unrealized Gain(Loss) 20,757 1,300,343 10,411,556 (1,643,758) (548,088) 953,227 (1,699) 62,516 214,764 (1,624,700) 814,771 11,579,547
Net Income $ 123,684 $ 1,314,597 $ 10,847,650 $ (756,351) $ 988,215 $ 1,667,141 $ 83,301 $ 123,073 $ 249,040 $ (549,366) $ 2,425,885 $ 12,763,831
(1) Certain private equity, credit and real estate fund amounts are as of and for the twelve months ended September 30, 2015, 2014 and 2013.
5. VARIABLE INTEREST ENTITIES
As described in note 2, the Company consolidates entities that are VIEs for which the Company has been designated as the primary beneficiary.There is no recourse to the Company for the consolidated VIEs’ liabilities.
- 158-

Table of ContentsAPOLLO GLOBAL MANAGEMENT, LLC
NOTES TO CONSOLIDATEDFINANCIAL STATEMENTS
(dollars in thousands, except share data, except where noted)
Consolidated Variable Interest Entities
Apollo has consolidated VIEs in accordance with the policy described in note 2. Through its role as investment manager of these VIEs, theCompany determined that Apollo has the power to direct the activities that most significantly impact the economic performance of these VIEs. Additionally,Apollo determined that its interests, both directly and indirectly from these VIEs, represent rights to returns that could potentially be significant to such VIEs.As a result, Apollo determined that it is the primary beneficiary and therefore should consolidate the VIEs.
Deconsolidation of CLOs
CLOs are generally determined to be VIEs if they are formed solely to issue collateralized notes in the legal form of debt and therefore do nothave sufficient total equity investment at risk to permit the entity to finance its activities without additional subordinated financial support. Prior to adoptionof the new consolidation guidance, Apollo was considered to possess a controlling financial interest in, and therefore consolidated, such CLOs as Apollo’srole as collateral manager provided the Company with the power to direct the activities that most significantly impacted the CLO’s economic performanceand the Company had the right to receive certain benefits from the CLO through incentive fees that could potentially be significant to the CLO. Under thenew guidance, the majority of these CLOs have been deconsolidated as the incentive fees received by Apollo from the deconsolidated CLOs are notconsidered variable interests. Accordingly, the Company deconsolidated approximately $14.6 billion in assets and $13.7 billion in liabilities related to theseentities reflected as of January 1, 2015. The net impact of the deconsolidation is reflected in the consolidated statement of changes in shareholders’ equitywithin Appropriated Partners Capital for the year ended December 31, 2015.
As a result of the adoption, certain deconsolidation adjustments have been recorded to various line items on the consolidated financialstatements, including adjustments to remove the impact of intercompany eliminations. These adjustments impacted multiple line items within total revenuesand other income, as well as net income attributable to Non-Controlling Interests on the consolidated statements of operations, as well as multiple line itemswithin the consolidated statements of financial condition, including goodwill (See note 3 to our consolidated financial statements for further detail regardingthe impact related to goodwill).
Consolidated CLOs
Certain CLOs remain consolidated by Apollo as the Company continues to be considered to hold a controlling financial interest through directand indirect interests in these CLOs exclusive of management and performance based fees received. Through its role as collateral manager of these VIEs, theCompany determined that Apollo had the power to direct the activities that most significantly impact the economic performance of these VIEs. These CLOswere formed for the sole purpose of issuing collateralized notes to investors. The assets of these VIEs are primarily comprised of senior secured loans and theliabilities are primarily comprised of debt.
The assets of these consolidated CLOs are not available to creditors of the Company. In addition, the investors in these consolidated VIEs haveno recourse against the assets of the Company. The Company has elected the fair value option for financial instruments held by its consolidated CLOs, whichincludes investments in loans and corporate bonds, as well as debt obligations and contingent obligations held by such consolidated CLOs. Other assetsinclude amounts due from brokers and interest receivables. Other liabilities include payables for securities purchased, which represent open trades within theconsolidated VIEs and primarily relate to corporate loans that are expected to settle within the next 60 days. From time to time, Apollo makes investments incertain consolidated CLOs denominated in foreign currencies. As of December 31, 2015 and December 31, 2014, the Company had invested $42.3 millionand $47.4 million, respectively, in consolidated foreign currency denominated CLOs, which eliminates in consolidation.
Investment in Champ L.P.
On September 30, 2014, the Company, through a wholly-owned subsidiary, acquired a 25.6% ownership interest in Champ L.P. following whicha wholly-owned subsidiary of Champ L.P. then acquired a 35% ownership interest in KBC Bank Deutschland AG (“KBC Bank”), the German subsidiary ofBelgian KBC Group NV (the “KBC Transaction”). Following the closing of the transaction, KBC Bank was renamed Bremer Kreditbank AG and the bankbegan to operate under the name BKB Bank. As of December 31, 2015, the Company had invested $18.2 million in Champ L.P. The Company, together withother affiliated investors which are not consolidated, in aggregate, own 100% of Champ L.P.
- 159-

Table of ContentsAPOLLO GLOBAL MANAGEMENT, LLC
NOTES TO CONSOLIDATEDFINANCIAL STATEMENTS
(dollars in thousands, except share data, except where noted)
The Company, through its aforementioned wholly-owned subsidiary, is the general partner and primary beneficiary of Champ L.P., which meetsthe definition of a VIE. Accordingly, the Company has consolidated Champ L.P. in accordance with the policy described in note 2. The Company’sinvestment in Champ L.P. is eliminated in consolidation.
Net Gains (Losses) from Investment Activities of Consolidated Variable Interest Entities
The following table presents net gains (losses) from investment activities of the consolidated VIEs for the years ended December 31, 2015, 2014and 2013:
For the Year Ended December 31,
2015 2014 2013Net unrealized gains (losses) from investment activities $ 9,021 $ (317,591) $ (33,275)Net realized gains from investment activities 6,766 79,057 87,472
Net gains (losses) from investment activities 15,787 (238,534) 54,197Net unrealized gains (losses) from debt 3,057 809 (232,509)Net realized gains from debt — 101,745 137,098
Net gains from debt 3,057 102,554 (95,411)Interest and other income 37,404 666,486 674,324Interest and other expenses (37,198) (507,942) (433,368)
Net Gains from Investment Activities of Consolidated Variable Interest Entities $ 19,050 $ 22,564 $ 199,742
Senior Secured Notes and Subordinated Notes—Included within debt are amounts due to third-party institutions by the consolidated VIEs. Thefollowing table summarizes the principal provisions of the debt of the consolidated VIEs as of December 31, 2015 and 2014:
As of December 31, 2015 As of December 31, 2014
Principal
Outstanding
WeightedAverageInterest
Rate
WeightedAverage
RemainingMaturity in
Years Principal
Outstanding
WeightedAverageInterest
Rate
WeightedAverage
RemainingMaturity in
YearsSenior Secured Notes(2)(3) $ 735,792 2.17% 12.1 $ 13,459,387 1.60% 7.8Subordinated Notes(2)(3) 82,365 N/A (1) 15.1 1,183,834 N/A (1) 9.0
Total $ 818,157 $ 14,643,221 (1) The subordinated notes do not have contractual interest rates but instead receive distributions from the excess cash flows of the VIEs.(2) The fair value of Senior Secured Notes and Subordinated Notes as of December 31, 2015 and 2014 was $801.3 million and $14,123.1 million, respectively.(3) The debt at fair value of the consolidated VIEs is collateralized by assets of the consolidated VIEs and assets of one vehicle may not be used to satisfy the liabilities of
another vehicle. As of December 31, 2015 and 2014, the fair value of the consolidated VIE assets was $1,030.8 million and $17,070.8 million, respectively. Thiscollateral consisted of cash and cash equivalents, investments, at fair value, and other assets.
The consolidated VIEs’ debt obligations contain various customary loan covenants as described above. As of December 31, 2015, the Companywas not aware of any instances of non-compliance with any of these covenants.
- 160-

Table of ContentsAPOLLO GLOBAL MANAGEMENT, LLC
NOTES TO CONSOLIDATEDFINANCIAL STATEMENTS
(dollars in thousands, except share data, except where noted)
As of December 31, 2015, the table below presents the contractual maturities for debt of the consolidated VIEs:
2016 2017 2018 2019 2020 Thereafter Total
Senior Secured Notes $ — $ — $ — $ — $ — $ 735,792 $ 735,792
Subordinated Notes — — — — — 82,365 82,365Total Obligations as of December 31,2015 $ — $ — $ — $ — $ — $ 818,157 $ 818,157
Variable Interest Entities Which are Not Consolidated
The Company holds variable interests in certain VIEs which are not consolidated, as it has been determined that Apollo is not the primarybeneficiary.
The following tables present the carrying amounts of the assets and liabilities of the VIEs for which Apollo has concluded that it holds asignificant variable interest, but that it is not the primary beneficiary as of December 31, 2015 and 2014. In addition, the tables present the maximumexposure to losses relating to these VIEs. As noted earlier, as a result of the adoption of the FASB’s new consolidation guidance, the Company is no longerconsidered to have a variable interest in many of the entities that it manages where its sole interest in an entity is either through carried interest, performancefees or other indirect interests which are not considered to absorb more than an insignificant amount of expected losses or returns of the entity.
As of December 31, 2015
Total Assets Total Liabilities Apollo Exposure Total $ 5,378,456 (1) $ 1,626,743 (2) $ 202,146 (3)
(1) Consists of $219.8 million in cash, $5,149.0 million in investments and $9.6 million in receivables.(2) Represents $1,626.7 million in debt and other payables.(3) Represents Apollo’s direct equity method investment in those entities in which Apollo holds a significant variable interest. Additionally, cumulative carried interest
income is subject to reversal in the event of future losses. The maximum amount of future reversal of carried interest income from all of Apollo’s funds, including thoseentities in which Apollo holds a significant variable interest, was $2.4 billion as of December 31, 2015 as discussed in note 16.
As of December 31, 2014
Total Assets Total Liabilities Apollo Exposure Total $ 11,676,038 (1) $ 729,515 (2) $ 30,752 (3)
(1) Consists of $794.5 million in cash, $10,456.0 million in investments and $425.6 million in receivables.(2) Represents $362.0 million in debt and other payables, $359.4 million in securities sold, not purchased, and $8.2 million in capital withdrawals payable.(3) Represents Apollo’s direct equity method investment in those entities in which Apollo holds a significant variable interest. Additionally, cumulative carried interest
income is subject to reversal in the event of future losses. The maximum amount of future reversal of carried interest income from all of Apollo’s funds, including thoseentities in which Apollo holds a significant variable interest, was $2.9 billion as of December 31, 2014.
- 161-

Table of ContentsAPOLLO GLOBAL MANAGEMENT, LLC
NOTES TO CONSOLIDATEDFINANCIAL STATEMENTS
(dollars in thousands, except share data, except where noted)
6. FAIR VALUE MEASUREMENTS OF FINANCIAL INSTRUMENTS
The following tables summarize the valuation of the Company’s financial assets and liabilities for which the fair value option has been electedby the fair value hierarchy as of December 31, 2015 and 2014, respectively:
As of December 31, 2015
Level I(5) Level II(5) Level III Total Cost of Investments,
at Fair Value
Assets Investments, at fair value:
Investments held by Apollo Senior Loan Fund $ — $ 26,913 $ 1,634 $ 28,547 $ 29,344
Other investments — — 434 434 831
Investment in Athene Holding(1) — — 510,099 510,099 387,526
Total investments, at fair value — 26,913 512,167 539,080 (6) $ 417,701
Investments of VIEs, at fair value(3) — 803,412 107,154 910,566 Total Assets $ — $ 830,325 $ 619,321 $ 1,449,646 Liabilities Liabilities of VIEs, at fair value(3)(4) $ — $ 801,270 $ 11,411 $ 812,681 Contingent consideration obligations(2) — — 79,579 79,579 Total Liabilities $ — $ 801,270 $ 90,990 $ 892,260
As of December 31, 2014
Level I(5) Level II(5) Level III Total Cost of Investments,
at Fair Value
Assets Investments, at fair value:
Investment in AAA Investments $ — $ — $ 2,144,118 $ 2,144,118 $ 1,494,358
Investments held by Apollo Senior Loan Fund — 25,537 4,359 29,896 30,100
Other investments — — 600 600 3,318
Investment in Athene Holding(1) — — 324,514 324,514 324,293
Total investments, at fair value — 25,537 2,473,591 2,499,128 (6) $ 1,852,069
AAA/Athene Receivable(1) — — 61,292 61,292 Investments of VIEs, at fair value(3) 176 13,135,564 2,522,913 15,658,653 Total Assets $ 176 $ 13,161,101 $ 5,057,796 $ 18,219,073 Liabilities Liabilities of VIEs, at fair value(3)(4) $ — $ 1,793,353 $ 12,343,021 $ 14,136,374 Contingent consideration obligations(2) — — 96,126 96,126 Total Liabilities $ — $ 1,793,353 $ 12,439,147 $ 14,232,500
(1) See note 15 for further disclosure regarding the investment in Athene Holding and the AAA/Athene receivable.
(2)See note 16 for further disclosure regarding contingent consideration obligations.
(3)See note 5 for further disclosure regarding VIEs.
(4) As of December 31, 2015, liabilities of VIEs, at fair value included debt and other liabilities of $801.3 million and $11.4 million, respectively. As of December 31, 2014,liabilities of VIEs, at fair value included debt and other liabilities of $14,123.1 million and $13.3 million, respectively. Other liabilities include contingent obligationsclassified as Level III.
(5)All Level I and Level II investments and liabilities were valued using third party pricing.
(6) See note 4 to our consolidated financial statements for further detail regarding our investments at fair value and reconciliation to the consolidated statements of financialcondition.
- 162-

Table of ContentsAPOLLO GLOBAL MANAGEMENT, LLC
NOTES TO CONSOLIDATEDFINANCIAL STATEMENTS
(dollars in thousands, except share data, except where noted)
There were no transfers of financial assets into Level I for the years ended December 31, 2015 and 2014. In addition, there were no transfers offinancial liabilities between Level I and Level II for the years ended December 31, 2015 and 2014. The following table summarizes the transfers of financialassets from Level I into Level II for positions that existed as of the years ended December 31, 2015 and 2014, respectively:
For the Year Ended December 31,
2015 2014
Transfers from Level I into Level II $ — $ 4,084
Transfers were a result of subjecting the broker quotes on these investments to various criteria which include the number and quality of brokerquotes, the standard deviation of obtained broker quotes and the percentage deviation from independent pricing services.
The following tables summarize the changes in fair value in financial assets measured at fair value for which Level III inputs have been used todetermine fair value for the years ended December 31, 2015 and 2014, respectively:
For the Year Ended December 31, 2015
Investment in
AAAInvestments
Investments held byApollo Senior Loan
Fund Other Investments Investment in
Athene Holding AAA/AtheneReceivable
Investment inRCAP
Investments ofConsolidated VIEs Total
Balance, Beginning of Period $ 2,144,118 $ 4,359 $ 600 $ 324,514 $ 61,292 $ — $ 2,522,913 $ 5,057,796
Adoption of accounting guidance (2,144,118) — — — — — (2,399,130) (4,543,248)
Fees — — — — 1,942 — — 1,942
Purchases — 5,913 272 — — 25,000 44,116 75,301
Sales of investments/distributions — (6,996) (115) — — (25,667) (36,909) (69,687)
Net realized gains/accrued interest — 48 — — — 667 5,539 6,254
Changes in net unrealized gains (losses) — (263) (323) 122,351 — — 8,816 130,581
Cumulative translation adjustment — — — — — — (12,111) (12,111)
Transfer into Level III(1) — 5,439 — — — — 59,316 64,755
Transfer out of Level III(1) — (6,866) — — — — (85,396) (92,262)
Settlement of receivable(2) — — — 63,234 (63,234) — — —
Balance, End of Period $ — $ 1,634 $ 434 $ 510,099 $ — $ — $ 107,154 $ 619,321
Change in net unrealized gains (losses)included in net gains (losses) frominvestment activities related toinvestments still held at reporting date $ — $ (677) $ (323) $ 122,351 $ — $ — $ — $ 121,351
Change in net unrealized gains includedin Net Gains from Investment Activitiesof Consolidated VIEs related toinvestments still held at reporting date — — — — — — 8,963 8,963
(1) Transfers between Level II and III were a result of subjecting the broker quotes on these financial assets to various criteria which include the number and quality of brokerquotes, the standard deviation of obtained broker quotes and the percentage deviation from independent pricing services.
(2) See note 15 for further disclosure regarding the settlement of the AAA/Athene receivable and the investment in Athene Holding.
- 163-

Table of ContentsAPOLLO GLOBAL MANAGEMENT, LLC
NOTES TO CONSOLIDATEDFINANCIAL STATEMENTS
(dollars in thousands, except share data, except where noted)
For the Year Ended December 31, 2014
Investment in
AAAInvestments
Investments heldby Apollo Senior
Loan Fund Other
Investments Athene and AAA
ServicesDerivatives
Investment inAthene Holding
AAA/AtheneReceivable
Investments ofConsolidated
VIEs Total
Balance, Beginning of Period $ 1,942,051 $ 892 $ 40,373 $ 130,709 $ — $ — $ 1,919,537 $ 4,033,562
Elimination of investments attributable toconsolidation of VIEs — — — — — — 19,187 19,187
Fees — — — 60,422 — 178,332 — 238,754
Purchases — 4,707 1,844 — 2,080 — 1,036,810 1,045,441
Sales of investments/distributions (2,500) (1,543) (51,052) — — — (825,429) (880,524)
Net realized gains (losses) — 10 (12,871) 24,242 — — 20,972 32,353
Changes in net unrealized gains (losses) 204,567 (66) 22,306 (10,203) 224 — (9,302) 207,526
Cumulative translation adjustment — — — — — — (5,834) (5,834)
Transfer into Level III(1) — 1,594 — — — — 1,413,688 1,415,282
Transfer out of Level III(1) — (1,235) — — — — (1,046,716) (1,047,951)
Settlement of derivatives(2) — — — (205,170) 322,210 (117,040) — —
Balance, End of Period $ 2,144,118 $ 4,359 $ 600 $ — $ 324,514 $ 61,292 $ 2,522,913 $ 5,057,796
Change in net unrealized gains included in NetGains from Investment Activities related toinvestments still held at reporting date $ 204,567 $ (66) $ 580 $ — $ 224 $ — $ — $ 205,305
Change in net unrealized gains included in NetGains from Investment Activities of ConsolidatedVIEs related to investments still held at reportingdate — — — — — — (52,485) (52,485)
(1) Transfers between Level II and III were a result of subjecting the broker quotes on these financial assets to various criteria which include the number and quality of brokerquotes, the standard deviation of obtained broker quotes and the percentage deviation from independent pricing services.
(2) See note 15 for further disclosure regarding the settlement of the AAA/Athene receivable and the investment in Athene Holding.
For the Year Ended December 31,
2015 2014
Liabilities of
Consolidated VIEs Contingent
ConsiderationObligations Total
Liabilities ofConsolidated VIEs
ContingentConsideration
Obligations Total
Balance, Beginning of Period $ 12,343,021 $ 96,126 $ 12,439,147 $ 9,994,147 $ 135,511 $ 10,129,658
Elimination of debt attributable to consolidation of VIEs — — — 13,493 — 13,493
Adoption of accounting guidance (11,433,815) — (11,433,815) — — —
Additions — — — 3,965,725 — 3,965,725
Payments/Extinguishment(4) — (15,743) (15,743) (1,551,533) (50,666) (1,602,199)
Net realized gains — — — (101,745) — (101,745)
Changes in net unrealized (gains) losses(2) (8,244) (804) (9,048) (25,685) 11,281 (14,404)
Cumulative translation adjustment (92,593) — (92,593) (71,558) — (71,558)
Transfers into Level III — — — 500,837 (1) — 500,837
Transfers out of Level III (796,958) (3) — (796,958) (380,660) (1) — (380,660)
Balance, End of Period $ 11,411 $ 79,579 $ 90,990 $ 12,343,021 $ 96,126 $ 12,439,147
Change in net unrealized gains included in Net Gains fromInvestment Activities of consolidated VIEs related to liabilitiesstill held at reporting date $ — $ — $ — $ (113,874) $ — $ (113,874)
(1) Transfers between Level II and III were a result of subjecting the broker quotes on these financial liabilities to various criteria which include the number and quality of brokerquotes, the standard deviation of obtained broker quotes and the percentage deviation from independent pricing services.
(2) Changes in fair value of contingent consideration obligations are recorded in profit sharing expense in the consolidated statements of operations.
(3) Upon adoption of new accounting guidance (see note 2), the debt obligations of consolidated CLOs are no longer categorized as Level III financial liabilities under the fairvalue hierarchy. Effective January 1, 2015, these financial liabilities are measured and leveled on the basis of the fair value of the financial assets of the consolidated CLOs andwere categorized as Level II as of December 31, 2015.
(4) For the year ended December 31, 2014, includes a $13.4 million extinguishment of contingent consideration obligations, which is recorded in other income onthe consolidated statements of operations.
- 164-

Table of ContentsAPOLLO GLOBAL MANAGEMENT, LLC
NOTES TO CONSOLIDATEDFINANCIAL STATEMENTS
(dollars in thousands, except share data, except where noted)
The following tables summarize the quantitative inputs and assumptions used for financial assets and liabilities categorized as Level III under thefair value hierarchy as of December 31, 2015 and 2014, respectively:
As of December 31, 2015
Fair Value Valuation Techniques Unobservable Inputs Ranges WeightedAverage
Financial Assets Investments of Consolidated Apollo Funds:
Apollo Senior Loan Fund $ 1,634 Third Party Pricing(1) N/A N/A N/A
Investments in Other 434 Other N/A N/A N/A
Investment in Athene Holding 510,099 Book Value Multiple Book Value Multiple 1.18x 1.18x
Investments of Consolidated VIEs: Bank Debt Term Loans 15,776 Third Party Pricing(1) N/A N/A N/A
Corporate Loans/Bonds/CLO Notes 22,409 Third Party Pricing(1) N/A N/A N/A
Equity Securities 62,756 Market Comparable Companies Comparable Multiples 0.60x 0.60x
Discounted Cash Flow Discount Rate 14.6% 14.6%
Other 6,213 Net Asset Value N/A N/A N/A
Total Investments of Consolidated VIEs 107,154 Total Financial Assets $ 619,321
Financial Liabilities Liabilities of Consolidated VIEs:
Contingent Obligation $ 11,411 Other N/A N/A N/A
Contingent Consideration Obligation 79,579 Discounted Cash Flow Discount Rate 11.0% - 18.5% 17.0%
Total Financial Liabilities $ 90,990
(1) These securities are valued primarily using unadjusted broker quotes.
- 165-

Table of ContentsAPOLLO GLOBAL MANAGEMENT, LLC
NOTES TO CONSOLIDATEDFINANCIAL STATEMENTS
(dollars in thousands, except share data, except where noted)
As of December 31, 2014
Fair Value Valuation Techniques Unobservable Inputs Ranges WeightedAverage
Financial Assets Investments of Consolidated Apollo Funds:
AAA Investments(1) $ 2,144,118 Net Asset Value N/A N/A N/A
Apollo Senior Loan Fund 4,359 Third Party Pricing(2) N/A N/A N/A
Other Investments 600 Other N/A N/A N/AInvestment in Athene Holding 324,514 Discounted Cash Flow Discount Rate 15.0% 15.0%AAA/Athene Receivable 61,292 Discounted Cash Flow Discount Rate 15.0% 15.0%
Investments of Consolidated VIEs:
Bank Debt Term Loans1,340,296 Third Party Pricing(2) N/A N/A N/A
87,314 Discounted Cash Flow Discount Rate 7.1% - 14.0% 8.4%
Corporate Loans/Bonds/CLO Notes(3) 1,009,873 Third Party Pricing(2) N/A N/A N/A
Equity Securities
930 Third Party Pricing(2) N/A N/A N/A4,610 Market Comparable Companies Comparable Multiples 5.8x 5.8x
58,923 Transaction Purchase Price N/A N/A20,967 Transaction Implied Multiple 5.2x 5.2x
Total Investments of Consolidated VIEs 2,522,913 Total Financial Assets $ 5,057,796
Financial Liabilities Liabilities of Consolidated VIEs:
Subordinated Notes $ 908,831
Discounted Cash Flow
Discount Rate 10.0% - 12.5% 11.5%
Default Rate 1.0% - 2.0% 1.7%
Recovery Rate 75.0% 75.0%Subordinated Notes 106,090 Other N/A N/A N/A
Senior Secured Notes 9,283,534 Third Party Pricing(2) N/A N/A N/A
Senior Secured and Subordinated Notes 2,031,292
Discounted Cash Flow Discount Rate 1.6% - 1.8% 1.7%
Default Rate 2.0% 2.0%
Recovery Rate 15.0% - 75.0% 69.0%
Contingent Obligation 13,274 Other N/A N/A N/A
Total Liabilities of Consolidated VIEs 12,343,021 Contingent Consideration Obligation 96,126 Discounted Cash Flow Discount Rate 11.0% - 18.5% 15.7%
Total Financial Liabilities $ 12,439,147
(1) The net asset value of the underlying securities held by AAA Investments represents its sole investment in Athene, offset by other net liabilities. The investment in Athene wasvalued at $2,244.2 million as of December 31, 2014 using the embedded value method based on the present value of the future expected regulatory distributable incomegenerated by the net assets of Athene plus the excess capital (i.e., the capital in excess of what is required to be held against Athene’s liabilities). The unobservable inputs andrespective ranges used are the same as noted for the Investment in Athene Holding and the AAA/Athene Receivable in the table above. See note 15 for discussion of theinvestment in Athene Holding.
(2) These securities are valued primarily using unadjusted broker quotes.(3) Balance includes investments in an affiliated fund, which primarily invests in corporate loans, bonds, and CLO notes. Balance at December 31, 2014 includes investments in
an affiliated fund in the amount of $865.9 million, which were valued based on NAV.
Investment in Athene Holding and AAA/Athene Receivable
The Company elected the fair value option for its investment in Athene Holding at the time of settlement of the derivative contract betweenAthene and Apollo (the “Athene Services Derivative”) and the derivative contract between AAA Investments and Apollo (the “AAA Services Derivative”).The Company has classified this investment as a Level III asset in the fair value hierarchy, as the pricing inputs into the determination of fair value requiresignificant judgment and estimation. The investment is valued based on the price of a common share of Athene Holding. During the third quarter of 2015, theCompany changed the valuation method used to value its investment in Athene Holding from the embedded value approach to the GAAP book valuemultiple approach. This change was driven by developments in Athene’s business as noted below.
- 166-

Table of ContentsAPOLLO GLOBAL MANAGEMENT, LLC
NOTES TO CONSOLIDATEDFINANCIAL STATEMENTS
(dollars in thousands, except share data, except where noted)
Athene’s business was principally built through a series of acquisitions of individual portfolios of fixed index annuities since its inception in2009. As of and prior to June 30, 2015, in valuing Apollo’s investment in Athene Holding, the embedded value method was employed to determine the fairvalue of shares in Athene Holding in periods where there was not an observable market value. The embedded value methodology is widely used by marketparticipants in the insurance industry in private company acquisitions of individual portfolios of annuities. The embedded value method estimates thepresent value of the future expected regulatory distributable income generated by the net assets plus the excess capital (i.e., the capital in excess of what isrequired to be held against liabilities) in determining fair value. Thus the embedded value method, as historically applied to the Athene valuation, was usedto derive a value of Athene’s existing block of business as well as the value of undeployed capital equivalent to the excess capital held. As of June 30, 2015and prior, Apollo also calculated an implied U.S. GAAP book value multiple for Athene, based on a projected U.S. GAAP book value, and compared thatmultiple to Athene’s publicly traded insurance peers as a secondary valuation point to assess the reasonableness of the valuation derived under the embeddedvalue method.
As of December 31, 2015, the fair value of Apollo’s investment in Athene Holding was estimated under the U.S. GAAP book value multipleapproach by applying a book value multiple to the U.S. GAAP book value per share of Athene Holding. The conversion price for all Athene managementincentive shares granted was added to Athene’s U.S. GAAP book value excluding accumulated other comprehensive income (“AOCI”) for purposes ofdetermining U.S. GAAP book value per share. Apollo calculated a multiple for public company peers of Athene by dividing each peer’s market capitalizationby its reported U.S. GAAP equity, excluding AOCI. A regression analysis was then prepared based on the calculated multiple of each peer relative to itsexpected return on U.S. GAAP equity, excluding AOCI, relative to Athene. From this analysis, a comparable book value multiple for Athene was derived andthen appropriately discounted to factor in the projected time frame of an initial public offering (“IPO”) of Athene and subsequent liquidity of shares (takinginto consideration any post-IPO lock-up restrictions on the shares). As a result of the above analysis, Apollo concluded it was appropriate to apply a multipleof 1.18 to Athene’s U.S. GAAP book value per share, in estimating the value per share of Athene Holding at December 31, 2015.
The unrealized gain recorded during the year ended December 31, 2015 was driven by activity as Athene continued to evolve its business modeland position itself for becoming a public company, including achieving “A-“ ratings from all of Athene’s three ratings agencies, hiring a new President andCFO, investing in a broad-based marketing campaign for its retail product offering, launching a Funding Agreement Backed Note ("FABN") program, anddiversifying into new businesses via the closing of the acquisition of Athene Germany. Further, during the year ended December 31, 2015, Athene publishedits 2014 audited U.S. GAAP financial statements and issued its unaudited U.S. GAAP financial statements for the nine months ended September 30, 2015(which facilitated the ability to use a book value multiple as a primary methodology). All of these activities are drivers of incremental value that occurredduring 2015. The embedded valuation methodology is well suited for valuing individual insurance portfolios, however, management believes the bookvalue multiple methodology best reflects the fair value of Athene going forward given the evolution of Athene’s business in 2015. The U.S. GAAP bookvalue multiple also serves as a common industry benchmark for Athene’s public insurance company peers. In addition, as a secondary valuationconsideration, the Company performed analysis under other methodologies including price to earnings multiple and embedded value approaches whichsupported the reasonableness of the fair market value estimate by the book value multiple method.
As of December 31, 2015, the significant unobservable input used in the fair value measurement of the investment in Athene Holding was theU.S. GAAP book value multiple. This input in isolation can cause significant increases or decreases in fair value. Specifically, when the U.S. GAAP bookvalue multiple method is used to determine fair value, the significant input used in the valuation model is the U.S. GAAP book value multiple itself. Anincrease in the U.S. GAAP book value multiple can significantly increase the fair value of an investment; conversely a decrease in the U.S. GAAP book valuemultiple can significantly decrease the fair value of an investment. The sensitivity of the valuation to changes in the multiple is directly proportional to thechange in the multiple itself.
As of December 31, 2014, Athene’s fair value was determined using the embedded value method which was based on the present value of thefuture expected regulatory distributable income generated by the net assets of Athene plus the excess capital (i.e., the capital in excess of what is required tobe held against Athene’s liabilities). The net assets of Athene consist of the current and projected assets less the current and projected liabilities related to inforce insurance contracts. For purposes of the excess capital calculation the assets are valued at fair value using the Company’s valuation methodology. Theapproach of using actuarially projected asset and liability income to value an insurance company is widely used by market participants in the insuranceindustry, particularly in private company acquisitions. The embedded value of the in force insurance contracts incorporates actuarial projections of expectedincome utilizing most recently available policyholder contract and experience data, industry information and assumptions, general economic and marketconditions, and other factors deemed relevant, including the cost of capital. In addition, consideration is also given to comparable company multiples in thedetermination of fair value.
- 167-

Table of ContentsAPOLLO GLOBAL MANAGEMENT, LLC
NOTES TO CONSOLIDATEDFINANCIAL STATEMENTS
(dollars in thousands, except share data, except where noted)
As of December 31, 2014, the significant unobservable input used in the fair value measurement of the investment in Athene Holding was thediscount rate applied in the valuation model. This input in isolation can cause significant increases or decreases in fair value. Specifically, when a discountedcash flow model is used to determine fair value, the significant input used in the valuation model is the discount rate applied to present value the projectedcash flows. An increase in the discount rate can significantly lower the fair value of an investment; conversely a decrease in the discount rate cansignificantly increase the fair value of an investment. The discount rate is determined based on the expected required rate of return based on the risk profile ofsimilar cash flows.
Apollo Senior Loan Fund
The Company is the sole investor in the Apollo Senior Loan Fund and therefore consolidates the assets and liabilities of the fund. The fundinvests in U.S. denominated senior secured loans, senior secured bonds and other income generating fixed-income investments.
Consolidated VIEs
Investments
The significant unobservable inputs used in the fair value measurement of the bank debt term loans and equity securities include the discountrate applied and the multiples applied in the valuation models. These unobservable inputs in isolation can cause significant increases or decreases in fairvalue. Specifically, when a discounted cash flow model is used to determine fair value, the significant input used in the valuation model is the discount rateapplied to present value the projected cash flows. Increases in the discount rate can significantly lower the fair value of an investment; conversely decreasesin the discount rate can significantly increase the fair value of an investment. The discount rate is determined based on the market rates an investor wouldexpect for a similar investment with similar risks. When a comparable multiple model is used to determine fair value, the comparable multiples are generallymultiplied by the underlying companies’ earnings before interest, taxes, depreciation and amortization (“EBITDA”) to establish the total enterprise value ofthe company. The comparable multiple is determined based on the implied trading multiple of public industry peers.
Liabilities
As of December 31, 2015, due to the adoption of new accounting guidance (see note 2), the debt obligations of the consolidated CLOs weremeasured on the basis of the fair value of the financial assets of the CLOs as the financial assets were determined to be more observable and, as a result,categorized as Level II in the fair value hierarchy. As of December 31, 2014, the significant unobservable inputs used in the fair value measurement of thesubordinated and senior secured notes include the discount rate applied in the valuation models, default and recovery rates applied in the valuation models.These inputs in isolation can cause significant increases or decreases in fair value. Specifically, when a discounted cash flow model is used to determine fairvalue, the significant input used in the valuation model is the discount rate applied to present value the projected cash flows. Increases in the discount ratecan significantly lower the fair value of subordinated and senior secured notes; conversely a decrease in the discount rate can significantly increase the fairvalue of subordinated and senior secured notes. The discount rate is determined based on the market rates an investor would expect for similar subordinatedand senior secured notes with similar risks.
Contingent Consideration Obligations
The significant unobservable input used in the fair value measurement of the contingent consideration obligations is the discount rate applied inthe valuation models. This input in isolation can cause significant increases or decreases in fair value. Specifically, when a discounted cash flow model isused to determine fair value, the significant input used in the valuation model is the discount rate applied to present value the projected cash flows. Increasesin the discount rate can significantly lower the fair value of the contingent consideration obligations; conversely a decrease in the discount rate cansignificantly increase the fair value of the contingent consideration obligations. The discount rate was based on the weighted average cost of capital for theCompany. See note 16 for further discussion of the contingent consideration obligations.
- 168-
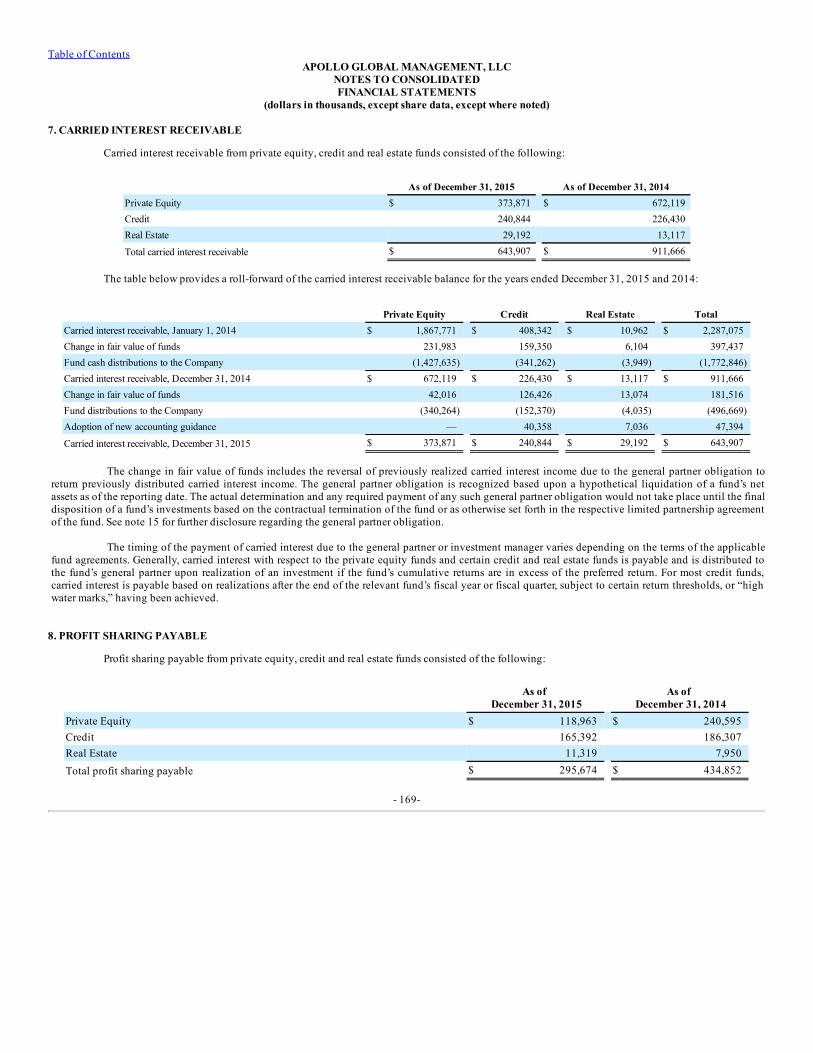
Table of ContentsAPOLLO GLOBAL MANAGEMENT, LLC
NOTES TO CONSOLIDATEDFINANCIAL STATEMENTS
(dollars in thousands, except share data, except where noted)
7. CARRIED INTEREST RECEIVABLE
Carried interest receivable from private equity, credit and real estate funds consisted of the following:
As of December 31, 2015 As of December 31, 2014Private Equity $ 373,871 $ 672,119Credit 240,844 226,430Real Estate 29,192 13,117
Total carried interest receivable $ 643,907 $ 911,666
The table below provides a roll-forward of the carried interest receivable balance for the years ended December 31, 2015 and 2014:
Private Equity Credit Real Estate TotalCarried interest receivable, January 1, 2014 $ 1,867,771 $ 408,342 $ 10,962 $ 2,287,075Change in fair value of funds 231,983 159,350 6,104 397,437Fund cash distributions to the Company (1,427,635) (341,262) (3,949) (1,772,846)Carried interest receivable, December 31, 2014 $ 672,119 $ 226,430 $ 13,117 $ 911,666Change in fair value of funds 42,016 126,426 13,074 181,516Fund distributions to the Company (340,264) (152,370) (4,035) (496,669)Adoption of new accounting guidance — 40,358 7,036 47,394
Carried interest receivable, December 31, 2015 $ 373,871 $ 240,844 $ 29,192 $ 643,907
The change in fair value of funds includes the reversal of previously realized carried interest income due to the general partner obligation toreturn previously distributed carried interest income. The general partner obligation is recognized based upon a hypothetical liquidation of a fund’s netassets as of the reporting date. The actual determination and any required payment of any such general partner obligation would not take place until the finaldisposition of a fund’s investments based on the contractual termination of the fund or as otherwise set forth in the respective limited partnership agreementof the fund. See note 15 for further disclosure regarding the general partner obligation.
The timing of the payment of carried interest due to the general partner or investment manager varies depending on the terms of the applicablefund agreements. Generally, carried interest with respect to the private equity funds and certain credit and real estate funds is payable and is distributed tothe fund’s general partner upon realization of an investment if the fund’s cumulative returns are in excess of the preferred return. For most credit funds,carried interest is payable based on realizations after the end of the relevant fund’s fiscal year or fiscal quarter, subject to certain return thresholds, or “highwater marks,” having been achieved.
8. PROFIT SHARING PAYABLE
Profit sharing payable from private equity, credit and real estate funds consisted of the following:
As of
December 31, 2015 As of
December 31, 2014Private Equity $ 118,963 $ 240,595Credit 165,392 186,307Real Estate 11,319 7,950Total profit sharing payable $ 295,674 $ 434,852
- 169-

Table of ContentsAPOLLO GLOBAL MANAGEMENT, LLC
NOTES TO CONSOLIDATEDFINANCIAL STATEMENTS
(dollars in thousands, except share data, except where noted)
The table below provides a roll-forward of the profit sharing payable balance for the years ended December 31, 2015 and 2014:
Private Equity Credit Real Estate TotalProfit sharing payable, January 1, 2014 $ 751,192 $ 234,504 $ 6,544 $ 992,240Profit sharing expense(1) 178,373 95,070 2,747 276,190Payments/other (688,970) (143,267) (1,341) (833,578)Profit sharing payable, December 31, 2014 $ 240,595 $ 186,307 $ 7,950 $ 434,852Profit sharing expense(1)(2) 52,807 42,172 5,076 100,055Payments/other (174,439) (63,087) (1,707) (239,233)Profit sharing payable, December 31, 2015 $ 118,963 $ 165,392 $ 11,319 $ 295,674
(1) Includes (i) changes in amounts payable to employees and former employees entitled to a share of carried interest income in Apollo’s funds and (ii) changes to the fairvalue of the contingent consideration obligations recognized in connection with certain Apollo acquisitions. See notes 6 and 16 for further disclosure regarding thecontingent consideration obligations.
(2) The Company has recorded a receivable from the Contributing Partners and certain employees and former employees for the potential return of profit sharingdistributions that would be due if certain funds were liquidated as of December 31, 2015. See note 15 for further disclosure.
9. OTHER ASSETS
Other assets consisted of the following:
As of December 31,
2015 2014Fixed assets $ 105,439 $ 104,617Less: Accumulated depreciation and amortization (73,803) (68,711)
Fixed assets, net 31,636 35,906Prepaid expenses 48,421 32,873Tax receivables 4,466 23,286Interest Receivable 105 11,059Other 11,216 11,117
Total Other Assets $ 95,844 $ 114,241
Depreciation expense for the years ended December 31, 2015, 2014 and 2013 was $10.5 million, $10.2 million and $11.0 million, respectively.
- 170-

Table of ContentsAPOLLO GLOBAL MANAGEMENT, LLC
NOTES TO CONSOLIDATEDFINANCIAL STATEMENTS
(dollars in thousands, except share data, except where noted)
10. OTHER INCOME, NET
Other income, net consisted of the following:
For the Year Ended December 31,
2015 2014 2013Tax receivable agreement adjustment $ — $ 32,182 $ 13,038Gain on derivatives — 14,039 10,203Gain (Loss) on extinguishment of liability/debt — 13,395 (2,741)Rental income 4,349 5,566 5,334Foreign exchange gain (loss) 1,719 (7,131) 4,142Loss on assets held for sale — — (1,087)Other 1,605 2,541 11,225
Total Other Income, Net $ 7,673 $ 60,592 $ 40,114
11. INCOME TAXES
The Company is treated as a partnership for income tax purposes and is therefore not subject to U.S. federal, state and local income taxes. APOCorp., a wholly-owned subsidiary of the Company, is subject to U.S. federal, state and local corporate income taxes. Certain other subsidiaries of theCompany are subject to NYC UBT attributable to the Company’s operations apportioned to New York City. In addition, certain non-U.S. subsidiaries of theCompany are subject to income taxes in their local jurisdictions.
The Company’s provision for income taxes totaled $26.7 million, $147.2 million and $107.6 million for the years ended December 31, 2015,2014 and 2013, respectively. The Company’s effective tax rate was approximately 7.1%, 16.8% and 4.3% for the years ended December 31, 2015, 2014 and2013, respectively.
The provision for income taxes is presented in the following table:
For the Year Ended December 31, 2015 2014 2013Current:
Federal income tax $ (10,108) $ 53,426 $ 30,422Foreign income tax 7,842 (1) 6,080 4,733State and local income tax 2,573 7,369 9,728
Subtotal 307 66,875 44,883Deferred:
Federal income tax 19,581 28,702 40,955Foreign income tax (256) (1) (137) 130State and local income tax 7,101 51,805 21,601
Subtotal 26,426 80,370 62,686Total Income Tax Provision $ 26,733 $ 147,245 $ 107,569
(1) The foreign income tax provision was calculated on $27.6 million of pre-tax income generated in foreign jurisdictions.
- 171-

Table of ContentsAPOLLO GLOBAL MANAGEMENT, LLC
NOTES TO CONSOLIDATEDFINANCIAL STATEMENTS
(dollars in thousands, except share data, except where noted)
The following table reconciles the provision for taxes to the U.S. Federal statutory tax rate:
For the Year Ended December 31, 2015 2014 2013
U.S. Statutory Tax Rate 35.0 % 35.0 % 35.0 %Income Passed Through to Non-Controlling Interests (26.4) (23.4) (24.1)Income Passed Through to Class A Shareholders (4.4) 0.1 (7.9)Equity Based Compensation - AOG Units — — 0.2Foreign Income Tax 1.1 0.4 0.1State and Local Income Taxes (net of Federal Benefit) 2.1 4.7 1.1Amortization & Other Accrual Adjustments (0.3) — (0.1)
Effective Income Tax Rate 7.1 % 16.8 % 4.3 %
Deferred income taxes are provided for the effects of temporary differences between the tax basis of an asset or liability and its reported amount inthe consolidated statements of financial condition. These temporary differences result in taxable or deductible amounts in future years.
The Company’s deferred tax assets and liabilities on the consolidated statements of financial condition consist of the following:
As of December 31, 2015 2014Deferred Tax Assets:
Depreciation and amortization $ 567,018 $ 543,288Revenue recognition 31,363 40,250Net operating loss carryforwards 47,139 —Equity-based compensation - RSUs and AAA RDUs 4,551 35,678Foreign tax credit 8,996 3,457Other 5,472 1,437
Total Deferred Tax Assets 664,539 624,110Deferred Tax Liabilities:
Unrealized gains from investments 13,274 13,053Other 5,058 4,340
Total Deferred Tax Liabilities $ 18,332 $ 17,393
As of December 31, 2015, the Company had approximately $121.3 million of federal net operating loss (“NOL”) carryforwards and $94.8 millionof state and local net operating loss carryforwards that will begin to expire in 2036. As a result of certain realization requirements of ASC 718, the table ofdeferred tax assets and liabilities does not include certain deferred tax assets as of December 31, 2015 that arose directly from tax deductions related toequity-based compensation greater than compensation recognized for financial reporting. Equity will be increased by $22.3 million if and when such excesstax benefits are ultimately realized. The Company uses tax law ordering when determining when excess tax benefits have been realized. In addition, theCompany’s foreign tax credit carryforwards will begin to expire in 2021.
The Company considered its historical and current year earnings, current utilization of existing deferred tax assets and deferred tax liabilities, the15 year amortization periods of the tax basis of its intangible assets and short and long term business forecasts in evaluating whether it should establish avaluation allowance. Based on this positive evidence, the Company concluded it is more likely than not that the deferred tax assets will be realized and thatno valuation allowance was needed at December 31, 2015.
- 172-

Table of ContentsAPOLLO GLOBAL MANAGEMENT, LLC
NOTES TO CONSOLIDATEDFINANCIAL STATEMENTS
(dollars in thousands, except share data, except where noted)
Under U.S. GAAP, a tax benefit from an uncertain tax position may be recognized when it is more likely than not that the position will besustained upon examination, including resolutions of any related appeals or litigation processes, based on the technical merits of the position. Based uponthe Company’s review of its federal, state, local and foreign income tax returns and tax filing positions, the Company determined that no unrecognized taxbenefits for uncertain tax positions were required to be recorded. In addition, the Company does not believe that it has any tax positions for which it isreasonably possible that it will be required to record significant amounts of unrecognized tax benefits within the next twelve months.
The Company’s primary jurisdictions in which it operates are the United States, New York State, New York City, California and the UnitedKingdom. In the normal course of business, the Company is subject to examination by federal and certain state, local and foreign tax authorities. With a fewexceptions, as of December 31, 2015, the Company’s U.S. federal, state, local and foreign income tax returns for the years 2012 through 2015 are open underthe general statute of limitations provisions and therefore subject to examination. Currently, the Internal Revenue Service is examining the tax return of asubsidiary for the 2012 tax year. The State and City of New York are examining certain subsidiaries’ tax returns for tax years 2011 and 2013, and the City ofLos Angeles is examining certain subsidiaries’ tax returns for the years 2011 to 2013. Additionally, the Company completed the Internal Revenue Serviceexamination of the tax return for 2011 for Apollo Global Management, LLC with no change.
The Company has recorded a deferred tax asset for the future amortization of tax basis intangibles as a result of the 2007 Reorganization. TheCompany recorded additional deferred tax assets as a result of the step-up in tax basis of intangibles from subsequent exchanges of AOG Units for Class Ashares. A related tax receivable agreement liability was recorded in due to affiliates in the consolidated statements of financial condition for the expectedpayments under the tax receivable agreement entered into by and among APO Corp., the Managing Partners, the Contributing Partners, and other partiesthereto (as amended, the “tax receivable agreement”) (see note 15). The increases in the deferred tax asset less the related liability resulted in increases toadditional paid-in capital which were recorded in the consolidated statements of changes in shareholders’ equity for the years ended December 31, 2015 and2014. The amortization period for these tax basis intangibles is 15 years and the deferred tax assets will reverse over the same period.
The tables below present the transactions related to the exchange of AOG Units for Class A shares during the years ended December 31, 2015 ,2014 and 2013 and the resulting impact to the deferred tax asset, tax receivable agreement liability and additional paid-in capital.
Exchange of AOG Unitsfor Class A shares
Increase in DeferredTax Asset
Increase in TaxReceivable
Agreement Liability Increase to Additional
Paid In CapitalFor the Year Ended December 31, 2015 $ 61,720 $ 45,432 $ 16,288For the Year Ended December 31, 2014 58,696 47,878 10,818For the Year Ended December 31, 2013 149,327 126,928 22,399
During the years ended December 31, 2014 and 2013, the Company adjusted the estimated rate of tax it expects to pay in the future and therebyreduced its net deferred tax assets, and increased its income tax provision, by $36.2 million and $16.9 million, respectively (see note 15 for details regardingthe impact on the tax receivable agreement liability).
- 173-

Table of ContentsAPOLLO GLOBAL MANAGEMENT, LLC
NOTES TO CONSOLIDATEDFINANCIAL STATEMENTS
(dollars in thousands, except share data, except where noted)
12. DEBT
Debt consisted of the following:
As of December 31, 2015 As of December 31, 2014
Outstanding
Balance
AnnualizedWeightedAverage
Interest Rate Outstanding
Balance
AnnualizedWeightedAverage
Interest Rate 2013 AMH Credit Facilities - Term Facility(1) $ 499,327 1.44% $ 499,107 1.36% 2024 Senior Notes(2) 494,555 4.00 493,902 4.00 2014 AMI Term Facility I(3) 14,543 2.15 16,204 2.34 2014 AMI Term Facility II(4) 16,830 1.85 18,752 1.93 Total Debt $ 1,025,255 $ 1,027,965
(1) Outstanding balance is presented net of unamortized debt issuance costs of $0.7 million and $0.9 million as of December 31, 2015 and 2014, respectively.(2) Includes impact of any amortization of note discount. Outstanding balance is presented net of unamortized debt issuance costs of $4.6 million and $5.2 million as of
December 31, 2015 and 2014, respectively.(3) On July 3, 2014, Apollo Management International LLP (“AMI”), a subsidiary of the Company, entered into a €13.4 million five year credit agreement (the “2014 AMI
Term Facility I”). Proceeds from the borrowing were used to fund the Company’s investment in a European CLO it manages.(4) On December 9, 2014, AMI entered into a €15.5 million five year credit agreement (the “2014 AMI Term Facility II”). Proceeds from the borrowing were used to fund
the Company’s investment in a European CLO it manages.
2007 AMH Credit Agreement—On April 20, 2007, Apollo Management Holdings, L.P. (“AMH”), a subsidiary of the Company which is aDelaware limited partnership, entered into a $1.0 billion seven year credit agreement (the “2007 AMH Credit Agreement”). Interest payable under the 2007AMH Credit Agreement was based on Eurodollar LIBOR or Alternate Base Rate ("ABR") as determined by the borrower. On December 20, 2010, Apolloamended the 2007 AMH Credit Agreement to extend the maturity date of $995.0 million (including the $90.9 million of fair value debt repurchased by theCompany) of the term loan from April 20, 2014 to January 3, 2017 and modified certain other terms of the 2007 AMH Credit Agreement. On December 20,2010, an affiliate of AMH that was a guarantor under the 2007 AMH Credit Agreement repurchased approximately $180.8 million of the term loan inconnection with the extension of the maturity date of such loan and thus the 2007 AMH Credit Agreement (excluding the portions held by AMH affiliates)had a remaining balance of $728.3 million. Interest expense incurred by the Company related to the 2007 AMH Credit Agreement was $28.3 million for theyear ended December 31, 2013. Amortization expense related to the 2007 AMH Credit Agreement was $0.7 million for the year ended December 31, 2013.
The outstanding loans under the 2007 AMH Credit Agreement were refinanced on December 18, 2013 with the net proceeds from the 2013 AMHCredit Facilities (as defined below). Additionally, the net proceeds were used to pay fees and expenses associated with the 2013 AMH Credit Facilities. The2007 AMH Credit Agreement and all related loan documents and security with respect thereto were terminated in connection with the refinancing.
2013 AMH Credit Facilities—On December 18, 2013, AMH and its subsidiaries and certain other subsidiaries of the Company (collectively, the“Borrowers”) entered into new credit facilities (the “2013 AMH Credit Facilities”) with JPMorgan Chase Bank, N.A. The 2013 AMH Credit Facilities providefor (i) a term loan facility to AMH (the “Term Facility”) that includes $750 million of the term loan from third-party lenders and $271.7 million of the termloan held by a subsidiary of the Company and (ii) a $500 million revolving credit facility (the “Revolver Facility”), in each case, with a final maturity date ofJanuary 18, 2019.
Interest on the borrowings is based on an adjusted LIBOR rate or alternate base rate, in each case plus an applicable margin, and undrawnrevolving commitments bear a commitment fee. Under the terms of the 2013 AMH Credit Facilities, the applicable margin ranges from 1.125% to 1.75% forLIBOR loans and 0.125% to 0.75% for alternate base rate loans, and the undrawn revolving commitment fee ranges from 0.125% to 0.25%, in each casedepending on the Company’s corporate rating assigned by Standard & Poor’s Ratings Group, Inc. The 2013 AMH Credit Facilities do not require anyscheduled amortization payments or other mandatory prepayments (except with respect to overadvances on the Revolver Facility) prior to the final maturitydate, and the Borrowers may prepay the loans and/or terminate or reduce the revolving commitments under the 2013 AMH Credit Facilities at any timewithout penalty. In connection with the issuance of the 2024 Senior Notes (as defined below), $250 million
- 174-

Table of ContentsAPOLLO GLOBAL MANAGEMENT, LLC
NOTES TO CONSOLIDATEDFINANCIAL STATEMENTS
(dollars in thousands, except share data, except where noted)
of the proceeds were used to repay a portion of the Term Facility outstanding with third party lenders at par. The interest rate on the $500 million TermFacility as of December 31, 2015 was 1.65% and the commitment fee as of December 31, 2015 on the $500 million undrawn Revolver Facility was 0.125%.Interest expense incurred by the Company related to the 2013 AMH Credit Facilities was $7.8 million, $9.0 million and $0.4 million for the years endedDecember 31, 2015, 2014 and 2013, respectively. Debt issuance cost amortization expense related to the 2013 AMH Credit Facilities was $0.8 million and$1.0 million for the years ended December 31, 2015 and 2014, respectively.
The estimated fair value of the Company’s long-term debt obligation related to the 2013 AMH Credit Facilities is approximately $501.3 millionbased on obtained broker quotes as of December 31, 2015. The $500.0 million carrying value of debt that is recorded on the consolidated statements offinancial condition at December 31, 2015 is the amount for which the Company expects to settle the 2013 AMH Credit Facilities. The Company hasdetermined that the long-term debt obligation related to the 2013 AMH Credit Facilities would be categorized as a Level III liability in the fair valuehierarchy based on the number and quality of broker quotes obtained, the standard deviations of the observed broker quotes and the percentage deviationfrom independent pricing services.
As of December 31, 2015, the 2013 AMH Credit Facilities were guaranteed and collateralized by AMH and its subsidiaries, Apollo Management,L.P., Apollo Capital Management, L.P., Apollo International Management, L.P., AAA Holdings, L.P., Apollo Principal Holdings I, L.P., Apollo PrincipalHoldings II, L.P., Apollo Principal Holdings III, L.P., Apollo Principal Holdings IV, L.P., Apollo Principal Holdings V, L.P., Apollo Principal Holdings VI,L.P., Apollo Principal Holdings VII, L.P., Apollo Principal Holdings VIII, L.P., Apollo Principal Holdings IX, L.P., Apollo Principal Holdings X, L.P., STHoldings GP, LLC and ST Management Holdings, LLC. The 2013 AMH Credit Facilities contain affirmative and negative covenants which limit the abilityof the Borrowers, the guarantors and certain of their subsidiaries to, among other things, incur indebtedness and create liens. Additionally, the 2013 AMHCredit Facilities contain financial covenants which require the Borrowers and their subsidiaries to maintain (1) at least $40 billion of Fee-Generating AssetsUnder Management and (2) a maximum total net leverage ratio of not more than 4.00 to 1.00 (subject to customary equity cure rights). The 2013 AMH CreditFacilities also contain customary events of default, including events of default arising from non-payment, material misrepresentations, breaches of covenants,cross default to material indebtedness, bankruptcy and changes in control of the Company.
Borrowings under the Revolver Facility may be used for working capital and general corporate purposes, including, without limitation, permittedacquisitions. In addition, the Borrowers may incur incremental facilities in respect of the Revolver Facility and the Term Facility in an aggregate amount notto exceed $500 million plus additional amounts so long as the Borrowers are in compliance with a net leverage ratio not to exceed 3.75 to 1.00. As ofDecember 31, 2015 and 2014, the Revolver Facility was undrawn.
2024 Senior Notes—On May 30, 2014, AMH issued $500 million in aggregate principal amount of its 4.000% Senior Notes due 2024 (the “2024Senior Notes”), at an issue price of 99.722% of par. Interest on the 2024 Senior Notes is payable semi-annually in arrears on May 30 and November 30 of eachyear. The 2024 Senior Notes will mature on May 30, 2024. The discount will be amortized into interest expense on the consolidated statements of operationsover the term of the 2024 Senior Notes. Interest expense incurred by the Company related to the 2024 Senior Notes was $20.0 million and $11.7 million forthe years ended December 31, 2015 and 2014, respectively.
Prior to the adoption of the updated debt issuance cost guidance as described in note 2, the Company capitalized debt issuance costs of $5.5million incurred in connection with the issuance of the 2024 Senior Notes, which was recorded in other assets in the consolidated statements of financialcondition as of December 31, 2015, to be amortized over the term of the notes. As a result of the Company’s adoption of the new accounting guidance, theCompany has retrospectively adjusted the debt issuance costs that were initially capitalized and reported in other assets to debt as a direct deduction of thecarrying amount of the related debt arrangement. The debt issuance costs will continue to be amortized as an increase to interest expense over the term of thedebt arrangement. As such, the debt issuance cost amortization expense related to the issuance of the 2024 Senior Notes was $0.6 million and $0.3 million forthe years ended December 31, 2015 and 2014, respectively.
As of December 31, 2015, the 2024 Senior Notes were guaranteed by Apollo Principal Holdings I, L.P., Apollo Principal Holdings II, L.P., ApolloPrincipal Holdings III, L.P., Apollo Principal Holdings IV, L.P., Apollo Principal Holdings V, L.P., Apollo Principal Holdings VI, L.P., Apollo PrincipalHoldings VII, L.P., Apollo Principal Holdings VIII, L.P., Apollo Principal Holdings IX, L.P., Apollo Principal Holdings X, L.P., AMH Holdings (Cayman), L.P.and any other entity that is required to become a guarantor of the notes under the terms of the indenture governing the 2024 Senior Notes (the “2024 SeniorNotes Indenture”). The 2024 Senior Notes Indenture includes covenants that restrict the ability of AMH and, as applicable, the guarantors to incur
- 175-

Table of ContentsAPOLLO GLOBAL MANAGEMENT, LLC
NOTES TO CONSOLIDATEDFINANCIAL STATEMENTS
(dollars in thousands, except share data, except where noted)
indebtedness secured by liens on voting stock or profit participating equity interests of their respective subsidiaries or merge, consolidate or sell, transfer orlease assets. The 2024 Senior Notes Indenture also provides for customary events of default.
The estimated fair value of the Company’s long-term debt obligation related to the 2024 Senior Notes is approximately $495.3 million based onobtained broker quotes as of December 31, 2015. The face amount of $500.0 million related to the 2024 Senior Notes is the amount for which the Company isobligated to settle the 2024 Senior Notes. The Company has determined that the long-term debt obligation related to the 2024 Senior Notes would becategorized as a Level II liability in the fair value hierarchy based on the number and quality of broker quotes obtained, the standard deviations of theobserved broker quotes and the percentage deviation from independent pricing services.
As of December 31, 2015, the table below presents the contractual maturities for the Company's debt arrangements:
2016 2017 2018 2019 2020 Thereafter Total2013 AMH Credit Facilities - Term Facility $ — $ — $ — $ 500,000 $ — $ — $ 500,0002024 Senior Notes — — — — — 500,000 $ 500,0002014 AMI Term Facility I — — — 14,543 — — $ 14,5432014 AMI Term Facility II — — — 16,830 — — $ 16,830
Total Obligations as of December 31, 2015 $ — $ — $ — $ 531,373 $ — $ 500,000 $ 1,031,373
13. NET INCOME (LOSS) PER CLASS A SHARE
The table below presents basic and diluted net income per Class A share using the two-class method for the years ended December 31, 2015,2014 and 2013:
Basic and Diluted
For the Year Ended December 31, 2015 2014 2013 Numerator: Net income attributable to Apollo Global Management, LLC $ 134,497 $ 168,229 $ 659,391 Distributions declared on Class A shares (339,397) (1) (483,458) (1) (556,954) (1)
Distributions on participating securities(4) (28,497) (72,074) (93,235) Earnings allocable to participating securities — (2) — (2) (1,394) Undistributed income (loss) attributable to Class A shareholders: Basic and Diluted (233,397) (387,303) 7,808 Dilution effect on undistributed income attributable to Class A shareholders — — 9,106 Dilution effect on distributable income attributable to participating securities — — (1,329) Undistributed income (loss) attributable to Class A shareholders: Diluted $ (233,397) $ (387,303) $ 15,585 Denominator: Weighted average number of Class A shares outstanding: Basic 173,271,666 155,349,017 139,173,386 Dilution effect of share options and unvested RSUs — — 3,040,964 Weighted average number of Class A shares outstanding: Diluted 173,271,666 155,349,017 142,214,350 Net Income per Class A share: Basic Distributed Income $ 1.96 $ 3.11 $ 4.00 Undistributed Income (Loss) (1.35) (2.49) 0.06 Net Income per Class A Share: Basic $ 0.61 $ 0.62 $ 4.06 Net Income per Class A share: Diluted(3) Distributed Income $ 1.96 $ 3.11 $ 3.92 Undistributed Income (Loss) (1.35) (2.49) 0.11 Net Income per Class A Share: Diluted $ 0.61 $ 0.62 $ 4.03
- 176-

Table of ContentsAPOLLO GLOBAL MANAGEMENT, LLC
NOTES TO CONSOLIDATEDFINANCIAL STATEMENTS
(dollars in thousands, except share data, except where noted)
(1) See note 15 for information regarding the quarterly distributions declared and paid during 2015, 2014 and 2013.(2) No allocation of undistributed losses was made to the participating securities as the holders do not have a contractual obligation to share in the losses of the Company
with Class A shareholders.(3) For the years ended December 31, 2015 and 2014, the Company had an undistributed loss attributable to Class A shareholders and none of the classes of securities
resulted in dilution. For the years ended December 31, 2015 and 2014, all of the classes of securities were anti-dilutive. For the year ended December 31, 2013 shareoptions and unvested RSUs were determined to be dilutive, and were accordingly included in the diluted earnings per share calculation. For the year ended December31, 2013, the AOG Units and participating securities were determined to be anti-dilutive and were accordingly excluded from the diluted earnings per share calculation.
(4) Participating securities consist of vested and unvested RSUs that have rights to distributions and unvested restricted shares.
The Company has granted RSUs that provide the right to receive, subject to vesting, Class A shares of Apollo Global Management, LLC,pursuant to the Company’s 2007 Omnibus Equity Incentive Plan. Certain RSU grants to employees provide the right to receive distribution equivalents onvested RSUs on an equal basis any time a distribution is declared. The Company refers to these RSU grants as “Plan Grants.” For certain Plan Grants,distribution equivalents are paid in January of the calendar year next following the calendar year in which a distribution on Class A shares was declared. Inaddition, certain RSU grants to employees provide that both vested and unvested RSUs participate in distribution equivalents on an equal basis with theClass A shareholders any time a distribution is declared. The Company refers to these as “Bonus Grants.”
Any distribution equivalent paid to an employee will not be returned to the Company upon forfeiture of the award by the employee. Vested andunvested RSUs that are entitled to non-forfeitable distribution equivalents qualify as participating securities and are included in the Company’s basic anddiluted earnings per share computations using the two-class method. The holder of an RSU participating security would have a contractual obligation toshare in the losses of the entity if the holder is obligated to fund the losses of the issuing entity or if the contractual principal or mandatory redemptionamount of the participating security is reduced as a result of losses incurred by the issuing entity. Because the RSU participating securities do not have amandatory redemption amount and the holders of the participating securities are not obligated to fund losses, neither the vested RSUs nor the unvested RSUsare subject to any contractual obligation to share in losses of the Company.
Holders of AOG Units are subject to the vesting requirements and transfer restrictions set forth in the agreements with the respective holders, andmay a limited number of times each year, upon notice (subject to the terms of the Exchange Agreement), exchange their AOG Units for Class A shares on aone-for-one basis. A limited partner must exchange one partnership unit in each of the Apollo Operating Group partnerships to effectuate an exchange for oneClass A share.
Apollo Global Management, LLC has one Class B share outstanding, which is held by BRH Holdings GP, Ltd. (“BRH”). The voting power of theClass B share is reduced on a one vote per one AOG Unit basis in the event of an exchange of AOG Units for Class A shares, as discussed above. The Class Bshare has no net income (loss) per share as it does not participate in Apollo’s earnings (losses) or distributions. The Class B share has no distribution orliquidation rights. The Class B share has voting rights on a pari passu basis with the Class A shares. The Class B share represented 61.4%, 65.4% and 69.3%of the total voting power of the Company’s shares entitled to vote as of December 31, 2015, 2014 and 2013, respectively.
The following table summarizes the anti-dilutive securities for the years ended December 31, 2015, 2014 and 2013, respectively.
For the Year Ended December 31,
2015 2014 2013
Weighted average vested RSUs 9,984,862 19,541,458 20,664,694Weighted average unvested RSUs 4,858,935 9,556,131 —Weighted average unexercised options 227,086 548,441 —Weighted average AOG Units outstanding 219,575,738 225,005,386 234,132,052Weighted average unvested restricted shares 90,985 — —
- 177-

Table of ContentsAPOLLO GLOBAL MANAGEMENT, LLC
NOTES TO CONSOLIDATEDFINANCIAL STATEMENTS
(dollars in thousands, except share data, except where noted)
The table below presents transactions in Class A shares each quarter during the years ended December 31, 2015, 2014 and 2013, and the resultingimpact on the Company’s and Holdings’ ownership interests in the Apollo Operating Group:
Date
Type of Class AShares
Transaction
Number of Shares Issued inClass A Shares
Transaction(in thousands)
Apollo GlobalManagement, LLC
ownership%in ApolloOperating
Group beforeClass AShares
Transaction
Apollo GlobalManagement, LLC
ownership%in ApolloOperating
Group afterClass AShares
Transaction
Holdingsownership%
in ApolloOperating
Group beforeClass AShares
Transaction
Holdingsownership%
in ApolloOperating
Group afterClass AShares
TransactionQuarter Ended March 31,2013 Issuance 2,091 35.1% 35.5% 64.9% 64.5%Quarter Ended June 30, 2013 Issuance/Offering 9,577 (1) 35.5 38.0 64.5 62.0Quarter Ended September30, 2013 Issuance 1,977 38.0 38.3 62.0 61.7Quarter Ended December31, 2013 Issuance/Exchange 2,581 (1) 38.3 39.0 61.7 61.0Quarter Ended March 31,2014 Issuance 2,672 39.0 39.4 61.0 60.6Quarter Ended June 30, 2014 Issuance/Exchange 7,344 (1) 39.4 41.2 60.6 58.8Quarter Ended September30, 2014 Issuance 3,660 41.2 41.8 58.8 58.2Quarter EndedDecember 31, 2014 Issuance/Exchange 3,090 (1) 41.8 42.3 58.2 57.7Quarter EndedMarch 31, 2015 Issuance/Exchange 4,866 (1) 42.3 43.0 57.7 57.0Quarter Ended June 30, 2015 Issuance/Exchange 4,275 (1) 43.0 43.8 57.0 56.2Quarter Ended September30, 2015 Issuance/Exchange 6,819 (1) 43.8 45.3 56.2 54.7Quarter Ended December31, 2015 Issuance/Exchange 2,067 45.3 45.6 54.7 54.4
(1) In May 2013, November 2013, May 2014, October 2014, February 2015, May 2015, August 2015 and November 2015, certain holders of AOG Units exchanged their AOGUnits for Class A shares and approximately 8.8 million, 2.3 million, 6.2 million, 0.1 million, 0.2 million, 1.8 million, 4.4 million and 27.5 thousand Class A shares, respectively,were issued by the Company in the exchanges.
14. EQUITY-BASED COMPENSATION
AOG Units
The fair value of the AOG Units of approximately $5.6 billion was charged to compensation expense on a straight-line basis over the five or sixyear service period, as applicable. For the year ended December 31, 2013, compensation expense of $30.0 million was recognized. The AOG Units were fullyvested and amortized as of June 30, 2013.
- 178-

Table of ContentsAPOLLO GLOBAL MANAGEMENT, LLC
NOTES TO CONSOLIDATEDFINANCIAL STATEMENTS
(dollars in thousands, except share data, except where noted)
The following table summarizes the activity of the AOG Units for the year ended December 31, 2013:
AOG Units
Weighted AverageGrant DateFair Value
Balance at January 1, 2013 1,500,366 $ 20.00Vested (1,500,366) 20.00Balance at December 31, 2013 — $ —
RSUs
The Company grants RSUs under the Company’s 2007 Omnibus Equity Incentive Plan. These grants are accounted for as a grant of equityawards in accordance with U.S. GAAP. The fair value of all grants after March 29, 2011 is based on the grant date fair value, which considers the public shareprice of the Company. For Plan Grants, the grant date fair value is based on the grant date public share price of the Company’s Class A shares discountedprimarily for transfer restrictions and lack of distributions until vested. For Bonus Grants, the grant date fair value is based on the grant date public share priceof the Company’s Class A shares discounted primarily for transfer restrictions and in certain cases timing of distributions. The following table summarizes theweighted average discounts for Plan Grants and Bonus Grants for the years ended December 31, 2015, 2014 and 2013.
For the Year Ended December 31,
2015 2014 2013
Plan Grants: Discount for the lack of distributions until vested(1) 26.0% 32.5% 30.5%Marketability discount for transfer restrictions(2) 4.2% 5.1% 6.0%
Bonus Grants: Marketability discount for transfer restrictions(2) 2.2% 3.2% 3.2%
(1) Based on the present value of a growing annuity calculation.(2) Based on the Finnerty Model calculation.
The estimated total fair value is charged to compensation expense on a straight-line basis over the vesting period, which for Plan Grants isgenerally up to six years, with the first installment vesting one year after grant and quarterly vesting thereafter, and for Bonus Grants is annual vesting overthree years. The fair value of grants made during the years ended December 31, 2015, 2014 and 2013 was $70.6 million, $149.1 million, and $56.6 million,respectively. The actual forfeiture rate was 1.2%, 6.7% and 5.3% for the years ended December 31, 2015, 2014 and 2013, respectively. Compensationexpense recognized for the years ended December 31, 2015, 2014 and 2013 was $65.7 million, $80.7 million, and $87.7 million, respectively.
In addition, during 2014, the Company entered into an agreement with an executive officer providing for the grant of RSUs when certain metricshave been achieved. In accordance with U.S. GAAP, equity-based compensation expense is recognized only when certain metrics are met or deemedprobable. Accordingly, for the years ended December 31, 2015, and 2014, no equity-based compensation expense was recognized relating to these RSUs.
- 179-

Table of ContentsAPOLLO GLOBAL MANAGEMENT, LLC
NOTES TO CONSOLIDATEDFINANCIAL STATEMENTS
(dollars in thousands, except share data, except where noted)
The following table summarizes RSU activity for the years ended December 31, 2015, 2014 and 2013:
Unvested
Weighted AverageGrant Date Fair
Value Vested
Total Number of RSUs
Outstanding Balance at January 1, 2013 14,724,474 $ 11.62 22,512,930 37,237,404 (1) Granted 2,101,277 26.95 — 2,101,277 Forfeited (888,594) 13.30 — (888,594) Delivered — 12.30 (6,879,050) (6,879,050) Vested (7,159,871) 12.60 7,159,871 — Balance at December 31, 2013 8,777,286 14.32 22,793,751 31,571,037 (1) Granted 7,046,490 21.16 — 7,046,490 Forfeited(2) (1,055,639) 12.19 — (1,055,639) Delivered — 12.96 (9,490,011) (9,490,011) Vested(2) (4,050,502) 16.75 4,050,502 — Balance at December 31, 2014 10,717,635 18.11 17,354,242 28,071,877 (1) Granted 4,634,950 15.24 — 4,634,950 Forfeited (186,741) 20.70 — (186,741) Delivered — 13.16 (15,185,890) (15,185,890) Vested (4,125,701) 19.35 4,125,701 — Balance at December 31, 2015 11,040,143 $ 16.40 6,294,053 17,334,196 (1)
(1) Amount excludes RSUs which have vested and have been issued in the form of Class A shares.(2) In connection with the departure of an employee from the Company, such employee vested in 625,000 RSUs that were previously granted to him and forfeited 625,000
RSUs that were previously granted to him. As a result of the additional vesting, the Company recorded an incremental compensation expense of $17.5 million related tothe relevant RSU award for the year ended December 31, 2014.
Units Expected to Vest—As of December 31, 2015, approximately 10,400,000 RSUs were expected to vest over the next 3.3 years.
Restricted Share Awards
In connection with the Venator Acquisition and a performance-based incentive plan, the Company issued $5.0 million of restricted Class Ashares. Based on the terms of the awards of the Company’s Class A shares, equity-based compensation will be expensed over two years. For the year endedDecember 31, 2015, 359,367 restricted shares were granted. Compensation expense recognized for the year ended December 31, 2015 related to theserestricted shares was $2.7 million. There were no forfeitures of restricted shares during the year ended December 31, 2015.
- 180-

Table of ContentsAPOLLO GLOBAL MANAGEMENT, LLC
NOTES TO CONSOLIDATEDFINANCIAL STATEMENTS
(dollars in thousands, except share data, except where noted)
Share Options
The Company has granted options under the 2007 Omnibus Equity Incentive Plan. For the years ended December 31, 2015, 2014 and 2013,compensation expense of $0.1 million, $28.2 million and $4.7 million was recognized as a result of these grants, respectively. In connection with thedeparture of an employee from the Company, such employee vested in 1,250,000 share options that were previously granted to him and forfeited1,250,000 share options that were previously granted to him. As a result of the additional vesting, the Company recorded an incremental compensationexpense of $28.1 million related to the relevant option award agreement for the year ended December 31, 2014.
There were no share options granted during the years ended December 31, 2015, 2014 and 2013. Apollo measures the fair value of each optionaward on the date of grant using the Black-Scholes option-pricing model.
The following table summarizes the share option activity for the years ended December 31, 2015, 2014 and 2013:
Options
Outstanding
WeightedAverageExercise
Price
AggregateFair
Value
WeightedAverage
RemainingContractual
TermBalance at January 1, 2013 5,275,000 $ 8.44 $ 29,020 8.01Exercised (2,324,997) 8.12 (12,896) —Balance at December 31, 2013 2,950,003 8.69 16,124 7.08Exercised (1,468,750) 8.03 (8,217) —Forfeited (1,250,000) 8.00 (7,025) —Balance at December 31, 2014 231,253 16.60 882 7.93Exercised (8,333) 12.38 (17) —Balance at December 31, 2015 222,920 17.69 $ 865 6.95Exercisable at December 31, 2015 118,751 $ 17.14 $ 384 6.99
Options Expected to Vest—As of December 31, 2015, approximately 100,000 options were expected to vest.
The expected life of the options granted represents the period of time that options are expected to be outstanding and is based on the contractualterm of the option. Unamortized compensation cost related to unvested share options at December 31, 2015 was $0.3 million and is expected to berecognized over a weighted average period of 2.5 years. The intrinsic value of options exercised was $0.1 million, $26.6 million and $42.9 million for theyears ended December 31, 2015, 2014 and 2013, respectively.
Delivery of Class A Shares - RSUs and Share Options
During the years ended December 31, 2015, 2014 and 2013, the Company delivered Class A shares in settlement of vested RSUs and exercisedshare options. The Company has generally allowed holders of vested RSUs and exercised share options to settle their tax liabilities by reducing the numberof Class A shares delivered to them, which the Company refers to as “net share settlement.” Additionally, the Company has generally allowed holders of shareoptions to settle their exercise price by reducing the number of Class A shares delivered to them at the time of exercise by an amount sufficient to cover theexercise price. The net share settlement results in a liability for the Company and a corresponding accumulated deficit adjustment. This adjustment for theyears ended December 31, 2015, 2014 and 2013 was $78.9 million, $0.4 million and $85.9 million, respectively.
The delivery of Class A shares in settlement of vested RSUs and exercised share options does not cause a transfer of amounts in the consolidatedstatements of changes in shareholders’ equity to the Class A shareholders. The delivery of Class A shares in settlement of vested RSUs and exercised shareoptions causes the income allocated to the Non-Controlling Interests to shift to the Class A shareholders from the date of delivery forward. The table belowsummarizes the delivery of Class A shares in settlement of vested RSUs and exercised share options for the years ended December 31, 2015, 2014 and 2013:
- 181-

Table of ContentsAPOLLO GLOBAL MANAGEMENT, LLC
NOTES TO CONSOLIDATEDFINANCIAL STATEMENTS
(dollars in thousands, except share data, except where noted)
For the Year Ended December 31,
2015 2014 2013
Class A shares delivered or issued 11,296,388 10,491,649 5,181,389Gross value of shares(1) $ 325,747 $ 289,000 $ 212,900
(1) Based on the closing price of a Class A share at the time of delivery.
AAA RDUs
Incentive units that provide the right to receive AAA restricted depositary units (“RDUs”) following vesting are granted periodically toemployees of Apollo. These grants are accounted for as equity awards in accordance with U.S. GAAP. The incentive units granted to employees generallyvest over three years. The fair value at the date of the grants is recognized on a straight-line basis over the vesting period (or upon grant in the case of fullyvested AAA RDUs). The grant date fair value is based on the public share price of AAA. Vested AAA RDUs can be converted into ordinary common units ofAAA subject to applicable securities law restrictions. During the years ended December 31, 2015, 2014 and 2013, the actual forfeiture rate was 0.0%, 1.1%and 0.0%, respectively. For the years ended December 31, 2015, 2014 and 2013, compensation expense of $0.7 million, $0.4 million and $1.2 million wasrecognized, respectively. The following table summarizes RDU activity for the years ended year ended December 31, 2015, 2014 and 2013, respectively:
Unvested
WeightedAverage
Grant DateFair Value Vested
Total Numberof RDUs
OutstandingBalance at January 1, 2013 338,430 $ 8.85 114,896 453,326Granted 27,286 26.90 — 27,286Delivered — 9.02 (114,896) (114,896)Vested (120,354) 9.83 120,354 —Balance at December 31, 2013 245,362 10.38 120,354 365,716Granted 18,426 33.05 — 18,426Forfeited (2,861) 8.36 — (2,861)Delivered — 9.02 (120,354) (120,354)Vested (96,267) 11.17 96,267 —Balance at December 31, 2014 164,660 12.49 96,267 260,927Delivered — 11.17 (96,267) (96,267)Vested (96,268) 11.17 96,268 —Balance at December 31, 2015 68,392 $ 14.35 96,268 164,660
Units Expected to Vest—As of December 31, 2015, approximately 64,288 RDUs were expected to vest over the next 1.2 years.
- 182-

Table of ContentsAPOLLO GLOBAL MANAGEMENT, LLC
NOTES TO CONSOLIDATEDFINANCIAL STATEMENTS
(dollars in thousands, except share data, except where noted)
The following table summarizes the activity of RDUs available for future grants:
RDUs AvailableFor Future
GrantsBalance at January 1, 2013 1,685,345Purchases 6,236Granted/Issued (39,272)Forfeited —Balance at December 31, 2013 1,652,309Purchases 9,719Granted/Issued (18,426)Forfeited 2,861Balance at December 31, 2014 and 2015 1,646,463
Restricted Stock and Restricted Stock Unit Awards—ARI and AMTG
ARI restricted stock awards, ARI restricted stock unit awards ("ARI RSUs") and AMTG restricted stock unit awards (“AMTG RSUs”) granted tothe Company and certain of the Company’s employees generally vest over three years, either quarterly or annually. The awards granted to the Company areaccounted for as investments and deferred revenue in the consolidated statements of financial condition. As these awards vest, the deferred revenue isrecognized as management fees. The investment is accounted for using the equity method of accounting for awards granted to the Company and as a deferredcompensation asset for the awards granted to employees. Compensation expense is recognized on a straight line-basis over the vesting period for the awardsgranted to the employees. The Company recorded an asset and a liability upon receiving the awards on behalf of the Company’s employees. The fair value ofthe awards to employees is based on the grant date fair value, which utilizes the public share price of ARI and AMTG, less discounts for transfer restrictions aswell as timing of distributions for the AMTG RSUs. The awards granted to the Company’s employees are remeasured each period to reflect the fair value ofthe asset and other liabilities and any changes in these values are recorded in the consolidated statements of operations.
The following table summarizes the management fees, compensation expense, and forfeiture rates for the ARI restricted stock awards and ARIRSUs for the years ended December 31, 2015, 2014, and 2013:
For the Year Ended December 31,
2015 2014 2013Management fees $ 3,334 $ 1,326 $ 2,837Compensation expense 3,081 1,329 2,047Forfeiture rate 1.3% —% 1.6%
The following table summarizes the management fees, compensation expense, and forfeiture rates for the AMTG RSUs for the years endedDecember 31, 2015, 2014, and 2013:
For the Year Ended December 31,
2015 2014 2013Management fees $ 1,171 $ 915 $ 849Compensation expense 1,171 828 804Forfeiture rate 2.5% 2.5% 1.3%
- 183-

Table of ContentsAPOLLO GLOBAL MANAGEMENT, LLC
NOTES TO CONSOLIDATEDFINANCIAL STATEMENTS
(dollars in thousands, except share data, except where noted)
The following tables summarize activity for the ARI restricted stock awards, ARI RSUs and AMTG RSUs that were granted to both the Companyand certain of its employees for the years ended December 31, 2015, 2014 and 2013:
ARI RSUsUnvested
WeightedAverage
Grant DateFair Value
ARI RSUsVested
TotalNumber ofARI RSUs
OutstandingBalance at January 1, 2013 237,542 $ 14.62 113,148 350,690Granted to employees of the Company 205,000 16.58 — 205,000Granted to the Company 40,000 17.59 — 40,000Forfeited by employees of the Company (5,000) 16.66 — (5,000)Delivered — 13.32 (18,978) (18,978)Vested awards of employees of the Company (137,807) 15.48 137,807 —Vested awards of the Company (65,333) 15.41 65,333 —Balance at December 31, 2013 274,402 15.86 297,310 571,712Granted to employees of the Company 400,254 16.59 — 400,254Delivered — 14.76 (307,731) (307,731)Vested awards of employees of the Company (129,148) 15.55 129,148 —Vested awards of the Company (65,333) 15.41 65,333 —Balance at December 31, 2014 480,175 16.61 184,060 664,235Granted to employees of the Company 642,056 17.15 — 642,056Forfeited by employees of the Company (13,500) 17.17 — (13,500)Delivered — 14.99 (33,981) (33,981)Vested awards of employees of the Company (201,586) 17.02 201,586 —Vested awards of the Company (13,335) 17.59 13,335 —Balance at December 31, 2015 893,810 $ 16.88 365,000 1,258,810
Units Expected to Vest—As of December 31, 2015, approximately 840,181 ARI RSUs were expected to vest over the next 2.7 years.
- 184-

Table of ContentsAPOLLO GLOBAL MANAGEMENT, LLC
NOTES TO CONSOLIDATEDFINANCIAL STATEMENTS
(dollars in thousands, except share data, except where noted)
AMTG RSUs
Unvested
WeightedAverage
Grant DateFair Value
AMTG RSUsVested
TotalNumber of
AMTG RSUsOutstanding
Balance at January 1, 2013 161,257 $ 20.28 12,862 174,119Granted to employees of the Company 25,848 14.73 — 25,848Forfeited by employees of the Company (2,359) 18.74 — (2,359)Vested awards of employees of the Company (51,259) 20.30 51,259 —Vested awards of the Company (6,250) 18.20 6,250 —Balance at December 31, 2013 127,237 19.28 70,371 197,608Granted to employees of the Company 130,124 16.01 — 130,124Forfeited by employees of the Company (4,855) 21.22 — (4,855)Delivered — 17.56 (31,167) (31,167)Vested awards of employees of the Company (57,982) 19.56 57,982 —Vested awards of the Company (4,688) 18.20 4,688 —Balance at December 31, 2014 189,836 16.93 101,874 291,710Forfeited by employees of the Company (4,676) 15.75 — (4,676)Delivered — 20.60 (138,862) (138,862)Vested awards of employees of the Company (94,569) 18.02 94,569 —Balance at December 31, 2015 90,591 $ 15.85 57,581 148,172
Units Expected to Vest—As of December 31, 2015, approximately 85,156 AMTG RSUs were expected to vest over the next 1.9 years.
Restricted Share Awards—Athene Holding
Athene Holding has granted restricted share awards (“AHL Awards”) to certain employees of Apollo which function similarly to options in thatthey are exchangeable for Class A shares of Athene Holdings upon payment of a conversion price and other conditions being met. Certain of the awardsgranted are subject to time-based vesting conditions that generally vest over five years and certain of the awards vest once certain metrics have beenachieved, such as attainment of certain rates of return and realized cash received by certain investors in Athene Holding upon sale of their shares. The AHLAwards are not convertible into Class A shares of Athene Holding until the completion of an initial public offering of Athene Holding. During 2014, thevesting terms of some of the AHL Awards were modified such that the portion of AHL Awards related to services provided from the date of grant were deemedvested.
The AHL Awards, are accounted for as a prepaid compensation asset within other assets and deferred revenue in the consolidated statements offinancial condition. From the date of grant, the deferred revenue is recognized as management fees and the prepaid compensation asset is recognized ascompensation expense over the vesting period. The fair value of the awards to employees is based on the grant date fair value, which utilizes the share priceof Athene Holding, less discounts for transfer restrictions. Shares granted as part of the AHL Awards were valued using a multiple-scenario model, whichconsiders the price volatility of the underlying stock price of Athene Holding, time to expiration and the risk-free rate. The awards granted are recognized asliability awards and are remeasured each period to reflect the fair value of the prepaid compensation asset and deferred revenue. Any changes in fair value arerecorded in management fees and equity-based compensation expense in the consolidated statements of operations.
For the years ended December 31, 2015 and 2014, $24.2 million and $16.7 million of equity-based compensation expense was recognized in theconsolidated statements of operations, respectively, related to AHL Awards granted to employees of Athene Asset Management.
The following table summarizes activity for the AHL Awards that were granted to certain employees of the company for the years endedDecember 31, 2015 and 2014:
- 185-

Table of ContentsAPOLLO GLOBAL MANAGEMENT, LLC
NOTES TO CONSOLIDATEDFINANCIAL STATEMENTS
(dollars in thousands, except share data, except where noted)
AHL Awards
Unvested
WeightedAverage
Grant DateFair Value
AHL AwardsVested
TotalNumber of
AHL AwardsOutstanding
Balance at January 1, 2014 1,717,568 $ 1.23 — 1,717,568Granted to employees of the Company 850,000 9.31 — 850,000Vested awards of the employees of the Company (849,495) 3.69 849,495 —Balance at December 31, 2014 1,718,073 4.00 849,495 2,567,568Granted to employees of the Company 583,268 2.17 — 583,268Vested awards of employees of the Company (195,374) 6.04 195,374 —Transfers(1) (590,089) 2.72 — (590,089)Balance at December 31, 2015 1,515,878 $ 3.54 1,044,869 2,560,747
(1) On January 1, 2015, certain employees of Athene Asset Management who had been granted AHL Awards became employees of Athene Holding, an unconsolidatedaffiliate of the Company.
There were no AHL Awards converted into Class A shares of Athene Holding during the years ended December 31, 2015 and 2014.
Units Expected to Vest—As of December 31, 2015, approximately 463,052 AHL Awards were expected to vest over the next 2.4 years and1,052,826 AHL Awards may vest if certain metrics are achieved.
Equity-Based Compensation Allocation
Equity-based compensation is allocated based on ownership interests. Therefore, the amortization of the AOG Units is allocated to shareholders’equity attributable to Apollo Global Management, LLC and the Non-Controlling Interests, which results in a difference in the amounts charged to equity-based compensation expense and the amounts credited to shareholders’ equity attributable to Apollo Global Management, LLC in the Company’sconsolidated financial statements.
Below is a reconciliation of the equity-based compensation allocated to Apollo Global Management, LLC for the year ended December 31,2015:
Total
Amount
Non-Controlling
Interest % inApollo
OperatingGroup
Allocated toNon-
ControllingInterest in
ApolloOperatingGroup(1)
Allocated toApolloGlobal
Management,LLC
RSUs and Share Options $ 68,535 —% $ — $ 68,535AHL Awards 24,180 54.4 13,158 11,022Other equity-based compensation awards 4,961 54.4 2,699 2,262
Total Equity-Based Compensation $ 97,676 15,857 81,819
Less other equity-based compensation awards (2) (15,857) (13,860)
Capital Increase Related to Equity-Based Compensation $ — $ 67,959 (1) Calculated based on average ownership percentage for the period considering Class A share issuances during the period.(2) Includes equity-based compensation reimbursable by certain funds.
- 186-

Table of ContentsAPOLLO GLOBAL MANAGEMENT, LLC
NOTES TO CONSOLIDATEDFINANCIAL STATEMENTS
(dollars in thousands, except share data, except where noted)
Below is a reconciliation of the equity-based compensation allocated to Apollo Global Management, LLC for the year ended December 31,2014:
Total
Amount
Non-Controlling
Interest % inApollo
OperatingGroup
Allocated toNon-
ControllingInterest in
ApolloOperatingGroup(1)
Allocated toApolloGlobal
Management,LLC
RSUs and Share Options $ 107,017 —% $ — $ 107,017AHL Awards 16,738 57.7 9,938 6,800Other equity-based compensation awards 2,565 57.7 1,517 1,048
Total Equity-Based Compensation $ 126,320 11,455 114,865
Less other equity-based compensation awards(2) (11,455) (5,994)
Capital Increase Related to Equity-Based Compensation $ — $ 108,871
(1) Calculated based on average ownership percentage for the period considering Class A share issuances during the period.(2) Includes equity-based compensation reimbursable by certain funds.
Below is a reconciliation of the equity-based compensation allocated to Apollo Global Management, LLC for the year ended December 31,2013:
Total
Amount
Non-Controlling
Interest % inApollo
OperatingGroup
Allocated toNon-
ControllingInterest in
ApolloOperatingGroup(1)
Allocated toApolloGlobal
Management,LLC
AOG Units $ 30,007 61.0% $ 19,163 $ 10,844RSUs and Share Options 92,185 — — 92,185Other equity-based compensation awards 4,035 61.0 2,494 1,541
Total Equity-Based Compensation $ 126,227 21,657 104,570
Less other equity-based compensation awards(2) (2,494) 365
Capital Increase Related to Equity-Based Compensation $ 19,163 $ 104,935
(1) Calculated based on average ownership percentage for the period considering Class A share issuances during the period.(2) Includes equity-based compensation reimbursable by certain funds.
15. RELATED PARTY TRANSACTIONS AND INTERESTS IN CONSOLIDATED ENTITIES
The Company typically facilitates the initial payment of certain operating costs incurred by the funds that it manages as well as their affiliates.These costs are normally reimbursed by such funds and are included in due from affiliates.
- 187-
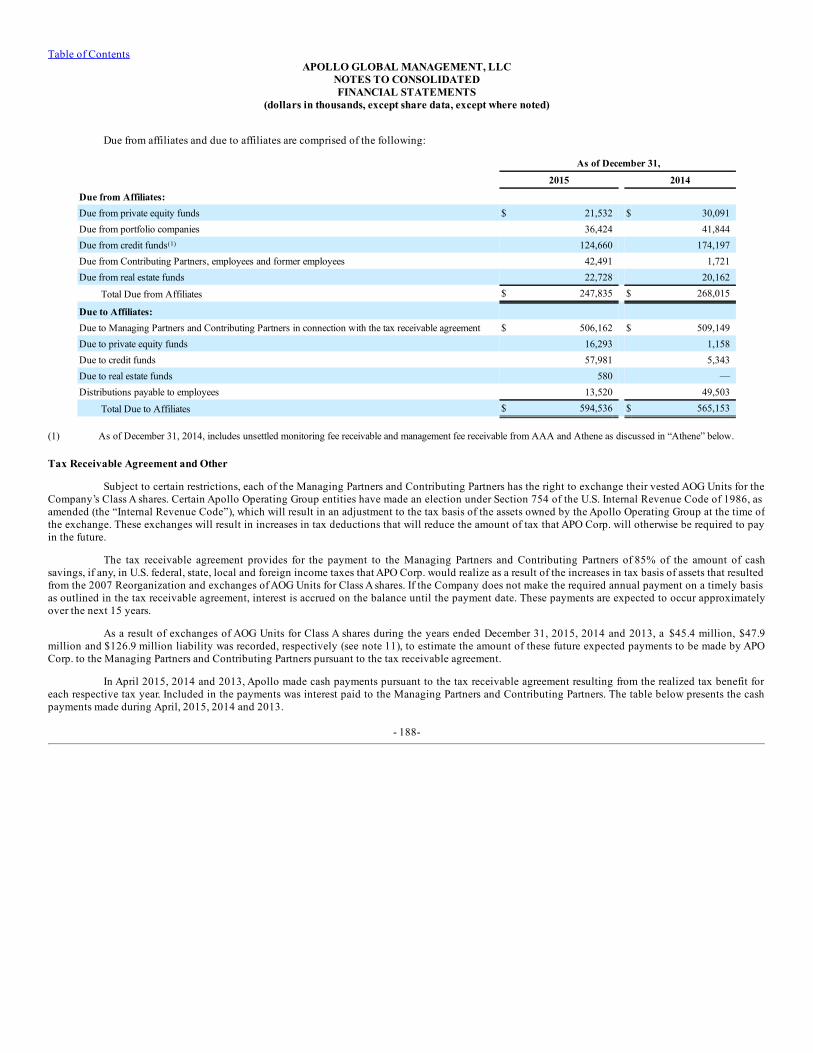
Table of ContentsAPOLLO GLOBAL MANAGEMENT, LLC
NOTES TO CONSOLIDATEDFINANCIAL STATEMENTS
(dollars in thousands, except share data, except where noted)
Due from affiliates and due to affiliates are comprised of the following:
As of December 31,
2015 2014
Due from Affiliates: Due from private equity funds $ 21,532 $ 30,091Due from portfolio companies 36,424 41,844Due from credit funds(1) 124,660 174,197Due from Contributing Partners, employees and former employees 42,491 1,721Due from real estate funds 22,728 20,162
Total Due from Affiliates $ 247,835 $ 268,015
Due to Affiliates: Due to Managing Partners and Contributing Partners in connection with the tax receivable agreement $ 506,162 $ 509,149Due to private equity funds 16,293 1,158Due to credit funds 57,981 5,343Due to real estate funds 580 —Distributions payable to employees 13,520 49,503
Total Due to Affiliates $ 594,536 $ 565,153
(1) As of December 31, 2014, includes unsettled monitoring fee receivable and management fee receivable from AAA and Athene as discussed in “Athene” below.
Tax Receivable Agreement and Other
Subject to certain restrictions, each of the Managing Partners and Contributing Partners has the right to exchange their vested AOG Units for theCompany’s Class A shares. Certain Apollo Operating Group entities have made an election under Section 754 of the U.S. Internal Revenue Code of 1986, asamended (the “Internal Revenue Code”), which will result in an adjustment to the tax basis of the assets owned by the Apollo Operating Group at the time ofthe exchange. These exchanges will result in increases in tax deductions that will reduce the amount of tax that APO Corp. will otherwise be required to payin the future.
The tax receivable agreement provides for the payment to the Managing Partners and Contributing Partners of 85% of the amount of cashsavings, if any, in U.S. federal, state, local and foreign income taxes that APO Corp. would realize as a result of the increases in tax basis of assets that resultedfrom the 2007 Reorganization and exchanges of AOG Units for Class A shares. If the Company does not make the required annual payment on a timely basisas outlined in the tax receivable agreement, interest is accrued on the balance until the payment date. These payments are expected to occur approximatelyover the next 15 years.
As a result of exchanges of AOG Units for Class A shares during the years ended December 31, 2015, 2014 and 2013, a $45.4 million, $47.9million and $126.9 million liability was recorded, respectively (see note 11), to estimate the amount of these future expected payments to be made by APOCorp. to the Managing Partners and Contributing Partners pursuant to the tax receivable agreement.
In April 2015, 2014 and 2013, Apollo made cash payments pursuant to the tax receivable agreement resulting from the realized tax benefit foreach respective tax year. Included in the payments was interest paid to the Managing Partners and Contributing Partners. The table below presents the cashpayments made during April, 2015, 2014 and 2013.
- 188-

Table of ContentsAPOLLO GLOBAL MANAGEMENT, LLC
NOTES TO CONSOLIDATEDFINANCIAL STATEMENTS
(dollars in thousands, except share data, except where noted)
Date Cash Payment Interest Paid to
Managing Partners Interest Paid to
Contributing PartnersApril, 2015 $ 48,420 $ 13,090 $ 555April, 2014 32,032 8,272 469April, 2013 30,403 7,645 333
During the years ended December 31, 2014 and 2013, the Company reduced the tax receivable agreement liability and recorded $32.2 millionand $13.0 million, respectively, in other income, net in the consolidated statement of operations due to changes in estimated tax rates.
Due from Contributing Partners, Employees and Former Employees
As of December 31, 2015 and 2014, due from Contributing Partners, Employees and Former Employee balances include various amounts due tothe Company including director fee receivables. In addition, as of December 31, 2015, the balance included interest-bearing employee loans receivable of$25.0 million. The outstanding principal amount of the loans as well as all accrued and unpaid interest is required to be repaid at the earlier of the eighthanniversary of the date of the relevant loan or at the date of the relevant employee’s resignation from the Company.
The Company has recorded a receivable from the Contributing Partners and certain employees and former employees for the potential return ofprofit sharing distributions that would be due if certain funds were liquidated as of December 31, 2015 with respect to ACLF, Fund V, ANRP I and aperformance-based incentive plan of $6.9 million, $4.9 million, $1.3 million and $1.6 million, respectively, as of December 31, 2015.
- 189-

Table of ContentsAPOLLO GLOBAL MANAGEMENT, LLC
NOTES TO CONSOLIDATEDFINANCIAL STATEMENTS
(dollars in thousands, except share data, except where noted)
Distributions
In addition to other distributions such as payments pursuant to the tax receivable agreement, the table below presents information regarding thequarterly distributions which were made at the sole discretion of the manager of the Company during 2015, 2014 and 2013 (in millions, except per sharedata):
DistributionDeclaration Date
Distributionper
Class A Share
DistributionPayment Date
Distributionto
Class AShareholders
Distribution toNon-ControllingInterest Holders
in the ApolloOperating
Group
TotalDistributions
fromApollo
OperatingGroup
DistributionEquivalents
onParticipating
SecuritiesFebruary 8, 2013 $ 1.05 February 28, 2013 $ 138.7 $ 252.0 $ 390.7 $ 25.0April 12, 2013 — April 12, 2013 — 55.2 (1) 55.2 —May 6, 2013 0.57 May 30, 2013 80.8 131.8 212.6 14.3August 8, 2013 1.32 August 30, 2013 189.7 305.2 494.9 30.8November 7, 2013 1.01 November 29, 2013 147.7 231.2 378.9 24.1For the year ended December31, 2013 $ 3.95 $ 556.9 $ 975.4 $ 1,532.3 $ 94.2
February 7, 2014 $ 1.08 February 26, 2014 $ 160.9 $ 247.3 $ 408.2 $ 25.5April 3, 2014 — April 3, 2014 — 49.5 (1) 49.5 —May 8, 2014 0.84 May 30, 2014 130.0 188.4 318.4 20.9June 16, 2014 — June 16, 2014 — 28.5 (1) 28.5 —August 6, 2014 0.46 August 29, 2014 73.6 102.5 176.1 10.2September 11, 2014 — September 11, 2014 — 12.4 (1) 12.4 —October 30, 2014 0.73 November 21, 2014 119.0 162.6 281.6 15.5December 15, 2014 — December 15, 2014 — 25.2 (1) 25.2 —For the year ended December31, 2014 $ 3.11 $ 483.5 $ 816.4 $ 1,299.9 $ 72.1
February 5, 2015 $ 0.86 February 27, 2015 $ 144.4 $ 191.3 $ 335.7 $ 15.3April 11, 2015 — April 11, 2015 — 22.4 (1) 22.4 —May 7, 2015 0.33 May 29, 2015 56.8 72.8 129.6 4.9July 29, 2015 0.42 August 31, 2015 74.8 91.2 166.0 5.1October 28, 2015 0.35 November 30, 2015 $ 63.4 $ 75.7 $ 139.1 $ 3.1For the year ended December31, 2015 $ 1.96 $ 339.4 $ 453.4 $ 792.8 $ 28.4
(1) On April 12, 2013, April 3, 2014, June 16, 2014, September 11, 2014, December 15, 2014, and April 11, 2015, the Company madea $0.23, $0.22, $0.13, $0.06, $0.11, and $0.10 distribution per AOG Unit, respectively, to the Non-Controlling Interest holders in the Apollo Operating Group.
- 190-

Table of ContentsAPOLLO GLOBAL MANAGEMENT, LLC
NOTES TO CONSOLIDATEDFINANCIAL STATEMENTS
(dollars in thousands, except share data, except where noted)
Indemnity
Carried interest income from certain funds that the Company manages can be distributed to the Company on a current basis, but is subject torepayment by the subsidiary of the Apollo Operating Group that acts as general partner of the fund in the event that certain specified return thresholds are notultimately achieved. The Managing Partners, Contributing Partners and certain other investment professionals have personally guaranteed, subject to certainlimitations, the obligation of these subsidiaries in respect of this general partner obligation. Such guarantees are several and not joint and are limited to aparticular Managing Partner’s or Contributing Partner’s distributions. An existing shareholders agreement includes clauses that indemnify each of theCompany’s Managing Partners and certain Contributing Partners against all amounts that they pay pursuant to any of these personal guarantees in favor ofcertain funds that the Company manages (including costs and expenses related to investigating the basis for or objecting to any claims made in respect of theguarantees) for all interests that the Company’s Managing Partners and Contributing Partners have contributed or sold to the Apollo Operating Group.
Accordingly, in the event that the Company’s Managing Partners, Contributing Partners and certain investment professionals are required to payamounts in connection with a general partner obligation for the return of previously made distributions, the Company will be obligated to reimburse theCompany’s Managing Partners and certain Contributing Partners for the indemnifiable percentage of amounts that they are required to pay even though theCompany did not receive the certain distribution to which that general partner obligation related. The Company recorded an indemnification liability of $4.6million as of December 31, 2015. There was no indemnification liability recorded as of December 31, 2014.
Due to Private Equity Funds
Based upon a hypothetical liquidation of Fund V, APC and ANRP I as of December 31, 2015, the Company has recorded a general partnerobligation to return previously distributed carried interest income, which represents amounts due to these funds. As such, there was a general partnerobligation to return previously distributed carried interest income with respect to Fund V, APC and ANRP I of $10.8 million, $2.1 million and $3.4 millionaccrued as of December 31, 2015, respectively. As of December 31, 2014, there was no general partner obligation to return previously distributed carriedinterest income. The actual determination and any required payment of a general partner obligation would not take place until the final disposition of thefund’s investments based on contractual termination of the fund or as otherwise set forth in the respective limited partnership agreement of the fund.
Due to Credit Funds
Based upon a hypothetical liquidation of certain of our credit funds, as of December 31, 2015, 2014 and 2013, the Company has recorded ageneral partner obligation to return previously distributed carried interest income, which represents amounts due to these funds. As such, there was a generalpartner obligation to return previously distributed carried interest income with respect to ACLF, COF II and certain SIAs within the credit segment of $25.6million, $0.4 million and $29.7 million accrued as of December 31, 2015, respectively. As of December 31, 2014, there was a general partner obligation toreturn previously distributed carried interest income with respect to ACLF and an SIA of $2.5 million and $0.9 million, respectively. As of December 31,2013, there was a general partner obligation to return previously distributed carried interest income with respect to an SIA and APC of $19.3 million and $0.3million, respectively. The actual determination and any required payment of a general partner obligation would not take place until the final disposition ofthe fund’s investments based on contractual termination of the fund or as otherwise set forth in the respective limited partnership agreement or othergoverning document of the fund.
Athene
Athene Holding is the ultimate parent of various insurance company operating subsidiaries. Through its subsidiaries, Athene Holding providesinsurance products focused primarily on the retirement market and its business centers primarily on issuing or reinsuring fixed indexed annuities.
Athene Asset Management receives a management fee equal to 0.40% per annum on all assets under management in accounts owned by orrelated to Athene (the “Athene Accounts”), with certain limited exceptions. In addition, the Company receives sub-advisory management fees and carriedinterest income with respect to a portion of the assets in the Athene Accounts. With respect to capital invested in an Apollo fund, Apollo receivesmanagement fees directly from the relevant funds under the investment management agreements with such funds. Athene Asset Management and otherApollo subsidiaries incur all expenses associated with their provision of services to Athene, including but not limited to, asset allocation services, direct assetmanagement services, risk management, asset and liability matching management, mergers and acquisitions asset diligence, hedging and other services.
- 191-

Table of ContentsAPOLLO GLOBAL MANAGEMENT, LLC
NOTES TO CONSOLIDATEDFINANCIAL STATEMENTS
(dollars in thousands, except share data, except where noted)
Under a transaction advisory services agreement with Athene (the “Athene Services Agreement”), effective February 5, 2013 through December31, 2014, Apollo earned a quarterly monitoring fee of 0.50% of Athene’s capital and surplus as of the end of the applicable quarter multiplied by 2.5,excluding the shares of Athene Holding that were newly acquired (and not in satisfaction of prior commitments to buy such shares) by AAA Investments inthe contribution of certain assets by AAA to Athene in October 2012 (the “Excluded Athene Shares”). The Athene Services Agreement was amended inconnection with the Athene Private Placement described below (the “Amended Athene Services Agreement”). The Amended Athene Services Agreementadjusted the calculation of Athene Holding’s capital and surplus downward by an amount equal to (x) the equity capital raised in the Athene PrivatePlacement and (y) certain disproportionate increases to the statutory capital and surplus of Athene, as compared to the stockholders’ equity of Athenecalculated on a U.S. GAAP basis, as a result of certain future acquisitions by Athene. Prior to the consummation of the Athene Private Placement, all suchmonitoring fees were paid pursuant to the Athene Services Derivative. In connection with the Athene Private Placement, the Athene Services Derivative wassettled on April 29, 2014 by delivery to Apollo of common shares of Athene Holding, and as a result, such derivative was terminated. Following settlement ofthe Athene Services Derivative, future monitoring fees paid to Apollo pursuant to the Amended Athene Services Agreement, were paid on a quarterly basis inarrears by delivery to Apollo of common shares of Athene Holding. Unsettled monitoring fees pursuant to the Amended Athene Services Agreement arerecorded as due from affiliates in the consolidated statements of financial condition. For the years ended December 31, 2014 and 2013, Apollo earned $226.4million and $107.9 million, respectively related to this monitoring fee. The monitoring fee is recorded in advisory and transaction fees from affiliates, net, int h e consolidated statements of operations. As of December 31, 2014, Apollo had a $58.2 million receivable recorded in due from affiliates on theconsolidated statements of financial condition.
In accordance with the services agreement among AAA, AAA Investments and the other service recipients party thereto and Apollo (the “AAAServices Agreement”), Apollo receives a management fee for managing the assets of AAA Investments. In connection with each of the contribution of certainassets by AAA to Athene in October 2012, and the initial closing of the Athene Private Placement on April 4, 2014, the AAA Services Agreement wasamended (the “Amended AAA Services Agreement”). Pursuant to the Amended AAA Services Agreement, the parties agreed that there will be no managementfees payable by AAA Investments with respect to the Excluded Athene Shares. AAA Investments agreed to continue to pay Apollo the same management feeon its investment in Athene Holding (other than with respect to the Excluded Athene Shares), except that Apollo agreed that the obligation to pay theexisting management fee terminated on December 31, 2014 (although services will continue through December 31, 2020). Prior to the consummation of theAthene Private Placement, all such management fees were accrued pursuant to the AAA Services Derivative. In connection with the Athene PrivatePlacement, the AAA Services Derivative was settled on April 29, 2014 by delivery to Apollo of common shares of Athene Holding, and as a result, suchderivative was terminated. Following settlement of the AAA Services Derivative, future management fees paid to Apollo pursuant to the Amended AAAServices Agreement were paid on a quarterly basis in arrears by delivery to Apollo of common shares of Athene Holding. Unsettled management fees pursuantto the Amended AAA Services Agreement are recorded as due from affiliates in the consolidated statements of financial condition. There were nomanagement fees receivable as of December 31, 2015 as AAA Investments’ obligation to pay the existing management fee terminated on December 31, 2014.As of December 31, 2014, Apollo had a $3.1 million receivable recorded in due from affiliates related to this management fee on the consolidated statementsof financial condition. The total management fees earned by Apollo related to the Amended AAA Services Agreement were $3.4 million, $1.9 million and$2.2 million for the years ended December 31, 2015, 2014 and 2013, respectively. These management fees are recorded in management fees from affiliates inthe consolidated statements of operations.
Prior to the settlement of the Athene Services Derivative and the AAA Services Derivative, the Amended Athene Services Agreement and theAmended AAA Services Agreement together with the Athene Services Derivative and the AAA Services Derivative, met the definition of derivatives underU.S. GAAP. The Company had classified these derivatives as Level III assets in the fair value hierarchy, as the pricing inputs into the determination of fairvalue require significant judgment and estimation. After the settlement of the Athene Services Derivative and the AAA Services Derivatives the unsettledshares receivable recorded in due from affiliates related to the Amended Athene Services Agreement and the Amended AAA Services Agreement are valued atfair value based on the price of a common share of Athene Holding. The Company had classified the derivative and the shares receivable as Level III assets inthe fair value hierarchy, as the pricing inputs into the determination of fair value require significant judgment and estimation. See note 6 for furtherdiscussion regarding fair value measurements.
Prior to the settlement of the Athene Services Derivative and the AAA Services Derivative, the change in unrealized market value of thederivatives was reflected in other income, net in the consolidated statements of operations. For the year ended December 31, 2013, there was a $10.2 millionchange in market value recognized related to these derivatives.
- 192-

Table of ContentsAPOLLO GLOBAL MANAGEMENT, LLC
NOTES TO CONSOLIDATEDFINANCIAL STATEMENTS
(dollars in thousands, except share data, except where noted)
In addition, Apollo, as general partner of AAA Investments, is generally entitled to a carried interest that allocates to it 20% of the realizedreturns (net of related expenses, including borrowing costs) on the investments of AAA Investments, except that Apollo will not be entitled to receive anycarried interest in respect of the Excluded Athene Shares. Carried interest receivable from AAA Investments will be paid in common shares of Athene Holding(valued at the then fair market value) if there is a distribution in kind of shares of Athene Holding (unless such payment in shares would violate Section 16(b)of the Exchange Act) or paid in cash if AAA sells the shares of Athene Holding. For the years ended December 31, 2015, 2014, and 2013, the Companyrecorded carried interest income less the related profit sharing expense of $36.1 million, $14.6 million and $27.6 million from AAA Investments,respectively, which is recorded in the consolidated statements of operations. As of December 31, 2015 and 2014, the Company had a $185.5 million and a$121.5 million carried interest receivable, respectively, related to AAA Investments. As of December 31, 2015 and 2014, the Company had a related profitsharing payable of $62.8 million and $34.9 million, respectively, recorded in profit sharing payable in the consolidated statements of financial condition.
For the years ended December 31, 2015, 2014 and 2013, Apollo earned gross revenues in the aggregate totaling $526.5 million, $546.5 millionand $435.1 million, respectively, consisting of management fees, sub-advisory and monitoring fees and carried interest income from Athene after consideringthe related profit sharing expense and changes in the market value of the Athene Holding shares owned directly by Apollo, which is recorded in theconsolidated statements of operations. These amounts exclude the deferred revenue recognized as management fees associated with the vesting of AHLAwards granted to employees of Athene Asset Management as further described in note 14.
On April 4, 2014, Athene Holding completed an initial closing of a private placement offering of common equity in which it raised $1.048billion of primary commitments from third-party institutional and certain existing investors in Athene Holding (the “Athene Private Placement”). Shares inthe Athene Private Placement were offered at a price per common share of Athene Holding of $26.00. In connection with the Athene Private Placement,Athene raised an additional $80 million of third party capital at $26.00 per share, all of which was used to buy back a portion of the shares of one of itsexisting investors at a price of $26.00 per share in a transaction that was consummated on April 29, 2014. As announced by AAA on June 24, 2014, a secondclosing of the Athene Private Placement occurred in which Athene Holding raised $170.0 million of commitments primarily from employees of Athene andits affiliates at a price per common share of Athene Holding of $26.00. The Athene Private Placement offering was concluded in the first quarter of 2015 witha final closing of $60.0 million of additional capital commitments from affiliates of Athene. The Investment Partnership did not purchase any additionalcommon shares of Athene Holding as part of the Athene Private Placement.
The Company had an approximate 9.2% economic ownership interest in Athene Holding as of December 31, 2015, which comprises Apollo’sdirect ownership of 8.0% of the economic equity of Athene Holding plus an additional 1.2% economic ownership interest, which is calculated as the sum ofthe Company’s approximate 2.4% economic ownership interest in AAA and the Company’s approximate 0.06% economic ownership interest in AAAInvestments, multiplied by AAA Investments’ approximate 46.3% economic ownership interest in Athene, calculated without giving effect to restrictedcommon shares issued under Athene’s management equity plan as of December 31, 2015. As disclosed in note 2, as a result of the adoption of newaccounting guidance, AAA was deconsolidated as of January 1, 2015.
As of December 31, 2014, the Company, through its consolidation of AAA, had an approximate 47.7% economic ownership interest in Athenethrough its investment in AAA Investments, (calculated as if the commitments on the Athene Private Placement closed through December 31, 2014 were fullydrawn down but without giving effect to (i) restricted common shares issued under Athene’s management equity plan, (ii) common shares to be issued underthe Amended Athene Services Agreement subsequent to December 31, 2014 or (iii) the common shares to be issued under the Amended AAA ServicesAgreement subsequent to December 31, 2014). The Company effectively held 45% of the voting power of Athene as of December 31, 2014.
The Company had an approximate 8.1% economic ownership interest in Athene Holding as of December 31, 2014, which comprises Apollo’sdirect ownership of 6.9% of the economic equity of Athene Holding plus an additional 1.2% economic ownership interest, which is calculated as the sum ofthe Company’s approximate 2.5% economic ownership interest in AAA and the Company’s approximate 0.06% economic ownership interest in AAAInvestments, multiplied by AAA Investments’ approximate 47.7% economic ownership interest in Athene as of December 31, 2014. During 2014, theremaining ownership interest in AAA was recognized in the Company’s consolidated statements of operations as Non-Controlling Interest in consolidatedentities.
- 193-

Table of ContentsAPOLLO GLOBAL MANAGEMENT, LLC
NOTES TO CONSOLIDATEDFINANCIAL STATEMENTS
(dollars in thousands, except share data, except where noted)
MidCap
During the year ended December 31, 2015, Apollo, through its subsidiary Apollo MidCap Holdings (Cayman), L.P., entered into a subscriptionagreement providing for an aggregate commitment of $50.0 million to subscribe for (i) Class A Variable Funding Subordinated Notes due 2114 (“Class ANotes”) of MidCap FinCo Limited (“MidCap”), a private limited company domiciled in Ireland focused on direct lending opportunities in the senior securedcredit market across a diverse range of industries and asset classes that includes the former operations and assets of MidCap Financial Holdings, LLC, aleading specialty finance firm focused on senior secured direct origination in the healthcare sector, and (ii) ordinary shares of nominal value in MidCap’sholding company, MidCap FinCo Holdings Limited (“Ordinary Shares”). The subscription agreement has a commitment period of three years (subject toextension under certain circumstances). The commitment was fully funded as of December 31, 2015. Pursuant to an investment management agreement,Apollo, through its subsidiary Apollo Capital Management, L.P., is acting as the investment manager of MidCap’s credit business. Certain third parties havealso entered into subscription agreements for direct or indirect ownership of Class A Notes and Ordinary Shares.
Additionally, during the year ended December 31, 2015, AAA Investments (Co-Invest VII), L.P. (“Co-Invest VII”) contributed all of its ownershipinterest in MidCap Financial Holdings, LLC to MidCap in exchange for Class A Notes pursuant to a transfer agreement dated January 21, 2015. As a result ofthis contribution, Apollo, through its subsidiary AAA Associates (Co-Invest VII), L.P., the general partner of Co-Invest VII, realized $29.9 million of carriedinterest from Co-Invest VII, which Co-Invest VII settled with a payment of Class A Notes to AAA Associates (Co-Invest VII), L.P.
Apollo has recorded a $79.3 million equity method investment in MidCap as of December 31, 2015, which is reflected in Investments in theconsolidated statement of financial condition.
Regulated Entities
Apollo Global Securities, LLC (“AGS”) is a registered broker dealer with the SEC and is a member of the Financial Industry RegulatoryAuthority, subject to the minimum net capital requirements of the SEC. AGS was in compliance with these requirements at December 31, 2015. From time totime, this entity is involved in transactions with affiliates of Apollo, including portfolio companies of the funds Apollo manages, whereby AGS earnsunderwriting and transaction fees for its services.
Apollo Management International LLP, is authorized and regulated by the U.K. Financial Conduct Authority and as such is subject to the capitalrequirements of the U.K. Financial Conduct Authority. This entity has continuously operated in excess of these regulatory capital requirements.
Certain other of the Company’s U.S. and non-U.S. subsidiaries are subject to various regulations, including a number of U.S. entities that areregistered as investment advisors with the SEC. To the extent applicable, these entities have continuously operated in excess of any minimum regulatorycapital requirements.
- 194-

Table of ContentsAPOLLO GLOBAL MANAGEMENT, LLC
NOTES TO CONSOLIDATEDFINANCIAL STATEMENTS
(dollars in thousands, except share data, except where noted)
Interests in Consolidated Entities
The table below presents equity interests in Apollo’s consolidated, but not wholly-owned, subsidiaries and funds. Net income andcomprehensive income attributable to Non-Controlling Interests consisted of the following:
For the Year Ended December 31,
2015 2014 2013AAA(1) $ — $ (196,964) $ (331,504)Interest in management companies and a co-investment vehicle(2) (10,543) (13,186) (18,872)Other consolidated entities (10,821) (17,590) 43,357
Net (income) loss attributable to Non-Controlling Interests in consolidated entities (21,364) (227,740) (307,019)Net (income) loss attributable to Appropriated Partners’ Capital(3) — 70,729 (149,934)Net (income) loss attributable to Non-Controlling Interests in the Apollo OperatingGroup (194,634) (404,682) (1,257,650)
Net Income attributable to Non-Controlling Interests $ (215,998) $ (561,693) $ (1,714,603)Net income (loss) attributable to Appropriated Partners’ Capital(4) — (70,729) 149,934Other comprehensive (income) loss attributable to Non-Controlling Interests 7,020 591 (41)
Comprehensive Income Attributable to Non-Controlling Interests $ (208,978) $ (631,831) $ (1,564,710) (1) Reflects the Non-Controlling Interests in the net (income) loss of AAA and is calculated based on the Non-Controlling Interests ownership percentage in AAA as of
December 31, 2014 and 2013, which was approximately 97.5% and 97.4%, respectively. As of December 31, 2014 and 2013, Apollo owned approximately 2.5% and2.6% of AAA, respectively. AAA was deconsolidated effective January 1, 2015 as a result of the Company’s adoption of new accounting guidance, as described innote 2.
(2) Reflects the remaining interest held by certain individuals who receive an allocation of income from certain of our credit funds.(3) Reflects net income of the consolidated CLOs classified as VIEs.(4) Appropriated Partners’ Capital is included in total Apollo Global Management, LLC shareholders’ equity and is therefore not a component of comprehensive income
attributable to Non-Controlling Interests on the consolidated statements of comprehensive income.
16. COMMITMENTS AND CONTINGENCIES
Investment Commitments—As a limited partner, general partner and manager of the Apollo funds, Apollo has unfunded capital commitments asof December 31, 2015 and 2014 of $566.3 million and $646.6 million, respectively.
Apollo has an ongoing obligation to acquire additional common units of AAA in an amount equal to 25% of the aggregate after-tax cashdistributions, if any, that are made by AAA to Apollo’s affiliates pursuant to the carried interest distribution rights that are applicable to investments madethrough AAA Investments. In addition, on April 30, 2015, Apollo entered into a revolving credit agreement with AAA Investments (“AAA Investments CreditAgreement”). Under the terms of the AAA Investments Credit Agreement, the Company shall make available to AAA Investments one or more advances at thediscretion of AAA Investments in the aggregate amount not to exceed a balance of $10.0 million at an applicable rate of LIBOR plus 1.5%. The Companyreceives an annual commitment fee of 0.125% on the unused portion of the loan. As of December 31, 2015 no advance on the AAA Investments CreditAgreement has been made by the Company.
Debt Covenants—Apollo’s debt obligations contain various customary loan covenants. As of December 31, 2015, the Company was not aware ofany instances of non-compliance with the financial covenants contained in the documents governing the Company’s debt obligations.
Litigation and Contingencies—Apollo is, from time to time, party to various legal actions arising in the ordinary course of business includingclaims and lawsuits, reviews, investigations or proceedings by governmental and self regulatory agencies regarding its business.
In March 2012, plaintiffs filed two putative class actions, captioned Kelm v. Chase Bank (No. 12-cv-332) and Miller v. 1-800-Flowers.com, Inc.(No. 12-cv-396), in the District of Connecticut on behalf of a class of consumers alleging online fraud. The defendants included, among others, TrilegiantCorporation, Inc. (“Trilegiant”), its parent company, Affinion Group, LLC
- 195-

Table of ContentsAPOLLO GLOBAL MANAGEMENT, LLC
NOTES TO CONSOLIDATEDFINANCIAL STATEMENTS
(dollars in thousands, except share data, except where noted)
(“Affinion”), and Apollo Global Management, LLC (“AGM”), which is affiliated with funds that are the beneficial owners of 68% of Affinion’s commonstock. In both cases, plaintiffs allege that Trilegiant, aided by its business partners, who include e-merchants and credit card companies, developed a set ofbusiness practices intended to create consumer confusion and ultimately defraud consumers into unknowingly paying fees to clubs for unwanted services.Plaintiffs allege that AGM is a proper defendant because of its indirect stock ownership and ability to appoint the majority of Affinion’s board. Thecomplaints assert claims under the Racketeer Influenced Corrupt Organizations Act; the Electronic Communications Privacy Act; the Connecticut UnfairTrade Practices Act; and the California Business and Professional Code, and seek, among other things, restitution or disgorgement, injunctive relief,compensatory, treble and punitive damages, and attorneys’ fees. The allegations in Kelm and Miller are substantially similar to those in Schnabel v.Trilegiant Corp. (No. 3:10-cv-957), a putative class action filed in the District of Connecticut in 2010 that names only Trilegiant and Affinion as defendants.The court has consolidated the Kelm, Miller, and Schnabel cases under the caption In re: Trilegiant Corporation, Inc. and ordered that they proceed on thesame schedule. On June 18, 2012, the court appointed lead plaintiffs’ counsel, and on September 7, 2012, plaintiffs filed their consolidated amendedcomplaint (“CAC”), which alleges the same causes of action against AGM as did the complaints in the Kelm and Miller cases. Defendants filed motions todismiss on December 7, 2012, plaintiffs filed opposition papers on February 7, 2013, and defendants filed replies on April 5, 2013. On December 5, 2012,plaintiffs filed another putative class action, captioned Frank v. Trilegiant Corp. (No. 12- cv-1721), in the District of Connecticut, naming the samedefendants and containing allegations substantially similar to those in the CAC. On January 23, 2013, plaintiffs moved to transfer and consolidate Frank intoIn re: Trilegiant. On July 24, 2013 the Frank court transferred the case to Judge Bryant, who is presiding over In re: Trilegiant, and on March 28, 2014, JudgeBryant granted the motion to consolidate. On September 25, 2013, the court held oral argument on defendants’ motions to dismiss. On March 28, 2014, thecourt granted in part and denied in part motions to dismiss filed by Affinion and Trilegiant on behalf of all defendants, and also granted separate motions todismiss filed by certain defendants, including AGM. On that same day, the court directed the clerk to terminate AGM as a defendant in the consolidatedaction. The case is proceeding against several defendants, and so plaintiffs’ time to file their notice of appeal as to the dismissed defendants has not begunrunning.
Various state attorneys general and federal and state agencies have initiated industry-wide investigations into the use of placement agents inconnection with the solicitation of investments, particularly with respect to investments by public pension funds. Certain affiliates of Apollo have receivedsubpoenas and other requests for information from various government regulatory agencies and investors in Apollo’s funds, seeking information regardingthe use of placement agents. California Public Employees’ Retirement System (“CalPERS”), one of Apollo’s Strategic Investors, announced on October 14,2009, that it had initiated a special review of placement agents and related issues. The report of the CalPERS’ Special Review was issued on March 14, 2011.That report does not allege any wrongdoing on the part of Apollo or its affiliates. Apollo is continuing to cooperate with all such investigations and otherreviews. In addition, on May 6, 2010, the California Attorney General filed a civil complaint against Alfred Villalobos and his company, Arvco CapitalResearch, LLC (“Arvco”) (a placement agent that Apollo has used) and Federico Buenrostro Jr., the former CEO of CalPERS, alleging conduct in violation ofcertain California laws in connection with CalPERS’s purchase of securities in various funds managed by Apollo and another asset manager. Apollo is not aparty to the civil lawsuit and the lawsuit does not allege any misconduct on the part of Apollo. Likewise, on April 23, 2012, the SEC filed a lawsuit allegingsecurities fraud on the part of Arvco, as well as Messrs. Buenrostro and Villalobos, in connection with their activities concerning certain CalPERSinvestments in funds managed by Apollo. This lawsuit also does not allege wrongdoing on the part of Apollo, and alleges that Apollo was defrauded byArvco, Villalobos, and Buenrostro. On March 14, 2013, the United States Department of Justice unsealed an indictment against Messrs. Villalobos andBuenrostro alleging, among other crimes, fraud in connection with those same activities; again, Apollo is not accused of any wrongdoing and in fact isalleged to have been defrauded by the defendants. The criminal action was set for trial in a San Francisco federal court in July 2014, but was put on hold afterMr. Buenrostro pleaded guilty on July 11, 2014. As part of Mr. Buenrostro’s plea agreement, he admitted to taking cash and other bribes from Mr. Villalobosin exchange for several improprieties, including attempting to influence CalPERS’ investing decisions and improperly preparing disclosure letters to satisfyApollo’s requirements. There is no suggestion that Apollo was aware that Mr. Buenrostro had signed the letters with a corrupt motive. The government hasindicated that they will file new charges against Mr. Villalobos incorporating Mr. Buenrostro’s admissions. On August 7, 2014, the government filed asuperseding indictment against Mr. Villalobos asserting additional charges. Trial had been scheduled for February 23, 2015, but Mr. Villalobos passed awayon January 13, 2015. Additionally, on April 15, 2013, Mr. Villalobos, Arvco and related entities (the “Arvco Debtors”) brought a civil action in the UnitedStates Bankruptcy Court for the District of Nevada (the “Bankruptcy Court”) against Apollo. The action is related to the ongoing bankruptcy proceedings ofthe Arvco Debtors. This action alleges that Arvco served as a placement agent for Apollo in connection with several funds associated with Apollo, and seeksto recover purported fees the Arvco Debtors claim Apollo has not paid them for a portion of Arvco’s placement agent services. In addition, the Arvco Debtorsallege that Apollo has interfered with the Arvco Debtors’ commercial relationships with third parties, purportedly causing the Arvco Debtors to lose businessand to incur fees and expenses in the defense of various investigations and litigations. The Arvco Debtors also seek
- 196-

Table of ContentsAPOLLO GLOBAL MANAGEMENT, LLC
NOTES TO CONSOLIDATEDFINANCIAL STATEMENTS
(dollars in thousands, except share data, except where noted)
compensation from Apollo for these alleged lost profits and fees and expenses. The Arvco Debtors’ complaint asserts various theories of recovery under theBankruptcy Code and common law. Apollo denies the merit of all of the Arvco Debtors’ claims and will vigorously contest them. The Bankruptcy Court hadstayed this action pending the result in the criminal case against Mr. Villalobos but lifted the stay on May 1, 2015; in light of Mr. Villalobos’s death, thecriminal case was dismissed. For these reasons, no estimate of possible loss, if any, can be made at this time.
On June 18, 2014, BOKF N.A. (the “First Lien Trustee”), the successor indenture trustee under the indenture governing the First Lien Notesissued by Momentive Performance Materials, Inc. (“Momentive”), commenced a lawsuit in the Supreme Court for the State of New York, New York Countyagainst AGM and members of an ad hoc group of Second Lien Noteholders (including, but not limited to, Euro VI (BC) S.a.r.l.). The First Lien Trusteeamended its complaint on July 2, 2014 (the “First Lien Intercreditor Action”). In the First Lien Intercreditor Action, the First Lien Trustee seeks, among otherthings, a declaration that the defendants violated an intercreditor agreement entered into between holders of the First Lien Notes and holders of the secondlien notes. On July 16, 2014, the successor indenture trustee under the indenture governing the 1.5 Lien Notes (the “1.5 Lien Trustee,” and, together with theFirst Lien Trustee, the “Indenture Trustees”) filed an action in the Supreme Court of the State of New York, New York County that is substantially similar tothe First Lien Intercreditor Action (the “1.5 Lien Intercreditor Action,” and, together with the First Lien Intercreditor Action, the “Intercreditor Actions”).AGM subsequently removed the Intercreditor Actions to federal district court, and the Intercreditor Actions were automatically referred to the BankruptcyCourt adjudicating the Momentive chapter 11 bankruptcy cases. The Indenture Trustees then filed motions with the Bankruptcy Court to remand theIntercreditor Actions back to the state court (the “Remand Motions”). On September 9, 2014, the Bankruptcy Court denied the Remand Motions. On August15, 2014, the defendants in the Intercreditor Actions (including AGM) filed a motion to dismiss the 1.5 Lien Intercreditor Action and a motion for judgmenton the pleadings in the First Lien Intercreditor Action (the “Dismissal Motions”). On September 30, 2014, the Bankruptcy Court granted the DismissalMotions. In its order granting the Dismissal Motions, the Bankruptcy Court gave the Indenture Trustees until mid-November 2014 to move to amend some,but not all, of the claims alleged in their respective complaints. On November 14, 2014, the Indenture Trustees moved to amend their respective complaintspursuant to the Bankruptcy Court’s order (the “Motions to Amend”). On January 9, 2015, the defendants filed their oppositions to the Motions to Amend. OnJanuary 16, 2015, the Bankruptcy Court denied the Motions to Amend (the “Dismissal Order”), but gave the Indenture Trustees until March 2, 2015 to seekto amend their respective complaints. On March 2, 2015, the First Lien Trustee filed a motion seeking to amend its complaint. On April 10, 2015, thedefendants, including AGM and Euro VI (BC) S.a.r.l., filed an opposition to the First Lien Trustee’s motion to amend. Instead of moving again to amend itscomplaint, the 1.5 Lien Trustee chose to appeal the Dismissal Order (the “1.5 Lien Appeal”). On March 30, 2015, the 1.5 Lien Trustee filed its Statement ofIssues and Designation of Record on Appeal. On March 31, 2015, because the legal issues presented in the 1.5 Lien Appeal are substantially similar to thosepresented in the First Lien Intercreditor Action, the parties in the 1.5 Lien Appeal submitted a joint stipulation and proposed order to the District Courtstaying the briefing schedule on the 1.5 Lien Appeal pending the outcome of the First Lien Trustee’s most recent motion to amend. On April 13, 2015, theDefendants filed their Counter-Designation of the Record on Appeal in the 1.5 Lien Appeal. On May 8, 2015, the Bankruptcy Court denied the motion toamend filed on March 2, 2015 by the First Lien Trustee. On May 27, 2015, the First Lien Trustee filed a notice of appeal from the orders of the BankruptcyCourt dismissing the First Lien Intercreditor Action and denying the First Lien Trustee’s motions to amend (the “First Lien Appeal”). On June 2, 2015, theFirst Lien Trustee filed its Statement of Issues and Designation of Record on Appeal. On June 24, 2015, the defendants filed their Counter-Designation of theRecord on Appeal in the First Lien Appeal. On July 31, 2015, the 1.5 Lien Trustee sent a letter to the federal district court hearing the 1.5 Lien Appeal askingthe court to consolidate the 1.5 Lien Appeal with the First Lien Appeal which had been assigned to a different judge (the “Consolidation Request”). OnAugust 4, 2015, the First Lien Trustee asked the federal district court hearing the First Lien Appeal to stay all further proceedings in the First Lien Appealuntil the court hearing the 1.5 Lien Appeal decided whether to consolidate the First Lien Appeal with the 1.5 Lien Appeal. On August 5, 2015, the courtgranted the First Lien Trustee’s request to stay the First Lien Appeal pending the other court’s decision on whether to consolidate the First Lien Appeal withthe 1.5 Lien Appeal. As a result of the Consolidation Request, the 1.5 Lien Trustee has taken the position that the 1.5 Lien Appeal has also been stayed, andtherefore no briefs have been filed in either the First Lien Appeal or the 1.5 Lien Appeal. On November 16, 2015, the 1.5 Lien Trustee filed its motion insupport of the Consolidation Request. On December 16, 2015, the defendants filed a statement of No Objection to the Consolidation Request. Apollo isunable at this time to assess a potential risk of loss. In addition, Apollo does not believe that AGM is a proper defendant in these actions.
On June 13, 2014, plaintiffs Stark Master Fund Ltd and Stark Global Opportunities Master Fund Ltd filed a lawsuit in the United States DistrictCourt for the Eastern District of Wisconsin against AGM and Apollo Management Holdings, (the “Apollo Defendants”), as well as Credit Suisse Securities(USA) LLC and Deutsche Bank Securities (USA) LLC (the “Bank Defendants”). The complaint alleges that the Apollo Defendants and the other defendantsentered into an undisclosed and improper
- 197-

Table of ContentsAPOLLO GLOBAL MANAGEMENT, LLC
NOTES TO CONSOLIDATEDFINANCIAL STATEMENTS
(dollars in thousands, except share data, except where noted)
agreement concerning the financing of a potential acquisition of Hexion Specialty Chemicals Inc., and on this basis alleges a variety of common lawmisrepresentation claims, both intentional and negligent. The Apollo Defendants and Bank Defendants filed motions to dismiss the complaint on October 15,2014. Rather than respond to the motions, plaintiffs filed an Amended Complaint on November 5, 2014. The Apollo Defendants and Bank Defendants filedmotions to dismiss the Amended Complaint on December 23, 2014. Plaintiffs filed a motion for leave to conduct jurisdictional discovery on February 2,2015. On April 9, 2015, the Court issued an order granting plaintiffs’ motion for leave to conduct limited jurisdictional discovery. Pursuant to the parties’stipulation approved by the Court, Plaintiffs must file their opposition to Defendants’ motion to dismiss the Amended Complaint on or before 30 daysfollowing the close of jurisdictional discovery. Because the claims against the Apollo Defendants are in their early stages, no reasonable estimate of possibleloss, if any, can be made at this time.
There are several pending actions concerning transactions related to Caesars Entertainment Operating Company, Inc.’s (“CEOC”) restructuring efforts. Apollo is not a defendant in these matters.
• In re: Caesars Entertainment Operating Company, Inc. bankruptcy proceedings, No. 15-10047 (Del. Bankr.) (the “DelawareBankruptcy Action”) and No. 15-01145 (N.D. Ill. Bankr.) (the “Illinois Bankruptcy Action”). On January 12, 2015, threeholders of CEOC second lien notes filed an involuntary bankruptcy petition against CEOC in the United States BankruptcyCourt for the District of Delaware. On January 15, 2015, CEOC and certain of its affiliates (collectively the “Debtors”) filed forChapter 11 bankruptcy in the Northern District of Illinois. On February 2, 2015, the court in the Delaware Bankruptcy Actionordered that all bankruptcy proceedings relating to the Debtors should take place in the Illinois Bankruptcy Action. On March11, 2015, the Debtors filed an adversary complaint in the Illinois Bankruptcy Action to stay, pending resolution of thebankruptcy, the Trustee, Meehancombs, Danner, and BOKF Actions described below. On June 3-4, 2015, the court held anevidentiary hearing on the Debtors’ stay request. On July 22, 2015, the court denied the Debtors’ stay request (the “StayDenial”). On October 8, 2015, the United States District Court for the Northern District of Illinois (No. 15-06504 (N.D. Ill.))affirmed the Stay Denial, and the Debtors filed an appeal to the United States Court of Appeals for the Seventh Circuit (No. 15-3259 (7th Cir.)). On December 23, 2015, the Seventh Circuit vacated the lower court opinions denying the injunction andremanded the dispute to the Bankruptcy Court for further proceedings. On January 11, 2016, the CEOC noteholders submitteda petition for rehearing before the Seventh Circuit en banc. The Seventh Circuit denied the petition, and on February 26, 2016,the Bankruptcy Court granted the stay request as to the BOKF Action until the sooner of 60 days after the Examiner releases hisreport or May 9, 2016. The Bankruptcy Court continued consideration of the stay request as to the other proceedings, andscheduled a stauts hearing for May 4, 2016. Separately, the Bankruptcy Court held an evidentiary hearing to determine whetherthe Debtors’ petition date was January 12, 2015 or January 15, 2015. The Bankruptcy Court has indicated that it will decidethat issue on March 16, 2016. Certain of the Debtors’ creditors have indicated in filings with the Illinois bankruptcy court thatan investigation into certain acts and transactions that predated the Debtors’ bankruptcy filing could lead to claims against anumber of parties, including Apollo. To date, no such claims have been brought against Apollo.
• Wilmington Savings Fund Society, FSB v. Caesars Entertainment Corp. et al., No. 10004-CVG (Del. Ch.) (the “TrusteeAction”). On August 4, 2014, Wilmington Savings Fund Society, FSB (“WSFS”), as trustee for certain CEOC second-liennotes, sued Caesars Entertainment Corporation (“Caesars Entertainment”), CEOC, other Caesars Entertainment-affiliatedentities, and certain of Caesars Entertainment’s directors, including Marc Rowan, Eric Press, David Sambur (each an ApolloPartner) and Jeff Benjamin (a consultant to Apollo), in Delaware’s Court of Chancery. WSFS (i) asserts claims (against some orall of the defendants) for fraudulent conveyance, breach of fiduciary duty, breach of contract, corporate waste and aiding andabetting related to certain transactions among CEOC and other Caesars Entertainment affiliates, and (ii) requests (among otherthings) that the court unwind the challenged transactions and award damages. WSFS served a subpoena for documents onApollo on September 11, 2014, but Apollo’s response was stayed during the pendency of motions to dismiss under a September23, 2014 stipulated order. On March 18, 2015, the Court denied Defendants’ motion to dismiss. Apollo served responses andobjections to the Trustee’s subpoena on March 25, 2015. Caesars Entertainment answered the complaint on April 1, 2015.
- 198-

Table of ContentsAPOLLO GLOBAL MANAGEMENT, LLC
NOTES TO CONSOLIDATEDFINANCIAL STATEMENTS
(dollars in thousands, except share data, except where noted)
During the pendency of CEOC’s bankruptcy proceedings, the Trustee Action has been automatically stayed with respect toCEOC. WSFS additionally advised the bankruptcy court that, during CEOC’s bankruptcy proceedings, the Trustee would onlypursue claims in the Trustee Action relating to whether Caesars Entertainment remains liable on a guarantee of certain ofCEOC’s second priority notes. On July 17, 2015, WSFS served supplemental subpoenas to several entities affiliated withApollo. Apollo has substantially completed its production of non-privileged documents responsive to those subpoenas.
• Meehancombs Global Credit Opportunities Master Fund, L.P., et al. v. Caesars Entertainment Corp., et al., No. 14-cv-7091(S.D.N.Y.) (the “Meehancombs Action”). On September 3, 2014, institutional investors allegedly holding approximately $137million in CEOC unsecured senior notes sued CEOC and Caesars Entertainment for breach of contract and the impliedcovenant of good faith, Trust Indenture Act (“TIA”) violations and a declaratory judgment challenging the August 2014private financing transaction in which a portion of outstanding senior unsecured notes were purchased by CaesarsEntertainment, and a majority of the noteholders agreed to amend the indenture to terminate Caesars Entertainment’s guaranteeof the notes and modify certain restrictions on CEOC’s ability to sell assets. Caesars Entertainment and CEOC filed a motion todismiss on November 12, 2014. On January 15, 2015, the court granted the motion with respect to a TIA claim byMeehancombs but otherwise denied the motion. On January 30, 2015, plaintiffs filed an amended complaint seeking reliefagainst Caesars Entertainment only, and Caesars Entertainment answered on February 12, 2015. On October 2, 2014, a relatedputative class action complaint was filed on behalf of the holders of these notes captioned Danner v. Caesars EntertainmentCorp., et al., No. 14-cv-7973 (S.D.N.Y.) (the “Danner Action”), against Caesars Entertainment alleging claims similar to those inthe Meehancombs Action. On February 19, 2015, plaintiffs filed an amended complaint, and Caesars Entertainment answeredthe amended complaint on February 25, 2015. In March 2015, each of Meehancombs and Danner served subpoenas fordocuments on Apollo. Apollo produced responsive, non-privileged documents in response to those subpoenas. In July 2015,Meehancombs and Danner served subpoenas for depositions on Apollo and those depositions were completed on September22, 2015. On October 23, 2015, Meehancombs and Danner filed motions for partial summary judgment, related to TIA andbreach of contract claims. On December 29, 2015, the court denied the motions for partial summary judgment. The parties arecurrently engaged in expert discovery. Trial in the Meehancombs and Danner Actions is scheduled to begin May 9, 2016.
• UMB Bank v. Caesars Entertainment Corporation, et al., No. 10393 (Del. Ch.) (the “UMB Action”). On November 25, 2014,UMB Bank, as trustee for certain CEOC notes, sued Caesars Entertainment, CEOC, other Caesars Entertainment-affiliatedentities, and certain of Caesars Entertainment’s directors, including Marc Rowan, Eric Press, David Sambur (each an ApolloPartner) and Jeffrey Benjamin (an Apollo consultant), in Delaware Chancery Court. The lawsuit alleges claims for actual andconstructive fraudulent conveyance and transfer, insider preferences, illegal dividends, breach of contract, intentionalinterference with contractual relations, breach of fiduciary duty, aiding and abetting breach of fiduciary duty, usurpation ofcorporate opportunities, and unjust enrichment. The UMB Action seeks appointment of a receiver for CEOC, a constructivetrust, and other relief. The UMB Action has been assigned to the same judge overseeing the Trustee Action. Upon filing thecomplaint, UMB Bank moved to expedite its claim, seeking a receiver, on which the court held oral argument on December 17,2014. On January 15, 2015, the court entered a stipulated order staying the UMB Action as to all parties due to CEOC’sbankruptcy filing.
• Koskie v. Caesars Acquisition Company, et al., No. A-14-711712-C (Clark Cnty Nev. Dist. Ct.) (the “Koskie Action”). OnDecember 30, 2014, Nicholas Koskie brought a shareholder class action on behalf of shareholders of Caesars AcquisitionCompany (“CAC”) against CAC, Caesars Entertainment, and members of CAC’s Board of Directors, including Marc Rowan andDavid Sambur (each an Apollo partner). The lawsuit challenges CAC and Caesars Entertainment’s plan to merge, alleging thatthe proposed transaction will not give CAC shareholders fair value. Koskie asserts claims for breach of fiduciary duty relatingto the director defendants’ interrelationships with
- 199-

Table of ContentsAPOLLO GLOBAL MANAGEMENT, LLC
NOTES TO CONSOLIDATEDFINANCIAL STATEMENTS
(dollars in thousands, except share data, except where noted)
the entities involved the proposed transaction. The deadline for CAC to respond to this lawsuit has been adjourned indefinitelyby agreement of the parties.
• BOKF, N.A. v. Caesars Entertainment Corporation, No. 15-156 (S.D.N.Y) (the “BOKF Action”). On March 3, 2015, BOKF, N.A.,as trustee for certain CEOC notes, sued Caesars Entertainment in the Southern District of New York. The lawsuit alleges claimsfor breach of contract, intentional interference with contractual relations and a declaratory judgment, and seeks to enforceCaesars Entertainment’s guarantee of certain CEOC notes. The BOKF Action has been assigned to the same judge as theMeehancombs and Danner Actions. On March 25, 2015, Caesars Entertainment filed an answer to the complaint. On May 19,2015, BOKF sent the court a letter requesting permission to file a partial summary judgment motion on Counts II and V of itscomplaint, related to the validity and enforceability of Caesars Entertainment’s guarantee of certain notes issued by CEOC andalleged violations of the Trust Indenture Act, 15 U.S.C. §§ 76aaa, et seq. The Meehancombs and Danner plaintiffs did not joinBOKF’s request to file for partial summary judgment. On May 28, 2015, the court granted BOKF permission to move for partialsummary judgment. On June 15, 2015, another related complaint captioned UMB Bank, N.A. v. Caesars Entertainment Corp., etal., No. 15-cv-4634 (S.D.N.Y.) (the “UMB SDNY Action”) was filed by UMB Bank, N.A., solely in its capacity as IndentureTrustee of certain first lien notes (“UMB”), against Caesars Entertainment alleging claims similar to those alleged in the BOKF,Meehancombs and Danner Actions. On June 16, 2015, UMB sent a letter to the court requesting permission to file a partialsummary judgment motion on the same schedule with BOKF. On June 26, 2015, BOKF and UMB filed partial summaryjudgment motions (the “Partial Summary Judgment Motions”). On July 24, 2015, Caesars Entertainment filed its opposition tothe Partial Summary Judgment Motions, and on August 7, 2015, BOKF and UMB filed reply briefs in further support of thePartial Summary Judgment Motions. On August 27, 2015, the Court denied the Partial Summary Judgment Motions andcertified its opinion for an interlocutory appeal to the United States Court of Appeals for the Second Circuit. On December 22,2015, the Second Circuit declined to hear the interlocutory appeal. Separately, on November 20, 2015, BOKF and UMB filed asecond set of motions for partial summary judgment, on the issue of the disputed contract interpretation related to indenturerelease provisions. On January 5, 2016 the District Court denied these motions. At a hearing on February 22, 2015, the Courtbifurcated the trial in the BOKF and UMB Actions and scheduled the trial on the breach of contract and TIA claims to begin onMarch 14, 2016. The Court ordered a separate trial on the claims for breach of the covenant of good faith and fair dealing andtortious interference with contract to begin at a later date to be determined. On February 24, 2016, Caesars Entertainment filed amotion for partial summary judgment to dispose of the claims for (1) breach of the implied covenant of good faith and fairdealing brought by BOKF and UMB, and (2) intentional interference with contractual relations brought by BOKF. Theplaintiffs’ responses are due on March 23, 2016, and Caesars Entertainment’s reply is due on April 1, 2016. Separately, onOctober 20, 2015, another related complaint captioned Wilmington Trust, National Association v. Caesars Entertainment Corp.,No. 15-cv-08280 (S.D.N.Y.) (the “Wilmington Trust Action”) was filed by Wilmington Trust, N.A., solely in its capacity asIndenture Trustee for the 10.75% Notes due 2016 (“Wilmington Trust”), against Caesars Entertainment alleging claims similarto those alleged in the BOKF, UMB, Meehancombs, and Danner Actions. The Wilmington Trust Action has been referred to thesame judge as the other Southern District of New York litigations.
• Apollo believes that the claims in the Trustee Action, the UMB Action, the Meehancombs Action, the Danner Action, theKoskie Action, the BOKF Action, the UMB SDNY Action, and the Wilmington Trust Action are without merit. For this reason,and because of pending bankruptcy proceedings involving CEOC, no reasonable estimate of possible loss, if any, can be madeat this time.
Following the January 16, 2014 announcement that CEC Entertainment, Inc. (“CEC”) had entered into a merger agreement with certain entitiesaffiliated with Apollo (the “Merger Agreement”), four putative shareholder class actions were filed in the District Court of Shawnee County, Kansas on behalfof purported stockholders of CEC against, among others, CEC, its directors and Apollo and certain of its affiliates, which include Queso Holdings Inc., QMerger Sub Inc., Apollo Management VIII, L.P., and AP VIII Queso Holdings, L.P. The first purported class action, which is captioned Hilary Coyne v.Richard M. Frank et
- 200-

Table of ContentsAPOLLO GLOBAL MANAGEMENT, LLC
NOTES TO CONSOLIDATEDFINANCIAL STATEMENTS
(dollars in thousands, except share data, except where noted)
al., Case No. 14C57, was filed on January 21, 2014 (the “Coyne Action”). The second purported class action, which was captioned John Solak v. CECEntertainment, Inc. et al., Civil Action No. 14C55, was filed on January 22, 2014 (the “Solak Action”). The Solak Action was dismissed for lack ofprosecution on October 14, 2014. The third purported class action, which is captioned Irene Dixon v. CEC Entertainment, Inc. et al., Case No. 14C81, wasfiled on January 24, 2014 and additionally names as defendants Apollo Management VIII, L.P. and AP VIII Queso Holdings, L.P. (the “Dixon Action”). Thefourth purported class action, which is captioned Louisiana Municipal Public Employees’ Retirement System v. Frank, et al., Case No. 14C97, was filed onJanuary 31, 2014 (the “LMPERS Action”) (together with the Coyne and Dixon Actions, the “Shareholder Actions”). A fifth purported class action, which wascaptioned McCullough v. Frank, et al., Case No. CC-14-00622-B, was filed in the County Court of Dallas County, Texas on February 7, 2014. This actionwas dismissed for want of prosecution on May 21, 2014. Each of the Shareholder Actions alleges, among other things, that CEC’s directors breached theirfiduciary duties to CEC’s stockholders in connection with their consideration and approval of the Merger Agreement, including by agreeing to an inadequateprice, agreeing to impermissible deal protection devices, and filing materially deficient disclosures regarding the transaction. Each of the ShareholderActions further alleges that Apollo and certain of its affiliates aided and abetted those alleged breaches. As filed, the Shareholder Actions seek, among otherthings, rescission of the various transactions associated with the merger, damages and attorneys’ and experts’ fees and costs. On February 7, 2014 andFebruary 11, 2014, the plaintiffs in the Shareholder Actions pursued a consolidated action for damages after the transaction closed. Thereafter, theShareholder Actions were consolidated under the caption In re CEC Entertainment, Inc. Stockholder Litigation, Case No. 14C57, and the parties engaged inlimited discovery. On July 21, 2015, a consolidated class action complaint was brought by Twin City Pipe Trades Pension Trust in the Shareholder Actionsthat did not name as defendants Apollo, Queso Holdings Inc., Q Merger Sub Inc., Apollo Management VIII, L.P., or AP VIII Queso Holdings, L.P., continuedto assert claims against CEC and its former directors, and added The Goldman Sachs Group Inc. (“Goldman Sachs”) as a defendant. The consolidatedcomplaint alleges, among other things, that CEC’s former directors breached their fiduciary duties to CEC’s stockholders by conducting a deficient salesprocess, agreeing to impermissible deal protection devices, and filing materially deficient disclosures regarding the transaction. It further alleges that twomembers of the board who also served as the senior managers of the company had material conflicts of interest and that Goldman Sachs aided and abetted theboard’s breaches as a result of various conflicts of interest facing the bank. The consolidated complaint seeks, among other things, to recover damages,attorneys’ fees and costs. On October 22, 2015, the parties to the consolidated action moved to dismiss the complaint. Although Apollo cannot predict theultimate outcome of the consolidated action, and therefore no reasonable estimate of possible loss, if any, can be made at this time, Apollo believes that suchaction is without merit.
On June 10, 2014, Magnetar Global Event Driven Fund Ltd., Spectrum Opportunities Master Fund, Ltd., Magnetar Capital Master Fund, Ltd., andBlackwell Partners LLC, as the purported beneficial owners of shares held as of record by the nominal petitioner Cede & Co., (the “Appraisal Petitioners”),filed an action for statutory appraisal under Kansas state law against CEC in the U.S. District Court for the District of Kansas, captioned Magnetar GlobalEvent Driven Master Fund Ltd, et al. v. CEC Entertainment, Inc., 2:14-cv-02279-RDR-KGS. The Appraisal Petitioners seek appraisal of 750,000 shares ofcommon stock. CEC has answered the complaint and filed a verified list of stockholders, as required under Kansas law. On September 3, 2014, the courtentered a scheduling order that contemplated that discovery would commence in the fall of 2014 and would be substantially completed by May 2015. OnJanuary 13, 2015, the court entered a revised scheduling order that contemplated that fact discovery would be completed by March 13, 2015, expertdiscovery would be completed by June 15, 2015. On June 25, 2015, the court entered an order requiring the Appraisal Petitioners to produce additionaldocuments to CEC. On June 29, 2015, the court held a pretrial conference. Following this conference, on June 30, 2015, the court entered a pretrial order. OnDecember 11, 2015, the court scheduled a trial to begin on February 16, 2016. After executing a settlement agreement to resolve the Appraisal Petitioners’claims, on February 4, 2016, the court entered an order dismissing the action with prejudice.
On June 12, 2015, a putative class action was commenced in the United States District Court for the Northern District of California by RachelSilva and Don Hudson, on behalf of themselves and all others similarly situated, against Aviva plc; Athene Annuity and Life Company f/k/a Aviva Life andAnnuity Company (“Aviva”); Athene USA Corporation f/k/a Aviva USA Corporation; Athene Holding; Athene Life Re Ltd.; Athene Asset Management; andAGM. The complaint in this action alleges violations of the Racketeer Influenced and Corrupt Organizations Act, 18 U.S.C. Sections 1962(c) and (d). Theplaintiffs allege that commencing in 2007 and continuing thereafter, Aviva and its then management engaged in a scheme to, among other things, falselyrepresent the financial strength of and hide the true financial condition of Aviva by, among other things, allegedly ceding risky liabilities to Aviva’sundercapitalized subsidiaries and affiliates, misvaluing assets, and failing to make required disclosures to purchasers of policies, and that after AtheneHolding purchased all of the outstanding stock of Aviva’s parent effective October 2, 2013 the scheme was unwound and rewound so as to continue, and thatas a result thereof some of the purchasers of annuity products issued by Aviva were charged an excessive price and were damaged as a result thereof. Alldefendants (except Aviva plc) have (a) moved to transfer this action to the United States District Court for the Southern District of Iowa and (b) moved todismiss
- 201-

Table of ContentsAPOLLO GLOBAL MANAGEMENT, LLC
NOTES TO CONSOLIDATEDFINANCIAL STATEMENTS
(dollars in thousands, except share data, except where noted)
this action. Aviva plc separately moved to dismiss the action for lack of jurisdiction over it. All of these motions were heard by the Court on December 15,2015, and the Court reserved decisions. In connection with these motions, the plaintiffs served discovery requests limited to the motion to transfer and Avivaplc’s motion to dismiss for lack of jurisdiction. If the action is not dismissed, Athene Asset Management and AGM (and the other defendants) will deny thematerial allegations of the complaint and will vigorously defend themselves against these claims. Although neither Athene Asset Management nor AGM canpredict the ultimate outcome of this action, each believes that it is without merit, and because this action is in its early stages, no reasonable estimate ofpossible loss, if any, can be made at this time.
Following the June 1, 2015 announcement that OM Group, Inc. (“OM Group”) had entered into a merger agreement (the “OM Group MergerAgreement”) with certain entities affiliated with AGM and an entity affiliated with Platform Specialty Products Corporation (“PSP”), six putative classactions were filed in the Court of Chancery of the State of Delaware on behalf of purported OM Group stockholders against certain current and former OMGroup directors, the merger entities affiliated with AGM, which include Duke Acquisition Holdings, LLC and Duke Acquisition, Inc. (together with AGM,the “Apollo Parties”), and, except in one action, the merger entity affiliated with PSP, MacDermid Americas Acquisitions Inc. (together with PSP, the “PSPParties”). AGM, PSP, and OM Group were also named as defendants in some of these putative class actions. On July 16, 2015, these six actions wereconsolidated into a putative class action captioned In re OM Group Inc. Stockholders Litigation, Consol. Case No. 11216-VCN (the “Consolidated Action”).The plaintiffs in the Consolidated Action subsequently designated the complaint previously filed in the action captioned City of Sarasota Firefighters’Pension Fund v. Apollo Global Management, LLC, Case No. 11249-VCN as the Consolidated Action’s operative complaint. That complaint challenges,among other things, the OM Group Merger Agreement and the transactions contemplated thereby, alleging, among other things, that OM Group’s directorsbreached their fiduciary duties to OM Group stockholders by engaging in a flawed sales process, agreeing to a price that does not adequately compensate OMGroup stockholders, agreeing to certain unfair deal protection terms in the OM Group Merger Agreement and by failing to disclose material information toOM Group stockholders. The complaint also alleges that the Apollo Parties and the PSP Parties aided and abetted these alleged breaches of fiduciary duty.The complaint seeks various remedies, including declaratory relief and preliminary and permanent injunctive relief. While plaintiffs had declared their intentto pursue preliminary injunctive relief, and a hearing had been scheduled for August 6, plaintiffs dropped that request on August 2, 2015. The court has notyet set a schedule for resolving the case on the merits. Because this action is in its early stages, no reasonable estimate of possible loss, if any, can be made.Apollo believes that the allegations in the complaint are without merit and intends to vigorously defend the Consolidated Action.
On January 26, 2016, Verso Corporation and its subsidiaries (“Verso”), a portfolio company of certain of our private equity funds, filed forbankruptcy protection under Chapter 11 in the United States Bankruptcy Court for the District of Delaware. In connection with the bankruptcy filing, Versoentered into a debtor-in-possession financing package totaling $775 million.
As has been reported in the press, the SEC has focused recently on the disclosure to limited partners of the acceleration of certain special fees. TheCompany provided information about this topic to the staff of the SEC in connection with the SEC’s periodic examination of the Company in 2013. TheCompany recently received an informal request for additional information from the staff of the SEC on this topic and certain ancillary issues. The Company isfully and voluntarily cooperating with the informal requests and is in discussions with the SEC regarding a potential resolution of these matters. As ofDecember 31, 2015, the Company accrued a $45.0 million legal reserve in connection with these matters.
The Company received an informal request for information from the staff of the SEC concerning the use of designated lender counsel with respectto financing buyout transactions, an issue recently covered in the press. The Company is fully cooperating with the SEC’s request for information.
Although the ultimate outcome of these matters cannot be ascertained at this time, Apollo is of the opinion, after consultation with counsel, thatthe resolution of any such matters to which it is a party at this time will not have a material adverse effect on the consolidated financial statements. Legalactions material to Apollo could, however, arise in the future.
Commitments—Apollo leases office space and certain office equipment under various lease and sublease arrangements, which expire on variousdates through 2024. As these leases expire, it can be expected that in the normal course of business, they will be renewed or replaced. Certain leaseagreements contain renewal options, rent escalation provisions based on certain costs incurred by the landlord or other inducements provided by thelandlord. Rent expense is accrued to recognize lease escalation provisions and inducements provided by the landlord, if any, on a straight-line basis over thelease term and renewal periods where applicable. Apollo has entered into various operating lease service agreements in respect of certain assets.
- 202-

Table of ContentsAPOLLO GLOBAL MANAGEMENT, LLC
NOTES TO CONSOLIDATEDFINANCIAL STATEMENTS
(dollars in thousands, except share data, except where noted)
As of December 31, 2015, the approximate aggregate minimum future payments required for operating leases were as follows:
2016 2017 2018 2019 2020 Thereafter TotalAggregate minimum futurepayments $ 37,812 $ 35,871 $ 31,207 $ 30,641 $ 14,159 $ 10,817 $ 160,507
Expenses related to non-cancellable contractual obligations for premises, equipment, auto and other assets were $41.9 million, $42.5 million and$42.0 million for the years ended December 31, 2015, 2014 and 2013, respectively.
Other Long-term Obligations—These obligations relate to payments with respect to certain consulting agreements entered into by ApolloInvestment Consulting LLC, a subsidiary of Apollo, as well as long-term service contracts. A significant portion of these costs are reimbursable by funds orportfolio companies. As of December 31, 2015, fixed and determinable payments due in connection with these obligations were as follows:
2016 2017 2018 2019 2020 Thereafter TotalOther long-term obligations $ 10,594 $ 5,282 $ 4,908 $ 2,329 $ — $ — $ 23,113
Contingent Obligations—Carried interest income with respect to private equity funds and certain credit and real estate funds is subject to reversalin the event of future losses to the extent of the cumulative carried interest recognized in income to date. If all of the existing investments became worthless,the amount of cumulative revenues that have been recognized by Apollo through December 31, 2015 and that would be reversed approximates $2.4 billion.Management views the possibility of all of the investments becoming worthless as remote. Carried interest income is affected by changes in the fair values ofthe underlying investments in the funds that Apollo manages. Valuations, on an unrealized basis, can be significantly affected by a variety of external factorsincluding, but not limited to, bond yields and industry trading multiples. Movements in these items can affect valuations quarter to quarter even if theunderlying business fundamentals remain stable.
Additionally, at the end of the life of certain funds that the Company manages, there could be a payment due to a fund by the Company if theCompany, as general partner, has received more carried interest income than was ultimately earned. The general partner obligation amount, if any, willdepend on final realized values of investments at the end of the life of each fund or as otherwise set forth in the respective limited partnership agreement ofthe fund. See note 15 to our consolidated financial statements for further detail regarding the general partner obligation.
Certain funds may not generate carried interest income as a result of unrealized and realized losses that are recognized in the current and priorreporting period. In certain cases, carried interest income will not be generated until additional unrealized and realized gains occur. Any appreciation wouldfirst cover the deductions for invested capital, unreturned organizational expenses, operating expenses, management fees and priority returns based on theterms of the respective fund agreements.
One of the Company’s subsidiaries, AGS, provides underwriting commitments in connection with securities offerings to the portfolio companiesof the funds Apollo manages. As of December 31, 2015, there were no underwriting commitments outstanding related to such offerings.
Contingent Consideration
In connection with the acquisition of Stone Tower in April 2012, the Company agreed to pay the former owners of Stone Tower a specifiedpercentage of any future carried interest income earned from certain of the Stone Tower funds, CLOs, and strategic investment accounts. This contingentconsideration liability was determined based on the present value of estimated future carried interest payments, and is recorded in profit sharing payable inthe consolidated statements of financial condition. The fair value of the remaining contingent obligation was $70.9 million and $84.5 million as ofDecember 31, 2015 and 2014, respectively.
In connection with the Gulf Stream acquisition, the Company agreed to make payments to the former owners of Gulf Stream under a contingentconsideration obligation which required the Company to transfer cash to the former owners of Gulf Stream based on a specified percentage of carried interestincome. The contingent liability had a fair value of $8.7 million and
- 203-

Table of ContentsAPOLLO GLOBAL MANAGEMENT, LLC
NOTES TO CONSOLIDATEDFINANCIAL STATEMENTS
(dollars in thousands, except share data, except where noted)
$11.6 million as of December 31, 2015 and 2014, respectively, which was recorded in profit sharing payable in the consolidated statements of financialcondition.
The contingent consideration obligations will be remeasured to fair value at each reporting period until the obligations are satisfied. The changesin the fair value of the contingent consideration obligations is reflected in profit sharing expense in the consolidated statements of operations.
The contingent consideration obligations are measured at fair value and are characterized as Level III liabilities. See note 6 for furtherinformation regarding fair value measurements.
17. MARKET AND CREDIT RISK
In the normal course of business, Apollo encounters market and credit risk concentrations. Market risk reflects changes in the value ofinvestments due to changes in interest rates, credit spreads or other market factors. Credit risk includes the risk of default on Apollo’s investments, where thecounterparty is unable or unwilling to make required or expected payments.
The Company is subject to a concentration risk related to the investors in its funds. As of December 31, 2015, there were more than 1,000investors in Apollo’s active private equity, credit and real estate funds, and no individual investor accounted for more than 10% of the total committedcapital to Apollo’s active funds.
Apollo’s derivative financial instruments contain credit risk to the extent that its counterparties may be unable to meet the terms of theagreements. Apollo seeks to minimize this risk by limiting its counterparties to highly rated major financial institutions with good credit ratings.Management does not expect any material losses as a result of default by other parties.
Substantially all amounts on deposit with major financial institutions that exceed insured limits are invested in interest-bearing accounts withU.S. money center banks.
Apollo is exposed to economic risk concentrations insofar as Apollo is dependent on the ability of the funds that it manages to compensate it forthe services it provides to these funds. Further, the carried interest income component of this compensation is based on the ability of such funds to generatereturns above certain specified thresholds.
Additionally, Apollo is exposed to interest rate risk. Apollo has debt obligations that have variable rates. Interest rate changes may thereforeaffect the amount of interest payments, future earnings and cash flows. At December 31, 2015 and 2014, $530.7 million and $534.1 million of Apollo’s debtbalance (excluding debt of the consolidated VIEs) had a variable interest rate, respectively.
18. SEGMENT REPORTING
Apollo conducts its business primarily in the United States and substantially all of its revenues are generated domestically. Apollo’s business isconducted through three reportable segments namely private equity, credit and real estate.
These business segments are differentiated based on the varying investment strategies. The performance is measured by management on anunconsolidated basis because management makes operating decisions and assesses the performance of each of Apollo’s business segments based on financialand operating metrics and data that exclude the effects of consolidation of any of the affiliated funds.
The Company’s financial results vary since carried interest, which generally constitutes a large portion of the income from the funds that Apollomanages, as well as the transaction and advisory fees that the Company receives, can vary significantly from quarter to quarter and year to year. As a result,the Company emphasizes long-term financial growth and profitability to manage its business.
- 204-

Table of ContentsAPOLLO GLOBAL MANAGEMENT, LLC
NOTES TO CONSOLIDATEDFINANCIAL STATEMENTS
(dollars in thousands, except share data, except where noted)
Economic Income (Loss)
Economic Income, or EI, is a key performance measure used by management in evaluating the performance of Apollo’s private equity, credit andreal estate segments. Management believes the components of EI, such as the amount of management fees, advisory and transaction fees and carried interestincome, are indicative of the Company’s performance. Management uses EI in making key operating decisions such as the following:
• Decisions related to the allocation of resources such as staffing decisions including hiring and locations for deployment of thenew hires;
• Decisions related to capital deployment such as providing capital to facilitate growth for the business and/or to facilitateexpansion into new businesses; and
• Decisions relating to expenses, such as determining annual discretionary bonuses and equity-based compensation awards to itsemployees. With respect to compensation, management seeks to align the interests of certain professionals and selected otherindividuals with those of the investors in such funds and those of the Company’s shareholders by providing such individuals aprofit sharing interest in the carried interest income earned in relation to the funds. To achieve that objective, a certain amountof compensation is based on the Company’s performance and growth for the year.
EI is a measure of profitability and has certain limitations in that it does not take into account certain items included under U.S. GAAP. EIrepresents segment income (loss) before income tax provision excluding transaction-related charges arising from the 2007 private placement, and anyacquisitions. Transaction-related charges include equity-based compensation charges, the amortization of intangible assets, contingent consideration andcertain other charges associated with acquisitions. In addition, segment data excludes non-cash revenue and expense related to equity awards granted byunconsolidated affiliates to employees of the Company, as well as the assets, liabilities and operating results of the funds and VIEs that are included in theconsolidated financial statements.
During the first quarter of 2015 the definition of Economic Income (“EI”) was changed to exclude transaction-related charges related tocontingent consideration associated with acquisitions, which only impacted the credit segment. The impact of this change on EI has been made to priorperiod financial data to conform to the current period presentation and resulted in the following impact to the Company’s credit segment for the years endedDecember 31, 2014 and 2013:
Impact of Revised Definition on
Economic Income (Loss)
Total EI as
Previously Reported Impact of Revised
Definition Total EI After
Revised DefinitionFor the Year Ended December 31, 2014 $ 755,546 $ (495) $ 755,051For the Year Ended December 31, 2013 2,127,651 61,449 2,189,100
These changes have been made to prior period financial data to conform to the current period presentation.
- 205-

Table of ContentsAPOLLO GLOBAL MANAGEMENT, LLC
NOTES TO CONSOLIDATEDFINANCIAL STATEMENTS
(dollars in thousands, except share data, except where noted)
The following table presents financial data for Apollo’s reportable segments as of and for the years ended December 31, 2015, 2014 and 2013:
As of and for the Year Ended December 31, 2015
PrivateEquity
Segment Credit
Segment
RealEstate
Segment
TotalReportableSegments
Revenues: Advisory and transaction fees from affiliates, net $ (7,485) $ 17,246 $ 4,425 $ 14,186Management fees from affiliates 295,836 565,241 50,816 911,893Carried interest income from affiliates:
Unrealized gains (losses)(1) (314,161) (80,534) 7,154 (387,541)Realized gains 339,822 139,152 5,857 484,831
Total Revenues 314,012 641,105 68,252 1,023,369
Expenses: Compensation and benefits:
Salary, bonus and benefits 104,367 213,479 38,076 355,922Equity-based compensation 31,324 26,683 4,177 62,184Profit sharing expense 46,572 34,384 5,075 86,031
Total compensation and benefits 182,263 274,546 47,328 504,137Other expenses 80,109 127,767 22,869 230,745
Total Expenses 262,372 402,313 70,197 734,882
Other Income: Net interest expense (9,878) (13,740) (2,915) (26,533)Net gains from investment activities 6,933 114,199 — 121,132Income (loss) from equity method investments 19,125 (6,025) 2,978 16,078Other income, net 3,148 3,574 1,455 8,177
Total Other Income 19,328 98,008 1,518 118,854Non-Controlling Interests — (11,684) — (11,684)
Economic Income (Loss) $ 70,968 $ 325,116 $ (427) $ 395,657
Total Assets $ 1,255,340 $ 2,143,813 $ 192,469 $ 3,591,622
(1) Included in unrealized carried interest losses from affiliates for the year ended December 31, 2015 was a reversal of previously realized carried interest income due to thegeneral partner obligation to return previously distributed carried interest income. See note 15 for further detail regarding the general partner obligation.
- 206-

Table of ContentsAPOLLO GLOBAL MANAGEMENT, LLC
NOTES TO CONSOLIDATEDFINANCIAL STATEMENTS
(dollars in thousands, except share data, except where noted)
As of and for the Year Ended December 31, 2014
PrivateEquity
Segment Credit
Segment
RealEstate
Segment
TotalReportableSegments
Revenues: Advisory and transaction fees from affiliates, net $ 58,241 $ 255,186 $ 2,655 $ 316,082Management fees from affiliates 315,069 538,742 47,213 901,024Carried interest income from affiliates:
Unrealized gains (losses)(1) (1,196,093) (156,644) 4,951 (1,347,786)Realized gains 1,428,076 322,233 3,998 1,754,307
Total Revenues 605,293 959,517 58,817 1,623,627
Expenses: Compensation and benefits:
Salary, bonus and benefits 96,689 210,546 32,611 339,846Equity-based compensation 49,526 47,120 8,849 105,495Profit sharing expense 178,373 83,788 2,747 264,908
Total compensation and benefits 324,588 341,454 44,207 710,249Other expenses 70,286 151,252 21,669 243,207
Total Expenses 394,874 492,706 65,876 953,456
Other Income: Net interest expense (7,883) (9,274) (1,941) (19,098)Net gains from investment activities — 9,062 — 9,062Income from equity method investments 30,418 18,812 5,675 54,905Other income, net 14,027 35,263 3,409 52,699
Total Other Income 36,562 53,863 7,143 97,568Non-Controlling Interests — (12,688) — (12,688)
Economic Income $ 246,981 $ 507,986 $ 84 $ 755,051
Total Assets $ 1,833,254 $ 2,136,173 $ 202,395 $ 4,171,822
(1) Included in unrealized carried interest losses from affiliates for the year ended December 31, 2014 was a reversal of previously realized carried interest income due to thegeneral partner obligation to return previously distributed carried interest income. See note 15 for further detail regarding the general partner obligation.
- 207-

Table of ContentsAPOLLO GLOBAL MANAGEMENT, LLC
NOTES TO CONSOLIDATEDFINANCIAL STATEMENTS
(dollars in thousands, except share data, except where noted)
For the Year Ended December 31, 2013
PrivateEquity
Segment Credit
Segment
RealEstate
Segment
TotalReportableSegments
Revenues: Advisory and transaction fees from affiliates, net $ 78,371 $ 114,643 $ 3,548 $ 196,562Management fees from affiliates 284,833 392,433 53,436 730,702Carried interest income from affiliates:
Unrealized gains (losses)(1) 454,722 (56,568) 4,681 402,835Realized gains 2,062,525 430,260 541 2,493,326
Total Revenues 2,880,451 880,768 62,206 3,823,425
Expenses: Compensation and benefits:
Salary, bonus and benefits 109,761 153,056 31,936 294,753Equity-based compensation 31,967 24,167 10,207 66,341Profit sharing expense 1,030,404 81,279 123 1,111,806
Total compensation and benefits 1,172,132 258,502 42,266 1,472,900Other expenses 100,896 147,525 24,528 272,949
Total Expenses 1,273,028 406,027 66,794 1,745,849
Other Income: Net interest expense (10,701) (9,686) (2,804) (23,191)Net loss from investment activities — (12,593) — (12,593)Income from equity method investments 78,811 30,678 3,722 113,211Other income, net 13,774 32,193 2,115 48,082
Total Other Income 81,884 40,592 3,033 125,509Non-Controlling Interests — (13,985) — (13,985)
Economic Income (Loss) $ 1,689,307 $ 501,348 $ (1,555) $ 2,189,100
(1) Included in unrealized carried interest losses from affiliates for the year ended December 31, 2013 was a reversal of previously realized carried interest income due to thegeneral partner obligation to return previously distributed carried interest income. See note 15 for further detail regarding the general partner obligation.
- 208-

Table of ContentsAPOLLO GLOBAL MANAGEMENT, LLC
NOTES TO CONSOLIDATEDFINANCIAL STATEMENTS
(dollars in thousands, except share data, except where noted)
The following tables reconcile the total reportable segments to Apollo’s income before income tax provision and total assets as of and for theyears ended December 31, 2015, 2014 and 2013:
As of and for the Year Ended December 31, 2015
TotalReportableSegments
ConsolidationAdjustments
and Other ConsolidatedRevenues $ 1,023,369 $ 18,301 (1) $ 1,041,670Expenses 734,882 96,093 (2) 830,975Other income 118,854 47,679 (3) 166,533Non-Controlling Interests (11,684) 11,684 —
Economic Income / Income before income tax provision $ 395,657 (4) $ (18,429) $ 377,228
Total Assets $ 3,591,622 $ 968,186 (5) $ 4,559,808
As of and for the Year Ended December 31, 2014
TotalReportableSegments
ConsolidationAdjustments
and Other ConsolidatedRevenues $ 1,623,627 $ (63,544) (1) $ 1,560,083Expenses 953,456 90,107 (2) 1,043,563Other income 97,568 263,079 (3) 360,647Non-Controlling Interests (12,688) 12,688 —
Economic Income / Income before income tax provision $ 755,051 (4) $ 122,116 $ 877,167
Total Assets $ 4,171,822 $ 19,000,966 (5) $ 23,172,788
For the Year Ended December 31, 2013
TotalReportableSegments
ConsolidationAdjustments
and Other ConsolidatedRevenues $ 3,823,425 $ (89,854) (1) $ 3,733,571Expenses 1,745,849 195,866 (2) 1,941,715Other income 125,509 564,198 (3) 689,707Non-Controlling Interests (13,985) 13,985 —
Economic Income / Income before income tax provision $ 2,189,100 (4) $ 292,463 $ 2,481,563
(1) Represents advisory fees, management fees and carried interest income earned from consolidated VIEs which are eliminated in consolidation. Includes non-cashrevenues related to equity awards granted by unconsolidated affiliates to employees of the Company.
(2) Represents the addition of expenses of consolidated funds and VIEs and transaction-related charges. Transaction-related charges include equity-based compensationcharges, the amortization of intangible assets, contingent consideration and certain other charges associated with acquisitions.
(3) Results from the following:
- 209-

Table of ContentsAPOLLO GLOBAL MANAGEMENT, LLC
NOTES TO CONSOLIDATEDFINANCIAL STATEMENTS
(dollars in thousands, except share data, except where noted)
For the Year Ended December 31,
2015 2014 2013Net gains from investment activities $ 591 $ 204,181 $ 342,828Net gains from investment activities of consolidated variable interest entities 19,050 22,564 199,742Loss from equity method investments (1,223) (1,048) (5,861)Other income, net 29,261 37,382 27,489
Total consolidation adjustments $ 47,679 $ 263,079 $ 564,198 (4) The reconciliation of Economic Income to income before income tax provision reported in the consolidated statements of operations consists of the following:
For the Year Ended December 31,
2015 2014 2013Economic Income 395,657 755,051 2,189,100Adjustments:
Net income attributable to Non-Controlling Interests in consolidated entitiesand appropriated partners’ capital 21,364 157,011 456,953Transaction-related charges(6) (39,793) (34,895) (164,490)
Total consolidation adjustments and other $ (18,429) $ 122,116 $ 292,463
Income before income tax provision $ 377,228 $ 877,167 $ 2,481,563 (5) Represents the addition of assets of consolidated funds and VIEs. Upon adoption of new accounting guidance (see note 2), debt issuance costs previously recorded in
other assets in the consolidated statements of financial condition were reclassified as a direct deduction of the carrying amount of the related debt arrangement.(6) Transaction-related charges include equity-based compensation charges, the amortization of intangible assets, contingent consideration and certain other charges
associated with acquisitions. Equity-based compensation adjustment includes non-cash revenues and expenses related to equity awards granted by unconsolidatedaffiliates to employees of the Company.
19. SUBSEQUENT EVENTS
On January 14, 2016, the Company issued 529,395 Class A shares in settlement of vested RSUs. This issuance caused the Company’s ownershipinterest in the Apollo Operating Group to increase from 45.6% to 45.7%.
On February 3, 2016, the Company declared a cash distribution of $0.28 per Class A share, which will be paid on February 29, 2016 to holders ofrecord on February 19, 2016.
In February 2016, Apollo adopted a plan to repurchase up to $250 million in the aggregate of its Class A shares, including up to $150 million inthe aggregate of its outstanding Class A shares through a share repurchase program and up to $100 million through a reduction of Class A shares to be issuedto employees to satisfy associated tax obligations in connection with the settlement of equity-based awards granted under the Company’s equity incentiveplan. Under the share repurchase program, shares may be repurchased from time to time in open market transactions, in privately negotiated transactions orotherwise, with the size and timing of these repurchases depending on legal requirements, price, market and economic conditions and other factors.
On February 5, 2016, the Company issued 2,745,799 Class A shares in settlement of vested RSUs. This issuance caused the Company’sownership interest in the Apollo Operating Group to increase from 45.7% to 46.0%.
- 210-

Table of ContentsAPOLLO GLOBAL MANAGEMENT, LLC
NOTES TO CONSOLIDATEDFINANCIAL STATEMENTS
(dollars in thousands, except share data, except where noted)
20. QUARTERLY FINANCIAL DATA (UNAUDITED)
For the Three Months Ended
March 31,
2015(1) June 30,
2015 September 30,
2015 December 31, 2015
Revenues $ 303,024 $ 351,727 $ 193,268 $ 193,651
Expenses 223,996 244,539 174,911 187,529
Other Income 7,984 49,978 84,793 23,778
Income Before Provision for Taxes $ 87,012 $ 157,166 $ 103,150 $ 29,900
Net Income $ 81,498 $ 148,074 $ 96,559 $ 24,364
Net income attributable to Apollo Global Management, LLC $ 30,927 $ 56,428 $ 41,051 $ 6,091
Net Income per Class A Share - Basic $ 0.09 $ 0.30 $ 0.20 $ 0.02Net Income per Class A Share - Diluted $ 0.09 $ 0.30 $ 0.20 $ 0.02
(1) Apollo adopted new U.S. GAAP consolidation and collateralized financing entity (“CFE”) guidance during the three months ended June 30, 2015 which resulted in thedeconsolidation of certain funds and VIEs as of January 1, 2015 and a measurement alternative of the financial assets and liabilities of the remaining consolidatedCLOs as of January 1, 2015. The adoption did not impact net income attributable to Apollo Global Management, LLC but did impact various line items within thestatement of operations and financial condition. See note 2 for details regarding the Company’s adoption of the new consolidation and CFE guidance.
For the Three Months Ended
March 31,
2014 June 30,
2014 September 30,
2014 December 31, 2014
Revenues $ 491,400 $ 572,152 $ 221,135 $ 275,396
Expenses 314,119 354,369 177,388 197,687
Other Income (Loss) 314,912 69,556 (82,135) 58,314
Income Before Provision for Taxes $ 492,193 $ 287,339 $ (38,388) $ 136,023
Net Income (Loss) $ 459,644 $ 252,302 $ (67,764) $ 85,740
Net income attributable to Apollo Global Management, LLC $ 72,169 $ 71,668 $ 2,210 $ 22,182
Net Income (Loss) per Class A Share - Basic $ 0.32 $ 0.33 $ (0.05) $ 0.04Net Income (Loss) per Class A Share - Diluted $ 0.32 $ 0.33 $ (0.05) $ 0.04
For the Three Months Ended
March 31,
2013 June 30,
2013 September 30,
2013 December 31, 2013
Revenues $ 1,309,073 $ 497,261 $ 1,132,089 $ 795,148
Expenses 622,602 322,787 600,115 396,211
Other Income (Loss) 132,173 (8,165) 210,820 354,879
Income Before Provision for Taxes $ 818,644 $ 166,309 $ 742,794 $ 753,816
Net Income $ 800,065 $ 148,170 $ 695,590 $ 730,169
Net income attributable to Apollo Global Management, LLC $ 248,978 $ 58,737 $ 192,516 $ 159,160
Net Income per Class A Share-Basic $ 1.60 $ 0.32 $ 1.13 $ 0.94Net Income per Class A Share - Diluted $ 1.59 $ 0.32 $ 1.13 $ 0.93
- 211-

Table of Contents
ITEM 8A. UNAUDITED SUPPLEMENTAL PRESENTATION OF STATEMENTS
OF FINANCIAL CONDITION
APOLLO GLOBAL MANAGEMENT, LLCCONSOLIDATING STATEMENTS OF FINANCIAL CONDITION (Unaudited)
(dollars in thousands, except share data)
December 31, 2015
Apollo Global Management,LLC and Consolidated
Subsidiaries Consolidated
Funds and VIEs Eliminations Consolidated
Assets: Cash and cash equivalents $ 612,505 $ — $ — $ 612,505
Cash and cash equivalents held at consolidated funds — 4,817 — 4,817
Restricted cash 5,700 — — 5,700
Investments 1,223,407 28,547 (97,205) 1,154,749
Assets of consolidated variable interest entities Cash and cash equivalents — 56,793 — 56,793
Investments, at fair value — 910,858 (292) 910,566
Other assets — 63,413 — 63,413
Carried interest receivable 643,907 — — 643,907
Due from affiliates 248,972 — (1,137) 247,835
Deferred tax assets 646,207 — — 646,207
Other assets 93,452 2,636 (244) 95,844
Goodwill 88,852 — — 88,852
Intangible assets, net 28,620 — — 28,620
Total Assets $ 3,591,622 $ 1,067,064 $ (98,878) $ 4,559,808
Liabilities and Shareholders’ Equity Liabilities:
Accounts payable and accrued expenses $ 92,012 $ — $ — $ 92,012
Accrued compensation and benefits 54,836 — — 54,836
Deferred revenue 177,875 — — 177,875
Due to affiliates 594,536 — — 594,536
Profit sharing payable 295,674 — — 295,674
Debt 1,025,255 — — 1,025,255
Liabilities of consolidated variable interest entities: Debt, at fair value — 843,584 (42,314) 801,270
Other liabilities — 86,226 (244) 85,982
Due to affiliates — 1,137 (1,137) —
Other liabilities 38,750 4,637 — 43,387
Total Liabilities 2,278,938 935,584 (43,695) 3,170,827
Shareholders’ Equity:
Apollo Global Management, LLC shareholders’ equity: Additional paid in capital 2,005,509 — — 2,005,509
Accumulated deficit (1,348,386) 34,468 (34,466) (1,348,384)
Appropriated partners’ capital — — — —
Accumulated other comprehensive income (loss) (5,171) (2,496) 47 (7,620)
Total Apollo Global Management, LLC shareholders’ equity 651,952 31,972 (34,419) 649,505
Non-Controlling Interests in consolidated entities 7,817 99,508 (20,764) 86,561
Non-Controlling Interests in Apollo Operating Group 652,915 — — 652,915
Total Shareholders’ Equity 1,312,684 131,480 (55,183) 1,388,981
Total Liabilities and Shareholders’ Equity $ 3,591,622 $ 1,067,064 $ (98,878) $ 4,559,808

- 212-

Table of Contents
APOLLO GLOBAL MANAGEMENT, LLCCONSOLIDATING STATEMENTS OF FINANCIAL CONDITION (Unaudited)
(dollars in thousands, except share data)
December 31, 2014
Apollo Global Management,LLC and Consolidated
Subsidiaries Consolidated
Funds and VIEs Eliminations Consolidated
Assets: Cash and cash equivalents $ 1,204,052 $ — $ — $ 1,204,052
Cash and cash equivalents held at consolidated funds — 1,611 — 1,611
Restricted cash 6,353 — — 6,353
Investments 857,391 2,173,989 (151,374) 2,880,006
Assets of consolidated variable interest entities Cash and cash equivalents — 1,088,952 — 1,088,952
Investments, at fair value — 15,658,948 (295) 15,658,653
Other assets — 323,932 (692) 323,240
Carried interest receivable 958,846 — (47,180) 911,666
Due from affiliates 278,632 — (10,617) 268,015
Deferred tax assets 606,717 — — 606,717
Other assets 110,940 3,578 (277) 114,241
Goodwill 88,852 — (39,609) 49,243
Intangible assets, net 60,039 — — 60,039
Total Assets $ 4,171,822 $ 19,251,010 $ (250,044) $ 23,172,788
Liabilities and Shareholders’ Equity Liabilities:
Accounts payable and accrued expenses $ 43,772 $ 474 $ — $ 44,246
Accrued compensation and benefits 59,278 — — 59,278
Deferred revenue 199,614 — — 199,614
Due to affiliates 564,799 354 — 565,153
Profit sharing payable 434,852 — — 434,852
Debt 1,027,965 — — 1,027,965
Liabilities of consolidated variable interest entities: Debt, at fair value — 14,170,474 (47,374) 14,123,100
Other liabilities — 728,957 (239) 728,718
Due to affiliates — 58,526 (58,526) —
Other liabilities 42,183 4,218 — 46,401
Total Liabilities 2,372,463 14,963,003 (106,139) 17,229,327
Shareholders’ Equity:
Apollo Global Management, LLC shareholders’ equity: Additional paid in capital 2,256,054 — (1,771) 2,254,283
Accumulated deficit (1,433,759) 2,175,406 (2,142,308) (1,400,661)
Appropriated partners’ capital — 972,774 (39,608) 933,166
Accumulated other comprehensive income (loss) 33,052 — (33,358) (306)
Total Apollo Global Management, LLC shareholders’ equity 855,347 3,148,180 (2,217,045) 1,786,482
Non-Controlling Interests in consolidated entities 9,228 1,139,827 2,073,140 3,222,195
Non-Controlling Interests in Apollo Operating Group 934,784 — — 934,784
Total Shareholders’ Equity 1,799,359 4,288,007 (143,905) 5,943,461
Total Liabilities and Shareholders’ Equity $ 4,171,822 $ 19,251,010 $ (250,044) $ 23,172,788
- 213-

Table of Contents
ITEM 9. CHANGES IN AND DISAGREEMENTS WITH ACCOUNTANTS ON ACCOUNTING AND FINANCIAL DISCLOSURES
None.
ITEM 9A. CONTROLS AND PROCEDURES
We maintain “disclosure controls and procedures”, as such term is defined in Rules 13a-15(e) and 15d-15(e) under the Securities Exchange Act of1934 (the “Exchange Act”), that are designed to ensure that information required to be disclosed by us in reports that we file or submit under the ExchangeAct is recorded, processed, summarized and reported within the time periods specified in Securities and Exchange Commission rules and forms, and that suchinformation is accumulated and communicated to our management, including our Chief Executive Officer and Chief Financial Officer, as appropriate, toallow timely decisions regarding required disclosure. In designing disclosure controls and procedures, our management necessarily was required to apply itsjudgment in evaluating the cost-benefit relationship of possible disclosure controls and procedures. The design of any disclosure controls and proceduresalso is based in part upon certain assumptions about the likelihood of future events, and there can be no assurance that any design will succeed in achievingits stated goals under all potential future conditions. Any controls and procedures, no matter how well designed and operated, can provide only reasonableassurance of achieving the desired objectives.
Our management, including our Chief Executive Officer and Chief Financial Officer, evaluated the effectiveness of our disclosure controls andprocedures pursuant to Rule 13a-15 under the Exchange Act as of the end of the period covered by this report. Based on that evaluation, our Chief ExecutiveOfficer and Chief Financial Officer have concluded that, as of the end of the period covered by this report, our disclosure controls and procedures (as definedin Rule 13a-15(e) under the Exchange Act) are effective at the reasonable assurance level to accomplish their objectives of ensuring that information we arerequired to disclose in reports that we file or submit under the Exchange Act is recorded, processed, summarized and reported within the time periodsspecified in Securities and Exchange Commission rules and forms, and that such information is accumulated and communicated to our management,including our Chief Executive Officer and Chief Financial Officer, as appropriate, to allow timely decisions regarding required disclosure.
No changes in our internal control over financial reporting (as such term is defined in Rules 13a–15(f) and 15d–15(f) under the SecuritiesExchange Act) occurred during our most recent quarter, that have materially affected, or are reasonably likely to materially affect, our internal control overfinancial reporting.
Management’s Report on Internal Control Over Financial Reporting
Management of Apollo is responsible for establishing and maintaining adequate internal control over financial reporting. Apollo’s internalcontrol over financial reporting is a process designed under the supervision of its principal executive and principal financial officers to provide reasonableassurance regarding the reliability of financial reporting and the preparation of its consolidated financial statements for external reporting purposes inaccordance with accounting principles generally accepted in the United States of America.
Apollo’s internal control over financial reporting includes policies and procedures that pertain to the maintenance of records that, in reasonabledetail, accurately and fairly reflect transactions and dispositions of assets, provide reasonable assurances that transactions are recorded as necessary to permitpreparation of financial statements in accordance with generally accepted accounting principles, and that receipts and expenditures are being made only inaccordance with authorizations of management and the directors, and provide reasonable assurance regarding prevention or timely detection of unauthorizedacquisition, use or disposition of Apollo’s assets that could have a material effect on its financial statements.
Because of its inherent limitations, internal control over financial reporting may not prevent or detect misstatements. In addition, projections ofany evaluation of effectiveness to future periods are subject to the risk that controls may become inadequate because of changes in conditions or that thedegree of compliance with the policies or procedures may deteriorate.
Management conducted an assessment of the effectiveness of Apollo’s internal control over financial reporting as of December 31, 2015 basedon the framework established in Internal Control - Integrated Framework (2013) issued by the Committee of Sponsoring Organizations of the TreadwayCommission. Based on this assessment, management has determined that Apollo’s internal control over financial reporting as of December 31, 2015 waseffective.
Deloitte & Touche LLP, an independent registered public accounting firm, has audited Apollo’s financial statements included in this annualreport on Form 10-K and issued its report on the effectiveness of Apollo’s internal control over financial reporting as of December 31, 2015, which isincluded herein.
- 214-

Table of Contents
ITEM 9B. OTHER INFORMATION
None.
PART III
ITEM 10. DIRECTORS, EXECUTIVE OFFICERS AND CORPORATE GOVERNANCE
Directors and Executive Officers
The following table presents certain information concerning our board of directors and executive officers:
Name Age Position(s)Leon Black 64 Chairman, Chief Executive Officer and DirectorJoshua Harris 51 Senior Managing Director and DirectorMarc Rowan 53 Senior Managing Director and DirectorMartin Kelly 48 Chief Financial OfficerJohn Suydam 56 Chief Legal OfficerMichael Ducey 67 DirectorPaul Fribourg 62 DirectorRobert Kraft 74 DirectorA.B. Krongard 79 DirectorPauline Richards 67 Director
Leon Black. Mr. Black is the Chairman of the board of directors and Chief Executive Officer of Apollo and a Managing Partner of ApolloManagement, L.P. In 1990, Mr. Black founded Apollo Management, L.P. and Lion Advisors, L.P. to manage investment capital on behalf of a group ofinstitutional investors, focusing on corporate restructuring, leveraged buyouts and taking minority positions in growth-oriented companies. From 1977 to1990, Mr. Black worked at Drexel Burnham Lambert Incorporated, where he served as a Managing Director, head of the Mergers & Acquisitions Group, andco-head of the Corporate Finance Department. Mr. Black also serves on the board of directors of the general partner of AAA and previously served on theboard of directors of Sirius XM Radio Inc. Mr. Black is a Co-Chairman of The Museum of Modern Art and a trustee of The Mount Sinai Medical Center andThe Asia Society. He is also a member of The Council on Foreign Relations and The Partnership for New York City. He is also a member of the boards ofdirectors of FasterCures and the Port Authority Task Force. Mr. Black graduated summa cum laude from Dartmouth College in 1973 with a major inPhilosophy and History and received an MBA from Harvard Business School in 1975. Mr. Black has significant experience making and managing privateequity investments on behalf of Apollo and has over 36 years’ experience financing, analyzing and investing in public and private companies. In his priorpositions with Drexel and in his positions at Apollo, Mr. Black is responsible for leading and overseeing teams of professionals. His extensive experienceallows Mr. Black to provide insight into various aspects of Apollo’s business and is of significant value to the board of directors.
Joshua Harris. Mr. Harris is a Senior Managing Director and a member of the board of directors of Apollo and a Managing Partner of ApolloManagement, L.P., which he co-founded in 1990. Prior to 1990, Mr. Harris was a member of the Mergers and Acquisitions group of Drexel Burnham LambertIncorporated. Mr. Harris has previously served on the board of directors of Berry Plastics Group Inc., EP Energy Corporation, EPE Acquisition, LLC, CEVALogistics, Momentive Performance Materials Holdings LLC, Constellium N.V., LyondellBasell Industries B.V., Momentive Specialty Chemicals Inc. andMomentive Specialty Chemicals Holdings LLC. Mr. Harris is a member of the Federal Reserve Bank of New York’s Investor Advisory Committee, theCouncil of Foreign Relations, and is on the Board of Trustees of Mount Sinai Medical Center. He participates on the University of Pennsylvania’s WhartonSchool’s Board of Overseers, the Board of Trustees at the Harvard Business School and certain other charitable and educational boards. Mr. Harris is aManaging Member of the Philadelphia 76ers and a Managing Member of the New Jersey Devils. Mr. Harris graduated summa cum laude and Beta GammaSigma from the University of Pennsylvania’s Wharton School of Business with a B.S. in Economics and received his M.B.A. from the Harvard BusinessSchool, where he graduated as a Baker and Loeb
- 215-

Table of Contents
Scholar. Mr. Harris has significant experience in making and managing private equity investments on behalf of Apollo and has over 26 years’ experience infinancing, analyzing and investing in public and private companies. Mr. Harris’s extensive knowledge of Apollo’s business and experience in a variety ofsenior leadership roles enhance the breadth of experience of the board of directors.
Marc Rowan. Mr. Rowan is a Senior Managing Director and member of the board of directors of Apollo and a Managing Partner of ApolloManagement, L.P., which he co-founded in 1990. Prior to 1990, Mr. Rowan was a member of the Mergers & Acquisitions Group of Drexel Burnham LambertIncorporated, with responsibilities in high yield financing, transaction idea generation and merger structure negotiation. Mr. Rowan currently serves on theboards of directors of, inter alia, Athene Holding Ltd, Caesars Entertainment Corporation, Caesars Acquisition Co. and Caesars Entertainment Operating Co.He has previously served on the boards of directors of, inter alia, the general partner of AAA, AMC Entertainment, Inc., Cablecom GmbH, Culligan WaterTechnologies, Inc., Countrywide Holdings Limited, Furniture Brands International Inc., Mobile Satellite Ventures, LLC, National Cinemedia, Inc., NationalFinancial Partners, Inc., New World Communications, Inc., Norwegian Cruise Lines, Quality Distribution, Inc., Samsonite Corporation, SkyTerraCommunications Inc., Unity Media SCA, Vail Resorts, Inc. and Wyndham International, Inc. Mr. Rowan is also active in charitable activities. He is afounding member and Chairman of the YRF-Darca and is a member of the Board of Overseers of the University of Pennsylvania’s Wharton School of Businessand serves on the boards of directors of Jerusalem Online and the New York City Police Foundation. Mr. Rowan graduated summa cum laude from theUniversity of Pennsylvania’s Wharton School of Business with a B.S. and an M.B.A. in Finance. Mr. Rowan has significant experience making and managingprivate equity investments on behalf of Apollo and has over 27 years’ experience financing, analyzing and investing in public and private companies. Mr.Rowan’s extensive financial background and expertise in private equity investments enhance the breadth of experience of the board of directors.
Martin Kelly. Mr. Kelly joined Apollo in 2012 as Chief Financial Officer. Mr. Kelly also oversees the Firm's IT, Risk, Operations and Audit groups. From 2008 to 2012, Mr. Kelly was with Barclays Capital and, from 2000 to 2008, Mr. Kelly was with Lehman Brothers Holdings Inc. Prior to departingBarclays Capital, Mr. Kelly served as Managing Director, CFO of the Americas, and Global Head of Financial Control for their Corporate and InvestmentBank. Prior to joining Lehman Brothers in 2000, Mr. Kelly spent 13 years with PricewaterhouseCoopers LLP, including serving in the Financial ServicesGroup in New York from 1994 to 2000. Mr. Kelly was appointed a Partner of the firm in 1999. Mr. Kelly received a degree in Commerce, majoring in Financeand Accounting, from the University of New South Wales in 1989.
John Suydam. Mr. Suydam joined Apollo in 2006 and serves as Apollo’s Chief Legal Officer. From 2002 to 2006, Mr. Suydam was a partner atO’Melveny & Myers LLP where he served as head of Mergers and Acquisitions and co-head of the Corporate Department. Prior to that time, Mr. Suydamserved as Chairman of the law firm O’Sullivan, LLP which specialized in representing private equity investors. Mr. Suydam serves on the boards of The LegalAction Center, Environmental Solutions Worldwide, Inc. and New York University School of Law, and is a member of the Department of Medicine AdvisoryBoard of the Mount Sinai Medical Center. Mr. Suydam received his J.D. from New York University and graduated magna cum laude with a B.A. in Historyfrom the State University of New York at Albany.
Michael Ducey. Mr. Ducey has served as an independent director of Apollo and a member of the audit committee and as Chairman of the conflictscommittee of our board of directors since 2011. Mr. Ducey was with Compass Minerals International, Inc., from March 2002 to May 2006, where he served ina variety of roles, including as President, Chief Executive Officer and Director prior to his retirement in May 2006. Prior to joining Compass MineralsInternational, Inc., Mr. Ducey worked for nearly 30 years at Borden Chemical, Inc., in various management, sales, marketing, planning and commercialdevelopment positions, and ultimately as President, Chief Executive Officer and Director. Mr. Ducey is currently a director of and serves as the Chairman ofthe audit committee of Verso Paper Holdings, Inc. He is also the Chairman of the compliance and governance committee and the nominations committee ofthe board of directors of HaloSource, Inc. Mr. Ducey joined Ciner Resources Corporation (formerly OCI Resources LP) as an independent member of theboard of directors in September 2014, where he serves on the audit committee and the conflicts committee. From September 2009 to December 2012,Mr. Ducey was the non-executive Chairman of TPC Group, Inc. and served on the audit committee and the environmental health and safety committee. FromJune 2006 to May 2008, Mr. Ducey served on the board of directors of and as a member of the governance and compensation committee of the board ofdirectors of UAP Holdings Corporation. Also, from July 2010 to May 2011, Mr. Ducey was a member of the board of directors and served on the auditcommittee of Smurfit-Stone Container Corporation. Mr. Ducey graduated from Otterbein University with a degree in Economics and an M.B.A. in financefrom the University of Dayton. Mr. Ducey’s comprehensive corporate background and his experience serving on various boards and committees addsignificant value to the board of directors.
Paul Fribourg. Mr. Fribourg has served as an independent director of Apollo and as a member of the conflicts committee of our board of directorssince 2011. From 1997 to the present, Mr. Fribourg has served as Chairman and Chief Executive Officer of Continental Grain Company. Prior to 1997, Mr.Fribourg served in a variety of other roles at Continental Grain Company, including Merchandiser, Product Line Manager, Group President and ChiefOperating Officer. Mr. Fribourg serves on the boards of directors of Restaurant Brands International Inc., Loews Corporation, Castleton CommoditiesInternational LLC and The Estee Lauder Companies, Inc. He also serves as a board member of the Rabobank International North American AgribusinessAdvisory Board,
- 216-

Table of Contents
the New York University Mitchell Jacobson Leadership Program in Law and Business Advisory Board and Endeavor Global Inc. Mr. Fribourg is also amember of the Council on Foreign Relations and the International Business Leaders Advisory Council for The Mayor of Shanghai. Mr. Fribourg graduatedmagna cum laude from Amherst College and completed the Advanced Management Program at Harvard Business School. Mr. Fribourg’s extensive corporateexperience enhances the breadth of experience and independence of the board of directors.
Robert Kraft. Mr. Kraft has served as an independent director of Apollo and as a member of the conflicts committee of our board of directors since2014. Mr. Kraft is Chairman and Chief Executive Officer of The Kraft Group, which includes the New England Patriots, New England Revolution, GilletteStadium, Rand-Whitney Group and International Forest Products Corporation. Mr. Kraft serves on a number of NFL Committees, including the ExecutiveCommittee, Finance Committee and Broadcast Committee (Chairman). Since 2006, Mr. Kraft has been a member of the board of directors of Viacom Inc. Healso serves as Chairman for both the New England Patriots Charitable Foundation and the Robert and Myra Kraft Family Foundation, and is a director of theDana Farber Cancer Institute. Mr. Kraft’s corporate strategic and operational experience combined with his strong relationships in the business communitymake him a valuable member of the board of directors.
A.B. Krongard. Mr. Krongard has served as an independent director of Apollo and as a member of the audit committee of our board of directors since2011. From 2001 to 2004, Mr. Krongard served as Executive Director of the Central Intelligence Agency. From 1998 to 2001, Mr. Krongard served asCounselor to the Director of Central Intelligence. Prior to 1998, Mr. Krongard served in various capacities at Alex Brown, Incorporated, including serving asChief Executive Officer beginning in 1991 and assuming additional duties as Chairman of the board of directors in 1994. Upon the merger of Alex Brown,Incorporated with Bankers Trust Corporation in 1997, Mr. Krongard served as Vice-Chairman of the Board of Bankers Trust Corporation and served in suchcapacity until joining the Central Intelligence Agency. Mr. Krongard serves as the Lead Director and audit committee Chairman of Under Armour, Inc. andalso serves as a board member of Iridium Communications Inc., Seventy-Seven Energy Inc. and In-Q-Tel, Inc. Mr. Krongard graduated with honors fromPrinceton University and received a J.D. from the University of Maryland School of Law, where he also graduated with honors. Mr. Krongard also serves asthe Vice Chairman of the Johns Hopkins Health System. Mr. Krongard’s comprehensive corporate background contributes to the range of experience of theboard of directors.
Pauline Richards. Ms. Richards has served as an independent director of Apollo and as Chairman of the audit committee of our board of directorssince 2011. Ms. Richards currently serves as Chief Operating Officer of Armour Group Holdings Limited, a position she has held since 2008. Ms. Richardsalso serves as a member of the Audit and Compensation Committees of the board of directors of Wyndham Worldwide, a position she has held since 2006; isa director of Hamilton Insurance Group, serving on the audit and investment committees, a position she has held since 2013; and is the Treasurer of the boardof directors of PRIDE Bermuda, a drug prevention organization of which she has been a member for over 20 years. Prior to 2008, Ms. Richards served asDirector of Development of Saltus Grammar School from 2003 to 2008, as Chief Financial Officer of Lombard Odier Darier Hentsch (Bermuda) Limited from2001 to 2003, and as Treasurer of Gulf Stream Financial Limited from 1999 to 2000. Ms. Richards also served as a member of the Audit Committee and chairof the Corporate Governance Committee of the board of directors of Butterfield Bank from 2006 to 2013. Ms. Richards graduated from Queen’s University,Ontario, Canada, with a BA in psychology and has obtained certification as a CPA, CMA. Ms. Richards’ extensive finance experience and her service on theboards of other public companies add significant value to the board of directors.
- 217-

Table of Contents
Our Manager
Our operating agreement provides that so long as the Apollo Group beneficially owns at least 10% of the aggregate number of votes that may be castby holders of outstanding voting shares, our manager, which is owned and controlled by our Managing Partners, will manage all of our operations andactivities and will have discretion over significant corporate actions, such as the issuance of securities, payment of distributions, sales of assets, makingcertain amendments to our operating agreement and other matters, and our board of directors will have no authority other than that which our managerchooses to delegate to it. We refer to the Apollo Group’s beneficial ownership of at least 10% of such voting power as the “Apollo control condition.” Forpurposes of our operating agreement, the “Apollo Group” means (i) our manager and its affiliates, including their respective general partners, members andlimited partners, (ii) Holdings and its affiliates, including their respective general partners, members and limited partners, (iii) with respect to each ManagingPartner, such Managing Partner and such Managing Partner’s “group” (as defined in Section 13(d) of the Exchange Act), (iv) any former or current investmentprofessional of or other employee of an “Apollo employer” (as defined below) or the Apollo Operating Group (or such other entity controlled by a member ofthe Apollo Operating Group), (v) any former or current executive officer of an Apollo employer or the Apollo Operating Group (or such other entitycontrolled by a member of the Apollo Operating Group); and (vi) any former or current director of an Apollo employer or the Apollo Operating Group (orsuch other entity controlled by a member of the Apollo Operating Group). With respect to any person, “Apollo employer” means Apollo Global Management,LLC or such other entity controlled by Apollo Global Management, LLC or its successor as may be such person’s employer but does not include anyportfolio companies.
Decisions by our manager are made by its executive committee, which is composed of our three Managing Partners. Each Managing Partner willremain on the executive committee for so long as he is employed by us, provided that Mr. Black, upon his retirement, may at his option remain on theexecutive committee until his death or disability or any commission of an act that would constitute cause if Mr. Black had still been employed by us. Otherthan those actions that require unanimous consent, actions by the executive committee are determined by majority vote of its voting members, except as tothe following matters, as to which Mr. Black will have the right of veto: (i) the designations of directors to our board, or (ii) a sale or other disposition of theApollo Operating Group and/or its subsidiaries or any portion thereof, through a merger, recapitalization, stock sale, asset sale or otherwise, to an unaffiliatedthird party (other than through an exchange of Apollo Operating Group units, transfers by a Managing Partner or a permitted transferee to another permittedtransferee, or the issuance of bona fide equity incentives to any of our non-Managing Partner employees) that constitutes (x) a direct or indirect sale of aratable interest (or substantially ratable interest) in each entity that constitutes the Apollo Operating Group or (y) a sale of all or substantially all of the assetsof Apollo (this clause (ii), an “LB Approval Event”). Exchanges of Apollo Operating Group units for Class A shares that are not pro rata among our ManagingPartners or in which each Managing Partner has the option not to participate are not subject to Mr. Black’s right of veto.
Subject to limited exceptions described in our operating agreement, our manager may not sell, exchange or otherwise dispose of all or substantiallyall of our assets and those of our subsidiaries, taken as a whole, in a single transaction or a series of related transactions without the approval of holders of amajority of the aggregate number of voting shares outstanding; provided, however, that this does not preclude or limit our manager’s ability, in its solediscretion, to mortgage, pledge, hypothecate or grant a security interest in all or substantially all of our assets and those of our subsidiaries (including for thebenefit of persons other than us or our subsidiaries, including affiliates of our manager) and does not apply to any forced sale of any or all of our assetspursuant to the foreclosure of, or other realization upon, any such encumbrance.
We will reimburse our manager and its affiliates for all costs incurred in managing and operating us, and our operating agreement provides that ourmanager will determine the expenses that are allocable to us. The agreement does not limit the amount of expenses for which we will reimburse our managerand its affiliates.
Board Composition and Limited Powers of Our Board of Directors
For so long as the Apollo control condition is satisfied, our manager shall (i) nominate and elect all directors to our board of directors, (ii) set thenumber of directors of our board of directors and (iii) fill any vacancies on our board of directors. After the Apollo control condition is no longer satisfied,each of our directors will be elected by the vote of a plurality of our shares entitled to vote, voting as a single class, to serve until his or her successor is dulyelected or appointed and qualified or until his or her earlier death, retirement, disqualification, resignation or removal. Our board currently consists of eightmembers. For so long as the Apollo control condition is satisfied, our manager may remove any director, with or without cause, at any time. After suchcondition is no longer satisfied, a director or the entire board of directors may be removed by the affirmative vote of holders of 50% or more of the totalvoting power of our shares.
As noted, so long as the Apollo control condition is satisfied, our manager will manage all of our operations and activities, and our board of directorswill have no authority other than that which our manager chooses to delegate to it. In the event that the Apollo control condition is not satisfied, our board ofdirectors will manage all of our operations and activities.
- 218-

Table of Contents
Pursuant to a delegation of authority from our manager, which may be revoked, our board of directors has established and at all times will maintainaudit and conflicts committees of the board of directors that have the responsibilities described below under “—Committees of the Board of Directors—AuditCommittee” and “—Committees of the Board of Directors—Conflicts Committee.”
Where action is required or permitted to be taken by our board of directors or a committee thereof, a majority of the directors or committee memberspresent at any meeting of our board of directors or any committee thereof at which there is a quorum shall be the act of our board or such committee, as thecase may be. Our board of directors or any committee thereof may also act by unanimous written consent.
Under the Agreement Among Managing Partners (as described under “Item 13. Certain Relationships and Related Transactions—Lenders RightsAgreement—Amendments to Managing Partner Transfer Restrictions”), the vote of a majority of the independent members of our board of directors willdecide the following: (i) in the event that a vacancy exists on the executive committee of our manager and the remaining members of the executivecommittee cannot agree on a replacement (other than a replacement for Mr. Black nominated by Mr. Black or his representative, which requires the approvalof only one member of the executive committee), the independent members of our board of directors shall select one of the two nominees to the executivecommittee of our manager presented to them by the remaining members of such executive committee to fill the vacancy on such executive committee and (ii)in the event that Mr. Black wishes to exercise his ability to cause an LB Approval Event, the affirmative vote of the majority of the independent members ofour board of directors shall be required to approve such a transaction. We are not a party to the Agreement Among Managing Partners, and neither we nor ourshareholders (other than our Strategic Investors, as described under “Item 13. Certain Relationships and Related Transactions—Lenders Rights Agreement—Amendments to Managing Partner Transfer Restrictions”) have any right to enforce the provisions described above. Such provisions can be amended orwaived upon agreement of our Managing Partners at any time.
Committees of the Board of Directors
We have established an audit committee as well as a conflicts committee. Our audit committee has adopted a charter that complies with current SECand NYSE rules relating to corporate governance matters. Our board of directors may from time to time establish other committees of our board of directors.
Audit Committee
The primary purpose of our audit committee is to assist our manager in overseeing and monitoring (i) the quality and integrity of our financialstatements, (ii) our compliance with legal and regulatory requirements, (iii) our independent registered public accounting firm’s qualifications andindependence and (iv) the performance of our independent registered public accounting firm.
The current members of our audit committee are Messrs. Ducey and Krongard and Ms. Richards. Ms. Richards currently serves as Chairperson of thecommittee. Each of the members of our audit committee meets the independence standards and financial literacy requirements for service on an auditcommittee of a board of directors pursuant to the Exchange Act and NYSE rules applicable to audit committees and corporate governance. Furthermore, ourmanager has determined that Ms. Richards is an “audit committee financial expert” within the meaning of Item 407(d)(5) of Regulation S-K. Our auditcommittee has a charter which is available on our website at www.agm.com under the “Investor Relations” section.
Conflicts Committee
The current members of our conflicts committee are Messrs. Ducey, Fribourg and Kraft. Mr. Ducey currently serves as Chairman of the committee.The purpose of the conflicts committee is to review specific matters that our manager believes may involve conflicts of interest. The conflicts committee willdetermine whether the resolution of any conflict of interest submitted to it is fair and reasonable to us. Any matters approved by the conflicts committee willbe conclusively deemed to be fair and reasonable to us and not a breach by us of any duties that we may owe to our shareholders. In addition, the conflictscommittee may review and approve any related person transactions, other than those that are approved pursuant to our related person policy, as describedunder “Item 13. Certain Relationships and Related Party Transactions—Statement of Policy Regarding Transactions with Related Persons,” and mayestablish guidelines or rules to cover specific categories of transactions.
- 219-

Table of Contents
Code of Business Conduct and Ethics
We have a Code of Business Conduct and Ethics, which applies to, among others, our principal executive officer, principal financial officer andprincipal accounting officer. A copy of our Code of Business Conduct and Ethics is available on our website at www.agm.com under the “Investor Relations”section. We intend to disclose any amendment to or waiver of the Code of Business Conduct and Ethics on behalf of an executive officer or director either onour website or in an 8-K filing.
Corporate Governance Guidelines
We have Corporate Governance Guidelines that address significant issues of corporate governance and set forth procedures by which our managerand board of directors carry out their respective responsibilities. The guidelines are available for viewing on our website at www.agm.com under the “InvestorRelations” section. We will also provide the guidelines, free of charge, to shareholders who request them. Requests should be directed to our Secretary atApollo Global Management, LLC, 9 West 57th Street, 43rd Floor, New York, New York 10019.
Communications with the Board of Directors
A shareholder or other interested party who wishes to communicate with our directors, a committee of our board of directors, our independentdirectors as a group or our board of directors generally may do so in writing. Any such communications may be sent to our board of directors by U.S. mail orovernight delivery and should be directed to our Secretary at Apollo Global Management, LLC, 9 West 57th Street, 43rd Floor, New York, New York 10019,who will forward them to the intended recipient(s). Any such communications may be made anonymously. Unsolicited advertisements, invitations toconferences or promotional materials, in the discretion of our Secretary, are not required, however, to be forwarded to the directors.
Executive Sessions of Independent Directors
The independent directors serving on our board of directors meet periodically in executive sessions during the year at regularly scheduled meetingsof our board of directors. These executive sessions will be presided over by one of the independent directors serving on our board of directors selected on anad-hoc basis.
Section 16(a) Beneficial Ownership Reporting Compliance
Section 16(a) of the Exchange Act requires our officers and directors, and persons who own more than ten percent of a registered class of theCompany’s equity securities to file initial reports of ownership and reports of changes in ownership with the SEC and furnish us with copies of all Section16(a) forms they file. To our knowledge, based solely on our review of the copies of such reports furnished to us or written representations from such personsthat they were not required to file a Form 5 to report previously unreported ownership or changes in ownership, we believe that, with respect to the fiscal yearended December 31, 2015, such persons complied with all such filing requirements.
ITEM 11. EXECUTIVE COMPENSATION
Compensation Discussion and Analysis
Overview of Compensation Philosophy
Alignment of Interests with Investors and Shareholders. Our principal compensation philosophy is to align the interests of our Managing Partnersand other senior professionals with those of our Class A shareholders and fund investors. This alignment, which we believe is a key driver of our success, hasbeen achieved principally by our Managing Partners’ and other investment professionals’ direct beneficial ownership of equity in our business in the form ofAOG Units and Class A shares, their ownership of rights to receive a portion of the incentive income earned from our funds, the direct investment by ourinvestment professionals in our funds, and our practice of paying annual incentive compensation partly in the form of equity-based grants that are subject tovesting. As a result of this alignment, the compensation of our professionals is closely tied to the performance of our businesses.
Significant Personal Investment. Our investment professionals generally make significant personal investments in our funds (as more fullydescribed under “Item 13. Certain Relationships and Related Party Transactions”), directly or indirectly, and our professionals who receive carried interests inour funds are generally required to invest their own capital in the funds on which they work in amounts that are generally proportionate to the size of theirparticipation in incentive income. We believe that these investments help to ensure that our professionals have capital at risk and reinforce the linkagebetween the success of the funds we manage, the success of the Company and the compensation paid to our professionals.
- 220-

Table of Contents
Long-Term Performance and Commitment. Most of our professionals have been issued RSUs, which provide rights to receive Class A shares and, insome instances, distribution equivalents on those shares. The vesting requirements and minimum retained ownership requirements for these awards contributeto our professionals’ focus on long-term performance while enhancing retention of these professionals. RSUs are not awarded to our Managing Partners,whose beneficial ownership of equity interests in the company is generally in the form of AOG units, as discussed below under “—Note on Distributions onApollo Operating Group Units.”
Discouragement of Excessive Risk-Taking. Although investments in alternative assets can pose risks, we believe that our compensation programincludes significant elements that discourage excessive risk-taking while aligning the compensation of our professionals with our long-term performance. Forexample, notwithstanding that we accrue compensation for our carried interest programs (described below) as increases in the value of the portfolioinvestments are recorded in the related funds, we generally make payments in respect of carried interest allocations to our employees only after profitableinvestments have actually been realized. This helps to ensure that our professionals take a long-term view that is consistent with the interests of theCompany, our shareholders and the investors in our funds. Moreover, if a fund fails to achieve specified investment returns due to diminished performance oflater investments, our carried interest program relating to that fund generally permits, for the benefit of the limited partner investors in that fund, the return ofcarried interest payments (generally net of tax) previously made to us or our employees. These provisions discourage excessive risk-taking and promote along-term view that is consistent with the interests of our fund investors and shareholders. Our general requirement that our professionals invest in the fundswe manage further aligns the interests of our professionals, fund investors and Class A shareholders. Finally, the minimum retained ownership requirements ofour RSUs and AOG Units, as well as a requirement that certain investment professionals use a portion of their distributions of carried interest income andincentive fees to purchase Class A restricted shares, discourage excessive risk-taking because the value of these interests is tied directly to the long-termperformance of our Class A shares.
Note on Distributions on Apollo Operating Group Units
We note that all of our Managing Partners beneficially own AOG Units. In particular, as of December 31, 2015, the Managing Partners beneficiallyowned, through their interest in Holdings, approximately 48.4% of the total limited partner interests in the Apollo Operating Group. When made,distributions on these units are in the same amount per unit as distributions made to us in respect of the AOG Units we hold. Although distributions on AOGUnits are distributions on equity rather than compensation, they play a central role in aligning our Managing Partners’ interests with those of our Class Ashareholders, which is consistent with our compensation philosophy. In 2015, the Managing Partners were required to retain 77.5% of their AOG Units.
Compensation Elements for Named Executive Officers
Consistent with our emphasis on alignment of interests with our fund investors and Class A shareholders, compensation elements tied to theprofitability of our different businesses and that of the funds that we manage are the primary means of compensating our five executive officers listed in thetables below, or the “named executive officers.” The key elements of the compensation of our named executive officers during fiscal year 2015 are describedbelow. We distinguish among the compensation components applicable to our named executive officers as appropriate in the below summary. Messrs. Black,Harris and Rowan are the three members of the group referred to elsewhere in this report as the “Managing Partners.”
Annual Salary. Each of our named executive officers receives an annual salary. The base salaries of our named executive officers are set forth in theSummary Compensation Table below, and those base salaries were set by our Managing Partners in their judgment after considering the historiccompensation levels of the officer, competitive market dynamics, and each officer’s level of responsibility and anticipated contributions to our overallsuccess.
RSUs. In 2015, a portion of our named executive officers’ compensation (other than for our Managing Partners) was paid in the form of RSUs. Werefer to our annual grants of RSUs as Bonus Grants. The RSUs are subject to multi-year vesting and minimum retained ownership requirements. In 2015, allnamed executive officers who have received RSUs were required to retain at least 77.5% of any Class A shares issued to them pursuant to RSU awards, net ofthe number of gross shares sold or netted to pay applicable income or employment taxes. The named executive officer Plan Grants and Bonus Grants aredescribed below under “—Narrative Disclosure to the Summary Compensation Table and Grants of Plan-Based Awards Table—Awards of Restricted ShareUnits Under the Equity Plan.”
Carried Interest and Incentive Fees. Carried interests and incentive fee entitlements with respect to our funds confer rights to receive distributions ifa distribution is made to investors following the realization of an investment or receipt of operating profit from an investment by the fund. Distributions ofcarried interest generally are subject to contingent repayment (generally net of tax) if the fund fails to achieve specified investment returns due to diminishedperformance of later investments, while distributions in respect of incentive fees are generally not subject to contingent repayment. The actual gross amountof carried interest allocations or incentive fees available for distribution are a function of the performance of the applicable fund. For these
- 221-
Table of Contents
reasons, we believe that participation in carried interest and incentive fees generated by our funds aligns the interests of our participating named executiveofficers with those of our Class A shareholders and fund investors.
We currently have two principal types of carried interest programs, which we refer to as dedicated and incentive pool. Messrs. Kelly and Suydamhave been awarded rights to participate in a dedicated percentage of the carried interest or incentive fee income earned by the general partners of certain ofour funds. Participation in dedicated carried interest in our private equity funds is typically subject to vesting, which rewards long-term commitment to thefirm and thereby enhances the alignment of participants’ interests with the Company. As with our distributions in respect of incentive fees, our financialstatements characterize the carried interest income allocated to participating professionals in respect of their dedicated carried interests as compensation.Actual distributions in respect of dedicated carried interests and incentive fees are included in the “All Other Compensation” column of the summarycompensation table.
Our performance based incentive arrangement referred to as the incentive pool further aligns the overall compensation of certain of our professionalsto the realized performance of our business. The incentive pool provides for compensation based on carried interest realizations earned by us during the yearand enhances our capacity to offer competitive compensation opportunities to our professionals. “Carried interest realizations earned” means carried interestearned by the general partners of our funds under the applicable fund limited partnership agreements based upon transactions that have closed or other rightsto cash that have become fixed in the applicable calendar year period. Under this arrangement, Messrs. Kelly and Suydam, among other of our professionals,were awarded incentive pool compensation based on carried interest realizations earned during 2015. Allocations to participants in the incentive poolcontain both a fixed component and a discretionary component, both of which may vary year-to-year, including as a result of our overall realizedperformance and the contributions and performance of each participant. The Managing Partners determine the amount of the carried interest realizations toplace into the incentive pool in their discretion after considering various factors, including Company profitability, management company cash requirementsand anticipated future costs, provided that the incentive pool consists of an amount equal to at least one percent (1%) of the carried interest realizationsattributable to profits generated after creation of the incentive pool that were taxable in the applicable year and not allocable to dedicated carried interests.Each participant in the incentive pool is entitled to receive, as a fixed component of participation in the incentive pool, his or her pro rata allocation of this1% amount each year, provided the participant remains employed by us at the time of allocation. Our financial statements characterize the carried interestincome allocated to participating professionals in respect of incentive pool interests as compensation. The “All Other Compensation” column of the summarycompensation table includes actual distributions paid from the incentive pool.
Restricted Shares. We require that a portion of the carried interest and incentive fee distributions in respect of certain of the investment funds wemanage is used by our employees who receive those distributions to purchase Class A restricted shares issued under our 2007 Omnibus Equity Incentive Plan.This practice further promotes alignment with our shareholders and encourages participating professionals to maximize the success of the Company as awhole. Like our RSUs, the restricted shares are subject to multi-year vesting, which fosters retention. In 2015, the funds with respect to which Messrs. Kellyand Suydam have rights subject to this restricted share purchase requirement had not yet commenced making carried interest or incentive fee distributions.
Determination of Compensation of Named Executive Officers
Our Managing Partners make all final determinations regarding named executive officer compensation. Decisions about the variable elements of anamed executive officer’s compensation, including participation in our carried interest and incentive fee programs, discretionary bonuses (if any) and grantsof equity-based awards, are based primarily on our Managing Partners’ assessment of such named executive officer’s individual performance, operationalperformance for the department or division in which the officer (other than a Managing Partner) serves, and the officer’s impact on our overall operatingperformance and potential to contribute to long-term shareholder value. In evaluating these factors, our Managing Partners do not utilize quantitativeperformance targets but rather rely upon their judgment about each named executive officer’s performance to determine an appropriate reward for the currentyear’s performance. The determinations by our Managing Partners are ultimately subjective, are not tied to specified annual, qualitative or individualobjectives or performance factors, and reflect discussions among the Managing Partners. Factors that our Managing Partners typically consider in makingsuch determinations include the named executive officer’s type, scope and level of responsibilities, active participation in managing a team of professionals,corporate citizenship and the named executive officer’s overall contributions to our success. Our Managing Partners also consider each named executiveofficer’s prior-year compensation, the appropriate balance between incentives for long-term and short-term performance, competitive market dynamics,compensation provided to the named executive officer by other entities, and the compensation paid to the named executive officer’s peers within theCompany. The Managing Partners determined that, based on the above factors, including the named executive officers’ overall compensation levels,discretionary cash bonuses would not be awarded to any named executive officer for 2015.
- 222-

Table of Contents
Compensation Committee Interlocks and Insider Participation
Our board of directors does not have a compensation committee. Our Managing Partners make all compensation determinations with respect toexecutive officer compensation. For a description of certain transactions between us and the Managing Partners, see “Item 13. Certain Relationships andRelated Party Transactions.”
Compensation Committee Report
As noted above, our board of directors does not have a compensation committee. The executive committee of our manager identified below hasreviewed and discussed with management the foregoing Compensation Discussion and Analysis and, based on such review and discussion, has determinedthat the Compensation Discussion and Analysis should be included in this Annual Report on Form 10-K.
Leon BlackJoshua Harris
Marc Rowan
Summary Compensation Table
The following summary compensation table sets forth information concerning the compensation earned by, awarded to or paid to our principalexecutive officer, our principal financial officer, and our three other most highly compensated executive officers for the fiscal year ended December 31, 2015.The earnings of our Managing Partners, Messrs. Black, Harris and Rowan, derive predominantly from distributions they receive as a result of their indirectbeneficial ownership of AOG Units and their rights under the tax receivable agreement (described elsewhere in this report, including above under “Item 5.Market for Registrant’s Common Equity, Related Stockholder Matters and Issuer Purchases of Equity Securities—Cash Distribution Policy”), rather thanfrom compensation, and accordingly are not included in the tables below. We recently reevaluated our management structure and the group of persons withpolicy making functions as of January 2015. As a result, certain members of our management are no longer considered to be executive officers. The executiveofficers named in the table are referred to as the named executive officers.
Name and Principal Position Year Salary
($) Bonus
($)
StockAwards
($)(1)
All OtherCompensation
($)(2) Total
($)
Leon Black,Chairman, Chief Executive Officerand Director
2015 100,000 — — 144,751 244,751 2014 100,000 — — 173,980 273,980
2013 100,000 — — 173,053 273,053Martin Kelly,
Chief Financial Officer 2015 1,000,000 — 681,643 1,300,000 2,981,643
2014 1,000,000 — 698,444 1,300,000 2,998,444
2013 1,000,000 — 541,246 950,000 2,491,246John Suydam,Chief Legal Officer
2015 2,500,000 — 499,058 1,640,003 4,639,062
2014 3,000,000 — 511,370 5,420,540 8,931,910
2013 3,000,000 949,788 504,345 7,148,168 11,602,301Joshua Harris,
Senior Managing Director andDirector
2015
100,000
—
—
281,204
381,204
Marc Rowan,Senior Managing Director andDirector
2015
100,000
—
—
169,671
269,671
(1) For Messrs. Kelly and Suydam, represents the aggregate grant date fair value of stock awards granted, as applicable, computed in accordance with FASB ASC Topic 718. Theamounts shown do not reflect compensation actually received by the named executive officers, but instead represent the aggregate grant date fair value of the awards. See note14 to our consolidated financial statements for further information concerning the assumptions made in valuing our RSU awards.
(2) Amounts included for 2015 represent, in part, actual cash distributions in respect of dedicated carried interest allocations for Mr. Suydam of $1,111,472. The 2015 amountsalso include actual incentive pool cash distributions of $1,300,000 for Mr. Kelly and $500,000 for Mr. Suydam. The “All Other Compensation” column for 2015 also includescosts relating to Company-provided cars and drivers for the business and personal use of Messrs. Black, Harris, Rowan and Suydam. We provide this benefit because webelieve that its cost is outweighed by
- 223-

Table of Contents
the convenience, increased efficiency and added security and confidentiality that it offers. The personal use cost was approximately $130,076 for Mr. Black, $172,095 for Mr.Harris, $154,996 for Mr. Rowan and $26,631 for Mr. Suydam. For Messrs. Black, Harris and Rowan, this amount includes both fixed and variable costs, including leasecosts, driver compensation, driver meals, fuel, parking, tolls, repairs, maintenance and insurance, and, for Mr. Rowan, car service costs. For Mr. Suydam, this amount includesthe costs to the Company associated with his use of a car service. For Mr. Harris, this amount also includes $94,434 in information technology services. Except as discussed inthis paragraph, no 2015 perquisites or personal benefits individually exceeded the greater of $25,000 or 10% of the total amount of all perquisites and other personal benefitsreported for the named executive officer. The cost of excess liability insurance provided to our named executive officers falls below this threshold. Mr. Kelly did not receiveperquisites or personal benefits in 2015, except for incidental benefits having an aggregate value of less than $10,000. Our named executive officers also receive secretarialsupport with respect to personal matters. We incur no incremental cost for the provision of such additional benefits. Accordingly, no such amount is included in the SummaryCompensation Table.
Narrative Disclosure to the Summary Compensation Table and Grants of Plan-Based Awards Table
Employment, Non-Competition and Non-Solicitation Agreements with Chairman and Chief Executive Officer and with each Senior Managing Director
In July 2012, we entered into an employment, non-competition and non-solicitation agreement with Leon Black, our chairman and chief executiveofficer, and with each of Joshua Harris and Marc Rowan, our senior managing directors, all of whom are members of our manager’s executive committee.These agreements superseded and were substantially similar to agreements with our Managing Partners dated July 13, 2007. The term of the 2012 agreementsconcluded on July 19, 2015. Since that date, our Managing Partners’ employment has continued on the same terms as provided under the agreements, andeach continues to receive an annual salary of $100,000 and to participate in our employee benefit plans, as in effect from time to time.
Employment, Non-Competition and Non-Solicitation Agreement with Chief Financial Officer
On July 2, 2012, we entered into an employment, non-competition and non-solicitation agreement with Martin Kelly, our chief financial officer. Hisannual base salary is $1,000,000. As provided in his employment agreement, Mr. Kelly received a Plan Grant of 375,000 RSUs in connection with hiscommencement of employment. He is eligible for an annual bonus in an amount to be determined by the Managing Partners in their discretion. Mr. Kellyparticipates in the incentive pool and is eligible to receive distributions thereunder.
Employment Terms of Chief Legal Officer
John Suydam, our chief legal officer, does not have an employment agreement with us.
Awards of Restricted Share Units Under the Equity Plan
On October 23, 2007, we adopted our 2007 Omnibus Equity Incentive Plan. Grants of RSUs under the plan have been made to certain of our namedexecutive officers primarily pursuant to two programs, which we call the “Plan Grants” and the “Bonus Grants.” Following the 2007 Reorganization, PlanGrants were made to Mr. Suydam and a broad range of our other employees. Plan Grants have also been made to subsequent employee hires, including Mr.Kelly. The Plan Grants generally vest over six years, with the first installment becoming vested approximately one year after grant and the balance vestingthereafter in equal quarterly installments. Holders of Plan Grant RSUs become entitled to distribution equivalents on their vested RSUs if we pay ordinarydistributions on our outstanding Class A shares. The administrator of the 2007 Omnibus Equity Incentive Plan determines when shares issued pursuant to theRSU Awards may be disposed of, except that a participant will generally be permitted to sell shares if necessary to cover taxes. Under our retained ownershiprequirements, in 2015, all executive officers who received RSU awards were required to retain at least 77.5% of any Class A shares issued to them under thoseawards (net of the number of gross shares sold or netted to pay applicable income or employment taxes).
The RSUs advance several goals of our compensation program. The Plan Grants align employee interests with those of our shareholders by makingour employees, upon delivery of the underlying Class A shares, shareholders themselves. Because they vest over time, the Plan Grants reward employees forsustained contributions to the Company and foster retention. The size of the Plan Grants is determined by the Plan administrator based on the grantee’s levelof responsibility and contributions to the Company. The restrictive covenants contained in the RSU agreements reinforce our culture of fiduciary protectionof our fund investors and shareholders by requiring RSU holders to abide by the provisions regarding non-competition, confidentiality and other limitationson behavior described in the immediately preceding paragraph.
The Bonus Grants are also grants of RSUs under the 2007 Omnibus Equity Incentive Plan. However, the Bonus Grants constitute payment of aportion of the annual compensation earned by certain of our professionals, including Messrs. Kelly and Suydam, subject to the employee’s continued servicethrough the vesting dates. Our named executive officers’ Bonus Grants
- 224-

Table of Contents
generally differ from their Plan Grants in the following principal ways:
• The RSU Shares underlying Bonus Grants are generally scheduled to vest in three equal annual installments.• Distribution equivalents are earned on Bonus Grant RSUs (whether or not vested) when ordinary distributions are made on Class A shares after
the grant date, but distribution equivalents are earned on Plan Grant RSUs only after they have vested.
Grants of Plan-Based Awards
The following table presents information regarding RSUs granted to Messrs. Kelly and Suydam under our 2007 Omnibus Equity Incentive Plan in2015. No options were granted to a named executive officer in 2015.
Name Grant Date
EstimatedFuture
Payoutsunder Equity
IncentivePlan Awards
Target (#)
Stock Awards:Number ofShares of
Stock or Units(#)(1)
Grant Date Fair Valueor Modification Date
Incremental FairValue of
Stock and OptionAwards
($)(2)
Leon Black — — — —Martin Kelly December 29, 2015 — 45,871 681,643John Suydam December 29, 2015 — 33,584 499,058Joshua Harris — — — —Marc Rowan — — — —
(1) Represents the aggregate number of RSUs covering our Class A shares (none of the Bonus Grants awarded in 2015 vested in 2015). For a discussion of these grants, pleasesee the discussion above under “—Narrative Disclosure to the Summary Compensation Table and Grants of Plan-Based Awards Table—Awards of Restricted Share UnitsUnder the Equity Plan.”
(2) Represents the aggregate grant date fair value of the RSUs granted in 2015, computed in accordance with FASB ASC Topic 718. The amounts shown do not reflectcompensation actually received, but instead represent the aggregate grant date fair value of the award.
Outstanding Equity Awards at Fiscal Year-End
The following table presents information regarding unvested RSU awards made by us to our named executive officers under our 2007 OmnibusEquity Incentive Plan that were outstanding at December 31, 2015. Our named executive officers did not hold any options at fiscal year-end.
Stock Awards
Name
Number of UnearnedShares, Units or
Other Rights ThatHave Not Vested
(#)
Market orPayout Value of
UnearnedShares, Units or Other Rights
That Have Not Vested($) (5)
Leon Black — — —Martin Kelly
December 29, 2015 45,871 (1) 696,322December 29, 2014 20,567 (2) 312,207December 26, 2013 6,038 (3) 91,657September 30, 2012 171,875 (4) 2,609,063
John Suydam
December 29, 2015 33,584 (1) 509,805December 29, 2014 15,059 (2) 228,596December 26, 2013 5,627 (3) 85,418
Joshua Harris — — —Marc Rowan — — —
- 225-

Table of Contents
(1) Bonus Grant RSUs that vest in substantially equal annual installments on December 31 of each of 2016, 2017 and 2018.(2) Bonus Grant RSUs that vest in substantially equal annual installments on December 31 of each of 2016 and 2017.(3) Bonus Grant RSUs that vest on December 31, 2016.(4) Plan Grant RSUs that vest in substantially equal installments over the 11 calendar quarters beginning March 31, 2016.(5) Amounts calculated by multiplying the number of unvested RSUs held by the named executive officer by the closing price of $15.18 per Class A share on December 31, 2015.
Option Exercises and Stock VestedThe following table presents information regarding the number of outstanding initially unvested RSUs held by our named executive officers that
vested during 2015 and the number of options exercised by our named executive officers in 2015. The amounts shown below do not reflect compensationactually received by the named executive officers, but instead are calculations of the number of RSUs that vested during 2015 based on the closing price ofour Class A shares on the date of vesting. Shares received by our named executive officers are subject to our retained ownership requirements. No optionswere exercised by our named executive officers in 2015.
Stock Awards
Name Type of Award Number of Shares
Acquired on Vesting(#) Value Realized on
Vesting($) Leon Black — — — Martin Kelly RSUs 87,832 1,573,759 (1)
John Suydam RSUs 23,268 353,208 (1)
Joshua Harris — — — Marc Rowan — — —
(1) Amounts calculated by multiplying the number of RSUs held by the named executive officer that vested on each applicable vesting date in 2015 by the closing price per ClassA share on that date. Class A shares underlying these vested RSUs are issued to the named executive officer in accordance with the schedules described above under “—Narrative Disclosure to the Summary Compensation Table and Grants of Plan-Based Awards Table—Awards of Restricted Share Units Under the Equity Plan.”
Potential Payments upon Termination or Change in Control
None of the named executive officers is entitled to payment or other benefits in connection with a change in control.
None of Messrs. Black, Harris or Rowan is entitled to severance or other payments or benefits in connection with an employment termination.Messrs. Black, Harris and Rowan are required to protect the confidential information of Apollo both during and after employment. In addition, until one yearafter employment termination, each is required to refrain from soliciting employees under specified circumstances or interfering with our relationships withinvestors and to refrain from competing with us in a business that involves primarily (i.e., more than 50%) third-party capital. These post-terminationcovenants survive any termination or expiration of the Agreement Among Managing Partners (described elsewhere in this report under “Item 13. CertainRelationships and Related Party Transactions—Agreement Among Managing Partners”). If any of Messrs. Black, Harris or Rowan becomes subject to apotential termination for cause or by reason of disability, our manager may appoint an investment professional to perform his functional responsibilities andduties until cause or disability definitively results in his termination or is determined not to have occurred, but the manager may so appoint an investmentprofessional only if such Managing Partner is unable to perform his responsibilities and duties or, as a matter of fiduciary duty, should be prohibited fromdoing so. During any such period, the Managing Partner shall continue to serve on the executive committee of our manager unless otherwise prohibited fromdoing so pursuant to the Agreement Among Managing Partners.
If Mr. Kelly’s employment is terminated by us without cause or he resigns for good reason, he will be entitled to severance of six months’ base payand reimbursement of health insurance premiums paid in the six months following his employment termination. If Mr. Kelly’s employment is terminated byus without cause or he resigns for good reason, he will vest in 50% of any unvested portion of his Plan Grant RSUs. If his employment is terminated by reasonof death or disability, he will vest in 50% of any unvested portion of his Plan Grant and Bonus Grant RSUs. We may terminate Mr. Kelly’s employment withor without cause, and we will provide 90 days’ notice (or payment in lieu of such period of notice) prior to a termination without cause. Mr. Kelly is requiredto give us 90 days’ notice prior to a resignation for any reason. He is required to protect the confidential information of Apollo both during and afteremployment. In addition, during employment and for 12 months after employment, Mr. Kelly is
- 226-

Table of Contents
also obligated to refrain from soliciting our employees, interfering with our relationships with investors or other business relations, and competing with us ina business that manages or invests in assets substantially similar to those managed or invested in by Apollo or its affiliates.
If Mr. Suydam’s employment is terminated by reason of death or disability, he will vest in 50% of his then unvested RSUs. Mr. Suydam is required toprotect our confidential information at all times. During his employment and for 12 months thereafter, Mr. Suydam is also obligated to refrain from solicitingour employees, interfering with our relationships with investors or other business relations, and competing with us in a business that manages or invests inassets substantially similar to those invested in or managed by Apollo or its affiliates. Mr. Suydam is required to provide 90 days’ notice prior to a resignationfor any reason.
The named executive officers’ obligations during and after employment were considered by the Managing Partners in determining appropriate post-employment payments and benefits for the named executive officers.
The following table lists the estimated amounts that would have been payable to each of our named executive officers in connection with atermination that occurred on the last day of our last completed fiscal year and the value of any additional equity that would vest upon such termination.When listing the potential payments to named executive officers under the plans and agreements described above, we have assumed that the applicabletriggering event occurred on December 31, 2015 and that the price per share of our Class A shares was $15.18, which is equal to the closing price on suchdate. For purposes of this table, RSU values are based on the $15.18 closing price.
Name Reason for Employment Termination
Estimated Valueof Cash
Payments($)
Estimated Valueof Equity
Acceleration($)
Leon Black Cause — — Death, disability — —
Martin Kelly Without cause, by executive for good reason 517,673 (1) 1,304,531 (2)
Death, disability — 1,854,624 (2)
John Suydam Without cause; by executive for good reason — — Death, disability — 411,909 (2)
Joshua Harris Cause — —
Death, disability — — Marc Rowan Cause — —
Death, disability — — (1) This amount would have been payable to the named executive officer had his employment been terminated by the Company without cause (and other than by reason of death or
disability) or for good reason on December 31, 2015.(2) This amount represents the additional equity vesting that the named executive officer would have received had his employment terminated in the circumstances described in the
column, “Reason for Employment Termination,” on December 31, 2015, based on the closing price of a Class A share on such date. Please see our “Outstanding EquityAwards at Fiscal Year-End” table above for information regarding the named executive officer’s unvested equity as of December 31, 2015
Director Compensation
We do not pay additional remuneration to our employees, including Messrs. Black, Harris and Rowan, for their service on our board of directors. The2015 compensation of Messrs. Black, Harris and Rowan is set forth above on the Summary Compensation Table.
During 2015, each independent director received (1) a base annual director fee of $125,000, (2) an additional annual director fee of $25,000 if he orshe a member of the audit committee, (3) an additional annual director fee of $10,000 if he or she was a member of the conflicts committee, (4) an additionalannual director fee of $25,000 (incremental to the fee described in (2)) if he or she served as the chairperson of the audit committee, and (5) an additionalannual director fee of $15,000 (incremental to the fee described in (3)) if he or she served as the chairperson of the conflicts committee. In addition,independent directors were reimbursed for reasonable expenses incurred in attending board meetings.
Currently, upon initial election to the board of directors, an independent director receives a grant of RSUs with a value of $300,000 that vests inequal annual installments on June 30 of each of the first, second and third years following the year that the grant is made. Mr. Kraft received this type ofaward on July 14, 2014 in connection with his appointment to the board of directors. Incumbent independent directors who have fully vested in their initialRSU award receive an annual RSU award with a
- 227-

Table of Contents
value of $100,000 that vests on June 30 of the year following the year that the grant is made, and the directors listed on the below table (other than Mr. Kraft)received that award on July 22, 2015.
The following table provides the compensation for our independent directors during the year ended December 31, 2015.
Name
Fees Earned orPaid in Cash
($) Stock Awards
($)(1) Total
($)Michael Ducey 175,000 81,974 256,974Paul Fribourg 135,000 81,974 216,974Robert Kraft 135,000 — 135,000A. B. Krongard 150,000 81,974 231,974Pauline Richards 175,000 81,974 256,974
(1) Represents the aggregate grant date fair value of stock awards granted, as applicable, computed in accordance with FASB ASC Topic 718. See note 14 to our consolidatedfinancial statements for further information concerning the assumptions made in valuing our RSU awards. The amounts shown do not reflect compensation actually receivedby the independent directors, but instead represent the aggregate grant date fair value of the awards. Unvested director RSUs are not entitled to distributions or distributionequivalents. As of December 31, 2015, each of Ms. Richards and Messrs. Ducey, Fribourg and Krongard, held 4,514 RSUs that were unvested and outstanding, and Mr.Kraft held 7,240 RSUs that were unvested and outstanding.
ITEM 12. SECURITY OWNERSHIP OF CERTAIN BENEFICIAL OWNERS AND MANAGEMENT AND RELATED STOCKHOLDER MATTERS
The following table sets forth information regarding the beneficial ownership of our Class A shares as of February 22, 2016 by (i) each personknown to us to beneficially own more than 5% of the voting Class A shares of Apollo Global Management, LLC, (ii) each of our directors, (iii) each personwho is a named executive officer for 2015 and (iv) all directors and executive officers as a group.
Beneficial ownership is determined in accordance with the rules of the SEC. To our knowledge, each person named in the table below has solevoting and investment power with respect to all of the Class A shares and interests in our Class B share shown as beneficially owned by such person, exceptas otherwise set forth in the notes to the table and pursuant to applicable community property laws. Unless otherwise indicated, the address of each personnamed in the table is c/o Apollo Global Management, LLC, 9 West 57th Street, New York, NY 10019.
In respect of our Class A shares, the table set forth below assumes the exchange by Holdings of all AOG Units for our Class A shares with respectto which the person listed below has the right to direct such exchange pursuant to the exchange agreement described under “Item 13. Certain Relationshipsand Related Party Transactions—Exchange Agreement,” and the distribution of such shares to such person as a limited partner of Holdings.
- 228-

Table of Contents
Class A Shares Beneficially Owned Class B Share Beneficially Owned
Number of
Shares Percent(1)
TotalPercentageof VotingPower(2)
Number ofShares Percent
Total Percentageof VotingPower(2)
Directors and Executive Officers: Leon Black(3)(4) 92,727,166 33.6% 60.9% 1 100% 60.9%
Joshua Harris(3)(4) 53,932,643 22.7% 60.9% 1 100% 60.9%
Marc Rowan(3)(4) 46,296,921 20.2% 61.1% 1 100% 60.9%
Pauline Richards 26,867 * * — — —
Alvin Bernard Krongard(5) 274,218 * * — — —
Michael Ducey(6) 32,232 * * — — —
Robert Kraft(7) 263,620 * * — — —
Paul Fribourg 29,063 * * — — —
Martin Kelly(8) 146,872 * * — — —
John Suydam(9) 1,019,972 * * — — —
All directors and executive officers as a group (tenpersons)(10) 194,749,574 51.8% 54.9% 1 100% 60.9%
BRH(4) — — — 1 100% 60.9%
AP Professional Holdings, L.P.(11) 216,169,856 54.1% 60.9% — — —
5% Stockholders: UBS Group AG(12) 10,226,989 5.6% 2.9% — — —
*Represents less than 1%.(1) The percentage of beneficial ownership of our Class A shares is based on voting and non-voting Class A shares outstanding.(2) The total percentage of voting power is based on voting Class A shares and the Class B share.(3) The number of Class A shares presented are held by estate planning vehicles, for which this individual disclaims beneficial ownership except to the extent of his pecuniary
interest therein. The number of Class A shares presented do not include any Class A shares owned by Holdings with respect to which this individual, as one of the threeowners of all of the interests in BRH, the general partner of Holdings, or as a party to the Agreement Among Managing Partners described under “Item 13. CertainRelationships and Related Party Transactions—Agreement Among Managing Partners” or the Managing Partner Shareholders Agreement described under “Item 13. CertainRelationships and Related Party Transactions—Managing Partner Shareholders Agreement,” may be deemed to have shared voting or dispositive power. Each of theseindividuals disclaims any beneficial ownership of these shares, except to the extent of his pecuniary interest therein.
(4) BRH, the holder of the Class B share, is one third owned by Mr. Black, one third owned by Mr. Harris and one third owned by Mr. Rowan. Pursuant to the AgreementAmong Managing Partners, the Class B share is to be voted and disposed of by BRH based on the determination of at least two of the three Managing Partners; as such, theyshare voting and dispositive power with respect to the Class B share. As of February 22, 2016, Mr. Rowan beneficially owned an additional 565,519 Class A shares throughan estate planning vehicle, for which voting and investment control are exercised by Mr. Rowan.
(5) Includes 250,000 Class A shares held by a trust for the benefit of Mr. Krongard’s children, for which Mr. Krongard’s children are the trustees. Mr. Krongard disclaimsbeneficial ownership with respect to such shares, except to the extent of his pecuniary interest therein.
(6) Includes 2,616 Class A shares held by two trusts for the benefit of Mr. Ducey’s grandchildren, for which Mr. Ducey and several of Mr. Ducey’s immediate family membersare trustees and have shared investment power. Mr. Ducey disclaims beneficial ownership of the Class A shares held in the trusts, except to the extent of his pecuniary interesttherein.
(7) Includes 260,000 Class A shares held by two entities, which are under the sole control of Mr. Kraft, and may be deemed to be beneficially owned by Mr. Kraft.(8) Includes 15,625 RSUs covering Class A shares which will vest and with respect to which Mr. Kelly will have the right to acquire beneficial ownership within 60 days of
February 22, 2016.(9) Includes 249,009 Class A shares held by a trust for the benefit of Mr. Suydam’s spouse and children, for which Mr. Suydam’s spouse is the trustee. Mr. Suydam disclaims
beneficial ownership with respect to such shares, except to the extent of his pecuniary interest therein.(10) Refers to shares beneficially owned by the individuals who were directors and executive officers as of February 22, 2016.(11) Assumes that no Class A shares are distributed to the limited partners of Holdings. The general partner of Holdings, is BRH, which is one third owned by Mr. Black, one
third owned by Mr. Harris and one third owned by Mr. Rowan. BRH is also the general partner of BRH Holdings, L.P., the limited partnership through which Messrs. Black,Harris and Rowan indirectly beneficially own (through estate planning vehicles) their limited partner interests in Holdings. These individuals disclaim any beneficial ownershipof these Class A shares, except to the extent of their pecuniary interest therein.
(12) Based on a Schedule 13G filed on February 9, 2016, by UBS Group AG. The address of UBS Group AG is Bahnhofstrasse 45, PO BOX CH-8021, Zurich, Suwitzerland.
- 229-

Table of Contents
Securities Authorized for Issuance under Equity Incentive Plans
The following table sets forth information concerning the awards that may be issued under the Company’s Omnibus Equity Incentive Plan as ofDecember 31, 2015.
Plan Category
Number of Securities to be IssuedUpon Exercise of Outstanding
Options, Warrants and Rights(1)
Weighted-Average ExercisePrice of Outstanding Options,
Warrants and Rights
Number of SecuritiesRemaining Available for Future
Issuance Under EquityCompensation Plans (excluding
securities reflected in column(a)(2)
(a) (b) (c)Equity Compensation Plans Approved bySecurity Holders 17,551,579 $17.69 37,324,169Equity Compensation Plans Not Approved bySecurity Holders — — —
Total 17,551,579 $17.69 37,324,169
(1) Reflects the aggregate number of outstanding options and RSUs granted under the Company’s 2007 Omnibus Equity Incentive Plan (the “Equity Plan”) as of December 31,2015.
(2) The Class A shares reserved under the Equity Plan are increased on the first day of each fiscal year by (i) the amount (if any) by which (a) 15% of the number of outstandingClass A shares and AOG Units exchangeable for Class A shares on a fully converted and diluted basis on the last day of the immediately preceding fiscal year exceeds (b) thenumber of shares then reserved and available for issuance under the Equity Plan, or (ii) such lesser amount by which the administrator may decide to increase the number of ClassA shares. The number of shares reserved under the Equity Plan is also subject to adjustment in the event of a share split, share dividend, or other change in our capitalization.Generally, employee shares that are forfeited, canceled, surrendered or exchanged from awards under the Equity Plan will be available for future awards. We have filed aregistration statement and intend to file additional registration statements on Form S-8 under the Securities Act to register Class A shares under the Equity Plan (including pursuantto automatic annual increases). Any such Form S-8 registration statement will automatically become effective upon filing. Accordingly, Class A shares registered under suchregistration statement will be available for sale in the open market.
- 230-

Table of Contents
ITEM 13. CERTAIN RELATIONSHIPS AND RELATED PARTY TRANSACTIONS
Agreement Among Managing Partners
Our Managing Partners have entered into the Agreement Among Managing Partners. The Managing Partners own Holdings in accordance withtheir respective sharing percentages, or “Sharing Percentages,” as set forth in the Agreement Among Managing Partners. For the purposes of the AgreementAmong Managing Partners, “Pecuniary Interest” means, with respect to each Managing Partner, the number of AOG Units that would be distributable to himassuming that Holdings was liquidated and its assets distributed in accordance with its governing agreements.
Pursuant to the Agreement Among Managing Partners, each Managing Partner is vested in full in their respective AOG Units. We may notterminate a Managing Partner except for cause or by reason of disability.
The transfer by a Managing Partner of any portion of his Pecuniary Interest to a permitted transferee will in no way affect any of his obligationsunder the Agreement Among Managing Partners; provided, that all permitted transferees are required to sign a joinder to the Agreement Among ManagingPartners.
The Managing Partners’ respective Pecuniary Interests in certain funds, or the “Heritage Funds,” within the Apollo Operating Group are not heldin accordance with the Managing Partners’ respective Sharing Percentages. Instead, each Managing Partner’s Pecuniary Interest in such Heritage Funds isheld in accordance with the historic ownership arrangements among the Managing Partners, and the Managing Partners continue to share the operatingincome in such Heritage Funds in accordance with their historic ownership arrangement with respect to such Heritage Funds.
The Agreement Among Managing Partners may be amended and the terms and conditions of the Agreement Among Managing Partners may bechanged or modified upon the unanimous approval of the Managing Partners. We, our shareholders (other than the Strategic Investors, as set forth under “-Lenders Rights Agreement-Amendments to Managing Partner Transfer Restrictions”) and the Apollo Operating Group have no ability to enforce anyprovision of the Agreement Among Managing Partners or to prevent the Managing Partners from amending it.
Managing Partner Shareholders Agreement
We have entered into the Managing Partner Shareholders Agreement with our Managing Partners. The Managing Partner ShareholdersAgreement provides the Managing Partners with certain rights with respect to the approval of certain matters and the designation of nominees to serve on ourboard of directors, as well as registration rights for our securities that they own.
Board Representation
The Managing Partner Shareholders Agreement requires our board of directors, so long as the Apollo control condition is satisfied, to nominateindividuals designated by our manager such that our manager will have a majority of the designees on our board.
Transfer Restrictions
The Managing Partner Shareholders Agreement provides that no Managing Partner may, nor shall any of such Managing his permittedtransferees, directly or indirectly, voluntarily effect cumulative transfers of Pecuniary Interests (as defined in the Managing Partner Shareholders Agreement),representing more than: (i) 22.5% of his Pecuniary Interests at any time on or after the fourth anniversary and prior to the fifth anniversary of our IPO; (ii) 30%of his Pecuniary Interests at any time on or after the fifth anniversary and prior to the sixth anniversary of our IPO; and (iii) 100% of his Pecuniary Interests atany time on or after the sixth anniversary of our IPO, other than, in each case, with respect to transfers (a) from one Managing Partner to another ManagingPartner, (b) to a permitted transferee of such Managing Partner, or (c) in connection with a sale by one or more of our Managing Partners in one or a relatedseries of transactions resulting in the Managing Partners owning or controlling, directly or indirectly, less than 50.1% of the economic or voting interests inus or the Apollo Operating Group, or any other person exercising control over us or the Apollo Operating Group by contract, which would include a transferof control of our manager.
The percentages referenced in the preceding paragraph will apply to the aggregate amount of Equity Interests held by each Managing Partner(and his permitted transferees) as of July 13, 2007. Following the sixth anniversary of the IPO, each Managing Partner and his permitted transferees maytransfer all of the Pecuniary Interests of such Managing Partner to any person or entity in accordance with Rule 144, in a registered public offering or in atransaction exempt from the registration requirements of the Securities Act. The above transfer restrictions will lapse with respect to a Managing Partner if hedies or becomes disabled.
A “permitted transferee” means, with respect to each Managing Partner and his permitted transferees, (i) such Managing Partner’s spouse, (ii) alineal descendant of such Managing Partner’s parents (or any such descendant’s spouse), (iii) a charitable
- 231-

Table of Contents
institution controlled by such Managing Partner, (iv) a trustee of a trust (whether inter vivos or testamentary), the current beneficiaries and presumptiveremaindermen of which are one or more of such Managing Partner and persons described in clauses (i) through (iii) above, (v) a corporation, limited liabilitycompany or partnership, of which all of the outstanding shares of capital stock or interests therein are owned by one or more of such Managing Partner andpersons described in clauses (i) through (iv) above, (vi) an individual mandated under a qualified domestic relations order, (vii) a legal or personalrepresentative of such Managing Partner in the event of his death or disability, (viii) any other Managing Partner with respect to transactions contemplatedby the Managing Partner Shareholders Agreement, and (ix) any other Managing Partner who is then employed by Apollo or any of its affiliates or anypermitted transferee of such Managing Partner in respect of any transaction not contemplated by the Managing Partner Shareholders Agreement, in each casethat agrees in writing to be bound by these transfer restrictions.
Any waiver of the above transfer restrictions may only occur with our consent. As our Managing Partners control the management of ourcompany, however, they have discretion to cause us to grant one or more such waivers. Accordingly, the above transfer restrictions might not be effective inpreventing our Managing Partners from selling or transferring their Pecuniary Interests.
Indemnity
Carried interest income from our funds can be distributed to us on a current basis, but is subject to repayment by the subsidiaries of the ApolloOperating Group that act as general partners of the funds in the event that certain specified return thresholds are not ultimately achieved. The ManagingPartners, Contributing Partners and certain other investment professionals have personally guaranteed, subject to certain limitations, the obligations of thesesubsidiaries in respect of this general partner obligation. Such guarantees are several and not joint and are limited to a particular Managing Partner’s,Contributing Partner’s or other investment professional’s distributions. Pursuant to the Managing Partner Shareholders Agreement, we agreed to indemnifyeach of our Managing Partners and certain Contributing Partners against all amounts that they pay pursuant to any of these personal guarantees in favor ofFund IV, Fund V and Fund VI (including costs and expenses related to investigating the basis for or objecting to any claims made in respect of theguarantees) for all interests that our Managing Partners and Contributing Partners have contributed or sold to the Apollo Operating Group.
Accordingly, in the event that our Managing Partners, Contributing Partners and certain other investment professionals are required to payamounts in connection with a general partner obligation for the return of previously made distributions with respect to Fund IV, Fund V and Fund VI, we willbe obligated to reimburse our Managing Partners and certain Contributing Partners for the indemnifiable percentage of amounts that they are required to payeven though we did not receive the distribution to which that general partner obligation related.
Registration Rights
Pursuant to the Managing Partner Shareholders Agreement, we have granted Holdings, an entity through which our Managing Partners andContributing Partners own their AOG Units, and its permitted transferees the right, under certain circumstances and subject to certain restrictions, to require usto register under the Securities Act our Class A shares held or acquired by them. Under the Managing Partner Shareholders Agreement, the registration rightsholders (i) have “demand” registration rights that require us to register under the Securities Act the Class A shares that they hold or acquire, (ii) may require usto make available registration statements permitting sales of Class A shares they hold or acquire in the market from time to time over an extended period and(iii) have the ability to exercise certain piggyback registration rights in connection with registered offerings requested by other registration rights holders orinitiated by us. We have agreed to indemnify each registration rights holder and certain related parties against any losses or damages resulting from anyuntrue statement or omission of material fact in any registration statement or prospectus pursuant to which such holder sells our shares, unless such liabilityarose from the holder’s misstatement or omission, and each registration rights holder has agreed to indemnify us against all losses caused by hismisstatements or omissions. We have filed a shelf registration statement in connection with the rights described above.
Roll-Up Agreements
Pursuant to the Roll-Up Agreements, the Contributing Partners received interests in Holdings, which we refer to as AOG Units, in exchange fortheir contribution of assets to the Apollo Operating Group. The AOG Units received by our Contributing Partners and any units into which they have beenexchanged are fully vested. AOG Units were subject to a lock-up until two years after our IPO. Thereafter, 7.5% of the AOG Units became, or will become,tradable on each of the second, third, fourth and fifth anniversaries of our IPO, with the remaining AOG Units becoming tradable on the sixth anniversary ofour IPO or upon subsequent vesting. Our Contributing Partners have the ability to direct Holdings to exercise Holdings’ registration rights described aboveunder “-Managing Partner Shareholders Agreement-Registration Rights.”
Under their Roll-Up Agreements, each of our Contributing Partners is subject to a noncompetition provision until the first anniversary of the dateof termination of his service as a partner to us. During that period, our Contributing Partners are prohibited from (i) engaging in any business activity inwhich we operate, (ii) rendering any services to any alternative asset
- 232-

Table of Contents
management business (other than that of us or our affiliates) that involves primarily (i.e., more than 50%) third-party capital or (iii) acquiring a financialinterest in, or becoming actively involved with, any competitive business (other than as a passive holding of a specified percentage of publicly tradedcompanies). In addition, our Contributing Partners are subject to nonsolicitation, nonhire and noninterference covenants during employment and for at least12 months thereafter. Our Contributing Partners are also bound to a nondisparagement covenant with respect to us and our Contributing Partners and toconfidentiality restrictions. Resignation by any of our Contributing Partners shall require ninety days’ notice. Any restricted period applicable to aContributing Partner will commence after the ninety-day notice of termination period.
Amended and Restated Exchange Agreement
We have entered into an exchange agreement with Holdings under which, subject to certain procedures and restrictions (including anyapplicable transfer restrictions and lock-up agreements described above) upon 60 days’ written notice prior to a designated quarterly date, each ManagingPartner and Contributing Partner (or certain transferees thereof) has the right to cause Holdings to exchange the AOG Units that he owns through Holdings forour Class A shares and to sell such Class A shares at the prevailing market price (or at a lower price that such Managing Partner or Contributing Partner iswilling to accept). To effect the exchange, Holdings distributes the AOG Units to be exchanged to the applicable Managing Partner or Contributing Partner.Under the exchange agreement, the Managing Partner or Contributing Partner must then simultaneously exchange one AOG Unit (being an equal limitedpartner interest in each Apollo Operating Group entity) for each Class A share received from our intermediate holding companies. As a Managing Partner orContributing Partner exchanges his AOG Units, our interest in the AOG Units will be correspondingly increased and the voting power of the Class B sharewill be correspondingly decreased.
The exchange agreement was amended and restated on May 6, 2013 and further amended and restated on March 5, 2014. The amendments to theoriginal exchange agreement (i) permit exchanging holders certain rights to revoke exchanges of their AOG Units in whole, but not in part, in certaincircumstances; (ii) permit transfers of a holder’s exchanged shares to a qualifying entity that can sell them under a Rule 10b5-1 trading plan; (iii) require theCompany to use its commercially reasonable efforts to file and keep effective a shelf registration statement relating to the exchange of Class A sharesreceived upon an exchange of AOG Units; (iv) modify the exchange mechanics to address certain tax considerations of an exchange for exchanging holders;and (v) require exchanging holders to reimburse APO Corp. for any incremental U.S. federal income tax incurred by APO Corp. as a result of the modificationof the exchange mechanics.
Amended and Restated Tax Receivable Agreement
As a result of each of AMH Holdings (Cayman), L.P. and the Apollo Operating Group entities controlled by it or Apollo Management Holdings,L.P. having made an election under Section 754 of the Internal Revenue Code, any exchanges by a Managing Partner or Contributing Partner of AOG Unitsthat he owns through Holdings (together with the corresponding interest in our Class B share) for our Class A shares in a taxable transaction may result in anadjustment to the tax basis of a portion of the assets owned by the Apollo Operating Group at the time of the exchange. The taxable exchanges may result inincreases in the tax depreciation and amortization deductions from depreciable and amortizable assets, as well as an increase in the tax basis of other assets, ofthe Apollo Operating Group that otherwise would not have been available. A portion of these increases in tax depreciation and amortization deductions, aswell as the increase in the tax basis of such other assets, will reduce the amount of tax that APO Corp. would otherwise be required to pay in the future.Additionally, our acquisition of AOG Units from the Managing Partners or Contributing Partners, such as our acquisition of AOG Units from the ManagingPartners in the Strategic Investors Transaction, have resulted, and may continue to result, in increases in tax deductions and tax basis that reduces the amountof tax that APO Corp. would otherwise be required to pay in the future.
APO Corp. has entered into a tax receivable agreement with our Managing Partners and Contributing Partners that provides for the payment byAPO Corp. to an exchanging or selling Managing Partner or Contributing Partner of 85% of the amount of actual cash savings, if any, in U.S. Federal, state,local and foreign income tax that APO Corp. realizes (or is deemed to realize in the case of an early termination payment by APO Corp. or a change of control,as discussed below) as a result of these increases in tax deductions and tax basis, and certain other tax benefits, including imputed interest expense, related topayments pursuant to the tax receivable agreement. APO Corp. expects to benefit from the remaining 15% of actual cash savings, if any, in income tax that itrealizes. For purposes of the tax receivable agreement, cash savings in income tax will be computed by comparing our actual income tax liability to theamount of such taxes that APO Corp. would have been required to pay had there been no increase to the tax basis of the tangible and intangible assets of theapplicable Apollo Operating Group entity as a result of the transaction and had APO Corp. not entered into the tax receivable agreement. The tax savingsachieved may not ensure that we have sufficient cash available to pay our tax liability or generate additional distributions to our investors. Also, we mayneed to incur additional debt to repay the tax receivable agreement if our cash flow needs are not met. The term of the tax receivable agreement will continueuntil all such tax benefits have been utilized or expired, unless APO Corp. exercises the right to terminate the tax receivable agreement by paying an amountbased on the present value of payments remaining to be made under the agreement with respect to units that have been exchanged or sold and units whichhave not yet been exchanged or sold. Such present value
- 233-

Table of Contents
will be determined based on certain assumptions, including that APO Corp. would have sufficient taxable income to fully utilize the deductions that wouldhave arisen from the increased tax deductions and tax basis and other benefits related to the tax receivable agreement. In the event that other of our current orfuture U.S. subsidiaries become taxable as corporations and acquire AOG Units in the future, or if we become taxable as a corporation for U.S. Federal incometax purposes, each U.S. corporation will become subject to a tax receivable agreement with substantially similar terms. In connection with an amendment ofthe AMH partnership agreement in April 2010, the tax receivable agreement was revised to reflect the Managing Partners’ agreement to defer 25% of requiredpayments pursuant to the tax receivable agreement that were attributable to the 2010 fiscal year until 2015.
The IRS could challenge our claim to any increase in the tax basis of the assets owned by the Apollo Operating Group that results from theexchanges entered into by the Managing Partners or Contributing Partners. The IRS could also challenge any additional tax depreciation and amortizationdeductions or other tax benefits we claim as a result of such increase in the tax basis of such assets. If the IRS were to successfully challenge a tax basisincrease or tax benefits we previously claimed from a tax basis increase, our Managing Partners and Contributing Partners would not be obligated under thetax receivable agreement to reimburse APO Corp. for any payments previously made to it (although future payments would be adjusted to reflect the result ofsuch challenge). As a result, in certain circumstances, payments could be made to our Managing Partners and Contributing Partners under the tax receivableagreement in excess of 85% of APO Corp.’s actual cash tax savings. In general, estimating the amount of payments that may be made to our ManagingPartners and Contributing Partners under the tax receivable agreement is by its nature, imprecise, in the absence of an actual transaction, insofar as thecalculation of amounts payable depends on a variety of factors. The actual increase in tax basis and the amount and timing of any payments under the taxreceivable agreement will vary depending upon a number of factors, including:
• the timing of the transactions-for instance, the increase in any tax deductions will vary depending on the fair market value, which mayfluctuate over time, of the depreciable or amortizable assets of the Apollo Operating Group entities at the time of the transaction;
• the price of our Class A shares at the time of the transaction-the increase in any tax deductions, as well as tax basis increase in otherassets, of the Apollo Operating Group entities, is directly proportional to the price of the Class A shares at the time of the transaction;
• the taxability of exchanges-to the extent an exchange is not taxable for any reason, increased deductions will not be available; and
• the amount and timing of our income-APO Corp. will be required to pay 85% of the tax savings as and when realized, if any. If APOCorp. does not have taxable income, it is not required to make payments under the tax receivable agreement for that taxable yearbecause no tax savings were actually realized.
In addition, the tax receivable agreement provides that, upon a merger, asset sale or other form of business combination or certain other changesof control, APO Corp.’s (or its successor’s) obligations with respect to exchanged or acquired units (whether exchanged or acquired before or after suchchange of control) would be based on certain assumptions, including that APO Corp. would have sufficient taxable income to fully utilize the deductionsarising from the increased tax deductions and tax basis and other benefits related to entering into the tax receivable agreement. As noted above, no paymentswill be made if a Managing Partner or Contributing Partner elects to exchange his or her AOG Units in a tax-free transaction.
In connection with the first amendment and restatement of the exchange agreement, the tax receivable agreement was amended and restated onMay 6, 2013 to conform the agreement to the amended and restated exchange agreement, particularly to address the modified exchange mechanics, and tomake non-substantive updates to recognize certain additional Apollo Operating Group entities that have been formed since the original tax receivableagreement was entered into in 2007.
Strategic Relationship Agreement
On April 20, 2010, we announced a new strategic relationship agreement with CalPERS, whereby we agreed to reduce management fees and otherfees charged to CalPERS on funds we manage, or in the future will manage, solely for CalPERS by $125 million over a five-year period or as close a period asrequired to provide CalPERS with that benefit. The agreement further provides that we will not use a placement agent in connection with securing any futurecapital commitments from CalPERS. Through December 31, 2015, the Company had reduced fees charged to CalPERS on the funds it manages byapproximately $100.7 million.
Strategic Investors Transaction
On July 13, 2007, we sold securities to the Strategic Investors in return for a total investment of $1.2 billion. Through our intermediate holdingcompanies, we used all of the proceeds from the issuance of such securities to the Strategic Investors to
- 234-

Table of Contents
purchase AOG Units from our Managing Partners, and to purchase from our Contributing Partners a portion of their points. The Strategic Investors hold non-voting Class A shares, which represented 24.9% of our issued and outstanding Class A shares and 11.3% of the economic interest in the Apollo OperatingGroup, in each case as of December 31, 2015.
As all of their holdings in us are non-voting, neither of the Strategic Investors has any means for exerting control over our company.
Lenders Rights Agreement
In connection with the Strategic Investors Transaction, we entered into a shareholders agreement, or the “Lenders Rights Agreement,” with theStrategic Investors.
Transfer Restrictions
Each Strategic Investor may transfer (i) up to 75% of its non-voting Class A shares at any time after the fourth anniversary and prior to the fifthanniversary of our IPO and (ii) 100% of its non-voting Class A shares at any time after the fifth anniversary of our IPO.
Notwithstanding the foregoing, at no time following the registration effectiveness date may a Strategic Investor make a transfer representing 2%or more of our total Class A shares to any one person or group of related persons.
Registration Rights
Pursuant to the Lenders Rights Agreement, each Strategic Investor is afforded four demand registrations with respect to its non-voting Class Ashares, covering offerings of at least 2.5% of our total equity ownership and customary piggyback registration rights. All cutbacks between the StrategicInvestors and Holdings (or its partners) in any such demand registration shall be pro rata based upon the number of shares available for sale at such time(regardless of which party exercises a demand).
Amendments to Managing Partner Transfer Restrictions
Each Strategic Investor has a consent right with respect to any amendment or waiver of any transfer restrictions that apply to our ManagingPartners.
Apollo Operating Group Limited Partnership Agreements
Pursuant to the partnership agreements of the Apollo Operating Group partnerships, the indirect wholly-owned subsidiaries of Apollo GlobalManagement, LLC that are the general partners of those partnerships have the right to determine when distributions will be made to the partners of the ApolloOperating Group and the amount of any such distributions. If a distribution is authorized, such distribution will be made to the partners of the ApolloOperating Group pro rata in accordance with their respective partnership interests.
The partnership agreements of the Apollo Operating Group partnerships also provide that substantially all of our expenses, includingsubstantially all expenses solely incurred by or attributable to Apollo Global Management, LLC, will be borne by the Apollo Operating Group; provided thatobligations incurred under the tax receivable agreement by Apollo Global Management, LLC and its wholly-owned subsidiaries, income tax expenses ofApollo Global Management, LLC and its wholly-owned subsidiaries and indebtedness incurred by Apollo Global Management, LLC and its wholly-ownedsubsidiaries shall be borne solely by Apollo Global Management, LLC and its wholly-owned subsidiaries.
Employment Arrangements
Please see the section entitled “Item 11. Executive Compensation-Narrative Disclosure to the Summary Compensation Table and Grants of Plan-Based Awards Table” and “-Potential Payments upon Termination or Change in Control” for a description of the employment agreements of our namedexecutive officers who have employment agreements.
In addition, Joshua Black and Benjamin Black, sons of Leon Black, are each employed by the Company as a Principal and an Associate,respectively, in the Company’s private equity business. They are each entitled to receive a base salary, incentive compensation and employee benefitscomparable to those offered to similarly situated employees of the Company. Each is also eligible to receive an annual performance-based bonus in anamount determined by the Company in its discretion.
Reimbursements
In the normal course of business, our personnel have made use of aircraft owned as personal assets by Messrs. Black, Rowan and Harris. Messrs.Black, Rowan and Harris paid for their purchases of the aircraft and bear all operating, personnel and
- 235-

Table of Contents
maintenance costs associated with their operation for personal use. Payment by us for the business use of these aircraft by Messrs. Black, Rowan and Harrisand other of our personnel totaled $947,963, $1,770,837 and $988,154 for 2015 to Messrs. Black, Rowan and Harris, respectively (which amounts aredetermined based on the lower of the actual costs of operating the aircraft or a specified hourly market rate).
Investments In Apollo Funds
Our directors and executive officers are generally permitted to invest their own capital (or capital of estate planning vehicles that they control)directly in our funds and affiliated entities. In general, such investments are not subject to management fees, and in certain instances, may not be subject tocarried interest. The opportunity to invest in our funds in the same manner is available to all of the senior Apollo professionals and to those of our employeeswhom we have determined to have a status that reasonably permits us to offer them these types of investments in compliance with applicable laws. From ourinception through December 31, 2015, our professionals have committed or invested approximately $1.2 billion of their own capital to our funds.
The amount invested in our investment funds by our directors and executive officers (and their estate planning vehicles) during 2015 was$14,938,433, $15,905,028, $7,807,205, $2,530,157 and $262,832 for Messrs. Black, Harris, Rowan, Suydam, and Kelly, respectively. The amount ofdistributions, including profits and return of capital to our directors and executive officers (and their estate planning vehicles) during 2015 was $17,850,541,$15,515,746, $7,715,598, $2,516,110 and $7,718 for Messrs. Black, Harris, Rowan, Suydam, and Kelly, respectively.
Sub-Advisory Arrangements and Strategic Investment Accounts
From time to time, we have entered into sub-advisory arrangements with, or established strategic investment accounts for, certain of our directorsand executive officers or vehicles they manage. Such arrangements have been approved in advance in accordance with our policy regarding transactions withrelated persons. In addition, such sub-advisory arrangements or strategic investment accounts have been entered into with, or advised by, an Apollo entityserving as investment advisor registered under the Investment Advisers Act, and any fee arrangements, if applicable, have been on an arms-length basis. Theamount of such fees paid by our directors and executive officers or vehicles they manage to the Company during 2015 was $162,291 for Mr. Rowan.
Indemnification of Directors, Officers and Others
Under our operating agreement, in most circumstances we will indemnify the following persons, to the fullest extent permitted by law, from andagainst all losses, claims, damages, liabilities, joint or several, expenses (including legal fees and expenses), judgments, fines, penalties, interest, settlementsor other amounts: our manager; any departing manager; any person who is or was an affiliate of our manager or any departing manager; any person who is orwas a member, partner, tax matters partner, officer, director, employee, agent, fiduciary or trustee of us or our subsidiaries, our manager or any departingmanager or any affiliate of us or our subsidiaries, our manager or any departing manager; any person who is or was serving at the request of our manager orany departing manager or any affiliate of our manager or any departing manager as an officer, director, employee, member, partner, agent, fiduciary or trusteeof another person; or any person designated by our manager. We have agreed to provide this indemnification unless there has been a final and non-appealable judgment by a court of competent jurisdiction determining that these persons acted in bad faith or engaged in fraud or willful misconduct. Wehave also agreed to provide this indemnification for criminal proceedings. Any indemnification under these provisions will only be out of our assets. We maypurchase insurance against liabilities asserted against and expenses incurred by persons for our activities, regardless of whether we would have the power toindemnify the person against liabilities under our operating agreement.
We have entered into indemnification agreements with each of our directors, executive officers and certain of our employees which set forth theobligations described above.
We have also agreed to indemnify each of our Managing Partners and certain Contributing Partners against certain amounts that they are requiredto pay in connection with a general partner obligation for the return of previously made carried interest distributions in respect of Fund IV, Fund V and FundVI. See the above description of the indemnity provisions of the Managing Partner Shareholders Agreement.
Statement of Policy Regarding Transactions with Related Persons
Our board of directors has adopted a written statement of policy regarding transactions with related persons, which we refer to as our “relatedperson policy.” Our related person policy requires that a “related person” (as defined in paragraph (a) of Item 404 of Regulation S-K) must promptly discloseto our Chief Legal Officer any “related person transaction” (defined as any transaction that is reportable by us under Item 404(a) of Regulation S-K in whichwe were or are to be a participant and the amount involved exceeds $120,000 and in which any related person had or will have a direct or indirect materialinterest) and all
- 236-

Table of Contents
material facts with respect thereto. Our Chief Legal Officer will then promptly communicate that information to our manager. No related person transactionwill be consummated without the approval or ratification of the executive committee of our manager or any committee of our board of directors consistingexclusively of disinterested directors. It is our policy that persons interested in a related person transaction will recuse themselves from any vote of a relatedperson transaction in which they have an interest.
Director Independence
Because more than fifty percent of our voting power is controlled by BRH, we are considered a “controlled company” as defined in the listingstandards of the NYSE and we are exempt from the NYSE rules that require that:
• our board of directors be comprised of a majority of independent directors;
• we establish a compensation committee composed solely of independent directors; and
• we establish a nominating and corporate governance committee composed solely of independent directors.
While our board of directors is currently comprised of a majority of independent directors, we plan on availing ourselves of the controlledcompany exceptions. We have elected not to have a nominating and corporate governance committee comprised entirely of independent directors, nor acompensation committee comprised entirely of independent directors. Our board of directors has determined that five of our eight directors meet theindependence standards under the NYSE and the SEC. These directors are Messrs. Ducey, Fribourg, Krongard and Kraft and Ms. Richards.
At such time that we are no longer deemed a controlled company, our board of directors will take all action necessary to comply with allapplicable rules within the applicable time period under the NYSE listing standards.
- 237-

Table of Contents
ITEM 14. PRINCIPAL ACCOUNTING FEES AND SERVICES
The following table summarizes the aggregate fees for professional services provided by Deloitte & Touche LLP, the member firms of DeloitteTouche Tohmatsu, and their respective affiliates (collectively, the "Deloitte Entities") for the years ended December 31, 2015 and 2014:
Year Ended December 31, 2015 2014 (in thousands) Audit fees $ 10,185 (1) $ 12,810 (1) Audit fees for Apollo fund entities 20,389 (2) 20,413 (2) Audit-related fees 6,138 (3)(4) 7,360 (3)(4) Tax fees 2,188 (5) 3,275 (5) Tax fees for Apollo fund entities 19,150 (2) 16,857 (2)
(1) Audit fees consisted of fees for (a) the audits of our consolidated financial statements in our Annual Report on Form 10-K and services attendant to,or required by, statute or regulation; (b) reviews of the interim condensed consolidated financial statements included in our quarterly reports onForm 10-Q.
(2) Audit and Tax fees for Apollo fund entities consisted of services to investment funds managed by Apollo in its capacity as the general partner and/ormanager of such entities.
(3) Audit-related fees consisted of comfort letters, consents and other services related to SEC and other regulatory filings.(4) Includes audit-related fees for Apollo fund entities of $0.9 million and $0.3 million for the years ended December 31, 2015 and 2014, respectively.(5) Tax fees consisted of fees for services rendered for tax compliance and tax planning and advisory services.
Our audit committee charter requires the audit committee of our board of directors to approve in advance all audit and non-audit related servicesto be provided by our independent registered public accounting firm. All services reported in the Audit, Audit-related, Tax and Other categories above wereapproved by the committee.
- 238-

Table of Contents
PART IV
ITEM 15. EXHIBITS
ExhibitNumber Exhibit Description
2.1
Transaction Agreement, dated as of August 6, 2015, by and among AMH Holdings (Cayman), L.P., AR Capital, LLC andAR Global, LLC. (incorporated by reference to Exhibit 2.1 to the Registrant’s Form 10-Q for the period ended September30, 2015 (File No. 001-35107)).
2.2
Termination Agreement and Release, dated as of November 8, 2015, by and among AMH Holdings (Cayman), L.P.,Apollo Management Holdings, L.P., Apollo Principal Holdings I, L.P., AR Capital, LLC, AR Global Investments, LLC,Nicholas S. Schorsch, Peter M. Budko, William M. Kahane, Edward M. Weil, Jr. and Brian S. Block. (incorporated byreference to Exhibit 2.2 to the Registrant’s Form 10-Q for the period ended September 30, 2015 (File No. 001-35107)).
2.3
Membership Interest Purchase Agreement, dated as of August 6, 2015, by and among ApolloManagement Holdings, L.P., RCS Capital Corporation and RCS Capital Holdings, LLC. (incorporated by reference toExhibit 2.3 to the Registrant’s Form 10-Q for the period ended September 30, 2015 (File No. 001-35107)).
2.4
First Amendment to the Membership Interest Purchase Agreement, dated as of August 19, 2015, by and among ApolloManagement Holdings, L.P., RCS Capital Corporation and RCS Capital Holdings, LLC. (incorporated by reference toExhibit 2.4 to the Registrant’s Form 10-Q for the period ended September 30, 2015 (File No. 001-35107)).
2.5
Amended and Restated Membership Interest Purchase Agreement, dated as of November 8, 2015, by and among RCSCapital Corporation, RCS Capital Holdings, LLC and Apollo Management Holdings, L.P. (incorporated by reference toExhibit 2.5 to the Registrant’s Form 10-Q for the period ended September 30, 2015 (File No. 001-35107)).
3.1 Certificate of Formation of Apollo Global Management, LLC (incorporated by reference to Exhibit 3.1 to the Registrant’sRegistration Statement on Form S-1 (File No. 333-150141)).
3.2 Amended and Restated Limited Liability Company Agreement of Apollo Global Management, LLC (incorporated byreference to Exhibit 3.2 to the Registrant’s Registration Statement on Form S-1 (File No. 333-150141)).
4.1 Specimen Certificate evidencing the Registrant’s Class A shares (incorporated by reference to Exhibit 4.1 to theRegistrant’s Registration Statement on Form S-1 (File No. 333-150141)).
4.2
Indenture dated as of May 30, 2014, among Apollo Management Holdings, L.P., the Guarantors party thereto and WellsFargo Bank, National Association, as trustee (incorporated by reference to Exhibit 4.1 to the Registrant’s Form 8-K filedwith the Securities and Exchange Commission on May 30, 2014 (File No. 001-35107)).
4.3
First Supplemental Indenture dated as of May 30, 2014, among Apollo Management Holdings, L.P., the Guarantors partythereto and Wells Fargo Bank, National Association, as trustee (incorporated by reference to Exhibit 4.2 to theRegistrant’s Form 8-K filed with the Securities and Exchange Commission on May 30, 2014 (File No. 001-35107)).
4.4
Form of 4.000% Senior Note due 2024 (included in Exhibit 4.2 to the Registrant’s Form 8-K filed with the Securities andExchange Commission on May 30, 2014 (File No. 001-35107), which is incorporated by reference).
- 239-

Table of Contents
ExhibitNumber Exhibit Description
4.5
Second Supplemental Indenture dated as of January 30, 2015, among Apollo Management Holdings, L.P., the Guarantorsparty thereto, Apollo Principal Holdings X, L.P. and Wells Fargo Bank, National Association, as trustee (incorporated byreference to Exhibit 4.5 to the Registrant’s Form 10-K for the period ended December 31, 2014 (File No. 001-35107)).
4.6
Registration Rights Agreement, dated as of August 19, 2015, by and among RCS Capital Corporation and ApolloPrincipal Holdings I, L.P. (incorporated by reference to Exhibit 4.6 to the Registrant’s Form 10-Q for the period endedSeptember 30, 2015 (File No. 001-35107)).
10.1 Amended and Restated Limited Liability Company Operating Agreement of AGM Management, LLC dated as of July 10,2007 (incorporated by reference to Exhibit 10.1 to the Registrant’s Registration Statement on Form S-1 (File No. 333-150141)).
10.2 Third Amended and Restated Limited Partnership Agreement of Apollo Principal Holdings I, L.P. dated as of April 14,2010 (incorporated by reference to Exhibit 10.2 to the Registrant’s Registration Statement on Form S-1 (File No. 333-150141)).
10.3 Third Amended and Restated Limited Partnership Agreement of Apollo Principal Holdings II, L.P. dated as of April 14,2010 (incorporated by reference to Exhibit 10.3 to the Registrant’s Registration Statement on Form S-1 (File No. 333-150141)).
10.4 Third Amended and Restated Exempted Limited Partnership Agreement of Apollo Principal Holdings III, L.P. dated as ofApril 14, 2010 (incorporated by reference to Exhibit 10.4 to the Registrant’s Registration Statement on Form S-1 (File No.333-150141)).
10.5 Third Amended and Restated Exempted Limited Partnership Agreement of Apollo Principal Holdings IV, L.P. dated as ofApril 14, 2010 (incorporated by reference to Exhibit 10.5 to the Registrant’s Registration Statement on Form S-1 (File No.333-150141)).
+10.6 Apollo Global Management, LLC 2007 Omnibus Equity Incentive Plan, as amended and restated (incorporated byreference to Exhibit 10.8 to the Registrant’s Registration Statement on Form S-1 (File No. 333-150141)).
10.7 Agreement Among Principals, dated as of July 13, 2007, by and among Leon D. Black, Marc J. Rowan, Joshua J. Harris,Black Family Partners, L.P., MJR Foundation LLC, AP Professional Holdings, L.P. and BRH Holdings, L.P. (incorporatedby reference to Exhibit 10.9 to the Registrant’s Registration Statement on Form S-1 (File No. 333-150141)).
10.8 Shareholders Agreement, dated as of July 13, 2007, by and among Apollo Global Management, LLC, AP ProfessionalHoldings, L.P., BRH Holdings, L.P., Black Family Partners, L.P., MJR Foundation LLC, Leon D. Black, Marc J. Rowanand Joshua J. Harris (incorporated by reference to Exhibit 10.10 to the Registrant’s Registration Statement on Form S-1(File No. 333-150141)).
10.9 Second Amended and Restated Exchange Agreement, dated as of March 5, 2014, by and among Apollo GlobalManagement, LLC, Apollo Principal Holdings I, L.P., Apollo Principal Holdings II, L.P., Apollo Principal Holdings III,L.P., Apollo Principal Holdings IV, L.P., Apollo Principal Holdings V, L.P., Apollo Principal Holdings VI, L.P., ApolloPrincipal Holdings VII, L.P., Apollo Principal Holdings VIII, L.P., Apollo Principal Holdings IX, L.P., AMH Holdings(Cayman), L.P. and the Apollo Principal Holders (as defined therein) from time to time party thereto (incorporated byreference to Exhibit 10.11 to the Registrant’s Form 10-Q for the period ended March 31, 2014 (File No. 001-35107)).
- 240-

Table of Contents
ExhibitNumber Exhibit Description
10.10 Amended and Restated Tax Receivable Agreement, dated as of May 6, 2013, by and among APO Corp., Apollo PrincipalHoldings II, L.P., Apollo Principal Holdings IV, L.P., Apollo Principal Holdings VI, Apollo Principal Holdings VIII, L.P.,AMH Holdings (Cayman), L.P. and each Holder defined therein (incorporated by reference to Exhibit 10.2 to theRegistrant’s Form 8-K filed with the Securities and Exchange Commission on May 7, 2013 (File No. 001-35107)).
+10.11 Employment Agreement with Leon D. Black (incorporated by reference to Exhibit 10.43 to the Registrant’s Form 10-Qfor the period ended June 30, 2012 (File No. 001-35107)).
+10.12 Employment Agreement with Marc J. Rowan (incorporated by reference to Exhibit 10.44 to the Registrant’s Form 10-Qfor the period ended June 30, 2012 (File No. 001-35107)).
+10.13 Employment Agreement with Joshua J. Harris (incorporated by reference to Exhibit 10.45 to the Registrant’s Form 10-Qfor the period ended June 30, 2012 (File No. 001-35107)).
10.14 Second Amended and Restated Limited Partnership Agreement of Apollo Principal Holdings V, L.P. dated as of April 14,2010 (incorporated by reference to Exhibit 10.20 to the Registrant’s Registration Statement on Form S-1 (File No. 333-150141)).
10.15 Second Amended and Restated Limited Partnership Agreement of Apollo Principal Holdings VI, L.P. dated as of April 14,2010 (incorporated by reference to Exhibit 10.21 to the Registrant’s Registration Statement on Form S-1 (File No. 333-150141)).
10.16 Second Amended and Restated Exempted Limited Partnership Agreement of Apollo Principal Holdings VII, L.P. dated asof April 14, 2010 (incorporated by reference to Exhibit 10.22 to the Registrant’s Registration Statement on Form S-1 (FileNo. 333-150141)).
10.17 Second Amended and Restated Limited Partnership Agreement of Apollo Principal Holdings VIII, L.P. dated as of April14, 2010 (incorporated by reference to Exhibit 10.23 to the Registrant’s Registration Statement on Form S-1 (File No.333-150141)).
10.18 Second Amended and Restated Exempted Limited Partnership Agreement of Apollo Principal Holdings IX, L.P. dated asof April 14, 2010 (incorporated by reference to Exhibit 10.24 to the Registrant’s Registration Statement on Form S-1 (FileNo. 333-150141)).
10.19
Amended and Restated Exempted Limited Partnership Agreement of Apollo Principal Holdings X, L.P. dated as of April8, 2015 (incorporated by reference to Exhibit 10.19 to the Registrant’s Form 10-Q for the period ended March 31, 2015(File No. 001-35107)).
10.20 Fourth Amended and Restated Limited Partnership Agreement of Apollo Management Holdings, L.P. dated as of October30, 2012 (incorporated by reference to Exhibit 10.25 to the Registrant’s Form 10-Q for the period ended March 31, 2013(File No. 001-35107)).
10.21 Settlement Agreement, dated December 14, 2008, by and among Huntsman Corporation, Jon M. Huntsman, Peter R.Huntsman, Hexion Specialty Chemicals, Inc., Hexion LLC, Nimbus Merger Sub, Inc., Craig O. Morrison, Leon Black,Joshua J. Harris and Apollo Global Management, LLC and certain of its affiliates (incorporated by reference to Exhibit10.26 to the Registrant’s Registration Statement on Form S-1 (File No. 333-150141)).
- 241-

Table of Contents
ExhibitNumber Exhibit Description
10.22 First Amendment and Joinder, dated as of August 18, 2009, to the Shareholders Agreement, dated as of July 13, 2007, byand among Apollo Global Management, LLC, AP Professional Holdings, L.P., BRH Holdings, L.P., Black FamilyPartners, L.P., MJR Foundation LLC, Leon D. Black, Marc J. Rowan and Joshua J. Harris (incorporated by reference toExhibit 10.27 to the Registrant’s Registration Statement on Form S-1 (File No. 333-150141)).
10.23 Form of Indemnification Agreement (incorporated by reference to Exhibit 10.28 to the Registrant’s RegistrationStatement on Form S-1 (File No. 333-150141)).
+10.24 Form of Restricted Share Unit Award Agreement under the Apollo Global Management, LLC 2007 Omnibus EquityIncentive Plan (for Plan Grants) (incorporated by reference to Exhibit 10.31 to the Registrant’s Registration Statement onForm S-1 (File No. 333-150141)).
+10.25 Form of Restricted Share Unit Award Agreement under the Apollo Global Management, LLC 2007 Omnibus EquityIncentive Plan (for Bonus Grants) (incorporated by reference to Exhibit 10.32 to the Registrant’s Registration Statementon Form S-1 (File No. 333-150141)).
+10.26 Form of Restricted Share Unit Award Agreement under the Apollo Global Management, LLC 2007 Omnibus EquityIncentive Plan (for new independent directors) (incorporated by reference to Exhibit 10.31 to the Registrant’s Form 10-Qfor the period ended June 30, 2014 (File No. 001-35107)).
+10.27 Form of Restricted Share Unit Award Agreement under the Apollo Global Management, LLC 2007 Omnibus EquityIncentive Plan (for continuing independent directors) (incorporated by reference to Exhibit 10.32 to the Registrant’sForm 10-Q for the period ended June 30, 2014 (File No. 001-35107)).
+10.28 Form of Restricted Share Award Grant Notice and Restricted Share Award Agreement under the Apollo GlobalManagement, LLC 2007 Omnibus Equity Incentive Plan (incorporated by reference to Exhibit 10.33 to the Registrant’sForm 10-Q for the period ended June 30, 2014 (File No. 001-35107)).
+10.29 Form of Share Award Grant Notice and Share Award Agreement under the Apollo Global Management, LLC 2007Omnibus Equity Incentive Plan (for Retired Partners) (incorporated by reference to Exhibit 10.34 to the Registrant’s Form10-Q for the period ended June 30, 2014 (File No. 001-35107)).
+10.30 Apollo Management Companies AAA Unit Plan (incorporated by reference to Exhibit 10.34 to the Registrant’sRegistration Statement on Form S-1 (File No. 333-150141)).
+10.31 Non-Qualified Share Option Agreement pursuant to the Apollo Global Management, LLC 2007 Omnibus EquityIncentive Plan with Marc Spilker dated December 2, 2010 (incorporated by reference to Exhibit 10.40 to the Registrant’sRegistration Statement on Form S-1 (File No. 333-150141)).
10.32 Amended Form of Independent Director Engagement Letter (incorporated by reference to Exhibit 10.38 to theRegistrant’s Form 10-Q for the period ended March 31, 2014 (File No. 001-35107)).
+10.33 Employment Agreement with Martin Kelly, dated July 2, 2012 (incorporated by reference to Exhibit 10.42 to theRegistrant’s Form 10-Q for the period ended June 30, 2012 (File No. 001-35107)).
- 242-

Table of Contents
ExhibitNumber Exhibit Description
10.34 Second Amended and Restated Exempted Limited Partnership Agreement of AMH Holdings (Cayman), L.P., datedNovember 30, 2012 (incorporated by reference to Exhibit 10.38 to the Registrant’s Form 10-Q for the period ended June30, 2015 (File No. 001-35107)).
+10.35 Amended and Restated Limited Partnership Agreement of Apollo Advisors VI, L.P., dated as of April 14, 2005 andamended as of August 26, 2005 (incorporated by reference to Exhibit 10.41 to the Registrant’s Form 10-K for the periodended December 31, 2013 (File No. 001-35107)).
+10.36 Third Amended and Restated Limited Partnership Agreement of Apollo Advisors VII, L.P. dated as of July 1, 2008 andeffective as of August 30, 2007 (incorporated by reference to Exhibit 10.42 to the Registrant’s Form 10-K for the periodended December 31, 2013 (File No. 001-35107)).
+10.37
Third Amended and Restated Limited Partnership Agreement of Apollo Credit Opportunity Advisors I, L.P., datedJanuary 12, 2011 and made effective as of July 14, 2009 (incorporated by reference to Exhibit 10.43 to the Registrant’sForm 10-K for the period ended December 31, 2013 (File No. 001-35107)).
+10.38
Third Amended and Restated Limited Partnership Agreement of Apollo Credit Opportunity Advisors II, L.P., datedJanuary 12, 2011 and made effective as of July 14, 2009 (incorporated by reference to Exhibit 10.44 to the Registrant’sForm 10-K for the period ended December 31, 2013 (File No. 001-35107)).
+10.39
Third Amended and Restated Limited Partnership Agreement of Apollo Credit Liquidity Advisors, L.P., dated January 12,2011 and made effective as of July 14, 2009 (incorporated by reference to Exhibit 10.45 to the Registrant’s Form 10-K forthe period ended December 31, 2013 (File No. 001-35107)).
+10.40
Second Amended and Restated Limited Partnership Agreement of Apollo Credit Liquidity CM Executive Carry, L.P.,dated January 12, 2011 and made effective as of July 14, 2009 (incorporated by reference to Exhibit 10.46 to theRegistrant’s Form 10-K for the period ended December 31, 2013 (File No. 001-35107)).
+10.41
Second Amended and Restated Limited Partnership Agreement Apollo Credit Opportunity CM Executive Carry I, L.P.dated January 12, 2011 and made effective as of July 14, 2009 (incorporated by reference to Exhibit 10.47 to theRegistrant’s Form 10-K for the period ended December 31, 2013 (File No. 001-35107)).
+10.42
Second Amended and Restated Limited Partnership Agreement of Apollo Credit Opportunity CM Executive Carry II, L.P.dated January 12, 2011 and made effective as of July 14, 2009 (incorporated by reference to Exhibit 10.48 to theRegistrant’s Form 10-K for the period ended December 31, 2013 (File No. 001-35107)).
+10.43
Second Amended and Restated Exempted Limited Partnership Agreement of AGM Incentive Pool, L.P., dated June 29,2012 (incorporated by reference to Exhibit 10.49 to the Registrant’s Form 10-K for the period ended December 31, 2013(File No. 001-35107)).
10.44
Credit Agreement, dated as of December 18, 2013, by and among Apollo Management Holdings, L.P., as the TermFacility Borrower and a Revolving Facility Borrower, the other Revolving Facility Borrowers party thereto, the otherguarantors party thereto from time to time, the lenders party thereto from time to time, the issuing banks party theretofrom time to time and JPMorgan Chase Bank, N.A., as administrative agent (incorporated by reference to Exhibit 10.50 tothe Registrant’s Form 10-K for the period ended December 31, 2013 (File No. 001-35107)).
- 243-

Table of Contents
ExhibitNumber Exhibit Description
10.45
Guarantor Joinder Agreement, dated as of January 30, 2015, by Apollo Principal Holdings X, L.P. to the CreditAgreement, dated as of December 18, 2013, by and among Apollo Management Holdings, L.P., as the Term FacilityBorrower and a Revolving Facility Borrower, the other Revolving Facility Borrowers party thereto, the existingguarantors party thereto, the lenders party thereto from time to time, the issuing banks party thereto from time to time andJPMorgan Chase Bank, N.A., as administrative agent (incorporated by reference to Exhibit 10.49 to the Registrant’s Form10-Q for the period ended March 31, 2015 (File No. 001-35107)).
+10.46
Form of Letter Agreement under the Amended and Restated Limited Partnership Agreement of Apollo Advisors VIII, L.P.effective as of January 1, 2014 (incorporated by reference to Exhibit 10.56 to the Registrant’s Form 10-Q for the periodended June 30, 2014 (File No. 001-35107)).
+10.47
Form of Award Letter under the Amended and Restated Limited Partnership Agreement of Apollo Advisors VIII, L.P.effective as of January 1, 2014 (incorporated by reference to Exhibit 10.57 to the Registrant’s Form 10-Q for the periodended June 30, 2014 (File No. 001-35107)).
+10.48
Amended and Restated Limited Partnership Agreement of Apollo EPF Advisors, L.P., dated as of February 3, 2011(incorporated by reference to Exhibit 10.52 to the Registrant’s Form 10-K for the period ended December 31, 2014 (FileNo. 001-35107)).
+10.49
First Amended and Restated Exempted Limited Partnership Agreement of Apollo EPF Advisors II, L.P. dated as of April 9,2012 (incorporated by reference to Exhibit 10.53 to the Registrant’s Form 10-K for the period ended December 31, 2014(File No. 001-35107)).
+10.50
Amended and Restated Agreement of Exempted Limited Partnership of Apollo CIP Partner Pool, L.P., dated as ofDecember 18, 2014 (incorporated by reference to Exhibit 10.54 to the Registrant’s Form 10-K for the period endedDecember 31, 2014 (File No. 001-35107)).
+10.51
Form of Award Letter under the Amended and Restated Agreement of Exempted Limited Partnership Agreement ofApollo CIP Partner Pool, L.P. (incorporated by reference to Exhibit 10.55 to the Registrant’s Form 10-K for the periodended December 31, 2014 (File No. 001-35107)).
+10.52
Second Amended and Restated Agreement of Limited Partnership of Apollo Credit Opportunity Advisors III (APO FC),L.P., dated as of December 18, 2014 (incorporated by reference to Exhibit 10.56 to the Registrant’s Form 10-K for theperiod ended December 31, 2014 (File No. 001-35107)).
+10.53
Form of Award Letter under Second Amended and Restated Agreement of Limited Partnership of Apollo CreditOpportunity Advisors III (APO FC), L.P. (incorporated by reference to Exhibit 10.57 to the Registrant’s Form 10-K for theperiod ended December 31, 2014 (File No. 001-35107)).
10.54
Guaranty and Support Agreement, dated as of August 6, 2015, by and among AMH Holdings (Cayman), L.P., Nicholas S.Schorsch, Peter M. Budko, William M. Kahane, Edward M. Weil, Jr. and Brian S. Block. (incorporated by reference toExhibit 10.59 to the Registrant’s Form 10-Q for the period ended September 30, 2015 (File No. 001-35107)).
10.55
Investment Agreement, dated as of August 6, 2015, by and between Apollo Management Holdings, L.P. and RCS CapitalCorporation. (incorporated by reference to Exhibit 10.60 to the Registrant’s Form 10-Q for the period ended September30, 2015 (File No. 001-35107)).
- 244-

Table of Contents
ExhibitNumber Exhibit Description
*21.1 Subsidiaries of Apollo Global Management, LLC
*23.1 Consent of Deloitte & Touche LLP.
*31.1 Certification of the Chief Executive Officer pursuant to Rule 13a-14(a).
*31.2 Certification of the Chief Financial Officer pursuant to Rule 13a-14(a).
*32.1 Certification of the Chief Executive Officer pursuant to 18 U.S.C. Section 1350, as adopted pursuant to Section 906 of theSarbanes-Oxley Act of 2002 (furnished herewith).
*32.2 Certification of the Chief Financial Officer pursuant to 18 U.S.C. Section 1350, as adopted pursuant to Section 906 of theSarbanes-Oxley Act of 2002 (furnished herewith).
*101.INS XBRL Instance Document
*101.SCH XBRL Taxonomy Extension Scheme Document
*101.CAL XBRL Taxonomy Extension Calculation Linkbase Document
*101.DEF XBRL Taxonomy Extension Definition Linkbase Document
*101.LAB XBRL Taxonomy Extension Label Linkbase Document
*101.PRE XBRL Taxonomy Extension Presentation Linkbase Document
* Filed herewith.
+ Management contract or compensatory plan or arrangement.
The agreements and other documents filed as exhibits to this report are not intended to provide factual information or other disclosure other thanwith respect to the terms of the agreements or other documents themselves, and you should not rely on them for that purpose. In particular, anyrepresentations and warranties made by us in these agreements or other documents were made solely within the specific context of the relevant agreement ordocument and may not describe the actual state of affairs as of the date they were made or at any other time.
- 245-

Table of Contents
SIGNATURES
Pursuant to the requirements of the Securities Exchange Act of 1934, the registrant has duly caused this report to be signed on its behalf by theundersigned, thereunto duly authorized.
Apollo Global Management, LLC (Registrant)
Date: February 29, 2016 By: /s/ Martin Kelly Name: Martin Kelly
Title: Chief Financial Officer(principal financial officer andauthorized signatory)
- 246-

Table of Contents
Pursuant to the requirements of the Securities Exchange Act of 1934, this report has been signed below by the following persons on behalf of theregistrant and in the capacities and on the dates indicated:
Name Title Date
/s/ Leon Black Chairman and Chief Executive Officer and Director(principal executive officer)
February 29, 2016Leon Black
/s/ Martin Kelly Chief Financial Officer(principal financial officer)
February 29, 2016Martin Kelly
/s/ Chris Weidler Chief Accounting Officer February 29, 2016Chris Weidler (principal accounting officer)
/s/ Joshua Harris Senior Managing Director and Director February 29, 2016Joshua Harris
/s/ Marc Rowan Senior Managing Director and Director February 29, 2016Marc Rowan
/s/ Michael Ducey Director February 29, 2016Michael Ducey
/s/ Paul Fribourg Director February 29, 2016Paul Fribourg
/s/ Robert Kraft Director February 29, 2016Robert Kraft
/s/ AB Krongard Director February 29, 2016AB Krongard
/s/ Pauline Richards Director February 29, 2016Pauline Richards
- 247-

Exhibit 21.1
LIST OF SUBSIDIARIES
Entity Name Jurisdiction of Organization2012 CMBS-I GP LLC Delaware2012 CMBS-I Management LLC Delaware2012 CMBS-II GP LLC Delaware2012 CMBS-II Management LLC Delaware2012 CMBS-III GP LLC Delaware2012 CMBS-III Management LLC DelawareA/A Capital Management, LLC DelawareA/A Investor I, LLC DelawareA-A Mortgage Opportunities Corp. DelawareAAA Associates (Co-Invest VII GP), Ltd. Cayman IslandsAAA Associates (Co-Invest VII), L.P. Cayman IslandsAAA Associates, L.P. GuernseyAAA Guernsey Limited GuernseyAAA Holdings GP Limited GuernseyAAA Holdings, L.P. GuernseyAAA Life Re Carry, L.P. Cayman IslandsAAA MIP Limited GuernseyAAM GP Ltd. Cayman IslandsAAME UK CM, LLC AnguillaACC Advisors A/B, LLC DelawareACC Advisors C, LLC DelawareACC Advisors D, LLC DelawareACC Management, LLC DelawareACREFI Management, LLC DelawareAEM GP, LLC DelawareAES Advisors II GP, LLC DelawareAES Advisors II, L.P. Cayman IslandsAES Co-Investors II, LLC DelawareAGM Incentive Pool, L.P. Cayman IslandsAGM India Advisors Private Limited IndiaAGM Marketing Pool, L.P. Cayman IslandsAGRE - CRE Debt Manager, LLC DelawareAGRE - DCB, LLC DelawareAGRE - E Legacy Management, LLC DelawareAGRE - E2 Legacy Management, LLC DelawareAGRE Asia Pacific Legacy Management, LLC DelawareAGRE Asia Pacific Management, LLC DelawareAGRE Asia Pacific Real Estate Advisors GP, Ltd Cayman IslandsAGRE Asia Pacific Real Estate Advisors, L.P. Cayman IslandsAGRE CMBS GP II LLC DelawareAGRE CMBS GP LLC DelawareAGRE CMBS Management II LLC DelawareAGRE CMBS Management LLC DelawareAGRE Debt Fund I GP, Ltd. Cayman Islands
AGRE Europe Co-Invest Advisors GP, LLC Marshall Islands
AGRE Europe Co-Invest Advisors, L.P. Marshall IslandsAGRE Europe Co-Invest Management GP, LLC Marshall IslandsAGRE Europe Co-Invest Management, L.P. Marshall IslandsAGRE Europe Legacy Management, LLC DelawareAGRE Europe Management, LLC Delaware

AGRE GP Holdings, LLC DelawareAGRE Hong Kong Management, LLC DelawareAGRE NA Legacy Management, LLC DelawareAGRE NA Management, LLC DelawareAGRE U.S. Real Estate Advisors Cayman, Ltd. Cayman IslandsAGRE U.S. Real Estate Advisors GP, LLC DelawareAGRE U.S. Real Estate Advisors, L.P. DelawareAHL 2014 Investor GP, Ltd. Cayman IslandsAIF III Management, LLC DelawareAIF V Management, LLC DelawareAIF VI Management Pool Investors, L.P. DelawareAIF VI Management, LLC DelawareAIF VII Management, LLC DelawareAIF VIII Management, LLC DelawareAIM Pool Investors, L.P. DelawareAION Co-Investors (D) Ltd MauritiusALM IV, Ltd. Cayman IslandsALM Loan Funding 2010-1, LLC DelawareALM Loan Funding 2010-3, LLC DelawareALM V, Ltd. Cayman IslandsALM VI, Ltd. Cayman IslandsALM VII (R), LLC DelawareALM VII (R)-2, LLC DelawareALM VII(R), Ltd. Cayman IslandsALM VII(R)-2, Ltd. Cayman IslandsALM VII, Ltd. Cayman IslandsALM VIII, Ltd. Cayman IslandsALM X, LLC DelawareALM X, Ltd. Cayman IslandsALM XI, LLC DelawareALM XI, Ltd. Cayman IslandsALM XIV, LLC DelawareALM XIV, Ltd. Cayman IslandsALME Loan Funding II Limited IrelandALME Loan Funding III Limited IrelandAMH Holdings (Cayman), L.P. Cayman IslandsAMH Holdings GP, Ltd. Cayman IslandsAMI (Holdings), LLC DelawareAMI (Luxembourg) S.a r.l. LuxembourgANRP EPE GenPar, Ltd. Cayman IslandsANRP II GenPar, Ltd. Cayman IslandsANRP PG GenPar, Ltd. Cayman IslandsANRP Talos GenPar, Ltd. Cayman IslandsAP Alternative Assets, L.P. GuernseyAP AOP VII Transfer Holdco, LLC DelawareAP Transport LLC DelawareAP TSL Funding, LLC Delaware
APH HFA Holdings GP, Ltd Cayman Islands
APH HFA Holdings, L.P. Cayman IslandsAPH Holdings (DC), L.P. Cayman IslandsAPH Holdings (FC), L.P. Cayman IslandsAPH Holdings, L.P. Cayman IslandsAPH I (Sub I), Ltd. Cayman IslandsAPH III (Sub I), Ltd. Cayman Islands

APO (FC II), LLC AnguillaAPO (FC), LLC AnguillaAPO Asset Co., LLC DelawareAPO Corp. DelawareAPO UK (FC), LLC AnguillaApollo Achilles Co-Invest GP, LLC AnguillaApollo Administration GP Ltd. Cayman IslandsApollo Advisors (Mauritius) Ltd. MauritiusApollo Advisors (MHE), LLC DelawareApollo Advisors IV, L.P. DelawareApollo Advisors V (EH Cayman), L.P. Cayman IslandsApollo Advisors V (EH), LLC AnguillaApollo Advisors V, L.P. DelawareApollo Advisors VI (APO DC), L.P. DelawareApollo Advisors VI (APO DC-GP), LLC DelawareApollo Advisors VI (APO FC), L.P. Cayman IslandsApollo Advisors VI (APO FC-GP), LLC AnguillaApollo Advisors VI (EH), L.P. Cayman IslandsApollo Advisors VI (EH-GP), Ltd. Cayman IslandsApollo Advisors VI, L.P. DelawareApollo Advisors VII (APO DC), L.P. DelawareApollo Advisors VII (APO DC-GP), LLC DelawareApollo Advisors VII (APO FC), L.P. Cayman IslandsApollo Advisors VII (APO FC-GP), LLC AnguillaApollo Advisors VII (EH), L.P. Cayman IslandsApollo Advisors VII (EH-GP), Ltd. Cayman IslandsApollo Advisors VII, L.P. DelawareApollo Advisors VIII (APO DC), L.P. DelawareApollo Advisors VIII (APO DC-GP), LLC DelawareApollo Advisors VIII (APO FC), L.P. Cayman IslandsApollo Advisors VIII (APO FC-GP), Ltd. Cayman IslandsApollo Advisors VIII (EH), L.P. Cayman IslandsApollo Advisors VIII (EH-GP), Ltd. Cayman IslandsApollo Advisors VIII, L.P. DelawareApollo AGRE APREF Co-Investors (D), L.P. Cayman IslandsApollo AGRE Prime Co-Investors (D), LLC AnguillaApollo AGRE USREF Co-Investors (B), LLC DelawareApollo AIE II Co-Investors (B), L.P. Cayman IslandsApollo AION Capital Partners GP, LLC DelawareApollo AION Capital Partners, L.P. Cayman IslandsApollo ALS Holdings II GP, LLC DelawareApollo ALST GenPar, Ltd. Cayman IslandsApollo ALST Voteco, LLC DelawareApollo Alteri Investments Advisors, L.P. Cayman IslandsApollo Alteri Investments Management, Ltd. Cayman IslandsApollo Alternative Assets GP Limited Cayman IslandsApollo Alternative Assets, L.P. Cayman Islands
Apollo Alternative Credit Absolute Return Advisors LLC Delaware
Apollo Alternative Credit Absolute Return Management LLC DelawareApollo Alternative Credit Long Short Advisors LLC DelawareApollo Alternative Credit Long Short Management LLC DelawareApollo A-N Credit Advisors (APO FC Delaware), L.P. DelawareApollo A-N Credit Advisors (APO FC-GP), LLC DelawareApollo A-N Credit Co-Investors (FC-D), L.P. Delaware

Apollo A-N Credit Management, LLC DelawareApollo Anguilla B LLC AnguillaApollo ANRP Advisors (APO DC), L.P. DelawareApollo ANRP Advisors (APO DC-GP), LLC DelawareApollo ANRP Advisors (APO FC), L.P. Cayman IslandsApollo ANRP Advisors (APO FC-GP), LLC AnguillaApollo ANRP Advisors (IH), L.P. Cayman IslandsApollo ANRP Advisors (IH-GP), LLC AnguillaApollo ANRP Advisors II (APO DC), L.P. DelawareApollo ANRP Advisors II (APO DC-GP), LLC DelawareApollo ANRP Advisors II, L.P. DelawareApollo ANRP Advisors, L.P. DelawareApollo ANRP Capital Management II, LLC DelawareApollo ANRP Capital Management, LLC DelawareApollo ANRP Co-Investors (D), L.P. DelawareApollo ANRP Co-Investors (DC-D), L.P. DelawareApollo ANRP Co-Investors (FC-D), LP AnguillaApollo ANRP Co-Investors (IH-D), LP AnguillaApollo ANRP Co-Investors II (D), L.P. DelawareApollo ANRP Co-Investors II (DC-D), L.P. DelawareApollo ANRP Fund Administration, LLC DelawareApollo APC Advisors, L.P. Cayman IslandsApollo APC Capital Management, LLC AnguillaApollo APC Management GP, LLC DelawareApollo APC Management, L.P. DelawareApollo Arrowhead Management, LLC DelawareApollo Asia Administration, LLC DelawareApollo Asia Advisors, L.P. DelawareApollo Asia Capital Management, LLC DelawareApollo Asia Management GP, LLC DelawareApollo Asia Management, L.P. DelawareApollo Asia Real Estate Advisors GP, LLC DelawareApollo Asia Real Estate Management, LLC DelawareApollo Asian Infrastructure Management, LLC DelawareApollo ASPL Management, LLC DelawareApollo Athlon GenPar, Ltd. Cayman IslandsApollo BCSSS Management, LLC DelawareApollo BSL Management, LLC DelawareApollo Capital Credit Management, LLC DelawareApollo Capital Management GP, LLC DelawareApollo Capital Management IV, Inc. DelawareApollo Capital Management V, Inc. DelawareApollo Capital Management VI, LLC DelawareApollo Capital Management VII, LLC DelawareApollo Capital Management VIII, LLC DelawareApollo Capital Management, L.P. DelawareApollo Capital Spectrum Advisors, LLC Delaware
Apollo Capital Spectrum Management, LLC Delaware
Apollo Centre Street Advisors (APO DC), L.P. DelawareApollo Centre Street Advisors (APO DC-GP), LLC DelawareApollo Centre Street Co-Investors (DC-D), L.P. DelawareApollo Centre Street Management, LLC DelawareApollo CIP European SMAs & CLOs, L.P. Cayman IslandsApollo CIP GenPar, Ltd. Cayman Islands

Apollo CIP Global SMAs (FC), L.P. Cayman IslandsApollo CIP Global SMAs, L.P. Cayman IslandsApollo CIP Hedge Funds, L.P. Cayman IslandsApollo CIP Partner Pool, L.P. Cayman IslandsApollo CIP Professionals, L.P. DelawareApollo CIP Structured Credit, L.P. Cayman IslandsApollo CIP US SMAs, L.P. Cayman IslandsApollo CKE GP, LLC DelawareApollo COF I Capital Management, LLC DelawareApollo COF II Capital Management, LLC DelawareApollo COF Investor, LLC DelawareApollo Co-Investment Capital Management, LLC DelawareApollo Co-Investment Management, LLC DelawareApollo Co-Investors Manager, LLC DelawareApollo Co-Investors VI (D), L.P. DelawareApollo Co-Investors VI (DC-D), L.P. DelawareApollo Co-Investors VI (EH-D), LP AnguillaApollo Co-Investors VI (FC-D), LP AnguillaApollo Co-Investors VII (D), L.P. DelawareApollo Co-Investors VII (DC-D), L.P. DelawareApollo Co-Investors VII (EH-D), LP AnguillaApollo Co-Investors VII (FC-D), L.P. AnguillaApollo Co-Investors VII (NR D), L.P. DelawareApollo Co-Investors VII (NR DC-D), L.P. DelawareApollo Co-Investors VII (NR EH-D), LP AnguillaApollo Co-Investors VII (NR FC-D), LP AnguillaApollo Co-Investors VIII (D), L.P. DelawareApollo Co-Investors VIII (DC-D), L.P. DelawareApollo Co-Investors VIII (EH-D), L.P. Cayman IslandsApollo Co-Investors VIII (FC-D), L.P. Cayman IslandsApollo Commodities Management GP, LLC DelawareApollo Commodities Management, L.P DelawareApollo Commodities Management, L.P., with respect to Series I DelawareApollo Commodities Partners Fund Administration, LLC DelawareApollo Consumer Credit Advisors, LLC DelawareApollo Consumer Credit Fund, L.P. DelawareApollo Consumer Credit Master Fund, L.P. DelawareApollo Credit Advisors I, LLC DelawareApollo Credit Advisors II, LLC DelawareApollo Credit Advisors III, LLC DelawareApollo Credit Capital Management, LLC DelawareApollo Credit Fund LP DelawareApollo Credit Funding I Ltd. Cayman IslandsApollo Credit Funding III Ltd. Cayman IslandsApollo Credit Income Advisors LLC DelawareApollo Credit Income Co-Investors (D) LLC DelawareApollo Credit Income Management LLC Delaware
Apollo Credit Liquidity Advisors, L.P. Delaware
Apollo Credit Liquidity Capital Management, LLC DelawareApollo Credit Liquidity CM Executive Carry, L.P. DelawareApollo Credit Liquidity Investor, LLC DelawareApollo Credit Liquidity Management GP, LLC DelawareApollo Credit Liquidity Management, L.P. DelawareApollo Credit Management (CLO), LLC Delaware

Apollo Credit Management (European Senior Debt), LLC DelawareApollo Credit Management (Senior Loans) II, LLC DelawareApollo Credit Management (Senior Loans), LLC DelawareApollo Credit Management, LLC DelawareApollo Credit Opportunity Advisors I, L.P. DelawareApollo Credit Opportunity Advisors II, L.P. DelawareApollo Credit Opportunity Advisors III (APO FC) GP LLC DelawareApollo Credit Opportunity Advisors III (APO FC) LP DelawareApollo Credit Opportunity Advisors III GP LLC DelawareApollo Credit Opportunity Advisors III LP DelawareApollo Credit Opportunity CM Executive Carry I, L.P. DelawareApollo Credit Opportunity CM Executive Carry II, L.P. DelawareApollo Credit Opportunity Co-Investors III (D) LLC DelawareApollo Credit Opportunity Co-Investors III (FC-D) LLC DelawareApollo Credit Opportunity Management III LLC DelawareApollo Credit Opportunity Management, LLC DelawareApollo Credit Senior Loan Fund, L.P. DelawareApollo Credit Short Opportunities Advisors LLC DelawareApollo Credit Short Opportunities Co-Investors (D), LLC DelawareApollo Credit Short Opportunities Management, LLC DelawareApollo Emerging Markets Absolute Return Advisors GP LLC DelawareApollo Emerging Markets Absolute Return Advisors LP Cayman IslandsApollo Emerging Markets Absolute Return Co-Investors (D) GP LLC DelawareApollo Emerging Markets Absolute Return Co-Investors (D) LP DelawareApollo Emerging Markets Absolute Return Management LLC DelawareApollo Emerging Markets Fixed Income Strategies Advisors GP, LLC DelawareApollo Emerging Markets Fixed Income Strategies Advisors, L.P. Cayman IslandsApollo Emerging Markets Fixed Income Strategies Management, LLC DelawareApollo Emerging Markets, LLC DelawareApollo Energy Opportunity Advisors GP LLC DelawareApollo Energy Opportunity Advisors LP DelawareApollo Energy Opportunity Co-Investors (D) LLC DelawareApollo Energy Opportunity Management LLC DelawareApollo Energy Yield Advisors LLC DelawareApollo Energy Yield Co-Investors (D) LLC DelawareApollo Energy Yield Management LLC DelawareApollo EPF Administration, Limited Cayman IslandsApollo EPF Advisors II, L.P. Cayman IslandsApollo EPF Advisors, L.P. Cayman IslandsApollo EPF Capital Management, Limited Cayman IslandsApollo EPF Co-Investors (B), L.P. Cayman IslandsApollo EPF Co-Investors II (D), L.P. Cayman IslandsApollo EPF Co-Investors II (Euro), L.P. Cayman IslandsApollo EPF II Capital Management, LLC Marshall IslandsApollo EPF Management GP, LLC DelawareApollo EPF Management II GP, LLC DelawareApollo EPF Management II, L.P. Delaware
Apollo EPF Management, L.P. Delaware
Apollo Europe Advisors III, L.P. Cayman IslandsApollo Europe Advisors, L.P. Cayman IslandsApollo Europe Capital Management III, LLC DelawareApollo Europe Capital Management, Ltd. Cayman IslandsApollo Europe Co-Investors III (D), LLC DelawareApollo Europe Management III, LLC Delaware

Apollo Europe Management, L.P. DelawareApollo European Credit Advisors GP, LLC DelawareApollo European Credit Advisors, L.P. Cayman IslandsApollo European Credit Co-Investors, LLC DelawareApollo European Credit Management GP, LLC DelawareApollo European Credit Management, L.P. DelawareApollo European Long Short Advisors GP, LLC DelawareApollo European Long Short Advisors, L.P. Cayman IslandsApollo European Long Short Management, LLC DelawareApollo European Senior Debt Advisors II, LLC DelawareApollo European Senior Debt Advisors, LLC DelawareApollo European Senior Debt Management, LLC DelawareApollo European Strategic Advisors GP, LLC DelawareApollo European Strategic Advisors, L.P. Cayman IslandsApollo European Strategic Co-Investors, LLC DelawareApollo European Strategic Management GP, LLC DelawareApollo European Strategic Management, L.P. DelawareApollo Executive Carry VII (NR APO DC), L.P. DelawareApollo Executive Carry VII (NR APO FC), L.P. Cayman IslandsApollo Executive Carry VII (NR EH), L.P. Cayman IslandsApollo Executive Carry VII (NR), L.P. DelawareApollo Franklin Advisors (APO DC), L.P. DelawareApollo Franklin Advisors (APO DC-GP), LLC DelawareApollo Franklin Co-Investors (DC-D), L.P. DelawareApollo Franklin Management, LLC DelawareApollo Fund Administration IV, L.L.C. DelawareApollo Fund Administration V, L.L.C. DelawareApollo Fund Administration VI, LLC DelawareApollo Fund Administration VII, LLC DelawareApollo Fund Administration VIII, LLC DelawareApollo Gaucho GenPar, Ltd Cayman IslandsApollo Global Funding, LLC DelawareApollo Global Real Estate Management GP, LLC DelawareApollo Global Real Estate Management, L.P. DelawareApollo Global Securities, LLC DelawareApollo GSS GP Limited GuernseyApollo Hercules Advisors GP, LLC DelawareApollo Hercules Advisors, L.P. Cayman IslandsApollo Hercules Co-Investors (D), LLC DelawareApollo Hercules Management, LLC DelawareApollo HK TMS Investment Holdings GP, LLC DelawareApollo HK TMS Investment Holdings Management, LLC DelawareApollo India Credit Opportunity Management, LLC DelawareApollo International Management (Canada) ULC British ColumbiaApollo International Management GP, LLC DelawareApollo International Management, L.P. DelawareApollo Investment Administration, LLC Delaware
Apollo Investment Consulting LLC Delaware
Apollo Investment Management, L.P. DelawareApollo Jupiter Resources Co-Invest GP, LLC DelawareApollo Laminates Agent, LLC DelawareApollo Life Asset Ltd. Cayman IslandsApollo Lincoln Fixed Income Advisors (APO DC), L.P. DelawareApollo Lincoln Fixed Income Advisors (APO DC-GP), LLC Delaware

Apollo Lincoln Fixed Income Management, LLC DelawareApollo Lincoln Private Credit Advisors (APO DC), L.P. DelawareApollo Lincoln Private Credit Advisors (APO DC-GP), LLC DelawareApollo Lincoln Private Credit Co-Investors (DC-D), L.P. DelawareApollo Lincoln Private Credit Management, LLC DelawareApollo Longevity, LLC DelawareApollo Management (AOP) VII, LLC DelawareApollo Management (AOP) VIII, LLC DelawareApollo Management (Germany) VI, LLC DelawareApollo Management (UK) VI, LLC DelawareApollo Management (UK), L.L.C. DelawareApollo Management Advisors Espana, S.L.U. SpainApollo Management Advisors GmbH GermanyApollo Management Asia Pacific Limited Hong KongApollo Management GP, LLC DelawareApollo Management Holdings GP, LLC DelawareApollo Management Holdings, L.P. DelawareApollo Management III, L.P. DelawareApollo Management International LLP United KingdomApollo Management IV, L.P. DelawareApollo Management Singapore Pte Ltd. SingaporeApollo Management V, L.P. DelawareApollo Management VI, L.P. DelawareApollo Management VII, L.P. DelawareApollo Management VIII, L.P. DelawareApollo Management, L.P. DelawareApollo Maritime Management, LLC DelawareApollo Master Fund Administration, LLC DelawareApollo Master Fund Feeder Advisors, L.P. DelawareApollo Master Fund Feeder Management, LLC DelawareApollo MidCap FinCo Feeder GP LLC DelawareApollo MidCap Holdings (Cayman) GP, Ltd. Cayman IslandsApollo MidCap Holdings (Cayman) II GP, Ltd. Cayman IslandsApollo MidCap Holdings (Cayman) II, L.P. Cayman IslandsApollo MidCap Holdings (Cayman), L.P. Cayman IslandsApollo Moultrie Capital Management, LLC DelawareApollo Moultrie Credit Fund Advisors, L.P DelawareApollo Moultrie Credit Fund Management, LLC DelawareApollo NA Management II, LLC DelawareApollo Offshore Credit Fund Ltd. Cayman IslandsApollo Palmetto Advisors, L.P. DelawareApollo Palmetto Athene Advisors, L.P. DelawareApollo Palmetto Athene Management, LLC DelawareApollo Palmetto HFA Advisors, L.P. DelawareApollo Palmetto Management, LLC DelawareApollo Parallel Partners Administration, LLC DelawareApollo PE VIII Director, LLC Anguilla
Apollo PG GenPar, Ltd. Cayman Islands
Apollo Principal Holdings I GP, LLC DelawareApollo Principal Holdings I, L.P. DelawareApollo Principal Holdings II GP, LLC DelawareApollo Principal Holdings II, L.P. DelawareApollo Principal Holdings III GP, Ltd. Cayman IslandsApollo Principal Holdings III, L.P. Cayman Islands

Apollo Principal Holdings IV GP, Ltd. Cayman IslandsApollo Principal Holdings IV, L.P. Cayman IslandsApollo Principal Holdings IX GP, Ltd. Cayman IslandsApollo Principal Holdings IX, L.P. Cayman IslandsApollo Principal Holdings V GP, LLC DelawareApollo Principal Holdings V, L.P. DelawareApollo Principal Holdings VI GP, LLC DelawareApollo Principal Holdings VI, L.P. DelawareApollo Principal Holdings VII GP, Ltd. Cayman IslandsApollo Principal Holdings VII, L.P. Cayman IslandsApollo Principal Holdings VIII GP, Ltd. Cayman IslandsApollo Principal Holdings VIII, L.P. Cayman IslandsApollo Principal Holdings X GP, Ltd. Cayman IslandsApollo Principal Holdings X, L.P. Cayman IslandsApollo Principal Holdings XI, LLC AnguillaApollo Resolution Servicing GP, LLC DelawareApollo Resolution Servicing, L.P. DelawareApollo Rose GP, L.P. Cayman IslandsApollo Royalties Management, LLC DelawareApollo Senior Loan Fund Co-Investors (D), L.P. DelawareApollo SK Strategic Advisors GP, L.P. Cayman IslandsApollo SK Strategic Advisors, LLC AnguillaApollo SK Strategic Co-Investors (DC-D), LLC Marshall IslandsApollo SK Strategic Management, LLC DelawareApollo SOMA Advisors, L.P. DelawareApollo SOMA Capital Management, LLC DelawareApollo SOMA II Advisors, L.P. Cayman IslandsApollo SPN Advisors (APO DC), L.P. Cayman IslandsApollo SPN Advisors (APO FC), L.P. Cayman IslandsApollo SPN Advisors, L.P. Cayman IslandsApollo SPN Capital Management (APO DC-GP), LLC AnguillaApollo SPN Capital Management (APO FC-GP), LLC AnguillaApollo SPN Capital Management, LLC AnguillaApollo SPN Co-Investors (D), L.P. AnguillaApollo SPN Co-Investors (DC-D), L.P. AnguillaApollo SPN Co-Investors (FC-D), L.P. AnguillaApollo SPN Management, LLC DelawareApollo ST Capital LLC DelawareApollo ST CLO Holdings GP, LLC DelawareApollo ST Credit Partners GP LLC DelawareApollo ST Credit Strategies GP LLC DelawareApollo ST Debt Advisors LLC DelawareApollo ST Fund Management LLC DelawareApollo ST Operating LP DelawareApollo ST Structured Credit Recovery Partners II GP LLC DelawareApollo Strategic Advisors, L.P. Cayman IslandsApollo Strategic Capital Management, LLC Delaware
Apollo Strategic Management GP, LLC Delaware
Apollo Strategic Management, L.P. DelawareApollo Structured Credit Recovery Advisors III (APO DC) LLC DelawareApollo Structured Credit Recovery Advisors III LLC DelawareApollo Structured Credit Recovery Co-Investors III (D), LLC DelawareApollo Structured Credit Recovery Management III LLC DelawareApollo SVF Administration, LLC Delaware

Apollo SVF Advisors, L.P. DelawareApollo SVF Capital Management, LLC DelawareApollo SVF Management GP, LLC DelawareApollo SVF Management, L.P. DelawareApollo Tactical Value SPN Advisors (APO DC), L.P. Cayman IslandsApollo Tactical Value SPN Capital Management (APO DC-GP), LLC AnguillaApollo Tactical Value SPN Co-Investors (DC-D), L.P. AnguillaApollo Tactical Value SPN Management, LLC DelawareApollo Talos GenPar, Ltd. Cayman IslandsApollo Total Return Advisors GP LLC DelawareApollo Total Return Advisors LP Cayman IslandsApollo Total Return Co-Investors (D) GP LLC DelawareApollo Total Return Co-Investors (D) LP DelawareApollo Total Return Enhanced Advisors GP LLC DelawareApollo Total Return Enhanced Advisors LP Cayman IslandsApollo Total Return Enhanced Management LLC DelawareApollo Total Return ERISA Advisors GP LLC DelawareApollo Total Return ERISA Advisors, L.P. DelawareApollo Total Return Management LLC DelawareApollo U.S. Real Estate Advisors GP II, LLC DelawareApollo U.S. Real Estate Advisors II, L.P DelawareApollo Union Street Advisors, L.P. Cayman IslandsApollo Union Street Capital Management, LLC DelawareApollo Union Street Co-Investors (D), L.P. DelawareApollo Union Street Management, LLC DelawareApollo USREF Co-Investors II (D), LLC DelawareApollo Value Administration, LLC DelawareApollo Value Advisors, L.P. DelawareApollo Value Capital Management, LLC DelawareApollo Value Management GP, LLC DelawareApollo Value Management, L.P. DelawareApollo Verwaltungs V GmbH GermanyApollo VII TXU Administration, LLC DelawareApollo VIII GenPar, Ltd. Cayman IslandsApollo Zeus Strategic Advisors, L.P. Cayman IslandsApollo Zeus Strategic Advisors, LLC DelawareApollo Zeus Strategic Co-Investors (DC-D), LLC DelawareApollo Zeus Strategic Management, LLC DelawareApollo Zohar Advisors LLC DelawareApollo/Artus Management, LLC DelawareARM Manager, LLC DelawareAthene Asset Management, L.P. Cayman IslandsAthene Investment Analytics LLC DelawareAthene Mortgage Opportunities GP, LLC DelawareAugust Global Management, LLC FloridaBlue Bird GP, Ltd. Cayman IslandsBond3 GP, Ltd. Cayman Islands
CAI Strategic European Real Estate Advisors GP, LLC Marshall Islands
CAI Strategic European Real Estate Advisors, L.P. Marshall IslandsChamp GP, LLC DelawareChamp II Luxembourg Holdings S.a r.l. LuxembourgChamp L.P. Cayman IslandsChamp Luxembourg Holdings S.a r.l. LuxembourgCMP Apollo LLC Delaware

Cornerstone CLO, Ltd. Cayman IslandsCPI Asia G-Fdr General Partner GmbH GermanyCPI Capital Partners Asia Pacific GP Ltd. Cayman IslandsCPI Capital Partners Asia Pacific MLP II Ltd. Cayman IslandsCPI Capital Partners Europe GP Ltd. Cayman IslandsCPI CCP EU-T Scots GP Ltd. ScotlandCPI European Carried Interest, L.P. DelawareCPI European Fund GP LLC DelawareCPI NA Cayman Fund GP L.P. Cayman IslandsCPI NA Fund GP LP DelawareCPI NA GP LLC DelawareCPI NA WT Fund GP LP DelawareCyclone Royalties, LLC DelawareDelaware Rose GP, L.L.C. DelawareEPE Acquisition Holdings, LLC DelawareEPF II Team Carry Plan, L.P. Marshall IslandsFinancial Credit I Capital Management, LLC DelawareFinancial Credit II Capital Management, LLC DelawareFinancial Credit III Capital Management, LLC DelawareFinancial Credit Investment Advisors I, L.P. Cayman IslandsFinancial Credit Investment Advisors II, L.P. Cayman IslandsFinancial Credit Investment Advisors III, L.P. Cayman IslandsFinancial Credit Investment I Manager, LLC DelawareFinancial Credit Investment II Manager, LLC DelawareFinancial Credit Investment III Manager, LLC DelawareGranite Ventures II Ltd. Cayman IslandsGranite Ventures III Ltd Cayman IslandsGreen Bird GP, Ltd. Cayman IslandsGreenhouse Holdings, Ltd. Cayman IslandsGSAM Apollo Holdings, LLC DelawareGulf Stream - Compass CLO 2007, Ltd. Cayman IslandsGulf Stream - Rashinban CLO 2006-I, Ltd. Cayman IslandsGulf Stream - Sextant CLO 2006-1, Ltd. Cayman IslandsGulf Stream - Sextant CLO 2007-1, Ltd. Cayman IslandsGulf Stream Asset Management, LLC North CarolinaGulf Stream-Compass CLO 2005-II, Ltd. Cayman IslandsHarvest Holdings, LLC Marshall IslandsInsight Solutions GP, LLC DelawareKarpos Investments, LLC Marshall IslandsLapithus EPF II Team Carry Plan, L.P. Marshall IslandsLeverageSource Management, LLC DelawareLondon Prime Apartments Guernsey Holdings Limited GuernseyLondon Prime Apartments Guernsey Limited GuernseyNeptune Finance CCS, Ltd. Cayman IslandsOhio Haverly Finance Company GP, LLC DelawareOhio Haverly Finance Company, L.P. DelawareRampart CLO 2006-I Ltd. Cayman Islands
Rampart CLO 2007 Ltd. Cayman Islands
Red Bird GP, Ltd. Cayman IslandsRWNIH-ALL Advisors, LLC DelawareSmart & Final Holdco LLC DelawareST Holdings GP, LLC DelawareST Management Holdings, LLC DelawareStanhope Life Advisors, L.P. Cayman Islands

Stone Tower CLO II Ltd. Cayman IslandsStone Tower CLO III Ltd. Cayman IslandsStone Tower CLO IV Ltd Cayman IslandsStone Tower CLO V Ltd Cayman IslandsStone Tower CLO VI Ltd. Cayman IslandsStone Tower CLO VII Ltd. Cayman IslandsStone Tower Credit Solutions Fund LP DelawareStone Tower Credit Solutions GP LLC DelawareStone Tower Europe Limited IrelandStone Tower Europe LLC DelawareStone Tower Offshore Ltd. Cayman IslandsStone Tower Structured Credit Recovery Partners GP, LLC DelawareVC GP C, LLC DelawareVC GP, LLC DelawareVenator Investment Management Consulting (Shanghai) Limited ChinaVenator Real Estate Capital Partners (Hong Kong) Limited Hong KongVerso Paper Investments Management LLC Delaware

Exhibit 23.1
CONSENT OF INDEPENDENT REGISTERED PUBLIC ACCOUNTING FIRM
We consent to the incorporation by reference in the following Registration Statements of our report, dated February 29, 2016, relating to theconsolidated financial statements of Apollo Global Management, LLC and subsidiaries (the “Company”), and the effectiveness of the Company’s internalcontrol over financial reporting, appearing in this Annual Report on Form 10-K of the Company for the year ended December 31, 2015:
• Registration Statement No. 333-182844 on Form S-3ASR• Registration Statement No. 333-188415 on Form S-3ASR• Registration Statement No. 333-188416 on Form S-3ASR• Registration Statement No. 333-188417 on Form S-3ASR• Registration Statement No. 333-173161 on Form S-8
/s/ Deloitte & Touche LLPNew York, New YorkFebruary 29, 2016

Exhibit 31.1
CHIEF EXECUTIVE OFFICER CERTIFICATION
I, Leon Black, certify that:
1. I have reviewed this Annual Report on Form 10-K for the year ended December 31, 2015 of Apollo Global Management, LLC;
2. Based on my knowledge, this report does not contain any untrue statement of a material fact or omit to state a material fact necessary to makethe statements made, in light of the circumstances under which such statements were made, not misleading with respect to the period covered bythis report;
3. Based on my knowledge, the financial statements, and other financial information included in this report, fairly present in all material respectsthe financial condition, results of operations and cash flows of the Registrant as of, and for, the periods presented in this report;
4. The Registrant’s other certifying officer and I are responsible for establishing and maintaining disclosure controls and procedures (as defined inExchange Act Rules 13a-15(e) and 15d-15(e)) and internal control over financial reporting (as defined in Exchange Act Rules 13a-15(f) and15d-15(f)) for the Registrant and have:
a) Designed such disclosure controls and procedures, or caused such disclosure controls and procedures to be designed under oursupervision, to ensure that material information relating to the Registrant, including its consolidated subsidiaries, is made knownto us by others within those entities, particularly during the period in which this report is being prepared;
b) Designed such internal control over financial reporting, or caused such internal control over financial reporting to be designedunder our supervision, to provide reasonable assurance regarding the reliability of financial reporting and the preparation offinancial statements for external purposes in accordance with generally accepted accounting principles;
c) Evaluated the effectiveness of the Registrant’s disclosure controls and procedures and presented in this report our conclusionsabout the effectiveness of the disclosure controls and procedures, as of the end of the period covered by this report based on suchevaluation; and
d) Disclosed in this report any change in the Registrant’s internal control over financial reporting that occurred during theRegistrant’s most recent fiscal quarter (the Registrant’s fourth fiscal quarter in the case of an annual report) that has materiallyaffected, or is reasonably likely to materially affect, the Registrant’s internal control over financial reporting; and
5. The Registrant’s other certifying officer and I have disclosed, based on our most recent evaluation of internal control over financial reporting, tothe Registrant’s auditors and the audit committee of the Registrant’s board of directors (or persons performing the equivalent functions):
a) All significant deficiencies and material weaknesses in the design or operation of internal control over financial reporting whichare reasonably likely to adversely affect the Registrant’s ability to record, process, summarize and report financial information; and
b) Any fraud, whether or not material, that involves management or other employees who have a significant role in the Registrant’sinternal control over financial reporting.
Date: February 29, 2016
/s/ Leon BlackLeon BlackChief Executive Officer
Exhibit 31.2
CHIEF FINANCIAL OFFICER CERTIFICATION
I, Martin Kelly, certify that:
1. I have reviewed this Annual Report on Form 10-K for the year ended December 31, 2015 of Apollo Global Management, LLC
2. Based on my knowledge, this report does not contain any untrue statement of a material fact or omit to state a material fact necessary to makethe statements made, in light of the circumstances under which such statements were made, not misleading with respect to the period covered bythis report;
3. Based on my knowledge, the financial statements, and other financial information included in this report, fairly present in all material respectsthe financial condition, results of operations and cash flows of the Registrant as of, and for, the periods presented in this report;
4. The Registrant’s other certifying officer and I are responsible for establishing and maintaining disclosure controls and procedures (as defined inExchange Act Rules 13a-15(e) and 15d-15(e)) and internal control over financial reporting (as defined in Exchange Act Rules 13a-15(f) and15d-15(f)) for the Registrant and have:
a. Designed such disclosure controls and procedures, or caused such disclosure controls and procedures to be designed under oursupervision, to ensure that material information relating to the Registrant, including its consolidated subsidiaries, is made knownto us by others within those entities, particularly during the period in which this report is being prepared;
b. Designed such internal control over financial reporting, or caused such internal control over financial reporting to be designedunder our supervision, to provide reasonable assurance regarding the reliability of financial reporting and the preparation offinancial statements for external purposes in accordance with generally accepted accounting principles;
c. Evaluated the effectiveness of the Registrant’s disclosure controls and procedures and presented in this report our conclusionsabout the effectiveness of the disclosure controls and procedures, as of the end of the period covered by this report based on suchevaluation; and
d. Disclosed in this report any change in the Registrant’s internal control over financial reporting that occurred during theRegistrant’s most recent fiscal quarter (the Registrant’s fourth fiscal quarter in the case of an annual report) that has materiallyaffected, or is reasonably likely to materially affect, the Registrant’s internal control over financial reporting; and
5. The Registrant’s other certifying officer and I have disclosed, based on our most recent evaluation of internal control over financial reporting, tothe Registrant’s auditors and the audit committee of the Registrant’s board of directors (or persons performing the equivalent functions):
a. All significant deficiencies and material weaknesses in the design or operation of internal control over financial reporting whichare reasonably likely to adversely affect the Registrant’s ability to record, process, summarize and report financial information;and
b. Any fraud, whether or not material, that involves management or other employees who have a significant role in the Registrant’sinternal control over financial reporting.
Date: February 29, 2016
/s/ Martin KellyMartin KellyChief Financial Officer

Exhibit 32.1
Certification of the Chief Executive OfficerPursuant to 18 U.S.C. Section 1350,
As Adopted Pursuant to Section 906 of the Sarbanes-Oxley Act of 2002
In connection with the Annual Report of Apollo Global Management, LLC (the “Company”) on Form 10-K for the year ended December 31,2015 as filed with the Securities and Exchange Commission on the date hereof (the “Report”), I, Leon Black, Chief Executive Officer of the Company,certify, pursuant to 18 U.S.C. § 1350, as adopted pursuant to Section 906 of the Sarbanes-Oxley Act of 2002, that, to my knowledge:(1) The Report fully complies with the requirements of Section 13(a) or 15(d) of the Securities Exchange Act of 1934; and(2) The information contained in the Report fairly presents, in all material respects, the financial condition and results of operations of the
Company.
Date: February 29, 2016
/s/ Leon BlackLeon BlackChief Executive Officer
* The foregoing certification is being furnished solely pursuant to 18 U.S.C. Section 1350 and is not being filed as part of the Report or as a separatedisclosure document.

Exhibit 32.2
Certification of the Chief Financial OfficerPursuant to 18 U.S.C. Section 1350,
As Adopted Pursuant to Section 906 of the Sarbanes-Oxley Act of 2002
In connection with the Annual Report of Apollo Global Management, LLC (the “Company”) on Form 10-K for the year ended December 31,2015 as filed with the Securities and Exchange Commission on the date hereof (the “Report”), I, Martin Kelly, Chief Financial Officer of the Company,certify, pursuant to 18 U.S.C. § 1350, as adopted pursuant to Section 906 of the Sarbanes-Oxley Act of 2002, that to my knowledge:
(1) The Report fully complies with the requirements of Section 13(a) or 15(d) of the Securities Exchange Act of 1934; and
(2) The information contained in the Report fairly presents, in all material respects, the financial condition and results of operations of theCompany.
Date: February 29, 2016
/s/ Martin KellyMartin KellyChief Financial Officer
* The foregoing certification is being furnished solely pursuant to 18 U.S.C. Section 1350 and is not being filed as part of the Report or as a separatedisclosure document.


