Embed Size (px)
Citation preview

2001ANNUAL REPORT

the separation is behind us
there are manyopportunities toenhance returns
our prime focusis operationalimprovement

2 Chairman’s review
4 Chief executive’s review
6 Building Products
8 Concrete
10 Construction
11 Distribution
12 People & safety
13 Environment & community
14 Fletcher Building’s profile
16 Fletcher Building directors
18 Corporate governance
21 Fletcher Building management
22 Financial review
24 Financial statements
56 Audit report
57 Statutory disclosure
59 Shareholder information
61 Investor information
www.fletcherbuilding.com
Fletcher Building is committed to a high level of customer service. As part of this commitment,
we recently launched a significantly upgraded internet site. The new site displays information
on Fletcher Building’s operations and highlights our well established, powerful brands.
Contents
01

Chairman’s reviewA new beginning As your Chairman, I am
pleased to report, on behalf of the Board of
Directors, on the results and progress of our
new company – Fletcher Building Limited.
On 23 March this year, Fletcher BuildingLimited acquired the operations, assetsand liabilities previously attributed toFletcher Challenge Limited – BuildingOperations, completed the separationprocess from the former parent companyand began a new stand-alone corporateexistence.
This resolved an extended period ofuncertainty about the future of the business. During this time, its futureownership and the value that might beachieved were very much in question,and much forbearance was asked of theshareholders. The Directors of FletcherBuilding are very conscious of the faithshareholders have invested in them andthe company, and will use their bestendeavours to ensure that the investmentis justified.
Thus the results for this new companyare only for the period 24 March to 30June, which will be the normal year endfor Fletcher Building. In that limited trading period, improved operating performance and some recovery indemand led to significant increases inearnings and cash flow when comparedto the approximately nine months periodprior to separation.
Net earnings before unusual items were$22 million in the June period (comparedto $12 million for the rest of the year),and cash flow from operations was$159 million in the June period ($92 million in the rest of the year). Thisstrong recent improvement stands thecompany in good stead as we moveinto the current year.
A difficult full yearIt has been a complex year for FletcherBuilding. Not only was demand sharplydown compared to the previous year,but the process of separation fromFletcher Challenge was very disruptive.Initially, the Fletcher Challenge Board ofDirectors was prepared to consider asale of Fletcher Building as an alternativeto transferring it to existing FletcherChallenge shareholders. This necessitated anumber of potential acquirers conductingdue diligence to enable them to formulateoffers, and this was demanding and distracting for management. In the end,the Fletcher Challenge Board rejectedthe sale option, believing that highervalue would be created if FletcherBuilding was transferred to shareholders.In that context, it is particularly pleasingto note the recent lift in operating performance and the improved share
02
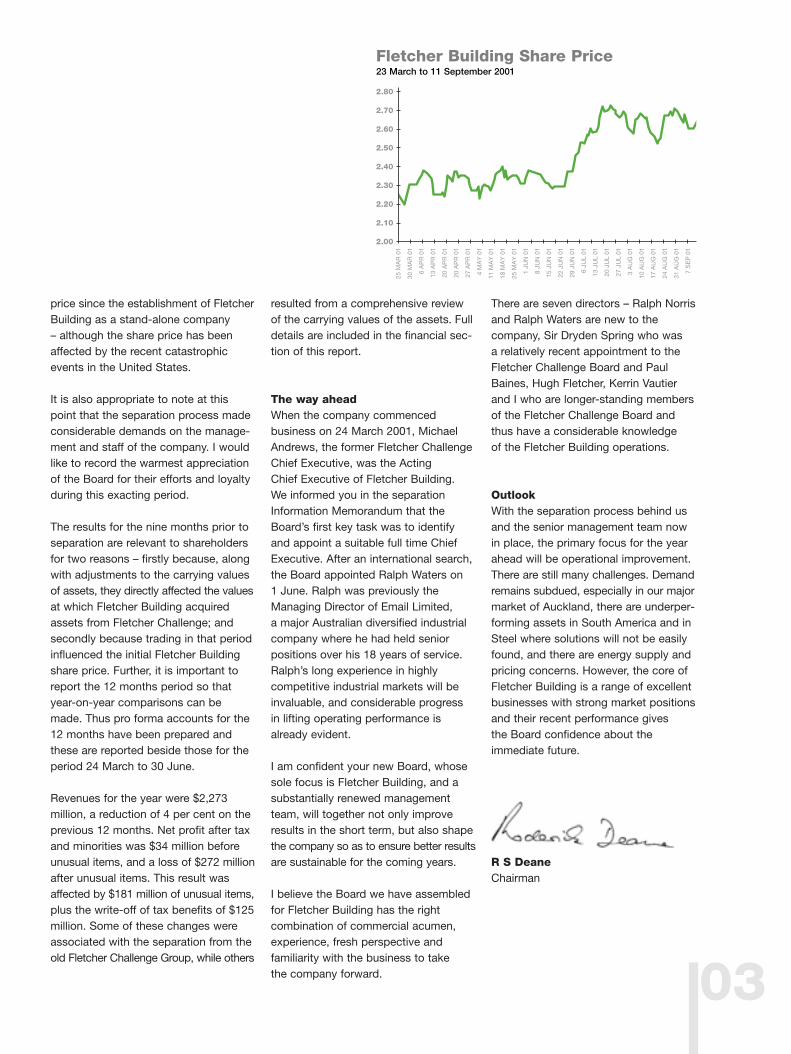
price since the establishment of FletcherBuilding as a stand-alone company – although the share price has beenaffected by the recent catastrophicevents in the United States.
It is also appropriate to note at thispoint that the separation process madeconsiderable demands on the manage-ment and staff of the company. I wouldlike to record the warmest appreciationof the Board for their efforts and loyaltyduring this exacting period.
The results for the nine months prior toseparation are relevant to shareholdersfor two reasons – firstly because, alongwith adjustments to the carrying valuesof assets, they directly affected the valuesat which Fletcher Building acquiredassets from Fletcher Challenge; andsecondly because trading in that periodinfluenced the initial Fletcher Buildingshare price. Further, it is important toreport the 12 months period so thatyear-on-year comparisons can bemade. Thus pro forma accounts for the12 months have been prepared andthese are reported beside those for theperiod 24 March to 30 June.
Revenues for the year were $2,273 million, a reduction of 4 per cent on theprevious 12 months. Net profit after taxand minorities was $34 million beforeunusual items, and a loss of $272 millionafter unusual items. This result wasaffected by $181 million of unusual items,plus the write-off of tax benefits of $125million. Some of these changes wereassociated with the separation from theold Fletcher Challenge Group, while others
resulted from a comprehensive reviewof the carrying values of the assets. Fulldetails are included in the financial sec-tion of this report.
The way aheadWhen the company commenced business on 24 March 2001, MichaelAndrews, the former Fletcher ChallengeChief Executive, was the Acting Chief Executive of Fletcher Building. We informed you in the separationInformation Memorandum that theBoard’s first key task was to identifyand appoint a suitable full time ChiefExecutive. After an international search,the Board appointed Ralph Waters on 1 June. Ralph was previously theManaging Director of Email Limited, a major Australian diversified industrialcompany where he had held seniorpositions over his 18 years of service.Ralph’s long experience in highly competitive industrial markets will beinvaluable, and considerable progress in lifting operating performance isalready evident.
I am confident your new Board, whosesole focus is Fletcher Building, and asubstantially renewed managementteam, will together not only improveresults in the short term, but also shapethe company so as to ensure better resultsare sustainable for the coming years.
I believe the Board we have assembledfor Fletcher Building has the right combination of commercial acumen,experience, fresh perspective and familiarity with the business to take the company forward.
There are seven directors – Ralph Norrisand Ralph Waters are new to the company, Sir Dryden Spring who was a relatively recent appointment to theFletcher Challenge Board and PaulBaines, Hugh Fletcher, Kerrin Vautierand I who are longer-standing membersof the Fletcher Challenge Board andthus have a considerable knowledge of the Fletcher Building operations.
OutlookWith the separation process behind usand the senior management team nowin place, the primary focus for the yearahead will be operational improvement.There are still many challenges. Demandremains subdued, especially in our majormarket of Auckland, there are underper-forming assets in South America and inSteel where solutions will not be easilyfound, and there are energy supply andpricing concerns. However, the core ofFletcher Building is a range of excellentbusinesses with strong market positionsand their recent performance gives the Board confidence about the immediate future.
R S DeaneChairman
03
Fletcher Building Share Price23 March to 11 September 2001
25 M
AR
01
30 M
AR
01
6 A
PR
01
13 A
PR
01
20 A
PR
01
20 A
PR
01
27 A
PR
01
4 M
AY
01
11 M
AY
01
18 M
AY
01
25 M
AY
01
1 JU
N 0
1
8 JU
N 0
1
15 J
UN
01
22 J
UN
01
29 J
UN
01
6 JU
L 01
13 J
UL
01
20 J
UL
01
27 J
UL
01
3 A
UG
01
10 A
UG
01
17 A
UG
01
24 A
UG
01
31 A
UG
01
7 S
EP
01
2.80
2.70
2.60
2.50
2.40
2.30
2.20
2.10
2.00

04
These business segments have clearNew Zealand market leadership in oneor more of their activities. WinstoneWallboards, Golden Bay Cement, Firth’s readymixed concrete, WinstoneAggregates, Fletcher Construction,Pacific Coil Coaters, and PlaceMakersare the major examples.
Although demand did not favour any ofthe businesses, there were good resultsfrom some business units – for example,the full year results from Golden BayCement and Winstone Wallboards, andmuch improved last quarters from FletcherConstruction, Fletcher Residential andPlaceMakers. Wood Panels, Aluminium,Firth and Winstone Aggregates allreported profits well down on the previous year through lower demandand a range of cost issues. Some ofthese were one-time costs such asthose resulting from our exit of the LunnAvenue quarry while others, includingfuel increases in the transport intensivebusinesses and resin in Wood Panels,continue into the new year. The Steelbusiness units were affected by poordomestic demand, competitive pricingand difficulties relating to the implemen-tation of a new information technologysystem. The South American businessesincurred significant losses.
The operational review that follows covers all of the company’s businesses.Whilst the full year results are quite
unsatisfactory, the results of FletcherBuilding Limited since trading com-menced on 24 March 2001 are anencouraging indication of what share-holders might expect of the companygoing forward. Also, resolution of somelong-running disputes in constructionprojects in Australia and New Zealandhas removed further uncertainty fromforward prospects.
Cash flow during the year was strong – particularly in the last quarter, where a $159 million inflow resulted in a year-end net debt of $274 million, comparedto $485 million a year earlier. Thus wehave entered the new financial year withimproving earnings, a strong balancesheet and all major disputes now resolved,providing a sound base for our first fullyear of trading as a stand-alone company.
OperationalimprovementsTo achieve its earnings potential,Fletcher Building will have to commit toa continuous improvement programmethat will affect all facets of the business.There are a number of areas wherechanges have been made to improveperformance.
OrganisationThe company has now been organisedaround four separate operating groups.Each is headed by a chief executiveoverseeing a range of businesses with acommon discipline at its core. The broader,
flatter organisation structure should alloweach chief executive more time to devoteto new initiatives such as new products,new processes, new technologies, ornew complementary business activities.The broader structure did not require thecreation of new positions; it simplyrequired some existing positions to reportdirectly to the Fletcher Building CEO,rather than through an additional level.
ManagementThe senior management team has beensubstantially changed from that in placeprior to separation from Fletcher Challenge.The Executive Committee comprises theseven most senior executives of thecompany. Only two of the present committee were also members of thesenior executive team prior to separation.
Reporting to the operating group chiefexecutives are business unit generalmanagers, and a number of these positions have also undergone or areundergoing change. It is vital that for allgeneral management positions and abovethere be a greater degree of ownershipof, and accountability for, their resultsthan might have been the case in the past.
RemunerationIncentive arrangements have beenchanged to link all performance-basedremuneration to the achievement of asatisfactory level of earnings. Thisreplaced a scheme that rewardedimprovement on the prior year.
Chief executive’s reviewOperations summary The pro forma results for the 2001 year
have been reported for each of the major segments in which
Fletcher Building conducts business. These are Building
Products, Concrete, Construction and Distribution.

Thus, while incentive remuneration entitlements are low given the poorearnings for the 2001 financial year, the previous scheme would, in the 2002financial year, have rewarded improve-ment from this low base.
CostsA hard-headed approach to all costs isvital. Fletcher Building’s head office teamhas been substantially reduced andmajor service providers have also beensubjected to a competitive pricingprocess that has achieved valuable sav-ings. Rather than use its size to achievebetter commercial terms, there is clearevidence that the reverse had occurredin too many areas. Fletcher Buildingparticipates in very competitive markets.It must be vigilant in ensuring it isachieving the lowest supplier cost andoperating its businesses with best prac-tice overhead levels. There is still muchto be done in these areas.
ConsultantsA greater level of self-sufficiency will resultin a substantial reduction in consultants’costs. Despite an over-reliance on externaladvice in the past, there is too little success to show for it.
Capital ExpenditureA disciplined review process for all capitalexpenditure is an imperative of well-runbusinesses. Management’s delegatedauthority level has been reduced fromprevious arrangements to ensure Directorsare more fully informed of investmentsand their implications. It is difficult not toconclude, given the large scale of write-downs on previous capital projects, thatthe review, approval, monitoring andpost-implementation audit processeswere not operating effectively.
InitiativeIt is insufficient to operate in a disciplinedand cost-effective manner. Markets aredynamic and products and processes are
made obsolete by new developments,new technologies and other innovations.Business units will be measured on theirinitiative and innovation, as these arevital ingredients in maintaining marketleadership.
The strategic agendaThe earnings of Fletcher Building arebuilt on a foundation of leading marketpositions for a number of the company’sbusinesses. However, the full potential ofthese leading positions is compromisedby unsatisfactory results from a numberof other involvements.
The strategic priority for the company is to assess whether these under-performingbusinesses can be improved underFletcher Building’s ownership, or whetherthey should be divested. Other businessesalso warrant review because of industrystructure, size, or relevance to FletcherBuilding’s core portfolio.
The major problems are easily identified,but finding a satisfactory solution will bethe greater challenge. To sell an under-performing business at a satisfactoryprice, an opportunity for industry ratio-nalisation is usually required. Where nosuch opportunity exists, the companyfaces the decision of whether to incurfurther write-offs to effect a sale, or bemore patient with the underperformingbusiness. If the outlook is for continuinglosses, action will be taken even if thisresults in under-realisation of asset values.
As a consequence, there are likely to befurther asset sales in the year ahead.Since balance date, an aluminium distri-bution business and our interest in theLunn Avenue quarry have been sold.
VALEIt is with deep regret that we advise ofthe death of Neil Gunn on 17 August2001. Neil was a long-serving seniorexecutive of the Company and theGeneral Manager of Winstone Wallboardsfrom 1990 to 2001. Winstone Wallboardshas long been one of Fletcher Building’smost successful businesses and Neil’sextraordinary passion for excellence andinnovation was a key part of that success.
Ralph WatersChief Executive Officer
05
06
Results were affected by the drop inresidential construction activity in NewZealand and Australia, and increasedcosts flowing from a weaker New Zealanddollar. In the last three months of theyear, results improved in line withincreased activity, particularly in thecommercial sector, offset by increasedenergy costs.
Domestic demand for plasterboarddeclined, with sales volumes down by12%. EBIT was approximately 10%lower than that for the previous year.Product prices were higher and performance board volumes improvedfrom the previous year; however, thecost of imported raw material increasedbecause of the weak New Zealand dollar.
Wood products sales volumes werelower in both the New Zealand andAustralian markets. Whilst the weakerNew Zealand dollar had a positiveimpact on export revenues, resin andshipping costs increased.
The aluminium operations experienceda significant downturn in New Zealand,with sales volumes to franchisees 19%below those for the same period in theprevious year. Export sales, particularlyto Australia, also fell. This was duelargely to the sale of the Hamilton plant,which extruded shapes for export toAustralia, in April 2000. In July 2001, the assets of the Fletcher AluminiumSolution Centres, which distributedrolled and other aluminium productswithin New Zealand, were sold to theUllrich Aluminium Company. Our corebusiness, comprising the windows anddoors operations, has been retained.
Our panel and hardware distributionoperations maintained their revenuesand EBIT in what was a difficult year. In door manufacturing, our volumeswere down 9% and average prices alsofell, while raw material costs increased.
Steel volumes were at a record high asexport orders increased, aided by thelower New Zealand dollar. Domesticprices were weak however, and
extraordinarily high energy prices in thelast quarter of the year had an adverseimpact on margins, especially in steelmanufacturing. Overall steel revenuesincreased by 3%, while EBIT declinedby 55%.
In steel manufacturing, domestic demandfor most products continued to weakenthroughout the year and domestic salesprices were on average $41 per tonnelower than last year. Production wasdiverted to lower margin export markets.Production costs per tonne increasedby approximately 20%, primarily due tohigher scrap prices and electricity charges.
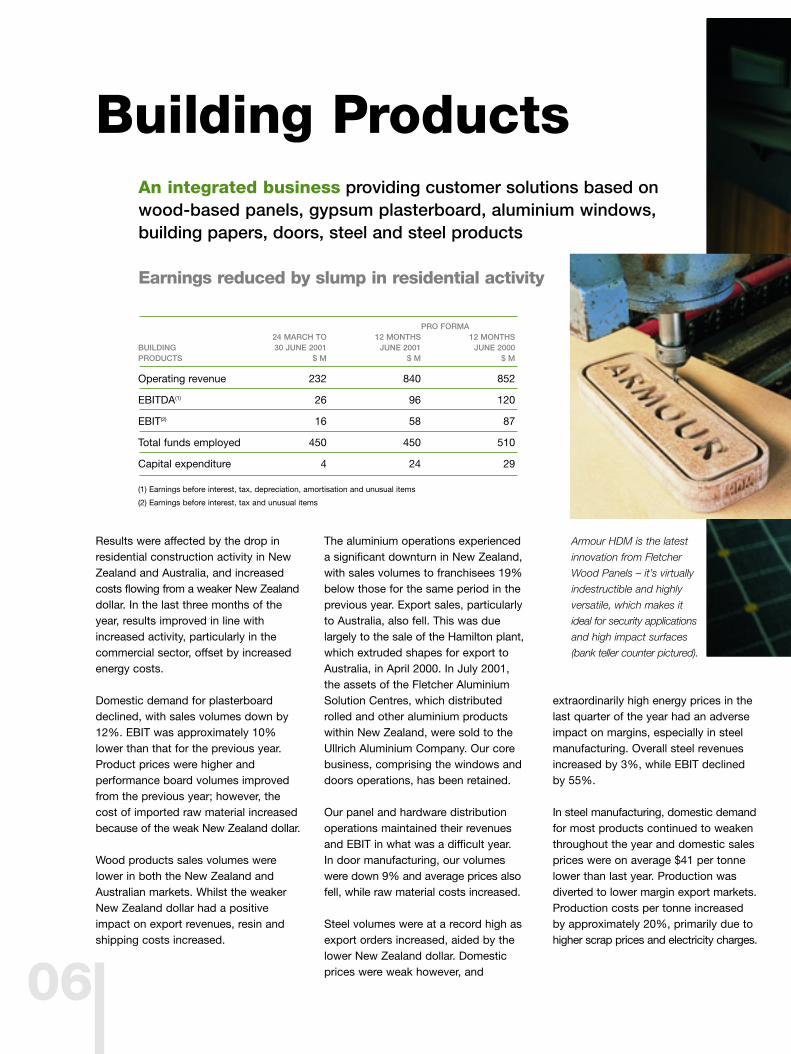
Building ProductsAn integrated business providing customer solutions based onwood-based panels, gypsum plasterboard, aluminium windows,building papers, doors, steel and steel products
Earnings reduced by slump in residential activity
Armour HDM is the latest
innovation from Fletcher
Wood Panels – it’s virtually
indestructible and highly
versatile, which makes it
ideal for security applications
and high impact surfaces
(bank teller counter pictured).
PRO FORMA24 MARCH TO 12 MONTHS 12 MONTHS
BUILDING 30 JUNE 2001 JUNE 2001 JUNE 2000PRODUCTS $ M $ M $ M
Operating revenue 232 840 852
EBITDA(1) 26 96 120
EBIT(2) 16 58 87
Total funds employed 450 450 510
Capital expenditure 4 24 29
(1) Earnings before interest, tax, depreciation, amortisation and unusual items
(2) Earnings before interest, tax and unusual items

07
Increased competition and weakerdemand in steel distribution and roofingled sales and margins to decline andrestructuring costs of $1 million wereincurred. Our continuous paint coatingplant maintained its sales volumes inthe domestic market, but saw a sharpdecline in its export markets during theyear. These operations also experienceddifficulties with the implementation oftheir new information technology systemswhich adversely affected customerservice, margins and administration costs.
An increase in scrap metal prices,together with an increase in throughput,led to a higher dividend for the year
from our joint venture partner, SimsPacific Metal Industries.
Focus and outlook for the 2002 yearAlthough conditions in the residentialmarket are expected to improve, thiswill be steady rather than strong growth.We are well placed to take advantage of any such upturns in the market. In addition, a number of new productsshould provide increased returns. On the negative side international markets, particularly in Asia, have begun the year on a quiet note.
Domestic and international steel pricesare expected to decrease during thisyear, and our focus will be on improvingthe operational performance of the business. As a priority, we will also beseeking to determine the best outcomefor the steel business in any restructuringof the Australasian steel industry.
08
New Zealand operationsRevenues were up by 3%, howeverthere were sharp regional discrepancies,with rural areas performing strongly andthe Auckland market weak in all productgroups. EBIT before unusual itemsdeclined by 30 per cent, due primarily tosofter demand for aggregates and concretepipes, increased costs associated witha change in the quarry mix in theAuckland market, and higher energy,marketing and transportation costs.
Domestic cement sales were 2% higherthan those for the previous year, and thehighest volume on record. This was particularly pleasing in view of the lowresidential and flat commercial activityin Auckland. Sales to export markets
were down by 7% from the record100,000 tonnes achieved in the previousyear. Domestic prices were similar tothose for the 2000 year, while exportprices were down 10% in the secondhalf as a result of competitor activity inoffshore markets. Cement prices to thedomestic market have been increasedapproximately 4% with effect from 1 September 2001. Cash costs of production were approximately 3%higher due to increased spot prices forelectricity, increased coal consumptionand reduced kiln run times. Shipping anddistribution costs rose due to the impactof higher fuel costs and change in theregional mix of sales. Overheads weresimilar to those for the previous year.
The aggregates operations had a difficultyear. First half earnings were affected bydelayed commissioning of plant upgradesat the Hunua and Pukekawa quarries.
The resultant shortage of capacity forcedincreased production at high extractioncosts from the Lunn Avenue quarry.With the commissioning of the newplants and improved control on spending,second half earnings improved signifi-cantly. Production costs were higher,but there was a downward trendthroughout the second half of the yearas the benefits of higher activity, strictcost control and the changing quarrymix were realised. Subsequent to balance date, the Lunn Avenue quarry,in which the Company had a 50% interest, was sold for $38 million.
Sales of readymix, concrete masonryand associated products were at similarlevels to those for the previous year.Operational expenses – particularly fortransport, marketing, restoration work andenvironmental compliance – were higher.
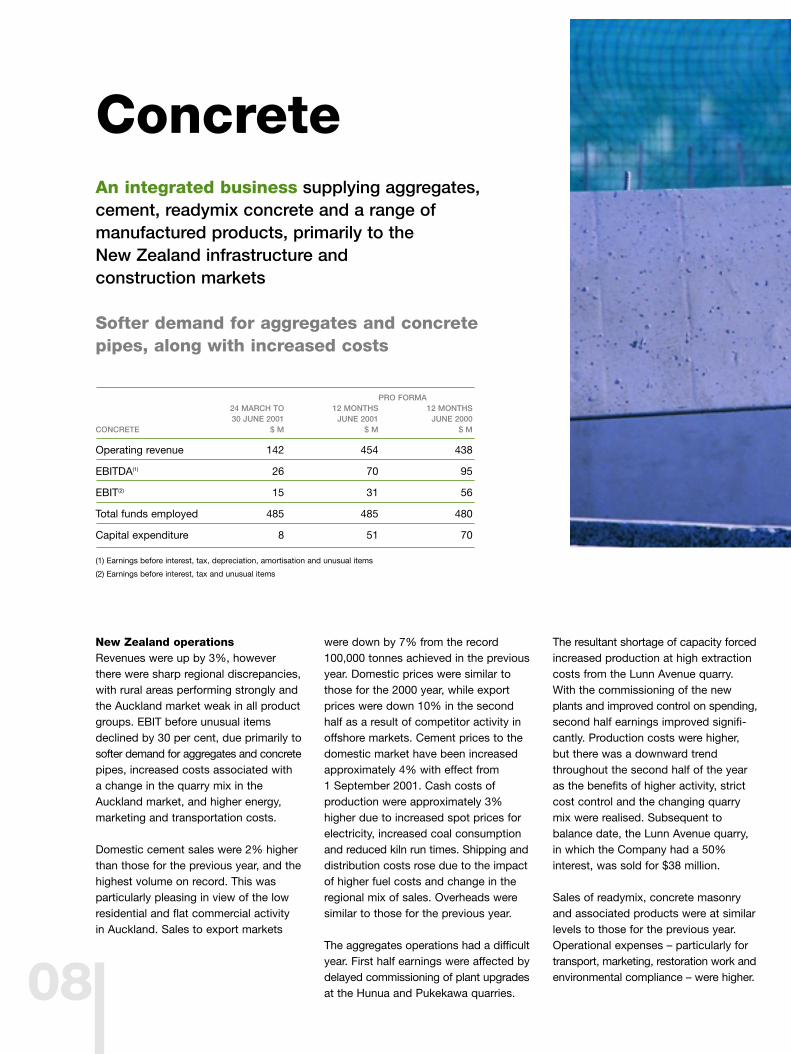
ConcreteAn integrated business supplying aggregates, cement, readymix concrete and a range of manufactured products, primarily to the New Zealand infrastructure and construction markets
Softer demand for aggregates and concrete pipes, along with increased costs
PRO FORMA24 MARCH TO 12 MONTHS 12 MONTHS30 JUNE 2001 JUNE 2001 JUNE 2000
CONCRETE $ M $ M $ M
Operating revenue 142 454 438
EBITDA(1) 26 70 95
EBIT(2) 15 31 56
Total funds employed 485 485 480
Capital expenditure 8 51 70
(1) Earnings before interest, tax, depreciation, amortisation and unusual items
(2) Earnings before interest, tax and unusual items

09
Tighter control on costs should improveearnings in the current financial year.The pre-stressed concrete productsoperations recorded a loss, but havemade significant progress in improvingtheir underlying performance.
Earnings from concrete pipes werereduced by a 20-30% fall in North Islandinfrastructure and pipeline activity. Thismeant our plants ran significantly belowcapacity, resulting in higher manufacturingcosts per tonne, while prices came underpressure from increased competition.
International operationsWeaker than expected market conditionsin Peru and Bolivia resulted in a loss atthe EBIT level. In addition, assets werewritten down by $70 million as the company recognised that the morerecent and prolonged earnings and
economic downturns warranted areassessment of the carrying value of the assets in both countries. Thebusinesses are currently under intensereview. Both management teams have been strengthened and capitalexpenditure is being held to a minimum.
In Peru, the economy has not seen anyimprovement in activity as a consequenceof the recent elections, but someimprovement is forecast over the courseof the year. In Bolivia, the outlook is lesspromising, with activity levels unlikely toimprove until the next financial year atthe earliest. Overall, the South Americanactivities plan to generate positive cashflow next year.
In India, our 50% joint venture operationsin Bangalore and Hyderabad continuedto experience a growing market forreadymix concrete and recorded a smallprofit at the EBIT level.
Focus and outlook for the 2002 yearParticular emphasis will be on achievinga more robust performance in the keyAuckland market, particularly with respectto aggregates and readymix concrete.This will be sought through tighter costcontrol, improved asset utilisation andbetter market penetration.
In offshore markets, the emphasis willbe on obtaining better performancefrom our South American assets, whilesimultaneously establishing the longer-term position of these businesses.
Stresscrete’s timely production and delivery of pre-cast products was a crucial factor in meeting the challenging
construction timetable – one floor per week – for the PricewaterhouseCoopers Tower project, in Auckland.
10
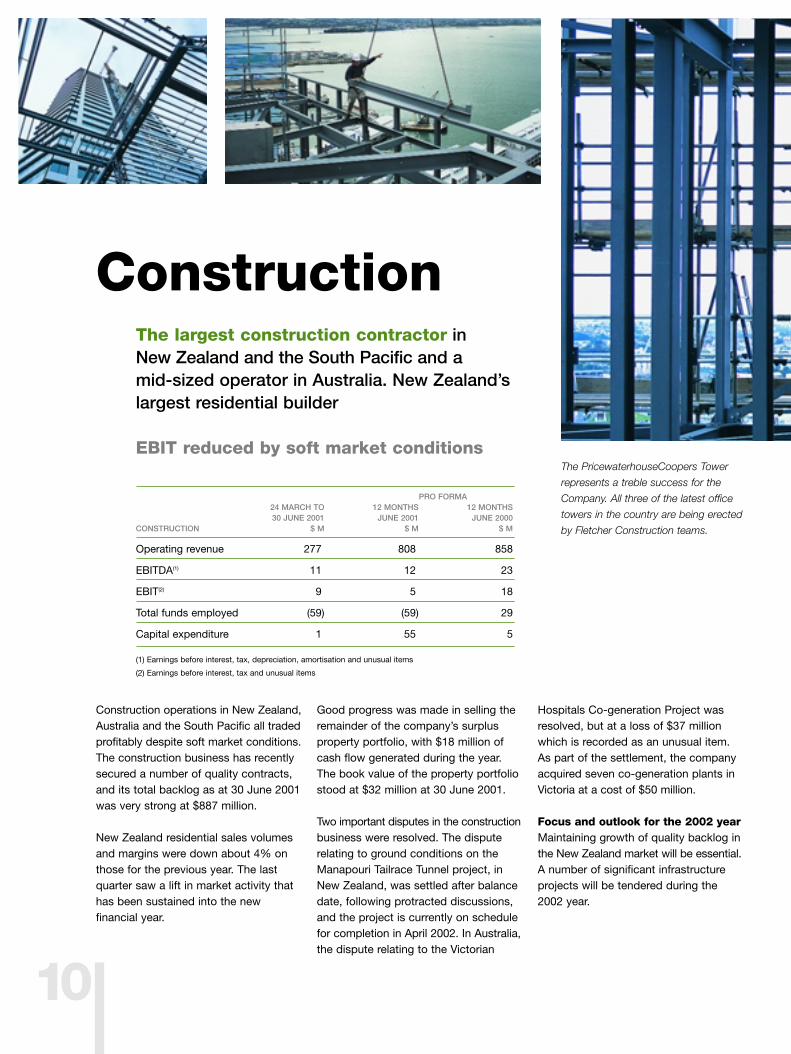
Construction
The PricewaterhouseCoopers Tower
represents a treble success for the
Company. All three of the latest office
towers in the country are being erected
by Fletcher Construction teams.
Construction operations in New Zealand,Australia and the South Pacific all tradedprofitably despite soft market conditions.The construction business has recentlysecured a number of quality contracts,and its total backlog as at 30 June 2001was very strong at $887 million.
New Zealand residential sales volumesand margins were down about 4% onthose for the previous year. The lastquarter saw a lift in market activity thathas been sustained into the new financial year.
Good progress was made in selling theremainder of the company’s surplusproperty portfolio, with $18 million ofcash flow generated during the year.The book value of the property portfoliostood at $32 million at 30 June 2001.
Two important disputes in the constructionbusiness were resolved. The disputerelating to ground conditions on theManapouri Tailrace Tunnel project, inNew Zealand, was settled after balancedate, following protracted discussions,and the project is currently on schedulefor completion in April 2002. In Australia,the dispute relating to the Victorian
Hospitals Co-generation Project wasresolved, but at a loss of $37 millionwhich is recorded as an unusual item.As part of the settlement, the companyacquired seven co-generation plants inVictoria at a cost of $50 million.
Focus and outlook for the 2002 yearMaintaining growth of quality backlog inthe New Zealand market will be essential.A number of significant infrastructureprojects will be tendered during the2002 year.
The largest construction contractor in New Zealand and the South Pacific and a mid-sized operator in Australia. New Zealand’slargest residential builder
EBIT reduced by soft market conditions
PRO FORMA24 MARCH TO 12 MONTHS 12 MONTHS30 JUNE 2001 JUNE 2001 JUNE 2000
CONSTRUCTION $ M $ M $ M
Operating revenue 277) 808) 858
EBITDA(1) 11) 12) 23
EBIT(2) 9) 5) 18
Total funds employed (59) (59) 29
Capital expenditure 1) 55) 5
(1) Earnings before interest, tax, depreciation, amortisation and unusual items
(2) Earnings before interest, tax and unusual items
11
Customer service in action at The Building Depot,
Mt Wellington.
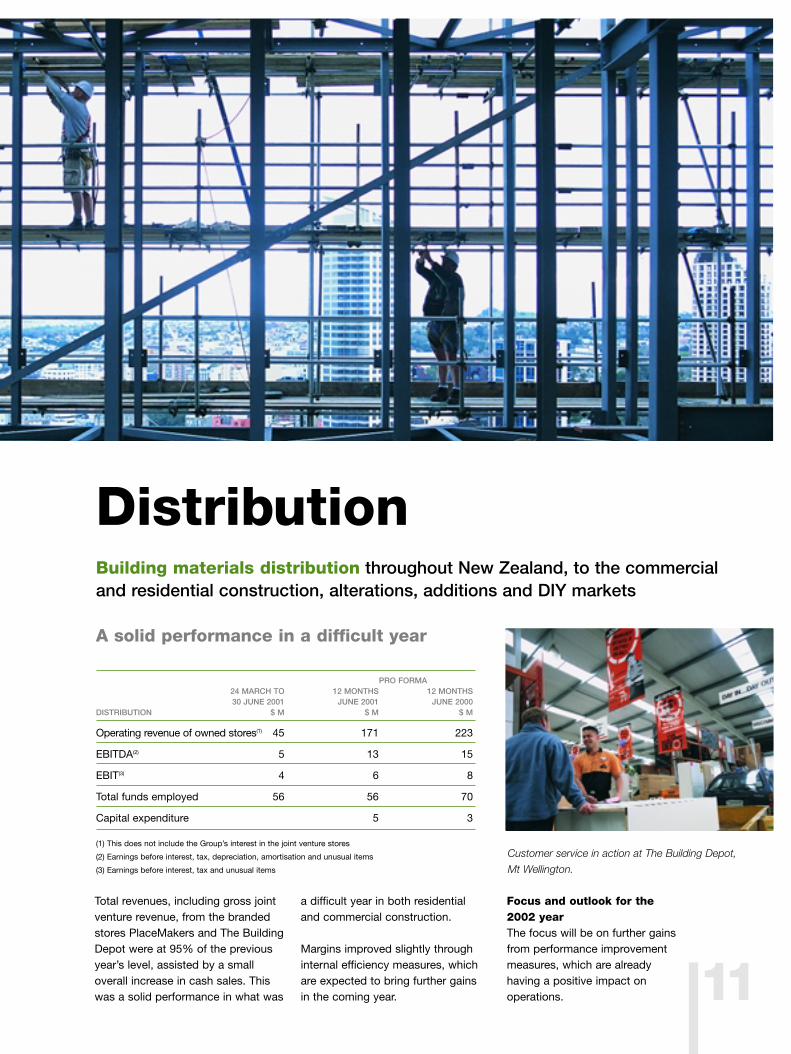
DistributionBuilding materials distribution throughout New Zealand, to the commercialand residential construction, alterations, additions and DIY markets
A solid performance in a difficult year
Total revenues, including gross jointventure revenue, from the brandedstores PlaceMakers and The BuildingDepot were at 95% of the previousyear’s level, assisted by a small overall increase in cash sales. Thiswas a solid performance in what was
a difficult year in both residential and commercial construction.
Margins improved slightly throughinternal efficiency measures, whichare expected to bring further gains in the coming year.
Focus and outlook for the 2002 yearThe focus will be on further gainsfrom performance improvementmeasures, which are already having a positive impact on operations.
PRO FORMA24 MARCH TO 12 MONTHS 12 MONTHS30 JUNE 2001 JUNE 2001 JUNE 2000
DISTRIBUTION $ M $ M $ M
Operating revenue of owned stores(1) 45 171 223
EBITDA(2) 5 13 15
EBIT(3) 4 6 8
Total funds employed 56 56 70
Capital expenditure 5 3
(1) This does not include the Group’s interest in the joint venture stores
(2) Earnings before interest, tax, depreciation, amortisation and unusual items
(3) Earnings before interest, tax and unusual items

People & safety
12
“Border control” to Fletcher Construction
sites now involves a check that all workers
on site possess a current SiteSafe
Passport, indicating that they have under-
gone a training programme on safe work
practices. On the Courtney Central site in
Wellington, the Fletcher Construction
gatehouse has been embellished with
domestic touches as a counterpoint to
the solemnity of the hazards board.
Building safety into the businessThe building industry in New Zealandhas had a poor safety record. Becauseso many separate groups of peoplework in close proximity in potentiallyhazardous situations, it requires a concerted effort by all parties to achievesafe sites. Pan-industry safety improve-ments have only begun to occur asleading players have demonstrated thenecessary leadership.
SiteSafe is an initiative that FletcherBuilding has embraced and supportedboth financially and with executive support. Through its subsidiary FletcherConstruction, the Company providedseed funding, an inaugural chairmanand subsequent board members andsafety specialists.
A key campaign has been the SiteSafePassport, whereby complying sitesallow employees of contractors andsubcontractors to work on site only ifthey have attended an in-depth safety programme and been issued with the“passport” document. The constructionindustry has, as a result of this increasedsafety focus, experienced a dramaticreduction in work fatalities, down from17 last year to 9 this year. FletcherBuilding's commercial and residential
businesses are actively promoting theSiteSafe campaign on their sites. Thefocus is on general awareness, identifi-cation of specific hazards and practicalsteps to be taken to manage the risk.
Fletcher Building is looking to facilitateefficient sharing of best practice acrossthe business and the development ofcommon core safety standards. Safetychampions are meeting monthly and arecurrently establishing a peer review proce-dure for investigating any serious incident.
The Accident Compensation Corporation(ACC) Partnership Programme is anotherway that Fletcher Building is drivingchange. By self-managing all work-related safety issues and providing self-cover for costs, we not only benefitfrom a rigorous external audit, butreduced premiums provide tangibleendorsement of our sound safety management practices. The most recentACC review elevated Fletcher Building'saccreditation status and complimentedthe Company on the very high level ofemployee involvement in the safetyassessment process.
Other initiatives are also underway.Fletcher Steel is utilising both subjectiveand objective measures in its SmartSiteprogramme. As well as work-related healthmanagement, there are also initiativesfor personal health assessments andseminars under the "Safe & Well” programme which is provided with the
support of the Fletcher Building EmployeeWelfare Fund and the Fletcher BuildingEducational Fund.
The Fletcher Building Employee Educa-tional Fund (EEF) has been establishedto recognise, encourage and financiallysupport vocational learning, and thesharing of learning, amongst FletcherBuilding’s employees and their families.
The EEF is independent of FletcherBuilding, but is an exciting and innovativeplatform for assisting in the developmentof the people who are responsible forFletcher Building’s reputation today andencouraging the people who will shapethe Company for tomorrow. If employeesor their dependants have an educationopportunity and some assistance is need-ed to progress it, the EEF may be able toprovide financial assistance for trainingincluding literacy, vocation, personal skillsdevelopment or extramural education.
Another important initiative is the availability of a special fund, the FletcherBuilding Employee Welfare Fund, to helpemployees and their families in the eventof an unexpected loss such as personalaccident, sickness, death, disability orsubsequent financial hardship. While thisFund is also independent of FletcherBuilding, it assists in creating a supportiveworking environment for our employeesin New Zealand.

Fletcher Building’s operations includenatural resource development andextraction, waste recycling, manufactur-ing and distribution. Our key areas ofenvironmental focus are:• Securing resource consents for
operations• Managing operations to meet
appropriate environmental standards• Innovative business planning to
identify and implement sustainablesolutions
• Participation in regulatory processesto promote effective and practicableenvironmental controls.
Fletcher Building regards environmentalperformance as a key element of sustainable value creation. Our operatingunits are required to comply with environ-mental legislation and regulations, andto report regularly on their performancein this regard. This reporting is supple-mented from time to time by externalaudits. We have made significant investments in plant and equipment in order to maintain compliance.
Our operations are subject to numerousnational and local regulatory regimes forenvironmental performance. In someoperating arenas outside New Zealand,these are at a relatively early stage ofdevelopment. Where this is the case,rather than operating only to local standards we apply a uniform risk management approach that requires theidentification of appropriate measuresand controls to achieve environmentallyresponsible outcomes. We believe that,in general, our international operationshave environmental performance levelshigher than those of locally-ownedcompanies in the countries in whichthey operate.
Fletcher Building is monitoring closely thepotential implications of the New ZealandGovernment’s commitment to ratify theKyoto Protocol on climate change andgreenhouse gas emissions. While wesupport the drive to reduce emissions,and our operations have provided tangiblebacking in recent years through theimplementation of voluntary reductionagreements, we are concerned to ensurethat this aim is achieved in a mannerthat is equitable for all sectors andstakeholders in the New Zealand econ-omy. The issues in terms of internationaltrade and an appropriate domestic policy mix are far from simple, andinformed debate is essential.
Wherever possible, we seek to resolveenvironmental issues in ways that benefitthe community and the company. Oneexample of this approach is at FletcherWood Panels’ Taupo site, where waste-water and stormwater have been divertedfor irrigation, enabling an iwi trust toestablish a thriving dairy farm.
The Wood Panels site, which uses250,000 cubic metres of water annually,had spent 10 years piping processwater 10 kilometres to soak holes in forest plantations. With surface irrigationbecoming the disposal method preferred by environmental authorities,the Company looked to neighbouringfarmland owned by the Tauhara North3B Trust. A successful trial led to a jointventure between the company and thetrust. Eventually, consent was gainedfrom Environment Waikato to irrigate for 30 years over 170 hectares.
Irrigation has enabled the trust to establisha 500 cow dairy herd (eventually to beexpanded to 1000), which deliveredabove-budget production in its first sixmonths of operation. The farm standsout not only for its performance, but alsofor its appearance. While neighbouringproperties wear a sunburnt look in summer,its pastures remain consistently green.
Fletcher Building’s relationship withTangaroa College, in the Auckland suburb of Otara, continued into itssixth year. This involvement providesongoing administrative and strategicsupport for the school, along with amentoring programme for senior students. Other support is providedaccording to need, but has at timesincluded training programmes for teaching and other staff, and advice on human resources, finance, planningand other administrative functions.
Environment & community
13
Surface irrigation of waste water from the
Fletcher Wood Panels Taupo plant has
enabled a neighbouring farmer to establish
a dairy herd that has achieved production
above expectation.
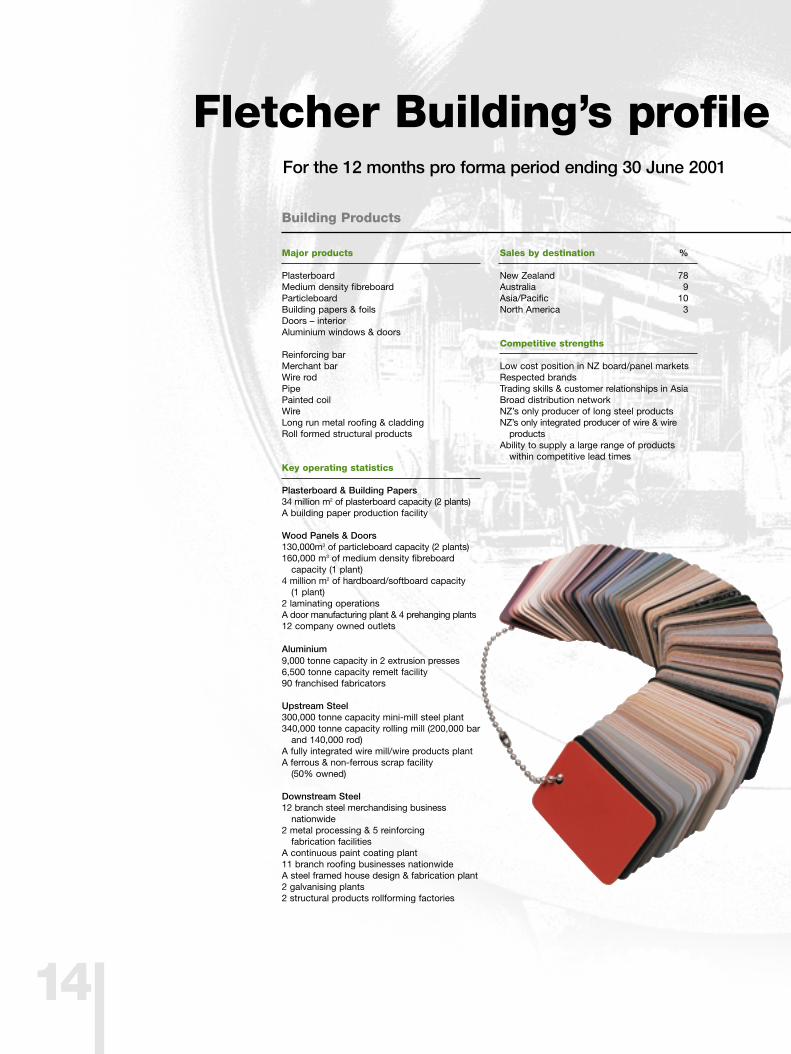
Fletcher Building’s profile
Building Products
Major products
PlasterboardMedium density fibreboard ParticleboardBuilding papers & foilsDoors – interiorAluminium windows & doors
Reinforcing barMerchant barWire rodPipePainted coilWireLong run metal roofing & claddingRoll formed structural products
Key operating statistics
Plasterboard & Building Papers34 million m2 of plasterboard capacity (2 plants)A building paper production facility
Wood Panels & Doors130,000m3 of particleboard capacity (2 plants)160,000 m3 of medium density fibreboard
capacity (1 plant)4 million m2 of hardboard/softboard capacity
(1 plant)2 laminating operationsA door manufacturing plant & 4 prehanging plants12 company owned outlets
Aluminium9,000 tonne capacity in 2 extrusion presses6,500 tonne capacity remelt facility90 franchised fabricators
Upstream Steel300,000 tonne capacity mini-mill steel plant340,000 tonne capacity rolling mill (200,000 bar
and 140,000 rod)A fully integrated wire mill/wire products plantA ferrous & non-ferrous scrap facility
(50% owned)
Downstream Steel12 branch steel merchandising business
nationwide2 metal processing & 5 reinforcing
fabrication facilitiesA continuous paint coating plant11 branch roofing businesses nationwide A steel framed house design & fabrication plant2 galvanising plants2 structural products rollforming factories
Sales by destination %
New Zealand 78Australia 9Asia/Pacific 10North America 3
Competitive strengths
Low cost position in NZ board/panel marketsRespected brandsTrading skills & customer relationships in AsiaBroad distribution networkNZ’s only producer of long steel productsNZ’s only integrated producer of wire & wire
productsAbility to supply a large range of products
within competitive lead times
14
For the 12 months pro forma period ending 30 June 2001
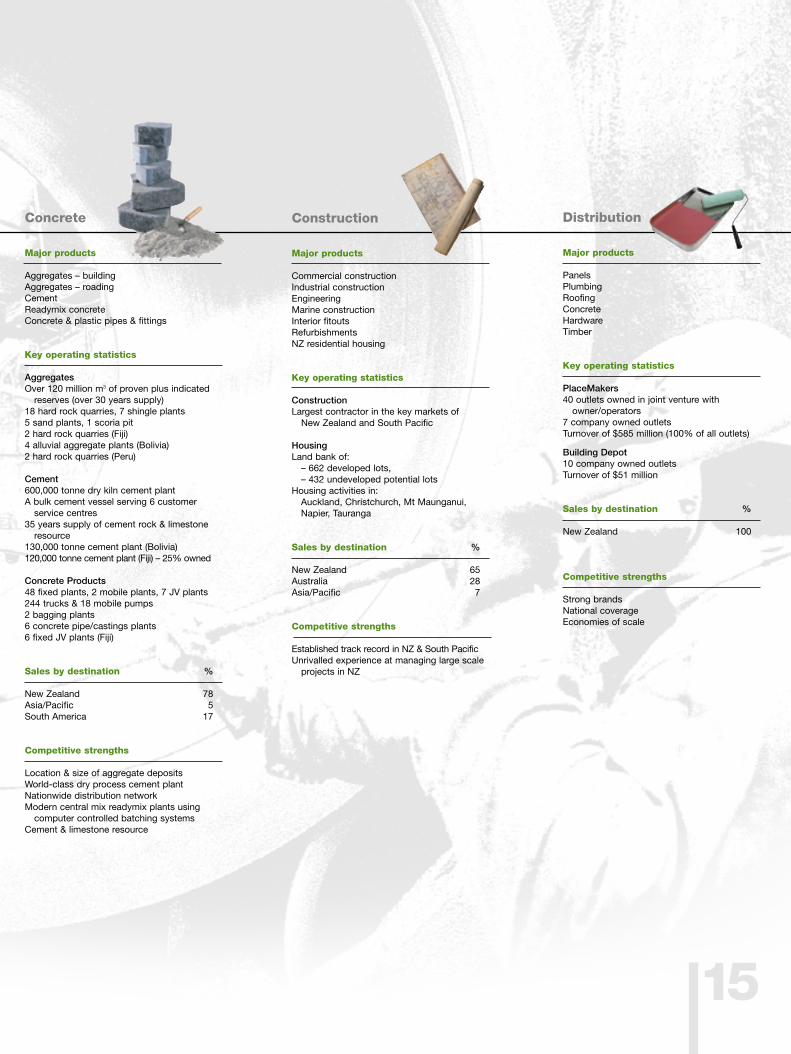
Distribution
Major products
PanelsPlumbingRoofingConcreteHardwareTimber
Key operating statistics
PlaceMakers40 outlets owned in joint venture with
owner/operators7 company owned outletsTurnover of $585 million (100% of all outlets)
Building Depot10 company owned outletsTurnover of $51 million
Sales by destination %
New Zealand 100
Competitive strengths
Strong brandsNational coverageEconomies of scale
Construction
Major products
Commercial constructionIndustrial constructionEngineeringMarine constructionInterior fitoutsRefurbishmentsNZ residential housing
Key operating statistics
ConstructionLargest contractor in the key markets of
New Zealand and South Pacific
HousingLand bank of:
– 662 developed lots,– 432 undeveloped potential lots
Housing activities in:Auckland, Christchurch, Mt Maunganui,Napier, Tauranga
Sales by destination %
New Zealand 65Australia 28Asia/Pacific 7
Competitive strengths
Established track record in NZ & South PacificUnrivalled experience at managing large scale
projects in NZ
Concrete
Major products
Aggregates – buildingAggregates – roadingCementReadymix concreteConcrete & plastic pipes & fittings
Key operating statistics
AggregatesOver 120 million m3 of proven plus indicated
reserves (over 30 years supply)18 hard rock quarries, 7 shingle plants5 sand plants, 1 scoria pit2 hard rock quarries (Fiji)4 alluvial aggregate plants (Bolivia)2 hard rock quarries (Peru)
Cement600,000 tonne dry kiln cement plantA bulk cement vessel serving 6 customer
service centres35 years supply of cement rock & limestone
resource130,000 tonne cement plant (Bolivia)120,000 tonne cement plant (Fiji) – 25% owned
Concrete Products48 fixed plants, 2 mobile plants, 7 JV plants244 trucks & 18 mobile pumps2 bagging plants6 concrete pipe/castings plants6 fixed JV plants (Fiji)
Sales by destination %
New Zealand 78Asia/Pacific 5South America 17
Competitive strengths
Location & size of aggregate depositsWorld-class dry process cement plantNationwide distribution networkModern central mix readymix plants using
computer controlled batching systemsCement & limestone resource
15

Roderick Sheldon DeanePhD, LLD (Hon), BCom(Hons), FACA, FCIS, FNZIM
Chairman of Directors
Dr Deane, 60, is Chairman ofTelecom New Zealand, havingretired as Chief Executive ofthat company in 1999. He isalso Chairman of ANZ BankingGroup (NZ), Te Papa Tongarewa(the Museum of New Zealand),New Zealand Seed FundManagement and New ZealandSeed Fund Partnership. Dr Deane is a director ofTransAlta Corporation (ofCanada), Australia and NewZealand Banking Group andWoolworths (both Australiancompanies). He is Professor ofEconomics and Management atVictoria University of Wellingtonand is on the Board ofGovernance of IHC Inc. Dr Deane has previously beenChief Executive of the ElectricityCorporation of New Zealand,Chairman of Fletcher Challengeand the State ServicesCommission, Deputy Governorof the Reserve Bank of NewZealand, and AlternateExecutive Director of theInternational Monetary Fund.
Paul Edward Alex BainesBCA, CA, MPP
Non-Executive Director Chairman of the AuditCommittee
Mr Baines, 51, is Chairman ofTower Managed Funds and aDirector of Comalco NewZealand, Gough, Gough andHamer, Greenstone Fund, theReserve Bank of New Zealand,Telecom New Zealand andWrightson, and is a memberof the P A Consulting GroupAdvisory Board. He was previously a director ofFletcher Challenge, NewZealand Post and SouthEastern Utilities, and ChiefExecutive Officer of CS FirstBoston New Zealand from1990 until 1993. Prior to thathe held a number of seniorpositions in the sharebrokingand investment banking firmof Jarden & Co.
Hugh Alasdair FletcherMCom (Hons), MBA(Stanford), BSc
Non-Executive DirectorMember of the AuditCommittee
Mr Fletcher, 53, is Chairmanof New Zealand Insurance,CGNU Insurance Australia, a Director of VCU Technology,Infrastructure Auckland andRubicon, a member of the AsiaPacific Advisory Committee ofthe New York Stock Exchange,the Business Advisory Councilof the United Nations Officefor Project Services, the Tertiary Education AdvisoryCommission, the InvestmentCommittee of No 8 Ventures,and the University of AucklandCouncil. Mr Fletcher was previously a director of FletcherChallenge and its ChiefExecutive Officer from 1987until his retirement in 1997.
Ralph James NorrisFNZCS, FNZIM
Non-Executive DirectorMember of the RemunerationCommittee
Mr Norris, 52, is Head ofInternational Financial Servicesfor the Commonwealth BankGroup, a role responsible forthe Group’s operations in New Zealand, the Pacific andAsia and is Managing Directorand CEO of ASB Group. He isalso Chairman of SovereignAssurance and the NewZealand Business Roundtable,Deputy Chairman of the NewZealand Bankers Association,a Director of Air New Zealand,Ansett Holdings and NewZealand’s America’s Cupdefence company. He is alsoa trustee of the Woolf FisherTrust, Northern LifeguardServices and the StarshipChildren’s Hospital Foundation.
16
The Board of Directors
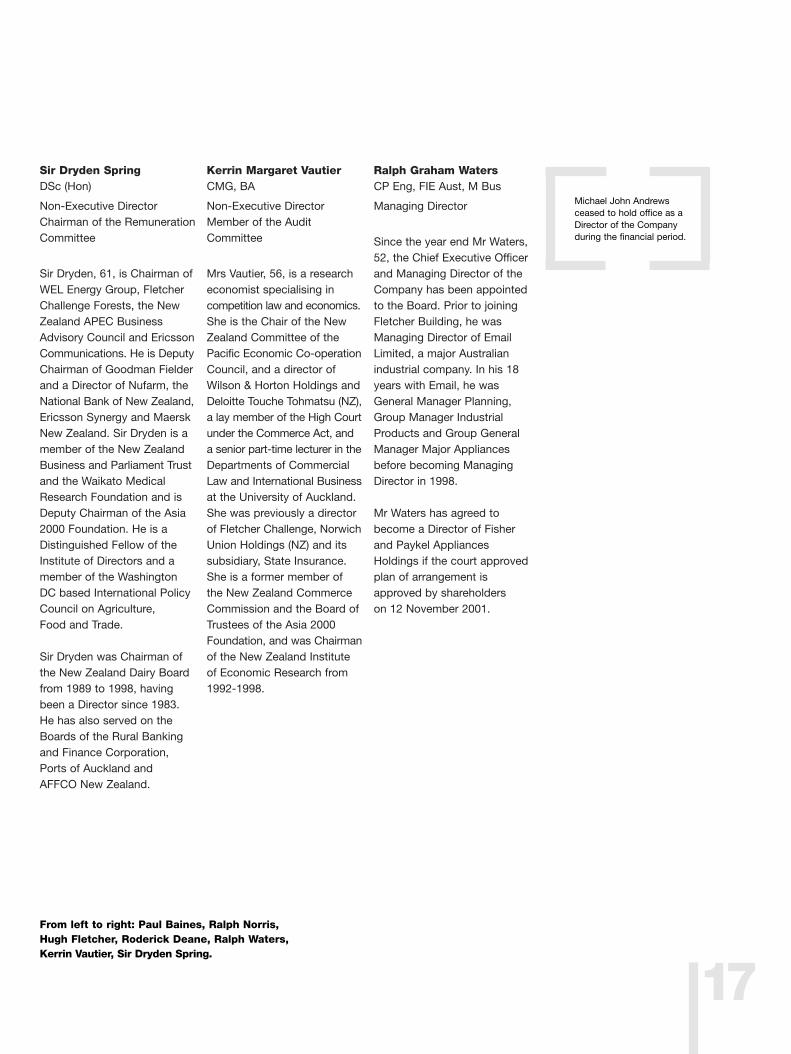
Sir Dryden SpringDSc (Hon)
Non-Executive DirectorChairman of the RemunerationCommittee
Sir Dryden, 61, is Chairman ofWEL Energy Group, FletcherChallenge Forests, the NewZealand APEC BusinessAdvisory Council and EricssonCommunications. He is DeputyChairman of Goodman Fielderand a Director of Nufarm, theNational Bank of New Zealand,Ericsson Synergy and MaerskNew Zealand. Sir Dryden is amember of the New ZealandBusiness and Parliament Trustand the Waikato MedicalResearch Foundation and isDeputy Chairman of the Asia2000 Foundation. He is aDistinguished Fellow of theInstitute of Directors and amember of the WashingtonDC based International PolicyCouncil on Agriculture, Food and Trade.
Sir Dryden was Chairman ofthe New Zealand Dairy Boardfrom 1989 to 1998, havingbeen a Director since 1983.He has also served on theBoards of the Rural Bankingand Finance Corporation,Ports of Auckland and AFFCO New Zealand.
Kerrin Margaret VautierCMG, BA
Non-Executive DirectorMember of the AuditCommittee
Mrs Vautier, 56, is a researcheconomist specialising incompetition law and economics.She is the Chair of the NewZealand Committee of thePacific Economic Co-operationCouncil, and a director ofWilson & Horton Holdings andDeloitte Touche Tohmatsu (NZ),a lay member of the High Courtunder the Commerce Act, anda senior part-time lecturer in theDepartments of CommercialLaw and International Businessat the University of Auckland.She was previously a directorof Fletcher Challenge, NorwichUnion Holdings (NZ) and itssubsidiary, State Insurance.She is a former member of the New Zealand CommerceCommission and the Board ofTrustees of the Asia 2000Foundation, and was Chairmanof the New Zealand Instituteof Economic Research from1992-1998.
Ralph Graham WatersCP Eng, FIE Aust, M Bus
Managing Director
Since the year end Mr Waters,52, the Chief Executive Officerand Managing Director of theCompany has been appointedto the Board. Prior to joiningFletcher Building, he wasManaging Director of EmailLimited, a major Australianindustrial company. In his 18years with Email, he wasGeneral Manager Planning,Group Manager IndustrialProducts and Group GeneralManager Major Appliancesbefore becoming ManagingDirector in 1998.
Mr Waters has agreed tobecome a Director of Fisherand Paykel AppliancesHoldings if the court approvedplan of arrangement isapproved by shareholders on 12 November 2001.
Michael John Andrewsceased to hold office as aDirector of the Companyduring the financial period.
From left to right: Paul Baines, Ralph Norris,Hugh Fletcher, Roderick Deane, Ralph Waters,Kerrin Vautier, Sir Dryden Spring.
17
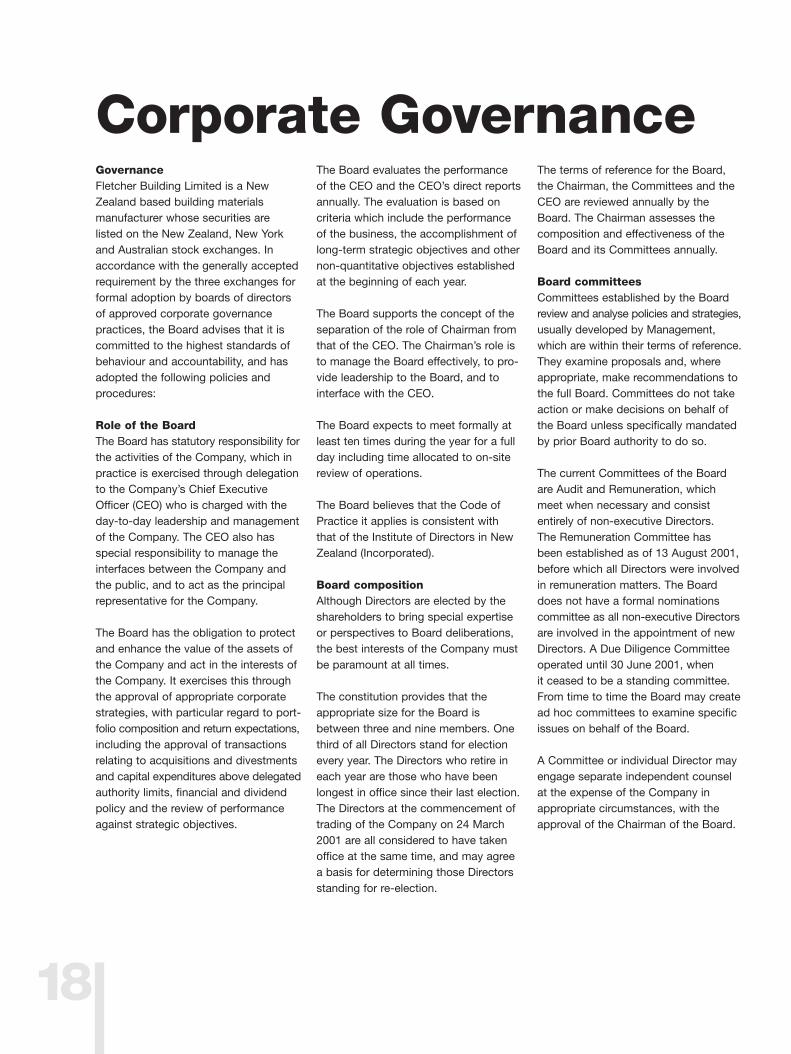
GovernanceFletcher Building Limited is a NewZealand based building materials manufacturer whose securities are listed on the New Zealand, New Yorkand Australian stock exchanges. Inaccordance with the generally acceptedrequirement by the three exchanges forformal adoption by boards of directorsof approved corporate governancepractices, the Board advises that it is committed to the highest standards ofbehaviour and accountability, and hasadopted the following policies and procedures:
Role of the BoardThe Board has statutory responsibility forthe activities of the Company, which inpractice is exercised through delegationto the Company’s Chief ExecutiveOfficer (CEO) who is charged with theday-to-day leadership and managementof the Company. The CEO also has special responsibility to manage theinterfaces between the Company andthe public, and to act as the principalrepresentative for the Company.
The Board has the obligation to protectand enhance the value of the assets ofthe Company and act in the interests ofthe Company. It exercises this throughthe approval of appropriate corporatestrategies, with particular regard to port-folio composition and return expectations,including the approval of transactionsrelating to acquisitions and divestmentsand capital expenditures above delegatedauthority limits, financial and dividendpolicy and the review of performanceagainst strategic objectives.
The Board evaluates the performance of the CEO and the CEO’s direct reportsannually. The evaluation is based on criteria which include the performanceof the business, the accomplishment oflong-term strategic objectives and othernon-quantitative objectives establishedat the beginning of each year.
The Board supports the concept of theseparation of the role of Chairman fromthat of the CEO. The Chairman’s role isto manage the Board effectively, to pro-vide leadership to the Board, and tointerface with the CEO.
The Board expects to meet formally atleast ten times during the year for a fullday including time allocated to on-sitereview of operations.
The Board believes that the Code ofPractice it applies is consistent with that of the Institute of Directors in NewZealand (Incorporated).
Board compositionAlthough Directors are elected by theshareholders to bring special expertiseor perspectives to Board deliberations,the best interests of the Company mustbe paramount at all times.
The constitution provides that theappropriate size for the Board isbetween three and nine members. Onethird of all Directors stand for electionevery year. The Directors who retire ineach year are those who have beenlongest in office since their last election.The Directors at the commencement oftrading of the Company on 24 March2001 are all considered to have takenoffice at the same time, and may agreea basis for determining those Directorsstanding for re-election.
The terms of reference for the Board,the Chairman, the Committees and theCEO are reviewed annually by theBoard. The Chairman assesses thecomposition and effectiveness of theBoard and its Committees annually.
Board committeesCommittees established by the Boardreview and analyse policies and strategies,usually developed by Management,which are within their terms of reference.They examine proposals and, whereappropriate, make recommendations tothe full Board. Committees do not takeaction or make decisions on behalf ofthe Board unless specifically mandatedby prior Board authority to do so.
The current Committees of the Boardare Audit and Remuneration, whichmeet when necessary and consistentirely of non-executive Directors. The Remuneration Committee has been established as of 13 August 2001,before which all Directors were involvedin remuneration matters. The Boarddoes not have a formal nominationscommittee as all non-executive Directorsare involved in the appointment of newDirectors. A Due Diligence Committeeoperated until 30 June 2001, when it ceased to be a standing committee.From time to time the Board may createad hoc committees to examine specificissues on behalf of the Board.
A Committee or individual Director mayengage separate independent counselat the expense of the Company inappropriate circumstances, with theapproval of the Chairman of the Board.
Corporate Governance
18
ContractsSubject to the Company’s standardcessation of employment criteria, R GWaters’ appointment as Chief ExecutiveOfficer is for indefinite duration. As aterm of that contract he has been issued1,000,000 options over the ordinaryshares of the Company, at an exerciseprice calculated as the weighted averageselling price of the Company’s shares inthe 10 trading days prior to 16 May 2001(being $2.28 per option). The optionshave a term of six years.
Directors’ and officers’ indemnification and insuranceThe Company has arranged a programme of directors’ and officers’liability insurance covering Directors,executives and employees in managerialpositions acting on behalf of theCompany. Cover is for damages, judgements, fines, penalties, legal costsawarded and defence costs arisingfrom wrongful acts committed whilstacting for the Company. The types ofacts that are not covered are dishonest,fraudulent, malicious acts or omissions,wilful breach of statute or regulations,or duty to the Company, improper useof information to the detriment of theCompany or breach of professionalduty. This is supplemented by indemni-fication by the Company, but excludingliability for criminal acts.
Dealing in company securitiesThe Company’s Securities Trading Codeof Conduct for insider trading supple-ments the New Zealand legislation containing the Insider Trading (ApprovedProcedure for Company Officers) Notice1996. That legislation and the SecuritiesTrading Code of Conduct prevent short-term trading and dealing in theCompany’s securities whilst Directorsand senior executives are in possessionof non-public material and relevantinformation.
During the financial year Directors disclosed in respect of Section 148(2)of the Companies Act 1993, the detailsscheduled on page 57.
Directors’ interests registerDirectors’ certificates to cover entries in the Interests Register in respect ofremuneration, dealing in the Company’ssecurities, insurance and other interestshave been disclosed as required by theCompanies Act 1993, and are scheduledon page 58.
The initial Directors of the Company on incorporation on 19 December 2000,were John McDonald and AlexanderTöldte, who resigned with effect from23 January 2001 and 24 January 2001respectively. During this period no trading activities were undertaken and no disclosures of interests were considered necessary.
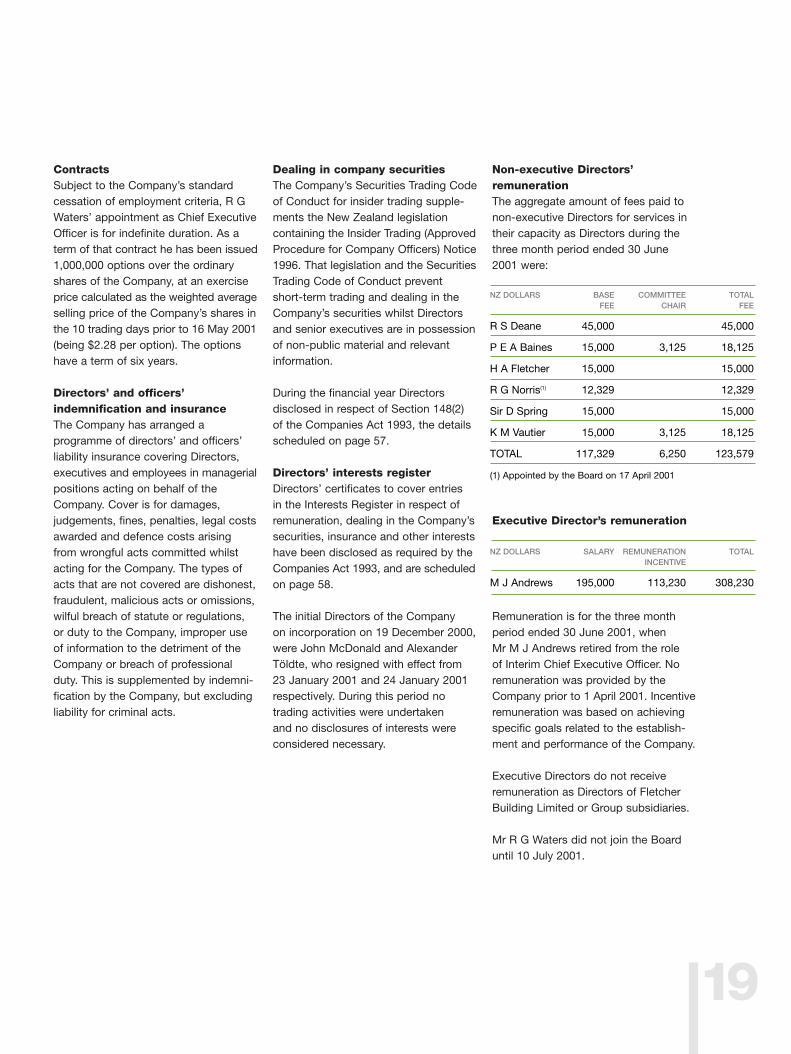
Non-executive Directors’ remunerationThe aggregate amount of fees paid tonon-executive Directors for services intheir capacity as Directors during thethree month period ended 30 June2001 were:
Executive Director’s remuneration
Remuneration is for the three monthperiod ended 30 June 2001, when Mr M J Andrews retired from the role of Interim Chief Executive Officer. Noremuneration was provided by theCompany prior to 1 April 2001. Incentiveremuneration was based on achievingspecific goals related to the establish-ment and performance of the Company.
Executive Directors do not receiveremuneration as Directors of FletcherBuilding Limited or Group subsidiaries.
Mr R G Waters did not join the Board until 10 July 2001.
19
NZ DOLLARS BASE COMMITTEE TOTALFEE CHAIR FEE
R S Deane 45,000 45,000
P E A Baines 15,000 3,125 18,125
H A Fletcher 15,000 15,000
R G Norris(1) 12,329 12,329
Sir D Spring 15,000 15,000
K M Vautier 15,000 3,125 18,125
TOTAL 117,329 6,250 123,579
NZ DOLLARS SALARY REMUNERATION TOTALINCENTIVE
M J Andrews 195,000 113,230 308,230
(1) Appointed by the Board on 17 April 2001
20
Stock Exchange DisclosuresOn 14 March 2001 the MarketSurveillance Panel of the NewZealand Stock Exchange granted theCompany a waiver from Listing Rules3.4.3 (interested directors not voting)and 9.2.1 (material transactionsinvolving related parties) in relation to a finance facility established withseveral banks including ANZ BankingGroup (NZ) Limited in connectionwith the separation process. Thiswaiver was necessary because, atthe time the financing facility wasarranged, Dr Roderick Deane wasdeemed to be an interested directorfor the purposes of Listing Rule 3.4.3and ANZ Banking Group (NZ) Limitedwas deemed to be a related party ofthe Company for the purposes ofListing Rule 9.2.1, as Dr RoderickDeane was a director of FletcherBuilding Limited and a director ofANZ Banking Group (NZ) Limited.
On 10 May 2001 the MarketSurveillance Panel of the NewZealand Stock Exchange granted theCompany a waiver from Listing Rule9.2.1 (material transactions involvingrelated parties) in relation to afinance facility established with The National Bank of New ZealandLimited. This waiver was necessarybecause, at the time the financingfacility was arranged, The NationalBank of New Zealand Limited wasdeemed to be a related party of theCompany for the purposes of ListingRule 9.2.1, as Sir Dryden Spring wasa director of Fletcher Building Limitedand a director of The National Bankof New Zealand Limited.
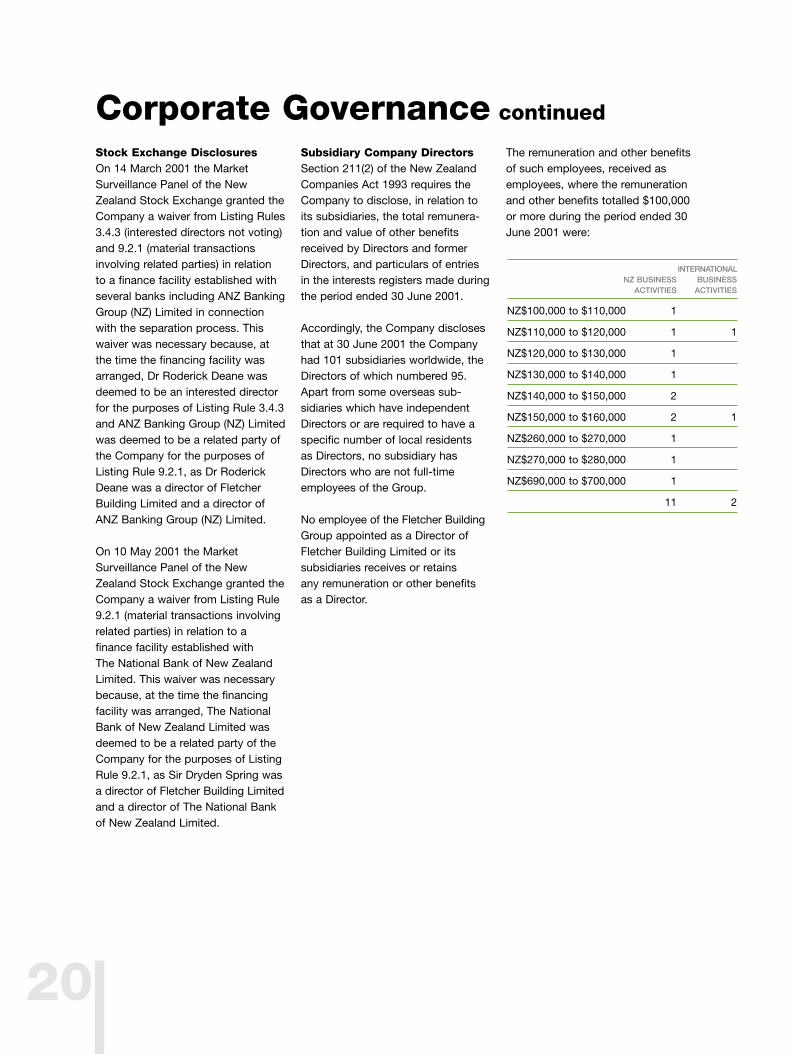
Subsidiary Company Directors Section 211(2) of the New ZealandCompanies Act 1993 requires theCompany to disclose, in relation toits subsidiaries, the total remunera-tion and value of other benefitsreceived by Directors and formerDirectors, and particulars of entriesin the interests registers made duringthe period ended 30 June 2001.
Accordingly, the Company disclosesthat at 30 June 2001 the Companyhad 101 subsidiaries worldwide, theDirectors of which numbered 95.Apart from some overseas sub-sidiaries which have independentDirectors or are required to have aspecific number of local residents as Directors, no subsidiary hasDirectors who are not full-timeemployees of the Group.
No employee of the Fletcher BuildingGroup appointed as a Director ofFletcher Building Limited or its subsidiaries receives or retains any remuneration or other benefits as a Director.
The remuneration and other benefitsof such employees, received asemployees, where the remunerationand other benefits totalled $100,000or more during the period ended 30June 2001 were:
Corporate Governance continued
INTERNATIONALNZ BUSINESS BUSINESS
ACTIVITIES ACTIVITIES
NZ$100,000 to $110,000 1
NZ$110,000 to $120,000 1 1
NZ$120,000 to $130,000 1
NZ$130,000 to $140,000 1
NZ$140,000 to $150,000 2
NZ$150,000 to $160,000 2 1
NZ$260,000 to $270,000 1
NZ$270,000 to $280,000 1
NZ$690,000 to $700,000 1
11 2

21
Executive Committee
Chief Executive Officer and Managing DirectorRalph Waters
Company SecretaryMartin Farrell
Chief Financial OfficerBill Roest
Chief Executive – ConcreteMark Binns
Chief Executive – ConstructionMark Binns
Chief Executive – Building ProductsAndrew Reding
Chief Executive – DistributionAppointment pending
General Manager – Planning & Corporate SupportMalcolm Hope
Senior Management Team
Building Products
Fletcher Wood PanelsBob Linton
Scott Panel & HardwareJoan Young (acting GM)
Winstone WallboardsDavid Thomas
Fletcher AluminiumAlec Mandis
Plyco DoorsJo Clayton
Fletcher EasySteelJohn Beveridge
DimondTo be appointed
CSP GalvanizingShane Mitchell
Pacific CoilcoatersRob Hartley
Fletcher ReinforcingRobert Sim
Pacific SteelPacific WireSteel Shared ServicesAlan Pearson
CycloneScott Paterson
Distribution
PlaceMakersKeith Avery
Building DepotGarry Stone
Hire A HubbyWarren Powell
Construction
Chief Financial OfficerCarl Munkowits
NZ Upper North & South Island Peter Neven
NZ Wellington & Lower North IslandBob Hall
AustraliaGraham Taylor
EngineeringGraham Darlow
Fletcher ResidentialBruce Nixon
Concrete
Golden Bay CementRoss Harper
Firth IndustriesChris Badger
StresscreteRobert Gibbes
Winstone AggregatesChris Ellis
Humes Pipeline SystemsJohn Williamson
PeruRoberto Silva
BoliviaKen Cowie
Corporate
TreasurySara Ellis
Chief Information OfficerPaul Knight
Financial ControllerJohn Hames
Fletcher PropertyDavid Wood
ProcurementIan Maynard
Management
From left to right: Martin Farrell, Bill Roest, Malcolm Hope,Ralph Waters, Mark Binns, Andrew Reding.
22
Financial Review
Fletcher Building Limited commenced trading as a stand-alone entity on 24 March 2001, following the acquisition ofthe operations, assets and liabilities previously attributed toFletcher Challenge Limited – Building Operations, as part ofthe Fletcher Challenge Group separation process. The AnnualReport is for the period since incorporation on 19 December2000 but as no trading was undertaken until 24 March 2001,this Report records the financial results for the “TradingPeriod,” being the period 24 March 2001 to 30 June 2001.
For comparative purposes, pro forma accounts have beenprepared. The pro forma results include the earnings of allbusinesses as if the operations, assets and liabilities previouslyattributed to Fletcher Challenge Limited – Building Operationswere part of Fletcher Building Limited from 1 July 2000.Comparative figures for the previous corresponding year have been prepared on a similar basis.
Revenues for the “Trading Period” ended 30 June 2001 were$696 million and reflect external sales only. Earnings beforeinterest, tax and unusual items in the same period were $42million. Compared to the $94 million for the 12 months period,the “Trading Period” result showed a marked improvementthrough better operational performance and some recovery in demand. Net profit after tax and minorities was $22 millionbefore unusual items, and $19 million after unusual items.
Pro forma net profit after tax and minorities was $34 millionbefore unusual items, compared to $106 million for the corresponding period. After unusual items a loss of $272 millionresulted, compared to a profit of $63 million last year.
Despite the difficult trading year, cash generation throughworking capital reductions, construction progress paymentsand improved earnings in the “Trading Period” was encouraging.
The strong cash flow is reflected in Fletcher Building’s ratio ofdebt to total capitalisation (debt to debt plus equity and capitalfunds at book value) reducing to 25.8% from 33.4%, theequivalent ratio at June 2000. Interest cover (EBITDA beforeunusual items / interest paid) for the “Trading Period” was 7.4 times, in line with that achieved at June 2000. At year endFletcher Building had available undrawn facilities of $235 million.
The return on permanent capital (excluding unusual items) forthe “Trading Period” was 17% on an annualised basis. Thiscompares with the return for the 12 months ended June 2001and June 2000 of 10% and 16% respectively. Based on thepro forma 12 months accounts, about 45% of the year’searnings at the EBIT level, and 63% of the year’s cash flow,were generated in the “Trading Period” of just over three months.
While there was a net loss after tax and minorities for the 12months ended 30 June 2001 of $272 million, this result wasaffected by a number of adverse adjustments:
Risk managementThe Company has an integrated programme to manage risksassociated with interest rate, commodity price and exchangerate movements. This hedge programme aims to assure abase level of profitability and reduce volatility in earnings.
RevaluationFollowing the acquisition of the assets of Fletcher ChallengeLimited – Building Operations, the Directors have adopted apolicy to revalue land, buildings and plant and machinery inaccordance with Financial Reporting Standard No 3 “Accountingfor Property, Plant and Equipment.” These valuations havebeen prepared by independent and suitably qualified valuersand have resulted in an uplift of $91 million in the value ofthese assets, a net transfer to the revaluation reserve of $73million and a reduction in the deferred tax asset of $18 million.
Capital notesThe Company will consider replacing capital notes with normaldebt funding as the opportunity arises, and the terms for theOctober 2001 noteholders’ election reflect this.
The initial trading period produced significant increases
in both earnings and cash flow.
$ MILLION
Restructuring and separation costs 43
Permanent impairment 101
Victorian co-generation settlement 37
Unusual items 181
Taxation adjustments 125
Total adjustments 306
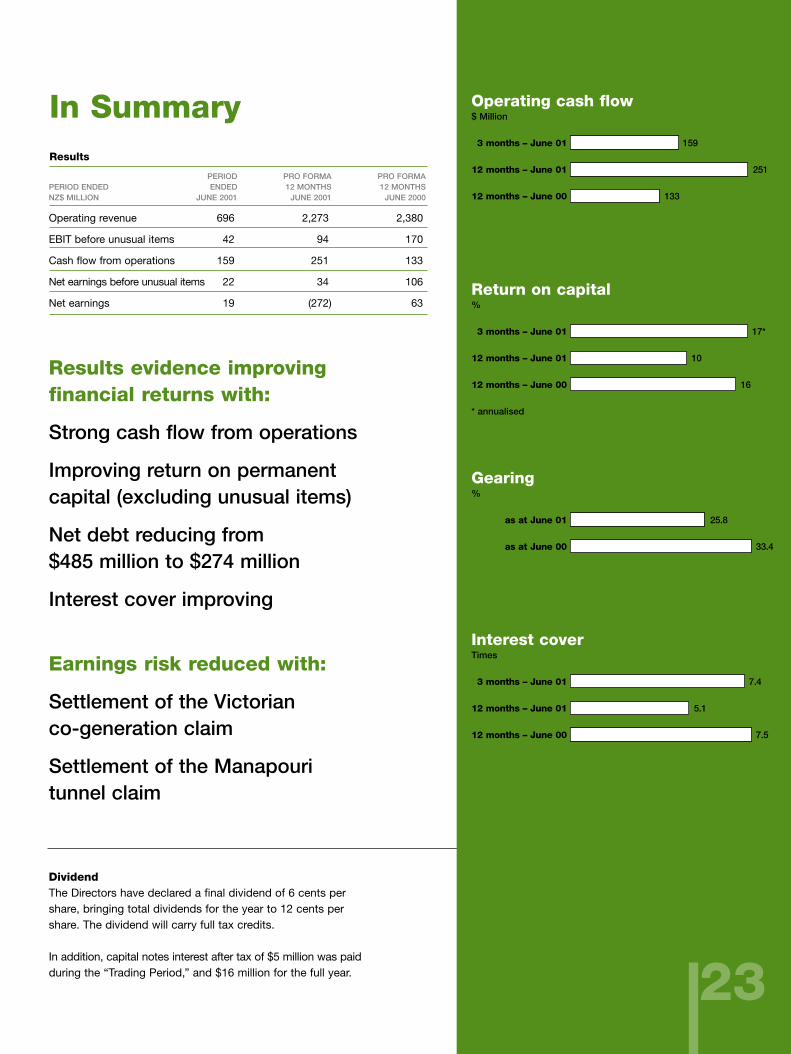
In SummaryResults
PERIOD PRO FORMA PRO FORMAPERIOD ENDED ENDED 12 MONTHS 12 MONTHSNZ$ MILLION JUNE 2001 JUNE 2001 JUNE 2000
Operating revenue 696) 2,273) 2,380)
EBIT before unusual items 42) 94) 170)
Cash flow from operations 159) 251) 133)
Net earnings before unusual items 22) 34) 106)
Net earnings 19) (272) 63)
Results evidence improving financial returns with:
Strong cash flow from operations
Improving return on permanent capital (excluding unusual items)
Net debt reducing from $485 million to $274 million
Interest cover improving
Earnings risk reduced with:
Settlement of the Victorian co-generation claim
Settlement of the Manapouri tunnel claim
23
Operating cash flow$ Million
13 months – June 01 159
12 months – June 01 251
12 months – June 00 133
Return on capital%
13 months – June 01 17*
12 months – June 01 10
12 months – June 00 16
* annualised
Interest coverTimes
13 months – June 01 7.4
12 months – June 01 5.1
12 months – June 00 7.5
Gearing%
as at June 01 25.8
as at June 00 33.4
DividendThe Directors have declared a final dividend of 6 cents pershare, bringing total dividends for the year to 12 cents pershare. The dividend will carry full tax credits.
In addition, capital notes interest after tax of $5 million was paidduring the “Trading Period,” and $16 million for the full year.

Financials
24
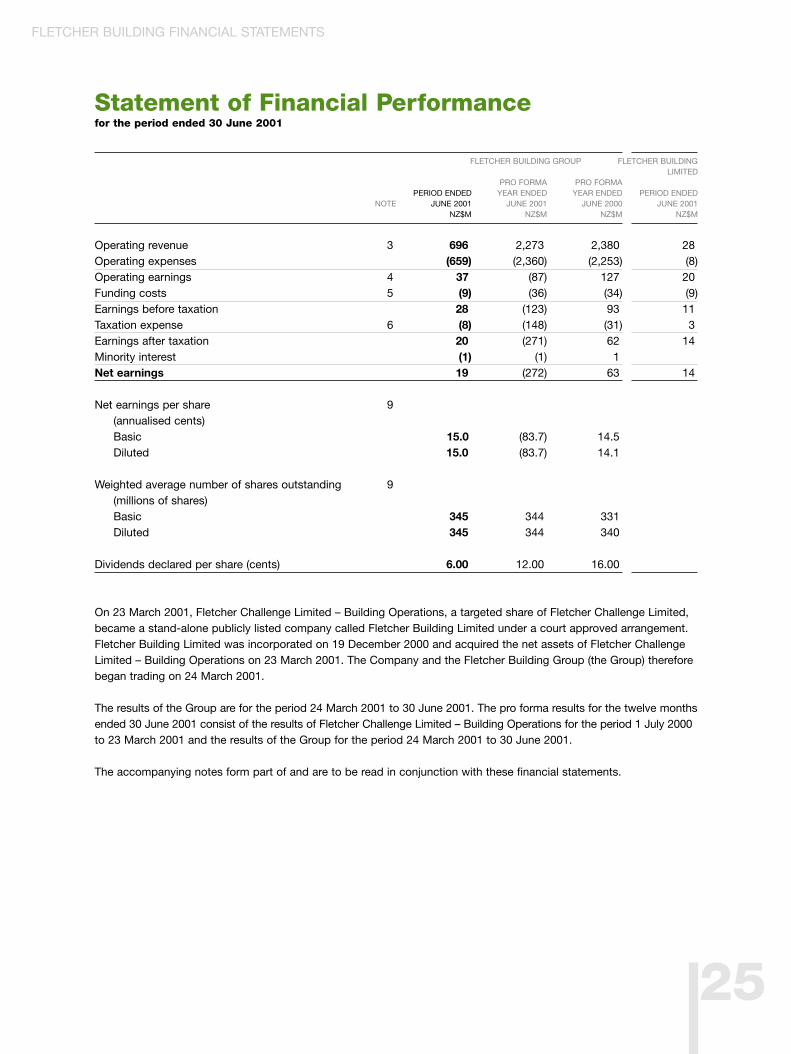
Statement of Financial Performancefor the period ended 30 June 2001
FLETCHER BUILDING GROUP FLETCHER BUILDING LIMITED
PRO FORMA PRO FORMAPERIOD ENDED YEAR ENDED YEAR ENDED PERIOD ENDED
NOTE JUNE 2001 JUNE 2001 JUNE 2000 JUNE 2001NZ$M NZ$M NZ$M NZ$M
Operating revenue 3) 696) 2,273) 2,380) 28)Operating expenses (659) (2,360) (2,253) (8)Operating earnings 4) 37) (87) 127) 20)Funding costs 5) (9) (36) (34) (9)Earnings before taxation 28) (123) 93) 11)Taxation expense 6) (8) (148) (31) 3)Earnings after taxation 20) (271) 62) 14)Minority interest (1) (1) 1)Net earnings 19) (272) 63) 14)
Net earnings per share 9)(annualised cents)Basic 15.0) (83.7) 14.5)Diluted 15.0) (83.7) 14.1)
Weighted average number of shares outstanding 9)(millions of shares)Basic 345) 344) 331)Diluted 345) 344) 340)
Dividends declared per share (cents) 6.00) 12.00) 16.00)
On 23 March 2001, Fletcher Challenge Limited – Building Operations, a targeted share of Fletcher Challenge Limited, became a stand-alone publicly listed company called Fletcher Building Limited under a court approved arrangement. Fletcher Building Limited was incorporated on 19 December 2000 and acquired the net assets of Fletcher Challenge Limited – Building Operations on 23 March 2001. The Company and the Fletcher Building Group (the Group) therefore began trading on 24 March 2001.
The results of the Group are for the period 24 March 2001 to 30 June 2001. The pro forma results for the twelve months ended 30 June 2001 consist of the results of Fletcher Challenge Limited – Building Operations for the period 1 July 2000to 23 March 2001 and the results of the Group for the period 24 March 2001 to 30 June 2001.
The accompanying notes form part of and are to be read in conjunction with these financial statements.
FLETCHER BUILDING FINANCIAL STATEMENTS
25
26
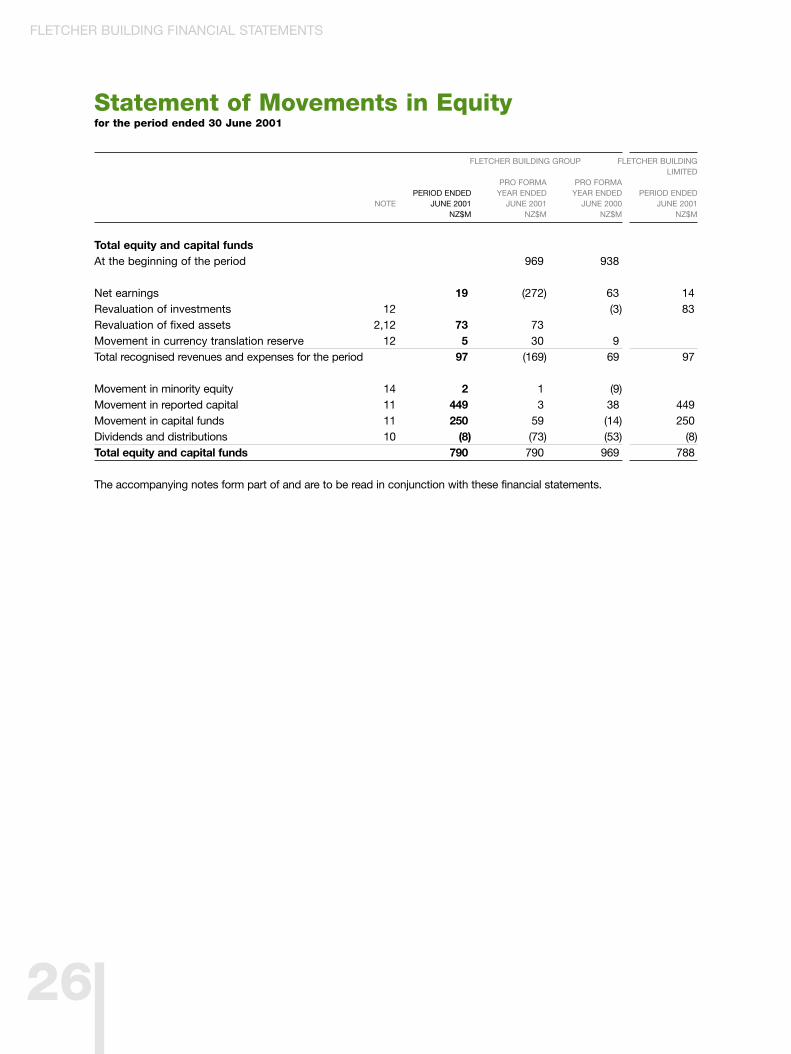
Statement of Movements in Equityfor the period ended 30 June 2001
FLETCHER BUILDING GROUP FLETCHER BUILDING LIMITED
PRO FORMA PRO FORMAPERIOD ENDED YEAR ENDED YEAR ENDED PERIOD ENDED
NOTE JUNE 2001 JUNE 2001 JUNE 2000 JUNE 2001NZ$M NZ$M NZ$M NZ$M
Total equity and capital fundsAt the beginning of the period 969) 938)
Net earnings 19) (272) 63) 14)Revaluation of investments 12 (3) 83)Revaluation of fixed assets 2,12 73) 73)Movement in currency translation reserve 12 5) 30) 9)Total recognised revenues and expenses for the period 97) (169) 69) 97)
Movement in minority equity 14 2) 1) (9)Movement in reported capital 11 449) 3) 38) 449)Movement in capital funds 11 250) 59) (14) 250)Dividends and distributions 10 (8) (73) (53) (8)Total equity and capital funds 790) 790) 969) 788)
The accompanying notes form part of and are to be read in conjunction with these financial statements.
FLETCHER BUILDING FINANCIAL STATEMENTS
27
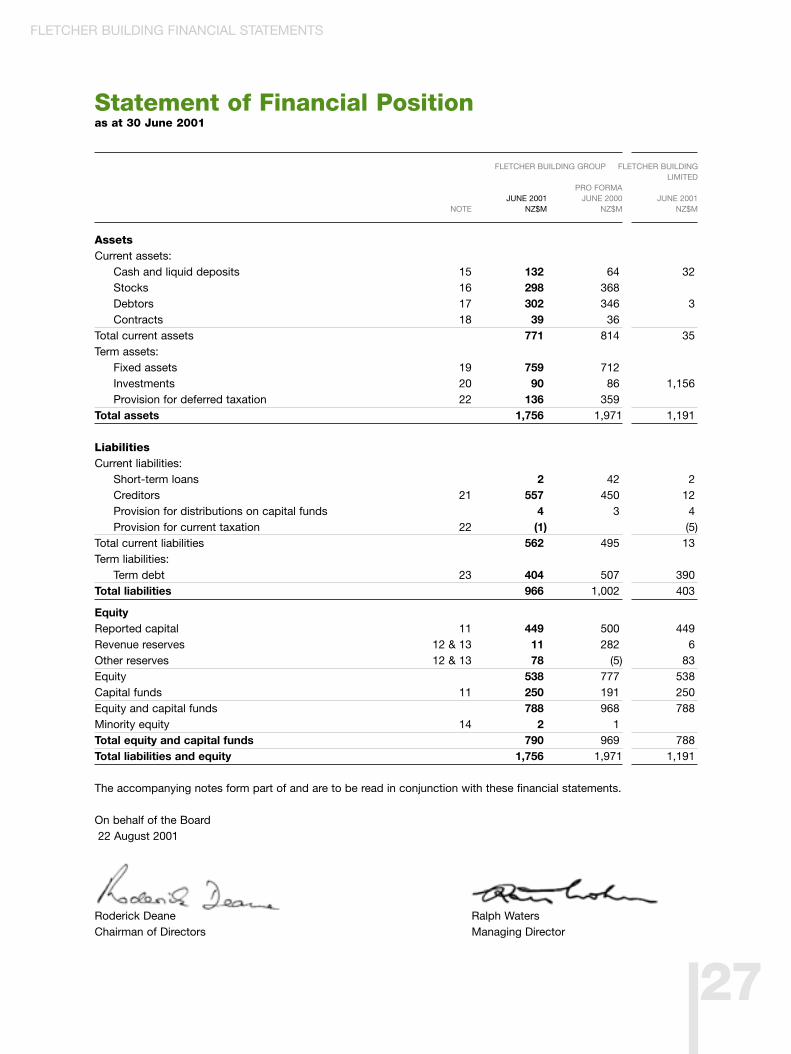
Statement of Financial Positionas at 30 June 2001
FLETCHER BUILDING GROUP FLETCHER BUILDINGLIMITED
PRO FORMAJUNE 2001 JUNE 2000 JUNE 2001
NOTE NZ$M NZ$M NZ$M
AssetsCurrent assets:
Cash and liquid deposits 15 132) 64) 32)Stocks 16 298) 368)Debtors 17 302) 346) 3)Contracts 18 39) 36)
Total current assets 771) 814) 35)Term assets:
Fixed assets 19 759) 712)Investments 20 90) 86) 1,156)Provision for deferred taxation 22 136) 359) )
Total assets 1,756) 1,971 1,191)
LiabilitiesCurrent liabilities:
Short-term loans 2) 42) 2)Creditors 21 557) 450) 12)Provision for distributions on capital funds 4) 3) 4)Provision for current taxation 22 (1) (5)
Total current liabilities 562) 495) 13)Term liabilities:
Term debt 23 404) 507) 390)Total liabilities 966) 1,002) 403)
EquityReported capital 11 449) 500) 449)Revenue reserves 12 & 13 11) 282) 6)Other reserves 12 & 13 78) (5) 83)Equity 538) 777) 538)Capital funds 11 250) 191) 250)Equity and capital funds 788) 968) 788)Minority equity 14 2) 1)Total equity and capital funds 790) 969) 788)Total liabilities and equity 1,756) 1,971 1,191)
The accompanying notes form part of and are to be read in conjunction with these financial statements.
On behalf of the Board22 August 2001
Roderick Deane Ralph WatersChairman of Directors Managing Director
FLETCHER BUILDING FINANCIAL STATEMENTS
28
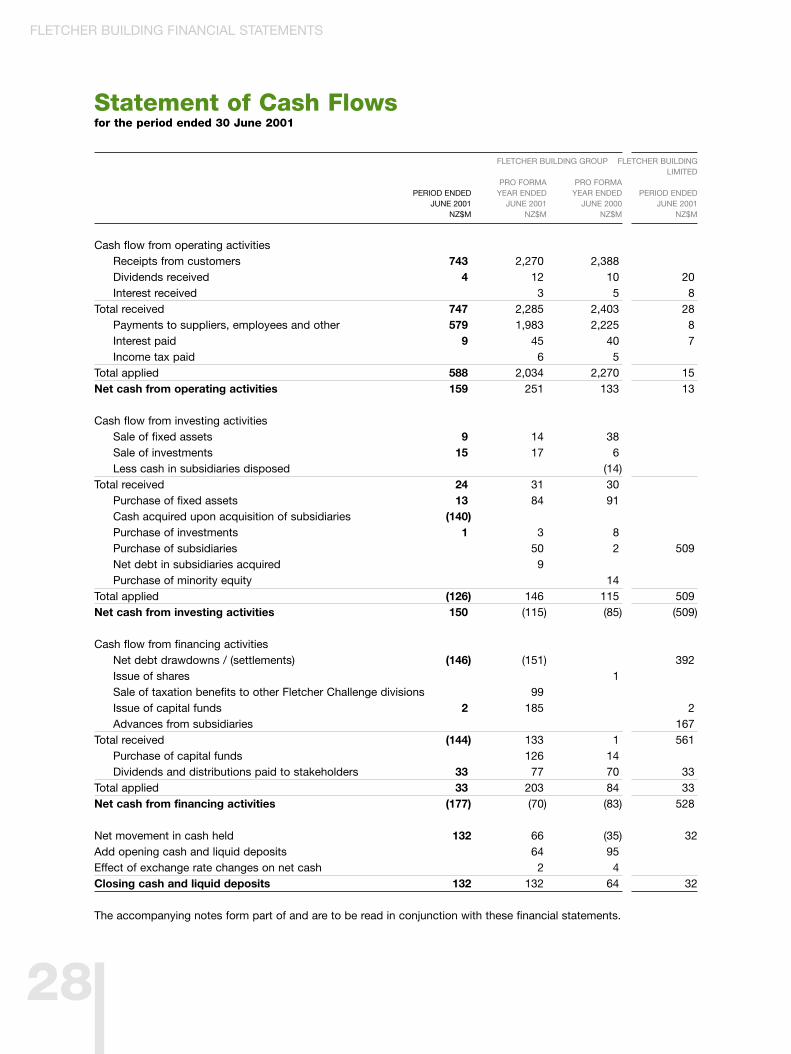
Statement of Cash Flowsfor the period ended 30 June 2001
FLETCHER BUILDING GROUP FLETCHER BUILDINGLIMITED
PRO FORMA PRO FORMAPERIOD ENDED YEAR ENDED YEAR ENDED PERIOD ENDED
JUNE 2001 JUNE 2001 JUNE 2000 JUNE 2001NZ$M NZ$M NZ$M NZ$M
Cash flow from operating activitiesReceipts from customers 743) 2,270) 2,388)Dividends received 4) 12) 10) 20)Interest received 3) 5) 8)
Total received 747) 2,285) 2,403) 28)Payments to suppliers, employees and other 579) 1,983) 2,225) 8)Interest paid 9) 45) 40) 7)Income tax paid 6) 5)
Total applied 588) 2,034) 2,270) 15)Net cash from operating activities 159) 251) 133) 13)
Cash flow from investing activitiesSale of fixed assets 9) 14) 38)Sale of investments 15) 17) 6)Less cash in subsidiaries disposed (14)
Total received 24) 31) 30)Purchase of fixed assets 13) 84) 91)Cash acquired upon acquisition of subsidiaries (140)Purchase of investments 1) 3) 8)Purchase of subsidiaries 50) 2) 509)Net debt in subsidiaries acquired 9)Purchase of minority equity 14)
Total applied (126) 146) 115) 509)Net cash from investing activities 150) (115) (85) (509)
Cash flow from financing activitiesNet debt drawdowns / (settlements) (146) (151) 392)Issue of shares 1)Sale of taxation benefits to other Fletcher Challenge divisions 99)Issue of capital funds 2) 185) 2)Advances from subsidiaries 167)
Total received (144) 133) 1) 561)Purchase of capital funds 126) 14)Dividends and distributions paid to stakeholders 33) 77) 70) 33)
Total applied 33) 203) 84) 33)Net cash from financing activities (177) (70) (83) 528)
Net movement in cash held 132 66) (35) 32 Add opening cash and liquid deposits 64) 95)Effect of exchange rate changes on net cash 2) 4)Closing cash and liquid deposits 132 132) 64) 32
The accompanying notes form part of and are to be read in conjunction with these financial statements.
FLETCHER BUILDING FINANCIAL STATEMENTS
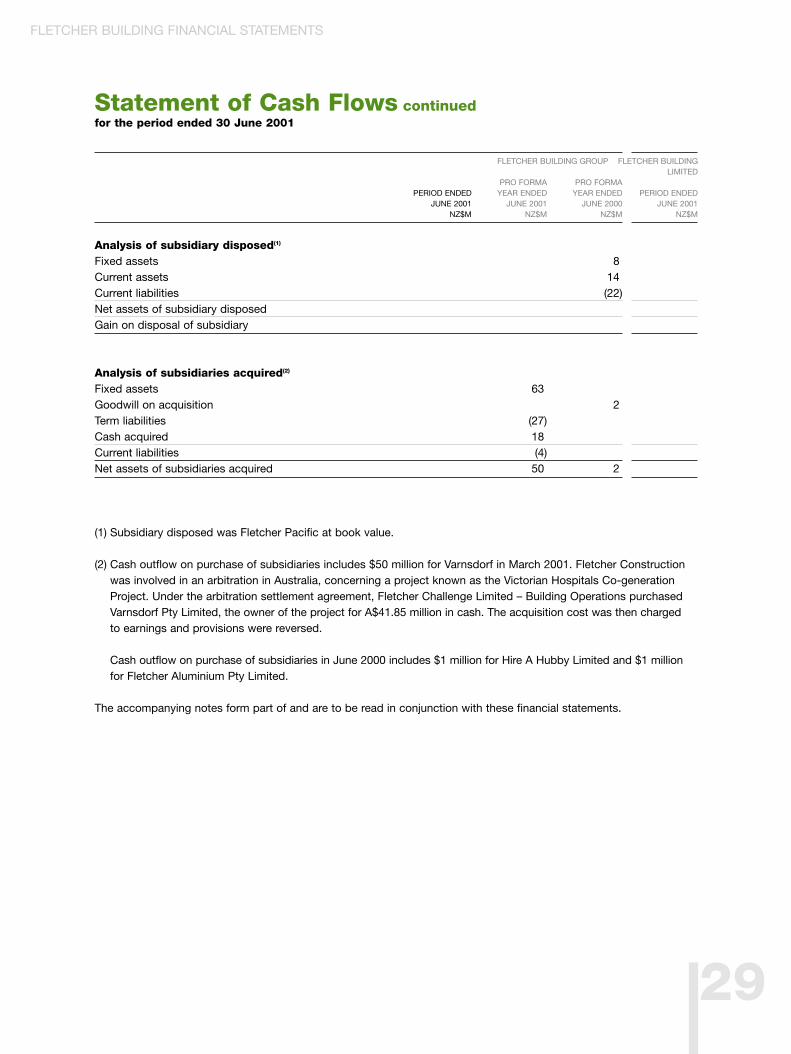
Statement of Cash Flows continuedfor the period ended 30 June 2001
FLETCHER BUILDING GROUP FLETCHER BUILDINGLIMITED
PRO FORMA PRO FORMAPERIOD ENDED YEAR ENDED YEAR ENDED PERIOD ENDED
JUNE 2001 JUNE 2001 JUNE 2000 JUNE 2001NZ$M NZ$M NZ$M NZ$M
Analysis of subsidiary disposed(1) )Fixed assets 8)Current assets 14)Current liabilities (22)Net assets of subsidiary disposedGain on disposal of subsidiary
Analysis of subsidiaries acquired(2)
Fixed assets 63)Goodwill on acquisition 2)Term liabilities (27)Cash acquired 18)Current liabilities (4)Net assets of subsidiaries acquired 50) 2)
(1) Subsidiary disposed was Fletcher Pacific at book value.
(2) Cash outflow on purchase of subsidiaries includes $50 million for Varnsdorf in March 2001. Fletcher Construction was involved in an arbitration in Australia, concerning a project known as the Victorian Hospitals Co-generation Project. Under the arbitration settlement agreement, Fletcher Challenge Limited – Building Operations purchased Varnsdorf Pty Limited, the owner of the project for A$41.85 million in cash. The acquisition cost was then charged to earnings and provisions were reversed.
(2) Cash outflow on purchase of subsidiaries in June 2000 includes $1 million for Hire A Hubby Limited and $1 millionfor Fletcher Aluminium Pty Limited.
The accompanying notes form part of and are to be read in conjunction with these financial statements.
29
FLETCHER BUILDING FINANCIAL STATEMENTS
30
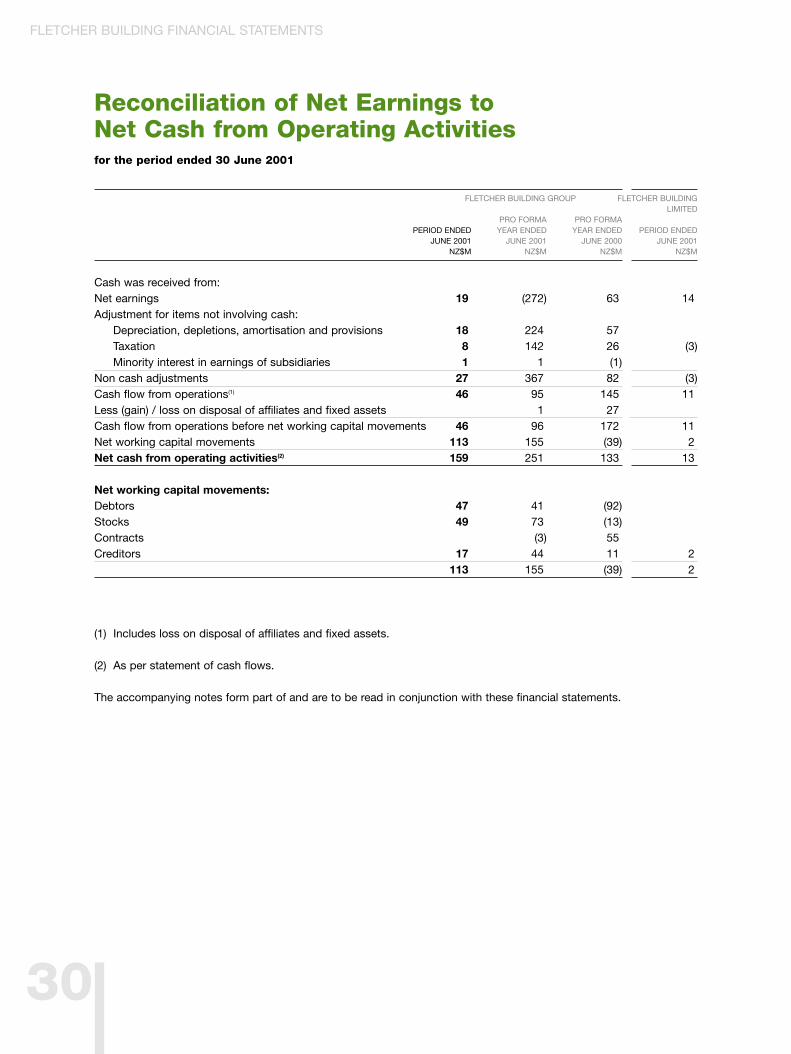
Reconciliation of Net Earnings to Net Cash from Operating Activitiesfor the period ended 30 June 2001
FLETCHER BUILDING GROUP FLETCHER BUILDINGLIMITED
PRO FORMA PRO FORMAPERIOD ENDED YEAR ENDED YEAR ENDED PERIOD ENDED
JUNE 2001 JUNE 2001 JUNE 2000 JUNE 2001NZ$M NZ$M NZ$M NZ$M
Cash was received from:Net earnings 19) (272) 63) 14)Adjustment for items not involving cash:
Depreciation, depletions, amortisation and provisions 18) 224) 57)Taxation 8) 142) 26) (3)Minority interest in earnings of subsidiaries 1) 1) (1)
Non cash adjustments 27) 367) 82) (3)Cash flow from operations(1) 46) 95) 145) 11)Less (gain) / loss on disposal of affiliates and fixed assets 1) 27)Cash flow from operations before net working capital movements 46) 96) 172) 11)Net working capital movements 113) 155) (39) 2)Net cash from operating activities(2) 159) 251) 133) 13)
Net working capital movements:Debtors 47) 41) (92)Stocks 49) 73) (13)Contracts (3) 55)Creditors 17) 44) 11) 2)
113) 155) (39) 2)
(1) Includes loss on disposal of affiliates and fixed assets.
(2) As per statement of cash flows.
The accompanying notes form part of and are to be read in conjunction with these financial statements.
FLETCHER BUILDING FINANCIAL STATEMENTS
31
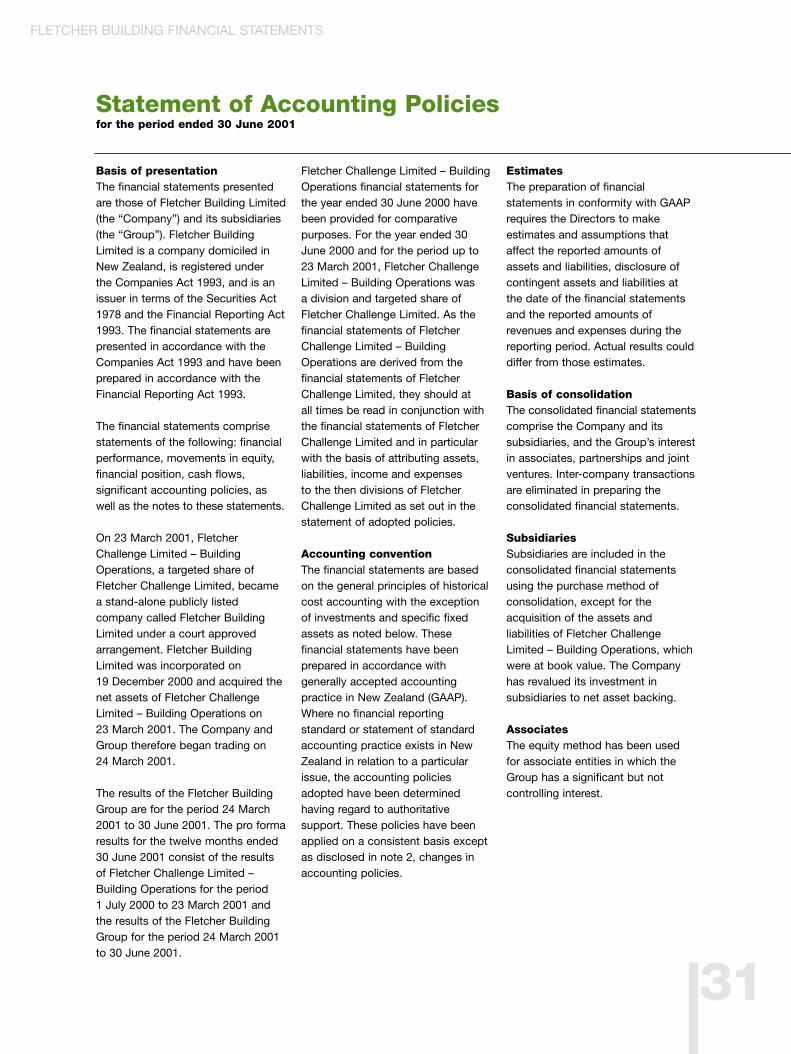
Statement of Accounting Policiesfor the period ended 30 June 2001
Basis of presentationThe financial statements presentedare those of Fletcher Building Limited(the “Company”) and its subsidiaries(the “Group”). Fletcher BuildingLimited is a company domiciled inNew Zealand, is registered under the Companies Act 1993, and is anissuer in terms of the Securities Act1978 and the Financial Reporting Act1993. The financial statements arepresented in accordance with theCompanies Act 1993 and have beenprepared in accordance with theFinancial Reporting Act 1993.
The financial statements comprisestatements of the following: financialperformance, movements in equity,financial position, cash flows,significant accounting policies, aswell as the notes to these statements.
On 23 March 2001, FletcherChallenge Limited – BuildingOperations, a targeted share ofFletcher Challenge Limited, becamea stand-alone publicly listedcompany called Fletcher BuildingLimited under a court approvedarrangement. Fletcher BuildingLimited was incorporated on 19 December 2000 and acquired thenet assets of Fletcher ChallengeLimited – Building Operations on 23 March 2001. The Company andGroup therefore began trading on 24 March 2001.
The results of the Fletcher BuildingGroup are for the period 24 March2001 to 30 June 2001. The pro formaresults for the twelve months ended30 June 2001 consist of the resultsof Fletcher Challenge Limited –Building Operations for the period 1 July 2000 to 23 March 2001 andthe results of the Fletcher BuildingGroup for the period 24 March 2001to 30 June 2001.
Fletcher Challenge Limited – BuildingOperations financial statements forthe year ended 30 June 2000 havebeen provided for comparativepurposes. For the year ended 30June 2000 and for the period up to23 March 2001, Fletcher ChallengeLimited – Building Operations was a division and targeted share ofFletcher Challenge Limited. As thefinancial statements of FletcherChallenge Limited – BuildingOperations are derived from thefinancial statements of FletcherChallenge Limited, they should at all times be read in conjunction withthe financial statements of FletcherChallenge Limited and in particularwith the basis of attributing assets,liabilities, income and expenses to the then divisions of FletcherChallenge Limited as set out in thestatement of adopted policies.
Accounting conventionThe financial statements are basedon the general principles of historicalcost accounting with the exceptionof investments and specific fixedassets as noted below. Thesefinancial statements have beenprepared in accordance withgenerally accepted accountingpractice in New Zealand (GAAP).Where no financial reportingstandard or statement of standardaccounting practice exists in NewZealand in relation to a particularissue, the accounting policiesadopted have been determinedhaving regard to authoritativesupport. These policies have beenapplied on a consistent basis exceptas disclosed in note 2, changes inaccounting policies.
EstimatesThe preparation of financialstatements in conformity with GAAPrequires the Directors to makeestimates and assumptions thataffect the reported amounts ofassets and liabilities, disclosure ofcontingent assets and liabilities atthe date of the financial statementsand the reported amounts ofrevenues and expenses during thereporting period. Actual results coulddiffer from those estimates.
Basis of consolidationThe consolidated financial statementscomprise the Company and itssubsidiaries, and the Group’s interestin associates, partnerships and jointventures. Inter-company transactionsare eliminated in preparing theconsolidated financial statements.
SubsidiariesSubsidiaries are included in theconsolidated financial statementsusing the purchase method ofconsolidation, except for theacquisition of the assets andliabilities of Fletcher ChallengeLimited – Building Operations, whichwere at book value. The Companyhas revalued its investment insubsidiaries to net asset backing.
AssociatesThe equity method has been usedfor associate entities in which theGroup has a significant but notcontrolling interest.
FLETCHER BUILDING FINANCIAL STATEMENTS
32
Goodwill on acquisitionFair values are assigned to the assetsand liabilities of subsidiaries andassociates of the Group at the date theyare acquired. Goodwill arises to theextent that the fair value is determinedto be less than the purchase cost andthis goodwill is amortised to earningson a systematic basis over the period inwhich it is believed benefits will arise.
The period of amortisation will generallybe five years or less; however, inindividual cases it may be up to twentyyears. The period of amortisation of anygoodwill is regularly reviewed and, if it is believed that the amount remaining to be amortised will not be recovered by future benefits to be realised, theunrecoverable amount is written off toearnings and the balance amortisedover the period it is believed benefitswill be realised. Negative goodwill onacquisition arises to the extent that fairvalue is determined to exceed thepurchase cost and this surplus isapplied to reduce the book value ofnon-monetary assets acquired and, tothe extent there are insufficient non-monetary assets, taken to earnings.
Joint venturesWhere the ownership interest in the joint venture is in the net residue of thebusiness and does not give rise to aneconomic or controlling interest inexcess of 50 per cent, the share of thenet assets and liabilities and earnings ofthe investment is included on an equitybasis. If the interest does give rise to acontrolling interest in excess of 50 percent, the investment is consolidated.
Joint ventures in which the ownershipinterest is directly in the assets andliabilities rather than the net residue areincluded on a proportional basis withassets, liabilities and earnings based on the Group’s proportional interests.
Currency translationStatements of financial position inforeign currencies are translated intoNew Zealand currency at the rates ofexchange ruling at balance date.Statements of financial performance inforeign currencies are translated usingan average exchange rate reflecting an approximation of the appropriatetransaction rates. Exchange variationsarising from translation are held in thecurrency translation reserve.
Valuation of assets
Land, buildings, plant andmachinery, fixtures and equipmentLand, buildings, and plant andmachinery are revalued by independentregistered valuers on the basis of fairvalue. The revaluations are conductedon a systematic basis across the Groupso that each asset is revalued at leastevery five years.
The values are reviewed annually toensure that no asset is held at a valuematerially different from fair value.Fixtures and equipment are valued at cost. Land, buildings, plant andmachinery, fixtures and equipment are stated at cost or valuation, lessaccumulated depreciation.
InvestmentsInvestments are valued at historicalcost. Impairments in value of investmentsare written off to earnings as they arise.
StocksTrading stock, raw materials and work inprogress are valued at the lower of cost,net realisable value or replacement price,determined principally on the first-in-first-out basis. Cost includes directmanufacturing costs and manufacturingoverheads at normal operating levels.
Construction contractsEarnings on construction contracts(including sub-contracts) are determinedusing the percentage-of-completionmethod. Earnings are not recogniseduntil the outcome can be reliablyestimated. Provision is made for estimatedfuture losses on the entire contract fromthe date it is first recognised that acontract loss may be incurred.
DebtorsDebtors are valued at estimated netrealisable value. The valuation is net of a provision maintained for doubtfuldebts. All known losses are written offto earnings in the period in which itbecomes apparent that the debts arenot collectable.
CashCash and liquid deposits comprise cashand demand deposits with banks orother financial institutions and highlyliquid investments that are readilyconvertible to cash.
Statement of Accounting Policies continuedfor the period ended 30 June 2001
FLETCHER BUILDING FINANCIAL STATEMENTS
33
ImpairmentImpairment is deemed to occur whenthe recoverable amount falls below thebook value of the asset. The recoverableamount is determined to be the sum ofexpected future discounted net cash flowsarising from the ownership of the asset.Future net cash flows take into accountremaining useful life, and the expectedperiod of continued ownership, includingany intended disposals, and any costsor proceeds expected to eventuate atthe end of the remaining useful life orend of the expected period of continuedownership.
For the purposes of consideringwhether there has been an impairment,assets are grouped at the lowest levelfor which there are identifiable cashflows that are largely independent of thecash flows of other groups of assets.When an impairment loss arises, theimpairment is measured as the amountby which the book value exceeds therecoverable amount of the asset.
Valuation of liabilities
Derivative financial instrumentsDerivative financial instrumentsincluding foreign exchange contracts,interest rate swaps, currency swaps,options, forward rate agreements andelectricity price swaps are utilised toreduce exposure to market risks.
Group policy specifically prohibits theuse of derivative financial instrumentsfor trading or speculative purposes. Allderivative financial instruments are held tohedge risk on underlying assets, liabilities,sales and purchases. For a derivativeinstrument to be classified and accountedfor as a hedge, it must be highly correlatedwith, and effective as a hedge of theunderlying risk being managed.
Derivative financial instruments arereported in the financial statements on a basis consistent with the underlyinghedged item. The fair value of derivativefinancial instruments, as disclosed in thefinancial instrument note, is estimatedbased upon quoted market prices.
The Group holds instruments untilexpiry except where the underlyingrationale from a risk management pointof view changes, such as when theunderlying asset or liability which theinstrument hedges no longer exists, in which case early termination occurs.
TaxationThe provision for current tax is theestimated amount due for payment inthe next 12 months by the Group. Theprovision for deferred tax of the Groupis the liability for taxation that has beendeferred because of timing differencesless taxation benefits which will offsetthe deferred liability as it arises. Theprovision for deferred taxation of theGroup has been calculated by applyingthe liability method.
In the Group, the future tax benefit ofpast and current tax losses, to theextent they exceed related deferredtaxation liabilities, is not recognisedunless recovery is considered certain.
Finance leasesFinance leases are capitalised to reflectthe term borrowing incurred and thecost of the asset acquired. Suchobligations are classified within termdebt. The finance cost portion of leasepayments is written off to earnings. The leased asset is depreciated on astraight line basis over the estimateduseful life of the asset with regard toresidual values.
Incomedetermination
Revenue recognitionOperating revenue is recognised inaccordance with the terms of sale when the benefits of ownership and risk of loss passes to the customer.
Investment revenueInterest income is taken to earningswhen received or accrued in respect of the period for which it was earned.Dividends and distributions are taken to earnings when received or accruedwhere declared prior to balance date.
Foreign currency itemsForeign currency monetary items arerecorded at the rates of exchange rulingat balance date. Losses or gains arewritten off to earnings. Foreign currencynon-monetary items are translated atthe exchange rates in effect when the amounts of these items weredetermined. If a foreign currency liabilityis designated as a hedge of a foreigncurrency non monetary asset, the items are translated at the closing rate andthe exchange difference taken to thecurrency translation reserve. Foreigncurrency items subject to a forwardexchange hedge contract are recordedat the contract rate.
Statement of Accounting Policies continuedfor the period ended 30 June 2001
FLETCHER BUILDING FINANCIAL STATEMENTS
34
Statement of Accounting Policies continuedfor the period ended 30 June 2001
FLETCHER BUILDING FINANCIAL STATEMENTS
DepreciationDepreciation of fixed assets iscalculated on the straight line method.Expected useful lives, which areregularly reviewed, are (on a weightedaverage basis):
Buildings 30 yearsPlant and machinery 13 yearsFixtures and equipment 5 years
Leasing commitmentsExpenditure arising from operatingleasing commitments is written off to earnings in the period incurred.Purchased head leases are valued atcost and amortised over the unexpiredperiod of the lease.
Pension plan expenseThe actuarial cost of providing pensionplan benefits in respect of servicesprovided by pension plan members tothe Group is expensed as it accruesover the service life of the employees,taking account of the income earned by the income generating assets ownedby the plan. Any over or under accrualof expenses or income from previousperiods is amortised to earnings over a maximum period of the remainingaverage service life of plan membersemployed by the Group.
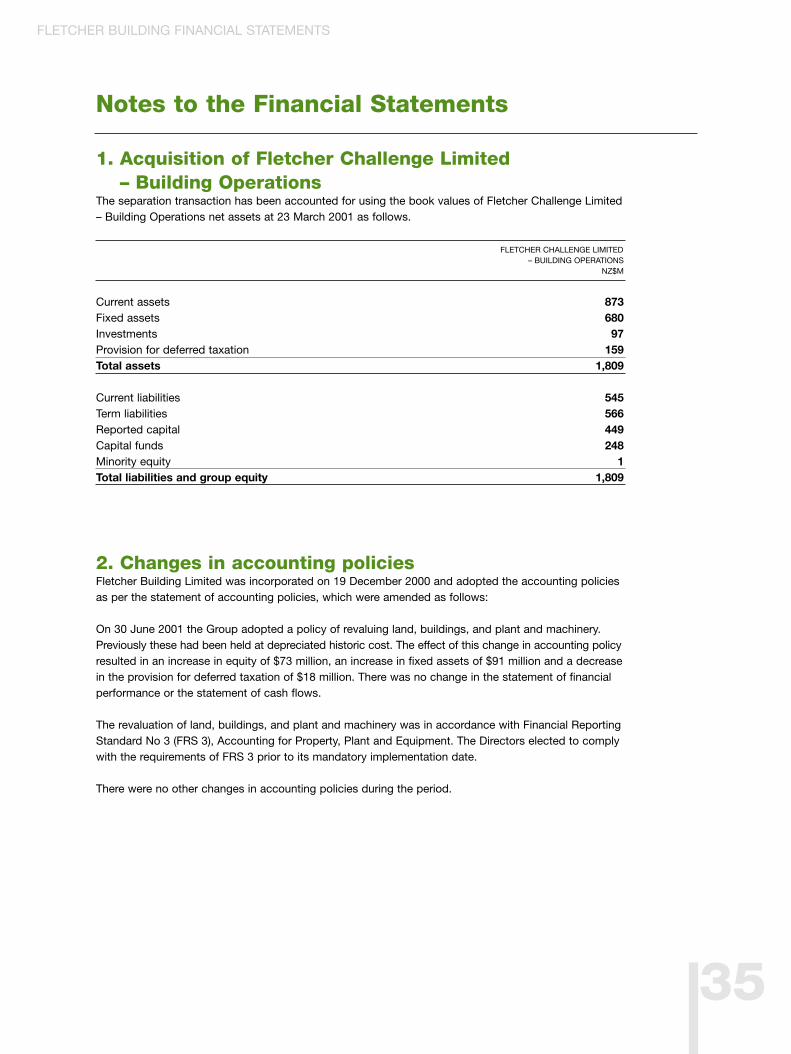
35
Notes to the Financial Statements
FLETCHER BUILDING FINANCIAL STATEMENTS
1. Acquisition of Fletcher Challenge Limited– Building Operations
The separation transaction has been accounted for using the book values of Fletcher Challenge Limited – Building Operations net assets at 23 March 2001 as follows.
FLETCHER CHALLENGE LIMITED – BUILDING OPERATIONS
NZ$M
Current assets 873Fixed assets 680Investments 97Provision for deferred taxation 159Total assets 1,809
Current liabilities 545Term liabilities 566Reported capital 449Capital funds 248Minority equity 1Total liabilities and group equity 1,809
2. Changes in accounting policiesFletcher Building Limited was incorporated on 19 December 2000 and adopted the accounting policies as per the statement of accounting policies, which were amended as follows:
On 30 June 2001 the Group adopted a policy of revaluing land, buildings, and plant and machinery. Previously these had been held at depreciated historic cost. The effect of this change in accounting policyresulted in an increase in equity of $73 million, an increase in fixed assets of $91 million and a decrease in the provision for deferred taxation of $18 million. There was no change in the statement of financial performance or the statement of cash flows.
The revaluation of land, buildings, and plant and machinery was in accordance with Financial Reporting Standard No 3 (FRS 3), Accounting for Property, Plant and Equipment. The Directors elected to comply with the requirements of FRS 3 prior to its mandatory implementation date.
There were no other changes in accounting policies during the period.

FLETCHER BUILDING GROUP FLETCHER BUILDINGLIMITED
PRO FORMA PRO FORMAPERIOD ENDED YEAR ENDED YEAR ENDED PERIOD ENDED
JUNE 2001 JUNE 2001 JUNE 2000 JUNE 2001NZ$M NZ$M NZ$M NZ$M
3. Operating revenueOperating revenue from continuing operations includes:Sales
Trading sales to external customers 687 2,249 2,345Inter-divisional trading sales 11
687 2,249 2,356Investment revenue
Dividends 4 12 10 20Interest 1 8Income from joint ventures 5 12 13
696 2,273 2,380 28
4. Operating earningsOperating earnings from continuing operations includes:Net gains on disposal of fixed assets 1 3Amortisation of goodwill and intangibles 2 9 6Depreciation and depletions:
Buildings 2 6 5Plant and machinery 19 67 63Fixtures and equipment 1 7 7Resource extraction assets 1 1Total depreciation and depletions 22 81 76
Unusual items:Restructuring and separation costs(1) 4 43 33Impairment(2) 1 101 10Other losses(3) 37
Research and development 1 3 5Bad debts written off 2 8 6Donations 1Maintenance and repairs 15 59 63Operating lease expense 11 34 33Auditors' fees and expenses payable for:
Statutory audit 1 1 2Other services 5 1
(1) Restructuring and separation costs of $43 million in June 2001 and $3 million in June 2000 arise from the separation of the Fletcher Challenge targeted share structure. The write-off of $30 million in June 2000 was upon the re-organisation of the Fletcher Challenge Employee Educational Fund.
(2) The impairment in June 2001 relates to the concrete operations in New Zealand of $17 million, the Group’sowned properties in Auckland of $14 million and the concrete operations in South America of $70 million. The impairment of $10 million in June 2000 relates to the Fijian operations.
(3) Other losses of $37 million in June 2001 relate to the settlement of a dispute over the construction of co-generation plants in Australia.36
FLETCHER BUILDING FINANCIAL STATEMENTS
Notes to the Financial Statements continued
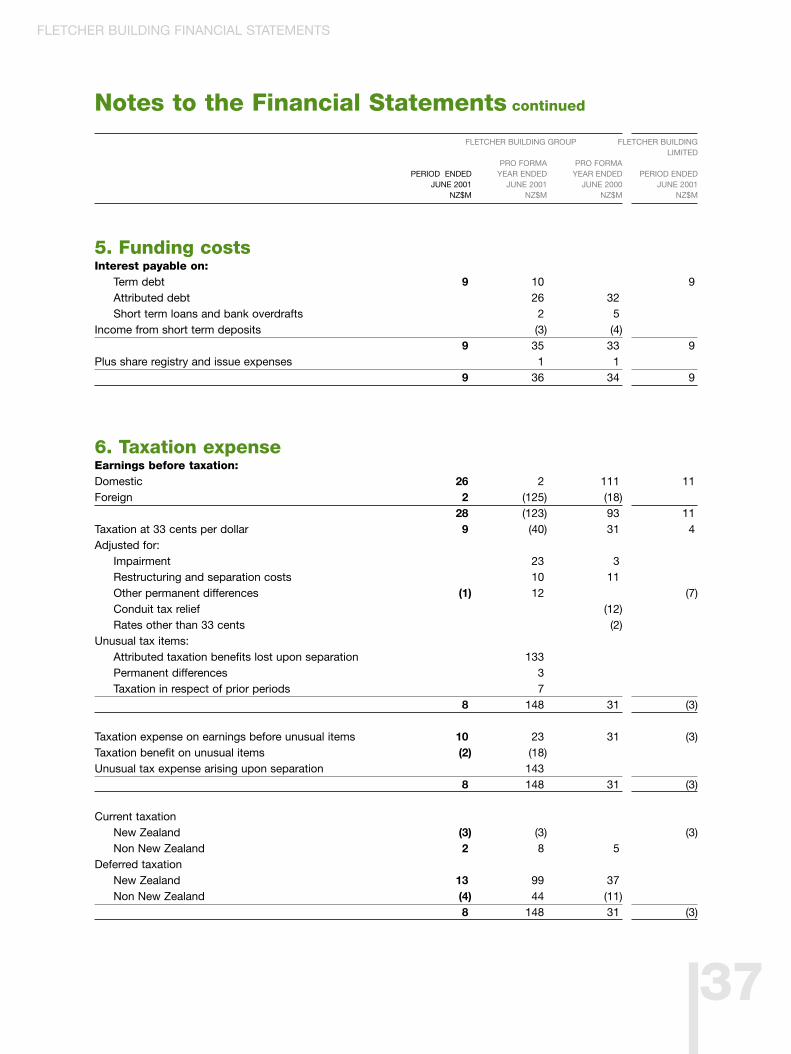
FLETCHER BUILDING GROUP FLETCHER BUILDINGLIMITED
PRO FORMA PRO FORMAPERIOD ENDED YEAR ENDED YEAR ENDED PERIOD ENDED
JUNE 2001 JUNE 2001 JUNE 2000 JUNE 2001NZ$M NZ$M NZ$M NZ$M
5. Funding costsInterest payable on:
Term debt 9) 10) 9)Attributed debt 26) 32)Short term loans and bank overdrafts 2) 5)
Income from short term deposits (3) (4)9) 35) 33) 9)
Plus share registry and issue expenses 1) 1)9) 36) 34) 9)
6. Taxation expenseEarnings before taxation:Domestic 26) 2) 111) 11)Foreign 2) (125) (18)
28) (123) 93) 11)Taxation at 33 cents per dollar 9) (40) 31) 4)Adjusted for:
Impairment 23) 3)Restructuring and separation costs 10) 11)Other permanent differences (1) 12) (7)Conduit tax relief (12)Rates other than 33 cents (2)
Unusual tax items:Attributed taxation benefits lost upon separation 133)Permanent differences 3)Taxation in respect of prior periods 7)
8) 148) 31) (3)
Taxation expense on earnings before unusual items 10) 23) 31) (3)Taxation benefit on unusual items (2) (18)Unusual tax expense arising upon separation 143)
8) 148) 31) (3)
Current taxationNew Zealand (3) (3) (3)Non New Zealand 2) 8) 5)
Deferred taxationNew Zealand 13) 99) 37)Non New Zealand (4) 44) (11)
8) 148) 31) (3)
37
FLETCHER BUILDING FINANCIAL STATEMENTS
Notes to the Financial Statements continued
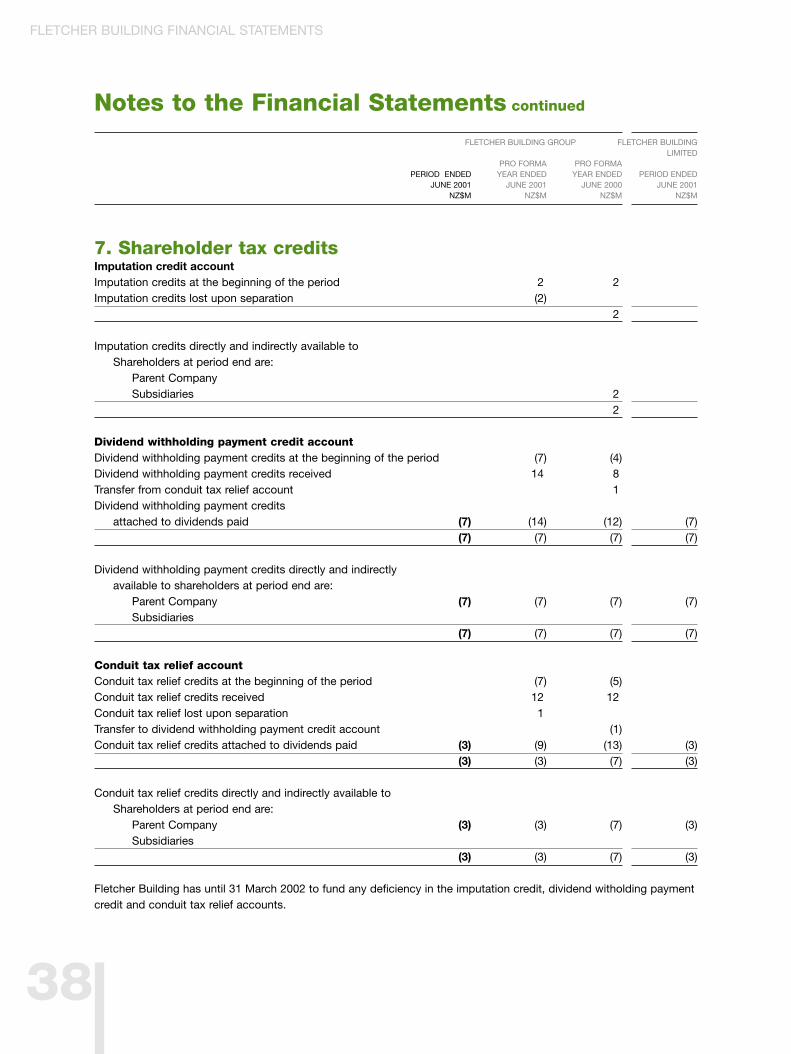
FLETCHER BUILDING GROUP FLETCHER BUILDINGLIMITED
PRO FORMA PRO FORMAPERIOD ENDED YEAR ENDED YEAR ENDED PERIOD ENDED
JUNE 2001 JUNE 2001 JUNE 2000 JUNE 2001NZ$M NZ$M NZ$M NZ$M
7. Shareholder tax creditsImputation credit accountImputation credits at the beginning of the period 2) 2)Imputation credits lost upon separation (2)
2)
Imputation credits directly and indirectly available to Shareholders at period end are:
Parent CompanySubsidiaries 2)
2)
Dividend withholding payment credit accountDividend withholding payment credits at the beginning of the period (7) (4)Dividend withholding payment credits received 14) 8)Transfer from conduit tax relief account 1)Dividend withholding payment credits
attached to dividends paid (7) (14) (12) (7)(7) (7) (7) (7)
Dividend withholding payment credits directly and indirectly available to shareholders at period end are:
Parent Company (7) (7) (7) (7)Subsidiaries
(7) (7) (7) (7)
Conduit tax relief accountConduit tax relief credits at the beginning of the period (7) (5)Conduit tax relief credits received 12) 12)Conduit tax relief lost upon separation 1)Transfer to dividend withholding payment credit account (1)Conduit tax relief credits attached to dividends paid (3) (9) (13) (3)
(3) (3) (7) (3)
Conduit tax relief credits directly and indirectly available toShareholders at period end are:
Parent Company (3) (3) (7) (3)Subsidiaries
(3) (3) (7) (3)
Fletcher Building has until 31 March 2002 to fund any deficiency in the imputation credit, dividend witholding payment credit and conduit tax relief accounts.
38
FLETCHER BUILDING FINANCIAL STATEMENTS
Notes to the Financial Statements continued
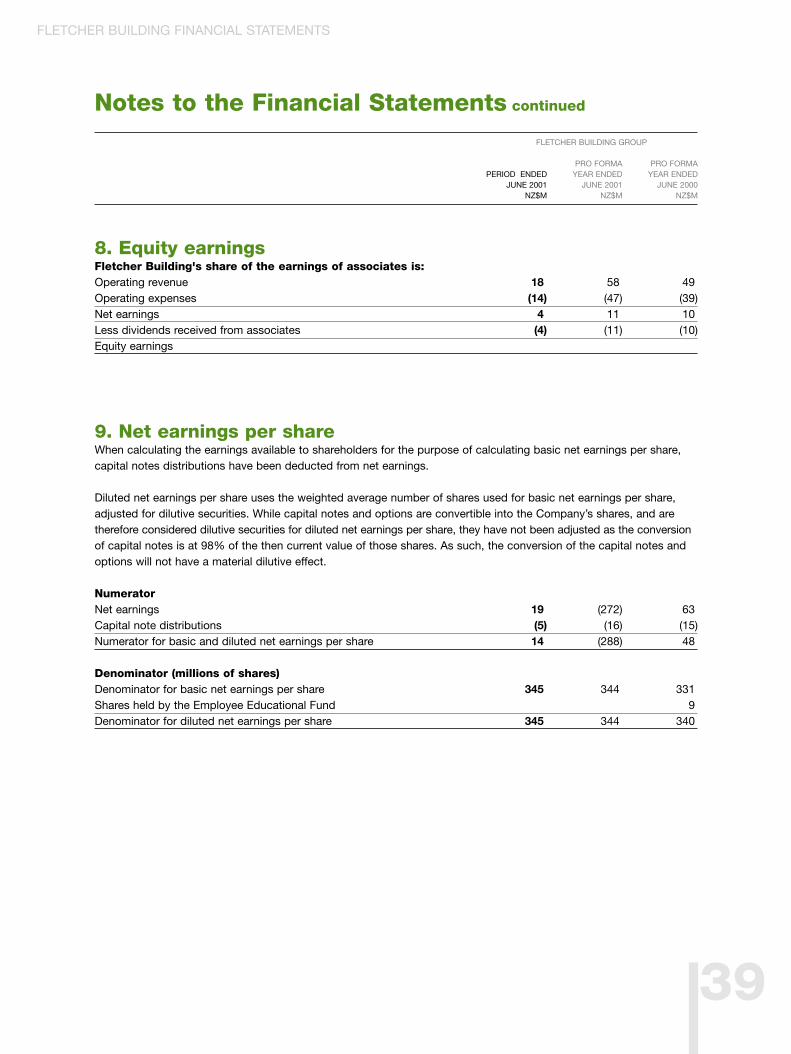
FLETCHER BUILDING GROUP
PRO FORMA PRO FORMAPERIOD ENDED YEAR ENDED YEAR ENDED
JUNE 2001 JUNE 2001 JUNE 2000NZ$M NZ$M NZ$M
8. Equity earningsFletcher Building's share of the earnings of associates is:Operating revenue 18) 58) 49)Operating expenses (14) (47) (39)Net earnings 4) 11) 10)Less dividends received from associates (4) (11) (10)Equity earnings
9. Net earnings per shareWhen calculating the earnings available to shareholders for the purpose of calculating basic net earnings per share, capital notes distributions have been deducted from net earnings.
Diluted net earnings per share uses the weighted average number of shares used for basic net earnings per share, adjusted for dilutive securities. While capital notes and options are convertible into the Company’s shares, and are therefore considered dilutive securities for diluted net earnings per share, they have not been adjusted as the conversionof capital notes is at 98% of the then current value of those shares. As such, the conversion of the capital notes and options will not have a material dilutive effect.
NumeratorNet earnings 19) (272) 63)Capital note distributions (5) (16) (15)Numerator for basic and diluted net earnings per share 14) (288) 48)
Denominator (millions of shares)Denominator for basic net earnings per share 345) 344) 331)Shares held by the Employee Educational Fund 9)Denominator for diluted net earnings per share 345) 344) 340)
39
FLETCHER BUILDING FINANCIAL STATEMENTS
Notes to the Financial Statements continued
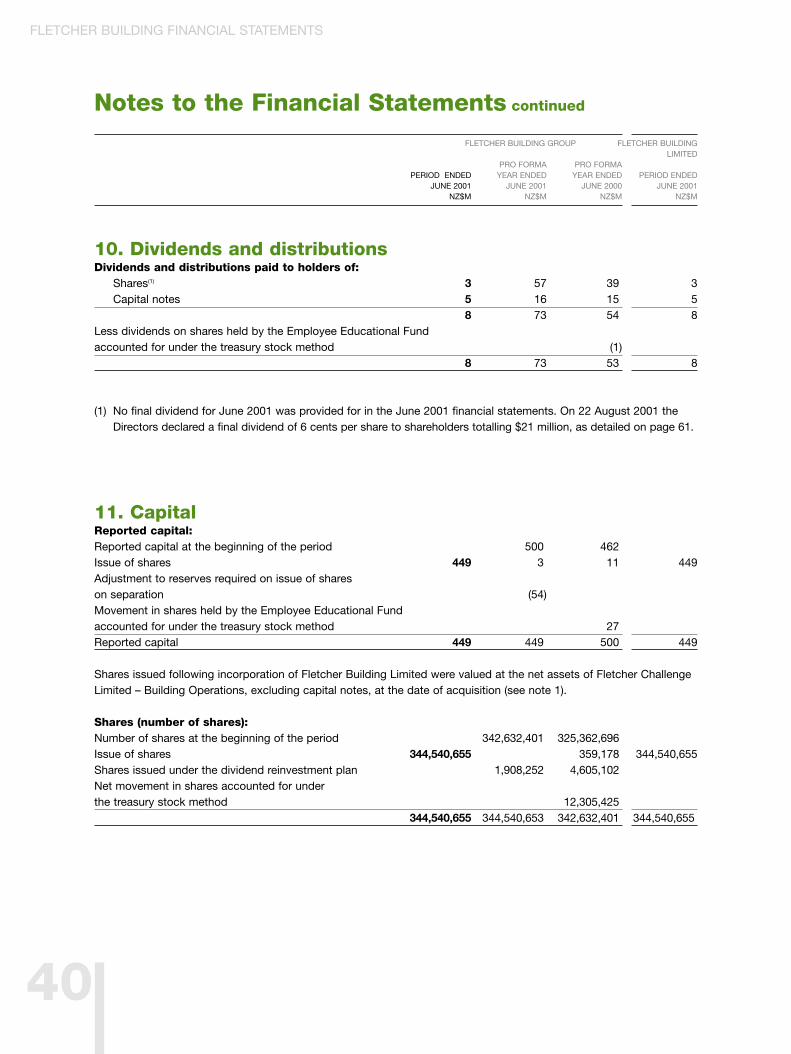
FLETCHER BUILDING GROUP FLETCHER BUILDINGLIMITED
PRO FORMA PRO FORMAPERIOD ENDED YEAR ENDED YEAR ENDED PERIOD ENDED
JUNE 2001 JUNE 2001 JUNE 2000 JUNE 2001NZ$M NZ$M NZ$M NZ$M
10. Dividends and distributionsDividends and distributions paid to holders of:
Shares(1) 3 57 39) 3Capital notes 5 16 15) 5
8 73 54) 8Less dividends on shares held by the Employee Educational Fund accounted for under the treasury stock method (1)
8 73 53) 8
(1) No final dividend for June 2001 was provided for in the June 2001 financial statements. On 22 August 2001 the Directors declared a final dividend of 6 cents per share to shareholders totalling $21 million, as detailed on page 61.
11. CapitalReported capital:Reported capital at the beginning of the period 500) 462)Issue of shares 449 3) 11) 449Adjustment to reserves required on issue of shares on separation (54)Movement in shares held by the Employee Educational Fundaccounted for under the treasury stock method 27)Reported capital 449 449) 500) 449
Shares issued following incorporation of Fletcher Building Limited were valued at the net assets of Fletcher Challenge Limited – Building Operations, excluding capital notes, at the date of acquisition (see note 1).
Shares (number of shares):Number of shares at the beginning of the period 342,632,401) 325,362,696) 22Issue of shares 344,540,655 359,178) 344,540,655Shares issued under the dividend reinvestment plan 1,908,252) 4,605,102)Net movement in shares accounted for under the treasury stock method 12,305,425)
344,540,655 344,540,653) 342,632,401) 344,540,655)
40
FLETCHER BUILDING FINANCIAL STATEMENTS
Notes to the Financial Statements continued
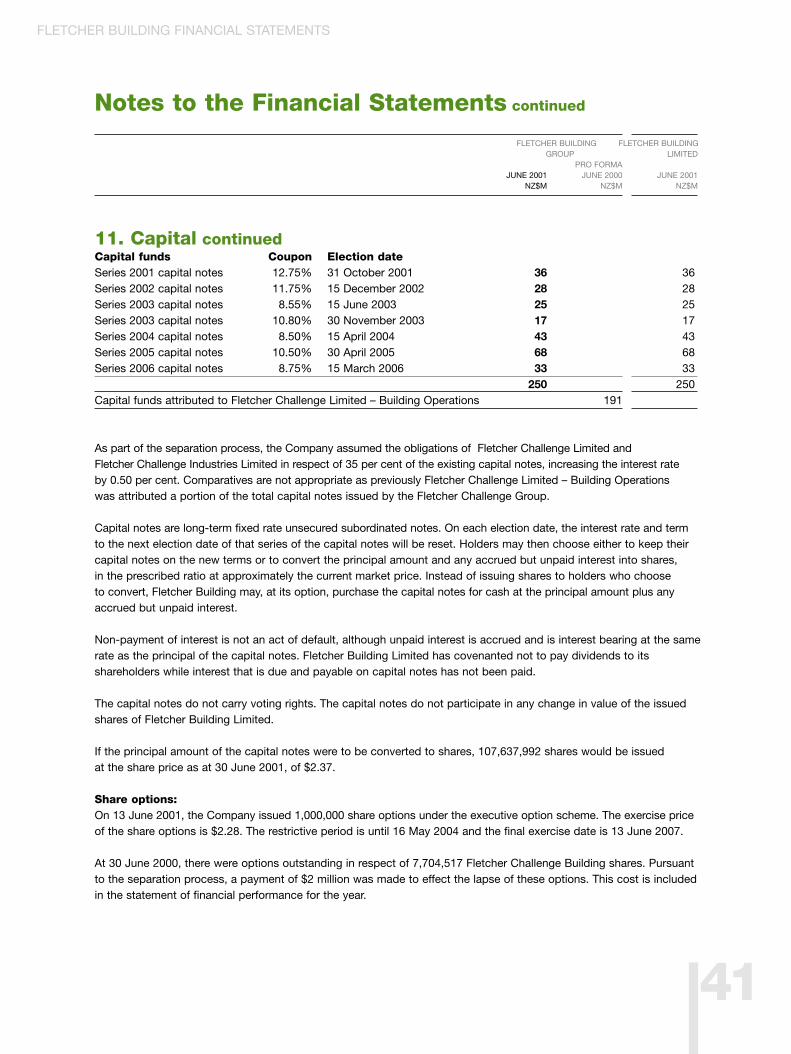
FLETCHER BUILDING FLETCHER BUILDINGGROUP LIMITED
PRO FORMAJUNE 2001 JUNE 2000 JUNE 2001
NZ$M NZ$M NZ$M
11. Capital continuedCapital funds Coupon Election dateSeries 2001 capital notes 12.75% 31 October 2001 36 36)Series 2002 capital notes 11.75% 15 December 2002 28 28)Series 2003 capital notes 8.55% 15 June 2003 25 25)Series 2003 capital notes 10.80% 30 November 2003 17 17)Series 2004 capital notes 8.50% 15 April 2004 43 43)Series 2005 capital notes 10.50% 30 April 2005 68 68)Series 2006 capital notes 8.75% 15 March 2006 33 33)
250 250)Capital funds attributed to Fletcher Challenge Limited – Building Operations 191
As part of the separation process, the Company assumed the obligations of Fletcher Challenge Limited and Fletcher Challenge Industries Limited in respect of 35 per cent of the existing capital notes, increasing the interest rate by 0.50 per cent. Comparatives are not appropriate as previously Fletcher Challenge Limited – Building Operations was attributed a portion of the total capital notes issued by the Fletcher Challenge Group.
Capital notes are long-term fixed rate unsecured subordinated notes. On each election date, the interest rate and termto the next election date of that series of the capital notes will be reset. Holders may then choose either to keep their capital notes on the new terms or to convert the principal amount and any accrued but unpaid interest into shares, in the prescribed ratio at approximately the current market price. Instead of issuing shares to holders who choose to convert, Fletcher Building may, at its option, purchase the capital notes for cash at the principal amount plus any accrued but unpaid interest.
Non-payment of interest is not an act of default, although unpaid interest is accrued and is interest bearing at the same rate as the principal of the capital notes. Fletcher Building Limited has covenanted not to pay dividends to its shareholders while interest that is due and payable on capital notes has not been paid.
The capital notes do not carry voting rights. The capital notes do not participate in any change in value of the issued shares of Fletcher Building Limited.
If the principal amount of the capital notes were to be converted to shares, 107,637,992 shares would be issued at the share price as at 30 June 2001, of $2.37.
Share options:On 13 June 2001, the Company issued 1,000,000 share options under the executive option scheme. The exercise priceof the share options is $2.28. The restrictive period is until 16 May 2004 and the final exercise date is 13 June 2007.
At 30 June 2000, there were options outstanding in respect of 7,704,517 Fletcher Challenge Building shares. Pursuant to the separation process, a payment of $2 million was made to effect the lapse of these options. This cost is included in the statement of financial performance for the year.
41
FLETCHER BUILDING FINANCIAL STATEMENTS
Notes to the Financial Statements continued
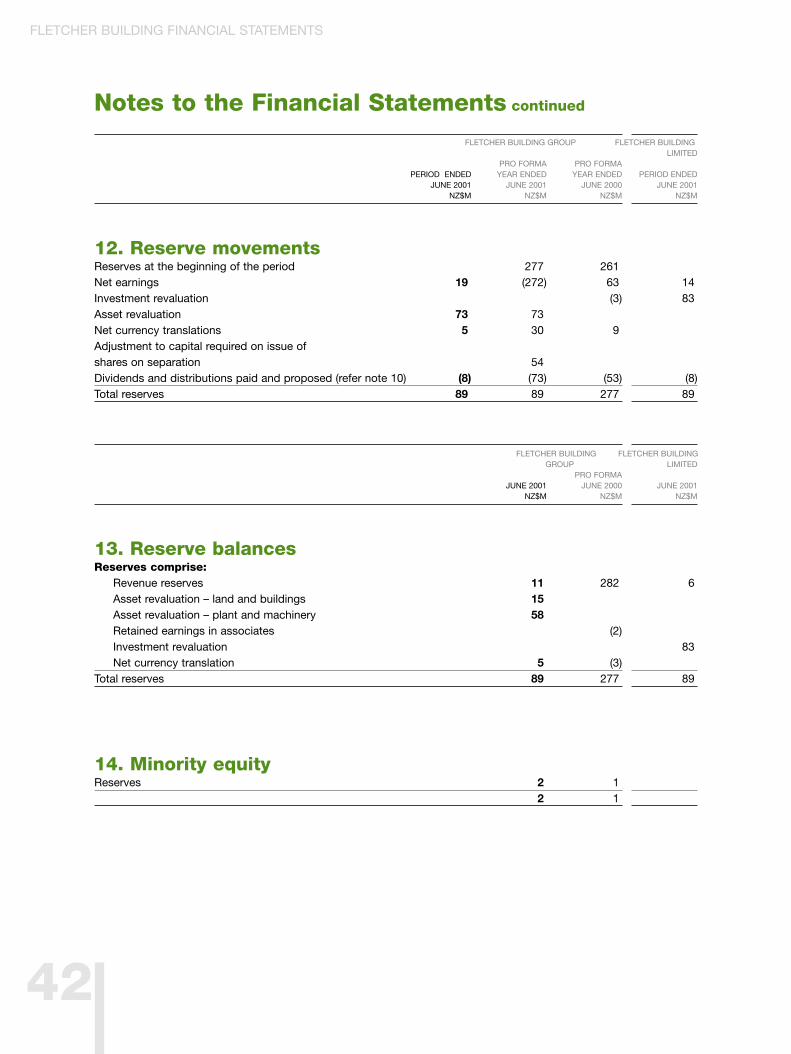
FLETCHER BUILDING GROUP FLETCHER BUILDINGLIMITED
PRO FORMA PRO FORMAPERIOD ENDED YEAR ENDED YEAR ENDED PERIOD ENDED
JUNE 2001 JUNE 2001 JUNE 2000 JUNE 2001NZ$M NZ$M NZ$M NZ$M
12. Reserve movementsReserves at the beginning of the period 277) 261)Net earnings 19) (272) 63) 14)Investment revaluation (3) 83)Asset revaluation 73) 73)Net currency translations 5) 30) 9)Adjustment to capital required on issue of shares on separation 54)Dividends and distributions paid and proposed (refer note 10) (8) (73) (53) (8)Total reserves 89) 89) 277) 89)
FLETCHER BUILDING FLETCHER BUILDINGGROUP LIMITED
PRO FORMAJUNE 2001 JUNE 2000 JUNE 2001
NZ$M NZ$M NZ$M
13. Reserve balancesReserves comprise:
Revenue reserves 11) 282) 6)Asset revaluation – land and buildings 15)Asset revaluation – plant and machinery 58)Retained earnings in associates (2)Investment revaluation 83)Net currency translation 5) (3)
Total reserves 89) 277) 89)
14. Minority equityReserves 2) 1)
2) 1)
42
FLETCHER BUILDING FINANCIAL STATEMENTS
Notes to the Financial Statements continued
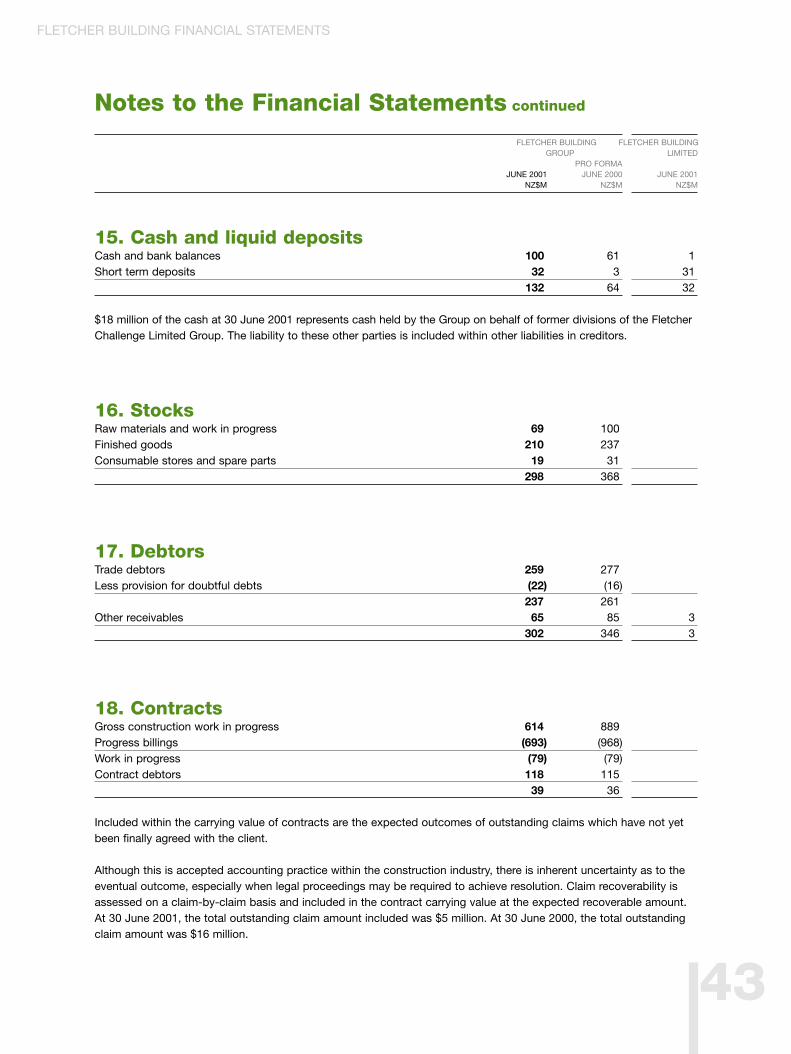
FLETCHER BUILDING FLETCHER BUILDINGGROUP LIMITED
PRO FORMAJUNE 2001 JUNE 2000 JUNE 2001
NZ$M NZ$M NZ$M
15. Cash and liquid depositsCash and bank balances 100) 61) 1)Short term deposits 32) 3) 31)
132) 64) 32)
$18 million of the cash at 30 June 2001 represents cash held by the Group on behalf of former divisions of the FletcherChallenge Limited Group. The liability to these other parties is included within other liabilities in creditors.)
16. StocksRaw materials and work in progress 69) 100)Finished goods 210) 237)Consumable stores and spare parts 19) 31)
298) 368)
17. DebtorsTrade debtors 259) 277)Less provision for doubtful debts (22) (16)
237) 261)Other receivables 65) 85) 3)
302) 346) 3)
18. ContractsGross construction work in progress 614) 889)Progress billings (693) (968)Work in progress (79) (79)Contract debtors 118) 115)
39) 36)
Included within the carrying value of contracts are the expected outcomes of outstanding claims which have not yet been finally agreed with the client.
Although this is accepted accounting practice within the construction industry, there is inherent uncertainty as to the eventual outcome, especially when legal proceedings may be required to achieve resolution. Claim recoverability is assessed on a claim-by-claim basis and included in the contract carrying value at the expected recoverable amount. At 30 June 2001, the total outstanding claim amount included was $5 million. At 30 June 2000, the total outstanding claim amount was $16 million.
43
FLETCHER BUILDING FINANCIAL STATEMENTS
Notes to the Financial Statements continued
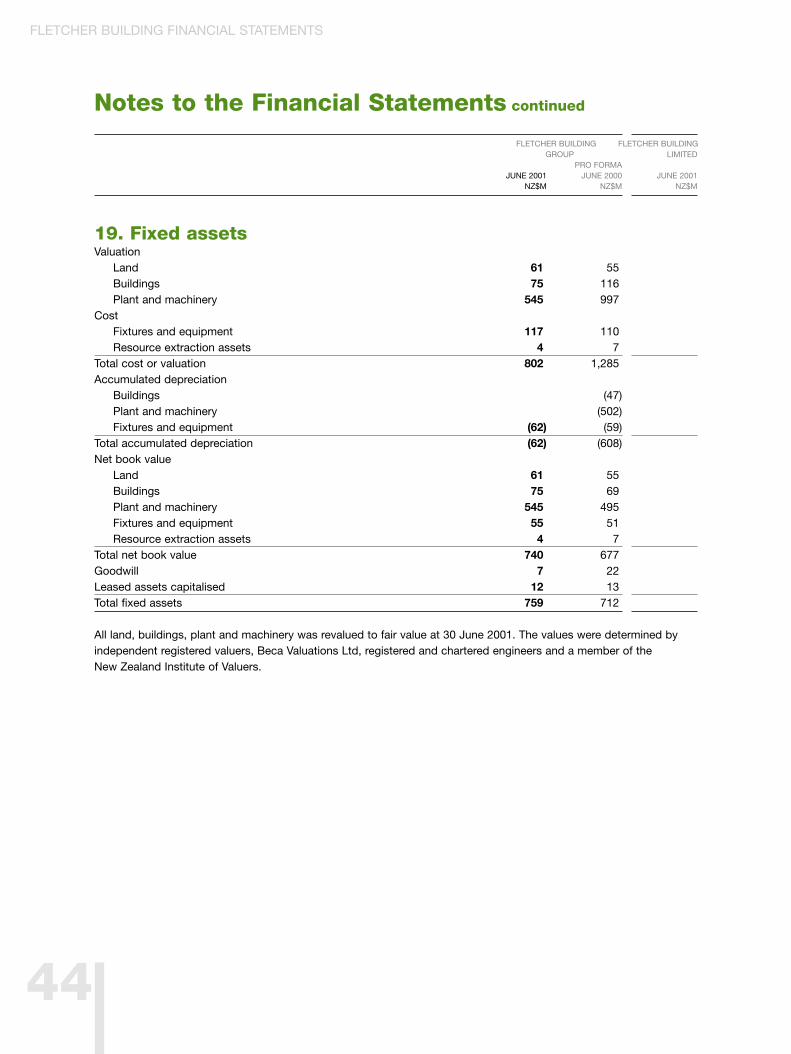
FLETCHER BUILDING FLETCHER BUILDINGGROUP LIMITED
PRO FORMAJUNE 2001 JUNE 2000 JUNE 2001
NZ$M NZ$M NZ$M
19. Fixed assetsValuation
Land 61) 55)Buildings 75) 116)Plant and machinery 545) 997)
CostFixtures and equipment 117) 110)Resource extraction assets 4) 7)
Total cost or valuation 802) 1,285)Accumulated depreciation
Buildings (47)Plant and machinery (502)Fixtures and equipment (62) (59)
Total accumulated depreciation (62) (608)Net book value
Land 61) 55)Buildings 75) 69)Plant and machinery 545) 495)Fixtures and equipment 55) 51)Resource extraction assets 4) 7)
Total net book value 740) 677)Goodwill 7) 22)Leased assets capitalised 12) 13)Total fixed assets 759) 712)
All land, buildings, plant and machinery was revalued to fair value at 30 June 2001. The values were determined by independent registered valuers, Beca Valuations Ltd, registered and chartered engineers and a member of theNew Zealand Institute of Valuers.
44
FLETCHER BUILDING FINANCIAL STATEMENTS
Notes to the Financial Statements continued
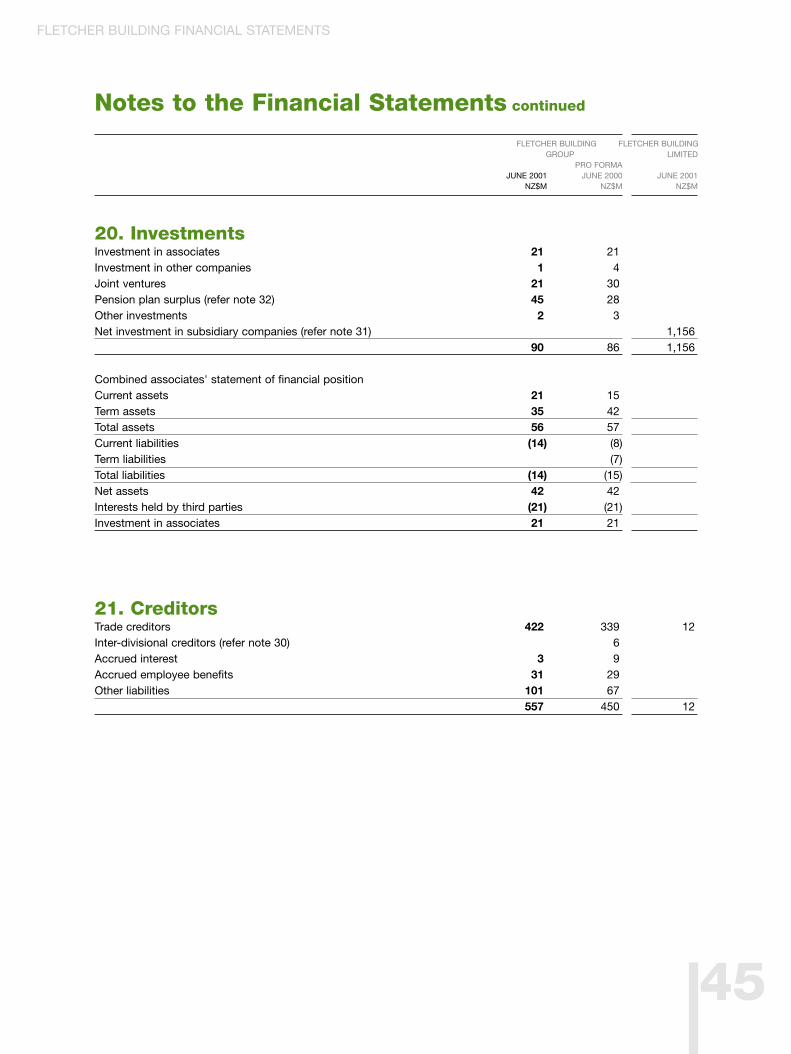
FLETCHER BUILDING FLETCHER BUILDINGGROUP LIMITED
PRO FORMAJUNE 2001 JUNE 2000 JUNE 2001
NZ$M NZ$M NZ$M
20. InvestmentsInvestment in associates 21) 21)Investment in other companies 1) 4)Joint ventures 21) 30)Pension plan surplus (refer note 32) 45) 28)Other investments 2) 3)Net investment in subsidiary companies (refer note 31) 1,156)
90) 86) 1,156)
Combined associates' statement of financial positionCurrent assets 21) 15)Term assets 35) 42)Total assets 56) 57)Current liabilities (14) (8)Term liabilities (7)Total liabilities (14) (15)Net assets 42) 42)Interests held by third parties (21) (21)Investment in associates 21) 21)
21. CreditorsTrade creditors 422) 339) 12)Inter-divisional creditors (refer note 30) 6)Accrued interest 3) 9)Accrued employee benefits 31) 29)Other liabilities 101) 67)
557) 450) 12)
45
FLETCHER BUILDING FINANCIAL STATEMENTS
Notes to the Financial Statements continued
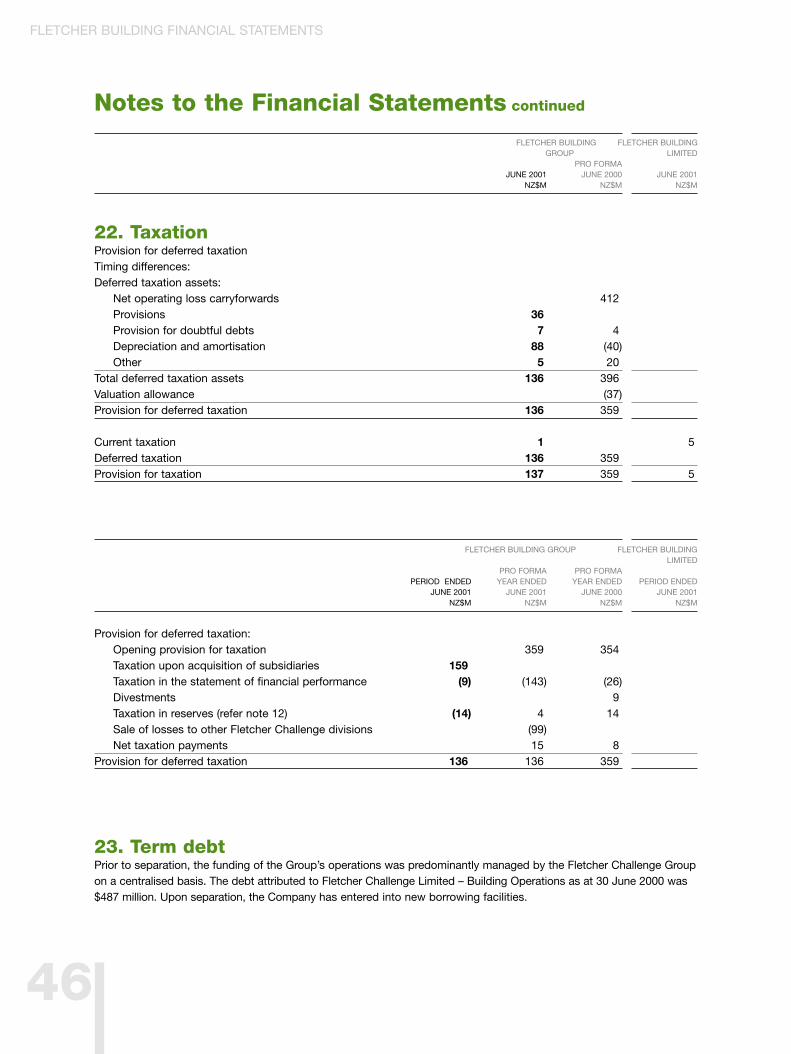
FLETCHER BUILDING FLETCHER BUILDINGGROUP LIMITED
PRO FORMAJUNE 2001 JUNE 2000 JUNE 2001
NZ$M NZ$M NZ$M
22. TaxationProvision for deferred taxationTiming differences:Deferred taxation assets:
Net operating loss carryforwards 412)Provisions 36)Provision for doubtful debts 7) 4)Depreciation and amortisation 88) (40)Other 5) 20)
Total deferred taxation assets 136) 396)Valuation allowance (37)Provision for deferred taxation 136) 359)
Current taxation 1) 5)Deferred taxation 136) 359)Provision for taxation 137) 359) 5)
FLETCHER BUILDING GROUP FLETCHER BUILDINGLIMITED
PRO FORMA PRO FORMAPERIOD ENDED YEAR ENDED YEAR ENDED PERIOD ENDED
JUNE 2001 JUNE 2001 JUNE 2000 JUNE 2001NZ$M NZ$M NZ$M NZ$M
Provision for deferred taxation:Opening provision for taxation 359) 354)Taxation upon acquisition of subsidiaries 159)Taxation in the statement of financial performance (9) (143) (26)Divestments 9)Taxation in reserves (refer note 12) (14) 4) 14)Sale of losses to other Fletcher Challenge divisions (99)Net taxation payments 15) 8)
Provision for deferred taxation 136) 136) 359)
23. Term debtPrior to separation, the funding of the Group’s operations was predominantly managed by the Fletcher Challenge Groupon a centralised basis. The debt attributed to Fletcher Challenge Limited – Building Operations as at 30 June 2000 was $487 million. Upon separation, the Company has entered into new borrowing facilities.
46
FLETCHER BUILDING FINANCIAL STATEMENTS
Notes to the Financial Statements continued
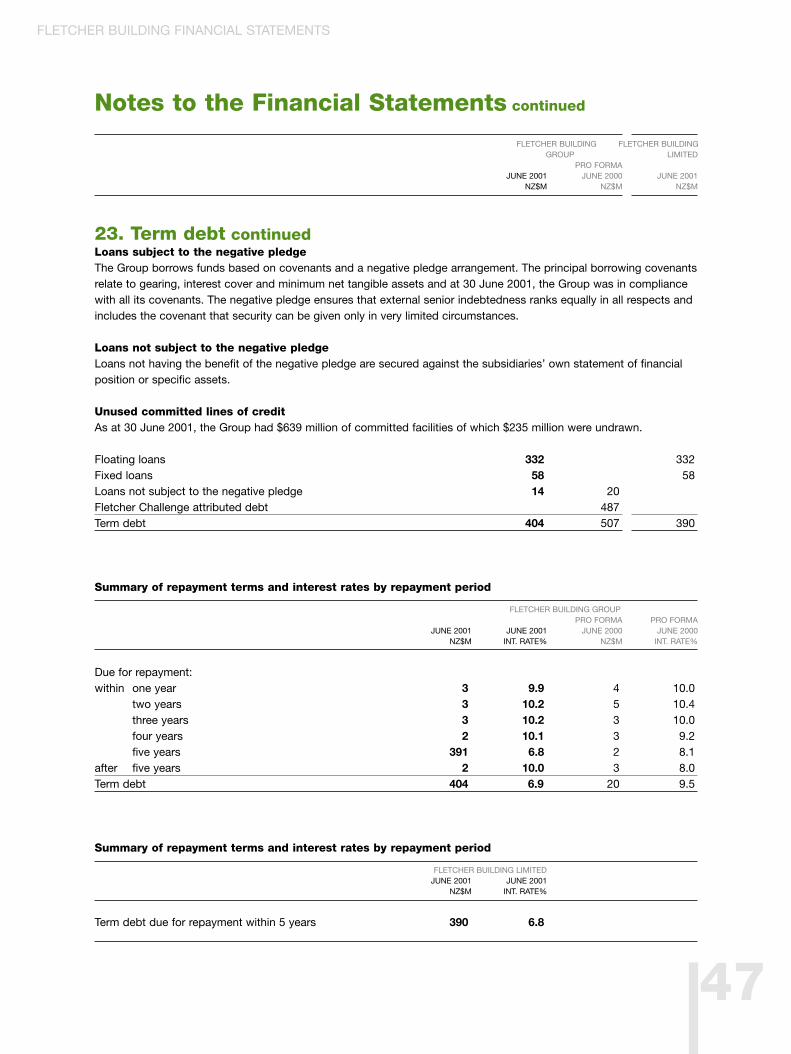
FLETCHER BUILDING FLETCHER BUILDINGGROUP LIMITED
PRO FORMAJUNE 2001 JUNE 2000 JUNE 2001
NZ$M NZ$M NZ$M
23. Term debt continuedLoans subject to the negative pledgeThe Group borrows funds based on covenants and a negative pledge arrangement. The principal borrowing covenants relate to gearing, interest cover and minimum net tangible assets and at 30 June 2001, the Group was in compliance with all its covenants. The negative pledge ensures that external senior indebtedness ranks equally in all respects and includes the covenant that security can be given only in very limited circumstances.
Loans not subject to the negative pledgeLoans not having the benefit of the negative pledge are secured against the subsidiaries’ own statement of financial position or specific assets.
Unused committed lines of creditAs at 30 June 2001, the Group had $639 million of committed facilities of which $235 million were undrawn.
Floating loans 332) 332)Fixed loans 58) 58)Loans not subject to the negative pledge 14) 20)Fletcher Challenge attributed debt 487)Term debt 404) 507) 390)
Summary of repayment terms and interest rates by repayment period
FLETCHER BUILDING GROUPPRO FORMA PRO FORMA
JUNE 2001 JUNE 2001 JUNE 2000 JUNE 2000NZ$M INT. RATE% NZ$M INT. RATE%
Due for repayment: within one year 3) 9.9) 4) 10.0)
two years 3) 10.2) 5) 10.4)three years 3) 10.2) 3) 10.0)four years 2) 10.1) 3) 9.2)five years 391) 6.8) 2) 8.1)
after five years 2) 10.0) 3) 8.0)Term debt 404) 6.9) 20) 9.5)
Summary of repayment terms and interest rates by repayment period
FLETCHER BUILDING LIMITEDJUNE 2001 JUNE 2001
NZ$M INT. RATE%
Term debt due for repayment within 5 years 390) 6.8)
47
FLETCHER BUILDING FINANCIAL STATEMENTS
Notes to the Financial Statements continued
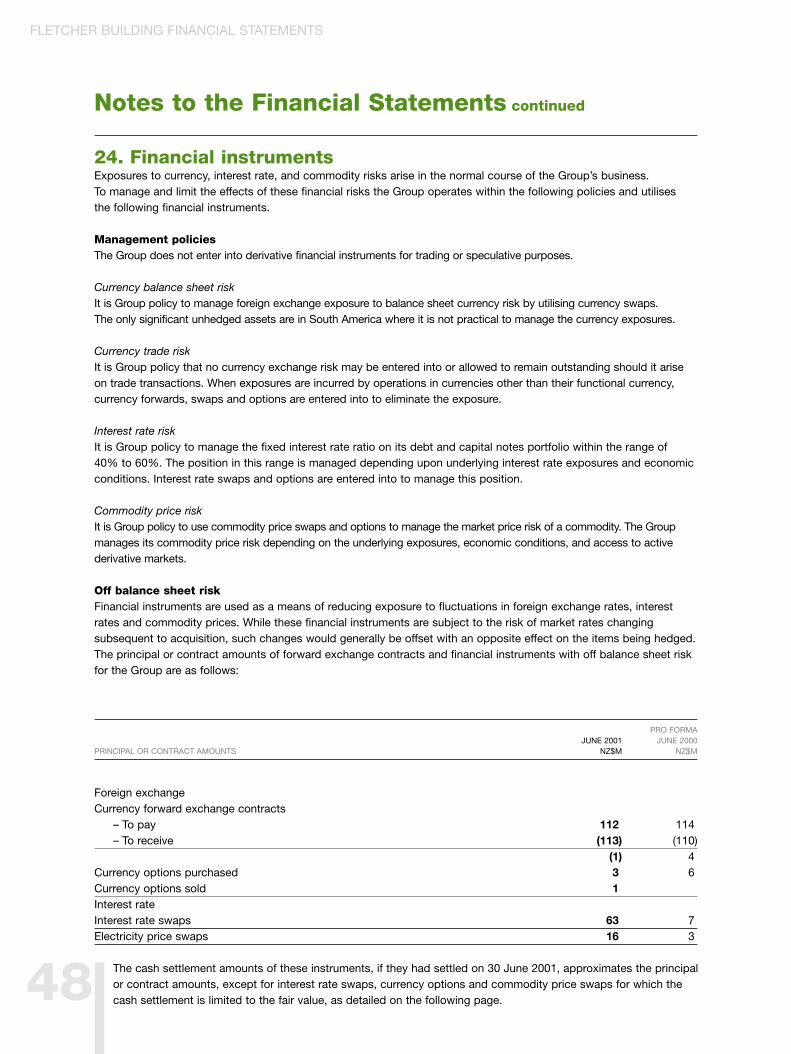
24. Financial instrumentsExposures to currency, interest rate, and commodity risks arise in the normal course of the Group’s business.To manage and limit the effects of these financial risks the Group operates within the following policies and utilises the following financial instruments.
Management policiesThe Group does not enter into derivative financial instruments for trading or speculative purposes.
Currency balance sheet riskIt is Group policy to manage foreign exchange exposure to balance sheet currency risk by utilising currency swaps. The only significant unhedged assets are in South America where it is not practical to manage the currency exposures.
Currency trade riskIt is Group policy that no currency exchange risk may be entered into or allowed to remain outstanding should it arise on trade transactions. When exposures are incurred by operations in currencies other than their functional currency,currency forwards, swaps and options are entered into to eliminate the exposure.
Interest rate riskIt is Group policy to manage the fixed interest rate ratio on its debt and capital notes portfolio within the range of 40% to 60%. The position in this range is managed depending upon underlying interest rate exposures and economicconditions. Interest rate swaps and options are entered into to manage this position.
Commodity price riskIt is Group policy to use commodity price swaps and options to manage the market price risk of a commodity. The Groupmanages its commodity price risk depending on the underlying exposures, economic conditions, and access to activederivative markets.
Off balance sheet riskFinancial instruments are used as a means of reducing exposure to fluctuations in foreign exchange rates, interest rates and commodity prices. While these financial instruments are subject to the risk of market rates changingsubsequent to acquisition, such changes would generally be offset with an opposite effect on the items being hedged.The principal or contract amounts of forward exchange contracts and financial instruments with off balance sheet riskfor the Group are as follows:
PRO FORMAJUNE 2001 JUNE 2000
PRINCIPAL OR CONTRACT AMOUNTS NZ$M NZ$M
Foreign exchangeCurrency forward exchange contracts
– To pay 112) 114)– To receive (113) (110)
(1) 4)Currency options purchased 3) 6)Currency options sold 1)Interest rateInterest rate swaps 63) 7)Electricity price swaps 16) 3)
The cash settlement amounts of these instruments, if they had settled on 30 June 2001, approximates the principal or contract amounts, except for interest rate swaps, currency options and commodity price swaps for which thecash settlement is limited to the fair value, as detailed on the following page.48
FLETCHER BUILDING FINANCIAL STATEMENTS
Notes to the Financial Statements continued
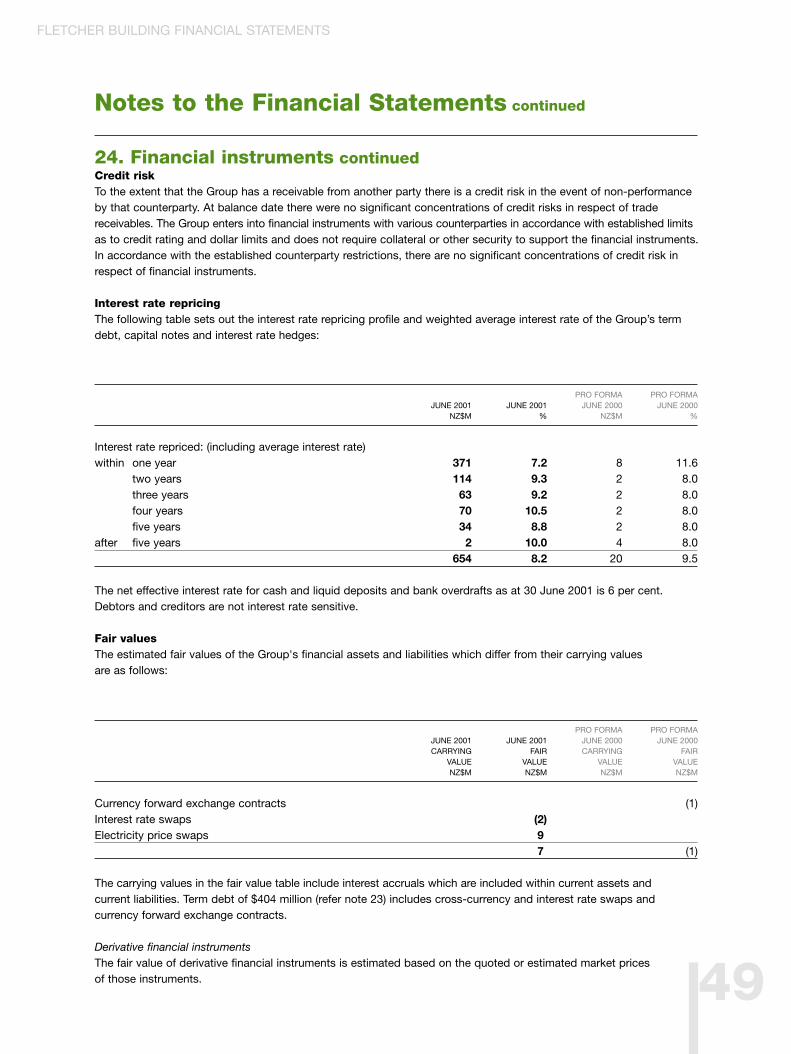
24. Financial instruments continuedCredit riskTo the extent that the Group has a receivable from another party there is a credit risk in the event of non-performance by that counterparty. At balance date there were no significant concentrations of credit risks in respect of trade receivables. The Group enters into financial instruments with various counterparties in accordance with established limitsas to credit rating and dollar limits and does not require collateral or other security to support the financial instruments. In accordance with the established counterparty restrictions, there are no significant concentrations of credit risk in respect of financial instruments.
Interest rate repricingThe following table sets out the interest rate repricing profile and weighted average interest rate of the Group’s term debt, capital notes and interest rate hedges:
PRO FORMA PRO FORMA JUNE 2001 JUNE 2001 JUNE 2000 JUNE 2000
NZ$M % NZ$M %
Interest rate repriced: (including average interest rate)within one year 371 7.2 8 11.6
two years 114 9.3 2 8.0three years 63 9.2 2 8.0four years 70 10.5 2 8.0five years 34 8.8 2 8.0
after five years 2 10.0 4 8.0654 8.2 20 9.5
The net effective interest rate for cash and liquid deposits and bank overdrafts as at 30 June 2001 is 6 per cent. Debtors and creditors are not interest rate sensitive.
Fair valuesThe estimated fair values of the Group's financial assets and liabilities which differ from their carrying values are as follows:
PRO FORMA PRO FORMAJUNE 2001 JUNE 2001 JUNE 2000 JUNE 2000CARRYING FAIR CARRYING FAIR
VALUE VALUE VALUE VALUENZ$M NZ$M NZ$M NZ$M
Currency forward exchange contracts (1)Interest rate swaps (2)Electricity price swaps 9)
7) (1)
The carrying values in the fair value table include interest accruals which are included within current assets and current liabilities. Term debt of $404 million (refer note 23) includes cross-currency and interest rate swaps andcurrency forward exchange contracts.
Derivative financial instrumentsThe fair value of derivative financial instruments is estimated based on the quoted or estimated market prices of those instruments. 49
FLETCHER BUILDING FINANCIAL STATEMENTS
Notes to the Financial Statements continued
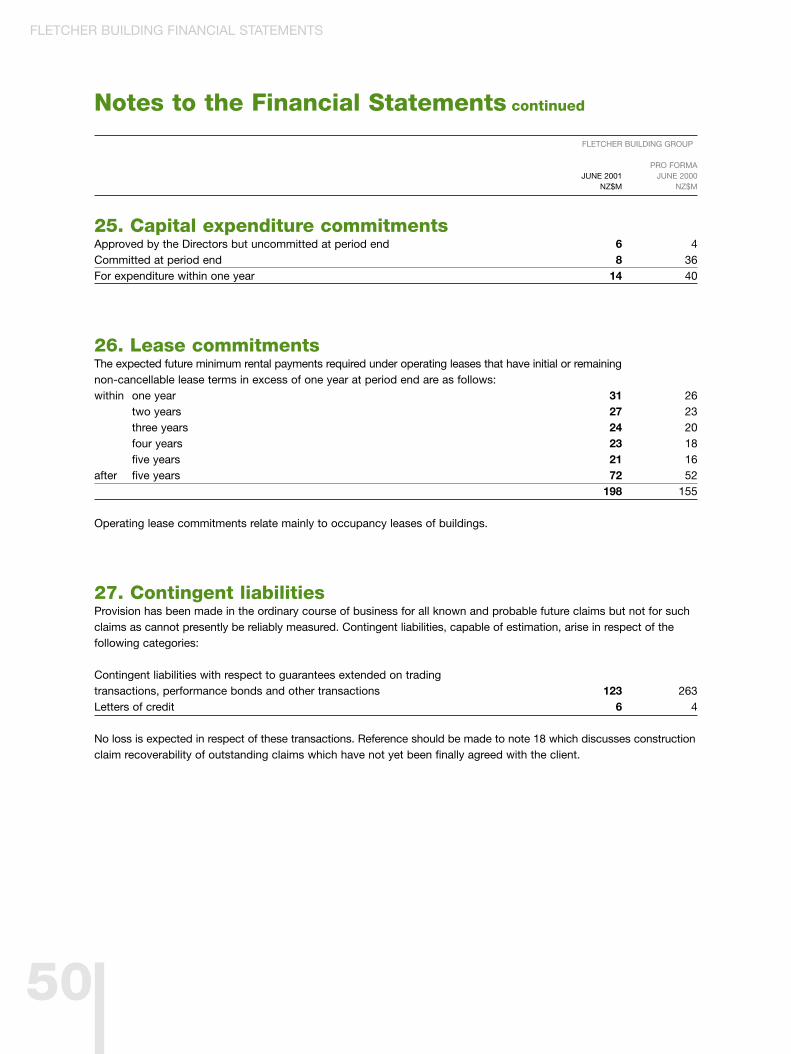
FLETCHER BUILDING GROUP
PRO FORMAJUNE 2001 JUNE 2000
NZ$M NZ$M
25. Capital expenditure commitmentsApproved by the Directors but uncommitted at period end 6 4 Committed at period end 8 36 For expenditure within one year 14 40
26. Lease commitmentsThe expected future minimum rental payments required under operating leases that have initial or remainingnon-cancellable lease terms in excess of one year at period end are as follows:within one year 31 26
two years 27 23 three years 24 20 four years 23 18 five years 21 16
after five years 72 52 198 155
Operating lease commitments relate mainly to occupancy leases of buildings.
27. Contingent liabilitiesProvision has been made in the ordinary course of business for all known and probable future claims but not for such claims as cannot presently be reliably measured. Contingent liabilities, capable of estimation, arise in respect of the following categories:
Contingent liabilities with respect to guarantees extended on tradingtransactions, performance bonds and other transactions 123 263Letters of credit 6 4
No loss is expected in respect of these transactions. Reference should be made to note 18 which discusses constructionclaim recoverability of outstanding claims which have not yet been finally agreed with the client.
50
FLETCHER BUILDING FINANCIAL STATEMENTS
Notes to the Financial Statements continued
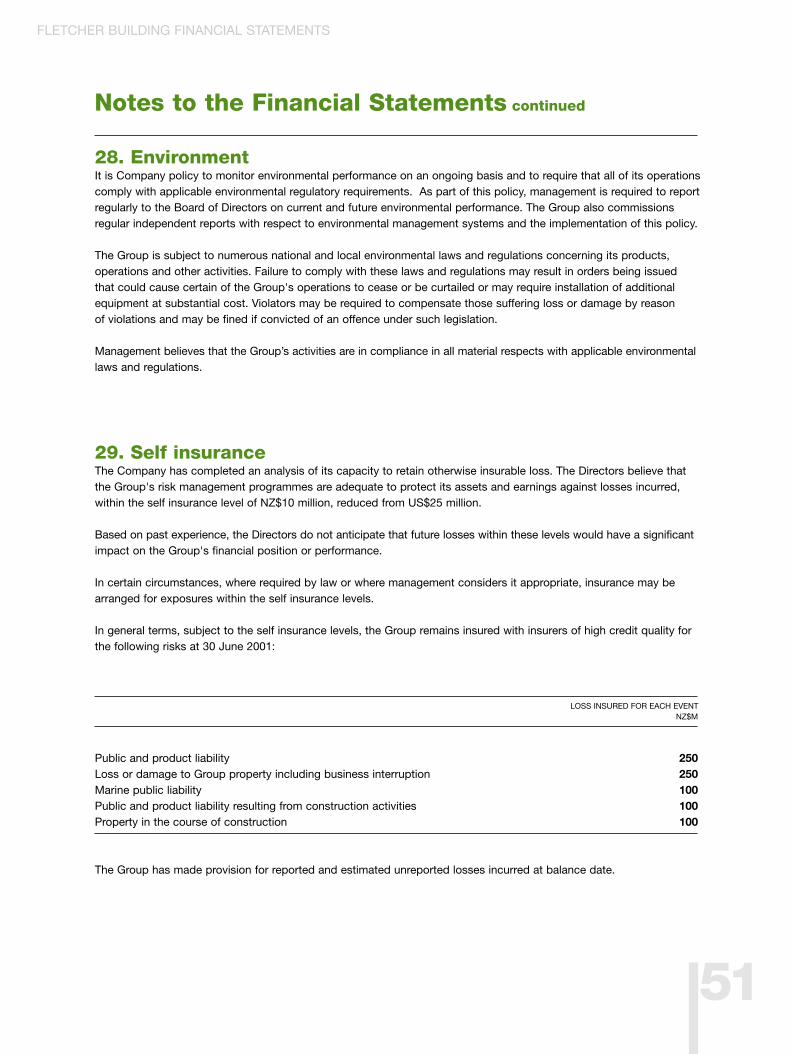
28. EnvironmentIt is Company policy to monitor environmental performance on an ongoing basis and to require that all of its operationscomply with applicable environmental regulatory requirements. As part of this policy, management is required to reportregularly to the Board of Directors on current and future environmental performance. The Group also commissions regular independent reports with respect to environmental management systems and the implementation of this policy.
The Group is subject to numerous national and local environmental laws and regulations concerning its products, operations and other activities. Failure to comply with these laws and regulations may result in orders being issued that could cause certain of the Group's operations to cease or be curtailed or may require installation of additionalequipment at substantial cost. Violators may be required to compensate those suffering loss or damage by reason of violations and may be fined if convicted of an offence under such legislation.
Management believes that the Group’s activities are in compliance in all material respects with applicable environmentallaws and regulations.
29. Self insuranceThe Company has completed an analysis of its capacity to retain otherwise insurable loss. The Directors believe that the Group's risk management programmes are adequate to protect its assets and earnings against losses incurred, within the self insurance level of NZ$10 million, reduced from US$25 million.
Based on past experience, the Directors do not anticipate that future losses within these levels would have a significantimpact on the Group's financial position or performance.
In certain circumstances, where required by law or where management considers it appropriate, insurance may be arranged for exposures within the self insurance levels.
In general terms, subject to the self insurance levels, the Group remains insured with insurers of high credit quality for the following risks at 30 June 2001:
LOSS INSURED FOR EACH EVENTNZ$M
Public and product liability 250Loss or damage to Group property including business interruption 250Marine public liability 100Public and product liability resulting from construction activities 100Property in the course of construction 100
The Group has made provision for reported and estimated unreported losses incurred at balance date.
51
FLETCHER BUILDING FINANCIAL STATEMENTS
Notes to the Financial Statements continued

FLETCHER BUILDING GROUP FLETCHER BUILDINGLIMITED
PRO FORMA PRO FORMAPERIOD ENDED YEAR ENDED YEAR ENDED PERIOD ENDED
JUNE 2001 JUNE 2001 JUNE 2000 JUNE 2001NZ$M NZ$M NZ$M NZ$M
30. Related party transactionsFletcher Building GroupTrading activities with other Fletcher Challenge divisions(1)
Intercompany sales to other Fletcher Challenge divisions 11
Purchase of lumber and wood products from Fletcher Challenge Forests 47 70 Amounts owing relating to the purchase of lumber and wood products from Fletcher Challenge Forests, and included within creditors 6
Trading activities with related partiesPurchase of scrap metal from Sims Pacific Metals Limited 10 41 33
Fletcher Building LimitedInterest income received from subsidiary companies 8Dividend received from subsidiary companies 20Net term receivable owing from subsidiary companies included within net investment in subsidiary companies(2) 171
(1) All trading activities with other Fletcher Challenge divisions were carried out on a commercial and arm’s length basisand relate to the period prior to the separation of the Fletcher Challenge Group.
(2) These advances are for no fixed term but represent long term funding advances, and bear interest at 8%. The principal subsidiaries included within net investment in subsidiary companies are disclosed in note 31, principal operations.
52
FLETCHER BUILDING FINANCIAL STATEMENTS
Notes to the Financial Statements continued
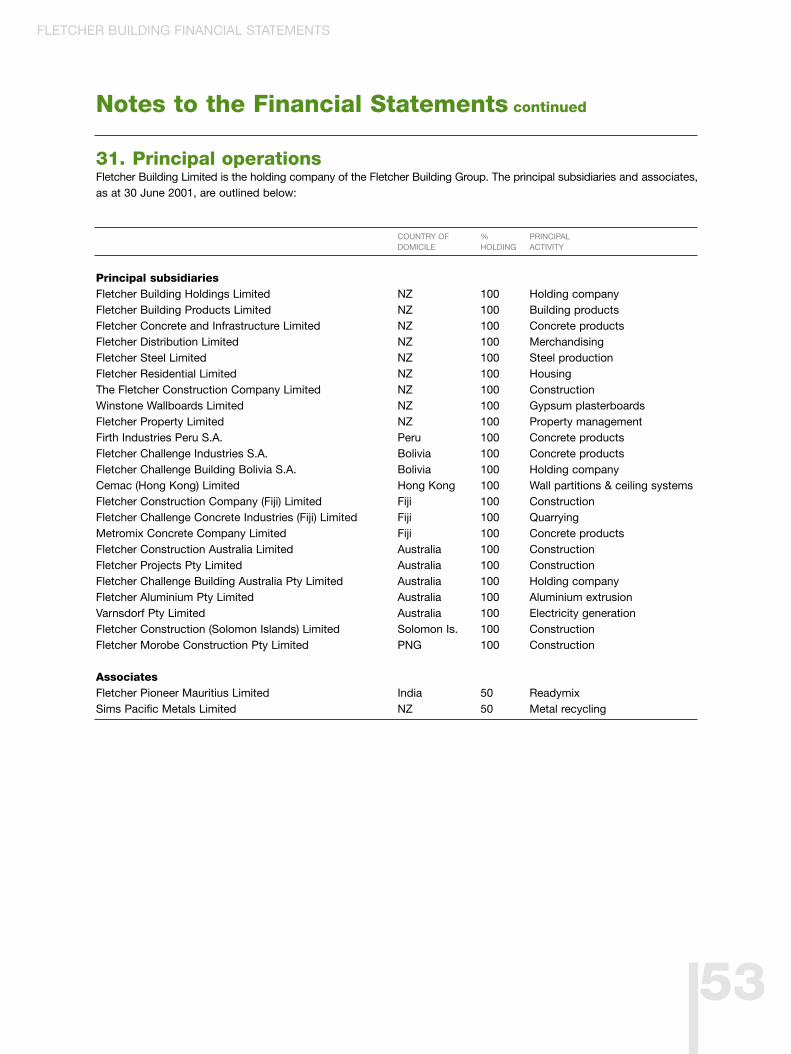
31. Principal operationsFletcher Building Limited is the holding company of the Fletcher Building Group. The principal subsidiaries and associates,as at 30 June 2001, are outlined below:
COUNTRY OF % PRINCIPAL DOMICILE HOLDING ACTIVITY
Principal subsidiariesFletcher Building Holdings Limited NZ 100 Holding companyFletcher Building Products Limited NZ 100 Building productsFletcher Concrete and Infrastructure Limited NZ 100 Concrete productsFletcher Distribution Limited NZ 100 MerchandisingFletcher Steel Limited NZ 100 Steel productionFletcher Residential Limited NZ 100 HousingThe Fletcher Construction Company Limited NZ 100 ConstructionWinstone Wallboards Limited NZ 100 Gypsum plasterboardsFletcher Property Limited NZ 100 Property managementFirth Industries Peru S.A. Peru 100 Concrete productsFletcher Challenge Industries S.A. Bolivia 100 Concrete productsFletcher Challenge Building Bolivia S.A. Bolivia 100 Holding companyCemac (Hong Kong) Limited Hong Kong 100 Wall partitions & ceiling systemsFletcher Construction Company (Fiji) Limited Fiji 100 ConstructionFletcher Challenge Concrete Industries (Fiji) Limited Fiji 100 QuarryingMetromix Concrete Company Limited Fiji 100 Concrete productsFletcher Construction Australia Limited Australia 100 ConstructionFletcher Projects Pty Limited Australia 100 ConstructionFletcher Challenge Building Australia Pty Limited Australia 100 Holding companyFletcher Aluminium Pty Limited Australia 100 Aluminium extrusionVarnsdorf Pty Limited Australia 100 Electricity generationFletcher Construction (Solomon Islands) Limited Solomon Is. 100 ConstructionFletcher Morobe Construction Pty Limited PNG 100 Construction
AssociatesFletcher Pioneer Mauritius Limited India 50 ReadymixSims Pacific Metals Limited NZ 50 Metal recycling
53
FLETCHER BUILDING FINANCIAL STATEMENTS
Notes to the Financial Statements continued
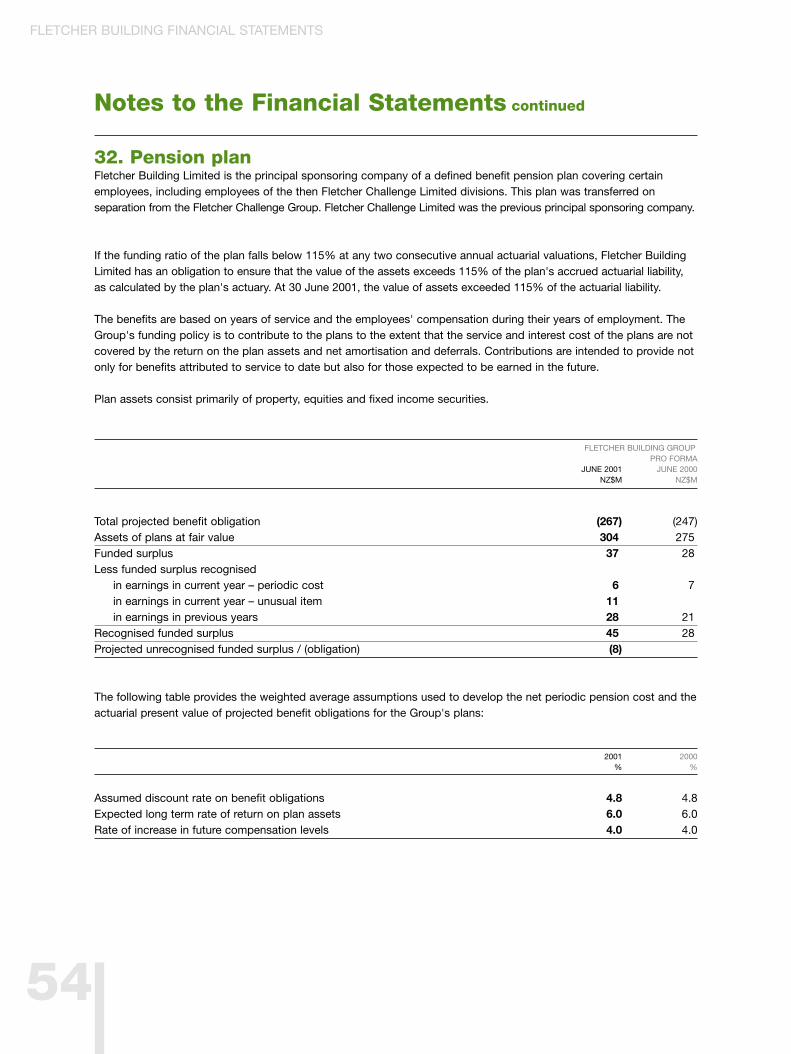
32. Pension planFletcher Building Limited is the principal sponsoring company of a defined benefit pension plan covering certainemployees, including employees of the then Fletcher Challenge Limited divisions. This plan was transferred onseparation from the Fletcher Challenge Group. Fletcher Challenge Limited was the previous principal sponsoring company.
If the funding ratio of the plan falls below 115% at any two consecutive annual actuarial valuations, Fletcher BuildingLimited has an obligation to ensure that the value of the assets exceeds 115% of the plan's accrued actuarial liability, as calculated by the plan's actuary. At 30 June 2001, the value of assets exceeded 115% of the actuarial liability.
The benefits are based on years of service and the employees' compensation during their years of employment. TheGroup's funding policy is to contribute to the plans to the extent that the service and interest cost of the plans are notcovered by the return on the plan assets and net amortisation and deferrals. Contributions are intended to provide notonly for benefits attributed to service to date but also for those expected to be earned in the future.
Plan assets consist primarily of property, equities and fixed income securities.
FLETCHER BUILDING GROUPPRO FORMA
JUNE 2001 JUNE 2000 NZ$M NZ$M
Total projected benefit obligation (267) (247)Assets of plans at fair value 304) 275)Funded surplus 37) 28)Less funded surplus recognised
in earnings in current year – periodic cost 6) 7)in earnings in current year – unusual item 11)in earnings in previous years 28) 21)
Recognised funded surplus 45) 28)Projected unrecognised funded surplus / (obligation) (8)
The following table provides the weighted average assumptions used to develop the net periodic pension cost and theactuarial present value of projected benefit obligations for the Group's plans:
2001 2000% %
Assumed discount rate on benefit obligations 4.8 4.8Expected long term rate of return on plan assets 6.0 6.0Rate of increase in future compensation levels 4.0 4.0
54
FLETCHER BUILDING FINANCIAL STATEMENTS
Notes to the Financial Statements continued
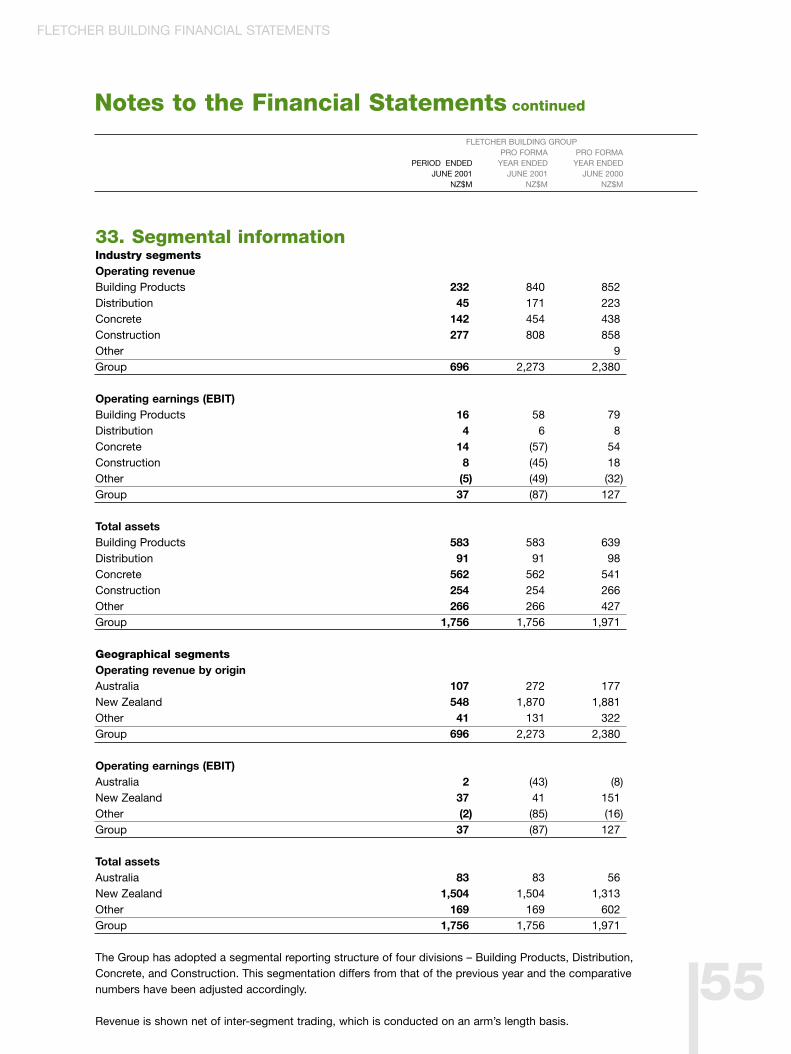
FLETCHER BUILDING GROUPPRO FORMA PRO FORMA
PERIOD ENDED YEAR ENDED YEAR ENDEDJUNE 2001 JUNE 2001 JUNE 2000
NZ$M NZ$M NZ$M
33. Segmental informationIndustry segmentsOperating revenueBuilding Products 232) 840) 852)Distribution 45) 171) 223)Concrete 142) 454) 438)Construction 277) 808) 858)Other 9)Group 696) 2,273) 2,380)
Operating earnings (EBIT)Building Products 16) 58) 79)Distribution 4) 6) 8)Concrete 14) (57) 54)Construction 8) (45) 18)Other (5) (49) (32)Group 37) (87) 127)
Total assetsBuilding Products 583) 583) 639)Distribution 91) 91) 98)Concrete 562) 562) 541)Construction 254) 254) 266)Other 266) 266) 427)Group 1,756) 1,756) 1,971)
Geographical segmentsOperating revenue by originAustralia 107) 272) 177)New Zealand 548) 1,870) 1,881)Other 41) 131) 322)Group 696) 2,273) 2,380)
Operating earnings (EBIT)Australia 2) (43) (8)New Zealand 37) 41) 151)Other (2) (85) (16)Group 37) (87) 127)
Total assetsAustralia 83) 83) 56)New Zealand 1,504) 1,504) 1,313)Other 169) 169) 602)Group 1,756) 1,756) 1,971)OperThe Group has adopted a segmental reporting structure of four divisions – Building Products, Distribution,Concrete, and Construction. This segmentation differs from that of the previous year and the comparativenumbers have been adjusted accordingly.
Revenue is shown net of inter-segment trading, which is conducted on an arm’s length basis.
55
FLETCHER BUILDING FINANCIAL STATEMENTS
Notes to the Financial Statements continued
56
To the shareholders of Fletcher Building LimitedWe have audited the statutory financialstatements and pro forma financialstatements on pages 25 to 55.
On 23 March 2001, under a courtapproved arrangement. Fletcher BuildingLimited acquired the operations, assetsand liabilities attributed to FletcherChallenge Limited – Building Operations,a division of Fletcher Challenge Limited.Although Fletcher Building Limited wasincorporated on 19 December 2000, theCompany and Group commenced tradingon 24 March 2001.
The statutory financial statementsprovide information about the pastfinancial performance and financialposition of Fletcher Building Limited(the Company) and its subsidiaries(together the Group) as at 30 June2001. This information is stated inaccordance with the accounting policies set out on pages 31 to 34.
The pro forma financial statements havebeen prepared by the Directors, forillustrative purposes only, to provideinformation to the readers of the financialstatements about the financial perfor-mance of Fletcher Challenge Limited – Building Operations for the nine monthperiod ended 23 March 2001, combinedwith the financial performance of theGroup for the three month period ended30 June 2001, together the pro formacombined financial performance for theyear ended 30 June 2001.
Directors’ responsibilitiesThe Directors are responsible for thepreparation of statutory financialstatements which give a true and fair viewof the financial position of the Companyand Group as at 30 June 2001 and theresults of their operations and cashflows for the period ended on that date.
The Directors are also responsible for thepreparation of the pro forma financialstatements which give a true and fairview of the pro forma combined financialperformance of Fletcher ChallengeLimited – Building Operations and thegroup for the year ended 30 June 2001.
Auditors’ responsibilitiesIt is our responsibility to express anindependent opinion on the statutoryfinancial statements presented by theDirectors and report our opinion to you.
The Directors have also asked us toexpress an independent opinion on the pro forma combined financialperformance of Fletcher ChallengeLimited – Building Operations and theGroup for the year ended 30 June 2001and report our opinion to you.
Basis of opinionAn audit includes examining, on a testbasis, evidence relevant to the amountsand disclosures in the financialstatements. It also includes assessing:
• the significant estimates andjudgements made by the Directorsin the preparation of the statutoryfinancial statements and the proforma financial statements;
• whether the accounting policies areappropriate to the Company’s andGroup’s circumstances, consistentlyapplied and adequately disclosed.
We conducted our audit in accordancewith New Zealand Auditing Standardsissued by the Institute of CharteredAccountants of New Zealand. Weplanned and performed our audit so as to obtain all the information andexplanations which we considerednecessary in order to provide us withsufficient evidence to obtain reasonableassurance that the statutory financialstatements and the pro forma financial
statements are free from materialmisstatements, whether caused byfraud or error. In forming our opinion wealso evaluated the overall adequacy ofthe presentation of information in thestatutory financial statements and thepro forma financial statements.
Our firm carries out other assignmentsfor the Company and certain of itssubsidiaries in the area of taxationadvice and special consultancyprojects. Partners and employees of ourfirm may also deal with the Companyand Group on normal terms within theordinary course of trading activities ofthe business of the Company andGroup. The firm has no other interest inthe Company or any of its subsidiaries.
In forming our unqualified opinion inrelation to the year ended 30 June 2001we have considered the inclusion of thepro forma Fletcher Challenge Limited –Building Operations financial statementsfor the year ended 30 June 2000.The pro forma Fletcher ChallengeLimited – Building Operations financialstatements have been extracted fromthe audited financial statements ofFletcher Challenge Limited – BuildingOperations for the year ended 30 June 2000. For the year ended 30June 2000 and for the period up to 23March 2001 Fletcher Challenge Limited– Building Operations was a division of Fletcher Challenge Limited. As thefinancial statements of FletcherChallenge Limited – Building Operationsfor the year ended 30 June 2000 arederived from the financial statements ofFletcher Challenge Limited, they shouldat all times be read in conjunction withthe financial statements of FletcherChallenge Limited for the year ended 30 June 2000 and in particular with thebasis of attributing assets, liabilities,income and expenses to the thendivisions of Fletcher Challenge Limitedas set out in the statement of adoptedpolicies in the financial statements ofFletcher Challenge Limited for the yearended 30 June 2000.
Audit report

Directors’ holdings – equity securities
30 JUNE 2001 BENEFICIAL ASSOCIATED OPTIONS CAPITAL
PERSONS NOTES
P E A Baines 12,115
R S Deane 1,295 50,000
H A Fletcher 150,186 383,283
R J Norris
D T Spring 3,550
K M Vautier 34,961 11,523 9,000
R G Waters 1,000,000
202,107 444,806 1,000,000 9,000
Subsequent to the Company’s results announcement on 22 August 2001, further shares in the
Company have been acquired by Directors; namely:
DIRECTOR NUMBER OFSHARES ACQUIRED
P E A Baines 10,000
R J Norris 20,000
D T Spring 17,000
R G Waters 78,398
Share dealings by Directors
During the year, Directors acquired or disposed of shares as follows:
DIRECTOR NUMBER OF NUMBER OF CONSIDERATION DATE SHARES ACQUIRED SHARES DISPOSED PAID/RECEIVED
M J Andrews 60 (1) 23/03/01
P E A Baines 12,115 (1) 23/03/01
R S Deane 1,295 (1) 23/03/01
H A Fletcher 150,186 (1) 23/03/01
R J Norris
D T Spring 7,100 (1) 23/03/01
D T Spring 3,550 $8,165 30/03/01
K M Vautier 34,961 (1) 23/03/01
205,717 3,550 $8,165
(1) Acquired in exchange for each Fletcher Challenge Building share pursuant to the
Court-approved separation of Fletcher Challenge Limited.
57
Unqualified opinionWe have obtained all the informationand explanations we have required.
In our opinion:
• proper accounting records havebeen kept by the Company as faras appears from our examinationof those records;
• the statutory financial statements on pages 25 to 55:– comply with New Zealand
generally accepted accountingpractice;
– give a true and fair view of thefinancial position of the Companyand Group as at 30 June 2001 and the results of their operationsand cash flows for the periodended on that date;
• the pro forma financial statementson pages 25 to 55 give a true andfair view of the combined financialperformance of Fletcher ChallengeLimited – Building Operations andthe Group for the year ended 30June 2001.
Our audit was completed on 22August 2001 and our unqualifiedopinion is expressed as at that date.
KPMG Auckland, New Zealand
Statutory disclosure
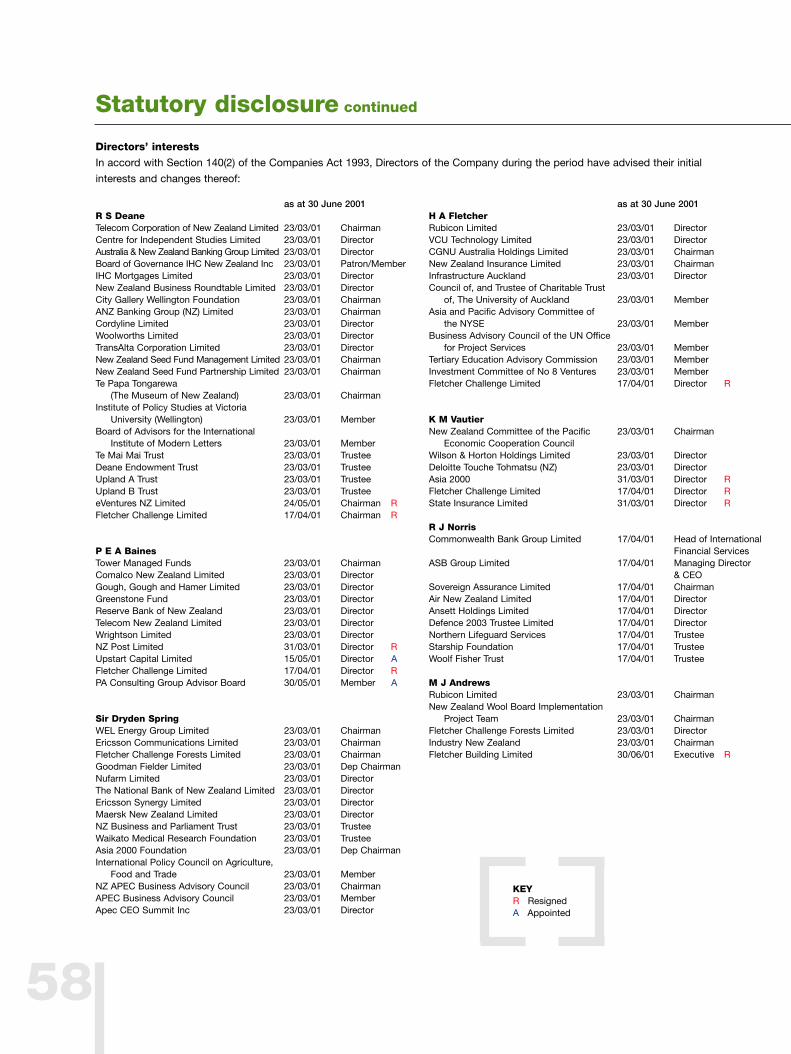
58
as at 30 June 2001R S Deane Telecom Corporation of New Zealand Limited 23/03/01 Chairman Centre for Independent Studies Limited 23/03/01 Director Australia & New Zealand Banking Group Limited 23/03/01 Director Board of Governance IHC New Zealand Inc 23/03/01 Patron/Member IHC Mortgages Limited 23/03/01 Director New Zealand Business Roundtable Limited 23/03/01 Director City Gallery Wellington Foundation 23/03/01 Chairman ANZ Banking Group (NZ) Limited 23/03/01 Chairman Cordyline Limited 23/03/01 Director Woolworths Limited 23/03/01 Director TransAlta Corporation Limited 23/03/01 Director New Zealand Seed Fund Management Limited 23/03/01 Chairman New Zealand Seed Fund Partnership Limited 23/03/01 Chairman Te Papa Tongarewa
(The Museum of New Zealand) 23/03/01 Chairman Institute of Policy Studies at Victoria
University (Wellington) 23/03/01 Member Board of Advisors for the International
Institute of Modern Letters 23/03/01 Member Te Mai Mai Trust 23/03/01 Trustee Deane Endowment Trust 23/03/01 Trustee Upland A Trust 23/03/01 Trustee Upland B Trust 23/03/01 Trustee eVentures NZ Limited 24/05/01 Chairman RFletcher Challenge Limited 17/04/01 Chairman R
P E A BainesTower Managed Funds 23/03/01 Chairman Comalco New Zealand Limited 23/03/01 Director Gough, Gough and Hamer Limited 23/03/01 Director Greenstone Fund 23/03/01 Director Reserve Bank of New Zealand 23/03/01 Director Telecom New Zealand Limited 23/03/01 Director Wrightson Limited 23/03/01 Director NZ Post Limited 31/03/01 Director RUpstart Capital Limited 15/05/01 Director AFletcher Challenge Limited 17/04/01 Director R PA Consulting Group Advisor Board 30/05/01 Member A
Sir Dryden SpringWEL Energy Group Limited 23/03/01 Chairman Ericsson Communications Limited 23/03/01 Chairman Fletcher Challenge Forests Limited 23/03/01 Chairman Goodman Fielder Limited 23/03/01 Dep Chairman Nufarm Limited 23/03/01 Director The National Bank of New Zealand Limited 23/03/01 Director Ericsson Synergy Limited 23/03/01 Director Maersk New Zealand Limited 23/03/01 Director NZ Business and Parliament Trust 23/03/01 Trustee Waikato Medical Research Foundation 23/03/01 Trustee Asia 2000 Foundation 23/03/01 Dep Chairman International Policy Council on Agriculture,
Food and Trade 23/03/01 Member NZ APEC Business Advisory Council 23/03/01 ChairmanAPEC Business Advisory Council 23/03/01 Member Apec CEO Summit Inc 23/03/01 Director
as at 30 June 2001H A Fletcher Rubicon Limited 23/03/01 Director VCU Technology Limited 23/03/01 Director CGNU Australia Holdings Limited 23/03/01 Chairman New Zealand Insurance Limited 23/03/01 Chairman Infrastructure Auckland 23/03/01 Director Council of, and Trustee of Charitable Trust
of, The University of Auckland 23/03/01 Member Asia and Pacific Advisory Committee of
the NYSE 23/03/01 Member Business Advisory Council of the UN Office
for Project Services 23/03/01 Member Tertiary Education Advisory Commission 23/03/01 Member Investment Committee of No 8 Ventures 23/03/01 Member Fletcher Challenge Limited 17/04/01 Director R
K M Vautier New Zealand Committee of the Pacific 23/03/01 Chairman
Economic Cooperation Council Wilson & Horton Holdings Limited 23/03/01 Director Deloitte Touche Tohmatsu (NZ) 23/03/01 Director Asia 2000 31/03/01 Director RFletcher Challenge Limited 17/04/01 Director RState Insurance Limited 31/03/01 Director R
R J NorrisCommonwealth Bank Group Limited 17/04/01 Head of International
Financial Services ASB Group Limited 17/04/01 Managing Director
& CEOSovereign Assurance Limited 17/04/01 Chairman Air New Zealand Limited 17/04/01 Director Ansett Holdings Limited 17/04/01 Director Defence 2003 Trustee Limited 17/04/01 Director Northern Lifeguard Services 17/04/01 Trustee Starship Foundation 17/04/01 Trustee Woolf Fisher Trust 17/04/01 Trustee
M J AndrewsRubicon Limited 23/03/01 Chairman New Zealand Wool Board Implementation
Project Team 23/03/01 Chairman Fletcher Challenge Forests Limited 23/03/01 Director Industry New Zealand 23/03/01 Chairman Fletcher Building Limited 30/06/01 Executive R
Directors’ interests
In accord with Section 140(2) of the Companies Act 1993, Directors of the Company during the period have advised their initial
interests and changes thereof:
Statutory disclosure continued
KEYR ResignedA Appointed
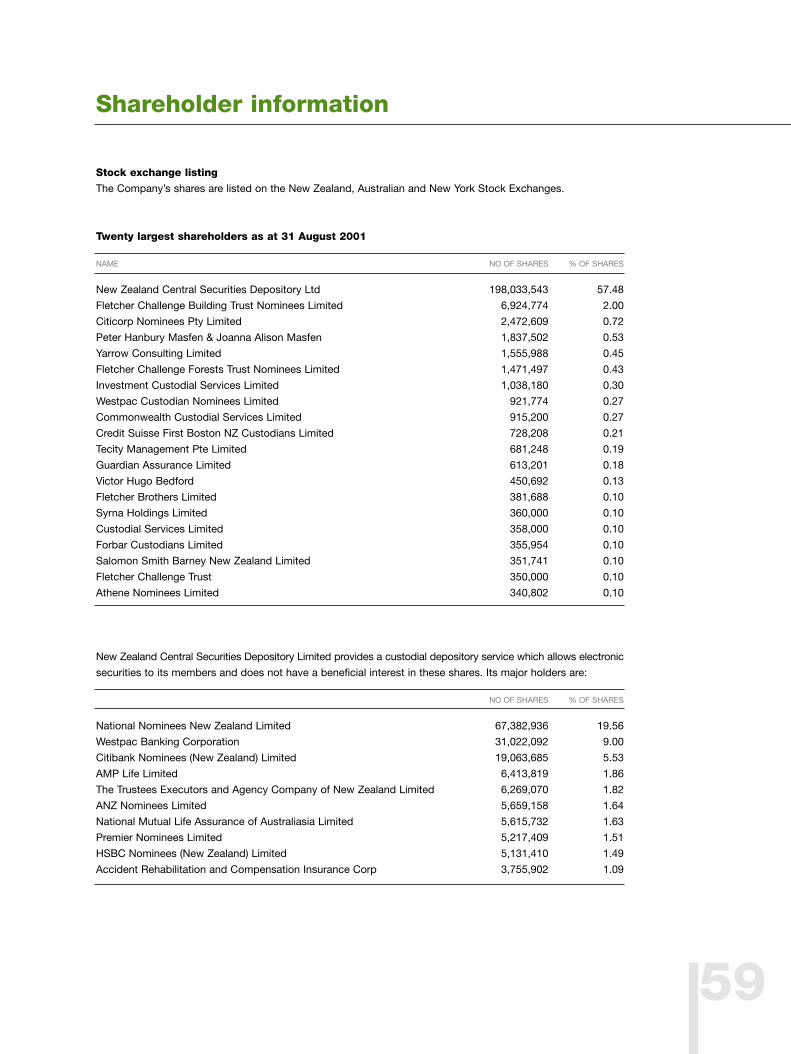
59
Stock exchange listing
The Company’s shares are listed on the New Zealand, Australian and New York Stock Exchanges.
Twenty largest shareholders as at 31 August 2001
NAME NO OF SHARES % OF SHARES
New Zealand Central Securities Depository Ltd 198,033,543 57.48
Fletcher Challenge Building Trust Nominees Limited 6,924,774 2.00
Citicorp Nominees Pty Limited 2,472,609 0.72
Peter Hanbury Masfen & Joanna Alison Masfen 1,837,502 0.53
Yarrow Consulting Limited 1,555,988 0.45
Fletcher Challenge Forests Trust Nominees Limited 1,471,497 0.43
Investment Custodial Services Limited 1,038,180 0.30
Westpac Custodian Nominees Limited 921,774 0.27
Commonwealth Custodial Services Limited 915,200 0.27
Credit Suisse First Boston NZ Custodians Limited 728,208 0.21
Tecity Management Pte Limited 681,248 0.19
Guardian Assurance Limited 613,201 0.18
Victor Hugo Bedford 450,692 0.13
Fletcher Brothers Limited 381,688 0.10
Syrna Holdings Limited 360,000 0.10
Custodial Services Limited 358,000 0.10
Forbar Custodians Limited 355,954 0.10
Salomon Smith Barney New Zealand Limited 351,741 0.10
Fletcher Challenge Trust 350,000 0.10
Athene Nominees Limited 340,802 0.10
New Zealand Central Securities Depository Limited provides a custodial depository service which allows electronic
securities to its members and does not have a beneficial interest in these shares. Its major holders are:
NO OF SHARES % OF SHARES
National Nominees New Zealand Limited 67,382,936 19.56
Westpac Banking Corporation 31,022,092 9.00
Citibank Nominees (New Zealand) Limited 19,063,685 5.53
AMP Life Limited 6,413,819 1.86
The Trustees Executors and Agency Company of New Zealand Limited 6,269,070 1.82
ANZ Nominees Limited 5,659,158 1.64
National Mutual Life Assurance of Australiasia Limited 5,615,732 1.63
Premier Nominees Limited 5,217,409 1.51
HSBC Nominees (New Zealand) Limited 5,131,410 1.49
Accident Rehabilitation and Compensation Insurance Corp 3,755,902 1.09
Shareholder information
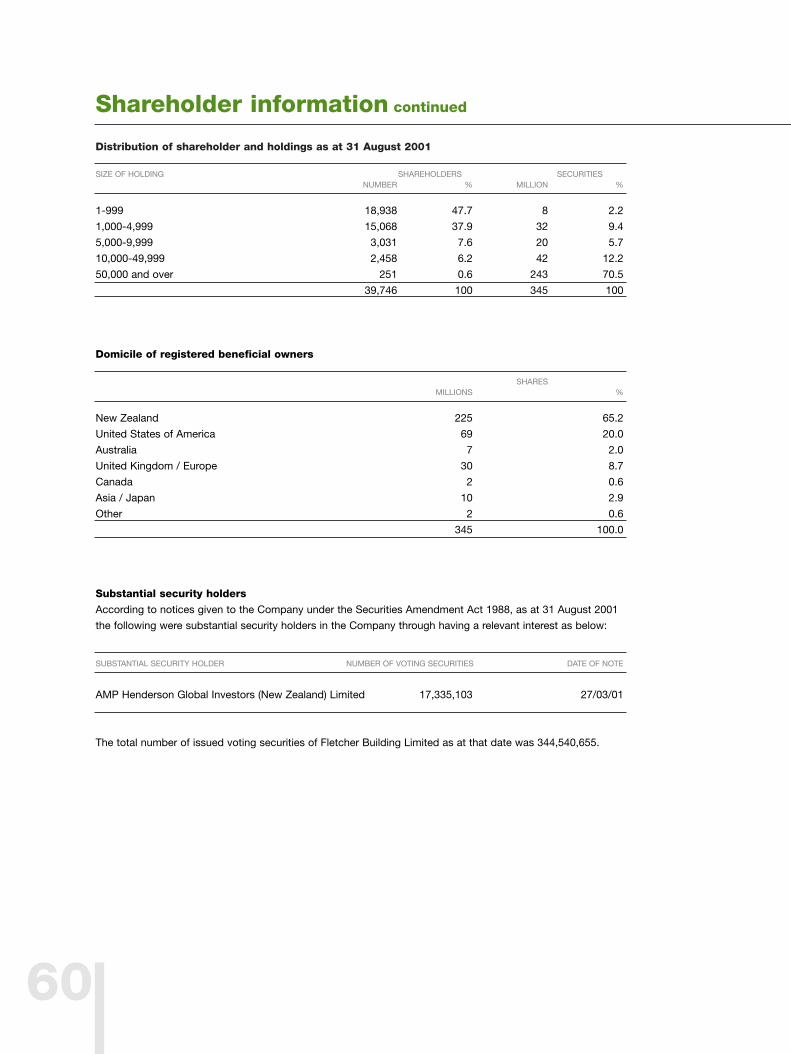
Distribution of shareholder and holdings as at 31 August 2001
SIZE OF HOLDING SHAREHOLDERS SECURITIES NUMBER % MILLION %
1-999 18,938 47.7 8 2.2
1,000-4,999 15,068 37.9 32 9.4
5,000-9,999 3,031 7.6 20 5.7
10,000-49,999 2,458 6.2 42 12.2
50,000 and over 251 0.6 243 70.5
39,746 100 345 100
Domicile of registered beneficial owners
SHARES MILLIONS %
New Zealand 225 65.2
United States of America 69 20.0
Australia 7 2.0
United Kingdom / Europe 30 8.7
Canada 2 0.6
Asia / Japan 10 2.9
Other 2 0.6
345 100.0
Substantial security holders
According to notices given to the Company under the Securities Amendment Act 1988, as at 31 August 2001
the following were substantial security holders in the Company through having a relevant interest as below:
SUBSTANTIAL SECURITY HOLDER NUMBER OF VOTING SECURITIES DATE OF NOTE
AMP Henderson Global Investors (New Zealand) Limited 17,335,103 27/03/01
The total number of issued voting securities of Fletcher Building Limited as at that date was 344,540,655.
60
Shareholder information continued
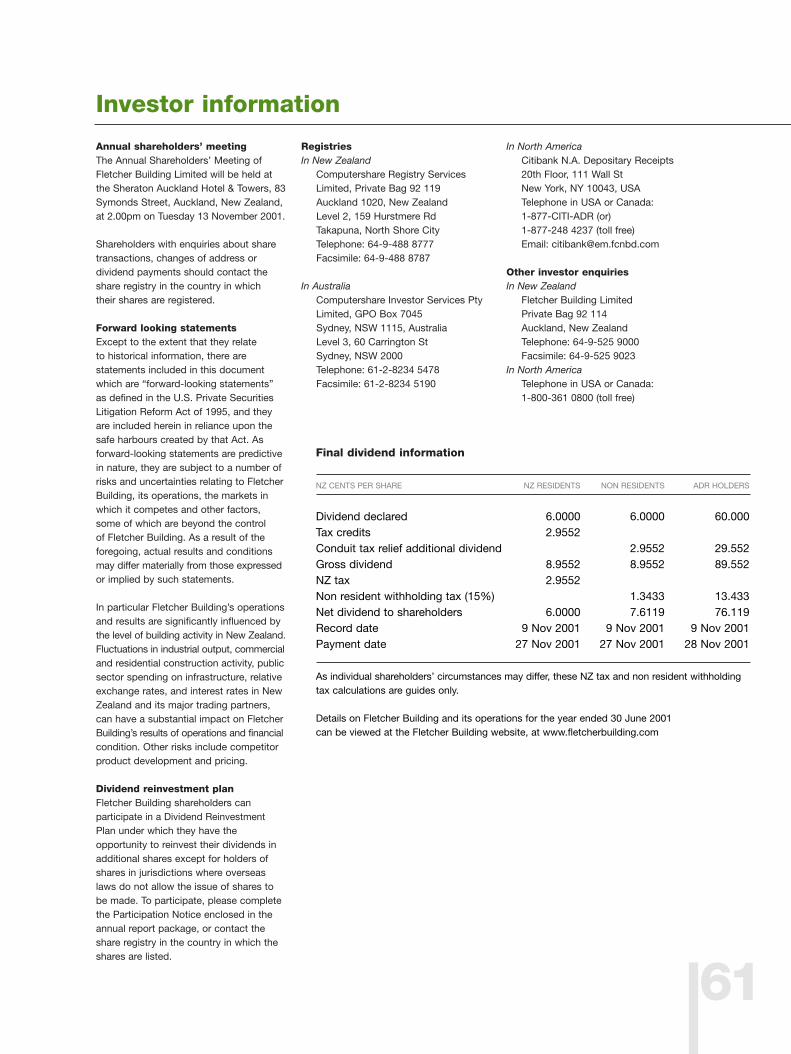
Annual shareholders’ meetingThe Annual Shareholders’ Meeting ofFletcher Building Limited will be held atthe Sheraton Auckland Hotel & Towers, 83Symonds Street, Auckland, New Zealand,at 2.00pm on Tuesday 13 November 2001.
Shareholders with enquiries about sharetransactions, changes of address ordividend payments should contact theshare registry in the country in which their shares are registered.
Forward looking statementsExcept to the extent that they relate to historical information, there arestatements included in this documentwhich are “forward-looking statements”as defined in the U.S. Private SecuritiesLitigation Reform Act of 1995, and theyare included herein in reliance upon thesafe harbours created by that Act. Asforward-looking statements are predictivein nature, they are subject to a number ofrisks and uncertainties relating to FletcherBuilding, its operations, the markets inwhich it competes and other factors,some of which are beyond the control of Fletcher Building. As a result of theforegoing, actual results and conditionsmay differ materially from those expressedor implied by such statements.
In particular Fletcher Building’s operationsand results are significantly influenced bythe level of building activity in New Zealand.Fluctuations in industrial output, commercialand residential construction activity, publicsector spending on infrastructure, relativeexchange rates, and interest rates in NewZealand and its major trading partners,can have a substantial impact on FletcherBuilding’s results of operations and financialcondition. Other risks include competitorproduct development and pricing.
Dividend reinvestment planFletcher Building shareholders canparticipate in a Dividend ReinvestmentPlan under which they have theopportunity to reinvest their dividends inadditional shares except for holders ofshares in jurisdictions where overseaslaws do not allow the issue of shares tobe made. To participate, please completethe Participation Notice enclosed in theannual report package, or contact theshare registry in the country in which theshares are listed.
RegistriesIn New Zealand
Computershare Registry ServicesLimited, Private Bag 92 119Auckland 1020, New ZealandLevel 2, 159 Hurstmere RdTakapuna, North Shore CityTelephone: 64-9-488 8777Facsimile: 64-9-488 8787
In AustraliaComputershare Investor Services PtyLimited, GPO Box 7045Sydney, NSW 1115, AustraliaLevel 3, 60 Carrington StSydney, NSW 2000Telephone: 61-2-8234 5478Facsimile: 61-2-8234 5190
In North AmericaCitibank N.A. Depositary Receipts20th Floor, 111 Wall StNew York, NY 10043, USATelephone in USA or Canada:1-877-CITI-ADR (or)1-877-248 4237 (toll free)Email: [email protected]
Other investor enquiriesIn New Zealand
Fletcher Building LimitedPrivate Bag 92 114Auckland, New ZealandTelephone: 64-9-525 9000Facsimile: 64-9-525 9023
In North AmericaTelephone in USA or Canada:1-800-361 0800 (toll free)
Final dividend information
NZ CENTS PER SHARE NZ RESIDENTS NON RESIDENTS ADR HOLDERS
Dividend declared 6.0000 6.0000 60.000Tax credits 2.9552Conduit tax relief additional dividend 2.9552 29.552Gross dividend 8.9552 8.9552 89.552NZ tax 2.9552Non resident withholding tax (15%) 1.3433 13.433Net dividend to shareholders 6.0000 7.6119 76.119Record date 9 Nov 2001 9 Nov 2001 9 Nov 2001Payment date 27 Nov 2001 27 Nov 2001 28 Nov 2001
As individual shareholders’ circumstances may differ, these NZ tax and non resident withholdingtax calculations are guides only.
Details on Fletcher Building and its operations for the year ended 30 June 2001 can be viewed at the Fletcher Building website, at www.fletcherbuilding.com
61
Investor information