Embed Size (px)
Citation preview
Analysis of on-farm irrigation performance inMediterranean greenhouses
M.D. Fernandez a,*, A.M. Gonzalez a, J. Carreno a, C. Perez a, S. Bonachela b
aEstacion Experimental de la Fundacion Cajamar, Autovıa del Mediterraneo, km. 416.7, 04710 El Ejido, Almerıa, SpainbDepartamento de Produccion Vegetal, Universidad de Almerıa, La Canada de San Urbano s/n, 04120 Almerıa, Spain
a g r i c u l t u r a l w a t e r m a n a g e m e n t 8 9 ( 2 0 0 7 ) 2 5 1 – 2 6 0
avai lab le at www.sc iencedi rec t .com
journal homepage: www.e lsev ier .com/ locate /agwat
a r t i c l e i n f o
Article history:
Accepted 7 February 2007
Keywords:
Water use
Drip irrigation
Horticultural crops
Performance indicators
Greenhouse
Mediterrranean
a b s t r a c t
A comprehensive irrigation assessment was conducted using on-farm water use informa-
tion and simulated crop water requirements in a Mediterranean greenhouse area, mainly
dedicated to horticultural crops, located on the Almerıa coast.
The mean irrigation water supply (IWS) for the main greenhouse crop cycles was 228 mm
and ranged from 158 mm (autumn green bean) to 362 mm (autumn–spring sweet pepper).
Besides, the mean AIWS value for the main crop rotations was 444 mm and ranged between
363 mm for autumn–spring sweet pepper and 502 mm for autumn–winter pepper and spring
melon.
Mean relative irrigation supply (RIS) values were close to 1 for most greenhouse vegetable
crops, indicating that, on average, the irrigation supply matched the maximum water
requirements of these crops. By contrast, the mean RIS value of autumn–winter cucumber
was 1.6, indicating that, on average, the irrigation supply clearly exceeded the calculated
optima. However, for most crops, the high CV values observed for RIS and the analysis of the
RIS dynamics throughout the cycles indicate that there are greenhouse crops and crop cycle
periods for which the IWS clearly does not match the crop water requirements. Greenhouse
irrigation water use in the Almerıa coastal region can, therefore, be improved.
Mean irrigation water use efficiency (IWUE) values for greenhouse horticultural crops
ranged from 15.3 kg m�3 (autumn–winter green bean) to 35.6 kg m�3 (spring watermelon).
They were, in general, higher than those found when these crops were grown outdoors in
similar climatic regions. Water productivity (WP) varied from 7.8 to 15.9 s m�3 and were
highest for green bean crops. WP values of greenhouse crops were generally much higher
than those found in other irrigation districts around the world, including Mediterranean
areas, due to the low IWS and, especially, to the high value of the vegetable crops grown
off-season.
# 2007 Elsevier B.V. All rights reserved.
1. Introduction
Greenhouse vegetable production is expanding in many world
regions (Enoch and Enoch, 1999) and in particular throughout
Mediterranean coastal areas (Pardossi et al., 2004). The
Mediterranean greenhouse vegetable system is mostly based
* Corresponding author. Tel.: +34 950 580 569; fax: +34 950 580 450.E-mail address: [email protected] (M.D. Fernandez).
0378-3774/$ – see front matter # 2007 Elsevier B.V. All rights reservedoi:10.1016/j.agwat.2007.02.001
on simple low technology plastic greenhouses located in mild
winter areas, which enables the production of high-value
vegetables from autumn to spring (Castilla and Hernandez,
2005).
Growing populations and an expected higher standard of
living will increase water demand dramatically in the near
d.
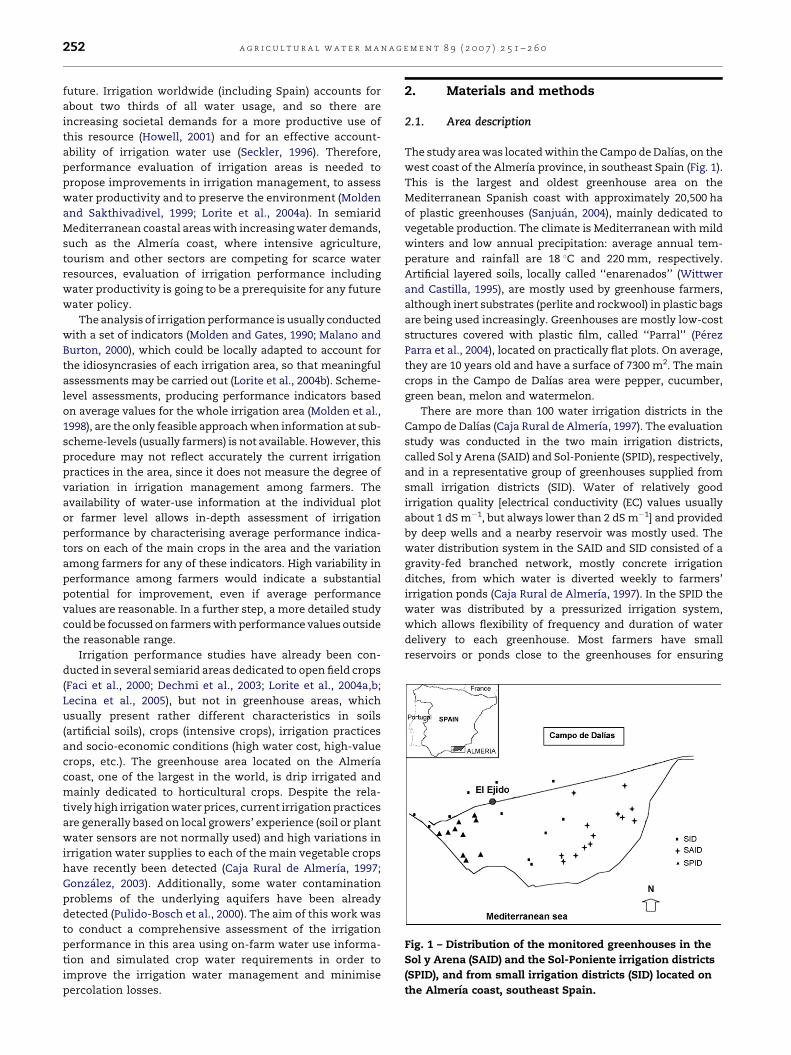
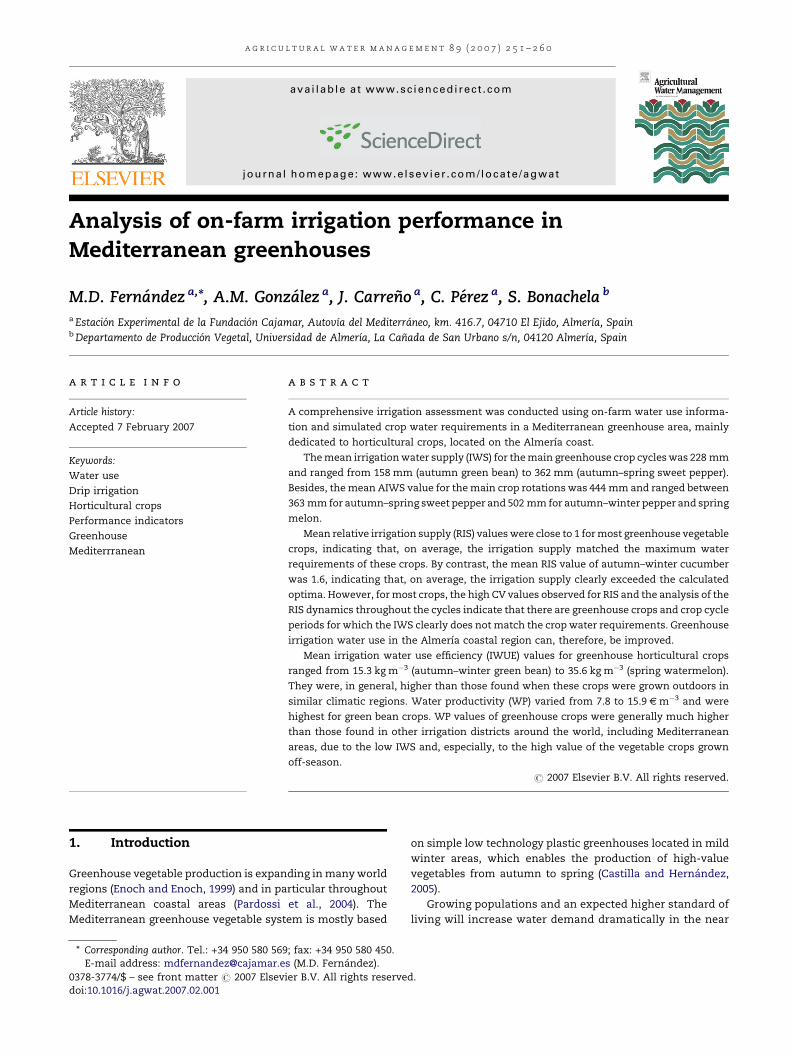
Fig. 1 – Distribution of the monitored greenhouses in the
Sol y Arena (SAID) and the Sol-Poniente irrigation districts
(SPID), and from small irrigation districts (SID) located on
the Almerıa coast, southeast Spain.
a g r i c u l t u r a l w a t e r m a n a g e m e n t 8 9 ( 2 0 0 7 ) 2 5 1 – 2 6 0252
future. Irrigation worldwide (including Spain) accounts for
about two thirds of all water usage, and so there are
increasing societal demands for a more productive use of
this resource (Howell, 2001) and for an effective account-
ability of irrigation water use (Seckler, 1996). Therefore,
performance evaluation of irrigation areas is needed to
propose improvements in irrigation management, to assess
water productivity and to preserve the environment (Molden
and Sakthivadivel, 1999; Lorite et al., 2004a). In semiarid
Mediterranean coastal areas with increasing water demands,
such as the Almerıa coast, where intensive agriculture,
tourism and other sectors are competing for scarce water
resources, evaluation of irrigation performance including
water productivity is going to be a prerequisite for any future
water policy.
The analysis of irrigation performance is usually conducted
with a set of indicators (Molden and Gates, 1990; Malano and
Burton, 2000), which could be locally adapted to account for
the idiosyncrasies of each irrigation area, so that meaningful
assessments may be carried out (Lorite et al., 2004b). Scheme-
level assessments, producing performance indicators based
on average values for the whole irrigation area (Molden et al.,
1998), are the only feasible approach when information at sub-
scheme-levels (usually farmers) is not available. However, this
procedure may not reflect accurately the current irrigation
practices in the area, since it does not measure the degree of
variation in irrigation management among farmers. The
availability of water-use information at the individual plot
or farmer level allows in-depth assessment of irrigation
performance by characterising average performance indica-
tors on each of the main crops in the area and the variation
among farmers for any of these indicators. High variability in
performance among farmers would indicate a substantial
potential for improvement, even if average performance
values are reasonable. In a further step, a more detailed study
could be focussed on farmers with performance values outside
the reasonable range.
Irrigation performance studies have already been con-
ducted in several semiarid areas dedicated to open field crops
(Faci et al., 2000; Dechmi et al., 2003; Lorite et al., 2004a,b;
Lecina et al., 2005), but not in greenhouse areas, which
usually present rather different characteristics in soils
(artificial soils), crops (intensive crops), irrigation practices
and socio-economic conditions (high water cost, high-value
crops, etc.). The greenhouse area located on the Almerıa
coast, one of the largest in the world, is drip irrigated and
mainly dedicated to horticultural crops. Despite the rela-
tively high irrigation water prices, current irrigation practices
are generally based on local growers’ experience (soil or plant
water sensors are not normally used) and high variations in
irrigation water supplies to each of the main vegetable crops
have recently been detected (Caja Rural de Almerıa, 1997;
Gonzalez, 2003). Additionally, some water contamination
problems of the underlying aquifers have been already
detected (Pulido-Bosch et al., 2000). The aim of this work was
to conduct a comprehensive assessment of the irrigation
performance in this area using on-farm water use informa-
tion and simulated crop water requirements in order to
improve the irrigation water management and minimise
percolation losses.
2. Materials and methods
2.1. Area description
The study area was located within the Campo de Dalıas, on the
west coast of the Almerıa province, in southeast Spain (Fig. 1).
This is the largest and oldest greenhouse area on the
Mediterranean Spanish coast with approximately 20,500 ha
of plastic greenhouses (Sanjuan, 2004), mainly dedicated to
vegetable production. The climate is Mediterranean with mild
winters and low annual precipitation: average annual tem-
perature and rainfall are 18 8C and 220 mm, respectively.
Artificial layered soils, locally called ‘‘enarenados’’ (Wittwer
and Castilla, 1995), are mostly used by greenhouse farmers,
although inert substrates (perlite and rockwool) in plastic bags
are being used increasingly. Greenhouses are mostly low-cost
structures covered with plastic film, called ‘‘Parral’’ (Perez
Parra et al., 2004), located on practically flat plots. On average,
they are 10 years old and have a surface of 7300 m2. The main
crops in the Campo de Dalıas area were pepper, cucumber,
green bean, melon and watermelon.
There are more than 100 water irrigation districts in the
Campo de Dalıas (Caja Rural de Almerıa, 1997). The evaluation
study was conducted in the two main irrigation districts,
called Sol y Arena (SAID) and Sol-Poniente (SPID), respectively,
and in a representative group of greenhouses supplied from
small irrigation districts (SID). Water of relatively good
irrigation quality [electrical conductivity (EC) values usually
about 1 dS m�1, but always lower than 2 dS m�1] and provided
by deep wells and a nearby reservoir was mostly used. The
water distribution system in the SAID and SID consisted of a
gravity-fed branched network, mostly concrete irrigation
ditches, from which water is diverted weekly to farmers’
irrigation ponds (Caja Rural de Almerıa, 1997). In the SPID the
water was distributed by a pressurized irrigation system,
which allows flexibility of frequency and duration of water
delivery to each greenhouse. Most farmers have small
reservoirs or ponds close to the greenhouses for ensuring
a g r i c u l t u r a l w a t e r m a n a g e m e n t 8 9 ( 2 0 0 7 ) 2 5 1 – 2 6 0 253
water availability, as these high-value crops are usually
irrigated frequently. All greenhouses are drip irrigated, and
the irrigation head, usually near the ponds, consisted of a
pump, water filters, fertilizer injector and control mechan-
isms. Water is distributed within greenhouses by polyethylene
drip lines with emitters of nominal discharge rates ranging
from 2 to 4 L h�1 placed every 0.5 m.
2.2. Data collection
The study was carried out over six cropping seasons (1993/
1994–1998/1999) in 41 representative greenhouses chosen by
local experts from the SAID (58 monitorised greenhouse data),
the SPID (80) and the smaller irrigation districts (62). The
spatial study unit was the greenhouse. Total irrigation water
supply per crop (IWS, mm) and cropping season (AIWS, mm)
were measured by water-meter readings installed in the main
irrigation pipe entering each greenhouse. Measurements were
taken approximately every month and at the start and end of
each crop cycle. Information on plot size (greenhouse), crop
and cycle, variety, sowing or planting date and plant
population was obtained from personal interviews with each
greenhouse farmer. They also provided data of total fresh fruit
production (CP, kg m�2) and gross income (s m�2) per crop
cycle and greenhouse. Characteristics of each drip irrigation
system (emission uniformity, EU) were measured at the
beginning of the study (Merriam and Keller, 1978), while the
irrigation water electrical conductivity (ECw) was determined
once per cropping season. Average ECw and EU values for the
whole period and area studied were 1.05 dS m�1 and 91%,
respectively. These variables were measured at the beginning
of the cropping season.
2.3. Simulation model
Crop water requirements were calculated as the maximum
crop evapotranspiration (ETc) plus the additional water
required for leaching of salts or for compensating for non-
uniformity of water application (Allen et al., 1998). Leaching
requirements were calculated using EC irrigation water data
(Ayers and Westcot, 1985).
The effective rainfall was considered practically null, as the
amount of rainwater entering the greenhouse is usually small
and heterogeneously distributed. Thus, the irrigation water
requirements were equal to the crop water requirements. ETc
was calculated using the Kc–ETo method recommended by the
FAO (Doorenbos and Pruitt, 1977; Allen et al., 1998) and
adapted to greenhouse crops by Orgaz et al. (2005):
ETc ¼ ETo � Kc (1)
The reference crop evapotranspiration (ETo) was calculated
with a locally calibrated radiation method (Bonachela et al.,
2006) that requires daily solar radiation data and greenhouse
transmissivity estimates. Kc values for major greenhouse
horticultural crops were determined according to Fernandez
(2000) and Orgaz et al. (2005). Daily Kc values from sowing/
planting to effective full cover were determined as a function
of thermal time, calculated using greenhouse air temperature.
Real-time meteorological data required for determining ETc
values were taken from a weather station located within the
‘‘Cajamar Foundation’’ research station (28430W; 368480E; and
155 m a.s.l.) in the Campo de Dalıas. Greenhouse air
temperatures were measured within a typical Mediterranean
greenhouse located in the same research station.
Based on local practices and their own experience, green-
house farmers usually irrigate abundantly before crop sowing
or planting, and frequently later on (daily in periods of high
water demand). The soil water content is not measured or
considered in the greenhouse water balance. Farmers usually
try to maintain the soil water content around field capacity.
2.4. Irrigation performance indicators
Two irrigation performance indicators (Malano and Burton,
2000) were used: relative irrigation supply (RIS) and irrigation
water productivity (WP) per crop cycle. These indicators were
also determined annually (ARIS and AWP, respectively), as
many farmers usually cultivate two horticultural crops per
season. The irrigation water use efficiency (IWUE) was also
assessed (Sinclair et al., 1984). For greenhouse crops, the RIS
indicator is equal to the relative water supply indicator
(Malano and Burton, 2000) since all the water requirements
were applied by irrigation, because the effective rainwater
entering the greenhouse was considered negligible. We
defined the indicators as:
RIS ¼ total crop irrigation water supply ðIWSÞtotal irrigation water requirements ðIWRÞ (2)
ARIS ¼ annual irrigation water supply ðAIWSÞannual irrigation water requirements ðAWRÞ (3)
WP ðs m�3Þ ¼ total value of crop productiontotal crop irrigation water supply ðIWSÞ (4)
AWP ðs m�3Þ ¼ annual value of crop productionannual irrigation water supply ðAIWSÞ (5)
IWUE ðkg m�3Þ ¼ marketable crop productiontotal crop irrigation water supply ðIWSÞ (6)
3. Results and discussion
3.1. Irrigation district comparison
Irrigation performance indicators for the three irrigation
districts studied are presented in Table 1. These values are
the averages of six cropping seasons and include the major
crop cycles of each irrigation district: autumn–winter cycles of
sweet pepper, cucumber and green bean, spring cycles of
melon, watermelon and green bean, and autumn–spring
sweet pepper. No significant differences were found between
irrigation districts for IWS nor for any of the irrigation
performance indicators (RIS, IWUE and WP), although the
ECw was higher in the SAID than in the SPID and SDI.
Greenhouse farmers with irrigation water of relatively high
ECw from the SAID either reduced slightly the concentration of
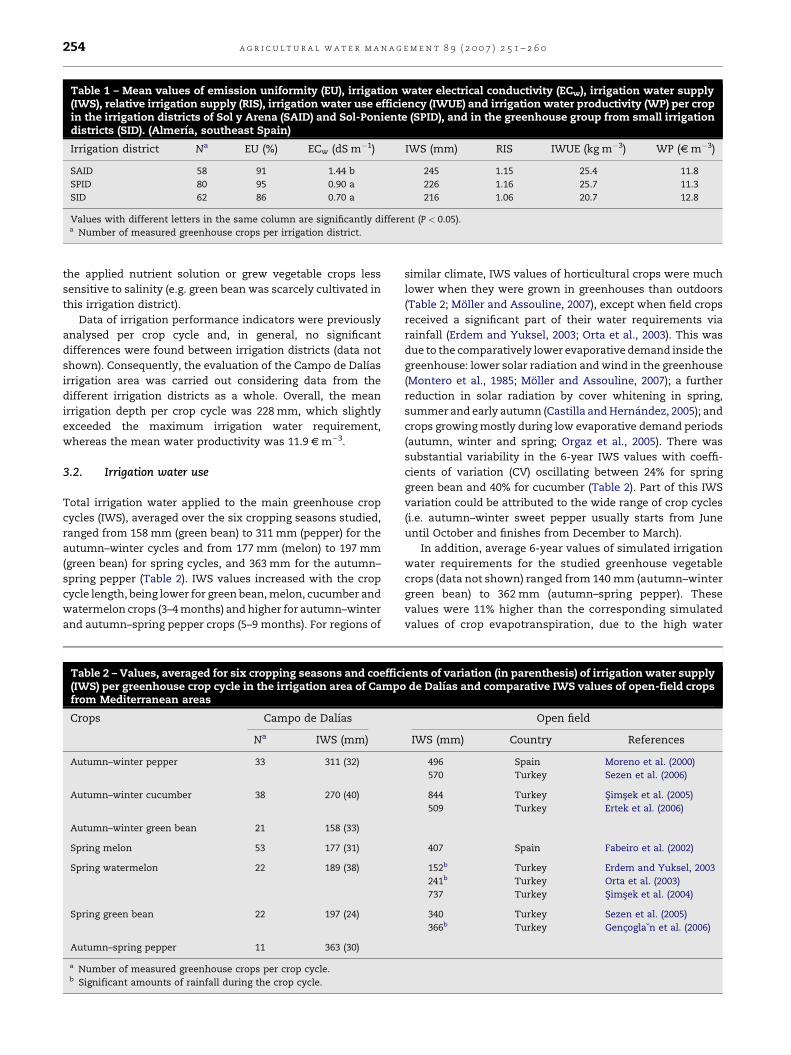
Table 1 – Mean values of emission uniformity (EU), irrigation water electrical conductivity (ECw), irrigation water supply(IWS), relative irrigation supply (RIS), irrigation water use efficiency (IWUE) and irrigation water productivity (WP) per cropin the irrigation districts of Sol y Arena (SAID) and Sol-Poniente (SPID), and in the greenhouse group from small irrigationdistricts (SID). (Almerıa, southeast Spain)
Irrigation district Na EU (%) ECw (dS m�1) IWS (mm) RIS IWUE (kg m�3) WP (s m�3)
SAID 58 91 1.44 b 245 1.15 25.4 11.8
SPID 80 95 0.90 a 226 1.16 25.7 11.3
SID 62 86 0.70 a 216 1.06 20.7 12.8
Values with different letters in the same column are significantly different (P < 0.05).a Number of measured greenhouse crops per irrigation district.
a g r i c u l t u r a l w a t e r m a n a g e m e n t 8 9 ( 2 0 0 7 ) 2 5 1 – 2 6 0254
the applied nutrient solution or grew vegetable crops less
sensitive to salinity (e.g. green bean was scarcely cultivated in
this irrigation district).
Data of irrigation performance indicators were previously
analysed per crop cycle and, in general, no significant
differences were found between irrigation districts (data not
shown). Consequently, the evaluation of the Campo de Dalıas
irrigation area was carried out considering data from the
different irrigation districts as a whole. Overall, the mean
irrigation depth per crop cycle was 228 mm, which slightly
exceeded the maximum irrigation water requirement,
whereas the mean water productivity was 11.9 s m�3.
3.2. Irrigation water use
Total irrigation water applied to the main greenhouse crop
cycles (IWS), averaged over the six cropping seasons studied,
ranged from 158 mm (green bean) to 311 mm (pepper) for the
autumn–winter cycles and from 177 mm (melon) to 197 mm
(green bean) for spring cycles, and 363 mm for the autumn–
spring pepper (Table 2). IWS values increased with the crop
cycle length, being lower for green bean, melon, cucumber and
watermelon crops (3–4 months) and higher for autumn–winter
and autumn–spring pepper crops (5–9 months). For regions of
Table 2 – Values, averaged for six cropping seasons and coeffic(IWS) per greenhouse crop cycle in the irrigation area of Campofrom Mediterranean areas
Crops Campo de Dalıas
Na IWS (mm)
Autumn–winter pepper 33 311 (32)
Autumn–winter cucumber 38 270 (40)
Autumn–winter green bean 21 158 (33)
Spring melon 53 177 (31)
Spring watermelon 22 189 (38)
Spring green bean 22 197 (24)
Autumn–spring pepper 11 363 (30)
a Number of measured greenhouse crops per crop cycle.b Significant amounts of rainfall during the crop cycle.
similar climate, IWS values of horticultural crops were much
lower when they were grown in greenhouses than outdoors
(Table 2; Moller and Assouline, 2007), except when field crops
received a significant part of their water requirements via
rainfall (Erdem and Yuksel, 2003; Orta et al., 2003). This was
due to the comparatively lower evaporative demand inside the
greenhouse: lower solar radiation and wind in the greenhouse
(Montero et al., 1985; Moller and Assouline, 2007); a further
reduction in solar radiation by cover whitening in spring,
summer and early autumn (Castilla and Hernandez, 2005); and
crops growing mostly during low evaporative demand periods
(autumn, winter and spring; Orgaz et al., 2005). There was
substantial variability in the 6-year IWS values with coeffi-
cients of variation (CV) oscillating between 24% for spring
green bean and 40% for cucumber (Table 2). Part of this IWS
variation could be attributed to the wide range of crop cycles
(i.e. autumn–winter sweet pepper usually starts from June
until October and finishes from December to March).
In addition, average 6-year values of simulated irrigation
water requirements for the studied greenhouse vegetable
crops (data not shown) ranged from 140 mm (autumn–winter
green bean) to 362 mm (autumn–spring pepper). These
values were 11% higher than the corresponding simulated
values of crop evapotranspiration, due to the high water
ients of variation (in parenthesis) of irrigation water supplyde Dalıas and comparative IWS values of open-field crops
Open field
IWS (mm) Country References
496 Spain Moreno et al. (2000)
570 Turkey Sezen et al. (2006)
844 Turkey Simsek et al. (2005)
509 Turkey Ertek et al. (2006)
407 Spain Fabeiro et al. (2002)
152b Turkey Erdem and Yuksel, 2003
241b Turkey Orta et al. (2003)
737 Turkey Simsek et al. (2004)
340 Turkey Sezen et al. (2005)
366b Turkey Gencogla˘n et al. (2006)
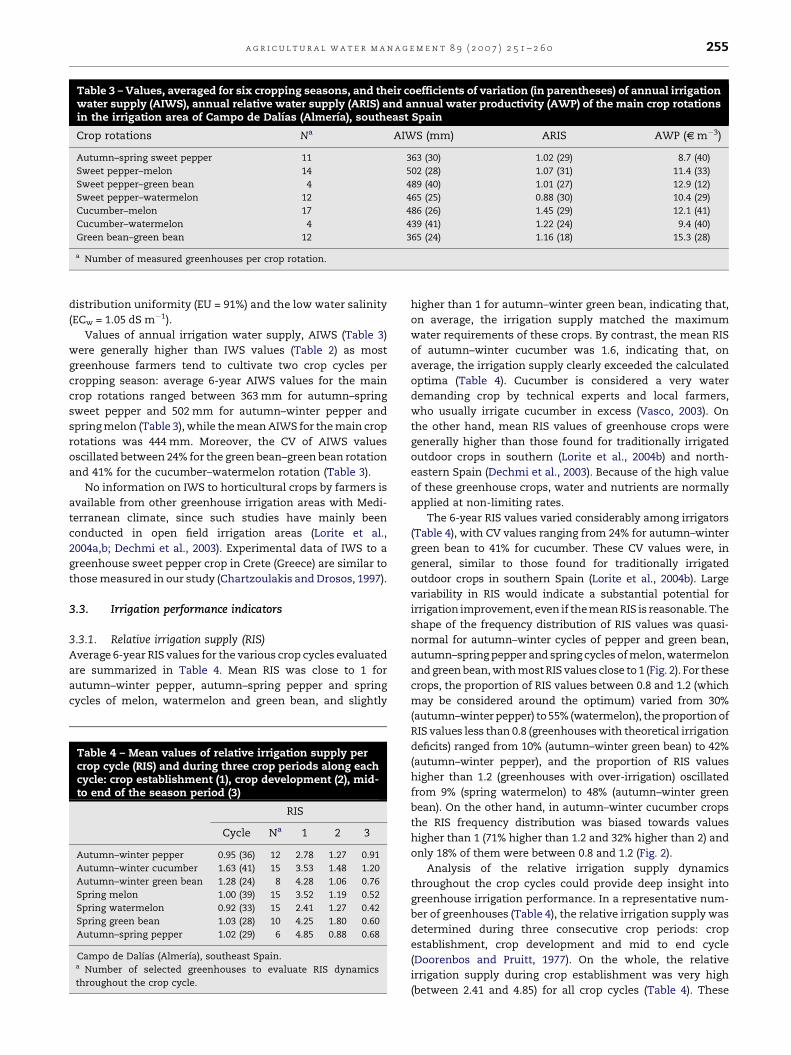
Table 3 – Values, averaged for six cropping seasons, and their coefficients of variation (in parentheses) of annual irrigationwater supply (AIWS), annual relative water supply (ARIS) and annual water productivity (AWP) of the main crop rotationsin the irrigation area of Campo de Dalıas (Almerıa), southeast Spain
Crop rotations Na AIWS (mm) ARIS AWP (s m�3)
Autumn–spring sweet pepper 11 363 (30) 1.02 (29) 8.7 (40)
Sweet pepper–melon 14 502 (28) 1.07 (31) 11.4 (33)
Sweet pepper–green bean 4 489 (40) 1.01 (27) 12.9 (12)
Sweet pepper–watermelon 12 465 (25) 0.88 (30) 10.4 (29)
Cucumber–melon 17 486 (26) 1.45 (29) 12.1 (41)
Cucumber–watermelon 4 439 (41) 1.22 (24) 9.4 (40)
Green bean–green bean 12 365 (24) 1.16 (18) 15.3 (28)
a Number of measured greenhouses per crop rotation.
a g r i c u l t u r a l w a t e r m a n a g e m e n t 8 9 ( 2 0 0 7 ) 2 5 1 – 2 6 0 255
distribution uniformity (EU = 91%) and the low water salinity
(ECw = 1.05 dS m�1).
Values of annual irrigation water supply, AIWS (Table 3)
were generally higher than IWS values (Table 2) as most
greenhouse farmers tend to cultivate two crop cycles per
cropping season: average 6-year AIWS values for the main
crop rotations ranged between 363 mm for autumn–spring
sweet pepper and 502 mm for autumn–winter pepper and
spring melon (Table 3), while the mean AIWS for the main crop
rotations was 444 mm. Moreover, the CV of AIWS values
oscillated between 24% for the green bean–green bean rotation
and 41% for the cucumber–watermelon rotation (Table 3).
No information on IWS to horticultural crops by farmers is
available from other greenhouse irrigation areas with Medi-
terranean climate, since such studies have mainly been
conducted in open field irrigation areas (Lorite et al.,
2004a,b; Dechmi et al., 2003). Experimental data of IWS to a
greenhouse sweet pepper crop in Crete (Greece) are similar to
those measured in our study (Chartzoulakis and Drosos, 1997).
3.3. Irrigation performance indicators
3.3.1. Relative irrigation supply (RIS)Average 6-year RIS values for the various crop cycles evaluated
are summarized in Table 4. Mean RIS was close to 1 for
autumn–winter pepper, autumn–spring pepper and spring
cycles of melon, watermelon and green bean, and slightly
Table 4 – Mean values of relative irrigation supply percrop cycle (RIS) and during three crop periods along eachcycle: crop establishment (1), crop development (2), mid-to end of the season period (3)
RIS
Cycle Na 1 2 3
Autumn–winter pepper 0.95 (36) 12 2.78 1.27 0.91
Autumn–winter cucumber 1.63 (41) 15 3.53 1.48 1.20
Autumn–winter green bean 1.28 (24) 8 4.28 1.06 0.76
Spring melon 1.00 (39) 15 3.52 1.19 0.52
Spring watermelon 0.92 (33) 15 2.41 1.27 0.42
Spring green bean 1.03 (28) 10 4.25 1.80 0.60
Autumn–spring pepper 1.02 (29) 6 4.85 0.88 0.68
Campo de Dalıas (Almerıa), southeast Spain.a Number of selected greenhouses to evaluate RIS dynamics
throughout the crop cycle.
higher than 1 for autumn–winter green bean, indicating that,
on average, the irrigation supply matched the maximum
water requirements of these crops. By contrast, the mean RIS
of autumn–winter cucumber was 1.6, indicating that, on
average, the irrigation supply clearly exceeded the calculated
optima (Table 4). Cucumber is considered a very water
demanding crop by technical experts and local farmers,
who usually irrigate cucumber in excess (Vasco, 2003). On
the other hand, mean RIS values of greenhouse crops were
generally higher than those found for traditionally irrigated
outdoor crops in southern (Lorite et al., 2004b) and north-
eastern Spain (Dechmi et al., 2003). Because of the high value
of these greenhouse crops, water and nutrients are normally
applied at non-limiting rates.
The 6-year RIS values varied considerably among irrigators
(Table 4), with CV values ranging from 24% for autumn–winter
green bean to 41% for cucumber. These CV values were, in
general, similar to those found for traditionally irrigated
outdoor crops in southern Spain (Lorite et al., 2004b). Large
variability in RIS would indicate a substantial potential for
irrigation improvement, even if the mean RIS is reasonable. The
shape of the frequency distribution of RIS values was quasi-
normal for autumn–winter cycles of pepper and green bean,
autumn–spring pepper and spring cycles of melon, watermelon
and green bean, with most RIS values close to 1 (Fig. 2). For these
crops, the proportion of RIS values between 0.8 and 1.2 (which
may be considered around the optimum) varied from 30%
(autumn–winter pepper) to 55% (watermelon), the proportion of
RIS values less than 0.8 (greenhouses with theoretical irrigation
deficits) ranged from 10% (autumn–winter green bean) to 42%
(autumn–winter pepper), and the proportion of RIS values
higher than 1.2 (greenhouses with over-irrigation) oscillated
from 9% (spring watermelon) to 48% (autumn–winter green
bean). On the other hand, in autumn–winter cucumber crops
the RIS frequency distribution was biased towards values
higher than 1 (71% higher than 1.2 and 32% higher than 2) and
only 18% of them were between 0.8 and 1.2 (Fig. 2).
Analysis of the relative irrigation supply dynamics
throughout the crop cycles could provide deep insight into
greenhouse irrigation performance. In a representative num-
ber of greenhouses (Table 4), the relative irrigation supply was
determined during three consecutive crop periods: crop
establishment, crop development and mid to end cycle
(Doorenbos and Pruitt, 1977). On the whole, the relative
irrigation supply during crop establishment was very high
(between 2.41 and 4.85) for all crop cycles (Table 4). These
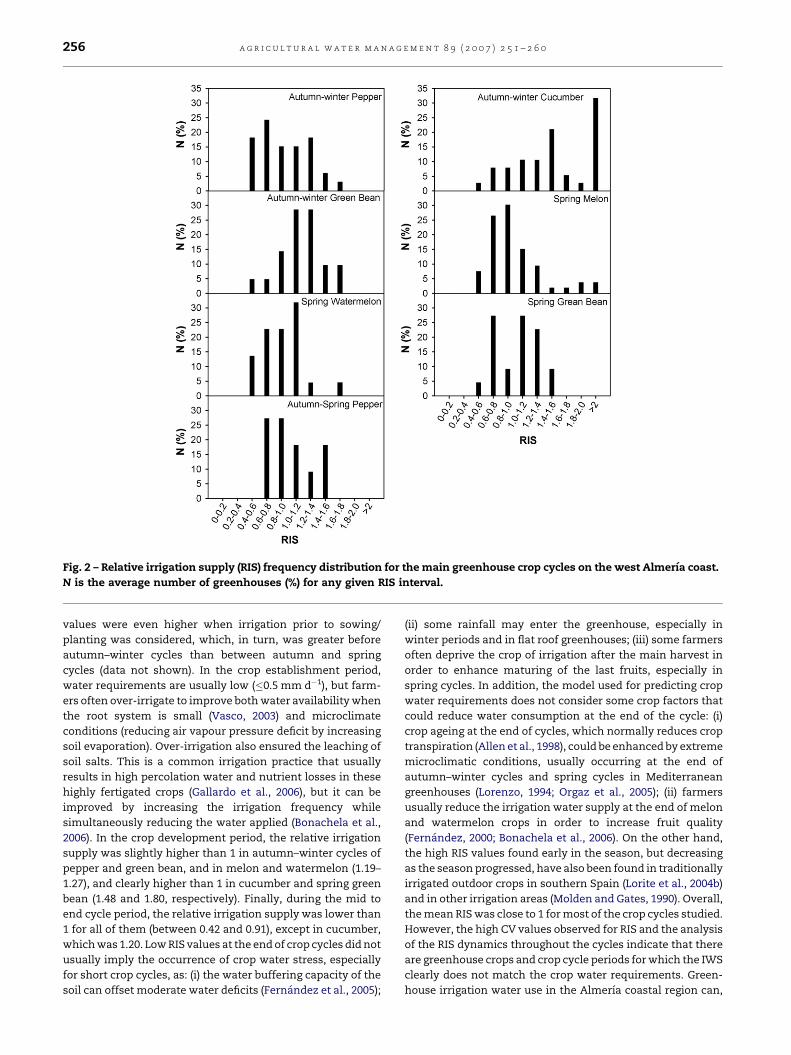
Fig. 2 – Relative irrigation supply (RIS) frequency distribution for the main greenhouse crop cycles on the west Almerıa coast.
N is the average number of greenhouses (%) for any given RIS interval.
a g r i c u l t u r a l w a t e r m a n a g e m e n t 8 9 ( 2 0 0 7 ) 2 5 1 – 2 6 0256
values were even higher when irrigation prior to sowing/
planting was considered, which, in turn, was greater before
autumn–winter cycles than between autumn and spring
cycles (data not shown). In the crop establishment period,
water requirements are usually low (�0.5 mm d�1), but farm-
ers often over-irrigate to improve both water availability when
the root system is small (Vasco, 2003) and microclimate
conditions (reducing air vapour pressure deficit by increasing
soil evaporation). Over-irrigation also ensured the leaching of
soil salts. This is a common irrigation practice that usually
results in high percolation water and nutrient losses in these
highly fertigated crops (Gallardo et al., 2006), but it can be
improved by increasing the irrigation frequency while
simultaneously reducing the water applied (Bonachela et al.,
2006). In the crop development period, the relative irrigation
supply was slightly higher than 1 in autumn–winter cycles of
pepper and green bean, and in melon and watermelon (1.19–
1.27), and clearly higher than 1 in cucumber and spring green
bean (1.48 and 1.80, respectively). Finally, during the mid to
end cycle period, the relative irrigation supply was lower than
1 for all of them (between 0.42 and 0.91), except in cucumber,
which was 1.20. Low RIS values at the end of crop cycles did not
usually imply the occurrence of crop water stress, especially
for short crop cycles, as: (i) the water buffering capacity of the
soil can offset moderate water deficits (Fernandez et al., 2005);
(ii) some rainfall may enter the greenhouse, especially in
winter periods and in flat roof greenhouses; (iii) some farmers
often deprive the crop of irrigation after the main harvest in
order to enhance maturing of the last fruits, especially in
spring cycles. In addition, the model used for predicting crop
water requirements does not consider some crop factors that
could reduce water consumption at the end of the cycle: (i)
crop ageing at the end of cycles, which normally reduces crop
transpiration (Allen et al., 1998), could be enhanced by extreme
microclimatic conditions, usually occurring at the end of
autumn–winter cycles and spring cycles in Mediterranean
greenhouses (Lorenzo, 1994; Orgaz et al., 2005); (ii) farmers
usually reduce the irrigation water supply at the end of melon
and watermelon crops in order to increase fruit quality
(Fernandez, 2000; Bonachela et al., 2006). On the other hand,
the high RIS values found early in the season, but decreasing
as the season progressed, have also been found in traditionally
irrigated outdoor crops in southern Spain (Lorite et al., 2004b)
and in other irrigation areas (Molden and Gates, 1990). Overall,
the mean RIS was close to 1 for most of the crop cycles studied.
However, the high CV values observed for RIS and the analysis
of the RIS dynamics throughout the cycles indicate that there
are greenhouse crops and crop cycle periods for which the IWS
clearly does not match the crop water requirements. Green-
house irrigation water use in the Almerıa coastal region can,
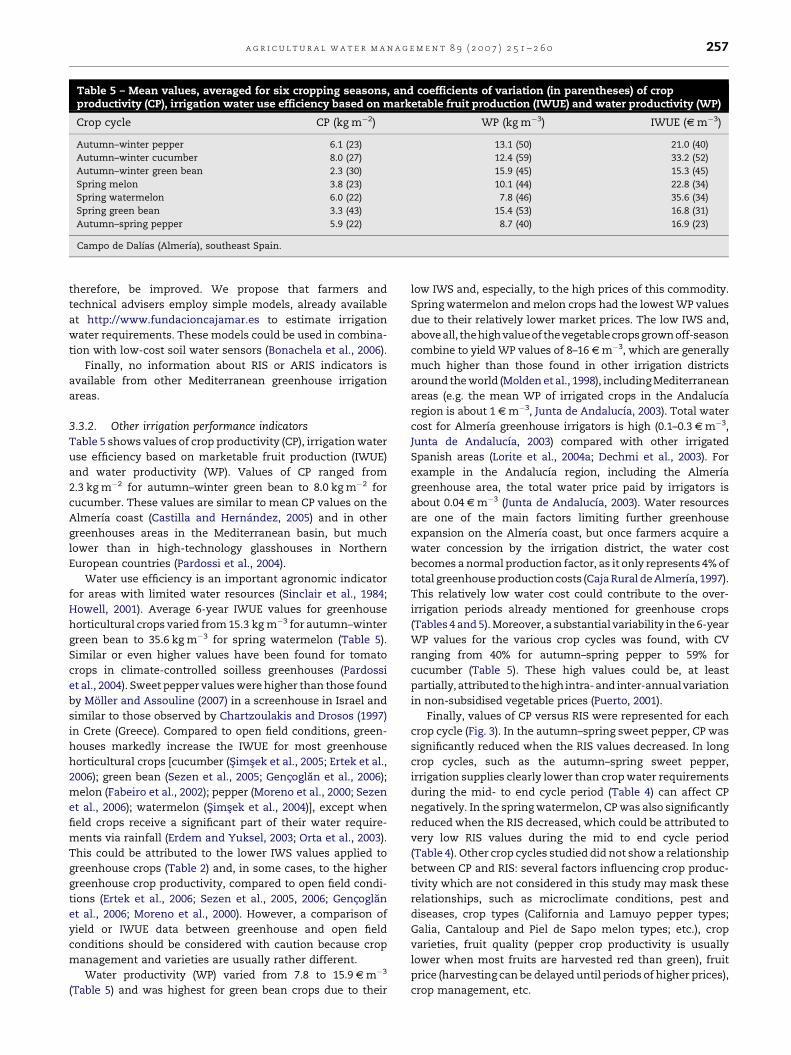
Table 5 – Mean values, averaged for six cropping seasons, and coefficients of variation (in parentheses) of cropproductivity (CP), irrigation water use efficiency based on marketable fruit production (IWUE) and water productivity (WP)
Crop cycle CP (kg m�2) WP (kg m�3) IWUE (s m�3)
Autumn–winter pepper 6.1 (23) 13.1 (50) 21.0 (40)
Autumn–winter cucumber 8.0 (27) 12.4 (59) 33.2 (52)
Autumn–winter green bean 2.3 (30) 15.9 (45) 15.3 (45)
Spring melon 3.8 (23) 10.1 (44) 22.8 (34)
Spring watermelon 6.0 (22) 7.8 (46) 35.6 (34)
Spring green bean 3.3 (43) 15.4 (53) 16.8 (31)
Autumn–spring pepper 5.9 (22) 8.7 (40) 16.9 (23)
Campo de Dalıas (Almerıa), southeast Spain.
a g r i c u l t u r a l w a t e r m a n a g e m e n t 8 9 ( 2 0 0 7 ) 2 5 1 – 2 6 0 257
therefore, be improved. We propose that farmers and
technical advisers employ simple models, already available
at http://www.fundacioncajamar.es to estimate irrigation
water requirements. These models could be used in combina-
tion with low-cost soil water sensors (Bonachela et al., 2006).
Finally, no information about RIS or ARIS indicators is
available from other Mediterranean greenhouse irrigation
areas.
3.3.2. Other irrigation performance indicatorsTable 5 shows values of crop productivity (CP), irrigation water
use efficiency based on marketable fruit production (IWUE)
and water productivity (WP). Values of CP ranged from
2.3 kg m�2 for autumn–winter green bean to 8.0 kg m�2 for
cucumber. These values are similar to mean CP values on the
Almerıa coast (Castilla and Hernandez, 2005) and in other
greenhouses areas in the Mediterranean basin, but much
lower than in high-technology glasshouses in Northern
European countries (Pardossi et al., 2004).
Water use efficiency is an important agronomic indicator
for areas with limited water resources (Sinclair et al., 1984;
Howell, 2001). Average 6-year IWUE values for greenhouse
horticultural crops varied from 15.3 kg m�3 for autumn–winter
green bean to 35.6 kg m�3 for spring watermelon (Table 5).
Similar or even higher values have been found for tomato
crops in climate-controlled soilless greenhouses (Pardossi
et al., 2004). Sweet pepper values were higher than those found
by Moller and Assouline (2007) in a screenhouse in Israel and
similar to those observed by Chartzoulakis and Drosos (1997)
in Crete (Greece). Compared to open field conditions, green-
houses markedly increase the IWUE for most greenhouse
horticultural crops [cucumber (Simsek et al., 2005; Ertek et al.,
2006); green bean (Sezen et al., 2005; Gencoglan et al., 2006);
melon (Fabeiro et al., 2002); pepper (Moreno et al., 2000; Sezen
et al., 2006); watermelon (Simsek et al., 2004)], except when
field crops receive a significant part of their water require-
ments via rainfall (Erdem and Yuksel, 2003; Orta et al., 2003).
This could be attributed to the lower IWS values applied to
greenhouse crops (Table 2) and, in some cases, to the higher
greenhouse crop productivity, compared to open field condi-
tions (Ertek et al., 2006; Sezen et al., 2005, 2006; Gencoglan
et al., 2006; Moreno et al., 2000). However, a comparison of
yield or IWUE data between greenhouse and open field
conditions should be considered with caution because crop
management and varieties are usually rather different.
Water productivity (WP) varied from 7.8 to 15.9 s m�3
(Table 5) and was highest for green bean crops due to their
low IWS and, especially, to the high prices of this commodity.
Spring watermelon and melon crops had the lowest WP values
due to their relatively lower market prices. The low IWS and,
above all, thehigh valueof the vegetable cropsgrown off-season
combine to yield WP values of 8–16 s m�3, which are generally
much higher than those found in other irrigation districts
around the world (Molden et al., 1998), including Mediterranean
areas (e.g. the mean WP of irrigated crops in the Andalucıa
region is about 1 s m�3, Junta de Andalucıa, 2003). Total water
cost for Almerıa greenhouse irrigators is high (0.1–0.3 s m�3,
Junta de Andalucıa, 2003) compared with other irrigated
Spanish areas (Lorite et al., 2004a; Dechmi et al., 2003). For
example in the Andalucıa region, including the Almerıa
greenhouse area, the total water price paid by irrigators is
about 0.04 s m�3 (Junta de Andalucıa, 2003). Water resources
are one of the main factors limiting further greenhouse
expansion on the Almerıa coast, but once farmers acquire a
water concession by the irrigation district, the water cost
becomes a normal production factor, as it only represents 4% of
total greenhouse production costs (Caja Rural de Almerıa, 1997).
This relatively low water cost could contribute to the over-
irrigation periods already mentioned for greenhouse crops
(Tables 4 and 5). Moreover, a substantial variability in the 6-year
WP values for the various crop cycles was found, with CV
ranging from 40% for autumn–spring pepper to 59% for
cucumber (Table 5). These high values could be, at least
partially, attributed to thehighintra-and inter-annualvariation
in non-subsidised vegetable prices (Puerto, 2001).
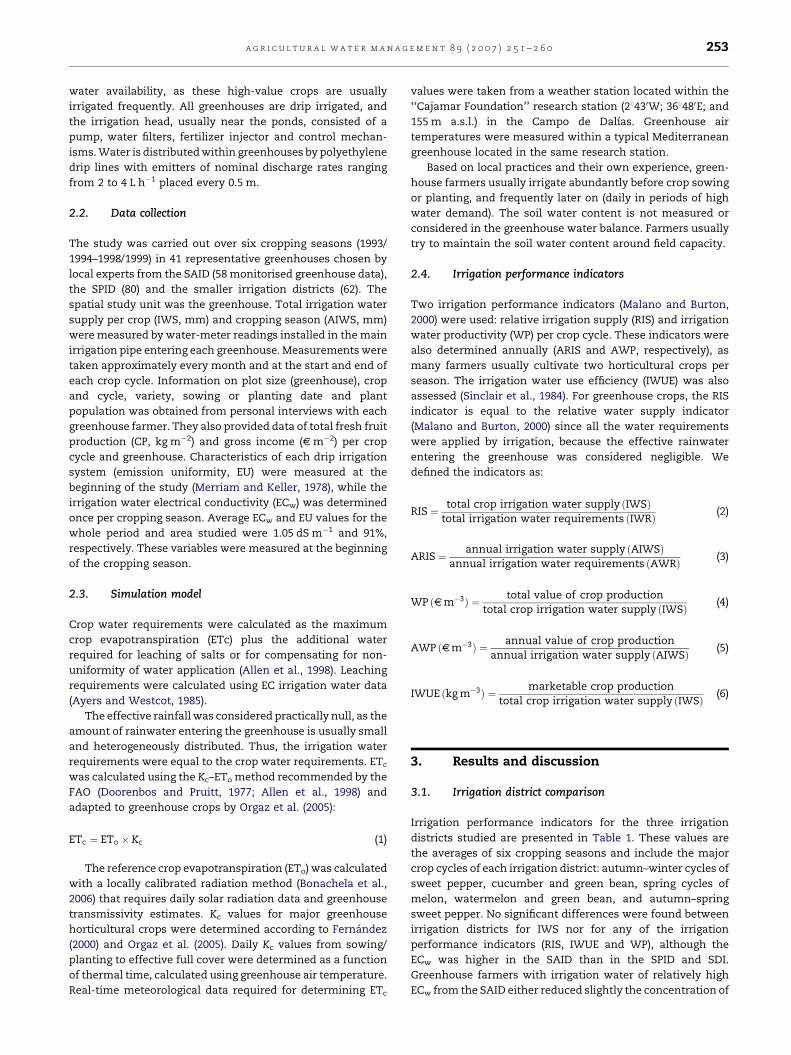
Finally, values of CP versus RIS were represented for each
crop cycle (Fig. 3). In the autumn–spring sweet pepper, CP was
significantly reduced when the RIS values decreased. In long
crop cycles, such as the autumn–spring sweet pepper,
irrigation supplies clearly lower than crop water requirements
during the mid- to end cycle period (Table 4) can affect CP
negatively. In the spring watermelon, CP was also significantly
reduced when the RIS decreased, which could be attributed to
very low RIS values during the mid to end cycle period
(Table 4). Other crop cycles studied did not show a relationship
between CP and RIS: several factors influencing crop produc-
tivity which are not considered in this study may mask these
relationships, such as microclimate conditions, pest and
diseases, crop types (California and Lamuyo pepper types;
Galia, Cantaloup and Piel de Sapo melon types; etc.), crop
varieties, fruit quality (pepper crop productivity is usually
lower when most fruits are harvested red than green), fruit
price (harvesting can be delayed until periods of higher prices),
crop management, etc.
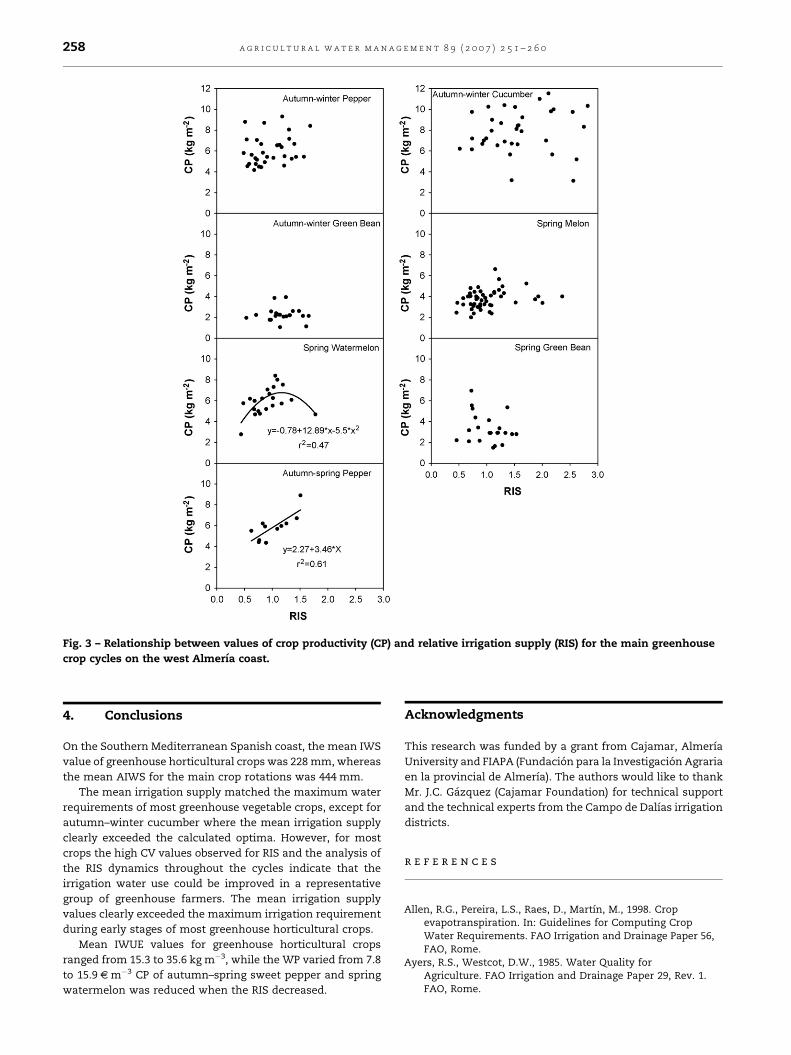
Fig. 3 – Relationship between values of crop productivity (CP) and relative irrigation supply (RIS) for the main greenhouse
crop cycles on the west Almerıa coast.
a g r i c u l t u r a l w a t e r m a n a g e m e n t 8 9 ( 2 0 0 7 ) 2 5 1 – 2 6 0258
4. Conclusions
On the Southern Mediterranean Spanish coast, the mean IWS
value of greenhouse horticultural crops was 228 mm, whereas
the mean AIWS for the main crop rotations was 444 mm.
The mean irrigation supply matched the maximum water
requirements of most greenhouse vegetable crops, except for
autumn–winter cucumber where the mean irrigation supply
clearly exceeded the calculated optima. However, for most
crops the high CV values observed for RIS and the analysis of
the RIS dynamics throughout the cycles indicate that the
irrigation water use could be improved in a representative
group of greenhouse farmers. The mean irrigation supply
values clearly exceeded the maximum irrigation requirement
during early stages of most greenhouse horticultural crops.
Mean IWUE values for greenhouse horticultural crops
ranged from 15.3 to 35.6 kg m�3, while the WP varied from 7.8
to 15.9 s m�3 CP of autumn–spring sweet pepper and spring
watermelon was reduced when the RIS decreased.
Acknowledgments
This research was funded by a grant from Cajamar, Almerıa
University and FIAPA (Fundacion para la Investigacion Agraria
en la provincial de Almerıa). The authors would like to thank
Mr. J.C. Gazquez (Cajamar Foundation) for technical support
and the technical experts from the Campo de Dalıas irrigation
districts.
r e f e r e n c e s
Allen, R.G., Pereira, L.S., Raes, D., Martın, M., 1998. Cropevapotranspiration. In: Guidelines for Computing CropWater Requirements. FAO Irrigation and Drainage Paper 56,FAO, Rome.
Ayers, R.S., Westcot, D.W., 1985. Water Quality forAgriculture. FAO Irrigation and Drainage Paper 29, Rev. 1.FAO, Rome.
a g r i c u l t u r a l w a t e r m a n a g e m e n t 8 9 ( 2 0 0 7 ) 2 5 1 – 2 6 0 259
Bonachela, S., Gonzalez, A.M., Fernandez, M.D., 2006. Irrigationscheduling of plastic greenhouse vegetable crops based onhistorical weather data. Irrig. Sci. 25 (1), 53–62.
Caja Rural de Almerıa, 1997. Gestion del regadıo en el campo deDalıas: Las comunidades de regantes Sol y Arena y Sol-Poniente. Caja Rural de Almerıa, Almerıa, Spain.
Castilla, N., Hernandez, J., 2005. The plastic greenhouse industryin Spain. Chronica Hort. 45 (3), 15–20.
Chartzoulakis, K., Drosos, N., 1997. Water requirements ofgreenhouse grown pepper under drip irrigation. Acta Hort.449 (1), 75–80.
Dechmi, F., Playan, E., Faci, J.M., Tejero, M., 2003. Analysis of anirrigation district in northeastern Spain. I. Characterisationand water use assessment. Agric. Water Manage. 61, 75–92.
Doorenbos, J., Pruitt, W.O., 1977. Guidelines for Predicting CropWater Requirements. FAO Irrigation and Drainage Paper 24.FAO, Rome.
Enoch, H.Z., Enoch, Y., 1999. The history and geography of thegreenhouse. In: Stanhil, G., Enoch, H.Z. (Eds.), GreenhouseEcosystems. Ecosystems of the World 20. Elsevier,Amsterdam, pp. 1–15.
Erdem, Y., Yuksel, A.N., 2003. Yield response of watermelon toirrigation shortage. Sci. Hort. 98, 365–383.
Ertek, A., Sensoy, S., Gedik, I., Kucukyumuk, C., 2006. Irrigationscheduling based on pan evaporation values for cucumber(Cucumis sativus L.) grown under field conditions. Agric.Water Manage. 81, 159–172.
Fabeiro, C., Martın de Santa Olalla, F., de Juan, J.A., 2002.Production of muskmelon (Cucumis melo L.) under controlleddeficit irrigation in a semi-arid climate. Agric. WaterManage. 54, 93–105.
Faci, J.M., Bensaci, A., Slatni, A., Playan, E., 2000. A case study forirrigation modernisation. I. Characterisation of the districtand analysis of water delivery records. Agric. WaterManage. 42, 313–334.
Fernandez, M.D., 2000. Necesidades hıdricas y programacion deriegos en los cultivos hortıcolas en invernadero y sueloenarenado de Almerıa. Doctoral Thesis. UniversidadAlmerıa, Spain.
Fernandez, M.D., Gallardo, M., Bonachela, S., Orgaz, F.,Thompson, R.B., Fereres, E., 2005. Water use and productionof a greenhouse pepper crop under optimum and limitedwater supply. J. Hort. Sci. Biotechnol. 80 (1), 87–96.
Gallardo, M., Thompson, R.B., Fernandez, M.D., Lopez-Toral, J.,2006. Effect of applied N concentration in a fertigatedvegetable crop on soil solution nitrate and nitrate leachingloss. Acta Hort. 700, 221–224.
Gencogla˘n, C., Altunbey, H., Gencogla˘n, S., 2006. Response ofgreen bean (P. vulgaris L.) to subsurface drip irrigation andpartial rootzone-dryng irrigation. Agric. Water Manage. 84,274–280.
Gonzalez, A.M., 2003. Programas de riego para cultivoshortıcolas en invernaderos enarenados en Almerıa.Doctoral Thesis. Universidad Almerıa, Spain.
Howell, T.A., 2001. Enhancing water use efficiency in irrigatedagriculture. Agron. J. 93, 281–289.
Junta de Andalucıa, 2003. Inventario y caracterizacion de losregadıos de Andalucıa. Consejerıa de Agricultura y Pesca,ISBN: 84-8474-117-6 (CD Rom).
Lecina, S., Playan, E., Isidoro, D., Dechmi, F., Causape, J., Faci,J.M., 2005. Irrigation evaluation and simulation at theIrrigation District V of Bardenas (Spain). Agric. WaterManage. 73 (3), 223–245.
Lorenzo, P., 1994. Interceptacion de la luz, bioproductividad eintercambio gaseoso durante la ontogenia del cultivo depepino (Cucumis sativus L.) en invernadero. Doctoral Thesis.Universidad de Barcelona, Spain.
Lorite, I.J., Mateos, L., Fereres, E., 2004a. Evaluating irrigationperformance in a Mediterranean environment. I. Model and
general assessement of an irrigation scheme. Irrig. Sci. 23,77–84.
Lorite, I.J., Mateos, L., Fereres, E., 2004b. Evaluating irrigationperformance in a Mediterranean environment. II.Variability among crops and farmers. Irrig. Sci. 23, 85–92.
Malano, H., Burton, M., 2000. Guidelines for BenchmarkingPerformance in the Irrigation and Drainage Sector. IPTRIDSecretariat, FAO, Rome.
Merriam, J.L., Keller, J., 1978. Farm Irrigation System Evaluation.Utah State University Misc. Pub., 217 pp.
Molden, D.J., Gates, T.K., 1990. Performance measures forevaluation of irrigation-water-delivery systems. J. Irrig.Drainage Eng. 116 (6), 804–823.
Molden, D.J., Sakthivadivel, R., Perry, C.J., de Fraiture, C.,Kloezen, W.H., 1998. Indicators for comparing performanceof irrigated agricultural systems. Research Report 20.International Water Management Institute, Colombo, SriLanka.
Molden, D.J., Sakthivadivel, R., 1999. Water accounting to assessuse and productivity of water. Water Res. Dev. 15, 55–71.
Moller, M., Assouline, S., 2007. Effects of a shading screen onmicroclimate and crop water requirements. Irrig. Sci. 25,171–181.
Montero, J.I., Castilla, N., Gutierrez de Rave, E., Bretones, F.,1985. Climate under plastic in the Almerıa area. Acta Hort.170, 227–234.
Moreno, M.M. Caballero, M.J., Moreno, A., Ribas, F., 2000.Influencia de la dosis de riego sobre el rendimiento y laincidencia de necrosis apical en pimiento (Capsicum annuumL.). In: S.E.C.H. (Ed.), Acta Hort. 28, 159–166, Villaviciosa,Asturias, Spain, June 6–8, 2000.
Orgaz, F., Fernandez, M.D., Bonachela, S., Gallardo, M., Fereres,E., 2005. Evapotranspiration of horticultural cropsin an unheated plastic greenhouse. Agric. Water Manage.72, 81–96.
Orta, A.H., Erdem, Y., Erdem, T., 2003. Crop water stress indexfor watermelon. Sci. Hort. 98, 121–130.
Pardossi, A., Tognoni, F., Incrocci, L., 2004. Mediterraneangreenhouse technology. Chronica Hort. 44 (2), 28–34.
Perez Parra, J., Baeza, E., Montero, J.I., Bailey, B., 2004.Natural ventilation of parral greenhouses. Biosyst. Eng. 87,355–366.
Puerto, H., 2001. Respuesta productiva de un cultivo de pepinoholandes bajo invernadero a la calefaccion por aire caliente.Doctoral Thesis. Universidad de Almerıa, Spain.
Pulido-Bosch, A., Bensi, S., Molina, L., Vallejos, A., Calaforra,J.M., Pulido-Leboeuf, P., 2000. Nitrates as indicator of aquiferinter-connection. Application to the Campo de Dalıas (SE-Spain). Environ. Geol. 39, 791–799.
Sanjuan, J.F., 2004. Estudio Multitemporal sobre la Evolucion dela Superficie Invernada en la Provincia de Almerıa porTerminos Municipales desde 1984 hasta 2004 medianteTeledeteccion de Imagenes Thematic Mapper de losSatelites Landsat V y VII. FIAPA, Almerıa, Spain.
Seckler, D., 1996. The new era of water resources management:from ‘dry’ to ‘wet’ water savings. Research Report 1.International Irrigation Management Institute, Colombo, SriLanka.
Sezen, S.M., Yazar, A., Cambolat, M., Eker, S., Celikel, G., 2005.Effect of drip irrigation management on yield and qualityof field grown green beans. Agric. Water Manage. 71 (3),243–255.
Sezen, S.M., Yazar, A., Eker, S., 2006. Effect of drip irrigationmanagement on yield and quality of field grown bellpepper. Agric. Water Manage. 81, 115–131.
Simsek, M., Kacira, M., Tonkaz, T., 2004. The effects of differentirrigation regimes on watermelon (Citrullus lanatus (Thumb))yield and yield components under semi-arid conditions.Aust. J. Agric. Res. 55 (11), 1149–1157.

a g r i c u l t u r a l w a t e r m a n a g e m e n t 8 9 ( 2 0 0 7 ) 2 5 1 – 2 6 0260
Simsek, M., Tonkaz, T., Kacira, M., Comlecioglu, N., Dogan, Z.,2005. The effects of different irrigation regimes oncucumber (Cucumis sativus L.) yield and yield characteristicsunder open field conditions. Agric. Water Manage. 73 (3),173–191.
Sinclair, T.R., Tanner, C.B., Bennett, J.M., 1984. Water-useefficiency in crop production. BioScience 34, 36–40.
Vasco, R., 2003. El cultivo de pepino en Almerıa. In: Cajamar(Caja Rural Intermediterranea), Instituto de Estudios deCajamar (Eds.), Tecnicas de produccion de frutas yhortalizas en los cultivos protegidos, vol. 2. Cajamar,Almerıa, Spain, pp. 692–722.
Wittwer, S.H., Castilla, N., 1995. Protected cultivation ofhorticultural crops worldwide. HortTechnology 3, 6–19.