Embed Size (px)
Citation preview
Analysis of maize canopy development under water stressand incorporation into the ADEL-Maize model
Youhong SongA, Colin BirchA,C and Jim HananB,D
AThe University of Queensland, School of Land, Crop and Food Sciences, Gatton, Qld 4343, Australia.BThe University of Queensland, Centre for Biological Information Technology, Brisbane, Qld 4072, Australia.CPresent address: The University of Tasmania, Cradle Coast Campus, Burnie, Tas. 7320, Australia.DCorresponding author. Email: [email protected]
This paper originates from a presentation at the 5th International Workshop on Functional–Structural Plant Models,Napier, New Zealand, November 2007.
Abstract. Substantial progress inmodelling crop architecture has beenmade under optimalwatering conditions; however,crop production is often exposed to water stress. In this research, we develop methods for implementing the simulation ofmaize (ZeamaysL.) canopy architectural development underwater stress using data fromamaizefield trial in 2006–07.Dataof leaf number, leaf and internode extension were collected using non-destructive and destructive sampling at 2–3 dayintervals. Water stress reduced the extension rate of organs and, therefore, their final length, the reduction being greater asseverity of water stress increased. The duration of extension of organs in most phytomers was not significantly affected bywater stress. Also, the rate of extension during the linear phase responded linearly to fraction of extractable soil water. Anexisting 3-D architectural model ADEL-Maize was revised using relationships developed in this study to better incorporateeffects of water stress on organ extension and production. Simulated canopy production under three water regimes wasvalidated by comparing predicted final leaf and internode length, plant height and leaf area to independent observations. Theanalysis and simulation showed thatmaize organ extension andfinal length under water stress can be adequately representedby simple linear patterns that are easily integrated into models.
Additional keywords: crop architecture, linear extension, Zea mays.
Introduction
Plant architecture and its kinetics influence light interception(Maddonni and Otegui 1996; Pommel et al. 2001) and cropadaptation to the abiotic environments (Maddonni and Otegui1996; Dingkuhn et al. 2006; Manschadi et al. 2006). Variousmethods for describing and modelling plant architecture havebeen developed in the past two decades. Recently, there has beenwidespread interest in developing crop and plant architecturemodels to enrich their functional role and improve the ability toanalyse crop productivity in specific environments (Hanan andHearn 2003; Tardieu 2003; Yan et al. 2004; Fournier et al. 2005;Guo et al. 2006; Luquet et al. 2006; Evers et al. 2007). Substantialprogress in improving architectural resolution of aerial plant partsby quantifying internode and leaf kinetics has been achieved(Morrison et al. 1994; Robertson 1994; Fournier and Andrieu1998, 2000; Birch et al. 2002, 2007). Further, architecturalmodelling facilitates the introduction of functionality at thelevel of individual organs to produce functional–structuralmodels (Fournier and Andrieu 1999; Birch et al. 2007; Everset al. 2007; Luquet et al. 2007).
Maize (Zea mays L.) growth and development is oftensubjected to water stress in areas of seasonal or transient water
limitation (NeSmith and Ritchie 1992; Abrecht and Carberry1993;Granier andTardieu 1999; Stone et al. 2001; Farré and Faci2006).Water stress during the vegetative stage limits cell divisionand expansion (Granier and Tardieu 1999; Reymond et al. 2003),and, thus, reduces stem elongation and leaf area growth(Robertson 1994; Stone et al. 2001). However, water stresseffects have seldom been taken into account in existing plantarchitectural or functional-structural models. Introducing theability to model the effects of water stress to these models willenhance the application of the models by providing capacity toassess specific aspects of crop response to water deficit.
ADEL-Maize has beendeveloped to provide a robust platformto simulate maize 3-D canopy architectural developmentdependant on abiotic environments (e.g. temperature, light)(Fournier and Andrieu 1999; Pommel et al. 2001). Apreliminary study of the effects of water stress on maizecanopy development involved revising the ADEL-Maizemodel to include cultivar-specific parameters such as leafnumber, leaf appearance rate and leaf dimensions underdiffering water regimes (Birch et al. 2008a). However, thesimulations of plant height and plant leaf area dynamics weresubstantially lower than observed data under either fully irrigated
CSIRO PUBLISHING
www.publish.csiro.au/journals/fpb Functional Plant Biology, 2008, 35, 925–935
� CSIRO 2008 10.1071/FP08055 1445-4408/08/100925
or rainfed conditions, though final plant height and total leafarea were satisfactory. Possible explanations for the under-prediction of plant height and leaf area growth were exploredby these authors, who proposed that the effects of water stress onrates of leaf and internode extension should be examined underwater stress conditions (Birch et al. 2008a). Therefore, theobjectives of this paper are to: (i) examine the effects of waterstress on kinetics of individual organs; (ii) establish responsefunctions of organ extension to water stress; and (iii) revise theexisting three-dimensional architectural model ADEL-Maize tosimulate crop architectural development under differing waterregimes.
Materials and methodsField trials
Datasets from field trials conducted at Gatton, Australia, in2003–04 and 2006–07 were used. The experimental sites werelocated on the University of Queensland Gatton Campus(Latitude 27�340S, longitude 152�200E) using a moderatelyfertile Typic Chromustert soil (Vertosol, Lawes series soil(Schafer et al. 1986)) which has 195mm plant available watercontent (PAWC) to 1.8m (Dalgleish and Foale 1998),representing conditions that are favourable for rainfed maize(Zea mays L.) production in north-eastern Australia (Birchet al. 2008b). Detailed data on hourly average and dailymaximum and minimum air temperatures, vapour pressuredeficit, incident radiation, rainfall and evaporation, soiltemperature at 5 and 1 cm deep, 5 cm above ground, andhourly average temperatures at the plant apex until the apexwas 40 cm above ground were collected (as in Birch et al. 2002).
2006–07 experiment
Cultural conditionsTwo replicates of three water regimes designed to induce
differing levels of water stress were used: (i) RF, a fully rainfedtreatment that relied on natural rainfall andwater stored in the soilprofile at sowing for its water supply; (ii) IRF, irrigated until the12th leaf, numbered acropetally, was fully expanded, (whichoccurred 49 days after sowing) followed by reliance on rainfall;and (iii) FI, fully irrigated from sowing to completion of canopyproduction as control treatment. A pre-sowing irrigation tosupplement rainfall was used to ensure that the soil was fullywet to 1.8m (the expected limit of root exploration by maize(Madhiyazhagan 2005)) before sowing. Subsequent irrigationwas implemented by trickle application using T-tape at2.0mmh�1.
Individual plots were 20m long� 9m wide (12 rowswith plants 0.75m apart). Maize (cultivar Pioneer 31H50)was sown on 6 September 2006 to achieve an establishedpopulation density of 60 000 plants ha�1. Seeds had beenchemically treated by Pioneer Hi-Bred Australia Pty Ltd(Toowoomba, Queensland, Australia) to prevent damage frominsects and soil borne diseases, and 150 kgNha�1 as urea wasincorporated into the soil before planting to prevent nitrogenstress. Other nutrients were in adequate supply according to soilanalysis results and local standards. Weeds and insect pestswere rigorously controlled.
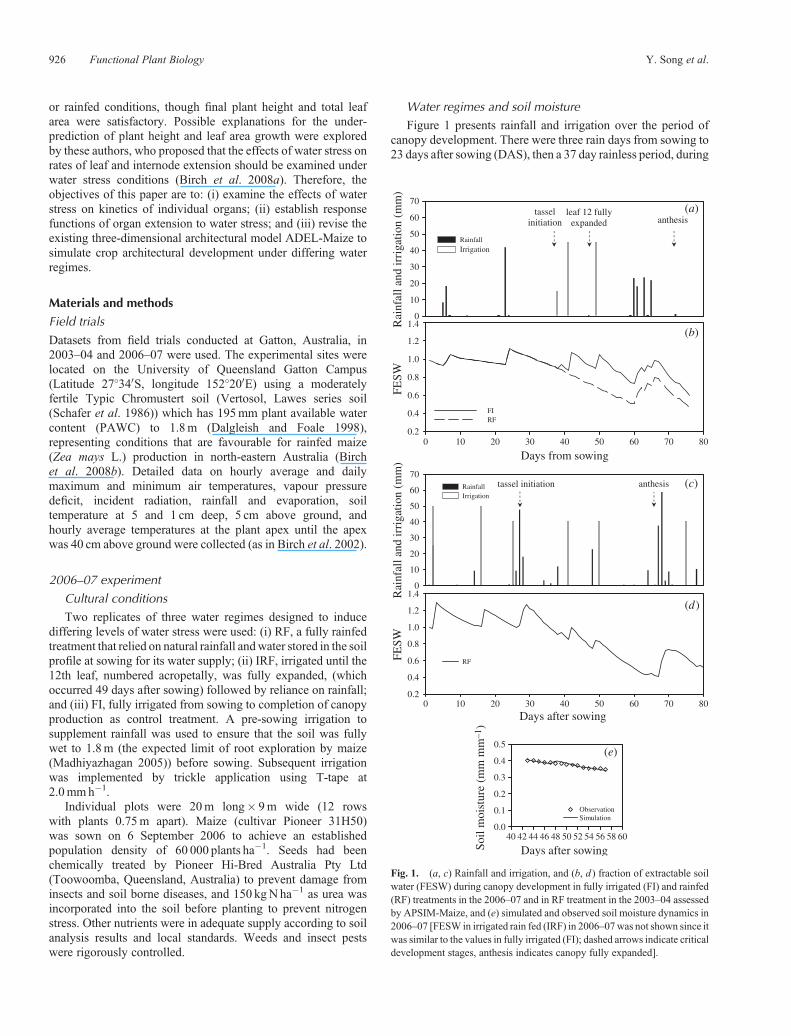
Water regimes and soil moistureFigure 1 presents rainfall and irrigation over the period of
canopy development. There were three rain days from sowing to23 days after sowing (DAS), then a 37 day rainless period, during
Rai
nfal
l and
irri
gati
on (
mm
)
0
10
20
30
40
50
60
70
Rainfall
Irrigation
FE
SW
0.2
0.4
0.6
0.8
1.0
1.2
1.4
FIRF
(a)
(b)
leaf 12 fully expanded anthesis
tassel initiation
Rai
nfal
l and
irri
gati
on (
mm
)
0
10
20
30
40
50
60
70Rainfall Irrigation
Days after sowing0 10 20 30 40 50 60 70 80
Days from sowing0 10 20 30 40 50 60 70 80
FE
SW
0.2
0.4
0.6
0.8
1.0
1.2
1.4
RF
0.0
0.1
0.2
0.3
0.4
0.5
40 42 44 46 48 50 52 54 56 58 60
Days after sowingSoil
moi
stur
e (m
m m
m–1
)
ObservationSimulation
anthesis tassel initiation (c)
(d)
(e)
Fig. 1. (a, c) Rainfall and irrigation, and (b, d ) fraction of extractable soilwater (FESW) during canopy development in fully irrigated (FI) and rainfed(RF) treatments in the 2006–07 and in RF treatment in the 2003–04 assessedby APSIM-Maize, and (e) simulated and observed soil moisture dynamics in2006–07 [FESW in irrigated rain fed (IRF) in 2006–07was not shown since itwas similar to the values in fully irrigated (FI); dashed arrows indicate criticaldevelopment stages, anthesis indicates canopy fully expanded].
926 Functional Plant Biology Y. Song et al.
which irrigation was applied to IRF (38 and 41 DAS) and FI (38,41 days and 49 DAS) treatments (the irrigation at 38 DAS wasinterrupted by equipment failure and completed by irrigation at41 days). Sufficient water was applied to return the soil profile tofull plant available water content (PAWC) from an allowabledeficit not exceeding 45mm, estimated from pan evaporation atLawesMetrological Station, crop factors and reference cropwateruse (Batten et al. 2003). No further irrigation was necessarybefore completion of canopy expansion as substantial rain fellfrom61days after sowing (Fig. 1a). The lackof rainfall from23 to60 days after sowing imposed water stress in RF treatments. Dataon soil water content at 15 cm depth in RF and IRF weremonitored using a SM200 sensor (Delta-T Devices Ltd,Cambridge, UK) and a T-Bug data logger (MeasurementEngineering Australia, Magill, South Australia, Australia),which assess water content (%) of soil using a capacitanceprobe. However, as the instrument was measuring soil watercontent at 15 cm, and plants had access to water to 1.8m as inMadhiyazhagan (2005), estimates of water content deeper in theprofile were made using the APSIM crop modelling system(Keating et al. 2003), configured for maize (APSRU 2003). Itwas parameterised to produce close agreement with observedphenology, leaf area and biomass to the end of canopy productionand used to simulate water supply through the profile. Theprediction of root penetration by maize has been validated forsimilar soils (APSRU 2003). Also prediction of water extractionby APSIM has been validated for a range of soils including theVertosol usedhere (APSRU2003;Madhiyazhagan2005).As soilmoisture was not collected because of a failure of the instrumentfrom 58 to 64 days after sowing, this gap was also filled in usingoutput from APSIM-Maize. There was a close agreementbetween soil water information measured by the soil watersensor (T-Bug) and predicted by APSIM for the 15–30 cmdepth interval in RF (in which the T-Bug sensor was located)giving confidence that the predictions of soil water by APSIMwere sound (Fig. 1e). APSIM-Maize provided the fraction ofplant extractable water (FESW) defined as plant available waterdivided by plant available water capacity (Craufurd et al. 2006) atvarious depth intervals and, as used here, for the profile as awhole(Fig. 1b, d).
Plant sampling and data collectionPlants were sampled from the inner eight rows of each plot,
allowing a 1.5m guard area at the end of each plot. Ten plants ineach treatment, representing the median number of leaves andfully expanded leaves on30 randomly selectedplants in eachplot,were selected at the four fully expanded leaf stage, and tagged asreferenceplants tomonitor plant growthanddevelopmentbynon-destructive sampling. Leaves at positions five and 10 on theseplants were also tagged to avoid errors in leaf identification aftersenescence of lower leaves commenced. The median number oftotal and fully expanded leaf numbers on these reference plantswas used to guide selection of plants for destructive sampling at2–3 days intervals. Sufficient guard area was maintained aroundthe reference plants and where destructive sampling hadoccurred to avoid edge effects. At each sampling time,individual plants were dissected to collect data on: number offully expanded and expanding leaves, visible and total length oflamina and sheath, internode length, and width of lamina at the
widest point. A stereomicroscope fitted with appropriate scalingrule was used to measure the length of very small organs earlyin their extension. When water stress induced changes ineffective lamina width because of leaf curling, the effectivewidth of the leaf was also measured at the widest point.Panicle initiation was recorded when the apex inphotomicrographs of maize apices had reached an averagerating of two using the scale of Moncur (1981). Anthesis wasrecorded when 50% of reference plants had 25–50% of the tasselshowing extruded anther sacks. Completion of leafexpansion was recorded when the ligule had appeared on flagleaves of 50% of reference plants.
2003–04 experiments
A field experiment was conducted in 2003–04 (Birch et al.2008b), and the dataset was used to independently assess theperformance of the revisions made to an architectural modelusing data from the 2006–07 experiment. Briefly, the sitecharacteristics and cultural conditions were similar, but theplant population used was 70 000 plants ha�1. Environmental,soil and plant data had been collected in a similar manner tothe 2006–07 experiment. Figure 1c presents rainfall andirrigation during canopy development in 2003–04. There waslack of rainfall for 15 days during late canopy development(Fig. 1c). Again, FESW simulated by APSIM-Maize is used(Fig. 1d).
Modelling studies
A key process in modelling architectural development iscapturing organ extension, which is sensitive to water stress(Robertson 1994; Granier and Tardieu 1999; Tardieu et al.2005). Leaf extension in ADEL-Maize model is concernedwith the visible part and represented in three phases (a quasi-exponential growth, linear growth and decreasing growth rate)parameterised by Fournier and Andrieu (1998), and internodeextension is quantified with average extension rate multiplied byduration (Fournier and Andrieu 1999). Subsequently, a four-phase model was developed by Fournier and Andrieu (2000),Birch et al. (2002) and Birch et al. (2007) to quantify organextension. These phases are: Phase I, during which elongation isexponential; Phase II –which is short and duringwhich extensionrate increases rapidly; Phase III – extension rate is essentiallyconstant andorgan length increases linearly; andPhase IV, duringwhich extension rate decreases as the organ approaches its finallength. Final leaf and internode length is found to be closelyrelated to linear extension rate (Phase III) (Fournier and Andrieu2000;Birch et al. 2002, 2007). Therefore, the linear extension ratewas able to be used to predict final organ length. To improve thesimulation, the procedures for modelling leaf and internodeextension were replaced by an effective linear representationbased on the four-phase model with three parameters i.e. linearextension onset (LEO), linear extension rate (LER) and effectivelinear extension duration (LED) (Birch et al. 2002). As a result,leaf and internode extension are now predicted using a similarapproach and comparable parameters. Data from the 2006–07experiment were used to:
(i) introduce functions for LEO and LER of leaves for thecultivar Pioneer 31H50 under FI conditions;
Architectural modelling of maize under water stress Functional Plant Biology 927
(ii) revise functions for LEO and LER of internodes under FIconditions;
(iii) replace leaf and internode final length according tomeasurement for experimental cultivar under FIconditions; and
(iv) insert equations relating difference in LER to averagedifference in FESW against water stress during organextension.
Functions for LEO and LED for leaves and internodes underRF conditions were retained in this iteration of the model as thesewere only affected slightly and only in some organs by moderatewater stress in the present study.Nomodificationwasmade to theleaf spatial parameters (e.g. leaf angle, leaf curvature) forproducing visualisations.
The revised model was then used to calculate fitted values forfinal length of leaf and internode for each phytomer, total stemheight and plant leaf area to present a visualisation of the FI andRF treatments in the 2006–07 experiment. Its ability to simulatewater stress was then tested on independent data for the IRFtreatment in the 2006–07 and RF treatments in the 2003–04experiment. There was a small difference in plant populationbetween the 2 years; however, ADEL-Maize has been shown topredict canopyproduction satisfactorily at plant populations closeto those used here, but not at greater than 15 plantsm�2 (Fournierand Andrieu 1999).
Data analysis and presentation
Rate of linear extension (LER) of individual organs wasobtained by regressing individual leaf and internode lengthduring the linear phase of organ extension (Phase III) on
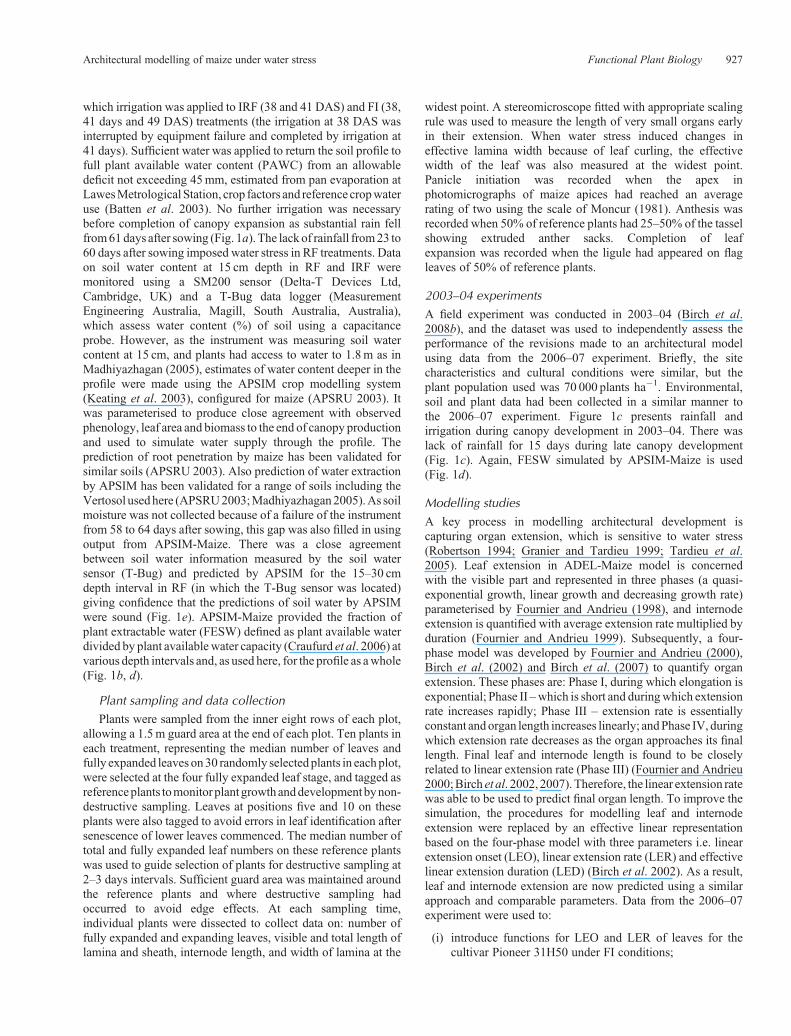
thermal time after emergence, and the onset of linear extension(LEO) and the end of linear extension (LEE) of individualleaves and internodes were determined by extending the linearphase to intersect with the horizontally parallel lines y= 0 andy= final length (Fournier and Andrieu 2000; Birch et al. 2002,2007; Andrieu et al. 2006). LER and LEO are presented for theFI treatment for leaves (phytomers� 5) and internodes(phytomers� 6) (Fig. 2). Since the first five internodes arevery short, modelling of extension of those internodes was notnecessary. LER and LEO were related to phytomer positionusing piecewise linear, linear and curvilinear regressions(Eqns 1–5 below).
As there are similarities in the various groups of phytomers,representative lower, middle and upper phytomers were used inpresenting the impact of water stress on extension of leaves andinternodes against thermal time from emergence. The effect ofreducedwater availability on LERwas assessed by regressing thedifference of LER (LER(FI) –LER(RF)) and the average differencein FESW (FESW(FI) – (FESW(RF)) over the period of linearextension of specific organs.
Statistical analyses were carried out using Microsoft Excel2003 (Microsoft Inc., Seattle, WA, USA) and SigmaPlot v8(Systat Software Inc., Richmond, CA, USA), and significanceis reported atP< 0.05, and95%confidence intervals are shownongraphs, where relevant.
Results
Leaf and internode extension
Leaf (visible part) or internode extension rate was related tophytomer position (Fig. 2a, b; Eqns 1–5). For lower and upper
0.00
0.10
0.20
0.30
0.40
0.50
0.60
Phytomer position
LE
R (
cm º
C–1
d–1)
LE
R (
cm º
C–1
d–1)
0.00
0.04
0.08
0.12
0.16
Phytomer position
y = 33.775x – 86.817
R2 = 0.99**
0
200
400
600
800
0 2 4 6 8 10 12 14 16 18 20
4 6 8 10 12 14 16 18 20 6 8 10 12 14 16 18 20
0 2 4 6 8 10 12 14 16 18 20
Phytomer position
LE
O (
ºCd)
y = 35.627x + 60.163
R2 = 0.99**
0
200
400
600
800
Phytomer position
LE
O (
ºCd)
(a) (b)
(c) (d)
Fig. 2. Linear extension rate (LER) variation of (a) leaf and (b) internode with its position, and linear extensiononset (LEO)of (c) leaf and (d ) internode linearly related tophytomerpositionunderoptimalwateringofmaize in the2006–07 experiment (**, significant at 0.01 level).
928 Functional Plant Biology Y. Song et al.
leaves, LER is linearly related to phytomer position (Eqns 1, 3)and for phytomers 8–13, is constant (0.0521 cm �C�1 d�1, Eqn 2).For internodes, LER is curvilinearly related to position forphytomers 6–12 (Eqn 4), and LER is linearly related toposition for phytomers 13–18 (Eqn 5), and LER is notconsidered for internodes 1–5 as these are very short. LEO islinearly related to phytomer position (Fig. 1c, d). For the last threeleaves and internodes, LER was not calculated as there were notenough data points.
LERleaf ¼ 0:0652�phytomer þ 0:0154;
1� phytomer < 8; R2 ¼ 0:96; (1)
LERleaf ¼ 0:0521; 8� phytomer < 14; (2)
LERleaf ¼ �0:0398�phytomer þ 1:0641;
14� phytomer < 19; R2 ¼ 0:98; (3)
8>>>>>><
>>>>>>:
LERintermode ¼ �0:00252�phytomer2 þ 0:0622�phytomer
� 0:2593; 6� phytomer < 13; R2 ¼ 0:98; (4)
LERintermode ¼ �0:009�phytomer þ 0:2481;
13� phytomer < 19; R2 ¼ 0:98 (5)
8>>><
>>>:
In the formulae, LER indicates linear extension rate forleaf or internode, phytomer denotes the position of leaf orinternode.
Effect of water stress on leaf and internode extensionand final length
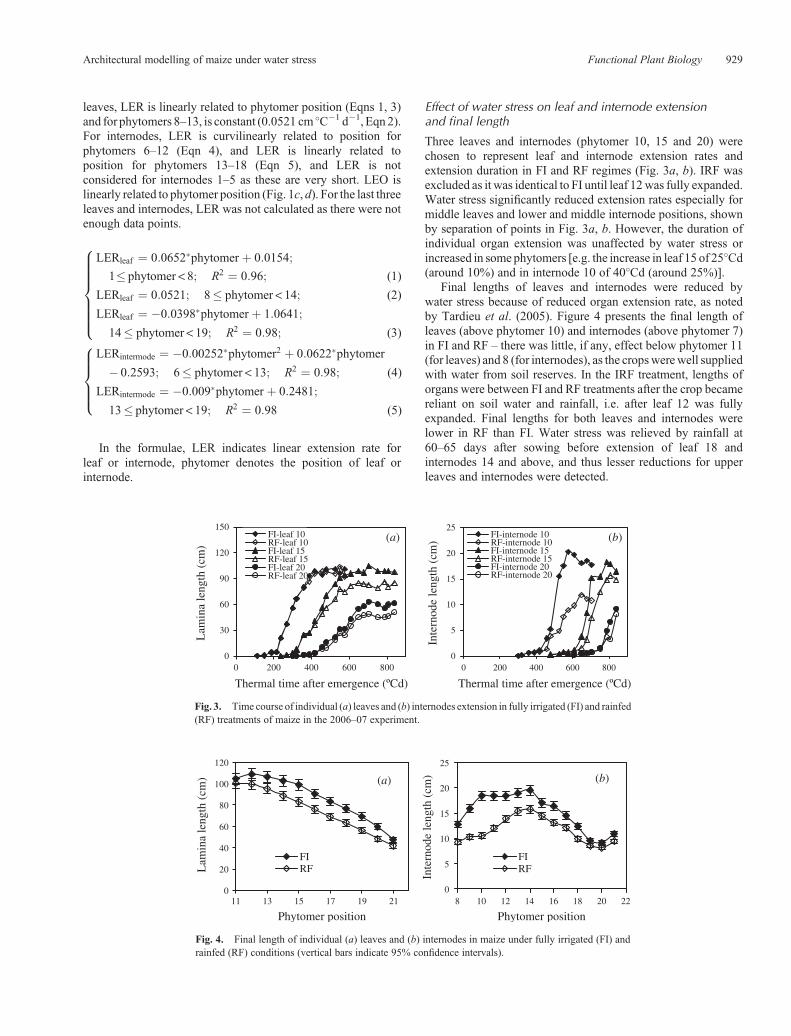
Three leaves and internodes (phytomer 10, 15 and 20) werechosen to represent leaf and internode extension rates andextension duration in FI and RF regimes (Fig. 3a, b). IRF wasexcluded as it was identical to FI until leaf 12was fully expanded.Water stress significantly reduced extension rates especially formiddle leaves and lower and middle internode positions, shownby separation of points in Fig. 3a, b. However, the duration ofindividual organ extension was unaffected by water stress orincreased in some phytomers [e.g. the increase in leaf 15 of 25�Cd(around 10%) and in internode 10 of 40�Cd (around 25%)].
Final lengths of leaves and internodes were reduced bywater stress because of reduced organ extension rate, as notedby Tardieu et al. (2005). Figure 4 presents the final length ofleaves (above phytomer 10) and internodes (above phytomer 7)in FI and RF – there was little, if any, effect below phytomer 11(for leaves) and 8 (for internodes), as the cropswerewell suppliedwith water from soil reserves. In the IRF treatment, lengths oforgans were between FI and RF treatments after the crop becamereliant on soil water and rainfall, i.e. after leaf 12 was fullyexpanded. Final lengths for both leaves and internodes werelower in RF than FI. Water stress was relieved by rainfall at60–65 days after sowing before extension of leaf 18 andinternodes 14 and above, and thus lesser reductions for upperleaves and internodes were detected.
0
30
60
90
120
150
0 200 400 600 800
Thermal time after emergence (ºCd)
(a) (b)
Lam
ina
leng
th (
cm)
FI-leaf 10RF-leaf 10FI-leaf 15RF-leaf 15FI-leaf 20RF-leaf 20
0
5
10
15
20
25
0 200 400 600 800
Thermal time after emergence (ºCd)
Inte
rnod
e le
ngth
(cm
)
FI-internode 10RF-internode 10FI-internode 15RF-internode 15FI-internode 20RF-internode 20
Fig. 3. Time course of individual (a) leaves and (b) internodes extension in fully irrigated (FI) and rainfed(RF) treatments of maize in the 2006–07 experiment.
0
20
40
60
80
100
120
11 13 15 17 19 21 8 10 12 14 16 18 20 22
Phytomer position
(a) (b)
Lam
ina
leng
th (
cm)
FIRF
0
5
10
15
20
25
Phytomer position
Inte
rnod
e le
ngth
(cm
)
FIRF
Fig. 4. Final length of individual (a) leaves and (b) internodes in maize under fully irrigated (FI) andrainfed (RF) conditions (vertical bars indicate 95% confidence intervals).
Architectural modelling of maize under water stress Functional Plant Biology 929
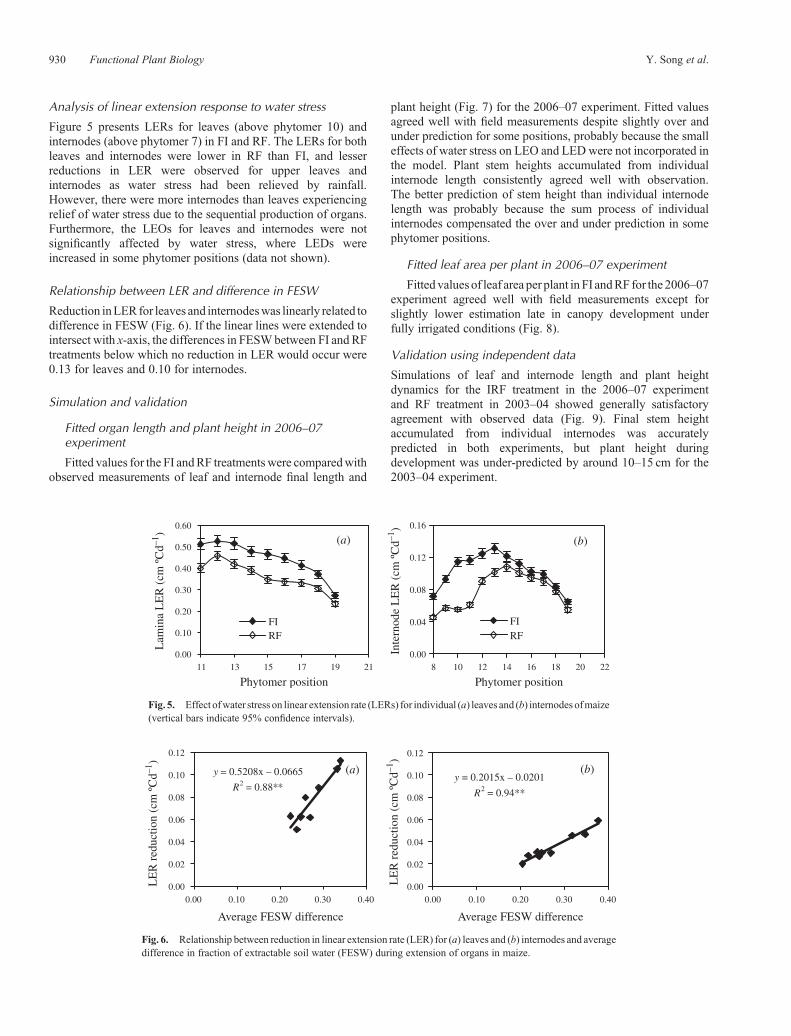
Analysis of linear extension response to water stress
Figure 5 presents LERs for leaves (above phytomer 10) andinternodes (above phytomer 7) in FI and RF. The LERs for bothleaves and internodes were lower in RF than FI, and lesserreductions in LER were observed for upper leaves andinternodes as water stress had been relieved by rainfall.However, there were more internodes than leaves experiencingrelief of water stress due to the sequential production of organs.Furthermore, the LEOs for leaves and internodes were notsignificantly affected by water stress, where LEDs wereincreased in some phytomer positions (data not shown).
Relationship between LER and difference in FESW
Reduction inLERfor leaves and internodeswas linearly related todifference in FESW (Fig. 6). If the linear lines were extended tointersect with x-axis, the differences in FESWbetween FI and RFtreatments below which no reduction in LER would occur were0.13 for leaves and 0.10 for internodes.
Simulation and validation
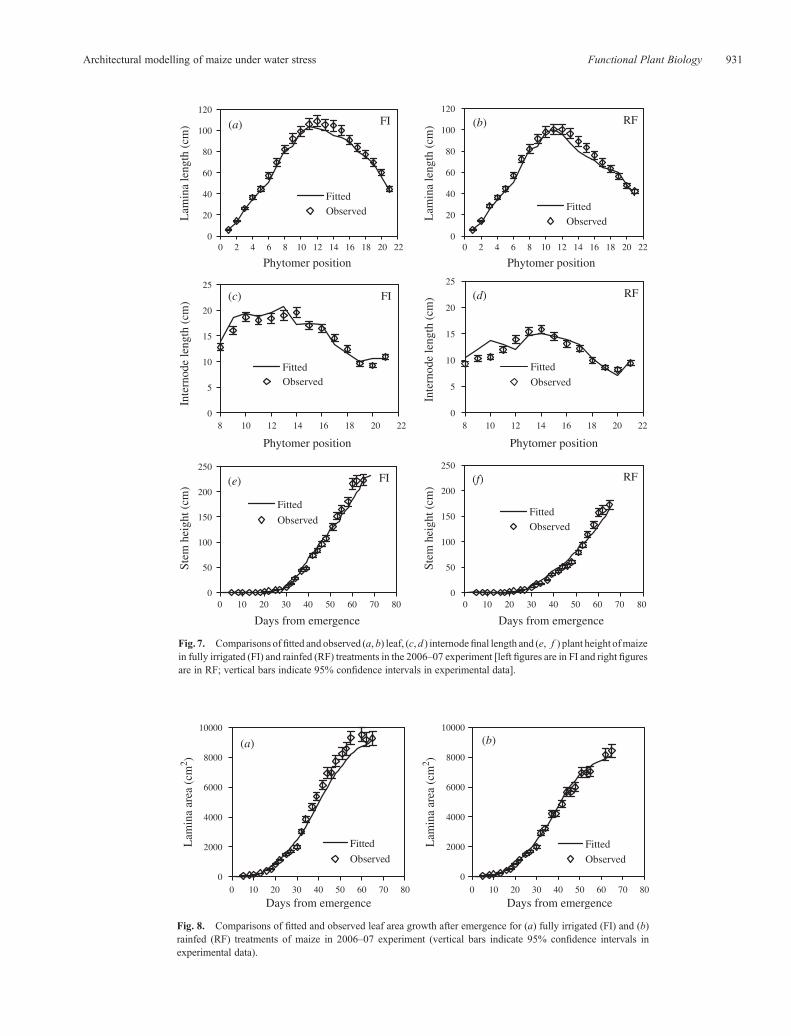
Fitted organ length and plant height in 2006–07experiment
Fitted values for the FI andRF treatments were comparedwithobserved measurements of leaf and internode final length and
plant height (Fig. 7) for the 2006–07 experiment. Fitted valuesagreed well with field measurements despite slightly over andunder prediction for some positions, probably because the smalleffects of water stress on LEO and LEDwere not incorporated inthe model. Plant stem heights accumulated from individualinternode length consistently agreed well with observation.The better prediction of stem height than individual internodelength was probably because the sum process of individualinternodes compensated the over and under prediction in somephytomer positions.
Fitted leaf area per plant in 2006–07 experiment
Fitted values of leaf area per plant in FI andRF for the 2006–07experiment agreed well with field measurements except forslightly lower estimation late in canopy development underfully irrigated conditions (Fig. 8).
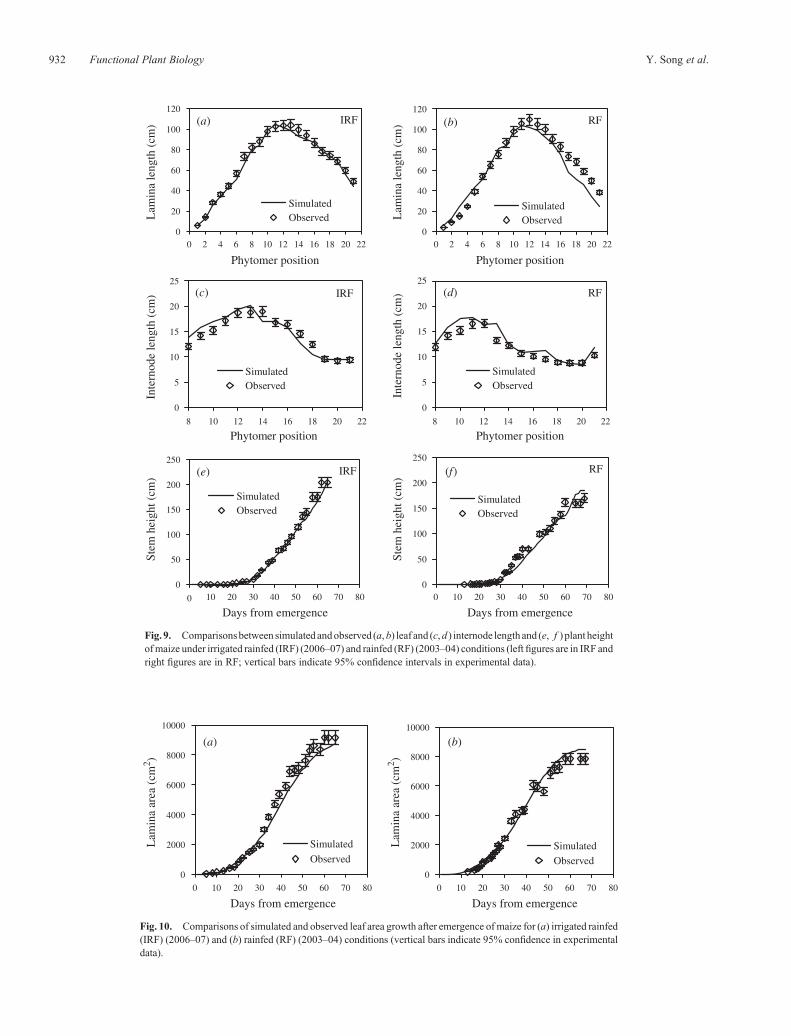
Validation using independent data
Simulations of leaf and internode length and plant heightdynamics for the IRF treatment in the 2006–07 experimentand RF treatment in 2003–04 showed generally satisfactoryagreement with observed data (Fig. 9). Final stem heightaccumulated from individual internodes was accuratelypredicted in both experiments, but plant height duringdevelopment was under-predicted by around 10–15 cm for the2003–04 experiment.
(a) (b)
0.00
0.10
0.20
0.30
0.40
0.50
0.60
Phytomer position
Lam
ina
LE
R (
cm º
Cd–1
)
FIRF
0.00
0.04
0.08
0.12
0.16
Phytomer position
Inte
rnod
e L
ER
(cm
ºC
d–1)
FIRF
11 13 15 17 19 21 8 10 12 14 16 18 20 22
Fig. 5. Effect ofwater stress on linear extension rate (LERs) for individual (a) leaves and (b) internodes ofmaize(vertical bars indicate 95% confidence intervals).
(a) (b)y = 0.5208x – 0.0665
R2 = 0.88**
0.00
0.02
0.04
0.06
0.08
0.10
0.12
0.00 0.10 0.20 0.30 0.40 0.00 0.10 0.20 0.30 0.40
Average FESW difference
LE
R r
educ
tion
(cm
ºC
d–1)
y = 0.2015x – 0.0201
R2 = 0.94**
0.00
0.02
0.04
0.06
0.08
0.10
0.12
Average FESW difference
LE
R r
educ
tion
(cm
ºC
d–1)
Fig. 6. Relationship between reduction in linear extension rate (LER) for (a) leaves and (b) internodes and averagedifference in fraction of extractable soil water (FESW) during extension of organs in maize.
930 Functional Plant Biology Y. Song et al.
FI
0
20
40
60
80
100
120
Phytomer position
(a)
(e)
(b)
(f)
(c) (d)
Lam
ina
leng
th (
cm)
FittedObserved
RF
0
20
40
60
80
100
120
Phytomer position
Lam
ina
leng
th (
cm)
FittedObserved
FI
0
5
10
15
20
25
Phytomer position
Inte
rnod
e le
ngth
(cm
)
FittedObserved
RF
0
5
10
15
20
25
Phytomer positionIn
tern
ode
leng
th (
cm)
Fitted
Observed
FI
0
50
100
150
200
250
0 10 20 30 40 50 60 70 80 0 10 20 30 40 50 60 70 80
Days from emergence
Stem
hei
ght (
cm)
Fitted
Observed
RF
0
50
100
150
200
250
Days from emergence
Stem
hei
ght (
cm)
FittedObserved
8 10 12 14 16 18 20 22
86420 10 12 14 16 18 20 2286420 10 12 14 16 18 20 22
8 10 12 14 16 18 20 22
Fig. 7. Comparisons offitted and observed (a, b) leaf, (c,d ) internodefinal length and (e, f ) plant height ofmaizein fully irrigated (FI) and rainfed (RF) treatments in the 2006–07 experiment [left figures are in FI and right figuresare in RF; vertical bars indicate 95% confidence intervals in experimental data].
0
2000
4000
6000
8000
10000
0 10 20 30 40 50 60 70 80 0 10 20 30 40 50 60 70 80
Days from emergence
(a) (b)
Lam
ina
area
(cm
2 )
Lam
ina
area
(cm
2 )
Fitted
Observed
0
2000
4000
6000
8000
10000
Days from emergence
Fitted
Observed
Fig. 8. Comparisons of fitted and observed leaf area growth after emergence for (a) fully irrigated (FI) and (b)rainfed (RF) treatments of maize in 2006–07 experiment (vertical bars indicate 95% confidence intervals inexperimental data).
Architectural modelling of maize under water stress Functional Plant Biology 931
(a) (b)
(c) (d)
(e) (f)
IRF
0
20
40
60
80
100
120
Phytomer position
Lam
ina
leng
th (
cm)
SimulatedObserved
RF
0
20
40
60
80
100
120
Phytomer position
Lam
ina
leng
th (
cm)
SimulatedObserved
IRF
0
5
10
15
20
25
Phytomer position
Inte
rnod
e le
ngth
(cm
)
SimulatedObserved
RF
0
5
10
15
20
25
Phytomer position
Inte
rnod
e le
ngth
(cm
)
SimulatedObserved
IRF
0
50
100
150
200
250
Days from emergence
Stem
hei
ght (
cm)
SimulatedObserved
RF
0
50
100
150
200
250
Days from emergence
Stem
hei
ght (
cm)
SimulatedObserved
8 10 12 14 16 18 20 228 10 12 14 16 18 20 22
0 10 20 30 40 50 60 70 800 10 20 30 40 50 60 70 80
86420 10 12 14 16 18 20 22 86420 10 12 14 16 18 20 22
Fig. 9. Comparisonsbetween simulated andobserved (a,b) leaf and (c,d ) internode length and (e, f ) plant heightofmaize under irrigated rainfed (IRF) (2006–07) and rainfed (RF) (2003–04) conditions (leftfigures are in IRF andright figures are in RF; vertical bars indicate 95% confidence intervals in experimental data).
0
2000
4000
6000
8000
10000
(a) (b)
Lam
ina
area
(cm
2 )
Lam
ina
area
(cm
2 )
Simulated
Observed
0
2000
4000
6000
8000
10000
SimulatedObserved
Days from emergence0 10 20 30 40 50 60 70 80
Days from emergence0 10 20 30 40 50 60 70 80
Fig. 10. Comparisons of simulated and observed leaf area growth after emergence of maize for (a) irrigated rainfed(IRF) (2006–07) and (b) rainfed (RF) (2003–04) conditions (vertical bars indicate 95% confidence in experimentaldata).
932 Functional Plant Biology Y. Song et al.
Leaf area per plant in independent datasets
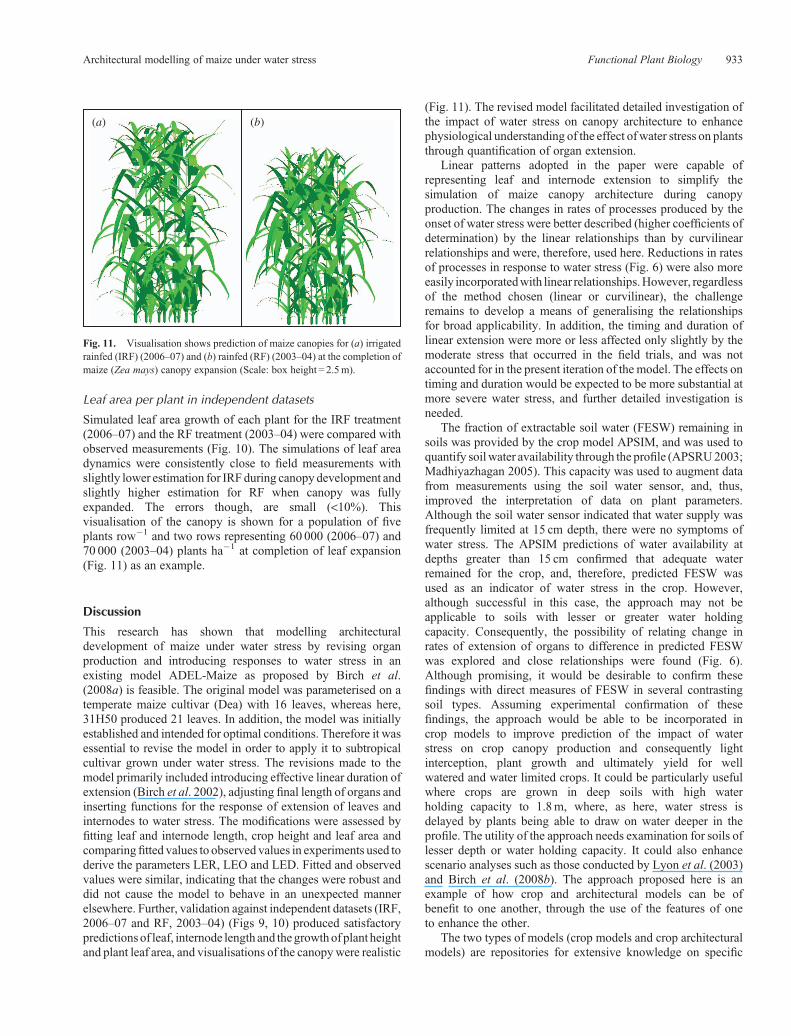
Simulated leaf area growth of each plant for the IRF treatment(2006–07) and the RF treatment (2003–04) were compared withobserved measurements (Fig. 10). The simulations of leaf areadynamics were consistently close to field measurements withslightly lower estimation for IRFduring canopy development andslightly higher estimation for RF when canopy was fullyexpanded. The errors though, are small (<10%). Thisvisualisation of the canopy is shown for a population of fiveplants row�1 and two rows representing 60 000 (2006–07) and70 000 (2003–04) plants ha�1 at completion of leaf expansion(Fig. 11) as an example.
Discussion
This research has shown that modelling architecturaldevelopment of maize under water stress by revising organproduction and introducing responses to water stress in anexisting model ADEL-Maize as proposed by Birch et al.(2008a) is feasible. The original model was parameterised on atemperate maize cultivar (Dea) with 16 leaves, whereas here,31H50 produced 21 leaves. In addition, the model was initiallyestablished and intended for optimal conditions. Therefore it wasessential to revise the model in order to apply it to subtropicalcultivar grown under water stress. The revisions made to themodel primarily included introducing effective linear duration ofextension (Birch et al. 2002), adjusting final length of organs andinserting functions for the response of extension of leaves andinternodes to water stress. The modifications were assessed byfitting leaf and internode length, crop height and leaf area andcomparingfitted values to observed values in experiments used toderive the parameters LER, LEO and LED. Fitted and observedvalues were similar, indicating that the changes were robust anddid not cause the model to behave in an unexpected mannerelsewhere. Further, validation against independent datasets (IRF,2006–07 and RF, 2003–04) (Figs 9, 10) produced satisfactorypredictions of leaf, internode length and the growthof plant heightand plant leaf area, and visualisations of the canopywere realistic
(Fig. 11). The revised model facilitated detailed investigation ofthe impact of water stress on canopy architecture to enhancephysiological understanding of the effect ofwater stress on plantsthrough quantification of organ extension.
Linear patterns adopted in the paper were capable ofrepresenting leaf and internode extension to simplify thesimulation of maize canopy architecture during canopyproduction. The changes in rates of processes produced by theonset of water stress were better described (higher coefficients ofdetermination) by the linear relationships than by curvilinearrelationships and were, therefore, used here. Reductions in ratesof processes in response to water stress (Fig. 6) were also moreeasily incorporatedwith linear relationships.However, regardlessof the method chosen (linear or curvilinear), the challengeremains to develop a means of generalising the relationshipsfor broad applicability. In addition, the timing and duration oflinear extension were more or less affected only slightly by themoderate stress that occurred in the field trials, and was notaccounted for in the present iteration of the model. The effects ontiming and duration would be expected to be more substantial atmore severe water stress, and further detailed investigation isneeded.
The fraction of extractable soil water (FESW) remaining insoils was provided by the crop model APSIM, and was used toquantify soilwater availability through the profile (APSRU2003;Madhiyazhagan 2005). This capacity was used to augment datafrom measurements using the soil water sensor, and, thus,improved the interpretation of data on plant parameters.Although the soil water sensor indicated that water supply wasfrequently limited at 15 cm depth, there were no symptoms ofwater stress. The APSIM predictions of water availability atdepths greater than 15 cm confirmed that adequate waterremained for the crop, and, therefore, predicted FESW wasused as an indicator of water stress in the crop. However,although successful in this case, the approach may not beapplicable to soils with lesser or greater water holdingcapacity. Consequently, the possibility of relating change inrates of extension of organs to difference in predicted FESWwas explored and close relationships were found (Fig. 6).Although promising, it would be desirable to confirm thesefindings with direct measures of FESW in several contrastingsoil types. Assuming experimental confirmation of thesefindings, the approach would be able to be incorporated incrop models to improve prediction of the impact of waterstress on crop canopy production and consequently lightinterception, plant growth and ultimately yield for wellwatered and water limited crops. It could be particularly usefulwhere crops are grown in deep soils with high waterholding capacity to 1.8m, where, as here, water stress isdelayed by plants being able to draw on water deeper in theprofile. The utility of the approach needs examination for soils oflesser depth or water holding capacity. It could also enhancescenario analyses such as those conducted by Lyon et al. (2003)and Birch et al. (2008b). The approach proposed here is anexample of how crop and architectural models can be ofbenefit to one another, through the use of the features of oneto enhance the other.
The two types of models (crop models and crop architecturalmodels) are repositories for extensive knowledge on specific
(a) (b)
Fig. 11. Visualisation shows prediction of maize canopies for (a) irrigatedrainfed (IRF) (2006–07) and (b) rainfed (RF) (2003–04) at the completion ofmaize (Zea mays) canopy expansion (Scale: box height = 2.5m).
Architectural modelling of maize under water stress Functional Plant Biology 933
aspects of crop growth and development and eco-physiologicalprocesses. In plant architectural models, remarkable progress hasbeen made recently in describing and modelling organogenesisprocesses at a level of detail not included in models based onindividual plants or crop canopies. By establishing connectionsbetween canopy-based crop models and the more recentlydeveloped crop architectural models, predictions from one canbe provided to the other, enhancing the utility of both. Forinstance, we produced soil moisture information from APSIM-Maize for architectural analysis in this paper. In future research,themodel developed herewill be used tomodel the effect ofwaterstress on light distribution and interception within the canopythrough connecting it to a light model (e.g. Cieslak et al. 2008).The combination will enable investigation of the interaction oflight environment and plant development and growth at the levelof individual organs under differing watering conditions. Thus,functional processes (e.g. photosynthesis, photomorphogenesis)will be able to be analysed. As an example, effects of water stresson the light extinction coefficient (k), used in calculating lightinterception and biomass production in conventional cropmodelling (Maddonni and Otegui 1996; Farré and Faci 2006),will be able to be analysed for a wide range of conditions ratherthan relying on adjustments for individual experiments.However, additional detailed data on the impact of water stresson parameters such as leaf angle and effective leaf width willalso be needed. These aspects will be examined using additionaldata from the experiments reported here and other experimentsthat employed a range of water stresses from fully watered (nostress) to severe stress (close to terminal as plant size increases).Further, architectural information on stem diameter, tasseldevelopment and root architecture under water-stressedconditions should be included in more comprehensivedevelopment of the model.
The progress reported here is related to field conditions inwhich moderate water stress occurred. However, more severewater stressmay alter the response, and further research is neededto assess the utility of the relationships presented here. It wouldalso be beneficial to be able to include the impact of relief ofwaterstress by rainfall or strategic irrigation during crop growth.Conceptually, this may be able to be achieved throughmodelling and experimental approaches utilising relationshipsbetween differences in rate of organ extension and FESWproposed here, with validation against new or existingindependent datasets.
Conclusion
Water stress reduced the rates of extension of leaves andinternodes of maize, the reduction was linearly related to waterstress, quantified as difference in fraction of plant extractable soilwater between non-limited (fully irrigated) and water stressedconditions. This study successfully implemented simulation ofarchitectural development in maize in a sub-tropical area underwater stress by incorporating relationships that describe theeffects of water stress on processes of organogenesis intoADEL-Maize. The revisions were principally concerned withenvironmental control of rates of processes of production andextension of organs. Use of the effective linear pattern in
extensions of laminae, sheaths and internodes simplifiedsimulation of organ extension and will facilitate study ofarchitectural plasticity in response to water stress.
Acknowledgements
The financial support of the University of Queensland for the research andpostdoctoral fellowship for the senior author is gratefully acknowledged. Weappreciate the Scientific Officers Mr Victor Robertson and Mr Ian Broad forassistance in2006–07field experiment andMrAlDoherty for assistance inuseof APSIM-Maize. Anonymous reviewers are also appreciated for theirvaluable comments.
References
Abrecht DG, Carberry PS (1993) The influence of water deficit prior to tasselinitiation onmaize growth, development and yield.Field Crops Research31, 55–69. doi: 10.1016/0378-4290(93)90050-W
AndrieuB,Hillier J, BirchC (2006)Onset of sheath extension and duration oflamina extension are major determinants of the response of maize laminalength to plant density. Annals of Botany 98, 1005–1016. doi: 10.1093/aob/mcl177
APSRU (2003) The APSIMMaizemodule. Agricultural Production SystemsResearch Unit, Toowoomba, Australia. Available at: http://www.apsim.info/apsim/Publish/apsimui/types.xml [Verified 10 September 2008]
BattenG,KatupitiyaA,Pratley J (2003) Irrigationmanagement. In ‘Principlesof field crop production’. 4th edn. (Ed. J Pratley) pp. 418–462. (OxfordUniversity Press: Melbourne)
Birch CJ, Andrieu B, Fournier C (2002) Dynamics of internode and stemelongation in three cultivars of maize. Agronomie 22, 511–524.doi: 10.1051/agro:2002030
Birch CJ, Andrieu B, Fournier C, Kroesen C (2007) Parameterization ofprocesses of leaf extension in tropically adapted maize cultivars sown ontwo dates at Gatton. European Journal of Agronomy 27, 215–224.doi: 10.1016/j.eja.2007.04.003
Birch CJ, Thornby D, Adkins S, Andrieu B, Hanan J (2008a) Architecturalmodelling of maize under water stress. Australian Journalof Experimental Agriculture 48, 335–341. doi: 10.1071/EA06105
Birch CJ, Stephen K, McLean G, Doherty A, Hammer GL, Robertson MJ(2008b) Reliability of production of quick to medium maturity maize inareas of variable rainfall in north-east Australia. Australian Journalof Experimental Agriculture 48, 326–334. doi: 10.1071/EA06104
CieslakM, Lemieux C, Hanan J, Prusinkiewicz P (2008) Quasi-Monte Carlosimulation of the light environment of plants. Functional Plant Biology35, 837–849.
Craufurd PQ, Prasad PVV, Waliyar F, Taheri A (2006) Drought, pod yield,pre-harvest Aspergillus infection and aflatoxin contamination on peanutinNiger.FieldCropsResearch98, 20–29. doi: 10.1016/j.fcr.2005.12.001
Dalgleish N, Foale M (1998) ‘Soil matters – monitoring soil water andnutrients in raingrown farming.’ (Agricultural Production SystemsResearch Unit: Toowoomba, Qld)
Dingkuhn M, Luquet D, Kim H, Tambour L, Clément-Vidal A (2006)EcoMeristem, a model of morphogenesis and competition among sinksin rice. 2. Simulating genotype responses to phosphorus deficiency.Functional Plant Biology 33, 325–337. doi: 10.1071/FP05267
Evers JB, Vos J, Fournier C, Andrieu B, Chelle M, Struik PC (2007) Anarchitecturalmodel of springwheat: evaluationof the effects of populationdensity and shading on model parameterization and performance.Ecological Modelling 200, 308–320. doi: 10.1016/j.ecolmodel.2006.07.042
Farré I, Faci JM (2006) Comparative response of maize (Zea mays L.) andsorghum (Sorghum bicolour L. Moench) to irrigation deficit in aMediterranean environment. Agricultural Water Management 83,135–143. doi: 10.1016/j.agwat.2005.11.001
934 Functional Plant Biology Y. Song et al.
FournierC,AndrieuB (1998)A3-D architectural and process-basedmodel ofmaize development. Annals of Botany 81, 233–250. doi: 10.1006/anbo.1997.0549
Fournier C, Andrieu B (1999)ADEL-maize: an L-system basedmodel for theintegration of growth processes from the organ to the canopy.Applicationto regulation of morphogenesis by light availability. Agronomie 19,313–327. doi: 10.1051/agro:19990311
Fournier C, Andrieu B (2000) Dynamics of the elongation of internodes inmaize (Zea mays L.): analysis of phases of elongation and theirrelationships to phytomer development. Annals of Botany 86,551–563. doi: 10.1006/anbo.2000.1217
FournierC,Durand JL,LjutovacS,SchäufeleR,Gastal F,AndrieuB (2005)Afunctional-structural model of elongation of the grass leaf and itsrelationships with the phyllochron. New Phytologist 166, 881–894.doi: 10.1111/j.1469-8137.2005.01371.x
Granier C, Tardieu F (1999) Water deficit and spatial pattern of leafdevelopment. Variability in responses can be simulated using a simplemodel of leaf development.PlantPhysiology119, 609–620. doi: 10.1104/pp.119.2.609
Guo Y, Ma Y, Zhan Z, Li B, Dingkuhn M, Luquet D, de Reffye P (2006)Parameter optimization and field validation of the functional–structuralmodel GREENLAB for maize. Annals of Botany 97, 217–230.doi: 10.1093/aob/mcj033
HananJS,HearnAB(2003)Linkingphysiological andarchitecturalmodelsofcotton. Agricultural Systems 75, 47–77. doi: 10.1016/S0308-521X(01)00114-7
Keating BA, Carberry PS, Hammer GL, Probert ME, Robertson MJ, et al.(2003) The Agricultural Production Systems Simulator (APSIM): itshistory and current capability. European Journal of Agronomy 18,267–288. doi: 10.1016/S1161-0301(02)00108-9
Luquet D, Dingkuhn M, Kim HK, Tambour L, Clément-Vidal A (2006)EcoMeristem, amodel of morphogenesis and competition among sinks inrice. 1. Concept, validation and sensitivity analysis. Functional PlantBiology 33, 309–323. doi: 10.1071/FP05266
Luquet D, Song Y, Elbelt S, This D, Clément-Vidal A, Périn C, Fabre D,Dingkuhn M (2007) Model-assisted physiological analysis of phyllo, arice architectural mutant. Functional Plant Biology 34, 11–23.doi: 10.1071/FP06180
Lyon DJ, Hammer GL, McLean GB, Blumenthal M (2003) Simulationsupplements field studies to determine no-till dryland corn population:recommendations for semi arid western Nebraska.Agronomy Journal 95,884–891.
Maddonni GA, Otegui ME (1996) Leaf area, light interception, and cropdevelopment in maize. Field Crops Research 48, 81–87. doi: 10.1016/0378-4290(96)00035-4
Madhiyazhagan R (2005) Modelling approach to assess the impact of hightemperature andwater stressondry landmaize.PhDthesis.TheUniversityof Queensland, Gatton Campus, Qld, Australia.
Manschadi AM, Christopher J, deVoil P, HammerGL (2006) The role of rootarchitectural traits in adaptation of wheat to water-limited environments.Functional Plant Biology 33, 823–837. doi: 10.1071/FP06055
Moncur MW (1981) ‘Floral initiation in field crops. An atlas of scanningelectron micrographs.’ (Division of Land Use Research, CSIRO:Canberra)
Morrison TA, Kessler JR, Buxton DR (1994) Maize internode elongationpatterns. Crop Science 34, 1055–1060.
NeSmith DS, Ritchie JT (1992) Short- and long-term responses of corn to apre-anthesis soil water deficit. Agronomy Journal 84, 107–113.
Pommel B, Sohbi Y, Andrieu B (2001) Use of virtual 3-D maize canopies toassess the effect of plot heterogeneity on radiation interception.Agricultural and Forest Meteorology 110, 55–67. doi: 10.1016/S0168-1923(01)00270-2
Reymond M, Muller B, Leonardi A, Charcosset A, Tardieu F (2003)Combining quantitative trait loci analysis and an ecophysiologicalmodel to analyse the genetic variability of the responses of leaf growthto temperature and water deficit. Plant Physiology 131, 664–675.doi: 10.1104/pp.013839
RobertsonMJ (1994)Relationship between internodeelongation, plant heightand leaf appearance in maize. Field Crops Research 38, 135–145.doi: 10.1016/0378-4290(94)90085-X
Schafer BM, Ritchie AM, Strachan DB (1986) Soils of the QueenslandAgricultural College farm, Darbalara. Queensland AgriculturalCollege, Technical Paper No. 7, Queensland Agricultural College,Lawes, Qld, Australia.
Stone PJ,WilsonDR, Jamieson PD,Gillespie RN (2001)Water deficit effectson sweet corn. II. Canopy development. Australian Journal ofAgricultural Research 52, 115–126. doi: 10.1071/AR99145
Tardieu F (2003) Virtual plants: modelling as a tool for the genomics oftolerance to water deficit. Trends in Plant Science 8, 9–14. doi: 10.1016/S1360-1385(02)00008-0
Tardieu F, Reymond M, Muller B, Simonneau T, Sadok W, Welcker C(2005) Linking physiological and genetic analyses of the control ofleaf growth under fluctuating environmental conditions. AustralianJournal of Agricultural Research 56, 937–946. doi: 10.1071/AR05156
Yan H, Kang M, de Reffye P, Dingkuhn M (2004) A dynamic architecturalplant model simulating resource-dependent growth. Annals of Botany 93,591–602. doi: 10.1093/aob/mch078
Manuscript received 7 March 2008, accepted 29 July 2008
Architectural modelling of maize under water stress Functional Plant Biology 935
http://www.publish.csiro.au/journals/fpb


