Embed Size (px)
Citation preview

59JOURNAL OF GLOBAL BUSINESS AND ECONOMICSJANUARY 2011. VOLUME 2. NUMBER 1
ANALYSIS OF INCOME AND EXPENDITURE OF HOUSEHOLDS IN THE EAST COASTOF PENINSULAR MALAYSIA
Noorhaslinda Kulub Abd. [email protected]
Aslina [email protected]
Nik Hashim Nik [email protected]
Nik Fuad Kamil
Faculty of Management and EconomicsUniversiti Malaysia Terengganu (UMT)
ABSTRACT
Analysis of expenditure and income patterns of households in Malaysia that focuses on income,expenditure, loan, and saving is important. This study analyzes the impact of post global economic crisison the income and expenditure patterns of Malaysian households. The study identifies majorcomponents of household’s expenditure on food, education, and health; as well as saving and loan, inrelation to household income. In Pahang, Kelantan and Terengganu, the total expenditures come fromthe variables such as income, housing loan, automobile loan and expenditure for education. Thesevariables were selected due to the highly significant value that contributed to the Total of Expenditures(EXTO).
Keywords: expenditure, income, household.
----------------------------------------------------------------------------------------------------------------------------------
1.0 INTRODUCTION
In Malaysia the slogan ’Spend Wisely’ is often promoted and advertised at shopping centers as well as inthe media. The slogan addresses the importance of wise spending under whatever economic situations.With the increase in Consumer Consumption Index (CPI) for goods and services, wise spending is theonly solution to reduce consumer problems. Consumer problems are many but it revolves around thebalancing act of income, expenditure, loan, and savings.
Income level is the major factor that determines consumption spending of an individual. However,income is not the only factor that influences spending, as loan and saving also affect spending. Spendingof course fulfill the needs for basic necessity of an individual and family members. Leon Zurawicki &Nestor Braidot (2004), reported that households tend to make an adjustment to their income and

60JOURNAL OF GLOBAL BUSINESS AND ECONOMICSJANUARY 2011. VOLUME 2. NUMBER 1
expenditures to fulfill their needs during an economic crisis or recession. Stephen (2001) disclosed thatconsumption and expenditures pattern changes along with changes in income level.
2.0 ISSUES IN INCOME AND EXPENDITURE
Recession and fluctuations in the economy would normally cause changes in the socioeconomic andsocial standing of the populace. These changes often lead to social crisis (Walton & Manuelyan, 1998).Atsushi Maki (2006) reported that economic crisis lead to sudden changes in saving behavior as well aslifestyle. However variation in income among the population would lead to wider income disparitybetween households. Household expenditure and income disparity can lead to significant differences ineither rural or urban setting in terms of expenses on basic needs. An urban household tends to increaseconsumption based on the increment of income in order to improve their lifestyle (Farkhanda Shamim &Eatzaz Ahmad, 2007). Micheal Beine et. al (2001) found that households in United States prefer to spendtheir money at shopping centers rather than use their leisure time for other activities.
This research seeks to know the factors that influence household income and expenditure in Malaysia.Households often change their spending patterns whenever economic crisis occurs. In 1986, 1997 till1998 and in 2008, Malaysian had experienced significant changes in the economy arising from currencyspeculation and global economic crisis. Households in Malaysia spend their money wisely in respond tothe structural changes in the economy.
3.0 RESEARCH OBJECTIVES
The general objective of this research is to analyze levels of household’s income and patterns ofexpenditure among the East Coast population. The specific objectives is to analyze post global economiccrisis on the income and expenditure patterns of the East Coast households. To identify majorcomponents of household’s expenditure of the East Coast households as the percentage of total incomein terms of food, education, health, utility as well as saving and loan. To determine factors that influencehousehold’s propensity to consume on major components of expenditure in relation to income. Toestimate an empirical two stage least square model for the household’s expenditure.
4.0 ANALYTICAL FRAMEWORK
Simple random sampling was used as the basis in the selection of the respondents. Three states in theEast Coast of Peninsular Malaysia were selected namely Pahang, Kelantan and Terengganu. Theselection of districts and mukims was purposively based on the suggestion from District Officers due totheir knowledge and wide experience about the survey areas. In Pahang, two selected districts wereKuantan (urban) and Pekan (rural), while for Kelantan, the selected districts were Kota Bharu (urban)and Kuala Krai (rural). Lastly for Terengganu, Kuala Terengganu and Setiu were chosen to represent theurban and rural area respectively.Based on mukims selected in each state, respondents were drawn bysimple random sampling technique.
5.0 THE DISTRIBUTION OF HOUSEHOLD SAMPLING FOR EACH STATE & DISTRICT
To make it more clear, the information provided on the below table shows how the distributions ofrespondents (household) will be made.

61JOURNAL OF GLOBAL BUSINESS AND ECONOMICSJANUARY 2011. VOLUME 2. NUMBER 1
From Figure 1, the number of total respondents for three states are 645 which separated into urban andrural area. In Pahang, the number of urban area, Kuantan and rural area,Pekan are 118 and 100respectively with total of respondents in both area 218. While, the total number of respondents inKelantan is 214 with 110 and 104 number of respondents respectively in Kota Bharu (urban) and Kotakrai (urban). For Terengganu, the number of respondents in Kuala Terengganu is 103 that represent asan urban area whereas Setiu represent as a rural area with 110 of respondents. So, the total number ofrespondents in Terengganu is 213.
6.0 ANALYSIS
In this research, two types of analysis were used – the descriptive and inferential analysis (Correlationand Regression). Descriptive analysis is the one of analysis method to describe the data or certaininformation in the simple way, more clear, orderly and easy to be understanding. Usually the data willbe interpret and analyzed according to the years of research (whether time series or cross sectionaldata) to make it more clearance. Furthermore, this statistic data will be transformed into schedule orgraph according to information suitability. Correlation analysis is used to achieve the second objective ofstudy. This analysis involved the hypothesis testing that will be established between income and qualityof life indicators based on secondary data. While for regression analysis, on the other hand is usedbased on regression model form so-called “Simultaneous Equation” to identify the relationship and thepattern of expenditure that interrelated to each others. In this research the expenditure will be dividedinto six components such as food, education, utility consumption, saving and loan payment.
7.0 RESULT AND DISCUSSION
In general, are relatively low which selected at least 0.3 because the study were using the cross-sectional data. Based on the result as shown in Table 1, there are 8 equation systems for Pahanghousehold according to their value of which over than 0.3.

62JOURNAL OF GLOBAL BUSINESS AND ECONOMICSJANUARY 2011. VOLUME 2. NUMBER 1
Most of t-values for Equation 1 in Pahang are significant at 0.01 and 0.05. There is positive relationshipbetween INC (income) and EXTO (Expenditure Total) whereby the EXTO clarify as an endogenousvariable. About 1 percent (1%) increased in income necessitate an increase of 0.21 percent (%) in totalof expenditure (Refer to equation 1). This scenario is consistent to the Engel Theory, which can beexplained by the function that relates the equilibrium quantity for individual with their income level(Ahmad Mahdzan Ayob, 1991). It means that, the income level will generate to their spending behavior(total expenditures).
While, for two variables such as HLO (Housing Loan) and ALO (Automobile Loan), there are highlycorrelated or strongly relationship with EXTO (Expenditure Total) at 0.01 level of significant or 99.0 %(probability level). As a conclusion, the reason of their total of expenditure is more than their income ismost of them like to spend more money to fulfill their needs by making loan such as housing loan andautomobile loan from any financial.
Next, if refer to the Equation 2, there is also the same findings as in Equation 1 whereby INC as anendogenous variable. The Equation 1 and 2 have inter related each other because in this study the 2SLSEquation Systems were used simultaneously. The highly correlated variables at 0.01 level of significantare EXTO, FSA (Family Size) and also DEP (Dependent). It shows that the number of family members andthe number of dependent in family’s will influence the income level whether it is sufficient or not. That’swhy in the case of Pahang, The value for TBL (Total Borrowing Loan) can be rank as the highest valueamong the variables. The household tend to make loans if there is insufficient for make theirexpenditures for certain item.

63JOURNAL OF GLOBAL BUSINESS AND ECONOMICSJANUARY 2011. VOLUME 2. NUMBER 1
Table 1: Results of 2SLS Regression Analysis for Pahang
RegressorEndogenous Variables
EXTO EXF EXC EXE SAV TBL INC EXL
ExogenousVariables
Constant 593.37 50.457 -185.16 -105.28 93.024 9.3627 -204.62 -254.57(3.127)*** (0.8788) (-1.983)** (-1.774)** (0.9972) (0.253) (-0.2916) (-1.715)**
EXTO 0.1339 0.1184 0.04215 1.2146 0.623(10.69)*** (2.987)*** (0.5834) (7.809)*** (5.715)***
INC 0.1207 0.00209 0.05506 0.00612 -0.07507
(1.808)** (0.1405) (1.1013) (0.4128) (-0.8983)
HLO 1.2539 1.1058(4.475)*** (21.05)***
ALO 0.948 -0.1184 1.0478(3.244)*** (-1.057) (20.63)***
FSA 20.779 -33.942 2.6439 546.72 25.319(3.422)*** (-1.05) (0.3979) (4.738)*** (0.4503)
AGE 1.6877 1.9913 -0.5563 19.937
(1.759)* (1.304) (-0.3261) (1.835)
EXT 0.6924
(2.056)**
EXE 3.0281(3.197)***
EDLO -0.00995 0.9955(-1.044) (10.77)***
TBL 0.02925
(0.5981)
DEP 28.408 22.723 5.1121 -593.59 -81.063(2.559)** (3.3260)*** (0.1466) (-4.963)*** (-1.381)
DPE -20.238 -261.97 -100.83
(-0.5295) (-0.6156) (-0.9873)
DSE 32.554 -586.13 -35.931(0.8906) (-1.388) (-0.3439)
DUE 45.403 -475.37 31.354(1.149) (-1.041) (0.2813)
SEX -14.968(-0.5297)
MST -31.917
(-0.3394)LOC 72.742
(1.645)R2 0.5924 0.5827 0.3619 0.3093 0.3851 0.9288 0.3755 0.5864
DW 1.9382 1.6312 1.7452 1.8111 1.8921 1.7928 1.9037 1.6199
* significant at 0.1 level or 90%** significant at 0.05 level or 95%*** significant at 0.01 level or 99%

64JOURNAL OF GLOBAL BUSINESS AND ECONOMICSJANUARY 2011. VOLUME 2. NUMBER 1
EXEALOHLOINCEXTO 0281.3948.02539.11207.037.593 ………..(Equation 1)AGEFSAEXTOEXF 6877.1779.201339.0457.50
AGEDEPALOEXTOEXC 9913.1408.281184.01184.016.185
SEXDUE
DSEDPEDEPEDLOEXTINCEXE
968.14403.45
554.32238.20723.2200995.06924.000209.028.105
LOCDEPAGEFSAINCEXTOSAV 742.721121.55563.0942.3305506.004215.0024.93 FSAINCALOHLOEDLOTBL 6439.200612.00478.11058.19955.03627.9
DUEDSEDPEDEPAGEFSAEXTOINC 37.47513.58697.26159.593937.1972.5462146.162.204 …(Equation 2)
DUEDSE
DPEFSAMSTDEPEXTOINCEXL
354.31931.35
83.100319.25917.31063.81623.007507.057.254
Where
EXTO = Expenditures total EXF = Food ExpendituresEXE = Education Expenditures TBL = Total Borrowing LoanEXL = Loan Expenditures INC = IncomeHLO = Housing Loan ALO = Allowance LoanFSA = Family’s Size AGE = AgeEXT = Transportation Expenditures EDLO = Education LoanDEP = Dependent DPE = PrivateDSE = Self Employment DUE = UnemploymentSAV = Saving
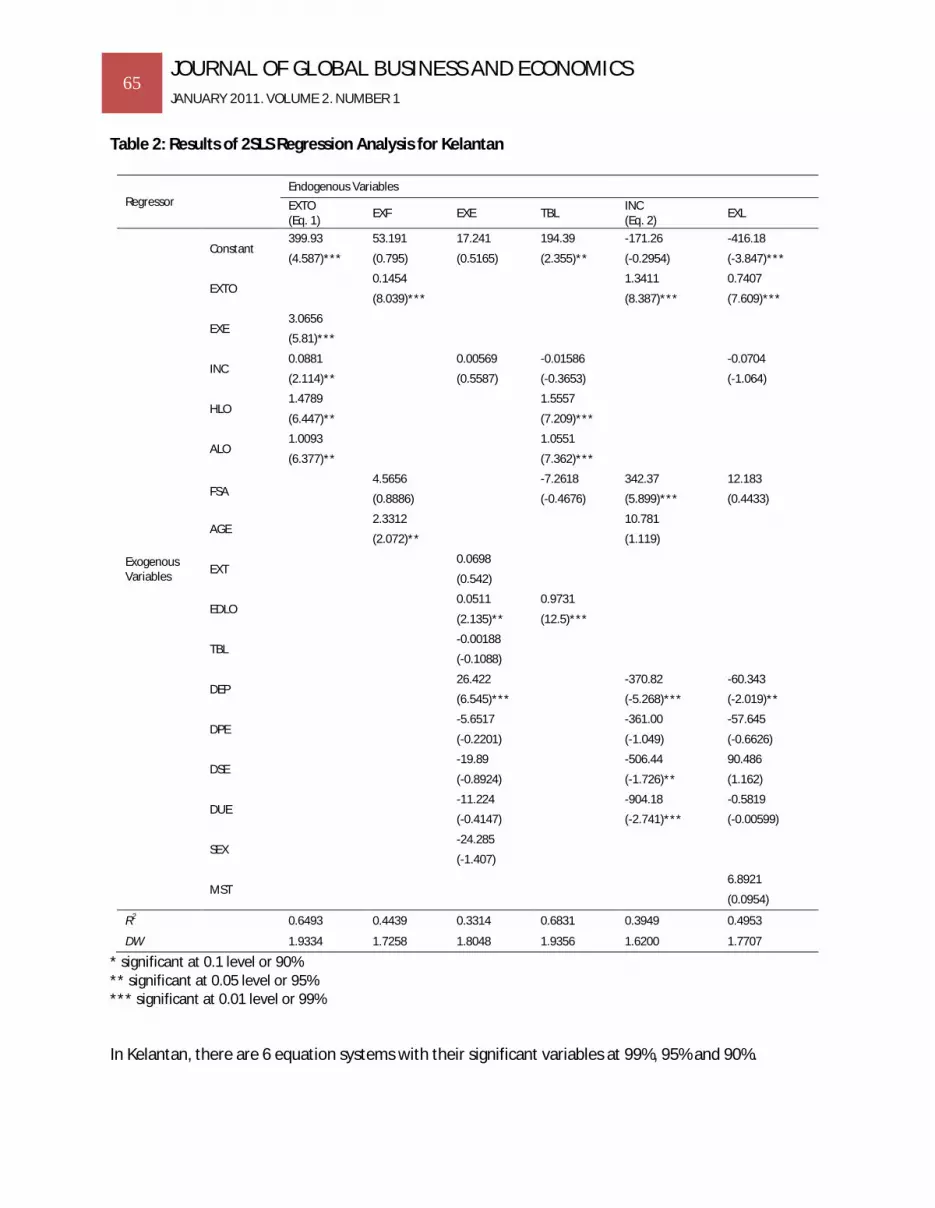
The findings in Kelantan are slightly as same as Pahang where by the TBL (Total Borrowing Loan) stillshow the highest =0.6831. Most of t-values for Equation 1 in Kelantan are significant at 0.05 and 0.01.There is positive relationship between INC (income) and endogenous variable, EXTO (ExpendituresTotal). About 1 percent (1%) increased in income means that 0.14 percent (%) changes in total ofexpenditure (Refer to equation 1). Besides of income, there are three independent variables that havestrongly relationship with EXTO at significant level at 0.05 and 0.01, which identified as EXE(Expenditures for Food), INC (Income), HLO (Housing Loan), and lastly ALO (Automobile Loan).
If refer to the Equation 2, there is also the same findings as in Equation 1 whereby endogenous variable,INC have strongly relationship (0.05 and 0.01 level of significant) between INC and five exogenousvariables such as EXTO, FSA (Family Size), DEP (Dependent), DSE (Dummy for Self Employment) and DUE(Dummy for Unemployment). So, based on these findings, the number of family members and thenumber of dependents in family’s strongly contributed to the level of income. In addition, with the selfemployment and unemployment of the household, it gives an impact to the level of income as a whole.
65JOURNAL OF GLOBAL BUSINESS AND ECONOMICSJANUARY 2011. VOLUME 2. NUMBER 1
Table 2: Results of 2SLS Regression Analysis for Kelantan
RegressorEndogenous VariablesEXTO(Eq. 1) EXF EXE TBL INC
(Eq. 2) EXL
ExogenousVariables
Constant399.93 53.191 17.241 194.39 -171.26 -416.18
(4.587)*** (0.795) (0.5165) (2.355)** (-0.2954) (-3.847)***
EXTO0.1454 1.3411 0.7407
(8.039)*** (8.387)*** (7.609)***
EXE3.0656
(5.81)***
INC0.0881 0.00569 -0.01586 -0.0704
(2.114)** (0.5587) (-0.3653) (-1.064)
HLO1.4789 1.5557
(6.447)** (7.209)***
ALO1.0093 1.0551
(6.377)** (7.362)***
FSA4.5656 -7.2618 342.37 12.183
(0.8886) (-0.4676) (5.899)*** (0.4433)
AGE2.3312 10.781
(2.072)** (1.119)
EXT0.0698
(0.542)
EDLO0.0511 0.9731
(2.135)** (12.5)***
TBL-0.00188
(-0.1088)
DEP26.422 -370.82 -60.343
(6.545)*** (-5.268)*** (-2.019)**
DPE-5.6517 -361.00 -57.645
(-0.2201) (-1.049) (-0.6626)
DSE-19.89 -506.44 90.486
(-0.8924) (-1.726)** (1.162)
DUE-11.224 -904.18 -0.5819
(-0.4147) (-2.741)*** (-0.00599)
SEX-24.285
(-1.407)
MST6.8921
(0.0954)
R2 0.6493 0.4439 0.3314 0.6831 0.3949 0.4953
DW 1.9334 1.7258 1.8048 1.9356 1.6200 1.7707
* significant at 0.1 level or 90%** significant at 0.05 level or 95%*** significant at 0.01 level or 99%
In Kelantan, there are 6 equation systems with their significant variables at 99%, 95% and 90%.
22222

66JOURNAL OF GLOBAL BUSINESS AND ECONOMICSJANUARY 2011. VOLUME 2. NUMBER 1
ALOHLOINCEXEEXTO 0093.14789.10881.00656.393.399 ………………(Equation 1)AGEFSAEXTOEXF 3312.25656.41454.0191.53
EXEDUEDSE
DPEDEPTBLEDLOEXTINCEXE
285.24224.1189.19
6517.5422.2600188.00511.00698.000569.0241.17
EDLOFSAALOHLOINCTBL 9731.02618.70551.15557.101586.039.194 DUEDSEDPEDEPAGEFSAEXTOINC 15.90444.50600.36182.370781.1037.3423411.126.171
…………..(Equation 2)DUEDSEDPEDEPFSAINCEXTOEXL 5819.0486.90645.57343.60183.120704.07407.018.416
Table 3: Results of 2SLS Regression Analysis for Terengganu
Regressor
Endogenous Variables
EXTO EXF INC TBL EXL
ExogenousVariables
Constant 458.52 13.774 3565.0 -164.09 -546.29
(3.534)*** (0.162) (3.723)*** (-2.223)** (-2.746)***
EXTO 0.0905 0.8776 0.07594
(5.37)*** (4.328)*** (10.39)***
INC 0.07515 0.069 0.07096
(1.436) (2.677)*** (-1.185)
HLO 1.3856 1.001
(9.011)*** (15.34)***
ALO 1.4144 0.7556
(6.948)*** (8.223)***
FSA 20.288 161.33 12.519 23.34
(3.565)*** (2.099)** (1.765)** (1.203)
AGE 2.9636 -24.661
(2.309)** (-2.069)**
EXT
EXE 3.046
(6.565)***
EDLO 0.8633
(10.74)***
DEP -359.8 -86.608
(-4.582)** (-3.30)***
DPE -385.44 141.41
(-0.8428) (1.295)
DSE -766.03 351.97
(-1.645) (3.001)***
DUE -156.67 351.91
(-0.309) (2.928)***
SEX
MST -113.69
(-0.9866)
R2 0.7127 0.3083 0.3019 0.8226 0.482
DW 1.5575 1.5612 1.7637 2.0195 1.7979
* significant at 0.1 level or 90%** significant at 0.05 level or 95%*** significant at 0.01 level or 99%

67JOURNAL OF GLOBAL BUSINESS AND ECONOMICSJANUARY 2011. VOLUME 2. NUMBER 1
Compared to Pahang and Kelantan, Terengganu has 5 equation systems with their significant variablesat 99%, 95% and 90% as below. Most of t-values for Equation 1 in Terengganu are significant at 0.01.There is positive relationship between INC (income) and endogenous variable, EXTO (ExpendituresTotal). About 1 percent (1%) increased in income means that 0.13 percent (%) increase in total ofexpenditures (Refer to equation 1). Contrast to the case of Pahang and Kelantan, Terengganu does nothave any relationship between income and total of expenditures. With highest value in TBL (TotalBorrowing Loan), means that Terengganu household tend to spend more money by making loan eventhough they are insufficient of income. It means that in Terengganu, income does not contribute to theexpenditure pattern among the households. Nevertheless, there are three independent variables thathave strongly relationship with EXTO at significant level at 0.05 and 0.01, which identified as EXE(Expenditures for Food), INC (Income), HLO (Housing Loan), and lastly ALO (Automobile Loan).
Next, for Equation 2, the endogenous variable, INC has highly correlated to the four exogenous variablessuch as EXTO, FSA, AGE (Age) and DEP at 0.01 and 0.05 level of significant. Compared to Pahang andKelantan, Terengganu has strongly relationship between INC and AGE because the more their age, theless productive to contribute to the job market. Furthermore, after their pension period, their income isnot sufficient to bear the members of family. That’s why the relationship between INC and AGE arenegative.
EXEALOHLOINCEXTO 046.34144.13856.107515.052.458 …………(Equation 1)
AGEFSAEXTOEXF 9636.2288.200905.0774.13 DUEDSEDPEDEPAGEFSAEXTOINC 67.15603.76644.3858.359661.2433.1618776.00.3565
………(Equation 2)EDLOFSAALOHLOINCTBL 8633.0519.127556.0001.10069.009.164
MSTDUEDSEDPEDEPFSAINCEXTOEXL 69.11391.35197.35141.141608.8634.2307096.007594.029.546
8.0 ANALYSIS OF EXPENDITURE
In Pahang, Kelantan and Terengganu, the total expenditures come from the variables such as income,housing loan, automobile loan and expenditure for education. These variables were selected due to thehighly significant value that contributed to the Total of Expenditures (EXTO). The detail explanations forthese variables can be illustrated as below whereby the total expenditures for income, housing loan,automobile loan and education expenditure with their slightly differences respectively.
Table 1: Correlation between Income and Total Expenditure
INC PAHANG KELANTAN TERENGGANU200 1454 994 1336400 1478 1012 1351600 1502 1030 1366800 1526 1047 13811000 1550 1065 13961200 1574 1082 14111400 1599 1100 14261600 1623 1118 14411800 1647 1135 14572000 1671 1153 1472

68JOURNAL OF GLOBAL BUSINESS AND ECONOMICSJANUARY 2011. VOLUME 2. NUMBER 1
Figure 2: Correlation between Income and Total Expenditure
Based on the Figure 2 in above, the correlation between income and total expenditure shows thedifference trend in three states. Pahang shows the highest value, followed by Terengganu and lastlyKelantan whereby the higher the income values the higher the total of expenditures. These stronglyrelationship means that once the income level increase even 1%, the total expenditure tends to behigher with proportionately.
Table 2: Correlation between Housing Loan and Total Expenditure
HLO PAHANG KELANTAN TERENGGANU200 1873 1343 1623400 2124 1639 1900600 2375 1935 2177800 2625 2231 24541000 2876 2527 27311200 3127 2822 30081400 3378 3118 32851600 3628 3414 35621800 3879 3710 38392000 4130 4005 4117

69JOURNAL OF GLOBAL BUSINESS AND ECONOMICSJANUARY 2011. VOLUME 2. NUMBER 1
Figure 3: Correlation between Housing Loan and Total Expenditure
Next, the housing loan and total expenditure in Figure 3 show the different pattern for these threestates compared to the Figure 2 in above. Pahang was the first ranking in making housing loan, followedby Terengganu and then Kelantan. Based on the findings in this surveying to the urban and rural area foreach state, majority of the respondent agreed that the expensive housing loan especially in urban areahas increased the total expenditure among of them. Instead of the standard of living in Kelantan wasrelatively cheaper compared to the Pahang and Terengganu, the large proportion in making housingloan made them suffering to survive in comfortable residence.
In terms of making automobile loan, the correlation between automobile loan and total expenditure aredramatically different in Terengganu compared to Pahang and Kelantan. There is a gap betweenTerengganu and these two states on making automobile loan, shown in Figure 4 as below.
Table 3: Correlation between Automobile Loan and Total Expenditure
ALO PAHANG KELANTAN TERENGGANU300 1871 1324 1720600 2156 1627 2145900 2440 1930 25691200 2724 2233 29931500 3009 2536 34181800 3293 2838 38422100 3578 3141 42662400 3862 3444 46912700 4146 3747 51153000 4431 4049 5539

70JOURNAL OF GLOBAL BUSINESS AND ECONOMICSJANUARY 2011. VOLUME 2. NUMBER 1
Figure 4: Correlation between Automobile Loan and Total Expenditure
Lastly, the same findings that we can see in these three states are education expenditure. Thecorrelation between education expenditure and total expenditure are approximately similar each other.It means that in theses three states, the education is one of the important aspects to be emphasized inorder to born the higher level education person and first class mentality students. So that, majority ofthe parent agreed that investment in education aspects can guaranteed the positive return and benefitfor their children in the future.
Table 4: Correlation between Education Expenditure and Total Expenditure
EXE PAHANG KELANTAN TERENGGANU200 1959 1385 1651400 2565 1998 2260600 3170 2611 2870800 3776 3224 34791000 4382 3837 40881200 4987 4450 46971400 5593 5063 53061600 6198 5677 59161800 6804 6290 65252000 7410 6903 7134

71JOURNAL OF GLOBAL BUSINESS AND ECONOMICSJANUARY 2011. VOLUME 2. NUMBER 1
Figure 5: Correlation between Education Expenditure and Total Expenditure
9.0 CONCLUSION
Based on our discussion in above, it is very important to highlight the household income andexpenditure in order to know how their spending pattern in the context of nowadays situation. From theexpenditure items that mentioned before this, all Malaysian especially among the household shouldhave good information and knowledge to manage their money and to put the priority expenses of thetotal expenditures. The following below are the steps or guidance in thrift spending:
• Get to know the thrift store shopping to avoid losing money
Thrift stores fit most any budget and are not just for people with low income. Experienced savvyshoppers pay cheap prices for household goods, gift items, and clothes that others can no longer use.There are advantages to shopping at thrift stores, especially at the beginning of school and around theholidays. But thrift store shopping has disadvantages too, and consumers are advised to know thestore's policies before making any expensive purchases. There are thrift store items that shoppersshould avoid to keep from losing money.
• Make a budget
A budget is absolutely one of the best tools that help us to spend less than what we make. It startedwith how we make a budget in order to spend wisely and thrift. An effective budget is needed to gettingout of debt and unnecessary items. Everyone who does not budget spends more money than those whodo. It is very simple as that and very useful to apply. It doesn’t have to be painful and can even be fun.
• Limited Promotion and Unbeneficial Advertisement
In terms of government role, they should limit the promotion, campaign and advertisement for certaincompany in order to educate the household to spend wisely. Sometimes unbeneficial advertisement is

72JOURNAL OF GLOBAL BUSINESS AND ECONOMICSJANUARY 2011. VOLUME 2. NUMBER 1
very easy to influence the society to make a debt by using their credit card and also easier to spendmore than they do.
• Individual awareness
The awareness among the individual is the main important aspect to be emphasized in order to educatethem in how to be good money spender. Furthermore, with unstable economic and financial, it is veryimportant to saving our money for contingency items in the future.
As a conclusion, learning to manage the money wisely takes time and effort, but it also depends on theindividual and others in the society on how to make it reality
REFERENCES
Atsushi Maki, (2006). Changes In Japanese Household Consumption and Saving Behavior Before, Duringand After The Bubble Era : Empirical Analysis using NSFIE Micro-data Sets. Japan and the WorldEconomy.
Farkhanda Shamim and Eatzaz Ahmad, (2007). Understanding Household Consumption Patterns inPakistan. Journal of Retailing and Consumer Services.
Leon Zurawicki and Nestor Braidot, (2005). Consumers During Crisis : Responses From The Middle Classin Argentina. Journal Of Business Research.
Michel Beine, Francis Bismans, Frederic Docquier and Sebastian Laurent, (2001). Life-Cycle Behaviour OfUS Household A Nonlinear GMM Estimation On Pseudopanel Data. Journal Of Policy Modeling.
Syed, O.A. 1996. Poverty Eradication From Islamic Perspectives [online]. Available from:http://vlib.unitarkl1.edu.my/staff-publications/datuk [Accessed in Disember 2009].
Cutler, J. (2005). The Relationship Between Consumption, Income and Wealth in Hong Kong. PacificEconomic Review, 10 (2), 217-241.
Dejuan, J. P. and J. J. Seater. (1999). ‘The permanent income hypothesis: Evidence from the consumerexpenditure survey’ Journal of Monetary Economics, 43, 351-376.