Embed Size (px)
Citation preview

AgribusinessSupply ChainManagement

This page intentionally left blankThis page intentionally left blank
AgribusinessSupply ChainManagement
N. Chandrasekaran n G. Raghuram
CRC PressTaylor & Francis Group6000 Broken Sound Parkway NW, Suite 300Boca Raton, FL 33487-2742
© 2014 by Taylor & Francis Group, LLCCRC Press is an imprint of Taylor & Francis Group, an Informa business
No claim to original U.S. Government worksVersion Date: 20130918
International Standard Book Number-13: 978-1-4665-1675-5 (eBook - PDF)
This book contains information obtained from authentic and highly regarded sources. Reasonable efforts have been made to publish reliable data and information, but the author and publisher cannot assume responsibility for the validity of all materials or the consequences of their use. The authors and publishers have attempted to trace the copyright holders of all material reproduced in this publication and apologize to copyright holders if permission to publish in this form has not been obtained. If any copyright material has not been acknowledged please write and let us know so we may rectify in any future reprint.
Except as permitted under U.S. Copyright Law, no part of this book may be reprinted, reproduced, transmit-ted, or utilized in any form by any electronic, mechanical, or other means, now known or hereafter invented, including photocopying, microfilming, and recording, or in any information storage or retrieval system, without written permission from the publishers.
For permission to photocopy or use material electronically from this work, please access www.copyright.com (http://www.copyright.com/) or contact the Copyright Clearance Center, Inc. (CCC), 222 Rosewood Drive, Danvers, MA 01923, 978-750-8400. CCC is a not-for-profit organization that provides licenses and registration for a variety of users. For organizations that have been granted a photocopy license by the CCC, a separate system of payment has been arranged.
Trademark Notice: Product or corporate names may be trademarks or registered trademarks, and are used only for identification and explanation without intent to infringe.
Visit the Taylor & Francis Web site athttp://www.taylorandfrancis.com
and the CRC Press Web site athttp://www.crcpress.com
v
Contents
Preface ...........................................................................................................xvIntroduction ................................................................................................xviiAcknowledgements ...................................................................................... xxvAuthors .......................................................................................................xxix
SeCtion i ACtorS
1 Nature of Agribusiness Supply Chain ....................................................31.1 Supply Chain ......................................................................................31.2 Logistics and Supply Chain ................................................................61.3 Agribusiness ........................................................................................81.4 Challenges Faced ..............................................................................10
1.4.1 Production ............................................................................121.4.2 Labour and Inputs ................................................................121.4.3 Supply Chain Network .........................................................121.4.4 Corporate and Organized Business .......................................14
1.5 Role of Supply Chain ........................................................................171.5.1 Players and Their Activities ....................................................171.5.2 Needs of Producers and Consumers ......................................201.5.3 Four Utilities .........................................................................21
1.5.3.1 Form .......................................................................211.5.3.2 Place ........................................................................211.5.3.3 Time .......................................................................221.5.3.4 Possession ................................................................22
1.6 Supply Chain Drivers ........................................................................221.6.1 Facilities ................................................................................231.6.2 Transportation ......................................................................261.6.3 Inventory ..............................................................................281.6.4 Sourcing................................................................................311.6.5 Pricing ..................................................................................331.6.6 Information ..........................................................................35
vi ◾ Contents
1.7 External Factors ................................................................................371.8 Conclusion ........................................................................................37References ..................................................................................................37
2 Input Suppliers .....................................................................................392.1 Introduction ......................................................................................392.2 Categorization of Inputs .................................................................. 402.3 Growth of Inputs Manufacturing Sector ......................................... 402.4 Manufacturing and Processing .........................................................41
2.4.1 Supply Chain Challenges ......................................................452.4.2 Supply Chain Goals .............................................................502.4.3 Push versus Pull ....................................................................51
2.5 Supply Chain Drivers ........................................................................522.5.1 Facility ..................................................................................522.5.2 Inventory ..............................................................................532.5.3 Transportation ......................................................................562.5.4 Sourcing ................................................................................582.5.5 Pricing ..................................................................................592.5.6 Information ..........................................................................61
2.6 Conclusion........................................................................................63Appendix 2.1 ............................................................................................ 64
A2.1.1 Transportation Options and Challenges for a Fertilizer Manufacturing Firm.......................................................... 64
A2.1.2 Indian Fertilizer Industry .................................................. 64A2.1.3 Freight Rate Management by Government .........................65A2.1.4 Company Background ...................................................... 66A2.1.5 Demand and Distribution Pattern ..................................... 66A2.1.6 Transportation Challenges .................................................67A2.1.7 Movement by Rail ..............................................................68A2.1.8 Trade-Offs ..........................................................................69
Discussion Points .......................................................................................70Notes .........................................................................................................71References ..................................................................................................71
3 Farm Output: Market Intermediaries ..................................................733.1 Introduction ......................................................................................733.2 Trends in Output ..............................................................................743.3 Marketing Channels .........................................................................74
3.3.1 Direct to Consumer ..............................................................763.3.2 Through Wholesalers and Intermediaries ..............................78
3.3.2.1 The Mandi System ..................................................79
Contents ◾ vii
3.3.2.2 Informal Financial System and Intermediation ....80 3.3.2.3 Procurement by Government Agencies
and Cooperatives .................................................803.3.3 Producers’ Cooperative ...................................................... 843.3.4 Through Processors .............................................................87
3.4 Conclusion ........................................................................................88Appendix 3.1 .............................................................................................89
A3.1.1 Agricultural Crops and Intermediation Process: Pomegranate and Banana ...................................................89A3.1.1.1 Pomegranate ......................................................89A3.1.1.2 Banana ..............................................................92
References ..................................................................................................96
4 Processors .............................................................................................974.1 Introduction ......................................................................................974.2 Primary Processing ...........................................................................984.3 Food Processing ..............................................................................1014.4 Supply Chain Drivers ......................................................................106
4.4.1 Facilities ............................................................................1064.4.2 Inventory ..........................................................................1074.4.3 Transportation ..................................................................1074.4.4 Sourcing ...........................................................................1084.4.5 Pricing ..............................................................................1134.4.6 Information ...................................................................... 114
4.5 Industrial Production ...................................................................... 1164.6 Conclusion ...................................................................................... 119References ................................................................................................ 119
5 Retailers ..............................................................................................1215.1 Introduction ....................................................................................1215.2 Size of Indian Retail .......................................................................1225.3 Unorganized Sector.........................................................................126
5.3.1 Rationale .............................................................................1265.3.2 Business Structure...............................................................128
5.4 Organized Sector ............................................................................1325.5 Supply Chain Challenges ................................................................1375.6 Role of Intermediaries .....................................................................1385.7 Foreign Direct Investment ..............................................................1395.8 Conclusion ......................................................................................140References ................................................................................................141
viii ◾ Contents
SeCtion ii intrinSiC iSSueS
6 Perishability .......................................................................................1456.1 Introduction ..................................................................................1456.2 Facilities at Source: Case of Different Products .............................147
6.2.1 Seafood ...........................................................................147 6.2.2 Oil Palm ......................................................................... 151 6.2.3 Dairy ..............................................................................154 6.2.4 Plantation White Sugar ................................................... 157 6.2.5 Other Perishable Products ...............................................158
6.3 Distribution and Value Addition ..................................................1586.4 Processing .....................................................................................160
6.4.1 Benefits ............................................................................162 6.4.2 Products in India .............................................................162
6.5 Direct Marketing through Wholesale Markets .............................1636.6 Intermediaries ...............................................................................1676.7 Wastage ........................................................................................168
6.7.1 Source .............................................................................169 6.7.2 Storage ............................................................................169 6.7.3 Transportation ................................................................171
6.8 Quality Management ....................................................................1716.9 Price Management ........................................................................1726.10 Supply and Demand Side Risks ....................................................173
6.10.1 Types ...............................................................................173 6.10.2 Deflation ......................................................................... 174 6.10.3 Resource Crisis ................................................................175
6.11 Conclusion ....................................................................................175References ................................................................................................176
7 Quality ...............................................................................................1777.1 Introduction ..................................................................................1777.2 Grading .........................................................................................178
7.2.1 Process .............................................................................179 7.2.2 Importance ......................................................................179 7.2.3 Benefits ............................................................................180
7.2.3.1 Uniformity .......................................................180 7.2.3.2 Facilitates Buying and Selling ...........................180 7.2.3.3 Competitive Advantage ....................................180 7.2.3.4 Price Fixing ......................................................182 7.2.3.5 Market Access...................................................183 7.2.3.6 Transparency ....................................................183
Contents ◾ ix
7.2.3.7 Sustainable Agriculture ........................................1837.2.3.8 Incentives for Fair Trade ......................................184
7.3 Stages of Supply Chain ..................................................................184 7.3.1 Farm Level .........................................................................184 7.3.2 Transportation ...................................................................184 7.3.3 Storage and Distribution ....................................................185
7.4 Need for a Structured Approach ....................................................1877.5 Overview of Policies ......................................................................1877.6 International Policies .....................................................................1907.7 Role of Government Agencies .......................................................1937.8 Foreign Trade ................................................................................198
7.8.1 Emergence ..........................................................................198 7.8.2 World Agricultural Trade ...................................................198 7.8.3 Exports ..............................................................................199
7.8.3.1 Global Tea Trade .................................................1997.8.3.2 Fruit and Vegetable Trade to the
European Union ................................................. 2007.9 Secondary and Tertiary Processing ............................................... 2007.10 Conclusion ....................................................................................201Appendix 7.1 ............................................................................................202
Grading of Cashew Kernels (Whole) ..............................................202Appendix 7.2 ............................................................................................202
Grading of Fruits and Vegetables—Minimum Requirements for Export to EU Countries .................................................................202
Appendix 7.3 ............................................................................................203American Spice Trade Association (ASTA) Cleanliness Specifications for Turmeric .............................................................203
Appendix 7.4 ............................................................................................203Codex Standard for Wheat and Durum Wheat: Quality and Safety Factors ...........................................................................203
Appendix 7.5 ........................................................................................... 204Quality Information Requirements for Import of Food Products into India ....................................................................................... 204
Appendix 7.6 ........................................................................................... 204Commodity Grading and Marketing Rules ................................... 204
Appendix 7.7 ............................................................................................210National and International Standards—Websites List ....................210
References ................................................................................................210
x ◾ Contents
8 Risk ....................................................................................................2118.1 Introduction .................................................................................... 2118.2 Sources of Risks ..............................................................................2138.3 Classifications of Agricultural Risks................................................214
8.3.1 Production ..........................................................................217 8.3.1.1 Land Use Pattern .................................................217 8.3.1.2 Soil ......................................................................218 8.3.1.3 Water and Irrigation ............................................219 8.3.1.4 Weather and Climate .......................................... 220 8.3.1.5 Farm Inputs and Management .............................221
8.3.2 Prices and Markets .............................................................225 8.3.2.1 Market and Price Risks Drivers .......................... 226
8.4 Management .................................................................................. 2268.4.1 Production ..........................................................................227
8.4.1.1 Financial Inputs and Calamity Relief: Insurance .............................................................227
8.4.1.2 Post-Harvest Management and Value Addition ...2308.4.2 Prices and Markets .............................................................232
8.4.2.1 Government Policy Instruments ..........................232 8.4.2.2 Electronic Spot Exchanges .................................. 234 8.4.2.3 Commodity Markets .......................................... 234 8.4.2.4 Contract Farming ................................................235
8.5 Conclusion ......................................................................................236Appendix 8.1 ...........................................................................................238
Agricultural Land Use in India .......................................................238Appendix 8.2 ...........................................................................................241
Potential Risks and Their Management (Indicative) .......................241Acknowledgement....................................................................................243References ................................................................................................243
SeCtion iii Support SyStemS
9 Infrastructure .....................................................................................2479.1 Introduction ...................................................................................2479.2 Definition ......................................................................................2489.3 Role ...............................................................................................2499.4 Transportation Network ................................................................2499.5 Challenges .....................................................................................2529.6 Cold Storages .................................................................................253
9.6.1 Status ..................................................................................2559.6.2 Challenges ..........................................................................2559.6.3 Inadequate and Poor Infrastructure ....................................256
Contents ◾ xi
9.6.4 Rising Energy Cost ...........................................................257 9.6.5 Poor Utilization ................................................................257
9.7 Organized Markets .......................................................................257 9.7.1 Rythu Bazaars....................................................................258 9.7.2 Uzhavar Santhai ................................................................258 9.7.3 Facilities ............................................................................259
9.8 Communication Network ............................................................ 2609.9 Training ........................................................................................2629.10 Investment .....................................................................................2639.11 Conclusion ................................................................................... 264Appendix 9.1............................................................................................265
Infrastructure Required in the Wholesale Market ........................265Appendix 9.2 .......................................................................................... 266
NHDP Projects as on December 2011 ......................................... 266Appendix 9.3 ...........................................................................................267
Expenditure Budget ......................................................................267Appendix 9.4 ...........................................................................................269
Projections for Agri Supply Chain Infrastructure in the Public Sector ............................................................................................269
Appendix 9.5............................................................................................271 Web Portals on Agri Market Information .....................................271
References ................................................................................................272
10 Information Technology ....................................................................27310.1 Introduction ..................................................................................27310.2 Legacy Systems .............................................................................27410.3 Enterprise Resource Planning .......................................................27510.4 Supply-Chain-Centric Applications ..............................................27810.5 Internet Technologies ....................................................................281
10.5.1 ITC E-Choupal ...............................................................28210.6 Mobile Technology ...................................................................... 28410.7 Cloud Computing ........................................................................ 28610.8 Conclusion ....................................................................................287Appendix 10.1 ..........................................................................................288
SME Cluster: Processing of Coconut Kernel and Extraction of Oil—A Case Study at Kangeyam, Tirupur District ......................288
Introduction .................................................................................288 Sourcing of Coconut and Kernels .................................................288 Direct Consumption Trade ...........................................................289 Process Cluster at Kangeyam ........................................................289 Processing Activity........................................................................291 Information and Price Efficiency ..................................................292
xii ◾ Contents
Appendix 10.2 .........................................................................................295 Cloud Computing and Its Perspectives .........................................295
References ................................................................................................297
11 Financial Systems ...............................................................................29911.1 Introduction ..................................................................................29911.2 Role and Relevance ...................................................................... 30011.3 Problems in Synchronization .........................................................30311.4 Role of Technology ....................................................................... 30411.5 Credit Structure in India ...............................................................305
11.5.1 Reserve Bank of India (RBI).............................................307 11.5.2 NABARD ....................................................................... 308
11.6 Commodity Markets ..................................................................... 31111.7 Corporates in Agribusiness ............................................................ 31411.8 Conclusion ....................................................................................316Appendix 11.1 ..........................................................................................316
Prevalence of Indebtedness in India ...............................................316Appendix 11.2 .......................................................................................... 317
Kisan Credit Cards ........................................................................ 317Appendix 11.3 ..........................................................................................320
List of Organizations under Department of Agriculture and Cooperation ...................................................................................320
Appendix 11.4 ..........................................................................................321 Structure of Commodity Markets in India ....................................321
References ................................................................................................321
12 Role of Government ............................................................................32312.1 Introduction ..................................................................................32312.2 Agencies ........................................................................................324
12.2.1 As a Direct Player ...........................................................325 12.2.2 Food Corporation of India (FCI) ...................................325 12.2.3 Public Distribution System .............................................326 12.2.4 Buffer Stock Creation .....................................................327 12.2.5 Price Control Mechanism ...............................................328 12.2.6 Essential Commodities Act, 1955 ...................................328 12.2.7 Food Subsidy ..................................................................329
12.3 Policy Reforms ..............................................................................33212.4 Direct Cash Subsidy......................................................................33312.5 As a Regulator ...............................................................................33412.6 As a Facilitating Institution...........................................................33512.7 Trade Negotiations and Subsidy ....................................................335
12.7.1 General Agreement on Tariffs and Trade (GATT), 1947 .............................................................336
Contents ◾ xiii
12.7.2 Uruguay Round Agreement on Agriculture (URAA), 1986–1994 ......................................................................336
12.7.3 World Trade Organization (WTO), 1995 .......................336 12.7.4 Doha Negotiations, 2001 ................................................337 12.7.5 Domestic Subsidy ............................................................337
12.8 Conclusion ....................................................................................338Appendix 12.1 .........................................................................................338
Important Agri Business Websites ................................................338Appendix 12.2 ........................................................................................ 340
Minimum Support Price .............................................................. 340Appendix 12.3 ........................................................................................ 342
Minimum Support Price (`/Quintal) for Nonfoodgrains According to Crop Year (Fair Average Quality) ............................. 342
Appendix 12.4 ........................................................................................ 344Public Distribution System—Procurement, Off-Take and Stocks (Million Tonnes) ............................................................................ 344
Appendix 12.5 .........................................................................................345Important Cooperatives Acts ..........................................................345
Appendix 12.6 .........................................................................................345Some of the Leading Government Organizations in the Agro-Based Sector (Indicative List) ................................................345Commission of Agricultural Costs and Prices .................................345Indian Council of Agricultural Research (ICAR) .......................... 346National Bank for Agriculture and Rural Development ................ 346Food Corporation of India (FCI) ....................................................347Agriculture and Processed Food Products Export Development Authority (APEDA) ....................................................................... 348Marine Products Exports Development Authority (MPEDA)........ 348National Dairy Development Board ...............................................349Spices Board of India ......................................................................349Tea Board of India ..........................................................................349
Acknowledgement....................................................................................349References ................................................................................................350
Case Studies1 Bayer CropScience: Science for a Better Supply Chain .......................3512 Marico: Disintermediating the Copra Supply Chain .........................3693 Hasmukhbhai K. Nakum: Cold Storage Entrepreneur ......................3934 Chilli in Soup (A) ..............................................................................4415 Chilli in Soup (B) ..............................................................................4696 Adani Wilmar Limited ...................................................................... 5157 Woolworths Limited, Australia ..........................................................5338 Akshaya Patra, Gandhinagar ..............................................................607
Index ...........................................................................................................659

This page intentionally left blankThis page intentionally left blank
xv
preface
Agribusiness is one of the key economic activities in India that links the agricultural economy, and its demand and supply management is aimed at the well-being of the society. An agribusiness supply chain includes a number of processes such as sup-ply management, production management and demand management to ultimate customers through a competitive distribution channel. India leads in production of many of the agricultural commodities but is still widely criticized for improper management of distribution. This is due to diversity of production and demand bases and inefficient logistics management. Further, complexity of agribusiness supply chains is due to bulkiness of produce, perishability and seasonality. It is imperative to have a well-designed supply chain.
It is important to understand issues from the perspectives of various actors in the agribusiness supply chain. This includes the input sector, farms as produc-tion centres processing units as value-adding production centres, and delivery to ultimate customers through retailers and directly from the higher echelons of the distribution channel. The supply chain effectiveness also depends on intrinsic issues like perishability, quality and risk.
An agribusiness supply chain is dependent upon the functioning of a support system that includes infrastructure like cold storage and warehouses, adoption of information technology and a well designed and implemented financial system to overcome the vagaries of informal financial systems affecting cost and responsive-ness of the supply chain.
Finally, an agribusiness supply chain depends upon government and its bodies at the central (federal), state and local levels to function effectively. There are a num-ber of laws and regulations that impact this sector. Agribusiness supply chain role agents, analysts and policy makers must be able to relate to this in decision making.
Agribusiness supply chain management focuses on how a firm organizes receipts of material and components, adds value and delivers to the ultimate customer through planning, sourcing, manufacturing and distribution processes engaging multiple stakeholders in the supply chain. With increased proliferation of products and services, and customers becoming ever demanding and expecting differentia-tion at low cost, supply chain challenges are going to be aplenty for firms. Supply
xvi ◾ Preface
chain management impacts a company significantly for achieving a competitive edge in any market. Managing fertilizer production and distribution and, in the same way, managing processing and distribution of commodities like tea are highly competitive, and supply chain design matters most.
In today’s world, companies compete on supply chains. Those who have the capability to establish a distinctive supply chain and create it as a strategic asset are leaders in their business and in fact emerge as the best in class across industries and markets.
Some of the examples of such distinctive agribusiness supply chains in India include those established by Gujarat Cooperative Milk Marketing Federation (GCMMF), brand owner of AMUL, ITC Ltd—Foods Division, PepsiCo India and HUL, to name a few. Similarly, in the input sector, companies in fertilizers, seeds and machinery compete through their supply chains.
This book is an attempt to provide readers a comprehensive perspective of agri-business supply chains. It covers issues across various business and government roles in the agribusiness supply chain domain. The book also provides different cases for readers to relate to decision-making situations. The aim of this book is to provide a treatment of agribusiness supply chain management that is clear, well-structured and interesting. It brings out inter-relations within its drivers and across functions in the agribusiness supply chain. The text provides a logical approach to key activi-ties of agribusiness supply chain management and relates principles and practices predominantly with examples from India.
N. Chandrasekaran G. Raghuram
xvii
introduction
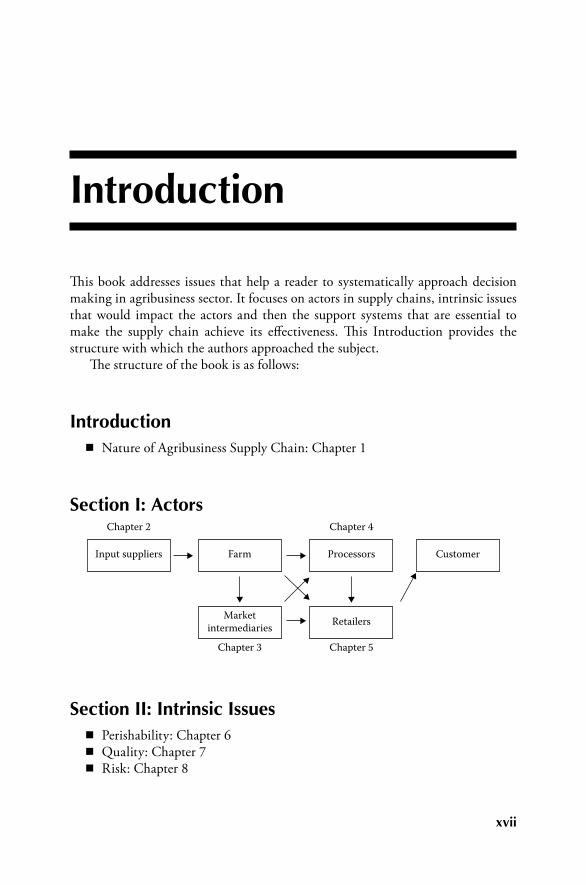
This book addresses issues that help a reader to systematically approach decision making in agribusiness sector. It focuses on actors in supply chains, intrinsic issues that would impact the actors and then the support systems that are essential to make the supply chain achieve its effectiveness. This Introduction provides the structure with which the authors approached the subject.
The structure of the book is as follows:
introduction ◾ Nature of Agribusiness Supply Chain: Chapter 1
Section i: Actors
Input suppliers Farm
Marketintermediaries
Chapter 3 Chapter 5
Chapter 4Chapter 2
Retailers
Processors Customer
Section ii: intrinsic issues ◾ Perishability: Chapter 6 ◾ Quality: Chapter 7 ◾ Risk: Chapter 8
xviii ◾ Introduction
Section iii: Support Systems ◾ Infrastructure: Chapter 9 ◾ Information Technology: Chapter 10 ◾ Financial Systems: Chapter 11 ◾ Role of Government: Chapter 12
Chapter 1 discusses “Nature of Agribusiness Supply Chain.” The complexity of agribusiness has two components: farm output for direct demand and farm-based intermediate products for final demand. Then, three flows—physical, financial and information, and their interrelation for an effective agribusiness supply chain—are discussed. An introduction to contemporary issues like quality, security and challenges for society, and the role of supply chains is provided next. Then discus-sions follow on different drivers and their role in managing effectiveness of the agribusiness supply chain.
Section I: ActorsThis section discusses actors in agribusiness supply chains, which include input providers, farm output market intermediaries, processors and retailers.
Chapter 2 is on “Input Suppliers” with the objective of understanding specific-ity of each input and importance of a driver for supply chain effectiveness. An input is taken up with reference to a case highlighting demand and supply management, and the way supply chain processes like planning, sourcing, value addition and dis-tribution to users are critical. The chapter addresses inbound material and services at farm level operations.
Chapter 3 is on “Farm Output: Market Intermediaries” with the objective of understanding distribution options and forward linkages aimed at reaching ulti-mate customers. The coverage includes: farm gate procurement, local procurement through intermediaries, role of mandis/auction centres in farm output distribution, role of government agencies and challenges of organized players in a supply chain.
Chapter 4 is on “Processors.” The objective of the chapter is to understand the challenges faced in this sector by processors when organizing their production and when reaching markets with their products. A number of issues like planning processes, sourcing, facilities, distribution management and waste management are discussed here.
Chapter 5 is on “Retailers” with the objective of understanding the complexity of retailing agricultural produces, both farm fresh and processed, and the need for efficiency and effectiveness of the supply chain. Both organized and unorganized markets are covered. Also, discussions are presented on the role of intermediaries and a short disguised case on challenges of managing a retail store.
Introduction ◾ xix
Section II: Intrinsic IssuesAfter having looked at the major actors in the agribusiness supply chain, we move to discussing three intrinsic issues namely perishability, quality and risk.
Chapter 6 is on “Perishability.” The objective is to understand the challenges faced in this sector with respect to distribution of produce, short life, lack of tem-perature control for storage and transportation, wastages and pricing pressures.
Chapter 7 is on “Quality” and how it is important for agribusiness supply chain effectiveness. The discussions include appreciating the importance of grading and quality management; current practices and brief overview of different policies that may impact on the quality of goods especially from trade perspective.
Chapter 8 is on “Risk” in agribusiness with the objective of understanding a number of risks that could hamper supply chains and the ways to mitigate them.
Section III: Support SystemsAfter having looked at the major actors and intrinsic issues in the agribusiness sup-ply chain, we analyse the support systems required for managing effectiveness of agribusiness supply chain. These include: infrastructure, information technology, financial systems and government policies.
Chapter 9 is on “Infrastructure,” which discusses the importance of transport connectivity, availability of storages including cold storages, communication net-work and so on.
Chapter 10 discusses importance of “Information Technology” with the objec-tive of understanding the scope of deploying technology in agribusinesses at the farm level and in the different stages of agribusiness supply network. A number of instances of success in Indian agribusiness are cited in discussions.
Chapter 11 is on “Financial Systems” with an objective to enumerate the vari-ous financial challenges in this sector that impact the supply chain. The discussions are on: informal credit operations; role of commodity exchanges for efficiency and on awareness and new systems approach such as e-choupal and community com-munication centres. Here again instances of various policies and systems are cited.
Chapter 12 discusses the “Role of Government” with the objective of under-standing various initiatives taken by the government to improve efficiency in this sector. Discussions include trade negotiations and subsidy; domestic subsidy schemes and their impact on supply chains and direct interventions through mea-sures like buffer stock creation, releases, price and distribution control, Essential Commodities Act, food credit, farmers credit support system, cooperatives and so on, and their impact on the supply chain.
Each chapter starts with learning objectives. The subject is then presented with illustrations and examples. Agribusiness supply chain management is a practical application subject based on theoretical concepts. Most of the chapters contain a framework, and issues in handling the supply chain with real-life examples.
xx ◾ Introduction
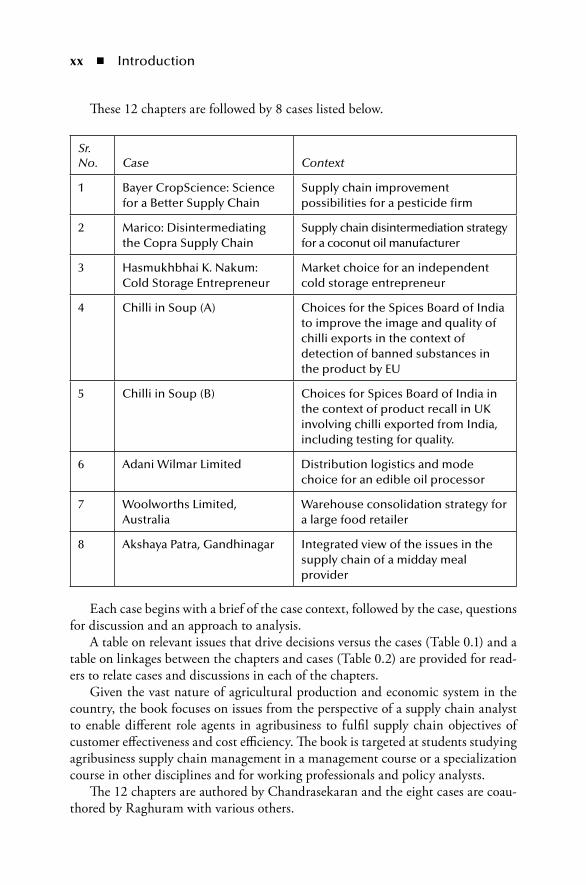
These 12 chapters are followed by 8 cases listed below.
Sr. No. Case Context
1 Bayer CropScience: Science for a Better Supply Chain
Supply chain improvement possibilities for a pesticide firm
2 Marico: Disintermediating the Copra Supply Chain
Supply chain disintermediation strategy for a coconut oil manufacturer
3 Hasmukhbhai K. Nakum: Cold Storage Entrepreneur
Market choice for an independent cold storage entrepreneur
4 Chilli in Soup (A) Choices for the Spices Board of India to improve the image and quality of chilli exports in the context of detection of banned substances in the product by EU
5 Chilli in Soup (B) Choices for Spices Board of India in the context of product recall in UK involving chilli exported from India, including testing for quality.
6 Adani Wilmar Limited Distribution logistics and mode choice for an edible oil processor
7 Woolworths Limited, Australia
Warehouse consolidation strategy for a large food retailer
8 Akshaya Patra, Gandhinagar Integrated view of the issues in the supply chain of a midday meal provider
Each case begins with a brief of the case context, followed by the case, questions for discussion and an approach to analysis.
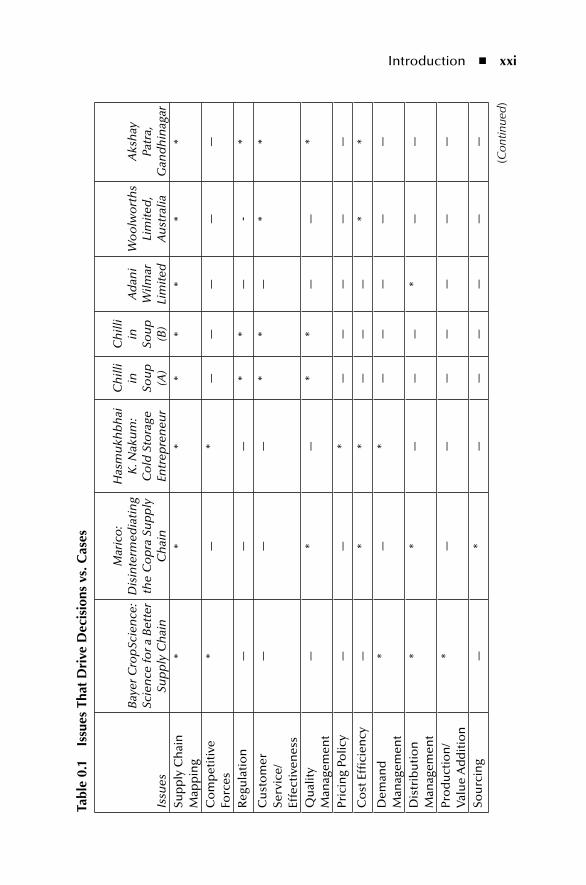
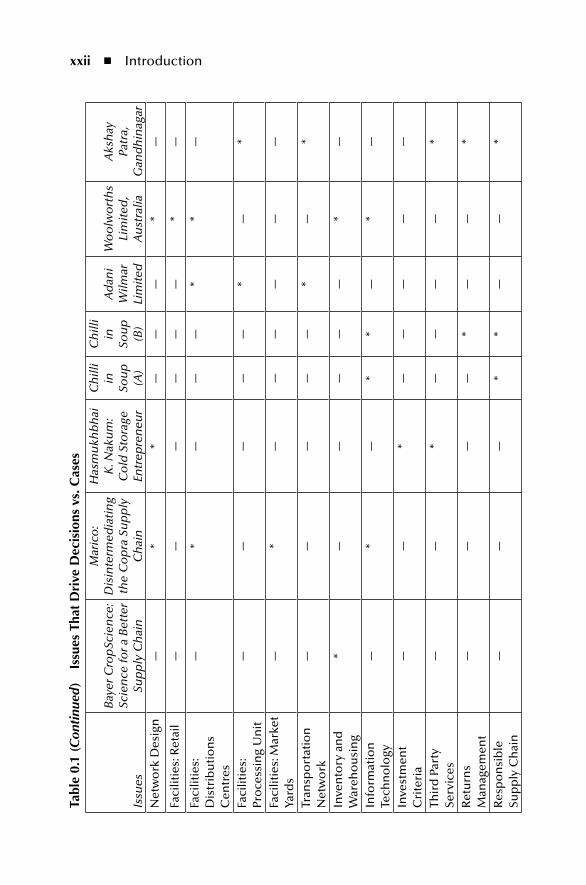
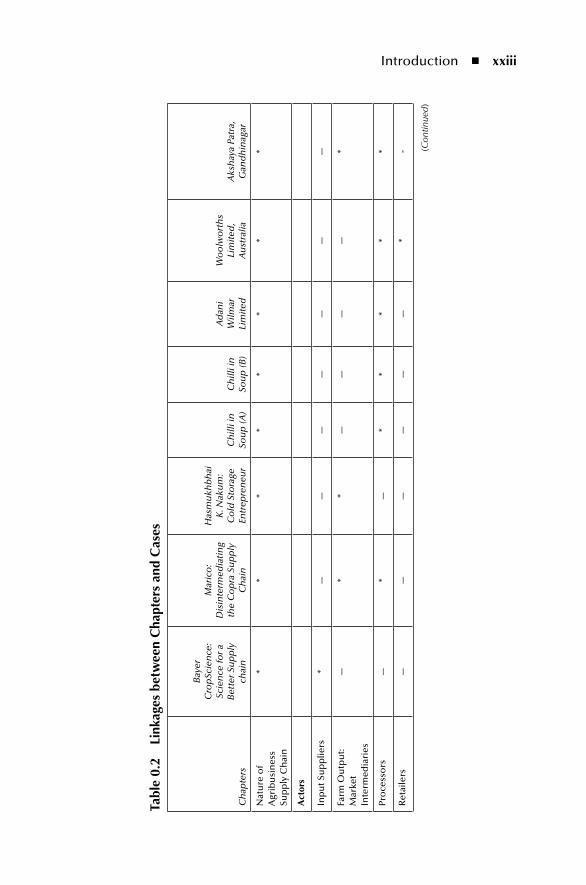
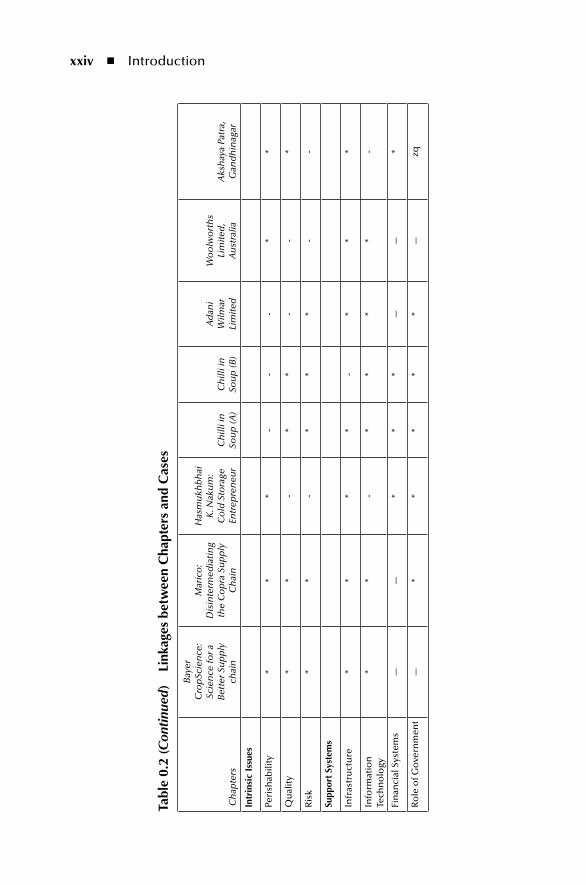
A table on relevant issues that drive decisions versus the cases (Table 0.1) and a table on linkages between the chapters and cases (Table 0.2) are provided for read-ers to relate cases and discussions in each of the chapters.
Given the vast nature of agricultural production and economic system in the country, the book focuses on issues from the perspective of a supply chain analyst to enable different role agents in agribusiness to fulfil supply chain objectives of customer effectiveness and cost efficiency. The book is targeted at students studying agribusiness supply chain management in a management course or a specialization course in other disciplines and for working professionals and policy analysts.
The 12 chapters are authored by Chandrasekaran and the eight cases are coau-thored by Raghuram with various others.
Introduction ◾ xxi
tabl
e 0.
1 is
sues
tha
t D
rive
Dec
isio
ns v
s. C
ases
Issu
es
Bay
er C
rop
Scie
nce
: Sc
ien
ce fo
r a B
ette
r Su
pp
ly C
hai
n
Mar
ico
: D
isin
term
edia
tin
g th
e C
op
ra S
up
ply
C
hai
n
Has
mu
khb
hai
K
. Nak
um
: C
old
Sto
rage
En
trep
ren
eur
Ch
illi
in
Sou
p
(A)
Ch
illi
in
Sou
p
(B)
Ad
ani
Wilm
ar
Lim
ited
Wo
olw
ort
hs
Lim
ited
, A
ust
ralia
Aks
hay
Pa
tra,
G
and
hin
agar
Sup
ply
Ch
ain
M
app
ing
**
**
**
**
Co
mp
etit
ive
Forc
es*
—*
——
——
—
Reg
ula
tio
n—
——
**
—-
*
Cu
sto
mer
Se
rvic
e/Ef
fect
iven
ess
——
—*
*—
**
Qu
alit
y M
anag
emen
t—
*—
**
——
*
Pric
ing
Polic
y—
—*
——
——
—
Co
st E
ffici
ency
—*
*—
——
**
Dem
and
M
anag
emen
t*
—*
——
——
—
Dis
trib
uti
on
M
anag
emen
t*
*—
——
*—
—
Pro
du
ctio
n/
Val
ue
Ad
dit
ion
*—
——
——
——
Sou
rcin
g—
*—
——
——
—
(Con
tinue
d)
xxii ◾ Introduction
tabl
e 0.
1 (C
onti
nued
) is
sues
tha
t D
rive
Dec
isio
ns v
s. C
ases
Issu
es
Bay
er C
rop
Scie
nce
: Sc
ien
ce fo
r a B
ette
r Su
pp
ly C
hai
n
Mar
ico
: D
isin
term
edia
tin
g th
e C
op
ra S
up
ply
C
hai
n
Has
mu
khb
hai
K
. Nak
um
: C
old
Sto
rage
En
trep
ren
eur
Ch
illi
in
Sou
p
(A)
Ch
illi
in
Sou
p
(B)
Ad
ani
Wilm
ar
Lim
ited
Wo
olw
ort
hs
Lim
ited
, A
ust
ralia
Aks
hay
Pa
tra,
G
and
hin
agar
Net
wo
rk D
esig
n—
**
——
—*
—
Faci
litie
s: R
etai
l—
——
——
—*
—
Faci
litie
s:
Dis
trib
uti
on
s C
entr
es
—*
——
—*
*—
Faci
litie
s:
Pro
cess
ing
Un
it—
——
——
*—
*
Faci
litie
s: M
arke
t Ya
rds
—*
——
——
——
Tran
spo
rtat
ion
N
etw
ork
——
——
—*
—*
Inve
nto
ry a
nd
W
areh
ou
sin
g*
——
——
—*
—
Info
rmat
ion
Te
chn
olo
gy—
*—
**
—*
—
Inve
stm
ent
Cri
teri
a—
—*
——
——
—
Thir
d P
arty
Se
rvic
es—
—*
——
——
*
Ret
urn
s M
anag
emen
t—
——
—*
——
*
Res
po
nsi
ble
Su
pp
ly C
hai
n—
——
**
——
*
Introduction ◾ xxiii
tabl
e 0.
2 Li
nkag
es b
etw
een
Cha
pter
s an
d C
ases
Ch
apte
rs
Bay
er
Cro
pSc
ien
ce:
Scie
nce
for a
B
ette
r Su
pp
ly
chai
n
Mar
ico
: D
isin
term
edia
tin
g th
e C
op
ra S
up
ply
C
hai
n
Has
mu
khb
hai
K
. Nak
um
: C
old
Sto
rage
En
trep
ren
eur
Ch
illi i
n
Sou
p (A
)C
hill
i in
So
up
(B)
Ad
ani
Wilm
ar
Lim
ited
Wo
olw
ort
hs
Lim
ited
, A
ust
ralia
Aks
hay
a Pa
tra,
G
and
hin
agar
Nat
ure
of
Agr
ibu
sin
ess
Sup
ply
Ch
ain
**
**
**
**
Act
ors
Inp
ut S
up
plie
rs*
——
——
——
—
Farm
Ou
tpu
t: M
arke
t In
term
edia
ries
—*
*—
——
—*
Pro
cess
ors
—*
—*
**
**
Ret
aile
rs—
——
——
—*
- (Con
tinue
d)
xxiv ◾ Introduction
tabl
e 0.
2 (C
onti
nued
) Li
nkag
es b
etw
een
Cha
pter
s an
d C
ases
Ch
apte
rs
Bay
er
Cro
pSc
ien
ce:
Scie
nce
for a
B
ette
r Su
pp
ly
chai
n
Mar
ico
: D
isin
term
edia
tin
g th
e C
op
ra S
up
ply
C
hai
n
Has
mu
khb
hai
K
. Nak
um
: C
old
Sto
rage
En
trep
ren
eur
Ch
illi i
n
Sou
p (A
)C
hill
i in
So
up
(B)
Ad
ani
Wilm
ar
Lim
ited
Wo
olw
ort
hs
Lim
ited
, A
ust
ralia
Aks
hay
a Pa
tra,
G
and
hin
agar
intr
insi
c is
sues
Peri
shab
ility
**
*-
--
**
Qu
alit
y*
*-
**
--
*
Ris
k*
*-
**
*-
-
Supp
ort
Syst
ems
Infr
astr
uct
ure
**
**
-*
**
Info
rmat
ion
Te
chn
olo
gy*
*-
**
**
-
Fin
anci
al S
yste
ms
——
**
*—
—*
Ro
le o
f Go
vern
men
t —
**
**
*—
zq
xxv
Acknowledgements
I thank Mr. H. R. Srinivasan, vice chairman and managing director, Take Solutions Ltd., for his continued support and encouragement on all my academic endeavors. Without his understanding and open-minded approach, this initiative would not have been accomplished. I thank Rev. Fr. Christie and Rev. Fr. Peter Xavier, director, LIBA, Chennai, for their continued support in pursuing this work.
I would like put on record my sincere gratitude to Dr. T. V. Subramaniam, Prof P. S. Anantha Narayanan, Mr. P. G. Subramanaiam, Dr. T. K. Nathan, executive director, KKID and Mr. K. Krishnamurthy, publisher from Chennai for their guidance and comments on various issues connected with this work. I would like to thank Prof. P. Chandiran, Prof. M. Ramasubramaniam, Mr. H. Sai Sridhar and Ms. M. Rammyaa, research scholar from LIBA, who have been encouraging and supportive at different stages of this work. I would like to thank Mr. K. Venkatesh who has provided editorial support.
I thank Oxford University Press India and NABARD for giving permissions for reproducing some of their material.
I am grateful to Prof. Raghuram and his family, my mother Mrs. Annapoorani Nagarajan, my spouse Prabha and daughter Sangeethaa for their support and understanding.
N. Chandrasekaran
xxvi ◾ Acknowledgements
I thank the following coauthors of the cases for permitting use of the material for the publication of this book:
Tathagata BandyopadhyayFaculty, IIM-A
N. Vijaya Baskar(then) PGP ABM Student, IIM-A
Sanjay Choudhari(then) Academic Associate, IIM-A
Sarang Deo(then) PGP Student, IIM-A
Atanu Ghosh(then) Faculty, IIM-A
G Kuberkar(then) Research Associate, IIM-A
Santosh Kumar Mishra(then) PGP ABM Student, IIM-A
Shravanti Mishra(then) Research Associate, IIM-A
Saral MukherjeeFaculty, IIM A
Sanjay Kumar Singh(then) PGP Student, IIM-A
Neeraj Sisodia(then) Research Associate, IIM-A
The organizations that have rendered direct support in the material develop-ment efforts include:
The Akshaya Patra FoundationMother Shree Cold Storage Private LimitedMarico Industries LimitedSpices Board of IndiaWoolworths LimitedBayer CropScience LimitedAdani Wilmar Limited
I acknowledge the research assistance provided by:
Ramesh Reddy AmereddyAnjali DaveVishal KashyapKruti ModyShivani ShuklaAnju SinglaNiti Sirohi
Acknowledgements ◾ xxvii
I also thank Tata McGraw-Hill for permitting us to print the cases, “Chilli in Soup (A)” and “Bayer CropScience: Science for a Better Supply Chain,” and Asian Case Research Journal for the case “Adani Wilmar Limited (A).”
G. Raghuram
We thank Ganesh Nachiappan, Rachna Rana and Niraja Shukla for content and data validation, and administrative aspects of editorial work.
We are grateful to Taylor & Francis for coming forward with this publication. We sincerely thank Lara Zoble and Laurie Schlags for their continued support and encouragement. We also thank copy editors of Taylor & Francis in helping us in standardizing and improving the content. We are also grateful to all those who would use and come back with feedback on this book.
N. ChandrasekaranG. Raghuram

This page intentionally left blankThis page intentionally left blank
xxix
Authors
N. Chandrasekaran holds a PhD in financial management (1990) from Institute for Financial Management and Research (IFMR), University of Madras, and has about 25 years of corporate experience in areas relating to supply chain manage-ment, corporate planning, strategic management, mergers, acquisitions, corporate restructuring and has also worked with start-ups. He is also a Certified Supply Chain Professional (CSCP) awarded by Association of Operations Management, USA.
He is currently with Take Solutions Ltd as vice president, Corporate Affairs. He is also director, Centre for Logistics and Supply Chain Management, Loyola Institute of Business Administration, Chennai. Dr. Chandrasekaran has worked for agro-based business for organizations like National Dairy Development Board, leading groups engaged in the business of sugar manufacture, and with IT and knowledge-based companies as head of strategy, Human Resources Management and Policy and Systems.
He has published a number of articles in leading professional journals and brought out a first annual publication named Indian Supply Chain Network. He has authored a book Supply Chain Management published by Oxford University Press India in 2010. He is also coauthor of Strategic Management, published by Oxford University Press India in 2011. He led a team of four researchers on a project “Ethical Supply Chain Management in India,” which was later published by Shroff Publishers in 2012.
G. Raghuram has been a faculty member at IIM Ahmedabad since 1985. He is the dean (Faculty) since September 2013. He was the vice chancellor of the Indian Maritime University from July 2012 to March 2013 and was the Indian Railways Chair Professor from January 2008 to August 2010. He specializes in infrastruc-ture and transport systems and logistics and supply chain management. He con-ducts research on the railway, port, shipping, aviation and road sectors. He has published over 30 refereed papers in journals and written over 140 case studies. His fifth coauthored book is in the press now. He was awarded “Academician of the Year” by the Chartered Institute of Logistics and Transport in 2012. He is a fellow of the Operational Research Society of India, and Chartered Institute of
xxx ◾ Authors
Logistics and Transport. He has teaching experience at universities in India, the U.S., Canada, Yugoslavia, Singapore, Tanzania and the UAE.
He has offered consultancy services to over 100 organisations including mul-tilateral agencies. He is on the board of eight companies in the fields of infra-structure and logistics. He has served on various government policy making and advisory committees for the Ministry of Railways, Ministry of Shipping, Ministry of Civil Aviation, Planning Commission, Comptroller and Auditor General and the Cabinet Secretariat.
Prof. Raghuram has a BTech degree from IIT, Madras; a postgraduate diploma in management from IIM, Ahmedabad; and a PhD from Northwestern University, U.S.

iACtorS

This page intentionally left blankThis page intentionally left blank
3
Chapter 1
nature of Agribusiness Supply Chain
1.1 Supply ChainWe may understand supply chains from the perspective of how an end consumer of tea gets it in his or her tea pot. This tea consumer is the ultimate customer of say, Lipton, a Unilever brand. Lipton tea blends are selected from many differ-ent plantations around the world in well-known source countries such as India, Sri Lanka, Kenya, and China. Lipton sources tea both from its own and from other plantations, processes the tea, and moves its products across borders and through distribution networks to reach the ultimate customer. The entire process, which runs into months, involves different role players, with responsibilities discharged by each of them under the guidance of Unilever, all aimed at satisfying the ulti-mate customers. The planning and managing of demand, and the organization of supply, involving the holding and moving of stock, with value addition at each step across the chain, constitute supply chain management (SCM) activities. While performing these activities, several other managerial disciplines, such as produc-tion, marketing, finance, operations, and information management come into play.
Obje CTIv eThis chapter introduces the concepts of supply chain and logistics and their relevance to the agribusiness system. Furthermore, it discusses the role of the supply chain and the importance of supply chain drivers, namely, facilities, inventory, transportation, sourcing, pricing, and information technology.
4 ◾ Agribusiness Supply Chain Management
The supply chain focuses on managing a network of organizations and their activi-ties to fulfil the demands of the ultimate customers of a focal firm in a dynamic environment.
SCM is the integration of key business processes for serving customers. During these processes, value is added to goods and services right from the original sup-pliers to each manufacturer and other intermediaries in the chain until they reach the end customers. While managing these processes, the focus is also on providing value to all stakeholders. These business processes are not limited to buying, move-ment, storage, and their integration. Some interesting terms such as original sup-pliers and adding value to customers and stakeholders also have to be considered.
According to Monczka et al. (2002),
a supply chain encompasses all activities associated with the flow and transformation of goods from the raw material stage (extraction) to consumption by the end users, as well as the associated information flows both up and down the supply chain. Therefore, it comprises a physical element (the strategic partnering of various market-focused, responsive organisations involved in the transformation of specific goods) and an information element (controlled sharing of business data and processes). A supply chain can, therefore, be viewed as a value chain network consisting of individual functional entities committed to the controlled sharing of business data and synchronized coordina-tion of processes for optimizing supply chain profit.
Hence, the term SCM is used to describe the management of the flow of materi-als, information, and funds across the entire supply chain, starting from suppliers and going to component producers, final assemblers and distributors (warehouses and retailers), and ultimately, to the consumers. This description talks about man-aging three flows—physical, informational, and financial—across the chain, and also about the importance of the customer. In contemporary business practice, a fourth flow, namely, reverse physical goods flow or reverse logistics, is gaining importance.
Thus, the objective of a supply chain manager is to manage a network of organizations that are involved, through upstream and downstream linkages, in the different processes and activities that produce value in the form of products and services in the hands of the ultimate customer (Christopher, 1998). This connotes that a supply chain involves two or more organizations, and exists by articulating the flow of material, finance, and information with the purpose of serving the ulti-mate customer. It may be worth reiterating here that the key to the existence of a supply chain is the presence of an ultimate customer and its value to him.
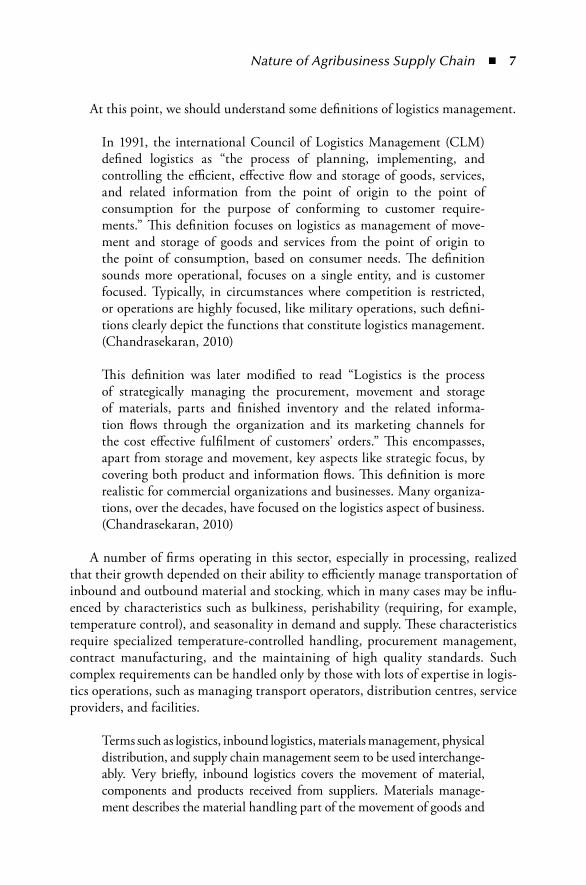
An example of a network for processing and marketing of edible oil in India, where it is a regulated business, is discussed here. The schematic representation is given in Figure 1.1.
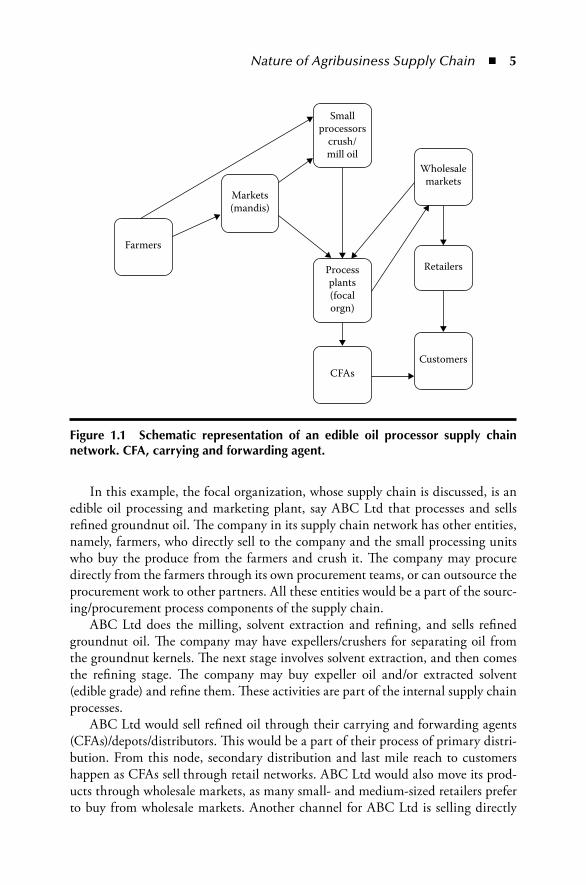
Nature of Agribusiness Supply Chain ◾ 5
In this example, the focal organization, whose supply chain is discussed, is an edible oil processing and marketing plant, say ABC Ltd that processes and sells refined groundnut oil. The company in its supply chain network has other entities, namely, farmers, who directly sell to the company and the small processing units who buy the produce from the farmers and crush it. The company may procure directly from the farmers through its own procurement teams, or can outsource the procurement work to other partners. All these entities would be a part of the sourc-ing/procurement process components of the supply chain.
ABC Ltd does the milling, solvent extraction and refining, and sells refined groundnut oil. The company may have expellers/crushers for separating oil from the groundnut kernels. The next stage involves solvent extraction, and then comes the refining stage. The company may buy expeller oil and/or extracted solvent ( edible grade) and refine them. These activities are part of the internal supply chain processes.
ABC Ltd would sell refined oil through their carrying and forwarding agents (CFAs)/depots/distributors. This would be a part of their process of primary distri-bution. From this node, secondary distribution and last mile reach to customers happen as CFAs sell through retail networks. ABC Ltd would also move its prod-ucts through wholesale markets, as many small- and medium-sized retailers prefer to buy from wholesale markets. Another channel for ABC Ltd is selling directly
Smallprocessors
crush/mill oil
Markets(mandis)
Farmers
Processplants(focalorgn)
CFAsCustomers
Retailers
Wholesalemarkets
Figure 1.1 Schematic representation of an edible oil processor supply chain network. CFA, carrying and forwarding agent.
6 ◾ Agribusiness Supply Chain Management
to institutional buyers, who would be bulk consumers. A few situations may arise where the CFAs also sell to wholesale market players on a need basis; this is not depicted in Figure 1.1, as this is more an exception rather than a normal practice. All these are parts of the distribution network, which is a part of the customer rela-tionship management process in a supply chain network.
Hence, ABC Ltd is the supply chain focal organization whose refined ground-nut oil supply chain is relevant for decision making. The participants in the network could be CFAs and others in the distribution network, as well as procurement agen-cies and institutions that constitute the supplier network. ABC Ltd would work towards maximizing its profit while processing groundnut kernels and marketing groundnut refined oil. It would refrain from being intra-firm focused, and would not like to make profits at the cost of the role agents across its supply chain. On the other hand, the supply chain framework, which is responsive and pegged towards value for money, would help to improve profits of all the players across the chain and enhance customer satisfaction.
This explains the typical operation and relevance of a supply chain network.
1.2 Logistics and Supply ChainThere has been a tendency to use these two terms interchangeably, even by management professionals. It may be useful to understand the focus areas of both of these terms so that we are able to identify their distinguishing and common features. The evolution of each of these terms has been an advantage over the other; logistics functions have been in existence since time immemorial and have contrib-uted to public life, military operations, and business.
Even today, it is amazing to study the logistics operations for milk mar-keting, as it is happening in India. States like Gujarat have a surplus of milk, and have successfully driven cooperative movements. The success of AMUL and the initiative of the National Diary Development Board have led to the success of the Gujarat Cooperative Milk Marketing Federation Ltd. (GCMMF), the brand owners of AMUL. It is one of the largest diary companies in India, selling milk and milk products across various states in India. GCMMF/AMUL works through its milk unions in Gujarat to sell milk across deficit regions in bulk. Just consider the operations involving a perishable product like milk, which is collected from remote villages, processed in dairy plants and moved across India in wagons for augmenting supplies in domestic markets. (Chandrasekaran, 2010)
The entire supply chain needs to be handled with an emphasis on high quality and hygiene in a temperature-controlled environment. These logistical operations are very extensive and are critical for the success of the dairy supply chain network.
Nature of Agribusiness Supply Chain ◾ 7
At this point, we should understand some definitions of logistics management.
In 1991, the international Council of Logistics Management (CLM) defined logistics as “the process of planning, implementing, and controlling the efficient, effective flow and storage of goods, services, and related information from the point of origin to the point of consumption for the purpose of conforming to customer require-ments.” This definition focuses on logistics as management of move-ment and storage of goods and services from the point of origin to the point of consumption, based on consumer needs. The definition sounds more operational, focuses on a single entity, and is customer focused. Typically, in circumstances where competition is restricted, or operations are highly focused, like military operations, such defini-tions clearly depict the functions that constitute logistics management. (Chandrasekaran, 2010)
This definition was later modified to read “Logistics is the process of strategically managing the procurement, movement and storage of materials, parts and finished inventory and the related informa-tion flows through the organization and its marketing channels for the cost effective fulfilment of customers’ orders.” This encompasses, apart from storage and movement, key aspects like strategic focus, by covering both product and information flows. This definition is more realistic for commercial organizations and businesses. Many organiza-tions, over the decades, have focused on the logistics aspect of business. (Chandrasekaran, 2010)
A number of firms operating in this sector, especially in processing, realized that their growth depended on their ability to efficiently manage transportation of inbound and outbound material and stocking, which in many cases may be influ-enced by characteristics such as bulkiness, perishability (requiring, for example, temperature control), and seasonality in demand and supply. These characteristics require specialized temperature-controlled handling, procurement management, contract manufacturing, and the maintaining of high quality standards. Such complex requirements can be handled only by those with lots of expertise in logis-tics operations, such as managing transport operators, distribution centres, service providers, and facilities.
Terms such as logistics, inbound logistics, materials management, physical distribution, and supply chain management seem to be used interchange-ably. Very briefly, inbound logistics covers the movement of material, components and products received from suppliers. Materials manage-ment describes the material handling part of the movement of goods and
8 ◾ Agribusiness Supply Chain Management
components within a factory or firm. Physical distribution refers to the movement of the finished goods outward from the end of the plant opera-tions to the shipping or dispatch department. (Chandrasekaran, 2010)
Logistics describes the entire process of material and products moving into and through process centres, and out of a firm. The facets of logistics management include
◾ Order management ◾ Outbound transportation and distribution management ◾ Inventory management ◾ In-plant logistics, such as stores and movements towards lines and shops ◾ Inbound transportation ◾ Procurement ◾ Information management
From the above-mentioned features, it can be said that logistics management is oriented towards process optimization, that is, cost minimization for the focal organization. It gives a sense of internal SCM. But current thinking on SCM and experience has evolved to a broader perspective, where one needs to go beyond logistics operations (Chandrasekaran, 2010).
1.3 AgribusinessAgriculture in India has a long history, and today India ranks second worldwide in agricultural output. Agriculture and allied sectors, such as forestry and logging, accounted for 16.6% of the GDP in 2007. The sector employs about 60% of the total workforce and plays a significant role in the overall socio-economic development of India. India is the largest producer of milk, coconut, tea, ginger, turmeric, and black pepper in the world. It has the world’s largest cattle population, at about 281 mil-lion (in 2009). India is the second largest producer of wheat, rice, sugar, groundnut, and inland fish. Furthermore, India accounts for 10% of the world’s fruit production, ranking first in the production of banana and sapota (marmalade plum). One of the challenges for India is that its population is growing faster than its ability to produce rice and wheat.
It may be noted here that apart from agricultural and allied sector production as farm outputs, a country needs to have capability to process farm or unit level output through processing sector. Agribusiness sector considers all commercializa-tion of farm raw outputs and processed output. Here, we may note that processing is the largest sub-sector in agribusiness.
Apart from providing food, the agribusiness sector is important because it allows us to undertake routine activities similar to those in science, government, and education,
Nature of Agribusiness Supply Chain ◾ 9
which are important for developing economies. Agriculture has traditionally been one of the key sectors contributing to the national income, and is very important socially, as the country has a huge population and different strata of economic groups that are dependent on agriculture for food and on agricultural products for living.
Agriculture relates to farming, animal husbandry, and aqua-/marine-related activities. “Agribusiness” is a complex system reaching beyond the farm and com-modities or produce. It includes everything required to bring food to the consumer, even the challenges of providing inputs to farms for producing food. For example, if we consider the production of wheat to be a part of agriculture, agribusiness relates to all associated activities, from procurement of wheat and conversion into flour and/or processed food, till the end products reach the customers. Similarly, all aspects of the input side of the business, namely, capital equipment, and inputs such as fertilizers, are part of the agribusiness sector.
As in manufacturing, the agribusiness supply chain also depends on various role agents and their activities. If we look at the case of the branded wheat flour supply chain in India, there could be a number of actors, whose roles need to be clearly understood for the various activities performed. For example, the company that owns the brand Pureatta, which sells nationally, procures wheat mainly from western Uttar Pradesh and Punjab. The produce is seasonal, whereas consumption is year round. Thus, the company will be serving a huge market, and therefore setting up processing facilities across regions would not make sense. Similarly, centralized production and redistribution throughout regions would also not be effective. Thus, the company has adopted the strategy of engaging contract manufacturers, who procure wheat and convert it as per standards set by the company, and sells the end product through them in the form of Pureatta branded wheat flour. In this process, there are pro-curement agencies that buy wheat; convertors; brand owners who release production schedules, distribution plans, and controlled marketing; and a host of intermediaries such as regional distribution centre operators, transport operators, CFAs, and retail-ers. All these players are aligned towards optimizing resources and efforts for fulfill-ing Pureatta customers’ needs in the supply chain network. Each player has clearly defined roles and responsibilities, and is remunerated for the services rendered. The orchestration of such supply chain activities is what makes for the challenge, espe-cially in agribusiness, where seasonality, bulkiness, and perishability are involved.
Resources are another key aspect in agribusiness supply chains. Often, pro-duction centres and demand centres are widely spread out. Typically, production centres would be in clusters, whereas demand centres would be spread across the geography. This requires a number of role agents and activities to be structured to serve the demand. This would require resources such as processing units, stor-age centres, and transport operators, including, possibly, temperature-controlled trucks. Similarly, in terms of time, agricultural produce is bunched in certain time windows, based on seasonality, whereas consumption is all year round. This again requires very effective resource management through storage, handling, and even processing. In a country like India, which has a large geographical spread, with
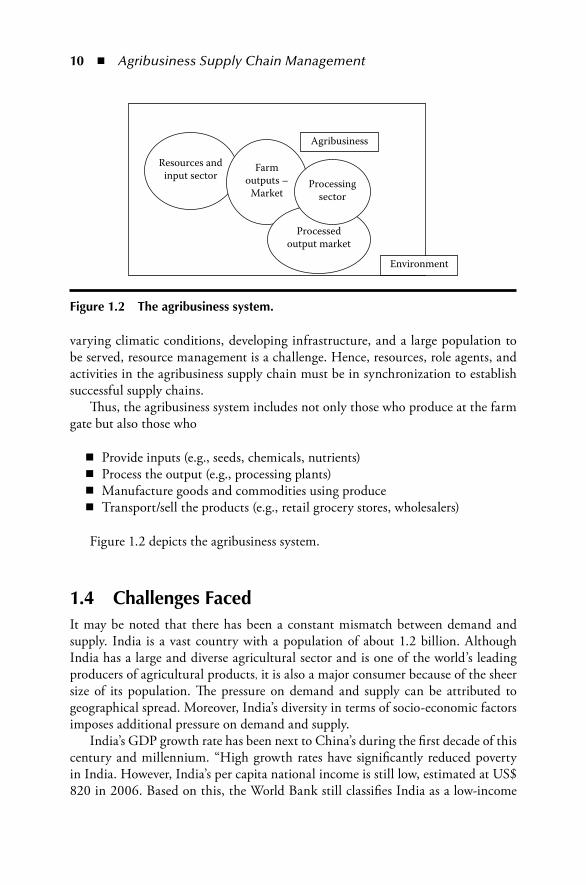
10 ◾ Agribusiness Supply Chain Management
varying climatic conditions, developing infrastructure, and a large population to be served, resource management is a challenge. Hence, resources, role agents, and activities in the agribusiness supply chain must be in synchronization to establish successful supply chains.
Thus, the agribusiness system includes not only those who produce at the farm gate but also those who
◾ Provide inputs (e.g., seeds, chemicals, nutrients) ◾ Process the output (e.g., processing plants) ◾ Manufacture goods and commodities using produce ◾ Transport/sell the products (e.g., retail grocery stores, wholesalers)
Figure 1.2 depicts the agribusiness system.
1.4 Challenges FacedIt may be noted that there has been a constant mismatch between demand and supply. India is a vast country with a population of about 1.2 billion. Although India has a large and diverse agricultural sector and is one of the world’s leading producers of agricultural products, it is also a major consumer because of the sheer size of its population. The pressure on demand and supply can be attributed to geographical spread. Moreover, India’s diversity in terms of socio-economic factors imposes additional pressure on demand and supply.
India’s GDP growth rate has been next to China’s during the first decade of this century and millennium. “High growth rates have significantly reduced poverty in India. However, India’s per capita national income is still low, estimated at US$ 820 in 2006. Based on this, the World Bank still classifies India as a low-income
Resources andinput sector
Agribusiness
Farmoutputs –
Market
Processedoutput market
Processingsector
Environment
Figure 1.2 the agribusiness system.
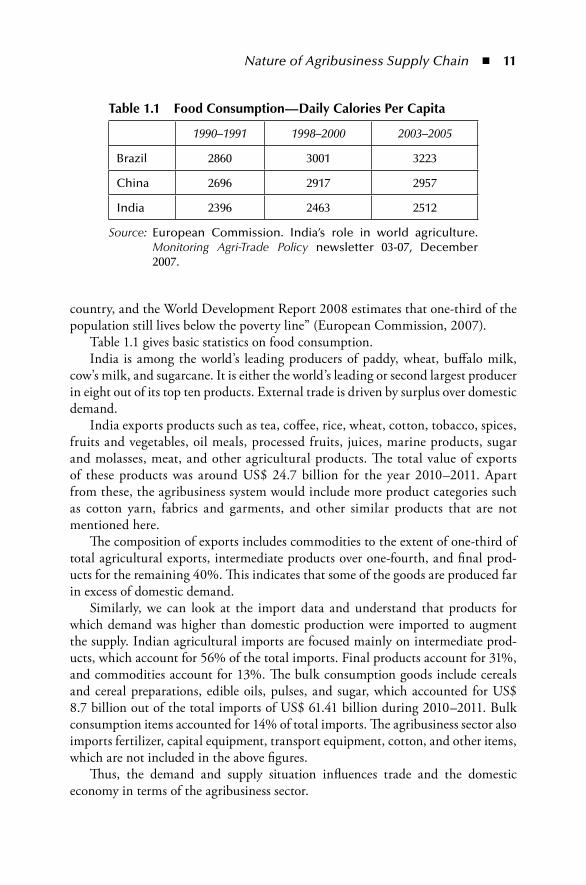
Nature of Agribusiness Supply Chain ◾ 11
country, and the World Development Report 2008 estimates that one-third of the population still lives below the poverty line” (European Commission, 2007).
Table 1.1 gives basic statistics on food consumption.India is among the world’s leading producers of paddy, wheat, buffalo milk,
cow’s milk, and sugarcane. It is either the world’s leading or second largest producer in eight out of its top ten products. External trade is driven by surplus over domestic demand.
India exports products such as tea, coffee, rice, wheat, cotton, tobacco, spices, fruits and vegetables, oil meals, processed fruits, juices, marine products, sugar and molasses, meat, and other agricultural products. The total value of exports of these products was around US$ 24.7 billion for the year 2010–2011. Apart from these, the agribusiness system would include more product categories such as cotton yarn, fabrics and garments, and other similar products that are not mentioned here.
The composition of exports includes commodities to the extent of one-third of total agricultural exports, intermediate products over one-fourth, and final prod-ucts for the remaining 40%. This indicates that some of the goods are produced far in excess of domestic demand.
Similarly, we can look at the import data and understand that products for which demand was higher than domestic production were imported to augment the supply. Indian agricultural imports are focused mainly on intermediate prod-ucts, which account for 56% of the total imports. Final products account for 31%, and commodities account for 13%. The bulk consumption goods include cereals and cereal preparations, edible oils, pulses, and sugar, which accounted for US$ 8.7 billion out of the total imports of US$ 61.41 billion during 2010–2011. Bulk consumption items accounted for 14% of total imports. The agribusiness sector also imports fertilizer, capital equipment, transport equipment, cotton, and other items, which are not included in the above figures.
Thus, the demand and supply situation influences trade and the domestic economy in terms of the agribusiness sector.
table 1.1 Food Consumption—Daily Calories per Capita
1990–1991 1998–2000 2003–2005
Brazil 2860 3001 3223
China 2696 2917 2957
India 2396 2463 2512
Source: European Commission. India’s role in world agriculture. Monitoring Agri-Trade Policy newsletter 03-07, December 2007.
12 ◾ Agribusiness Supply Chain Management
1.4.1 ProductionAs may be observed from the data on food consumption, India rates among the lowest. In spite of achieving high growth rates, India is still categorized as a low-income economy. Moreover, the data on imports reveal that edible oils and pulses, which are important dietary inputs in India, are imported in large quantities.
India had its first green revolution in the 1960s. However, the population has more than doubled since then. This requires improving productivity with bet-ter input and resource management. Furthermore, we need to understand mar-ket sensitivities and, if required, to work on the demand pattern for optimal use of available resources. Hence, there is a need to stimulate production or induce socially desirable standards for production functions, instead of allowing autono-mous production functions to operate. This calls for active policy orientation by agricultural economists and supply chain specialists, who need to be involved in decision making.
1.4.2 Labour and InputsAgriculture is the key employer in India, accounting for 60% of the labour force, down from 70% in the 1990s. The movement of the labour force has not kept pace with the development of the economy. Agriculture accounted for about 44% of the labour in China in 2002, and for 21% in Brazil in 2004. What do these numbers mean? Probably, low value added per unit of agricultural labour.
In India, agricultural value added per worker has grown by only 15% in real terms from 1990 to 2004, whereas it rose by 60% in China and more than doubled in Brazil. Apart from labour productivity issues, India suffers from the problem of low per farmer holding, which has an average size of less than 1.4 ha. Small farm holdings are fit just for subsistence, with low investment and productivity. Because of this, subsidies on farm inputs, including fertilizers, electric power, and irrigation water, have led to inefficient use of inputs. Among the challenges, a prominent one is the vagaries of nature, such as floods, droughts, and cyclones in the same year, all of which lead to supply side issues in Indian agriculture.
1.4.3 Supply Chain NetworkThe management of post-harvest losses is one of the major challenges faced by the supply chain network. Agricultural products are perishable in nature and losses occur due to various reasons such as lack of knowledge, improper handling, lack of storage facilities, and the inability of the various supply chain partners to work in unison.
Farmers are focused on producing a crop, purchase a number of inputs. They are capable of handling production in given conditions. A vast proportion of
Nature of Agribusiness Supply Chain ◾ 13
Indian agriculture is dependent on two monsoons, namely, the south-west and the north-east. Although cereals such as paddy and wheat benefit from irriga-tional support from rivers in catchment areas, a large proportion of the land is arid, and crops such as edible oilseeds and pulses that are grown here are mostly dependent on the monsoons. Farmers are exposed to high levels of production risk, and investments in inputs in the early stages of farming are not covered appropriately. There is a tendency to go to moneylenders or intermediaries who typically charge high interest. Also, farmers are not fully aware of crop insurance and other support provided by the government. They approach middlemen for their needs. Thus, by configuration, the supply chain becomes weak, with fre-quent breaks.
After the produce leaves the farm gate, processing and food manufacturing become the centrepieces of the supply chain network. There are a number of logistics and supply chain challenges that have to be overcome. The first and foremost issue from the supply chain profits perspective is whether there are fair price mechanisms and distribution management functioning in this sector. In a well- orchestrated supply chain network, firms and participating role agents are rewarded based on activities and performance, and there is a fair distribution of profits. There is great transparency, as all players are in partnership mode. However, in agriculture, indi-viduals and disaggregated farmers are unable to keep current with the markets, and thus are often exploited by the intermediaries.
The growth of organized corporate involvement in the fast moving con-sumer goods (FMCG) and the retail sectors has helped the farming community. Corporates such as ITC (a subsidiary of British Tobacco) have started engaging at the farm level, effecting better dissemination of information on market trends and reducing the levels of intermediaries through e-choupals, which are discussed later in Exhibit 1.1. Over the coming years, this situation is likely to improve efficiency in this part of the supply chain.
The next stage in the supply chain network is the conversion of raw products to forms that are more convenient to consumers. This stage would involve processing, grading, and even converting to products for consumption. Examples include the making of sugar from sugarcane, dairy products from milk, a host of beverages for adults and children, and jams and juices with improved preservation, and so on. The challenge here is procurement dynamics, susceptible to seasonality, and the carrying forward of inventory, given regulatory conditions in India.
The following lists provide quick summaries of the input, production, and processing subsectors.
The input subsector includes
◾ seed, nutrients, credit, equipment, fuel and chemicals, all of which are needed for operation (i.e., production)
◾ level of inputs and challenges
14 ◾ Agribusiness Supply Chain Management
◾ management of the physical flow, as in the case of improved seeds ◾ management of financial flows ◾ roles of intermediaries ◾ efficiency in terms of cost, availability on time and trade-offs ◾ other input change; use of energy ◾ due to efficiency, energy usage has not changed much on farms, just the type
of input ◾ relatively few input businesses compared to production or processing (look at
feed manufacturing vs. the number of farms!).
The production subsector includes
◾ the challenge posed by the average size of farms in India ◾ the trend towards increased specialization of production, taking advantage of
new technologies − genetically improved growth/survival
◾ the involvement of large corporations ◾ increased production efficiency brought about by specialization (increased
production in the face of decreased or constant levels of input) ◾ production economics
− production costs increase every year due to increased input costs − but costs of inputs are not related to commodity prices; when commod-
ity prices drop, gross farm income falls, but the amount spent on inputs does not.
The processing-manufacturing subsector includes
◾ all businesses that turn raw materials into finished (or partially finished) products
◾ aquaculture-related activities, largely accomplished by processors/processing plants
◾ those who package, distribute, and sell at times, places and in forms desired by consumers (the marketing “lot”)
◾ distribution, which represents a major share of the total amount spent by consumers on food.
1.4.4 Corporate and Organized BusinessIn India, agriculture and agribusiness are highly regulated in terms of procurement price, minimum guaranteed output price, distribution control under The Essential Commodities Act, land holding, and so on. Corporate involvement and organized approaches to agribusiness face challenges, although a few entities have successfully established their credentials.
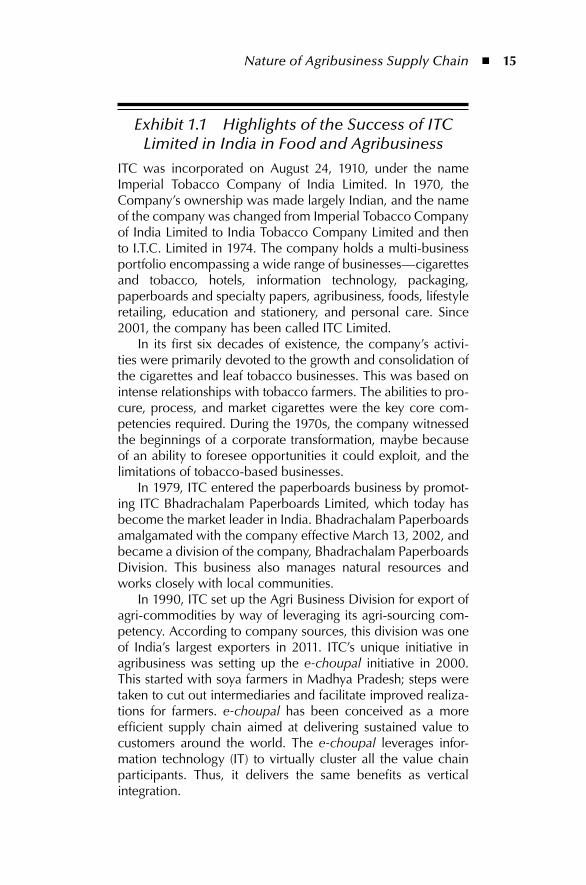
Nature of Agribusiness Supply Chain ◾ 15
Exhibit 1.1 Highlights of the Success of ITC Limited in India in Food and Agribusiness
ITC was incorporated on August 24, 1910, under the name Imperial Tobacco Company of India Limited. In 1970, the Company’s ownership was made largely Indian, and the name of the company was changed from Imperial Tobacco Company of India Limited to India Tobacco Company Limited and then to I.T.C. Limited in 1974. The company holds a multi-business portfolio encompassing a wide range of businesses— cigarettes and tobacco, hotels, information technology, packaging, paperboards and specialty papers, agribusiness, foods, lifestyle retailing, education and stationery, and personal care. Since 2001, the company has been called ITC Limited.
In its first six decades of existence, the company’s activi-ties were primarily devoted to the growth and consolidation of the cigarettes and leaf tobacco businesses. This was based on intense relationships with tobacco farmers. The abilities to pro-cure, process, and market cigarettes were the key core com-petencies required. During the 1970s, the company witnessed the beginnings of a corporate transformation, maybe because of an ability to foresee opportunities it could exploit, and the limitations of tobacco-based businesses.
In 1979, ITC entered the paperboards business by promot-ing ITC Bhadrachalam Paperboards Limited, which today has become the market leader in India. Bhadrachalam Paperboards amalgamated with the company effective March 13, 2002, and became a division of the company, Bhadrachalam Paperboards Division. This business also manages natural resources and works closely with local communities.
In 1990, ITC set up the Agri Business Division for export of agri-commodities by way of leveraging its agri-sourcing com-petency. According to company sources, this division was one of India’s largest exporters in 2011. ITC’s unique initiative in agribusiness was setting up the e-choupal initiative in 2000. This started with soya farmers in Madhya Pradesh; steps were taken to cut out intermediaries and facilitate improved realiza-tions for farmers. e-choupal has been conceived as a more efficient supply chain aimed at delivering sustained value to customers around the world. The e-choupal leverages infor-mation technology (IT) to virtually cluster all the value chain participants. Thus, it delivers the same benefits as vertical integration.
16 ◾ Agribusiness Supply Chain Management
The e-choupal is a blend of click and mortar capabilities. The village-level internet kiosks are managed by farmers—called sanchalaks. This enables the agricultural commu-nity to access ready information on the weather and market prices in its local language, and to benefit from knowledge on scientific farm practices and risk management, facilitating the sale of farm inputs and the purchase of farm produce from the farmers’ doorsteps.
Real-time information and customized knowledge pro-vided by the e-choupal enhance the ability of farmers to take decisions and align their farm output with market demand. The farmers benefit through enhanced farm productivity and higher farm gate prices, whereas ITC benefits from the lower net cost of procurement, having eliminated costs in the supply chain that do not add value.
ITC Limited has extended e-choupal to 10 states, cover-ing over 4 million farmers. ITC’s first rural mall, christened “Choupal Saagar,” was inaugurated in August 2004 at Sehore, Madhya Pradesh. On the rural retail front, 24 “Choupal Saagars” are operational in the three states of Madhya Pradesh, Maharashtra, and Uttar Pradesh.
ITC Limited entered into the food processing business by blending multiple internal competencies to create a new driver of business growth. It began in August 2001 with the introduc-tion of ready-to-eat Indian gourmet dishes. In 2002, ITC entered the confectionery and staples segments with the launch of the brands mint-o, Candyman confectionery and Aashirvaad atta (wheat flour). In 2003, the company entered the biscuits seg-ment, which was highly competitive. ITC Limited has managed a high degree of market penetration with its Sunfeast brand of biscuits. In 2007, ITC entered the fast-growing branded snacks category with its brand Bingo! In eight years, ITC’s foods pro-cessing business has grown to a significant size, featuring over 200 differentiated products under six distinctive brands, with an enviable distribution reach, a rapidly growing market share, and a solid market standing.
Source: ITC Limited, Our profile. 2012.
It can be seen here that the ability of corporations to be innovative and flexible is critical for growth and success. Also, we may infer from the ITC Limited example that establishing conglomerates and a multi-divisional diversified business would also help in a big way. Hindustan Unilever Limited (HUL) also has a similar track
Nature of Agribusiness Supply Chain ◾ 17
record. Many large companies in other sectors have divisions in the agribusiness along with their main line of activities. An example is the Jubilant Group, which primarily had a base in organic chemicals and pharmaceuticals and later entered the ready-to-eat-food segment. Household-name brands such as Amul, which is focused on dairy products, have grown horizontally across India integrating a large number of players under the umbrella of the Gujarat Cooperative Milk Marketing Federation Limited (GCMMF). A company such as Marico has stayed focused on its core area of operation involving branded oils and spices, and has become a market leader. Similarly, a brand such as Mother Dairy has been successful in the dairy and fruits and vegetables sectors in a focused geography. There are numerous examples of such businesses that have established themselves as lead players under challenging circumstances.
1.5 role of Supply ChainAs in any supply chain network, SCM in agribusiness involves the strategic man-agement of a network of relationships by a focal organization, aimed at catering to the demands of its ultimate customers, and in the process achieving efficiency and competitive advantage through its role agents and their individual and joint discharge of activities.
1.5.1 Players and Their ActivitiesAs depicted in Figure 1.3, the following are the different players and their activities in the agribusiness supply chain.
1. Resource owners: Resource owners are the trigger point in any supply chain. Most of the resources are naturally endowed and need to be subjected to a production process. In an agrarian economy, resources owners need not neces-sarily engage in production, but can lease their resources for third parties to produce. For example, owners may lease their land for others to raise crops. Furthermore, satellite farming is increasingly being practised in India where corporates are involved. For example, a sugar manufacturing company may have in its command area registered plots of farmers—either their own or leased—where crops are raised under the management guidance of the factory. The farmers harvest and sell the produce to the factory. Thus, resource manage-ment is a key aspect of the agribusiness supply chain. There are situations where seed producers lease farmers’ land for raising and harvesting their crop, and sell their produce for high profits. Farmers lend their resource in such cases.
2. Input providers: The agricultural production function requires a number of inputs, namely, seeds, fertilizers, pesticides, irrigation and equipment, capital equipment such as tractors, threshers, and so on. Labour is another critical
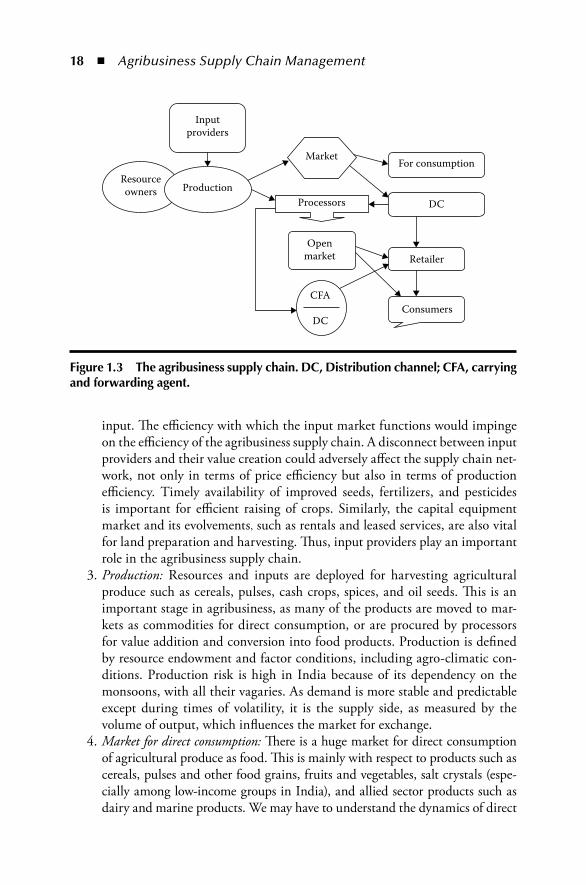
18 ◾ Agribusiness Supply Chain Management
input. The efficiency with which the input market functions would impinge on the efficiency of the agribusiness supply chain. A disconnect between input providers and their value creation could adversely affect the supply chain net-work, not only in terms of price efficiency but also in terms of production efficiency. Timely availability of improved seeds, fertilizers, and pesticides is important for efficient raising of crops. Similarly, the capital equipment market and its evolvements, such as rentals and leased services, are also vital for land preparation and harvesting. Thus, input providers play an important role in the agribusiness supply chain.
3. Production: Resources and inputs are deployed for harvesting agricultural produce such as cereals, pulses, cash crops, spices, and oil seeds. This is an important stage in agribusiness, as many of the products are moved to mar-kets as commodities for direct consumption, or are procured by processors for value addition and conversion into food products. Production is defined by resource endowment and factor conditions, including agro-climatic con-ditions. Production risk is high in India because of its dependency on the monsoons, with all their vagaries. As demand is more stable and predictable except during times of volatility, it is the supply side, as measured by the volume of output, which influences the market for exchange.
4. Market for direct consumption: There is a huge market for direct consumption of agricultural produce as food. This is mainly with respect to products such as cereals, pulses and other food grains, fruits and vegetables, salt crystals (espe-cially among low-income groups in India), and allied sector products such as dairy and marine products. We may have to understand the dynamics of direct
Resourceowners
Inputproviders
MarketFor consumption
Processors
Openmarket
Consumers
DC
CFA
DC
Retailer
Production
Figure 1.3 the agribusiness supply chain. DC, Distribution channel; CFA, carrying and forwarding agent.
Nature of Agribusiness Supply Chain ◾ 19
consumption and the channels through which direct consumption products reach the ultimate customers. After keeping a small amount of produce for their own consumption, farmers sell their output through the market, or to those who come for direct procurement. The government has established regulated markets for agricultural products. This helps farmers to sell in markets where there is a fair play of market forces. An alternative channel available to them is direct procurement agents, who act as intermediaries between the farmers and the direct consumption markets. Farm produce are also traded through taluk-wise agriculture producers’ cooperative societies, which act as intermediaries and make sure that all farmers get the right prices, and that payment is made within defined times (examples of such produce include cotton, groundnut, and turmeric). Whether through intermediaries or direct markets, the produce moves through wholesalers and retailers before being bought by the ultimate customers. The ultimate consumers could be individuals or institutional buyers who serve individual consumers, such as large hotel chains and canteens.
5. Processors: Processors are of paramount importance in agribusinesses. Much of the agricultural produce gets converted into food and other products as it reaches the final consumers. For example, India is the leading producer of sugarcane. Yet, only less than 1% of sugarcane is directly consumed. Almost all of the sugarcane grown is processed as plantation white sugar, gur, and khandasari, which are common sweeteners in India. Similarly, cotton, jute, and edible oil seeds need to be processed before reaching forms and shapes that are of value to consumers. Even food grains go through some processing, such as the conversion of wheat into flour for direct consumption and for the manufacture of products such as biscuits. Direct consumption items are also branded, and increasingly, consumers prefer small lot sizes over bulk buying, due to the conveniences of modern living. Processors’ business dynamics are influenced by the margins between input prices and output prices, conversion costs and margins on transactions, and value additions. Processors play a vital role in the supply chain network.
6. Open market: The open market has a key role to play in distribution chan-nels. As mentioned in Fig. 1.3 and “market for direct consumption”, produce for direct consumption moves through open markets. Similarly, processed agricultural goods also get sold through open markets, and directly from pro-cessors. For example, products such as edible oil, coffee, tea, and spices are widely traded in open market operations. Not only are physical flows enabled, but also the existence of commodities markets, where spots and futures and other options are available. Open market operations play a vital role in a sup-ply chain, defining its strength and the sharing of profits across the network.
7. Retailers: Retailers number in millions across the country, enabling the move-ment of products in the agribusiness supply chain. Traditionally, India has had the “Mom and Pop” store format of retail, and organized retail is just picking up. Although organized retail would benefit supply chain efficiency,
20 ◾ Agribusiness Supply Chain Management
local governments are protective of small traders, and hence, additional inter-mediaries are being encouraged. It is likely that with increasing experience of organized retail served by domestic firms, and with improvement in overall standards with technology breakthroughs, retail formats are likely to become more efficient.
8. Consumers: Consumers are the final point at one end of the spectrum of a supply chain network. In India, agribusiness is regulated with consumers’ interests being protected, as the socio-economic structure calls for such regu-latory measures. Consumers as a group exercise a lot of competitive pres-sure. There are certain areas where farmers’ interests and consumers’ interests are directly pitched against each other, resulting in competitive pressure and stress for policy makers.
9. Financial agents and impact on physical flows: In India, a majority of farmers are weak due to poor holding sizes. The ability to raise funding for operations from the organized financial system is limited. Hence, unorganized money-lenders take advantage and set low procurement prices, exploiting the plight of farmers. Due to poor information, poor knowledge, and lack of drive to break out from this cobweb, farmers are affected, and supply chain profits are usurped by the middlemen. This is the classic weakness in the system.
In early 2002, the government set up nation-wide multi-commodity exchanges, using modern practices for clearing and other activities. The system is yet to mature fully, although it has attracted huge volumes of trade. The ability to go beyond selective cash crops and the scope to regulate effectively on payments and deliveries will help improve financial and physical flows, and thereby, supply chain benefits will flow across the system. At this point, it is important to note that synchroniza-tion of agribusiness supply chains to enable distribution of supply chain profits among role agents and actors based on their time, effort, and risk assumption is vital. This would require effective management of financial, informational, and physical flows within, out of, and into supply chain networks.
1.5.2 Needs of Producers and ConsumersProducers, processors, and intermediaries work in silos to maximize their profits. Most of the time, producers are exploited by intermediaries in inverse proportion to their ability to reach the markets. Producers who have committed to resources look at long-term profits and the ability to recover a decent return on capital. Unfortunately, in the prevailing situation, this group carries most of the produc-tion risks in the supply chains.
As we can observe from Figure 1.4 on the conflicting needs of producers and consumers, consumers demand a higher level of satisfaction on a limited budget, and hence, demand favourable prices. Furthermore, they buy very small quantities of many products. Hence, we observe conflicts between consumers and producers
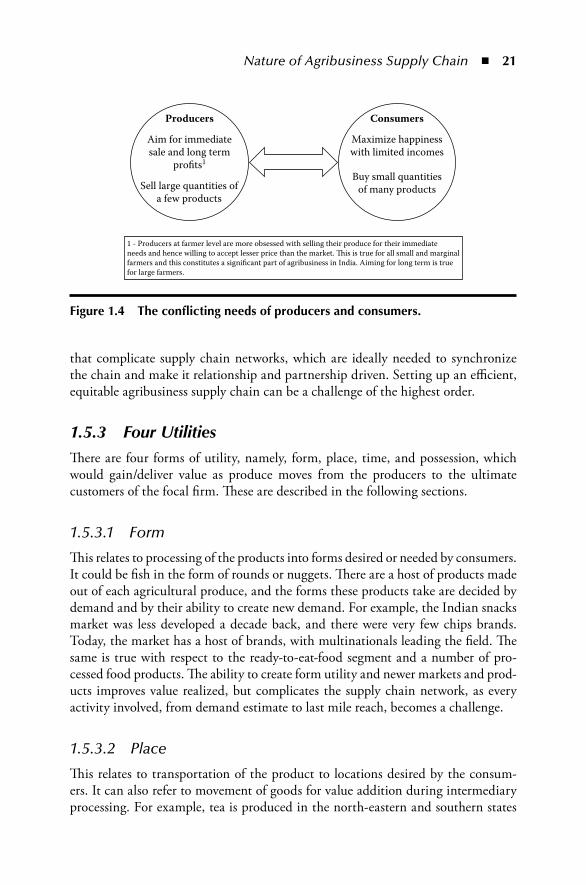
Nature of Agribusiness Supply Chain ◾ 21
that complicate supply chain networks, which are ideally needed to synchronize the chain and make it relationship and partnership driven. Setting up an efficient, equitable agribusiness supply chain can be a challenge of the highest order.
1.5.3 Four UtilitiesThere are four forms of utility, namely, form, place, time, and possession, which would gain/deliver value as produce moves from the producers to the ultimate customers of the focal firm. These are described in the following sections.
1.5.3.1 Form
This relates to processing of the products into forms desired or needed by consumers. It could be fish in the form of rounds or nuggets. There are a host of products made out of each agricultural produce, and the forms these products take are decided by demand and by their ability to create new demand. For example, the Indian snacks market was less developed a decade back, and there were very few chips brands. Today, the market has a host of brands, with multinationals leading the field. The same is true with respect to the ready-to-eat-food segment and a number of pro-cessed food products. The ability to create form utility and newer markets and prod-ucts improves value realized, but complicates the supply chain network, as every activity involved, from demand estimate to last mile reach, becomes a challenge.
1.5.3.2 Place
This relates to transportation of the product to locations desired by the consum-ers. It can also refer to movement of goods for value addition during intermediary processing. For example, tea is produced in the north-eastern and southern states
1 - Producers at farmer level are more obsessed with selling their produce for their immediateneeds and hence willing to accept lesser price than the market. �is is true for all small and marginalfarmers and this constitutes a signi�cant part of agribusiness in India. Aiming for long term is truefor large farmers.
Producers
Aim for immediatesale and long term
pro�ts1
Sell large quantities ofa few products
Consumers
Maximize happinesswith limited incomes
Buy small quantitiesof many products
Figure 1.4 the conflicting needs of producers and consumers.
22 ◾ Agribusiness Supply Chain Management
of India. But a large quantity of tea is consumed in the western and northern states. Hence, tea needs to be transported in the most cost-efficient manner, with quality being maintained in the process. Place utility plays a major role as demand centres and consumption centres are two different concepts. Baskin-Robbins, a leading ice cream brand in India, has a centralized manufacturing plant at Pune and distrib-utes its products across India by outsourcing to a cold chain operated by a third party, namely, Snowman, the cold chain company. Thus, place utility is accom-plished through this method. We can consider a number of such examples. Onion is produced largely in Maharashtra, but consumed across the length and breadth of India. Transportation facilitates place utility for customers.
1.5.3.3 Time
This relates to storing of raw material, products in process, and end products until they are needed, that is, time utility refers to the matching of demand and supply in terms of any time lag between their occurrences. For example, milk is produced in plenty during the flush season, between October and March, but demand is low during this period. Milk demand peaks during April to September, which is a lean period for milk production. Milk being a perishable product, the dairy will have to separate butter oil (fat) and other milk derivatives (milk solids other than fats) and store. During the lean season, when demand is high, it is possible to recom-bine milk derivatives along with fresh milk to enhance supply volumes. Thus, time value is created. Similarly, mango is procured during the summer months in India, namely, April to July, but the juice concentrate is consumed in the form of beverages throughout the year. Thus, time utility plays an important role in overcoming issues associated with seasonality in production where demand exists throughout the year.
1.5.3.4 Possession
This relates to the gaining of ownership or the right to use a resource for pro-duction, or a product for consumption. For example, land resource owners need not necessarily be producers. Many times, they lease out their lands to producers who raise crops. Similarly, in the case of processing, common facilities are created through cooperative organizations, and processing could happen through sharing of fixed resources. More commonly, this is seen in storage, where common facilities are shared. In all these cases, the right to use is what provides possession utility, which is important from the supply chain perspective.
1.6 Supply Chain DriversSupply chain drivers are key to the performance of supply chain constituents and role players across the network. A network is operational only when supply chain drivers are in place. The drivers are components of the supply chain structure that
Nature of Agribusiness Supply Chain ◾ 23
lead to effectiveness of the supply chain. In a way, supply chain drivers are to be viewed as operating tools for implementing supply chain strategies and carrying out operations. Drivers act as pillars of the supply chain on which blocks are laid and operations dwell. Drivers could be logistical drivers such as warehouse facili-ties, inventory, and transportation, or cross-functional drivers such as pricing, sourcing, and information. Apart from these drivers, certain external factors such as regulatory systems, international agreements, tax systems, and infrastructure may impact the performance of supply chains indirectly, through configuration of the drivers. Hence, it is important to understand the role of drivers in sup-ply chain performance, their components, and how they influence and impact competition.
Supply chain drivers ensure a balance between responsiveness to customers and efficiency in the supply chain, which enables a company to be competitive in its chosen strategic arena. It may be noted that there is a need for synchronization of the supply chain strategy with functional strategies such as product, marketing, and finance and with competitive strategies. The supply chain structure defines the strategic focus for the supply chain that needs to be accomplished through effective deployment of supply chain drivers. It may be important here to define these drivers in terms of facilities, inventory, transportation, sourcing, pricing, and information. Then each of the drivers would be taken up and each of its components and their importance in the supply chain would be analysed.
1.6.1 FacilitiesFacilities in a supply chain refer to the physical location of the nodal organiza-tion or its partners in the supply chain; the locations where a product or service is being fabricated, assembled, produced, processed, or stored. Theorists developed propositions based on weight-losing material and volume-based raw material tend-ing to be located near raw material sources. These are products such as sugarcane, cotton, edible oil seeds, and many other agro-based goods, which are located near the sources of supply of the raw material. FMCG such as staple food, biscuits, and other similar products have a normal tendency to be located near markets. They engage contract manufacturers to serve the market.
The role of production facilities in a supply chain is derived from the supply chain strategy on whether to achieve responsiveness for a given level of efficiency or to achieve efficiency at a desired level of responsiveness.
Facilities are of two types as shown in Figure 1.5.The set-up for a warehousing facility varies from industry to industry and across
firms. It also changes over time, as can be seen in modern times, where corporates follow just-in-time and vendor-managed inventory practices and use third-party logistics services. However, in agribusiness, the main purpose is to manage demand and supply gaps across time and regions. Furthermore, temperature control is also another important factor in warehouse decisions.
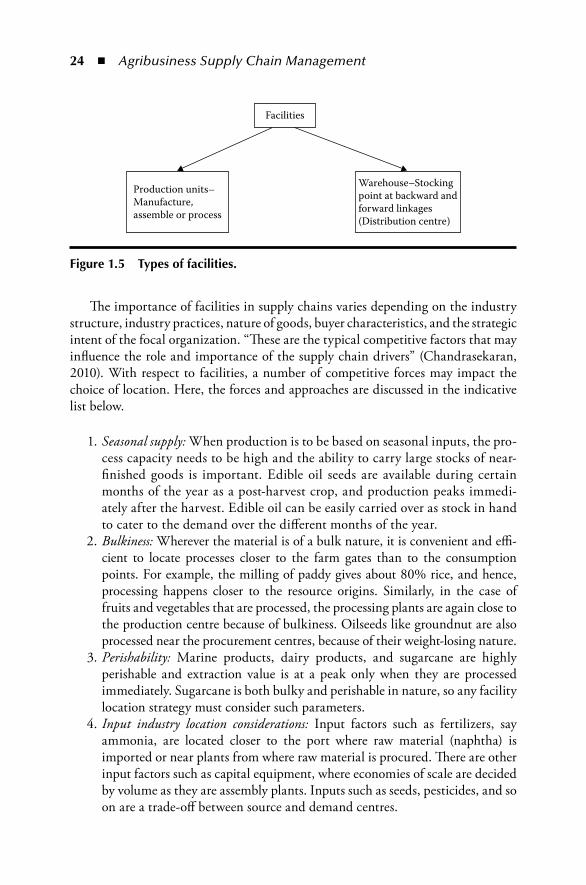
24 ◾ Agribusiness Supply Chain Management
The importance of facilities in supply chains varies depending on the industry structure, industry practices, nature of goods, buyer characteristics, and the strategic intent of the focal organization. “These are the typical competitive factors that may influence the role and importance of the supply chain drivers” (Chandrasekaran, 2010). With respect to facilities, a number of competitive forces may impact the choice of location. Here, the forces and approaches are discussed in the indicative list below.
1. Seasonal supply: When production is to be based on seasonal inputs, the pro-cess capacity needs to be high and the ability to carry large stocks of near- finished goods is important. Edible oil seeds are available during certain months of the year as a post-harvest crop, and production peaks immedi-ately after the harvest. Edible oil can be easily carried over as stock in hand to cater to the demand over the different months of the year.
2. Bulkiness: Wherever the material is of a bulk nature, it is convenient and effi-cient to locate processes closer to the farm gates than to the consumption points. For example, the milling of paddy gives about 80% rice, and hence, processing happens closer to the resource origins. Similarly, in the case of fruits and vegetables that are processed, the processing plants are again close to the production centre because of bulkiness. Oilseeds like groundnut are also processed near the procurement centres, because of their weight-losing nature.
3. Perishability: Marine products, dairy products, and sugarcane are highly perishable and extraction value is at a peak only when they are processed immediately. Sugarcane is both bulky and perishable in nature, so any facility location strategy must consider such parameters.
4. Input industry location considerations: Input factors such as fertilizers, say ammonia, are located closer to the port where raw material (naphtha) is imported or near plants from where raw material is procured. There are other input factors such as capital equipment, where economies of scale are decided by volume as they are assembly plants. Inputs such as seeds, pesticides, and so on are a trade-off between source and demand centres.
Facilities
Production units–Manufacture,assemble or process
Warehouse–Stockingpoint at backward andforward linkages(Distribution centre)
Figure 1.5 types of facilities.
Nature of Agribusiness Supply Chain ◾ 25
Apart from the above competitive factors, competitive structures influence facility location. In the case of agriculture, the market is imperfect, with many suppliers and buyers. A small number of firms that are in the branded market, with focus on selling processed goods and establishing branding in a commodity mar-ket, operate in oligopolistic conditions. Imperfect conditions with a large number of small processors may have inefficiencies, but the structure is difficult to alter for the better. The large players are few in number, and operate under oligopolistic con-ditions, where product and market differentiation are key. Facility decisions would also be determined based on these factors.
Key facility decisions, whether it is a manufacturing unit or a warehousing facility, would include location, capacity sizing, and operations methodology. As explained above, location decisions are driven by a host of factors such as com-petitive conditions, which include rival firms’ behaviours, resource availability, buyer behaviour, and entry and exit conditions. Many of these are strategic in nature. The fundamental trade-off is between cost efficiency and responsiveness to customers in most of the situations.
Capacity sizing decisions would be driven by both strategic and plan-ning level decisions. At the time of capacity creation, it would be more strategic, looking at the long-term demand and supply conditions, plant cost and the economies of scale in production and other mana-gerial functions. But once capacity is created, it is the near-term busi-ness cycle that influences capacity utilization, depending on demand and supply conditions. There is a need to have flexibility built into the capacity created, to enable adjustments to changing market scenarios. (Chandrasekaran, 2010)
Production choices and manufacturing and process designs are again driven by many competitive and technological factors. They are driven by the level of matu-rity of the technology deployed, the degree of associated capital that provides flex-ibility, the ability to handle flexibility, and its impact on operating cost efficiency. Changes in the snack foods market, sugar manufacturing along with co-generation of power, and increasing acceptance of refined edible oil are some of the examples of intensified competitive conditions impacted by choice of technology and product features in India.
It is interesting to note here that there have been developments in using mobile processing facilities at the farm level in India. These developments have happened through learning from developed countries and customizing to local requirements. Small and medium farmers can optimize returns by using such technology for value enhancement. For example, there is a company that markets mobile seed cleaning and grading plants, which help to process seeds directly in the fields. “The machine is capable of cleaning and grading of all cereals, pulses, oil seeds, spices, forestry seeds, vegetable seeds, fodder crop seeds etc., including wheat, maize,
26 ◾ Agribusiness Supply Chain Management
barley, millet, gram, soya, sunflower, mustard and jute” (http://www.agrosaw.com/smp.html).
In the case of warehouses and distribution centres, facility designs relate to location, the number of warehouses and the level of investment in the warehouses. The trade-off here is decided by responsiveness, which leads to decentralization and increased number of warehouses compared with centralization of facilities with one large warehouse, which focuses on cost efficiency.
Overall, facility decisions depend on a number of competitive factors, and from a supply chain perspective, the choice depends on which matters more: frequency and level of service to customers or cost of providing the same. Resource endowment and its influence on supply chain decisions in the case of farm output to direct markets and intermediary processes and market sectors of agribusiness are key decision areas.
1.6.2 TransportationTransportation plays a key role in the SCM of a nodal organization, as the move-ment of goods across supply chains to ultimate customers is an important value-creating activity. From the available array of transportation options, the nodal organization opts for a specific choice at every stage based on cost efficiency and responsiveness as the supply chain focus. When a firm operates on a supply chain focus of efficiency, then it chooses low-cost transportation, which may not neces-sarily be responsive.
On the other hand, when a firm operates on responsiveness as the supply chain focus, then speed of delivery would be the criterion, and cost is given lesser importance, as customers would be able to absorb the incremental cost for the service levels desired. The choice of transportation is driven not only by cost and responsiveness but also by a host of other factors within the framework of decision making. For example, highly perishable products are moved through air cargo, which would be expensive. Thus, responsiveness could be due to fac-tors such as the criticality, the value, or the perishable character of the product.
For a supply chain manager, the ability to balance the transportation cost with responsiveness would become important. Also, the spread of customer groups to be served and the efficiency of operations could be influencing factors in transportation decisions. It may also be noted that in a supply chain situation, the transportation decision is influ-enced by the location of facilities, inventory and information efficiency, like in the case of a national brand of processed agricultural produce such as wheat flour and edible oils. (Chandrasekaran, 2010)
The effectiveness of transportation as a driver depends upon the competi-tiveness forces which are operating in the industry in which firm is into. They are briefly discussed here.
Nature of Agribusiness Supply Chain ◾ 27
Cost leadership: When a firm adopts cost leadership as a strategy, transportation decisions may involve working out the most cost-effective options. More importantly, transportation can facilitate cost leadership through structuring of the network for effective planning of routes and schedules of vehicles, for both procurement and distri-bution. For example, effective procurement management of inbound milk collection in the dairy business achieves cost leadership through transportation. Similarly, on out-bound transportation, managing multiple chamber temperature-controlled vehicles for distribution could be an issue for a firm handling marketing of ice creams, dairy products such as flavoured milks and chocolates, and dry products such as biscuits.
Differentiation: When a firm adopts product and market differentiation as a strategy, transport decisions impact the choice of strategy. For example, when a plant decides to be a national brand or even a global brand in selling processed agricultural produce such as tea, transportation decisions play a vital role, as mode selection and assured placement of vehicles are critical for sustaining brand share.
Focus: When a firm adopts a focus strategy, transportation decisions can play a vital role in achieving competitive advantage. Let us take an agribusiness input industry such as fertilizer. The firm focuses on selling fertilizers of different nutri-ent values based on agro-climatic conditions. Consumption patterns and timings could be variants, and the firm needs to structure its distribution plan by designing transportation based on local market conditions.
Alliance and co-options: Alliances and co-options among firms could be an important transportation strategy for a firm, especially when it moves bulk mate-rial across long routes. Furthermore, when there is a need for deploying dedicated vehicles such as temperature-controlled and containerized trucks, backhaul support through co-option among user non-competitive companies can provide a competi-tive advantage. In the case of containerized trucks, alliances with truck operators for deducted trucking again provide a competitive advantage.
Apart from the firm level and strategic business unit or product group-wise transportation strategy deployed for supply chain efficiency and effectiveness, industry-led practices can also facilitate improvements. For example, transport operators in India have strong associations that constantly work on improvements for goods carriage. Furthermore, they have effective methods of exchanging infor-mation in order to improve asset utilization and overall economy of business, thus contributing to cost efficiency in transportation.
Similarly, there are regional and district-level operators’ associations that pro-cure orders for movement from major industries and distribute demand and supply to streamline operations. Such initiatives over the years are bound to strengthen practices, and a number of competitive advantages are likely to come up. For exam-ple, for inbound transportation of sugarcane, which is an intense seasonal activity, transportation cannot be resolved without the involvement of local associations. In the same way, manufacturers, especially those who move products in specialized vehicles such as temperature-controlled and containerized trucks, promote good practices through co-operation among themselves, enabling better utilization and
28 ◾ Agribusiness Supply Chain Management
investment in assets and bringing about overall improvements in the efficiency and effectiveness of all players in the supply chain network.
It may be noted that the key transportation decisions that a supply manager may look into would include selection of the transportation modes and the design of a transportation network. Generally, there are a number of options available, involving alternative modes of transport, for movement of cargo. However, the choice is determined by the cost of transportation and the ability of the network to pass it on to the customer.
A regular raw material item, which is an input in manufacturing, would have a standard flow, and its transportation mode would be fixed on the basis of cost and flow time factors. For example, in the case of edible oil refining processes where the brand owner buys material from the open market and processes, brands, and markets its products, production is defined by a production plan and schedule, and the arrival pattern is defined based on a given stocking plan. Transportation is defined by the bulk of material and distances involved, as also on the options available for the nodal organization. In this case, network selection would also be involved, as material may come from multiple points or vendors, and aggrega-tion through routes is possible. On the other hand, where decisions involve issues such as supplementing inputs with import of raw material from abroad, the cost of imports and transportation, including handling, would decide the selection of the final option.
Thus, transportation as a driver plays a critical role in supply chain net-work decisions, and is an important competitive factor that could influence the business success of the nodal organization as well as the participating players. Transportation as a driver is key to structuring inbound and outbound transporta-tion options for farms outputting to both direct markets and intermediate proces-sors. Disaggregation, cost management, and network design factors are some of the managerial issues that would need focus.
1.6.3 InventoryInventory plays a significant role not only in the supply chain but also in competi-tive strategies. A company’s competitive leadership could be impacted positively in certain industries because of effective inventory management practices. If respon-siveness is the supply chain strategy, the competitive situation must be one where the customer is keen on product variability and quick response rather than cost. Leadership here would depend on the ability to accomplish this with the highest degree of responsiveness, and the ability to be perfect or near perfect in fulfilment of orders. For example, in the marketing of processed agricultural outputs such as juices, inventories across the chain, ensuring freshness, would decide the success of the brand.
Inventory as a force in competition is also influenced by business cycles and by the need of a firm to adjust inventory, facility management, and production in
Nature of Agribusiness Supply Chain ◾ 29
response to movements in business cycles. For example, during the flush produc-tion season perishable products would be handled under an inventory policy of liquidating stocks and implementing an appropriate inventory carrying policy.
Inventory management policies are interwoven with stages of the product life cycle. During the introduction stage, product availability is the key factor in cap-turing market share, and the firm would focus on responsiveness, not on cost. The high level of demand uncertainty of the introduction stage does not lend itself to effective demand planning. At this stage, the firm is far from finalizing its supply chain strategy, as customer acceptance and growth plans are yet to be crystallized. In such conditions, holding high levels of inventory in the emerging product supply chain network assures product availability. Failing this, a firm not only incurs lost sales opportunities but also loses a valuable intangible asset, namely, its image in the market. Therefore, overstocking is the preferred tactic.
During the growth stage, inventory becomes a less important factor in ensuring responsiveness than at the introduction stage. As demand uncertainty decreases, the accuracy of demand forecasting improves, which in turn helps assure product availability by improving demand planning. The approach could still be responsive, as the firm may not like to lose sales opportunities during the growth phase, and this would be critical for building up the brand image. The competitive strategy would be to augment market share, and cost may not be the focus. Because it is the growth phase, the ability to pass on cost would also be available.
At the product maturity stage, efficiency is the dominant supply chain strat-egy. At this stage, the product becomes standardized, and growth rate is stable and predictable. A firm would focus on economies of scale to lower unit cost. In competitive situations, inventory becomes a cost factor in the profit and loss account and a liability in the balance sheet. The focus would be to reduce inven-tory to an optimal level, given demand predictability. Production focus would also move on to increasing commonality among products in a group and achiev-ing a configuration close to the demand point so that the value of the inventory held is low.
During the decline stage, falling sales volumes and product prices are the pri-mary features. A firm would focus on liquidating stocks in order to reduce losses due to inventory obsolescence. Cost would be the main driver in such conditions. This situation need not necessarily apply to a strategic business unit or a firm in a declining phase. It could also be applicable to a product in a product category or group.
Thus, inventory management becomes crucial, and is related to a firm’s strategic intent and the competitive situation in which it operates. Apart from product lifecycle, many industry factors such as stage of industry and competitive responses from stakeholders may also influ-ence inventory policies, which need to be understood by the supply chain manager. (Chandrasekaran, 2010)
30 ◾ Agribusiness Supply Chain Management
Inventory could include raw material, intermediary or in-process goods, and finished goods. These forms of inventory decide every stage of the supply chain, and how it intertwines with its role play-ers and creates value for the ultimate customers. Further, such cat-egories of inventory form the basis for inventory decisions relating to order phases, uncertainty handling, and seasonality factors. (Chandrasekaran, 2010)
Goods that are used as inputs in a process are classified as raw material. They form a part of the total value in goods produced in a supply chain at every stage of the supply chain as it progresses towards the ultimate customers. For a sugar manufacturer in India, the raw material is cane and the output is plantation white sugar, whereas in Brazil. In India, beet is used to produce raw sugar or refined sugar. In the refinery process, raw sugar becomes the input. In the manufacture of chocolates or syrups, sugar or refined sugar could be the input for different prod-uct category outputs. It is important to understand the different classifications of inventory in any production process, and their criticality in designing inventory holding policy. Although it is a rudimentary concept, it is basic process mapping and plays a vital role in policy making.
To decide on the balance between efficiency and responsiveness, one may have to understand cycle inventory, seasonal inventory, and safety inventory. Cycle inven-tory is the average amount of inventory used to satisfy demand between receipts of shipments. The choice is between a large inventory with a longer cycle time and less inventory with frequent offering, thereby reducing average lot size. Seasonal inven-tory refers to the beefing up of or slashing of inventory for peak and slack inventory seasons, respectively, based on experience and predictability. Seasonality could be due to demand or supply or both factors. The challenge for management would be to decide on the quantum of seasonal inventory based on the efficiency level for a desired level of responsiveness.
Safety inventory is basically built up to counter uncertainty in demand. If demand is certain, managerial decisions on inventory are handled rather firmly, based on experience and customer research. However, sudden factors can unexpect-edly affect demand. Firms may not like the opportunity to sell and corner market share during such spurts in uneven demands. Any firm will have to carefully bal-ance between the loss of likely sales for want of stocks and excess stocks due to overestimation and attempting to be responsive.
It may be noted that inventory plays a key role in the supply chain and in the competitive position of firm in its industry, irrespective of the form of inventory and the value creation arising from the utility it brings to all players across the supply chain network. The overall objective of balancing responsiveness and cost in terms of efficiency
Nature of Agribusiness Supply Chain ◾ 31
has to be achieved. Overcoming the challenges of managing stock and making the right managerial decisions with respect to stock and releases are key to success in the competitive agribusiness market. (Chandrasekaran, 2010)
1.6.4 SourcingSourcing has a key role in the supply chain, and would be considered as one of the drivers in many businesses, especially in agribusiness systems. Sourcing refers to a number of strategic activities that go into supplier relationship management right from selecting a vendor, engineering and configuring products along with vendors, to making strategic investments for committing with the vendor as a competi-tive differentiator to being a single vendor who has a proprietary commitment on resource and technology.
In the supply chain, sourcing becomes important, as it is the set of busi-ness processes required to purchase goods and services to make products for the ultimate customers. Supplier development and synchronization for production, product development, and cost management are going to be challenges. If we consider a manufacturer of capital machinery, say tractors, the demand for trac-tors for new capacity creation, expansion, and replacement is a derived demand. New capacity creation and expansion especially depend on the performances of agriculture and the monsoon. Replacements could be a function of the age profiles of the machinery deployed, technology advancement, and the industry cycle. However, tractor manufacturers will have to keep their suppliers engaged as per the requirements of their business. During a recessionary trend, derived demand may not be high. But critical component suppliers have to be taken into confidence and kept engaged. A supplier at this stage would expect transparency and commitment to get involved in future growth plans, when agriculture turns around. Hence, it may be noted that suppliers need to be categorized based on their positions with respect to bargaining power, criticality, and the value of items procured from them. Investing time, effort, and at times even financial inputs is important for effective SCM, as these would decide long-term cost efficiency and responsiveness.
The effectiveness of sourcing as a driver depends upon the competitive forces of the industry in which a firm is operation. They are briefly discussed here.
Cost leadership: Sourcing as a driver in supply chain focus may have conflicting influences when it comes to cost leadership and responsiveness. Generally, econ-omies in production would be facilitated to reduce costs of manufacture and at the same time, optimize sourcing efficiency by minimizing inefficiencies in buy-ing, such as wastages due to quality, adjustment costs in input, number of defects, and so on. “Long term contracts in volume, with a commitment on purchase, are more price efficient” (Chandrasekaran, 2010). However, in agriculture, factors
32 ◾ Agribusiness Supply Chain Management
such as seasonality and perishability adversely influence sourcing strategies for cost advantage. Because production is lumped, sourcing also needs to be managed when output reaches markets, as farmers in India do not have holding size power. Cost effectiveness in sourcing is determined by negotiating power, size, and so on. Nevertheless, cost leadership can be achieved if appropriate procurement policies are in place.
In India, there is an informal market for futures and options and there are for-mal, officially regulated commodities markets operating, which helps in managing cost. When we mention informal markets, we are talking about a system wherein the intermediary, who is typically a moneylender funding agriculture operations, ties up the procurement of produce at a predetermined price. Invariably, this leads to exploitation of the suppliers and poor synchronization among the components of the agribusiness supply chain network.
To overcome this, the government has permitted futures and options in selected commodities, so that market operations determine the values of the produces and improve supply chain benefits. Organized players can gain cost leadership by participating in this market.
Differentiation: Although a firm addresses differentiation as a sourcing initia-tive, responsiveness and customer satisfaction play a major role. Differentiation could be in the market, the product, or both. Multiple stock keeping units and varied customer groups would be the normal trend while deploying differentia-tion. Flexibility in supply as per the demand of the nodal firm’s production plan is the key. It may involve incremental costs due to low volume and change over. Customers could be in a position to absorb the costs. Sourcing strategies must enable the serving of different markets and product segments; for example, a dairy company must be able to sell in all regions and all through the year, although the production of milk may go through peaks and troughs. Similarly, the firm must be able sell differentiated products, as one market area may demand bulk milk, whereas another may demand dairy products, and so on.
Focus strategy: A firm may adopt a low-cost focus strategy for a large segment or a focus strategy with differentiation for a market or a combination of both for nation-wide territories. In such cases, balancing between efficiency and respon-siveness is important for success. The low-cost focus would be suitable for volume-based businesses, where customers could be price sensitive and product groups could be the focus of the nodal organization. Sourcing options in such cases should focus on efficiency, and the low-cost mode is preferred. Many products in agribusiness, which serve staple consumption markets, would belong to this cat-egory. Alternatively, “differentiation to build customer loyalty with broad product groups with narrow segmentation is possible. This may serve responsiveness to customers and sourcing for product variability or speed of service would require a customized approach and increased cost” (Chandrasekaran, 2010). Examples of this market could be ice creams, health quotient-driven high-end edible oils, and so on.
Nature of Agribusiness Supply Chain ◾ 33
Thus, sourcing forms play a key role in managing responsiveness and cost effi-ciency in any supply chain network, depending on the chosen focus of the nodal firm. Certain business sourcing could play a larger role as product development and the proprietary nature of resources and engineering may decide industry com-petition; suppliers may have strong bargaining power, compelling the nodal firm’s supply chain manager to work in a partnering mode.
There are certain country-based factors that give some firms a competitive advantage as potential sourcing partners. These advantages bring value to the firms, and also drive industry to higher levels of maturity. Similarly, foreign firms look at India for sourcing agricultural produce in processed forms for competitive advan-tage. Typical produce items are tea, coffee, and spices.
Domestic firms in agribusiness will have to work closely with farmers and intermediaries to plan and utilize their production capacities. Although time- consuming, it is important to conduct negotiations and work closely with these supplier segments. It requires lot of maturity and time to work fruitfully on such relationships. There are a number of leading companies such as Amul, ITC, and HUL that have established well-refined processes and demonstrated success.
1.6.5 PricingAn efficient supply chain moves the right product at the right time, the right place, the right quantity, and the right quality to the right customer, and most impor-tantly, at the right price for everyone in the supply chain network. Hence, it is clear that price would be one of the drivers of the supply chain. With one’s understand-ing of supply chain focus, in the trade-off between efficiency and responsiveness in a supply chain structure, price has connotations for both. An efficient supply chain is one where customers would prefer the best price at close to market efficient levels. Price would be one of the key factors in deciding demand. Although simple economics states that price is determined by demand and supply factors, in real life, business decides on supply under normal conditions keeping in view the demand and realizable price. Therefore, prices would necessarily be a factor in defining and configuring a supply chain.
However, when the supply chain manager focuses on responsiveness, where cus-tomer service is of paramount importance, it is believed that the customer would be able to pay a premium price, and price setting decisions would take this into consideration. “Supply chain network players reckon on this while defining and executing their activities, so that the incremental cost and margin could be borne by customers. In this case, price setting happens based on the level of customer ser-vice, and monopolistic practices such as price fixation, product differentiation and so on would be based on the realizable price” (Chandrasekaran, 2010). However, in agribusiness, farm output creates imperfect market conditions, where producers would not be able to exploit market conditions to their own benefit. In the case of the processed output segment, price is determined by supply conditions in terms of
34 ◾ Agribusiness Supply Chain Management
volume, demand factors, and sensitivities—for example, pressure built up in public forums and policy-making circles.
Thus, price would be one of the drivers of the supply chain network, whether the focus is on efficiency or responsiveness. The other drivers would influence and be influenced by the price factor.
We can consider the Indian biscuits market, which is worth more than `5000 crores, a large share of which comprises the unbranded and rural markets. Until 2003, Britannia and Parle were the two companies with brand names that domi-nated the branded biscuits market. For any company to be successful in this arena, it must be able to create a deep impact on the “bread-and-butter low margin, high volume, popular and low-priced small-pack glucose biscuit segment,” apart from the high-margin urban segment for cream biscuits. A typical customer is a member of a low-income group/daily wage earner who looks at energy boosting bouts during breaks in work. The selling points here are price and availability. Brand loyalty and recall matter least when price and availability are ignored. In this market, because the product is standardized for a branded player, price is a key differentiator. The price, coupled with supply chain efficiency (especially in distribution management), is a competitive force that determines success.
Another area which is of interest is the sale of perishables in supermar-kets in India. The perishables segment, especially in the case of fruits and vegetables, is one of the segments that determine the success of a store. Perishables are sensitive to price and freshness factors. Price is actually a function of freshness. The challenge for the supply chain manager is to ensure that fresh stocks keep rolling over the counter at competitive prices. When a customer walks into a store and is unable to find perishables of the right quality and price, the customer moves on to the next store, which means the store manager loses a poten-tially large sale. Thus, to overcome this problem, stores work on daily low-price time windows, when they liquidate stocks of perishables at low price points, increasing footprints into the store during non-peak hours, boosting sales volumes and allowing replenishment with fresh stocks for peak hour sales, thereby improving on price realization. Thus, price plays a key role in the ability to stay competitive. We may note that this strategy of price discounting and liquidation is not lim-ited to perishables alone, but is prevalent for many other commodities also. (Chandrasekaran, 2010)
The role of pricing as a supply chain driver is crucial in supply chain effective-ness, as every intermediary completes a transaction at a price that forms the cost for the next stage. The ultimate customer, for whom the focal organization works to provide value, pays for it. Competition and industry structure have a role in pric-ing. Traditionally, economists have proposed various theories on how price fixation
Nature of Agribusiness Supply Chain ◾ 35
happens in markets, and on how non-price competition can influence business. There are situations where non-price factors may attract customers. We must real-ize that all such factors are influenced and balanced by way of cost and price. We may have to delve into the fundamental concept of cost efficiency, which is primar-ily price sensitive and opt between functional product groups and responsiveness, or customer service-driven factors where customers are willing to pay premium prices for the desired levels of service. Hence, price is an aspect that a supply chain manager has to reckon with in order to achieve the overall business objective of syn-chronizing the contributions to the value chain of all the players linked to the nodal organization. Typical issues would be, given the government policy and incentives structure, is it a boon or bane for agribusiness efficiency for farm gate sector and for processing sectors? It looks like that the choices are between the ability to cushion margins by passing on inefficiency to consumers or the inability to manage margins and get stuck between farm gate and consumers through intermediaries.
1.6.6 InformationIn today’s business world, information and IT are paramount, and it needs a broad conception to encompass all the information that businesses create, and to use it. A wide spectrum of increasingly convergent and linked technologies helps to pro-cess information to collaborate, partner, and co-perform with entities and players across the supply chain, creating value for customers, suppliers, intermediaries, and the nodal organization. All such linkages are usually managed by the nodal organi-zation. Earlier, companies were competing through IT as a differentiator. However, the evolution of technology and reduced costs have made it a threshold competence for an organization.
IT changes industry structures and the fundamentals of competition with the application of new generation technology and process speeds. This is true for the supply chain domain as well. Some examples in business are the application of technology platforms for business processes such as sourcing and the facilitation of buying and selling through cyberspace.
ITC’s e-choupal clearly shows the competitive advantage that technology can bring to a company and its supply chain. IT can also create competitive advantages by giving companies new ways to outperform rivals in growth strategy and in the ability to create a new business model for existing business operations.
We could describe information as a driver along with the product life cycle of a focal organization. During the introduction stage, product-specific activities and transactions are limited to the focal firm, its closely located divisions, and a limited number of trading partners. The underlying business processes of the introduction stage tend to be less complex with respect to the number of entities. The focus here would be to ensure that the product meets customer acceptance and that the model is scalable. Hence, the range of IT capability requirements is limited to this ambit, which makes for a simple structure. Thus, during the introduction
36 ◾ Agribusiness Supply Chain Management
stage the focus would be on a reliable, cost-efficient information system to expedite an efficient supply chain, although the predominant supply chain focus would be responsiveness.
As sales and market share increase during the growth stage, the focal firm establishes more trading partners and suppliers with increased interaction across the network. Therefore, information becomes a critical driver, as it helps coordi-nate activities across the supply chain. At this stage, information systems such as Enterprise Resource Planning (ERP) and domain-based SCM systems are deployed to improve supply chain functioning.
The mature commodity product’s supply chain may extend over a wide area in terms of geographical locations. Efficiency is the dominant supply chain strategy. A stable market share and mature relationships with trading partners facilitate the establishment of complex transaction systems across the supply chain. The supply chain becomes more complex and highly networked, with multiple tiers and partners. The reach requirements include the ability to interact over the entire supply chain network, including customers, irrespective of the technologies at specific network locations. The range requirements can be extensive, because the capability is needed to execute complex, demanding transactions. Investment in IT could have reached the maturity level, but needs to be responsive to market requirements based on technology obsolescence and the needs of the supply chain network.
During the decline stage, as the focal firm loses trading partners, the supply chain shrinks. The focus would be to be cost efficient, and it may not be possible to update technology and keep it contemporary, but what exists needs to be very effective.
Apart from these, technology can be a key input in many strategic situ-ations involving the supply chain. The fundamental trade-off is to pri-oritize between efficiency and responsiveness, which could be related to the push and pull strategy of the supply chain. Investment in technol-ogy is largely driven by budgets and ease of implementation, without the need for change of business process time and again. Though process improvements and changes are welcome, frequent interventions irk the partners, and learning time requirements need adjustment along the entire supply chain network. Hence, while deploying enabling technol-ogies, a supply chain manager would consider such soft issues in terms of acceptability and ease of implementation. (Chandrasekaran, 2010)
Although there might have been scepticism about IT applications in India a decade back, a large number of firms have since revolutionized their operations and their industries with technology applications, as in the case of ITC, Marico, Britannia, and Amul (GCMMF). Proliferation in the use of handheld devices would further improve the pace of technology adoption.
Nature of Agribusiness Supply Chain ◾ 37
1.7 external FactorsThese drivers are influenced by certain external factors such as regulatory systems, international agreements, tax systems, and infrastructure. For example, the lack of cold storage availability at a reasonable cost is a limiting factor in India, and farmers with small- and medium-sized holdings expect government support for this facility. For many reasons, establishing and operating cold storages would not be the core competency of the government, and hence, the system suffers.
Regulatory systems, especially with respect to procurement price, output price ceiling, and interventions through export–import policies impact agribusiness. Agricultural input industries are heavily dependent on government support in the form of subsidies and duties exemptions. Price and distribution control also impact the input segment. Infrastructure issues can badly hurt production, especially when there are power shortages or withdrawals of subsidies to farmers.
1.8 ConclusionTo conclude, the agribusiness supply chain hinges on two criteria, namely, how well goods and services flow from businesses to consumers, which is referred to as efficiency, and how the SCM system meets the needs of consumers, which is referred to as responsiveness. Although supply chain decisions in manufactur-ing and services are driven by these two criteria through six drivers, agribusiness becomes complex because of two groups within the system, namely, the farm gate produce market and the processed goods market, and the play of a host of operators who tend to have divergent business objectives, with a narrow focus on short-term gains and decision unit level profit making. Farm gate produce markets are mostly dominated by traders, and are biased towards traders, not farmers. Consumers also do not benefit, and the inefficiency in the system is only helping intermediaries.
referencesChandrasekaran, N. Supply Chain Management, Oxford University Press, India, 2010.Christopher, M. Logistics and Supply Chain Management: Strategies for Reducing Cost and
Improving Service, Financial Times Pitman Publishing, London, 1998.CSCMP Supply Chain Management. Available from: http://cscmp.org/aboutcscmp/
definitions.aspEngle, C. R. and Quagrainie, K. Aquaculture Marketing Handbook, Blackwell Publishing,
London, 2006.European Commission. India’s role in world agriculture. Monitoring Agri-Trade Policy
newsletter 03-07, December 2007.ITC Limited, Our profile. 2012. http://www.itcportal.com/about-itc/itc-profile/itc-profile.
aspx
38 ◾ Agribusiness Supply Chain Management
Mobile Seed Cleaning Grading Plants. Available from: http://www.agrosaw.com/smp.htmlMonczka, R., Trent, R., and Handfield, R. Purchasing and Supply Chain Management (2nd
ed.), South-Western, Cincinnati, 2002.Reserve Bank of India. Handbook of Statistics on Indian Economy. 2013. Available from:
http://www.rbi.org.in/scripts/AnnualPublications.aspx?head=Handbook%20of%20Statistics%20on%20Indian%20Economy

39
Chapter 2
input Suppliers
2.1 introduction The inputs for an agricultural produce are seeds, fertilizers, crop protection products, farm machinery and equipment, veterinary products, agri-biotech, and environment-friendly products. These inputs are important for producing agricul-tural output and allied sector products and commodities in the required quantity and at the desired quality. Agricultural inputs play a crucial role in determining yield levels, and in turn, in the augmentation of the levels of production in the long run. It is well appreciated that improvement in the yield depends on the application of the right technology, the use of quality seeds, fertilizers, pesti-cides and micronutrients, and the availability of adequate irrigation resources. These are aspects stressed by agricultural domain experts and inter-disciplinary professionals.
In this chapter, we take a supply-chain-centric approach to optimum man-agement of agricultural inputs for achieving overall efficiency in the agribusiness sector. The focus of discussion would cover the passage from farm gate to produc-tion centre.
Obje CTIv eThis chapter discusses each agri input in specific detail and importance of drivers in terms of their effectiveness. The discussion goes further to supply chain processes such as planning, sourcing, products/value addition, distribu-tion and demand management. The chapter also addresses inbound material and services for farm level operations.
40 ◾ Agribusiness Supply Chain Management
2.2 Categorization of inputsDuring production, the inputs consisting of all material, machinery, men, efforts, and capital are converted through various means to produce the required output. Various disciplines define the input–output relationship based on their industry characteristics. One can classify agricultural inputs as follows:
◾ Natural resources such as land, soil, water and monsoon effects ◾ Technological resources, including inorganic fertilizer, insecticide, improved
seed varieties and equipment ◾ Human resources (including labour, extension services, and life-cycle concerns) ◾ Access to capital through credit and financial services, with farm produce as
collateral, other forms of credit and microfinance, and farm subsidies and grants ◾ Facilities that can count as being logistics/supply chain drivers, including
seed multiplication, fertilizer plants, and so on, transportation of inputs by road, rail, or other means, inventory policy with respect to procurement of inputs for use and for holding for re-use
◾ Social, political, capital and government policies that influence the input industry.
A wide range of dynamics influence the agribusiness inputs industry. For example, international agreements such as patent laws, Trade-Related Intellectual Property Rights (TRIPS), and other multilateral agreements regulate the indus-try. Similarly, certain market structures in the agricultural inputs industry are evolving, impacting the concentration and behaviour of firms and thereby influ-encing supply chain integration. This is mainly because of ongoing changes in power relationships, which jeopardize supply chain profits, though a few play-ers are able to increase their profitability. Some initiatives have the potential to transform industries, such as the National Dairy Development Board (NDDB) in India organising the input industry in the dairy sector. The NDDB pioneered transformative activities by working continuously with its member cooperatives on using best practices, including animal health, reproduction through biotech-nology, mobile veterinary support services and more importantly producing and marketing of balanced feed. The natural result of these activities led to an increase in overall efficiency of the sector because of improved supplier, focal firm, and customer linkages, which in turn enhanced profitability through the supply chain.
2.3 Growth of inputs manufacturing SectorAfter independence, and with the onset of the planning era, India witnessed rapid growth in the agro-processing sector. The first phase of development started with the Green Revolution, which resulted in increased agricultural production and
Input Suppliers ◾ 41
emphasized the need for post-harvest management. The Green Revolution refers to a series of research, development, and technology transfer initiatives, based on activities that happened between the 1940s and the late 1970s. These activities increased agriculture production around the world, and significant changes took place in the late 1960s. Norman Borlaug, the father of Green Revolution, created a number of initiatives, including the development of high-yielding varieties of cereal grains; expansion of irrigation infrastructures; modernization of management tech-niques; and distribution of hybridized seeds, synthetic fertilizers, and pesticides to farmers. In 1961, Borlaug was invited to India by Dr M. S. Swaminathan, who pioneered Green Revolution in India, thereby earning the title Father of the Green Revolution in India, at a time when the country was experiencing the worst-ever famine in modern history. Agronomists developed high-yielding varieties of rice, wheat, and maize, which led to phenomenal production, as may be observed in Table 2.1. The average yield of crops also increased with the adoption of the Green Revolution in India. These yield growth patterns can be observed in Table 2.2.
Inferences regarding the impact of the Green Revolution on agro-based manu-facturing and processing are as follows:
1. Growth in agricultural output increased demand for agricultural inputs such as certified seeds, fertilizers, tractors, and so on. These challenges are briefly discussed here to enable both the input and the output sectors of agro-based industries to be viewed in the right perspective.
2. The growth in agricultural output also gave opportunities for agro-based primary, secondary, and tertiary processing of goods. Primary processing mostly included sorting, grading, and storage before industrial processing. Secondary and tertiary processing comprised the use of capital equipment and machinery for conversion of raw material into processed foods and other products that would come under the industry classification. This kind of demand also poses innumerable supply chain challenges.
3. The growth in output and processing also increased the scope for managing recovery of produce and handling waste generated in production systems. We have attempted to provide examples of a few developments in these areas, which increased value generation and contributed to improving the econom-ics of agricultural produce processing and the manufacturing of goods based on agriculture.
2.4 manufacturing and processingThe growth in agricultural output with the advent of the Green Revolution was pos-sible with fertilizer application and better irrigation practices. It may be observed from Table 2.3 on fertilizer production, imports, and consumption that the pro-duction of all NPK fertilizer increased from 1,059 thousand tonnes of nutrients in
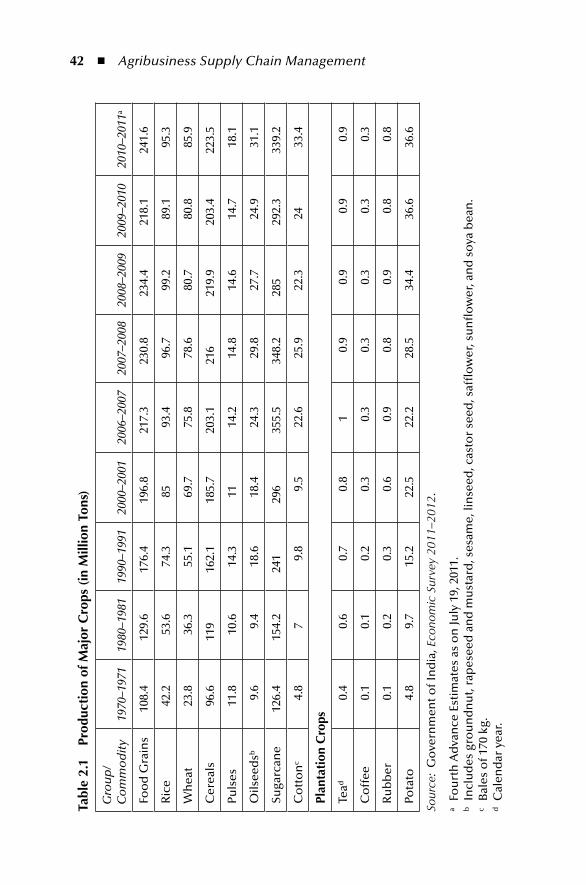
42 ◾ Agribusiness Supply Chain Management
tabl
e 2.
1 pr
oduc
tion
of m
ajor
Cro
ps (
in m
illio
n to
ns)
Gro
up
/C
om
mo
dit
y19
70–1
971
1980
–198
119
90–1
991
2000
–200
120
06–2
007
2007
–200
820
08–2
009
2009
–201
020
10–2
011a
Foo
d G
rain
s10
8.4
129.
617
6.4
196.
821
7.3
230.
823
4.4
218.
124
1.6
Ric
e42
.253
.674
.385
93.4
96.7
99.2
89.1
95.3
Wh
eat
23.8
36.3
55.1
69.7
75.8
78.6
80.7
80.8
85.9
Cer
eals
96.6
119
162.
118
5.7
203.
121
621
9.9
203.
422
3.5
Puls
es11
.810
.614
.311
14.2
14.8
14.6
14.7
18.1
Oils
eed
sb9.
69.
418
.618
.424
.329
.827
.724
.931
.1
Suga
rcan
e12
6.4
154.
224
129
635
5.5
348.
228
529
2.3
339.
2
Co
tto
nc
4.8
79.
89.
522
.625
.922
.324
33.4
plan
tati
on C
rops
Tead
0.4
0.6
0.7
0.8
10.
90.
90.
90.
9
Co
ffee
0.1
0.1
0.2
0.3
0.3
0.3
0.3
0.3
0.3
Ru
bb
er0.
10.
20.
30.
60.
90.
80.
90.
80.
8
Pota
to4.
89.
715
.222
.522
.228
.534
.436
.636
.6
Sour
ce:
Go
vern
men
t of I
nd
ia, E
cono
mic
Sur
vey
2011
–201
2.
a Fo
urt
h A
dva
nce
Est
imat
es a
s o
n Ju
ly 1
9, 2
011.
b
Incl
ud
es g
rou
nd
nu
t, ra
pes
eed
an
d m
ust
ard
, ses
ame,
lin
seed
, cas
tor
seed
, saf
flo
wer
, su
nfl
ow
er, a
nd
so
ya b
ean
.c
Bal
es o
f 170
kg.
d
Cal
end
ar y
ear.
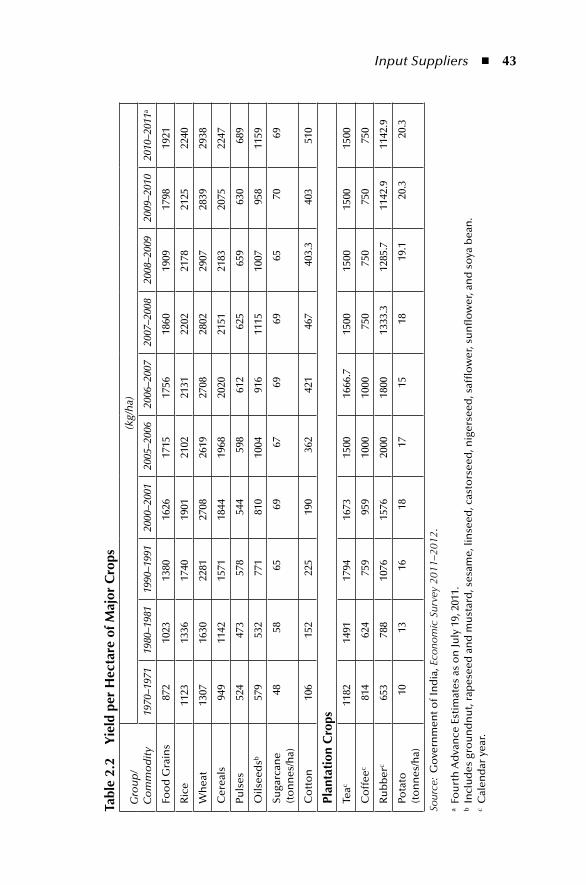
Input Suppliers ◾ 43
tabl
e 2.
2 y
ield
per
Hec
tare
of m
ajor
Cro
ps
Gro
up
/C
om
mo
dit
y
(kg/
ha)
1970
–197
119
80–1
981
1990
–199
120
00–2
001
2005
–200
620
06–2
007
2007
–200
820
08–2
009
2009
–201
020
10–2
011a
Foo
d G
rain
s87
210
2313
8016
2617
1517
5618
6019
0917
9819
21
Ric
e11
2313
3617
4019
0121
0221
3122
0221
7821
2522
40
Wh
eat
1307
1630
2281
2708
2619
2708
2802
2907
2839
2938
Cer
eals
949
1142
1571
1844
1968
2020
2151
2183
2075
2247
Puls
es52
447
357
854
459
861
262
565
963
068
9
Oils
eed
sb57
953
277
181
010
0491
611
1510
0795
811
59
Suga
rcan
e (t
on
nes
/ha)
4858
6569
6769
6965
7069
Co
tto
n10
615
222
519
036
242
146
740
3.3
403
510
plan
tati
on C
rops
Teac
1182
1491
1794
1673
1500
1666
.715
0015
0015
0015
00
Co
ffee
c81
462
475
995
910
0010
0075
075
075
075
0
Ru
bb
erc
653
788
1076
1576
2000
1800
1333
.312
85.7
1142
.911
42.9
Pota
to
(to
nn
es/h
a)10
1316
1817
1518
19.1
20.3
20.3
Sour
ce:
Go
vern
men
t of I
nd
ia, E
cono
mic
Sur
vey
2011
–201
2.
a Fo
urt
h A
dva
nce
Est
imat
es a
s o
n Ju
ly 1
9, 2
011.
b In
clu
des
gro
un
dn
ut,
rap
esee
d a
nd
mu
star
d, s
esam
e, li
nse
ed, c
asto
rsee
d, n
iger
seed
, saf
flo
wer
, su
nfl
ow
er, a
nd
so
ya b
ean
.c
Cal
end
ar y
ear.
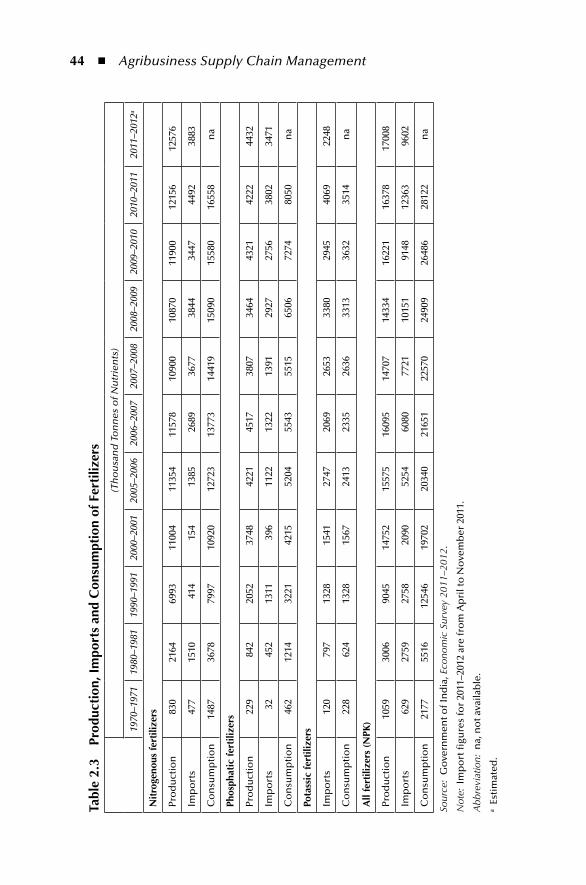
44 ◾ Agribusiness Supply Chain Management
tabl
e 2.
3 pr
oduc
tion
, im
port
s an
d C
onsu
mpt
ion
of F
erti
lizer
s(T
ho
usa
nd
To
nn
es o
f Nu
trie
nts
)
1970
–197
119
80–1
981
1990
–199
120
00–2
001
2005
–200
620
06–2
007
2007
–200
820
08–2
009
2009
–201
020
10–2
011
2011
–201
2a
nit
roge
nous
fert
ilize
rs
Pro
du
ctio
n83
021
6469
9311
004
1135
411
578
1090
010
870
1190
012
156
1257
6
Imp
ort
s47
715
1041
415
413
8526
8936
7738
4434
4744
9238
83
Co
nsu
mp
tio
n14
8736
7879
9710
920
1272
313
773
1441
915
090
1558
016
558
na
phos
phat
ic fe
rtili
zers
Pro
du
ctio
n22
984
220
5237
4842
2145
1738
0734
6443
2142
2244
32
Imp
ort
s32
452
1311
396
1122
1322
1391
2927
2756
3802
3471
Co
nsu
mp
tio
n46
212
1432
2142
1552
0455
4355
1565
0672
7480
50n
a
pota
ssic
fert
ilize
rs
Imp
ort
s12
079
713
2815
4127
4720
6926
5333
8029
4540
6922
48
Co
nsu
mp
tio
n22
862
413
2815
6724
1323
3526
3633
1336
3235
14n
a
All
fert
ilize
rs (
npK
)
Pro
du
ctio
n10
5930
0690
4514
752
1557
516
095
1470
714
334
1622
116
378
1700
8
Imp
ort
s62
927
5927
5820
9052
5460
8077
2110
151
9148
1236
396
02
Co
nsu
mp
tio
n21
7755
1612
546
1970
220
340
2165
122
570
2490
926
486
2812
2n
a
Sour
ce:
Go
vern
men
t of I
nd
ia, E
cono
mic
Sur
vey
2011
–201
2.
Not
e: I
mp
ort
figu
res
for
2011
–201
2 ar
e fr
om
Ap
ril t
o N
ove
mb
er 2
011.
Abb
revi
atio
n: n
a, n
ot a
vaila
ble
.a
Esti
mat
ed.
Input Suppliers ◾ 45
1970–1971 to 17,008 thousand tonnes of nutrients in 2011–2012. For the same period, imports increased from 629 thousand tonnes of nutrients to 9,602 thou-sand tonnes of nutrients. It is interesting to note that all N/P/K component imports also went through similar increases. Further, consumption of all NPK fertilizers increased from 2,177 thousand tonnes of nutrients in 1970–2071 to 28,122 thou-sand tonnes of nutrients in 2010–2011. The trend over a period of 40 years shows a compound annualized growth rate in production, import, and consumption in the range of 6.5%–7%.
It may be interesting to analyse the growth of industries manufacturing agricul-tural inputs such as pumps and tractors, which are increasingly used for irrigation and land preparation. One would expect the impact of the Green Revolution to sig-nificantly influence the growth of the agricultural inputs production sector. It can be observed from Table 2.4 that pump production increased from 35 million units in 1950–1951 to 3,139 million units by 2010–2011. This is a compounded, annual-ized growth rate of about 8%, which is significant. However, while analysing the data, one might note that the statistics for pumps include pumps produced for both agricultural and industrial usage, as the data pertains to the growth of mechani-cal engineering industries in India. Based on the interactions at the field level, we observe that modernization of agriculture required more water. Land usages, constraints in irrigation, improved coverage of supply of electrical power, and dis-tribution of fuel and economic rationale encouraged usage of pumps in agricultural sector. Similarly, tractor manufacturing industry, which belongs to the agricultural input sector, has experienced growth with the advent of the Green Revolution in India. It may be observed from Table 2.4 that the production of tractors in India in 1980–1981 was around 71,000 units and went up to 465,400 units by 2010–2011. This means a compounded annualized growth rate of 6.5%. This can be seen as a highly successful phase of growth in agribusiness, especially because of the fact that a number of farmers in India have fragmented land holdings, and the propensity to invest on capital machinery in agriculture is low.
One would expect other agriculture inputs industries such as those producing and distributing hybrid seeds, manufacturing machinery for other activities like harvesting and so on, would have had similar issues and opportunities.
2.4.1 Supply Chain ChallengesThe challenges associated with supply chain management of manufacturing processes in the agribusiness inputs sector would include the following:
1. Demand management: Fertilizers, hybrid seeds, and other inputs are in high demand with short lead times and high peaks immediately following the monsoons. Unless the production system and the supply chain are agile and able to cater to such demand, the supply chain is bound to fail. The spikes in
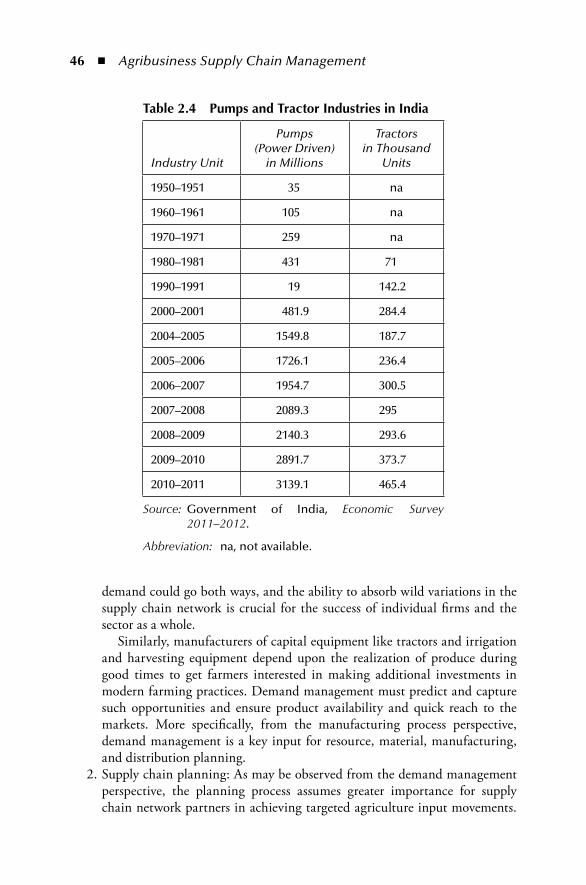
46 ◾ Agribusiness Supply Chain Management
demand could go both ways, and the ability to absorb wild variations in the supply chain network is crucial for the success of individual firms and the sector as a whole.
Similarly, manufacturers of capital equipment like tractors and irrigation and harvesting equipment depend upon the realization of produce during good times to get farmers interested in making additional investments in modern farming practices. Demand management must predict and capture such opportunities and ensure product availability and quick reach to the markets. More specifically, from the manufacturing process perspective, demand management is a key input for resource, material, manufacturing, and distribution planning.
2. Supply chain planning: As may be observed from the demand management perspective, the planning process assumes greater importance for supply chain network partners in achieving targeted agriculture input movements.
table 2.4 pumps and tractor industries in india
Industry Unit
Pumps (Power Driven)
in Millions
Tractors in Thousand
Units
1950–1951 35 na
1960–1961 105 na
1970–1971 259 na
1980–1981 431 71
1990–1991 19 142.2
2000–2001 481.9 284.4
2004–2005 1549.8 187.7
2005–2006 1726.1 236.4
2006–2007 1954.7 300.5
2007–2008 2089.3 295
2008–2009 2140.3 293.6
2009–2010 2891.7 373.7
2010–2011 3139.1 465.4
Source: Government of India, Economic Survey 2011–2012.
Abbreviation: na, not available.
Input Suppliers ◾ 47
The production systems of supply chain partners need to be synchronized with demand patterns, storage needs, and transportation networks at efficient costs. This is mainly to ensure that the farmers who are the end customers in this network realize value from different role agents. The big challenge with the planning process is synchronization of roles and responsibilities among players so that farmers get whatever they need on time at the level of service expected.
3. Supplier relationship management: Sourcing process is an enabler for effec-tively serving the customer demand, the customer in this context being the farming community and the government. Sourcing assumes greater impor-tance as a number of input materials such as fertilizer is regulated. In fact, inadequate water availability is one of the key constraints in India, and demand for irrigation pumps is a function of water distribution in different territories in the federal system. Supplier relationship management in certain cases, such as tractors and capital equipment for the agriculture sector, is more in line with the automotive industry, where the suppliers are tapped for strategic, critical, and bulk components and accordingly, relationships get defined. When it is a strategic component supplier, the relationship is such that interaction is more frequent, and is sharing- and partnering-oriented for mutual benefits. When it is a question of critical components, then again, the relationship is highly interactive and proactive, resulting in sharing of tech-nology and growth plans. When the purchases are for bulk values, the firm encourages competitive buying so that the value realized is the highest for the customers.
In most of the cases pertaining to agricultural inputs, sourcing requires intense plan synchronization and the ability to work closely with the sourcing agents.
4. The manufacturing function involves supply chain activities in the agribusi-ness input sector, which would critically influence the performance of the sector.
a. One activity is the choice of location of the plant and of regional distribution centres for the produce, so that the desired service level (responsiveness) and costs can be managed. For example, a fertilizer or tractor plant that requires huge capital investment is normally located in a centralized loca-tion, and the farmer community is served through regional distribution centres. On the other hand, hybrid seed plants can be spread in scattered locations and distributed through carry and forward agents.
b. Contract manufacture of inputs and delivery of service inputs are other important strategies deployed by firms and individual entrepreneurs, especially those who offer agricultural input services and products like organic manure, certified seeds, and so on. This strategy requires ensur-ing of the uniform quality of products provided by all players, and local-ization to the demands of the environment.
48 ◾ Agribusiness Supply Chain Management
c. Manufacturing of inputs like fertilizer and machinery like tractors will have to be carried out throughout the year, whereas demand, as mentioned earlier, arises in spikes. This requires effective management of inventory and optimization of inventory, transportation, and production costs.
5. Distribution management of the input sector is another key challenge for pro-cessors and manufacturers. For example, a fertilizer plant may sell its output in over an 800 km radius in India. This being a bulk commodity that has to be sold in interior lands across villages, distribution management poses a challenge. The Government of India (GOI) has fertilizer under regulatory management, where prices as well as freight cost equalization pools are in practice. If a company has to earn normal profits as determined by the GOI, it must operate efficiently at or above the level dictated by the norms prescribed by the regulatory agency. This is true for any agriculture input, because of the widely disbursed consumption centres and poor infrastructure.
6. Returns management in the agriculture input sector poses unique challenges. Returns in case of machinery is more to do with post-sale service and the ability to provide quick spares and service support to keep equipment opera-tional at locations far away from service centres. Similarly, in case of inputs like fertilizers and pesticides, redistribution by withdrawal from one location to the other is possible. Further, withdrawal of certain other inputs from the market is also possible, as in the case of certified seeds.
Thus, input processing and manufacturing in the agribusiness input sector offer opportunities for a supply chain analyst to constantly assess the goals of efficiency of the supply chain in terms of cost for a desired high level of responsiveness.
It may be useful to mention here the use of mechanical equipment in harvesting and the resulting growth of the industry. There has been increasing usage of mechani-cal equipment like tillage equipment, harrows, sowing equipment, plant protection equipment and irrigation equipment for different crops and fields; we are not discussing these issues, as they are still evolving in India. Further, these issues require technical discussions rather than economic discussions from the supply chain perspective. We encourage readers to refer to agricultural engineering papers for this purpose. With regard to harvesting equipment, it is increasingly being tried out in the harvesting of paddy, wheat, cotton, tea, sugarcane, and other crops. In Maharashtra, the relevant government departments and the sugar industry have collaborated in attempts to use mechanical harvesters for sugarcane due to the decreasing availability of cane harvesting labour, and also because of the economy associated with using mechanical harvesters.
Manual cane harvesting involves hard labour, with high energy demand. A group of 15 labourers deploying their best efforts can harvest about six tonnes a day, and thus, for an acre of land, which could yield about 40 tonnes, they may take about six to seven days. The sugarcane harvester is a large mobile machine weighing about eight tonnes. It can cut about 120 tonnes of sugarcane in 16 hours.
Input Suppliers ◾ 49
It costs about `265 to cut one tonne of sugarcane with a harvester, while the man-ual cost is about `322 per tonne (Exhibit 2.1). It is more important to note that the time efficiency of harvesters and the non-availability of labourers determine the push towards mechanization. The exhibit below highlights these factors.
Exhibit 2.1 Mechanization of Sugarcane Harvesting Encouraged
The Maharashtra government has proposed to give subsidies to cooperative sugar mills and farmers from the fiscal year 2011–2012 for purchase of sugarcane harvesters. This is mainly to tide over acute labour shortage. In 2006, about 10 lakh labourers were available. However, in 2011–2012, it was reported that their number had dwindled to about five lakhs. Cutting sugarcane is a very strenuous task, and therefore, not many labourers opt for it.
There are positive economics to deploying mechanical harvesters. A harvester can cut about 120 tonnes of sugarcane in 16 hours. It costs about `265 to cut a tonne of sugarcane with a harvester, while the manual cost is about `322 per tonne. It is estimated that by 2014, about 450 harvesters cost-ing over `450 crore will be acquired in the state. The state government has already approached the central government with a ̀ 100-crore subsidy plan proposal. However, under the Rashtriya Krishi Vikas Yojana of the Union Ministry of Agriculture, about `50 crores has been sanctioned. The cost of a harvester is about `1 crore, and if the govern-ment subsidy is given for 50%, a farmer has to invest only `50 lakhs. For the machines, the normal payback period is about eight years, but due to the subsidy, the payback time has been halved.
Source: Wadke, R., The Hindu Business Line, Aug. 25, 2011.
One may note that paddy and wheat harvesting are also attracting mechaniza-tion due to labour shortages. Increasingly, a lot of investment is going into mecha-nization of irrigation (using drip irrigation mechanisms), especially for cultivating grapes and oranges. Again, Maharashtra, which is the leading producer of both crops, is leading in investments. Thus, mechanization for production and harvest-ing is likely to continue to go up in India in the years to come. This will encourage manufacture of such equipment.
50 ◾ Agribusiness Supply Chain Management
2.4.2 Supply Chain Goals Efficiency is primarily measured by the internal measures of supply chains, namely, cost factors and asset utilization; responsiveness is the main supply chain goal, which is expected to be realized across the supply chain network. In the agribusi-ness input industry, these goals assume paramount importance. Responsiveness is the key for input management, especially for farm level production-driven supply chains. This is more so in a monsoon-dependent agrarian economy with large tracts of arid land that depend on rain. Inputs such as seeds, pesticides, fertilizers, human effort and capital equipment are likely to create pressure in terms of demand for these inputs and expectations regarding responsiveness. However, the input pro-viders will have to consider cost dynamics and raise produce under certain logical estimates. The challenge in the industry is to balance the divergent demands of supply chain goals.
In India, dry land farming activities for produce such as oilseeds and cotton increase depend upon the abundance of the monsoons. India frequently experi-ences volatile monsoon behaviour, impacting crop plantation and growth of pro-duce. Unfavourable monsoons have an adverse effect on supply chains, especially on input providers, as demand for inputs such as fertilizers, pesticides and other agrochemicals drops.
Exhibit 2.2 reflects a case study in 2011 in Gujarat, where land areas under oilseed cultivation increased substantially, increasing demand for farm inputs and throwing supply chains out of gear. Only those input provider firms which are agile and able to respond adequately to such unexpected developments can be successful. Many small players and intermediaries act without perspective, and work on the silo principle of maximizing their own local profits. Thus, the agricultural inputs sector faces the problem of delicately balancing its supply chain goals of efficiency and responsiveness.
Exhibit 2.2 Groundnut Production Estimated to Surge in 2011 Summer in India
A council consisting of the Indian Oilseeds and Produce Export Promotion Council (IOPEPC) and Junagadh Agriculture University (JAU) conducted a crop survey in various parts of Gujarat between May 7 and 13, 2011, and estimated that the summer groundnut production in Gujarat would be around 2.71 lakh tonnes, as against 1.29 lakh tonne in 2010—an increase of 110%. The production of sesame during the period was estimated to surge by 37.5% to 55,000 tonnes. Total area under groundnut cultivation in Gujarat during the 2011 kharif season increased from 68,000 hectares to 1.21 lakh hectares
Input Suppliers ◾ 51
due to sufficient availability of irrigation water. The survey also mentions that groundnut yield increased to 2,430 kg per hectare from 1,900 kg the previous year.
Source: Dave, V. Groundnut production to rise this summer. Business Standard, May 16, 2011.
The experience with agricultural inputs for the processing sector is similar. The challenges of meeting efficiency and responsiveness targets are compounded by the vagaries of nature and uncertainty in produce markets. For example, as shown in Exhibit 2.2, when groundnut sowing is extensive, operators like process firms plan for bumper harvests and boost their capacities for procurement, processing, and working capital to handle the larger volumes anticipated. If one considers the figures, the system needs to show a flexibility of more than 20% in resources, which is quite a challenge. With such a degree of adjustment required, efficiency may not be ideal. The focus would be on handling the increased volumes; otherwise, it would have an adverse effect on the farm produce economy.
2.4.3 Push versus PullIn supply chains, the push strategy is one where the supply chain is organized in anticipation of demand or customer orders. Such a situation mainly depicts the speculative character of a supply chain, where production and stocking happen on the basis of demand forecasts. This process would be driven more by economies of scale in operations and for low-value items. For example, popular models of tractors are produced in India on the basis of demand estimates. The tractors pro-duced lie in stock, awaiting customer orders. This is also the case with respect to seeds production and distribution. In the case of agricultural processing, the push strategy is more prevalent. For example, a sugar manufacturing company will have to intensively plan all its activities based on the push strategy. Sugar is produced during six to eight months of the year, and output is released for sale over non-productive months, too. Hence, the supply of inputs, namely cane, needs to be planned well ahead.
In contrast to the push strategy, the pull strategy in supply chains is organized to serve customers on the initiation of demand. The concept of “pull” in supply chains is about the execution of processes in response to customer orders. This con-cept is reactive, but enables value creation to customers by allowing flexible config-uration of products. The advantage to the focal organization in this process is that it reduces its finished goods inventory by postponement. For example, the demand for seeds for plantations, especially in the case of dry land farming, is based on the pull strategy, which comes into effect after the arrival of monsoon. Similarly, the
52 ◾ Agribusiness Supply Chain Management
demand for capital equipment services as well as labour and inputs could be based on cropping and growth patterns. Normally, a pull-based supply chain allows the focal organization to provide customers with flexibility in selecting inputs. At the same time, the pull factor works by enabling the focal organization to manage its inventory better.
However, it is important to understand the boundaries of push and pull in any supply chain network. Push and pull processes are useful in reaching strategic deci-sions relating to supply chain design, as the planner gets a more global view of how supply chain processes relate to customer orders. Based on such a global view, facil-ity locations, which could be split or consolidated, and other facets of the supply chain can be designed.
2.5 Supply Chain DriversIn this chapter, we have so far discussed the role of supply chain drivers namely facilities, inventory, transportation, sourcing and information technology impact-ing the performance of inputs industry.
2.5.1 FacilityFacility management for the agricultural inputs sector is an important aspect of supply chain drivers. When one looks at any facility, its various forms need to be analysed. One aspect is with respect to manufacturing, process, and resource endowment, and the other is about creating storage spaces such as warehouses and regional distribution centres, especially with respect to input management.
In the case of a seed multiplication plant for cereals and other large crop bases where seed processing is to be centralized, the facility-related decision would hinge on whether to locate centrally or be driven by location economics and distribute low weight/volume material like seeds through distribution networks. The situa-tion would remain true in the case of crop protection chemicals like pesticides. However, centralized locations would not necessarily be the criteria for industries dealing in certain other inputs, such as fertilizers and tractors. Though these plants are expected to use economies of scale in production, they tend to be located where there is maximum cost economy from perspectives of capital and operations. One may observe that some of the plants have skewed locations for a variety of reasons.
It may be useful to highlight an agricultural equipment manufacturing com-pany and its facility. Tractors and Farm Equipments Ltd (TAFE), a tractor manu-facturer, has four plants in India at Mandideep (Bhopal), Kalladipatti (Madurai), Doddaballapur (Bangalore) and Chennai, as well as a new overseas plant in Turkey. The Mandideep plant came up in 2005, when TAFE acquired Eicher’s tractor business. The company manufactures the Eicher brand of tractors at this plant, diesel engines at its plant at Alwar, and transmission components at Parwanoo.
Input Suppliers ◾ 53
TAFE’s success can be measured terms of its performance, in terms of revenue growth and production volumes. TAFE’s turnover, at `86 crore in 1985, had risen to `5,800 crore by 2010–2011. TAFE is the second biggest tractor company in India, after Mahindra Tractors. It is the third biggest in the world, after Mahindra and the US-based John Deere. From around 4000 tractors a year in 1985, the group now manufactures 120,000 units annually (Business Today, September 2011).
TAFE holds a market share of 22% excluding the Eicher brand; with Eicher, it holds about 28%. If one looks at India’s tractor market, northern states such as Uttar Pradesh, Punjab and Haryana, western states such as Rajasthan, Gujarat and Madhya Pradesh and southern states like Andhra Pradesh dominate sales. With its major plant location in the southern part of India, namely Madurai in Tamil Nadu, TAFE was able to rise to the position of being second in market share. This was possible in spite of its factory locations being skewed, mainly because of its dealer network and distribution management. A well-designed distribution network that is part of its facilities has helped it achieve success in business. Thus, one may conclude that the management of manufacturing locations and distribution networks, espe-cially nodes and flows to distribution points, can define the success of a supply chain.
2.5.2 InventoryAnother important supply chain driver is inventory management. In the agribusi-ness input industry, inventory would play a significant role, as inputs are used for producing agricultural produce during the season. In India, agriculture is carried out during two seasons, namely, the kharif and the rabi seasons. Kharif season is after first rains of south-west monsoon in India, which is in June–July and harvest happens in September and October. Rabi season starts after the kharif season and more popularly termed winter crop with plantation in November and harvest in February/March. Cultivation is triggered by the onset of the monsoon. Inputs such as seeds and capital equipment and preparatory farm equipment would be required at the initiation of crop farming. As the crop firms up, farmers would need fertil-izers, crop nutrients, and pesticides. Later, farmers would need farmer extension support services, harvesting support, and support in reaching the markets. All these activities require an effective inventory management policy across the supply chain.The players deploy inventory concepts such as cycle inventory, safety inventory, seasonal inventory, and pipeline inventory. Inventory could be in the form of raw material, work in progress, or finished goods.
Cycle inventory is the average inventory that builds up within the supply chain, because a supply chain stage either produces or purchases in lots that are larger in volume than the demands of customers. Raw materials, components, and parts are required for production. The cycle plays a crucial role in keeping the produc-tion process continuous. Raw materials and work-in-progress inventories are a major part of the production-related inventory. This works even in the agribusiness input sector. Fertilizers typically work on building cycle inventories, as they are
54 ◾ Agribusiness Supply Chain Management
moved along a distribution network before they reach the farming community. Similarly, many other farm inputs such as seeds, micronutrients, and crop protec-tion chemicals move through a distribution network requiring effective planning and management of cycle inventory.
Cycle inventories are “held primarily to take advantage of economies of scale in the supply chain. Supply chain costs are influenced by lot size. The primary role of the cycle inventory is to allow different stages to purchase products in lot sizes that minimize the sum of material, ordering, and holding costs. Ideally, cycle inventory decisions should consider costs across the entire supply chain, but in practice, each stage generally makes its own supply chain decisions, increasing total cycle inven-tory and total costs in the supply chain” (Chandrasekaran, 2010). The problem is compounded by multi-level intermediaries, with varying sizes and significant dif-ferences in negotiating power.
On the other hand, the safety inventory is an inventory carried for the purpose of satisfying demand that exceeds the amount forecast for a given period. Inventory is carried based on forecasts of demand, and forecasts are rarely accurate. In the agriculture sector, as noticed in Exhibit 2.1, demand for inputs like seeds surges under exceptional monsoon conditions. At such times, when demand is higher, there are lost sales if the product is not available along the distribution network.
Similarly, in the agricultural inputs equipment industry, it is important to stock critical components, as failures cannot be scientifically predicted. Breakdowns during peak operating seasons can have negative consequences. In order to avoid customer service problems and the hidden costs of unavailable components, com-panies hold safety stocks. This provides a cushion against uncertainties in demand, lead time and supply, thereby ensuring that operations are not disrupted.
The term, “seasonal inventory” refers to inventory that is used to absorb uneven rates of demand or supply that agribusinesses face. Manufacturers of seeds, fertil-izers, nutrients, and crop protection chemicals in India experience seasonality in sale, with peaks around monsoon time—either the south-west monsoon or the north-east monsoon. If there is no stock in stock-keeping units (SKUs) during this period, the firm may lose market share. Hence, holding seasonal inventory helps in evening out volatility in demand and supply. A focal firm may stock up on SKUs to meet seasonality-related fluctuations.
In contrast to the seasonal inventory, the pipeline inventory, or inven-tory in transit, refers to inventory moving from one node to another in the materials flow system. Materials move from suppliers to a plant, from the plant to a distribution centre or customer, and from distri-bution centre to a retailer. Pipeline inventory consists of orders that have been placed but not yet fulfilled. This can be reduced by reducing stocking locations, improving materials handling and avoiding delays in distribution. However, such a strategy is difficult in many consum-ables input segments of the agribusiness sector (Chandrasekaran, 2010).
Input Suppliers ◾ 55
Farm sector inventory issues are more to do with estimating demand and man-aging stocks across the distribution channel for effecting sales at appropriate times. Another critical challenge is the availability of the right SKUs in the required quantity, especially in case of seeds and crop protection. The agribusiness input sector has a varied and proliferate demand for SKUs in different locations, with a tendency to support its ultimate customers in the chain, namely, the farming community.
Another aspect of inventory management in the agribusiness input sector is the obsolescence of input material because of lapse of recommended useful period of life, loss of demand, and variance in demand estimation. These issues are quite normal, and business practices require building of inventory across the chain. The issue is: how does one handle unsold inventory or manage returns with respect to the focal firm? Generally, firms rely on the demand estimates and use extension staff to closely coordinate the information flow. Diverting products to relevant locations and quickly reprocessing before expiry are some of the practices deployed. There is a substantial cost incurred, as loss of goods due to expiry of useful life is provided for.
This leads to a discussion on the cost of managing inventory in the agribusiness sector. Discussions on inventory cost also include the holding cost, namely, financing costs such as interest on capital, obsolescence, warehousing at the institutional level, and so on. Depending upon the nature of the input industry, these costs would vary. For example, in the case of fertilizer, the inventory holding cost could be significant, as firms need to carry substantial stock to meet surges in seasonal demand.
In the case of seed crops like sugarcane, the work-in-progress inventory is criti-cal, as the seed crop takes almost seven months to harvest. Cane cultivation is coordinated by cane department of sugar plants, which promotes cropping for registering acreage under commercial production. At the farm level, farmers hold work-in-progress inventory in the field, incurring substantial commercial risk. There must be a commercial crop plantation plan under which seed cane must be harvested and inventory needs to be monetized.
On the other hand, many other crops may have different approaches. A firm generally produces its crop seeds one year ahead. Kharif seeds for a given season are produced in the previous kharif season, and the same practice applies for rabi seeds. However, there have been discussions exploring the feasibility of producing seed during the kharif season and selling it for the rabi season if the seed variety permits cropping in both seasons. Further, the possibility also exists of producing seed in the early (kharif or rabi) season and selling it in the late (kharif or rabi) season. This may be possible in regions where monsoon movements allow enough time to orga-nize the processing of seeds and logistics. Though such innovative practices would reduce inventory costs of input goods, traditional practices of carrying inventory for a year are more common in the seed industry.
Inventory management in godowns, processing plants, and other handling locations is very critical. As seeds are perishable, following proper inventory
56 ◾ Agribusiness Supply Chain Management
management practice is important. For example, a company may have a policy to follow the first-in first-out (FIFO) method, though one may not be sure whether it would be implemented effectively, considering the informal and unorganized nature of the sector.
Thus, inventory management in the agribusiness sector, both at the farm gate level and the processing level, brings several unique aspects and challenges.
2.5.3 TransportationTransportation management is another supply chain driver that could impact the agribusiness input sector. As mentioned in the previous chapter, agricultural inputs have the characteristics of bulkiness, perishability, and seasonality, which create challenges for transport management. Over and above these characteristics, the agribusiness input sector suffers often from the need to be cost-effective, as Indian farmers are afflicted by low income and poor savings. Farming is undertaken as a compelling economic activity, which may not necessarily pay back decent returns. In fact, apart from the rising issues with respect to the socio-economic aspects of agriculture input management, one will have to probe matters from the supply chain perspective, namely, are firms in the supply chain truly working on an equi-table partnering mode, such that that every player’s time, efforts, and resources are fairly compensated for? This would be an important perspective while understand-ing transportation management aspects relating to the agribusiness inputs sector.
The transportation network is influenced by the distribution network for the product. Here, one may be looking more at outbound challenges that become inbound issues at the next stage of the supply chain. In the case of the seeds mar-ket, the transportation issue is not that challenging when farmers buy local seeds, except in the case of products that are bulky and perishable. Such products may include seed plants for plantations or cane. More often, farmers manage these chal-lenges through better planning and use of local market vehicles.
Branded and labelled seeds are distributed through the channel partners. In such a network, these movements can be handled in the form of small parcels up to the last mile. Between the manufacturing unit and the warehouse, they will move in full truck loads. Then, between the warehouse and distribution points such as preferred dealers and stockists, they may move in trucks on the milk run. Only in case of sudden unexpected demand they would be moved in quantities lesser than truck loads, or through parcel services.
If one looks at transportation network challenges for a bulk product like cane for the sugar industry and fertilizer, the situation may be different.
In the case of the sugar industry, seed cane movement is mostly localized, as the material for planting has to be procured from within a geographical area of radius 50–100 km. The challenge lies in planning and scheduling of seed cane for plantation. Farmers mostly use their own transport like tractors for this pur-pose. For requirements involving large volumes and long distances, they also use
Input Suppliers ◾ 57
trucks. Coordination with seed cane farmers, plantation fields, labourers, and transport operators becomes critical in this operation. Any delay in handling caused by the failure to by any of the parties to show up can lead to a variance in the planned schedule, and to activity that may lead to poor supply chain network performance. Apart from seed cane, other transportation and distribution man-agement of other inputs such as fertilizers, crop nutrients, and crop protection also plays a significant role.
In the fertilizer business, delivering the product through the right mode to the right customer at the right time, right cost, and right quality matters most. Appendix 2.1 explains in detail, the transportation challenges of a fertilizer manu-facturing firm, using an assumed name.
Transportation problems associated with choice of mode, location of primary movement points, and management of normative and actual transportation costs are common challenges in any manufacturing set-up that has to market its products to the interior parts of the country. In the case of a number of fertilizer companies in India, transportation costs play a very significant role in the profitability of the firms. Further, there has been increasing pressure on the country’s economic policy mak-ers to reduce subsidies on fertilizer. However, at the firm level, a logistical trade-off needs to be achieved for improving operational efficiency, coupled with warehouse and inventory costs. Decisions based on the results of an evaluation of transporta-tion options would also have a considerable impact on the procurement process.
In any agribusiness input sector, the supply chain manager would constantly be evaluating the cost comparisons of the various options for transporting goods from stock points to consumption points. The manager would also be giving thought to the extent of spill over of stock possible during the peak period, and its associated cost.
If one looks at an input like pesticide, companies may not have an extended retail presence; instead, they may depend upon on a network of dealers, distribu-tors, and preferred dealers to service the demand. The sales organization is made up of independent operations in different zones (typically, the country is divided into four zones), with states divided into regions and districts into territories. SKUs are transported from the manufacturing plants to warehouses (regional distribution centres), which are at times managed by carrying and forwarding agents. Much of the transportation from the manufacturing locations to warehouses is done on a single source–single destination–multiple product–full truckload basis. The rest involves movement from a single source to multiple destinations on a full truck-load basis. From the warehouses, the material is usually moved to the distributors in full-truckload milk runs. Occasionally, materials are sent as parcels to a single destination. Distributors manage the movement of material to dealers using smaller vehicles such as auto-rickshaws and vans.
Thus, transportation management for the agribusiness input sector is challeng-ing, and varies widely from localized to centralized distribution involving volumes ranging from small parcels to bulk material. It is important to understand the
58 ◾ Agribusiness Supply Chain Management
nuances of each supply chain and optimize the transportation system taking into consideration all relevant inventory and facility decisions.
After having discussed the facility, transportation, and inventory drivers of the logistics part of agribusiness, we may analyse other drivers, namely, procurement, pricing, and information.
2.5.4 SourcingProcurement is also referred to as the sourcing and purchasing of goods and services for commercial purposes. Every decision unit, be it a farmer or a firm, sets procure-ment policies that govern its choice of suppliers, products, and the methods and procedures of buying. Depending upon the size of the decision unit and the com-plexity and level of formality of the agribusiness concern, procurement practices are evolved in various segments.
At the farm level, sourcing decisions to many inputs and services are decided by push factors, which is based on the availability of input to be sourced off the shelf. However, mismatch between what is required at the field and when may not be available.
For an individual farmer, inputs that are involved in procurement decisions include seeds, fertilizer, pesticides, plant nutrients, extension services, and labour. Though one would think that such procurement decisions are mostly driven by the fundamental economics of agrarian principles, group decisions also play a major role. For example, procurement chain decisions should focus on the micro level aspects of the geography in which the farm is located. Certain parts of one district sometimes get more rain, while neighbouring districts or taluks of the same district may not get as much rain. The supply of inputs should be planned at a micro level by getting enough information from the field. Farmers under such circumstances are driven by group decisions to achieve a balance between demand and supply, and also to enjoy the benefits of contiguous farming.
The need for contiguous farming can be better appreciated in wet crop lands and in some dry land irrigated cropping patterns, like with sugarcane. Since farm-ers are expected to support community goals in their villages, fields that are further away from access roads will have to go along with those that access the roads. Given the fact that there is a need for sharing water and optimizing efforts in crop man-agement, including those involved in receiving inputs to and sending outputs from the farm, contiguous farming is a compulsion. This influences procurement deci-sions at the individual farm level, since decisions are made jointly with others in the peer farming community. Peer groups build and improve upon relationships with many stakeholders, such as input suppliers and extension support system providers. This helps better handling of procurement challenges such as identifying the needs of customers (farmers) and suppliers, choosing tools and processes to communicate with suppliers, policies for evaluating proposals, and quotes and suppliers (pricing aspects). It is important to note that group behaviour and systems dominate the procurement process at the farm level. This is explained in Figure 2.1.
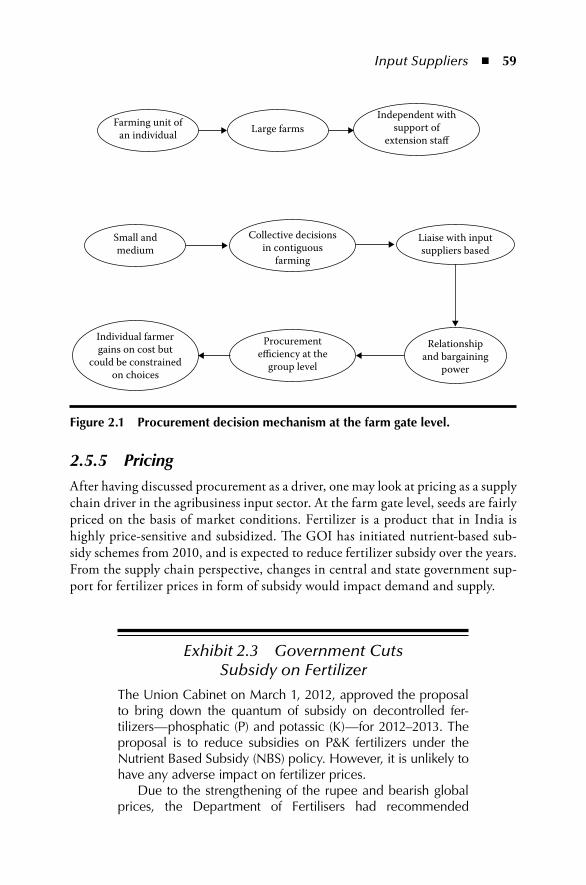
Input Suppliers ◾ 59
2.5.5 PricingAfter having discussed procurement as a driver, one may look at pricing as a supply chain driver in the agribusiness input sector. At the farm gate level, seeds are fairly priced on the basis of market conditions. Fertilizer is a product that in India is highly price-sensitive and subsidized. The GOI has initiated nutrient-based sub-sidy schemes from 2010, and is expected to reduce fertilizer subsidy over the years. From the supply chain perspective, changes in central and state government sup-port for fertilizer prices in form of subsidy would impact demand and supply.
Exhibit 2.3 Government Cuts Subsidy on Fertilizer
The Union Cabinet on March 1, 2012, approved the proposal to bring down the quantum of subsidy on decontrolled fer-tilizers—phosphatic (P) and potassic (K)—for 2012–2013. The proposal is to reduce subsidies on P&K fertilizers under the Nutrient Based Subsidy (NBS) policy. However, it is unlikely to have any adverse impact on fertilizer prices.
Due to the strengthening of the rupee and bearish global prices, the Department of Fertilisers had recommended
Farming unit ofan individual
Small andmedium
Individual farmergains on cost but
could be constrainedon choices
Collective decisionsin contiguous
farming
Liaise with inputsuppliers based
Large farmsIndependent with
support ofextension sta�
Procuremente�ciency at the
group level
Relationshipand bargaining
power
Figure 2.1 procurement decision mechanism at the farm gate level.
60 ◾ Agribusiness Supply Chain Management
reductions in subsidies on nitrogen (N) and potassium (K), which will be `24 a kg each for 2012–2013, with phosphate (P) at `21.8 a kg. For 2011–2012, the subsidy on NPK had been fixed at `27.15, `32.33, and `26.76 a kg, respectively, under the NBS policy. The reduction in P&K fertilizer subsidies are expected to bring down the government’s total subsidy bill by 20% in the fiscal year 2012–2013.
The subsidy bill on P&K fertilizers is estimated to be ̀ 52,000 crore, with the overall subsidy bill touching `90,000 crore for the year 2011–2012. Under the NBS regime, introduced from April 1, 2010, retail prices of 22 varieties of P&K fertilizers were freed. The government fixes subsidies on nutrients such as NPK, linking them to the import parity price of di-ammonium phosphate (DAP) and muriate of potash (MoP).
The subsidy is reimbursed to fertilizer firms for selling indig-enous or imported crop nutrients at lower prices to farmers. This comprises a reduction in subsidy on DAP by `4,763 a tonne and on MoP by `1,554 a tonne, a reduction of 27% and 10%, respectively. Since India imports almost its entire require-ment of non-urea fertilizers, this reduction could help bring down the fertilizer subsidy bill substantially.
Source: The Hindu. Govt cuts subsidy on key fertilizers. Mar. 1, 2012.
Other inputs at the farm gate level include pesticides and nutrients, which are predominantly market driven. Though irrigation and water resources are national assets, use of which is based on water sharing and availability conditions, at the farm level, water trading, especially of groundwater, has been taking place. Pricing is based on local demand and supply conditions and the cost of power, which is based on the efficiency of generators. Given the constraints in water availability, implementing a supply chain–centric approach could be difficult, and decision units are expected to take a silo approach.
Another important agribusiness input is agricultural labourers. In India, supply of agricultural labourers is becoming a problem, as majority of the rural population is no longer willing to work on demanding jobs in the field. This situation could be the result of the impact of urbanization, with increased work opportunities in construction and industries. Apart from these, developments in infrastructure are also absorbing agricultural labourers.
There is an increasing tendency among rural people who offer their services as agricultural labourers to reduce the time given by them to agricultural work, as they are get the support of the GOI through the National Rural Employment
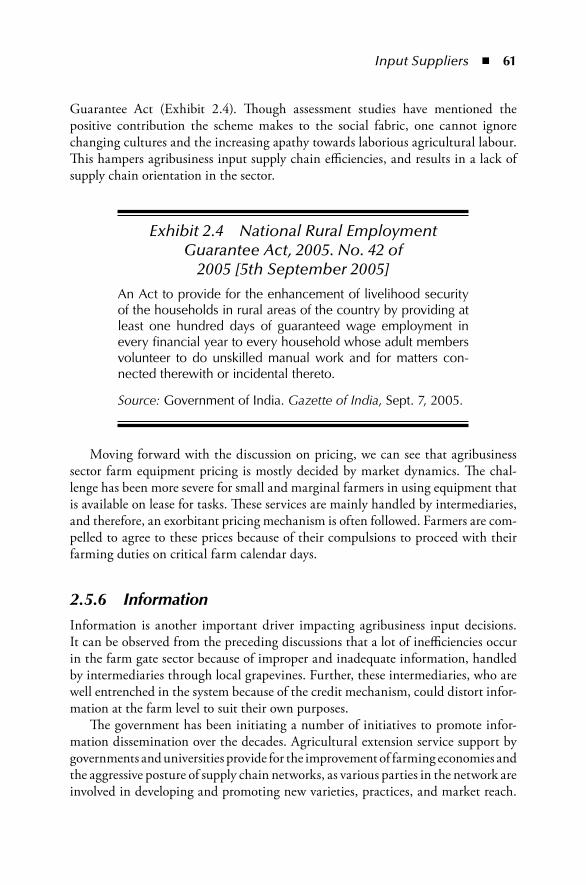
Input Suppliers ◾ 61
Guarantee Act (Exhibit 2.4). Though assessment studies have mentioned the positive contribution the scheme makes to the social fabric, one cannot ignore changing cultures and the increasing apathy towards laborious agricultural labour. This hampers agribusiness input supply chain efficiencies, and results in a lack of supply chain orientation in the sector.
Exhibit 2.4 National Rural Employment Guarantee Act, 2005. No. 42 of
2005 [5th September 2005]
An Act to provide for the enhancement of livelihood security of the households in rural areas of the country by providing at least one hundred days of guaranteed wage employment in every financial year to every household whose adult members volunteer to do unskilled manual work and for matters con-nected therewith or incidental thereto.
Source: Government of India. Gazette of India, Sept. 7, 2005.
Moving forward with the discussion on pricing, we can see that agribusiness sector farm equipment pricing is mostly decided by market dynamics. The chal-lenge has been more severe for small and marginal farmers in using equipment that is available on lease for tasks. These services are mainly handled by intermediaries, and therefore, an exorbitant pricing mechanism is often followed. Farmers are com-pelled to agree to these prices because of their compulsions to proceed with their farming duties on critical farm calendar days.
2.5.6 InformationInformation is another important driver impacting agribusiness input decisions. It can be observed from the preceding discussions that a lot of inefficiencies occur in the farm gate sector because of improper and inadequate information, handled by intermediaries through local grapevines. Further, these intermediaries, who are well entrenched in the system because of the credit mechanism, could distort infor-mation at the farm level to suit their own purposes.
The government has been initiating a number of initiatives to promote infor-mation dissemination over the decades. Agricultural extension service support by governments and universities provide for the improvement of farming economies and the aggressive posture of supply chain networks, as various parties in the network are involved in developing and promoting new varieties, practices, and market reach.
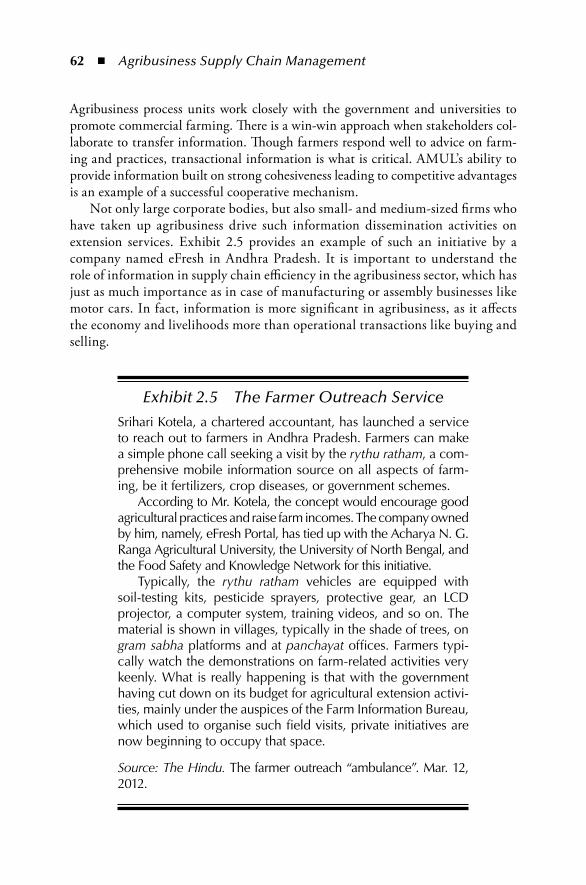
62 ◾ Agribusiness Supply Chain Management
Agribusiness process units work closely with the government and universities to promote commercial farming. There is a win-win approach when stakeholders col-laborate to transfer information. Though farmers respond well to advice on farm-ing and practices, transactional information is what is critical. AMUL’s ability to provide information built on strong cohesiveness leading to competitive advantages is an example of a successful cooperative mechanism.
Not only large corporate bodies, but also small- and medium-sized firms who have taken up agribusiness drive such information dissemination activities on extension services. Exhibit 2.5 provides an example of such an initiative by a company named eFresh in Andhra Pradesh. It is important to understand the role of information in supply chain efficiency in the agribusiness sector, which has just as much importance as in case of manufacturing or assembly businesses like motor cars. In fact, information is more significant in agribusiness, as it affects the economy and livelihoods more than operational transactions like buying and selling.
Exhibit 2.5 The Farmer Outreach Service
Srihari Kotela, a chartered accountant, has launched a service to reach out to farmers in Andhra Pradesh. Farmers can make a simple phone call seeking a visit by the rythu ratham, a com-prehensive mobile information source on all aspects of farm-ing, be it fertilizers, crop diseases, or government schemes.
According to Mr. Kotela, the concept would encourage good agricultural practices and raise farm incomes. The company owned by him, namely, eFresh Portal, has tied up with the Acharya N. G. Ranga Agricultural University, the University of North Bengal, and the Food Safety and Knowledge Network for this initiative.
Typically, the rythu ratham vehicles are equipped with soil-testing kits, pesticide sprayers, protective gear, an LCD projector, a computer system, training videos, and so on. The material is shown in villages, typically in the shade of trees, on gram sabha platforms and at panchayat offices. Farmers typi-cally watch the demonstrations on farm-related activities very keenly. What is really happening is that with the government having cut down on its budget for agricultural extension activi-ties, mainly under the auspices of the Farm Information Bureau, which used to organise such field visits, private initiatives are now beginning to occupy that space.
Source: The Hindu. The farmer outreach “ambulance”. Mar. 12, 2012.
Input Suppliers ◾ 63
Thus, the role of supply chain drivers such as facilities, inventory, transporta-tion, procurement, pricing, and information in bringing efficiency to the agribusi-ness input sector is clear. There are a number of role agents such as farmers, focal firms who could be processors, intermediaries, governments and institutions. All of them jointly lead to supply chain profits and create value in the system. Any silos approach leads to the kind of inefficiency that characterized the systems of the past. Farming has been maturing over the years, but that also brings new sets of issues that need the attention of farm managers and policy makers.
The technology, process, and people trilogy plays a significant role in defin-ing supply chain maturity. Technology and process improvements are impacting people in different walks of life, including agribusiness. At agribusiness process unit levels, a number of initiatives with information systems and the use of handheld devices have been supporting positive trends in supply chain efficiency.
In a few situations, the lack of availability of agricultural labourers and the negative trend impacting labour availability in some areas due to the implementa-tion of the National Rural Employment Guarantees Act have driven farmers to consider use of advanced technology-based capital equipment for farming activities such as sowing, fertilizing, harvesting, and even threshing of grains. This is an area of interesting developments in input management, as it economizes usage of labour by reducing dependence. Farmers need not necessarily buy the equipment, which in any case would be out of the reach of most of them. They can avail of the services of intermediaries who are dealers and operators of the required equipment in defined territories, and provide the equipment as a service on a use and pay model. There are cases where the dealers themselves come and perform the necessary activities as an outsourced process. This is certainly a welcome development in terms of the application of technology and process to overcome people-related issues. However, the disadvantages here are the inefficient clubbing of demand for services and the inadequate numbers of equipment in use, which deters usage at times by creating uncertain waiting times and loss of productivity due to loss of moisture in produce, and so on. One would expect this part of supply chains to pick up steam in the years ahead, improving efficiency and reducing certain value losses that are preva-lent in the current frame of operations.
2.6 ConclusionIn agribusiness, input supply chain network challenges exist both in the farm gate segment and in produce processing unit segments. It is observed that the constituents of a supply chain, together with the focal firm, need to work on planning, sourc-ing, processing, and distributing processes to achieve efficiency. Further, the roles of agents are to be synchronized, though there has been a tendency to work on local optimization, with drops in overall system efficiencies. Procurement drivers and information technology drivers are critically impacting efficiency, as the former is largely an operational aspect which works on markets as well as on relationships.
64 ◾ Agribusiness Supply Chain Management
Behavioural parameters substantially impact farm gate to direct and factory gate procurement, and also set up a balance between the cost and responsiveness of supply chains through other drivers, namely, facilities, transportation, and inventory. Agribusiness supply chain agents’ roles and activities are also largely regulated by the GOI, and one needs to follow a certain framework of operations to achieve effi-ciency. The technology, process, and people trilogy has a role to play, and adoption of technology and matured processes are likely to benefit all concerned in the long run.
Appendix 2.1A2.1.1 Transportation Options and Challenges
for a Fertilizer Manufacturing FirmSource: Reproduced from N. Chandrasekaran, Supply Chain Management, with permission of Oxford University Press, New Delhi, India.
It was the beginning of the Indian southwest monsoon in June 2009 when Mr. J. L. Narasimha Rao was firming up his SBU level plans, committed earlier to the corporate office in Chennai, on sale of fertilizers from his Kakinada plant in Andhra Pradesh. Mr. Rao was a firm believer in efficient operational management and in delivering the product to the right customer, at the right time, the right cost, the right mode and the right quality. He believed that his logistics manage-ment team is one of the best, and wanted to have a discussion with Mr. Sunil, his outbound transportation manager.
A2.1.2 Indian Fertilizer IndustryIndia has an agriculture-based economy, with the sector and its associated indus-tries contributing to nearly one-fourth of the country’s GDP. The fertilizer industry is one such associated sector that has shown significant growth patterns over the last decade. This industry in particular has been instrumental in achieving self-sufficiency in food grain production. The GOI has also created an environment conducive for the fertilizer business by way of subsidies/concessions to farmers and compensation to manufacturers. The Department of Fertilizers is responsible for policy formulation, and for promotion and development of the fertilizer indus-try. The government’s participation in the industry has ensured success in address-ing capacity requirements, though the sector’s efficiencies have taken backstage. However, recent changes in government policies are aimed at sufficiently improv-ing efficiencies in the sector. The government policies are oriented more towards deregulating the sector, with less emphasis on the policy parameters and long-term goals. India is one of the largest producers and consumers of fertilizers in the world.
In 2008–2009, India became the second largest consumer of fertilizer in the world, after China. The total consumption in that year was estimated at about
Input Suppliers ◾ 65
25.3 million tonnes in terms of various nutrients. The total production in that year was estimated at 32.8 million tonnes of urea/phosphatic/SSP combined, while the demand exceeded about 46.7 million tonnes.
The production levels of urea have ensured near self-sufficiency, while demand for nitrogenous fertilizers is wholly met by the indigenous industry. The raw mate-rials needed for production of phosphatic fertilizers are imported on a large scale. The Indian fertilizer industry is, however, not completely devoid of challenges. The policy parameters are not lucid, especially for nitrogenous and phosphatic fertiliz-ers, which slows down the domestic capacity-building process. Limited availability of feedstock is also forcing companies to look into joint venture options; fluctua-tions in gas pricing are also posing a significant challenge for fertilizer companies. The combined cost of feedstock and fuel accounts for anywhere between 60% and 80% of the total production cost, making the efficiency improvement process an immediate imperative for the sector.
The Indian fertilizer industry earlier was dominated by public enterprises, which still hold a major share; however, the private sector is also fast emerging, with a high installed capacity for phosphatic fertilizers. The sector as a whole is looking at bridging the demand–supply gap in the country, and the major players are striv-ing towards achieving this objective. The surge in demand in the Indian fertilizer industry on one hand, and supply uncertainty on the other, render decision making a difficult task for all the companies; the cost–benefit ratio becomes a crucial fac-tor. Fertilizer companies are hard pressed to take difficult decisions within a short period.
A2.1.3 Freight Rate Management by GovernmentThe fertilizer industry was regulated for a long time in India because of the dynamics of the agrarian economic issues the country faces. The freight equaliza-tion policy is essentially concerned with the equalization of freight charges, where the short distance charges subsidize the long distance movements. The policy essentially operated on rail fares, and road fares are also accommodated wherever railheads are not available. In cases of combined rail and road movements, the rail freight up to the nearest railhead is taken into consideration, and then the road transport charges up to the terminal point are adjusted and equalized. Typically, the way the freight equalization scheme works is that the weighted average expen-ditures on freight, based on the expected lead distances and the corresponding tariffs, are estimated in advance, to be added to the ex-factory price. This provides the basis for the allocation of freight equalization fund. In the case of the fertilizer industry, not only the freight but also the total production cost is equalized by means of a subsidy, resulting in a price equalization account based on normative costs and assured rates of return. Mr. Rao is constantly worried about operating in such a regulated environment, because if the plant fails to achieve the norma-tive basis of costs both in production and distribution, it could become a loser.
66 ◾ Agribusiness Supply Chain Management
A2.1.4 Company BackgroundCompany XYZ is a leading company in India, manufacturing a wide range of fertilizers, pesticides and specialty nutrients. XYZ has multi-locational produc-tion facilities, markets its products all over India and exports pesticides to various countries across the globe. The company has eight manufacturing units located in the states of Andhra Pradesh, Tamil Nadu, Maharashtra, Gujarat and Jammu and Kashmir. The company is also engaged in rural retail business in Andhra Pradesh through its outlets, “Mana Gromor Centres.”
XYZ is among the largest phosphatic fertilizer players in India. The company also markets phosphogypsum and sulphur pastilles. The company’s fertilizers are sold under well-established brand names like “Gromor”, “Godavari”, “Paramfos”, “XYZ Gold” and “XYZ Super.” XYZ has four fertilizer plants, of which two plants are located in Visakhapatnam and Kakinada in Andhra Pradesh, and two plants are located in and around Chennai in Tamilnadu. XYZ produces and sells phos-phatic fertilizers of various grades, including di-ammonium phosphate (DAP) and single super phosphate (SSP), and has a combined installed capacity of 22 lakh tonnes of DAP/complex fertilizers and 1.32 lakh tonnes of SSP. The company’s fer-tilizer products are also extensively marketed and sold through a network of dealers or “Mana Gromor Centres.”
A2.1.5 Demand and Distribution PatternThe company’s sales volume in the year ended on March 2009 was 21.62 lakh metric tonnes (MT), which included 1.19 lakh MT of imported DAP and 0.55 lakh MT of imported MOP, compared to 21.71 lakh MT sold during the previous year. The company has been marketing its fertilizers in 11 states, including Andhra Pradesh, Karnataka, Maharashtra and Tamil Nadu. The production and sales of the company’s fertilizers are highly dependent on and regulated by the availability of phosphoric acid and other raw materials.
The movements of fertilizers are strictly governed by movement orders issued by the Indian Government, entailing higher distribution cost because of multiple destination points. XYZ has a dominant presence in Andhra Pradesh, Tamil Nadu, Karnataka, Chhattisgarh, and Maharashtra, and is a significant player in West Bengal and Orissa.
XYZ continues to invest in infrastructural facilities, including raw material ware-houses and bagging and distribution facilities. This helps the company in improving its capacity to handle higher volumes of both raw materials and finished goods. The company has also made sizeable investments at its Vishakapatnam and Kakinada plants to increase production capacity and enhance operational efficiencies. The research and development facility at Vishakapatnam enables the company to develop new grades of fertilizers, including water soluble fertilizers, sulphozinc, etc.
Input Suppliers ◾ 67
The setting up of 407 Mana Gromor Centres across Andhra Pradesh has enabled the company to sell its products directly to farmers, thereby reducing its depen-dence on intermediaries, which has benefitted both the company as well as the farmer community. This has triggered direct interaction with the farmers, some-thing that has helped the company in developing new products to meet the specific and customized requirements of farmers.
A2.1.6 Transportation ChallengesMr. Sunil, the logistics and distribution manager at the Kakinada plant, is con-fronted by various operational problems and constraints. He is primarily concerned about the modes by which his company’s products reach end users, including those in remote markets, and about the average times taken by those modes. Company XYZ follows a multi-tier distribution system, as mentioned above. Sunil has to ensure the product reaches two categories of intermediaries—dealers/stockists as well as village retail centres (Mana Gromor Centres).
The planning for distribution of fertilizers each season is handled by the gov-ernment to meet the seasonal demand. The manufacturer has to keep stock in readiness at intermediate points, such as dealers and retail centres, and satisfy the variations in demand accordingly. Company XYZ also has its individual market strategy to align its sales objective with that of the macro level policies, resulting in mutually beneficial outputs.
Table A2.1 below shows the month-wise sales of ammonium phosphatic fertil-izers during the year 2008–2009.
As mentioned in Table A2.1, the total sale of ammonium phosphatic fertilizers for the year was 1.4 MT. The demand went up in the months of July–September and November–January and therefore, sales are higher during these periods. During the months of July–September, the demand stems primarily from the kharif season, and the demand during the months of November to January is due to the rabi sea-son. It is advisable to have buffer stocks during the months preceding and following the peak seasons to accommodate sudden upsurges in demand.
The fertilizer is transported from Kakinada to various places that fall within the 800 km radius. Table A2.1 above gives the month-wise distribution plan for fertil-izer from the XYZ plant. Every district within the 800 km radius has at least three stocking points. This is close to the rake point in the district for fertilizer.
The practice has been to transport the fertilizer by road if the distance from Kakinada is within 400 km and by rail if the distance is beyond 400 km. The loading factor varies significantly with road and rail. A normal truck can carry up to nine tonnes. In the case of rail transportation, fertilizer movement is achieved using rakes only. A–A broad gauge covered wagon has a capacity of 2,500 to 2,700 MT, while an open wagon carries up to 3,000 MT. A metre gauge wagon carries between 700 and 800 MT. XYZ has been moving broad gauge rakes with an
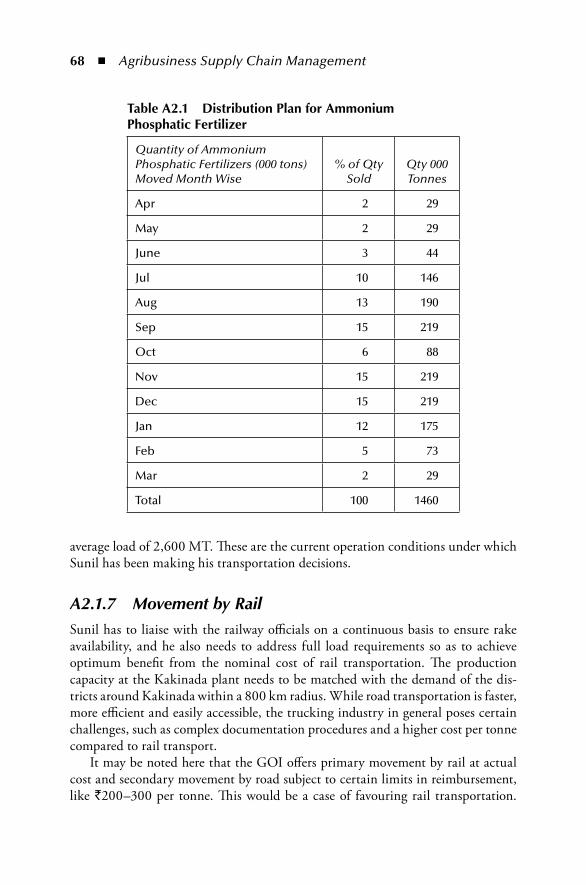
68 ◾ Agribusiness Supply Chain Management
average load of 2,600 MT. These are the current operation conditions under which Sunil has been making his transportation decisions.
A2.1.7 Movement by RailSunil has to liaise with the railway officials on a continuous basis to ensure rake availability, and he also needs to address full load requirements so as to achieve optimum benefit from the nominal cost of rail transportation. The production capacity at the Kakinada plant needs to be matched with the demand of the dis-tricts around Kakinada within a 800 km radius. While road transportation is faster, more efficient and easily accessible, the trucking industry in general poses certain challenges, such as complex documentation procedures and a higher cost per tonne compared to rail transport.
It may be noted here that the GOI offers primary movement by rail at actual cost and secondary movement by road subject to certain limits in reimbursement, like `200–300 per tonne. This would be a case of favouring rail transportation.
table A2.1 Distribution plan for Ammonium phosphatic Fertilizer
Quantity of Ammonium Phosphatic Fertilizers (000 tons) Moved Month Wise
% of Qty Sold
Qty 000 Tonnes
Apr 2 29
May 2 29
June 3 44
Jul 10 146
Aug 13 190
Sep 15 219
Oct 6 88
Nov 15 219
Dec 15 219
Jan 12 175
Feb 5 73
Mar 2 29
Total 100 1460
Input Suppliers ◾ 69
However, what is more important is to peg indirect costs such as ordering time cost and coordination cost.
The demand uncertainty needs to be met by opting for road transportation even when distances are greater than 400 km. This is because with rail transportation, rake availability needs to be confirmed and booked at least one week prior to the date of loading. Full wagon load conditions also need to be considered. This makes road transport more viable for smaller shipments to be delivered on a short notice period. Road transport service providers, however, operate in an unorganized envi-ronment, and Sunil needs to choose an appropriate transporter who will provide high service quality at a nominal cost.
The time taken for supply of rakes after placing a request with the railways is between one and five days. The turnaround time for rake load is between five and six days. The same distance when covered by road transport takes only three to four days. During the peak season, both road and rail capacities are fully utilized. In case of delay, backup storage needs to be arranged with the warehouse manager, since the stocking of other finished products such as pesticides and specialty nutri-ents also increases during the same period. The loading of products is possible only between 6 a.m. and 9 p.m. at the factory warehouse.
A2.1.8 Trade-OffsWhile reliability of supply is a crucial factor in the distribution of fertilizers, the inventory transportation balance needs to be maintained at an optimal level so as to ensure the operational efficiency of the company. Sunil is faced with the challenge of revisiting his company’s existing transportation plan and schedule and reducing the cost of operations, while maintaining an on-time delivery schedule to all the accessible districts. Demand information is given to the factory on a weekly basis; loading can be consolidated on a fortnightly or monthly basis depending on the distribution pattern, availability of road and rail capacity and cost of operations.
Sunil should also address the manpower requirements for loading of trucks directly for dispatch and for transportation to the railhead loading station. Labourers work in eight-hour shifts and during peak season, they work in two con-secutive shifts. Two labourers are needed to load a nine-tonne truck. Sunil needs to tie up with road transporters occasionally to deliver cargo to the railhead loading station. On an average, 25 labourers are available to work in each shift.
Sunil is also given the option of outsourcing his transportation requirements to a third party logistics service provider. The service provider has the capabilities of providing packaging, scheduling, booking of appropriate modes of transport, and delivering goods as requested by Sunil. However, the cost of these services will be higher than the cost of conducting them in-house. By developing a long-term relationship with the service provider, cost benefits could be accrued over the years to come.
70 ◾ Agribusiness Supply Chain Management
The transportation trade-off problem described above is a common challenge in any manufacturing setup that has to market products to interior parts of the country. The reliability of supply and availability of fertilizers are highly critical issues, since the agricultural sector is the backbone of the country’s growth, and its products are highly seasonal. Rail is generally the preferred mode of transport for bulk commodities like fertilizers, with a lower cost of transportation, though there are constraints such as specific destinations and loading problems. Road transpor-tation is more flexible and less time consuming than rail transportation, but comes at a higher cost. Transportation decisions revolve around rake loads, as well as road versus rail transportation benefit analysis. Till recently in India, about 73% of fertilizer was moved by rail and 27% by road. The XYZ plant has a different move-ment plan, as the plant is located in a fertile region where demand is concentrated within an area at a less than 400 km radius. Here, about 50% of the fertilizer is equally moved by road and by rail.
Sunil’s responsibility is to meticulously evaluate the various options available for transportation, including outsourcing to a third party logistics service provider, deriving cost–benefit analyses and then making modal choice decisions. He also needs to take into account storage considerations during the peak seasons. The costs of primary and secondary movement versus storage costs need to be carefully evaluated, and appropriate decisions made. These decisions should most impor-tantly take into account the seasonal nature of demand, and should be such that an optimum solution for the entire year is scheduled. There are also considerations of sudden upsurges in demand in specific locations, and hence, buffer stock would be needed at certain storage points and retail outlets. All these costs should be taken into account while making final decisions from the available outbound transporta-tion options.
In the case of company XYZ, transportation cost plays a very significant role in the final profitability of the firm. Coupled with the warehouse and inventory costs, the logistical trade-off needs to be achieved for improving operational effi-ciency. The result of this valuation of transportation options would also have a con-siderable impact on the procurement process.
Discussion points 1. Month-wise and mode-wise distribution plan 2. Budget for movement at `3.50 per tonne per km for road and for rail at 50%
of the road cost, as it is subsidized 3. Highlight distribution challenges considering demand spikes 4. What would be the benefits of using a third party logistics service provider?
Input Suppliers ◾ 71
notes 1. This case is for academic discussions only, and is not fully reflective of the
actual policy environment in India. 2. The case was first written about and published by N. Chandrasekaran, Supply
Chain Management, Oxford University Press of India, 2010, and has been revised now. Reprinted with permission of Oxford University Press of India.
referencesChandrasekaran, N., Supply Chain Management, India: Oxford University Press, 2010.Dave, V. Groundnut production to rise this summer. Business Standard, May 16, 2011. http://www.
business-standard.com/india/news/groundnut-production-to-rise-this-summer/435637/Government of India. National Rural Employment Guarantee Act, 2005 Gazette of India,
Sept. 7, 2005. http://www.nrega.nic.in/rajaswa.pdf (Accessed on March 28, 2012).Government of India, Economic Survey 2011–2012. http://indiabudget.nic.inPepsiCo India. PepsiCo India achieves splendid success in contract farming in West Bengal.
Mar. 23, 2010. http://www.pepsicoindia.co.in/media/Press-Releases/release_03_23_10.aspx (Accessed on Mar. 27, 2012).
Punj, S. Tractor queen on a roll—Mallika Srinivasan, Business Today, Sept. 18, 2011. http://www.businesstoday.intoday.in/story/most-powerful-women-in-business-2011-mallika-srinivasan/1/18321.html (Accessed on Mar. 7, 2012)
The Hindu. Govt cuts subsidy on key fertilizers. Mar. 1, 2012. http://www.thehindu.com/ business/Industry/article2950124.ece (Accessed on March 29, 2012).
The Hindu. The farmer outreach “ambulance”. Mar. 12, 2012. http://www.thehindu.com/sci-tech/agriculture/article2985487.ece (accessed on March 30, 2012).
Wadke, R. Subsidy for sugarcane harvesters in Maharashtra. The Hindu Business Line, Aug. 25, 2011. http://www.thehindubusinessline.com/industryand-economy/agri-biz/article2396944.ece

This page intentionally left blankThis page intentionally left blank
73
Chapter 3
Farm output: market intermediaries*
3.1 introductionMarketing of agricultural produce is a crucial aspect of agribusiness, as it can significantly impact the two goals of supply chains: cost and responsiveness. The responsiveness is measured in terms of the speed with which produce reaches customers. There are a number of factors that influence the distribution chan-nel of agricultural produce. These could include product bulkiness, perishability, seasonality, inadequate infrastructure, low market links at the farmer level and multiple intermediations because of poor structuring of financial flows. In spite of these constraints, the outbound movement of agricultural produce has been closely
* This chapter is reprinted from Chandrasekaran, N. Supply Chain Management. New Delhi: Oxford University Press India, 2010. With permission.
Obje CTIv eIn this chapter, various distribution options for farm output, such as directly from farm gate to consumer, wholesalers and other intermediaries, including mandis and auction centres, cooperatives and public agencies, and processors of farm output are discussed. The role of government agen-cies and organized players and challenges faced by them in managing their supply chains also are covered in the discussion.
74 ◾ Agribusiness Supply Chain Management
monitored by various interested groups such as the government for ensuring food availability and its security, farmers, consumers who are members of the general public, businesses, policy analysts and the media.
In this chapter, we analyse the various channels through which agricultural produce reaches the market, the challenges faced by supply chains and the various ways to improve supply chain objectives, so that the rewards for all constituents in the system are understood and achieved.
3.2 trends in outputThe production of agricultural produce has increased over the years. Table 3.1 pro-vides data on growth in agricultural production, Table 3.2 gives growth data for fish production in India and Table 3.3 reflects the data on the all-India production of milk, eggs and wool.
It may be observed from Table 3.1 that production of the major crops in India is growing, but not consistently. There have been years when agricultural production has dropped significantly, as in the case of pulses and coarse cereals in 2011–2012.
In the case of commercial crops, other than cotton, crops such as sugarcane, oil-seeds, jute and mesta have had fluctuating trends. Except for sugarcane, the other crops would directly impact trade of the produce. In India, most of the sugarcane harvested goes into production of plantation white sugar. However, during years of low production, intermediaries actively try to divert cane to low-end processes like manufacture of jaggery and khandsari, which are used as sweetening agents, especially in North India, for beverages.
It may be observed from Table 3.2 on fish production in India that marine production has recorded a sluggish increase over the decades. During the period 2000–2001 to 2009–2010, it grew from 28.11 lakh tonnes to 29.89 lakh tonnes. However, inland fish production has grown significantly, especially between 2000 and 2011, from 28.45 lakh tonnes to 48.62 lakh tonnes.
Similarly, Table 3.3 depicts the significant growth in milk production and egg production between 2000 and 2010. However, wool production has been sluggish during this period.
This kind of agriculture and allied products growth is bound to have a signifi-cant impact on marketing channels.
3.3 marketing ChannelsIt may be relevant here to mention that the output marketing system has evolved over centuries. A number of changes have happened in recent times, especially after the country’s independence, with the planned development of various sectors. The government has not only focused on agricultural policies but also on financial
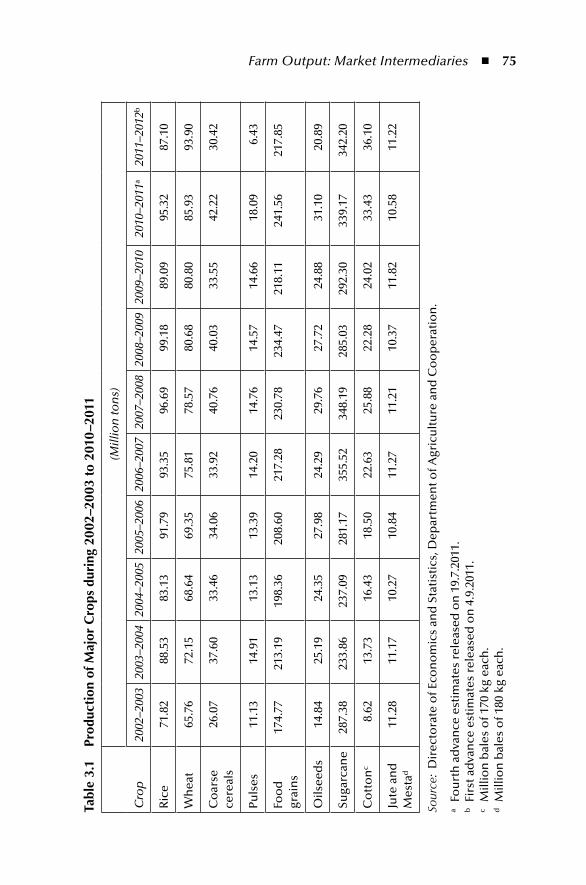
Farm Output: Market Intermediaries ◾ 75
tabl
e 3.
1 pr
oduc
tion
of m
ajor
Cro
ps d
urin
g 20
02–2
003
to 2
010
–201
1
Cro
p
(Mill
ion
ton
s)
2002
–200
320
03–2
004
2004
–200
520
05–2
006
2006
–200
720
07–2
008
2008
–200
920
09–2
010
2010
–201
1a20
11–2
012b
Ric
e71
.82
88.5
383
.13
91.7
993
.35
96.6
999
.18
89.0
995
.32
87.1
0
Wh
eat
65.7
672
.15
68.6
469
.35
75.8
178
.57
80.6
880
.80
85.9
393
.90
Co
arse
ce
real
s26
.07
37.6
033
.46
34.0
633
.92
40.7
640
.03
33.5
542
.22
30.4
2
Puls
es11
.13
14.9
113
.13
13.3
914
.20
14.7
614
.57
14.6
618
.09
6.43
Foo
d
grai
ns
174.
7721
3.19
198.
3620
8.60
217.
2823
0.78
234.
4721
8.11
241.
5621
7.85
Oils
eed
s14
.84
25.1
924
.35
27.9
824
.29
29.7
627
.72
24.8
831
.10
20.8
9
Suga
rcan
e28
7.38
233.
8623
7.09
281.
1735
5.52
348.
1928
5.03
292.
3033
9.17
342.
20
Co
tto
nc
8.62
13.7
316
.43
18.5
022
.63
25.8
822
.28
24.0
233
.43
36.1
0
Jute
an
d
Mes
tad
11.2
811
.17
10.2
710
.84
11.2
711
.21
10.3
711
.82
10.5
811
.22
Sour
ce:
Dir
ecto
rate
of E
con
om
ics
and
Sta
tist
ics,
Dep
artm
ent o
f Agr
icu
ltu
re a
nd
Co
op
erat
ion
.
a Fo
urt
h a
dva
nce
est
imat
es r
elea
sed
on
19.
7.20
11.
b
Firs
t ad
van
ce e
stim
ates
rel
ease
d o
n 4
.9.2
011.
c M
illio
n b
ales
of 1
70 k
g ea
ch.
d
Mill
ion
bal
es o
f 180
kg
each
.
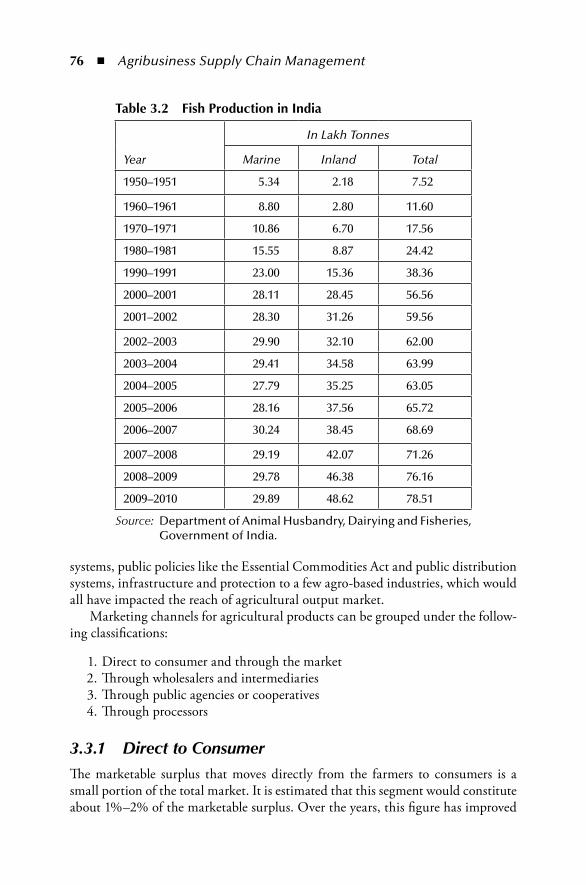
76 ◾ Agribusiness Supply Chain Management
systems, public policies like the Essential Commodities Act and public distribution systems, infrastructure and protection to a few agro-based industries, which would all have impacted the reach of agricultural output market.
Marketing channels for agricultural products can be grouped under the follow-ing classifications:
1. Direct to consumer and through the market 2. Through wholesalers and intermediaries 3. Through public agencies or cooperatives 4. Through processors
3.3.1 Direct to ConsumerThe marketable surplus that moves directly from the farmers to consumers is a small portion of the total market. It is estimated that this segment would constitute about 1%–2% of the marketable surplus. Over the years, this figure has improved
table 3.2 Fish production in india
Year
In Lakh Tonnes
Marine Inland Total
1950–1951 5.34 2.18 7.52
1960–1961 8.80 2.80 11.60
1970–1971 10.86 6.70 17.56
1980–1981 15.55 8.87 24.42
1990–1991 23.00 15.36 38.36
2000–2001 28.11 28.45 56.56
2001–2002 28.30 31.26 59.56
2002–2003 29.90 32.10 62.00
2003–2004 29.41 34.58 63.99
2004–2005 27.79 35.25 63.05
2005–2006 28.16 37.56 65.72
2006–2007 30.24 38.45 68.69
2007–2008 29.19 42.07 71.26
2008–2009 29.78 46.38 76.16
2009–2010 29.89 48.62 78.51
Source: Department of Animal Husbandry, Dairying and Fisheries, Government of India.
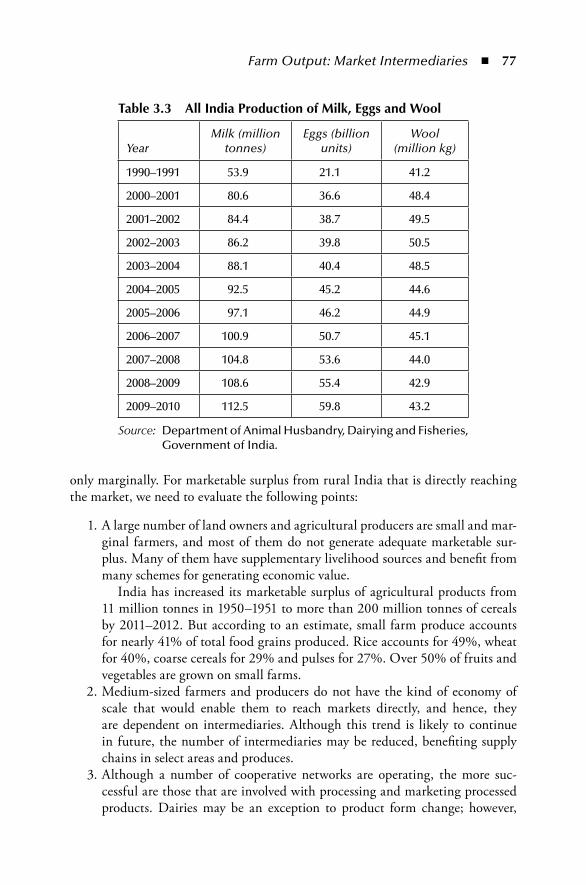
Farm Output: Market Intermediaries ◾ 77
only marginally. For marketable surplus from rural India that is directly reaching the market, we need to evaluate the following points:
1. A large number of land owners and agricultural producers are small and mar-ginal farmers, and most of them do not generate adequate marketable sur-plus. Many of them have supplementary livelihood sources and benefit from many schemes for generating economic value.
India has increased its marketable surplus of agricultural products from 11 million tonnes in 1950–1951 to more than 200 million tonnes of cereals by 2011–2012. But according to an estimate, small farm produce accounts for nearly 41% of total food grains produced. Rice accounts for 49%, wheat for 40%, coarse cereals for 29% and pulses for 27%. Over 50% of fruits and vegetables are grown on small farms.
2. Medium-sized farmers and producers do not have the kind of economy of scale that would enable them to reach markets directly, and hence, they are dependent on intermediaries. Although this trend is likely to continue in future, the number of intermediaries may be reduced, benefiting supply chains in select areas and produces.
3. Although a number of cooperative networks are operating, the more suc-cessful are those that are involved with processing and marketing processed products. Dairies may be an exception to product form change; however,
table 3.3 All india production of milk, eggs and Wool
YearMilk (million
tonnes)Eggs (billion
units)Wool
(million kg)
1990–1991 53.9 21.1 41.2
2000–2001 80.6 36.6 48.4
2001–2002 84.4 38.7 49.5
2002–2003 86.2 39.8 50.5
2003–2004 88.1 40.4 48.5
2004–2005 92.5 45.2 44.6
2005–2006 97.1 46.2 44.9
2006–2007 100.9 50.7 45.1
2007–2008 104.8 53.6 44.0
2008–2009 108.6 55.4 42.9
2009–2010 112.5 59.8 43.2
Source: Department of Animal Husbandry, Dairying and Fisheries, Government of India.
78 ◾ Agribusiness Supply Chain Management
processing is important, as the produce is highly perishable. This is mainly because of the fact that Indian milk market is for bulk and fresh milk.
4. A small portion of large farms, especially in high-value products and meat and fisheries, are engaged in direct marketing.
Thus, we believe that the direct marketing segment is still a small portion of the total agricultural produce raised in India, and is not likely to change dramatically.
Then the question that arises: how would the producers and suppliers to the agribusiness network benefit with a reasonable share of profits arising from the sup-ply chain networks?
3.3.2 Through Wholesalers and IntermediariesThere is a massive volume of produce handled by wholesalers and intermediaries in India. According to government sources, the private sector handles nearly 80% of the marketable surplus in agricultural products. The intermediaries include village traders, primary and secondary wholesalers, commission agents and also processors.
Intermediaries thrive because of the small volumes of food grain and other agricultural products that small- and medium-sized farmers produce. Other factors that influence the role and extent of intermediaries include the following:
The changing pattern of demand conditions, which is due to increased dispos-able income, provides scope for wider choices; price and budget are more liberal in certain cases.
1. Change in buying habits, such as greater frequency of buying, opting for buy-ing from departmental stores and exclusive outlets, health consciousness and limited ability to store at the family level, as there is an increase in the number of nuclear families, and space is increasingly at a premium.
2. On the supply side, in an earlier era farmers did not have an understanding of the markets, had access to inadequate data, and hence, were dependent on intermediaries. The situation has changed dramatically, as the explosion of media such as radio, television, private channels and Internet and their coverage has given tremendous, easy access to data on prices, arrivals and all other relevant information. Using these media, today farmers are able to use intermediaries more effectively. Intermediaries also now understand that their survival is more dependent on the value-added services they provide, rather than their exploitation of the gifts of gaps in the market system.
3. Another important development at the supply services side is the improvement in infrastructure such as storage, transportation and market centres. These fac-tors, along with the access to media and information technology, act as a boon to farmers when selling their output to intermediaries. This is because they are now informed producers/traders of produce, reflected in the confidence with which they can stock and sell for much better terms, rather than the hurry to monetize that was characteristic of the earlier decades of independent India.
Farm Output: Market Intermediaries ◾ 79
4. There is an increase in linkages with distant and overseas markets, which intermediaries enable access for agricultural produces. The focus of interme-diaries has shifted from taking produce to the nearest market to the business of reaching large and wide markets, where the advantages of volume and sustainability of business are in focus.
5. There are a number of changes in the forms and degrees of government interven-tion in the marketing of agricultural goods and infrastructure. This has made the intermediation profession more evolved and matured, moving towards per-formance and delivery rather than short-term gains. Government thinking and adoption of policies not only bring credence to the trade, but also enable evo-lution of competitive characteristics, shoring up the intensity of rivalry in the informal sector and making it more scientific and sensitive to value creation.
It may useful here to go through the market systems and some of the structural features of the Indian agriculture sector in relation to the above factors.
3.3.2.1 The Mandi System
Often, agricultural and allied production by an individual farmer in a field is of such meagre quantity that it is economically inadequate for the farmer to sell it directly in nearby regulated markets. This necessitates an aggregator to act as an intermediary for the farmer. Many farmers supply to one aggregator, who then sells through marketing channels that could include nearby markets, referred to as mandis. The produce then moves through wholesalers, before proceeding to retail-ers and consumers. Essentially, these are markets in small towns and cities to which farmers from nearby villages would bring the agricultural produce at harvest time and where traders would buy this produce from a large number of farmers selling their produce to a small number of traders who are the aggregators. This differ-entiates agricultural marketing from industrial products marketing, necessitating creation of separate special systems, institutions and infrastructure.
The roles played by brokers and commission agents include the following:
◾ Collection of the produce from a number of small farmers in villages or from larger farms and carrying everything in a single lot to towns/cities for sale
◾ Arranging transportation in single lots or unit loads and moving produce to the markets
◾ Enabling better price realization.
Thus, commission agents aggregate produce into marketable lots, improve price realization and enable transportation. These factors created a class of brokers and commission agents, who charged a commission from the farmers.
At times when a farmer does not find the prices quoted by the trader good enough, the trader would offer to keep the goods and wait for a buyer offering a
80 ◾ Agribusiness Supply Chain Management
better price. This could take days, weeks or months. The farmer would regularly check the latest price offered with the trader, and once the farmer agreed to a price, the trader would sell the goods on his behalf. For keeping the goods and arranging a buyer at a better price, the trader would again charge some extra fees/commission. This system came to be known as aadhat. This arrangement is simi-lar to a consignment sale.
3.3.2.2 Informal Financial System and Intermediation
Most of the farmers in India, as mentioned earlier, are small and marginal farm-ers who do not have sufficient funds or financial support for raising agricultural produce. They depend on money lenders, who are also incidentally traders and commission agents. Over years of regular buying of the produce from the same farmers, a trader had reasonable assurance that for each new harvest, his farmers would bring their produce to him for sale. The trader, therefore, found it relatively risk-free to lend money to such farmers in times of their need. A large number of traders in these markets are also money lenders. However, it is believed that such traders charge exorbitant interest rates, and bind farmers to a vicious cycle of debt burdens. It is also a sombre fact that there has been a large incidence of suicides by small and marginal farmers, as they were neither able to return the debt nor lead a decent standard living for themselves and their families.
All these transactions, as is obvious, were informal and unregulated systems and practices that evolved over centuries, mostly because of the socio-economic condi-tions and culture practices prevailing in the society at various times in history. The farmers were always an unorganized lot, with little or no strong resources, and the traders, aarhitia or brokers were wealthier and more powerful. The level of maturity of the social and legal system was inadequate to establish socio-economic justice. This led to gross exploitation of the market, wherein neither the producers nor the con-sumers were better off, but intermediaries in the system flourished at the cost of both.
With the independence of the country in 1947, many legislative and struc-tural reforms such as abolition of the zamindari system were undertaken by the government. Similarly, reform was introduced by enacting the Agricultural Produce Marketing Committee (APMC) Act, to regulate the system (Planning Commission). However, even today, there are pockets of India where intermediar-ies are still taking advantage of the plight of the poor farmers.
3.3.2.3 Procurement by Government Agencies and Cooperatives
The Food Corporation of India (FCI) is the nodal Government of India (GOI) agency that, along with other state government agencies, procures wheat, paddy and coarse grains directly from farmers. This is one of the government’s major interventionist programmes to
Farm Output: Market Intermediaries ◾ 81
1. facilitate fair price realization for farmers and 2. ensure availability of food grains to the weaker sections of Indian society
under any given circumstances through buffer stock maintenance operations. This is more of a food security measure.
The FCI and state government agencies establish a number of purchase centres at various points, so that farmers can utilize the benefits of the scheme. The number of procurement centres is decided by the state governments during every season, based on a number of parameters. The focus is to ensure that the minimum sup-port price programmes work well, and farmers are not compelled to sell to agents or processors at a price less than the minimum support price. It may be noted here that farmers are free to sell their produce at prices higher than the minimum sup-port price, if they find any such opportunities in the market.
Typically, the government procurement and food subsidy system in India oper-ates as explained below:
1. The GOI fixes the minimum support price (MSP) for food grains, at which procurements will be made from farmers.
2. The food grains are stocked and carried over for distribution through the Public Distribution System (PDS), while a buffer stock is maintained for managing any uncertainties.
3. By the socialist policies of the government followed, PDS distribution is heav-ily subsidized, as it is targeted at benefiting low-income groups, and a number of schemes for the poor are implemented using the stock carried.
4. Food subsidies in India have been severely criticized of late, as they have increased the non-plan expenditure burden. Food subsidies, which were around `2,850 crore in 1991–1992, have increased to `72,823 crore in 2011–2012.
Food production of the main staple crops, namely, rice and wheat, has grown over the years, but with an inconsistent trend, especially for wheat. This would certainly impact procurement, as during years of low production, one would expect the market to pay more than the minimum support price, and farmers would sell through the market. In years of high production, the markets would bear down and hence the FCI would procure more. Further, the FCI would be constrained by space and policy considerations, which we will discuss later. Table 3.4 provides data on recent trends in procurement of rice and wheat, and the share of procurement in total production.
Some of the observations from the above table are as follows:
1. Rice procurement has increased from 23.7% of production in 2001–2002 to 33% of total production in 2011–2012.
2. Rice procurement increased significantly in 2008–2009, and was around the same level in 2011–2012.
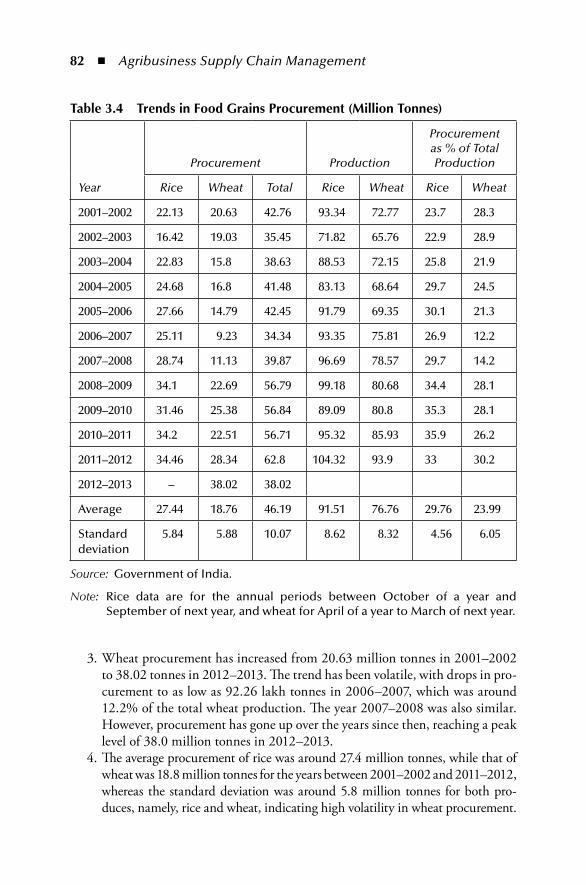
82 ◾ Agribusiness Supply Chain Management
3. Wheat procurement has increased from 20.63 million tonnes in 2001–2002 to 38.02 tonnes in 2012–2013. The trend has been volatile, with drops in pro-curement to as low as 92.26 lakh tonnes in 2006–2007, which was around 12.2% of the total wheat production. The year 2007–2008 was also similar. However, procurement has gone up over the years since then, reaching a peak level of 38.0 million tonnes in 2012–2013.
4. The average procurement of rice was around 27.4 million tonnes, while that of wheat was 18.8 million tonnes for the years between 2001–2002 and 2011–2012, whereas the standard deviation was around 5.8 million tonnes for both pro-duces, namely, rice and wheat, indicating high volatility in wheat procurement.
table 3.4 trends in Food Grains procurement (million tonnes)
Year
Procurement Production
Procurement as % of Total Production
Rice Wheat Total Rice Wheat Rice Wheat
2001–2002 22.13 20.63 42.76 93.34 72.77 23.7 28.3
2002–2003 16.42 19.03 35.45 71.82 65.76 22.9 28.9
2003–2004 22.83 15.8 38.63 88.53 72.15 25.8 21.9
2004–2005 24.68 16.8 41.48 83.13 68.64 29.7 24.5
2005–2006 27.66 14.79 42.45 91.79 69.35 30.1 21.3
2006–2007 25.11 9.23 34.34 93.35 75.81 26.9 12.2
2007–2008 28.74 11.13 39.87 96.69 78.57 29.7 14.2
2008–2009 34.1 22.69 56.79 99.18 80.68 34.4 28.1
2009–2010 31.46 25.38 56.84 89.09 80.8 35.3 28.1
2010–2011 34.2 22.51 56.71 95.32 85.93 35.9 26.2
2011–2012 34.46 28.34 62.8 104.32 93.9 33 30.2
2012–2013 – 38.02 38.02
Average 27.44 18.76 46.19 91.51 76.76 29.76 23.99
Standard deviation
5.84 5.88 10.07 8.62 8.32 4.56 6.05
Source: Government of India.
Note: Rice data are for the annual periods between October of a year and September of next year, and wheat for April of a year to March of next year.
Farm Output: Market Intermediaries ◾ 83
The objective of PDS management is to make food of a certain quantity and affordable price available to the poor and vulnerable sections of the society at all times, and also to provide fair returns to farmers. The most ideal situation would be to procure more from farmers during years of surplus production, when one would expect prices to be reasonable, and release more stocks during years of shortage. However, the reality is that there is massive stress on the system, for reasons that are given below:
1. The cost of management of buffer stocks and the PDS is high, as the eco-nomic costs include procurement prices, transportation and handling, cost of carrying stocks and obsolescence due to uneven stock and off-take.
2. Inflationary trends in food prices in India during the last two years have led to severe criticism of the government’s food policy. The years 2006–2007 and 2007–2008 were characterized by low-cost inflation for wheat and rice. However, procurement of both grains did not move up significantly. “In fact, wheat procurement declined sharply during these periods, contrary to expec-tations. The year 2009–10 witnessed sharp inflation in the prices of rice and wheat, and thus, one would have expected lower procurement of rice and wheat during this period. But the trend was again contrary” (Basu, 2011). This raises doubt about the efficacy of the procurement system that is operat-ing in India.
3. As per the current practice, FCI releases in open market operations are bought mostly by millers and rarely by traders. The millers are not allowed to resell to traders and make profits. Ideally, one would expect traders to bid in open market sales, so that they enjoy opportunities to book profit on volumes when prices are high and low surplus is available from the farming commu-nity. This does not happen, which again defies economic logic. The reasons could be the aggressive monitoring and controlling mechanisms on reselling and profiteering, which are not helpful to control prices, as releases are not adequate when they have to be!
4. There has been severe criticism again on the shortage of storage space with FCI and state governments, and on the poor quality of rice and wheat. Obsolescence again is looked upon as a crime in a country like India, where food inflation is a shocker and a substantial population of people who are downtrodden go without adequate food. Though FCI has been doing well in adding capacities, it is a challenge to rise up to the levels of procurement volumes that are ideal.
This is a vociferously debated subject in India, and enormous amount of reports and other information are available in the public domain. Our objective here is to highlight how public procurement plays a critical role in supply chain networks, though there are lots of challenges, and the desired levels of efficiency and respon-siveness are not achieved.
84 ◾ Agribusiness Supply Chain Management
3.3.3 Producers’ CooperativeA cooperative system is a voluntary organization established and managed by its members under a nurtured government system that enables farmers to market their farm products collectively. A cooperative marketing society’s main purpose is to help members to market their produce more profitably than would be possible if they traded through the private sector. This system works when credit flow is even and fair at the market, so that farmers need not depend upon contractors and trad-ers for credit, and can sell directly at the markets. Even for those who have bor-rowed from the private sector, the cooperative system helps to establish an alternate route and structure so that they may achieve fair realization on their produce.
The producers’ cooperative is mainly meant for the benefits of producers, and this would indicate a bias in principle. In reality, cooperatives are a way of improv-ing collective bargaining power, as individual farmers operate small holdings and produce quantities that individually may not reach marketable lot sizes.
In India, there is a four-tiered federal structure percolating down to the level of primary societies at village clusters. The structure is shown below.
Level Organization
National National Agricultural Co-operative Marketing Federation (NAFED)
State State Co-operative Marketing Federation (SCMF)
Regional District or Regional Marketing Society (DMS)
Village Primary Marketing Societies (PMS)
The National Agricultural Co-operative Marketing Federation (NAFED) is a federal organization of state level apex co-operative marketing societies in India.
It was established in 1958, with its headquarters in New Delhi. Its opera-tions cover the entire country. The objects of the NAFED are to organize, promote and develop marketing, processing and storage of agricultural, horticultural and forest produce; distribution of agricultural machinery, implements and other inputs; undertaking of inter-state, import and export trade, wholesale or retail as the case may be; and acting and assist-ing with technical advice in agricultural production for the promotion and effective working of its members and cooperative marketing, pro-cessing and supply societies in India (NAFED, 2012; see Table 3.5).
Highlights of operation of NAFED in 2011–2012 (NAFED, 2012):
1. NAFED procured 23,028.24. MT of various oilseeds and oils, including groundnut pods, mustard seed, soya bean, sunflower seed and assorted oils valued at `530.6 million, and sold a quantity of 24,274.44 MT of various oilseeds and oils valued at `632.2 million.
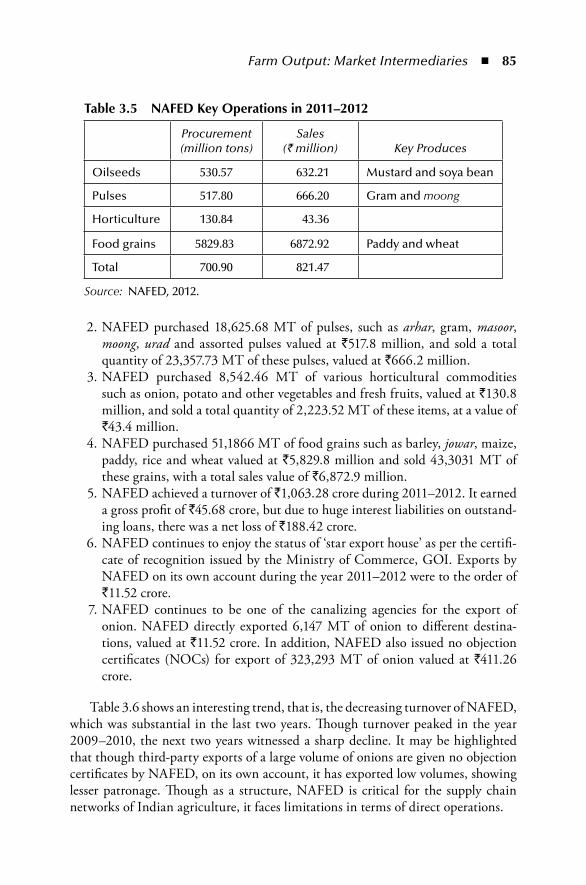
Farm Output: Market Intermediaries ◾ 85
2. NAFED purchased 18,625.68 MT of pulses, such as arhar, gram, masoor, moong, urad and assorted pulses valued at `517.8 million, and sold a total quantity of 23,357.73 MT of these pulses, valued at `666.2 million.
3. NAFED purchased 8,542.46 MT of various horticultural commodities such as onion, potato and other vegetables and fresh fruits, valued at `130.8 million, and sold a total quantity of 2,223.52 MT of these items, at a value of `43.4 million.
4. NAFED purchased 51,1866 MT of food grains such as barley, jowar, maize, paddy, rice and wheat valued at `5,829.8 million and sold 43,3031 MT of these grains, with a total sales value of `6,872.9 million.
5. NAFED achieved a turnover of `1,063.28 crore during 2011–2012. It earned a gross profit of `45.68 crore, but due to huge interest liabilities on outstand-ing loans, there was a net loss of `188.42 crore.
6. NAFED continues to enjoy the status of ‘star export house’ as per the certifi-cate of recognition issued by the Ministry of Commerce, GOI. Exports by NAFED on its own account during the year 2011–2012 were to the order of `11.52 crore.
7. NAFED continues to be one of the canalizing agencies for the export of onion. NAFED directly exported 6,147 MT of onion to different destina-tions, valued at `11.52 crore. In addition, NAFED also issued no objection certificates (NOCs) for export of 323,293 MT of onion valued at `411.26 crore.
Table 3.6 shows an interesting trend, that is, the decreasing turnover of NAFED, which was substantial in the last two years. Though turnover peaked in the year 2009–2010, the next two years witnessed a sharp decline. It may be highlighted that though third-party exports of a large volume of onions are given no objection certificates by NAFED, on its own account, it has exported low volumes, showing lesser patronage. Though as a structure, NAFED is critical for the supply chain networks of Indian agriculture, it faces limitations in terms of direct operations.
table 3.5 nAFeD Key operations in 2011–2012
Procurement (million tons)
Sales (` million) Key Produces
Oilseeds 530.57 632.21 Mustard and soya bean
Pulses 517.80 666.20 Gram and moong
Horticulture 130.84 43.36
Food grains 5829.83 6872.92 Paddy and wheat
Total 700.90 821.47
Source: NAFED, 2012.
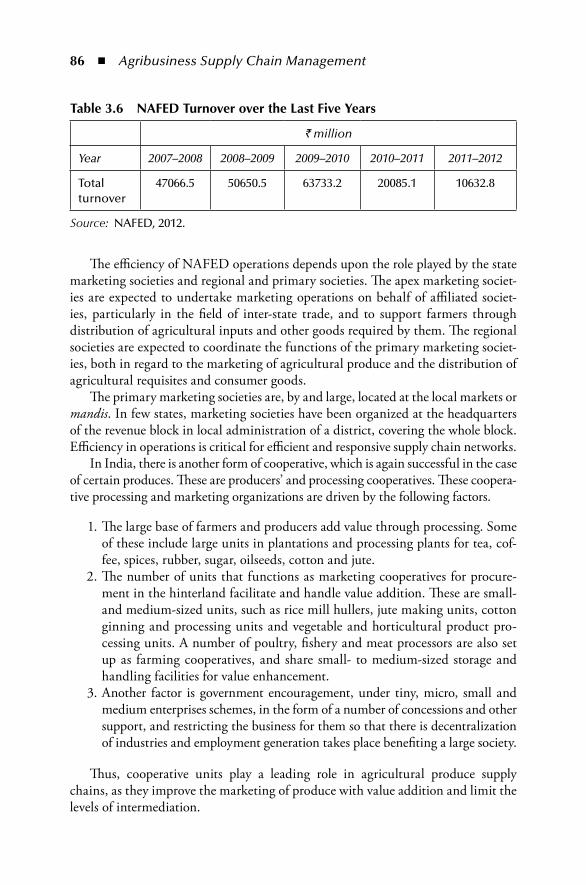
86 ◾ Agribusiness Supply Chain Management
The efficiency of NAFED operations depends upon the role played by the state marketing societies and regional and primary societies. The apex marketing societ-ies are expected to undertake marketing operations on behalf of affiliated societ-ies, particularly in the field of inter-state trade, and to support farmers through distribution of agricultural inputs and other goods required by them. The regional societies are expected to coordinate the functions of the primary marketing societ-ies, both in regard to the marketing of agricultural produce and the distribution of agricultural requisites and consumer goods.
The primary marketing societies are, by and large, located at the local markets or mandis. In few states, marketing societies have been organized at the headquarters of the revenue block in local administration of a district, covering the whole block. Efficiency in operations is critical for efficient and responsive supply chain networks.
In India, there is another form of cooperative, which is again successful in the case of certain produces. These are producers’ and processing cooperatives. These coopera-tive processing and marketing organizations are driven by the following factors.
1. The large base of farmers and producers add value through processing. Some of these include large units in plantations and processing plants for tea, cof-fee, spices, rubber, sugar, oilseeds, cotton and jute.
2. The number of units that functions as marketing cooperatives for procure-ment in the hinterland facilitate and handle value addition. These are small- and medium-sized units, such as rice mill hullers, jute making units, cotton ginning and processing units and vegetable and horticultural product pro-cessing units. A number of poultry, fishery and meat processors are also set up as farming cooperatives, and share small- to medium-sized storage and handling facilities for value enhancement.
3. Another factor is government encouragement, under tiny, micro, small and medium enterprises schemes, in the form of a number of concessions and other support, and restricting the business for them so that there is decentralization of industries and employment generation takes place benefiting a large society.
Thus, cooperative units play a leading role in agricultural produce supply chains, as they improve the marketing of produce with value addition and limit the levels of intermediation.
table 3.6 nAFeD turnover over the Last Five years
` million
Year 2007–2008 2008–2009 2009–2010 2010–2011 2011–2012
Total turnover
47066.5 50650.5 63733.2 20085.1 10632.8
Source: NAFED, 2012.
Farm Output: Market Intermediaries ◾ 87
3.3.4 Through ProcessorsIn India, buying and selling of agricultural produce mainly take place in market yards, sub-yards and rural periodic markets spread throughout the country. There are in all 7,246 regulated markets in the country (as on June 30, 2011) and 21,238 rural periodic markets, about 20% of which function under the ambit of regulation. The agricultural marketing system in India has experienced government intervention and evolved over the years. Private sector agricultural produce processors were earlier bought through regulated markets, directly or through contractors or other intermediaries.
However, there are certain crops like sugarcane where satellite farming is allowed. This would mean that there could be an allotted geographical area around processing plants, within which the plants could develop farming activities with landowners and cultivators. The plants can procure the produce and operate their plants profitably. Farmers have the right not to sell, if they choose to do so. In most cases, the government fixes the minimum procurement price in such farming activities, so that farmers are not exploited. Further discussions on this are handled in the chapter on agricultural processors.
A typical, formal contractual farming arrangement confers benefits to both producers and purchasers. Farmers avail of remunerative marketing opportunities by way of assured procurement of their produce of desired quality. The contrac-tor sponsor procures produce at a pre-determined price, based on certain quality parameters. Normally, the contract sponsor provides technical support and also input services to achieve the desired outcome and quality.
“One may note that the model APMC Act 2003 stipulates institutional arrange-ments for registration of sponsoring companies, recording of contract farming agreements, and indemnity for securing farmers land; and the Act also lays down a time-bound dispute resolution mechanism. Contract farming with a lot of infor-mality has been prevalent in various parts of the country for commercial crops such as sugarcane, cotton, tea and coffee” (planningcommission.nic.in).
In recent times, some Indian states have amended the APMC Act to allow contract farming. There have been private sector initiatives in direct procurement from farmers, such as Pepsi Foods Pvt. Ltd., Tata Rallies, Mahindra Shubh Labh and Cargill India. The focus in contract arrangements has been towards improv-ing farm economics through elimination of waste and productivity enhancement, thereby increasing farm income and at the same, helping the corporate entity achieve its goal of linking agriculturalist corporate activities to production systems in the agribusiness sector.
There have been some instances of appreciably successful contract farming in India, notwithstanding the criticism raised by different interest groups. ITC pro-moted the e-choupal model, which seeks to address the constraints faced by the Indian farmer arising out of small and fragmented farm holdings, weak infrastruc-ture, supply chain intermediaries and the lack of quality and real-time information. ITC appoints sanchalaks, who are local leaders. The sanchalak sets up a kiosk with
88 ◾ Agribusiness Supply Chain Management
Internet connectivity. Farmers use this facility to obtain real-time market infor-mation on prices, availability of inputs, weather data and other issues that are of relevance to them. The local leader, also on behalf of ITC, aggregates and procures the product, which is taken over by ITC for processing. ITC also enables farmers to aggregate their buying needs both for agricultural inputs and farming as well as for consumption, and provides group bargaining power.
It is estimated that ITC’s intervention in agribusiness supply chains has permit-ted farmers to increase their sales by 10%–15%. Further, ITC has succeeded in generating procurement cost saving to the tune of 3%–4%, allowing it to incre-mentally improve its competitive position (Patnaik, 2011).
Another company which is engaged in corporate farming in India is Pepsi. Similarly, McDonald’s has mentioned that through its supplier McCain, it has worked closely with farmers in Gujarat to produce process-grade potato varieties, which are not common in India. According to Bakshi, “These are mainly contract farmers in Deesa (North Gujarat) and Kheda (Central Gujarat). We continue to contribute in the growth of these farmers. McDonald’s remains steadfast to its commitment of working with local suppliers and farmers to source all its require-ments in India.” (Indo Asian News Service, 2012)
Apart from these multinationals, a number of large and middle-sized companies, who have set up successful agribusinesses, are working in partnership with farmers. This list includes companies like Tata, HUL, Britannia, Nestle, AVT Group, Cavin Kare, Hatsun Agro, Marico, Kaleesuwari, K.S Oils and Heritage, to name a few.
This fact highlights the scope for private processors to improve supply chains in agribusiness, provided the prevailing atmosphere provides all the necessary sup-port, enabling them to compete in a fair and regulated environment with less con-trols and more enabling polices.
3.4 ConclusionSupply chains for agricultural output face the challenges of product bulkiness, perish-ability, seasonality, inadequate infrastructure and low market links at the farmer level. There has been a trend towards multiple intermediations because of poor structuring of financial flows. Agricultural output has been growing over the years. The need to manage output and prices has been a challenge. The government has to manage farm-ing community economics with fair price realization and at the same time provide food security to the poor and vulnerable members of society in the India population. Output flow management is a key supply chain process, wherein market and regula-tory forces interact through governments, private players and the farming community to achieve efficiency and responsiveness. There seems to be a lot of misgivings about intermediaries through contractors. Traders and money lenders play active roles, as most of the farmers are small and marginal, and are unable to raise marketable
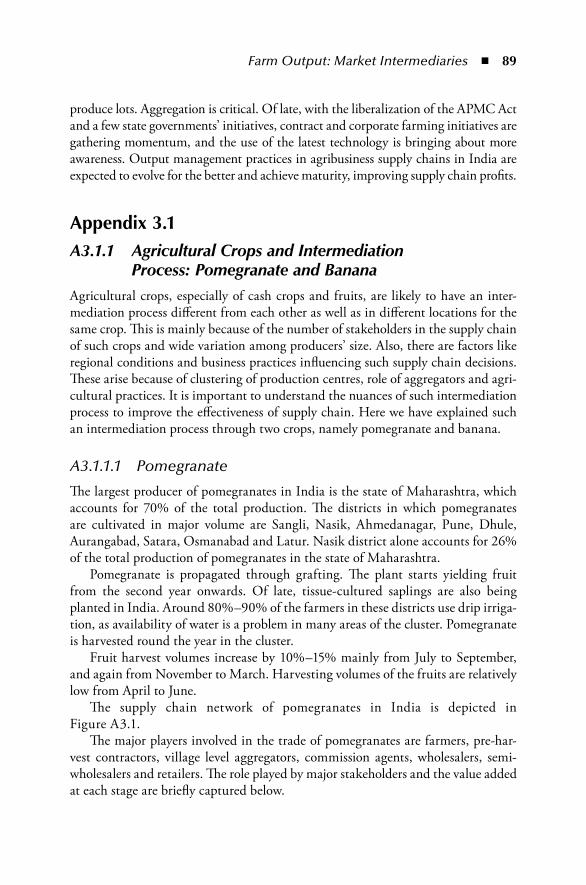
Farm Output: Market Intermediaries ◾ 89
produce lots. Aggregation is critical. Of late, with the liberalization of the APMC Act and a few state governments’ initiatives, contract and corporate farming initiatives are gathering momentum, and the use of the latest technology is bringing about more awareness. Output management practices in agribusiness supply chains in India are expected to evolve for the better and achieve maturity, improving supply chain profits.
Appendix 3.1A3.1.1 Agricultural Crops and Intermediation
Process: Pomegranate and BananaAgricultural crops, especially of cash crops and fruits, are likely to have an inter-mediation process different from each other as well as in different locations for the same crop. This is mainly because of the number of stakeholders in the supply chain of such crops and wide variation among producers’ size. Also, there are factors like regional conditions and business practices influencing such supply chain decisions. These arise because of clustering of production centres, role of aggregators and agri-cultural practices. It is important to understand the nuances of such intermediation process to improve the effectiveness of supply chain. Here we have explained such an intermediation process through two crops, namely pomegranate and banana.
A3.1.1.1 Pomegranate
The largest producer of pomegranates in India is the state of Maharashtra, which accounts for 70% of the total production. The districts in which pomegranates are cultivated in major volume are Sangli, Nasik, Ahmedanagar, Pune, Dhule, Aurangabad, Satara, Osmanabad and Latur. Nasik district alone accounts for 26% of the total production of pomegranates in the state of Maharashtra.
Pomegranate is propagated through grafting. The plant starts yielding fruit from the second year onwards. Of late, tissue-cultured saplings are also being planted in India. Around 80%–90% of the farmers in these districts use drip irriga-tion, as availability of water is a problem in many areas of the cluster. Pomegranate is harvested round the year in the cluster.
Fruit harvest volumes increase by 10%–15% mainly from July to September, and again from November to March. Harvesting volumes of the fruits are relatively low from April to June.
The supply chain network of pomegranates in India is depicted in Figure A3.1.
The major players involved in the trade of pomegranates are farmers, pre-har-vest contractors, village level aggregators, commission agents, wholesalers, semi-wholesalers and retailers. The role played by major stakeholders and the value added at each stage are briefly captured below.
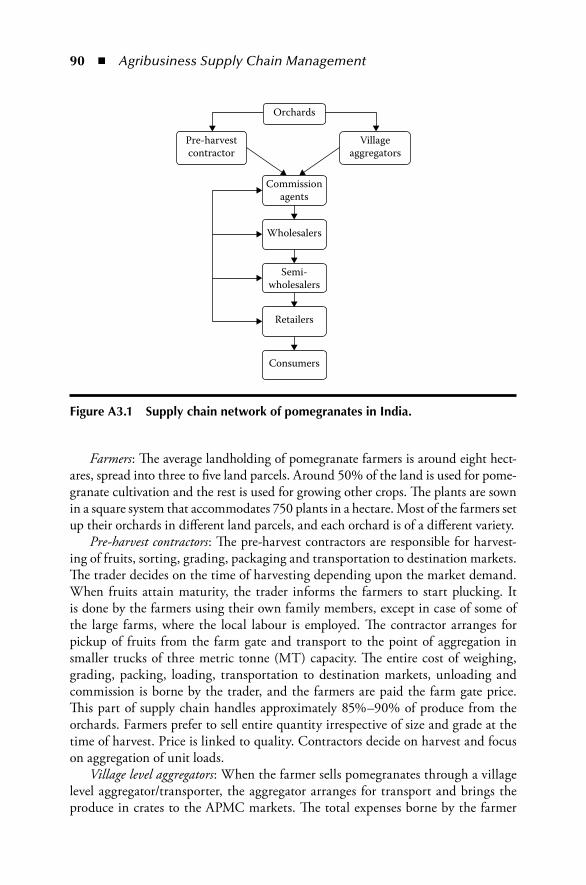
90 ◾ Agribusiness Supply Chain Management
Farmers: The average landholding of pomegranate farmers is around eight hect-ares, spread into three to five land parcels. Around 50% of the land is used for pome-granate cultivation and the rest is used for growing other crops. The plants are sown in a square system that accommodates 750 plants in a hectare. Most of the farmers set up their orchards in different land parcels, and each orchard is of a different variety.
Pre-harvest contractors: The pre-harvest contractors are responsible for harvest-ing of fruits, sorting, grading, packaging and transportation to destination markets. The trader decides on the time of harvesting depending upon the market demand. When fruits attain maturity, the trader informs the farmers to start plucking. It is done by the farmers using their own family members, except in case of some of the large farms, where the local labour is employed. The contractor arranges for pickup of fruits from the farm gate and transport to the point of aggregation in smaller trucks of three metric tonne (MT) capacity. The entire cost of weighing, grading, packing, loading, transportation to destination markets, unloading and commission is borne by the trader, and the farmers are paid the farm gate price. This part of supply chain handles approximately 85%–90% of produce from the orchards. Farmers prefer to sell entire quantity irrespective of size and grade at the time of harvest. Price is linked to quality. Contractors decide on harvest and focus on aggregation of unit loads.
Village level aggregators: When the farmer sells pomegranates through a village level aggregator/transporter, the aggregator arranges for transport and brings the produce in crates to the APMC markets. The total expenses borne by the farmer
Pre-harvestcontractor
Villageaggregators
Commissionagents
Wholesalers
Semi-wholesalers
Retailers
Consumers
Orchards
Figure A3.1 Supply chain network of pomegranates in india.
Farm Output: Market Intermediaries ◾ 91
includes the cost of transportation and loading/unloading charges, as well as the margin payable to the village level aggregator. Village level aggregators handle about 10%–15% of the produce from orchards. Transactions are driven by market forces and price is linked to quality. Typically, farmers decide on harvest time and village level aggregators sell in nearby APMCs.
Commission agents: They facilitate trade between the contractor and the whole-saler, for which they charge a commission of 8%–10% from the contractor. Payment to the contractor is made by the commission agent on behalf of the buyer/wholesaler.
Wholesalers: They are the bulk breakers and are responsible for distribution of pomegranates to various locations in the country. The wholesaler pays marketing cess at the rate of 1.05%, and sends the produce to semi-wholesalers or retailers.
As mentioned earlier, only 10%–15% of the produce from an orchard is sold through aggregators in APMC markets. The produce is sold by open auction through commission agents, and they charge 8% commission from the farmers. The produce is bought by traders, who pay marketing cess @1.05%. Pomegranates are graded and packed in premises provided by the commission agent, and the cost is borne by the trader.
Some of the salient features of the price build-up are mentioned below:
◾ There are around five intermediaries between the farmer and the consumer. The intermediaries are the contractor, the commission agent, the wholesaler, the semi-wholesaler and the retailer.
◾ In moving of produce from the farmer to the consumer, the price builds up by around 2.5 times.
◾ Since pomegranate is a hardy fruit, wastage is quite low along the value chain, that is, 3%–5% at the farm level and 1% during handling and transport. Major losses occur at the retailer level (both weight and value), that is, around 5%–10%, if the produce is not sold on the same day.
Some of the gaps widely discussed in the supply side are that
◾ farmers have limited knowledge about scientific crop management; ◾ plucking is mostly done manually and the use of equipment for harvesting is
limited to a few large growers; ◾ pomegranates are graded and packed manually at the farm level, at which
level pre-processing facilities such as pre-cooling, washing, grading and sort-ing are absent.
There are a number of interested parties such as state governments, central gov-ernment departments, financing institutions and banks, along with infrastructure companies, that are working on improving the supply chain.
The above discussion depicts the role and responsibilities of supply chain players in the pomegranate supply chain networks of India. We will now discuss another crop, which is similar to the pomegranate in terms of economic factors.
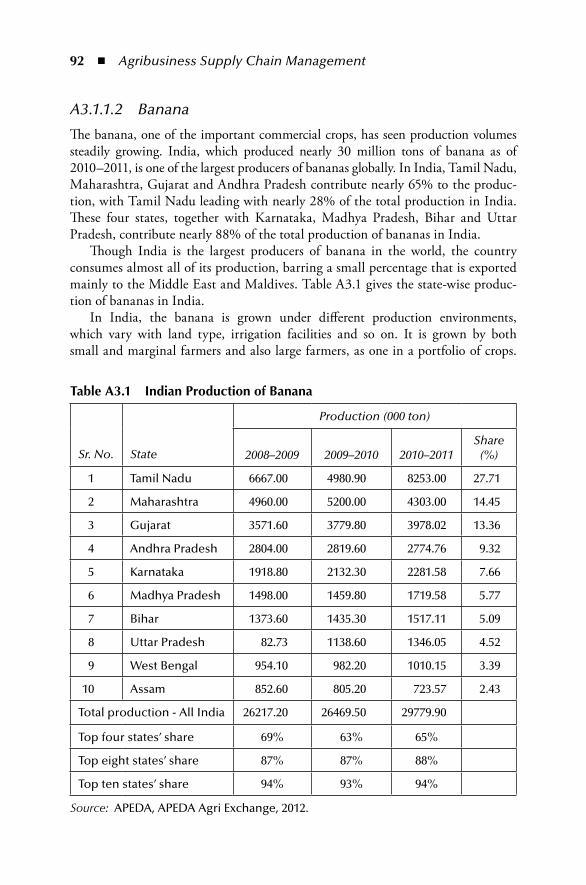
92 ◾ Agribusiness Supply Chain Management
A3.1.1.2 Banana
The banana, one of the important commercial crops, has seen production volumes steadily growing. India, which produced nearly 30 million tons of banana as of 2010–2011, is one of the largest producers of bananas globally. In India, Tamil Nadu, Maharashtra, Gujarat and Andhra Pradesh contribute nearly 65% to the produc-tion, with Tamil Nadu leading with nearly 28% of the total production in India. These four states, together with Karnataka, Madhya Pradesh, Bihar and Uttar Pradesh, contribute nearly 88% of the total production of bananas in India.
Though India is the largest producers of banana in the world, the country consumes almost all of its production, barring a small percentage that is exported mainly to the Middle East and Maldives. Table A3.1 gives the state-wise produc-tion of bananas in India.
In India, the banana is grown under different production environments, which vary with land type, irrigation facilities and so on. It is grown by both small and marginal farmers and also large farmers, as one in a portfolio of crops.
table A3.1 indian production of Banana
Sr. No. State
Production (000 ton)
2008–2009 2009–2010 2010–2011Share (%)
1 Tamil Nadu 6667.00 4980.90 8253.00 27.71
2 Maharashtra 4960.00 5200.00 4303.00 14.45
3 Gujarat 3571.60 3779.80 3978.02 13.36
4 Andhra Pradesh 2804.00 2819.60 2774.76 9.32
5 Karnataka 1918.80 2132.30 2281.58 7.66
6 Madhya Pradesh 1498.00 1459.80 1719.58 5.77
7 Bihar 1373.60 1435.30 1517.11 5.09
8 Uttar Pradesh 82.73 1138.60 1346.05 4.52
9 West Bengal 954.10 982.20 1010.15 3.39
10 Assam 852.60 805.20 723.57 2.43
Total production - All India 26217.20 26469.50 29779.90
Top four states’ share 69% 63% 65%
Top eight states’ share 87% 87% 88%
Top ten states’ share 94% 93% 94%
Source: APEDA, APEDA Agri Exchange, 2012.
Farm Output: Market Intermediaries ◾ 93
Contiguous cropping could be important in cases of large commercial farming. The garden land system, with three crop cycles, is a widely adopted system of produc-tion in many parts of the country. Wetland banana cultivation with deep trenches is common in Tamil Nadu and parts of Karnataka; perennial cultivation on hill slopes is also practised in Tamil Nadu, the north-eastern states and Karnataka. The banana is grown as a subsistence crop in homesteads, and is also grown as a crop mixed with areca nut and coconut trees (Mustaffa, 2011).
In Tamil Nadu, bananas are mostly cultivated in Tiruchirappalli, Coimbatore, Erode, Karur, Dindigul, Namakkal, Madurai, Tirunelveli, Kanyakumari, Vellore and Thanjavur districts. Banana produced in the southern states of India, namely, Tamil Nadu, Karnataka, Andhra Pradesh and Kerala, are consumed in major urban markets such as Chennai, Madurai, Coimbatore, Trivandrum, Kochi, Bangalore, Mysore, Hyderabad and Vishakhapatnam, and also get redistributed to nearby markets from these cities. The banana is consumed as a ripened fruit. It is also processed as chips. Kerala gets a lot of bananas from other states, whereas Tamil Nadu is not just more self-sufficient, but also supplies surplus quantities to other states.
In another leading banana-producing state, Maharashtra, Jalgoan, Dhule and Buldhana are the major banana-producing districts. Around 80%–85% of the banana produced in Maharashtra is marketed out of the state to New Delhi, Lucknow, Kanpur, Amritsar, Jaipur and other places. New Delhi is the most important market for bananas from Maharashtra, and it acts as a major consump-tion as well as distribution centre serving markets in the national capital region. Rail transport is widely used for movement.
In the case of the state of Gujarat, Surat, Anand, Vadodra, Bharuch and Narmada are the major banana-producing centres and similar to Maharashtra, a substantial quantity is moved to northern India through New Delhi, Jaipur and Lucknow markets.
A3.1.1.2.1 Channels of Distribution
Farmers: Farmers raise bananas in gardens or wet land as the supplementary or main crop. They bear the risk of production, as major crop risk components are water availability, cyclones, diseases and crop economics.
Marketing through Cooperative Societies: In Maharashtra, a large volume of bananas is traded through cooperative societies. The societies handle price negotia-tion with the commission agents in destination markets. This involves groups of farmers with negotiating power in produce sales, facilitated by the societies. They provide marketing linkages to their members. The societies charge a fee of 2%–3% to the farmers on the selling price of the produce. This is not common in Tamil Nadu and other states. However, farmers collude to negotiate price, especially if the harvesting and contiguous planting economics force a bind to exercise more nego-tiating power with the commission agents. Unfortunately, lack of financial strength and borrowing through informal network weaken the supply chain networks.
94 ◾ Agribusiness Supply Chain Management
Thus, cooperative societies facilitate aggregation of volume and negotiate with commission agents. Societies are voluntary group assuming power to ensure fair prices and avoid exploitation. Commission for administrative process is around 2%.
Marketing through Local Contractors: There are a number of contractors, rep-resenting commission agents, who work with the farmers both at the pre-harvest and at the post-harvest stages to procure the produce. When banana bunches are mature, local fruit merchants negotiate prices and give advance payments to the farmers. Typically, the produce is harvested at the farm and transported to the destinations by the contractors. This relieves the farmers of the burden of har-vesting, especially labour management; a process of agriculture is thus taken over by the intermediary. The contractors facilitate aggregation, transportation to the destination markets and payments to the farmers from the traders/commission agents. Intermediary costs would be around 2%–3% of the value of the crop to the farmers. However, the price realized would be lower, as the contractor adjusts for harvesting, handling, transportation and risk management during this process. Nevertheless, this constitutes the most commonly used method.
Commission agents/traders: They operate at major consumption and/or consoli-dation markets from where bananas move down the stream. They play a signifi-cant role and control trade. Financial strengths of agents and ability to organize transport and effectively handle local contractors are critical success factors. These intermediaries command around 5%–7% of the margin. If one imputes the hidden charges as in harvesting and transportation, they may make around 7%.
Direct marketing: A small percentage of large farmers with big landholdings directly deal with traders/commission agents from the wholesale markets, and send their produce to the destination markets after fixing up the rates and quantities. The cost of harvesting is borne by the farmer. The farmer facilitates aggregation and transportation. Most of the time, the prices would be fixed as the farm gate price, and the buyer keeps the margin and bears the transportation cost.
Wholesalers: They buy through commission agents in small towns and within limited geographical area for redistribution to local trade. Typically, they handle certain geographical areas and operate out of a market or common place where many such wholesalers operate. They may have a mark-up of 5%.
Retailers: They vary from vendors with carts to organized retail who sell pro-duce to final consumers. They assume the risks of physical damage and price dis-counts as the product ages. Though the post-harvest loss is estimated to be 10%, it is likely to be higher. Retailers work on a margin between 7% and 15%.
The supply chain mechanism for bananas in the region is depicted in Figure A3.2.The banana is an important agricultural produce of wet land and irrigated
regions, and an indispensable fruit for the common man in India, considering the value the fruit offers. Its availability and price would have a significant impact on markets, drawing huge attention from large sections of the society. The supply chain network needs to operate efficiently, and hence, the role of agents becomes critical.
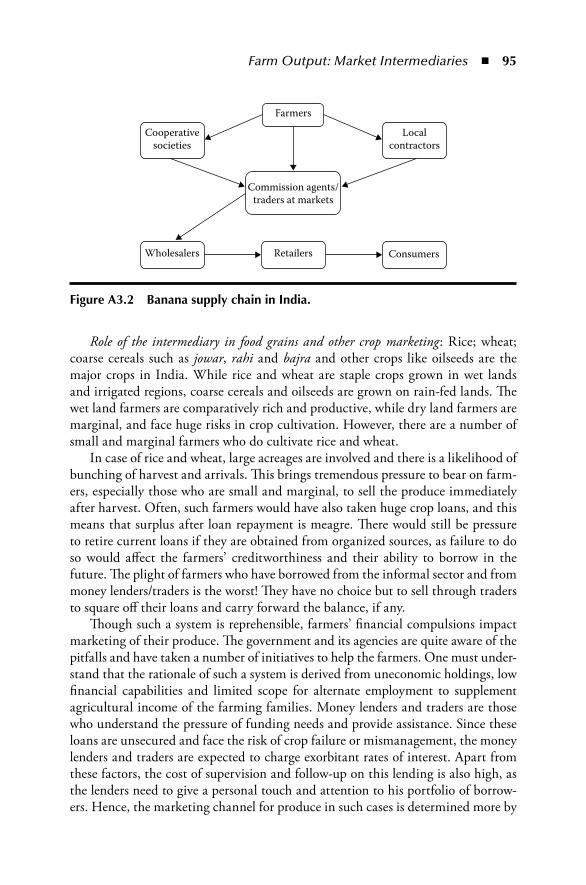
Farm Output: Market Intermediaries ◾ 95
Role of the intermediary in food grains and other crop marketing: Rice; wheat; coarse cereals such as jowar, rahi and bajra and other crops like oilseeds are the major crops in India. While rice and wheat are staple crops grown in wet lands and irrigated regions, coarse cereals and oilseeds are grown on rain-fed lands. The wet land farmers are comparatively rich and productive, while dry land farmers are marginal, and face huge risks in crop cultivation. However, there are a number of small and marginal farmers who do cultivate rice and wheat.
In case of rice and wheat, large acreages are involved and there is a likelihood of bunching of harvest and arrivals. This brings tremendous pressure to bear on farm-ers, especially those who are small and marginal, to sell the produce immediately after harvest. Often, such farmers would have also taken huge crop loans, and this means that surplus after loan repayment is meagre. There would still be pressure to retire current loans if they are obtained from organized sources, as failure to do so would affect the farmers’ creditworthiness and their ability to borrow in the future. The plight of farmers who have borrowed from the informal sector and from money lenders/traders is the worst! They have no choice but to sell through traders to square off their loans and carry forward the balance, if any.
Though such a system is reprehensible, farmers’ financial compulsions impact marketing of their produce. The government and its agencies are quite aware of the pitfalls and have taken a number of initiatives to help the farmers. One must under-stand that the rationale of such a system is derived from uneconomic holdings, low financial capabilities and limited scope for alternate employment to supplement agricultural income of the farming families. Money lenders and traders are those who understand the pressure of funding needs and provide assistance. Since these loans are unsecured and face the risk of crop failure or mismanagement, the money lenders and traders are expected to charge exorbitant rates of interest. Apart from these factors, the cost of supervision and follow-up on this lending is also high, as the lenders need to give a personal touch and attention to his portfolio of borrow-ers. Hence, the marketing channel for produce in such cases is determined more by
Farmers
Cooperativesocieties
Wholesalers Retailers Consumers
Commission agents/traders at markets
Localcontractors
Figure A3.2 Banana supply chain in india.
96 ◾ Agribusiness Supply Chain Management
crop financing than by the economics of the market system (other than funding). We conclude that the market intermediary for rice, paddy and other food grains exists because of the inadequacy of capital for a large number of small and marginal farmers, and because of the need to bunch harvest due to agricultural structural factors.
In the case of oilseeds, the intermediary exists because of his ability to support the farmer with finance and information and because he can do aggregation for market lots much more efficiently when compared to any efforts individual farmers may make. The difference between the growers of the two horticultural crops we discussed earlier, namely, pomegranate and banana, and growers of oilseeds is that the latter are economically much weaker, and thus, dependence on the intermedi-ary is far higher. Further, the crop volume considerations, and the compulsions to sell in regulated markets to get fair prices, necessitate reaching out to distant places with small quantities.
Thus, we conclude that in India, the intermediary exists for different crops because of socio-economic compulsions, and irrespective of the government’s efforts, the farming community is finding it difficult to rationalize their operations.
However, there are some positive signs in certain areas, where procurement by government agencies, cooperatives and private firms has helped to overcome the shortcomings of intermediation.
referencesAPEDA. APEDA Agri Exchange, 2012. http://agriexchange.apeda.gov.in/India%20Production/
India_Productions.aspx?hscode=08030000Basu, K. India’s food grains policy: An economic theory perspective. Economic & Political
Weekly, 46, 37–45. 2011.Government of India. Report of the working group on agricultural marketing infrastructure
and policy required for internal and external trade. Agricultural Division Planning Commission, 2007. http://planningcommission.nic.in/aboutus/committee/wrkgrp11/wg11_agrpm.pdf
Indo Asian News Service. We use Indian potatoes for our French fries: McDonald’s. Yahoo! News India, Dec. 5, 2012. http://in.news.yahoo.com/indian-potatoes-french-fries-mcdonalds-103629824--finance.html
Mustaffa, M.M. Vision 2030, National Research Centre for Banana, Tiruchirappalli, 2011. http://www.nrcb.res.in/document/Vision%202030.pdf
National Agricultural Co-operative Marketing Federation (NAFED). Website. 2012. http://www.nafed-india.com/
Patnaik, G. Status of agricultural marketing reforms. Workshop on Policy Options and Investment Priorities for Accelerating Agricultural Productivity and Development in India. IGIDR Proceedings PP-069-11b, Nov. 10–11, 2011. http://www.igidr.ac.in/newspdf/srijit/PP-069-11b.pdf
97
Chapter 4
processors
4.1 introductionAgro-processing is a significant activity in the agribusiness sector that contributes to value addition, product life management and the management of food avail-ability and prices in any country. India is no exception; rather, agro-processing is more critical in this country, as the large population depends upon the agricultural sector’s economic activities for employment, wages and consumption. Given the characteristics of agricultural produce, namely, perishability, seasonality and bulki-ness, value addition through processing is critical for the sector. Similarly, much of the produce is consumed after value addition through form change and place and/or time of production and consumption variations. It is the processing methods and facilitation that enable a producer to bring out utility produce for consumers in such a way they are able to realize the full value of the price paid. The difference between the producer’s cost and value additions through agents in the supply chain, including the channel operators, and the price paid by the consumers, makes up supply chain profits. In fact, consumer’s surplus must be considered as a part of supply chain profit that is realized by the consumer, wherever such consideration is relevant for decision making.
Obje CTIv eThis chapter helps to understand the challenges faced by processors in the agribusiness sector. Various problems in terms of both inputs and outputs, in organizing their production and reaching markets with their products are covered. The issues relevant for this actor in the supply chain are analysed with a few examples.
98 ◾ Agribusiness Supply Chain Management
In the post-independence era, the growth in agriculture produce was phenom-enal, as mentioned in the earlier chapters. This gave opportunities for many traders to consider processing, and entrepreneurs and firms realized the potential of pro-cessed agricultural produce among people. Population growth, urbanization and growth in income and wealth, as well as the support of the government through fiscal measures and direct intervention, paved the way for increase in demand for processed agricultural produce and more so from organized business.
4.2 primary processingThe primary processes of sorting, grading, value addition and storage play a sig-nificant role in agro-based products business. Businesses are impacted by supply chain issues like location of processing centres in terms of closeness to the farms, clustering of units, transportation of finished goods, inventory and storage (espe-cially with seasonality in demand and supply), level of foreign trade, length of the channel and finally regulatory aspects.
A number of agricultural commodities including cereals, pulses, grains, fruits and vegetables and products like poultry and marine go through sorting, grading and storage and then to market.
Many of these commodities and a few others fall under the categories for micro, cottage and small-scale industries sector. They are important parts of the agribusi-ness supply chain and value creation is achieved through activities around the sup-ply chain processes such as planning, sourcing, processing and distribution.
One such example is cashew processing and exports, which is described here to get an understanding of how it works.
India is the second largest producer of cashews after Vietnam. India produced 613,000 MT in the year 2009–2010, as shown in Table 4.1. The crop is grown mainly in the peninsular states of India, particularly along the coastal states like Kerala, Karnataka, Goa, Maharashtra, Tamil Nadu, Andhra Pradesh and Orissa.
India is also one of the largest processors of cashew. Table 4.2 gives details on the country’s cashew processing capacity as of 2005. It may be noted that India processed more cashew than it produced. Hence, trade in cashew was significant. We will first analyse cashew processing. The states like Kerala, Tamil Nadu and Karnataka handle large volumes of both indigenous and imported cashew. In this section, the processing of indigenous cashew is important. “There are two com-monly followed methods of cashew nut processing, viz., the roasting process and the steam cooking process. The processes are based on the variety of raw material, loca-tion, technological mechanization and availability of secured energy supply. In the cooking process, the vegetable oil that is extracted from the shells of the cashew seeds has a market in the paint and adhesive industries” (Mohod et al., 2010).
Since roasting demands manpower that is comparatively less skilled, many of the units in the industry in India follow the roasting process. “In the cashew nut
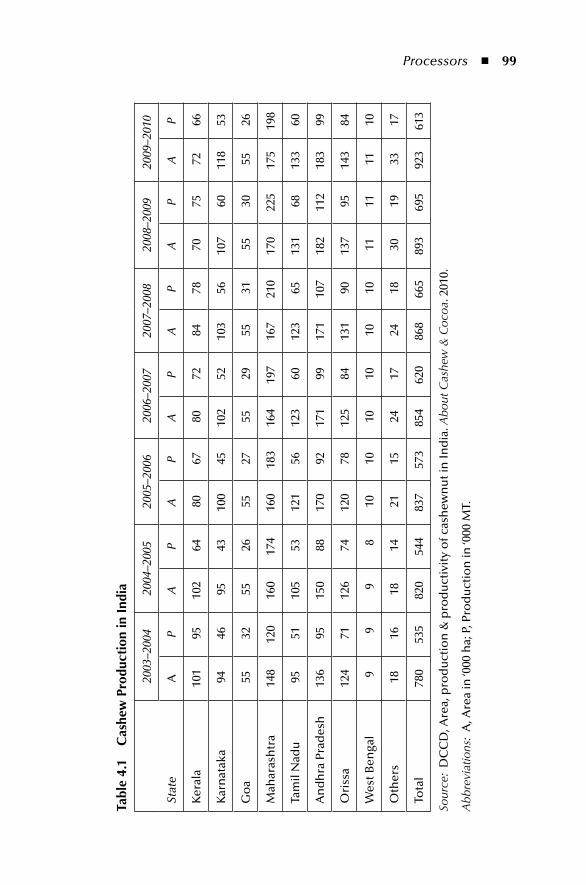
Processors ◾ 99
tabl
e 4.
1 C
ashe
w p
rodu
ctio
n in
ind
ia
Stat
e
2003
–200
420
04–2
005
2005
–200
620
06–2
007
2007
–200
820
08–2
009
2009
–201
0
AP
AP
AP
AP
AP
AP
AP
Ker
ala
101
9510
264
8067
8072
8478
7075
7266
Kar
nat
aka
9446
9543
100
4510
252
103
5610
760
118
53
Go
a55
3255
2655
2755
2955
3155
3055
26
Mah
aras
htr
a14
812
016
017
416
018
316
419
716
721
017
022
517
519
8
Tam
il N
adu
9551
105
5312
156
123
6012
365
131
6813
360
An
dh
ra P
rad
esh
136
9515
088
170
9217
199
171
107
182
112
183
99
Ori
ssa
124
7112
674
120
7812
584
131
9013
795
143
84
Wes
t Ben
gal
99
98
1010
1010
1010
1111
1110
Oth
ers
1816
1814
2115
2417
2418
3019
3317
Tota
l78
053
582
054
483
757
385
462
086
866
589
369
592
361
3
Sour
ce:
DC
CD
, Are
a, p
rod
uct
ion
& p
rod
uct
ivit
y o
f cas
hew
nu
t in
Ind
ia. A
bout
Cas
hew
& C
ocoa
. 201
0.
Abb
revi
atio
ns:
A, A
rea
in ‘0
00 h
a; P
, Pro
du
ctio
n in
‘000
MT.
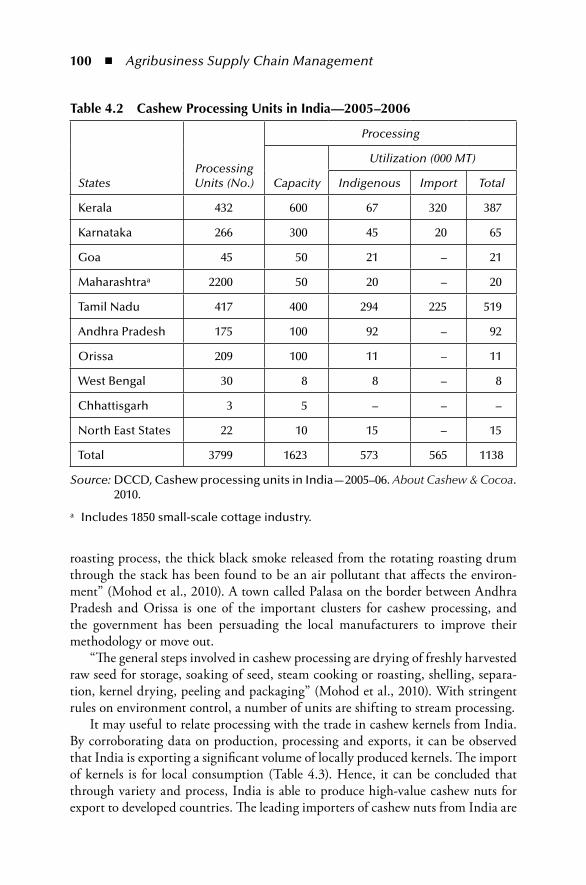
100 ◾ Agribusiness Supply Chain Management
roasting process, the thick black smoke released from the rotating roasting drum through the stack has been found to be an air pollutant that affects the environ-ment” (Mohod et al., 2010). A town called Palasa on the border between Andhra Pradesh and Orissa is one of the important clusters for cashew processing, and the government has been persuading the local manufacturers to improve their methodology or move out.
“The general steps involved in cashew processing are drying of freshly harvested raw seed for storage, soaking of seed, steam cooking or roasting, shelling, separa-tion, kernel drying, peeling and packaging” (Mohod et al., 2010). With stringent rules on environment control, a number of units are shifting to stream processing.
It may useful to relate processing with the trade in cashew kernels from India. By corroborating data on production, processing and exports, it can be observed that India is exporting a significant volume of locally produced kernels. The import of kernels is for local consumption (Table 4.3). Hence, it can be concluded that through variety and process, India is able to produce high-value cashew nuts for export to developed countries. The leading importers of cashew nuts from India are
table 4.2 Cashew processing units in india—2005–2006
StatesProcessing Units (No.)
Processing
Capacity
Utilization (000 MT)
Indigenous Import Total
Kerala 432 600 67 320 387
Karnataka 266 300 45 20 65
Goa 45 50 21 – 21
Maharashtraa 2200 50 20 – 20
Tamil Nadu 417 400 294 225 519
Andhra Pradesh 175 100 92 – 92
Orissa 209 100 11 – 11
West Bengal 30 8 8 – 8
Chhattisgarh 3 5 – – –
North East States 22 10 15 – 15
Total 3799 1623 573 565 1138
Source: DCCD, Cashew processing units in India—2005–06. About Cashew & Cocoa. 2010.
a Includes 1850 small-scale cottage industry.
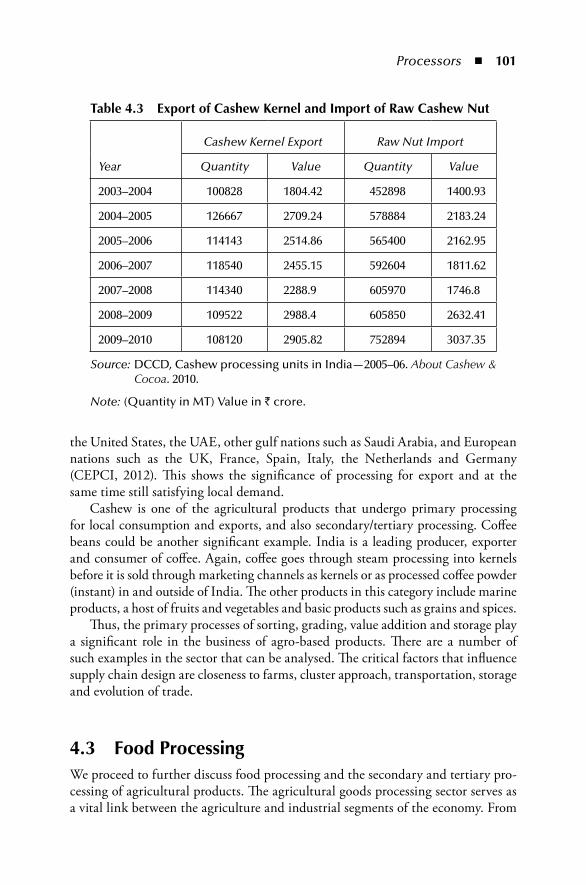
Processors ◾ 101
the United States, the UAE, other gulf nations such as Saudi Arabia, and European nations such as the UK, France, Spain, Italy, the Netherlands and Germany (CEPCI, 2012). This shows the significance of processing for export and at the same time still satisfying local demand.
Cashew is one of the agricultural products that undergo primary processing for local consumption and exports, and also secondary/tertiary processing. Coffee beans could be another significant example. India is a leading producer, exporter and consumer of coffee. Again, coffee goes through steam processing into kernels before it is sold through marketing channels as kernels or as processed coffee powder (instant) in and outside of India. The other products in this category include marine products, a host of fruits and vegetables and basic products such as grains and spices.
Thus, the primary processes of sorting, grading, value addition and storage play a significant role in the business of agro-based products. There are a number of such examples in the sector that can be analysed. The critical factors that influence supply chain design are closeness to farms, cluster approach, transportation, storage and evolution of trade.
4.3 Food processingWe proceed to further discuss food processing and the secondary and tertiary pro-cessing of agricultural products. The agricultural goods processing sector serves as a vital link between the agriculture and industrial segments of the economy. From
table 4.3 export of Cashew Kernel and import of raw Cashew nut
Year
Cashew Kernel Export Raw Nut Import
Quantity Value Quantity Value
2003–2004 100828 1804.42 452898 1400.93
2004–2005 126667 2709.24 578884 2183.24
2005–2006 114143 2514.86 565400 2162.95
2006–2007 118540 2455.15 592604 1811.62
2007–2008 114340 2288.9 605970 1746.8
2008–2009 109522 2988.4 605850 2632.41
2009–2010 108120 2905.82 752894 3037.35
Source: DCCD, Cashew processing units in India—2005–06. About Cashew & Cocoa. 2010.
Note: (Quantity in MT) Value in ` crore.
102 ◾ Agribusiness Supply Chain Management
the government perspective, focus is required for ensuring food security and for controlling inflation. Further, processing is important to reduce waste of agricul-tural raw materials, improve the value of agricultural produce by increasing shelf life and, at the same time, help fortify the nutritive capacity of the food products; processing also ensures remunerative prices to farmers as well as affordable prices to consumers. The effectiveness of these measures and the response of the agricultural and industrial sectors can be seen in export growth.
According to the Ministry of Food Processing Industry in India (2012), food processing industries would incorporate two processes:
1. “Manufacturing processes—if any raw product of agriculture, animal hus-bandry or fisheries is transformed through a process (involving employees, power, machines or money) in such a way that its original physical properties undergo a change and if the transformed product is edible and has commer-cial value, then it comes within the domain of food processing industries, and,
2. Other value-added processes—hence, if there is significant value addition (increased shelf life, shelled and ready for consumption, etc.) such produce also comes under food processing, even if it does not undergo manufacturing processes”.
Thus, food processing involves primary processing that converts raw agricultural produce, milk, meat and fish into commodities that are fit for human consumption. Steps such as cleaning, grading, sorting and packing are employed in processing. Secondary and tertiary processing industries usually deal with higher levels of processing, where new or modified food products are manufactured.
The Government of India has used the Annual Survey of Industries (ASI) and National Sample Survey Organization (NSSO) data to categorize National Informatics Centre (NIC) groups, based on the International Standard Industrial Classification for aggregation of national statistics. It has been assumed that the factories listed in the groups in Table 4.4 can be summed up to constitute food processing industries.
The following are the key highlights with respect to agricultural produce pro-cessing in India (Table 4.5):
1. GDP at 2004–2005 prices in India has gone up at a compound annual growth rate (CAGR) of 8.40% (mofpi.nic.in).
2. Manufacturing, which contributes about 16% of GDP, has grown at a CAGR of 9.35%, which is slightly higher than the GDP growth rate.
3. The food processing industries sector has grown from `44,355 crore in 2004–2005 to `66,078 crore in 2009–2010 at a CAGR of 8.49%.
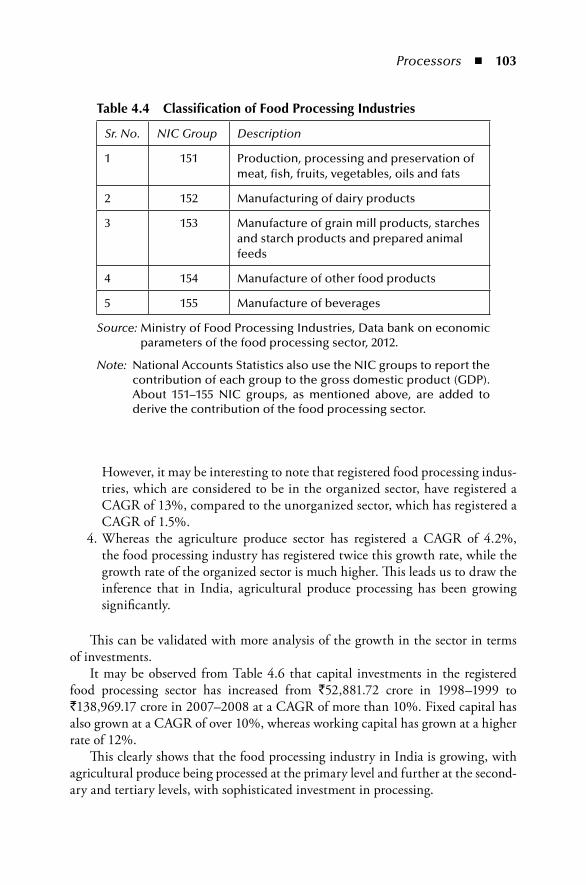
Processors ◾ 103
However, it may be interesting to note that registered food processing indus-tries, which are considered to be in the organized sector, have registered a CAGR of 13%, compared to the unorganized sector, which has registered a CAGR of 1.5%.
4. Whereas the agriculture produce sector has registered a CAGR of 4.2%, the food processing industry has registered twice this growth rate, while the growth rate of the organized sector is much higher. This leads us to draw the inference that in India, agricultural produce processing has been growing significantly.
This can be validated with more analysis of the growth in the sector in terms of investments.
It may be observed from Table 4.6 that capital investments in the registered food processing sector has increased from `52,881.72 crore in 1998–1999 to `138,969.17 crore in 2007–2008 at a CAGR of more than 10%. Fixed capital has also grown at a CAGR of over 10%, whereas working capital has grown at a higher rate of 12%.
This clearly shows that the food processing industry in India is growing, with agricultural produce being processed at the primary level and further at the second-ary and tertiary levels, with sophisticated investment in processing.
table 4.4 Classification of Food processing industries
Sr. No. NIC Group Description
1 151 Production, processing and preservation of meat, fish, fruits, vegetables, oils and fats
2 152 Manufacturing of dairy products
3 153 Manufacture of grain mill products, starches and starch products and prepared animal feeds
4 154 Manufacture of other food products
5 155 Manufacture of beverages
Source: Ministry of Food Processing Industries, Data bank on economic parameters of the food processing sector, 2012.
Note: National Accounts Statistics also use the NIC groups to report the contribution of each group to the gross domestic product (GDP). About 151–155 NIC groups, as mentioned above, are added to derive the contribution of the food processing sector.
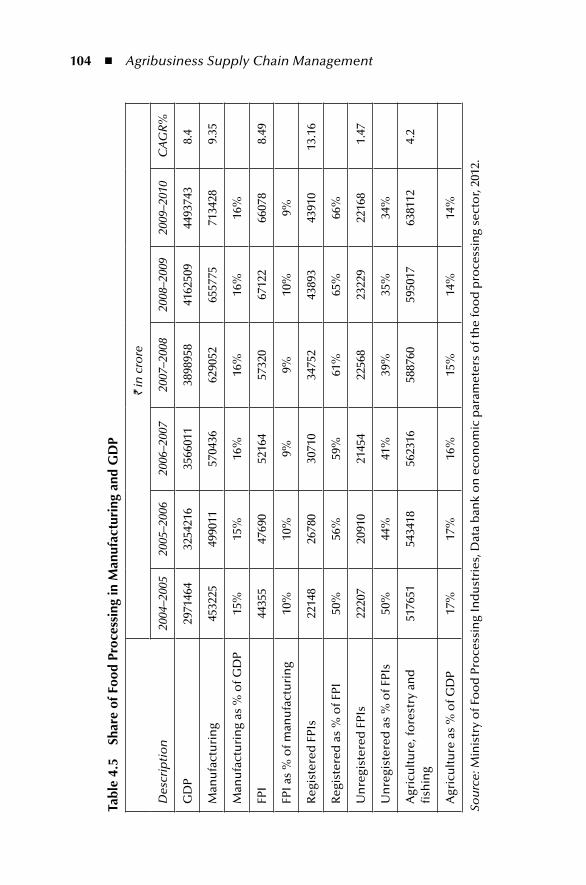
104 ◾ Agribusiness Supply Chain Management
tabl
e 4.
5 Sh
are
of F
ood
proc
essi
ng in
man
ufac
turi
ng a
nd G
Dp
Des
crip
tio
n
` in
cro
re
2004
–200
520
05–2
006
2006
–200
720
07–2
008
2008
–200
920
09–2
010
CA
GR
%
GD
P29
7146
432
5421
635
6601
138
9895
841
6250
944
9374
38.
4
Man
ufa
ctu
rin
g45
3225
4990
1157
0436
6290
5265
5775
7134
289.
35
Man
ufa
ctu
rin
g as
% o
f GD
P15
%15
%16
%16
%16
%16
%
FPI
4435
547
690
5216
457
320
6712
266
078
8.49
FPI a
s %
of m
anu
fact
uri
ng
10%
10%
9%9%
10%
9%
Reg
iste
red
FPI
s22
148
2678
030
710
3475
243
893
4391
013
.16
Reg
iste
red
as
% o
f FPI
50%
56%
59%
61%
65%
66%
Un
regi
ster
ed F
PIs
2220
720
910
2145
422
568
2322
922
168
1.47
Un
regi
ster
ed a
s %
of F
PIs
50%
44%
41%
39%
35%
34%
Agr
icu
ltu
re, f
ore
stry
an
d
fish
ing
5176
5154
3418
5623
1658
8760
5950
1763
8112
4.2
Agr
icu
ltu
re a
s %
of G
DP
17%
17%
16%
15%
14%
14%
Sou
rce:
Min
istr
y o
f Fo
od
Pro
cess
ing
Ind
ust
ries
, Dat
a b
ank
on
eco
no
mic
par
amet
ers
of t
he
foo
d p
roce
ssin
g se
cto
r, 20
12.
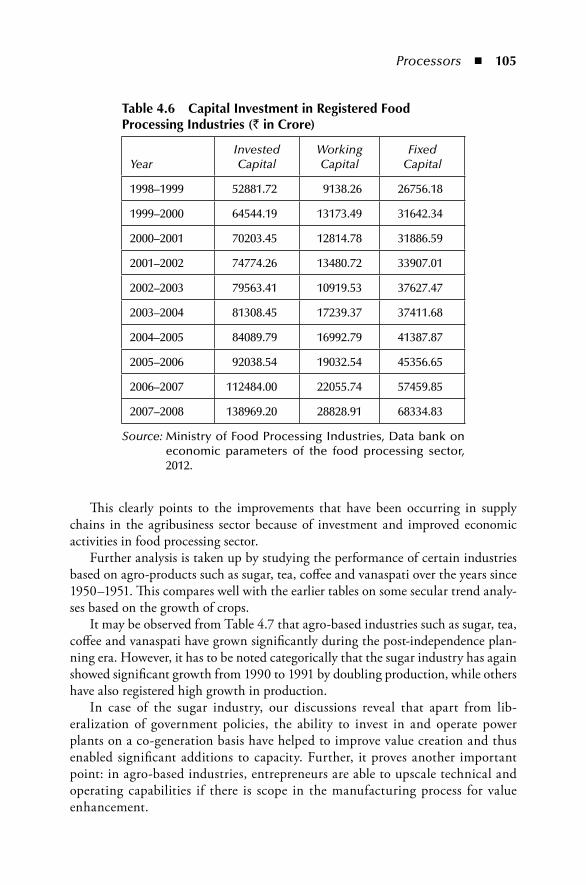
Processors ◾ 105
This clearly points to the improvements that have been occurring in supply chains in the agribusiness sector because of investment and improved economic activities in food processing sector.
Further analysis is taken up by studying the performance of certain industries based on agro-products such as sugar, tea, coffee and vanaspati over the years since 1950–1951. This compares well with the earlier tables on some secular trend analy-ses based on the growth of crops.
It may be observed from Table 4.7 that agro-based industries such as sugar, tea, coffee and vanaspati have grown significantly during the post-independence plan-ning era. However, it has to be noted categorically that the sugar industry has again showed significant growth from 1990 to 1991 by doubling production, while others have also registered high growth in production.
In case of the sugar industry, our discussions reveal that apart from lib-eralization of government policies, the ability to invest in and operate power plants on a co-generation basis have helped to improve value creation and thus enabled significant additions to capacity. Further, it proves another important point: in agro-based industries, entrepreneurs are able to upscale technical and operating capabilities if there is scope in the manufacturing process for value enhancement.
table 4.6 Capital investment in registered Food processing industries (` in Crore)
YearInvested Capital
Working Capital
Fixed Capital
1998–1999 52881.72 9138.26 26756.18
1999–2000 64544.19 13173.49 31642.34
2000–2001 70203.45 12814.78 31886.59
2001–2002 74774.26 13480.72 33907.01
2002–2003 79563.41 10919.53 37627.47
2003–2004 81308.45 17239.37 37411.68
2004–2005 84089.79 16992.79 41387.87
2005–2006 92038.54 19032.54 45356.65
2006–2007 112484.00 22055.74 57459.85
2007–2008 138969.20 28828.91 68334.83
Source: Ministry of Food Processing Industries, Data bank on economic parameters of the food processing sector, 2012.
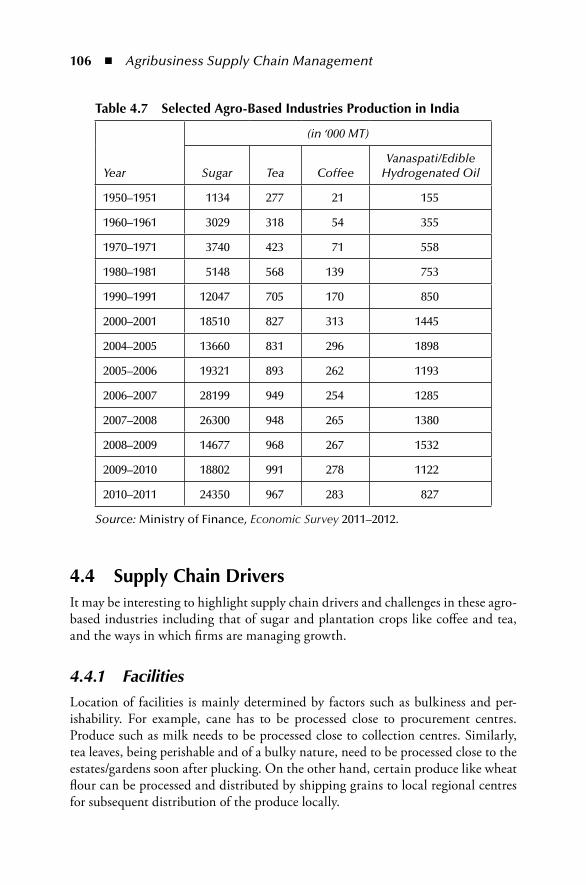
106 ◾ Agribusiness Supply Chain Management
4.4 Supply Chain DriversIt may be interesting to highlight supply chain drivers and challenges in these agro-based industries including that of sugar and plantation crops like coffee and tea, and the ways in which firms are managing growth.
4.4.1 FacilitiesLocation of facilities is mainly determined by factors such as bulkiness and per-ishability. For example, cane has to be processed close to procurement centres. Produce such as milk needs to be processed close to collection centres. Similarly, tea leaves, being perishable and of a bulky nature, need to be processed close to the estates/gardens soon after plucking. On the other hand, certain produce like wheat flour can be processed and distributed by shipping grains to local regional centres for subsequent distribution of the produce locally.
table 4.7 Selected Agro-Based industries production in india
Year
(in ‘000 MT)
Sugar Tea CoffeeVanaspati/Edible
Hydrogenated Oil
1950–1951 1134 277 21 155
1960–1961 3029 318 54 355
1970–1971 3740 423 71 558
1980–1981 5148 568 139 753
1990–1991 12047 705 170 850
2000–2001 18510 827 313 1445
2004–2005 13660 831 296 1898
2005–2006 19321 893 262 1193
2006–2007 28199 949 254 1285
2007–2008 26300 948 265 1380
2008–2009 14677 968 267 1532
2009–2010 18802 991 278 1122
2010–2011 24350 967 283 827
Source: Ministry of Finance, Economic Survey 2011–2012.
Processors ◾ 107
Another key aspect of facilities is the location of warehouses and distribution centres that processors manage through their network.
4.4.2 InventoryInventory management is another important perspective of supply chains that agro-based processing companies would have to handle efficiently for achieving growth and success. As mentioned earlier, much of agricultural produce is sea-sonal. From the facilities viewpoint, this requires the setting up of capacity for handling peak inflow. But the challenge from the inventory perspective is: how can the plant be run for a maximum time period in a year, so that idle capacity cost is minimized? A second challenge is the management of the raw material inventory, which has an uneven flow, as well as of the finished goods inventory, which would be more tapered and close to even demand? Over and above the seasonal charac-teristics, inventory management is complicated by regulatory measures on many of these products, as they come under the essential commodities category. The challenge for a supply chain manager is to manage this aspect, instead of leaving it to functional managers to handle. Normally, in many agro-based industries the functional managers, such as the procurement manager, the production manager and the finance manager, who directly report to the chief operations officer, drive business. This leads to the grave mistake of lack of supply chains and partnering approaches in decision making, which results in the cobweb theory taking over. Successful companies manage inventory through a partnering approach across the network.
4.4.3 TransportationThe transportation perspective of supply chains is another important aspect of the agro-based output sector. One may need specialized vehicles such as bulk container movement trucks. Often, less specialized trucks are operated in India because of poor economic sense, pointing to the ignorance of the cost of operation vis-à-vis the value. Further, other options like rail transport and air transport are not available widely in India because of route optimization issues, wagon/rake availability and multiple handling. In the case of some sectors like sugar manufacture, inbound issues are challenging aspects of supply chains. Cane is procured by factories from villages that are radially connected. A factory in its yard cannot plan for more than four hours of crushing. Assuming if a plant crushes 5000 tonnes of cane in a day, it has to crush approximately 220 tonnes in an hour. The minimal inflow of raw material must be maintained at that level. This means a minimum of 25 trucks an hour bringing in raw material. A factory needs to ensure that it runs 24 hours, as the processing is a continuous process, and therefore, 600 trucks per day are to be managed. If the turnaround time is two to three days for a truck from loading to unloading and returning for the next trip, then the transport manager has to manage 1500 trucks
108 ◾ Agribusiness Supply Chain Management
or more till the crushing season is over. On the other hand, the outbound aspects for sugar are fairly well managed, as the sales contracts are ex-factory, and buyers organize the trucks for transportation.
There are certain agro-based sectors like tea where the challenge is different. Geographically speaking, tea is procured for processing from a close radius. However, tea gardens are usually situated in mountain terrain, and tea is plucked manually (mostly by women). Since it has to be processed quickly, vehicles move quickly from aggregated load points to grading and processing centres. The chal-lenge is tougher while moving to demand centres. Many small processors move to auction centres at a nearby location. The tea auction centres in India are located in Kolkata, Siliguri, Guwahati, Cochin, Coimbatore and Coonoor. Public tea auc-tions have played a key role in the primary marketing of tea in India for over a cen-tury, ever since the first tea auction centre was set up in Calcutta in 1861. However, movements from the centres to demand points are interesting, especially in the case of bulk cargoes. In India, demand centres are in the west, the north, the east and the south in the same order. The majority of tea production activities take place in the north-east. Southern states like Tamil Nadu and Kerala also contribute to production. Often, tea from the north-eastern and eastern states is moved in trucks and by rail to the western and northern parts of the country, which is a quite challenge.
Thus, agro-processing units work seamlessly with buyers and their agents in the supply chain to enable efficient movement of goods.
4.4.4 SourcingSourcing issues have been discussed earlier as well. Agro-based industries have to necessarily map their procurement plans and ensure all operations are synchro-nized. More importantly, since agro-based industries depend upon resource endow-ments and their users for economic activities such as production and exchange, they have to necessarily establish partnering relationships with a strategic orien-tation with others in their supply chains. In the literature on supply chains, one normally comes across such recommendations for autos and auto components, high- technology industries, heavy engineering, consumer products (durable and entertainment goods), and so on. It is imperative for a large supplier-based (mostly fragmented) agro industry to have a highly supply chain-focused procurement management system.
Procurement activities for the agribusiness input sector can be seen at the farm gates as well as in process industries.
In the case of farm gate direct procurement, where relationships matter most, prices are set more on bargaining power and the value being brought in. When a process plant procures material, the price is based on market prices minus interme-diation costs, including those of logistics, like moving farm produce to the market. In the current market environment, farmers’ understanding of price factors is
Processors ◾ 109
realistic, and the focal firm behind the procurement also ensures enough trans-parency in the system to procure adequate volumes. In the case of regulated price regimes, the government fixes a certain procurement price as the minimum sup-port price, or the floor price. The focal firm will have to pay the minimum recom-mended price, and many times, farmers expect that price to be improved upon. There are cases where the central government fixes the statutory minimum price (SMP) and the state government comes up with a state advised price (SAP), which is higher than the SMP. The focal firm ends up paying SAP, as in the case of sugar-cane. Group negotiating power, especially within the political system, drives pric-ing, rather than supply chain dynamics.
In the case of the regulated markets, prices are determined by forces of demand and supply. This would apply more to agricultural produce arrivals at the regulated markets and is linked to demand conditions during the time window of demand. With the ongoing explosion of technology and maturity of systems, market infor-mation is widely available. Farmer groups are able to effectively use mobile phones and other media to decide on arrivals, and the same situation prevails with proces-sors as well. Price discovery and transactions are more structured. This phenom-enon has brought about a considerable evolution in pricing mechanisms, leading to supply chain efficiency. One major issue here is the role of intermediaries, who could take positions and play around with stock and price. However, the evolution of the commodities market and futures trading in some selected commodities has brought further efficiency to the supply chain.
It may be interesting to look at the procurement decisions and challenges in the agribusiness input segment of process industries. Many items of farm produce are procured from the following networks:
1. Directly from the farm gate 2. From the regulated markets 3. Delivery at the units.
Figure 4.1 on procurement challenges for processing units in agribusiness high-lights some of the key challenges for each of the nodes/options in the network. A firm may follow each of the options while relying predominantly on its chosen ones.
ITC’s e-choupal, PepsiCo India’s initiative for procuring potatoes and dairy processing firms like Amul have achieved huge success in directly procuring from the farm gate. The key elements of success in direct procurement lie in a company’s initiative in achieving unique partnerships with local agencies, ensuring transfer of technology through well-trained employees and supply of relevant agricultural implements. At times, suppliers may have to provide farm inputs on credit, and ensure it is done in a timely fashion, with the right quality. Optimum operations call for prompt procurement and timely payments, with effective use of modern communication technology and maintenance of perfect logistics and marketing practices.
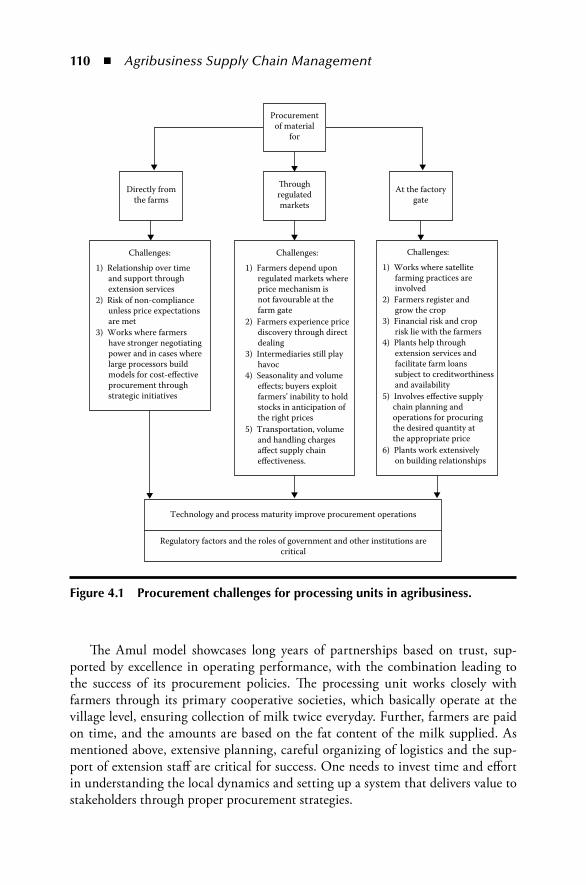
110 ◾ Agribusiness Supply Chain Management
The Amul model showcases long years of partnerships based on trust, sup-ported by excellence in operating performance, with the combination leading to the success of its procurement policies. The processing unit works closely with farmers through its primary cooperative societies, which basically operate at the village level, ensuring collection of milk twice everyday. Further, farmers are paid on time, and the amounts are based on the fat content of the milk supplied. As mentioned above, extensive planning, careful organizing of logistics and the sup-port of extension staff are critical for success. One needs to invest time and effort in understanding the local dynamics and setting up a system that delivers value to stakeholders through proper procurement strategies.
Directly fromthe farms
�roughregulatedmarkets
At the factorygate
Challenges:
1) Relationship over time and support through extension services2) Risk of non-compliance unless price expectations are met3) Works where farmers have stronger negotiating power and in cases where large processors build models for cost-e�ective procurement through strategic initiatives
Regulatory factors and the roles of government and other institutions arecritical
Challenges:
1) Farmers depend upon regulated markets where price mechanism is not favourable at the farm gate2) Farmers experience price discovery through direct dealing3) Intermediaries still play havoc4) Seasonality and volume e�ects; buyers exploit farmers’ inability to hold stocks in anticipation of the right prices5) Transportation, volume and handling charges a�ect supply chain e�ectiveness.
Challenges:
1) Works where satellite farming practices are involved2) Farmers register and grow the crop3) Financial risk and crop risk lie with the farmers4) Plants help through extension services and facilitate farm loans subject to creditworthiness and availability5) Involves e�ective supply chain planning and operations for procuring the desired quantity at the appropriate price6) Plants work extensively on building relationships
Technology and process maturity improve procurement operations
Procurementof material
for
Figure 4.1 procurement challenges for processing units in agribusiness.
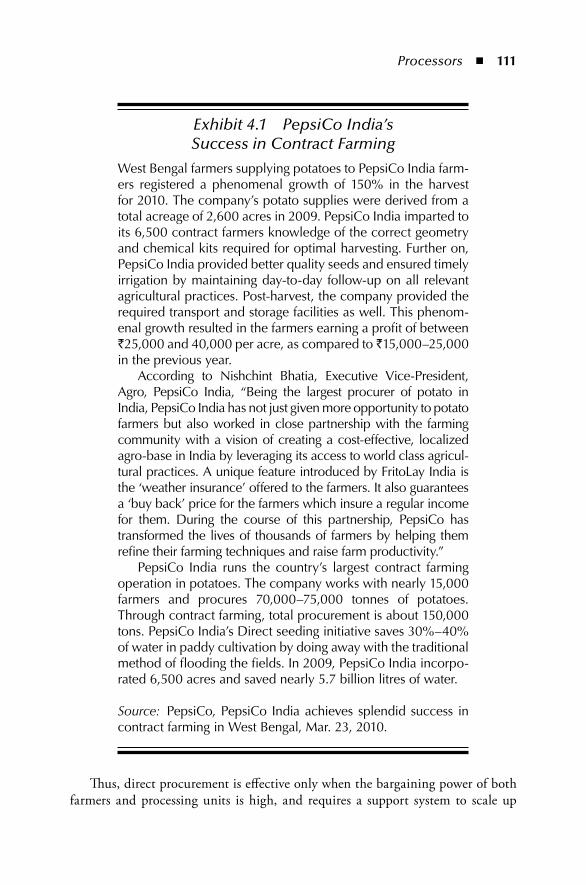
Processors ◾ 111
Exhibit 4.1 PepsiCo India’s Success in Contract Farming
West Bengal farmers supplying potatoes to PepsiCo India farm-ers registered a phenomenal growth of 150% in the harvest for 2010. The company’s potato supplies were derived from a total acreage of 2,600 acres in 2009. PepsiCo India imparted to its 6,500 contract farmers knowledge of the correct geometry and chemical kits required for optimal harvesting. Further on, PepsiCo India provided better quality seeds and ensured timely irrigation by maintaining day-to-day follow-up on all relevant agricultural practices. Post-harvest, the company provided the required transport and storage facilities as well. This phenom-enal growth resulted in the farmers earning a profit of between `25,000 and 40,000 per acre, as compared to ̀ 15,000–25,000 in the previous year.
According to Nishchint Bhatia, Executive Vice-President, Agro, PepsiCo India, “Being the largest procurer of potato in India, PepsiCo India has not just given more opportunity to potato farmers but also worked in close partnership with the farming community with a vision of creating a cost-effective, localized agro-base in India by leveraging its access to world class agricul-tural practices. A unique feature introduced by FritoLay India is the ‘weather insurance’ offered to the farmers. It also guarantees a ‘buy back’ price for the farmers which insure a regular income for them. During the course of this partnership, PepsiCo has transformed the lives of thousands of farmers by helping them refine their farming techniques and raise farm productivity.”
PepsiCo India runs the country’s largest contract farming operation in potatoes. The company works with nearly 15,000 farmers and procures 70,000–75,000 tonnes of potatoes. Through contract farming, total procurement is about 150,000 tons. PepsiCo India’s Direct seeding initiative saves 30%–40% of water in paddy cultivation by doing away with the traditional method of flooding the fields. In 2009, PepsiCo India incorpo-rated 6,500 acres and saved nearly 5.7 billion litres of water.
Source: PepsiCo, PepsiCo India achieves splendid success in contract farming in West Bengal, Mar. 23, 2010.
Thus, direct procurement is effective only when the bargaining power of both farmers and processing units is high, and requires a support system to scale up
112 ◾ Agribusiness Supply Chain Management
value in the supply chain network by the elimination of intermediaries. There may be cases where a firm makes efforts for procurement, but a farmer resorts to non-compliance for short-term gain. These instances are more aberrations than a regular practice.
One may also look at some retailing companies such as Reliance, Spencer’s, and Food Bazaar, which procure produce directly from farm gates. Direct procure-ment from farmers can be done only in states that have amended their Agricultural Produce Marketing Committee (APMC) Act to permit buyers to purchase directly from producers and farmers, in line with the Model Act 2003 proposed by the central government. Reliance had to face a lot of negative publicity. Small traders organized agitations against the practice of direct procurement from farmers.
Agribusiness processing units alternatively procure from regulated markets as well. Often, they use a combination of direct procurement and procurement from regulated markets. For example, the oilseeds processing plant of the Karnataka Co-operative Oilseeds Growers Federation Limited (KOF) has a processing plant at Hospet in Bellary district, with a crushing capacity of 250 tonnes per day (TPD) for groundnuts and 50 TPD for sunflower seeds, as well as a 100 TDP solvent extraction plant and a 50 TDP continuous refinery. The plant usually tries to pro-cure oilseeds for processing directly from growers/cooperative societies. But due to the dynamics of price and production, farmers may choose to sell their produce in regulated markets. Further, there could be scope for extending the operational period if a plant can supplement its procurement levels with purchases from market operations. More importantly, refinery operations would require their own feed-stock from expellers and also from the markets to utilize maximum capacity for longer periods of operations.
The plant operations manager may have to work on an effective production plan incorporating optimum use of plant capacity with a mix of direct procurements and material from market operations. Since market operations are based on market prices, which could be volatile, the ability to understand parity in price with input–output yield parameters and margin on operations is mandatory. Further, market operations require the ability to stock or hold goods by buying produce cheap and processing it while capacity is available and prices are conducive for output. This makes it necessary to balance inventory policy and procurement policy; further, synchronization should also be achieved with respect to transportation costs. Thus, market operations challenge the supply chain functions of procurement, price management, inventory, facility management and transportation.
It may be noted that the network structure for the factory gate procurement option requires a certain ecosystem to work with. This approach works in the case of satellite farming, as demonstrated by sugarcane factories. The plant is a com-mand area allocated by the state government to develop and nurture cane farming. The sugar factory is run by procuring cane from the command area. The firm that has been granted the license promotes registration of the land, wherein the farmer contracts to produce cane and offers it for procurement by the factory. The plant
Processors ◾ 113
will support the farmer with extension services during the growth phases, and will monitor crop growth.
Though it looks rather simple, it is quite a complex operation, with detailed procurement planning, policy and process set in place. For a 5,000-tonne per day cane crushing (TCD) capacity plant to be operational for 210 days in a year, around 10.50 lakh tonnes of cane are required. With an average yield of 35 tonnes per acre, the plant should have a minimum of 30,000 acres under sugarcane cultivation. In reality, it must provide for a 20% variation and, therefore, should target 36,000 acres. With average holding in certain parts of the country as low as one acre, a plant of this size may have to manage up to 36,000 farmer units. Further, there must be sequencing of plots in such a way that the procurement feeds plant operations for a period of eight months. One may note that the process in a sugar plant of this size has an ability to handle varying feeds of 3,750–6,750 TCD depending upon climatic conditions and the imbibition levels that can be handled while milling cane.
It is just not operations that challenge procurement but organizing harvest labourers for cutting cane from the field and loading is another challenge. Cane harvesting and loading cannot be easily done by regular agricultural labourers, as it is laborious and difficult. There are specialized labour groups that do this, and they are in high demand. The plant has the responsibility of organizing labour on behalf of farmers, as individual farmers do not have the wherewithal for the same. Hence, there must be a team that coordinates production planning, procurement and operations at the field. The other challenge in field operations is that of organiz-ing transportation of cane from the fields to the factory. Some of the rich farmers have their own means of transportation. Typically, cane is shipped to the factory from the fields in carts, trailers and trucks. Trucks are the most popular mode of transportation, but a 5000 TCD plant needs to organize approximately 500 trucks a day, which is a daunting task. Generally, the factory enters into agreements with local truck associations to ensure smooth operations. Transportation costs are paid in terms of tonnes carried.
Thus, at the factory gate, procurement for operations is a planned and well-structured activity involving relationships with many supply chain stakeholders. With this, one can see that the complexities of procurement operations in the agribusiness sector are wide ranging, and require meticulous planning and strong operational capabilities.
4.4.5 PricingPricing is another important perspective which supply chain managers need to focus on in agro-based industries. Input prices are sensitive to crop output and seasonal characteristics. Many times, the government regulates the input price through a minimum floor price stipulation (support price schemes). In the case of agro-based industries, output prices were highly regulated till the 1990s. Since then, there have been a number of liberalization policies like decontrolling of sugar, dairy processing
114 ◾ Agribusiness Supply Chain Management
and edible oils. However, one still needs to understand that output prices in India are not fully under market conditions, as the prices of sugar, edible oil and other outputs are very sensitive. In adverse situations, the government quickly imports these commodities or comes in with direct intervention. Another important aspect in the supply chain networks of agro-based industries that affects prices is the pres-ence of a number of intermediaries in the system, and even more, their inability to relate reward to responsibility, which affects pricing and profits. Agro-based industries improve distribution management and trying to reduce intermediation. However, fragmented markets and the vast reach required make this a challenging task. The progress of organized retail in India and customer demand for quality would help to improve price realization. Customer preferences for recent products, irrespective of long shelf life, also deter pricing. Firms are compelled to use dis-counting and markdown pricing to ensure freshness of stocks. Thus, pricing plays a significant role in agro-based produce processors.
4.4.6 InformationFinally, information, which is now considered as one of the key inputs to sup-ply chain decisions, enables efficiency in those decisions. Agro-based processors are today heavily deploying information systems and also looking for avenues for benefiting by aligning systems and processes around breakthrough technological developments that have surfaced in the market.
As may be seen in the tea industry, the newly designed e-auction system is being used by all the six auction centres. The e-auction system integrates the process, start-ing from the creation of invoices till the delivery of tea from the warehouses, enabling better control and avoiding duplication of work, thus reducing the time taken. The benefits of e-auctions are aplenty for all supply chain network operators, as summa-rized in Table 4.8. However, processors also have immensely benefitted in the form of streamlining of information, financial and physical flows in the system, enabled by technology upgrades. Though it is believed that there was an initial reluctance to move to e-auction, the success of it is now reflected in the increased patronage.
This is not only true of tea auctions in India, but also in many other trades where technology can be integrated. We would be discussing this in the chapter on IT for agribusiness efficiency, wherein a few case studies would be discussed. ITC, as mentioned in one of the earlier chapters 1 & 2, is a classic case. We believe that companies like Amul have adopted state-of-the-art technology applications for deriving supply chain efficiencies.
Thus, we observe the growth of the agricultural produce sector and processing industries in India impacting supply chain efficiencies. There is another which is gaining greater attention in contemporary agro-based business is of wastages and linkage to supply chain management.
While processing agricultural products, wastes are generated because of the fibre content after extraction or by process additions such as water and chemicals.
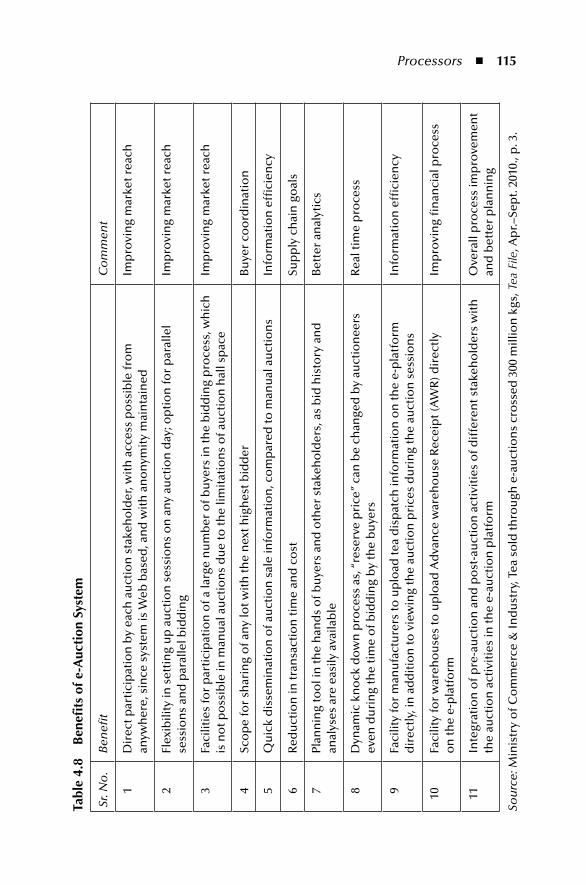
Processors ◾ 115
tabl
e 4.
8 B
enefi
ts o
f e-A
ucti
on S
yste
m
Sr. N
o.
Ben
efit
Co
mm
ent
1D
irec
t par
tici
pat
ion
by
each
au
ctio
n s
take
ho
lder
, wit
h a
cces
s p
oss
ible
fro
m
anyw
her
e, s
ince
sys
tem
is W
eb b
ased
, an
d w
ith
an
on
ymit
y m
ain
tain
edIm
pro
vin
g m
arke
t rea
ch
2Fl
exib
ility
in s
etti
ng
up
au
ctio
n s
essi
on
s o
n a
ny
auct
ion
day
; op
tio
n fo
r p
aral
lel
sess
ion
s an
d p
aral
lel b
idd
ing
Imp
rovi
ng
mar
ket r
each
3Fa
cilit
ies
for
par
tici
pat
ion
of a
larg
e n
um
ber
of b
uye
rs in
the
bid
din
g p
roce
ss, w
hic
h
is n
ot p
oss
ible
in m
anu
al a
uct
ion
s d
ue
to th
e lim
itat
ion
s o
f au
ctio
n h
all s
pac
eIm
pro
vin
g m
arke
t rea
ch
4Sc
op
e fo
r sh
arin
g o
f an
y lo
t wit
h th
e n
ext h
igh
est b
idd
erB
uye
r co
ord
inat
ion
5Q
uic
k d
isse
min
atio
n o
f au
ctio
n s
ale
info
rmat
ion
, co
mp
ared
to m
anu
al a
uct
ion
sIn
form
atio
n e
ffici
ency
6R
edu
ctio
n in
tran
sact
ion
tim
e an
d c
ost
Sup
ply
ch
ain
go
als
7Pl
ann
ing
too
l in
the
han
ds
of b
uye
rs a
nd
oth
er s
take
ho
lder
s, a
s b
id h
isto
ry a
nd
an
alys
es a
re e
asily
ava
ilab
leB
ette
r an
alyt
ics
8D
ynam
ic k
no
ck d
ow
n p
roce
ss a
s, “
rese
rve
pri
ce”
can
be
chan
ged
by
auct
ion
eers
ev
en d
uri
ng
the
tim
e o
f bid
din
g b
y th
e b
uye
rsR
eal t
ime
pro
cess
9Fa
cilit
y fo
r m
anu
fact
ure
rs to
up
load
tea
dis
pat
ch in
form
atio
n o
n th
e e-
pla
tfo
rm
dir
ectl
y, in
ad
dit
ion
to v
iew
ing
the
auct
ion
pri
ces
du
rin
g th
e au
ctio
n s
essi
on
sIn
form
atio
n e
ffici
ency
10Fa
cilit
y fo
r w
areh
ou
ses
to u
plo
ad A
dva
nce
war
eho
use
Rec
eip
t (A
WR
) dir
ectl
y o
n th
e e-
pla
tfo
rmIm
pro
vin
g fi
nan
cial
pro
cess
11In
tegr
atio
n o
f pre
-au
ctio
n a
nd
po
st-a
uct
ion
act
ivit
ies
of d
iffe
ren
t sta
keh
old
ers
wit
h
the
auct
ion
act
ivit
ies
in th
e e-
auct
ion
pla
tfo
rmO
vera
ll p
roce
ss im
pro
vem
ent
and
bet
ter
pla
nn
ing
Sou
rce:
Min
istr
y o
f Co
mm
erce
& In
du
stry
, Tea
so
ld th
rou
gh e
-au
ctio
ns
cro
ssed
300
mill
ion
kgs
, Tea
File
, Ap
r.–Se
pt.
2010
., p
. 3.
116 ◾ Agribusiness Supply Chain Management
We also observe that the sector faces a number of challenges, and has still been able to take advantage of attractive growth opportunities successfully. It also shows the unleashing of the large potential for processing goods, as the market widens with changing customers’ preferences and urbanization.
This can be better explained with an industry situation. In the case of sugar, cane is crushed using a lot of water in the crushers. The imbibition level is one such measure of performance. The more water is used, the better is the extrac-tion of the juice from the cane. However, this necessitates the demand for more steam to process the juice. At this stage, bagasse is the residual from the milling section. The sugar mills use this bagasse for combustion in the boilers, which pro-duce steam for processing, while electricity is also generated for use in the factory. Traditionally, earlier low-pressure boilers and turbines were reduced, which meant low efficiency, with the electricity produced just adequate for the factory. Over the last two decades, sugar plants have installed high-pressure boilers and matching turbines to generate electricity. With the same quantity of bagasse, now they are able to export substantial amounts of electricity to the grids. The increased recovery through this system has changed the fortunes of sugar manufacturers.
Moving further in the sugar manufacturing process, pressed mud is generated during the purification of juice process, and is sold as organic manure to farm-ers. Farmers pay for it and clear the load from the sugar factory; thus, sales are ex- factory, and transportation is through the farmers’ vehicles. After this, the crys-tallization process takes place through vacuum pans. The process generates molas-ses at this stage. Storage of molasses is a tough process, especially during the peak season, and can impact the environment, as the processes are rigid. Molasses stocks are sold, and in cases where there is manufacture of industrial alcohol attached to sugar plants, the process generates spent wash and solids. Disposing of spent wash as per the demands of environmental regulation is another major challenge.
Thus, as one may note, different types of materials are generated during pro-cesses, raising opportunities to create by-products, and residue management becomes important. A similar kind of waste management is necessary in every other agriculture process business. Often, the generated materials are used for pre-paring organic manure or by-products like bricks and land fillers. Of course, there are industries like those that process raw leather from animal skins, which are fac-ing challenges because of their inability to handle effluents, and thus, are being asked to close. At times, this forces India to import processed raw skins for further value addition and re-export to developed nations.
4.5 industrial productionWe move further to discuss on the use of agro-based products as input in the process-ing and manufacture of goods classified under Standard Industrial Classification (SIC) codes.
Processors ◾ 117
It may be interesting to look at the performance of a few more industries that would have been placed in various SIC categories, but use agricultural produce for secondary and tertiary processing. This may include industries for producing cot-ton, paper and capital goods like textile machinery.
The following are certain observations based on Table 4.9 on the performance of industries for cotton textile and paper-related products in India. The perfor-mance and inferences on supply chain issues are drawn here more as illustrative of the issues faced by this sector.
1. The corrugated and other similar paper industry has demonstrated a fluctuat-ing trend in production for the period 2004–2005 to 2010–2011. The indus-try has been plagued with problems of over-capacity, manual operations and low productivity. Further, transport constraints and high freight costs lead to setting up of small- and medium-sized plant near consumption points.
2. The craft paper and writing and printing paper industries have registered CAGRs of 7% and 6%, respectively, for the period 2004–2005 to 2010–2011.
3. Though the paper industry has grown at an average growth rate comparable with the manufacturing sector, the industry has specific challenges, espe-cially in terms of the availability of forestry resources and sustainability. One of the chief concerns of the supply chain managers in these industries is to ensure raw material availability and replantation of trees for sustainability of resources. Action must be undertaken in accordance with a well-designed plan to ensure resource availability. On the downstream of the supply chain network, managers have to handle distribution management, as large paper plants could be located close to raw material sources (paper raw material is weight losing in character), and the end products need to be moved across the network.
4. Cotton cloth and mixed/blended cloth manufacturing units use an agricul-tural produce, namely cotton, which is ginned. In fact, ginning is a large industrial activity which is mainly confined to tiny (cottage) and small- and medium-sized industries in India. The ginned cotton is then moved for mak-ing yarn and then cloth.
5. It can be observed from Table 4.9 that cotton cloth registered a CAGR of 7.5% from 2004–2005 to 2010–2011. The industry has grown phenomenally from 1950 to 1951 onwards. It may be noted that the cotton cloth industry has two components, namely, the mill sector and the decentralized sector. From 1990 to 1991 onwards, the decentralized sector has grown significantly compared to the mill sector mainly because of the labour problems and cost factors in the mill sector. The decentralized sector units are able to handle growth, as they are small in size and a lot of fiscal concessions are available. There are a number of factors which led to the fall in the mill sector, and units in certain mill sector centres like Mumbai and Ahmedabad have started switching over to other businesses because of the attractive real estate pricing
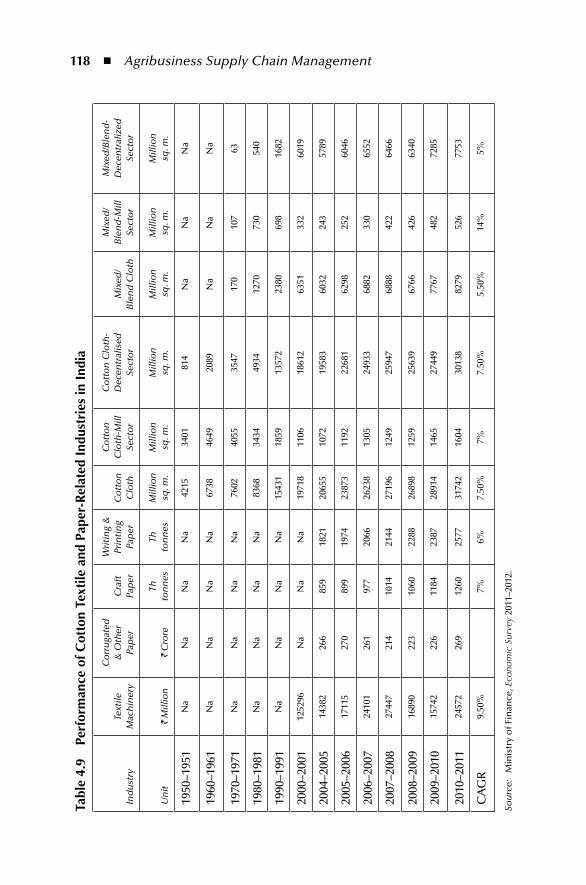
118 ◾ Agribusiness Supply Chain Management
tabl
e 4.
9 pe
rfor
man
ce o
f Cot
ton
text
ile a
nd p
aper
-rel
ated
ind
ustr
ies
in i
ndia
Ind
ust
ryTe
xtile
M
ach
iner
y
Co
rru
gate
d
& O
ther
Pa
per
Cra
ft
Pap
er
Wri
tin
g &
Pr
inti
ng
Pap
erC
ott
on
C
loth
Co
tto
n
Clo
th-M
ill
Sect
or
Co
tto
n C
loth
-D
ecen
tral
ised
Se
cto
rM
ixed
/B
len
d C
loth
Mix
ed/
Ble
nd
-Mill
Se
cto
r
Mix
ed/B
len
d-
Dec
entr
aliz
ed
Sect
or
Un
it`
Mill
ion
` C
rore
Th
ton
nes
Th
ton
nes
Mill
ion
sq
. m.
Mill
ion
sq
. m.
Mill
ion
sq
. m.
Mill
ion
sq
. m.
Mill
ion
sq
. m.
Mill
ion
sq
. m.
1950
–195
1N
aN
aN
aN
a42
1534
0181
4N
aN
aN
a
1960
–196
1N
aN
aN
aN
a67
3846
4920
89N
aN
aN
a
1970
–197
1N
aN
aN
aN
a76
0240
5535
4717
010
763
1980
–198
1N
aN
aN
aN
a83
6834
3449
3412
7073
054
0
1990
–199
1N
aN
aN
aN
a15
431
1859
1357
223
8069
816
82
2000
–200
112
5296
Na
Na
Na
1971
811
0618
612
6351
332
6019
2004
–200
514
382
266
859
1821
2065
510
7219
583
6032
243
5789
2005
–200
617
115
270
899
1974
2387
311
9222
681
6298
252
6046
2006
–200
724
101
261
977
2066
2623
813
0524
933
6882
330
6552
2007
–200
827
447
214
1014
2144
2719
612
4925
947
6888
422
6466
2008
–200
916
890
223
1060
2288
2689
812
5925
639
6766
426
6340
2009
–201
015
742
226
1184
2387
2891
414
6527
449
7767
482
7285
2010
–201
124
572
269
1260
2577
3174
216
0430
138
8279
526
7753
CA
GR
9.50
%7%
6%7.
50%
7%7.
50%
5.50
%14
%5%
Sou
rce:
Min
istr
y o
f Fin
ance
, Eco
nom
ic S
urve
y 20
11–2
012.
Processors ◾ 119
their lands attract. From a supply chain perspective, poor cost conditions and the scope for realizing the real estate potential raised the scope for revisiting supply chain configurations in the decentralized sector.
6. Finally, a look at the growth of the mixed/blended cloth sector shows that it has registered a CAGR of 5.5%. Here again, the decentralized sector has a larger share compared to the mill sector, but has grown at a lower CAGR compared to the mill sector.
7. In the cloth manufacturing industry, cotton assumes a significant part, which is determined by cotton prices, availability and trade policies.
8. Here, we have not discussed the situation regarding man-made fibre, filament yarn, spun yarn and so on as our discussions are focused on challenges faced by the agro-based processing sector rather than the cloth sector.
Thus, agro-based secondary and tertiary processing industries face innumerable challenges in designing supply chains in order to achieve the overall supply chain goals of efficiency and service levels. This is because of the characteristics of agricul-tural produce and the number of market intermediation levels. The latter is being addressed through application of technology and spread of information and data for decision making. But the former would continue to be a challenge.
4.6 ConclusionTo conclude, agro-based processing can include primary, secondary and tertiary processing industries. The challenges are in planning network operations and syn-chronizing all stakeholders to optimize the supply chain goals of cost efficiency and responsiveness, while still achieving maximum supply chain profits shared across the network players, based on their respective roles and responsibilities. Because of the typical characteristics of agricultural products, namely, their seasonality, bulkiness and perishability, certain role agents may skew relationships and achieve increased importance, reaping more benefits. Processing firms need to establish partnering relationships and synchronize operations like any other industry’s evolved supply chain network designs.
referencesCEPCI. Cashew Export Promotion Council of India. http://www.cashewindia.orgDCCD
(Directorate of Cashewnut and Cocoa Development). Area, production & produc-tivity of cashewnut in India. About Cashew & Cocoa. 2010. http://dccd.gov.in/stat.htm#Areahttp://dccd.gov.in/stat.htm#Area
DCCD. Directorate of Cashewnut and Cocoa Development. Cashew processing units in India—2005–06. About Cashew & Cocoa. 2010. http://dccd.gov.in/stat1a.htm#PROCESSING
120 ◾ Agribusiness Supply Chain Management
Ministry of Commerce & Industry, Tea sold through e-auctions crossed 300 million kgs, Tea File, Apr.–Sept. 2010, p. 3. http://www.teaboard.gov.in/pdf/Tea%20File%20PDF
Ministry of Finance, Economic Survey 2011–2012. http://indiabudget.nic.inMinistry of Food Processing Industries, Data bank on economic parameters of the food
processing sector, 2012. http://mofpi.nic.inMohod, A., Jain, S., and Powar, A.G. Pollution sources and standards of cashew nut process-
ing. American Journal of Environmental Sciences 6(4), 324–328, 2010.PepsiCo, PepsiCo India achieves splendid success in contract farming in West Bengal, Mar.
23, 2010. http://pepsicoindia.co.in/media/Press-Releases/release_03_23_10.aspxTea e-Auction. https://www.teaauction.gov.in/Home.aspx
121
Chapter 5
retailers
5.1 introductionTypically, the term retail is used to refer to sales for final consumption, in contrast to sales for processing or resale (i.e., wholesale). A retail sale is a sale to the ultimate consumer. Retailing can be said to be the interface between the producer and the individual consumer buying primarily for personal consumption. This definition of retail excludes direct interface between manufacturers and institutional buyers such as the government and other bulk customers. It may be appropriate to mention here that retailing is the last link that connects the individual consumer with the manufacturing and distribution chain.
“A retailer is involved in the act of selling goods to the individual consumer at a margin of profit. Retailing can be classified as organized or unorganized, based on the structure or format of business. Typically, organized retailing refers to trading activities undertaken by licensed retailers, that is, those who are reg-istered for sales tax, income tax, etc. This category includes corporate-backed hypermarkets and retail chains, and also privately-owned large retail businesses. On the other hand, unorganized retailing refers to the traditional formats of
Obje CTIv eThis chapter helps in understanding the complexity of retailing agricultural produce, such as farm fresh and processed produce, and the need for address-ing challenges of achieving efficiency and effectiveness in supply chains. The discussions include those of unorganized and organized retailers and role of intermediaries.
122 ◾ Agribusiness Supply Chain Management
low-cost retailing. This would include: local kirana shops, owner-manned general stores, convenience stores, hand cart and pavement vendors, etc. This is over-whelmingly popular in India.
The Indian retail sector is highly fragmented, with 97% of businesses being run by unorganized retailers. Organized retail is at a very nascent stage. The sector is the largest source of employment after agriculture, and has deep penetration in rural India, generating more than 10% of India‘s gross domestic product (GDP)” (NABARD, 2011).
Table 5.1 summarizes the advantages of organized and unorganized retail.It may be also important to note there that there are certain disadvantages
like poor hygiene at times, limited stock-keeping units and little or no shopping experience.
On the other hand, the organized retail in agricultural products, including fruits and vegetables, is picking up in India. Produce is sold through a number of registered outlets, comprising cooperative, private and sole-ownership stores. These establishments are becoming common in metros, urban centres and even in semi-urban centres with a population of 100,000 or more.
However, organized retail may have some disadvantages like higher wast-age, as responsiveness has to be high, with the challenges of managing stock and store, pilferage, incremental transaction costs, and in India, the high cost of real estate and poor parking facilities has proved to be spoil sport for buying experience.
5.2 Size of indian retailIt may be useful to discuss the pecuniary size of the retail industry in India and then relate it to the food and beverages that would be fall under agribusiness, so that we can then arrive at the unorganized component. A NABARD (2011)
table 5.1 Advantages of organized and unorganized retail
Unorganized Organized
Proximity to customer Better quality and grading
Excellent customer relationship Economies of scale
Long operating hours Better loyalty programmes
Favourable price points Appropriate standards
Low wastages Good shopping experience
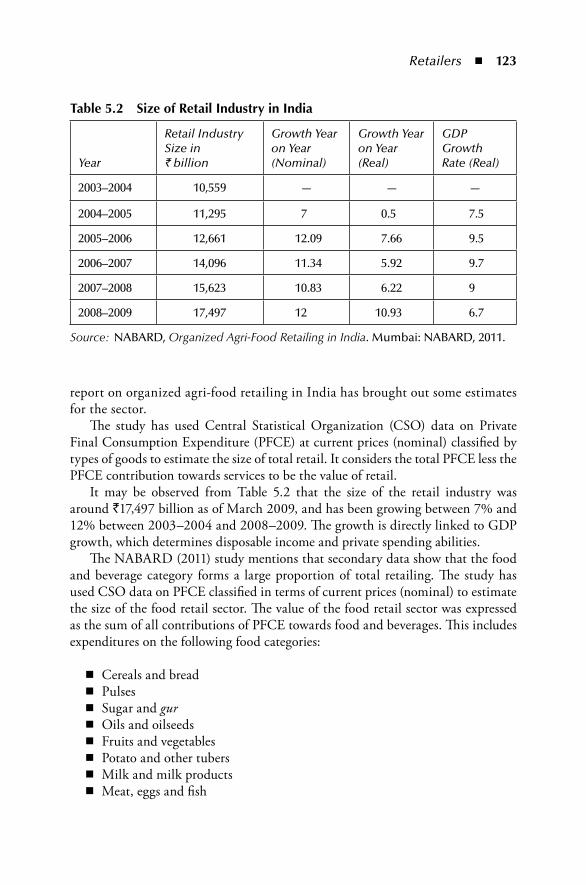
Retailers ◾ 123
report on organized agri-food retailing in India has brought out some estimates for the sector.
The study has used Central Statistical Organization (CSO) data on Private Final Consumption Expenditure (PFCE) at current prices (nominal) classified by types of goods to estimate the size of total retail. It considers the total PFCE less the PFCE contribution towards services to be the value of retail.
It may be observed from Table 5.2 that the size of the retail industry was around `17,497 billion as of March 2009, and has been growing between 7% and 12% between 2003–2004 and 2008–2009. The growth is directly linked to GDP growth, which determines disposable income and private spending abilities.
The NABARD (2011) study mentions that secondary data show that the food and beverage category forms a large proportion of total retailing. The study has used CSO data on PFCE classified in terms of current prices (nominal) to estimate the size of the food retail sector. The value of the food retail sector was expressed as the sum of all contributions of PFCE towards food and beverages. This includes expenditures on the following food categories:
◾ Cereals and bread ◾ Pulses ◾ Sugar and gur ◾ Oils and oilseeds ◾ Fruits and vegetables ◾ Potato and other tubers ◾ Milk and milk products ◾ Meat, eggs and fish
table 5.2 Size of retail industry in india
Year
Retail Industry Size in ` billion
Growth Year on Year (Nominal)
Growth Year on Year (Real)
GDP Growth Rate (Real)
2003–2004 10,559 — — —
2004–2005 11,295 7 0.5 7.5
2005–2006 12,661 12.09 7.66 9.5
2006–2007 14,096 11.34 5.92 9.7
2007–2008 15,623 10.83 6.22 9
2008–2009 17,497 12 10.93 6.7
Source: NABARD, Organized Agri-Food Retailing in India. Mumbai: NABARD, 2011.
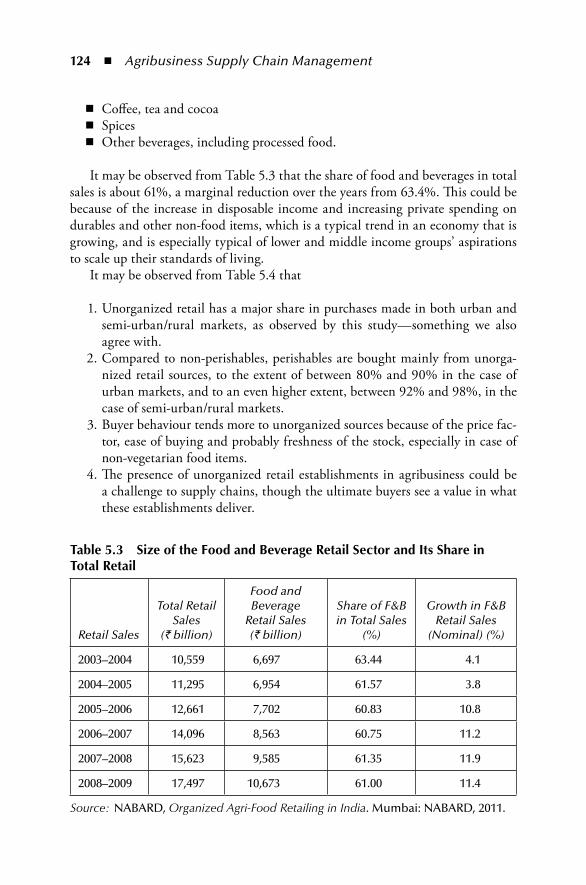
124 ◾ Agribusiness Supply Chain Management
◾ Coffee, tea and cocoa ◾ Spices ◾ Other beverages, including processed food.
It may be observed from Table 5.3 that the share of food and beverages in total sales is about 61%, a marginal reduction over the years from 63.4%. This could be because of the increase in disposable income and increasing private spending on durables and other non-food items, which is a typical trend in an economy that is growing, and is especially typical of lower and middle income groups’ aspirations to scale up their standards of living.
It may be observed from Table 5.4 that
1. Unorganized retail has a major share in purchases made in both urban and semi-urban/rural markets, as observed by this study—something we also agree with.
2. Compared to non-perishables, perishables are bought mainly from unorga-nized retail sources, to the extent of between 80% and 90% in the case of urban markets, and to an even higher extent, between 92% and 98%, in the case of semi-urban/rural markets.
3. Buyer behaviour tends more to unorganized sources because of the price fac-tor, ease of buying and probably freshness of the stock, especially in case of non-vegetarian food items.
4. The presence of unorganized retail establishments in agribusiness could be a challenge to supply chains, though the ultimate buyers see a value in what these establishments deliver.
table 5.3 Size of the Food and Beverage retail Sector and its Share in total retail
Retail Sales
Total Retail Sales
(` billion)
Food and Beverage
Retail Sales (` billion)
Share of F&B in Total Sales
(%)
Growth in F&B Retail Sales
(Nominal) (%)
2003–2004 10,559 6,697 63.44 4.1
2004–2005 11,295 6,954 61.57 3.8
2005–2006 12,661 7,702 60.83 10.8
2006–2007 14,096 8,563 60.75 11.2
2007–2008 15,623 9,585 61.35 11.9
2008–2009 17,497 10,673 61.00 11.4
Source: NABARD, Organized Agri-Food Retailing in India. Mumbai: NABARD, 2011.
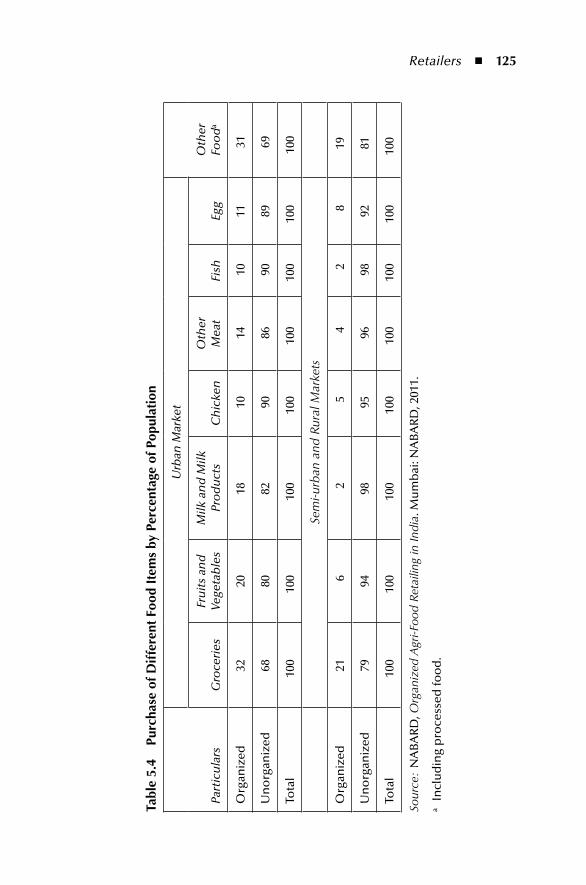
Retailers ◾ 125
tabl
e 5.
4 pu
rcha
se o
f Dif
fere
nt F
ood
item
s by
per
cent
age
of p
opul
atio
n
Part
icu
lars
Urb
an M
arke
t
Oth
er
Foo
da
Gro
ceri
esFr
uit
s an
d
Vege
tab
les
Milk
an
d M
ilk
Pro
du
cts
Ch
icke
nO
ther
M
eat
Fish
Egg
Org
aniz
ed32
2018
1014
1011
31
Un
org
aniz
ed68
8082
9086
9089
69
Tota
l10
010
010
010
010
010
010
010
0
Sem
i-urb
an a
nd R
ural
Mar
kets
Org
aniz
ed21
62
54
28
19
Un
org
aniz
ed79
9498
9596
9892
81
Tota
l10
010
010
010
010
010
010
010
0
Sour
ce:
NA
BA
RD
, Org
aniz
ed A
gri-F
ood
Ret
ailin
g in
Indi
a. M
um
bai
: NA
BA
RD
, 201
1.
a In
clu
din
g p
roce
ssed
foo
d.
126 ◾ Agribusiness Supply Chain Management
5.3 unorganized SectorTraditionally, “retailing in India has grown with the number of kirana shops (mom and pop format establishments). These shops are well distributed across all geographical areas, from metropolitan cities to small hamlets or villages. As the economy grew, reflected in changes in demography, and rise in income and wealth distribution, the number of such establishments grew and reached enor-mous levels. According to the economic census of 2005, the number of establish-ments in India engaged in retail trade was around 15 million. While 52% of these were in rural areas, the remaining 48% were in urban areas. During the earlier census of 1998, the total number of establishments engaged in retail trade was 10.6 million (with 49% in rural and 51% in urban areas). The period has seen an average growth of about 6% per year in the number of retail establishments” (NABARD, 2011).
5.3.1 Rationale 1. Buying convenience: Unorganized retail establishments are usually in close
proximity to their customers. The NABARD (2011) study points out that organized retail outlets are located quite far away, that is, more than four times the distance (average 1180 m) of unorganized outlets (average 280 m) from consumers’ residences in A class centres, while it was further away (1320 m) in case of B and C class centres. Though there is a high penetration of organized retail in A and A1 class cities, consumers have a clear prefer-ence for unorganized retail, especially for perishables. Consumers buy from the unorganized retail most especially when something needs to be bought quickly. The average amount of time spent per visit is significantly high in the organized sector compared to the average time spent at unorganized outlets. However, this additional time spent in organized retail organizations would span purchases of both food and non-food items. There are many reasons why this additional time is spent. They include the self-service systems, wherein customers go through different sections for choosing different items, more customers demanding attention and queues at billing/paying counters.
In the same manner, the average amount of time spent per visit is sig-nificantly higher in case of the organized retail sector. Since customers spend more time, but are less likely to visit as often as in the case of unorganized retail outlets, the time and amount spent per visit could be higher. This makes it clear that unorganized retailers are likely to be highly preferred for buying perishables.
This is clear from the structure of the marketplaces, where selling is done in small lots by persons using head loads, carts and other vehicles to provide door delivery as well. For example, one wonders how a hawker walking into a neighbourhood with his cart of vegetables and fruits knows the demand
Retailers ◾ 127
pattern of the families living in the area. It may be that one of his regular clients—an elderly lady—chats with him about the other households in the locality. Equipped with surprisingly precise knowledge about the demand pattern of each household, his cart would be stocked with the exact amount of perishables. If we observe his selling pattern a little more, we will find the hawker completes his round through the neighbourhood by 11 a.m.—a total work time of six hours—and makes a decent margin of profit with less vari-ability in price, lesser necessity for stock-keeping items and smaller quantities. It’s amazing. His customers are happy with his fresh stock and fair prices. The vendor is happy with his service, realization and the stability of his earn-ings. The cash-to-cash cycle is so perfect that his sourcing and distribution plans are also clear and well established. Synchronization of supplier relation-ship management and customer relationship management—the macro pro-cesses of supply chain management—is well in place. The hawker would have roughly around `3000 worth of stock, and made his sales at a 30% margin. Ideally, as per our enquiry, we observe that he sells about 80% of his stocks on his neighbourhood rounds, and sells the remaining 20% to small restaurants and hotels. There is also a likelihood of credit sales, and the vendor manages his cash flow by anticipating such credit sale requirements.
Apart from direct sales at homes, agricultural products are sold in market-places in each locality, either in the morning hours or in the evening hours. These marketplaces have assemblies of large numbers of sellers and buyers in locations either assigned by the local municipal authorities or captured by the traders by dint of long practice over the years. There would be no great convenience in buying in such marketplaces for high income groups, as these markets are unstructured and without much parking space; however, large middle- and low-income groups would find it attractive.
Thus, unorganized markets have come to stay because of convenience buying.
2. Way of livelihood for vendors and retailers: There are a large number of retailers and vendors in the unorganized market. For many of them, trading is their livelihood. They have taken up retailing of agricultural produce because the entry barriers are low. All that is required is possession of selling space in an advantageous location and limited working capital to invest on stock. When interviewed, many of the retailers gave us to understand that they are in the business by choice, and at times, because it was the family business. Further, they do not have any alternate means of livelihood, as they took up retail-ing with very little formal education, and started their careers as apprentices in retail stores. Hence, as they are engaged with their only livelihood, they stay focused, and try to create value for themselves by buying and selling goods and services. There is a common belief that such unorganized retailers thrive on low margins and low turnovers, benefiting from the corresponding low risks. As the population increases and new agglomerations of residential
128 ◾ Agribusiness Supply Chain Management
dwellings arise, agricultural products for the ultimate consumers reach the markets through the proliferation of both long-time retailers and new genera-tions of youth taking up a means of livelihood through trading of goods at the retail point.
3. Competitive pricing: Conceptually, organized retailing must provide strong price advantages, as they enjoy economies of scale; in reality, small and unor-ganized retailers are competitive in pricing. Our probing into the market brings out the fact that the small retailers have the advantages of low over-heads and low interest charges on their stocks. This may seem to be con-tradictory to common belief, as large retailers do have overheads, but these overheads are spread over wide inventories of stock. Similarly, large players must be able to get working capital at a lesser cost of fund. The key advan-tage to small retailers is their limited stocks and lesser wastage, resulting in their ability to offer competitive prices. It is also important to note that small retailers provide the scope for buying any lot size, which is seen as an advan-tage to buyers. Hence, it is not just price, but also the ability to transact at low volume and outflow, that makes them attractive retail outlet choices for consumers.
Thus, it is our view that the small unorganized retailers are popular because of the convenience they offer, their long working hours, competitive pricing, good understanding of customers and relationship management, as also their focus on their retail activity as their necessary choice of livelihood.
5.3.2 Business Structure 1. Petty, unorganized retailers who sell in carts, on pavements and in marketplaces:
These are businesses owned by operators who have typically organized their own capital and labour, and run their businesses for profits. The capital employed could be between `10,000 and `100,000. The focus is mainly on using the opportunity to maintain a steady livelihood with a regular cus-tomer base and the opportunity to serve repeat customers. The retailers earn a decent profit margin of 20%–30% and typically, do a cash turnover in a day or two. The more financially strong members of this group may have paid large sums in the range of `60,000–70,000 for the rights to set-up and run their petty shops on pavements or in marketplaces. This is true for perishables as well as for other agricultural products that are sold in rural and semi-urban markets. Normally, one would not come across non-perishables such as cere-als and grains being sold in this format in urban centres.
2. Petty shops: Typically, these shops are formally structured in an area of 600 sq. ft or less. Again, they are operated by their owners, with two or
Retailers ◾ 129
three helpers. The shop would sell many agricultural products and a few general format durable retail items such as personal care products, hair care products and home products. The total stock could be valued at around `300,000–500,000. Perishables will be replenished daily, and could be of value between `2,000 and `10,000. This is a key node in the agribusiness supply chain in India, as it caters to large sections of the population of India, especially low- and middle-income groups. This is especially so in rural mar-kets. The node participants may not be acting as part of a supply chain, but well-honed market survival instincts compel them to keep extending their businesses. There is stiff competition and low entry and exit barriers, making it unattractive for players who want to ensure mature operations and long-term survival with normal profits.
3. Single store: The unorganized retail trade for agricultural products includes perishables. Typically, these stores have the following characteristics:
a. Proximity, goodwill, credit sales, bargaining, loose items, convenient timings and home delivery, all of which are major drivers of these units.
b. While kirana (mom and pop) stores sell on credit to retain customers, their own reliance on institutional finance remains very low.
c. These stores depend on their customer bases and relationships with them, maintained by extending excellent service based on intimate knowledge of customer demand. They are responsive, and provide all support ser-vices such as home delivery, credit on purchases and information support on events and happenings around the locality.
d. Quality is never an issue as the customers are well known. If a retailer falls short on quality, his customers would demand replacements. Hence, the challenge these retailers face are having the right inventory and the right quality, and offering the best prices and service.
e. The viability of a single large store, retailing perishables and operating on a 3000 sq. ft area is given in Table 5.5.
It may be seen from Table 5.5 that a perishable retail outlet that could be selling fruits and vegetables along with a few more food items will probably have a stock valued at `1,800,000. The store may be employing about 27 staff, incurring a staff cost of `200,000 excluding their welfare expenses and bonus. We look at the other operating costs and determine the level at which the store must operate to earn profits.
It may also be observed from Table 5.5 that obsolescence cost, rental and interest on working capital are key line items that need discussion. Obsolescence cost in perishables is estimated to be 10% of the stock or 6.5% of turnover. It would be appropriate to see this cost as a percentage of turnover, as the success of business involving retail of perishables depends more on liquidation of stock and manage-ment of price and revenue using the discounting strategy. Rental is assumed to be
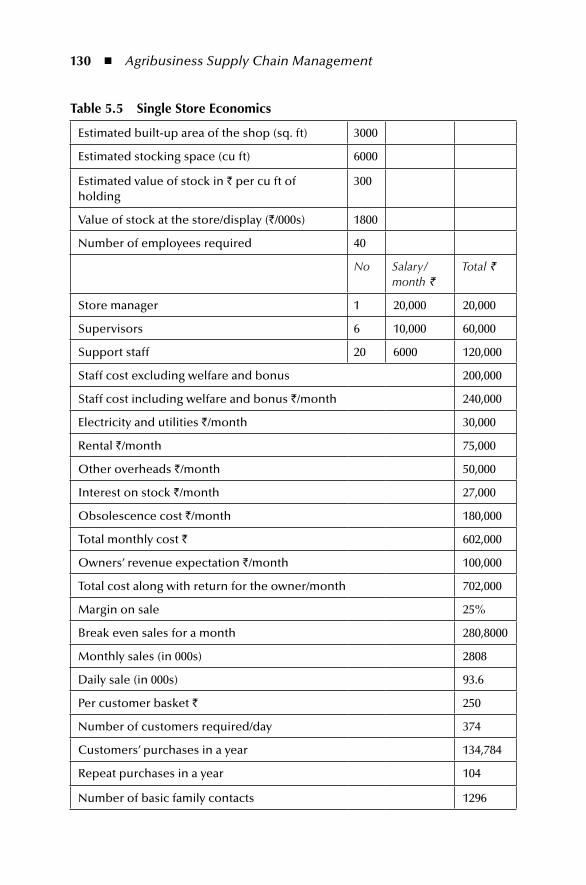
130 ◾ Agribusiness Supply Chain Management
table 5.5 Single Store economics
Estimated built-up area of the shop (sq. ft) 3000
Estimated stocking space (cu ft) 6000
Estimated value of stock in ` per cu ft of holding
300
Value of stock at the store/display (`/000s) 1800
Number of employees required 40
No Salary/month `
Total `
Store manager 1 20,000 20,000
Supervisors 6 10,000 60,000
Support staff 20 6000 120,000
Staff cost excluding welfare and bonus 200,000
Staff cost including welfare and bonus `/month 240,000
Electricity and utilities `/month 30,000
Rental `/month 75,000
Other overheads `/month 50,000
Interest on stock `/month 27,000
Obsolescence cost `/month 180,000
Total monthly cost ` 602,000
Owners’ revenue expectation `/month 100,000
Total cost along with return for the owner/month 702,000
Margin on sale 25%
Break even sales for a month 280,8000
Monthly sales (in 000s) 2808
Daily sale (in 000s) 93.6
Per customer basket ` 250
Number of customers required/day 374
Customers’ purchases in a year 134,784
Repeat purchases in a year 104
Number of basic family contacts 1296
Retailers ◾ 131
`25 per sq. foot, which is quite nominal in urban and semi-urban centres. If the retailer uses a designated market space operated by a large sellers’ association, this could be lower. This requires long leases and a hold on such opportunities over a long period. There is a trend, especially in A class and A1 class urban areas, for some retailers to invest on space. For example, in our illustration, the retailer must invest around `3 million to own 3,000 sq. ft, and the capital cost per month, exclud-ing repayment of capital, could be `50,000. In any case, the capital appreciates, and the retailer would make good on his investment. Another challenge for small retailers in India is the interest cost on stocks. In this case, we have assumed 18% per annum, or 1.5% on a monthly basis, which is very fair and optimistic. Often, small retailers do not have access to organized funding, and hence, the cost of their working capital is high. The retail trade, which is operated as a full-time engage-ment by the owner, provides `1,00,000 towards salary and return for risk-taking. This is abysmally low.
Let us understand the viability at this level of costs. The cost of operation is about `702,000, and at a 25% margin, the retailer has to achieve total sales of `2,808,000 per month. The daily sale must be about ̀ 93,600, which means at least 374 transactions at a basket value `250 each are required. This could be possible only if the retailer has about 1,296 customer accounts, with each customer buying at least twice in a week. This is based on actual observation and fair assumptions about customer loyalty. In reality, customer footprints to conversion and casual walk-ins would happen. But by and large, the economics is fairly supported on ground by a few experts. This case is not generalized, but is used to draw broad inferences about the sector.
The drivers or challenges for unorganized retail in India are:
1. the ability to build customer loyalty and ensure repeat purchases; 2. management of obsolescence and reduction of waste to a single-digit percent
of turnover; 3. management of the interest cost on working capital; 4. most important, the cost of real estate, which is met through ownership or
rentals. Since many of these categories of retailers do not have the support of institutions and are self-starters, capital is scarce. Hence, they go for rentals. Managing the space and holding on to the rental rate is a contemporary challenge, especially in class A and class A1 cities, where real estate prices have zoomed.
This leads us to the conclusion that given the clusters of dwellings and space constraints, agricultural retail trade in the unorganized format would continue to thrive in India, as it provides livelihood for a large community of small traders. There would be less recognition as parts of supply chain networks, but more effec-tiveness could be driven by instincts and node (retail) level business sense, and by providing value to small-quantity customers.
132 ◾ Agribusiness Supply Chain Management
5.4 organized SectorOrganized agricultural food retailing, as defined earlier, refers to food and beverage retailing by licensed retailers (registered for sales tax, income tax, etc.) with proper technical and accounting standardization. The organized retail trade in the food category also has a significant impact on supply chains related to the flow of mate-rial from the rural areas to the consumption centres and could directly affect the livelihoods of the farmers.
The hierarchy or structure of the agribusiness market has two components:
1. Agricultural inputs and services which are bought and consumed by farmers in their production activities as part of the backward linkages in agribusiness supply chains. However, we are not discussing this issue here, as it has been dealt with in the chapter 2 on agribusiness inputs. Moreover, it does not con-stitute ultimate individual consumption, but is seen as an input for an output to which value is being added. Though such products and services require retailing, they are not part of the discussion here for the reasons mentioned above.
2. Agricultural outputs move as products directly or through value additions to the retail points for ultimate consumption; this is a part of the forward link-ages of agribusiness chains, and our discussion here is centred around those products and the outputs to the food, perishable and organized retail busi-nesses where value-added agricultural produce is sold.
Table 5.6 provides the phases of evolution of the retail sector in India by bring-ing out the structures or hierarchies of retail formats.
Here, it is important to discuss the rural and urban definitions widely used in India, and how they need to be contextualized here. “As per the Census Report, the ‘rural sector’ means any place that meets the following criteria: a population of less than 5,000; a density of population less than 400 per sq. km, and more than 25% of the male working population engaged in agricultural pursuits.” (Ministry of Home Affairs, 2011b)
Further, the census further mentions that the rural areas are the smallest areas of habitation, viz., the village generally falls within the limits of a rev-enue village as recognized by the normal district administration. The revenue village need not necessarily be a single agglomeration of habitations, but has a definite surveyed boundary. Each village is a separate administrative unit, with separate village accounts. It may have one or more hamlets. The entire revenue village is one unit.
“Rural primary markets are typically located in rural and interior areas, and serve as focal points for a majority of the farmers in the vicinity. These are mostly small and marginal farmers who come to market their farm produce and purchase their consumption needs. Typically, the markets are like melas (celebrations) on
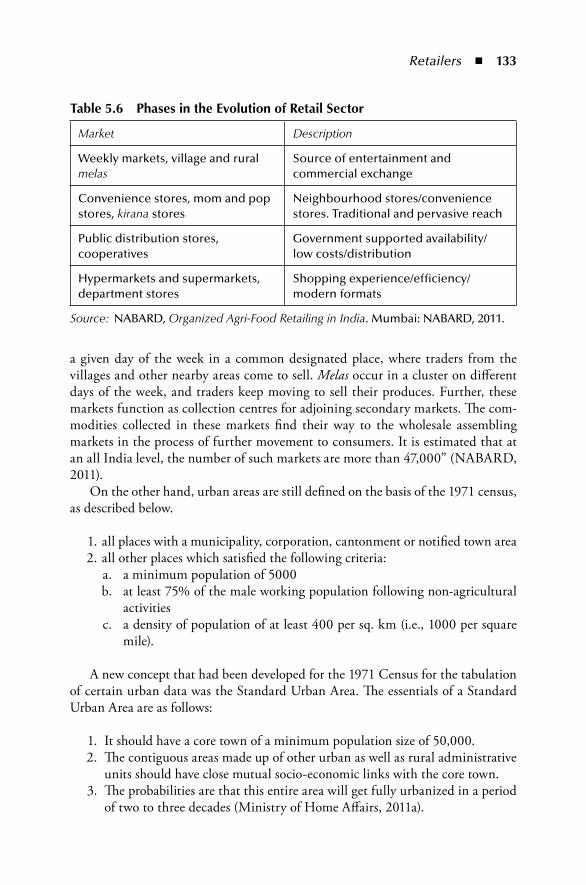
Retailers ◾ 133
a given day of the week in a common designated place, where traders from the villages and other nearby areas come to sell. Melas occur in a cluster on different days of the week, and traders keep moving to sell their produces. Further, these markets function as collection centres for adjoining secondary markets. The com-modities collected in these markets find their way to the wholesale assembling markets in the process of further movement to consumers. It is estimated that at an all India level, the number of such markets are more than 47,000” (NABARD, 2011).
On the other hand, urban areas are still defined on the basis of the 1971 census, as described below.
1. all places with a municipality, corporation, cantonment or notified town area 2. all other places which satisfied the following criteria: a. a minimum population of 5000 b. at least 75% of the male working population following non-agricultural
activities c. a density of population of at least 400 per sq. km (i.e., 1000 per square
mile).
A new concept that had been developed for the 1971 Census for the tabulation of certain urban data was the Standard Urban Area. The essentials of a Standard Urban Area are as follows:
1. It should have a core town of a minimum population size of 50,000. 2. The contiguous areas made up of other urban as well as rural administrative
units should have close mutual socio-economic links with the core town. 3. The probabilities are that this entire area will get fully urbanized in a period
of two to three decades (Ministry of Home Affairs, 2011a).
table 5.6 phases in the evolution of retail Sector
Market Description
Weekly markets, village and rural melas
Source of entertainment and commercial exchange
Convenience stores, mom and pop stores, kirana stores
Neighbourhood stores/convenience stores. Traditional and pervasive reach
Public distribution stores, cooperatives
Government supported availability/low costs/distribution
Hypermarkets and supermarkets, department stores
Shopping experience/efficiency/modern formats
Source: NABARD, Organized Agri-Food Retailing in India. Mumbai: NABARD, 2011.
134 ◾ Agribusiness Supply Chain Management
Further, “an urban agglomeration is a continuous urban spread constituting a town and its adjoining outgrowths or two or more physically contiguous town together with or without outgrowths of such towns” (Ministry of Home Affairs, 2011a).
The wholesale markets are located at talukas (a subdivision of a district; a group of several villages organized for revenue purposes), at the headquarters of a town or a municipality, or at important railway stations, and perform the assembling and distribution functions. The business is conducted according to market prac-tices established by age-old customs, or as per the regulations of Agricultural Produce Market Committee (APMC), wherever these regulations are in force. “As per government estimates, there are about 6,300 such markets across India” (NABARD, 2011). Here, largely small retailers and processors come to buy their needs, and at times, even end customers come to buy. It is an important avenue for end customers to buy directly or at last mile, and hence is discussed here.
“Over the years, to achieve an efficient system of buying and selling of agri-cultural commodities, most of the state governments and union territories enacted legislations Agricultural Produce Marketing (Regulation) Acts (APMRActs) to provide for regulation of agricultural produce markets. Most of the wholesale mar-kets and some of the rural primary markets have been brought under these regula-tions” (NABARD, 2011). Hence, they are discussed here under the organized retail category of agribusiness in India. Table 5.7 gives details of APMCs in different states in India.
APMCs are focal points for sellers, buyers and agents. The committees are responsible for providing the required infrastructure as well as for preventing unfair trade practices by functionaries. APMCs regulate the wholesale selling of agricul-tural produce in their defined areas of operation. The aim of regulating the mar-ket functioning was to establish a transparent trading market environment where sellers would bring their agricultural produce to sell in open auctions. The com-plete process of such sales, including the auction, weighing, grading, payment and temporary storage then would be controlled by a regulating body represented by democratically elected members. Moreover, even the behaviour of the functionar-ies operating in the market area is closely monitored. Updated information about the total inflow of various agricultural commodities, their prices, and month-wise demand/supply positions is easily available. It may be noted here that understand-ing of APMCs is important here, as small retailers and even large retail formats buy from here, and effective functioning of APMCs could lead to healthy retailing of agricultural produce.
One is not clear about the impact of the APMC, as only 17 out of 35 states and union territories have implemented the APMC Act and its amendments. According to Suparna (2011), “an important stakeholder group in the retail distribution chain are the multitude of small farmers and small agro-processors, who receive the most miniscule share of the revenue pie, and whose concerns are almost always overshad-owed by the better lobbying power of the intermediaries in the agricultural supply chain.” Only 17 states have amended their APMC Act to allow direct marketing,
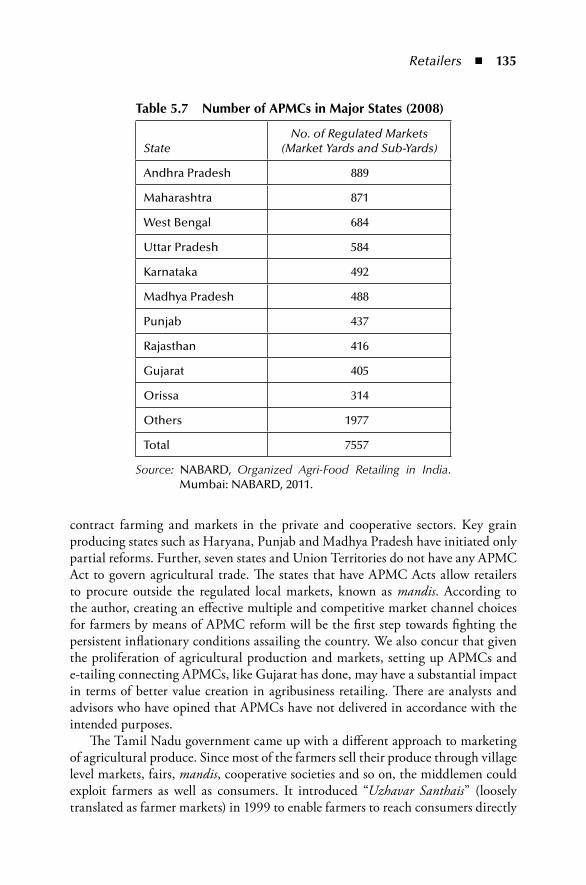
Retailers ◾ 135
contract farming and markets in the private and cooperative sectors. Key grain producing states such as Haryana, Punjab and Madhya Pradesh have initiated only partial reforms. Further, seven states and Union Territories do not have any APMC Act to govern agricultural trade. The states that have APMC Acts allow retailers to procure outside the regulated local markets, known as mandis. According to the author, creating an effective multiple and competitive market channel choices for farmers by means of APMC reform will be the first step towards fighting the persistent inflationary conditions assailing the country. We also concur that given the proliferation of agricultural production and markets, setting up APMCs and e-tailing connecting APMCs, like Gujarat has done, may have a substantial impact in terms of better value creation in agribusiness retailing. There are analysts and advisors who have opined that APMCs have not delivered in accordance with the intended purposes.
The Tamil Nadu government came up with a different approach to marketing of agricultural produce. Since most of the farmers sell their produce through village level markets, fairs, mandis, cooperative societies and so on, the middlemen could exploit farmers as well as consumers. It introduced “Uzhavar Santhais” (loosely translated as farmer markets) in 1999 to enable farmers to reach consumers directly
table 5.7 number of ApmCs in major States (2008)
StateNo. of Regulated Markets
(Market Yards and Sub-Yards)
Andhra Pradesh 889
Maharashtra 871
West Bengal 684
Uttar Pradesh 584
Karnataka 492
Madhya Pradesh 488
Punjab 437
Rajasthan 416
Gujarat 405
Orissa 314
Others 1977
Total 7557
Source: NABARD, Organized Agri-Food Retailing in India. Mumbai: NABARD, 2011.
136 ◾ Agribusiness Supply Chain Management
at consumption centres. There were about 103 Uzhavar Santhais functioning as of 2011. All Uzhavar Santhais are maintained and staffed by personnel from the Departments of Agricultural Marketing, Agriculture and Horticulture.
Though this is seen as an alternative to APMCs, one cannot say conclusively which approach is more ideal for improving supply chain efficiency.
Urban organized retail outlets are usually located quite far away compared to unorganized retail stores in the same location. Further, in terms of numbers, there are more unorganized stores for every organized store, as the size and economics of an organized store is five times and more in terms of size and stock. The differences also vary. For example, in large urban areas, one may find the organized stores bet-ter in terms of ratios than semi-urban and rural areas.
On an average, consumers spend more in an organized retail store on every purchase compared to that in an unorganized store. This is mainly because of two reasons: (a) the number of visits to organized stores is less compared to visits to unorganized stores, and (b) the range of items available, including items in the food and non-food categories, is higher in an organized store. We may have to keep in mind here that we cannot make an apple to apple comparison, as a customer would also buy general format items, which are not related to agribusiness, from an orga-nized store. As footprints are driven by demand, and sales happen on bundles of many items, organized stores have an advantage. This is true mainly for processed agricultural products, especially in an urban centre, as customers feel organized stores offer better quality and grade, even with private labels. When an item that is available without a brand in the unorganized sector is available with an estab-lished brand, the push in organized stores is high because of promotions. Hence, customer spending is high.
However, organized retail outlets continue to be less preferred by consumers for all categories of food items such as milk and milk products; fruits and vegetables; non-vegetarian food items and eggs. These food items are purchased frequently mostly at unorganized outlets. Typically in India, fruits and vegetables required for one to four days are purchased, while milk and eggs are purchased on a daily basis. Other food items are purchased in quantities meant to last between 7 and 15 days.
Customer loyalty towards organized retail is less compared to loyalty towards unorganized retail. The reasons are as follows: (a) Organized retail is in the early stages of growth and is providing new experiences and discounts for attracting footprints. (b) Customers believe all organized retail is at a given level of quality, and swapping loyalty is acceptable, as they can gain from every purchase. In the case of unorganized retail, loyalty has to be higher because of familiarity, value-added service offered and so on.
One would expect organized retail to score over unorganized retail in cleanli-ness and freshness for all food categories. Of the two factors, freshness is more important for grocery and non-vegetarian food items. However, for non-vegetarian items and other perishables, customers in India still prefer the unorganized retail market.
Retailers ◾ 137
On price competitiveness between organized and unorganized retailers, there is no perceptible difference. Though theoretically organized retail should offer better value for customers, current market structures and the cost of real estate, as well as working capital costs and losses due to wastage bring in competitive disadvantages.
It is also observed that customers are unhappy with organized retail because of long queues for billing, heavy customer rush during peak hours and lack of atten-dants who could facilitate the buying experience.
Thus, it may be observed that organized retail is at an evolutionary stage only, and initiatives taken by the government are expected to have less impact because of the costs of real estate and capital, footprints and value of basket bought, and customer choice. In India, it is difficult to imagine that there are stores where the value of customer experience can be higher, because there are no adequate parking spaces, and most stores are not well laid out, with lots of walking bays and huge displays that would bring the customer’s experience in line with stores in developed markets.
5.5 Supply Chain ChallengesWhile discussing supply chains, an analyst would be interested in knowing how many nodes and flows are there between the origin of a produce, in the value addition process and in the final reach to ultimate customers. The more the nodes, the more the intermediaries, the lesser the efficiency and the higher the supply chain costs. This is what is typically happening in Indian agribusiness.
There are companies such as ITC, Pepsi and many others in processed food business, with beverages such as coffee, tea and milk, who organized direct pro-curement with the support of the government and were able to reap benefits. Since a number of examples are discussed in this book in different chapters, we avoid repeating them here.
It may be important to note that direct procurement of fruits and vegetables by organized food retailers from farmers not only results in the farmer realizing a better share of consumer spending, but also in reducing costs to the consumers. This supply chain design requires certain preconditions.
1. Government policy support is required to enable direct procurement from farmers. It is not forthcoming in all states in India. There are a number of guidelines and approvals required even in states where it is permitted.
2. Farmers need to be organized into clusters or groups to produce in contiguous areas so that there are economies of scale and feasibility in cost management. Non-contiguous planting could impose difficulty in harvesting, post-harvest management and so on. More important, crop management costs within the support system would be higher.
138 ◾ Agribusiness Supply Chain Management
3. Adequate infrastructure is needed for grading, sorting and cleaning of pro-duce and for moving produce to markets/stores.
4. Excellent communication and supplier relationship management with farm-ers are needed to ensure seamless flow of products, information and finance. Farmers cannot accept reverse flows, and it is the responsibility of direct pro-curement agents/retailers to ensure that produce is liquidated and there are no returns. Typically, our observation has shown that farmers are open to grading while procuring and to fixing prices according to grades, but they do not encourage returns. We also observed that farmers received better prices in cases of direct procurement, when compared to the prices available at nearby wholesale markets; over and above this advantage, they also save on trans-portation and handling costs. Retailers who procure directly are able to get the right produce of good quality and standards and realize better prices, as wastage is reduced.
Thus, supply chain efficiencies can be improved through direct procurement or by reducing intermediaries wherever possible in agribusiness, mainly because a number of role agents do not have adequate responsibilities compared to the reward they receive.
5.6 role of intermediariesRetailing is the final stage of delivery of produce to the consumer. However, there is a long chain of intermediaries enabling the transfer of produce between the producer and the retailer. Further, most agricultural products require pro-cessing and value addition before they can be retailed. Agricultural products can be classified broadly into two groups on the basis of the degree of value addition.
Agricultural products requiring processing: These include grains, oils and pulses, as well as all processed and packaged foods (including packaged milk). They form the bulk of the merchandise of the retailers. Here, the role of the processor is important, as it brings value addition through grading and quality control, and often, changes in the form of the produce, like edible oil being extracted from oilseeds. Organized retailers directly procure from the processors or through wholesale markets. Processors/millers are an integral part of supply chains for this category, thus completing the channel; the length of the channel is determined by the processors’ ability to structure procurements directly from farmers. If they have to go through intermediation like agents and markets, products become more expensive.
Agricultural products requiring minimum or no processing: These include fresh fruits and vegetables, and eggs, which can be retailed with no significant value
Retailers ◾ 139
addition. Here, the minimum value addition, such as grading and packaging, can be done by the retailer or by the supplier. Fruits and vegetables, with their need to be retailed fresh, provide ample opportunity for the retailer to come near to the farmers and associate with them. However, a majority of the purchases of the organized and the unorganized retailers are through private sector wholesalers or through the APMCs.
The other commodities, including chicken, meat and milk, would come under the “processed food” category, and are supplied directly through the processors, intermediaries like agents and wholesalers and distributors. There are some excel-lent brands in India such as Amul, Aavin and Mother Dairy in milk and milk products that could go direct to the sources for bulk items and through interme-diation for items of longer shelf life. Similarly, in chicken products, brands such as Suguna and Venky’s are successful, apart from others. Long life shelf products such as sugar, tea, coffee, edible oil and processed grains all have to go through certain levels of intermediation. Spices comprise one of the largest markets in India, and some brands such as Sakthi Masala, Aachi Masala and MTR have cre-ated a large presence by managing their supply chains efficiently and as also by better retailing through their networks, such that they have a high brand recall and loyalty.
Thus, organized retailing in India is a challenge, and supply chain efficien-cies are critical. Supply chain efficiencies must exist through all drivers of supply chains, but most importantly in procurement and inventory management, along with facility management and transportation, all of which provide value to role players.
5.7 Foreign Direct investment“In January 2012, the government removed restrictions on FDI in the single brand retail sector, allowing 100% FDI. The government has put a condition in respect of proposals involving FDI beyond 51%, making it mandatory to source at least 30% of the value of products sold from Indian ‘small industries/village and cottage industries, artisans and craftsmen’” (www.business-standard.com). More recently, in September 2012, the government has proposed allowing FDI of up to 51% in the multi-brand sector. This has created a lot of opposition from many interested groups, who claim that it would kill the domestic retail business and that the agricultural sector would also be exploited by the large MNCs. Contrary to this, the government and those who are supportive of FDI in retail are of the view that there is scope for improving supply chain efficiencies by eliminating intermediaries, and customers would benefit from low prices and wide choices. According to them, both the organized and the unorganized sectors would be able to co-exist.
140 ◾ Agribusiness Supply Chain Management
We would like to submit the following points for consideration:
1. Organized retail in India is a miniscule part of the business, and different studies have given different projections. However, in a decade or more, its share cannot go up beyond the single-digit level, given the complexity of Indian operations. There would be advantages for large foreign players, but they cannot do away with the unorganized domestic players. In the short run, the domestic players may have a disadvantage, but would soon regain their competitive position.
2. FDI coming in would help with infrastructure investments and with better processes and practices in agriculture. These benefits would pass on com-monly as farmers learning would not compel their selling decisions.
3. FDI would find it difficult to bring in big changes, as real estate costs are high and would not allow such operations to be viable. FDI may have advan-tages in working capital costs, but would have disadvantages in labour and employee costs.
4. Given the complexity of trade, it may be worth allowing FDI in retail with certain conditions relating to procurement guidelines and the need in invest on common facilities that could benefit trade as well.
5. At the outset, it is not very attractive for FDI to try to make a big bang effect. In India, we already have corporate entities such as Reliance, the Goenkas and the Birlas spreading out in the retail sector and taking a long time to make deep impacts. FDI can be no different from them.
5.8 ConclusionRetail in agribusiness is challenging because of proliferated demand and supply market conditions. Speaking in ideal terms, the Indian sub-continent’s culture and social set-up are such that they have promoted retailing as a livelihood for many, and intermediation processes have benefited many. Unorganized retail is deep-rooted and is supported by consumers as well. Without taking positions, structural changes are not possible through statute or intentions; they can be achieved only by setting economic values for the various players in the supply chain system, namely, the producers, ultimate consumers and a host of interme-diaries. Considering the fact that real estate is expensive in India and customers largely prefer fresh produce, organized retail will slowly pick up in semi-urban and downtown areas of large cities. There cannot be two opinions on the need for agribusiness to benefit from a structured business approach, especially in retail-ing. A few sets of practices such as fair pricing, transparent systems and structured market operation supported infrastructure may usher in a lot of good for the sector.

Retailers ◾ 141
referencesMinistry of Home Affairs. Census terms. 2011a. http://censusindia.gov.in/Data_Products/
Library/Indian_perceptive_link/Census_Terms_link/censusterms.htmlMinistry of Home Affairs. Provisional population totals: Urban agglomerations and cities.
2011b. http://censusindia.gov.in/2011-prov-results/paper2/data_files/India2/1.%20Data%20Highlight.pdf
NABARD, Organized Agri-Food Retailing in India. Mumbai: NABARD, 2011.Suparna, K. APMCs hold key to retail reform, Business Line, 2011. http://www.
thehindubusinessline.com/opinion/article2660044.ece?homepage=true

This page intentionally left blankThis page intentionally left blank

iiintrinSiC iSSueS

This page intentionally left blankThis page intentionally left blank
145
Chapter 6
perishability
6.1 introductionIndia is most often portrayed as a country of hungry people deprived of food and basic nutrition. Is this a problem of insufficient production or of inefficiencies in the supply chains dealing with distribution of agricultural products including food grains, fruits and vegetables, meat and dairy products? There are reports which mention that wastage in the post-harvest stages for fruits and vegetables is about 30%–40%. Mounts of food grains that go rotten in storage godowns have also been drawn to our attention. This highlights the scope for improving supply chain efficiency in the perishables segment.
It is important to understand that the dimension of perishability varies for different types of farm produce, and that as these produce are processed, either the freshness of the produce or other original qualities of the produce may prob-ably change. This in turn impacts the supply chain, depending on whether the consumption at the customer’s end is soon after harvest, without processing, or whether the converted product from the harvest is consumed after some form of processing.
Obje CTIv eThe objective of this chapter is to understand the challenges faced in handling perishable commodities with respect to distribution of produce, short shelf life, lack of temperature control or appropriate facilities for storage and transporta-tion, wastages and pricing pressures. The chapter also addresses channels of distribution of perishable commodities and issues of wastages in the channel.
146 ◾ Agribusiness Supply Chain Management
This being the case, it is a question of how the efficiency and responsiveness of the supply chain adapt to whether unprocessed raw produce is consumed or pro-cessed produce is consumed. In other words, the issue is how long the supply chain should be to optimize the benefits for the various stakeholders.
When we talk about perishability, we basically need to look into the following:
◾ Depending on the basic qualities of the farm produce, the processes to add value and the ultimate shelf life of the final product, how to map out the supply chain components and the necessary logistics
◾ How to extend the shelf life of the produce, even if not be in its “harvested fresh” form
◾ The fact that wherever extending the shelf life does not serve any purpose, the supply chain cycle should be shorter than the “perishable cycle” of the produce.
In this chapter, issues related to the management of the supply chain mecha-nism for perishable agro-based products are discussed. This could help to under-stand the challenges faced not only by the central government and its agencies like the Food Corporation of India, as well as state government agencies, but also by corporations or companies involved in sectors relating to milk and milk products, flowers, perishable fruits and vegetables, meat and seafood processing, pharmaceu-ticals and other related industries. This chapter also covers topics related to facility management, processing, distribution networks, retailing and price management.
Along with the 4P’s of marketing, agricultural products and agri-related prod-ucts demand that another “P” be given close attention: perishability. Transporting fresh produce from one point to another is certainly not an easy task. Many factors affect perishable product logistics in today’s market, such as rising fuel costs, food safety and statutory issues. The quality and freshness requirements associated with the demand for these products put constraints on the time available for the supply chain steps to be completed. The demand for fresh produces virtually dictates a shorter supply chain. Quick decision making and faster operations only will help to meet targets and may or may not fulfil customer demand for fresh and qual-ity products fully. The supply chain set-up has also to assimilate quick transport, maintenance of ideal temperature ranges and efficient marketing through whole-sale markets and retailers to match customer expectation. Minimization of wast-age and the costs involved in transportation and storage can help increase profits. This happens because revenue is improved through better realization and costs are reduced as wastage is reduced, and thereby, the supply chain profits. Both revenue increase and cost reduction help ensure better profitability. Energy usage reduction and quality packaging also go a long way in ensuring better supply systems, longer life and increased returns. These elements also pave the way for food grains and other perishable products to be served to larger customer and population bases, which improves another supply chain goal, namely, service level, which is a measure of demand being served on a number of occasions.
Perishability ◾ 147
6.2 Facilities at Source: Case of Different productsOne of the integral and essential parts of managing a “perishables” supply chain is choosing a proper facility, as this plays a major role. These decisions are more influ-enced by industry structure and product characteristics, and hence, are strategic in nature. They are typically made over a longer time horizon because the industry/product management practices are being evolved. They are also closely connected to the corporate strategy in the case of supply chain focal firms.
The creation of a supply chain necessitates appropriate geographical placement of sourcing points, such as the farmers, production facilities and storage points. Resources would depend on a long-term basis on the facility selected. Therefore, selecting the facility is crucial to revenue, cost and service level. Consider a farmer whose farm production point is located close to the production unit. Obviously, this can facilitate the efficiency of the chain. However, with disaggregated farming and geographical spread, the challenges are in determination of size, number and location of facilities. Further, there must be synchronization with optimization of production and distribution costs. Production limitations contribute immensely to reducing the cost and quality issues in supply chain management.
The perishables’ facilities near the farm could be as follows:
1. Washing, cleaning and grading centres 2. Preservation centres such as in the case of fish, icing and salt mixing 3. Chilling centres and temperature control units 4. Intermediate and full-scale processing units.
After harvest, agricultural produce such as fruits, vegetables, milk, meat and fish could be impacted by accelerated physiological, chemical and microbial pro-cesses that invariably lead to deterioration and loss of freshness, physical quality and volume. This mandates the creation of facilities with some measure of process-ing, such as reduction in moisture content, denaturation of endogenous enzymes and micro-organisms or suitable packaging to reduce or eliminate perishability. It is important to have such facilities; in the absence of such facilities, farmers could incur huge post-harvest losses right at the farm gate itself. It is the responsibility of the players in the supply chain network to work with technologists to under-stand the underlying processes contributing to food deterioration and spoilage, and to devise appropriate measures and methods of preservation in order to ensure availability, acceptability and safety of foods. We now highlight the practices and challenges in select agriculture and allied businesses in India.
6.2.1 SeafoodIt may be interesting to look at aspects of supply chains in the Indian seafood indus-try, especially from the exports perspective, and to understand the importance of
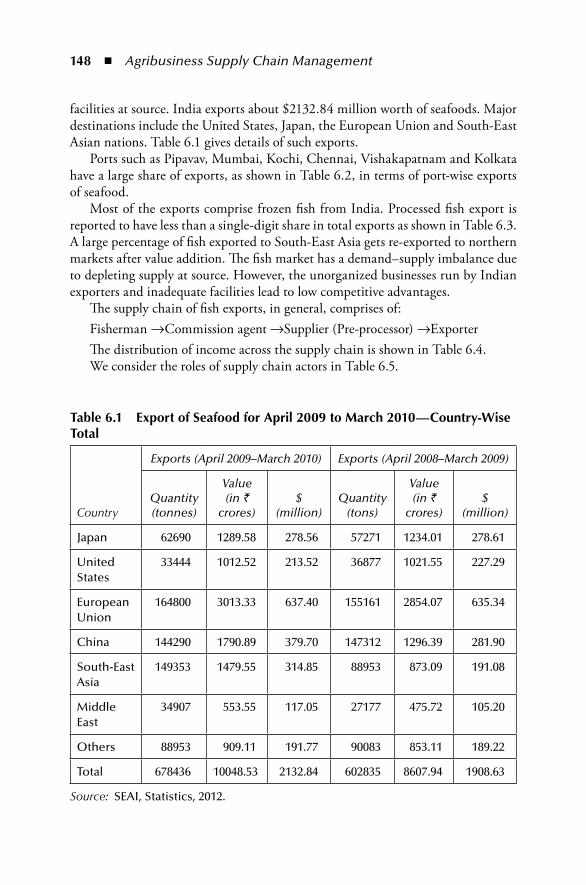
148 ◾ Agribusiness Supply Chain Management
facilities at source. India exports about $2132.84 million worth of seafoods. Major destinations include the United States, Japan, the European Union and South-East Asian nations. Table 6.1 gives details of such exports.
Ports such as Pipavav, Mumbai, Kochi, Chennai, Vishakapatnam and Kolkata have a large share of exports, as shown in Table 6.2, in terms of port-wise exports of seafood.
Most of the exports comprise frozen fish from India. Processed fish export is reported to have less than a single-digit share in total exports as shown in Table 6.3. A large percentage of fish exported to South-East Asia gets re-exported to northern markets after value addition. The fish market has a demand–supply imbalance due to depleting supply at source. However, the unorganized businesses run by Indian exporters and inadequate facilities lead to low competitive advantages.
The supply chain of fish exports, in general, comprises of:Fisherman →Commission agent →Supplier (Pre-processor) →ExporterThe distribution of income across the supply chain is shown in Table 6.4.We consider the roles of supply chain actors in Table 6.5.
table 6.1 export of Seafood for April 2009 to march 2010—Country-Wise total
Country
Exports (April 2009–March 2010) Exports (April 2008–March 2009)
Quantity (tonnes)
Value (in `
crores)$
(million)Quantity
(tons)
Value (in `
crores)$
(million)
Japan 62690 1289.58 278.56 57271 1234.01 278.61
United States
33444 1012.52 213.52 36877 1021.55 227.29
European Union
164800 3013.33 637.40 155161 2854.07 635.34
China 144290 1790.89 379.70 147312 1296.39 281.90
South-East Asia
149353 1479.55 314.85 88953 873.09 191.08
Middle East
34907 553.55 117.05 27177 475.72 105.20
Others 88953 909.11 191.77 90083 853.11 189.22
Total 678436 10048.53 2132.84 602835 8607.94 1908.63
Source: SEAI, Statistics, 2012.
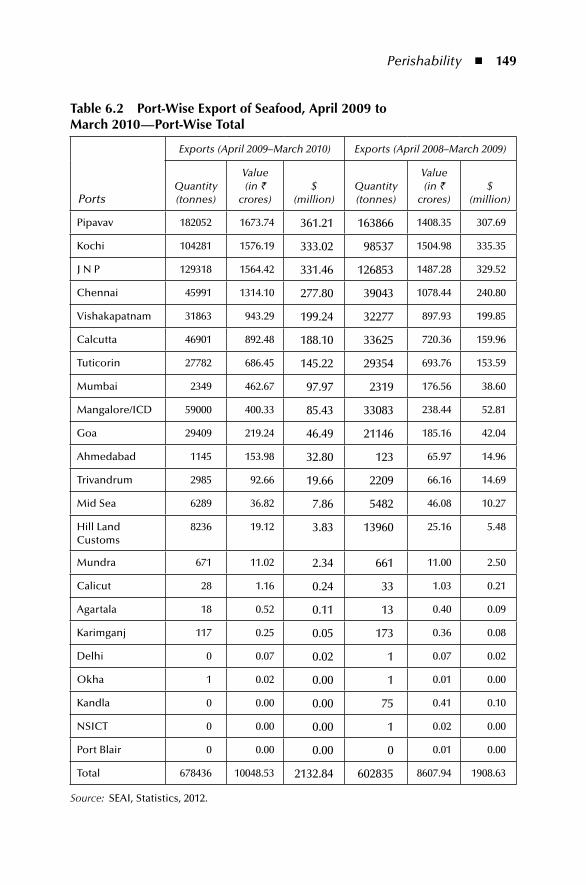
Perishability ◾ 149
table 6.2 port-Wise export of Seafood, April 2009 to march 2010— port-Wise total
Ports
Exports (April 2009–March 2010) Exports (April 2008–March 2009)
Quantity (tonnes)
Value (in `
crores)$
(million)Quantity (tonnes)
Value (in `
crores)$
(million)
Pipavav 182052 1673.74 361.21 163866 1408.35 307.69
Kochi 104281 1576.19 333.02 98537 1504.98 335.35
J N P 129318 1564.42 331.46 126853 1487.28 329.52
Chennai 45991 1314.10 277.80 39043 1078.44 240.80
Vishakapatnam 31863 943.29 199.24 32277 897.93 199.85
Calcutta 46901 892.48 188.10 33625 720.36 159.96
Tuticorin 27782 686.45 145.22 29354 693.76 153.59
Mumbai 2349 462.67 97.97 2319 176.56 38.60
Mangalore/ICD 59000 400.33 85.43 33083 238.44 52.81
Goa 29409 219.24 46.49 21146 185.16 42.04
Ahmedabad 1145 153.98 32.80 123 65.97 14.96
Trivandrum 2985 92.66 19.66 2209 66.16 14.69
Mid Sea 6289 36.82 7.86 5482 46.08 10.27
Hill Land Customs
8236 19.12 3.83 13960 25.16 5.48
Mundra 671 11.02 2.34 661 11.00 2.50
Calicut 28 1.16 0.24 33 1.03 0.21
Agartala 18 0.52 0.11 13 0.40 0.09
Karimganj 117 0.25 0.05 173 0.36 0.08
Delhi 0 0.07 0.02 1 0.07 0.02
Okha 1 0.02 0.00 1 0.01 0.00
Kandla 0 0.00 0.00 75 0.41 0.10
NSICT 0 0.00 0.00 1 0.02 0.00
Port Blair 0 0.00 0.00 0 0.01 0.00
Total 678436 10048.53 2132.84 602835 8607.94 1908.63
Source: SEAI, Statistics, 2012.
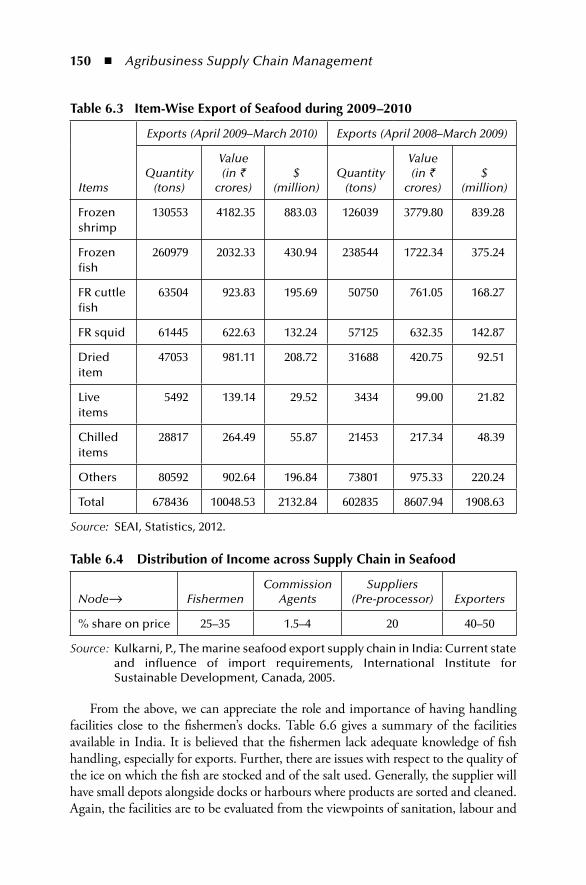
150 ◾ Agribusiness Supply Chain Management
From the above, we can appreciate the role and importance of having handling facilities close to the fishermen’s docks. Table 6.6 gives a summary of the facilities available in India. It is believed that the fishermen lack adequate knowledge of fish handling, especially for exports. Further, there are issues with respect to the quality of the ice on which the fish are stocked and of the salt used. Generally, the supplier will have small depots alongside docks or harbours where products are sorted and cleaned. Again, the facilities are to be evaluated from the viewpoints of sanitation, labour and
table 6.3 item-Wise export of Seafood during 2009–2010
Items
Exports (April 2009–March 2010) Exports (April 2008–March 2009)
Quantity (tons)
Value (in `
crores)$
(million)Quantity
(tons)
Value (in `
crores)$
(million)
Frozen shrimp
130553 4182.35 883.03 126039 3779.80 839.28
Frozen fish
260979 2032.33 430.94 238544 1722.34 375.24
FR cuttle fish
63504 923.83 195.69 50750 761.05 168.27
FR squid 61445 622.63 132.24 57125 632.35 142.87
Dried item
47053 981.11 208.72 31688 420.75 92.51
Live items
5492 139.14 29.52 3434 99.00 21.82
Chilled items
28817 264.49 55.87 21453 217.34 48.39
Others 80592 902.64 196.84 73801 975.33 220.24
Total 678436 10048.53 2132.84 602835 8607.94 1908.63
Source: SEAI, Statistics, 2012.
table 6.4 Distribution of income across Supply Chain in Seafood
Node→ FishermenCommission
AgentsSuppliers
(Pre-processor) Exporters
% share on price 25–35 1.5–4 20 40–50
Source: Kulkarni, P., The marine seafood export supply chain in India: Current state and influence of import requirements, International Institute for Sustainable Development, Canada, 2005.
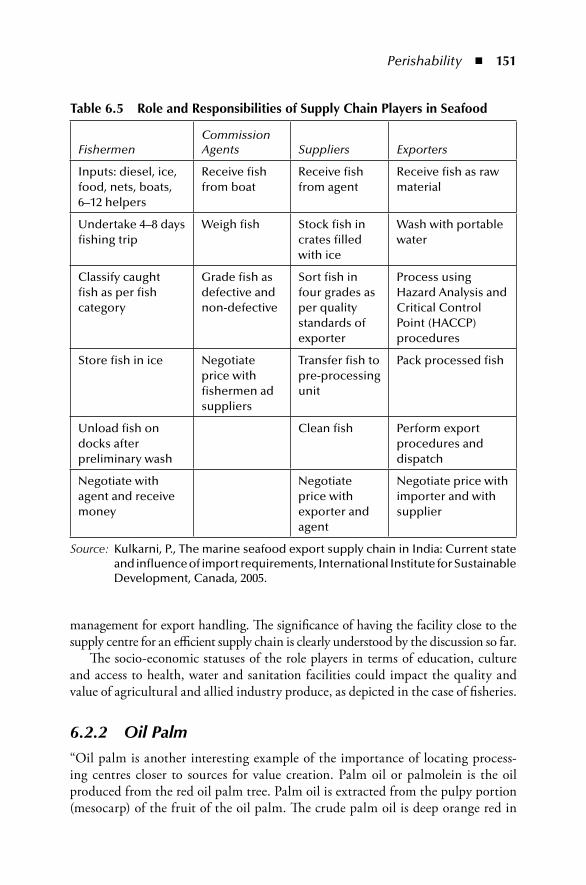
Perishability ◾ 151
management for export handling. The significance of having the facility close to the supply centre for an efficient supply chain is clearly understood by the discussion so far.
The socio-economic statuses of the role players in terms of education, culture and access to health, water and sanitation facilities could impact the quality and value of agricultural and allied industry produce, as depicted in the case of fisheries.
6.2.2 Oil Palm“Oil palm is another interesting example of the importance of locating process-ing centres closer to sources for value creation. Palm oil or palmolein is the oil produced from the red oil palm tree. Palm oil is extracted from the pulpy portion (mesocarp) of the fruit of the oil palm. The crude palm oil is deep orange red in
table 6.5 role and responsibilities of Supply Chain players in Seafood
FishermenCommission Agents Suppliers Exporters
Inputs: diesel, ice, food, nets, boats, 6–12 helpers
Receive fish from boat
Receive fish from agent
Receive fish as raw material
Undertake 4–8 days fishing trip
Weigh fish Stock fish in crates filled with ice
Wash with portable water
Classify caught fish as per fish category
Grade fish as defective and non-defective
Sort fish in four grades as per quality standards of exporter
Process using Hazard Analysis and Critical Control Point (HACCP) procedures
Store fish in ice Negotiate price with fishermen ad suppliers
Transfer fish to pre-processing unit
Pack processed fish
Unload fish on docks after preliminary wash
Clean fish Perform export procedures and dispatch
Negotiate with agent and receive money
Negotiate price with exporter and agent
Negotiate price with importer and with supplier
Source: Kulkarni, P., The marine seafood export supply chain in India: Current state and influence of import requirements, International Institute for Sustainable Development, Canada, 2005.
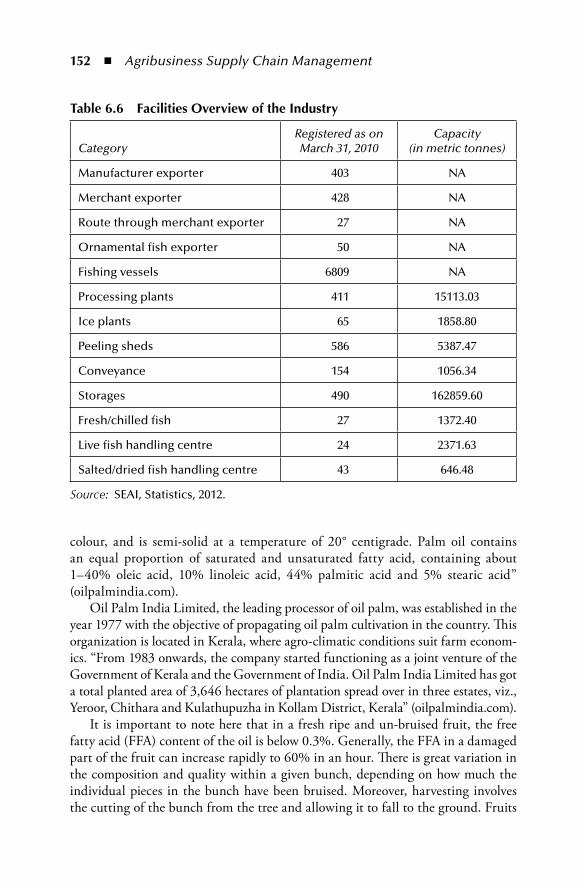
152 ◾ Agribusiness Supply Chain Management
colour, and is semi-solid at a temperature of 20° centigrade. Palm oil contains an equal proportion of saturated and unsaturated fatty acid, containing about 1–40% oleic acid, 10% linoleic acid, 44% palmitic acid and 5% stearic acid” (oilpalmindia.com).
Oil Palm India Limited, the leading processor of oil palm, was established in the year 1977 with the objective of propagating oil palm cultivation in the country. This organization is located in Kerala, where agro-climatic conditions suit farm econom-ics. “From 1983 onwards, the company started functioning as a joint venture of the Government of Kerala and the Government of India. Oil Palm India Limited has got a total planted area of 3,646 hectares of plantation spread over in three estates, viz., Yeroor, Chithara and Kulathupuzha in Kollam District, Kerala” (oilpalmindia.com).
It is important to note here that in a fresh ripe and un-bruised fruit, the free fatty acid (FFA) content of the oil is below 0.3%. Generally, the FFA in a damaged part of the fruit can increase rapidly to 60% in an hour. There is great variation in the composition and quality within a given bunch, depending on how much the individual pieces in the bunch have been bruised. Moreover, harvesting involves the cutting of the bunch from the tree and allowing it to fall to the ground. Fruits
table 6.6 Facilities overview of the industry
CategoryRegistered as on March 31, 2010
Capacity (in metric tonnes)
Manufacturer exporter 403 NA
Merchant exporter 428 NA
Route through merchant exporter 27 NA
Ornamental fish exporter 50 NA
Fishing vessels 6809 NA
Processing plants 411 15113.03
Ice plants 65 1858.80
Peeling sheds 586 5387.47
Conveyance 154 1056.34
Storages 490 162859.60
Fresh/chilled fish 27 1372.40
Live fish handling centre 24 2371.63
Salted/dried fish handling centre 43 646.48
Source: SEAI, Statistics, 2012.
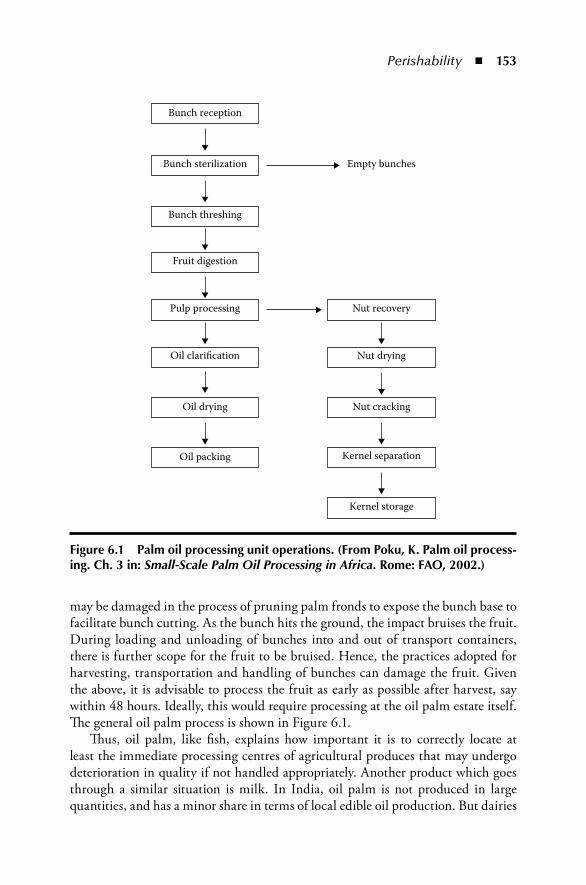
Perishability ◾ 153
may be damaged in the process of pruning palm fronds to expose the bunch base to facilitate bunch cutting. As the bunch hits the ground, the impact bruises the fruit. During loading and unloading of bunches into and out of transport containers, there is further scope for the fruit to be bruised. Hence, the practices adopted for harvesting, transportation and handling of bunches can damage the fruit. Given the above, it is advisable to process the fruit as early as possible after harvest, say within 48 hours. Ideally, this would require processing at the oil palm estate itself. The general oil palm process is shown in Figure 6.1.
Thus, oil palm, like fish, explains how important it is to correctly locate at least the immediate processing centres of agricultural produces that may undergo deterioration in quality if not handled appropriately. Another product which goes through a similar situation is milk. In India, oil palm is not produced in large quantities, and has a minor share in terms of local edible oil production. But dairies
Bunch reception
Bunch sterilization
Bunch threshing
Fruit digestion
Pulp processing Nut recovery
Empty bunches
Nut cracking
Kernel separation
Kernel storage
Oil clari�cation
Oil drying
Oil packing
Nut drying
Figure 6.1 palm oil processing unit operations. (From poku, K. palm oil process-ing. Ch. 3 in: Small-Scale Palm Oil Processing in Africa. rome: FAo, 2002.)
154 ◾ Agribusiness Supply Chain Management
are better distributed in most parts of rural India (except in Eastern India), which may not otherwise be well connected. Let us see how the perishable nature of the product is better handled with facilities support.
6.2.3 DairyIndia is one of the top-ranking countries in milk production. The milk production of India is about 13% of the world’s total milk production. The top five milk pro-ducing countries are India, the United States, Russia, Germany and France.
Milk production went up from 55.7 million tonnes in 1991–1992 to 121.8 million tonnes by 2010–2011, with a compound annual growth rate of about 4.2%. It may be interesting to note that the per capita consumption of milk has gone up to 281 g per day, which is still low compared to international standards, as shown in Table 6.7 and Figure 6.2. Further, with the growth in population, demand for milk is growing. Another issue is with respect to surplus milk, which is being marketed for consumption within the population.
As per popular belief, only 50%–60% of milk produced is available for distri-bution in the markets. Of this, a large portion of milk is sold through the unorga-nized sector. Of the milk distributed through the organized sector, more than 80% is sold as bulk milk. This really complicates handling, and we need to understand the process of milk movement to the markets from the farmers.
From Figure 6.3 on milk distribution, we can see farmers providing milk at the collection centres almost twice a day. As mentioned earlier, though India is the larg-est milk producer in the world, only 20% of its milk production is processed and moves through the organized sector. The remaining 80% of the total production is still distributed in the unorganized sector. In order to boost their milk procure-ment, many cooperative dairies and private sector have set up societies or collection centres in the rural areas.
“The traditional system of milk collection in the dairy cooperative societies mainly used volume to measure milk accepted, carried out fat testing using the Gerber method and entered the fat and SNF data manually in registers. Quite often, this approach did not receive adequate confidence from farmers. In order to avoid such issues, a unique system to automate milk procurement operations of village milk cooperative societies was developed. The Automatic Milk Collection Station is an integrated unit that combines different functions of a milk collection centre, such as measuring the weight and fat content, and providing the price output of the milk collected at the centre. The equipment also helps the milk cooperatives/milk collection centres to maintain operational data on milk supplied, amounts payable based on fat content, and so on. The system comprised of an electronic milk weigh-ing unit, an electronic milk tester and a data processing unit. At this point, the local facilities of collection centres play a significant role” (NABARD, 2011).
From here, trucks on a milk run collect the milk and carry it either to chilling centres or to processing plants, depending upon the volume and coverage of the
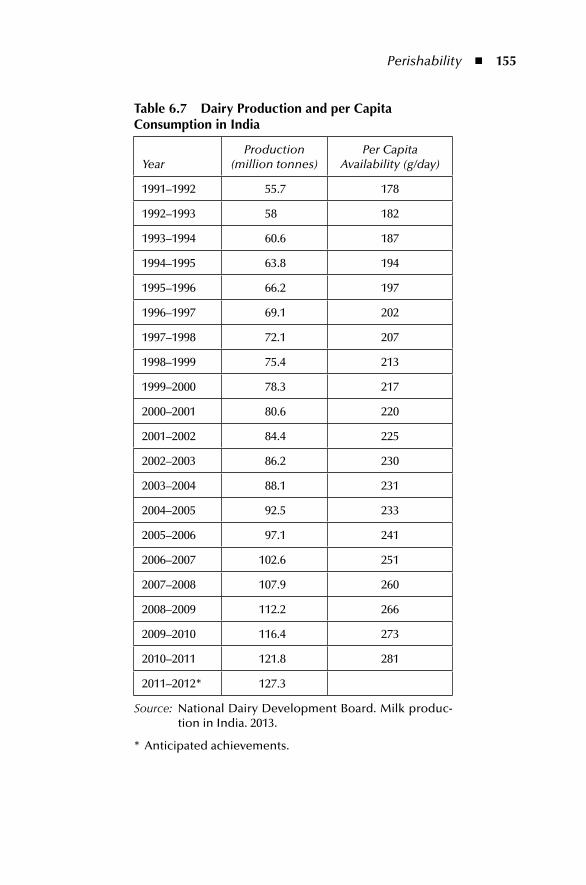
Perishability ◾ 155
table 6.7 Dairy production and per Capita Consumption in india
YearProduction
(million tonnes)Per Capita
Availability (g/day)
1991–1992 55.7 178
1992–1993 58 182
1993–1994 60.6 187
1994–1995 63.8 194
1995–1996 66.2 197
1996–1997 69.1 202
1997–1998 72.1 207
1998–1999 75.4 213
1999–2000 78.3 217
2000–2001 80.6 220
2001–2002 84.4 225
2002–2003 86.2 230
2003–2004 88.1 231
2004–2005 92.5 233
2005–2006 97.1 241
2006–2007 102.6 251
2007–2008 107.9 260
2008–2009 112.2 266
2009–2010 116.4 273
2010–2011 121.8 281
2011–2012* 127.3
Source: National Dairy Development Board. Milk produc-tion in India. 2013.
* Anticipated achievements.
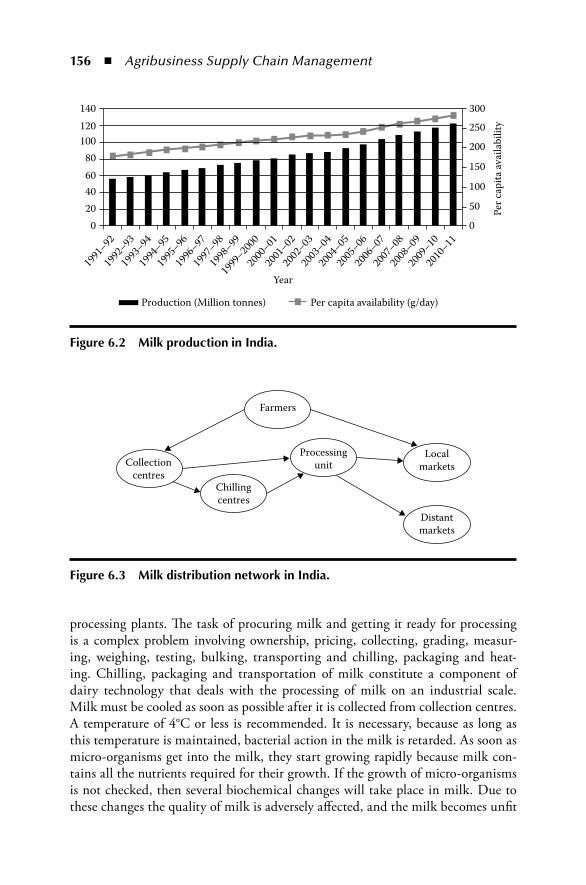
156 ◾ Agribusiness Supply Chain Management
processing plants. The task of procuring milk and getting it ready for processing is a complex problem involving ownership, pricing, collecting, grading, measur-ing, weighing, testing, bulking, transporting and chilling, packaging and heat-ing. Chilling, packaging and transportation of milk constitute a component of dairy technology that deals with the processing of milk on an industrial scale. Milk must be cooled as soon as possible after it is collected from collection centres. A temperature of 4°C or less is recommended. It is necessary, because as long as this temperature is maintained, bacterial action in the milk is retarded. As soon as micro-organisms get into the milk, they start growing rapidly because milk con-tains all the nutrients required for their growth. If the growth of micro-organisms is not checked, then several biochemical changes will take place in milk. Due to these changes the quality of milk is adversely affected, and the milk becomes unfit
1991
–9219
92–93
1993
–9419
94–95
1995
–9619
96–97
1997
–9819
98–99
1999
–2000
2000
–0120
01–02
2002
–0320
03–04
2004
–0520
05–06
2006
–0720
07–08
2008
–0920
09–10
2010
–11
140 300
250
200
150
Per c
apita
ava
ilabi
lity
100
50
0
120100
Production (Million tonnes) Per capita availability (g/day)
80604020
Year
0
Figure 6.2 milk production in india.
Collectioncentres
Farmers
Chillingcentres
Processingunit
Localmarkets
Distantmarkets
Figure 6.3 milk distribution network in india.
Perishability ◾ 157
for human consumption. Hence, in dairy products which are highly perishable in nature, collection centres and chilling centres play a significant role.
If there are more collection centres in a contiguous location, the transport vehi-cles would directly take the milk to a district level processing plant where the milk is processed using technology and then distributed. In India, some states such as Gujarat, Tamil Nadu, Karnataka and Andhra Pradesh are leaders in milk produc-tion and distribution, especially through cooperatives.
After discussing facilities close to farms/production centres for the fish, palm oil and dairy industries, we will highlight the situation prevailing in sugar manufacture.
6.2.4 Plantation White SugarGiven the characteristics of sugarcane, such as perishability and bulkiness, there is a need for shipping the sugarcane within a shorter time span; the longer the dura-tion, the less the sugar extract. The production of sugar depends on the quantity and quality of its raw material, sugarcane. Sugarcane is the raw material for jaggery and khandsarias well. Unlike in many other countries, sugarcane is the only source of sugar in India and hence any imbalance between demand and supply of sugar impacts the economics of sugarcane cultivation to a great extent. Sugarcane is cul-tivated in fertile agricultural lands that are developed virtually as satellite areas of sugarcane mills by both private companies and cooperative societies. According to the Sugarcane Control Act, the nearest sugar mill with whom a farmer registers his crop issues the cutting order for the fully grown cane, which is then transported by lorry, tractor or cart to that crushing mill. Since cane is a stem crop, some percentage of water content will be lost during transit. Thus, in order to benefit the farmers in terms of price per ton, weight loss is minimized by locating facili-ties near resource centres. This system also improves the production of sugar and other by-products, and helps the factories to achieve their goals. Crucially, as cane dries up, its sucrose content diminishes. Hence, plants must process cane within 48 hours of harvesting. In India, apart from logistics issues, involving transporta-tion and facilities, a larger concern is behavioural factors, as the farmers may resort to bunch planting, which impacts harvesting. This leads to unevenness in the day schedules of processing, unless they are coordinated very well by the focal firm, the sugar plant. Moreover, the issue of poor economics and the cyclical nature of the industry lead to problems wherein after years of abundant supply of cane, farmers tend to burn some portion of cane in their farms, leading to unhealthy agricultural economic practices. A more detailed discussion would be out of the scope of our discussion here, but may be useful to readers. In fact, sugarcane supply chains could be ideal examples of the woes of agribusiness in India.
Here, we reiterate that for the success of the sugar industry, facilities must be closer to the farm production centres, preferably in a centroid position, and operate efficiently, so that all players get good rewards.
158 ◾ Agribusiness Supply Chain Management
6.2.5 Other Perishable ProductsThere are a number of agricultural produce types such as fruits, vegetables, flowers, meats and poultry products, which require facilities near production centres. Most of the fruits and vegetables that are perishable in nature require washing, cleaning, sorting and grading even for sale in local and urban markets. In India, we are in the process of the creating necessary infrastructure for such activities. Efficiency in perishable supply chain can be achieved only when an efficient infrastructure is realized. A mature industry like the tea industry is able to keep improving because of quick and quality processing immediately after plucking. It is important that such developments occur in a much more aggressive manner to reduce losses of perishables at source or supply centres.
An efficient supply chain can increase surplus by reducing inefficiencies in produc-tion, processing, storage and transportation. It ensures that farmers get better prices, prompting them to invest more capital on the essential inputs, so that productivity increases. It expands market opportunities for products, and thus, helps in maintain-ing an ever increasing demand for them. Well-integrated supply chains stimulate the growth of agro-based industries, helping farmers to plan their production in advance, based on demand forecasts. Local decisions have a direct implication on the global (across players and processes) efficiency of an operation, and consequently, on its per-formance, despite the fact that they are primarily based on strategic factors.
The challenge for managing perishables is that goods value depreciates signifi-cantly with time taken in the supply chains, as they are extremely dependent on temperature and humidity. Taking dairy products as an example, raw milk received from farmers should be processed and treated within a few hours; this is because time-sensitive products may deteriorate without proper cold storage facilities. Shortening the distance between the source and the production point contributes to reduction of waste. Second, certain fruits and vegetables which face seasonal cus-tomer demand can be stocked utilizing optimum technology to reduce waste, thus enhancing profits. For perishable products, a decision about supply chain strategy involves a choice between responsiveness and efficiency. Proper management of facilities results in reducing wastage of resources, minimization of cost and maxi-mization of profit not only for the company, but also for the customer, who enjoys low prices on the final product.
6.3 Distribution and Value AdditionEffective management of a supply chain is all about getting the right product at the right time to the right place and in the right condition. This has never been a simple task, especially in case of supply chains dealing with perishable products. Regional distribution plays a significant role in the cost of goods, especially in the execution of processing of goods. To begin with, goods are received in bulk amounts and
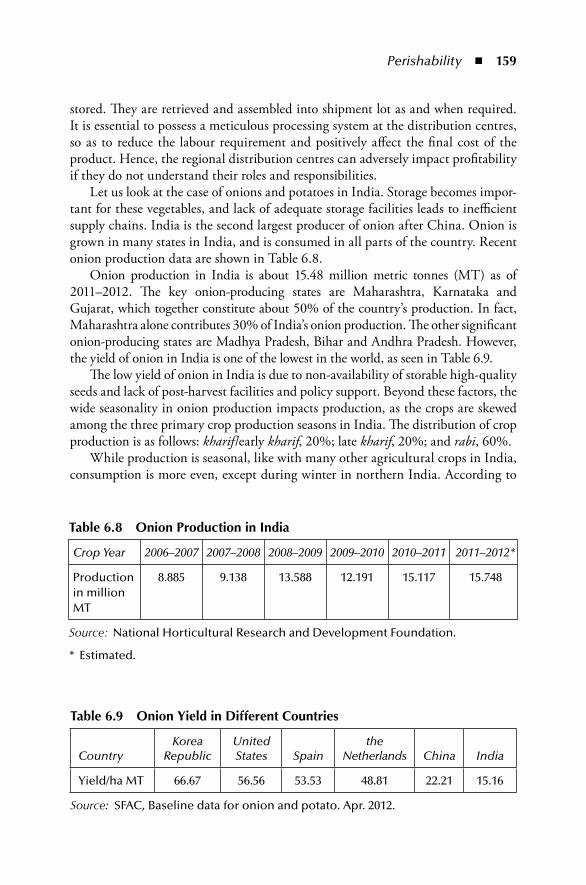
Perishability ◾ 159
stored. They are retrieved and assembled into shipment lot as and when required. It is essential to possess a meticulous processing system at the distribution centres, so as to reduce the labour requirement and positively affect the final cost of the product. Hence, the regional distribution centres can adversely impact profitability if they do not understand their roles and responsibilities.
Let us look at the case of onions and potatoes in India. Storage becomes impor-tant for these vegetables, and lack of adequate storage facilities leads to inefficient supply chains. India is the second largest producer of onion after China. Onion is grown in many states in India, and is consumed in all parts of the country. Recent onion production data are shown in Table 6.8.
Onion production in India is about 15.48 million metric tonnes (MT) as of 2011–2012. The key onion-producing states are Maharashtra, Karnataka and Gujarat, which together constitute about 50% of the country’s production. In fact, Maharashtra alone contributes 30% of India’s onion production. The other significant onion-producing states are Madhya Pradesh, Bihar and Andhra Pradesh. However, the yield of onion in India is one of the lowest in the world, as seen in Table 6.9.
The low yield of onion in India is due to non-availability of storable high-quality seeds and lack of post-harvest facilities and policy support. Beyond these factors, the wide seasonality in onion production impacts production, as the crops are skewed among the three primary crop production seasons in India. The distribution of crop production is as follows: kharif/early kharif, 20%; late kharif, 20%; and rabi, 60%.
While production is seasonal, like with many other agricultural crops in India, consumption is more even, except during winter in northern India. According to
table 6.8 onion production in india
Crop Year 2006–2007 2007–2008 2008–2009 2009–2010 2010–2011 2011–2012*
Production in million MT
8.885 9.138 13.588 12.191 15.117 15.748
Source: National Horticultural Research and Development Foundation.
* Estimated.
table 6.9 onion yield in Different Countries
CountryKorea
RepublicUnited States Spain
the Netherlands China India
Yield/ha MT 66.67 56.56 53.53 48.81 22.21 15.16
Source: SFAC, Baseline data for onion and potato. Apr. 2012.
160 ◾ Agribusiness Supply Chain Management
a report, total household consumption in 2011–2012 was about 9 million MT; indirect demand was about 3.50 million MT and exports accounted for about 2.00 million MT.
Cold storage of onions is not common in India. This is mainly because cold storage is prohibitively expensive, and the technical viability is also not clear. If we look at the high cost of cold storage, the ability to match demand and supply in the onion market becomes nearly impossible. Only low-cost and efficient storage can improve the economics of the onion market. Rabi crop onion needs to be stored between May and October for better economics for both farmers and consumers. Thus, the example of onions clearly establishes the case for intermediate storage, for managing of demand and supply mismatch.
Potato is another important crop in India, though per capita consumption is still low compared to many other countries in the world. Potato is cultivated in about 1.8 million hectares of land in India, and crop production is about 2 million MT. In India, Uttar Pradesh and West Bengal contribute to 50% of the production. Bihar, Punjab and Gujarat are the other states that contribute substantially to the output.
Again, potato is a rabi crop, with about 80% of output occurring during the period November to February. There is a huge seasonality in arrivals, and therefore in prices. During the post-harvest season, farmers stock up, as prices hit rock bot-tom as arrivals peak in February. In May, prices move up, to fall in August and September and move up again during early winter. Data on potato cold storage capacities and production in major states are shown in Table 6.10, which clearly shows a gap in the availability of facilities.
Due to this mismatch in production and storage, potato prices fall below the cost of production during the peak harvesting period but skyrocket during the lean season.
Apart from storage of goods, distribution centres perform value-added func-tions such as cleaning, grading, sorting, labelling and preserving the quality of the product against spoilage. In fact, distribution centres have evolved into essential hubs in supply chain networks, and have become a specialized professional area. Advancement of new processing technologies is essential for ensuring value addi-tion, particularly for perishables. Depending upon their temperament, some types of agricultural produce must be processed without delay, as otherwise, they will undergo a significant loss in quality and value.
6.4 processingProcessing refers to any activity that maintains or improves quality or modifies the physical characteristics of any material. A process can be as simple as cleaning vegetables or it can be as lengthy and complicated as making cheese. Various farm-house yields must be processed before they can be used as intended. Perishables, such as, for instance, most fruits and vegetables, are cleaned, graded and stored or
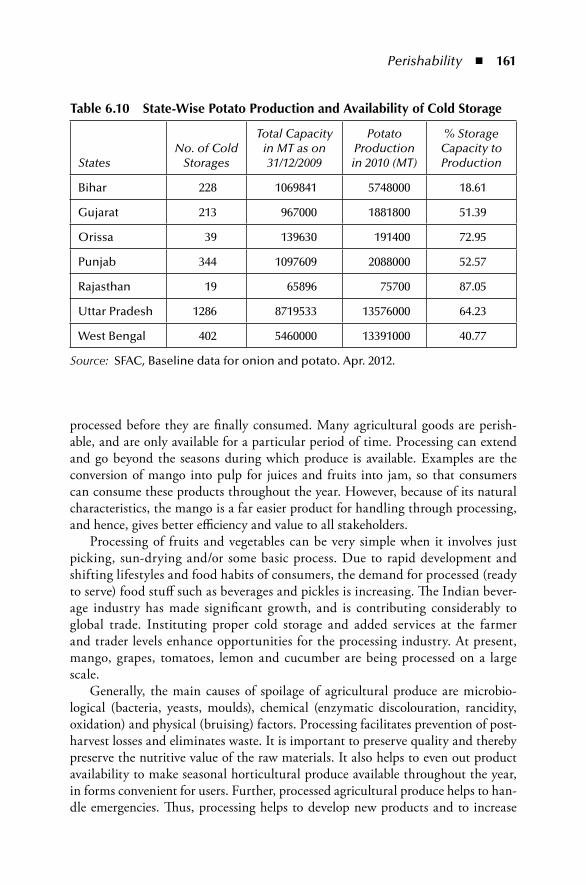
Perishability ◾ 161
processed before they are finally consumed. Many agricultural goods are perish-able, and are only available for a particular period of time. Processing can extend and go beyond the seasons during which produce is available. Examples are the conversion of mango into pulp for juices and fruits into jam, so that consumers can consume these products throughout the year. However, because of its natural characteristics, the mango is a far easier product for handling through processing, and hence, gives better efficiency and value to all stakeholders.
Processing of fruits and vegetables can be very simple when it involves just picking, sun-drying and/or some basic process. Due to rapid development and shifting lifestyles and food habits of consumers, the demand for processed (ready to serve) food stuff such as beverages and pickles is increasing. The Indian bever-age industry has made significant growth, and is contributing considerably to global trade. Instituting proper cold storage and added services at the farmer and trader levels enhance opportunities for the processing industry. At present, mango, grapes, tomatoes, lemon and cucumber are being processed on a large scale.
Generally, the main causes of spoilage of agricultural produce are microbio-logical (bacteria, yeasts, moulds), chemical (enzymatic discolouration, rancidity, oxidation) and physical (bruising) factors. Processing facilitates prevention of post-harvest losses and eliminates waste. It is important to preserve quality and thereby preserve the nutritive value of the raw materials. It also helps to even out product availability to make seasonal horticultural produce available throughout the year, in forms convenient for users. Further, processed agricultural produce helps to han-dle emergencies. Thus, processing helps to develop new products and to increase
table 6.10 State-Wise potato production and Availability of Cold Storage
StatesNo. of Cold
Storages
Total Capacity in MT as on 31/12/2009
Potato Production in 2010 (MT)
% Storage Capacity to Production
Bihar 228 1069841 5748000 18.61
Gujarat 213 967000 1881800 51.39
Orissa 39 139630 191400 72.95
Punjab 344 1097609 2088000 52.57
Rajasthan 19 65896 75700 87.05
Uttar Pradesh 1286 8719533 13576000 64.23
West Bengal 402 5460000 13391000 40.77
Source: SFAC, Baseline data for onion and potato. Apr. 2012.
162 ◾ Agribusiness Supply Chain Management
the value of the product. This is again a critical aspect of supply chain efficiency in agribusiness.
6.4.1 BenefitsThere are a number of benefits in processing agricultural produce. First, processing helps with storage of perishable and semi-perishable agricultural commodities. This facilitates the matching of demand and supply throughout the year. Second, apart from increasing availability of seasonal products in all seasons, it helps avoid gluts in the market that would otherwise lead to price volatility and wastages. Further, it helps in designing marketing and distribution channels so that products can penetrate markets effectively. More important, processing enables transportation of delicate perishable foods across long distances. Food processing can also help create nutritional and food security, especially in case of exigencies and disrup-tions in supply chain. Finally, in India, processing provides potential for exports, which fetch foreign exchange, as processed agricultural produce is exported in large volumes.
6.4.2 Products in IndiaFruits and vegetables are processed as jam, jelly and marmalade and preserved by concentrating fruits to nearly 70% solids (Total Soluble Solids, TSS), with addition of sugar and heat treatment. The preparation of jam requires several unit opera-tions, viz., selection of fruit, preparation of fruit, addition of sugar, permitted pre-servatives, mixing, cooking, filling, closing, cooling and storage. This is not very popular with a large segment in India, especially among the rural populations and poor and middle-income groups. A large volume of processing happens in cottage, micro and small-scale industries.
Another product, called chutney, is a mixture of fruits or vegetables with spices, salt and/or sugar, vinegar and other flavours or preservatives. Most popu-lar chutneys are those from tomato and mango, among many others. Similarly, sauces are prepared from tomato, papaya and a few other fruits. Vinegar, salt, sugar and spices are the common preservatives used for the preservation of these products. A large volume of processing happens in cottage, micro and small-scale industries.
Fruit juices are preserved in different forms, such as pure juices and bever-ages. Fruit beverages can be classified into two groups: unfermented beverages and fermented fruit juices. Fruit juices that do not undergo alcoholic fermentation are termed as unfermented beverages. They include natural and sweetened juices, ready-to-serve beverage, nectar, cordial, squash, crush, syrup, fruit juice concen-trate and fruit juice powder. These beverages can be distinguished on the basis of the differences in TSS content and minimum juice percentage. On the other hand, fermented beverages are fruit juices that have undergone alcoholic fermentation by
Perishability ◾ 163
yeasts and lactic fermentation by bacteria. They include wine, champagne, port, sherry and cider.
Other kinds of processing of fruits and vegetables include chemical processing, preparation of pickles and drying of products. Again, a large volume of processing happens in cottage, micro and small-scale industries. Except for a few dominant players, a large proportion of the market is being served by fragmented small players.
6.5 Direct marketing through Wholesale marketsThe most important concern whenever a product is carried is to decide on the type of distribution networks that have to be used, and whether a direct channel (direct to customer) or an indirect channel (customer through a channel intermediary) is preferable. Choosing the right distribution channel for perishables in agribusiness is critical, as time plays a crucial role. “The type of intermediary channel is highly dependent on the target customers. Wholesaling comprise all the activities involved in selling goods to those who purchase for resale or for commercial purpose. The main function of the wholesale distributor is to balance supplies against retail requirements and to take the initiative of bringing produce from areas where it is plentiful and cheap to those where it is relatively scarce and expensive. Wholesalers usually have a good understanding of the market, with access to first-hand market information. Wholesalers generally go directly to the producers/farmers. In some cases, they get produce from central wholesale markets, agents, collectors and local markets. Many wholesalers have their own storage space facilities. Wholesale dis-tributors may engage specialized transport agencies to conduct their collection and distribution activities” (www.ruralfinance.org).
To provide a quick understanding of wholesale market operations in perishables in India, an example of a wholesale market operating at Chennai is discussed in Exhibit 6.1.
Exhibit 6.1 Koyambedu Perishables Market in Chennai
The vegetables, fruits and flower market, called the Koyambedu market, is located at a prominent part of the Chennai city. Koyambedu market serves as the centralized distribution cen-tre for perishable such as flowers, greens and vegetables, and for fruits of both inland and imported origin. Established by the State Government of Tamil Nadu under the jurisdiction of the Chennai Metropolitan Development Authority (CMDA), Koyambedu market is located within the Chennai city lim-its, with adequate road connections and proximity to the
164 ◾ Agribusiness Supply Chain Management
government-operated long distance (Chennai to other cities) bus terminal and private bus terminals. This makes transporta-tion easy without causing disturbance to the city traffic, as the market is accessible through bypass roads.
The entire market premises are divided into three blocks:
1. The vegetable section, known as the “Periyar Vegetable Market”
2. The fruits section, known as the “Anna Fruits Market” 3. The flower section.
In each block, shops occupying space of various sizes were allotted and sold to wholesale merchants, dealers and commis-sion agents by the CMDA of Chennai. A cold storage facility is pro-vided by Tamil Nadu Cooperative Marketing Federation Limited (TANFED) (State Government of Tamil Nadu operated cold stor-age depot) within the market premises for merchants and dealers and also the general public. All common amenities are available for merchants/dealers and the public within the premises.
There is sufficient space provided in the market premises for movement of transportation vehicles carrying goods in and out of the market, with adequate parking facilities. Most of the perishable goods arrive at the market at night by truck, and are parked at one end, adjacent to the Periyar Vegetable Market.
As per the association’s market guidelines, traders in the fruit market can trade only on fruits of any variety, and similarly, the vegetable traders and merchants can trade only in vegetables. Similar guidelines are applicable to the flower traders.
Supply/procurement: Vegetables are procured and also supplied to various places in Tamil Nadu, Kerala, Karnataka, Andhra Pradesh, Maharashtra, Gujarat and New Delhi. Fresh garlic is imported from China, while cinnamon is imported from Sri Lanka. Fresh vegetables are also exported to Singapore, Malaysia and Canada by some of exporters who operate at Koyambedu. Small and large retailers and members of the pub-lic who plan to purchase large volumes of vegetables and fruits for family functions or other occasions visit the market for pro-curing their needs.
Fruits are procured from and supplied to various places in Tamil Nadu, Karnataka, Andhra Pradesh, Maharashtra, Himachal Pradesh and New Delhi. Apples are imported from the United States, Austria and Australia. Mangoes are exported to Singapore, Malaysia, Sri Lanka, Mauritius and Dubai. All exports of fruits and vegetables are made through air freight.
Perishability ◾ 165
Exporters of vegetable and fruits arrange to collect them at the market, get them packed at the market premises and then move the packed commodities to air cargo handlers for export. Commission agents and contract labourers provide the services of handling, packing, unloading and loading of bags, boxes and baskets of fruits and vegetables for transporting to various local markets as well as for export purposes.
Transportation and Handling: Fruits imported in 20- to 40-feet containers are brought to the fruit market after customs clearance and are stored in the cold storage at the first floor of the middle block in the fruit market. Fruits and vegetables procured from various states arrive at the market late at night by trucks, mini lorries and vans. Transport vehicles with the fresh vegetables that arrive by night halt in the parking area. The arrival of the transport vehicles is intimated to the contract merchant through phone by the driver of the vehicle, trader or any other seller’s representative, who accompanied the goods in the vehicles. The vegetables and fruits are handled by the unorganized and contracted labourers available in and around the market premises. Handling, packing and marking of the consignments for exports are undertaken by organized labour-ers of commission agents at the market for exporters who do not belong to the market association. Exporters within the mar-ket association make their own arrangements. Retailers make their own arrangements collectively for procuring their needs and transporting them to their destination by pre-arranged mini-vans, vehicles, autos or any other convenient form of transport; usually, several retailers along one route share the transportation costs.
Storage and Warehousing: There are two cold storage facili-ties maintained at the premises of the Koyambedu Market. One is situated at the Anna Fruit Market and is meant exclusively for storage of fruits. The other, next to the Periyar Vegetable Market, is run by TANFED for vegetables, fruits or any other commodities, and even members of the public can make use of the facility as long as they pay the specified storage rates.
Distribution: The Koyambedu Market at Chennai functions as the largest distribution centre for vegetables, fruits and flow-ers in Tamil Nadu. Vegetables, fruits and flowers are supplied and brought to the market by wholesale dealers and commis-sion agents from large farmers and growers at various places in several states. Wholesale traders and merchants, directly or indirectly through their representatives, as well as export-ers of vegetables, fruits or flowers, small and large retailers
166 ◾ Agribusiness Supply Chain Management
and individual customers visit the market every day looking for better deals.
The distribution and sale transactions begin early in the morning, at about 3 a.m. The peak time, when the most wholesale transactions and distribution activities take place, is between 3 and 8 a.m. every day. Thereafter, retail sales con-tinue till 6 p.m. All transactions are closed with cash on the spot. In a couple of cases, balance amounts and short pay-ments are accepted by the Koyambedu merchants for retail customers who are regular and trusted by the traders.
Pricing: Prices per unit/unit weight for vegetables are fixed by group of merchants on competitive methods based on the freshness of goods and information collected by the represen-tative of the traders and merchants of the Koyambedu Market from the transport drivers and representatives of the commis-sion agents who arrived with the trucks during the preceding night. The higher the quantities that have been brought in, the lower the unit prices fixed. Conversely, the lesser the quanti-ties that arrived, the higher are the unit prices fixed. For fresh vegetables, a higher unit price is fixed. Vegetables and fruits that arrived in trucks should be sold only to the traders and merchants of the Koyambedu Market, and not to any person who does not own a shop in the market. The entire wholesale transactions and distributions end by 8 a.m. every day. During the distribution, if demand for particular vegetables is higher and the available quantities are noticed to be inadequate, the sale prices per unit/unit weight of particular vegetables are raised, sometime even doubled, during the later hours of the distribution activities. Correspondingly, the prices per unit/unit weight of the vegetable sold to retailers also vary based on the quantities, that is, the larger the quantity, the lesser the unit price.
Competitive Markets in Chennai: Similar vegetable mar-kets are located at T. Nagar, Mylapore and Kothawal Chawadi. The markets at T. Nagar and Mylapore receive their supplies of vegetables every day from places and rural areas immediately outside Chennai and in neighbouring districts. Fresh vegetable are available in the afternoon and evening vegetable markets of T. Nagar, Mylapore and Kothawal Chawadi. For the most part, the fresh vegetable from the T. Nagar market are supplied to Kothawal Chawadi and other places. The T. Nagar market is located close to the Mambalam Railway Station, and a large number of working-class employees, who commute by local trains, buy vegetables from the T. Nagar market. However,
Perishability ◾ 167
these markets are very small, and can be treated more as retail vegetable shops serving direct individual customers.
A substantial quantity of fruits and vegetables in India is wasted due to poor infrastructure, especially in terms of poor development of wholesale markets, improper handling and lack of sensitivity to pricing at sourcing points and at markets catering to final customers. Generally, there is high information inefficiency in terms of availability at source and at market, and in terms of demand patterns. There are too many intermediar-ies, leading to market inefficiencies and wastages. Government initiatives like the Koyambedu Market provide the necessary infrastructure and cooperative framework to improve supply chain operations.
Source: Chandrasekaran, N., Supply Chain Management, New Delhi: Oxford University Press, 2010. With permission.
The roles of wholesalers in the distribution of perishables are adequately explained by the above examples. There are a number of such initiatives operating in most of the cities, including metros, urban and semi-urban centres in India, supported by local governments. Even in rural areas, there is a practice of having a weekly day market wherein players sell both in wholesale and retail for the benefit of the players in the supply chain. Thus, wholesale distributors are significant links in perishables supply chains in India.
6.6 intermediariesThere are several players and intermediaries, such as farmers, dealers, carriers and retailers, involved in satisfying the needs of consumers in the supply chains for perishables. Many agri producers do not have the economic resources and exper-tise required for direct distribution. Producers usually harvest a large quantity of a particular variety of goods. On the other hand, consumers generally need only a limited quantity of a wide variety of goods. Intermediaries act as important links between producers and consumers by bridging the gap between production and consumption and creating place, time and possession utilities.
Supply chain management in perishables has to be improved at all the stages of the supply chain by implementing worldwide best practices in storage, packaging, handling, transportation, value-added services, and so on, with a view to benefit-ing both farmers and intermediaries as well as ultimate consumers. Ease of access to markets is a significant factor. The transport facilities that are available to the market
168 ◾ Agribusiness Supply Chain Management
remain a key issue. The role of intermediaries has become important due to the ever-spreading markets and the increasing intricacies of distribution. A channel of distribution performs the work of moving goods and services from producers to consumers. It fills the place, time and possession gaps, and connects producers and con sumers.
There are interventions at times to reduce aberrations in prices, which could be seasonal. In India, there are cooperatives and government bodies that facilitate these interventions. Exhibit 6.2 cites one such practice initiated in Kerala.
Exhibit 6.2 Market Intervention Was Strong at Kerala during the Festive Season
Market interventions and increased supplies dampened the price run of vegetables and bananas during the Onam festive season. Officials at the Vegetable and Fruit Promotion Council Keralam said that market intervention was strong ahead of Onam with Big Bazaars being opened in all the major cities early June onwards. The Kerala State Horticultural Products Development Corporation has two special outlets in each of the districts for the Onam season. These outlets have increased local procurement and have done away with middlemen to improve returns for the farmers and to ensure sales at reason-able rates to the buyers.
The major reason for the softening vegetable market during Onam season was intervention by government agencies. There has been a reported four-fold increase in procurement of veg-etables and bananas from districts such as Wayanad, Palakkad, Idukki, Ernakulam and Thiruvananthapuram.
Horticorp procured 800 tonnes of vegetables directly from farmers and another 1,650 tonnes from the six wholesale mar-kets across the state.
Source: The Hindu, Aug. 28, 2012.
6.7 WastageIndia is endowed with good agro-climatic conditions and a skilled labour force for the cultivation of a wide variety of fruits and vegetables. It has the distinction of being the second largest fruits and vegetables producer in the world. However, there is massive waste during the post-harvest storage, transportation and han-dling stages due to power interruptions, lack of temperature control mechanisms,
Perishability ◾ 169
inadequate infrastructure and lack of cold store facilities for preserving the produce. Wastage is one of the primary reasons for loss occurring in the sup-ply chain of any perishable good. Waste occurring within the supply chain of a product results in increased costs and reduced efficiency for the business. For example, wastage on account of pest infestation is significant—if not more, defi-nitely on par with loss during transportation. Similarly, wastages occur because of improper temperatures during storage and transportation, arising out of an unreliable power situation. It is not uncommon to see freezers switched off to save power; generally, the backups provided are insufficient to run freezers during periods of power blackout. Hence, businesses are continuously on the lookout for options and techniques to reduce wastage during the various activities in the supply chain, such as transportation and storage. Wastage at source is also an increasing concern.
6.7.1 SourceMinimizing wastage in an agri-based supply chain gains more importance, since the items produced are perishable and damaged easily. To get the appropriate and required quantity of output in terms of the number of units of weight or volume of vegetables, fruits or milk sold in the market, it becomes essential to reduce wastage and preserve as much as possible.
Many agricultural products such as vegetables, fruits and grains get damaged or destroyed at the source itself. This could happen due to causes arising while the items are yet to be readied for transportation, or during the time of loading on to trucks or vans for transportation to godowns, retailers or to the markets. Such loss of goods at the source causes loss of income to the cultivator as well as his buyers. When a huge loss occurs at the source, which in most cases is the first stage in the supply chain, it drastically reduces the quantity of goods that ultimately reaches the markets. This could lead to shortage of these goods and a subsequent hike in their prices at the end stages of the supply chain. This increase in price often affects the inflation levels in the country.
6.7.2 StorageThe piling up of inventory in godowns is yet another form of wastage, more so in the case of perishable goods. The resources lie unused and often rot away, or are destroyed by moisture, vermin, fungus or other factors. There are reports that huge piles of wheat and other grain stocks lie unused in government and private godowns. Exhibit 6.3 mentions risky storage practices by the government agencies. However, FCI maintains that wastes are less than 0.001% (Kumar, 2011). Lack of proper facilities for storage, such as moisture-free zones for grains, and cooling facilities for dairy and meat products, together with frequent power outages, result in the perishable goods getting damaged.
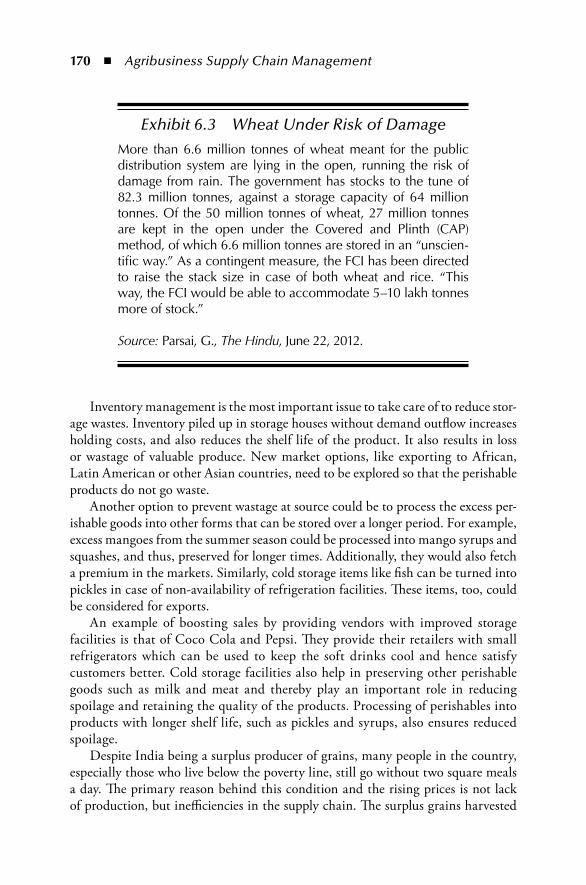
170 ◾ Agribusiness Supply Chain Management
Exhibit 6.3 Wheat Under Risk of Damage
More than 6.6 million tonnes of wheat meant for the public distribution system are lying in the open, running the risk of damage from rain. The government has stocks to the tune of 82.3 million tonnes, against a storage capacity of 64 million tonnes. Of the 50 million tonnes of wheat, 27 million tonnes are kept in the open under the Covered and Plinth (CAP) method, of which 6.6 million tonnes are stored in an “unscien-tific way.” As a contingent measure, the FCI has been directed to raise the stack size in case of both wheat and rice. “This way, the FCI would be able to accommodate 5–10 lakh tonnes more of stock.”
Source: Parsai, G., The Hindu, June 22, 2012.
Inventory management is the most important issue to take care of to reduce stor-age wastes. Inventory piled up in storage houses without demand outflow increases holding costs, and also reduces the shelf life of the product. It also results in loss or wastage of valuable produce. New market options, like exporting to African, Latin American or other Asian countries, need to be explored so that the perishable products do not go waste.
Another option to prevent wastage at source could be to process the excess per-ishable goods into other forms that can be stored over a longer period. For example, excess mangoes from the summer season could be processed into mango syrups and squashes, and thus, preserved for longer times. Additionally, they would also fetch a premium in the markets. Similarly, cold storage items like fish can be turned into pickles in case of non-availability of refrigeration facilities. These items, too, could be considered for exports.
An example of boosting sales by providing vendors with improved storage facilities is that of Coco Cola and Pepsi. They provide their retailers with small refrigerators which can be used to keep the soft drinks cool and hence satisfy customers better. Cold storage facilities also help in preserving other perishable goods such as milk and meat and thereby play an important role in reducing spoilage and retaining the quality of the products. Processing of perishables into products with longer shelf life, such as pickles and syrups, also ensures reduced spoilage.
Despite India being a surplus producer of grains, many people in the country, especially those who live below the poverty line, still go without two square meals a day. The primary reason behind this condition and the rising prices is not lack of production, but inefficiencies in the supply chain. The surplus grains harvested
Perishability ◾ 171
get wasted, as they are left to rot in the rains and be eaten by rats and rodents. Removing such inefficiencies can help eliminate hunger from India.
6.7.3 TransportationTransport of perishables starts early in the morning. A customer needs fresh veg-etables to start the day. Moving of garden-fresh goods all the way from the point of origin to the end consumer is often a challenge. An uninterrupted transport chain is thus essential.
Large quantities of goods are damaged or destroyed in transit. The lack of good roads and rail freight systems is one main reason for loss or damage of materials during transportation. Often, vehicles used for transportation are not refrigerated properly, mostly with the aim of cost cutting for the company concerned. But much more revenue is lost due to the amount of items wasted by this negligence.
Perishable goods, having very limited shelf lives, should be transported as soon as possible to the markets from their sources. This calls in for an efficient farm-to-retailer supply chain with minimal transport delays. Choosing the appropriate mode of transport is also essential to ensure the freshness and quick delivery of such perishables. Short transport times reduce costs and spoilage risks.
Emerging technologies and innovative cold chain management have ensured that spoilage during transportation of perishable goods can be minimized. The government needs to step in to help farmers to ensure safe delivery of their perish-able produce to the market, since transportation costs, especially with cold chains, can become almost out of reach.
By reducing wastage at source, storage and transportation of perishable goods can ensure better returns and customer satisfaction. The cost of cold chain opera-tion is the single most important factor that increases wastage, and India has lit-tle scope to overcome this drawback, considering the high energy costs and the inability to pass them on across the supply chain. However, any conscious effort to handle perishables prudently by segmenting markets on quality requirements and the ability to pay would bring in efficiency and improve overall supply chain profits. For example, one of the authors observed crates of fruits and vegetables going rot-ten in a day in a retail chain and getting dumped. Had there been focus on better deployment of efforts such as liquidation, product offering at appropriate point as juices or movement of products to lower strata by selling at a lower cost would have brought better results than zero recovery of cost.
6.8 Quality managementIn today’s business atmosphere, proper quality management is essential for per-ishables in agribusiness; everywhere, customers are not only demanding value for money but are also expecting the business community to demonstrate some concern
172 ◾ Agribusiness Supply Chain Management
for society at large. Consumers’ increasing concerns about food quality and safety, government laws and trade regulations have increased the nature and degree of responsibilities for producers all over the world. In developing countries and emerg-ing economies, however, companies face particular challenges in adapting to these changing requirements. Perishable goods demand the highest quality standards. A major share of the consumable goods market is comprised of food items: grains, bread, milk, meat, etc and so on. Hence, consumers demand the best quality and the freshest choice of products. There are also regulatory bodies that determine the market standards to be followed. “Agmark” is one of the premier quality standard indicators used in Indian markets. Further, in their roles as marketers and manu-facturers, the companies also have the moral and ethical responsibility to sell only quality products. The retailers, too, have to ensure that goods past their expiry date are taken off the shelf. Since the rate of spoilage among perishable goods is the highest, proper ambient conditions for storage should be maintained, to ensure that products do not get damaged before their due dates.
McDonald’s is a global fast food major that has perfected its supply chain sys-tem in India. Its supply chain involves procurement and transport of agri-based raw materials such as potatoes, tomatoes, lettuce leaves and milk and milk products. By procuring agri-products from farmers within India on a timely basis and using efficient transport systems that ensure temperature controls, McDonald’s ensures uniformity, freshness and quality in all its products. Quality checks at the various procurement points, good storage and inventory facilities and strong reporting and documentation practices have helped McDonald’s in building up a strong supply chain system. Clean and on-time delivery drives all members involved in the supply chain of this fast food major.
6.9 price managementPrice management includes planning, implementation and governance of pricing of the various goods produced by a company. It may involve continuous monitor-ing of prices, development of pricing techniques and determination and redefining of pricing strategies and tactics. Pricing strategies of perishable goods are dynamic in nature, and have to be monitored constantly and altered whenever necessary. Perishable goods have certain distinct characteristics, such as short sale cycles, low value of unsold goods and uncertain demand, which makes their pricing even more sensitive. Perishable items can include agricultural and related produce, dairy prod-ucts, fish, meat, flowers and others.
The use of dynamic pricing strategies helps to keep track of inventory and price changes. For example, the price of flowers is highest early in the day, then gradu-ally decreases through the day; flowers are sold at a pittance towards the evening as the flowers start to dry up and new stock comes in. In the same way, the prices of fruits and vegetables depend on quality. Thus, quality and freshness play a major
Perishability ◾ 173
role in the pricing of perishable goods. There is scope for using more supply chain analytics for dynamic pricing, and this aspect needs more efforts and focus by all stakeholders.
6.10 Supply and Demand Side risksMeeting customer needs at the right time, at the right place and at the right quantity and quality has always been a hectic job for marketers. This is all the more so for perishable goods that cannot be displayed on shelves for long periods. Sales of this nature of products cannot be deferred for even a few days. The mar-ket for fresh products is relatively higher than for processed variations in India. During certain periods, the consumption of certain crops will go down, and during festivals, specific crops face great demand. The success of supply chain management will depend on the actions taken to match demand and supply. However, even with the best efforts of a marketing manager performing to the best of his or her capabilities, success in this function can be obtained only with the support of an efficiently operating supply chain mechanism that the company must have in place.
Supply chain management plays a crucial role in ensuring timely delivery of goods to the right markets. There is always the fear of excess supply not matching up to demand expectations, with inventory piling up and goods going waste. On the other hand lies the reverse situation, that is, demand exceeding supply, causing revenue loss to the company and affecting its top line and bottom line. Accurate forecasting of demand and supply becomes even more essential if products have short life cycles, with the consequent inability to meet future demand with current inventory.
6.10.1 TypesMany different combinations of situations can arise when there is a demand and supply risk. Examples are situations where
1. expected demand exceeds the normal supply; 2. demand is not met due to lower than expected supply; 3. expected supply exceeds the normal demand; 4. higher than usual supply results in goods going unsold; and 5. mismatch between the required supply of goods and the demand.
The various challenges arising out of the different situations given above are discussed below.
Inflation: Inflation is one of the serious consequences of demand and supply side risks. Often, the demand for perishable goods such as vegetables and fruits goes up,
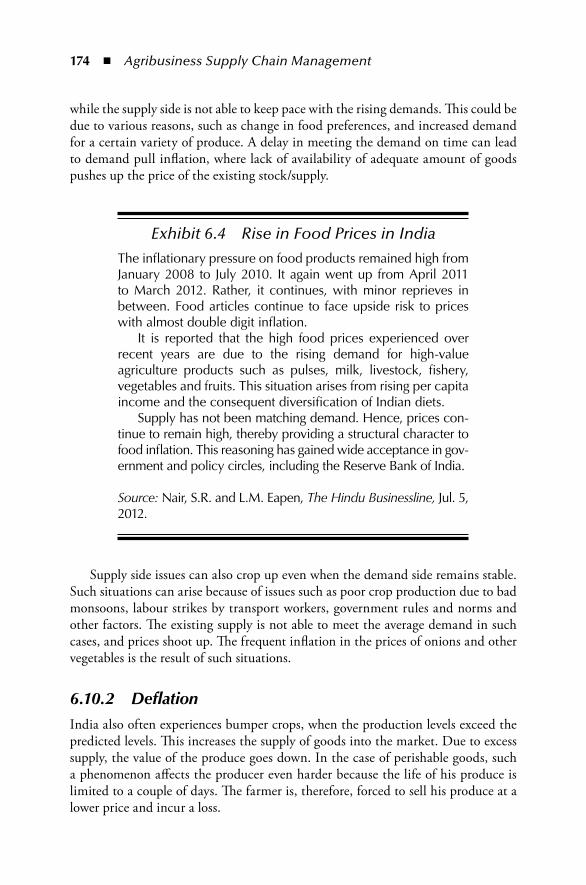
174 ◾ Agribusiness Supply Chain Management
while the supply side is not able to keep pace with the rising demands. This could be due to various reasons, such as change in food preferences, and increased demand for a certain variety of produce. A delay in meeting the demand on time can lead to demand pull inflation, where lack of availability of adequate amount of goods pushes up the price of the existing stock/supply.
Exhibit 6.4 Rise in Food Prices in India
The inflationary pressure on food products remained high from January 2008 to July 2010. It again went up from April 2011 to March 2012. Rather, it continues, with minor reprieves in between. Food articles continue to face upside risk to prices with almost double digit inflation.
It is reported that the high food prices experienced over recent years are due to the rising demand for high-value agriculture products such as pulses, milk, livestock, fishery, vegetables and fruits. This situation arises from rising per capita income and the consequent diversification of Indian diets.
Supply has not been matching demand. Hence, prices con-tinue to remain high, thereby providing a structural character to food inflation. This reasoning has gained wide acceptance in gov-ernment and policy circles, including the Reserve Bank of India.
Source: Nair, S.R. and L.M. Eapen, The Hindu Businessline, Jul. 5, 2012.
Supply side issues can also crop up even when the demand side remains stable. Such situations can arise because of issues such as poor crop production due to bad monsoons, labour strikes by transport workers, government rules and norms and other factors. The existing supply is not able to meet the average demand in such cases, and prices shoot up. The frequent inflation in the prices of onions and other vegetables is the result of such situations.
6.10.2 DeflationIndia also often experiences bumper crops, when the production levels exceed the predicted levels. This increases the supply of goods into the market. Due to excess supply, the value of the produce goes down. In the case of perishable goods, such a phenomenon affects the producer even harder because the life of his produce is limited to a couple of days. The farmer is, therefore, forced to sell his produce at a lower price and incur a loss.
Perishability ◾ 175
Storage issues: When supply volumes exceed predictions, they can also lead to storage problems. The capacities of the godowns would have been designed for the normal production quantities only. Excess crops often get wasted due to inadequate facilities, or are sold for very cheap prices.
6.10.3 Resource CrisisThere are often situations, much out of the control of producers and distributors, that affect the supply chain. For example, there has been alarming news about how the number of fish in the sea is getting depleted due to the heavy extent of fish-ing done over the past decades and the other commercial activities carried out in the seas. The fishing industry could get badly affected by such a resource crunch. Further, environmental norms might be instituted to protect these marine crea-tures. Such scarcity of resources can result in limited supply of fish to the market, leading to higher prices for these items. Further, government rules that come into force during certain seasons, like those banning trawling (as in states like Kerala), also lead to reduced catch and higher prices during those seasons.
Mismatch of supply and demand: Certain vegetables and fruits tend to follow the product life cycle of a fad. They are in high demand for a few weeks and then fade off. Such changes in food fashion and food fads can upset the supply arrangements and the market as a whole. The short-term popularity of certain vegetables or meat can lead to increased demand, which cannot be met easily by quick supplies. Such food fads result in the decreased consumption of other items, while the demand for the fad items skyrockets and markets are in no situation to meet this growing demand.
Reading the markets and predicting demand and supply trends accurately is a tough task, especially in the case of perishable goods that are generally fast moving. A single calculation error or slight disturbance in the system due to internal or external factors can cause an imbalance that can even hurt the whole economy.
A supply chain plays an important role in the success of any company, all the more so if it is an agri-based industry. Efficiency at all the points in the supply chain is essential to meet the ultimate goal of satisfying customers. Following best prac-tices in supply chains can help not just the corporate sector, but also government agencies and non-governmental organizations (NGOs), to meet the growing needs and expectations of millions of people around the world.
6.11 ConclusionSupply chain challenges in perishables are aplenty in India. There are tough demand side issues and equally daunting supply chain issues. The government and its agen-cies are fighting with regulatory mechanisms and support systems to ensure that there is food security and that the human development indices are not adversely
176 ◾ Agribusiness Supply Chain Management
affected because of supply chain challenges. A lot of these issues are structural in nature, and they arise more out of economic issues rather than the lack of under-standing or will. Taking this itself as a unique aspect, more supply chain profes-sionals must use analytics and fill in the gaps by using appropriate levers such as product conversion and pricing and information technology, rather than by focusing on storage and inventory issues.
referencesChandrasekaran, N., Supply Chain Management, New Delhi: Oxford University Press, 2010.The Hindu, Vegetable prices under control. Aug 28, 2012. http://www.thehindu.com/news/cit-
ies/Kochi/article3830941.ece (accessed on August 31, 2012)Kulkarni, P. The marine seafood export supply chain in India: Current state and influence
of import requirements, International Institute for Sustainable Development, Canada, 2005. http://www.iisd.org/tkn/pdf/tkn_marine_export_india.pdf
Kumar, C. Tribune rejoinder. Food Corporation of India, Aug. 4, 2011. http://fciweb.nic.in/app/webroot/upload/pressrelease/Tribune%20rejoinder.pdf
NABARD, Organized Agri-Food Retailing in India. Mumbai: NABARD, 2011.Nair, S.R. and L.M. Eapen, Food inflation not due to income. The Hindu Businessline, Jul. 5,
2012. http://www.thehindubusinessline.com/opinion/article3606405.eceNational Dairy Development Board. Milk production in India. 2013. http://www.nddb.org/
English/Statistics/Pages/Milk-Production.aspxNational Horticultural Research and Development Foundation. http://www.nhrdf.com/Parsai, G. 6.6 m. tonnes of wheat under open sky faces rain fury, admits Centre, The Hindu,
June 22, 2012. http://www.thehindu.com/news/national/article3555824.ecePoku, K. Palm oil processing. Chap. 3 in: Small-Scale Palm Oil Processing in Africa. Rome: FAO,
2002. http://www.fao.org/docrep/005/Y4355E/y4355e04.htmSeafood Exporters Association of India (SEAI), Statistics, 2012. http://seai.in/filecategory/
statisticsSmall Farmers’ Agribusiness Consortium (SFAC) Baseline data for onion and potato. Apr. 2012,
http://www.sfacindia.com/Docs/Onion%20&%20Potato%20Baseline%20Report.pdf
177
Chapter 7
Quality
7.1 introductionThe role of quality systems in the agriproduct sector has been gaining ever- increasing importance in recent years. During the early days, buyers and sellers met and bargained over their produce; there was not much requirement for stan-dardization because they knew each other very well, as they all mostly lived within a small region. However, today products are handled in huge volumes and move beyond borders. Hence, a well-regulated system of grading and quality is of the utmost importance to provide a common language for defining product values. Today, customers in various parts of the world demand certifiable evidence of trace-ability and more and more refined levels of quality in food and related products. With rising income levels and shifts in lifestyles, an increasing proportion of the populace depends on ready-to-eat meals. This has a significant effect on the role that agriculture would play in the future. Not only will it have to meet increasingly stringent food safety requirements and the need for adequate returns on invest-ment, but it should also ensure sustainable environmental norms in agriculture.
Obje CTIv eThe objective of this chapter is to understand the importance of quality systems, including that of grading. Practices and procedures of quality management for supply chain efficiency are discussed here. The discussions include inter-national standards with respect to foreign trade in the agribusiness sector and the role of government in adopting quality systems.
178 ◾ Agribusiness Supply Chain Management
This change in focus from high production yield to better quality and sustain-ability has resulted in demand for the creation and development of a traceable sup-ply chain. Companies are persistently searching for ways and means that allow the production of goods that meet the variety of characteristics demanded by the mar-ketplace. The quality of agricultural products is evaluated by a customer based on the freshness of the product and the time since its removal from the farm. Effective supply chain practices will help ensure the freshness of agriproducts by helping to reduce the time taken in transportation and by using favourable storage conditions and better processes and systems. The quality of farm products brought to the market by cul-tivators varies over space and time. To ensure that farm produce remains fresh, safe, and nutritious and is capable of fetching good prices in the market, it is necessary to improve infrastructure in the agriculture supply chain, reduce the length of the supply chain, and improve essential practices such as grading and quality management. This chapter focuses on the quality systems and procedures for supply chain effectiveness.
7.2 GradingBefore discussing the importance of grading and quality management systems, it would be appropriate to define and understand the role of these concepts in the agriproduct sector.
Grade refers to lots having similar quality features, whereas grading refers to the classification of products into different homogeneous lots, that is, each lot has similar characteristics. Grading describes the quality of the package and simpli-fies the marketing of agricultural products. Unlike industrialized products, which are manufactured to precise engineered specifications and are basically consistent, agronomic produces are more diverse and varied in characteristics such as colour, fragrance, location, heaviness (bulk), thickness, shape, ripeness, length of staple, taste, stains, stickiness, and so on. For instance, the characteristics may be based on location of origin (Nagpur orange, Salem mango, Byadagi chilli), shape (small, round, big), length of staple (cotton), and so on. Grading helps the farmer to get suitable prices for his products, because based on the lot characteristics different prices may be fixed for different lots.
Furthermore, quality refers to how well the characteristics of a produce meet the requirements of the end user. The quality of agriproducts requires preservation or main-tenance of the basic characteristics of the products. To preserve quality, it is imperative to devise a mechanism that controls bacteriological spoilage and chemical degradation.
Although quality connotes the level of requirement, standards are set up and estab-lished by statutory authorities as well as reputed authorities like quality standards orga-nization as rules for the measure of quantity, weight, volume, extent, value, age, and quality. In the agriproduct sector, an established set of guidelines or standards facili-tates determination of grades and provides a common language for describing prod-uct value. In the same manner, quality standards should have a common language.
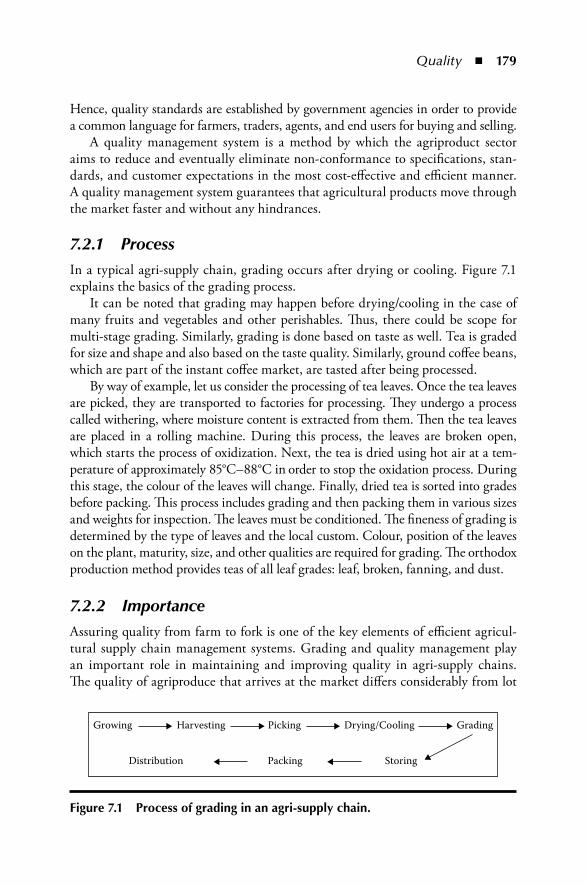
Quality ◾ 179
Hence, quality standards are established by government agencies in order to provide a common language for farmers, traders, agents, and end users for buying and selling.
A quality management system is a method by which the agriproduct sector aims to reduce and eventually eliminate non-conformance to specifications, stan-dards, and customer expectations in the most cost-effective and efficient manner. A quality management system guarantees that agricultural products move through the market faster and without any hindrances.
7.2.1 ProcessIn a typical agri-supply chain, grading occurs after drying or cooling. Figure 7.1 explains the basics of the grading process.
It can be noted that grading may happen before drying/cooling in the case of many fruits and vegetables and other perishables. Thus, there could be scope for multi-stage grading. Similarly, grading is done based on taste as well. Tea is graded for size and shape and also based on the taste quality. Similarly, ground coffee beans, which are part of the instant coffee market, are tasted after being processed.
By way of example, let us consider the processing of tea leaves. Once the tea leaves are picked, they are transported to factories for processing. They undergo a process called withering, where moisture content is extracted from them. Then the tea leaves are placed in a rolling machine. During this process, the leaves are broken open, which starts the process of oxidization. Next, the tea is dried using hot air at a tem-perature of approximately 85°C–88°C in order to stop the oxidation process. During this stage, the colour of the leaves will change. Finally, dried tea is sorted into grades before packing. This process includes grading and then packing them in various sizes and weights for inspection. The leaves must be conditioned. The fineness of grading is determined by the type of leaves and the local custom. Colour, position of the leaves on the plant, maturity, size, and other qualities are required for grading. The orthodox production method provides teas of all leaf grades: leaf, broken, fanning, and dust.
7.2.2 ImportanceAssuring quality from farm to fork is one of the key elements of efficient agricul-tural supply chain management systems. Grading and quality management play an important role in maintaining and improving quality in agri-supply chains. The quality of agriproduce that arrives at the market differs considerably from lot
Growing
Distribution Packing Storing
Harvesting Picking Drying/Cooling Grading
Figure 7.1 process of grading in an agri-supply chain.
180 ◾ Agribusiness Supply Chain Management
to lot. This is because of the wide range of varieties, farming practices, seasonal-ity issues, and different agro-climatic conditions that prevail at the sources of the various lots. Thus, it is essential to grade the products brought to the market on scientific grounds, in order to get competitive prices.
For example, the following dimensions are taken into account while grading pomegranates: size, appearance, shape, seed content, total sugars, acids, colour, and weight of the pulp. The producers or sellers must be able to satisfy consumers on the quality they are offering. Tables 7.1 and 7.2 explain grade designation and sizing for pomegranates as per AGMARK standards.
Size is determined by the weight or maximum diameter of the equatorial section of the fruit, in accordance with the data shown in Table 7.2.
From Tables 7.1 and 7.2, it is clear that there are variances in terms of size and weight while meeting grading requirements.
This is true for all of the agricultural produce, as size, colour, and content elements such as fibre and juice can influence the quality of the produce and the premium it can demand for direct consumption and for processing.
7.2.3 BenefitsGrading and quality management are a must for the agro-based industry because of natural compulsions and the likely diversity of multiple players and geographi-cal and climatic conditions. Adherence to quality standards is expected to improve value for all players across the supply chain, as the produce moves from farmer to consumer either fresh or processed. These are discussed in the following sections.
7.2.3.1 Uniformity
Customers can buy any kind of domestic and international products, as the qual-ity is certified and verified by a reputed authority. Because of grading and quality management, there is uniformity and consistency.
Therefore, a customer can purchase an item for consumption without any risk. For example, when fruits such as apples, oranges, and grapes are sold, they are graded on the quality of uniformity, which enables customers to pick a sample and finalize a sale.
7.2.3.2 Facilitates Buying and Selling
It provides valuable market information that makes it easy for sellers to explore new markets and helps buyers in making useful quality or price assessments. It also allows different market mechanisms such as commodity exchanges and futures trading.
7.2.3.3 Competitive Advantage
Improved grading and quality management present an opportunity to attain com-petitive advantage in certain products in the worldwide markets. For example,
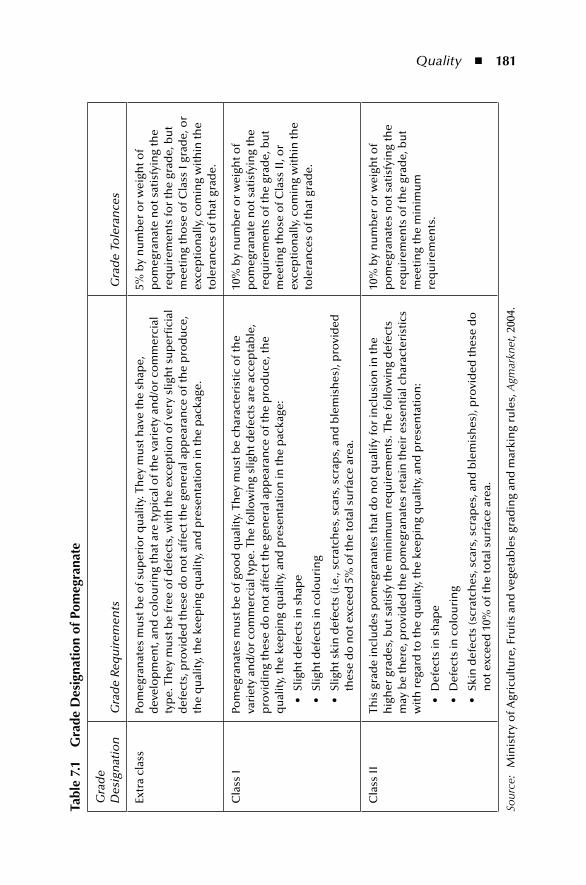
Quality ◾ 181
tabl
e 7.
1 G
rade
Des
igna
tion
of p
omeg
rana
te
Gra
de
Des
ign
atio
nG
rad
e Re
qu
irem
ents
Gra
de
Tole
ran
ces
Extr
a cl
ass
Pom
egra
nat
es m
ust
be
of s
up
erio
r q
ual
ity.
Th
ey m
ust
hav
e th
e sh
ape,
d
evel
op
men
t, an
d c
olo
uri
ng
that
are
typ
ical
of t
he
vari
ety
and
/or
com
mer
cial
ty
pe.
Th
ey m
ust
be
free
of d
efec
ts, w
ith
the
exce
pti
on
of v
ery
slig
ht s
up
erfi
cial
d
efec
ts, p
rovi
ded
thes
e d
o n
ot a
ffec
t th
e ge
ner
al a
pp
eara
nce
of t
he
pro
du
ce,
the
qu
alit
y, th
e ke
epin
g q
ual
ity,
an
d p
rese
nta
tio
n in
the
pac
kage
.
5% b
y n
um
ber
or
wei
ght o
f p
om
egra
nat
e n
ot s
atis
fyin
g th
e re
qu
irem
ents
for
the
grad
e, b
ut
mee
tin
g th
ose
of C
lass
I gr
ade,
or
exce
pti
on
ally
, co
min
g w
ith
in th
e to
lera
nce
s o
f th
at g
rad
e.
Cla
ss I
Pom
egra
nat
es m
ust
be
of g
oo
d q
ual
ity.
Th
ey m
ust
be
char
acte
rist
ic o
f th
e va
riet
y an
d/o
r co
mm
erci
al ty
pe.
Th
e fo
llow
ing
slig
ht d
efec
ts a
re a
ccep
tab
le,
pro
vid
ing
thes
e d
o n
ot a
ffec
t th
e ge
ner
al a
pp
eara
nce
of t
he
pro
du
ce, t
he
qu
alit
y, th
e ke
epin
g q
ual
ity,
an
d p
rese
nta
tio
n in
the
pac
kage
:
•Sl
igh
t def
ects
in s
hap
e
•Sl
igh
t def
ects
in c
olo
uri
ng
•Sl
igh
t ski
n d
efec
ts (i
.e.,
scra
tch
es, s
cars
, scr
aps,
an
d b
lem
ish
es),
pro
vid
ed
thes
e d
o n
ot e
xcee
d 5
% o
f th
e to
tal s
urf
ace
area
.
10%
by
nu
mb
er o
r w
eigh
t of
po
meg
ran
ate
no
t sat
isfy
ing
the
req
uir
emen
ts o
f th
e gr
ade,
bu
t m
eeti
ng
tho
se o
f Cla
ss II
, or
exce
pti
on
ally
, co
min
g w
ith
in th
e to
lera
nce
s o
f th
at g
rad
e.
Cla
ss II
This
gra
de
incl
ud
es p
om
egra
nat
es th
at d
o n
ot q
ual
ify
for
incl
usi
on
in th
e h
igh
er g
rad
es, b
ut s
atis
fy th
e m
inim
um
req
uir
emen
ts. T
he
follo
win
g d
efec
ts
may
be
ther
e, p
rovi
ded
the
po
meg
ran
ates
ret
ain
thei
r es
sen
tial
ch
arac
teri
stic
s w
ith
reg
ard
to th
e q
ual
ity,
the
keep
ing
qu
alit
y, a
nd
pre
sen
tati
on
:
•D
efec
ts in
sh
ape
•D
efec
ts in
co
lou
rin
g
•Sk
in d
efec
ts (s
crat
ches
, sca
rs, s
crap
es, a
nd
ble
mis
hes
), p
rovi
ded
thes
e d
o
no
t exc
eed
10%
of t
he
tota
l su
rfac
e ar
ea.
10%
by
nu
mb
er o
r w
eigh
t of
po
meg
ran
ates
no
t sat
isfy
ing
the
req
uir
emen
ts o
f th
e gr
ade,
bu
t m
eeti
ng
the
min
imu
m
req
uir
emen
ts.
Sour
ce:
Min
istr
y o
f Agr
icu
ltu
re, F
ruit
s an
d v
eget
able
s gr
adin
g an
d m
arki
ng
rule
s, A
gmar
knet
, 200
4.
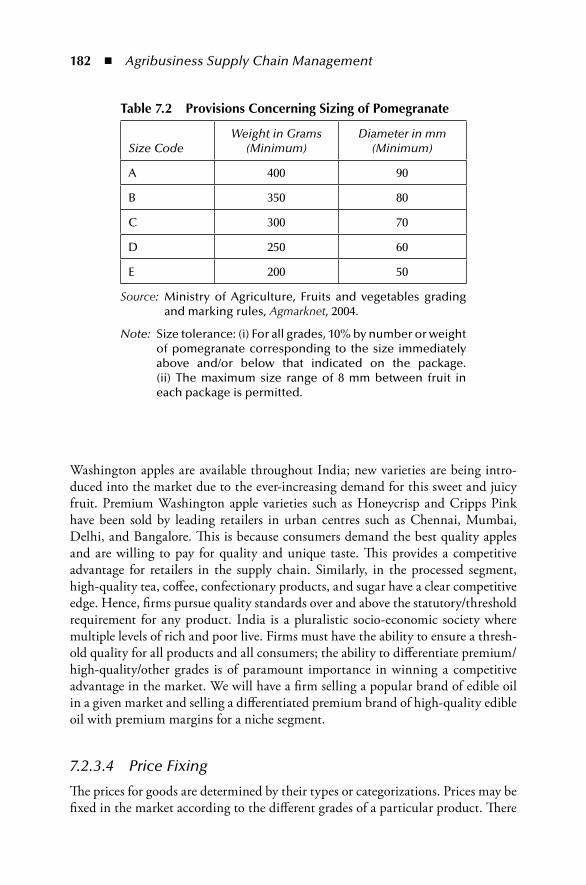
182 ◾ Agribusiness Supply Chain Management
Washington apples are available throughout India; new varieties are being intro-duced into the market due to the ever-increasing demand for this sweet and juicy fruit. Premium Washington apple varieties such as Honeycrisp and Cripps Pink have been sold by leading retailers in urban centres such as Chennai, Mumbai, Delhi, and Bangalore. This is because consumers demand the best quality apples and are willing to pay for quality and unique taste. This provides a competitive advantage for retailers in the supply chain. Similarly, in the processed segment, high-quality tea, coffee, confectionary products, and sugar have a clear competitive edge. Hence, firms pursue quality standards over and above the statutory/threshold requirement for any product. India is a pluralistic socio-economic society where multiple levels of rich and poor live. Firms must have the ability to ensure a thresh-old quality for all products and all consumers; the ability to differentiate premium/high-quality/other grades is of paramount importance in winning a competitive advantage in the market. We will have a firm selling a popular brand of edible oil in a given market and selling a differentiated premium brand of high-quality edible oil with premium margins for a niche segment.
7.2.3.4 Price Fixing
The prices for goods are determined by their types or categorizations. Prices may be fixed in the market according to the different grades of a particular product. There
table 7.2 provisions Concerning Sizing of pomegranate
Size CodeWeight in Grams
(Minimum)Diameter in mm
(Minimum)
A 400 90
B 350 80
C 300 70
D 250 60
E 200 50
Source: Ministry of Agriculture, Fruits and vegetables grading and marking rules, Agmarknet, 2004.
Note: Size tolerance: (i) For all grades, 10% by number or weight of pomegranate corresponding to the size immediately above and/or below that indicated on the package. (ii) The maximum size range of 8 mm between fruit in each package is permitted.
Quality ◾ 183
is an acknowledgement of quality perception; consumers are fairly aware of quality standards, and therefore relate to price differentiations.
7.2.3.5 Market Access
Grading and quality management not only create value for local trades but also deliver value in terms of improvement of quality for international trade. Thereby, these practices facilitate easy access to better quality products and prevent poor quality products from being traded. This is because the standards set are high, ensuring compliance with international norms.
7.2.3.6 Transparency
A well-established quality management system increases the efficiency and trans-parency of markets. Moreover, it also helps to differentiate among different geo-graphical origins. Mandatory labelling and other procedures governing the sale of certain edible products and visually clear practices in the case of fresh prod-ucts bring out transparency. Market practices are increasingly adopting methods to showcase objectivity and ensure transparency. For example, there was an issue about using calcium carbide to artificially ripen mango in Tamil Nadu. Local administrations tried to intervene and validate proactive measures to ensure that the fruits are naturally ripened. One wonders how transparency and objectivity can be achieved here, because the retailer may find it difficult to isolate artificially rip-ened lots from naturally ripened ones. The retailer is also not in a position to grade the fruit. Traders’ associations got together to ensure that the fears were addressed and communicated the relevance of natural ripening to all traders. Thus, lack of transparency could become an issue in supply chains. There was another case with respect to illegal meat being sold in some retail markets. The low price of the unhygienic meat is a major reason for its popularity among many small meat shops and hotels. Mutton, beef, and chicken sold at these places cost 40%–60% less than stamped meat. Local municipal corporations exercise vigilance, and wherever there is lack of transparency with respect to the source of the meat and stamp-ing, the product is summarily withdrawn from the supply chain. Thus, objectivity and transparency are critical for maintaining quality standards in the agro-based industry.
7.2.3.7 Sustainable Agriculture
Grading and quality management relating to sustainability are recently emerging market requirements. The objective of these standards is to safeguard the environ-ment and reduce the use of agrochemicals. The importance of these standards will increase, and in due course play a very important role in future product entry to markets.
184 ◾ Agribusiness Supply Chain Management
7.2.3.8 Incentives for Fair Trade
It assists farmers to get premium prices for quality products and safeguards cus-tomers from unfair trade practices. Grading and quality management help not only farmers but also all stakeholders in agriculture and related activities, namely, wholesalers, cooperatives, agents, dealers, and the final consumers.
7.3 Stages of Supply ChainA quality product available to customers at the tail end of a supply chain is a func-tion of quality perspectives and support mechanisms across the various players in the network. The players, from farm to fork, could be farmers; intermediaries; mar-ket operators; primary, secondary, and tertiary processors; storage, transport, and distribution players; and so on. Here, we provide some insights on the scope for quality management.
The factors that affect quality in various stages are described in the following sections.
7.3.1 Farm LevelFarming and harvesting conditions impact fresh and processed food stuffs. Important factors affecting quality include selection of the best plant varieties and the best cultivation methods. Weather and seasonal changes also affect quality. At the farm level, quality is impacted significantly by the absence of good agricultural practices (GAPs). Like good manufacturing practices (GMPs) for factories, GAP is for farming. This is discussed later in this chapter in Exhibit 7.1. Farming prac-tices are rudimentary in certain areas, which affects quality. For example, India is a leading producer of mango. Harvesting (plucking) of mango (in large quanti-ties) from trees is done without proper appliances and tools, leading to damage. It should be mentioned that a similar situation prevails for plantation crops as well. The other aspects of quality at the farm level include right application of manure and plant protection. All these would be a part of GAPs when adopted appropriately by farmers.
7.3.2 TransportationIn the course of transport and storage, damage may occur to plants; hence, the fol-lowing should be taken care of:
◾ Loading density ◾ Loading and unloading facilities ◾ Transport time
Quality ◾ 185
In India, goods are mostly moved by normal trucks, and wherever temperature control is required over short distances, freezers or ice stuffed insulated boxes are used. However, refrigerated trucks are needed in order to protect the quality of the produce during transportation. This is specifically applicable for milk and related products, fruits and vegetables, drugs, chemicals, genetic products, frozen rudi-ments, and other items that are very sensitive to temperature or to transportation time limitations, and are likely to deteriorate. Temperatures differ from product to product: in the case of milk, 32°F–40°F; eggs, at or below 45°F; poultry, 26°F–32°F; and meat, under 26°F.
Goods having limited shelf lives should be transported as soon as possible to the market from the source. For instance, milk transport from the farmhouses to the collection centres, processing centres, or factories should always be as quick as possible to prevent spoilage of milk. Availability of good quality raw milk at neighbouring localities is critical, as milk is highly perishable. In the case of frozen fish, a temperature of −0.4°F to −16.6°F (−18°C to −27°C) is essential during trans-port. This calls for an efficient farm-to-retailer supply chain with reduced transport delays.
Selection of a suitable mode of refrigerated transport is essential to ensure the freshness and natural qualities from the point of produce to warehouses, dis-tributors, retailers, and finally, customers. Short transport times reduce costs and spoilage risks. This means moving perishables with the highest efficiency, thus retaining freshness and natural qualities from the point of produce to warehouses, distributors, and retail customers. Pre-cooling freezer trucks help in transport-ing time-sensitive goods. Throughout the distribution process, even while loading and unloading of the truck, the temperature of the products must be maintained. Failure to do so may affect the quality of the produce.
Products that require specific care from ecological influences may be trans-ported by surface means, with protective measures. Proper employee training is required to take care of perishable products; they should not be left on loading yards for lengthy periods, and the least possible time should be spent on load-ing and unloading. This will enhance the quality of the produce and ensure that spoilage during transportation of perishable goods can be minimized.
7.3.3 Storage and DistributionStorage settings may impact the quality of fresh produces and processed foods. When considering current preservation techniques, there are limits that pertain to different factors such as temperature, sourness, water content, use of flavours and preservatives, and alteration of combinations. For instance, elevated temperatures are applied to reduce the number of micro-organisms, to inactivate enzyme activity and to increase chemical reactions.
As a further example, extremely perishable meat containing water and proteins requires specific temperatures, moisture, and exposure to air conditions. If the
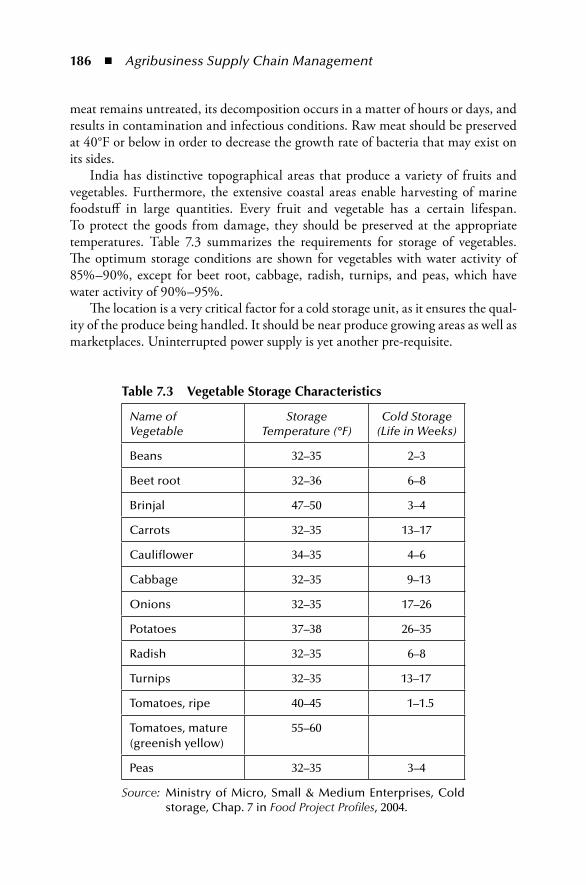
186 ◾ Agribusiness Supply Chain Management
meat remains untreated, its decomposition occurs in a matter of hours or days, and results in contamination and infectious conditions. Raw meat should be preserved at 40°F or below in order to decrease the growth rate of bacteria that may exist on its sides.
India has distinctive topographical areas that produce a variety of fruits and vegetables. Furthermore, the extensive coastal areas enable harvesting of marine foodstuff in large quantities. Every fruit and vegetable has a certain lifespan. To protect the goods from damage, they should be preserved at the appropriate temperatures. Table 7.3 summarizes the requirements for storage of vegetables. The optimum storage conditions are shown for vegetables with water activity of 85%–90%, except for beet root, cabbage, radish, turnips, and peas, which have water activity of 90%–95%.
The location is a very critical factor for a cold storage unit, as it ensures the qual-ity of the produce being handled. It should be near produce growing areas as well as marketplaces. Uninterrupted power supply is yet another pre-requisite.
table 7.3 Vegetable Storage Characteristics
Name of Vegetable
Storage Temperature (°F)
Cold Storage (Life in Weeks)
Beans 32–35 2–3
Beet root 32–36 6–8
Brinjal 47–50 3–4
Carrots 32–35 13–17
Cauliflower 34–35 4–6
Cabbage 32–35 9–13
Onions 32–35 17–26
Potatoes 37–38 26–35
Radish 32–35 6–8
Turnips 32–35 13–17
Tomatoes, ripe 40–45 1–1.5
Tomatoes, mature (greenish yellow)
55–60
Peas 32–35 3–4
Source: Ministry of Micro, Small & Medium Enterprises, Cold storage, Chap. 7 in Food Project Profiles, 2004.
Quality ◾ 187
7.4 need for a Structured ApproachEffective quality systems, which assure the health and safety of agriproducts, have become more and more important. Implementing proper quality systems has become a necessity in the agrifood sector. This is primarily due to changing consumer requirements, increased competition, environmental issues, and govern-mental interests. The customer perception of a commodity can be based on two approaches: intrinsic and extrinsic attributes. Intrinsic attributes for customers include considerations of whether the product is hygienic, non-toxic, and nutritive. These factors are directly related to the physical properties of the product. Extrinsic attributes refer to additional aspects such as environmental impact and sustainabil-ity. They do not directly influence physical properties, but may affect acceptance of products by customers. Examples are the use of chemicals and pesticides.
Nowadays, different farming methods are used in different parts of the world. Quality methods are changed rapidly and are becoming innovative through the deployment of technology. Although quality systems have been adopted in many countries, there is still a need for a structured approach to make our agricultural supply chain efficient so that neither are the customers burdened with high prices nor are the producers incurring losses. There are still lots of variations in terms of grading and quality practices. The agriproduct sector uses various quality assurance systems such as Hazard Analysis Critical Control Point (HACCP), International Organization for Standardization (ISO), British Retail Consortium (BRC), and other national and international standards.
In spite of all these approaches, human handling plays a crucial role in qual-ity management, and is rather unpredictable and changeable. As a consequence, results in the agribusiness and food industry, as the combined action of individu-als striving for quality, are much more uncertain than is often assumed. To face this challenge, continuous improvement in agri-quality management methods is required, where knowledge of modern technologies and management methods play a crucial role.
7.5 overview of policiesAgricultural policies are sets of regulations relating to national and international trade in agricultural products. Governments and other agencies devise these agri-cultural policies in order to accomplish product quality, guaranteed supply, and price stability. While devising these policies, countries must make sure that there is adequate production capability in order to meet the home country’s needs in the event of external supply interruption. Dependency on other countries puts a nation at risk in case of natural disasters, war, or other disruptions. Sustaining sufficient domestic product capability allows for self-reliance, which reduces the risk due to supply disruptions. Agriculture is considered to be the strength of our economy.
188 ◾ Agribusiness Supply Chain Management
Thus, there is an increasing need to confirm good quality in order to develop our agrarian economy. To ensure high quality of produce, several quality standards and systems are in place. This section provides an overview of different agriculture policies that may have an impact on the quality of goods in the agriproduct sector. Some of the Indian quality management systems and standards relating to this sec-tor are discussed in Exhibit 7.1.
Exhibit 7.1 Indian Quality Standards for Agriproducts
GAp—inDiAThe GAPs standard covers the basic requirements for all farm-ing practices in a sustainable manner for maintaining quality and food safety of agricultural produce. GAP, in addition to improving the yield and quality of the products, has environ-mental and social dimensions. Its social dimension would be to protect agricultural workers against risk to health arising from improper use of chemicals and pesticides. The main compo-nents of this standard are base modules and crop-based mod-ules. Crop-based modules include fresh fruits and vegetables, combinable crops, tea, and green coffee. There are various standards available for control measures in value addition through processing of food meant for human consumption. Although grade standards on size, shape, colour, and local preferences are available for most of the fruits and vegetables marketed and consumed in India, their quality in terms of maturity standards, residues of pesticides and other contami-nants, microbial loads, and so on, has not been adequately addressed. The Indian Good Agricultural Practices (INDGAP) guidelines take into account not only the quality and quantity of the produce obtained from a unit area, but also the care taken in integrating pre-harvest practices such as soil and water management, nutrient management, pest management, har-vesting, post- harvest handling, and other logistics.
DireCtorAte oF mArKetinG AnD inSpeCtion—miniStry oF AGriCuLtureThe Directorate of Marketing and Inspection (DMI) imple-ments the agricultural marketing policies and programmes of the Government of India. DMI performs the prime function of standardization, grading, and quality control of agricultural and allied produce. DMI has framed AGMARK standards for
Quality ◾ 189
agricultural and related produces. Standards outlined under the provisions of the Agricultural Produce (Grading and Marking) Act, 1937 (http://agmarknet.nic.in/apgm1937.htm) are popularly known as AGMARK standards.
AGmArKAGMARK is a quality certification mark provided by DMI, an agency of the Government of India for agricultural products in India. This certification guarantees that the product conforms to a set of prescribed quality standards. The legal enforcement of AGMARK in India is controlled by the Agricultural Produce Act of 1937. The AGMARK standard covers quality grading and certification of products for the domestic and export mar-kets. Nearly 205 commodities have been brought under the umbrella of the AGMARK standard. AGMARK is used to certify different commodities covering a wide spectrum of fruits and vegetables, pulses, cereals, vegetable oils, vermicelli, essential oils, roasted Bengal gram, vanaspati, cotton, sugar, honey, jute, wool, and so on. Appendix 7.1 outlines the grading of cashew kernels. DMI has a set-up for quality certification of agricultural produce through a network of 22 regional AGMARK laborato-ries at different places in the country with the Central AGMARK Laboratory at Nagpur as the apex laboratory. The regional AGMARK laboratories are engaged in analysis of agricultural and food commodities for evaluation of quality. Testing is con-ducted on all types of agricultural and allied commodities and meat products across regional laboratories for chemical and microbiological analysis, pesticide residue, and aflatoxin.
Fruit proDuCtS orDerThe Fruit Products Order (FPO) is a certification mark employed on all fruits and vegetables. FPO certification in India has been “effective since 1955, but became mandatory only in 2006, after passing of the Food Safety and Standards Act. It ensures that any food under consideration is suitable for purchase and is fit for consumption, and guarantees that it has been manufactured in a hygienic environment. FPO certifica-tion products include fruit crushes, beverages, syrups, sauces, ketchups, pickles, vinegars, canned juices, pulps, frozen veg-etables and fruits, cereal flakes containing fruits and other similar products containing processed fruits and vegetable” (www. indiatrademarkregistration.com).
190 ◾ Agribusiness Supply Chain Management
7.6 international policiesAgricultural policies differ from country to country. For instance, in the United States, nutrition labelling is mandatory. However, in France, the source confirma-tion, that is, display of country of origin of fruits and vegetables is mandatory in all types of markets. Peru requires packing dates for all meat and poultry products. In the case of exports, fruits and vegetables shall comply with the residue levels of heavy metals, pesticides, and other food safety parameters as laid down by the Codex Alimentarius Commission for exports. The Japanese JAS Law and Food Sanitation Law require that the label on retail packages for imported food products should include the name of the product, country of origin, net weight, and ingredi-ent information in Japanese.
Exhibit 7.2 outlines the different international quality policies and standards relating to the agriproduct sector.
Exhibit 7.2 International Quality Policies and Standards
AGriCuLture poLiCieS in tHe uniteD StAteSThe United States has various “agricultural policies, with goals that range from the traditional objectives of stabilizing agri-cultural production and supporting farm income to those that have more recently increased in importance, such as assuring adequate nutrition, securing food safety, encouraging environ-mental protection, and facilitating rural development” (www.oecd.ilibrary.org). The US Department of Agriculture quality grade marks are employed on chicken, eggs, beef, and butter. There are five specialized acts relating to agriculture: the “Food Security Act of 1985; the Food, Agriculture, Conservation, and Trade Act of 1990; the Federal Agriculture Improvement and Reform Act of 1996; the Farm Security and Rural Investment Act of 2002 (2002 Farm Act); and the Food, Conservation and Energy Act of 2008” (www.oecd.ilibrary.org).
internAtionAL StAnDArDS in AGriCuLtureAgriculture and agricultural produce have international stan-dards set by many organizations such as ISO, the United Nations Economic Commission for Europe (UNECE), the World Trade Organization (WTO), the National Agricultural Products Quality Management Service (NAQS), and others. UNECE, ISO, and Codex Alimentarius standards are globally recog-nized standards, and hence, they are commonly used as the
Quality ◾ 191
basis for many grades and standards. A few of these standards are elucidated below.
iSo AGriCuLturAL StAnDArDSISO international standards certify that products and services are safe, reliable, and of good quality. For agribusinesses, they are considered as strategic tools, as they decrease costs by minimizing waste and errors and increasing productivity. The ISO standards for agriculture are given in standards catalogue 65. They include standards relating to the fertilizers and pesti-cides that can be used, to animal feeding stuffs, to agricultural machinery, and to farm buildings. They also specify the stan-dards for fishing, fish breeding, and beekeeping. They have a specific section for tobacco products and related equipment. ISO/TC 34 deals with food products. These standards are most widely accepted, and most of the time, are required for the products to be successful and accepted.
uneCe AGriCuLture QuALity StAnDArDSUNECE develops “global agricultural quality standards to facili-tate international trade. The standards encourage high-quality production, improve profitability and protect consumer inter-ests. UNECE standards are used internationally by governments, producers, traders, importers, exporters and international orga-nizations. They cover a wide range of agricultural products: fresh fruit and vegetables (FFV), dry and dried produce (DDP), seed potatoes, meat, cut flowers, eggs and egg products” (www.unece.org). It collaborates with the WTO, the OECD Scheme for the Application of International Standards for Fruit and Vegetables, and also the FAO/WHO Codex Alimentarius Commission to prevent any duplication of standards. Together, these bodies have developed around 100 standards for agri-cultural products and international trade. They also conduct seminars and awareness programmes to make the standards well known to the agriculturists and also to the public who are the users of the products.
CoDex ALimentAriuS internAtionAL FooD StAnDArDSThe Codex Alimentarius international food standard has established procedures and principles that enable the safety, quality, and fairness of the international food trade. The Food and Agricultural Organization of the United Nations and the World Health Organization have together come up with this
192 ◾ Agribusiness Supply Chain Management
safety standard for food and agricultural products. They also unify the standards set by all governmental and non-govern-mental organizations to ensure the well-being of food consum-ers and also to see to it that fair trade practices are followed for food and agricultural products. The Codex Alimentarius, or the food code, has become the global reference point for con-sumers, food producers and processors, national food control agencies, and the international food trade.
Wto-SAnitAry AnD pHytoSAnitAry (SpS) StAnDArDSThe WTO has specified certain norms for food safety standards and standards for animal and plant health. The SPS measures are applicable to regionally produced or traded products, and lay down safety measures such as checking whether the agri-cultural produce has come from a disease-free area, carrying out general inspections of products, treatment or processing of products, and making sure that the products are safe for consumers. They also make sure that pests or diseases do not spread among plants and animals.
nAtionAL AGriCuLturAL proDuCtS QuALity mAnAGement SerViCeNAQS, a specialized organization in agri-food quality man-agement, promotes quality enhancement and fair trade through national inspections on agricultural products, and boosts the convenience of producers and buyers by improv-ing inspection methods. NAQS is upgrading product quality through various certification systems, including good agricul-tural practices (GAP), and enhancing certification capability gradually by nurturing credible private certification agen-cies. NAQS also supports the exports of GAP products, the quality of which is thoroughly managed from production to consumption, and lays a foundation for producing high-qual-ity and safe agricultural products through quality manager systems.
internAtionAL FeDerAtion oF orGAniC AGriCuLture moVementS (iFoAm)IFOAM’s organic guarantee system facilitates the development of organic standards and third-party certification worldwide, and also provides an international guarantee of these standards and organic certification. Organic agriculture is based on the factors discussed here.
Quality ◾ 193
The PrinciPle of healTh
It deals with the health of individuals and communities. Organic agriculture is envisioned to promote high-quality, nutritious food that contributes to preventive health care and well-being. For instance, it avoids the use of fertilizers, pesti-cides, animal drugs, and food additives that may have adverse health effects.
The PrinciPle of ecology
It is based on ecological processes and recycling. Organic agri-culture should attain ecological balance through the design of farming systems, establishment of habitats, and maintenance of genetic and agricultural diversity.
The PrinciPle of fairness
This principle emphasizes that those involved in organic agri-culture should conduct human relationships in a manner that ensures fairness at all levels and to all parties—farmers, work-ers, processors, distributors, traders, and consumers.
The PrinciPle of care
Organic agriculture is a production system that sustains the health of soils, ecosystems, and people. It relies on ecological processes, biodiversity, and cycles adapted to local conditions, rather than the use of inputs with adverse effects. Organic agri-culture combines tradition, innovation, and science to benefit the shared environment, and promotes fair relationships and a good quality of life for all involved (www.naqs.go.kr).
7.7 role of Government AgenciesGovernment and other allied agencies play a pivotal role in promoting and strength-ening grading and quality infrastructure for agriculture. For instance, governmen-tal support agencies such as the Food Safety and Standards Authority of India (FSSAI), the National Bank for Agriculture and Rural Development (NABARD), the Agricultural and Processed Food Products Export Development Authority (APEDA), and the commodities boards promote grading, standardization, and quality certification systems to give a major thrust to promotion of agricultural mar-kets in order to stabilize market systems and increase farmers’ income. Exhibit 7.3 discusses some of the agencies promoting quality systems in the agriproduct sec-tor. The Department of Agriculture provides technical assistance and advice to the state in framing suitable quality systems. The Government of India launched a
194 ◾ Agribusiness Supply Chain Management
scheme to develop the agricultural marketing infrastructure by encouraging private and cooperative sector investments. In order to increase investment in the develop-ment of marketing infrastructure as envisaged above, the ministry has formulated a scheme for development/strengthening of agricultural marketing infrastructure and grading and standardization. Under this scheme, the government provides sub-sidies for strengthening infrastructure facilities such as grading. Table 7.4 shows the subsidies sanctioned by various government agencies. The following observations on Table 7.4 could be useful.
1. Maharashtra is the state that has the maximum of projects (475) involving a financial outlay of `741.92 crores in the year 2012, with a subsidy compo-nent of `80.37 crores. Most of these projects (421), with a financial outlay of `674.62 crores, have come from the NABARD nodal agency (bank for growth of agriculture and rural development) in India. It will not be out of place to mention here that Maharashtra leads in the export of certain fruits such as pomegranates, grapes, and oranges in India.
2. Gujarat ranks second in terms of the number of projects, with 410 projects and a financial outlay of `48.21 crores. It is interesting to note that most of the projects (389) are funded by the National Cooperative Development Corporation (NCDC), an agency for developing cooperatives in agriculture. This goes well with the culture of the state. From the data, it can be observed that the average project size is relatively small.
3. With 82 projects, Andhra Pradesh is the third largest in terms of the num-ber of projects, with a financial outlay of `223.24 crores that is next only to Maharashtra. All of this support has come from NABARD.
4. This is followed by Madhya Pradesh, with 180 projects involving a financial outlay of `204.81 crores, all of which comes from NABARD.
5. Interestingly, some of the leading agro-based states such as Punjab, Tamil Nadu, Himachal Pradesh, and West Bengal have not drawn as much for projects aimed at strengthening infrastructure and building quality.
Exhibit 7.3 Agencies Promoting Quality Systems in the Agriproduct Sector
FooD SAFety AnD StAnDArDS AutHority oF inDiAFSSAI has been established under the Food Safety and Standards Act, 2006, which consolidates various acts and orders that have hitherto handled food-related issues in vari-ous ministries and departments. FSSAI (http://www.fssai.gov.in/)
Quality ◾ 195
has been created for laying down science-based standards for articles of food and to regulate their manufacture, storage, distribution, sale, and import to ensure availability of safe and wholesome food for human consumption.
The functions of FSSAI include:
◾ The framing of regulations to lay down the standards and guidelines in relation to articles of food and specifying appropriate systems of enforcing various standards thus notified
◾ The laying down of mechanisms and guidelines for accred-itation of certification bodies engaged in certification of food safety management systems for food businesses
◾ The laying down of procedures and guidelines for accred-itation of laboratories and notification of the accredited laboratories
◾ The provision of scientific advice and technical support to the central government and the state governments in the matters of framing policies and rules in areas that have a direct or indirect bearing on food safety and nutrition
◾ The collection and collation of data regarding food consumption, incidence and prevalence of biological risk, contaminants in food, residues of various contaminants in food products, identification of emerging risks, and intro-duction of a rapid alert system
◾ The creation of an information network across the coun-try so that the public, consumers, panchayats, and others receive rapid, reliable, and objective information about food safety and issues of concern
◾ The provision of training programmes for persons who are involved or intend to get involved in food businesses
◾ Contributions to the development of international techni-cal standards for food, including SPS standards
◾ Promotion of general awareness about food safety and food standards
nAtionAL BAnK For AGriCuLture AnD rurAL DeVeLopmentNABARD is an apex development bank in India that facili-tates credit flow for the promotion and development of agri-culture and cottage and village industries. It promotes quality practices in agriculture. With a view to strengthen the mar-keting grading infrastructure, it encourages investors to invest
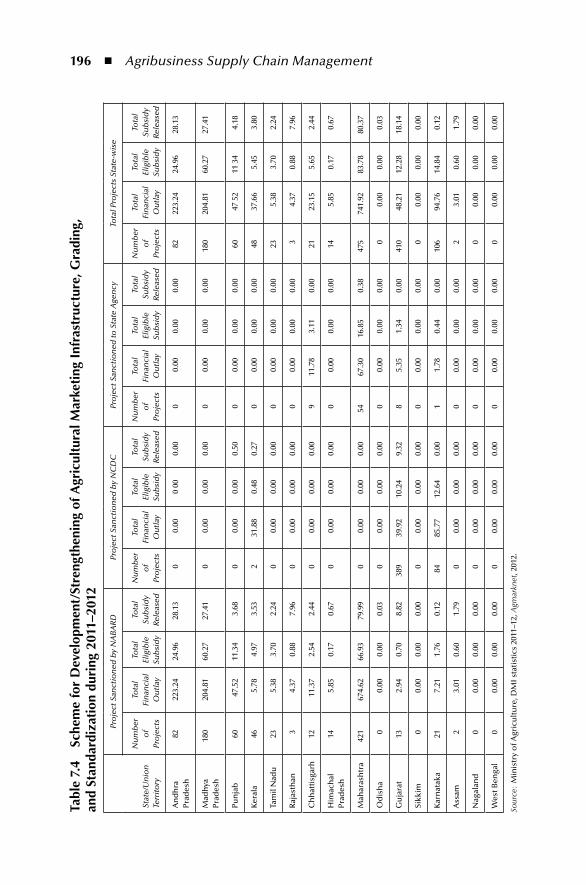
196 ◾ Agribusiness Supply Chain Management
tabl
e 7.
4 Sc
hem
e fo
r D
evel
opm
ent/
Stre
ngth
enin
g of
Agr
icul
tura
l mar
keti
ng i
nfra
stru
ctur
e, G
radi
ng,
and
Stan
dard
izat
ion
duri
ng 2
011–
2012
Stat
e/U
nio
n
Terr
ito
ry
Pro
ject
San
ctio
ned
by
NA
BA
RD
Pro
ject
San
ctio
ned
by
NC
DC
Pro
ject
San
ctio
ned
to S
tate
Age
ncy
Tota
l Pro
ject
s St
ate-
wis
e
Nu
mb
er
of
Pro
ject
s
Tota
l Fi
nan
cial
O
utl
ay
Tota
l El
igib
le
Sub
sid
y
Tota
l Su
bsi
dy
Rele
ased
Nu
mb
er
of
Pro
ject
s
Tota
l Fi
nan
cial
O
utl
ay
Tota
l El
igib
le
Sub
sid
y
Tota
l Su
bsi
dy
Rele
ased
Nu
mb
er
of
Pro
ject
s
Tota
l Fi
nan
cial
O
utl
ay
Tota
l El
igib
le
Sub
sid
y
Tota
l Su
bsi
dy
Rele
ased
Nu
mb
er
of
Pro
ject
s
Tota
l Fi
nan
cial
O
utl
ay
Tota
l El
igib
le
Sub
sid
y
Tota
l Su
bsi
dy
Rele
ased
An
dh
ra
Prad
esh
8222
3.24
24.9
628
.13
00.
000
000.
000
0.00
0.00
0.00
8222
3.24
24.9
628
.13
Mad
hya
Pr
ades
h18
020
4.81
60.2
727
.41
00.
000.
000.
000
0.00
0.00
0.00
180
204.
8160
.27
27.4
1
Pun
jab
6047
.52
11.3
43.
680
0.00
0.00
0.50
00.
000.
000.
0060
47 5
211
34
4.18
Ker
ala
465.
784.
973.
532
31.8
80.
480.
270
0.00
0.00
0.00
4837
.66
5.45
3.80
Tam
il N
adu
235.
383.
702.
240
0.00
0.00
0.00
00.
000.
000.
0023
5.38
3.70
2.24
Raj
asth
an3
4.37
0.88
7.96
00.
000.
000.
000
0.00
0.00
0.00
34.
370.
887.
96
Ch
hat
tisg
arh
1211
.37
2.54
2.44
00.
000.
000.
009
11.7
83.
110.
0021
23.1
55.
652.
44
Him
ach
al
Prad
esh
145.
850.
170.
670
0.00
0.00
0.00
00.
000.
000.
0014
5.85
0.17
0.67
Mah
aras
htr
a42
167
4.62
66.9
379
.99
00.
000.
000.
0054
67.3
016
.85
0.38
475
741.
9283
.78
80.3
7
Od
ish
a0
0.00
0.00
0.03
00.
000.
000.
000
0.00
0.00
0.00
00.
000.
000.
03
Gu
jara
t13
2.94
0.70
8.82
389
39.9
210
.24
9.32
85.
351.
340.
0041
048
.21
12.2
818
.14
Sikk
im0
0.00
0.00
0.00
00.
000.
000.
000
0.00
0.00
0.00
00.
000.
000.
00
Kar
nat
aka
217.
211.
760.
1284
85.7
712
.64
0.00
11.
780.
440.
0010
694
.76
14.8
40.
12
Ass
am2
3.01
0.60
1.79
00.
000.
000.
000
0.00
0.00
0.00
23.
010.
601.
79
Nag
alan
d0
0.00
0.00
0.00
00.
000.
000.
000
0.00
0.00
0.00
00.
000.
000.
00
Wes
t Ben
gal
00.
000.
000.
000
0.00
0.00
0.00
00.
000.
000.
000
0.00
0.00
0.00
Sour
ce:
Min
istr
y o
f Agr
icu
ltu
re, D
MI s
tati
stic
s 20
11–1
2, A
gmar
knet
, 201
2.
Quality ◾ 197
in agricultural infrastructure facilities. From Table 7.4 we can see that NABARD sanctioned the highest subsidies for grading infrastructure.
AGriCuLturAL AnD proCeSSeD FooD proDuCtS export DeVeLopment AutHorityAPEDA was established by the Government of India to provide standards and specifications for scheduled products for the purpose of exports. It is responsible for export promotion and development of scheduled products such as fruits, vegetables, meat, poultry, dairy, confectioneries, biscuits and bakery prod-ucts, honey, jaggery and sugar, cocoa, chocolates, alcoholic and non-alcoholic beverages, cereal, groundnuts, peanuts and walnuts, pickles, and guar gum. In addition to this, APEDA has been entrusted with the responsibility of monitoring imports of sugar. APEDA has also been taking various steps for promo-tion and control of quality. APEDA provides subsidies for the creation of laboratories to analyse quality parameters such as pesticide residue, metal content, and so on.
CoConut DeVeLopment BoArD“Coconut Development Board (CDB) is a statutory body established under the Ministry of Agriculture, Government of India, for the integrated development of coconut cultivation and associated industries in the country, with focus on prod-uct quality, productivity increase and product diversification” (coconutboard.nic.in).
SpiCeS BoArD oF inDiA“The Spices Board (Ministry of Commerce, Government of India) is the flagship organization for the development and worldwide promotion of Indian spices. The Board is an international link between Indian exporters and the importers abroad. The Board has been spearheading activities for excellence of Indian spices, involving every segment of the industry. The Board has made quality and hygiene the cornerstones of its development and promotional strategies” (http://www.indianspices.com).
tHe CASHeW export promotion CounCiL oF inDiA“The Cashew Export Promotion Council of India (CEPC) was established by the Government of India in the year 1955 with the active cooperation of the cashew industry, with the object
198 ◾ Agribusiness Supply Chain Management
of promoting exports of cashew kernels and cashew nut shell liquid from India. The Council has been set up such that it provides the necessary institutional frame-work for perform-ing the different functions that serve to intensify and promote exports of cashew kernels and cashew nut shell liquid” (cashewindia.org).
7.8 Foreign tradeQuality plays a very important role in the agriproduct sector, especially in foreign trade. Over the decades, international trade of agricultural products has rapidly increased between countries that have different environmental and development standards. This situation also increases the relevance of quality management in the international trade of agriproducts.
7.8.1 EmergenceAgricultural trade is not a modern phenomenon, but has been in existence since the times of the Indus Valley civilization. Historians have found evidence of trade between the Indian sub-continent and the Middle East and Europe. It is believed that agricultural products such as pepper, cinnamon, opium, indigo, and cotton were exported to Europe, the Middle East, and South East Asia in return for gold and silver. This trade grew further and was transformed by the coming of the Europeans to India.
Because of the comparative advantage theory, there is always bound to be trade in agricultural items, because no land is able to produce all types and variet-ies of products. Some areas of the world are blessed in the production of rubber, whereas other areas produce more wheat. As food is necessary for daily subsis-tence, agriculturally poor countries will be forced to barter, borrow, or buy from agriculturally rich countries, thus resulting in the international trade of agricul-tural products.
7.8.2 World Agricultural TradeFood is one of the basic necessities of life, so every country would like to be self-sufficient and therefore provide support and assistance to its agricultural commu-nity. This assistance can be in the form of subsidies, higher tariff on imported agriproducts, or imposition of stringent quality requirements on imported agricul-tural products.
The developed countries have a mechanized system of agriculture, with better seeds, fertilizers, and large integrated agricultural units, whereas the developing
Quality ◾ 199
countries still generally follow traditional methods, and have smaller land hold-ings. In combination with the lower capacity of the developing countries to provide agricultural subsidies, this results in imbalances in the foreign trade of agricultural products. World bodies such as WTO have brought in guidelines to reduce this divide and to ensure fair trade practices in agricultural products.
The Uruguay Round of the WTO aimed to establish a fair and market-ori-ented agricultural trading system, and stressed that its long-term objective would be to provide substantial reductions in agricultural support and protection over an agreed period of time, thus helping in correcting and preventing restrictions and distortions in world agricultural markets.
7.8.3 ExportsTo compete in the international market, it is necessary that exports must meet the specific standards set by the governments of the importing countries. The export of agricultural products requires the exporter to look carefully into the issues of quality of the produce before and during shipment. International trade in agriproducts is strictly governed by different rules in different countries. These rules lay down specifications for the quality of the product, such as the tempera-ture at which it is to be kept, its moisture content, packaging types, and so on. Export guidelines often also ask for documentation regarding the activities car-ried out on the farm during cultivation of the crops. For example, for export of mangoes to the United States, the guidelines require that the fruits be harvested at half-maturity stage if shipment is to be done by sea and at full maturity stage if shipment is by air. The guidelines also ask for storing of harvested fruits in clean and disinfected plastic crates with clean polyurethane foam. Quality measures are stringent, especially in the case of agricultural products, and vary from country to country. Hence, ensuring good control over quality of produce is essential, par-ticularly in international trade.
India’s share in the international agricultural trade has been very low. But it is promising to note that over the years since independence, our agricultural imports have decreased, whereas exports have increased. Our main export items include tea, coffee, wheat, cashew nut, spices, and other products. Indian agricultural exports have also come under the scanner in different countries such as the United States and the European Union for quality parameters.
7.8.3.1 Global Tea Trade
Tea as a beverage is widely used in almost all parts of the globe. India is the fourth largest exporter of tea along with other leading tea exporters such as Sri Lanka, Vietnam, China, and Kenya. Although tea traded internationally needs to comply with mandatory standards such as the European Union’s food safety and labelling
200 ◾ Agribusiness Supply Chain Management
regulations, quality standards imposed by major private companies and certain countries have increasingly important implications for exporters of tea products from developing countries. The quality standards dictated in different end mar-kets are affecting market accessibility for developing countries’ tea products.
The EU rules and regulations place an obligation on food business operators to ensure that all stages of production, processing, and distribution of tea under their control satisfy the relevant hygiene requirements laid down in the regulations. They also call for onsite inspection of 10% of the goods imported and sampling tests for checking pesticide residues and other items. The exporters are also required to have the necessary entry documents to enter designated ports, as well as documents for testing.
7.8.3.2 Fruit and Vegetable Trade to the European Union
Similar to its restrictions on the import of tea, the European Union has a spe-cific set of rules and regulations to monitor the import of vegetables and fruits Appendix 7.2. Some of the guidelines include the requirements that products packed together must be of the same origin, variety, commercial class, or quality; they must be intact, sound, free from pests and damage from pests, and clean. Imported items are also classified as Class I and Class II, based on their quality standards. The European Union also has stringent norms on packaging and label-ling, with stipulations for visible information such as variety, origin, quality class, dispatcher name and address, and so on marked prominently. Each variety of fruit or vegetable should be packed separately. From the processed grain and agriprod-ucts perspective, ISO 22000 is a very popular standard today. Most agencies, such as the Spices Board, APEDA, and the Ministry of Food Processing provide subsi-dies in the form of reimbursements to the companies opting for the certifications.
Although agricultural trade is a necessity, regulating it so as to ensure adher-ence to quality, safety, and hygiene norms is also important. However, it is also essential to ensure that all countries are given a level playing field in the foreign trade of agricultural products. Some of the major quality issues that affect the produce relate to:
1. Macrobiological factors such as insects 2. Foreign bodies such as stones 3. Pesticide residue, which is emerging as a major concern 4. Microbiological factors
7.9 Secondary and tertiary processingThe demand for ensuring quality standards in processing plants is high. There are a number of stringent procedures and statutory rules with respect
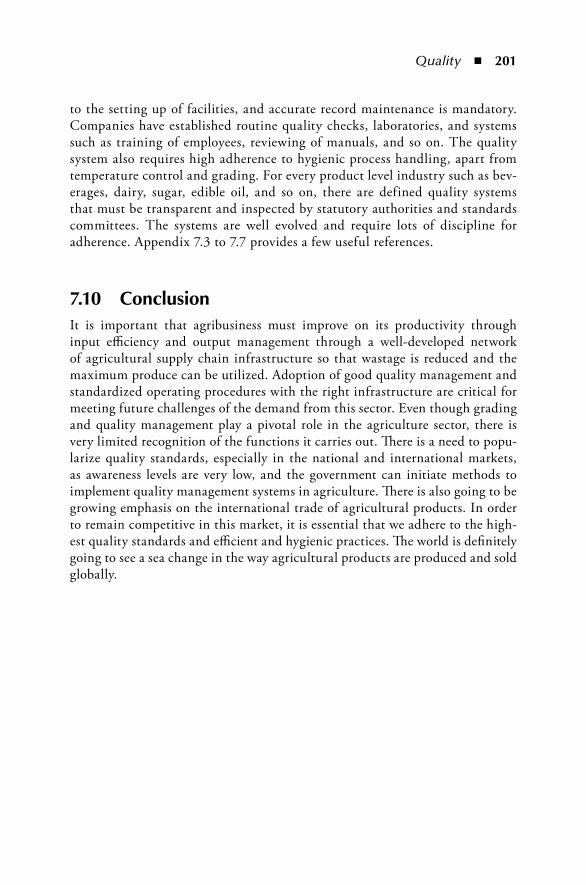
Quality ◾ 201
to the setting up of facilities, and accurate record maintenance is mandatory. Companies have established routine quality checks, laboratories, and systems such as training of employees, reviewing of manuals, and so on. The quality system also requires high adherence to hygienic process handling, apart from temperature control and grading. For every product level industry such as bev-erages, dairy, sugar, edible oil, and so on, there are defined quality systems that must be transparent and inspected by statutory authorities and standards committees. The systems are well evolved and require lots of discipline for adherence. Appendix 7.3 to 7.7 provides a few useful references.
7.10 ConclusionIt is important that agribusiness must improve on its productivity through input efficiency and output management through a well-developed network of agricultural supply chain infrastructure so that wastage is reduced and the maximum produce can be utilized. Adoption of good quality management and standardized operating procedures with the right infrastructure are critical for meeting future challenges of the demand from this sector. Even though grading and quality management play a pivotal role in the agriculture sector, there is very limited recognition of the functions it carries out. There is a need to popu-larize quality standards, especially in the national and international markets, as awareness levels are very low, and the government can initiate methods to implement quality management systems in agriculture. There is also going to be growing emphasis on the international trade of agricultural products. In order to remain competitive in this market, it is essential that we adhere to the high-est quality standards and efficient and hygienic practices. The world is definitely going to see a sea change in the way agricultural products are produced and sold globally.
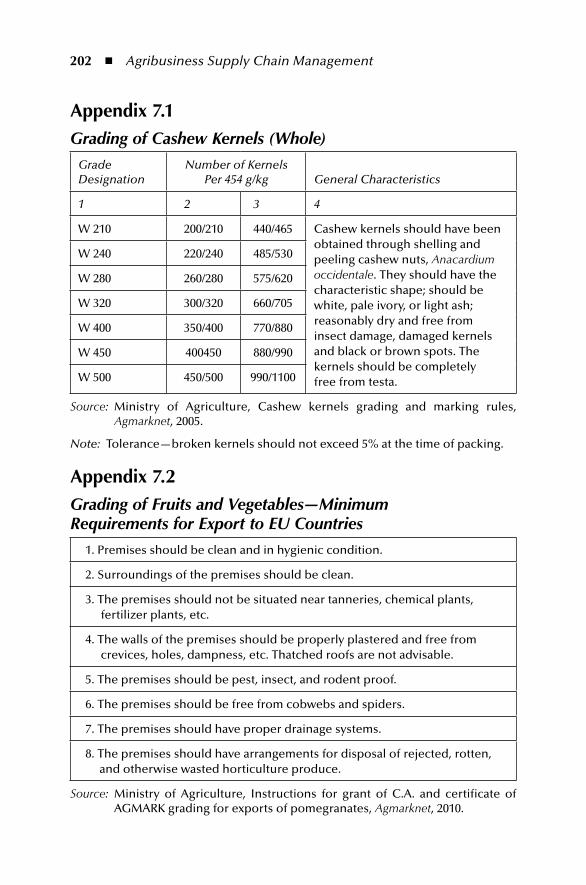
202 ◾ Agribusiness Supply Chain Management
Appendix 7.1Grading of Cashew Kernels (Whole)
Grade Designation
Number of Kernels Per 454 g/kg General Characteristics
1 2 3 4
W 210 200/210 440/465 Cashew kernels should have been obtained through shelling and peeling cashew nuts, Anacardium occidentale. They should have the characteristic shape; should be white, pale ivory, or light ash; reasonably dry and free from insect damage, damaged kernels and black or brown spots. The kernels should be completely free from testa.
W 240 220/240 485/530
W 280 260/280 575/620
W 320 300/320 660/705
W 400 350/400 770/880
W 450 400450 880/990
W 500 450/500 990/1100
Source: Ministry of Agriculture, Cashew kernels grading and marking rules, Agmarknet, 2005.
Note: Tolerance—broken kernels should not exceed 5% at the time of packing.
Appendix 7.2Grading of Fruits and Vegetables—Minimum Requirements for Export to EU Countries
1. Premises should be clean and in hygienic condition.
2. Surroundings of the premises should be clean.
3. The premises should not be situated near tanneries, chemical plants, fertilizer plants, etc.
4. The walls of the premises should be properly plastered and free from crevices, holes, dampness, etc. Thatched roofs are not advisable.
5. The premises should be pest, insect, and rodent proof.
6. The premises should be free from cobwebs and spiders.
7. The premises should have proper drainage systems.
8. The premises should have arrangements for disposal of rejected, rotten, and otherwise wasted horticulture produce.
Source: Ministry of Agriculture, Instructions for grant of C.A. and certificate of AGMARK grading for exports of pomegranates, Agmarknet, 2010.
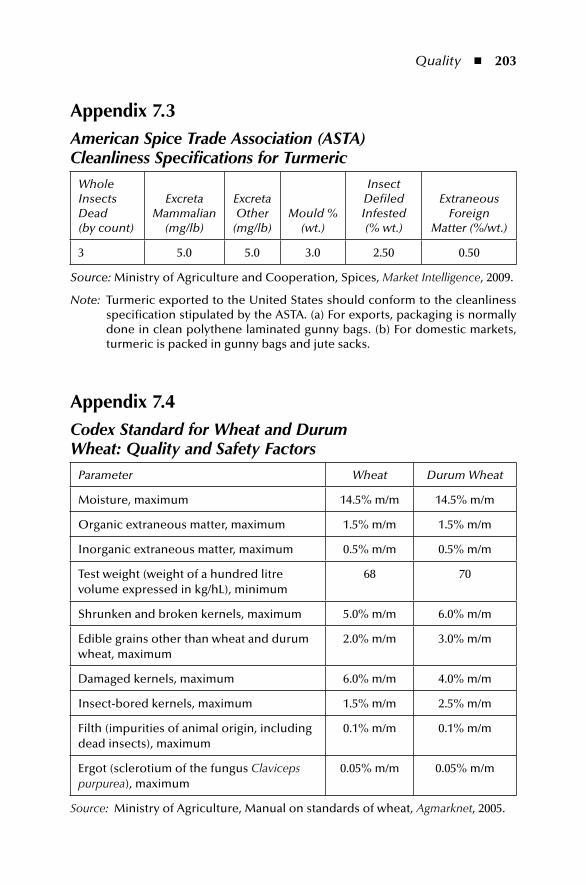
Quality ◾ 203
Appendix 7.3American Spice Trade Association (ASTA) Cleanliness Specifications for Turmeric
Whole Insects Dead (by count)
Excreta Mammalian
(mg/lb)
Excreta Other
(mg/lb)Mould %
(wt.)
Insect Defiled Infested (% wt.)
Extraneous Foreign
Matter (%/wt.)
3 5.0 5.0 3.0 2.50 0.50
Source: Ministry of Agriculture and Cooperation, Spices, Market Intelligence, 2009.
Note: Turmeric exported to the United States should conform to the cleanliness specification stipulated by the ASTA. (a) For exports, packaging is normally done in clean polythene laminated gunny bags. (b) For domestic markets, turmeric is packed in gunny bags and jute sacks.
Appendix 7.4Codex Standard for Wheat and Durum Wheat: Quality and Safety Factors
Parameter Wheat Durum Wheat
Moisture, maximum 14.5% m/m 14.5% m/m
Organic extraneous matter, maximum 1.5% m/m 1.5% m/m
Inorganic extraneous matter, maximum 0.5% m/m 0.5% m/m
Test weight (weight of a hundred litre volume expressed in kg/hL), minimum
68 70
Shrunken and broken kernels, maximum 5.0% m/m 6.0% m/m
Edible grains other than wheat and durum wheat, maximum
2.0% m/m 3.0% m/m
Damaged kernels, maximum 6.0% m/m 4.0% m/m
Insect-bored kernels, maximum 1.5% m/m 2.5% m/m
Filth (impurities of animal origin, including dead insects), maximum
0.1% m/m 0.1% m/m
Ergot (sclerotium of the fungus Claviceps purpurea), maximum
0.05% m/m 0.05% m/m
Source: Ministry of Agriculture, Manual on standards of wheat, Agmarknet, 2005.
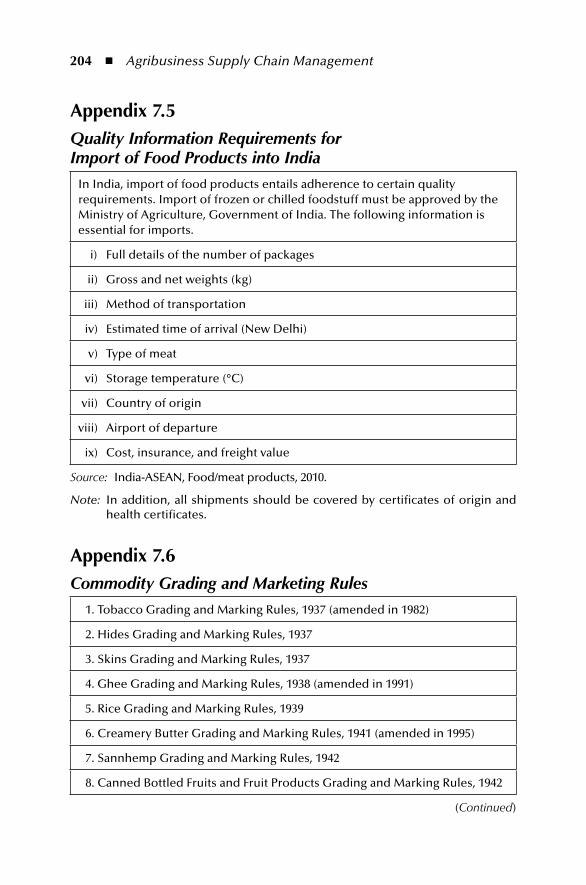
204 ◾ Agribusiness Supply Chain Management
Appendix 7.6Commodity Grading and Marketing Rules
1. Tobacco Grading and Marking Rules, 1937 (amended in 1982)
2. Hides Grading and Marking Rules, 1937
3. Skins Grading and Marking Rules, 1937
4. Ghee Grading and Marking Rules, 1938 (amended in 1991)
5. Rice Grading and Marking Rules, 1939
6. Creamery Butter Grading and Marking Rules, 1941 (amended in 1995)
7. Sannhemp Grading and Marking Rules, 1942
8. Canned Bottled Fruits and Fruit Products Grading and Marking Rules, 1942
(Continued)
Appendix 7.5Quality Information Requirements for Import of Food Products into India
In India, import of food products entails adherence to certain quality requirements. Import of frozen or chilled foodstuff must be approved by the Ministry of Agriculture, Government of India. The following information is essential for imports.
i) Full details of the number of packages
ii) Gross and net weights (kg)
iii) Method of transportation
iv) Estimated time of arrival (New Delhi)
v) Type of meat
vi) Storage temperature (°C)
vii) Country of origin
viii) Airport of departure
ix) Cost, insurance, and freight value
Source: India-ASEAN, Food/meat products, 2010.
Note: In addition, all shipments should be covered by certificates of origin and health certificates.
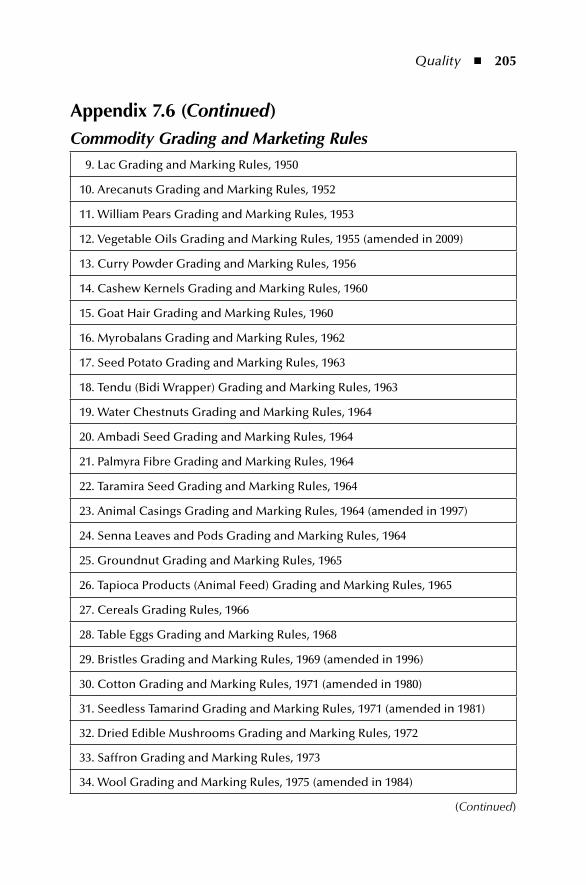
Quality ◾ 205
Appendix 7.6 (Continued)Commodity Grading and Marketing Rules
9. Lac Grading and Marking Rules, 1950
10. Arecanuts Grading and Marking Rules, 1952
11. William Pears Grading and Marking Rules, 1953
12. Vegetable Oils Grading and Marking Rules, 1955 (amended in 2009)
13. Curry Powder Grading and Marking Rules, 1956
14. Cashew Kernels Grading and Marking Rules, 1960
15. Goat Hair Grading and Marking Rules, 1960
16. Myrobalans Grading and Marking Rules, 1962
17. Seed Potato Grading and Marking Rules, 1963
18. Tendu (Bidi Wrapper) Grading and Marking Rules, 1963
19. Water Chestnuts Grading and Marking Rules, 1964
20. Ambadi Seed Grading and Marking Rules, 1964
21. Palmyra Fibre Grading and Marking Rules, 1964
22. Taramira Seed Grading and Marking Rules, 1964
23. Animal Casings Grading and Marking Rules, 1964 (amended in 1997)
24. Senna Leaves and Pods Grading and Marking Rules, 1964
25. Groundnut Grading and Marking Rules, 1965
26. Tapioca Products (Animal Feed) Grading and Marking Rules, 1965
27. Cereals Grading Rules, 1966
28. Table Eggs Grading and Marking Rules, 1968
29. Bristles Grading and Marking Rules, 1969 (amended in 1996)
30. Cotton Grading and Marking Rules, 1971 (amended in 1980)
31. Seedless Tamarind Grading and Marking Rules, 1971 (amended in 1981)
32. Dried Edible Mushrooms Grading and Marking Rules, 1972
33. Saffron Grading and Marking Rules, 1973
34. Wool Grading and Marking Rules, 1975 (amended in 1984)
(Continued)
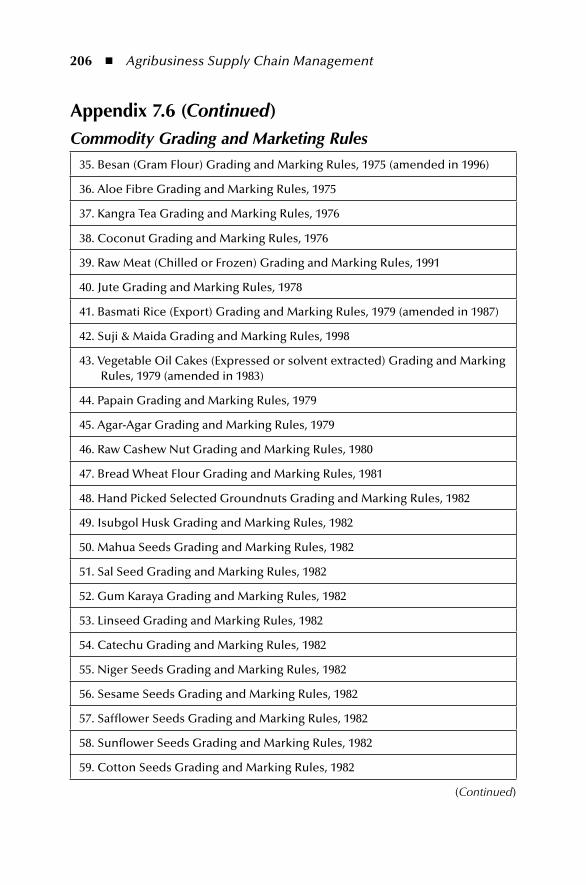
206 ◾ Agribusiness Supply Chain Management
Appendix 7.6 (Continued)Commodity Grading and Marketing Rules
35. Besan (Gram Flour) Grading and Marking Rules, 1975 (amended in 1996)
36. Aloe Fibre Grading and Marking Rules, 1975
37. Kangra Tea Grading and Marking Rules, 1976
38. Coconut Grading and Marking Rules, 1976
39. Raw Meat (Chilled or Frozen) Grading and Marking Rules, 1991
40. Jute Grading and Marking Rules, 1978
41. Basmati Rice (Export) Grading and Marking Rules, 1979 (amended in 1987)
42. Suji & Maida Grading and Marking Rules, 1998
43. Vegetable Oil Cakes (Expressed or solvent extracted) Grading and Marking Rules, 1979 (amended in 1983)
44. Papain Grading and Marking Rules, 1979
45. Agar-Agar Grading and Marking Rules, 1979
46. Raw Cashew Nut Grading and Marking Rules, 1980
47. Bread Wheat Flour Grading and Marking Rules, 1981
48. Hand Picked Selected Groundnuts Grading and Marking Rules, 1982
49. Isubgol Husk Grading and Marking Rules, 1982
50. Mahua Seeds Grading and Marking Rules, 1982
51. Sal Seed Grading and Marking Rules, 1982
52. Gum Karaya Grading and Marking Rules, 1982
53. Linseed Grading and Marking Rules, 1982
54. Catechu Grading and Marking Rules, 1982
55. Niger Seeds Grading and Marking Rules, 1982
56. Sesame Seeds Grading and Marking Rules, 1982
57. Safflower Seeds Grading and Marking Rules, 1982
58. Sunflower Seeds Grading and Marking Rules, 1982
59. Cotton Seeds Grading and Marking Rules, 1982
(Continued)
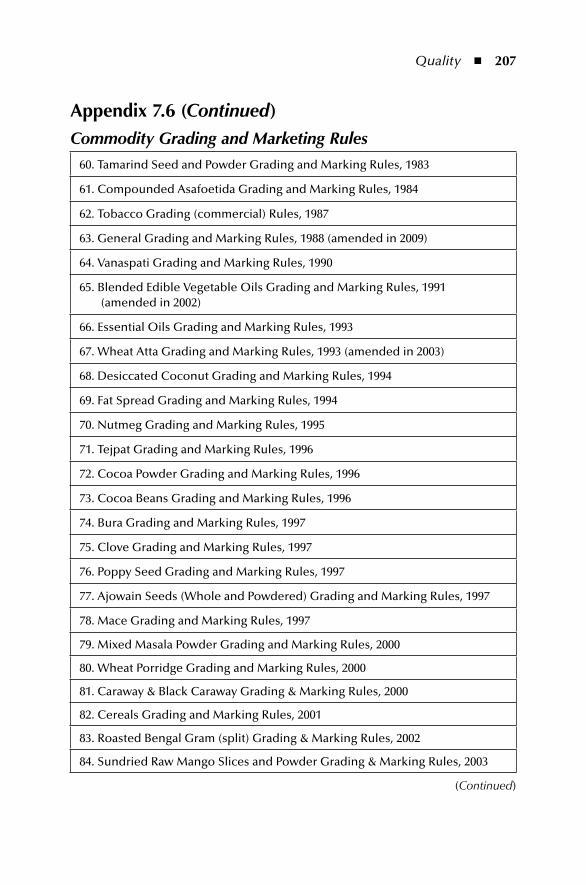
Quality ◾ 207
Appendix 7.6 (Continued)Commodity Grading and Marketing Rules
60. Tamarind Seed and Powder Grading and Marking Rules, 1983
61. Compounded Asafoetida Grading and Marking Rules, 1984
62. Tobacco Grading (commercial) Rules, 1987
63. General Grading and Marking Rules, 1988 (amended in 2009)
64. Vanaspati Grading and Marking Rules, 1990
65. Blended Edible Vegetable Oils Grading and Marking Rules, 1991 (amended in 2002)
66. Essential Oils Grading and Marking Rules, 1993
67. Wheat Atta Grading and Marking Rules, 1993 (amended in 2003)
68. Desiccated Coconut Grading and Marking Rules, 1994
69. Fat Spread Grading and Marking Rules, 1994
70. Nutmeg Grading and Marking Rules, 1995
71. Tejpat Grading and Marking Rules, 1996
72. Cocoa Powder Grading and Marking Rules, 1996
73. Cocoa Beans Grading and Marking Rules, 1996
74. Bura Grading and Marking Rules, 1997
75. Clove Grading and Marking Rules, 1997
76. Poppy Seed Grading and Marking Rules, 1997
77. Ajowain Seeds (Whole and Powdered) Grading and Marking Rules, 1997
78. Mace Grading and Marking Rules, 1997
79. Mixed Masala Powder Grading and Marking Rules, 2000
80. Wheat Porridge Grading and Marking Rules, 2000
81. Caraway & Black Caraway Grading & Marking Rules, 2000
82. Cereals Grading and Marking Rules, 2001
83. Roasted Bengal Gram (split) Grading & Marking Rules, 2002
84. Sundried Raw Mango Slices and Powder Grading & Marking Rules, 2003
(Continued)
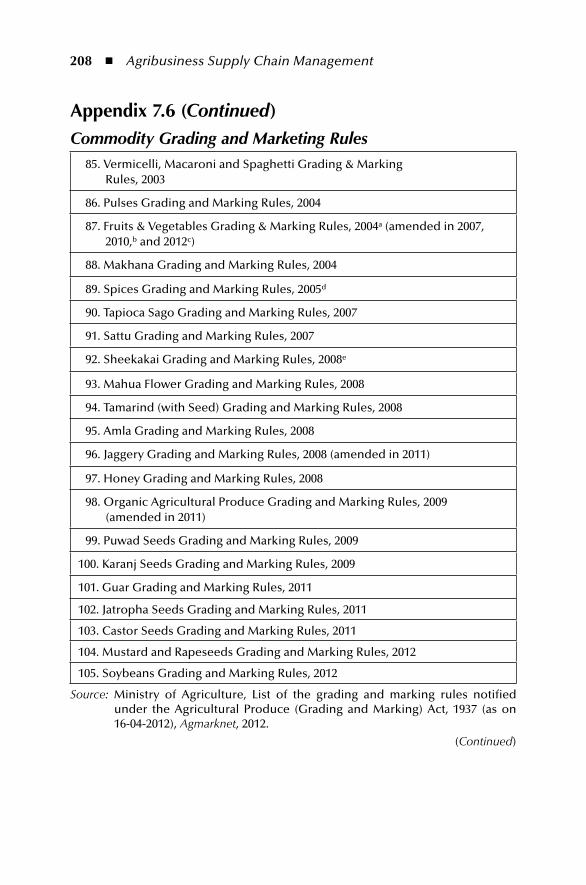
208 ◾ Agribusiness Supply Chain Management
Appendix 7.6 (Continued)Commodity Grading and Marketing Rules
85. Vermicelli, Macaroni and Spaghetti Grading & Marking Rules, 2003
86. Pulses Grading and Marking Rules, 2004
87. Fruits & Vegetables Grading & Marking Rules, 2004a (amended in 2007, 2010,b and 2012c)
88. Makhana Grading and Marking Rules, 2004
89. Spices Grading and Marking Rules, 2005d
90. Tapioca Sago Grading and Marking Rules, 2007
91. Sattu Grading and Marking Rules, 2007
92. Sheekakai Grading and Marking Rules, 2008e
93. Mahua Flower Grading and Marking Rules, 2008
94. Tamarind (with Seed) Grading and Marking Rules, 2008
95. Amla Grading and Marking Rules, 2008
96. Jaggery Grading and Marking Rules, 2008 (amended in 2011)
97. Honey Grading and Marking Rules, 2008
98. Organic Agricultural Produce Grading and Marking Rules, 2009 (amended in 2011)
99. Puwad Seeds Grading and Marking Rules, 2009
100. Karanj Seeds Grading and Marking Rules, 2009
101. Guar Grading and Marking Rules, 2011
102. Jatropha Seeds Grading and Marking Rules, 2011
103. Castor Seeds Grading and Marking Rules, 2011
104. Mustard and Rapeseeds Grading and Marking Rules, 2012
105. Soybeans Grading and Marking Rules, 2012
Source: Ministry of Agriculture, List of the grading and marking rules notified under the Agricultural Produce (Grading and Marking) Act, 1937 (as on 16-04-2012), Agmarknet, 2012.
(Continued)
Quality ◾ 209
Appendix 7.6 (Continued)Commodity Grading and Marketing Rulesa In exercise of the powers conferred by Section 3 of the Agricultural Produce
(Grading and Marking) Act, 1937 (1 of 1937), and in supersession of (1) the Grapes Grading and Marking Rules, 1937; (2) the Plums Grading and Marking Rules, 1938; (3) the Onion Grading and Marking Rules, 1964; (4) the Banana Grading and Marking Rules, 1980; (5) the Mangoes Grading and Marking Rules, 1981; (6) the Pineapple Grading and Marking Rules, 1982; (7) the Guavas Grading and Marking Rules, 1996; and (8) the Garlic Grading and Marking Rules, 2002. Fruits and Vegetables Grading and Marking Rules, 2004 was published vide GSR 220 dated 14 June 2004, on pages 1209–1285 dated 26 June 2004 in the Gazette of India Part II Section 3, sub-section (i).
b In exercise of the powers conferred by Section 3 of the Agricultural Produce (Grading and Marking) Act, 1937 (1 of 1937) and in supersession of (1) Citrus Fruits Grading & Marking Rules, 1949; (2) Table Potato Grading & Marking Rules, 1950; (3) Table Potato (for export) Grading & Marking Rules, 1964; (4) Walnut Grading & Marking Rules, 1960; (5) Oranges (for export) Grading & Marking Rules, v1983, the Fruits and Vegetables G&M (amendment) Rules, 2010, is published in the Gazette of India vide GSR no. 186(E), dated 12 March 2010.
c In exercise of the powers conferred by Section 3 of the Agricultural Produce (Grading and Marking) Act, 1937 (1 of 1937) and in supersession of the Apples Grading and Marking Rules, 1984, the Fruits and Vegetables G&M(amendment) Rules, 2012, is published in the Gazette of India.
d In exercise of the powers conferred by Section 3 of the Agricultural Produce (Grading and Marking) Act, 1937 (1 of 1937) and in supersession of (1) the Chillies Grading and Marking Rules, 1962; (2) the Cardamom Grading and Marking Rules, 1962; (3) the Turmeric Grading and Marking Rules, 1964; (4) the Chillies Powder Grading and Marking Rules, 1964; (5) the Ginger Grading and Marking Rules, 1964; (6) the Fennel (whole and ground), Fenugreek (whole and ground), and Celery seeds Grading and Marking Rules, 1967; (7) the Pepper Grading and Marking Rules, 1969; (8) the Coriander Grading and Marking Rules, 1997; (9) the Cumin Seeds Grading and Marking Rules, 1997; and (10) the Large Cardamom Grading and Marking Rules, 1998. The Spices Grading and Marking Rules, 2005 was published vide GSR 257 dated 21 July 2005 appearing on pages 943–991 dated 30 July 2005, in the Gazette of India, Part II, Section 3, sub-section (i).
e In exercise of the powers conferred by Section 3 of the Agricultural Produce (Grading and Marking) Act, 1937 (1 of 1937) and in supersession of Sheekakai Powder Grading and Marking Rules, 1973; the Sheekakai Grading and Marking Rules, 2008 was published vide GSR 66(E) dated 31 January 2008, in the Gazette of India, Part II, Section 3, sub-section (i) dated 02 February 2008.
210 ◾ Agribusiness Supply Chain Management
Appendix 7.7National and International Standards—Websites List
1. http://agmarknet.nic.in
2. www.iso.org
3. http://www.unece.org
4. http://www.wto.org/english/tratop_e/sps_e/spsagr_e.htm
5. http://www.naqs.go.kr/english/vision/vision.jsp
6. http://www.codexalimentarius.org
7. http://www.apeda.gov.in/apedawebsite/Latest_Notification/Latest_Notice.htm
8. http://www.mofpi.nic.in/
9. http://coconutboard.nic.in/
10. http://www.indianspices.com/php/trade_notifc.php
11. http://www.cashewindia.org/
12. http://www.indiatrademarkregistration.com/fpo-certification/
13. http://standardsdata.in/
14. www.ifoam.org/
referencesIndia-ASEAN, Food/meat products, 2010. http://www.india-aseanbusinessfair.com/e/
guidelines-food%20-products.pdfMinistry of Agriculture, Fruits and vegetables grading and marking rules, Agmarknet, 2004.
http://agmarknet.nic.in/fveggmrules04.htm#pomegranateMinistry of Agriculture, Manual on standards of wheat, Agmarknet, 2005. http://agmarknet.
nic.in/Wheat_manual.htmMinistry of Agriculture, Cashew kernels grading and marking rules, Agmarknet, 2005. http://
agmarknet.nic.in/cashewkernelsgmr.pdfMinistry of Agriculture, Instructions for grant of C.A. and certificate of AGMARK grading
for exports of pomegranates, Agmarknet, 2010. http://agmarknet.nic.in/Pomecert.pdfMinistry of Agriculture, DMI statistics 2011–12, Agmarknet, 2012. http://agmarknet.nic.
in/agmstat2012.pdfMinistry of Agriculture, List of the grading and marking rules notified under the Agricultural
Produce (Grading and Marking) Act, 1937 (as on 16-04-2012), Agmarknet, 2012. http://agmarknet.nic.in/listgradinglatest.pdf
Ministry of Agriculture, Notification (Fruits and vegetables grading and marking rules), Agmarknet, 2012. http://agmarknet.nic.in/FruitVegGmRules2012.pdf
Ministry of Agriculture and Cooperation, Spices, Market Intelligence, 2009. http://mi.agri.net.in/Default.aspx?mypath=Domestic/Spices
Ministry of Micro, Small & Medium Enterprises, Cold storage, Chap. 7 in Food Project Profiles, 2004. http://www.dcmsme.gov.in/publications/pmryprof/food/ch7.pdf
211
Chapter 8
risk
8.1 introductionIndian agriculture is subject to various risks and uncertainties. It is dependent on the monsoon, as perennial river resources are inadequate. Indian agriculture is hampered periodically as well as sporadically by droughts due to insufficient rains, and at times even by the total failure of monsoon. This dependence has stayed at such a level that Indian agriculture is described as “a gamble against monsoon.”
One would expect that the technology explosion in modern society can help in managing the risks in agribusiness. Modern management science facilitates understanding of and controlling the macro environment’s impact on business. In contemporary business, technological advancements are judged by their effective-ness in managing “uncertainties.” It may be noted that risks manifest themselves in two forms: normal and radical uncertainties.
On a different note, situations relating to risk can be discussed based on the probabilities of occurrence and the possibilities of damages. This refers to situations where the possible damages and their probabilities are known, and also to situations where the probabilities are unknown or the decision takers are confronted with ignorance (“unknown unknowns” or “don’t know what we don’t know” and how
Obje CTIv eThe objective of this chapter is to understand the different sources and classification of risks that affect agribusiness supply chains. Further, discus-sions include risk mitigation strategies, and detail price and market risks and support system for handling these issues. Insurance support is also discussed.
212 ◾ Agribusiness Supply Chain Management
relevant the issue is for our decisions), indeterminacy (issue conditions and causal chains open, outcomes dependent on how intermediate actors behave), complexity (open behavioural systems and multiplex, often non-linear processes) and so on. Typically one of the ways of differentiating risk and uncertainties is that the former can be understood and captured through probability of occurrences, whereas the latter is too unsure to be assigned with probability of occurrences.
As in any economic system, agriculture and agribusiness carry a number of risks and uncertainties. There are a number of controllable and uncontrollable factors that could affect agribusiness economic activities. These include weather climatic conditions, economic cycle, crop diseases, market factors like excess supply and low demand, and so on. There are a number of role agents in agribusiness supply chains. Risk impact and the ability to handle risks vary widely among them. For example, farmers are not generally well informed, and lack training in forecasting risk possibilities and pursuing mitigation strategies. On the other hand, corporates in agribusiness may be better off.
This risk would affect farm production decisions and role agents. How a role agent like a farmer manages such risks is an interesting issue. Like any decision maker, a farmer has to decide on various issues: farming, using portfolio techniques of his holdings and investment and using market instruments and other tools tra-ditionally available for managing risks. The government, as a facilitator and direct interventionist in this sector for the larger good of society, provides a number of support programmes to manage risks. Financial schemes like crop insurance and support financing, including subsidies and other forms of assistance that are routed through banking and insurance companies, facilitate managing risks. One may note that government policies and actions, the schemes of financial agencies and the overall farmer decision scenario in terms of on-farm and off-farm activities form a unique interdependent ecosystem.
There is also a need to study these interdependencies and develop an integral system. The integral system will help in better understanding of the actors, their actions and the implications of those actions. The risks can then be understood in terms of:
◾ sources of risks; ◾ risk management strategies and tools; ◾ government policies.
These three actors form an axis, and the interrelations among them and across the axis add to the complexity of risk management.
Agriculture by definition is a risky business. It is governed by the fact that due to a complex physical and economic environment, the produce from agricultural activities is subjected to great variation. Further, the possible outcome (produce) may vary depending upon the interactions of different actors. The distinctions between danger and risk are not clearly drawn. Hence, it becomes necessary that the dangers
Risk ◾ 213
and risks are segregated in the case of agriculture. Thus, in order to have clearly set goals, we would define “risk as exposure to uncertain and unfavourable economic consequences. Further, the term ‘vulnerability’ is often used to define the likeli-hood that a risk will result in a significant decline in well-being, that is, it refers to the resilience or lack of resilience against a given adversity. Vulnerability does not depend only on the characteristics of the risk, but also on the asset endowment of the entity at risk and the availability of insurance mechanisms” (www.oecd.org).
We will now try to look at risk at a broader level and analyse it to form a frame-work for risk mitigation in supply chains. Risks basically include three elements:
◾ Risk assessment and evaluation ◾ Risk management ◾ Risk communication.
Risk assessment is generally performed by systematically processing all avail-able information. Such a process would help to identify events and triggers that may be potential risks for business. On the other hand, the risk evaluation process would assign priorities to risk events and then evaluate the impact. On comple-tion of risk evaluation, it is important that the results are communicated to the different stakeholders who may need such information. This is referred to as risk communication.
All these processes require a comprehensive risk management system. The system should address the different sources of risk that affect farming, and facilitate strategies to manage them. It should have appropriate tools earmarked for combat-ing various kinds of risk. A typical approach to risk management would include (a) assessing and measuring the risks and their impact on income and assets; (b) collecting and analysing information to understand the optimal risk manage-ment tool for a farmer, while accounting for his endowments and risk preferences, and (c) deciding on appropriate policies to improve this risk management strategy.
These three elements are not related in a linear fashion. They interact in a com-plex manner. It is often not possible to isolate and identify individual risks and strategies for individual farmers against the backdrop of government policies, and thus, a holistic approach is needed for the analysis of the system.
8.2 Sources of risks“The risks and sources of risks that are relevant in agriculture have different charac-teristics, and they can be classified in very different ways. These can be classified in varying terms according to the context of the study. Some technical characteristics of risks apply across different classes, and these characteristics can be very signifi-cant in terms of determining the appropriate and available strategies to deal with each risk” (OECD, 2010).
214 ◾ Agribusiness Supply Chain Management
We will further discuss the possible classifications of the sources of risk, the cor-relations among them, and the links between agricultural risk and climate change.
The risks in agriculture may be defined as systematic and non-systematic risks. Systematic risks are related to events that repeat over time. A clear pattern can be drawn on the basis of past trends, and the pattern can be relied upon. The non-systematic risks are characterized by very short and/or imperfect records of their past manifestations, and hence, it is not possible to predict their future occurrences.
It may be noted here that it is downside risk that matters most. Further, the probability of downside risk occurring is high as and when risky variables are interdependent and non-linear in their relationships. This is particularly relevant in agriculture. For instance, yields depend on several factors, such as rainfall and temperature, but large deviations from the mean values of these variables in either direction have an adverse effect on all agribusiness elements, including farm out-put, primary, secondary and tertiary sector processing and marketing.
In agriculture, a normal crop season could be one where all defined variables are likely to realize their expected outcomes. Hopes for a normal season are usually far-fetched, as it is more unlikely to happen in India, considering the past perfor-mances of the sector. In the event of abnormal, or rather, dismal performance of the variables, the downside risk could be higher. Though theoretically the downside must be supported by a similar upside in returns, it seldom happens in such a fashion. It is always up to analysts and experts to estimate distribution based on risk and arrange for cover with suitable protection.
The frequency of occurrence and the intensity of occurrence, that is, the magnitude of loss, are the important attributes of risks. “The links among the distributions of different risks are very important for any risk evaluation. An individual risk that is independent or uncorrelated with any other risk, including market risk, is called idiosyncratic risk. However, in reality, a risk has some degree of correlation with other risks. If there is a high degree of correlation among individuals in the same region or country, the risk is called systemic risk” (OECD, 2010). There could be correlation with other risks, and the nature of relationship could be positive or negative.
Another risk type is the catastrophic risk, associated with a risk that may be of low frequency, but results in high losses. It relates to the extreme of the negative tail of the distribution of outcomes. This is more linked to the possibilities of huge overall losses, which could occur to a region or a country from causes such as swine flu or a tsunami. Such incidences are simultaneously catastrophic and systemic.
8.3 Classifications of Agricultural risksThe risks in agriculture have been segregated into a number of different categories. There are a number of ways to classify these risks. A broad and general way of risk classification in agriculture is detailed in Table 8.1.
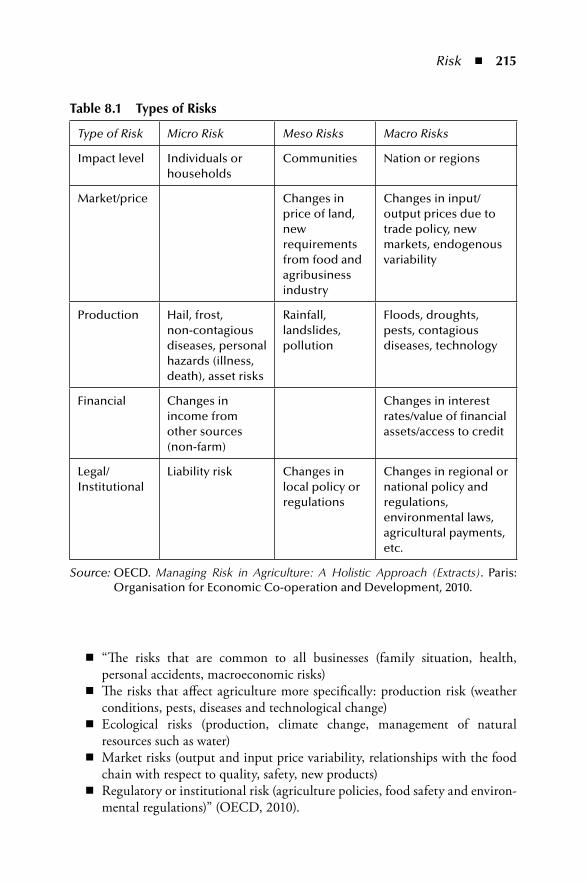
Risk ◾ 215
◾ “The risks that are common to all businesses (family situation, health, personal accidents, macroeconomic risks)
◾ The risks that affect agriculture more specifically: production risk (weather conditions, pests, diseases and technological change)
◾ Ecological risks (production, climate change, management of natural resources such as water)
◾ Market risks (output and input price variability, relationships with the food chain with respect to quality, safety, new products)
◾ Regulatory or institutional risk (agriculture policies, food safety and environ-mental regulations)” (OECD, 2010).
table 8.1 types of risks
Type of Risk Micro Risk Meso Risks Macro Risks
Impact level Individuals or households
Communities Nation or regions
Market/price Changes in price of land, new requirements from food and agribusiness industry
Changes in input/output prices due to trade policy, new markets, endogenous variability
Production Hail, frost, non-contagious diseases, personal hazards (illness, death), asset risks
Rainfall, landslides, pollution
Floods, droughts, pests, contagious diseases, technology
Financial Changes in income from other sources (non-farm)
Changes in interest rates/value of financial assets/access to credit
Legal/Institutional
Liability risk Changes in local policy or regulations
Changes in regional or national policy and regulations, environmental laws, agricultural payments, etc.
Source: OECD. Managing Risk in Agriculture: A Holistic Approach (Extracts). Paris: Organisation for Economic Co-operation and Development, 2010.
216 ◾ Agribusiness Supply Chain Management
However, a more precise and acceptable way to distinguish agriculture risk is described here.
The first category is “business risk, which includes production, markets, institu-tional and personal risks. Production risk is linked to natural phenomena and their relationships with agriculture. Production risk is due to unpredictable weather and performance of crops and livestock. It is concerned with variations in crop yields and in livestock production due to weather conditions, diseases and pests. Market risk is related to uncertainty about the prices of outputs (and sometimes inputs, too) at the time production decisions are taken. Marketing risk is related to variations in commodity prices and quantities that can be marketed in the post-production situation. Institutional risk is due to government actions and regulations such as the laws governing disposal of animal manure, the use of pesticides, tax provisions and payments. Legal and environmental risks are concerned with the possibility of lawsuits initiated by other businesses or individuals and changes in government regulations related to the environment and farming practices. Personal risks are due to uncertain life events, such as death, divorce or illnesses. These are associated with the personal matters of farm households. The human resources risk is concerned with the possibility that family or employees will not be available to provide labour or management” (OECD, 2010).
The second category includes “financial risks arising from different methods of financing the farm business. These risks are related to the nature and source of borrowings. The use of borrowed funds means that interest charges have to be met before equity is rewarded, which may create risk due to leverage” (OECD, 2010). Additionally, there is financial risk when there is an increase in interest rates or a decrease in the quota of loans that are available to agribusiness. A financial risk relates to the ability to pay for expenses and dues when they are liable to be paid so that farmers and processing units have money to continue farming and to avoid bankruptcy.
“Price and production risk are two important components or types of farming risk. However, they have different origins.
Production risk is determined by weather conditions and animal or plant diseases. Price risk originates in the markets for inputs and outputs” (OECD, 2010). This type of risk could also be generated in an economic environment due to the dynamics of the markets. Price and production risks are different with respect to all the important characteristics mentioned above, like information inefficiencies on systemic factors and market. Price and production risks differ, though the common perception would be that they must be highly correlated, as failure in production impacts with an upswing in price.
Price risk can be weakened by arbitrage or borrowing. “Normally, this makes prices for all farmers move in parallel, with very high correlation across farm-ers and regions whose markets are linked by trade” (OECD, 2010). Price risk is also influenced by factors like transportation and storage costs across locations and time.
Risk ◾ 217
Production risk could afflict farmers in a location because of large events like drought, floods and diseases that impact at a regional or a farm level due to inef-ficient management. A situation can arise where a farmer suffers a bad production year, while his neighbours have an average year. However, it is very unlikely that a farmer will receive a low price while his neighbours sell at much higher prices. It is difficult to use available information and collect more information to measure the magnitude of risks and their likely impact on earnings and asset positions. However, one may conclude that in general, it is far easier to predict and assess production risks compared to price risks.
8.3.1 ProductionThere are a number of facets of production risks that are enumerated here in this section.
8.3.1.1 Land Use Pattern
Land use patterns and usages have been changing in India. The increasing pressure of population, economic forces, livestock pressure and weakening of land laws and implementing institutions have further marred production. Added to this are the changes caused by natural factors. These factors are aggravated by the absence of any thinking and planning for the future.
India has a large land area of 328.73 million hectares (ha). Out of this, the land area in use is nearly 306 million ha (Appendix 8.1). The total land area under agriculture and related use is nearly 141 million ha. In addition to this, India has 17 million ha of barren and uncultivable land, 13 million ha of cultivable waste land, 10 million ha under permanent pasture and other grazing and 3 million ha under miscellaneous tree crops and groves. Over the years, there has been an increase in the land used for non-agricultural uses. Over the last 40 years, the net sown area has remained constant. The area under non-agricultural uses has increased from 16 to 26 million ha, while the land area that is barren and uncultivable has come down from 28 million ha in 1970–1971 to 17 million ha in 2008–2009.
This diversion of land from agriculture to other usages has resulted in an abrupt increase in the area under non-agriculture use land. However, the government has played a critical role in mitigating this negative impact of the land use trend. It has worked to improve the quality of barren and cultivable land and make it fit for agricul-ture use. Cropping intensity has increased from 118% to 138% during the same period.
The above trend shows a shift in land use from agriculture to urban use. This pose a serious threat to agricultural output, as the rate of urbanization is 2.4%, com-pared to a population growth rate of 1.132%. This rate of urbanization is the highest in the world. The increasing pressure of population and urbanization and increasing family income and literacy rates coupled with growth in the service and manufac-turing sectors will negatively affect agriculture farm production. It is projected in
218 ◾ Agribusiness Supply Chain Management
studies that the population explosion will result in a decrease in the per capita land availability from 0.32 ha in 2001 (against the world average of 2.19 ha) to 0.23 ha in 2025 and 0.19 ha in 2050. Further, it is reported that about 120 million ha of land is degraded in India, and about 5334 million tonnes of soil are lost annually through erosion. Out of 120 million ha of degraded area, a large portion is degraded because of water erosion (68%). The next worst factor is chemical erosion, which accounts for 21%, and then, wind erosion, which accounts for 10%. It is high time that poli-cymakers in India address the management of these issues, which could be caused by ecological degradation, improper management of water tables and discharge of effluents by manufacturers and processors. Apart from these factors, India also suf-fers from small size and fragmented holdings, tenancy, ceiling limits, improper land records, acquisition and diversion of productive land and climate change.
The above description suggests that there is very limited scope to expand the area under cultivation. This is primarily due to increase in industrialization, urban-ization, housing and infrastructure. With the increasing population pressure and the decreasing per capita availability of cultivable land, there is a need to enhance cropping intensity without compromising land productivity. The green revolution has improved productivity, but its effects are limited, and now it is also having adverse effects. This situation has forced authorities to seek alternate sustainable solutions for land use and improve the efficiency of resources and inputs.
The above trend of land use suggests an increasing shortage of land in use, com-pounded by the need to achieve production increases. The shortage of cultivable land will translate into a decrease in production. Other factors, like the population, will further hamper productivity by reducing per capita land availability. Some suggestions to assuage these effects are discussed here.
◾ All resources, including land, need to be planned and managed in an integrated manner for maximization of environmental, social and economic factors, apart from ensuring livelihood and equity.
◾ Comprehensive land inventories and detailed policies have to be prepared. ◾ A perspective plan for treating degraded lands has to be prepared. ◾ Infrastructural facilities have to be developed, and the technology support
system needs to be strengthened. ◾ Investments have to be made in capacity building, education and awareness
on the importance of conservation and optimum use of all natural resources. ◾ Continuous monitoring and assessment of the impact of climate change on
land use has to be done, and appropriate remedial measures suggested and undertaken.
8.3.1.2 Soil
Soil is a highly complex, multi-component system of water, air, rock strata and liv-ing materials. The interactions among these elements determine the properties of
Risk ◾ 219
the soil. Soil is classified into types, orders, groups and sub-groups. It is reported that 90% of soils are low to medium in nitrogen (N), 80% in phosphorus (P) and 50% in potassium (K). Incidences of micronutrient deficiencies are also increasing.
Soil health from the agricultural point of view refers to the capacity of the soil to ensure proper physical, chemical and biological activities. Effective management practices are required for sustaining higher crop productivity. Good soil would ensure proper retention and release of water and nutrients. It would also aid in promoting and sustaining root growth. It also resists degradation.
The major threats to soil quality come from
◾ loss of organic carbon, ◾ erosion, ◾ nutrient imbalance, ◾ compaction, ◾ salinization, ◾ water-logging, ◾ decline in soil bio-diversity, urbanization, ◾ contamination with heavy metals and pesticides, and ◾ the adverse impacts of climate changes.
A number of programmes have been initiated at the national level to counter the ill effects on soil. All of these programmes have been started by the government at the central and local levels. Primarily, these programmes are aimed at imparting knowledge to the farmers. Some of these initiatives are
◾ the use of chemical fertilizers along with organic manures based on soil test outcomes, and fertility maps based on crops and other practices;
◾ providing soil health cards, which are farm level repositories of information; ◾ encouraging integrated farming practices balancing varied factors; ◾ corrective actions in locations where soil is affected by salinity or leaching of
salts; ◾ deploying technology like GPS to collect data, analysis and decision making.
The use of this technology should also be increased by the government.
8.3.1.3 Water and Irrigation
Water shortage is a serious issue in India, and would be compounded in the decades to come. There are spatial variations because of the wide spread of the country. There is a temporal variation because large tracts of land are dependent on the mon-soon, which fluctuates between a good one and a bad one year on year. Water posi-tion and usage is also affected by high evaporation levels and climate changes. On top of all these factors is diversion, or competing demands for water, which affects agribusiness.
220 ◾ Agribusiness Supply Chain Management
To handle such precarious water availability position, extensive knowledge and information practically applied to solve specific area- and factor-wise problems are required. Specifically, for example,
◾ More rigorous understanding and integration of the biophysical and socio-economic processes involved in water resources generation and agricultural production is required. These aspects include climatic, hydrologic, hydraulic and soil-water processes, ground recharge patterns, crop growth patterns, and economic processes at the farm, regional and global levels.
◾ Extensive data, information and knowledge systems are required. These have to be created across regions and times and periods. They have to be analysed by policy and decision makers in various networks.
◾ Improved understanding of system behaviour needs to be accompanied by efficient methods of water control and execution in the conveyance and field application areas.
◾ Importance should be given to development of recharge measures and prudent use of efficient methods like micro irrigation.
Irrigation efficiency is at present 35% in the case of surface water systems and 65% in the case of ground water systems. In principle, there is scope to increase the former to 60% and the latter to 75%. Even a rise by 5% can impact about 10–15 million hectares. Though new irrigations systems like drip, trickle, micro jets and sprayers have been attempted in India, overall adoption has been very minimal.
8.3.1.4 Weather and Climate
Weather and climate variability, covering the quantity and temporal and spatial dis-tribution of rainfall during June to September, are very important determinants of agricultural performance during the kharif season. The key aspects comprise quan-titative forecasts for seven weather parameters, namely, rainfall, maximum temper-ature, minimum temperature, wind speed, wind direction, relative humidity and cloudiness. The risks to the Indian agriculture sector due to climatic variability and extreme events would be felt at the basic levels of crops, livestock, farms, cropping systems and food systems. Needless to say, failure to adopt risk mitigation strategies would lead to issues like hyper food inflation and engulf food security issues.
Therefore, it becomes imperative that Indian agriculture is transformed into a climate-resilient production system through suitable adaptation and mitigation measures in the domains of both crops and animal husbandry. The measures would include research and development in crop management, development of technology for agribusiness activities, adoption of best practices in farm and processing, cre-ation of physical infrastructure, allocation of financial support through appropriate institutional framework and so on. The focus should be on developing integrated
Risk ◾ 221
agriculture development in rain-fed areas as well as on developing dry-land agricul-ture. The ultimate goal would be to ensure sustainable agricultural development.
This would mean that the focus of agricultural investments must be on irriga-tion development, research and commercialization of crop varieties that could resist drought, development of information technology using satellite and communica-tion systems and development of a pool of scientists, researchers, statisticians and economists in agribusiness.
Some of the risk mitigation strategies are discussed below.
◾ Arrangements should be made to appropriately replace the rabi and kharif crops with each other in case of low yield or disasters. This strategy would enable loss to be minimized and impact nullified. This may include irrigation facilities as a primary requirement.
◾ The climate risk information system should be strengthened. This should be done not only at the information gathering and analysis levels, but also at the information dispensing level. This would require building up the capacity of climate assessment agencies.
◾ Better water management approaches like water budgeting, water conserva-tion, artificial recharging of water, development of community ponds, and so on.
◾ To achieve targets in agricultural production, priority investments would be required in building up the climate resilience of vulnerable rural com-munities with a portfolio of adaptation options that can address climate risks.
8.3.1.5 Farm Inputs and Management
The key inputs that change the complexion of agriculture include high-yielding variety (HYV) seeds, chemical fertilizers, irrigation, pesticides, farm machinery and equipment, credit and labour.
8.3.1.5.1 Fertilizers
“Fertilizer accounts for a significant portion of total operating costs, averaging around 30% for wheat production, 20% for sorghum and up to 40% for intensive corn production” (Kenkel, 2010). If fertilizer price volatility could be completely eliminated, the results would eliminate yield variability, as farming would con-sistently use fertilizers. In such a situation, this leads to overall risk reduction by managing input costs and output productivity. In the case of developed nations like the United States, “fertilizer prices have tended to move somewhat in tandem with crop prices. The scenario of low crop prices coupled with high fertilizer prices would stress farm profits.
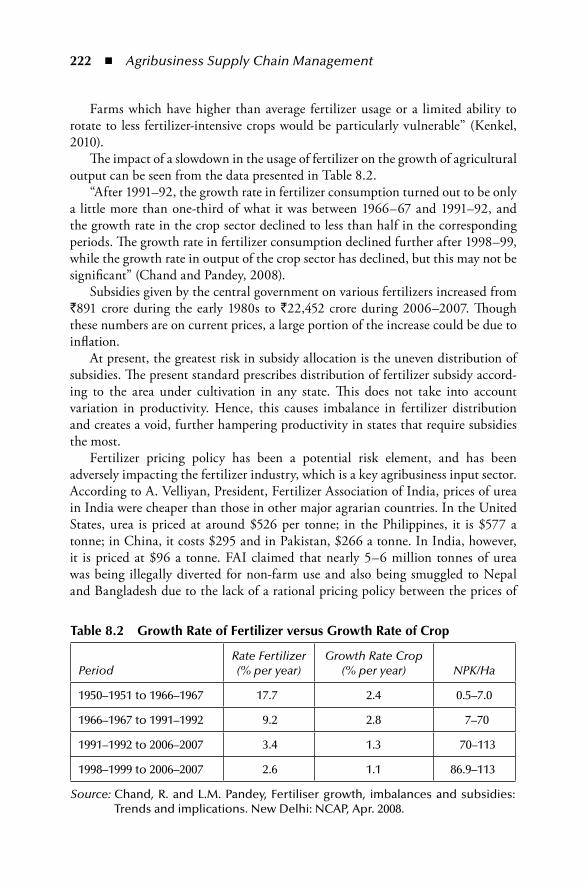
222 ◾ Agribusiness Supply Chain Management
Farms which have higher than average fertilizer usage or a limited ability to rotate to less fertilizer-intensive crops would be particularly vulnerable” (Kenkel, 2010).
The impact of a slowdown in the usage of fertilizer on the growth of agricultural output can be seen from the data presented in Table 8.2.
“After 1991–92, the growth rate in fertilizer consumption turned out to be only a little more than one-third of what it was between 1966–67 and 1991–92, and the growth rate in the crop sector declined to less than half in the corresponding periods. The growth rate in fertilizer consumption declined further after 1998–99, while the growth rate in output of the crop sector has declined, but this may not be significant” (Chand and Pandey, 2008).
Subsidies given by the central government on various fertilizers increased from `891 crore during the early 1980s to `22,452 crore during 2006–2007. Though these numbers are on current prices, a large portion of the increase could be due to inflation.
At present, the greatest risk in subsidy allocation is the uneven distribution of subsidies. The present standard prescribes distribution of fertilizer subsidy accord-ing to the area under cultivation in any state. This does not take into account variation in productivity. Hence, this causes imbalance in fertilizer distribution and creates a void, further hampering productivity in states that require subsidies the most.
Fertilizer pricing policy has been a potential risk element, and has been adversely impacting the fertilizer industry, which is a key agribusiness input sector. According to A. Velliyan, President, Fertilizer Association of India, prices of urea in India were cheaper than those in other major agrarian countries. In the United States, urea is priced at around $526 per tonne; in the Philippines, it is $577 a tonne; in China, it costs $295 and in Pakistan, $266 a tonne. In India, however, it is priced at $96 a tonne. FAI claimed that nearly 5–6 million tonnes of urea was being illegally diverted for non-farm use and also being smuggled to Nepal and Bangladesh due to the lack of a rational pricing policy between the prices of
table 8.2 Growth rate of Fertilizer versus Growth rate of Crop
PeriodRate Fertilizer (% per year)
Growth Rate Crop (% per year) NPK/Ha
1950–1951 to 1966–1967 17.7 2.4 0.5–7.0
1966–1967 to 1991–1992 9.2 2.8 7–70
1991–1992 to 2006–2007 3.4 1.3 70–113
1998–1999 to 2006–2007 2.6 1.1 86.9–113
Source: Chand, R. and L.M. Pandey, Fertiliser growth, imbalances and subsidies: Trends and implications. New Delhi: NCAP, Apr. 2008.
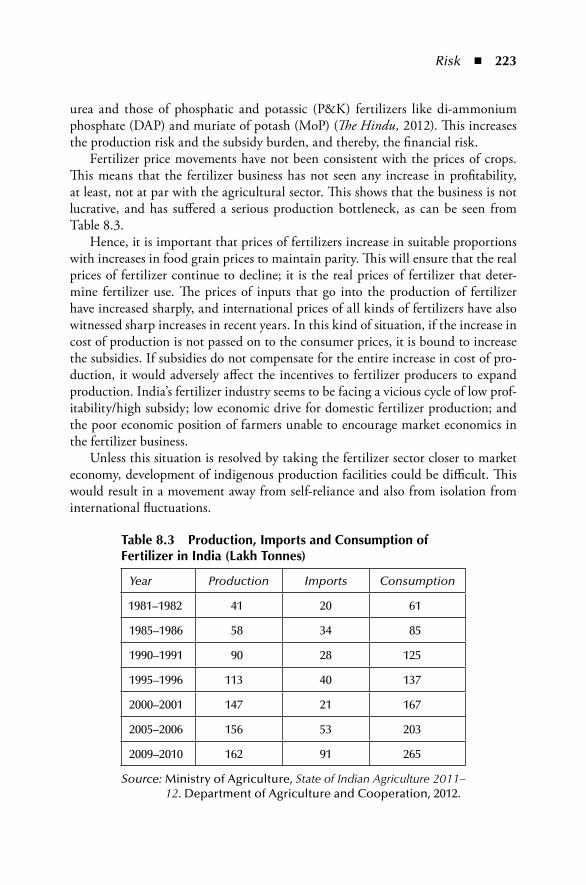
Risk ◾ 223
urea and those of phosphatic and potassic (P&K) fertilizers like di-ammonium phosphate (DAP) and muriate of potash (MoP) (The Hindu, 2012). This increases the production risk and the subsidy burden, and thereby, the financial risk.
Fertilizer price movements have not been consistent with the prices of crops. This means that the fertilizer business has not seen any increase in profitability, at least, not at par with the agricultural sector. This shows that the business is not lucrative, and has suffered a serious production bottleneck, as can be seen from Table 8.3.
Hence, it is important that prices of fertilizers increase in suitable proportions with increases in food grain prices to maintain parity. This will ensure that the real prices of fertilizer continue to decline; it is the real prices of fertilizer that deter-mine fertilizer use. The prices of inputs that go into the production of fertilizer have increased sharply, and international prices of all kinds of fertilizers have also witnessed sharp increases in recent years. In this kind of situation, if the increase in cost of production is not passed on to the consumer prices, it is bound to increase the subsidies. If subsidies do not compensate for the entire increase in cost of pro-duction, it would adversely affect the incentives to fertilizer producers to expand production. India’s fertilizer industry seems to be facing a vicious cycle of low prof-itability/high subsidy; low economic drive for domestic fertilizer production; and the poor economic position of farmers unable to encourage market economics in the fertilizer business.
Unless this situation is resolved by taking the fertilizer sector closer to market economy, development of indigenous production facilities could be difficult. This would result in a movement away from self-reliance and also from isolation from international fluctuations.
table 8.3 production, imports and Consumption of Fertilizer in india (Lakh tonnes)
Year Production Imports Consumption
1981–1982 41 20 61
1985–1986 58 34 85
1990–1991 90 28 125
1995–1996 113 40 137
2000–2001 147 21 167
2005–2006 156 53 203
2009–2010 162 91 265
Source: Ministry of Agriculture, State of Indian Agriculture 2011–12. Department of Agriculture and Cooperation, 2012.
224 ◾ Agribusiness Supply Chain Management
8.3.1.5.2 Farm Machinery and Equipment
The productivity of any farm depends on the use of modern technology. Farm mechanization saves time and labour, cuts down crop production costs in the long run, reduces post-harvest losses and boosts crop output and farm income. There is a likelihood of a strong correlation between farm mechanization and agricultural productivity, as has been observed in modern farming across the globe. In India, there has been a popular belief that states like Punjab, which adopted modern farm mechanization measures, have reaped higher productivity.
Thus, a low level of mechanization poses a threat to productivity. This mat-ter gains importance as the net sown area in India has remained constant over the past four decades. Hence, any improvement in productivity will come from improvement in inputs, processes and outputs. The inputs, namely raw materi-als, are given sufficient importance. The output factors like market development and prices mechanisms are also important. The process part is looked at only from the perspective of the key ingredients. The physical methods are rarely looked into. The importance of physical equipment is limited by the financial implications.
Some of the key benefits of using mechanization are discussed now.
◾ The “threat to natural resources, notably land and water, has further necessi-tated a switching over to machine-assisted resource-conservation techniques, such as zero tillage, raised-bed planting, precision farming, drip or sprinkler irrigation, etc.
◾ Mechanization allows some mitigating the effects of climate change by allow-ing the readjusting of crop sowing schedules.
◾ A greater degree of farm mechanization can also address the issues of scarcity of farm labour during the peak agricultural seasons of sowing and harvest-ing, even with the implementation of the Mahatma Gandhi National Rural Employment Guarantee Act (MGNREGA)” (Ministry of Agriculture, 2012).
8.3.1.5.3 Mechanization Process
Farm mechanization has become a dire necessity in view of the significant reduc-tion in the supply of labour for agricultural operations in recent years. With contin-ued shrinkage in average farm size, more and more farms will fall into the adversely affected category, thereby making individual ownership of agricultural machinery progressively more uneconomical. The higher risk due to “uncertain demand” and “immature markets” has barred even seasoned business entities from entering this segment. Non-availability of the much needed technical and institutional support, as well as of after sales infrastructures, has further prevented this segment from developing and maturing.
Risk ◾ 225
Risk mitigation strategies include
◾ increasing the reach of farm mechanization to small and marginal farmers and to regions where availability of farm power is low;
◾ offsetting adverse “economies of scale” and “higher cost of ownership” of high value farm equipment by promoting “custom hiring centres” for agricultural machinery;
◾ passing on the benefit of hi-tech, high value and highly productive agri-cultural machinery to farmers through creation of hubs for such farm equipment;
◾ promoting farm mechanization by creating awareness among stakeholders through demonstration and capacity building activities;
◾ ensuring quality control of newly developed agricultural machinery through performance evaluation and certification at designated testing centres located all over the country.
8.3.2 Prices and MarketsFood and agricultural commodity prices in India are primarily determined by domestic demand and supply factors influenced by domestic price policies. The nature of markets catering to agricultural commodities and the imperfections in these markets also influence price transmissions and final consumer prices. India meets a bulk of its large food demand through domestic production, barring a few commodities like edible oils and pulses.
In India, domestic demand and supply are the key determinants of agricul-tural commodity prices, as trade in agricultural products is especially unlikely to dampen prices or stimulate demand. India imports significant quantities of pulses and edible oils. They are sensitive, and prices are volatile. It is not just these two products, but also all other agro-based commodities that suffer market imperfections, which do not benefit the growers, the processors or the customers. However, intermediaries are able to benefit from these imperfections in the com-modity markets.
The rise in per capita income and its implications on food commodity prices need to be understood from the perspective of their impact on agribusiness. Per capita GDP has increased at an average rate of 6% per annum over the past five years. This means that the demand for products and commodities, especially for agro-based products, would go up. Production in the agricultural and allied sectors has to catch up with demand, or else prices cannot be controlled. A small decline in supplies can sharply affect the prices of these commodities.
In comparison to wholesale prices, retail prices in different consumption cen-tres display divergent trends in different markets.
226 ◾ Agribusiness Supply Chain Management
Such variations are due to differences in consumption patterns across regions in India. There are also supply and movement constraints which further aggravate such aberrations in prices. Added to these are infrastructural constraints, transpor-tation costs and government levies and taxes, which could further limit or widen market imperfections.
8.3.2.1 Market and Price Risks Drivers
The agriculture market is highly affected by local changes. This sector is highly fragmented, and hence the market forces and their effects are not so widespread. Retail prices in different consumption centres display divergent trends. Some of the key aspects driving the uncertainties in the markets are discussed in the following paragraphs.
The regional differences in consumption patterns and supply condition the prices, and their movements vary across the major markets. Imperfect market con-ditions, supply chain issues such as restrictions on the movement of agricultural commodities due to infrastructural constraints, transport costs and local taxes, and so on, influence retail price trends across the major markets and consumption centres.
Differences in tastes and varieties consumed across the centres also pose prob-lems for comparison of retail prices. In the case of fruits and vegetables, milk, egg, meat and fish, prices have gone up despite an increase in per capita availability. This is due to a changing pattern in increasing aggregate household demand for high value items—a result of increasing income levels.
Apart from demand side factors, one supply side factor, namely, constraints in gearing production and marketable surplus, also makes for an important factor in influencing price rise, both nationally and globally. One may note that supply side constraints have both long-term and short-term features. At times, due to weather or related factors, production may fall, which could have an impact for a season or longer—say, a year. Alternatively, the gap may be due to changes in con-sumer behaviour and demands, or changes in crop economics, leading to shifts that may require issues to be addressed on a long term. This leads to time lags between supply and demand, which in turn leads to a spiralling effect on prices.
8.4 managementIn agribusiness, risks can be across the supply chain at various nodes. Such risks could be impacting the actors like farmers, intermediaries, processors, marketers and consumers. Most part of the production risks are up to the level when the pro-duce is grown at the farm or processed and moved down the supply chain. Here, production risk is more in terms of volume of output and other cost side econom-ics with respect to production. Once the product moves towards the market, one
Risk ◾ 227
would experience market related risks which predominantly exposes to price risks. Apart from this, there is another perspective of looking at ex-ante and ex-post risks which are based on trigger of events and responses.
In agricultural risk management, a distinction is necessary between measures that aim to create and foster the management of risk by markets (particularly insur-ance, savings, and formal lending) on an ex ante basis and the management of risks by the government (particularly emergency humanitarian relief, compensa-tion for catastrophic events, and reconstruction of public goods) normally on an ex-post basis.
Facilitating the use of market-based approaches can reduce the needs and scope for government interventions, and thereby, decrease the costs incurred by government in ex- post coping activities. For this reason, many governments are active in the promotion of market-based risk management and insurance (although they are normally operated through public–private partnerships). Examples of such activity are government subsidies, information and extension, and legal and regula-tory measures, including those for insurance.
However, when disasters strike or when there are losses that were not managed by the agricultural sector’s stakeholders, government intervention will be necessary, partly because not all risks are insurable and partly because not all farmers or stake-holders can or want to access commercial insurance.
8.4.1 ProductionProduction risks affect volume and quality of output in agribusiness. These impacts financially at the micro level economic units namely farms, farmers, processors and even consumers. There are a number of initiatives taken by policy makers and system to manage such risks. Some of the important initiatives which are in vogue are discussed here.
8.4.1.1 Financial Inputs and Calamity Relief: Insurance
Given the sensitivity of yields and production to weather conditions and other hazards, there is a potential demand for crop insurance. Crop insurance has been successfully used to protect farmers from risk in many countries. There are instances where government support for insurance being higher compared to fair play of insurance market, which is a service business to trade and commerce. Since the cost of managing insurance is high, it is also difficult to expect private opera-tors to successfully provide support through insurance. In developing nations like India, funding costs are high, as is the incidence of failures, and further, avenues for managing insurance investment portfolios are less. Obviously, all these factors make insurance unattractive for fund managers to manage. Overshadowing these factors, information imperfections make the insurance operation position weak, demanding high expertise in operation.
228 ◾ Agribusiness Supply Chain Management
There are single peril insurance contract and multiple peril insurance contract options available to the farmer. However, owing to the high information asymme-try, the premium for such contracts is very high. The premium amount increases with the level of indemnity, that is, single peril contracts are cheaper than multiple peril contracts. The “high costs of offering insurance contracts are associated, at least in part, with information asymmetries. Moral hazard in this context occurs when it is impossible or excessively costly to write a contract based upon everything a farmer might do that would affect his yields. Adverse selection occurs when con-tracts based on all the relevant environmental parameters are unfeasible” (OECD, 2010). These two drawbacks of the insurance contract severely affect the feasibility and even availability of insurance contracts. The insurance contracts types most used, and the implications of each, are discussed below.
8.4.1.1.1 Area Yield–Based Crop Insurance
Area yield insurance provides support based on the average yield of a wide area. It also considers potentially reducing adverse selection. It may be noted that area yield–based insurance is done at the cost of adding basis risk to be borne by the farmer.
Another fundamental issue is that the level survey and preliminary study are done on a global scale. Such a study focuses on the macro level and does not take the micro aspects into consideration. It is not possible for such a mass level study to include minor risks. This hampers the risks coverage borne by such contracts. Thus, such an arrangement does not indemnify the farmer against all risks.
Further, the information available about the risks associated with farm products is minimal. This issue is not paid much attention. The lack of study about the perils and their probabilities makes it impossible to calculate the financial costs related to such events.
8.4.1.1.2 Strategies to Improve the Insurance Contracts
A primary classing of risks into different layers is imperative in order to understand the various risks and devise suitable insurance contracts. These layers segregate the risks according to the likelihood of their occurrence (probability) and the severity or magnitude of loss caused by such occurrence.
Table 8.4 shows the magnitude of damage with respect to expected income vs. probability of occurrence.
The retention layer shows that the expected losses or gains are limited in this region. They have a high occurrence rate, but are less severe. Hence, farmers can manage these risks with strategies available at the farm/household level.
The second layer is of “risks that are more significant and less frequent. Both frequency and magnitude are in the middle ranges. In this layer, there is scope for
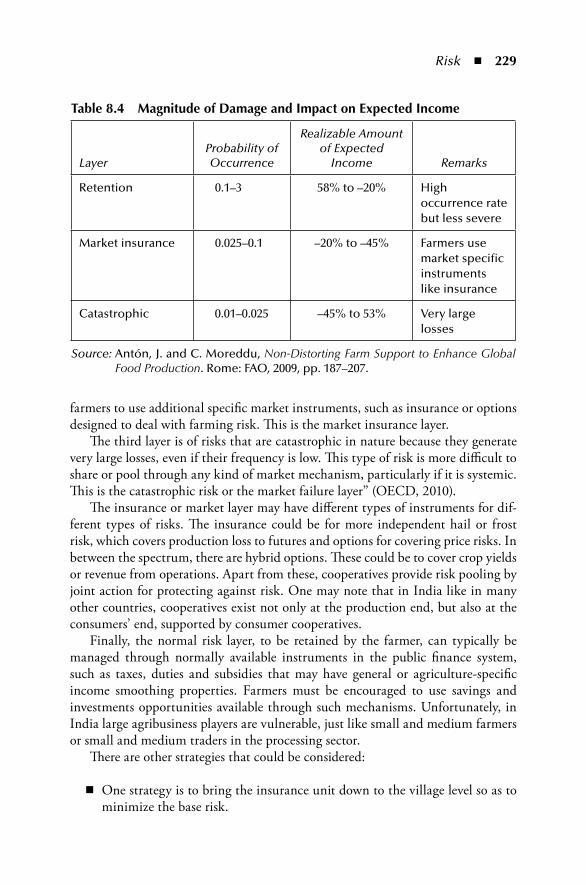
Risk ◾ 229
farmers to use additional specific market instruments, such as insurance or options designed to deal with farming risk. This is the market insurance layer.
The third layer is of risks that are catastrophic in nature because they generate very large losses, even if their frequency is low. This type of risk is more difficult to share or pool through any kind of market mechanism, particularly if it is systemic. This is the catastrophic risk or the market failure layer” (OECD, 2010).
The insurance or market layer may have different types of instruments for dif-ferent types of risks. The insurance could be for more independent hail or frost risk, which covers production loss to futures and options for covering price risks. In between the spectrum, there are hybrid options. These could be to cover crop yields or revenue from operations. Apart from these, cooperatives provide risk pooling by joint action for protecting against risk. One may note that in India like in many other countries, cooperatives exist not only at the production end, but also at the consumers’ end, supported by consumer cooperatives.
Finally, the normal risk layer, to be retained by the farmer, can typically be managed through normally available instruments in the public finance system, such as taxes, duties and subsidies that may have general or agriculture-specific income smoothing properties. Farmers must be encouraged to use savings and investments opportunities available through such mechanisms. Unfortunately, in India large agribusiness players are vulnerable, just like small and medium farmers or small and medium traders in the processing sector.
There are other strategies that could be considered:
◾ One strategy is to bring the insurance unit down to the village level so as to minimize the base risk.
table 8.4 magnitude of Damage and impact on expected income
LayerProbability of Occurrence
Realizable Amount of Expected
Income Remarks
Retention 0.1–3 58% to –20% High occurrence rate but less severe
Market insurance 0.025–0.1 –20% to –45% Farmers use market specific instruments like insurance
Catastrophic 0.01–0.025 –45% to 53% Very large losses
Source: Antón, J. and C. Moreddu, Non-Distorting Farm Support to Enhance Global Food Production. Rome: FAO, 2009, pp. 187–207.
230 ◾ Agribusiness Supply Chain Management
◾ Another is to use a longer time yield series when fixing the guaranteed yield, to ensure more stable coverage.
◾ A third strategy is to increase the levels of indemnity (coverage). ◾ Yet another strategy is to cover horticultural crops such as vegetables and
fruits.
8.4.1.1.3 Weather-Based Crop Insurance
“Monsoon-linked insurance indices can provide adequate collateral in terms of encouraging banks to lend more liberally to the agriculture sector. Weather indices can be used to make early payouts in areas covered by yield crop insurance. A macro weather index can be an ideal tool for protecting a large portfolio at the district/regional/state levels against drought or floods. The success of a weather insurance programme in India would depend on the product design, the steps taken to mini-mize the base risk, the adoption of reliable and sustainable pricing mechanisms (including government subsidies) and the resolution of the issues of product servic-ing and timely payouts” (Kolli and Bockel, 2008).
8.4.1.2 Post-Harvest Management and Value Addition
The post-harvest handling and processing of agriculture products ensure high-quality products. This, along with increase in productivity, is essential to the agri-culture markets. Too often, even when the yields are high, producers lose income due to poor post-harvest practices.
Food processing converts agricultural produces into more palatable and nutri-tious food stuff. Such activities also extend the shelf life of the products, and add value in various other ways. Food processing assumes further importance in India due to seasonal variations, which lead to high levels of wastage or shortages. One of the reasons is the lack of adequate measures to preserve and store the foods. The important aspect in food processing is that it covers all the steps, right from the farm to the fork. These steps include basic cleaning, grading and packaging, as in the case of fruits and vegetables, and also alteration of the raw material to a stage just before the final preparation. All the ready-to-eat food segments like bakery products, instant foods, flavoured and health drinks, etc., form part of the food processing sector. Such proliferated economic agents in the food process-ing industry can offer livelihood for many workers. Incidentally, they offer wide strata of communities several options at reasonable costs, as they can achieve low costs with the proper focus. In addition, these entities can play a primary role in the development of the rural community. Food processing has come a long way in the last few decades. The ever-changing lifestyles, food habits and tastes of customers globally have altered the dynamics of the industry. The world’s food production and consumption patterns are evolving with changes in the needs of the customers. Recent corporate diversifications into the food industry and the
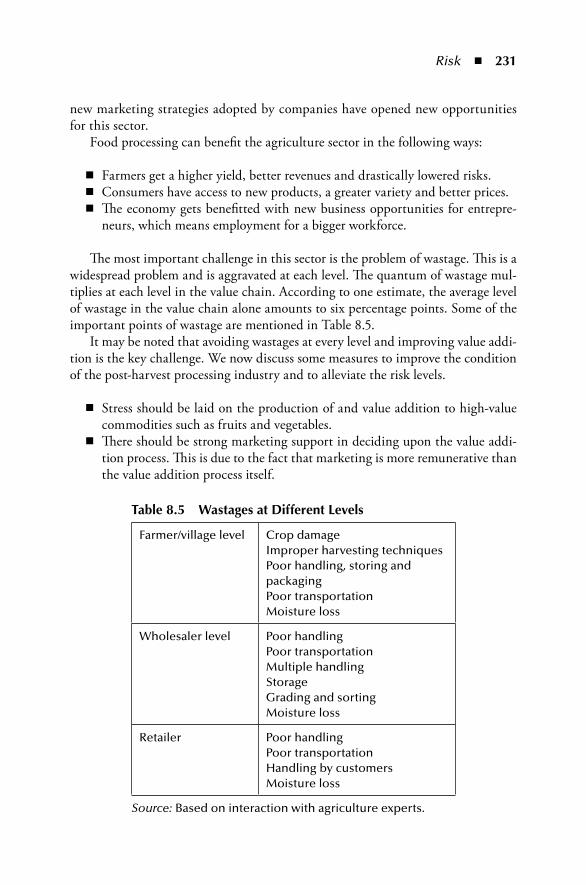
Risk ◾ 231
new marketing strategies adopted by companies have opened new opportunities for this sector.
Food processing can benefit the agriculture sector in the following ways:
◾ Farmers get a higher yield, better revenues and drastically lowered risks. ◾ Consumers have access to new products, a greater variety and better prices. ◾ The economy gets benefitted with new business opportunities for entrepre-
neurs, which means employment for a bigger workforce.
The most important challenge in this sector is the problem of wastage. This is a widespread problem and is aggravated at each level. The quantum of wastage mul-tiplies at each level in the value chain. According to one estimate, the average level of wastage in the value chain alone amounts to six percentage points. Some of the important points of wastage are mentioned in Table 8.5.
It may be noted that avoiding wastages at every level and improving value addi-tion is the key challenge. We now discuss some measures to improve the condition of the post-harvest processing industry and to alleviate the risk levels.
◾ Stress should be laid on the production of and value addition to high-value commodities such as fruits and vegetables.
◾ There should be strong marketing support in deciding upon the value addi-tion process. This is due to the fact that marketing is more remunerative than the value addition process itself.
table 8.5 Wastages at Different Levels
Farmer/village level Crop damageImproper harvesting techniquesPoor handling, storing and packagingPoor transportationMoisture loss
Wholesaler level Poor handlingPoor transportationMultiple handlingStorageGrading and sortingMoisture loss
Retailer Poor handlingPoor transportationHandling by customersMoisture loss
Source: Based on interaction with agriculture experts.
232 ◾ Agribusiness Supply Chain Management
◾ There is also a lack of appropriate and cost-effective packaging technologies. This also adds to the wastage of raw material during processing.
◾ The focus of processing activities should be pull driven, that is, demand driven, rather than push driven, that is, production driven, as has been traditional.
◾ Intermediaries in the food chain lock value and add to the cost of the raw materials, sometimes by as much as 80%–100%. Effective linkages need to be built between Indian agriculture farmers and processors on a mutually beneficial contractual agreement.
◾ A comprehensive analysis of the present situation is needed. Such a study can delineate effective strategies for network plans, warehouse locations, and so on. A complete study of supply chains at the regional level will produce a detailed plan of action.
◾ The processing of agricultural products results in by-products that are gener-ally termed waste. However, with the evolution of new technology and meth-ods, this so-called waste can be processed and utilized in an eco-friendly manner.
8.4.2 Prices and MarketsDemand and supply side risks impact agricultural products prices. This could further impact the markets in terms level of maturity and conditions towards fairness. There are a number of initiatives taken by policy makers to manage such risks. Some of the important price related policy and market changes are discussed here.
8.4.2.1 Government Policy Instruments
8.4.2.1.1 Minimum Support Prices (MSP)
“The government has pursued a policy of ensuring a remunerative and stable price environment for so long as a result of many political, social and economic compulsions. Specific instruments include the minimum support prices (MSP) scheme and the market intervention schemes (MIS). MSP is available for as many as 25 different agricultural commodities, accounting for 80% of the production of the gross farmed area and approximately 75% of the gross value of crop production.
MSP has been largely successful in keeping prices under control from the con-sumer point of view. On the other hand, the utility to producers has long been questioned, as only farmers from a few states (for only a few commodities) have been able to take advantage of MSP. Causes of worry include the extent of govern-ment funds involved in the MSP-based procurement operations; storage wastage; and inefficiencies in handling operations. While the Government wants to make MSP universal, many economists feel that the Government’s procurement of food
Risk ◾ 233
grains should be limited to its requirement for buffer stocks and welfare schemes like public distribution systems” (Kolli and Bockel, 2008).
The elements of rationale behind the determination of MSP include:
1. the need to provide incentives to producers and farmers for adopting improved technology and for developing a production pattern broadly in the light of national requirements;
2. the need to ensure rational utilization of land, water and other production resources;
3. the likely effect of the price policy on the rest of the economy, particularly in terms of the cost of living, level of wages, and so on; and
4. the terms of trade between the agricultural sector and the non-agricultural sector.
However, the challenge in MSP lies in reducing the wastage of products and in efficient storage and transportation systems.
8.4.2.1.2 Market Intervention Scheme (MIS)
Though the MSP is useful and effective for certain food grains, it cannot be applied across all types of crops. The Market Intervention Scheme (MIS) is a support pro-gramme for procurement of horticultural commodities that are perishable in nature and applies to commodities not covered under MSP. The objective is similar to that of MSP except that MIS is triggered when there is a bumper crop, and the focus is on avoiding distress sales by farmers.
The criteria for implementation of MIS are discussed below.
1. The MIS is implemented when there is at least a “10% increase in production or a 10% decrease in the ruling market prices over the previous normal year.
2. The MIS is implemented at the request of a state/UT government which is ready to bear 50% of the loss (25% in the case of the north-eastern states), if any, incurred on its implementation” (Ministry of Agriculture, 2012).
8.4.2.1.3 Price Supports Scheme (PSS)
The Department of Agriculture and Cooperation implements PSS for procure-ment of oil seeds, pulses and cotton through National Agricultural Cooperative Marketing Federation of India Limited (NAFED), which is the central nodal agency, at the MSP declared by the government. NAFED undertakes procurement of oil seeds, pulses and cotton under the PSS as and when prices fall below the MSP. This is typically done to support growers who reach the markets in a short time window in the post-harvest period. It continues to procure under PSS till
234 ◾ Agribusiness Supply Chain Management
prices stabilize at or above the MSP, so that farmers are ensured of a certain assured return.
However, these are government schemes that are supportive in nature. The aim is to prevent huge losses to farmers. This has been adopted to help upliftment of marginalized farmers. They in principle violate the free market economy principle.
8.4.2.2 Electronic Spot Exchanges
“The present marketing system, as governed by the Agricultural Produce Marketing Committee (APMC) Act, is replete with problems, such as a non-transparent auction system; poor incentives for quality-consciousness; multiple layers of intermediaries; poor infrastructure; informal credit linkages; significantly less buyers vis-à-vis sell-ers, etc. All these factors contribute to creating disadvantaged transaction terms for primary producers. As a result, the need for a near-perfect physical market network in India is becoming increasingly acute with the emergence of national-level futures exchanges. Over the last few years, the former is being a prerequisite for the effec-tive functioning of the latter. The objectives of an electronic spot market include transparency of physical markets; better links to quality parameters; improved information availability across players’ groups; reduced wastage through the cre-ation of better infrastructure; value-added a long the supply chain; and better price leads for futures markets.
The electronic spot exchange market is highly scalable because of its standardized operation, high level of technology orientation and the potential availability of private investments. India is piloting this system though SAFAL National Exchange (SNX) in Bangalore. The model presents an electronic platform that can be directly accessed by authorized brokers. Both buyers and sellers transact through these brokers. The presence of an electronic exchange absorbs counter-party risks and ensures the open dissemination of prevailing price levels. In addition, the auction system is technol-ogy-driven, where the parties involved enjoy complete anonymity. The scalability of this model is relatively easier because it attracts authorized brokers with investments to extend the technical infrastructure. Electronic spot exchanges are here to stay and provide huge marketing support to farmers” (Kolli and Bockel, 2008).
8.4.2.3 Commodity Markets
Across supply chains in agribusiness, farmers, producers, processors, traders or even consumers are concerned with commodity prices that disproportionately benefit and/or hamper only a few partners in their networks. For example, farmers are the most affected especially when they trade in regulated environments or sell through private traders. One of the ways to resolve imperfections of market affecting com-modity prices is enabling fair operations of open markets, especially of commodity markets. With future markets in place, partners in supply chain are able to shift risk based on perceptions of participating members and on better reach to market
Risk ◾ 235
information on demand and supply and prices. Further, futures prices, as well as influencing spot prices, are influenced by information availability. Such economic activity is a rather welcome development in commodities markets.
The price risk is the risk associated with sharp fluctuations in prices. These fluctuations could be highly uneven and adverse. Agricultural products are sea-sonal in nature. Due to this seasonality, the supply–demand balance is highly disturbed during harvest seasons. Forward and futures contracts are efficient risk management tools that insulate buyers and sellers from unexpected changes in future price movements. The futures market provides the lead in economic activ-ity. Futures prices give necessary indications to producers and consumers about the likely direction of future spot prices. They also give an idea of physical volumes in terms of the demand and supply conditions of the commodity traded. However, one should also note that the cash market, or the spot delivery market, on the other hand, is a time-tested market system, especially in agriculture, as farmers and processors, who have low holding capacities, have the tendency to deliver and cash in early.
There are 15 futures markets operational in India. For a variety of reasons, how-ever, these markets are not operating efficiently. The reasons include operational and management issues to infrastructure and trader issues. Future options are still in the developmental stage in India, and need some time to mature.
8.4.2.4 Contract Farming
“Contract farming is a structural issue in terms of agriculture production and marketing. Its chief aim is to bring agricultural management in line with the best agricultural production practices while ensuring a competitive and pre-arranged price for farmers. Thus, contract farming can play an important role as an alterna-tive risk management instrument. While India is catching up quickly with the contract farming model, the requisite developmental and regulatory framework is not yet in place” (Kolli and Bockel, 2008). At present, most contract farming contracts are loose and heavily loaded against the farmers. With the creation of an environment suitable for private–public partnerships, clear defining of roles, and given the limitations of corporate farming, one would expect contract farming to be a useful risk mitigation tool for small and marginal farmers.
From the processing side, risks can be business or operating risks and financial risks. Operating risk is measured by the variability in earnings before interest, depreciation, amortization and taxes. In agribusiness, variability is high, as prices are volatile and input costs, like the costs of procuring farm products, are also volatile. This is where contract farming helps. Financial risk is measured by the debt-to-equity ratio, which means that the higher the debt, the higher the finan-cial risk. In the agribusiness sector, financial risk is also high because of the need to borrow, especially for working capital. Contract farming helps handle risks in agribusiness.
236 ◾ Agribusiness Supply Chain Management
8.5 ConclusionIn this chapter, we present a holistic taxonomy and the implications of risks in agri-culture supply chains. It takes into account the design, aggregate planning, policy framework, long-term strategy and the latent facts of agriculture supply chains. Supply chain management at the global level is of critical importance. Today, the issues are tackled at tactical or regional levels. Modern-day studies, and therefore, the models they work on, look at only simple tools to take relevant decisions at this level. They fail to take complex issues into consideration, due to their strong assumptions about isolation and ceteris peribus. Existing problems are not consid-ered at a complex global level.
The brief classification of risks is the first step towards comprehensive risk management. Appendix 8.2 provides indicative lists of potential risks and their management which are discussed in this chapter. It can present a holistic and integrated picture of the complex issues. The model for future agriculture sup-ply chain management should also capture the stochastic and shelf life features of agricultural products. The future of any supply chain in the present context depends on energy management as well. The agriculture sector is energy intensive, and thus, has to take into account its energy usage while working on the policy framework.
Logistics and SCM have emerged as areas of critical importance for the ener-getic utilization of waste biomass and organic substrates. Unfortunately, the exist-ing models address only a minor subset of the decisions needed to be taken at a strategic, tactical and operational level; moreover, they fail to capture the existing complex and stochastic issues due to their severely limiting steady-state assump-tions. Moreover, the problem becomes even more challenging when considering the numerous variables, parameters and constraints that could be taken into account in the formulation of such a decision support model.
The use of modern technology has to be increased. Given the static nature of the net sown area over the last four decades, it is clear that any improvement in productivity can be brought about only by the better usage of available resources. Available satellite data relating to weather news, long-term and short-term weather forecasts, production information, market prices and policy developments pertain-ing to agriculture, apart from the number of advisory services in the public or the private domain that disseminate information should be utilized adequately. New initiatives are required to develop data and knowledge bases, as well as knowledge delivery mechanisms in different sectors of agriculture, such as water management, soil management, plant protection, animal and fish health cover, protected cultiva-tion in high value agriculture, genome analysis for genetic transformation in plants and animals, and so on.
Evidence of a large quantum of waste is abundant in the agriculture supply chain. This waste presents an easy and quick opportunity to improve the performance of
Risk ◾ 237
the supply chain. Adequate government expenditure on building up infrastructure, improving delivery networks, extending the reach of technology, enabling closely knit supply chains and putting into place better information systems can help in reducing the wastage of products.
Improved farm management and practices have also enabled a year-wide sowing season. In this context, the zaid-kharif and zaid-rabi gain prominence (in between the rabi and the kharif seasons, there is a short season during the summer months known as the zaid season). These crops can be developed so as to improve produc-tivity. Mapping of crop rotations and cropping patterns and geospatial modelling to assess performance have to be initiated at the national level. The output of this activity is linked with crop diversification and intensification planning under the National Food Security programme.
Before the consumer gets the food from the farmer, it goes through many hands. Traders buy and ship produce and commission agents arrange the transac-tions between farmers and traders. Since a typical farmer owns and sows only a small portion of land, the middleman has the advantage in terms of information and power. This leads to multiple marginalization of the supply chain and reduces its performance.
Appropriate studies and local adaptability are also critical. It is clear that food policy design and approaches to managing food sector risks will vary widely, depending on each country’s context; thus, different strategies have to be adopted in different regions. The reform agenda in India could also play an important role. This refers to the entry and use of the private sector in the agri-cultural sector.
Discrete risk management strategies at the farm and global levels will have only limited effects. “A single source of risk and a single instrument considered in isolation from other relevant sources of risk may induce unintended results in terms of revenue variability and welfare” (OECD, 2010). The produces and output from the farm should be correlated to other factors such as production variables and others to get a holistic model. At present, the cost of risk avoidance is very high. Therefore, finding ways to extend the reach of the risk market is important.
Hence, it is far more important to look at agribusiness and risks in a holis-tic sense. This can improve performance at the farm level and ensure food secu-rity. The policies should take multiple factors into account before devising any instrument.
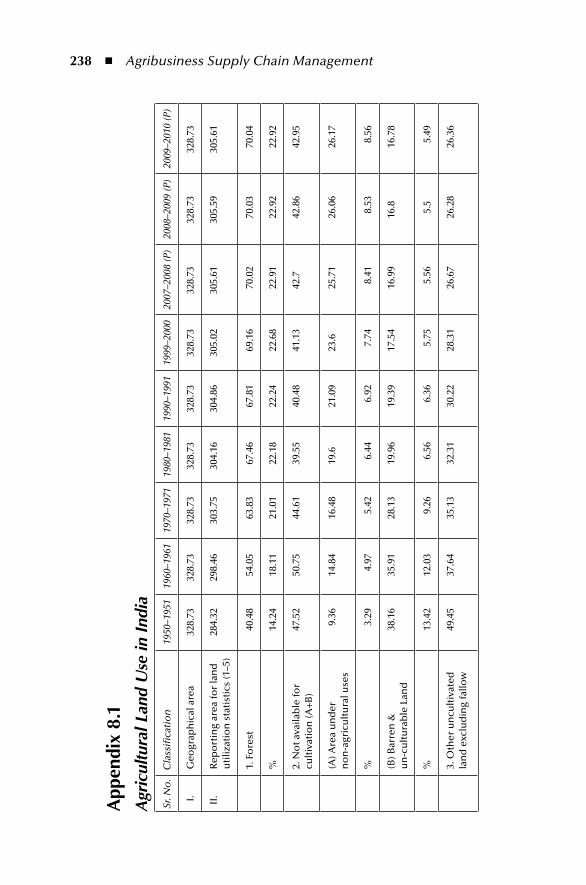
238 ◾ Agribusiness Supply Chain Management
App
endi
x 8.
1A
gric
ultu
ral L
and
Use
in I
ndia
Sr. N
o.
Cla
ssifi
cati
on
1950
–195
119
60–1
961
1970
–197
119
80–1
981
1990
–199
119
99–2
000
2007
–200
8 (P
)20
08–2
009
(P)
2009
–201
0 (P
)
I.G
eogr
aph
ical
are
a32
8.73
328.
7332
8.73
328.
7332
8.73
328.
7332
8.73
328.
7332
8.73
II.
Rep
ort
ing
area
for
lan
d
uti
lizat
ion
sta
tist
ics
(1–5
)28
4.32
298.
4630
3.75
304.
1630
4.86
305.
0230
5.61
305.
5930
5.61
1. F
ore
st40
.48
54.0
563
.83
67.4
667
.81
69.1
670
.02
70.0
370
.04
%14
.24
18.1
121
.01
22.1
822
.24
22.6
822
.91
22.9
222
.92
2. N
ot a
vaila
ble
for
cult
ivat
ion
(A+
B)
47.5
250
.75
44.6
139
.55
40.4
841
.13
42.7
42.8
642
.95
(A) A
rea
un
der
n
on
-agr
icu
ltu
ral u
ses
9.36
14.8
416
.48
19.6
21.0
923
.625
.71
26.0
626
.17
%3.
294.
975.
426.
446.
927.
748.
418.
538.
56
(B) B
arre
n &
u
n-c
ult
ura
ble
Lan
d38
.16
35.9
128
.13
19.9
619
.39
17.5
416
.99
16.8
16.7
8
%13
.42
12.0
39.
266.
566.
365.
755.
565.
55.
49
3. O
ther
un
cult
ivat
ed
lan
d e
xclu
din
g fa
llow
49.4
537
.64
35.1
332
.31
30.2
228
.31
26.6
726
.28
26.3
6
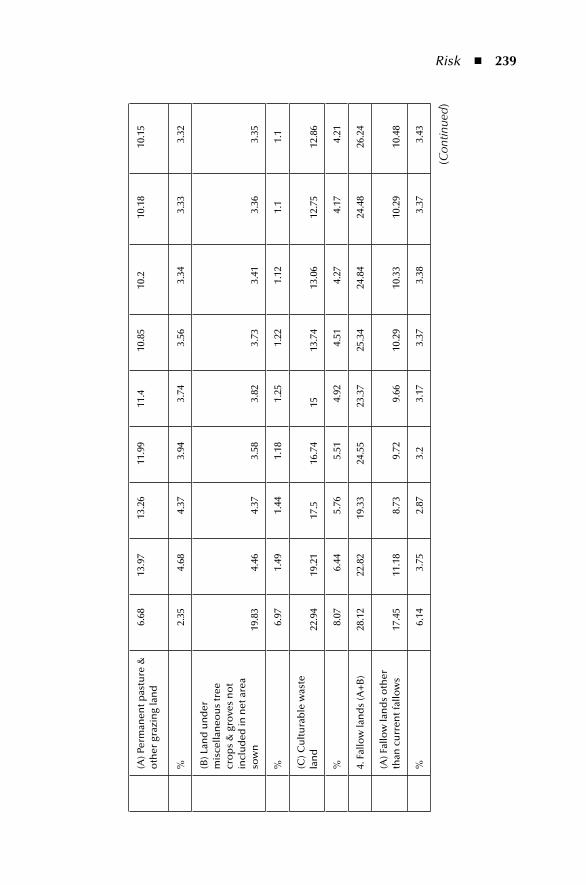
Risk ◾ 239
(A) P
erm
anen
t pas
ture
&
oth
er g
razi
ng
lan
d6.
6813
.97
13.2
611
.99
11.4
10.8
510
.210
.18
10.1
5
%2.
354.
684.
373.
943.
743.
563.
343.
333.
32
(B) L
and
un
der
m
isce
llan
eou
s tr
ee
cro
ps
& g
rove
s n
ot
incl
ud
ed in
net
are
a so
wn
19.8
34.
464.
373.
583.
823.
733.
413.
363.
35
%6.
971.
491.
441.
181.
251.
221.
121.
11.
1
(C) C
ult
ura
ble
was
te
lan
d22
.94
19.2
117
.516
.74
1513
.74
13.0
612
.75
12.8
6
%8.
076.
445.
765.
514.
924.
514.
274.
174.
21
4. F
allo
w la
nd
s (A
+B
)28
.12
22.8
219
.33
24.5
523
.37
25.3
424
.84
24.4
826
.24
(A) F
allo
w la
nd
s o
ther
th
an c
urr
ent f
allo
ws
17.4
511
.18
8.73
9.72
9.66
10.2
910
.33
10.2
910
.48
%6.
143.
752.
873.
23.
173.
373.
383.
373.
43
(Con
tinue
d)
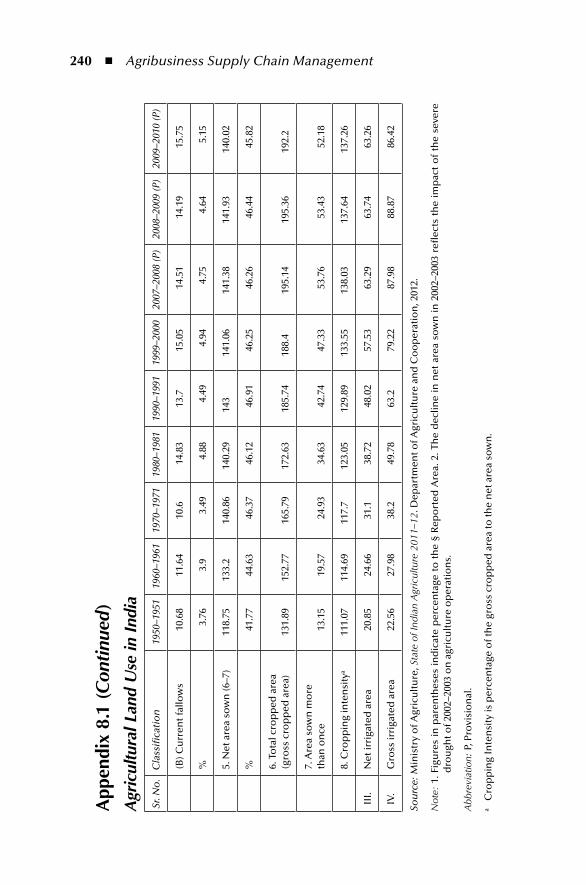
240 ◾ Agribusiness Supply Chain Management
App
endi
x 8.
1 (C
ontin
ued
)A
gric
ultu
ral L
and
Use
in I
ndia
Sr. N
o.
Cla
ssifi
cati
on
1950
–195
119
60–1
961
1970
–197
119
80–1
981
1990
–199
119
99–2
000
2007
–200
8 (P
)20
08–2
009
(P)
2009
–201
0 (P
)
(B) C
urr
ent f
allo
ws
10.6
811
.64
10.6
14.8
313
.715
.05
14.5
114
.19
15.7
5
%3.
763.
93.
494.
884.
494.
944.
754.
645.
15
5. N
et a
rea
sow
n (6
–7)
118.
7513
3.2
140.
8614
0.29
143
141.
0614
1.38
141.
9314
0.02
%41
.77
44.6
346
.37
46.1
246
.91
46.2
546
.26
46.4
445
.82
6. T
ota
l cro
pp
ed a
rea
(gro
ss c
rop
ped
are
a)13
1.89
152.
7716
5.79
172.
6318
5.74
188.
419
5.14
195.
3619
2.2
7. A
rea
sow
n m
ore
th
an o
nce
13.1
519
.57
24.9
334
.63
42.7
447
.33
53.7
653
.43
52.1
8
8. C
rop
pin
g in
ten
sity
a11
1.07
114.
6911
7.7
123.
0512
9.89
133.
5513
8.03
137.
6413
7.26
III.
Net
irri
gate
d a
rea
20.8
524
.66
31.1
38.7
248
.02
57.5
363
.29
63.7
463
.26
IV.
Gro
ss ir
riga
ted
are
a22
.56
27.9
838
.249
.78
63.2
79.2
287
.98
88.8
786
.42
Sou
rce:
Min
istr
y o
f Agr
icu
ltu
re, S
tate
of I
ndia
n A
gric
ultu
re 2
011–
12. D
epar
tmen
t of A
gric
ult
ure
an
d C
oo
per
atio
n, 2
012.
Not
e: 1
. Fig
ure
s in
par
enth
eses
in
dic
ate
per
cen
tage
to
th
e §
Rep
ort
ed A
rea.
2. T
he
dec
line
in n
et a
rea
sow
n i
n 2
002–
2003
refl
ects
th
e im
pac
t o
f th
e se
vere
d
rou
ght o
f 200
2–20
03 o
n a
gric
ult
ure
op
erat
ion
s.
Abb
revi
atio
n: P
, Pro
visi
on
al.
a C
rop
pin
g In
ten
sity
is p
erce
nta
ge o
f th
e gr
oss
cro
pp
ed a
rea
to th
e n
et a
rea
sow
n.
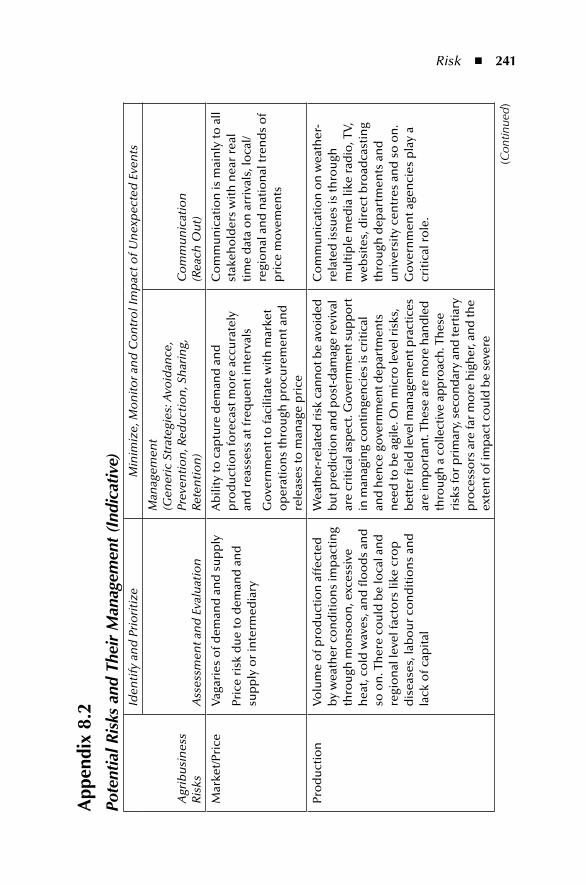
Risk ◾ 241
App
endi
x 8.
2Po
tent
ial R
isks
and
The
ir M
anag
emen
t (I
ndic
ativ
e)
Agr
ibu
sin
ess
Ris
ks
Iden
tify
an
d P
rio
riti
zeM
inim
ize,
Mo
nit
or a
nd
Co
ntr
ol I
mp
act o
f Un
exp
ecte
d E
ven
ts
Ass
essm
ent a
nd
Eva
luat
ion
Man
agem
ent
(Gen
eric
Str
ateg
ies:
Avo
idan
ce,
Prev
enti
on
, Red
uct
ion
, Sh
arin
g,
Rete
nti
on
)C
om
mu
nic
atio
n(R
each
Ou
t)
Mar
ket/
Pric
eV
agar
ies
of d
eman
d a
nd
su
pp
ly
Pric
e ri
sk d
ue
to d
eman
d a
nd
su
pp
ly o
r in
term
edia
ry
Ab
ility
to c
aptu
re d
eman
d a
nd
p
rod
uct
ion
fore
cast
mo
re a
ccu
rate
ly
and
rea
sses
s at
freq
uen
t in
terv
als
Go
vern
men
t to
faci
litat
e w
ith
mar
ket
op
erat
ion
s th
rou
gh p
rocu
rem
ent a
nd
re
leas
es to
man
age
pri
ce
Co
mm
un
icat
ion
is m
ain
ly to
all
stak
eho
lder
s w
ith
nea
r re
al
tim
e d
ata
on
arr
ival
s, lo
cal/
regi
on
al a
nd
nat
ion
al tr
end
s o
f p
rice
mo
vem
ents
Pro
du
ctio
nV
olu
me
of p
rod
uct
ion
aff
ecte
d
by
wea
ther
co
nd
itio
ns
imp
acti
ng
thro
ugh
mo
nso
on
, exc
essi
ve
hea
t, co
ld w
aves
, an
d fl
oo
ds
and
so
on
. Th
ere
cou
ld b
e lo
cal a
nd
re
gio
nal
leve
l fac
tors
like
cro
p
dis
ease
s, la
bo
ur
con
dit
ion
s an
d
lack
of c
apit
al
Wea
ther
-rel
ated
ris
k ca
nn
ot b
e av
oid
ed
bu
t pre
dic
tio
n a
nd
po
st-d
amag
e re
viva
l ar
e cr
itic
al a
spec
t. G
ove
rnm
ent s
up
po
rt
in m
anag
ing
con
tin
gen
cies
is c
riti
cal
and
hen
ce g
ove
rnm
ent d
epar
tmen
ts
nee
d to
be
agile
. On
mic
ro le
vel r
isks
, b
ette
r fi
eld
leve
l man
agem
ent p
ract
ices
ar
e im
po
rtan
t. Th
ese
are
mo
re h
and
led
th
rou
gh a
co
llect
ive
app
roac
h. T
hes
e ri
sks
for
pri
mar
y, s
eco
nd
ary
and
tert
iary
p
roce
sso
rs a
re fa
r m
ore
hig
her
, an
d th
e ex
ten
t of i
mp
act c
ou
ld b
e se
vere
Co
mm
un
icat
ion
on
wea
ther
-re
late
d is
sues
is th
rou
gh
mu
ltip
le m
edia
like
rad
io, T
V,
web
site
s, d
irec
t bro
adca
stin
g th
rou
gh d
epar
tmen
ts a
nd
u
niv
ersi
ty c
entr
es a
nd
so
on
. G
ove
rnm
ent a
gen
cies
pla
y a
crit
ical
ro
le.
(Con
tinue
d)
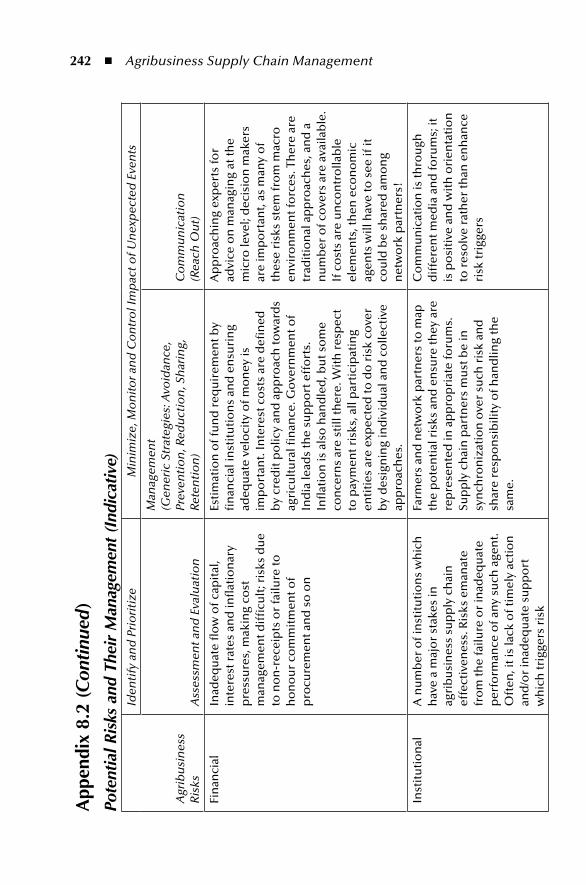
242 ◾ Agribusiness Supply Chain Management
App
endi
x 8.
2 (C
ontin
ued
)Po
tent
ial R
isks
and
The
ir M
anag
emen
t (I
ndic
ativ
e)
Agr
ibu
sin
ess
Ris
ks
Iden
tify
an
d P
rio
riti
zeM
inim
ize,
Mo
nit
or a
nd
Co
ntr
ol I
mp
act o
f Un
exp
ecte
d E
ven
ts
Ass
essm
ent a
nd
Eva
luat
ion
Man
agem
ent
(Gen
eric
Str
ateg
ies:
Avo
idan
ce,
Prev
enti
on
, Red
uct
ion
, Sh
arin
g,
Rete
nti
on
)C
om
mu
nic
atio
n(R
each
Ou
t)
Fin
anci
alIn
adeq
uat
e fl
ow
of c
apit
al,
inte
rest
rat
es a
nd
infl
atio
nar
y p
ress
ure
s, m
akin
g co
st
man
agem
ent d
iffi
cult
; ris
ks d
ue
to n
on
-rec
eip
ts o
r fa
ilure
to
ho
no
ur
com
mit
men
t of
pro
cure
men
t an
d s
o o
n
Esti
mat
ion
of f
un
d r
equ
irem
ent b
y fi
nan
cial
inst
itu
tio
ns
and
en
suri
ng
adeq
uat
e ve
loci
ty o
f mo
ney
is
imp
ort
ant.
Inte
rest
co
sts
are
defi
ned
b
y cr
edit
po
licy
and
ap
pro
ach
tow
ard
s ag
ricu
ltu
ral fi
nan
ce. G
ove
rnm
ent o
f In
dia
lead
s th
e su
pp
ort
eff
ort
s.
Infl
atio
n is
als
o h
and
led
, bu
t so
me
con
cern
s ar
e st
ill th
ere.
Wit
h r
esp
ect
to p
aym
ent r
isks
, all
par
tici
pat
ing
enti
ties
are
exp
ecte
d to
do
ris
k co
ver
by
des
ign
ing
ind
ivid
ual
an
d c
olle
ctiv
e ap
pro
ach
es.
Ap
pro
ach
ing
exp
erts
for
advi
ce o
n m
anag
ing
at th
e m
icro
leve
l; d
ecis
ion
mak
ers
are
imp
ort
ant,
as m
any
of
thes
e ri
sks
stem
fro
m m
acro
en
viro
nm
ent f
orc
es. T
her
e ar
e tr
adit
ion
al a
pp
roac
hes
, an
d a
n
um
ber
of c
ove
rs a
re a
vaila
ble
. If
co
sts
are
un
con
tro
llab
le
elem
ents
, th
en e
con
om
ic
agen
ts w
ill h
ave
to s
ee if
it
cou
ld b
e sh
ared
am
on
g n
etw
ork
par
tner
s!
Inst
itu
tio
nal
A n
um
ber
of i
nst
itu
tio
ns
wh
ich
h
ave
a m
ajo
r st
akes
in
agri
bu
sin
ess
sup
ply
ch
ain
ef
fect
iven
ess.
Ris
ks e
man
ate
fro
m th
e fa
ilure
or
inad
equ
ate
per
form
ance
of a
ny
such
age
nt.
Oft
en, i
t is
lack
of t
imel
y ac
tio
n
and
/or
inad
equ
ate
sup
po
rt
wh
ich
trig
gers
ris
k
Farm
ers
and
net
wo
rk p
artn
ers
to m
ap
the
po
ten
tial
ris
ks a
nd
en
sure
they
are
re
pre
sen
ted
in a
pp
rop
riat
e fo
rum
s.
Sup
ply
ch
ain
par
tner
s m
ust
be
in
syn
chro
niz
atio
n o
ver
such
ris
k an
d
shar
e re
spo
nsi
bili
ty o
f han
dlin
g th
e sa
me.
Co
mm
un
icat
ion
is th
rou
gh
dif
fere
nt m
edia
an
d fo
rum
s; it
is
po
siti
ve a
nd
wit
h o
rien
tati
on
to
res
olv
e ra
ther
than
en
han
ce
risk
trig
gers
Risk ◾ 243
AcknowledgementThe authors thank Shailesh Tiwari, PGPEx VLM, IIM Calcutta, 2013 who worked on an internship with N. Chandrasekaran on Agriculture Supply Chain-Ensuring Food Safety.
referencesAntón, J. and C. Moreddu, Risk management in OECD agriculture: From a holistic approach
to the reality of support measures. Ch 5 in Non-Distorting Farm Support to Enhance Global Food Production. Rome: Food and Agriculture Organization of the United Nations, 2009, pp. 187–207. ftp://ftp.fao.org/docrep/fao/012/i1098e/i1098e11.pdf
Chand, R. and L.M. Pandey, Fertiliser growth, imbalances and subsidies: Trends and impli-cations. New Delhi: National Centre for Agricultural Economics and Policy Research, April 2008. http://www.ncap.res.in/upload_files/others/oth_13.pdf
The Hindu, FAI favours rational pricing policy, September 21, 2012. http://www.thehindu.com/business/companies/fai-favours-rational-pricing-policy/article3918936.ece
Kenkel, P. Managing fertilizer price risk. Oklahoma Cooperative Extension Fact Sheet AGEC-262. Stillwater, OK: Oklahoma State University, 2010.
Kolli, N. and L. Bockel, Risk management as a pillar in agriculture and food security policies: India case study. Rome: Food and Agriculture Organization of the United Nations, 2008. http://www.fao.org/docs/up/easypol/764/risk_mngmnt_pllrfs_ policy_indiacs_209en.pdf
Ministry of Agriculture, State of Indian Agriculture 2011–12. Department of Agriculture and Cooperation, 2012. http://agricoop.nic.in/sia111213312.pdf
OECD. Managing Risk in Agriculture: A Holistic Approach (Extracts). Paris: Organisation for Economic Co-operation and Development, 2010. http://www.oecd.org/tad/ agricultural-policies/45558582.pdf

This page intentionally left blankThis page intentionally left blank

iiiSupport SyStemS

This page intentionally left blankThis page intentionally left blank
247
Chapter 9
infrastructure
9.1 introductionInfrastructure plays a significant role in the development of agriculture and indus-try, and in boosting overall economic growth. In a globalized economy, production facilities tend to converge on one location because of resource advantages, while the products are consumed at different locations, which are the demand points. It is the infrastructural facilities that play a major role in determining the success of firms, industries and the nation in managing production, distribution and exchange in markets, so that consumers and suppliers are rewarded for their roles and responsi-bilities in the economic system.
A country’s progress is often measured by how fast and effectively it can develop its infrastructure to help industries and businesses thrive, and also to ease the lives of the common people. Infrastructural support facilities needed for greater competence include efficient roads, railways, airports and shipping systems (transportation); buildings, water pipelines, sewers, electric power lines (physical infrastructure); and high-class storage facilities such as cold storage, moisture proof
Obje CTIv eThe objective of this chapter is to understand the importance of infrastructure such as distribution centres, organized market, cold storages and communi-cation networks in managing efficiency in agribusiness supply chains. Issues covered include transportation networks; quality of roads; cold storages; organized markets with storages, communication network and training of personnel.
248 ◾ Agribusiness Supply Chain Management
storage and so on (support infrastructure). The need for such facilities assumes greater importance in the case of perishable goods such as agricultural produce and dairy products. Timely shipment of these goods under the mandated temperature and moisture conditions is necessary to protect their quality and usability. The lim-ited shelf life of agri produce and its demand and price variability make agri supply chains more intricate and tougher to manage than most other supply chains. The strengthening of rural infrastructure in terms of quality roads, proper irrigation and adequate storage facilities, including post-harvesting facilities, results in higher production and lower cost. Furthermore, better infrastructure paves the way to market expansion and economies of scale, and promotes employment and income for the rural people. In this chapter, we discuss the importance of infrastructure in managing agribusiness supply chains. The focus would be on transportation networks, quality of roads and storage infrastructures.
9.2 DefinitionThe theory of infrastructure derives mainly from the public goods theory in economics. Infrastructure in a broad sense refers to basic physical and organiza-tional structures and facilities (e.g., buildings, roads, water and power supplies) required for the function of the general public or enterprises. Infrastructure is mainly comprised of physical structures, material or tangible structures that aid the competitiveness of the business world and the functioning of economic activi-ties. This understanding would extend to productive agriculture and agribusiness sectors. In this sense, agribusiness has a number of related organizational systems that support managerial functions such as planning, organizing, administering and monitoring of economic activities, which may include buying, producing, distribut-ing and consumption of goods and services. According to a Food and Agriculture Organization of the United Nations (FAO) report, “there are five infrastructure cat-egories: (i) farm to market roads, (ii) water for irrigation, (iii) wholesale markets and trading centres, (iv) agro-processing facilities and (v) information and communica-tions technology” (FAO and ODI, 2008). According to the Reserve Bank of India (RBI), “the infrastructure sector is defined as (i) power, (ii) telecommunication, (iii) railways, (iv) roads, including bridges, (v) sea ports and airports, (vi) industrial parks, (vii) urban infrastructure (water supply, sanitation and sewage projects) and (viii) mining, exploration and refining and (ix) cold storage or cold room facilities, including those for farm level pre-cooling and those for preservation or storage of agricultural and allied produce, marine products and meat” (Gangadharan, 2010). Thus, infrastructure is the set of interrelated structural elements that facilitate the production of goods and services, and also the distribution of raw material and finished products. For instance, roads and other transportation systems enable the movement of raw materials to production sites and facilitate distribution of finished products to marketplaces.
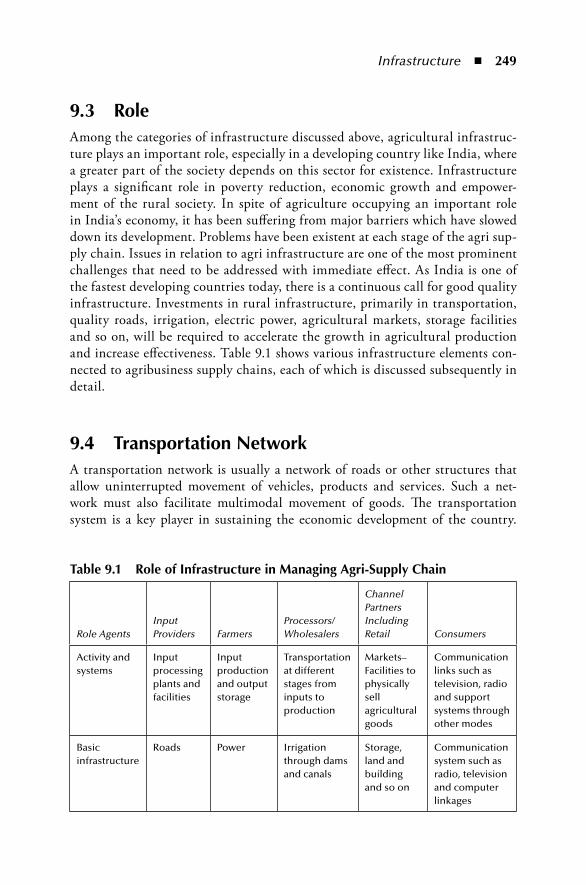
Infrastructure ◾ 249
9.3 roleAmong the categories of infrastructure discussed above, agricultural infrastruc-ture plays an important role, especially in a developing country like India, where a greater part of the society depends on this sector for existence. Infrastructure plays a significant role in poverty reduction, economic growth and empower-ment of the rural society. In spite of agriculture occupying an important role in India’s economy, it has been suffering from major barriers which have slowed down its development. Problems have been existent at each stage of the agri sup-ply chain. Issues in relation to agri infrastructure are one of the most prominent challenges that need to be addressed with immediate effect. As India is one of the fastest developing countries today, there is a continuous call for good quality infrastructure. Investments in rural infrastructure, primarily in transportation, quality roads, irrigation, electric power, agricultural markets, storage facilities and so on, will be required to accelerate the growth in agricultural production and increase effectiveness. Table 9.1 shows various infrastructure elements con-nected to agribusiness supply chains, each of which is discussed subsequently in detail.
9.4 transportation networkA transportation network is usually a network of roads or other structures that allow uninterrupted movement of vehicles, products and services. Such a net-work must also facilitate multimodal movement of goods. The transportation system is a key player in sustaining the economic development of the country.
table 9.1 role of infrastructure in managing Agri-Supply Chain
Role AgentsInput Providers Farmers
Processors/Wholesalers
Channel Partners Including Retail Consumers
Activity and systems
Input processing plants and facilities
Input production and output storage
Transportation at different stages from inputs to production
Markets– Facilities to physically sell agricultural goods
Communication links such as television, radio and support systems through other modes
Basic infrastructure
Roads Power Irrigation through dams and canals
Storage, land and building and so on
Communication system such as radio, television and computer linkages
250 ◾ Agribusiness Supply Chain Management
The transportation network includes different modes of transportation, such as roadways, railways, shipping, airways and pipelines. Many agricultural products are either bulky or perishable (sometimes both), and the costs involved in trans-porting inputs can account for a high proportion of the value of the final products; inadequate transport facilities will be a hindrance when farmers try to sell their produces.
Each agriculture produce has its own distinctive characteristic. Understanding of the harvest and its characteristics are essential in managing transportation net-works. The selection of the appropriate mode of transportation network is also vital. These decisions are more strategic in nature, and should be interconnected with inventory decisions. In several cases, the trade-off is between the cost of using the specific mode of transportation and the indirect cost of inventory associated with that mode. Further, quality problems and other regulatory issues also play a role in the decision-making process.
For example, wheat, which is produced in the northern states of India, is of a premium quality and is moved across the country. The farm produce of wheat, either procured directly or through agents, is transported to different processing mills by road, and at times by train. There are different locations where stocks are carried over. Based on the urgency of needs, the stocks are moved either by road or rail. Further, these decisions are dependent on volumes and the ability to aggregate loads for movement in case of movement by dedicated rail rake. There are certain produces like fruits and vegetables that need to be moved swiftly, and they depend upon road transportation. The travel is usually overnight and lasts less than a day. Of course, the traders also export and import agricultural goods wherein they use air and sea transport as modes for movement. It is important to note that since transportation is a major contributor to logistic costs, focusing on appropriate transportation networks makes good economic sense.
The configuration of an agricultural transportation network is determined by the nature of services required, and the costs, distances and volumes involved. Distances from the producers and the competence of the transportation network are important factors in managing agri supply chains. Batch sizes, routing and scheduling are crucial in effective management of the transport strategy. Farm roads and other road networks also affect the quality of the products. For example, if sugarcane has to be moved from farm to factory for processing cane sugar, the rural village roads determine the effectiveness of movement of goods. Normally, these roads are not well laid or maintained, and could be badly affected during monsoon. Moreover, these roads are not very wide. The goods are often moved through village roads maintained by local governments and state roads main-tained by state highway authorities. The local and state governments may not have funds adequately available for upkeep of these roads. However, in the organized sector, there are a number of opportunities to overcome this drawback, using some special grants and soft loans through various schemes operated by nodal agencies.
Infrastructure ◾ 251
It may be noted here that lack of suitable storage infrastructure, poor quality roads or slow and intermittent means of transport result in losses, as perishable items such as milk, fish, fresh vegetables, and tea deteriorate within a short span of time. India suffers an estimated food grain and agriculture produce loss of over `5 billion due to the lack of an adequate post-harvest infrastructure and ineffi-cient supply chain management. It has been estimated that loss of primary produce before reaching the markets due to lack of proper handling, cleaning, sorting, grad-ing and packaging facilities at the village level is about 7% of total production of food grains. Better transportation networks reduce the inputs cost to the farmer. Similarly, proper means of transport and connectivity from farm to marketplace is critical to efficient marketing structures. With increasing petrol prices, the influ-ence of transportation cost will affect the cost-effectiveness and profitability of agri-business supply chains.
Road infrastructure is the most important element in the agri supply chain, and it has a direct impact on the bottom line, as it affects both revenue and costs. Roads play a major role in the everyday food marketing system, which emphasizes the importance of the quality maintenance of road networks. The upkeep of efficient rural transportation networks is important for agricultural marketing, particularly in the case of seasonal and perishable products such as fruit and vegetables, dairy products, and fish. A bad network, that is, one with poor roads, and unsuitable and irregular means of transportation can result in low margin for farmers and high prices for consumers.
In India, the primary responsibilities for road construction, repairs and mainte-nance are vested with the governments (local, state and central). The state roads in India are administered by the state public works departments. The management of the national highway system is assigned to the Ministry of Surface Transport. The other minor roads in India are preserved by the relevant districts, municipalities and villages.
India has the third largest road network in the world. However, in terms of den-sity and quality, India still lags behind many countries of the world. “The Indian road network is the one of the largest in the world, aggregating 3.32 million km, consisting of 65,569 km of national highways, 1,28,000 km of state highways, 4,70,000 km of major district roads and 26,50,000 km of other district and rural roads. Out of the total length of national highways, about 22% have single lane/intermediate lanes, about 53% have the standard two lanes and the remaining 25% is standard four lanes or more. Though national highways comprise only about 2% of the total length of roads, they account for about 40% of the total traf-fic across the length and breadth of the country” (Planning Commission, 2011b). Roads are the primary factor that decides the magnitude of damage to agricul-tural produce that is being conveyed from source to market. Building good quality roads will help in transportation of agricultural products without loss of time, thus protecting their quality, which is a fundamental factor in the agri product sector. Increasing rural connectivity can ease market access for farmers and bring about
252 ◾ Agribusiness Supply Chain Management
an overall improvement of supply chains, in addition to having other constructive effects on rural households.
9.5 ChallengesOne of the main objectives of supply chains is to ensure that goods reach on time and at a reasonable cost. But due to poor road conditions, delivering “on time” becomes a daunting task. Some of the challenges faced are mentioned below.
1. One of the major reasons for excessive damage to roads in India is overload-ing of commodities. It is quite common for trucks to be overloaded. There are efforts now underway to regularize this. When a truck is overloaded, it affects the road, and further, in case of failure on the road, there is a major impact on vehicle movement. The ability to regain normalcy takes longer. The social cost of overloading had never been considered by the players.
2. India’s roads are congested, and getting more so. India is home to quite a large populace. Traffic congestion is a common problem in most of the cities because of the excessive population. Congestions are common, as there are a number of bottlenecks on the roads, by way of bridges, narrow connecting roads, rail crossings and so on. Congestions are also due to poor driving sense and lack of driver discipline. Projects undertaken by the National Highways Authority of India (NHAI) are improving the situation, but these efforts are still far from the level of intervention required.
3. In India, most of the rural parts do not have access to all weather roads, and therefore, have a hard time during the rainy seasons. Large sections of Indian rural roads, even during normal times, pose tough driving condi-tions, as they are not fully topped with bitumen or well laid with other suit-able substances. This reduces the speed of movement drastically. Further, the quality of vehicles used for transportation is often low, and thereby, efficiency is badly hit. Transportation operating costs rise due to break-downs, especially on roads that get worse during the monsoon seasons. Thus, both supply chain objectives, namely, cost and responsiveness, are affected.
4. The sluggish road conveyance system has also affected the movement of goods, particularly in terms of transportation of fresh goods such as milk, vegetables and flowers. These perishable goods become rotten or get destroyed before they reach the local or export markets. Due to delays in reaching the marketplaces, a large proportion of merchandise is wasted in transit.
5. India is a vast country experiencing widely varying weather at different parts of the country. There are places that experience frequent floods, bringing about major damage to road infrastructure. There are terrains that are dry,
Infrastructure ◾ 253
humid and poorly connected with markets. Again, weather in those places is not supportive of well-maintained local roads, which are a last mile issue in transportation.
6. Poor road connectivity hinders the efficient transfer of goods from the source to the destination. Poor connectivity must be understood in terms of the sectors involved: from farms to villages, from villages to markets and from markets and processors again to multiple consumption points. The roads are local roads, state roads and highways. They are not seam-lessly connected. Rapid road connectivity to the main ports of the coun-try and to important cities is very essential to increase trade and ensure enhanced prices for farm goods. It is a challenge at this point in most parts of India.
It may be noted here that the magnitude of the expenses incurred in repair-ing roads is alarming, and hence, the government lays emphasis on building quality roads. According to a Working Group report on the central roads sector, “several states have taken up improvement programmes for their states roads with funding assistance from the World Bank, ADB, JBIC, etc. Works completed are generally of good quality and high standards, with safety features” (Planning Commission, 2011a).
To conclude this section, road transportation, which is the main mode of transportation of agricultural produces and processed goods, continues to be a chal-lenge for achieving supply chain efficiency. Availability of capital and the ability to service the same could be a limiting factor for decades to come.
9.6 Cold StoragesA cold chain is a temperature-controlled supply chain. The cold chain infra-structure normally comprises pre-cooling services, icy storing, refrigerated transporters, warehousing, integrated information systems and so on. The cold storage infrastructure is very essential for temperature-specific goods. It is used to lengthen the shelf life of fresh agricultural produce such as milk and milk-related products, fresh fruits and vegetables, meat, seafood, frozen food, chemicals and pharmaceutical drugs.
There are two logistic layers in cold chains:Surface Storage: refrigerated warehouse for storage of time-sensitive goodsRefrigerated Transport: refrigerated trucks, containers and so on.A cold chain logistics industry consists of public and private players who could
be either cold storage owners or the owners of refrigerated trucks. Further, there are third party logistics firms that facilitate movement from sourcing to the final destination of temperature-sensitive products. Therefore, the success of cold chain companies depends on how proficiently they can transport temperature-sensitive
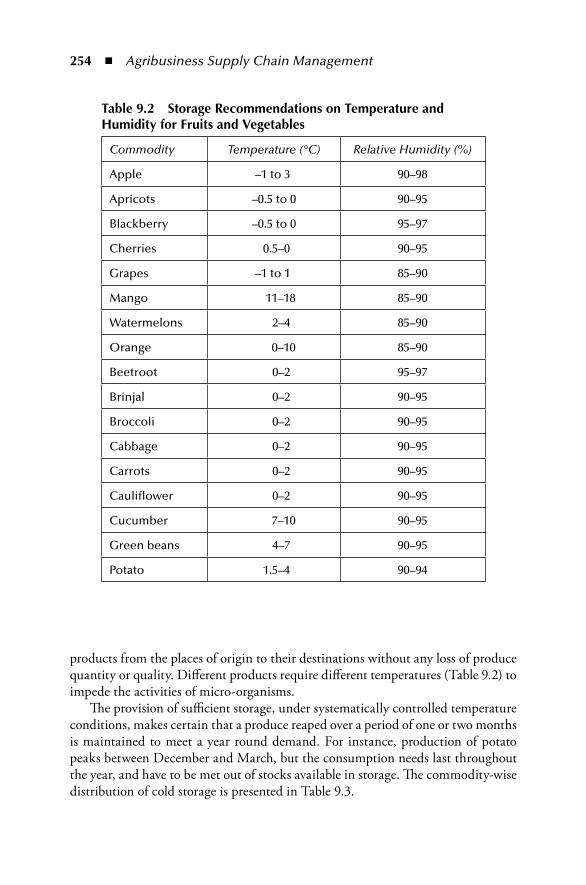
254 ◾ Agribusiness Supply Chain Management
products from the places of origin to their destinations without any loss of produce quantity or quality. Different products require different temperatures (Table 9.2) to impede the activities of micro-organisms.
The provision of sufficient storage, under systematically controlled temperature conditions, makes certain that a produce reaped over a period of one or two months is maintained to meet a year round demand. For instance, production of potato peaks between December and March, but the consumption needs last throughout the year, and have to be met out of stocks available in storage. The commodity-wise distribution of cold storage is presented in Table 9.3.
table 9.2 Storage recommendations on temperature and Humidity for Fruits and Vegetables
Commodity Temperature (°C) Relative Humidity (%)
Apple –1 to 3 90–98
Apricots –0.5 to 0 90–95
Blackberry –0.5 to 0 95–97
Cherries 0.5–0 90–95
Grapes –1 to 1 85–90
Mango 11–18 85–90
Watermelons 2–4 85–90
Orange 0–10 85–90
Beetroot 0–2 95–97
Brinjal 0–2 90–95
Broccoli 0–2 90–95
Cabbage 0–2 90–95
Carrots 0–2 90–95
Cauliflower 0–2 90–95
Cucumber 7–10 90–95
Green beans 4–7 90–95
Potato 1.5–4 90–94
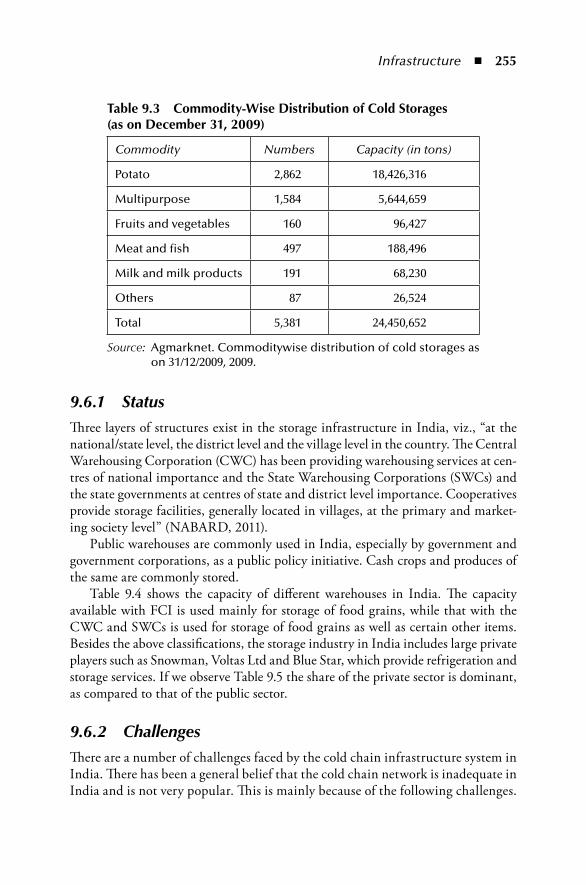
Infrastructure ◾ 255
9.6.1 StatusThree layers of structures exist in the storage infrastructure in India, viz., “at the national/state level, the district level and the village level in the country. The Central Warehousing Corporation (CWC) has been providing warehousing services at cen-tres of national importance and the State Warehousing Corporations (SWCs) and the state governments at centres of state and district level importance. Cooperatives provide storage facilities, generally located in villages, at the primary and market-ing society level” (NABARD, 2011).
Public warehouses are commonly used in India, especially by government and government corporations, as a public policy initiative. Cash crops and produces of the same are commonly stored.
Table 9.4 shows the capacity of different warehouses in India. The capacity available with FCI is used mainly for storage of food grains, while that with the CWC and SWCs is used for storage of food grains as well as certain other items. Besides the above classifications, the storage industry in India includes large private players such as Snowman, Voltas Ltd and Blue Star, which provide refrigeration and storage services. If we observe Table 9.5 the share of the private sector is dominant, as compared to that of the public sector.
9.6.2 ChallengesThere are a number of challenges faced by the cold chain infrastructure system in India. There has been a general belief that the cold chain network is inadequate in India and is not very popular. This is mainly because of the following challenges.
table 9.3 Commodity-Wise Distribution of Cold Storages (as on December 31, 2009)
Commodity Numbers Capacity (in tons)
Potato 2,862 18,426,316
Multipurpose 1,584 5,644,659
Fruits and vegetables 160 96,427
Meat and fish 497 188,496
Milk and milk products 191 68,230
Others 87 26,524
Total 5,381 24,450,652
Source: Agmarknet. Commoditywise distribution of cold storages as on 31/12/2009, 2009.
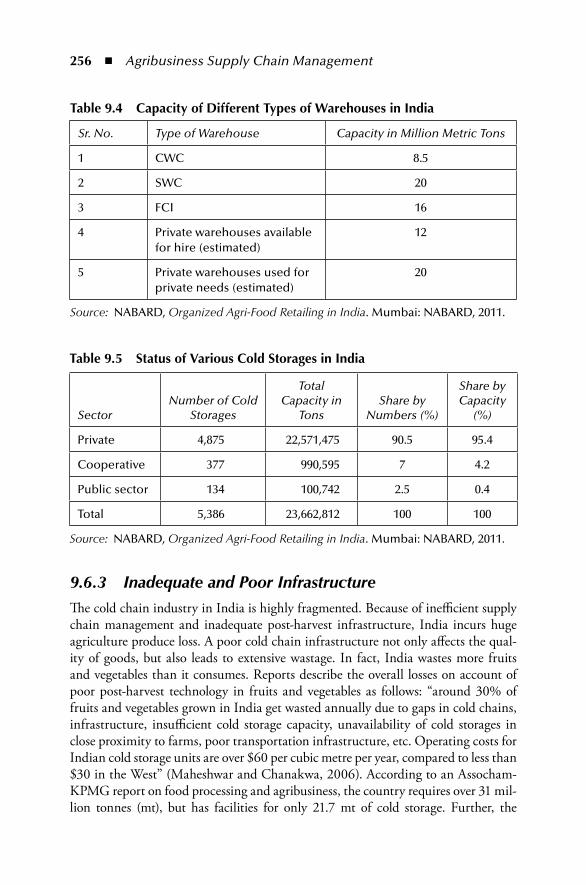
256 ◾ Agribusiness Supply Chain Management
9.6.3 Inadequate and Poor InfrastructureThe cold chain industry in India is highly fragmented. Because of inefficient supply chain management and inadequate post-harvest infrastructure, India incurs huge agriculture produce loss. A poor cold chain infrastructure not only affects the qual-ity of goods, but also leads to extensive wastage. In fact, India wastes more fruits and vegetables than it consumes. Reports describe the overall losses on account of poor post-harvest technology in fruits and vegetables as follows: “around 30% of fruits and vegetables grown in India get wasted annually due to gaps in cold chains, infrastructure, insufficient cold storage capacity, unavailability of cold storages in close proximity to farms, poor transportation infrastructure, etc. Operating costs for Indian cold storage units are over $60 per cubic metre per year, compared to less than $30 in the West” (Maheshwar and Chanakwa, 2006). According to an Assocham-KPMG report on food processing and agribusiness, the country requires over 31 mil-lion tonnes (mt), but has facilities for only 21.7 mt of cold storage. Further, the
table 9.4 Capacity of Different types of Warehouses in india
Sr. No. Type of Warehouse Capacity in Million Metric Tons
1 CWC 8.5
2 SWC 20
3 FCI 16
4 Private warehouses available for hire (estimated)
12
5 Private warehouses used for private needs (estimated)
20
Source: NABARD, Organized Agri-Food Retailing in India. Mumbai: NABARD, 2011.
table 9.5 Status of Various Cold Storages in india
SectorNumber of Cold
Storages
Total Capacity in
TonsShare by
Numbers (%)
Share by Capacity
(%)
Private 4,875 22,571,475 90.5 95.4
Cooperative 377 990,595 7 4.2
Public sector 134 100,742 2.5 0.4
Total 5,386 23,662,812 100 100
Source: NABARD, Organized Agri-Food Retailing in India. Mumbai: NABARD, 2011.
Infrastructure ◾ 257
export-related infrastructure for agricultural products is grossly inadequate at ports and airports.
A restrictive land use policy in terms of floor space indices limits the extent to which buildings can be constructed, and this has resulted in a tendency to increase the per square foot investment cost of cold storages.
9.6.4 Rising Energy Cost“Energy expenses make up about 28% of the total expenses for Indian cold stor-ages, compared to 10% in the West” (Maheshwar and Chanakwa, 2006). “This is the main constraint to setting up cold chains in India. India’s peak power deficit is around 17%–18%” (NABARD, 2011). As a result, cold storage units have to provi-sion for adequate backups, which increases capital investment costs. The intermit-tent power supply adversely impacts the operations of cold storages, and almost all units are using alternate power supply systems. This involves a high operating cost and requires the capability to manage and maintain alternate systems so that backup is available at all times. Though this is common across the globe, in India the dependency is very high, and hence, makes cold storage highly uneconomical for large parts of the agribusiness sector.
9.6.5 Poor UtilizationDifferent types of produce need different temperature conditions, and this leads to poor capacity utilization and higher fixed costs, reducing profitability. Further, many storage houses concentrate on a single commodity. This also leads to poor utilization. Coupled with this is the problem of high operational costs in India for cold storages, examples being as the high costs of power and insurance against spoilage. There is a hidden cost arising from in efficiency and failure, which adds to the operating costs.
Though there are numerous challenges, the growth in the processed food sector, the bio-pharma sector and the organized retail sector presents huge opportunities in the area of cold chain infrastructure. Furthermore, the government also plans to invest in partnerships with private players. Identifying and filling gaps in the infrastructure and adopting best practices, such as partnering with players in the logistic chain and adopting energy efficient technology, will benefit the entire agri supply chains.
9.7 organized marketsAgricultural produce moves through the marketing chain using different chan-nels of distribution. In order to eliminate the middlemen and facilitate farmers to sell their produce directly to the consumers at reasonable rates, organized markets are established. These markets can help to reduce costs by bringing the growers
258 ◾ Agribusiness Supply Chain Management
and retail merchants/dealers closer, leading to lower prices for the consumers and higher realization for the farmers. This way, both the farmers and the consumers are benefitted. The development of organized markets in recent years has boosted the demand for quality food stuffs. Organized markets can enable agrarians with technology and provide them better market access. The regulated markets are man-aged by Agricultural Produce Market Committees (APMCs). The main purpose of regulation of agricultural markets was to safeguard farmers from the exploitation of intermediaries and traders, and also to guarantee better prices and timely payments for their goods. Under the APMC Act, state governments are permitted to set up markets. These organized markets follow certain rules and procedures while car-rying out their transactions. Some examples of these channels are discussed now.
9.7.1 Rythu BazaarsRythu bazaars were started by the Government of Andhra Pradesh on January 26, 1999. “The following are the objectives of rythu bazaars:
1. To ensure remunerative prices to the farmers and provide fresh vegetables to the consumers at reasonable rates fixed every day
2. Facilitate prompt realization of sale proceeds by the farmers, without any deductions
3. Curb malpractice in weighment 4. Provide direct interface between farmers and consumers, eliminating inter-
mediaries in the trade process” (Ministry of Agriculture, n.d.).
Transport facilities for picking up and dropping off registered farmers at the rythu bazaars are to be arranged by the market functionaries through tie-ups with the state transport department. Stalls are to be allotted to the farmers on a first come first serve basis daily. The farmers are not allowed to occupy the stalls perma-nently. No fee is to be collected from the farmers. The market committee will every day communicate moderate wholesale prices of vegetables through fax between 7.30 and 8.00 a.m. Based on the these inputs, the prices of vegetable are fixed in consultation with the farmers’ committee, and may be 20%–25% higher than the wholesale price and lower than the local retail market prices in the area. The maintenance expenditure of rythu bazaars is being met from the financial sources of Agricultural Produce Market Committees.
9.7.2 Uzhavar SanthaiThe Uzhavar Santhai system was introduced by the Government of Tamil Nadu in order to provide more benefits to farmers as well as consumers. The location of the uzhavar santhai is of utmost importance. The uzhavar santhais are located in consumer areas, allowing easy access to consumers. “The first uzhavar santhai of the state was
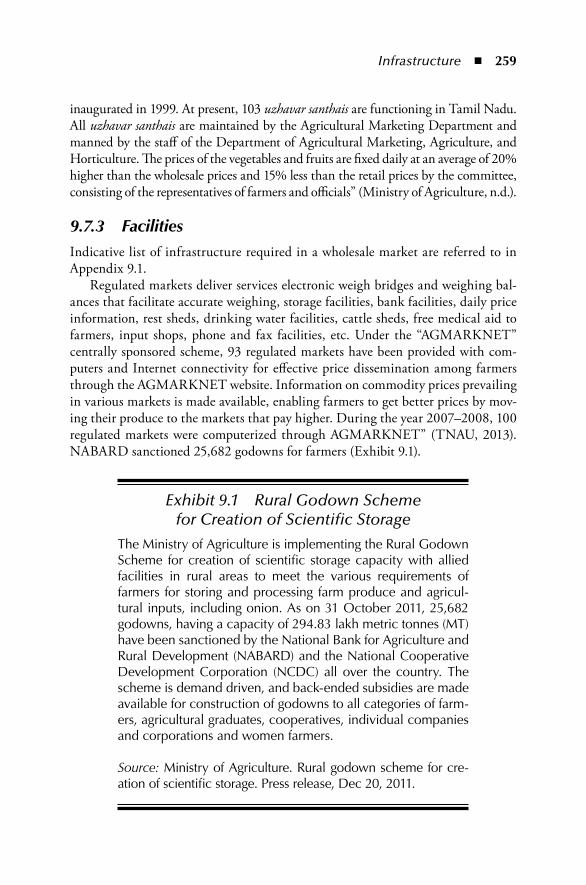
Infrastructure ◾ 259
inaugurated in 1999. At present, 103 uzhavar santhais are functioning in Tamil Nadu. All uzhavar santhais are maintained by the Agricultural Marketing Department and manned by the staff of the Department of Agricultural Marketing, Agriculture, and Horticulture. The prices of the vegetables and fruits are fixed daily at an average of 20% higher than the wholesale prices and 15% less than the retail prices by the committee, consisting of the representatives of farmers and officials” (Ministry of Agriculture, n.d.).
9.7.3 FacilitiesIndicative list of infrastructure required in a wholesale market are referred to in Appendix 9.1.
Regulated markets deliver services electronic weigh bridges and weighing bal-ances that facilitate accurate weighing, storage facilities, bank facilities, daily price information, rest sheds, drinking water facilities, cattle sheds, free medical aid to farmers, input shops, phone and fax facilities, etc. Under the “AGMARKNET” centrally sponsored scheme, 93 regulated markets have been provided with com-puters and Internet connectivity for effective price dissemination among farmers through the AGMARKNET website. Information on commodity prices prevailing in various markets is made available, enabling farmers to get better prices by mov-ing their produce to the markets that pay higher. During the year 2007–2008, 100 regulated markets were computerized through AGMARKNET” (TNAU, 2013). NABARD sanctioned 25,682 godowns for farmers (Exhibit 9.1).
Exhibit 9.1 Rural Godown Scheme for Creation of Scientific Storage
The Ministry of Agriculture is implementing the Rural Godown Scheme for creation of scientific storage capacity with allied facilities in rural areas to meet the various requirements of farmers for storing and processing farm produce and agricul-tural inputs, including onion. As on 31 October 2011, 25,682 godowns, having a capacity of 294.83 lakh metric tonnes (MT) have been sanctioned by the National Bank for Agriculture and Rural Development (NABARD) and the National Cooperative Development Corporation (NCDC) all over the country. The scheme is demand driven, and back-ended subsidies are made available for construction of godowns to all categories of farm-ers, agricultural graduates, cooperatives, individual companies and corporations and women farmers.
Source: Ministry of Agriculture. Rural godown scheme for cre-ation of scientific storage. Press release, Dec 20, 2011.
260 ◾ Agribusiness Supply Chain Management
9.8 Communication networkA communication network is the infrastructure that allows two or more people to communicate with each other. It consists of interconnected individuals who are linked by the patterned flows of information, and its analysis identifies the com-munication structure in the system (Rogers and Kincaid, 1981). In agriculture, the need for such a network should be obvious: it allows farmers from different parts of the country, with different operating characteristics, to know the market condi-tions prevailing at any given time.
Agricultural information networks interact with and impact agricultural effi-ciency in several ways. At present, there are certain communications networks exist-ing in the country through which farmers gather information from various sources.
◾ Radio: The radio is a very popular means of information dissemination among farmers. Various educational and informative programmes are being broadcast on radio to help the farmers at large. Agricultural universities and state agricultural departments use this media extensively to spread knowledge about agricultural practices and also information on farming, best practices, extension services, markets, financial assistance opportunities and so on.
◾ Television: There are educational and informational programmes on televi-sion targeted at creating awareness for farmers. An instance is the “Vayalum Vaazhvum” on the DD Podhigai channel. Radio and television are also widely used in all developed states for outreach to farmers.
◾ Toll-free call centres: The toll-free call centres such as ANGRAU and Kisan, started by the government help farmers to interact and get access to informa-tion whenever they need it. This call centre process is highly effective, as it involves close interaction with farmers.
◾ Workshops: Through agro-based workshops, farmers get useful information. These workshops are organized by local, state and central government depart-ments, agricultural universities, NGOs, farm input companies and research organizations.
Besides the above, farmers also get information through direct interaction with other farmers and dealers and from display boards in market yards. Such market information is gathered by APMCs, the Department of Agricultural Marketing, the Department of Food and field staff of the Directorate of Economics and Statistics. The Agricultural Marketing Information System Network (AGMARKNET), a pub-lic portal integrated with information technology, displays information on about 400 commodities every day. This AGMARKNET project benefits farmers by providing them with new global market access opportunities, and also strengthens the inter-nal agricultural marketing system in India. It connects almost 2900 markets all over the country and is the most successful intervention in this area. Many agricultural marketing boards (state and central) and agribusiness organizations have developed web portals on market information. Their websites’ URL are given in Appendix 9.5.
Infrastructure ◾ 261
The communication networks for price discovery and the commodity markets are discussed in further detail in a later chapter.
The Government of India has been spending on different programmes, under the five-year plans and the annual budgets, for the creation of information systems. There should be more coordination between public and private information sources in order to encourage the farmers to learn about and adopt reforms in agricultural practices so that they become proficient and yield quality products. Proper infor-mation networks are the essential infrastructure elements that help farmers to pro-duce quality goods and lead a better life.
A popular case of an effective communication network in the private sector is that of ITC’s e-choupal. “ITC’s e-choupal business model is mainly based on com-munications infrastructure. ITC has made significant investments to create and maintain its own IT network in rural India and to identify and train a local farmer to manage each e-choupal. The computer, typically housed in the farmer’s house, is linked to the internet via phone lines, or increasingly, through a VSAT connection, and serves at least 10 surrounding villages within a radius of about 5 km.
The host farmer, called a sanchalak, incurs some operating costs, and is obligated by a public oath to serve the entire community. He needs to be a well-respected local leader to run this service. The sanchalak benefits in the form of commissions paid to him for all e-choupal transactions. The farmers can use the computer to access daily closing prices at local mandis, as well as to track global price trends or find information about new farming techniques—either directly or, because many farmers are illiterate, via the sanchalak.
They also use the e-choupal for buying farm inputs directly through ITC. Farmers order seed, fertilizer and other products like consumer goods from ITC or its partners at prices lower than those available from village traders. The sanchalak typically aggregates the village demand for these products and transmits the order to an ITC representative.
At harvest time for farm produce output, ITC offers to buy the crop directly from any farmer at the previous day’s closing price; the farmer then transports his crop to an ITC processing centre, where the crop is weighed electronically and assessed for quality. The farmer is then paid for the crop, and also receives a transport fee. ‘Bonus points’, which are exchangeable for products that ITC sells, are given for crops with quality above the norm. Thus, the ITC communication infrastructure benefits agribusiness supply chains by reducing intermediaries and providing near real-time information to different stakeholders, mainly farming communities, and improves value creation in the system” (ITC, n.d.).
On similar lines is the establishment of the commodity exchanges in India. There are three national exchanges, and in total, 24 approved commodity exchanges are operating in India. The three national exchanges approved by the Government of India are the Multi-commodity Exchange of India Limited (MCX), Mumbai; (ii) the National Commodity and Derivatives Exchange Limited (NCDEX), Mumbai; and (iii) the National Multi-commodity Exchange of India Limited
262 ◾ Agribusiness Supply Chain Management
(NMCE), Ahmedabad. These on-line national commodity exchanges have been organized for conducting forward/futures trading activities in all commodities to which Section 15 of the Forward Contracts (Regulation) Act, 1952 is applicable. Trading in the other commodities that are neither listed under Section 17 nor under Section 15 of the said Act is subject to the approval of the Forward Markets Commission, Government of India. These national commodity exchanges have in place the best international practices in trading, clearing, settlement, and gover-nance (FMC, 2013). Technology for information handling with respect to com-modity arrivals and volumes offered, prices and financial flows are vital aspects of the communication network that makes the initiative successful.
Thus, establishment of appropriate communication infrastructures brings the benefits of a reduced number of intermediaries, and thereby, of improved margins and better responsiveness of the supply chains.
9.9 trainingTraining of personnel in different disciplines of agriculture is a pre-requisite to improve effectiveness. This is mentioned here as a part of human resource capabil-ity and the effectiveness of personnel in using the infrastructure currently available.
Educating farmers in agricultural technology will increase yield and land pro-ductivity. This is core to agricultural production systems, especially in a country like India, where farmers do not have adequate scope for learning and absorption of tools and techniques through customary channels of the informal awareness networks.
More specifically, farmers and other operators in agribusiness require training in logistical drivers, namely, operations of warehouses and regional distribution centres, transport decision making and inventory decisions. Training is provided to personnel involved in grading, handling, processing, storage and so on. According to a report on Indian warehouse marketing, there are huge skill gaps in the warehouse sector. Table 9.6 presents the profiles of the people employed in the warehouse sector in India.
It is estimated that by 2015, India will need approximately 35,000–40,000 ware-housing managers. There are a few training institutes like the CII Institute of Logistics and other specialized institutions that can train people in the managerial skills needed to cater to relevant needs as Level 3 managers in the warehousing sector. A number of private players use their own programmes, delivered by experts in the system, to improve capabilities at Levels 1 and 2. The demand for Levels 1 and 2 would be in large numbers, an issue that needs to be addressed to achieve growth in the long run.
The Ministry of Agriculture introduced special programmes for empowering farm women, designed to train them to contribute equally towards agricultural productivity. Farmers’ training classes are conducted periodically on various top-ics at the local level through Krishi Vigyan Kendras and field demonstrations. The farmer training programmes usually consist of training centres, vocational agri-cultural schools, agricultural market level training for farmers, information and
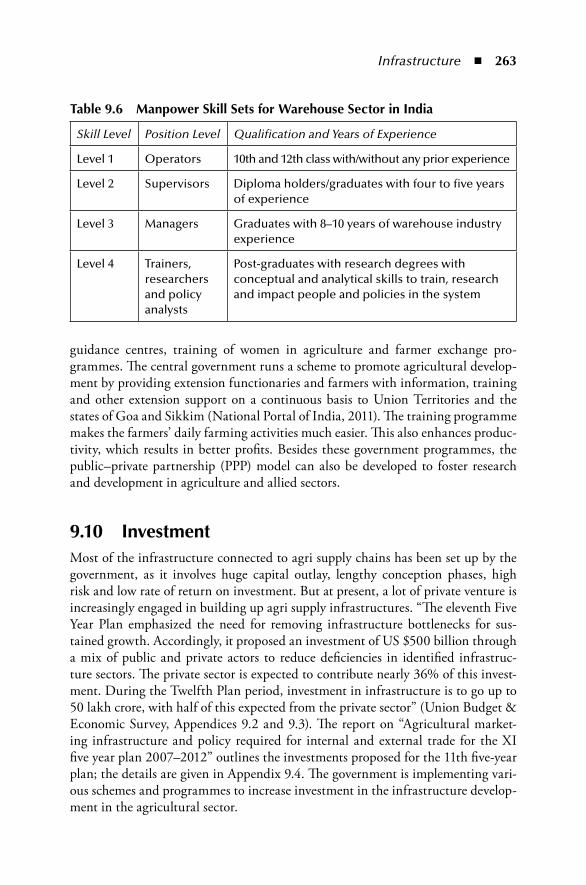
Infrastructure ◾ 263
guidance centres, training of women in agriculture and farmer exchange pro-grammes. The central government runs a scheme to promote agricultural develop-ment by providing extension functionaries and farmers with information, training and other extension support on a continuous basis to Union Territories and the states of Goa and Sikkim (National Portal of India, 2011). The training programme makes the farmers’ daily farming activities much easier. This also enhances produc-tivity, which results in better profits. Besides these government programmes, the public–private partnership (PPP) model can also be developed to foster research and development in agriculture and allied sectors.
9.10 investmentMost of the infrastructure connected to agri supply chains has been set up by the government, as it involves huge capital outlay, lengthy conception phases, high risk and low rate of return on investment. But at present, a lot of private venture is increasingly engaged in building up agri supply infrastructures. “The eleventh Five Year Plan emphasized the need for removing infrastructure bottlenecks for sus-tained growth. Accordingly, it proposed an investment of US $500 billion through a mix of public and private actors to reduce deficiencies in identified infrastruc-ture sectors. The private sector is expected to contribute nearly 36% of this invest-ment. During the Twelfth Plan period, investment in infrastructure is to go up to 50 lakh crore, with half of this expected from the private sector” (Union Budget & Economic Survey, Appendices 9.2 and 9.3). The report on “Agricultural market-ing infrastructure and policy required for internal and external trade for the XI five year plan 2007–2012” outlines the investments proposed for the 11th five-year plan; the details are given in Appendix 9.4. The government is implementing vari-ous schemes and programmes to increase investment in the infrastructure develop-ment in the agricultural sector.
table 9.6 manpower Skill Sets for Warehouse Sector in india
Skill Level Position Level Qualification and Years of Experience
Level 1 Operators 10th and 12th class with/without any prior experience
Level 2 Supervisors Diploma holders/graduates with four to five years of experience
Level 3 Managers Graduates with 8–10 years of warehouse industry experience
Level 4 Trainers, researchers and policy analysts
Post-graduates with research degrees with conceptual and analytical skills to train, research and impact people and policies in the system
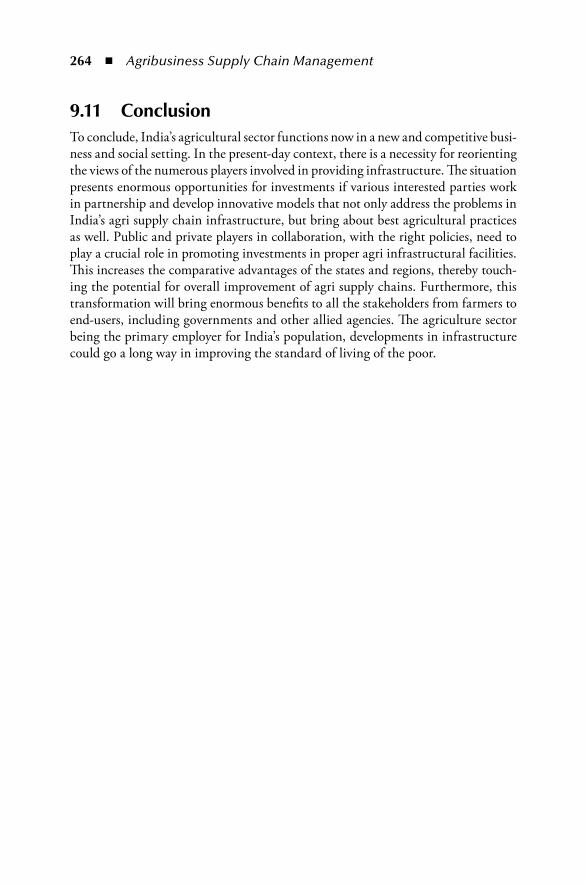
264 ◾ Agribusiness Supply Chain Management
9.11 ConclusionTo conclude, India’s agricultural sector functions now in a new and competitive busi-ness and social setting. In the present-day context, there is a necessity for reorienting the views of the numerous players involved in providing infrastructure. The situation presents enormous opportunities for investments if various interested parties work in partnership and develop innovative models that not only address the problems in India’s agri supply chain infrastructure, but bring about best agricultural practices as well. Public and private players in collaboration, with the right policies, need to play a crucial role in promoting investments in proper agri infrastructural facilities. This increases the comparative advantages of the states and regions, thereby touch-ing the potential for overall improvement of agri supply chains. Furthermore, this transformation will bring enormous benefits to all the stakeholders from farmers to end-users, including governments and other allied agencies. The agriculture sector being the primary employer for India’s population, developments in infrastructure could go a long way in improving the standard of living of the poor.
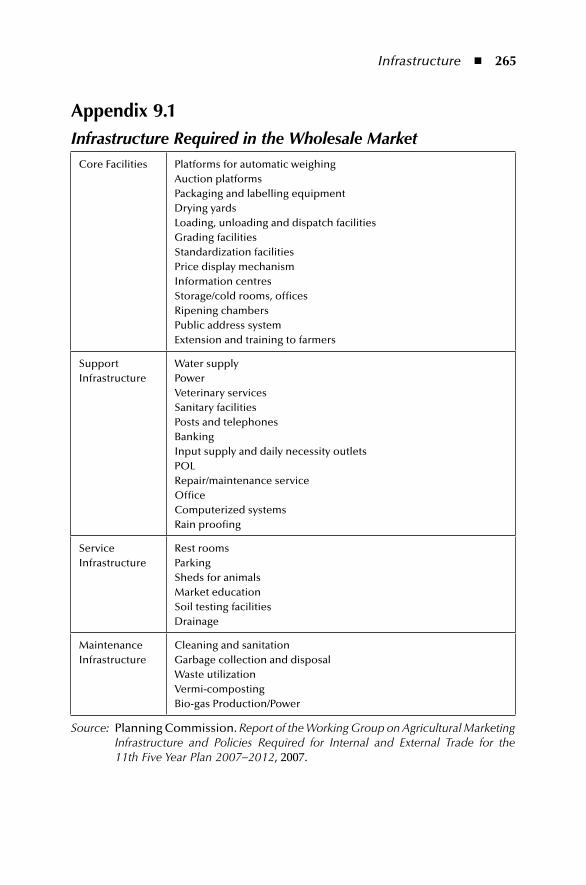
Infrastructure ◾ 265
Appendix 9.1Infrastructure Required in the Wholesale Market
Core Facilities Platforms for automatic weighingAuction platformsPackaging and labelling equipmentDrying yardsLoading, unloading and dispatch facilitiesGrading facilitiesStandardization facilitiesPrice display mechanismInformation centresStorage/cold rooms, officesRipening chambersPublic address systemExtension and training to farmers
Support Infrastructure
Water supplyPowerVeterinary servicesSanitary facilitiesPosts and telephonesBankingInput supply and daily necessity outletsPOLRepair/maintenance serviceOfficeComputerized systemsRain proofing
Service Infrastructure
Rest roomsParkingSheds for animalsMarket educationSoil testing facilitiesDrainage
Maintenance Infrastructure
Cleaning and sanitationGarbage collection and disposalWaste utilizationVermi-compostingBio-gas Production/Power
Source: Planning Commission. Report of the Working Group on Agricultural Marketing Infrastructure and Policies Required for Internal and External Trade for the 11th Five Year Plan 2007–2012, 2007.
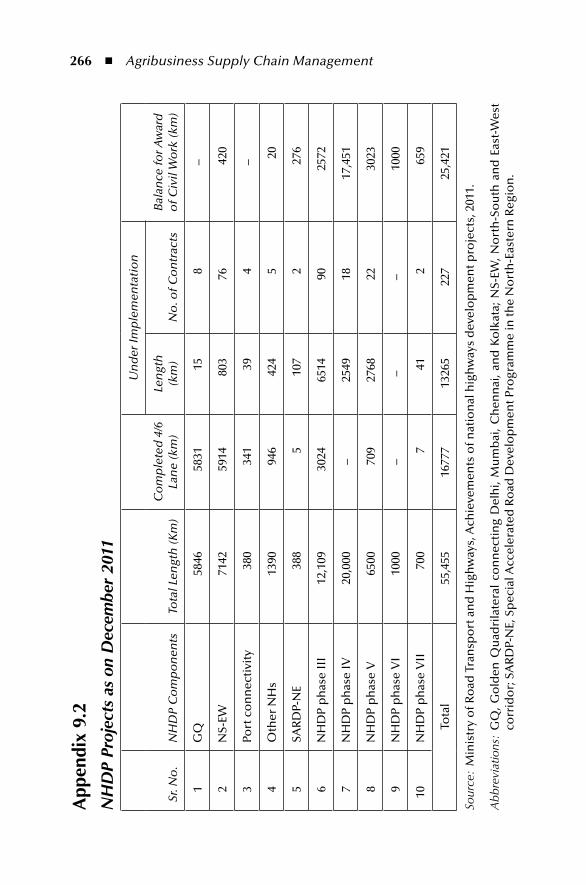
266 ◾ Agribusiness Supply Chain Management
App
endi
x 9.
2N
HD
P Pr
ojec
ts a
s on
Dec
embe
r 20
11
Sr. N
o.
NH
DP
Co
mp
on
ents
Tota
l Len
gth
(Km
)C
om
ple
ted
4/6
La
ne
(km
)
Un
der
Imp
lem
enta
tio
n
Bal
ance
for A
war
d
of C
ivil
Wo
rk (k
m)
Len
gth
(k
m)
No
. of C
on
trac
ts
1G
Q58
4658
3115
8–
2N
S-EW
7142
5914
803
7642
0
3Po
rt c
on
nec
tivi
ty38
034
139
4–
4O
ther
NH
s13
9094
642
45
20
5SA
RD
P-N
E38
85
107
227
6
6N
HD
P p
has
e II
I12
,109
3024
6514
9025
72
7N
HD
P p
has
e IV
20,0
00–
2549
1817
,451
8N
HD
P p
has
e V
6500
709
2768
2230
23
9N
HD
P p
has
e V
I10
00–
––
1000
10N
HD
P p
has
e V
II70
07
412
659
Tota
l55
,455
1677
713
265
227
25,4
21
Sour
ce:
Min
istr
y o
f Ro
ad T
ran
spo
rt a
nd
Hig
hw
ays,
Ach
ieve
men
ts o
f nat
ion
al h
igh
way
s d
evel
op
men
t pro
ject
s, 2
011.
Abb
revi
atio
ns: G
Q,
Go
lden
Qu
adri
late
ral
con
nec
tin
g D
elh
i, M
um
bai
, C
hen
nai
, an
d K
olk
ata;
NS-
EW,
No
rth
-So
uth
an
d E
ast-
Wes
t co
rrid
or;
SA
RD
P-N
E, S
pec
ial A
ccel
erat
ed R
oad
Dev
elo
pm
ent P
rogr
amm
e in
the
No
rth
-Eas
tern
Reg
ion
.
Infrastructure ◾ 267
App
endi
x 9.
3Ex
pend
iture
Bud
get
Five
-Yea
r Pla
n/A
nn
ual
Pla
n
Agr
icu
lture
an
d A
llied
Act
ivit
ies
Tota
l Pla
n O
utl
ay
Perc
enta
ge S
har
e o
f A
gric
ultu
re a
nd
Alli
ed
Act
ivit
ies
to T
ota
l (cr
ore
)
Plan
Ou
tlay
sA
ctu
al E
xpen
ditu
rePl
an O
utl
ays
12
34
56
7
nin
th p
lan
(199
7–20
02)
3754
637
239d
8592
0094
1041
d4.
94.
0
An
nu
al P
lan
(199
7–19
98)
6974
5929
1559
0512
9757
4.5
4.6
An
nu
al P
lan
(199
8–19
99)
8687
7698
1859
0715
1581
4.7
5.1
An
nu
al P
lan
(199
9–20
00)
8796
7365
1922
6316
0608
4.6
4.6
An
nu
al P
lan
(200
0–20
01)
8281
7577
2033
5916
4479
4.1
4.6
An
nu
al P
lan
(200
1–20
02)
9097
8248
2288
9318
6315
4.0
4.4
tent
h pl
an (
2002
–200
7)58
933
6070
2d15
2563
916
1846
0d3.
93.
8
An
nu
al P
lan
(200
2–20
03)
9977
7655
2478
9721
0203
4.0
3.8
An
nu
al P
lan
(200
3–20
04)
9940
8776
2560
4222
4827
3.9
3.9
An
nu
al P
lan
(200
4–20
05)
1110
910
963
2878
4326
3665
3.9
4.2
An
nu
al P
lan
(200
5–20
06)
1384
012
554
3612
3924
7177
3.8
5.1
(Con
tinue
d)
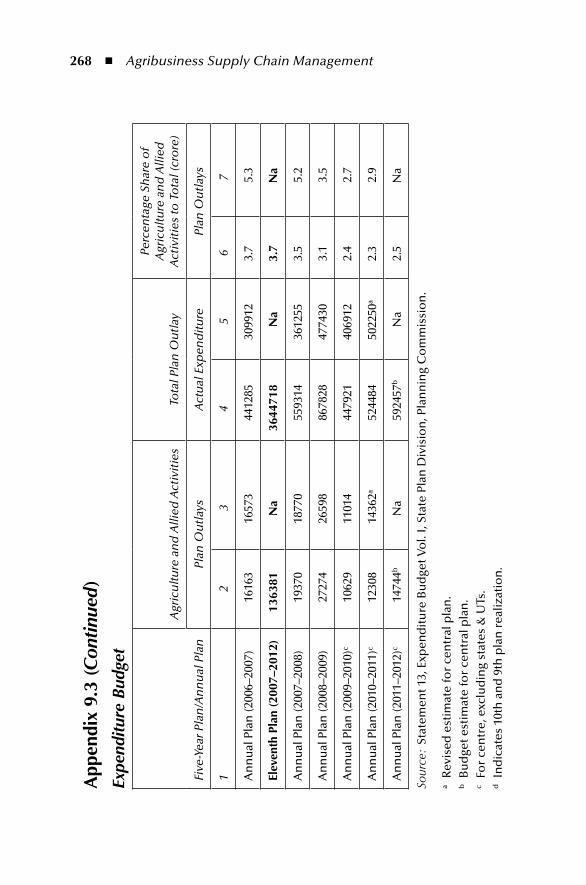
268 ◾ Agribusiness Supply Chain Management
App
endi
x 9.
3 (C
ontin
ued
)Ex
pend
iture
Bud
get
Five
-Yea
r Pla
n/A
nn
ual
Pla
n
Agr
icu
lture
an
d A
llied
Act
ivit
ies
Tota
l Pla
n O
utl
ay
Perc
enta
ge S
har
e o
f A
gric
ultu
re a
nd
Alli
ed
Act
ivit
ies
to T
ota
l (cr
ore
)
Plan
Ou
tlay
sA
ctu
al E
xpen
ditu
rePl
an O
utl
ays
12
34
56
7
An
nu
al P
lan
(200
6–20
07)
1616
316
573
4412
8530
9912
3.7
5.3
elev
enth
pla
n (2
007–
2012
)13
6381
na
3644
718
na
3.7
na
An
nu
al P
lan
(200
7–20
08)
1937
018
770
5593
1436
1255
3.5
5.2
An
nu
al P
lan
(200
8–20
09)
2727
426
598
8678
2847
7430
3.1
3.5
An
nu
al P
lan
(200
9–20
10)c
1062
911
014
4479
2140
6912
2.4
2.7
An
nu
al P
lan
(201
0–20
11)c
1230
814
362a
5244
8450
2250
a2.
32.
9
An
nu
al P
lan
(201
1–20
12)c
1474
4bN
a59
2457
bN
a2.
5N
a
Sour
ce:
Stat
emen
t 13,
Exp
end
itu
re B
ud
get V
ol.
I, St
ate
Plan
Div
isio
n, P
lan
nin
g C
om
mis
sio
n.
a R
evis
ed e
stim
ate
for
cen
tral
pla
n.
b
Bu
dge
t est
imat
e fo
r ce
ntr
al p
lan
.c
For
cen
tre,
exc
lud
ing
stat
es &
UTs
.d
In
dic
ates
10t
h a
nd
9th
pla
n r
ealiz
atio
n.
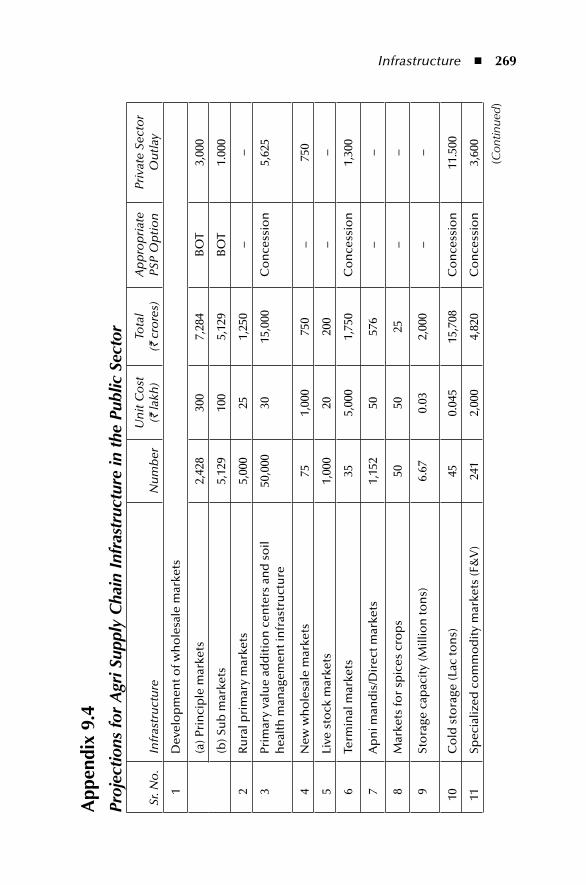
Infrastructure ◾ 269
App
endi
x 9.
4Pr
ojec
tions
for
Agr
i Sup
ply
Cha
in I
nfra
stru
ctur
e in
the
Pub
lic S
ecto
r
Sr. N
o.
Infr
astr
uct
ure
Nu
mb
erU
nit
Co
st
(` la
kh)
Tota
l (`
cro
res)
Ap
pro
pri
ate
PSP
Op
tio
nPr
ivat
e Se
cto
r O
utl
ay
1D
evel
op
men
t of w
ho
lesa
le m
arke
ts
(a) P
rin
cip
le m
arke
ts2,
428
300
7,28
4B
OT
3,00
0
(b) S
ub
mar
kets
5,12
910
05,
129
BO
T1.
000
2R
ura
l pri
mar
y m
arke
ts5,
000
251,
250
––
3Pr
imar
y va
lue
add
itio
n c
ente
rs a
nd
so
il h
ealt
h m
anag
emen
t in
fras
tru
ctu
re50
,000
3015
,000
Co
nce
ssio
n5,
625
4N
ew w
ho
lesa
le m
arke
ts75
1,00
075
0–
750
5Li
ve s
tock
mar
kets
1,00
020
200
––
6Te
rmin
al m
arke
ts35
5,00
01,
750
Co
nce
ssio
n1,
300
7A
pn
i man
dis
/Dir
ect m
arke
ts1,
152
5057
6–
–
8M
arke
ts fo
r sp
ices
cro
ps
5050
25–
–
9St
ora
ge c
apac
ity
(Mill
ion
ton
s)6.
670.
032,
000
––
10C
old
sto
rage
(Lac
ton
s)45
0.04
515
,708
Co
nce
ssio
n11
.500
11Sp
ecia
lized
co
mm
od
ity
mar
kets
(F&
V)
241
2,00
04,
820
Co
nce
ssio
n3,
600
(Con
tinue
d)
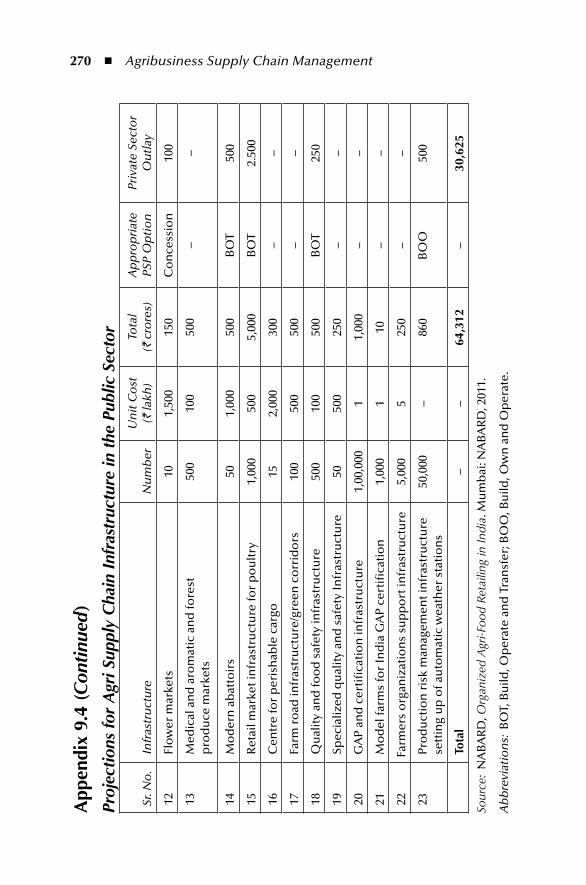
270 ◾ Agribusiness Supply Chain Management
App
endi
x 9.
4 (C
ontin
ued
)Pr
ojec
tions
for
Agr
i Sup
ply
Cha
in I
nfra
stru
ctur
e in
the
Pub
lic S
ecto
r
Sr. N
o.
Infr
astr
uct
ure
Nu
mb
erU
nit
Co
st
(` la
kh)
Tota
l (`
cro
res)
Ap
pro
pri
ate
PSP
Op
tio
nPr
ivat
e Se
cto
r O
utl
ay
12Fl
ow
er m
arke
ts10
1,50
015
0C
on
cess
ion
100
13M
edic
al a
nd
aro
mat
ic a
nd
fore
st
pro
du
ce m
arke
ts50
010
050
0–
–
14M
od
ern
ab
atto
irs
501,
000
500
BO
T50
0
15R
etai
l mar
ket i
nfr
astr
uct
ure
for
po
ult
ry1,
000
500
5,00
0B
OT
2.50
0
16C
entr
e fo
r p
eris
hab
le c
argo
152,
000
300
––
17Fa
rm r
oad
infr
astr
uct
ure
/gre
en c
orr
ido
rs10
050
050
0–
–
18Q
ual
ity
and
foo
d s
afet
y in
fras
tru
ctu
re50
010
050
0B
OT
250
19Sp
ecia
lized
qu
alit
y an
d s
afet
y In
fras
tru
ctu
re50
500
250
––
20G
AP
and
cer
tifi
cati
on
infr
astr
uct
ure
1,00
,000
11,
000
––
21M
od
el fa
rms
for
Ind
ia G
AP
cert
ifica
tio
n1,
000
110
––
22Fa
rmer
s o
rgan
izat
ion
s su
pp
ort
infr
astr
uct
ure
5,00
05
250
––
23Pr
od
uct
ion
ris
k m
anag
emen
t in
fras
tru
ctu
re
sett
ing
up
of a
uto
mat
ic w
eath
er s
tati
on
s50
,000
–86
0B
OO
500
tota
l–
–64
,312
–30
,625
Sour
ce:
NA
BA
RD
, Org
aniz
ed A
gri-F
ood
Ret
ailin
g in
Indi
a. M
um
bai
: NA
BA
RD
, 201
1.
Ab
bre
viat
ion
s: B
OT,
Bu
ild, O
per
ate
and
Tra
nsf
er; B
OO
, Bu
ild, O
wn
an
d O
per
ate.
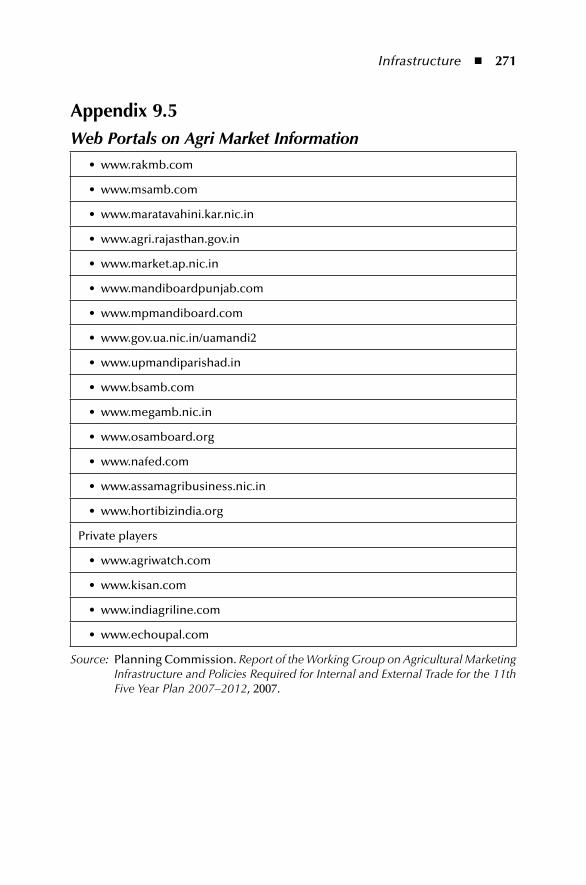
Infrastructure ◾ 271
Appendix 9.5Web Portals on Agri Market Information
• www.rakmb.com
• www.msamb.com
• www.maratavahini.kar.nic.in
• www.agri.rajasthan.gov.in
• www.market.ap.nic.in
• www.mandiboardpunjab.com
• www.mpmandiboard.com
• www.gov.ua.nic.in/uamandi2
• www.upmandiparishad.in
• www.bsamb.com
• www.megamb.nic.in
• www.osamboard.org
• www.nafed.com
• www.assamagribusiness.nic.in
• www.hortibizindia.org
Private players
• www.agriwatch.com
• www.kisan.com
• www.indiagriline.com
• www.echoupal.com
Source: Planning Commission. Report of the Working Group on Agricultural Marketing Infrastructure and Policies Required for Internal and External Trade for the 11th Five Year Plan 2007–2012, 2007.
272 ◾ Agribusiness Supply Chain Management
referencesAgmarknet. Commoditywise distribution of cold storages as on 31/12/2009, 2009. http://
www.agmarknet.nic.in/commcold3112009.htmFAO and ODI. Market-oriented agricultural infrastructure: Appraisal of public-private
partnerships. London: Food and Agriculture Organization of the United Nations and Overseas Development Institute, January 2008. http://www.odi.org.uk/resources/docs/2131.pdf
Forward Markets Commission (FMC). IV. Exchanges and their Role. 2013. http://www.fmc.gov.in/index3.aspx?sslid=141&subsublinkid=59&langid=2
Gangadharan, S. External commercial borrowings (ECB) Policy. Reserve Bank of India, March 2, 2010. http://rbi.org.in/scripts/NotificationUser.aspx?Id=5519&Mode=0
ITC. e-Choupal. n.d. http://www.itcportal.com/businesses/agri-business/e-choupal.aspxMaheshwar, C. and Chanakwa, T.S. Post harvest losses due to gaps in cold Chain in
India: A solution, Acta Hort. (ISHS) 712:777–784, 2006. http://www.actahort.org/books/712/712_100.htm
Ministry of Agriculture. Model project on development of direct marketing infrastructure: Rythu Bazar / farmers’ market. Agmarknet, n.d. http://agmarknet.nic.in/amrscheme/rythu_bazarmodel.htm
Ministry of Agriculture. Rural godown scheme for creation of scientific storage. Press release, Dec 20, 2011. http://pib.nic.in/newsite/erelease.aspx?relid=79068
Ministry of Road Transport and Highways (MoRT&H). Achievements of national high-ways development projects, 2011. http://mospi.nic.in/Mospi_New/upload/SYB2013/CH-21-ROADS/Table%2021.7.xls
NABARD, Organized Agri-Food Retailing in India. Mumbai: NABARD, 2011.National Portal of India, Farmers’ training, 2011. http://www.archive.india.gov.in/citizen/
agriculture/index.php?id=51Planning Commission. Report of the Working Group on Agricultural Marketing Infrastructure
and Policies Required for Internal and External Trade for the 11th Five Year Plan 2007–2012, 2007. http://planningcommission.nic.in/aboutus/committee/wrkgrp11/wg11_agrpm.pdf
Planning Commission. Report of the Working Group on Central Roads Sector, 2011a. http://planningcommission.gov.in/aboutus/committee/wrkgrp12/transport/report/wg_cen_roads.pdf
Planning Commission. Report of the Working Group on Logistics. New Delhi, 2011b. http://planningcommission.gov.in/reports/genrep/rep_logis.pdf
Rogers, E.M., & D.L. Kincaid. Communication Networks: Toward a New Paradigm for Research. New York: Free Press, 1981.
TNAU. Agricultural marketing in Tamilnadu, TNAU Agritech Portal, Tamil Nadu Agriculture University, 2013. http://agritech.tnau.ac.in/agricultural_marketing/ agrimark_Tamilnadu%201.html
273
Chapter 10
information technology
10.1 introductionInformation technology (IT) plays a key role in achieving the supply chain goals of efficiency and responsiveness. Over the last three decades, we have seen the emergence of the role of information technology in decision-making processes in agribusiness as well. The progression has been from data capture and use of office tools for analytics and decision making, to the modern-day phenomenon of real-time data capture and transfer, and application of sophisticated mod-els for decision making. This progression has been seen not only at the level of firms and organizations, but also at the level of individual farms. In this chapter, we highlight some of the impacts the India agribusiness sector has experienced over the years, and how the sector has improved supply chain efficiency and responsiveness.
Obje CTIv eThe objective is to understand the scope for deploying technology in agribusiness at the farm level and at the processing stage. Discussions are on various information technology systems, adoption of new technologies like Internet, mobile computing and cloud computing in this sector. A number of application examples are discussed here.
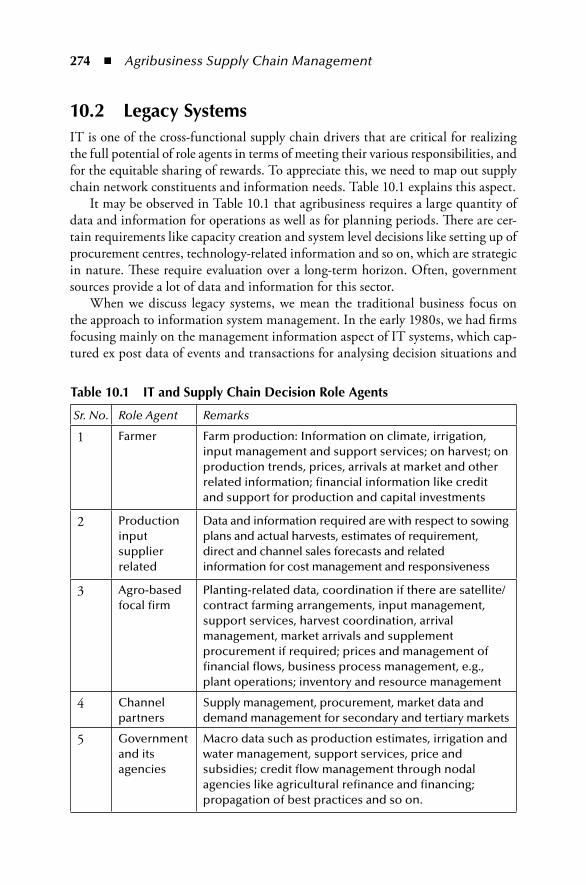
274 ◾ Agribusiness Supply Chain Management
10.2 Legacy SystemsIT is one of the cross-functional supply chain drivers that are critical for realizing the full potential of role agents in terms of meeting their various responsibilities, and for the equitable sharing of rewards. To appreciate this, we need to map out supply chain network constituents and information needs. Table 10.1 explains this aspect.
It may be observed in Table 10.1 that agribusiness requires a large quantity of data and information for operations as well as for planning periods. There are cer-tain requirements like capacity creation and system level decisions like setting up of procurement centres, technology-related information and so on, which are strategic in nature. These require evaluation over a long-term horizon. Often, government sources provide a lot of data and information for this sector.
When we discuss legacy systems, we mean the traditional business focus on the approach to information system management. In the early 1980s, we had firms focusing mainly on the management information aspect of IT systems, which cap-tured ex post data of events and transactions for analysing decision situations and
table 10.1 it and Supply Chain Decision role Agents
Sr. No. Role Agent Remarks
1 Farmer Farm production: Information on climate, irrigation, input management and support services; on harvest; on production trends, prices, arrivals at market and other related information; financial information like credit and support for production and capital investments
2 Production input supplier related
Data and information required are with respect to sowing plans and actual harvests, estimates of requirement, direct and channel sales forecasts and related information for cost management and responsiveness
3 Agro-based focal firm
Planting-related data, coordination if there are satellite/contract farming arrangements, input management, support services, harvest coordination, arrival management, market arrivals and supplement procurement if required; prices and management of financial flows, business process management, e.g., plant operations; inventory and resource management
4 Channel partners
Supply management, procurement, market data and demand management for secondary and tertiary markets
5 Government and its agencies
Macro data such as production estimates, irrigation and water management, support services, price and subsidies; credit flow management through nodal agencies like agricultural refinance and financing; propagation of best practices and so on.
Information Technology ◾ 275
impacts. For example, a large dairy firm would consolidate data on daily procure-ment from villages, distribution of payment for procurement and process analysis. If there was a funding agency like a bank that had lent fixed and working capital, it would require operational efficiency data for fund flows. IT systems were mainly focused on this and other similar issues.
A number of sugar mills, edible oil processors, dairy plants, plantation crop processors and channel partners used such legacy systems effectively then.
10.3 enterprise resource planningDuring the late 1980s and the early 1990s, businesses started implementing enter-prise resource planning (ERP) systems from large vendors for intra-firm resource utilization efficiency. The central theme of ERP systems is that better resources planning would enable enterprises to execute and manage internal business pro-cesses efficiently. The basic principles of management used for achieving internal efficiencies are the following:
1. Accounting principles 2. Production management principles 3. Value chain principles 4. Management accounting principles for control
If one looks at these principles, agro-based businesses require application of these systems more effectively. For example, let us look at the case of a sugar plant which receives input from about 25,000 farmers. Each of their accounts needs to be managed all through the planting time, the input of services and the receipt of produce for crushing. The cycle is completed with the payment of procurement price for the produce. Further, sugar plants will have a multitude of vendors who provide process material and other goods and services.
Apart from the procurement aspect, the plant has to manage its production systems, such as juice extraction, clarification and vaporization, condensation and granulization of sugar. There are a number of efficiency parameters and operational aspects in managing these process centres, as well as auxiliary equipment stations, operating boilers and power generation equipment, which, respectively, provide steam and power for processing. Effective operations require appropriate production planning systems that cover receipt of material, resource allocation and scheduling of operations. ERP facilitate the operations of a sugar factory to achieve the same.
ERP facilitates not only the production and operations management of the firm, but also its value chain activities. Table 10.2 relates the value chain activities and their links to information system in a sugar plant.
Thus, value chain activities show the need for ERP-based systems, especially for organized agro-based units, to have appropriate information set-ups for achieving internal efficiency and intra-firm-focused financial perspective-driven IT systems.
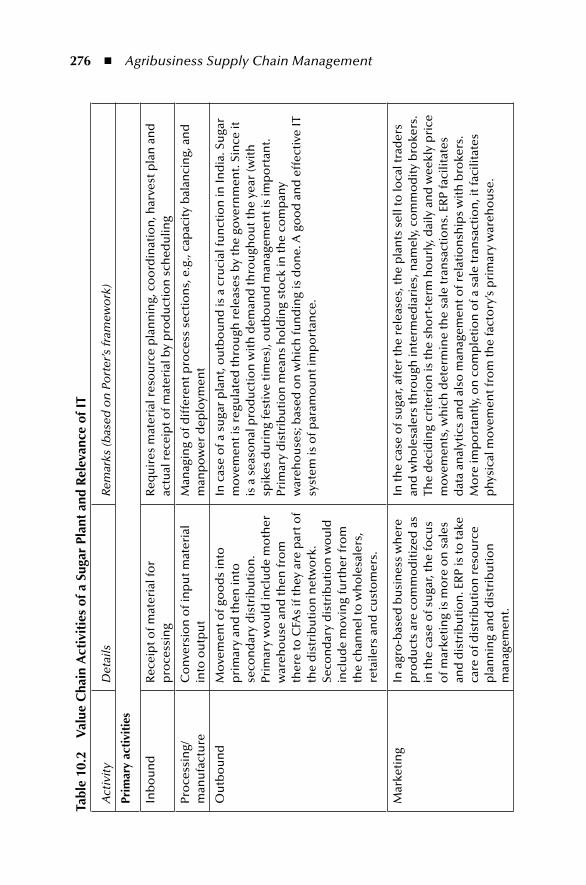
276 ◾ Agribusiness Supply Chain Management
tabl
e 10
.2
Val
ue C
hain
Act
ivit
ies
of a
Sug
ar p
lant
and
rel
evan
ce o
f it
Act
ivit
yD
etai
lsRe
mar
ks (b
ased
on
Po
rter
’s fr
amew
ork
)
prim
ary
acti
viti
es
Inb
ou
nd
Rec
eip
t of m
ater
ial f
or
pro
cess
ing
Req
uir
es m
ater
ial r
eso
urc
e p
lan
nin
g, c
oo
rdin
atio
n, h
arve
st p
lan
an
d
actu
al r
ecei
pt o
f mat
eria
l by
pro
du
ctio
n s
ched
ulin
g
Pro
cess
ing/
man
ufa
ctu
reC
on
vers
ion
of i
np
ut m
ater
ial
into
ou
tpu
tM
anag
ing
of d
iffe
ren
t pro
cess
sec
tio
ns,
e.g
., ca
pac
ity
bal
anci
ng,
an
d
man
po
wer
dep
loym
ent
Ou
tbo
un
dM
ove
men
t of g
oo
ds
into
p
rim
ary
and
then
into
se
con
dar
y d
istr
ibu
tio
n.
Prim
ary
wo
uld
incl
ud
e m
oth
er
war
eho
use
an
d th
en fr
om
th
ere
to C
FAs
if th
ey a
re p
art o
f th
e d
istr
ibu
tio
n n
etw
ork
. Se
con
dar
y d
istr
ibu
tio
n w
ou
ld
incl
ud
e m
ovi
ng
furt
her
fro
m
the
chan
nel
to w
ho
lesa
lers
, re
taile
rs a
nd
cu
sto
mer
s.
In c
ase
of a
su
gar
pla
nt,
ou
tbo
un
d is
a c
ruci
al fu
nct
ion
in In
dia
. Su
gar
mo
vem
ent i
s re
gula
ted
thro
ugh
rel
ease
s b
y th
e go
vern
men
t. Si
nce
it
is a
sea
son
al p
rod
uct
ion
wit
h d
eman
d th
rou
gho
ut t
he
year
(wit
h
spik
es d
uri
ng
fest
ive
tim
es),
ou
tbo
un
d m
anag
emen
t is
imp
ort
ant.
Prim
ary
dis
trib
uti
on
mea
ns
ho
ldin
g st
ock
in th
e co
mp
any
war
eho
use
s; b
ased
on
wh
ich
fun
din
g is
do
ne.
A g
oo
d a
nd
eff
ecti
ve IT
sy
stem
is o
f par
amo
un
t im
po
rtan
ce.
Mar
keti
ng
In a
gro
-bas
ed b
usi
nes
s w
her
e p
rod
uct
s ar
e co
mm
od
itiz
ed a
s in
the
case
of s
uga
r, th
e fo
cus
of m
arke
tin
g is
mo
re o
n s
ales
an
d d
istr
ibu
tio
n. E
RP
is to
take
ca
re o
f dis
trib
uti
on
res
ou
rce
pla
nn
ing
and
dis
trib
uti
on
m
anag
emen
t.
In th
e ca
se o
f su
gar,
afte
r th
e re
leas
es, t
he
pla
nts
sel
l to
loca
l tra
der
s an
d w
ho
lesa
lers
thro
ugh
inte
rmed
iari
es, n
amel
y, c
om
mo
dit
y b
roke
rs.
The
dec
idin
g cr
iter
ion
is th
e sh
ort
-ter
m h
ou
rly,
dai
ly a
nd
wee
kly
pri
ce
mo
vem
ents
, wh
ich
det
erm
ine
the
sale
tran
sact
ion
s. E
RP
faci
litat
es
dat
a an
alyt
ics
and
als
o m
anag
emen
t of r
elat
ion
ship
s w
ith
bro
kers
. M
ore
imp
ort
antl
y, o
n c
om
ple
tio
n o
f a s
ale
tran
sact
ion
, it f
acili
tate
s p
hys
ical
mo
vem
ent f
rom
the
fact
ory
’s p
rim
ary
war
eho
use
.
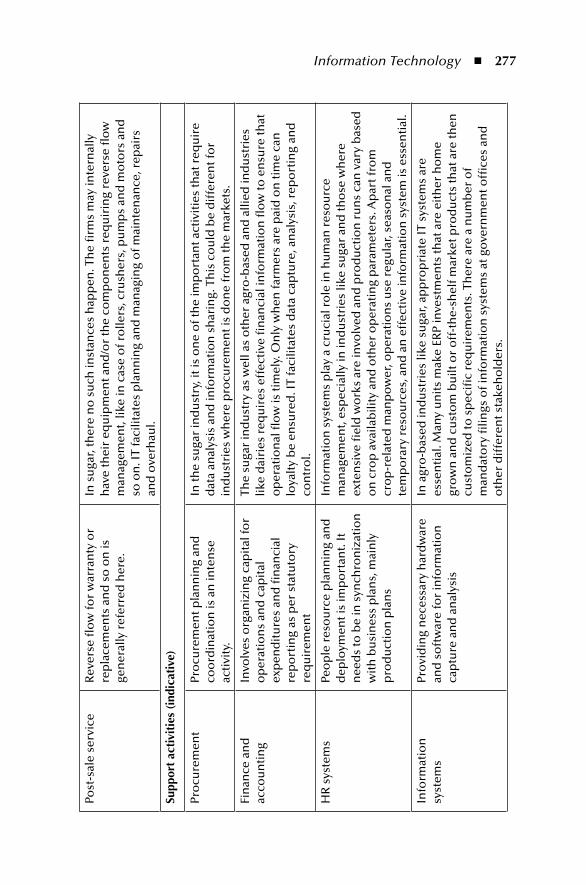
Information Technology ◾ 277
Post
-sal
e se
rvic
eR
ever
se fl
ow
for
war
ran
ty o
r re
pla
cem
ents
an
d s
o o
n is
ge
ner
ally
ref
erre
d h
ere.
In s
uga
r, th
ere
no
su
ch in
stan
ces
hap
pen
. Th
e fi
rms
may
inte
rnal
ly
hav
e th
eir
equ
ipm
ent a
nd
/or
the
com
po
nen
ts r
equ
irin
g re
vers
e fl
ow
m
anag
emen
t, lik
e in
cas
e o
f ro
llers
, cru
sher
s, p
um
ps
and
mo
tors
an
d
so o
n. I
T fa
cilit
ates
pla
nn
ing
and
man
agin
g o
f mai
nte
nan
ce, r
epai
rs
and
ove
rhau
l.
Supp
ort
acti
viti
es (
indi
cati
ve)
Pro
cure
men
tPr
ocu
rem
ent p
lan
nin
g an
d
coo
rdin
atio
n is
an
inte
nse
ac
tivi
ty.
In th
e su
gar
ind
ust
ry, i
t is
on
e o
f th
e im
po
rtan
t act
ivit
ies
that
req
uir
e d
ata
anal
ysis
an
d in
form
atio
n s
har
ing.
Th
is c
ou
ld b
e d
iffe
ren
t fo
r in
du
stri
es w
her
e p
rocu
rem
ent i
s d
on
e fr
om
the
mar
kets
.
Fin
ance
an
d
acco
un
tin
gIn
volv
es o
rgan
izin
g ca
pit
al fo
r o
per
atio
ns
and
cap
ital
ex
pen
dit
ure
s an
d fi
nan
cial
re
po
rtin
g as
per
sta
tuto
ry
req
uir
emen
t
The
suga
r in
du
stry
as
wel
l as
oth
er a
gro
-bas
ed a
nd
alli
ed in
du
stri
es
like
dai
ries
req
uir
es e
ffec
tive
fin
anci
al in
form
atio
n fl
ow
to e
nsu
re th
at
op
erat
ion
al fl
ow
is ti
mel
y. O
nly
wh
en fa
rmer
s ar
e p
aid
on
tim
e ca
n
loya
lty
be
ensu
red
. IT
faci
litat
es d
ata
cap
ture
, an
alys
is, r
epo
rtin
g an
d
con
tro
l.
HR
sys
tem
sPe
op
le r
eso
urc
e p
lan
nin
g an
d
dep
loym
ent i
s im
po
rtan
t. It
n
eed
s to
be
in s
ynch
ron
izat
ion
w
ith
bu
sin
ess
pla
ns,
mai
nly
p
rod
uct
ion
pla
ns
Info
rmat
ion
sys
tem
s p
lay
a cr
uci
al r
ole
in h
um
an r
eso
urc
e m
anag
emen
t, es
pec
ially
in in
du
stri
es li
ke s
uga
r an
d th
ose
wh
ere
exte
nsi
ve fi
eld
wo
rks
are
invo
lved
an
d p
rod
uct
ion
ru
ns
can
var
y b
ased
o
n c
rop
ava
ilab
ility
an
d o
ther
op
erat
ing
par
amet
ers.
Ap
art f
rom
cr
op
-rel
ated
man
po
wer
, op
erat
ion
s u
se r
egu
lar,
seas
on
al a
nd
te
mp
ora
ry r
eso
urc
es, a
nd
an
eff
ecti
ve in
form
atio
n s
yste
m is
ess
enti
al.
Info
rmat
ion
sy
stem
sPr
ovi
din
g n
eces
sary
har
dw
are
and
so
ftw
are
for
info
rmat
ion
ca
ptu
re a
nd
an
alys
is
In a
gro
-bas
ed in
du
stri
es li
ke s
uga
r, ap
pro
pri
ate
IT s
yste
ms
are
esse
nti
al. M
any
un
its
mak
e ER
P in
vest
men
ts th
at a
re e
ith
er h
om
e gr
ow
n a
nd
cu
sto
m b
uilt
or
off
-th
e-sh
elf m
arke
t pro
du
cts
that
are
then
cu
sto
miz
ed to
sp
ecifi
c re
qu
irem
ents
. Th
ere
are
a n
um
ber
of
man
dat
ory
filin
gs o
f in
form
atio
n s
yste
ms
at g
ove
rnm
ent o
ffice
s an
d
oth
er d
iffe
ren
t sta
keh
old
ers.
278 ◾ Agribusiness Supply Chain Management
In general, ERP revolves around managing different types of resources, namely, machines, material, men and money. Resources are used to manage functions and execute processes to achieve business objectives.
Finally, ERPs are used for management accounting and controls such as breakeven analyses for decisions, budgeting, investment appraisals, managing cost centres and arriving at decisions like apportionment of cost based on activity-based costing, and consequently, pricing decisions. In agro-based businesses, these become crucial, and hence, ERP plays a major role.
However, given the current business supply chain orientations, where one may have to move from the intra-firm perspective to network-based information systems, ERP may bring in certain limitations because of the design and rigidity it requires in processes.
10.4 Supply-Chain-Centric ApplicationsThere are three layers of supply chain management tools, which are supply chain planning tools, supply chain collaboration tools and supply chain execution tools. However, from the enterprise information system dimension, these automated tools could be classified based on their purpose, as we now consider.
1. Supply chain planning: Planning is a key decision area with focus on resource allocation, demand and supply planning, analysis and reporting. The plan-ning process provides key inputs for upstream and downstream linkages and for firm level (internal) input–output operation. All those companies that operate under an organized structure with IT in place would require supply chain planning tools.
2. Supply chain collaboration: Supply chain collaboration involves team and work group collaboration of upstream and downstream partners. It facilitates seamless operation of the firm’s supply chain. Collaboration could include sharing of documents, data and plans for effective management of supply chain costs and responsiveness. In agriculture input businesses like fertilizer and capital equipment like tractors, the need for collaboration is widely felt and used, based on availability of tools and techniques and the sophistication afforded by network partners. In modern times, even the farming sector uses collaboration tools such as mobile phones and the Internet.
3. Supply chain execution: The supply chain execution decision area relates to operations and execution management decisions on buying, storing, process-ing and moving, and so on. It would also include management of financial flows to various stakeholders. Execution information management involves using work support engines and/or frameworks. This would facilitate data cap-ture, instruction triggers for action and documents such as delivery reports, stock reports and so on. Typically, all types of agro-based firms require captur-ing execution data, and in certain cases like regulated business, statutory filling may be mandatory. Capture of execution data and reports are vital for the firm.
Information Technology ◾ 279
There are many information system vendors who offer a wide range of supply chain management solutions using different information technology frameworks. However, the purpose of the frameworks would be to enable the tools across three supply chain management layers: planning, collaboration and execution. Each of the supply chain management activities relies on supply chain processes that span across various functions inside and outside the enterprise boundaries.
It may be useful to discuss the supply chain council reference model processes such as plan, source, make, distribute and return. This could be related with agricultural business activity and information system requirements. Table 10.3 highlights this issue.
Thus, we see how a supply chain IT system improves the firm’s supply chain network and its partners’ business effectiveness and responsiveness to ulti-mate customers. In agro-based business, the benefits to the ultimate customer have been unclear, as they are large groups at the farthest end of the supply chain.
Here, we would like to highlight an example of IT application for enhancing the supplier relationship management process of a dairy company. Farmers deliver milk at collection centres twice a day. “Based on the quality and the number of litres supplied by a farmer, his or her total amount is calculated. A sample from the supply is taken and tested for fat and solid not fat (SNF) percentage. Once all the tests are done, each farmer’s data (quantity, fat & SNF percentages along with the farmer’s unique number) is entered in a scannable data sheet. This sheet is sent to the company’s computer centre, where it is scanned. The farmer is paid on a fixed day of every week for a week’s collection. The entire data base is managed through a state-of-the-art computer software system. It would not be out of place to mention that the company has been paying the farmers on time every week, without any exception” (www.hatsun.com).
It is important to note one of the areas where IT is used for distribution management, and hence, supply chain networks: the government and its agencies like the Food Corporation of India (FCI), which supports the public distribu-tion system (PDS) in India. This involves procurement, storage and distribu-tion of essential items for economically less privileged people in India, and thus, comprised a large supply chain. An IT system is crucial, as it has to link up various government departments, FCI offices and storage centres, movement plans and distribution effectiveness at the level of every outlet in every dis-trict. Government departments, supported by the National Informatics Centre and other state level departments and agencies, have embraced technology for the benefit of the common people, and the agribusiness supply chain, too, has improved its effectiveness.
It may be useful to note here that the Internet and mobile and cloud technolo-gies have dramatically impacted the supply chain partners’ decision areas. Here are a few instances of success based on technology deployment.
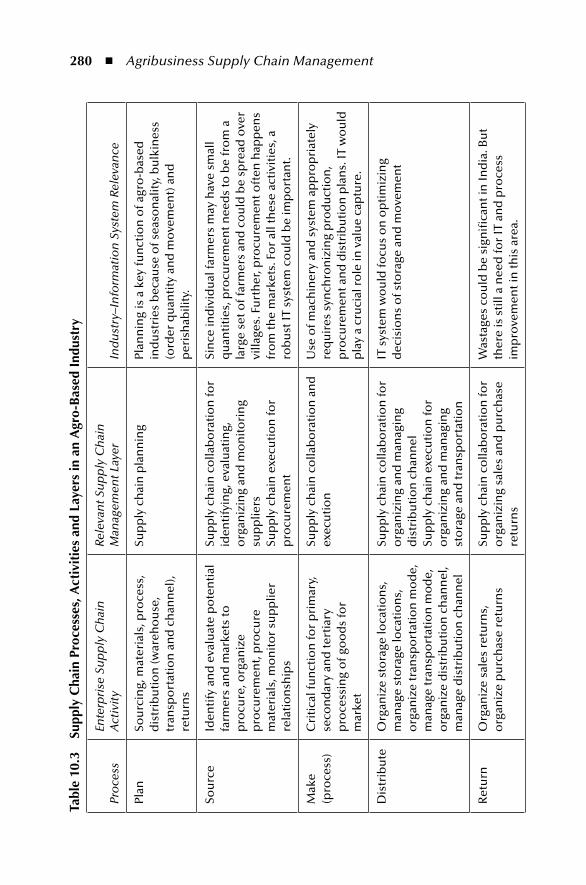
280 ◾ Agribusiness Supply Chain Management
tabl
e 10
.3
Supp
ly C
hain
pro
cess
es, A
ctiv
itie
s an
d La
yers
in a
n A
gro-
Bas
ed i
ndus
try
Pro
cess
Ente
rpri
se S
up
ply
Ch
ain
A
ctiv
ity
Rele
van
t Su
pp
ly C
hai
n
Man
agem
ent L
ayer
Ind
ust
ry–I
nfo
rmat
ion
Sys
tem
Rel
evan
ce
Plan
Sou
rcin
g, m
ater
ials
, pro
cess
, d
istr
ibu
tio
n (w
areh
ou
se,
tran
spo
rtat
ion
an
d c
han
nel
), re
turn
s
Sup
ply
ch
ain
pla
nn
ing
Plan
nin
g is
a k
ey fu
nct
ion
of a
gro
-bas
ed
ind
ust
ries
bec
ause
of s
easo
nal
ity,
bu
lkin
ess
(ord
er q
uan
tity
an
d m
ove
men
t) a
nd
p
eris
hab
ility
.
Sou
rce
Iden
tify
an
d e
valu
ate
po
ten
tial
fa
rmer
s an
d m
arke
ts to
p
rocu
re, o
rgan
ize
pro
cure
men
t, p
rocu
re
mat
eria
ls, m
on
ito
r su
pp
lier
rela
tio
nsh
ips
Sup
ply
ch
ain
co
llab
ora
tio
n fo
r id
enti
fyin
g, e
valu
atin
g,
org
aniz
ing
and
mo
nit
ori
ng
sup
plie
rsSu
pp
ly c
hai
n e
xecu
tio
n fo
r p
rocu
rem
ent
Sin
ce in
div
idu
al fa
rmer
s m
ay h
ave
smal
l q
uan
titi
es, p
rocu
rem
ent n
eed
s to
be
fro
m a
la
rge
set o
f far
mer
s an
d c
ou
ld b
e sp
read
ove
r vi
llage
s. F
urt
her
, pro
cure
men
t oft
en h
app
ens
fro
m th
e m
arke
ts. F
or
all t
hes
e ac
tivi
ties
, a
rob
ust
IT s
yste
m c
ou
ld b
e im
po
rtan
t.
Mak
e (p
roce
ss)
Cri
tica
l fu
nct
ion
for
pri
mar
y,
seco
nd
ary
and
tert
iary
p
roce
ssin
g o
f go
od
s fo
r m
arke
t
Sup
ply
ch
ain
co
llab
ora
tio
n a
nd
ex
ecu
tio
nU
se o
f mac
hin
ery
and
sys
tem
ap
pro
pri
atel
y re
qu
ires
syn
chro
niz
ing
pro
du
ctio
n,
pro
cure
men
t an
d d
istr
ibu
tio
n p
lan
s. IT
wo
uld
p
lay
a cr
uci
al r
ole
in v
alu
e ca
ptu
re.
Dis
trib
ute
Org
aniz
e st
ora
ge lo
cati
on
s,
man
age
sto
rage
loca
tio
ns,
o
rgan
ize
tran
spo
rtat
ion
mo
de,
m
anag
e tr
ansp
ort
atio
n m
od
e,
org
aniz
e d
istr
ibu
tio
n c
han
nel
, m
anag
e d
istr
ibu
tio
n c
han
nel
Sup
ply
ch
ain
co
llab
ora
tio
n fo
r o
rgan
izin
g an
d m
anag
ing
dis
trib
uti
on
ch
ann
elSu
pp
ly c
hai
n e
xecu
tio
n fo
r o
rgan
izin
g an
d m
anag
ing
sto
rage
an
d tr
ansp
ort
atio
n
IT s
yste
m w
ou
ld fo
cus
on
op
tim
izin
g d
ecis
ion
s o
f sto
rage
an
d m
ove
men
t
Ret
urn
Org
aniz
e sa
les
retu
rns,
o
rgan
ize
pu
rch
ase
retu
rns
Sup
ply
ch
ain
co
llab
ora
tio
n fo
r o
rgan
izin
g sa
les
and
pu
rch
ase
retu
rns
Was
tage
s co
uld
be
sign
ifica
nt i
n In
dia
. Bu
t th
ere
is s
till
a n
eed
for
IT a
nd
pro
cess
im
pro
vem
ent i
n th
is a
rea.
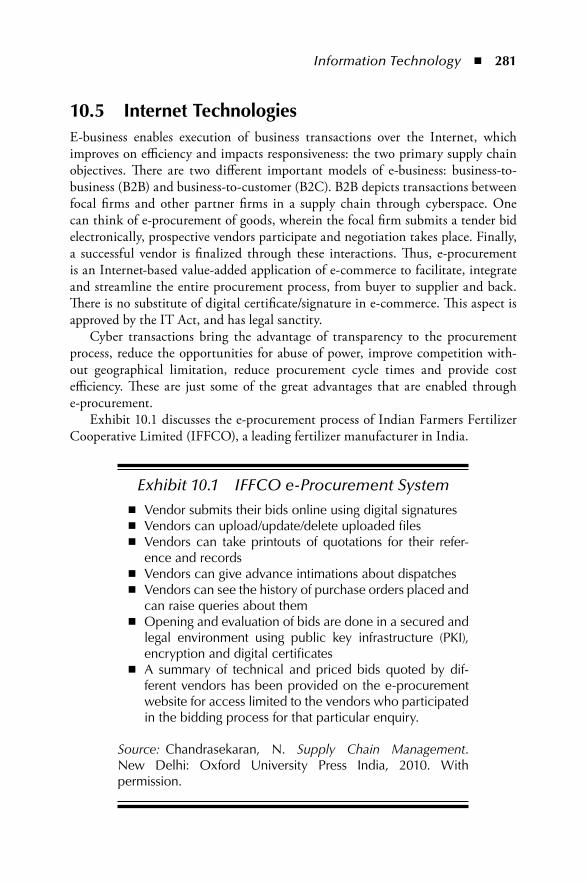
Information Technology ◾ 281
10.5 internet technologiesE-business enables execution of business transactions over the Internet, which improves on efficiency and impacts responsiveness: the two primary supply chain objectives. There are two different important models of e-business: business-to-business (B2B) and business-to-customer (B2C). B2B depicts transactions between focal firms and other partner firms in a supply chain through cyberspace. One can think of e-procurement of goods, wherein the focal firm submits a tender bid electronically, prospective vendors participate and negotiation takes place. Finally, a successful vendor is finalized through these interactions. Thus, e-procurement is an Internet-based value-added application of e-commerce to facilitate, integrate and streamline the entire procurement process, from buyer to supplier and back. There is no substitute of digital certificate/signature in e-commerce. This aspect is approved by the IT Act, and has legal sanctity.
Cyber transactions bring the advantage of transparency to the procurement process, reduce the opportunities for abuse of power, improve competition with-out geographical limitation, reduce procurement cycle times and provide cost efficiency. These are just some of the great advantages that are enabled through e-procurement.
Exhibit 10.1 discusses the e-procurement process of Indian Farmers Fertilizer Cooperative Limited (IFFCO), a leading fertilizer manufacturer in India.
Exhibit 10.1 IFFCO e-Procurement System
◾ Vendor submits their bids online using digital signatures ◾ Vendors can upload/update/delete uploaded files ◾ Vendors can take printouts of quotations for their refer-
ence and records ◾ Vendors can give advance intimations about dispatches ◾ Vendors can see the history of purchase orders placed and
can raise queries about them ◾ Opening and evaluation of bids are done in a secured and
legal environment using public key infrastructure (PKI), encryption and digital certificates
◾ A summary of technical and priced bids quoted by dif-ferent vendors has been provided on the e-procurement website for access limited to the vendors who participated in the bidding process for that particular enquiry.
Source: Chandrasekaran, N. Supply Chain Management. New Delhi: Oxford University Press India, 2010. With permission.
282 ◾ Agribusiness Supply Chain Management
In e-procurement, it is possible that vendors and buyers have the scope of hav-ing access to more information about the transactions than they would have in a normal supply chain management structure with disparate information flows. Vendors participating in bids may not be serious, and could fail to execute contracts awarded to them. Hence, focal firms need to do pre-bidding evaluation more rigor-ously and get scrutinized prospects for the bids.
Apart from e-procurement, which is information intensive, there are also other B2B transactions such as collaborative initiatives for product development, produc-tion information and product and market research, testing and analysis of results, literature development and so on. One may note that providing information across the supply chain, negotiating prices and contracts, allowing customers to place orders and tracking the same and managing financial flows are primary aspects of B2B e-business models. From the supply chain perspective, the system enables effective information flow, flawless financial flow and streamlined physical flow. B2B is more to do with sourcing, pricing and information, and logistical drivers such as warehousing, inventory and transportation enable the same. New business models evolve around these drivers and management of flows.
In agro-based business, ITC’s e-choupal business is a classic example of use of technology for business growth and for improvement of the overall effectiveness of the farm to process and process to market networks.
10.5.1 ITC E-ChoupalITC, one of India’s largest private sector companies, is into diversified businesses, and has a long history. It has a turnover of US$ 7 billion and a market capitaliza-tion of US$ 35 billion. The company’s shares are listed with three stock exchanges: Kolkata, Mumbai and the National Stock Exchange. ITC’s businesses include fast moving consumer goods (FMCG), hotels, paperboards and specialty papers, pack-aging, agri business and information technology.
ITC is a market leader in its traditional businesses of cigarettes, hotels, paper-boards, packaging and agri exports. It is rapidly gaining market share in its new businesses of packaged foods and confectioneries, branded apparels, personal care products and stationeries. It may be interesting to note here that its non-cigarette sector revenue, which was around 27% of the total revenue in 2002–2003, went up to 44% of the total revenue of the company by 2011–2012, which was a significant change in the composition of the revenue structure. Though ITC’s businesses are domestic market centric, they also have exports and thus, earn foreign exchanges. The earnings in foreign exchange over the last 10 years amounted to nearly US$ 4.9 billion. ITC’s agribusiness operation is one of India’s largest exporters of agricul-tural products and contributed to the extent of 56% of the last 10 years of ITC’s foreign exchange earnings.
ITC’s e-choupal initiative is a path-breaking move to improve the competitive-ness of Indian agriculture, benefiting farmers as well as the company by bringing
Information Technology ◾ 283
transparency in procurement prices, reducing intermediation processes and empow-ering local villagers. All these are possible through use of the Internet at the village level through ITC kiosks.
Traditionally, farmers sell their produce to traders either at the village level or at local markets, and traders operate in government-regulated wholesale agricul-tural markets (called mandis). The food processing companies used to buy from the mandis. The drawback in this marketing system is that the farmers rarely have any information on market conditions, such as data on prices and arrival patterns, when they decide on a sale. The traders, on the other hand, are well informed about crop prices prevailing in different markets and the prices offered by processing companies. This helps intermediaries to exploit the farmers and earn super normal profits for their roles, while all other network partners, such as the farmers, the processing companies and the consumers are at a disadvantage.
We now take a look at ITC’s e-choupal model. It is a unique hub-and-spoke model where villages near are linked to a village procurement centre with internet connec-tivity. Choupal means marketplace, and the prefix e stands for electronic, represent-ing the Internet thus, the e-choupal is an electronically linked market where farmers can sell produce to ITC after making informed decisions (TechSangam, 2011).
1. It has two dimensions, namely, transparency and dynamic information on prices and operational procurement perspectives. The first dimension is the Internet kiosk (e-choupal) set up in villages to enable farmers to access daily wholesale prices for produce such as soybean, wheat, tobacco and coffee in the local mandis. The kiosks also display the price offered by ITC ABD. The prices are updated every day in the evening by ITC. The second dimension is the hub, which includes operational aspects such as procurement, storage of goods and farmer training. There are warehouses and farmer training centres to support every 40–60 e-choupals.
2. The kiosk is installed at the home of the sanchalak, who is the manager. Typically, he is a well-respected person in the local community and is accept-able to them. He plays the role of disseminating information about crop prices in major markets and weather information. Each sanchalak manages three to six villages. There are upa-sanchalaks, who are deputy managers, operating at the village level.
3. Sanchalaks also facilitate the purchase of farming inputs, crop sales, and non-ITC products such as insurance policies. The information dissemination is a free service. In all other cases where the sanchalak enables transactions, he gets paid a commission ranging from 0.25% (fertilizers) to 15% (insur-ance policies). Upa-sanchalaks share the commission with the sanchalak for transactions enabled by them.
4. IT provides scope for connecting with farmers directly and giving them information on market prices and ITC’s procurement prices, and matching or improving upon market price. Farmers get value-added services like inputs
284 ◾ Agribusiness Supply Chain Management
and support extension services, which impact favourably on the crop eco-nomics. Other value-added services also include about 25 warehouse hubs, which are full-service Choupal Sagars housing retail stores, fuel stations, soil testing labs and food courts.
5. ITC is operating in about 10 states in India with about 6500 e-choupals, 110 warehouses and is impacting the lives of about 4 million farmers in about 40,000 villages. The system contributes nearly two-thirds of ITC’s agribusiness division revenues, a percentage that is likely to increase over the years.
6. Aparajita Goyal (2009), of the Development Research Group, World Bank, shares the following inferences based on research on ITC intervention through kiosks:
a. Significant increase in the average price of soybean (1%–3%) in local markets after introduction of kiosks
b. Heterogeneous effects of kiosks by distance. The further away the kiosks are from the markets, the lower is the effect on price
c. Dispersion in prices across markets decreasing over time d. Increase in the area under soya cultivation by 19%. Evidence of substitu-
tion moves away from rice cultivation e. Effect of warehouses on average prices in local markets is small and insig-
nificant, indicating the sorting effect offsets the competition effect. 7. ITC also reduced its procurement cost, improved loyalty and increased value
across the supply chain.
10.6 mobile technologyMobile phones represent one form of information and communication technology. Personal computers, laptops, the Internet, television, radio, and traditional news-papers are all used to promote improvement of agriculture and rural development. Hence, if mobile phones can use the Internet and other applications for informa-tion and transaction, then it is going to be important to understand how they improve supply chain effectiveness.
Mobile phones are used to deliver content and services that can help foster inclusive growth in India by digitally empowering citizens across all cross-sections of society, both urban and rural, in India. These services are called utility mobile value added services (MVAS). In urban areas, mobile penetration is believed to be 100%. However, in rural areas it is around 23% as of 2011.
With the increase in smart phones availability at a low cost, and with the preva-lence of content and applications that are made popular and economical by tele-communications companies and content providers, the scope for adopting use of mobile for agro-based businesses is high.
Information Technology ◾ 285
Rural segment services include selling and procurement information, support for farm commodities, education for farming communities on best practices and delivery of health care and education to remote villages via the mobile broadband network (World Bank, 2011). Thus, the proliferation of mobile phones is being used to help raise farmers’ incomes, make agricultural marketing more efficient, lower information costs, reduce transport costs and provide a platform to deliver services and innovate.
There are already a number of applications in India where mobile networks are used for agribusiness effectiveness. Some popular instances are discussed now.
1. Mobile phones can serve as the backbone for early warning systems to mitigate agricultural risks and safeguard agricultural incomes. The M.S. Swaminathan Centre, as well as a number of other interest groups, disseminates informa-tion on the weather through mobile phones, which helps farmers to plan their activities carefully under difficult agronomic and climatic conditions to man-age their input–process–output management. Fishermen communities have deployed systems to avoid going into rough seas during high tides. Similarly, farmers could plan fertilizer applications and deployment of labour much better using mobile networks.
2. Mobile phones make markets efficient and help farmers to sell goods better. They also facilitate intermediaries in understanding the demand, the arrival pattern and prices. It is understood that ITC has also scaled up its informa-tion system with mobile applications. Just the proliferation of usage itself becomes a boom.
Jensen (2007), in his study on information (technology), market perfor-mance and welfare of the South Indian fisheries sector, has observed that as mobile phone coverage increased in Kerala, fishermen bought phones and started using them to look for beach auctions along the coast, where supplies were lower and prices higher than at their home beaches. Fishermen rapidly learned to calculate whether the additional fuel costs of sailing to the high-priced auctions were justified.
Their group actions reduced price volatility and wastages. Price dis-persion was dramatically reduced, declining from 60%–70% to 15% or less. There was no net change in fishermen’s average catch, but more of the catch was sold because wastage, which previously averaged 5%–8% of the daily catch, was effectively eliminated. The rapid adoption of mobile phones improved fishermen’s profits by 8%, and was coupled with a 4% decline in consumer prices.
3. There are a number of companies that use mobile networks to enable price information and link it to procurement processes from primary and second-ary processors. Marico, a leading company in the consumer goods industry,
286 ◾ Agribusiness Supply Chain Management
especially in edible oil and personal and hair care products, is believed to be encouraging the use of mobile networks.
4. Small and medium enterprises in the processing of agro-based products have their own networks through mobile service providers. There is a coconut oil producers’ association that operates as a registered society at Kangeyam, pro-viding necessary price and transaction information to its members. Large buyers for secondary and tertiary processing have promoted information and price efficiency by encouraging community networks. They are bidding to purchase quantity at certain price points at regular intervals during the day through short messaging services using mobile telephone networks. This gives confidence to millers and improves information efficiency for market trading activities. Appendix 10.1 discusses a supply chain network for such a business.
Thus, mobile usage and evolution of telecommunications along with smart phone usage have improved supply chain efficiency in agro-based businesses in India.
10.7 Cloud ComputingIt may be useful here to highlight cloud computing and applications deployment in agribusiness. Appendix 10.1 and 10.2 throw light on a few perspectives of cloud computing.
A cloud-based agro system is a useful monitor for the agricultural sector and its constituents, such as farmers, markets, governments and intermediaries. One can provide online service facilities that are available to all the users, from any part of the country and at any time. In order to render the services, the agri-sector-oriented system may have the following services:
1. Communication: There is a need for communicating information on soil, testing, weather, crop-related issues, credit and so on to farmers and various other stakeholders.
2. Research and knowledge sharing: Agriculture requires extensive field research and analysis of data. The opportunity to include large sampling from differ-ent locations and use technology for research analysis and synthesis would help all participants in the supply chain.
3. Further, there is a wealth of best practices generated by agricultural experts, farmers and researchers that are to be propagated through the sharing of experiences. The explicit knowledge quotient is high, and a cloud-based sys-tem can help in sharing. Further, implicit knowledge could also be shared through forums and hierarchy-defined interactions.
Information Technology ◾ 287
The scope and advantages of cloud computing applications in the agro-based sector would include
1. Firms in agro-based businesses can join up to widen the network of firms that can be brought into the information technology processes, as even small players in the network can adopt cloud computing at a low cost.
2. Firms can move to cloud-based computing and thereby improve their busi-ness processes with upstream and downstream network players. Some of the potential upstream benefits are
a. reduction in procurement cycle; b. conversion of request for quotations into Purchase Order and issue in a
short time, especially during peak season process time at secondary and tertiary processing units;
c. reduction of process time for accounts payable invoices and quick release of payments, which would make farmers and intermediaries, including small-time primary processors, happy;
d. elimination of redundant processes, data entry and thereby improved process efficiency of processing firms.
3. Further, associations and institutions in support services can adopt more IT processes and greatly improve the quality of research, laboratory functions and information sharing.
Thus, cloud computing and its applications can play a significant role in the impact of IT on Indian agro-based businesses and effectiveness of their supply chain.
10.8 ConclusionThere are some unique advantages of IT usage in agribusiness supply chains for farmers as well as for processors.
1. Farmers are empowered with cell phones, and hence, they are networked and better informed about weather, superior seeds, more attractive prices, and so on.
2. Farmers are now getting immediate payments for most of their produce because the buying companies and traders are empowered by IT.
3. IT replaces some of the intermediaries and hence results in better efficiency.
IT systems and e-business models help achieve effective supply chains. Services supply chains, including that of governments, governmental bodies and research
288 ◾ Agribusiness Supply Chain Management
institutions have moved up in maturity level in using Internet-enabled customer support in business transactions. Manufacturing and processing units in agro-based industries and distribution-driven networks are in process of evolving in e-business adaptation, as there are still conflicts between traditional and contemporary busi-ness models. However, technology developments and adoption of equipment like smart phones and other handhelds would certainly improve the role of information technology as one of the supply chain drivers.
Appendix 10.1SME Cluster: Processing of Coconut Kernel and Extraction of Oil—A Case Study at Kangeyam, Tirupur District*
IntroductionKarthekeyan, son of Periyaswamy Gowndar, returns to his family business after completing his MBA at one of the premier institutions in Western India and work-ing for some time in the sourcing operations of an MNC which is in the FMCG business. As the only son of his parents, Karthekeyan inherits farmland of 50 acres of coconut groves in Pollachi near Coimbatore, and the family business of mer-chandising coconut kernels and processing and selling coconut oil. When he was a student, Karthekeyan had the opportunity to study at Ooty Public School, after which he did his mechanical engineering at the Premier Technology Institute. Immediately thereafter, he enrolled as a fresher for a master’s course in business administration. He has nurtured dreams of making it big in life. The sudden ill health of Periyaswamy Goundar compels him to take over the trusteeship of the family wealth and settle at home.
Periyaswamy Goundar, understanding the aspirations of Karthekeyan, briefs the latter on the nuances of coconut cluster operations. He sets the tone for Karthekeyan’s future moves, impressing on him the need to address the challenges of industry structures and supply chains to ensure effective operations.
Sourcing of Coconut and KernelsFarmers in and around Coimbatore district take pride in calling Pollachi the coco-nut city. Pollachi enjoys favourable agro climatic conditions because of its strategic location along the Palghat pass, where it benefits from both the southwest and the
* Source: Chandrasekaran, N. Supply Chain Management. New Delhi: Oxford University Press India, 2010. With permission.
Information Technology ◾ 289
northeast monsoons. Further, the temperature is always pleasant throughout the year, as it is neither too hot nor too cold, which makes it conducive to nurturing coconut that give the best of yield. The farms at Pollachi are well-irrigated and fer-tile. The disciplined labourers and landlords and an inclusive culture are conducive for nurturing coconut groves. Apart from coconuts, farmers also cultivate betel palm trees as interregnum crops to improve their earnings.
The best period for coconut yield falls between March and October, contrib-uting almost 75% of the annual yield. Coconuts from Pollachi are sold as tender coconuts for consumption, which are sold by and large at premiums across Tamil Nadu and Kerala. Approximately 30% of the yield during the peak season and 10% during the off season are sold as tender coconuts. The larger part of the coconuts goes in for processing.
Processed coconuts can be sold directly as kernels and used as edible products. This usage accounts for about 25% of the coconuts available for processing. The remaining 75% of coconuts is predominantly used for extraction of oil. This process occurs at two levels. First, premier FMCG companies such as Marico Industries, CavinKare, Hindustan Uni Lever (HUL) and others procure kernels from vendors and process them either on their own or through contract manufacturers for selling as branded oil. Second, a large portion of material is being crushed by small proces-sers and sold in bulk through commodity markets; their produce goes primarily to rural market and semi-urban markets for consumption, and also as intermediary to the personal care product segment.
Direct Consumption TradeProduce that moves as tender coconuts from Pollachi is traded by middlemen/ brokers at different consumption centres. They fix a farm gate price and move produce through road transport, mainly in trucks of 10/16 tonne capacity, to urban locations such as Chennai, Coimbatore, Trichy, Madurai, Cochin, Bangalore and so on. Typically, more tender coconut is sold during the March to September period every year, when the rest of Tamil Nadu goes through sum-mer climatic conditions. The volume of sale is generally observed to be stable, and the influencing factor has been the availability of trucks at reasonable rates. A truck approximately carries 10,000 units of coconuts; the cost of transporta-tion to Chennai, including secondary distribution to tender coconut sale points, is about `1.50 per piece. The market price for a tender coconut is `15. The farm gate price is about `10.
Process Cluster at KangeyamThere are about 500 units that process the kernels brought from Pollachi. There are about 70 units that have crushing and oil extraction capacities. The average size of
290 ◾ Agribusiness Supply Chain Management
the oil extraction plants is about 10 tonnes per day. These units buy coconuts from Pollachi and also from other locations such as Theni, Uttamar Palam of Kambam district, Rajapalayam, Thenkasi, Dindigul, Vedasandur, Pudukottai and Thanjavur districts. Pollachi is about 80 km by road from Kangeyam, and it is possible trans-port coconuts at a transportation cost of `2000 per 10-tonne load. The other loca-tions from where about 30% of the requirement is brought would average about `6000 per 10-tonne load.
One may like to understand two aspects of this cluster. First, the climatic conditions at Kangeyam support kernel processing, as the area receives less rain-fall but has good climatic conditions. Second, entrepreneurial attitudes, com-mitment of labour and the natural reinforcement of family orientation towards this business have helped develop this business in this region. Apart from pro-cessing of kernels, rice mills are also key agro businesses established in this location.
It may be noted that out of the 500 units, only 100 process kernel through-out the year. The remaining 400 units are predominantly seasonal in operation. Further, from the statistics on the distribution of process activity, only 70 out of the 500 units, which is about 14%, are in the business of extraction of oil. One must understand the structure of this business. In sun drying, an operation of large size, grading is manual. These two activities are not easily amenable to automation at viable costs. Another important characteristic is that there is a limitation to sun drying and grading, as it required about 10–15 days of labour, and can be done only by those who have acquired the skill for fast handling through years of experience. One of the major risks is the kernels getting wet by exposure to rains. In such an event, there will be huge losses, as the material mix is as follows:
Oil content 63%–64%; oil cakes about 31% or 32%; vapour 4%–6%. The cluster gets justified because of organizational efficiency and environmental factors.
One would like to know some more details regarding the dispersion of process capacities. About 86% of the units that process kernels typically have two tonnes a day capacities. They procure coconuts and make kernels and trade them. They would not be able to process kernels to edible oil because of economic viability, especially due to the material mix of the grades of kernels. Typically, only 20%–25% of kernels would undergo direct consumption. The remaining 75%, a mix of full graded kernels and broken kernels, determines the ability to process addition-ally. Further, the economic viability of oil processing depends on the ability to reduce wastages. Another important factor in oil processing is ensuring utilization during the off season as well.
The typical economics of coconut, kernel and processing are shown here.
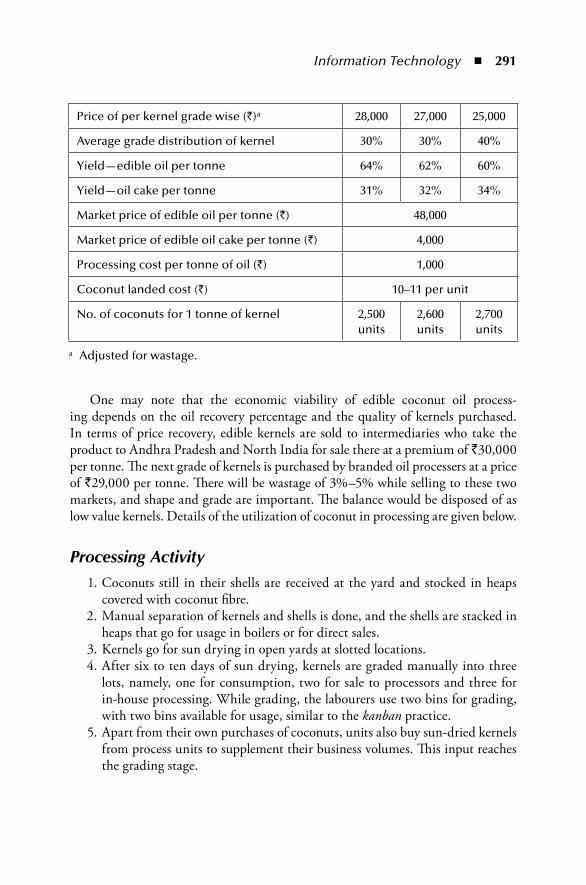
Information Technology ◾ 291
One may note that the economic viability of edible coconut oil process-ing depends on the oil recovery percentage and the quality of kernels purchased. In terms of price recovery, edible kernels are sold to intermediaries who take the product to Andhra Pradesh and North India for sale there at a premium of `30,000 per tonne. The next grade of kernels is purchased by branded oil processers at a price of `29,000 per tonne. There will be wastage of 3%–5% while selling to these two markets, and shape and grade are important. The balance would be disposed of as low value kernels. Details of the utilization of coconut in processing are given below.
Processing Activity 1. Coconuts still in their shells are received at the yard and stocked in heaps
covered with coconut fibre. 2. Manual separation of kernels and shells is done, and the shells are stacked in
heaps that go for usage in boilers or for direct sales. 3. Kernels go for sun drying in open yards at slotted locations. 4. After six to ten days of sun drying, kernels are graded manually into three
lots, namely, one for consumption, two for sale to processors and three for in-house processing. While grading, the labourers use two bins for grading, with two bins available for usage, similar to the kanban practice.
5. Apart from their own purchases of coconuts, units also buy sun-dried kernels from process units to supplement their business volumes. This input reaches the grading stage.
Price of per kernel grade wise (`)a 28,000 27,000 25,000
Average grade distribution of kernel 30% 30% 40%
Yield—edible oil per tonne 64% 62% 60%
Yield—oil cake per tonne 31% 32% 34%
Market price of edible oil per tonne (`) 48,000
Market price of edible oil cake per tonne (`) 4,000
Processing cost per tonne of oil (`) 1,000
Coconut landed cost (`) 10–11 per unit
No. of coconuts for 1 tonne of kernel 2,500 units
2,600 units
2,700 units
a Adjusted for wastage.
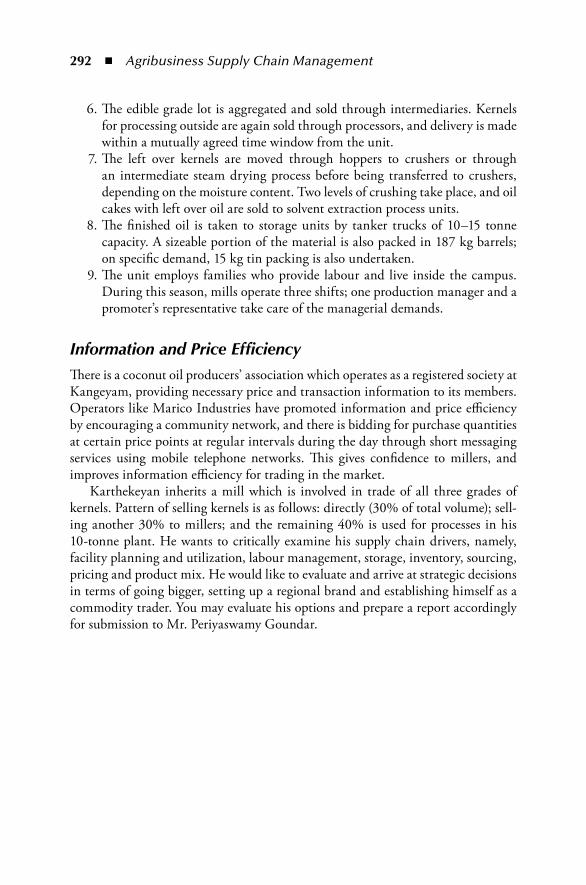
292 ◾ Agribusiness Supply Chain Management
6. The edible grade lot is aggregated and sold through intermediaries. Kernels for processing outside are again sold through processors, and delivery is made within a mutually agreed time window from the unit.
7. The left over kernels are moved through hoppers to crushers or through an intermediate steam drying process before being transferred to crushers, depending on the moisture content. Two levels of crushing take place, and oil cakes with left over oil are sold to solvent extraction process units.
8. The finished oil is taken to storage units by tanker trucks of 10–15 tonne capacity. A sizeable portion of the material is also packed in 187 kg barrels; on specific demand, 15 kg tin packing is also undertaken.
9. The unit employs families who provide labour and live inside the campus. During this season, mills operate three shifts; one production manager and a promoter’s representative take care of the managerial demands.
Information and Price EfficiencyThere is a coconut oil producers’ association which operates as a registered society at Kangeyam, providing necessary price and transaction information to its members. Operators like Marico Industries have promoted information and price efficiency by encouraging a community network, and there is bidding for purchase quantities at certain price points at regular intervals during the day through short messaging services using mobile telephone networks. This gives confidence to millers, and improves information efficiency for trading in the market.
Karthekeyan inherits a mill which is involved in trade of all three grades of kernels. Pattern of selling kernels is as follows: directly (30% of total volume); sell-ing another 30% to millers; and the remaining 40% is used for processes in his 10-tonne plant. He wants to critically examine his supply chain drivers, namely, facility planning and utilization, labour management, storage, inventory, sourcing, pricing and product mix. He would like to evaluate and arrive at strategic decisions in terms of going bigger, setting up a regional brand and establishing himself as a commodity trader. You may evaluate his options and prepare a report accordingly for submission to Mr. Periyaswamy Goundar.
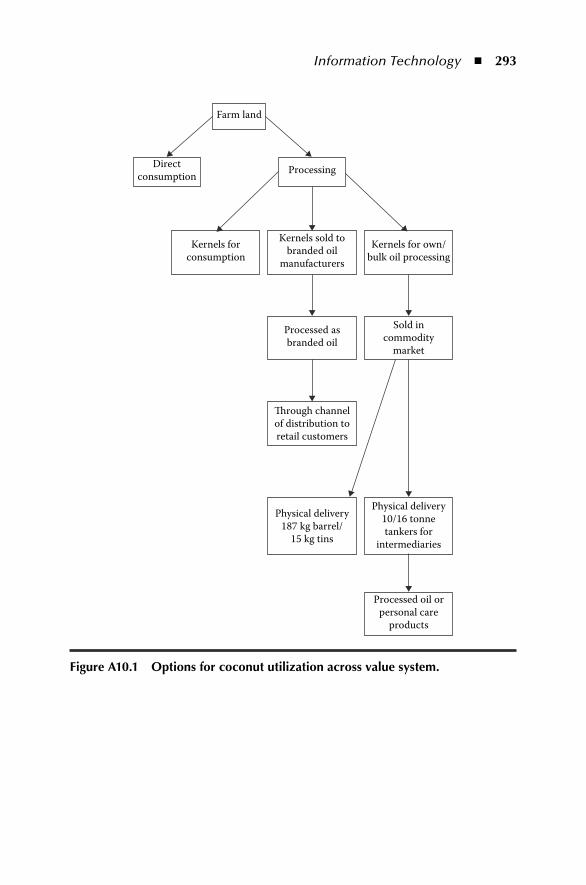
Information Technology ◾ 293
Farm land
ProcessingDirectconsumption
Kernels forconsumption
Kernels sold tobranded oil
manufacturers
Processed asbranded oil
Sold incommodity
market
�rough channelof distribution toretail customers
Physical delivery187 kg barrel/
15 kg tins
Physical delivery10/16 tonnetankers for
intermediaries
Processed oil orpersonal care
products
Kernels for own/bulk oil processing
Figure A10.1 options for coconut utilization across value system.
294 ◾ Agribusiness Supply Chain Management
Coconutswith shellarrive atyard
Kernel andshellseparated
Shell forsale orboiler
Sun dryingin open lots
Grading
Grading AConsumption
purposes
Grading BBranded
processors
Grading COwn bulk oil
processing
Hoppers
Extractors—two stages
Oil Oil cake
Outside kernelpurchases—
sun dried
Figure A10.2 Kernel processing at a unit level.
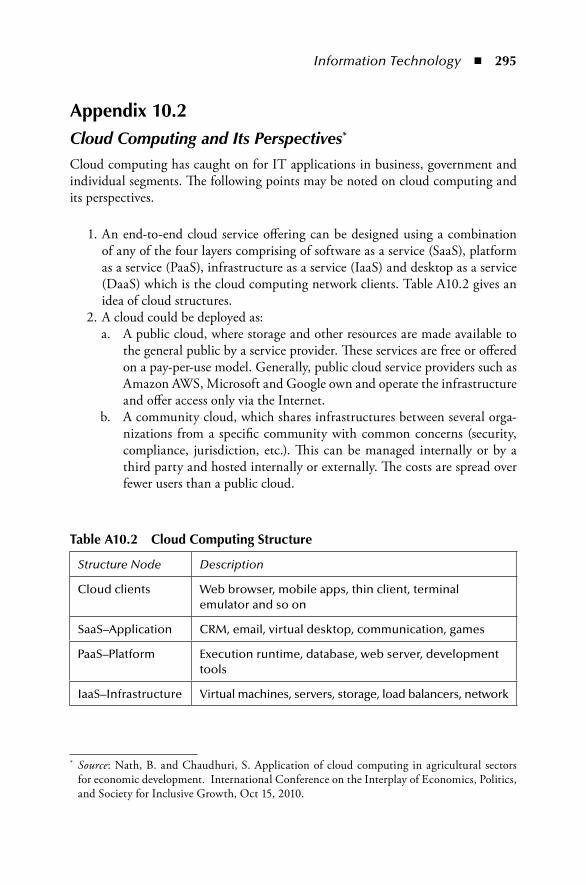
Information Technology ◾ 295
Appendix 10.2Cloud Computing and Its Perspectives*
Cloud computing has caught on for IT applications in business, government and individual segments. The following points may be noted on cloud computing and its perspectives.
1. An end-to-end cloud service offering can be designed using a combination of any of the four layers comprising of software as a service (SaaS), platform as a service (PaaS), infrastructure as a service (IaaS) and desktop as a service (DaaS) which is the cloud computing network clients. Table A10.2 gives an idea of cloud structures.
2. A cloud could be deployed as: a. A public cloud, where storage and other resources are made available to
the general public by a service provider. These services are free or offered on a pay-per-use model. Generally, public cloud service providers such as Amazon AWS, Microsoft and Google own and operate the infrastructure and offer access only via the Internet.
b. A community cloud, which shares infrastructures between several orga-nizations from a specific community with common concerns (security, compliance, jurisdiction, etc.). This can be managed internally or by a third party and hosted internally or externally. The costs are spread over fewer users than a public cloud.
* Source: Nath, B. and Chaudhuri, S. Application of cloud computing in agricultural sectors for economic development. International Conference on the Interplay of Economics, Politics, and Society for Inclusive Growth, Oct 15, 2010.
table A10.2 Cloud Computing Structure
Structure Node Description
Cloud clients Web browser, mobile apps, thin client, terminal emulator and so on
SaaS–Application CRM, email, virtual desktop, communication, games
PaaS–Platform Execution runtime, database, web server, development tools
IaaS–Infrastructure Virtual machines, servers, storage, load balancers, network
296 ◾ Agribusiness Supply Chain Management
c. A hybrid cloud is a composition of two or more clouds (private, community or public) that remain unique entities but are bound together, offering the benefits of multiple deployment models. Hybrid clouds lack the security and certainty of in-house applications. Hybrid clouds provide the flex-ibility of in-house applications with the fault tolerance and scalability of cloud-based services.
d. A private cloud, which is a cloud infrastructure operated solely for a single organization, whether managed internally or by a third-party and hosted internally or externally.Undertaking a private cloud project requires a sig-nificant level and degree of engagement to virtualize the business envi-ronment. They have attracted criticism because users “still have to buy, build, and manage them” and thus, do not benefit from a lesser hands-on management style.
3. An International Data Corporation (IDC) study commissioned by Amazon Web Services (AWS) found that the five-year total cost of ownership (TCO) of developing, deploying and managing critical applications on AWS rep-resented a 70% savings compared with deploying the same resources on- premises or in hosted environments. As stated earlier, the IDC findings show that the average five-year ROI of using AWS is 626%. Moreover, over a five-year period, each company saw cumulative savings of $2.5 million per application, IDC said. And TCO savings included savings in development and deployment costs, which were reduced by 80%. In addition, application-management costs were reduced by 52% and infrastructure support costs cut by 56%, while organizations were able to replace $1.6 million in infrastruc-ture costs with $302,000 in AWS costs. The IDC study also showed that ben-efits also increased over time. The study found a definite correlation between the length of time customers used AWS services and the returns they gained. At 36 months, these organizations are realizing $3.50 in benefits for every $1 invested in AWS; at 60 months, they are realizing $8.40 for every $1 invested, according to the report.
4. While calculating return on investment (ROI) in cloud offering, one must note that the IT capacity and IT utilization would have a significant impact on infrastructure. IT capacity is measured by storage, CPU cycles and network bandwidth or workload memory capacity as indicators of perfor-mance. IT utilization is measured by uptime availability and volume of usage as indicators of activity and usability.
There are other benefits that determine ROI on cloud offerings. They area. The speed and rate of change: Cost reduction and cost of adoption/
de-adoption is faster in the cloud. Cloud computing creates cost benefits by reducing delays in decision costs by adopting pre-built services and a faster rate of transition to new capabilities. This is a common goal for business improvement programmes that lack resources and skills, and are time-sensitive.
Information Technology ◾ 297
b. Total cost of ownership optimization: Users can select, design, configure and run infrastructure and applications that are best suited for business needs.
c. Rapid provisioning: Resources are scaled up and down to follow business activity as it expands and grows. They are redirected.
d. Increased margin and cost control: Revenue growth and cost control oppor-tunities allow companies to pursue new customers and markets for busi-ness growth and service improvement.
e. Dynamic usage: Elastic provisioning and service management targets real end users and real business needs for functionality, as the scope of users and services evolve seeking new solutions. This would be helpful in the case of clusters and business community networks where business process solutions are to be deployed. For example, ERP for SMEs through cloud in a cluster using a cloud would help with dynamic usage.
f. Enhanced capacity utilization: IT avoids over- and under-provisioning of IT services to improve smarter business services. Capacity addi-tions can be staggered, as economies of lumpiness in capacity can be spread among users instead of set-up functions in case of individual deployment.
g. Access to business skills and capability improvement: Cloud comput-ing enables access to new skills and solutions through cloud sourcing on demand solutions.
These measures define a new set of business indicators that can be used to create a “score card” of an organization’s current and future operational business and IT service needs relating to cloud computing potential.
referencesChandrasekaran, N. Supply Chain Management. New Delhi: Oxford University Press India,
2010.Chandrasekaran, N., Supply network management of Chennai Engineering Ltd; A case
authored for a national level management school competition organized by NITIE, 2012.
Goyal, A. Information technology and rural market performance in central India. Mobile Innovations for Social and Economic Transformation Workshop, September 16, 2009. http://siteresources.worldbank.org/EXTEDEVELOPMENT/Resources/Aparajita09.pdf
The Hindu. Rural India to drive mobile phone market growth: Report. January 23, 2011. http://www.thehindu.com/business/Industry/article1118628.ece?homepage=true
Jensen, R. The digital provide: Information (technology), market performance, and welfare in the South Indian fisheries sector. Quarterly Journal of Economics, 122(3), 879–924, 2007.
298 ◾ Agribusiness Supply Chain Management
Nath, B. and Chaudhuri, S. Application of cloud computing in agricultural sectors for economic development. International Conference on the Interplay of Economics, Politics, and Society for Inclusive Growth, October 15, 2010. http://www.rtc.bt/Conference/2012_10_15/4-BhagwanNath-CloudComputingAgriculture.pdf
Public Distribution System issue, Informatics, 19(3), 2011.TechSangam. ITC’s e-Choupal model to increase farmer revenue and its own
bottom-line, September 20, 2011. http://www.techsangam.com/2011/09/20/itc-e-choupal-model-to-increase-farmer-revenue-and-its-own-bottomline
World Bank. Mobile devices and their impact, in ICT in Agriculture Sourcebook, 2011. http://www.ictinagriculture.org/sourcebook/module-3-mobile-devices-and-their-impact
299
Chapter 11
Financial Systems
11.1 introductionFinancial flow is one of the key aspects for achieving supply chain efficiency. It also ensures completion of supply chain activities by all role agents, who then get rewards matching their responsibilities. If there is any strain on financial flow, it would affect the overall working of the supply chain. Typically, such shortfalls lead to inefficiency by way of delays and low volumes, and as a result, drops in efficiency levels in business. Further, they lead to a collapse of the supply chain such that, at times, the firm can be thrown into financial distress. There are a number of instances in India where unorganized markets have exploited gaps in the financial systems in agribusiness, leading to a lot of media attention and public debate, all calling for stern action. This has been most common in respect of fair prices for produce and timely payment of the procurement prices. Farmers have been known to launch intense agitations, accusing firms and the government of mismanaging financial flows. This is happening not only in cooperative sector farming and agri-business, but also in private sector agro-based industries. In this chapter, we discuss financial flows and how they impact agribusiness.
Obje CTIv eThe objective of this chapter is to highlight the importance of financial flow and then enumerate the various financial challenges impacting supply chain. Discussions are on enabling technology including that of commodity mar-kets, on role of corporate in improving financial flows and on credit and institutional structure for financing.
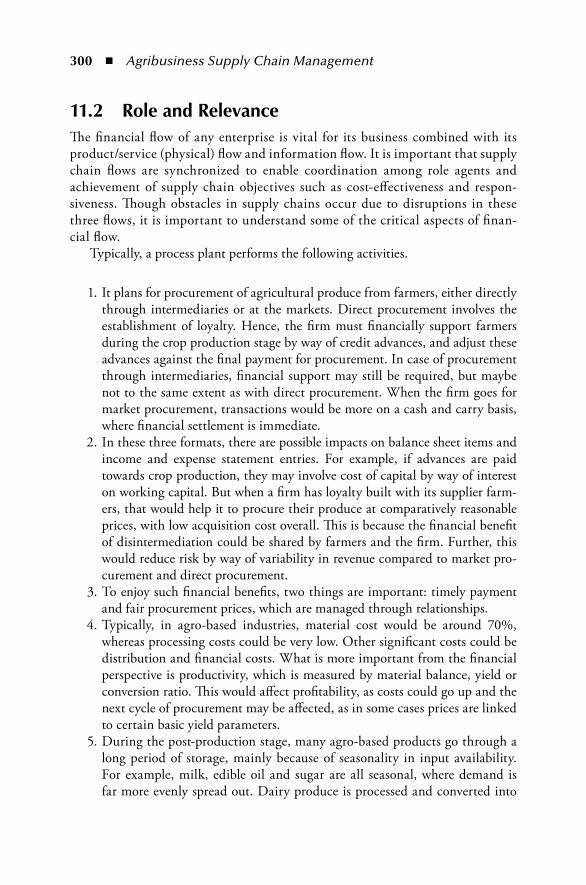
300 ◾ Agribusiness Supply Chain Management
11.2 role and relevanceThe financial flow of any enterprise is vital for its business combined with its product/service (physical) flow and information flow. It is important that supply chain flows are synchronized to enable coordination among role agents and achievement of supply chain objectives such as cost-effectiveness and respon-siveness. Though obstacles in supply chains occur due to disruptions in these three flows, it is important to understand some of the critical aspects of finan-cial flow.
Typically, a process plant performs the following activities.
1. It plans for procurement of agricultural produce from farmers, either directly through intermediaries or at the markets. Direct procurement involves the establishment of loyalty. Hence, the firm must financially support farmers during the crop production stage by way of credit advances, and adjust these advances against the final payment for procurement. In case of procurement through intermediaries, financial support may still be required, but maybe not to the same extent as with direct procurement. When the firm goes for market procurement, transactions would be more on a cash and carry basis, where financial settlement is immediate.
2. In these three formats, there are possible impacts on balance sheet items and income and expense statement entries. For example, if advances are paid towards crop production, they may involve cost of capital by way of interest on working capital. But when a firm has loyalty built with its supplier farm-ers, that would help it to procure their produce at comparatively reasonable prices, with low acquisition cost overall. This is because the financial benefit of disintermediation could be shared by farmers and the firm. Further, this would reduce risk by way of variability in revenue compared to market pro-curement and direct procurement.
3. To enjoy such financial benefits, two things are important: timely payment and fair procurement prices, which are managed through relationships.
4. Typically, in agro-based industries, material cost would be around 70%, whereas processing costs could be very low. Other significant costs could be distribution and financial costs. What is more important from the financial perspective is productivity, which is measured by material balance, yield or conversion ratio. This would affect profitability, as costs could go up and the next cycle of procurement may be affected, as in some cases prices are linked to certain basic yield parameters.
5. During the post-production stage, many agro-based products go through a long period of storage, mainly because of seasonality in input availability. For example, milk, edible oil and sugar are all seasonal, where demand is far more evenly spread out. Dairy produce is processed and converted into
Financial Systems ◾ 301
butter oil and milk powder, as well as many other value-added products like ghee and butter. Similarly, though edible oil has been regulated in terms of the number of days’ stock that can be carried over, the tendency would be to build stock across the network. In the case of sugar, it is normal for the output produced over six months to be sold over about 14 months. Thus, working capital flow is critical to manage stocks. Banks and institutions would fund up to 75%, and hence, a firm has to provide the balance through equity. These are the real challenges of financial flow management in agro-based businesses.
6. An example of a coffee export unit is discussed here, with the name being withheld. India is a leading manufacturer of coffee. There has been a huge demand for instant coffee powder in eastern Europe. Coffee is exported in bulk to those countries. The demand for exports would be from January to September every year, as the sales are high during the winter months. The physical flow process would be as follows:
a. The order to buy is received. b. The coffee beans are procured. c. The coffee beans are processed into powder. d. Export packaging and dispatch arrangements are made. e. Goods are received by the customers. 7. This process goes through a financial process that is linked to the physical
flow, and is described in Figure 11.1. 8. A normal operating cycle is about 90 days, and inventory turnover would be
four times in a year. On receipt of an order, a company estimates its produc-tion schedules and plans its cash flow requirements. It is commonly found that 50% of the total order value may be required to start with for buying of material and planned division of capacity utilization between domestic and export demands. Coffee production needs to be committed on order-wise receipts for improving realization and consistency of quality. The promoter is expected to finance up to 25% of the value of orders/inventory, and the
Receipt of an order
Balancepayments to
creditors
Receipt ofbalance
payments
Bankerreceiving
buyercon�rmation
Exportpackaging
and dispatch
Funding fromown sources
and bank
Procuringmaterials
Processing atplant
Figure 11.1 typical financial flow cycle.
302 ◾ Agribusiness Supply Chain Management
remaining balance of 75% is funded by banks. The order processing thus starts with the exporter’s own funds and funds released by its banks. On completion of the order and on receipt of the letter of credit (LC), the com-pany dispatches the goods. Depending on the type and nature of the LC and acknowledgement by the buyer or buyer’s bank, the focal firm’s banker releases the balance money. It is observed again that sundry debtors stay on the books for up to 120 days in this export business. The Export Credit Guarantee Corporation (ECGC) advises companies and their bankers about the creditworthiness of buyers, based on its information on defaulters and other market intelligence. There have been, however, cases when the company assumes a greater risk and takes on more contracts. Such com-panies get into financial trouble with a few deals, which again affects their ability to fund other orders. One observes here that smooth realization of funds against orders that are delivered on time, as per committed quality and quantity, is critical for streamlined financial operations (Chandrasekaran, 2010).
9. The importance of financial flows can be understood from this discussion: processing of agro-based goods is vertically and backwardly dependent on the orders. Any obstacle arising in financial transfers will jeopardize the entire supply chain. If an order is rejected on quality grounds, it is not just the primary vendor who gets affected, but also those who are part of the supply chain indirectly are also impacted negatively. It is important that the financial credibility of buyers and partnering organizations in supply chains be under-stood and shared for healthy operations. To some extent, the ECGC and banks facilitate this information sharing. Processors’ associations, like in the case of tea and other plantation crops and APEDA in the case of small-scale fruit exporters themselves, provide their networks with reliable information. Their associations get valuable information on the creditworthiness of buyers, on risk perceptions and on relevant aspects, which they share among their communities. However, notwithstanding such information bridges, failure in terms of financial performance by buyers or by their bankers is common in agro-based businesses, and often, the lack of consistent quality and standards is reported as the cause of failure.
Thus, the key learning for managing financial flows is that, for processing of an order, units in the downward stream require timely release of funds through the purchaser’s honouring of the invoice after delivery. The focal firm, which is the exporter, pays upstream and makes commitments for the business. If there is a financial flow disruption, then the business fails. It should be clear that the integra-tion of financial flow with information flow and physical flow is critical. Unless the information system captures product movements and confirm them to the funders, fund release cannot be made on time.
Financial Systems ◾ 303
11.3 problems in Synchronization 1. Financial bankruptcy or failure of the organization occurs when supplies are
not being paid for, especially when they are agro-based products. The focal firm in the supply chain in such cases goes in for a recovery mechanism, which can be arduous and time-consuming. It is possible that a farmer who is a producer and markets his goods is also the focal entity. Any problem with respect to disruption in financial flow could be due to an insufficient amount of money recovered through sales, or because of differences over the quan-tity or price of the produce marketed. Appendix 11.1 gives the details of the prevalence of farmers’ debt scenarios in various parts of India.
2. It is theoretically possible for farmers to hold stock for want of the right price or market response. But in reality, this does not happen, as farmers’ average land holding is low, and the pressure to realize money is high. Farmers borrow capital for raising farm output. Debt is based on estimated yield, expected price and additional collateral, as the case may be. A sudden reduction in yield or the failure of market agents or processing channel partners to buy adequate quantities puts pressure on the supply chain. Such situations lead to huge inventory holdings, involving cost, and poor realization on farm output.
3. There could also be occasions of quality variance observed at the custom-ers’ end, with resulting lot rejection. Though this is a physical flow manage-ment issue, it has got a serious impact on financial flow management. This is mainly because when the goods are rejected, the network firm needs to per-form a reverse logistic operation and liquidate stock at huge discounts. Thus, cash flow and credibility are affected, and future funding becomes difficult for the farming community involved.
4. From the manufacturing and sourcing nodes of supply chains, the following could lead to financial obstacles:
a. Financial solvency of the firm is affected by poor management of fund-ing, and by diversion of funds from operation to capital accounts or per-sonal accounts
b. There could be over-exposure to risk and aggressive order booking without adequate cover. There have been times when a focal firm has booked orders on trust and faith that are misplaced, and gets into financial distress.
c. Similarly, there could be over-exposure to purchase of material, or the book-ing of capacity of outsourced partners may not match orders, and thereby, the outflow of cash leads to financial imbalance. This is true for secondary and tertiary processors who could hedge on stocking and price variances.
d. An over inventory management policy leads to the blockage of funds. This is a contraposition of the above example, where the firm or the indi-vidual farmers, depending upon the position in the supply chain, try to hold stock, blocking huge funds. At times, this becomes a speculative move, rather than a calculated risk.
304 ◾ Agribusiness Supply Chain Management
e. Poor fund management and improper funding sources lead to high cost of funds. This leads to a loss of financial equilibrium. This is true for Indian agro-based businesses, as unstructured and informal sources of funding are often used.
f. Further, there could be poor checks and controls for receivables and pay-able management, and thereby, a lack of trust among the partners, lead-ing to strain on physical and financial flows.
g. Instances of inability to provide documentation for banks to fund on time, and thereby, getting into financial stress are common. This is because of inadequate knowledge and discipline with respect to record keeping, which may be encouraged by the informal financial sector. This leads to a creeping inability to raise capital from the organized sector.
One of the financial aspects that influence operating decisions and thereby could prop up as obstacles is fiscal factors like taxes, duties and direct controls. Proper document handling is fiscal major requirement for purposes of clearance and movement of goods; documents must be properly presented and validated. There are third party service providers who enable this function. Second, govern-ment levies, especially of sales tax in India, are different for movement within states and outside states. To take advantage of sales tax, companies earlier used to locate warehouses in major states with substantial demand. This could create an obstacle especially arising from obsolescence of inventory, the behavioural patterns of ware-house operators, and so on. With implementation of a general sales tax that may lead to a uniform sales tax structure, the location of warehouses could be more rational. Another important fiscal element is direct physical checking at state bor-ders, which leads to delays. Implementation of technological solutions like whole truck scanning might improve this situation.
11.4 role of technologyTechnology plays an important role in managing financial flows. Financial institu-tions, banks, large corporates and intermediaries have implemented technological solutions. This provides visibility across departments and enables partnering orga-nizations to monitor critical financial chocking points and expedite decisions to streamline the flow. Creditors and debtors no longer need to do excessive follow-up. This is because required flags are set to provide alerts for prioritizing payment; an easy flow of financial resources and physical goods is enabled through IT systems.
The level of openness and transparency with which an organization operates determines its information and financial flow efficiency. For example, when a ven-dor completes delivery against an order, the vendor becomes eligible for payment on the 21st day after delivery of goods and receipt of goods received note. A trigger is automatically generated for cash flow planning and any gap is highlighted, so that
Financial Systems ◾ 305
the concerned parties can take necessary steps to adjust the financial flow and make the supply chain more effective.
However, there are a number of cases that one comes across in real life, where such synchronization does not take place. Now this can be baffling to analysts: how and why do process and technology fail to streamline the financial flow? This is more common in cases of payments against supplies to farmers and small firms who have limited bargaining power in the supply chain.
IT systems must be linked to backward and forward linkages and to all part-ners in the system. The system must be transparent and provide access for partners to check their status, as relevant to their part of the network, using Internet con-nections. Any aberration in the schedules must be openly discussed among the partners, instead of efforts of back-door follow-up and intelligence sourcing by partners, which can lead to strains or even break up in network relationships. It is a common occurrence that a focal firm has some cash flow crunch. In such an event, the payment schedules may have to be prioritized, and technology cannot capture such intervention and scheduling. Even if there are valid reasons for a delay, some of them can be shared only orally, through trust-based relationships, rather than through technological processes. Hence, the supply chain’s financial flows must be sensitive to such occurrences and must take cognizance of the long-term supply chain goals of establishing equitably shared normal profits.
Thus, we have discussed the importance of financial flows, areas where there could be bottlenecks and how they can be approached. It may have been observed that most of the discussions were firm-centric, whether primary, secondary or ter-tiary processing firms. Wherever we have mentioned farmers, it has been more from the perspective of the upward linkages in supply chains, rather than from the individual economic unit. In fact, as individual economic units, farmers can themselves become focal points and form their own supply chains. In such cases, for understanding financial flows, it becomes important to understand credit struc-tures in India. These discussions throw light on the credit structure for farmers as well as for others who are funded in the agribusiness sector.
11.5 Credit Structure in indiaAs may have been noted from the discussions in earlier chapters, Indian agriculture has grown phenomenally. This was possible with the growth and evolution of credit structures for agro-based businesses. Our objective here is to highlight these credit structures; we suggest readers must go to open sources to understand the extent, scope and limitations of the agricultural credit structures in India. This is mainly because of the huge volume of material available at open sources and the span of issues covered, which could digress from the focus of this book.
The Government of India (GOI) plays a large role in shaping up agriculture. The Ministry of Agriculture consists of three departments through which it directly acts,
306 ◾ Agribusiness Supply Chain Management
regulates and coordinates with other entities in the ecosystem for growth. These departments are
1. the Department of Agriculture and Co-operation (DAC); 2. the Department of Agricultural Research and Education (DARE); and 3. the Department of Animal Husbandry and Dairying (DAH&D). These departments are vested with numerous responsibilities for shaping
Indian agriculture. This link provides details: http://agricoop.nic.in/Orghistory.pdf. For this discussion on financial flows and the government, the following aspects are relevant.
a. Agriculture-based industries with limits to formulation of demands and fixation of targets; price control of agricultural commodities except food grains, sugar, vanaspati, oilseeds, cakes and fats, jute, cotton and tea; cooperation in agricultural sector;
b. agricultural credit and debt of farmers; and c. general policies relating to the marketing of agricultural produce,
including pricing and exports. 4. The central government, directly or through state governments and various
bodies like the Reserve Bank of India (RBI), the National Bank for Agriculture and Rural Development (NABARD), department-managed institutions like public sector undertakings, autonomous bodies and national level coopera-tive organizations (refer to Appendix 11.2);
5. While there are many schemes, operated directly or through its agencies by the GOI, which impact financial flows, the following two schemes would be most relevant.
a. Kisan Credit Cards—The Kisan Credit Card is a credit delivery mechanism for providing credit to farmers under a single window, with flexible and simplified procedures and adoption of whole farm approaches. This focuses on providing adequate and timely credit to farmers. Further, it meets farmers’ short-term, medium-term and long-term credit needs for agriculture and allied activities, with a reasonable component for consumption needs. Appendix 11.3 explains the extent of Kisan Credit Cards.
b. Mahatma Gandhi National Rural Employment Guarantee Scheme (MGNREGS)—The Mahatma Gandhi National Rural Employment Guarantee Act (MGNREGA) was enacted by legislation on August 25, 2005, to provide job guarantees. The scheme provides a legal guarantee for 100 days of employment in every financial year to adult members of any rural household willing to do public work–related unskilled manual work at the statutory minimum wage of `120 per day at 2009 prices. The central government’s outlay for this scheme was `40,000 crore in FY 2010–2011. This act was introduced with the aim of improving the purchasing power of rural people by providing primarily semi-skilled or
Financial Systems ◾ 307
unskilled work opportunities to people living in rural India, whether or not they are below the poverty line. Around one-third of the stipulated work force is women. In 2011, the programme was widely criticized for being ineffective, or at the least, for being less effective than other poverty reduc-tion programmes in India. MGNREGA is also inflicted with controversy about corrupt officials, deficit financing as the source of funds, the poor quality of infrastructures built under this programme, and its unintended destructive effect on poverty.
Thus, GOI schemes like MGNREGA can impact financial flows, as easy options for labour deployment in the exchange markets make labour costly and difficult to access. This impacts adversely the financial viability of farming and allied activities. However, one must pay some accolades to the number of programmes organized by the government to ease financial flows in the agro-based sector.
11.5.1 Reserve Bank of India (RBI)RBI is the central bank of India and is responsible for managing monetary policy; thereby, it regulates credit policy and demand and supply for money. The objectives of monetary policy management by RBI include maintaining price stability and facilitating growth, especially through employment generation. The broad areas of economic sectors include agriculture and allied sectors, mining, manufacturing and services. In terms of GDP share, agriculture and allied sectors like forestry, logging and fishing accounted for 15.7% of the GDP in 2009–2010, and employed 52.1% of the total workforce. Industry accounts for 28% of the GDP and employs 14% of the total workforce. The balance is accounted for by the service sector.
Since agriculture engages a large workforce, monetary policy must be aimed at stimulating the agricultural economy. Apart from this, agricultural commodities have significant weight in price indices. Hence, RBI’s role is significant.
With respect to financial flows to the agriculture-based business sector, RBI mainly regulates credit through the commercial banking system. Primarily, RBI enables financial flows through priority sector lending, which goes for agri-culture, allied sectors and small and medium processors. The objective here is to enhance credit flow to agriculture by removing the bottlenecks in credit delivery. RBI has played a lot of constructive roles in streamlining the Indian cooperative sec-tor, especially in areas of financial credit management. RBI is constantly increasing its efforts to set up a healthy rural cooperative credit system. This is initiated through the strengthening of regional rural banks (RRBs), providing incentives to commer-cial banks for investment in rural economies and ensuring an adequate and timely delivery of credit at a reasonable price. RBI also works with banks and several state governments for financial inclusion of farmers and agro-based economic agents like labourers and small-scale processors, by adopting modern technology. RBI closely works with NABARD on improving credit and other financial services to the sector.
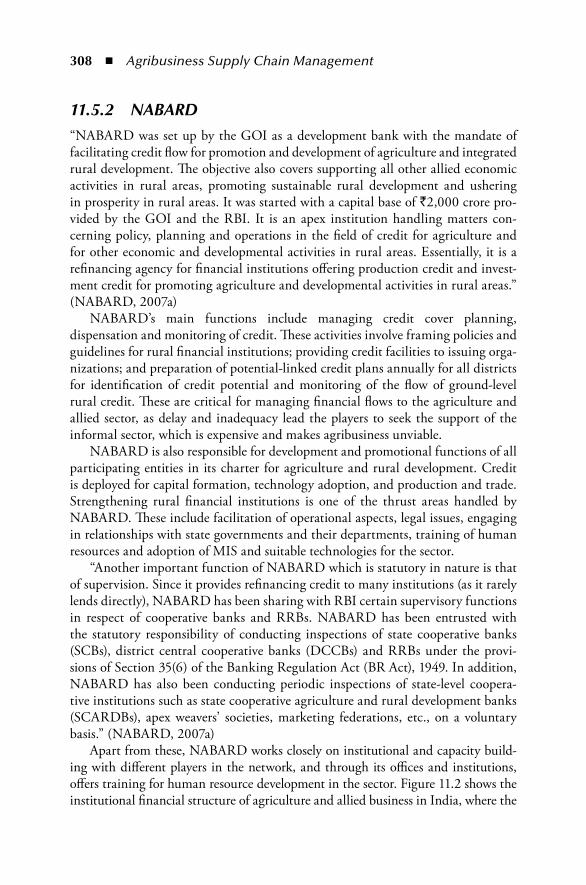
308 ◾ Agribusiness Supply Chain Management
11.5.2 NABARD“NABARD was set up by the GOI as a development bank with the mandate of facilitating credit flow for promotion and development of agriculture and integrated rural development. The objective also covers supporting all other allied economic activities in rural areas, promoting sustainable rural development and ushering in prosperity in rural areas. It was started with a capital base of `2,000 crore pro-vided by the GOI and the RBI. It is an apex institution handling matters con-cerning policy, planning and operations in the field of credit for agriculture and for other economic and developmental activities in rural areas. Essentially, it is a refinancing agency for financial institutions offering production credit and invest-ment credit for promoting agriculture and developmental activities in rural areas.” (NABARD, 2007a)
NABARD’s main functions include managing credit cover planning, dispensation and monitoring of credit. These activities involve framing policies and guidelines for rural financial institutions; providing credit facilities to issuing orga-nizations; and preparation of potential-linked credit plans annually for all districts for identification of credit potential and monitoring of the flow of ground-level rural credit. These are critical for managing financial flows to the agriculture and allied sector, as delay and inadequacy lead the players to seek the support of the informal sector, which is expensive and makes agribusiness unviable.
NABARD is also responsible for development and promotional functions of all participating entities in its charter for agriculture and rural development. Credit is deployed for capital formation, technology adoption, and production and trade. Strengthening rural financial institutions is one of the thrust areas handled by NABARD. These include facilitation of operational aspects, legal issues, engaging in relationships with state governments and their departments, training of human resources and adoption of MIS and suitable technologies for the sector.
“Another important function of NABARD which is statutory in nature is that of supervision. Since it provides refinancing credit to many institutions (as it rarely lends directly), NABARD has been sharing with RBI certain supervisory functions in respect of cooperative banks and RRBs. NABARD has been entrusted with the statutory responsibility of conducting inspections of state cooperative banks (SCBs), district central cooperative banks (DCCBs) and RRBs under the provi-sions of Section 35(6) of the Banking Regulation Act (BR Act), 1949. In addition, NABARD has also been conducting periodic inspections of state-level coopera-tive institutions such as state cooperative agriculture and rural development banks (SCARDBs), apex weavers’ societies, marketing federations, etc., on a voluntary basis.” (NABARD, 2007a)
Apart from these, NABARD works closely on institutional and capacity build-ing with different players in the network, and through its offices and institutions, offers training for human resource development in the sector. Figure 11.2 shows the institutional financial structure of agriculture and allied business in India, where the
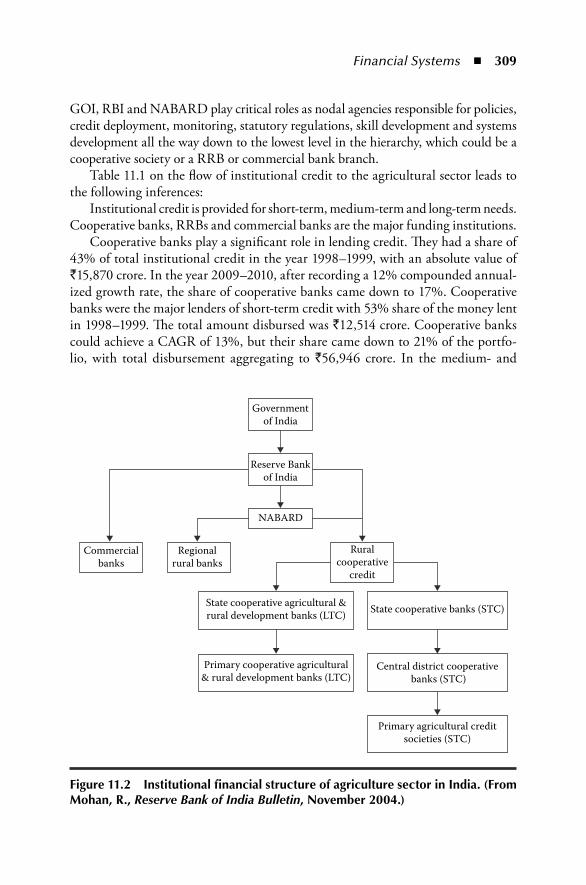
Financial Systems ◾ 309
GOI, RBI and NABARD play critical roles as nodal agencies responsible for policies, credit deployment, monitoring, statutory regulations, skill development and systems development all the way down to the lowest level in the hierarchy, which could be a cooperative society or a RRB or commercial bank branch.
Table 11.1 on the flow of institutional credit to the agricultural sector leads to the following inferences:
Institutional credit is provided for short-term, medium-term and long-term needs. Cooperative banks, RRBs and commercial banks are the major funding institutions.
Cooperative banks play a significant role in lending credit. They had a share of 43% of total institutional credit in the year 1998–1999, with an absolute value of `15,870 crore. In the year 2009–2010, after recording a 12% compounded annual-ized growth rate, the share of cooperative banks came down to 17%. Cooperative banks were the major lenders of short-term credit with 53% share of the money lent in 1998–1999. The total amount disbursed was `12,514 crore. Cooperative banks could achieve a CAGR of 13%, but their share came down to 21% of the portfo-lio, with total disbursement aggregating to `56,946 crore. In the medium- and
Governmentof India
Reserve Bankof India
Commercialbanks
Regionalrural banks
State cooperative agricultural &rural development banks (LTC) State cooperative banks (STC)
Central district cooperative banks (STC)
Primary agricultural creditsocieties (STC)
Primary cooperative agricultural& rural development banks (LTC)
Ruralcooperative
credit
NABARD
Figure 11.2 institutional financial structure of agriculture sector in india. (From mohan, r., Reserve Bank of India Bulletin, november 2004.)
310 ◾ Agribusiness Supply Chain Management
tabl
e 11
.1
Flow
of i
nsti
tuti
onal
Cre
dit
to A
gric
ultu
re S
ecto
r
Part
icu
lars
/Age
ncy
(In
Cro
re)
`
1998
–19
9919
99–
2000
2000
–20
0120
01–
2002
2002
–20
0320
03–
2004
2004
–20
0520
05–
2006
2006
–20
0720
07–
2008
2008
–20
0920
09–
2010
CA
GR
i. p
rodu
ctio
n (S
t) C
redi
t
Co
op
erat
ive
ban
ks12
514
1477
116
528
1878
719
668
2264
027
157
3493
038
622
4051
540
230
5694
613
%
RR
Bs
1710
2423
3245
3777
4775
6088
1001
012
712
1663
120
715
2241
329
802
27%
Co
mm
erci
al b
anks
9622
1169
713
486
1790
421
104
2619
236
793
5764
083
202
1222
8914
7818
1899
0828
%
Oth
er a
gen
cies
5974
5541
3957
104
680
00
0
Sub
-to
tal (
A)
2390
528
965
3331
440
509
4558
654
977
7406
410
5350
1384
5518
3519
2104
6127
6656
23%
ii. m
t/Lt
tot
al
Co
op
erat
ive
ban
ks33
5634
8941
9047
3739
6842
3540
7444
7438
5831
6959
6265
516%
RR
Bs
750
749
974
1077
1295
1493
2394
2511
3804
4099
4352
5415
18%
Co
mm
erci
al b
anks
8821
1303
614
321
1568
318
670
2624
944
688
6783
783
283
5879
881
133
9589
222
%
Oth
er a
gen
cies
3029
2839
4127
8931
40
00
0
Sub
-to
tal (
B)
1295
717
303
1951
321
536
2397
432
004
5124
575
136
9094
566
066
9144
710
7858
19%
S t+
mt/
Lt C
redi
t
Co
op
erat
ive
ban
ks15
870
1826
020
718
2352
423
636
2687
531
231
3940
342
480
4825
846
192
6349
712
%
RR
Bs
2460
3172
4219
4854
6070
7581
1240
415
223
2043
525
312
2676
535
217
25%
Co
mm
erci
al b
anks
1844
324
733
2780
733
587
3977
452
441
8148
112
5477
1664
8518
1088
2289
5128
5800
26%
Oth
er a
gen
cies
8710
383
8080
8419
338
20
00
0
Gra
nd
tota
l (A
+B
)36
860
4626
852
827
6204
569
560
8698
112
5309
1804
8522
9400
2546
5830
1908
3845
1422
%
Sour
ce:
Min
istr
y o
f Agr
icu
ltu
re, S
tate
of I
ndia
n A
gric
ultu
re 2
011–
12. D
epar
tmen
t of A
gric
ult
ure
an
d C
oo
per
atio
n, 2
012.
Financial Systems ◾ 311
long-term segments of the portfolio, cooperative banks’ share has again dwindled, and has achieved a CAGR of 6%.
RRBs play a significant role in institutional credit disbursement. RRBs had lent `2,460 crore in 1998–1999, with a share of 7%, and had achieved a CAGR of 25%. An amount of `35,217 crore of total credit was lent by all these institutions. RRBs have achieved a significant growth of 27% CAGR in the case of short-term capital for the period 1998–1999 to 2009–2010 and 18% CAGR for the same period in the medium- and long-term capital segments.
Commercial banks are the leaders in institutional credit for the agriculture and allied sectors. Commercial banks had deployed `18,443 crore in 1998–1999, with a share of 50%. And by 2009–2010, they had lent `285,800 crore, with a share of 74% of total money lent. The CAGR for this period was 26%. Commercial banks have the lead in the short-term capital portfolio with a CAGR of 28% for the same period; their share of the portfolio was at 60% in 2009–2010. Similarly, the growth rate has been even higher in the medium- and long-term portfolios, where commercial banks achieved a CAGR of 22% and their share went up from 68% in 1998–1999 to 89% in 2009–2010.
Thus, institutional credit to the sector has been growing at 22% (CAGR). This is higher than the growth rate in agricultural production in value terms. This leads to the inference that the informal sector is increasingly being replaced by institu-tionalized credit. Further, the more organized sector, comprising commercial banks and RRBs that are well regulated by apex bodies, are increasing their share. This proves that the sector is becoming increasingly formalized. However, critics express doubt as to whether the disbursements are actually reaching the real beneficiaries and helping the real sector to grow.
We consider such discussions out of the scope of this book, and are reasonably confident that the proliferation of commercial banks and RRBs in terms of geo-graphical disbursement, together with the effective supervision and active role of apex institutions, has improved financial flow in agribusiness in India.
11.6 Commodity marketsGenerally, spot trading takes place mostly in regional markets (mandis) and unor-ganized markets, where farmers are paid in cash based on the prevailing price. With markets being isolated and the weak information available to farmers, spot markets are not truly reflective of demand and supply. Often, these spot markets do not consider stocks and future trading. Even if they do so, their considerations are based more on inadequate information. Such things lead to
1. price inefficiency, resulting in poor realization, and thereby, lowered profits; 2. improper allocation of supply chain profits, as a few intermediaries make
disproportionate returns for their effort;
312 ◾ Agribusiness Supply Chain Management
3. to allocating resources inefficiently, without realizing the future market, as may be reflected in crop patterns, sowing patterns and cropping season outputs.
The commodities market is expected to manage such financial flow more effi-ciently, leading to improved supply chain profits and responsiveness. Realizing such potential, the first commodity derivative market in the world was started in Chicago in 1865. After the Board of Trade of Chicago, other trading centres such as Kansas, Minneapolis and New York started functioning. Futures trading in commodities like rubber, soya bean, black pepper, etc., were started in the United States after 1920. India is one country that has also launched commodities futures markets. Early products were cotton (Mumbai), oilseeds (Gujarat and Punjab), wheat (Hapur, 1913) and raw jute (Kolkata, then called Calcutta, 1912). During World War II, futures trading was banned.
In the post-independent era, the Forward Contracts (Regulation) Act (FCRA, 1952) was passed in 1952. This led to the formation of the Forward Markets Commission (FMC) in September 1953. The FMC, headquartered at Mumbai, is a regulatory authority which is overseen by the Ministry of Consumer Affairs and Public Distribution, GOI. The structure of commodity markets in India is given in Appendix 11.4. Currently, “five national exchanges, viz., the Multi Commodity Exchange (MCX), Mumbai; the National Commodity and Derivatives Exchange (NCDEX), Mumbai; the National Multi-Commodity Exchange (NMCE), Ahmedabad; the Indian Commodity Exchange Ltd., Mumbai (ICEX); and ACE Derivatives and Commodity Exchange, regulate forward trading in 113 commodi-ties. Besides, there are 16 recognized commodity-specific exchanges regulating trading in various commodities, approved by the Commission under the Forward Contracts (Regulation) Act, 1952.
The commodities traded at these exchanges comprise the following:
◾ Edible oilseeds complexes like groundnut, mustard seed, cottonseed, sunflower, rice bran oil, soy oil, etc.
◾ Food grains—wheat, gram, dal, bajra, maize, etc. ◾ Metals—gold, silver, copper, zinc, etc. ◾ Spices—turmeric, pepper, cumin seeds, etc. ◾ Fibres—cotton, jute, etc. ◾ Others—gur, rubber, natural gas, crude oil, etc.
Out of 21 recognized exchanges, the MCX, Mumbai; the NCDEX, Mumbai; the National Board of Trade (NBOT), Indore; the NMCE, Ahmedabad; and the ACE Derivatives & Commodity Exchange Ltd. accounted for 99% of the total value of the commodities traded during the year 2011–2012.” (Ministry of Finance, n.d.)
Financial Systems ◾ 313
Mukherjee, in his 2011 study on the impact of futures trading on the Indian agricultural commodity market, makes the following inferences:
The growth in agriculture commodities in India is found to be in 28–30 out of 113 commodities listed.
The national level exchanges are endowed with modern state-of-the-art tech-nology, with electronic online trading systems. They provide their facilities at con-sumers’ doorsteps. However, the commodity market functionaries and potential users, both hedgers and speculators in agricultural commodities and their related products, seem to be reluctant to avail of the exchanges’ services and facilities. The commodity future market in India is still at a nascent stage compared to the equity market.
This unsatisfactory growth of futures contracts in agricultural commodities in India has raised questions about the benefits and feasibility of futures trading. There are critics who label them as the main factor behind rising inflation in the Indian economy.
The FMC, in collaboration with the exchanges and other related bodies, has been disseminating information on agricultural commodity prices across the country on a real-time basis by installing electronic price ticker boards in all mandis/APMCs that are networked under the AGMARKNET project. This is expected to propagate the adoption of futures agriculture commodity markets in India.
The Indian commodity market development can be seen from two extreme perspectives:
1. The first is protection of the essential commodity market through govern-ment intervention.
2. The other is opening up of the sector and getting the necessary protection through market-based instruments like commodity futures contracts.
There are a number of research studies on the impact of futures markets on spot prices and inflationary trends. The results are inconclusive, even though inflation-ary pressure on the prices of commodities, especially agricultural commodities, has gone up sharply after the introduction of commodity futures contracts. The desta-bilizing effect of the futures contracts is casual in nature for inflationary trends, and tends to vary over a long period of time.
Futures markets could provide a comparative advantage in disseminating information, leading to significant price discovery and risk management. Such outcomes can help to successfully develop the underlying commodity market in India.
There is a need to strengthen the market structure, using measures such as integration of widespread spot markets, wider participation in futures trading (e.g., by bankers, farmers, investors, etc.), making available necessary trans-port and storage infrastructure facility, enactment of necessary reforms and
314 ◾ Agribusiness Supply Chain Management
synchronization of acts of different regulatory bodies (such as FMC, RBI, SEBI), etc. A successful history of futures trading, with a proper regulatory frame-work, is essential to develop the underlying commodity market of a fast-growing economy.
It may be concluded here that the futures commodity market plays a significant role in agribusiness supply chains, especially in terms of better price returns and improved information flow, aspects that would facilitate the streamlining of supply chains.
11.7 Corporates in AgribusinessThe corporate sector entities in India who are into agribusiness have been able to showcase a few success stories in terms of managing financial flows, and thereby, achieving success. A number of such examples have been mentioned in different chapters. Here, a few of them are recapped quickly to reiterate the fact that effec-tive management of financial flow is a prerequisite for successful participation in agribusiness in India, given the complexity of landholdings, diversity in agronomic conditions, market spreads, cultural patterns and the (lack of) maturity of the financial systems.
Amul, a member of GCMMF, established leadership in dairy production and marketing. This was possible with a cooperative structure because the suppliers could be paid the right prices on time. Daily milk collections are paid for on the following day based on the quality, which helps to win over the loyalty of farm-ers, and in turn, helps the growth of the milk producing unit. This also improved the overall effectiveness of the supply chain, whereby farmers as well as consum-ers benefited. A number of private dairy firms like Hatsun Foods, Heritage Food and CavinKare were able to establish similar models for dairy businesses and succeeded.
ITC’s e-choupal helped farmers access real-time price information, thus enabling them to make informed decisions on selling their output. This helped reduce the number of intermediaries in the system, thus improving supply chain efficiencies. ITC ensured that farmers received a bigger piece of the financial flow pie, by ensur-ing transparency in all aspects. This built up farmers’ loyalty and thus, a new busi-ness model was created.
There are a number of processors of items like edible oil, sugar and plantation crops like tea, coffee and rubber, where again streamlined financial flows help achieve effective supply chain management. Some of these industries feature the presence of private parties that are both listed and widely held companies and closely held companies. Further, there are public sector and cooperative sector units also present. This variety of ownership structures can be an impediment to smooth financial flows. However, widely held professionally managed com-panies have performed well through effective management of finance. Some of
Financial Systems ◾ 315
these are EID Parry, Shree Renuka Sugars, the K.K. Birla group of sugar com-panies, DCM Shriram and Bajaj Sugar Mills, to name a few. Exhibit 11.1, from Pepsi, discusses the improvement in supply chains brought about by corporate involvement.
Exhibit 11.1 Pepsi Contract Farming and Farmers Benefit in India
Since 1989, PepsiCo India has worked closely with farmers to help improve both their livelihoods and agricultural yield. They have introduced a high-yielding variety of tomato, and then helped paddy farmers increase their crop. Currently, they are into crop diversification and the farming of high-quality pota-toes and other edibles.
The company’s vision is to create a cost-effective, localized agri-supply chain for its business by building trust and relation-ships, leading to crop diversification and yield management. PepsiCo India’s potato farming programme reaches out to more than 12,000 farmer families across six states. PepsiCo India has an assured buy-back mechanism at a prefixed rate with farmers. This insulates them from market price fluctuations. Through their tie-up with the State Bank of India, PepsiCo helps farmers get credit at a lower rate of interest. The com-pany has arranged weather insurance for farmers through its tie-up with ICICI Lombard. According to company sources, in 2010, contract farmers in West Bengal registered a phenom-enal 100% growth in crop output, creating a huge increase in farm income. Farmers recorded a profit between `20,000 and 40,000 per acre, as compared to ̀ 10,000–20,000 per acre in 2009.
It is also reported that there has been a yield improvement by over 300%, and the length of the tomato season more than doubled, resulting in a substantial increase of farmer incomes. The success of contract farming has spread, and PepsiCo engages with over 22,000 farmers across the country to grow a variety of crops.
Source: PepsiCo. Partnership with farmers. n.d.
It is important for the corporate sector to provide the right prices and timely payments, and give visibility to financial flows involving fair practices for agribusi-nesses to grow and prosper in India. Supply chain partners must work in unison
316 ◾ Agribusiness Supply Chain Management
to create a congenial climate, and stay together with trust and cooperation to sail through the vagaries of nature and cyclic trends in business. If any of the constitu-ents is to apply pressure on the focal firm to perform during downtrends, it might stress and strain the entire supply chain.
11.8 ConclusionFor long the Indian agribusiness sector has been plagued by informal credit structures where farmers and small and medium processors are the losers. In addition, there is a need for a regulatory framework under the Essential Commodities Act and various welfare schemes to regulate agribusiness for achieving food security, scope for work and income and so on. With the growth of structured financial institutions led by the Ministry of Agriculture and Finance and apex institutions like RBI and NABARD, commercial banks, RRBs and cooperative societies have been able to infuse financial support for improving the sector. The advent of commodity futures market and the liberalization of policies allowing greater role for corporate, though short of expecta-tions, are impacting the agribusiness sector positively, as financial flows are stream-lined and even more important, constituents of supply chains are able to see visibility and objectivity in flow. This is typical of a growth economy which may have challenges but evolves in maturity to handle larger economic responsibilities, necessary to cater to the world’s second largest population, a population that features huge diversity.
Appendix 11.1Prevalence of Indebtedness in IndiaIt is reported in various sources that about 17,500 farmers killed themselves every year between 2002 and 2006. The most suicides occurred in the states of Andhra Pradesh, Maharashtra, Karnataka, Kerala and Punjab. It may be observed from Table A11.1 that the level of indebtedness among farm households are high in these states. In 2006, the state of Maharashtra, with 4,453 farmers’ suicides, accounted for over a quarter of the all-India total of 17,060, according to the National Crime Records Bureau (NCRB). NCRB also stated that there were at least 16,196 farmers’ suicides in India in 2008, deaths between 1997 and 2008 is 199,132.
Our interest is not to discuss about suicides, but to highlight how obstacles in financial flows can hamper supply chains. It is important to note that the right prices and timely payments for role agents are critical for the synchronized flow of goods and services in agribusiness supply chains.
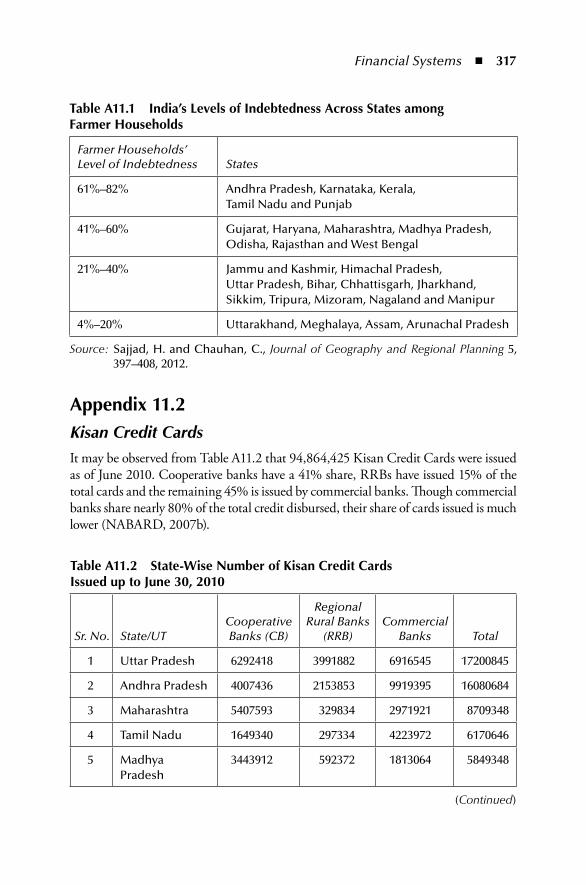
Financial Systems ◾ 317
Appendix 11.2Kisan Credit CardsIt may be observed from Table A11.2 that 94,864,425 Kisan Credit Cards were issued as of June 2010. Cooperative banks have a 41% share, RRBs have issued 15% of the total cards and the remaining 45% is issued by commercial banks. Though commercial banks share nearly 80% of the total credit disbursed, their share of cards issued is much lower (NABARD, 2007b).
table A11.1 india’s Levels of indebtedness Across States among Farmer Households
Farmer Households’ Level of Indebtedness States
61%–82% Andhra Pradesh, Karnataka, Kerala, Tamil Nadu and Punjab
41%–60% Gujarat, Haryana, Maharashtra, Madhya Pradesh, Odisha, Rajasthan and West Bengal
21%–40% Jammu and Kashmir, Himachal Pradesh, Uttar Pradesh, Bihar, Chhattisgarh, Jharkhand, Sikkim, Tripura, Mizoram, Nagaland and Manipur
4%–20% Uttarakhand, Meghalaya, Assam, Arunachal Pradesh
Source: Sajjad, H. and Chauhan, C., Journal of Geography and Regional Planning 5, 397–408, 2012.
table A11.2 State-Wise number of Kisan Credit Cards issued up to June 30, 2010
Sr. No. State/UTCooperative Banks (CB)
Regional Rural Banks
(RRB)Commercial
Banks Total
1 Uttar Pradesh 6292418 3991882 6916545 17200845
2 Andhra Pradesh 4007436 2153853 9919395 16080684
3 Maharashtra 5407593 329834 2971921 8709348
4 Tamil Nadu 1649340 297334 4223972 6170646
5 Madhya Pradesh
3443912 592372 1813064 5849348
(Continued)
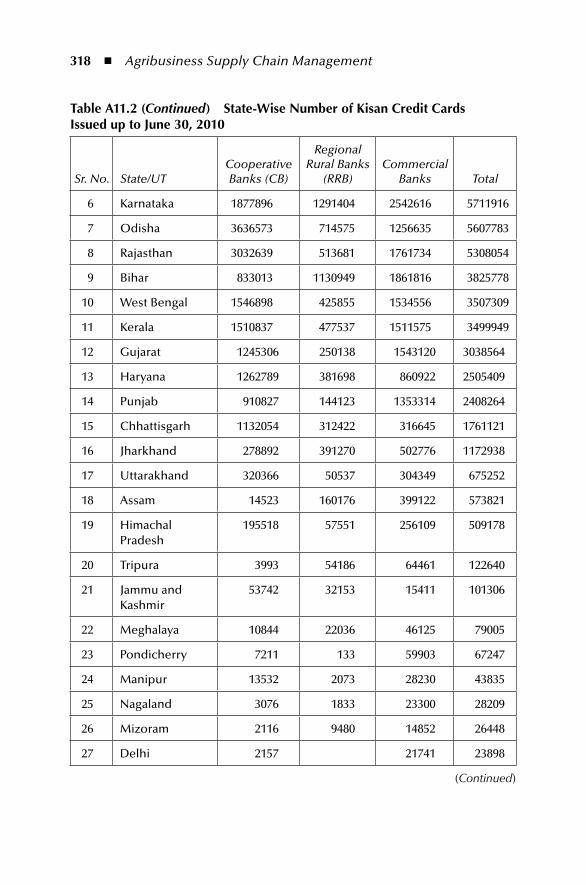
318 ◾ Agribusiness Supply Chain Management
table A11.2 (Continued) State-Wise number of Kisan Credit Cards issued up to June 30, 2010
Sr. No. State/UTCooperative Banks (CB)
Regional Rural Banks
(RRB)Commercial
Banks Total
6 Karnataka 1877896 1291404 2542616 5711916
7 Odisha 3636573 714575 1256635 5607783
8 Rajasthan 3032639 513681 1761734 5308054
9 Bihar 833013 1130949 1861816 3825778
10 West Bengal 1546898 425855 1534556 3507309
11 Kerala 1510837 477537 1511575 3499949
12 Gujarat 1245306 250138 1543120 3038564
13 Haryana 1262789 381698 860922 2505409
14 Punjab 910827 144123 1353314 2408264
15 Chhattisgarh 1132054 312422 316645 1761121
16 Jharkhand 278892 391270 502776 1172938
17 Uttarakhand 320366 50537 304349 675252
18 Assam 14523 160176 399122 573821
19 Himachal Pradesh
195518 57551 256109 509178
20 Tripura 3993 54186 64461 122640
21 Jammu and Kashmir
53742 32153 15411 101306
22 Meghalaya 10844 22036 46125 79005
23 Pondicherry 7211 133 59903 67247
24 Manipur 13532 2073 28230 43835
25 Nagaland 3076 1833 23300 28209
26 Mizoram 2116 9480 14852 26448
27 Delhi 2157 21741 23898
(Continued)
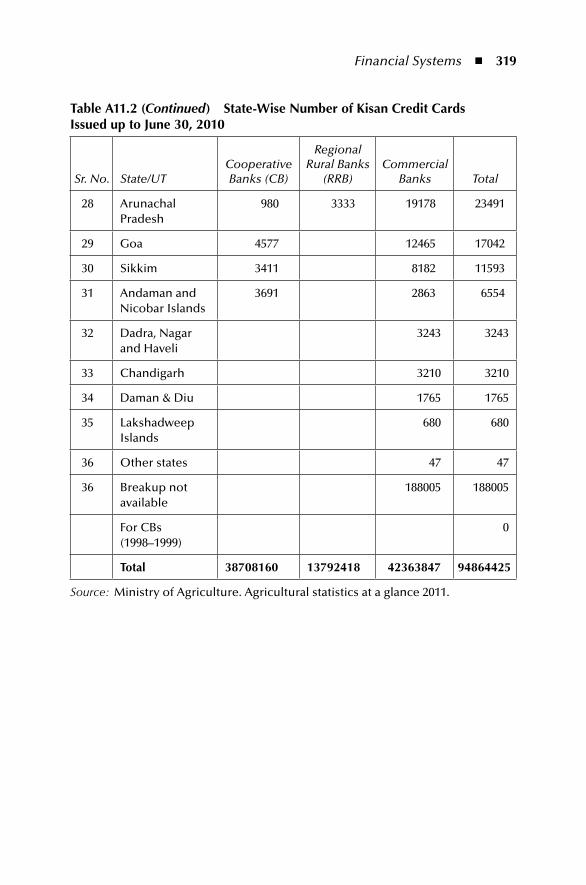
Financial Systems ◾ 319
table A11.2 (Continued) State-Wise number of Kisan Credit Cards issued up to June 30, 2010
Sr. No. State/UTCooperative Banks (CB)
Regional Rural Banks
(RRB)Commercial
Banks Total
28 Arunachal Pradesh
980 3333 19178 23491
29 Goa 4577 12465 17042
30 Sikkim 3411 8182 11593
31 Andaman and Nicobar Islands
3691 2863 6554
32 Dadra, Nagar and Haveli
3243 3243
33 Chandigarh 3210 3210
34 Daman & Diu 1765 1765
35 Lakshadweep Islands
680 680
36 Other states 47 47
36 Breakup not available
188005 188005
For CBs (1998–1999)
0
total 38708160 13792418 42363847 94864425
Source: Ministry of Agriculture. Agricultural statistics at a glance 2011.
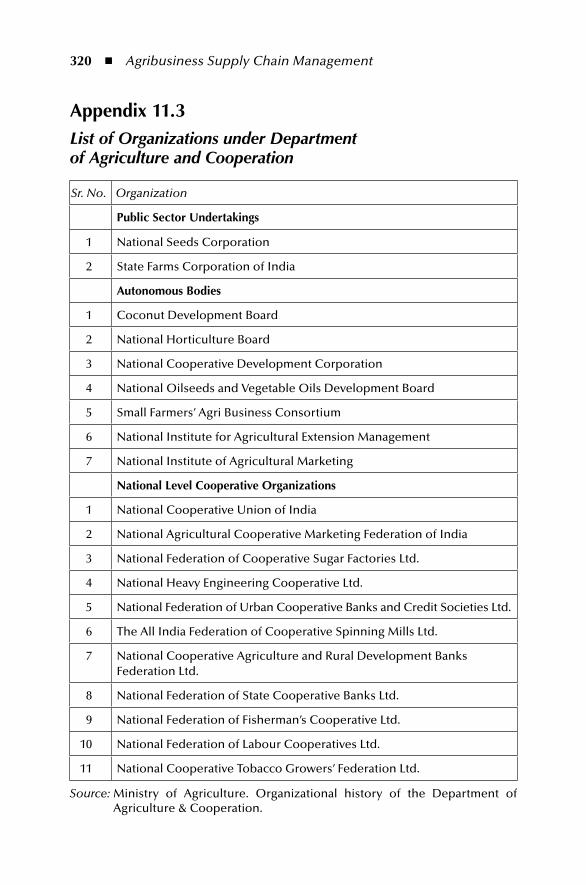
320 ◾ Agribusiness Supply Chain Management
Appendix 11.3List of Organizations under Department of Agriculture and Cooperation
Sr. No. Organization
public Sector undertakings
1 National Seeds Corporation
2 State Farms Corporation of India
Autonomous Bodies
1 Coconut Development Board
2 National Horticulture Board
3 National Cooperative Development Corporation
4 National Oilseeds and Vegetable Oils Development Board
5 Small Farmers’ Agri Business Consortium
6 National Institute for Agricultural Extension Management
7 National Institute of Agricultural Marketing
national Level Cooperative organizations
1 National Cooperative Union of India
2 National Agricultural Cooperative Marketing Federation of India
3 National Federation of Cooperative Sugar Factories Ltd.
4 National Heavy Engineering Cooperative Ltd.
5 National Federation of Urban Cooperative Banks and Credit Societies Ltd.
6 The All India Federation of Cooperative Spinning Mills Ltd.
7 National Cooperative Agriculture and Rural Development Banks Federation Ltd.
8 National Federation of State Cooperative Banks Ltd.
9 National Federation of Fisherman’s Cooperative Ltd.
10 National Federation of Labour Cooperatives Ltd.
11 National Cooperative Tobacco Growers’ Federation Ltd.
Source: Ministry of Agriculture. Organizational history of the Department of Agriculture & Cooperation.
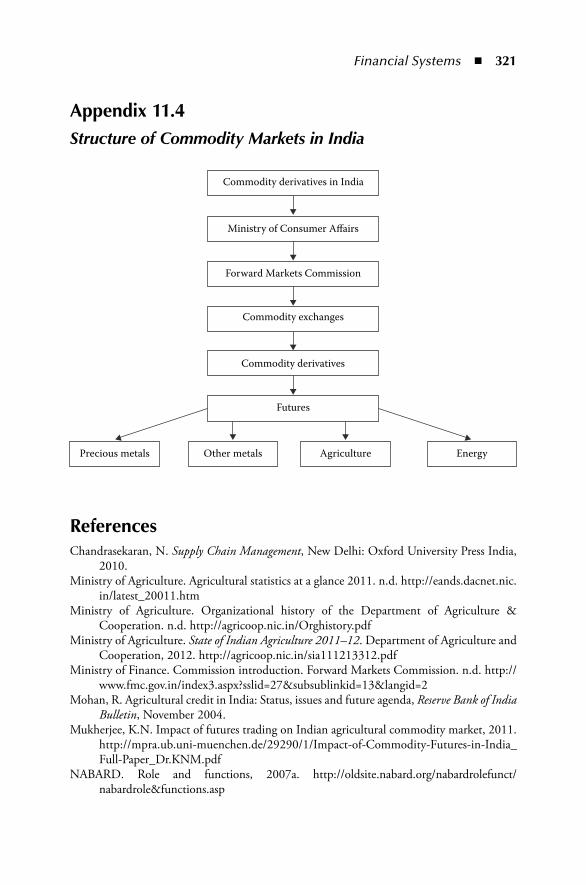
Financial Systems ◾ 321
Appendix 11.4Structure of Commodity Markets in India
Commodity derivatives in India
Ministry of Consumer A�airs
Forward Markets Commission
Commodity exchanges
Commodity derivatives
Futures
Precious metals Other metals Agriculture Energy
referencesChandrasekaran, N. Supply Chain Management, New Delhi: Oxford University Press India,
2010.Ministry of Agriculture. Agricultural statistics at a glance 2011. n.d. http://eands.dacnet.nic.
in/latest_20011.htmMinistry of Agriculture. Organizational history of the Department of Agriculture &
Cooperation. n.d. http://agricoop.nic.in/Orghistory.pdfMinistry of Agriculture. State of Indian Agriculture 2011–12. Department of Agriculture and
Cooperation, 2012. http://agricoop.nic.in/sia111213312.pdfMinistry of Finance. Commission introduction. Forward Markets Commission. n.d. http://
www.fmc.gov.in/index3.aspx?sslid=27&subsublinkid=13&langid=2Mohan, R. Agricultural credit in India: Status, issues and future agenda, Reserve Bank of India
Bulletin, November 2004.Mukherjee, K.N. Impact of futures trading on Indian agricultural commodity market, 2011.
http://mpra.ub.uni-muenchen.de/29290/1/Impact-of-Commodity-Futures-in-India_Full-Paper_Dr.KNM.pdf
NABARD. Role and functions, 2007a. http://oldsite.nabard.org/nabardrolefunct/nabardrole&functions.asp
322 ◾ Agribusiness Supply Chain Management
NABARD. Development and promotional functions: Kisan credit card, 2007b. http://old-site.nabard.org/development&promotional/kisancreditcardmore.asp
PepsiCo. Partnership with farmers. n.d. http://pepsicoindia.co.in/purpose/environmental-sustainability/partnership-with-farmers.html
Sajjad, H. and Chauhan, C. Agrarian distress and indebtedness in rural India: Emerging perspectives and challenges ahead, Journal of Geography and Regional Planning 5, 397–408, 2012. DOI: 10.5897/JGRP11.107.
323
Chapter 12
role of Government
12.1 introductionAgriculture plays a prominent role in the life of an economy. It is the strength of our economic system. The agricultural business system, which includes the gamut of activities from farm to fork, is the foremost creator of employment in the coun-try. Apart from those who are directly involved in the agribusiness sector, a large number of the populace are also involved in agro-based and allied activities. The prominence of the agribusiness sector has developed significantly, as agricultural growth strategies lifted focus from production to a comprehensive system. This shift laid emphasis on agri supply chain synchronization and value creation. It is in fact a pre-condition for the country’s improvement.
Over the past few decades, India has made significant advancements on the agricultural front. Agriculture growth strategies and policies would be a key fac-tor influencing the business environment. In a country like India, the essential extent of outlay for the expansion of agribusiness sector is massive. Agriculture is contributing remarkably, not only to the growth of the economy, but also to the vitality of industry. It has been considered to be an indicator of both social and
Obje CTIv eThe objective of this chapter is to understand various initiatives taken by the government towards efficiency and effectiveness of agribusiness supply chains. Discussions include trade negotiations and subsidy; domestic support systems; price and distribution control; farm credit system and role of govern-ment in buffer stock creation.
324 ◾ Agribusiness Supply Chain Management
economic development, as the development of most of the industries depends on it. Perceived as a driver for growth, the agricultural business sector and its allied indus-tries are gaining increasing visibility in government policies and strategies that aim to stimulate investments in agro-based value chains. Recognizing the significance of agriculture, the Indian government implemented several schemes to promote agriculture in the country. The state and central governments and the related bod-ies involved in the task of formulation of policies have been constantly trying to nurture the agribusiness environment that enables the sector to accomplish its role as the main driver of growth. This has created the need for a deeper understanding of the governmental role in strengthening the policy-making process for agribusi-ness supply chains. This chapter discusses various initiatives taken by governments towards efficiency in agribusiness supply chains.
12.2 Agencies“Being the most important contributor to economic development and employ-ment creation, the agribusiness supply chain plays a dominant role in reducing poverty and in achieving self-sufficiency. It ensures food security for the nation. Over the past five decades agriculture production improved significantly. Food grains production rose from 52 million tonnes in 1951–1952 to 244.78 million tonnes in 2010–2011” (Ministry of Finance, 2013). In spite of an exploding pop-ulation, we have been able to meet the food requirements of the people. In India, agri supply chains have grown in size and complexity, handling great volumes of goods for domestic and international consumption. Since the agri supply chain ensures food security, it tends to be regarded as strategically important for the nation, and this necessitates more government intervention in this sector. This section discusses the role of governments in enabling agribusiness supply chains.
It has already been observed in previous chapters that agri supply chain improve-ment does not occur by itself, but requires a lot of commitment and capabilities from the various stakeholders involved. It calls for firm determination from all chain partners. The government plays an important role in enabling agribusiness supply chains, which involve different players.
The government gets directly involved in agriculture in order to ensure food security, fair prices and public distribution. It provides infrastructure facilities, mar-ket information and credit facilities for needy farmers, and evens out prices with proper price controls, buffer stocks and so on. It also regulates market competitive-ness by establishing procedures or guidelines. During the recent past, we have seen a sturdy surge in the number of certification systems for sustainable and quality produce. Quality systems have been developed that set standards and procedures, including environmental and sustainable issues. This improvement is in accordance with government policies on supply chains to reduce the harmful aspects of agri production and supply. Thus, the government supports and promotes agriculture
Role of Government ◾ 325
directly and through the roles of government agencies as members of agri supply chains. It also regulates and monitors agribusiness activities.
In short, the government takes on the following roles to improve efficiency in the agribusiness sector.
1. The government serves as a direct player. 2. It serves as a regulator through statutory bodies, agencies, etc. 3. It acts as a facilitator through research institutes, universities and nodal agencies.
The following paragraphs explain each of the above roles in detail.
12.2.1 As a Direct PlayerDirect governmental intervention in agriculture has a long history, and it has passed through several phases. The most robust involvement began in the mid-1960s, a period that was very closely connected with vagaries in agricultural patterns. Due to numerous factors like bad harvests, high dependence on imports, inadequate food supplies and enormous food shortages in various parts of the country, the govern-ment decided to intervene by formulating an agriculture policy of self-reliance in food. After numerous attempts, the sharp rise in agriculture production during the Green Revolution of the 1970s saw the dream become a reality. The Green Revolution renovated farming practice in many districts for major food crops like rice, wheat and maize by adopting high-yielding new seeds, proper irrigation structures, upgraded cultivation techniques, etc. Subsequently, agriculture policy reforms were introduced.
This section outlines the government’s direct interventionist measures to strengthen agri supply chains. Government measures like buffer stock creation, releases, price and distribution control, the Essential Commodities Act and its impact on supply chains are discussed. The role of the government in risk mitiga-tion, infrastructure, farmer’s credit and investment and commodity markets is not covered here, as it is elaborated in the previous chapters.
12.2.2 Food Corporation of India (FCI)The Food Corporation of India (FCI) in India was set up under the Food Corporation Act, 1964, with a view to protect the interests of the farmers and to ensure smooth public distribution.
The following are the objectives of the FCI:
◾ To provide fair remunerative prices for farmers ◾ To make food grains available at reasonable prices, particularly to vulnerable
sections of the society ◾ To create buffer stocks as a measure of food security ◾ To maintain a smooth flow of price and distribution.
(FCI, n.d.)
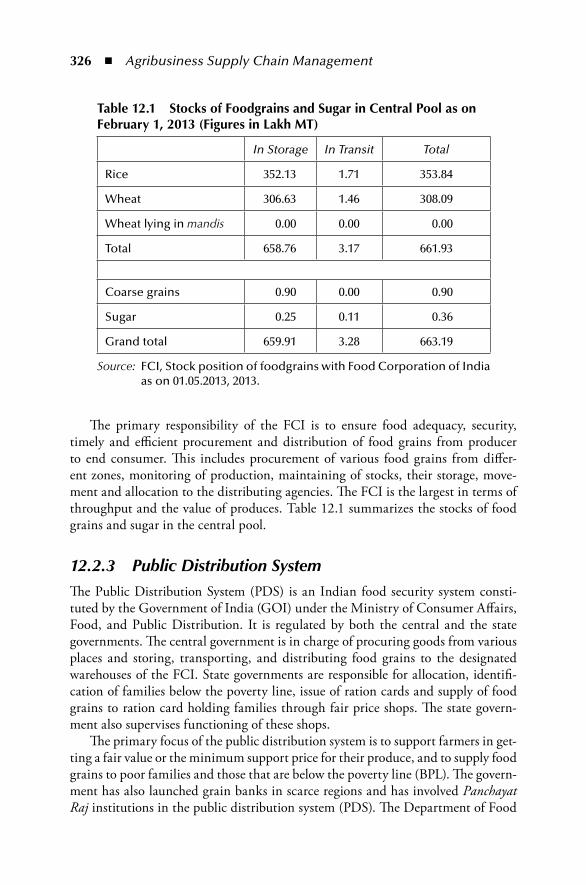
326 ◾ Agribusiness Supply Chain Management
The primary responsibility of the FCI is to ensure food adequacy, security, timely and efficient procurement and distribution of food grains from producer to end consumer. This includes procurement of various food grains from differ-ent zones, monitoring of production, maintaining of stocks, their storage, move-ment and allocation to the distributing agencies. The FCI is the largest in terms of throughput and the value of produces. Table 12.1 summarizes the stocks of food grains and sugar in the central pool.
12.2.3 Public Distribution SystemThe Public Distribution System (PDS) is an Indian food security system consti-tuted by the Government of India (GOI) under the Ministry of Consumer Affairs, Food, and Public Distribution. It is regulated by both the central and the state governments. The central government is in charge of procuring goods from various places and storing, transporting, and distributing food grains to the designated warehouses of the FCI. State governments are responsible for allocation, identifi-cation of families below the poverty line, issue of ration cards and supply of food grains to ration card holding families through fair price shops. The state govern-ment also supervises functioning of these shops.
The primary focus of the public distribution system is to support farmers in get-ting a fair value or the minimum support price for their produce, and to supply food grains to poor families and those that are below the poverty line (BPL). The govern-ment has also launched grain banks in scarce regions and has involved Panchayat Raj institutions in the public distribution system (PDS). The Department of Food
table 12.1 Stocks of Foodgrains and Sugar in Central pool as on February 1, 2013 (Figures in Lakh mt)
In Storage In Transit Total
Rice 352.13 1.71 353.84
Wheat 306.63 1.46 308.09
Wheat lying in mandis 0.00 0.00 0.00
Total 658.76 3.17 661.93
Coarse grains 0.90 0.00 0.90
Sugar 0.25 0.11 0.36
Grand total 659.91 3.28 663.19
Source: FCI, Stock position of foodgrains with Food Corporation of India as on 01.05.2013, 2013.
Role of Government ◾ 327
and Public Distribution is responsible for regulating the sugar industry. It frames polices on the fair and remunerative price (FRP) of sugarcane payable by sugar fac-tories, fixes the levy price for sugar and arranges its supply through the PDS, while also regulating the supply of free sale sugar. Further, it formulates policies on the export and import of food grains, sugar and edible oil.
Exhibit 12.1 Reforms in the Public Distribution System
According to the National Food Security Bill 2011, the reforms shall include
(a) doorstep delivery of food grains to the targeted PDS outlets; (b) application of information and communication technol-
ogy tools, including end-to-end computerization in order to ensure transparent recording of transactions at all lev-els, and to prevent diversion;
(c) leveraging the “Aadhaar” identification system for unique identification, with biometric information of entitled ben-eficiaries for proper targeting of benefits under this Act;
(d) maintenance of full transparency of records; (e) preference to public institutions or public bodies such as
panchayats, self-help groups and cooperatives, in licens-ing of fair price shops and management of fair price shops by women or their collectives;
(f) diversification of commodities distributed under the PDS over a period of time;
(g) support to local public distribution models and grains banks;
(h) introduction of schemes such as cash transfer, food cou-pons, or others to the targeted beneficiaries in lieu of their food grain entitlements prescribed by the central government.
Source: Ministry of Consumer Affairs, Food and Public Distribution. National Food Security Bill, 2011. Bill No. 132, 2011.
12.2.4 Buffer Stock CreationBuffer stocks were created to ensure proper flow of food grains in the course of any uncertainties like bad harvests, adversarial weather conditions or other calamities. These stocks also even out prices during period of production shortage. The whole
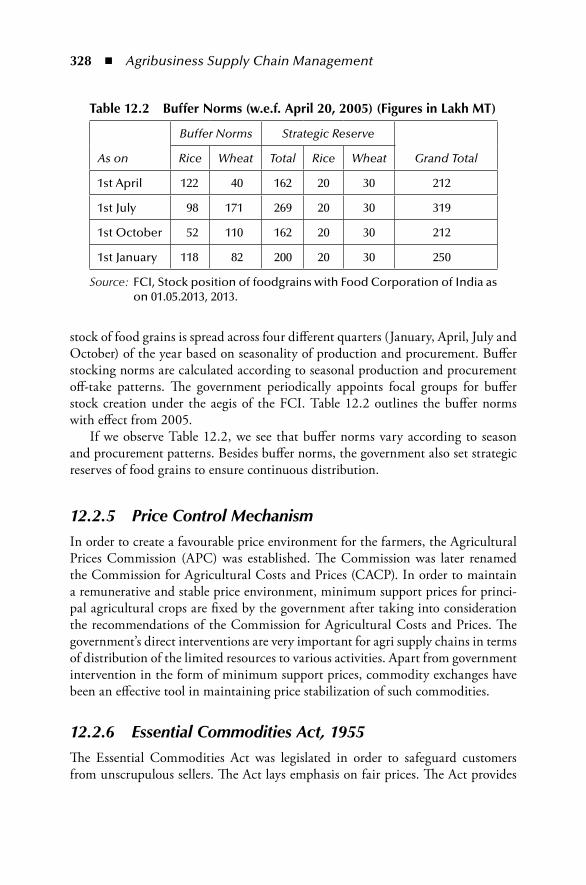
328 ◾ Agribusiness Supply Chain Management
stock of food grains is spread across four different quarters (January, April, July and October) of the year based on seasonality of production and procurement. Buffer stocking norms are calculated according to seasonal production and procurement off-take patterns. The government periodically appoints focal groups for buffer stock creation under the aegis of the FCI. Table 12.2 outlines the buffer norms with effect from 2005.
If we observe Table 12.2, we see that buffer norms vary according to season and procurement patterns. Besides buffer norms, the government also set strategic reserves of food grains to ensure continuous distribution.
12.2.5 Price Control MechanismIn order to create a favourable price environment for the farmers, the Agricultural Prices Commission (APC) was established. The Commission was later renamed the Commission for Agricultural Costs and Prices (CACP). In order to maintain a remunerative and stable price environment, minimum support prices for princi-pal agricultural crops are fixed by the government after taking into consideration the recommendations of the Commission for Agricultural Costs and Prices. The government’s direct interventions are very important for agri supply chains in terms of distribution of the limited resources to various activities. Apart from government intervention in the form of minimum support prices, commodity exchanges have been an effective tool in maintaining price stabilization of such commodities.
12.2.6 Essential Commodities Act, 1955The Essential Commodities Act was legislated in order to safeguard customers from unscrupulous sellers. The Act lays emphasis on fair prices. The Act provides
table 12.2 Buffer norms (w.e.f. April 20, 2005) (Figures in Lakh mt)
As on
Buffer Norms Strategic Reserve
Grand TotalRice Wheat Total Rice Wheat
1st April 122 40 162 20 30 212
1st July 98 171 269 20 30 319
1st October 52 110 162 20 30 212
1st January 118 82 200 20 30 250
Source: FCI, Stock position of foodgrains with Food Corporation of India as on 01.05.2013, 2013.
Role of Government ◾ 329
a regulatory framework for the pricing and distribution of those commodities that are classified as essential. The commodities that are declared to be essential com-modities are reviewed periodically in consultation with ministries governing the essential commodities. The following commodities are declared under the Essential Commodities Act, 1955:
1. Cattle fodder, including oilcakes and other concentrates 2. Coal, including coke and other derivatives 3. Component parts and accessories of automobiles 4. Cotton and woollen textiles 5. Drugs 6. Foodstuffs, including edible oilseeds and oils 7. Iron and steel, including products manufactured from iron and steel 8. Paper, including newsprint, paperboard and strawboard 9. Petroleum and petroleum products 10. Raw cotton, either ginned or unginned, and cotton seed 11. Raw jute 12. Jute textiles 13. Fertilizer, whether inorganic, organic or mixed 14. Yarn made wholly from cotton 15. (i) seeds of food crops and seeds of fruits and vegetables (ii) seeds of cattle fodder and (iii) jute seeds. (GOI, 1955)
12.2.7 Food SubsidyThe central government provides price support for paddy, coarse grains and wheat through the FCI and state agencies. All the food grains, conforming to the pre-scribed specifications, which are offered for sale at specified centres, are bought by the public procurement agencies at the minimum support price (MSP). The food grains are allotted for supply under the targeted public distribution system (TPDS) and other welfare schemes at subsidized prices. Besides this, the central government is also responsible for meeting the buffer stock requirements to ensure food security of the country. Hence, a portion of the total food subsidy also goes towards meeting the carrying cost of the buffer stock, in the form of buffer subsidy. (Dept. of Food & Public Distribution, n.d.)
Tables 12.3 and 12.4 show food subsidies handled by the FCI and the government.
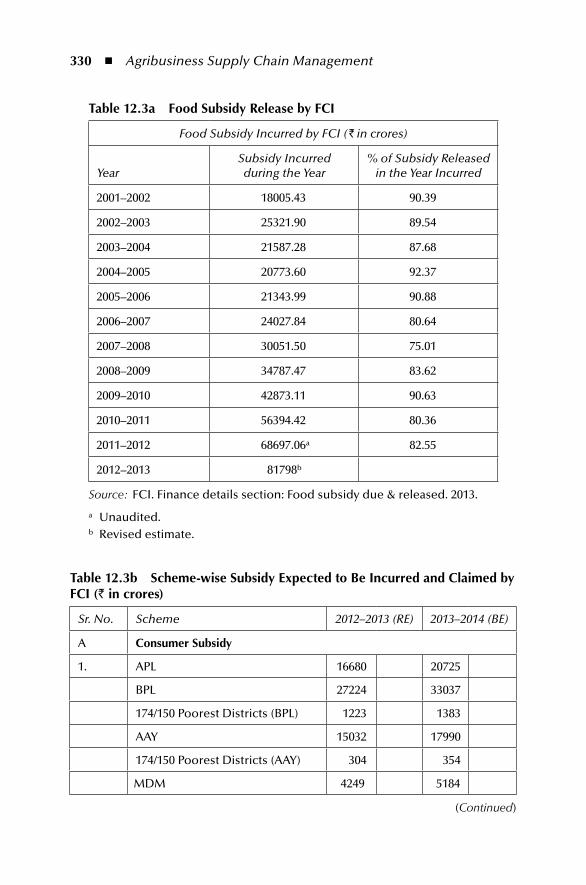
330 ◾ Agribusiness Supply Chain Management
table 12.3a Food Subsidy release by FCi
Food Subsidy Incurred by FCI ( ̀ in crores)
YearSubsidy Incurredduring the Year
% of Subsidy Released in the Year Incurred
2001–2002 18005.43 90.39
2002–2003 25321.90 89.54
2003–2004 21587.28 87.68
2004–2005 20773.60 92.37
2005–2006 21343.99 90.88
2006–2007 24027.84 80.64
2007–2008 30051.50 75.01
2008–2009 34787.47 83.62
2009–2010 42873.11 90.63
2010–2011 56394.42 80.36
2011–2012 68697.06a 82.55
2012–2013 81798b
Source: FCI. Finance details section: Food subsidy due & released. 2013.
a Unaudited.b Revised estimate.
table 12.3b Scheme-wise Subsidy expected to Be incurred and Claimed by FCi (` in crores)
Sr. No. Scheme 2012–2013 (RE) 2013–2014 (BE)
A Consumer Subsidy
1. APL 16680 20725
BPL 27224 33037
174/150 Poorest Districts (BPL) 1223 1383
AAY 15032 17990
174/150 Poorest Districts (AAY) 304 354
MDM 4249 5184
(Continued)
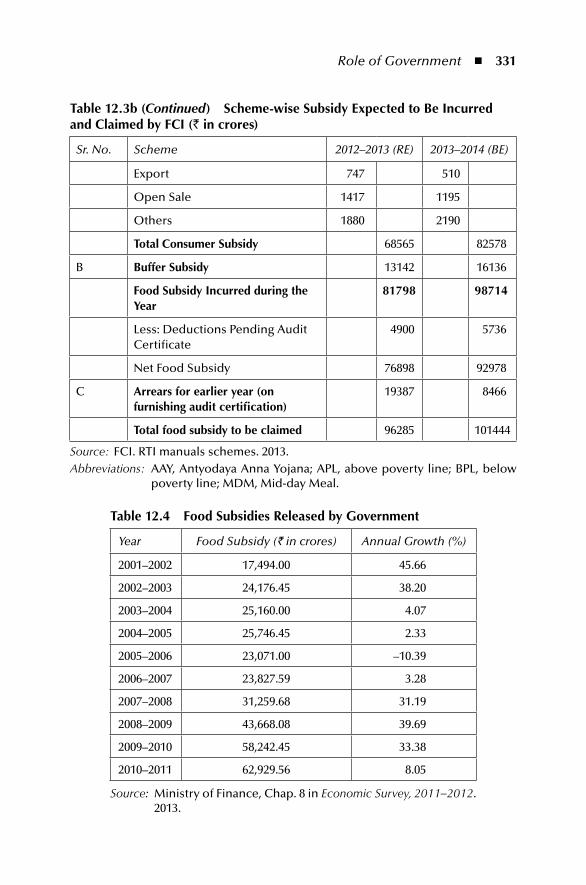
Role of Government ◾ 331
table 12.3b (Continued) Scheme-wise Subsidy expected to Be incurred and Claimed by FCi (` in crores)
Sr. No. Scheme 2012–2013 (RE) 2013–2014 (BE)
Export 747 510
Open Sale 1417 1195
Others 1880 2190
total Consumer Subsidy 68565 82578
B Buffer Subsidy 13142 16136
Food Subsidy incurred during the year
81798 98714
Less: Deductions Pending Audit Certificate
4900 5736
Net Food Subsidy 76898 92978
C Arrears for earlier year (on furnishing audit certification)
19387 8466
total food subsidy to be claimed 96285 101444
Source: FCI. RTI manuals schemes. 2013.Abbreviations: AAY, Antyodaya Anna Yojana; APL, above poverty line; BPL, below
poverty line; MDM, Mid-day Meal.
table 12.4 Food Subsidies released by Government
Year Food Subsidy (` in crores) Annual Growth (%)
2001–2002 17,494.00 45.66
2002–2003 24,176.45 38.20
2003–2004 25,160.00 4.07
2004–2005 25,746.45 2.33
2005–2006 23,071.00 –10.39
2006–2007 23,827.59 3.28
2007–2008 31,259.68 31.19
2008–2009 43,668.08 39.69
2009–2010 58,242.45 33.38
2010–2011 62,929.56 8.05
Source: Ministry of Finance, Chap. 8 in Economic Survey, 2011–2012. 2013.
332 ◾ Agribusiness Supply Chain Management
12.3 policy reformsOver the past few decades, government policies for agriculture in India have evolved significantly. One strategy that has been incorporated into national agendas and five-year plans includes the strengthening of agricultural supply chains through government initiatives. In order to create a competitive economy, India has devel-oped policies that lay emphasis on the improvement of supply chains at the national level. The underlying principle behind the agri supply chain policy would be to link partners at various levels of the supply chains to increase synchronization, invest funds for research and development and negotiate international trade policies and subsidies. As has been indicated, different channel partners play variously impor-tant roles in building sustainable and mutually supporting relationships. India’s supply chain policy has focused on establishing the link between macro-level policy initiatives and their implementation, to make sure that whole supply chain partners obtain a justifiable share of the revenues, and thus, strengthen the sector’s competi-tive edge.
Government policies can impact agri produce prices directly or indirectly due to social and other political reasons. The challenges of managing agricultural supply chains are evident in India, though the government has undertaken a series of policy reforms. The following are the challenges for the government in handling agri supply chains.
◾ Farmers in India hold small or marginal holdings of land, and are widely scattered.
◾ Support infrastructure facilities like roads are inadequate. ◾ Basic agriculture infrastructure facilities are in poor shape. ◾ There are too many intermediary levels. ◾ There is a major lack of standardization and quality certification systems. ◾ There is a lack of grading and cold storage facilities. ◾ There is limited access to information about agriculture markets.
The Ministry of Agriculture’s policy lays emphasis on agriculture for improv-ing supply chains. However, the success of those policies on agricultural supply chains depends on how partners within a supply chain cooperates. Lack of coor-dination in any stage will lead to major obstacles to the creation of a harmonized supply chain. Any policy reforms or transformations in the agriculture sector need constant support from all stakeholders, including farmers, state govern-ments, and the central government, consumers and private players, to strengthen them further.
Role of Government ◾ 333
12.4 Direct Cash SubsidyIn the Union Budget for 2011–2012, the government announced a direct transfer of subsidies to below poverty line (BPL) households. This was a drastic departure from the earlier indirect or price subsidy system. In the earlier system, subsidies were routed through manufacturers who were required to sell goods at prices below the market rate. Under the direct transfer system, the difference between the mar-ket price and the subsidized price is directly transferred to the beneficiary in the form of cash in proportion to the quantity bought from the market. This would be based on estimated demand, and adjudged as being reasonable enough to deserve support from the government.
The earlier subsidy policy adopted by the government is believed to have the following shortcomings:
◾ Dual-pricing: This policy allows for one controlled price and another open market price at which a large portion of produce is allowed to be sold under market operations. There is a strong likelihood of traders diverting food grains from the regulated markets into the open markets to benefit from the premium. This both distorts the markets and creates inefficiency.
◾ Unresponsiveness: Subsidized goods are distributed through manufacturers, who lack the ability to respond to customers’ needs in terms of categories of product, timing and quantity.
◾ Poor target: Though subsidies are meant to help the BPL population, under the current scheme they benefit people who are outside the target as well like even for people who are not poor or below poverty line.
◾ Diversion and leakages: This is one of the biggest problems as those who are in genuine need may still find it difficult to access products, while subsidized produce may get diverted into open markets either illegally, by administrat-ing staff in the sales chains, or through the buyers themselves.
Direct cash distribution would overcome some of the problems, as beneficiaries would receive cash in their bank accounts and buy directly from the open markets. On the other hand, the challenges would be
◾ identification of right beneficiaries; ◾ disbursement through banking systems and cash withdrawal facilities,
including access to ATMs; ◾ the ability of families, a lot of whom are still BPL, to use such systems prop-
erly and benefit from them;
334 ◾ Agribusiness Supply Chain Management
◾ maintaining consumption baskets at the levels desirable for a healthy society; and
◾ the need to calculate the quantum of subsidy on the basis of the number of individuals per household. Normally, the government is likely to estimate average family size and distribute subsidies accordingly.
Though the scheme is well intentioned, and has been working in other coun-tries, in India it has to evolve over the years, and the government must sternly implement the scheme, ensuring that the needy get support and that over the years, a reduction in the subsidy bill is possible.
12.5 As a regulatorIn olden days, farmers faced no difficulty in disposing of their produce, as they exchanged them with consumers under a barter system. In the present-day context, agro products have to go through chains of transfers from one entity to another before they reach the end user. All the produces may not be sold directly in the market; some may requires processing, storage, etc. Further, demand and supply may not be the same on all days. In an imperfect market, selling one produce depends on factors like seasonality, storage availability, demand, etc. Government agencies act as a facilitator in matching demand and supply across markets and supporting farmers in gaining access to global opportunities.
There are numerous central and state-owned enterprises under the Ministry of Agriculture that are involved in agribusiness supply chains, like RBI, NABARD, state-specific markets, etc. Besides these, various associations are grouped in the form of cooperative unions and export promotion councils to enhance cultivation, pro-duction, consumption, farm credit, marketing and export of agri products. There are also specialized marketing bodies for silk, sugar, tea, coffee, rubber, cereals and vegetables.
India is an agricultural nation, as most of the population is influenced by the agricultural sector directly or indirectly. With food being the basic requisite of humankind, importance has been given to agricultural production to a great extent. Adequate production and “even supply” of food are essential to satisfy the nation’s populace. The growing population, increasing global demand, adverse weather con-ditions and rising energy prices have brought new opportunities and challenges. In order to meet the opportunities and challenges and to enable farmers to benefit from the recent global market opportunities, the agriculture sector in India needs to be reformed and strengthened. The government plays a prominent role in regu-lating agribusiness supply chains.
Role of Government ◾ 335
12.6 As a Facilitating institutionOver the years, the government has actively engaged in promoting agribusinesses through a variety of facilitation roles. These include
1. Setting up of education, research and training institutes, universities and bodies across India and on different products, commodities and services in the sector;
2. Setting up promotion centres, mainly for marketing and business/trade development;
3. Setting up financial institutions and bodies for primarily promoting credit and also financial flows;
4. Setting up trade exhibitions and other means of promotion of and familiar-ization with Indian products across the globe;
5. Setting up auxiliary support services across the regions of India; creating products and services for promoting agribusiness.
12.7 trade negotiations and SubsidyOver the last several years, agriculture has been the central theme of trade negotia-tions, as a majority of developing countries derive their livelihood from agribusi-ness. As food is one of the basic necessities of life, every country would like to be self-reliant in food production, and thus, would provide support and assistance to its agricultural sector. This support can be in the form of subsidies, special grants and rebates, tariffs, domestic subsidies and export subsidies, etc. While the devel-oped countries have an industrialized system of agriculture, developing countries still face obstacles in providing subsidies because of poor capacity. This results in imbalances in international trade negotiations.
The government has a critical role to play in trade negotiations, and facili-tates international trade. It creates market access, strengthens agri infra-structure, provides enabling policy interventions, and develops international collaborations. It endeavours to obtain support from worldwide organizations such as the World Bank, the Food and Agricultural Organization, the World Trade Organization and agriculture research institutes, and provides roadmaps for improvements.
These multilateral trade negotiations in the agriculture sector have significant effects for developing countries like India, which have agriculture as a crucial com-ponent of their food security and poverty reduction planning, and of their trade and industry growth. Though these multilateral trade agreements deal with more subjects, this section covers only issues pertaining to agriculture.
336 ◾ Agribusiness Supply Chain Management
In order to get proper understanding of trade negotiations and subsidy, it is important to look at the historical developments relating to international agricul-ture agreements. The General Agreement on Trade and Tariffs (GATT) would be the first agreement one must look at.
12.7.1 General Agreement on Tariffs and Trade (GATT), 1947
The General Agreement on Tariffs and Trade (GATT), 1947, was a multilateral agreement constituted in order to remove barriers affecting international trade. GATT lasted till 1994, and was replaced by the World Trade Organization in 1995. Agriculture stayed outside the purview of GATT before the Uruguay Round. The Uruguay Round, signed in 1994 by 120 countries, was a significant step in the liberalization of world trade in agriculture. The Uruguay Round dealt with import restrictions aimed at reducing the distortions in trade in agricultural products, pri-marily in the form of farm subsidies offered by developed countries. India was one of the initial signatories to GATT 1947.
12.7.2 Uruguay Round Agreement on Agriculture (URAA), 1986–1994
The Uruguay Round of WTO aimed at establishing a fair and market-oriented agricultural trading system. At present, multilateral trade in agricultural prod-ucts is governed by the Uruguay Round agreement on agriculture. This agreement imposes policies and directions on agricultural export subsidies, domestic subsidies and sanitary and phytosanitary (SPS) measures. Multilateral negotiations created four main parts of the agreement:
1. Agreement on agriculture 2. Market access, domestic support and export subsidies 3. Sanitary and phytosanitary measures 4. A ministerial decision concerning least developed and net food importing
developing countries.
12.7.3 World Trade Organization (WTO), 1995The agriculture sector is distorted by trade barriers in domestic and export subsidies. The WTO supports the GOI, stimulating significant reductions in trade distorting subsidies, tariffs and tariff quotas, export subsidies and protection measures used by other countries. During 1986–1994 in the Uruguay Round’s WTO Agreement on Agriculture, the major phase of fair competition and a less distorted sector were
Role of Government ◾ 337
constituted. WTO member countries agreed to reduce trade-distorting subsidies and increase market access to agriculture.
12.7.4 Doha Negotiations, 2001The Doha Development Round is the most recent trade-negotiation round of the WTO. It took place in Doha (Qatar) in 2001. This round of trade negotiations was much extensive than earlier global trade negotiations, and was specifically designed for developing countries. The Doha negotiations reformed the international trad-ing system through the introduction of lower trade barriers and revised trade rules. Developing countries oppose the fact that their own producers cannot compete against the surplus agricultural goods that the developed countries, primarily the EU and the United States, produce. India has made one of the most comprehensive proposals on agriculture to the Doha negotiations. The most vital aspect of India’s negotiations would be to address implementation problems in the areas of market access, domestic support and export subsidy, with the aim of safeguarding its food security and improving market access opportunities that would encourage agricul-tural exports.
12.7.5 Domestic SubsidyThe WTO aims to achieve a significant reduction in domestic subsidies in develop-ing countries. This has come as an after-effect of the Doha Development Round, which concluded that agriculture and the subsidies related to it are among the main reasons for the distortion of trade globally and the adverse influencing of prices. This, combined with import barriers in a few developed countries, poses a serious threat. It would require a lot of effort to bring about even small reductions in subsi-dies. As a part of the G20 initiative, it was mentioned that India has a responsibility to reduce these subsidies to a great extent as well. The Uruguay Round Agreement stated that “box shifting” (between the amber [production levels], blue [produc-tion limiting programmes] and green [causing minimal distortion of trade boxes]) should be minimized.
One of the proposed solutions for this is using a tiered approach to aggregate measure of support (AMS) in order to harmonize the effects of increased trade prices due to subsidies. But the effectiveness of this approach can only be deter-mined once it is put into practice. On the whole, it is also suggested that the overall trade distorting support (OTDS), which is the sum of the AMS, be cut. There is no one-size-fits-all solution for the subsidies issue, as various crops such as sugarcane and tobacco need to be dealt with individually.
In short, with food security concerns topping the agenda of various global dis-cussions, meaningful and conclusive trade negotiations and subsidies have become highly relevant. While protecting the interests of farmers is absolutely essential, it
338 ◾ Agribusiness Supply Chain Management
should not be at the cost of millions of people living in the third world countries. There is an urgent need to arrive at long-term agricultural agreements that ben-efit all countries and help in forming strong markets, in protecting geographical indicators and in encouraging active and robust international trade arrangements. International bodies like the WTO should see to active participation, and pay heed to the needs of all its member nations. Settling agricultural trade issues and pro-tecting those involved in agriculture is absolutely essential to tackle food security concerns.
12.8 ConclusionIndia has evolved into a service sector-based economy, but our policies and schemes still lay considerable emphasis on agriculture and food security. The gov-ernment tries to support the farmers through various means like minimum sup-port prices, fertilizer and diesel subsidies and restrictions on import and export of agricultural goods. Additionally, on the local government scale, too, like at the panchayat level, the government tries to support farmers by providing free seeds and advice on new farming techniques through its agricultural departments and officers. While the government’s efforts in plugging the gaps in the agri sup-ply chain and agri sector infrastructure have not been sufficient, it has in the recent past tried to invite public–private partnerships to work towards achieve these objectives. Governmental support in agricultural trade becomes necessary not only because of the many financial hardships faced by individual small-scale farmers, but also to protect India’s interests in the international trade of agricul-tural produce.
Appendix 12.1Important Agri Business Websites
1 http://www.agricoop.nic.in
2 http://www.dacnet.nic.in
3 http://www.nafed-india.com
4 http://www.iffco.nic.in
5 http://www.kribhco.net
(Continued)
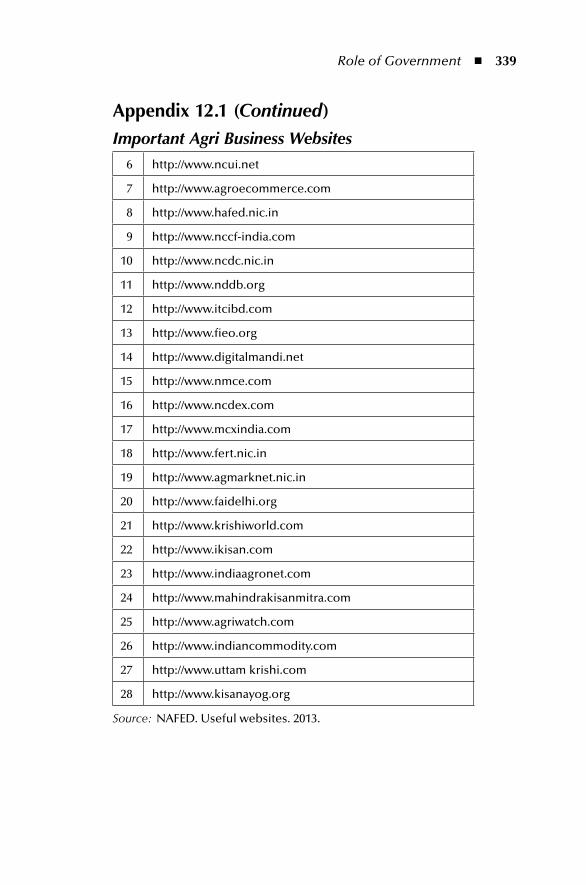
Role of Government ◾ 339
Appendix 12.1 (Continued)Important Agri Business Websites
6 http://www.ncui.net
7 http://www.agroecommerce.com
8 http://www.hafed.nic.in
9 http://www.nccf-india.com
10 http://www.ncdc.nic.in
11 http://www.nddb.org
12 http://www.itcibd.com
13 http://www.fieo.org
14 http://www.digitalmandi.net
15 http://www.nmce.com
16 http://www.ncdex.com
17 http://www.mcxindia.com
18 http://www.fert.nic.in
19 http://www.agmarknet.nic.in
20 http://www.faidelhi.org
21 http://www.krishiworld.com
22 http://www.ikisan.com
23 http://www.indiaagronet.com
24 http://www.mahindrakisanmitra.com
25 http://www.agriwatch.com
26 http://www.indiancommodity.com
27 http://www.uttam krishi.com
28 http://www.kisanayog.org
Source: NAFED. Useful websites. 2013.
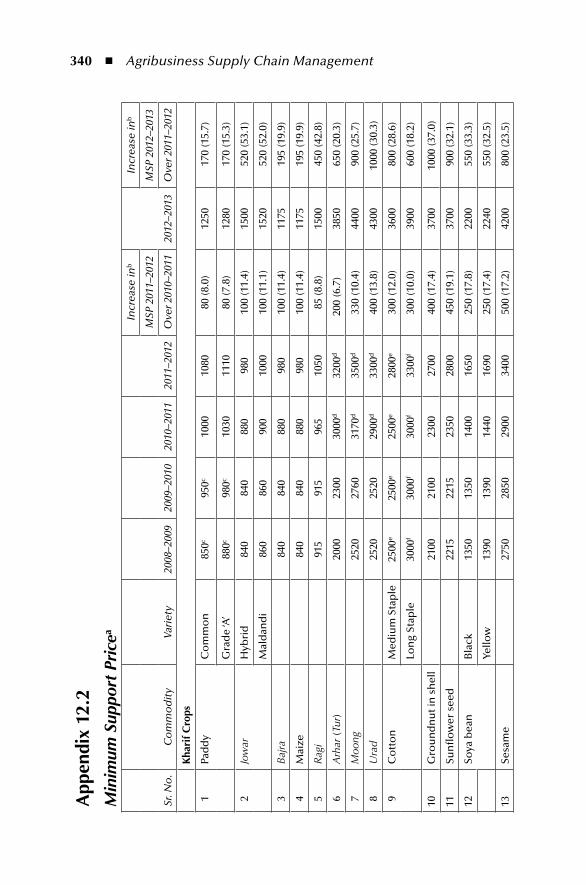
340 ◾ Agribusiness Supply Chain Management
App
endi
x 12
.2M
inim
um S
uppo
rt P
rice
a
Sr. N
o.
Co
mm
od
ity
Vari
ety
2008
–200
920
09–2
010
2010
–201
120
11–2
012
Incr
ease
inb
2012
–201
3
Incr
ease
inb
MSP
201
1–20
12M
SP 2
012–
2013
Ove
r 201
0–20
11O
ver 2
011–
2012
Kha
rif C
rops
1Pa
dd
yC
om
mo
n85
0c95
0c10
0010
8080
(8.0
)12
5017
0 (1
5.7)
Gra
de
‘A’
880c
980c
1030
1110
80 (7
.8)
1280
170
(15.
3)
2Jo
war
Hyb
rid
840
840
880
980
100
(11.
4)15
0052
0 (5
3.1)
Mal
dan
di
860
860
900
1000
100
(11.
1)15
2052
0 (5
2.0)
3B
ajra
840
840
880
980
100
(11.
4)11
7519
5 (1
9.9)
4M
aize
840
840
880
980
100
(11.
4)11
7519
5 (1
9.9)
5R
agi
915
915
965
1050
85 (8
.8)
1500
450
(42.
8)
6A
rhar
(Tu
r)20
0023
0030
00d
3200
d20
0 (6
.7)
3850
650
(20.
3)
7M
oong
2520
2760
3170
d35
00d
330
(10.
4)44
0090
0 (2
5.7)
8U
rad
2520
2520
2900
d33
00d
400
(13.
8)43
0010
00 (3
0.3)
9C
ott
on
Med
ium
Sta
ple
2500
e25
00e
2500
e28
00e
300
(12.
0)36
0080
0 (2
8.6)
Lon
g St
aple
3000
f30
00f
3000
f33
00f
300
(10.
0)39
0060
0 (1
8.2)
10G
rou
nd
nu
t in
sh
ell
2100
2100
2300
2700
400
(17.
4)37
0010
00 (3
7.0)
11Su
nfl
ow
er s
eed
2215
2215
2350
2800
450
(19.
1)37
0090
0 (3
2.1)
12So
ya b
ean
Bla
ck13
5013
5014
0016
5025
0 (1
7.8)
2200
550
(33.
3)
Yello
w13
9013
9014
4016
9025
0 (1
7.4)
2240
550
(32.
5)
13Se
sam
e27
5028
5029
0034
0050
0 (1
7.2)
4200
800
(23.
5)
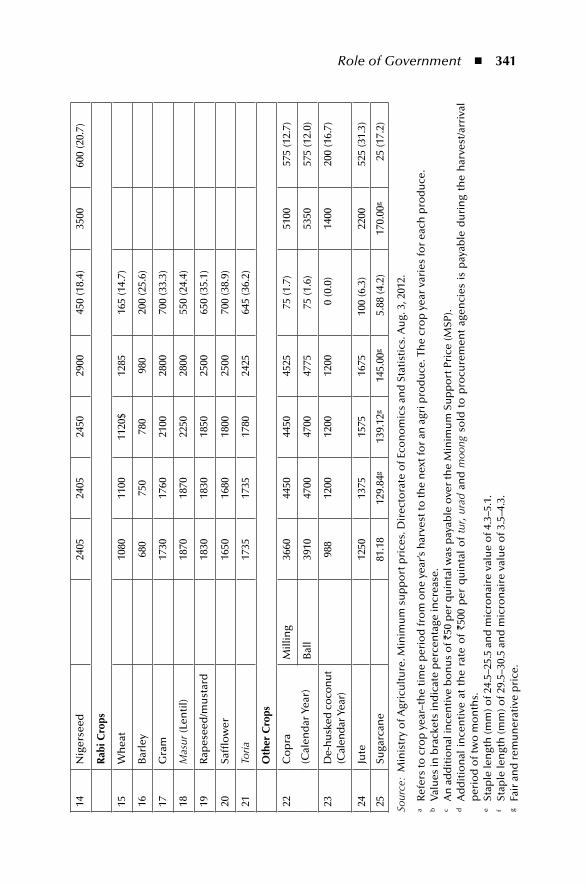
Role of Government ◾ 341
14N
iger
seed
2405
2405
2450
2900
450
(18.
4)35
0060
0 (2
0.7)
rab
i Cro
ps
15W
hea
t10
8011
0011
20$
1285
165
(14.
7)
16B
arle
y68
075
078
098
020
0 (2
5.6)
17G
ram
1730
1760
2100
2800
700
(33.
3)
18M
asur
(Len
til)
1870
1870
2250
2800
550
(24.
4)
19R
apes
eed
/mu
star
d18
3018
3018
5025
0065
0 (3
5.1)
20Sa
fflo
wer
1650
1680
1800
2500
700
(38.
9)
21To
ria17
3517
3517
8024
2564
5 (3
6.2)
oth
er C
rops
22C
op
ra
(Cal
end
ar Y
ear)
Mill
ing
3660
4450
4450
4525
75 (1
.7)
5100
575
(12.
7)
Bal
l39
1047
0047
0047
7575
(1.6
)53
5057
5 (1
2.0)
23D
e-h
usk
ed c
oco
nu
t (C
alen
dar
Yea
r)98
812
0012
0012
000
(0.0
)14
0020
0 (1
6.7)
24Ju
te12
5013
7515
7516
7510
0 (6
.3)
2200
525
(31.
3)
25Su
garc
ane
81.1
812
9.84
g13
9.12
g14
5.00
g5.
88 (4
.2)
170.
00g
25 (1
7.2)
Sour
ce:
Min
istr
y o
f Agr
icu
ltu
re. M
inim
um
su
pp
ort
pri
ces.
Dir
ecto
rate
of E
con
om
ics
and
Sta
tist
ics.
Au
g. 3
, 201
2.
a R
efer
s to
cro
p y
ear–
the
tim
e p
erio
d fr
om
on
e ye
ar’s
har
vest
to th
e n
ext f
or
an a
gri p
rod
uce
. Th
e cr
op
yea
r va
ries
for
each
pro
du
ce.
b
Val
ues
in b
rack
ets
ind
icat
e p
erce
nta
ge in
crea
se.
c A
n a
dd
itio
nal
ince
nti
ve b
on
us
of `
50 p
er q
uin
tal w
as p
ayab
le o
ver
the
Min
imu
m S
up
po
rt P
rice
(MSP
).d
A
dd
itio
nal
in
cen
tive
at
the
rate
of
`500
per
qu
inta
l o
f tu
r, ur
ad a
nd
moo
ng s
old
to
pro
cure
men
t ag
enci
es i
s p
ayab
le d
uri
ng
the
har
vest
/arr
ival
p
erio
d o
f tw
o m
on
ths.
e St
aple
len
gth
(mm
) of 2
4.5–
25.5
an
d m
icro
nai
re v
alu
e o
f 4.3
–5.1
. f
Stap
le le
ngt
h (m
m) o
f 29.
5–30
.5 a
nd
mic
ron
aire
val
ue
of 3
.5–4
.3.
g Fa
ir a
nd
rem
un
erat
ive
pri
ce.
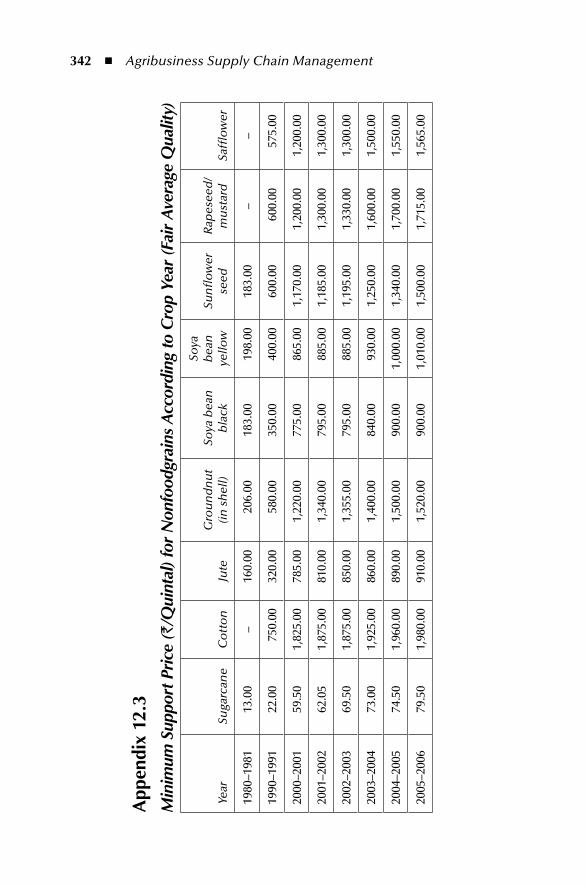
342 ◾ Agribusiness Supply Chain Management
App
endi
x 12
.3M
inim
um S
uppo
rt P
rice
(`/
Qui
ntal
) for
Non
food
grai
ns A
ccor
ding
to C
rop
Year
(Fai
r A
vera
ge Q
ualit
y)
Year
Suga
rcan
eC
ott
on
Jute
Gro
un
dn
ut
(in
sh
ell)
So
ya b
ean
b
lack
Soya
bea
n
yello
w
Sun
flo
wer
se
ed
Rap
esee
d/
mu
star
d
Saffl
ow
er
1980
–198
113
.00
–16
0.00
206.
0018
3.00
198.
0018
3.00
––
1990
–199
122
.00
750.
0032
0.00
580.
0035
0.00
400.
0060
0.00
600.
0057
5.00
2000
–200
159
.50
1,82
5.00
785.
001,
220.
0077
5.00
865.
001,
170.
001,
200.
001,
200.
00
2001
–200
262
.05
1,87
5.00
810.
001,
340.
0079
5.00
885.
001,
185.
001,
300.
001,
300.
00
2002
–200
369
.50
1,87
5.00
850.
001,
355.
0079
5.00
885.
001,
195.
001,
330.
001,
300.
00
2003
–200
473
.00
1,92
5.00
860.
001,
400.
0084
0.00
930.
001,
250.
001,
600.
001,
500.
00
2004
–200
574
.50
1,96
0.00
890.
001,
500.
0090
0.00
1,00
0.00
1,34
0.00
1,70
0.00
1,55
0.00
2005
–200
679
.50
1,98
0.00
910.
001,
520.
0090
0.00
1,01
0.00
1,50
0.00
1,71
5.00
1,56
5.00
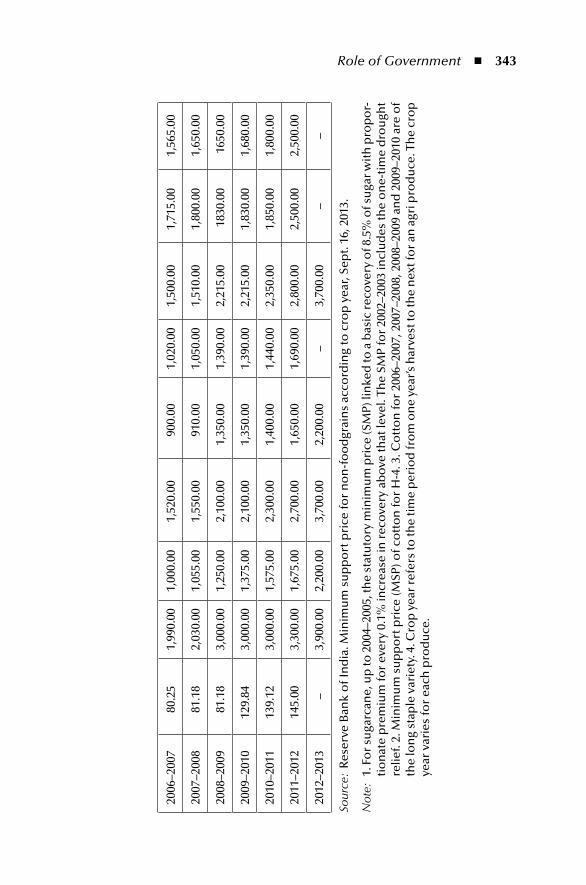
Role of Government ◾ 343
2006
–200
780
.25
1,99
0.00
1,00
0.00
1,52
0.00
900.
001,
020.
001,
500.
001,
715.
001,
565.
00
2007
–200
881
.18
2,03
0.00
1,05
5.00
1,55
0.00
910.
001,
050.
001,
510.
001,
800.
001,
650.
00
2008
–200
981
.18
3,00
0.00
1,25
0.00
2,10
0.00
1,35
0.00
1,39
0.00
2,21
5.00
1830
.00
1650
.00
2009
–201
012
9.84
3,00
0.00
1,37
5.00
2,10
0.00
1,35
0.00
1,39
0.00
2,21
5.00
1,83
0.00
1,68
0.00
2010
–201
113
9.12
3,00
0.00
1,57
5.00
2,30
0.00
1,40
0.00
1,44
0.00
2,35
0.00
1,85
0.00
1,80
0.00
2011
–201
214
5.00
3,30
0.00
1,67
5.00
2,70
0.00
1,65
0.00
1,69
0.00
2,80
0.00
2,50
0.00
2,50
0.00
2012
–201
3–
3,90
0.00
2,20
0.00
3,70
0.00
2,20
0.00
–3,
700.
00–
–
Sour
ce:
Res
erve
Ban
k o
f In
dia
. Min
imu
m s
up
po
rt p
rice
for
no
n-f
oo
dgr
ain
s ac
cord
ing
to c
rop
yea
r, Se
pt.
16, 2
013.
Not
e: 1
. Fo
r su
garc
ane,
up
to 2
004–
2005
, th
e st
atu
tory
min
imu
m p
rice
(SM
P) li
nke
d to
a b
asic
rec
ove
ry o
f 8.5
% o
f su
gar
wit
h p
rop
or-
tio
nat
e p
rem
ium
for
ever
y 0.
1% in
crea
se in
rec
ove
ry a
bo
ve th
at le
vel.
The
SMP
for
2002
–200
3 in
clu
des
the
on
e-ti
me
dro
ugh
t re
lief.
2. M
inim
um
su
pp
ort
pri
ce (M
SP) o
f co
tto
n fo
r H
-4. 3
. Co
tto
n fo
r 20
06–2
007,
200
7–20
08, 2
008–
2009
an
d 2
009–
2010
are
of
the
lon
g st
aple
var
iety
. 4. C
rop
yea
r re
fers
to th
e ti
me
per
iod
fro
m o
ne
year
’s h
arve
st to
the
nex
t fo
r an
agr
i pro
du
ce. T
he
cro
p
year
var
ies
for
each
pro
du
ce.
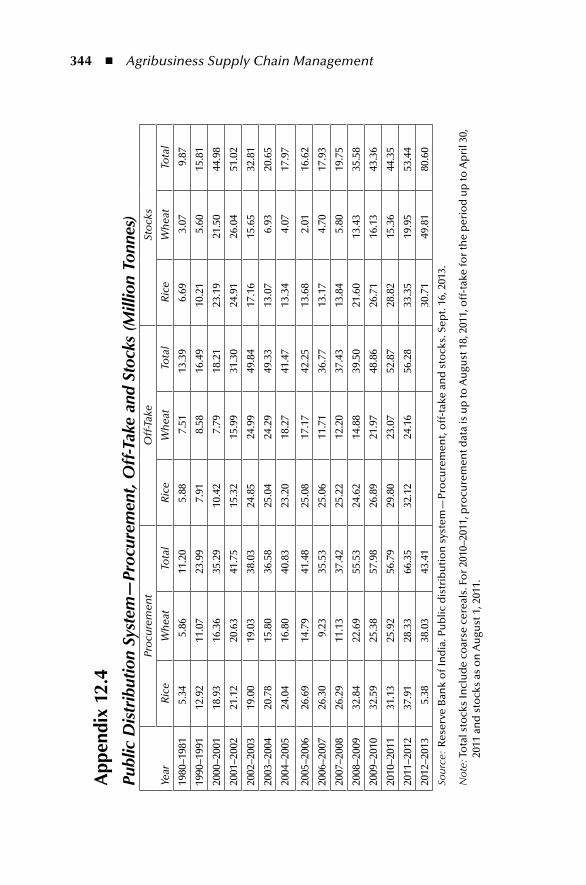
344 ◾ Agribusiness Supply Chain Management
App
endi
x 12
.4Pu
blic
Dis
trib
utio
n Sy
stem
—Pr
ocur
emen
t, O
ff-T
ake
and
Stoc
ks (M
illio
n To
nnes
)
Year
Pro
cure
men
tO
ff-T
ake
Sto
cks
Ric
eW
hea
tTo
tal
Ric
eW
hea
tTo
tal
Ric
eW
hea
tTo
tal
1980
–198
15.
345.
8611
.20
5.88
7.51
13.3
96.
693.
079.
87
1990
–199
112
.92
11.0
723
.99
7.91
8.58
16.4
910
.21
5.60
15.8
1
2000
–200
118
.93
16.3
635
.29
10.4
27.
7918
.21
23.1
921
.50
44.9
8
2001
–200
221
.12
20.6
341
.75
15.3
215
.99
31.3
024
.91
26.0
451
.02
2002
–200
319
.00
19.0
338
.03
24.8
524
.99
49.8
417
.16
15.6
532
.81
2003
–200
420
.78
15.8
036
.58
25.0
424
.29
49.3
313
.07
6.93
20.6
5
2004
–200
524
.04
16.8
040
.83
23.2
018
.27
41.4
713
.34
4.07
17.9
7
2005
–200
626
.69
14.7
941
.48
25.0
817
.17
42.2
513
.68
2.01
16.6
2
2006
–200
726
.30
9.23
35.5
325
.06
11.7
136
.77
13.1
74.
7017
.93
2007
–200
826
.29
11.1
337
.42
25.2
212
.20
37.4
313
.84
5.80
19.7
5
2008
–200
932
.84
22.6
955
.53
24.6
214
.88
39.5
021
.60
13.4
335
.58
2009
–201
032
.59
25.3
857
.98
26.8
921
.97
48.8
626
.71
16.1
343
.36
2010
–201
131
.13
25.9
256
.79
29.8
023
.07
52.8
728
.82
15.3
644
.35
2011
–201
237
.91
28.3
366
.35
32.1
224
.16
56.2
833
.35
19.9
553
.44
2012
–201
35.
3838
.03
43.4
130
.71
49.8
180
.60
Sour
ce:
Res
erve
Ban
k o
f In
dia
. Pu
blic
dis
trib
uti
on
sys
tem
—Pr
ocu
rem
ent,
off
-tak
e an
d s
tock
s. S
ept.
16, 2
013.
Not
e: T
ota
l sto
cks
Incl
ud
e co
arse
cer
eals
. Fo
r 20
10–2
011,
pro
cure
men
t dat
a is
up
to A
ugu
st 1
8, 2
011,
off
-tak
e fo
r th
e p
erio
d u
p to
Ap
ril 3
0,
2011
an
d s
tock
s as
on
Au
gust
1, 2
011.
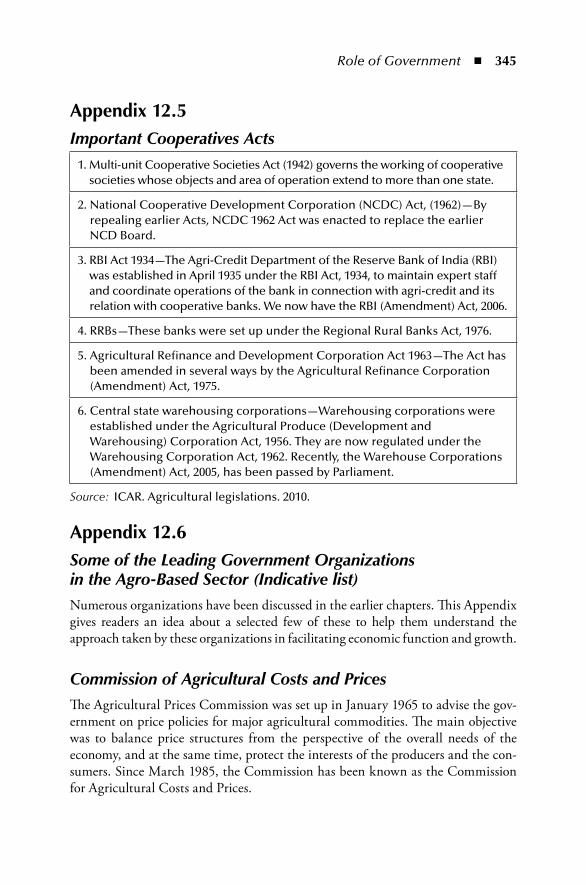
Role of Government ◾ 345
Appendix 12.6Some of the Leading Government Organizations in the Agro-Based Sector (Indicative list)Numerous organizations have been discussed in the earlier chapters. This Appendix gives readers an idea about a selected few of these to help them understand the approach taken by these organizations in facilitating economic function and growth.
Commission of Agricultural Costs and PricesThe Agricultural Prices Commission was set up in January 1965 to advise the gov-ernment on price policies for major agricultural commodities. The main objective was to balance price structures from the perspective of the overall needs of the economy, and at the same time, protect the interests of the producers and the con-sumers. Since March 1985, the Commission has been known as the Commission for Agricultural Costs and Prices.
Appendix 12.5Important Cooperatives Acts
1. Multi-unit Cooperative Societies Act (1942) governs the working of cooperative societies whose objects and area of operation extend to more than one state.
2. National Cooperative Development Corporation (NCDC) Act, (1962)—By repealing earlier Acts, NCDC 1962 Act was enacted to replace the earlier NCD Board.
3. RBI Act 1934—The Agri-Credit Department of the Reserve Bank of India (RBI) was established in April 1935 under the RBI Act, 1934, to maintain expert staff and coordinate operations of the bank in connection with agri-credit and its relation with cooperative banks. We now have the RBI (Amendment) Act, 2006.
4. RRBs—These banks were set up under the Regional Rural Banks Act, 1976.
5. Agricultural Refinance and Development Corporation Act 1963—The Act has been amended in several ways by the Agricultural Refinance Corporation (Amendment) Act, 1975.
6. Central state warehousing corporations—Warehousing corporations were established under the Agricultural Produce (Development and Warehousing) Corporation Act, 1956. They are now regulated under the Warehousing Corporation Act, 1962. Recently, the Warehouse Corporations (Amendment) Act, 2005, has been passed by Parliament.
Source: ICAR. Agricultural legislations. 2010.
346 ◾ Agribusiness Supply Chain Management
Minimum support prices (MSPs) for major agricultural products are fixed by the government each year after taking into account the recommendations of the Commission for Agricultural Costs and Prices (CACP). The Commission analy-ses a wide spectrum of data, covering the costs of cultivation/production, trends and spread of input use, production and productivity of the crop concerned, market prices, both domestic and global inter-crop price parity, the emerging supply-demand situation, procurement and distribution, terms of trade between agriculture and non-agriculture sectors, and so on. Since the price policy involves certain considerations of long-run consequences, the Commission also looks at the yield- raising research being conducted by institutions like ICAR. Data are gath-ered through field work and expert opinions. The commission supports 25 crops for MSP.
For further information refer to: About CACP. http://cacp.dacnet.nic.in/r2inf/aboutcacp.htm
Indian Council of Agricultural Research (ICAR)The Indian Council of Agricultural Research (ICAR) is an autonomous organization under the Department of Agricultural Research and Education (DARE), Ministry of Agriculture, GOI. It was established on July 16, 1929 as a registered society under the Societies Registration Act, 1860, in pursuance of the report of the Royal Commission on Agriculture, and was then called Imperial Council of Agricultural Research.
The Council is the apex body for co-ordinating, guiding and managing research and education in agriculture, including horticulture, fisheries and animal sciences, in the entire country. There are 99 ICAR institutes and 53 agricultural universities under its fold.
It has played a pioneering role in ushering in the Green Revolution and in sub-sequent developments in agriculture in India through its research and technology development. According to sources, it has enabled the country to increase its produc-tion of food grains by four times, horticultural crops by six times, fish by nine times (marine by five times and inland by 17 times), milk by six times and eggs by 27 times since 1950–1951. The contribution is quite significant for the national food and nutritional security. It has played a major role in promoting excellence in higher edu-cation in agriculture. It is engaged in the cutting edge areas of science and technology development, and its scientists are internationally acknowledged in their fields.
For further information refer to: ICAR. About us. 2010. http://www.icar.org.in/en/aboutus.htm
National Bank for Agriculture and Rural DevelopmentNABARD was set up as an apex development bank with a mandate for facili-tating credit flow for promotion and development of agriculture, small-scale
Role of Government ◾ 347
industries, cottage and village industries, handicrafts and other rural crafts. It also has the mandate to support all other allied economic activities in rural areas, promote integrated and sustainable rural development and secure prosperity of rural areas. In discharging its role as a facilitator for rural prosperity, NABARD is entrusted with
◾ providing refinance to lending institutions in rural areas; ◾ bringing about or promoting institutional development; and ◾ evaluating, monitoring and inspecting client banks,
Besides this pivotal role, NABARD also
◾ acts as a coordinator in the operations of rural credit institutions; ◾ extends assistance to the government, the RBI and other organizations in
matters relating to rural development; ◾ offers training and research facilities for banks, cooperatives and organiza-
tions working in the field of rural development; ◾ helps state governments in reaching their targets of providing assistance to
eligible institutions in agriculture and rural development; and ◾ acts as a regulator for cooperative banks and RRBs.
For further information refer to: NABARD: https://www.nabard.org/ english/Home.aspx
Food Corporation of India (FCI)Food Corporation of India was setup under the Food Corporation Act, 1964, in order to fulfil the following objectives of the Food Policy:
◾ Effective price support operations for safeguarding the interests of farmers ◾ Distribution of food grains throughout the country through the public dis-
tribution system ◾ Maintaining satisfactory levels of operational and buffer stocks of food grains
to ensure national food security
FCI’s objectives are
◾ to provide farmers with remunerative prices; ◾ to make food grains available at reasonable prices, particularly to vulnerable
sections of the society; ◾ to maintain buffer stocks as measures of food security; and ◾ to intervene in the market for price stabilization.
For further information refer to: FCI: http://fciweb.nic.in/
348 ◾ Agribusiness Supply Chain Management
Agriculture and Processed Food Products Export Development Authority (APEDA)APEDA was established by the GOI under the Agricultural and Processed Food Products Export Development Authority Act passed by Parliament in December 1985. The Authority replaced the Processed Food Export Promotion Council (PFEPC).
The following functions have been assigned to the authority.
◾ Develop industries relating to the scheduled products for export by way of providing financial assistance or otherwise for undertaking surveys and fea-sibility studies, participation in enquiry capital through joint ventures and other reliefs and subsidy schemes
◾ Register persons as exporters of the scheduled products on payment of such fees as may be prescribed
◾ Fix standards and specifications for the scheduled products for the purpose of exports.
◾ Carry out inspection of meat and meat products in slaughter houses, pro-cessing plants, storage premises, conveyances or other places where such products are kept or handled for the purpose of ensuring the quality of such products.
◾ Improve packaging of the scheduled products. ◾ Improve marketing of the scheduled products outside India. ◾ Promote export-oriented production and development of the scheduled
products. ◾ Collect statistics from the owners of factories or establishments engaged in
the production, processing, packaging, marketing or export of the scheduled products or from such other persons as may be prescribed on any matter relat-ing to the scheduled products, and publish the statistics so collected, or any portions thereof, or extracts therefrom.
◾ Provide training in various aspects of the industries connected with the scheduled products.
◾ Work on such other matters as may be prescribed. For further information refer to: About APEDA. http://www.apeda.gov.in/
apedawebsite/about_apeda/About_apeda.htm
Marine Products Exports Development Authority (MPEDA)MPEDA was set up in 1972 for increasing exports by specifying standards, pro-cessing, marketing, extension and training in various aspects of the fisheries sector.
For further information refer to MPEDA: http://www.mpeda.com/inner_home.asp?pg=overview
Role of Government ◾ 349
National Dairy Development BoardNDDB is a premier government body that was responsible for the dairy revolution in India under the leadership of Dr. V. Kurien. The organization created history by spreading the cooperative movement in India in first the diary field and then in edible oilseeds and oil.
For further information refer to NDDB: http://www.nddb.org/
Spices Board of IndiaThe Spices Board (Ministry of Commerce, GOI) is an organization for the develop-ment and worldwide promotion of Indian spices. The Board is an international link between Indian exporters and importers abroad. The Board has been spearheading activities for excellence of Indian spices, involving every segment of the industry. The Board has made quality and hygiene the cornerstones of its development and promotional strategies.
The Board’s activities include promotion of exports of spices and spice products; maintenance and monitoring of quality of exports; development and implementa-tion of better production methods, through scientific, technological and economic research, and so on.
Spices Board India: http://www.indianspices.com/html/spices_board_intro.htm
Tea Board of IndiaTea is one of the industries that by an Act of Parliament come under the control of the union government. The genesis of the Tea Board India dates back to 1903, when the Indian Tea Cess Bill was passed. The bill provided for levying a cess on tea exports, the proceeds of which were to be used for the promotion of Indian tea both within and outside India. The present Tea Board, set up under Section 4 of the Tea Act, 1953, was constituted on April 1, 1954. It has succeeded the Central Tea Board and the Indian Tea Licensing Committee, which functioned, respectively, under the Central Tea Board Act, 1949, and the Indian Tea Control Act, 1938, which were later repealed. The activities of the two previous bodies had been confined largely to regulation of tea cultivation and export of tea, as required by the International Tea Agreement then in force, and to promotion of tea consumption. (Tea Board of India, 2013)
AcknowledgementThe authors would like to place on record the support received from Ms. Rammyaa M, research scholar with the Centre for Logistics and SCM, Loyola Institute of Business Administration, in terms of research support for this chapter.
350 ◾ Agribusiness Supply Chain Management
referencesAgricultural and Processed Food Products Export Development Authority (APEDA). About
APEDA. http://www.apeda.gov.in/apedawebsite/about_apeda/About_apeda.htmCommission of Agricultural Costs and Prices. About CACP. http://cacp.dacnet.nic.in/r2inf/
aboutcacp.htmDepartment of Food & Public Distribution. Website. http://dfpd.nic.inFood Corporation of India (FCI). Objective. n.d. http://fciweb.nic.in/articles/view/268Food Corporation of India (FCI). Finance details section: Food subsidy due & released,
2013. http://fciweb.nic.in/finances/view/6Food Corporation of India (FCI). RTI Manuals Schemes, 2013. http://fciweb.nic.in/articles/
view/328Food Corporation of India (FCI). Stock Position of Foodgrains with Food Corporation of
India as on 01.05.2013. 2013. http://fciweb.nic.in/upload/Stock/5.pdfGovernment of India. Essential Commodities Act, 1955.Indian Council of Agricultural Research (ICAR). About us, 2010. http://www.icar.org.in/
en/aboutus.htmIndian Council of Agricultural Research (ICAR). Agricultural legislations, 2010. http://
www.icar.org.in/files/Agril-Legislation.pdfMarine Products Export Development Authority (MPEDA) Overview. n.d. http://www.
mpeda.com/inner_home.asp?pg=overviewMinistry of Agriculture. Minimum support prices. Directorate of Economics and Statistics,
Aug. 3, 2012. http://eands.dacnet.nic.in/msp/MSPStatement_(2012.03.08)_latest.pdfMinistry of Consumer Affairs, Food and Public Distribution. Department of Food & Public
Distribution website. http://dfpd.nic.inMinistry of Consumer Affairs, Food and Public Distribution. National Food Security Bill,
2011. Bill No. 132, 2011. http://dfpd.nic.in/fcamin/FSBILL/food-security.pdfMinistry of Finance, Economic Survey, 2011–2012. 2013. http://indiabudget.nic.in/survey.
aspNational Agricultural Co-operative Marketing Federation (NAFED). Useful websites, 2013.
http://www.nafed-india.com/hindi/useful-websites.aspNational Dairy Development Board. Website. http://www.nddb.org/Reserve Bank of India. Minimum support price for non-foodgrains according to crop year,
September 16, 2013. http://www.rbi.org.in/scripts/PublicationsView.aspx?id=15147Reserve Bank of India. Public distribution system—Procurement, off-take and stocks,
September 16, 2013. http://www.rbi.org.in/scripts/PublicationsView.aspx?id=15148Tea Board of India. Website, 2013. http://www.teaboard.gov.inWorld Trade Organization (WTO). Website 2013. http://www.wto.org
351
Case 1 Bayer CropScience: Science for a Better Supply Chain
September 14, 2005
Jadcherla, Andhra Pradesh
Suresh Babu, Territory Manager for Jadcherla, was a worried person. Standing in the middle of a cotton field, he could clearly see the telltale signs of an extensive boll-worm attack. This was the second year that farmers in Andhra Pradesh had planted BT cotton, supposedly resistant to bollworm attacks. Acreage under BT cotton had increased substantially since last year. Owing to premium pricing, a major section of farmers had opted for BT cotton seeds from illegal third-party sources. The qual-ity of these seeds was always under doubt. Suresh Babu had taken a big risk by giv-ing a sales plan of Spintor that matched last year’s sales volume. Spintor was highly effective in controlling the bollworm pest and was a premium brand in the market. The big risk taken seemed to be turning in his favour a few days ago as bollworm attacks were reported to be at the same level as last year. Yet, Suresh could not believe his bad luck. A few feet away, the farmer was filling up the spraying machine with a mix of water and a cola-based soft drink. A rumour had spread through the district that cola-based soft drinks were particularly effective in resisting bollworm attacks. Within a few days, cola-based beverages were selling at a premium in the market. This meant that Spintor sales would not be anywhere near the quantities that Suresh had stocked at dealers and distributors.
352 ◾ Agribusiness Supply Chain Management
Kaithal, Haryana
Sampat Singh, Regional Manager, had just finished calling the Logistics and Distribution Department (LDD) of Bayer CropScience at the Mumbai head-quarters. He felt a growing anxiety as he recalled the day’s events. Earlier in the day he had talked to major dealers offering them a 10 per cent discount if they lifted a specified quantity of Sherpa Alpha. Sherpa Alpha was a generic product sold in a highly competitive market. By offering this discount, Singh was sure about capturing at least 25 per cent of the market. He had planned his moves well in advance. The discounts were announced only Wednesday morning and he planned to deliver the quantities by next Monday. This way the competitors would not have enough time to react even if they came to know of the develop-ment through the grapevine. As an experienced sales manager, he knew that speed of execution was a prime factor in the success of such moves. It was abso-lutely essential that the shelf space at dealers be blocked before others could do so. The amount of Sherpa Alpha lying in the godowns was not enough to meet the huge demand. Realizing this, Singh had already been in touch with LDD and arrangements had been made to divert excess stock from nearby regions. Arrangement had also been made with the plant in Chandigarh to produce the excess requirement on a war footing. LDD was reasonably sure that all demand could be met by Monday morning. “All’s well that ends well,” thought Sampat Singh as he uttered a silent prayer.
BackgroundBayer CropScience Limited was a leading firm in the fields of crop protection, non-agricultural pest control, seeds, and plant biotechnology. For the year ended December 2004, its annual turnover of `7865 million constituted a major portion of the annual turnover of `19816 million of the Bayer group in India. (Table A1.1 provides details about different Bayer group companies in India.) Bayer CropScience had a market share of 20.2 per cent in 2004, down from 22.8 per cent in the previous year. Its main competitors were established players like Syngenta, Dow Chemicals, Du Pont, Monsanto, and Rallis.
The firm converted six zonal sales offices into four zonal profit centres in a recent restructuring exercise. The objective was to inculcate a spirit of entrepreneur-ship through a decentralized structure, empowerment, and accountability. (The organization structure is shown in Figure A1.1.) The general managers at the zonal level enjoyed substantial decision making powers and had complete responsibility over all zonal functions. At the zonal level, the distribution and finance functions reported to the general manager with dotted relationship reporting to the head office (Figure A1.2).
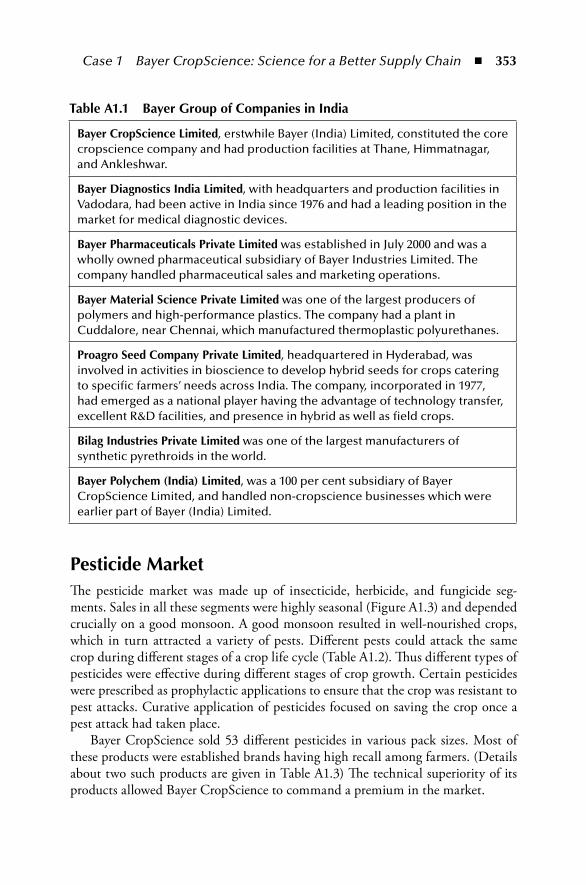
Case 1 Bayer CropScience: Science for a Better Supply Chain ◾ 353
pesticide marketThe pesticide market was made up of insecticide, herbicide, and fungicide seg-ments. Sales in all these segments were highly seasonal (Figure A1.3) and depended crucially on a good monsoon. A good monsoon resulted in well-nourished crops, which in turn attracted a variety of pests. Different pests could attack the same crop during different stages of a crop life cycle (Table A1.2). Thus different types of pesticides were effective during different stages of crop growth. Certain pesticides were prescribed as prophylactic applications to ensure that the crop was resistant to pest attacks. Curative application of pesticides focused on saving the crop once a pest attack had taken place.
Bayer CropScience sold 53 different pesticides in various pack sizes. Most of these products were established brands having high recall among farmers. (Details about two such products are given in Table A1.3) The technical superiority of its products allowed Bayer CropScience to command a premium in the market.
table A1.1 Bayer Group of Companies in india
Bayer CropScience Limited, erstwhile Bayer (India) Limited, constituted the core cropscience company and had production facilities at Thane, Himmatnagar, and Ankleshwar.
Bayer Diagnostics india Limited, with headquarters and production facilities in Vadodara, had been active in India since 1976 and had a leading position in the market for medical diagnostic devices.
Bayer pharmaceuticals private Limited was established in July 2000 and was a wholly owned pharmaceutical subsidiary of Bayer Industries Limited. The company handled pharmaceutical sales and marketing operations.
Bayer material Science private Limited was one of the largest producers of polymers and high-performance plastics. The company had a plant in Cuddalore, near Chennai, which manufactured thermoplastic polyurethanes.
proagro Seed Company private Limited, headquartered in Hyderabad, was involved in activities in bioscience to develop hybrid seeds for crops catering to specific farmers’ needs across India. The company, incorporated in 1977, had emerged as a national player having the advantage of technology transfer, excellent R&D facilities, and presence in hybrid as well as field crops.
Bilag industries private Limited was one of the largest manufacturers of synthetic pyrethroids in the world.
Bayer polychem (india) Limited, was a 100 per cent subsidiary of Bayer CropScience Limited, and handled non-cropscience businesses which were earlier part of Bayer (India) Limited.
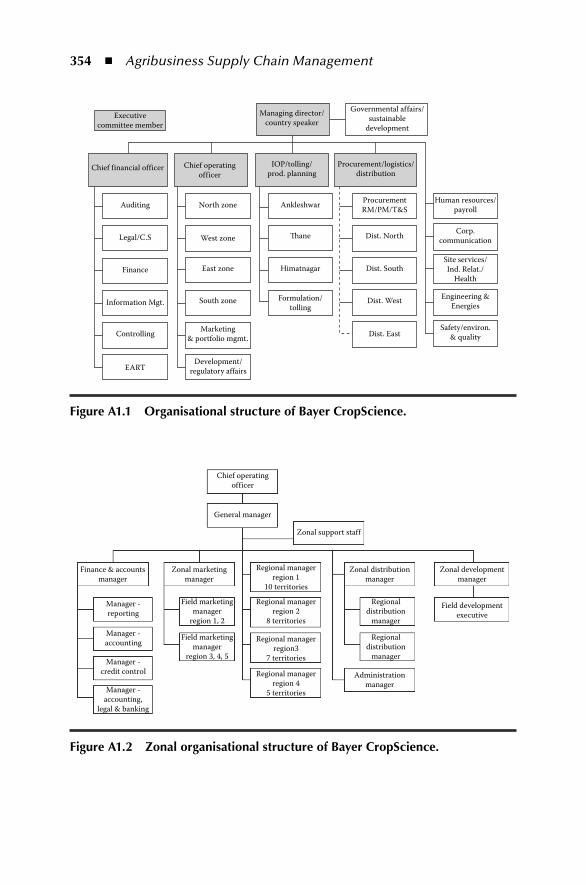
354 ◾ Agribusiness Supply Chain Management
Executivecommittee member
Managing director/country speaker
IOP/tolling/prod. planning
Procurement/logistics/distribution
Governmental af fairs/sustainable
development
Chief f inancial of f icer
Legal/C.S
Finance
Information Mgt. South zone
Marketing& portfolio mgmt.
Development/regulatory af fairs
Controlling
EART
East zone Himatnagar
Formulation/tolling
Dist. South
Dist. West
Dist. East
Site services/Ind. Relat./
Health
Engineering &Energies
Safety/environ.& quality
West zone �ane Dist. North
North zone Ankleshwar ProcurementRM/PM/T&S
Human resources/payroll
Corp.communication
Chief operatingof f icer
Auditing
Figure A1.1 organisational structure of Bayer CropScience.
Chief operatingof f icer
General manager
Finance & accountsmanager
Manager -reporting
Manager -accounting
Manager -credit control
Manager -accounting,
legal & banking
Zonal marketingmanager
Field marketingmanager
region 1, 2
Field marketingmanager
region 3, 4, 5
Regional managerregion 1
10 territories
Regional managerregion3
7 territories
Regional managerregion 2
8 territories
Regional managerregion 4
5 territories
Zonal distributionmanager
Regionaldistribution
manager
Regionaldistribution
manager
Administrationmanager
Zonal developmentmanager
Field developmentexecutive
Zonal support staf f
Figure A1.2 Zonal organisational structure of Bayer CropScience.
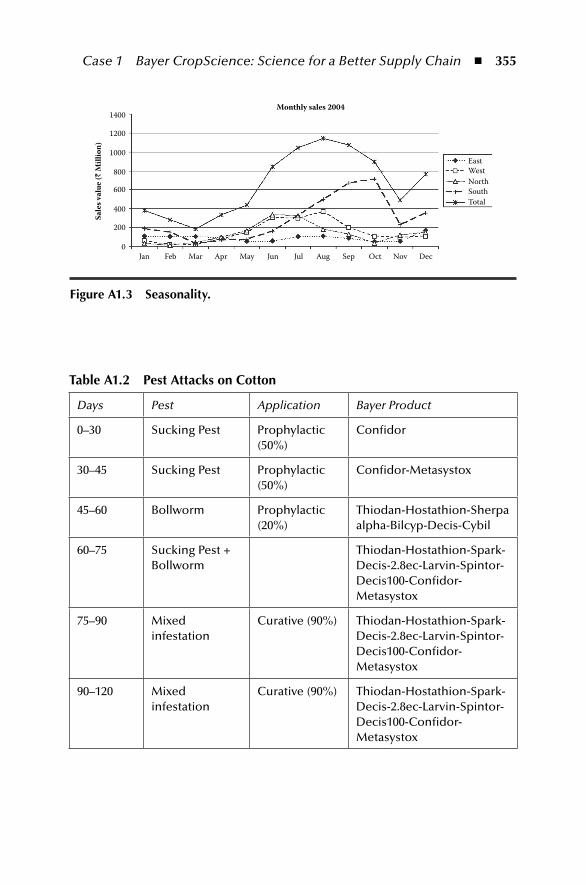
Case 1 Bayer CropScience: Science for a Better Supply Chain ◾ 355
table A1.2 pest Attacks on Cotton
Days Pest Application Bayer Product
0–30 Sucking Pest Prophylactic (50%)
Confidor
30–45 Sucking Pest Prophylactic (50%)
Confidor-Metasystox
45–60 Bollworm Prophylactic (20%)
Thiodan-Hostathion-Sherpa alpha-Bilcyp-Decis-Cybil
60–75 Sucking Pest + Bollworm
Thiodan-Hostathion-Spark-Decis-2.8ec-Larvin-Spintor-Decis100-Confidor-Metasystox
75–90 Mixed infestation
Curative (90%) Thiodan-Hostathion-Spark-Decis-2.8ec-Larvin-Spintor-Decis100-Confidor-Metasystox
90–120 Mixed infestation
Curative (90%) Thiodan-Hostathion-Spark-Decis-2.8ec-Larvin-Spintor-Decis100-Confidor-Metasystox
1400Monthly sales 2004
EastWestNorthSouthTotal
Sale
s val
ue (`
Mill
ion)
1200
1000
800
600
400
200
0Jan Feb Mar Apr May Jun Jul Aug Sep Oct Nov Dec
Figure A1.3 Seasonality.
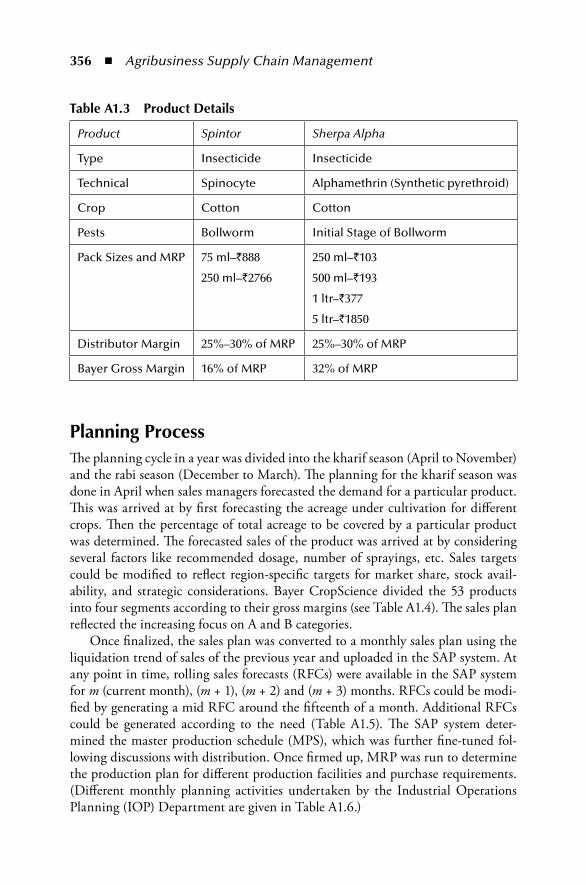
356 ◾ Agribusiness Supply Chain Management
planning processThe planning cycle in a year was divided into the kharif season (April to November) and the rabi season (December to March). The planning for the kharif season was done in April when sales managers forecasted the demand for a particular product. This was arrived at by first forecasting the acreage under cultivation for different crops. Then the percentage of total acreage to be covered by a particular product was determined. The forecasted sales of the product was arrived at by considering several factors like recommended dosage, number of sprayings, etc. Sales targets could be modified to reflect region-specific targets for market share, stock avail-ability, and strategic considerations. Bayer CropScience divided the 53 products into four segments according to their gross margins (see Table A1.4). The sales plan reflected the increasing focus on A and B categories.
Once finalized, the sales plan was converted to a monthly sales plan using the liquidation trend of sales of the previous year and uploaded in the SAP system. At any point in time, rolling sales forecasts (RFCs) were available in the SAP system for m (current month), (m + 1), (m + 2) and (m + 3) months. RFCs could be modi-fied by generating a mid RFC around the fifteenth of a month. Additional RFCs could be generated according to the need (Table A1.5). The SAP system deter-mined the master production schedule (MPS), which was further fine-tuned fol-lowing discussions with distribution. Once firmed up, MRP was run to determine the production plan for different production facilities and purchase requirements. (Different monthly planning activities undertaken by the Industrial Operations Planning (IOP) Department are given in Table A1.6.)
table A1.3 product Details
Product Spintor Sherpa Alpha
Type Insecticide Insecticide
Technical Spinocyte Alphamethrin (Synthetic pyrethroid)
Crop Cotton Cotton
Pests Bollworm Initial Stage of Bollworm
Pack Sizes and MRP 75 ml–`888
250 ml–`2766
250 ml–`103
500 ml–`193
1 ltr–`377
5 ltr–`1850
Distributor Margin 25%–30% of MRP 25%–30% of MRP
Bayer Gross Margin 16% of MRP 32% of MRP
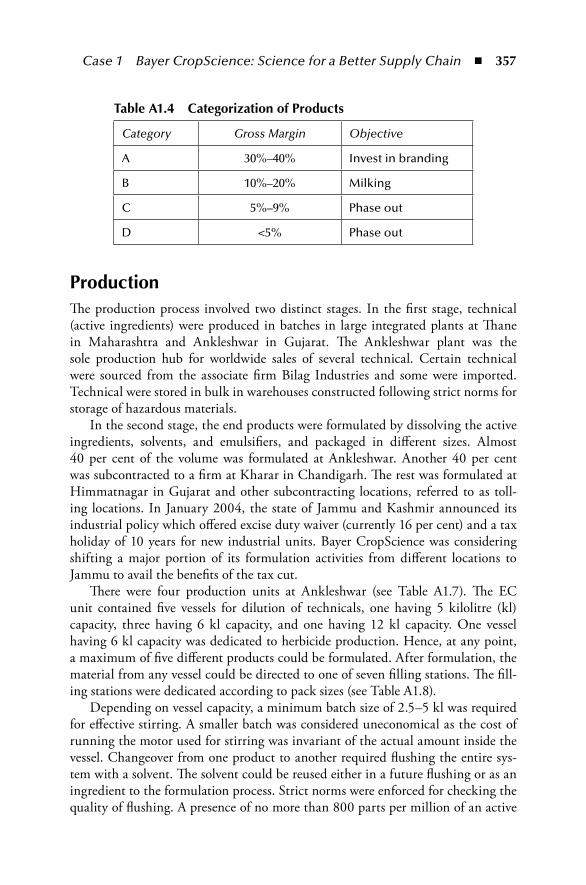
Case 1 Bayer CropScience: Science for a Better Supply Chain ◾ 357
productionThe production process involved two distinct stages. In the first stage, technical (active ingredients) were produced in batches in large integrated plants at Thane in Maharashtra and Ankleshwar in Gujarat. The Ankleshwar plant was the sole production hub for worldwide sales of several technical. Certain technical were sourced from the associate firm Bilag Industries and some were imported. Technical were stored in bulk in warehouses constructed following strict norms for storage of hazardous materials.
In the second stage, the end products were formulated by dissolving the active ingredients, solvents, and emulsifiers, and packaged in different sizes. Almost 40 per cent of the volume was formulated at Ankleshwar. Another 40 per cent was subcontracted to a firm at Kharar in Chandigarh. The rest was formulated at Himmatnagar in Gujarat and other subcontracting locations, referred to as toll-ing locations. In January 2004, the state of Jammu and Kashmir announced its industrial policy which offered excise duty waiver (currently 16 per cent) and a tax holiday of 10 years for new industrial units. Bayer CropScience was considering shifting a major portion of its formulation activities from different locations to Jammu to avail the benefits of the tax cut.
There were four production units at Ankleshwar (see Table A1.7). The EC unit contained five vessels for dilution of technicals, one having 5 kilolitre (kl) capacity, three having 6 kl capacity, and one having 12 kl capacity. One vessel having 6 kl capacity was dedicated to herbicide production. Hence, at any point, a maximum of five different products could be formulated. After formulation, the material from any vessel could be directed to one of seven filling stations. The fill-ing stations were dedicated according to pack sizes (see Table A1.8).
Depending on vessel capacity, a minimum batch size of 2.5–5 kl was required for effective stirring. A smaller batch was considered uneconomical as the cost of running the motor used for stirring was invariant of the actual amount inside the vessel. Changeover from one product to another required flushing the entire sys-tem with a solvent. The solvent could be reused either in a future flushing or as an ingredient to the formulation process. Strict norms were enforced for checking the quality of flushing. A presence of no more than 800 parts per million of an active
table A1.4 Categorization of products
Category Gross Margin Objective
A 30%–40% Invest in branding
B 10%–20% Milking
C 5%–9% Phase out
D <5% Phase out
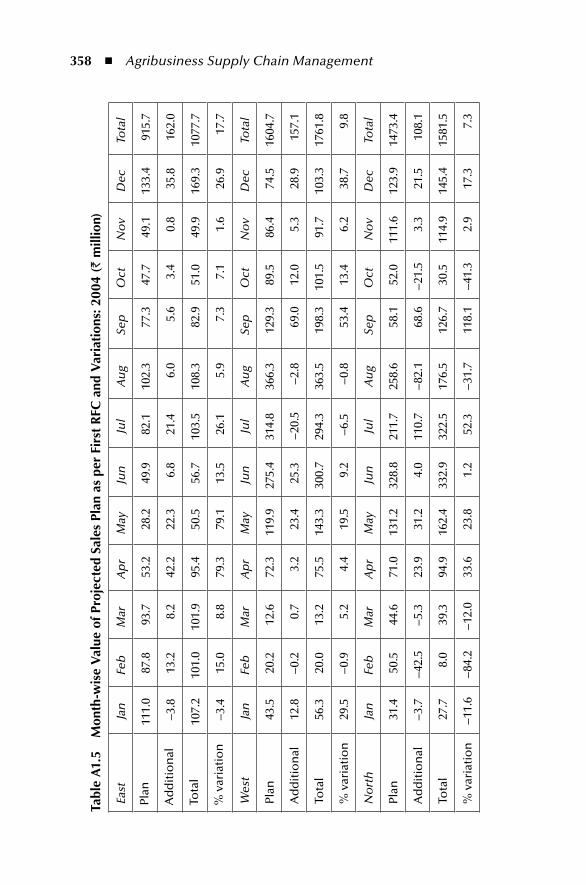
358 ◾ Agribusiness Supply Chain Management
tabl
e A
1.5
mon
th-w
ise
Val
ue o
f pro
ject
ed S
ales
pla
n as
per
Fir
st r
FC a
nd V
aria
tion
s: 2
004
(` m
illio
n)
East
Jan
Feb
Mar
Ap
rM
ayJu
nJu
lA
ug
Sep
Oct
No
vD
ecTo
tal
Plan
111.
087
.893
.753
.228
.249
.982
.110
2.3
77.3
47.7
49.1
133.
491
5.7
Ad
dit
ion
al−3
.813
.28.
242
.222
.36.
821
.46.
05.
63.
40.
835
.816
2.0
Tota
l10
7.2
101.
010
1.9
95.4
50.5
56.7
103.
510
8.3
82.9
51.0
49.9
169.
310
77.7
% v
aria
tio
n−3
.415
.08.
879
.379
.113
.526
.15.
97.
37.
11.
626
.917
.7
Wes
tJa
n
Feb
Mar
Ap
rM
ayJu
nJu
lA
ug
Sep
Oct
No
vD
ecTo
tal
Plan
43.5
20.2
12.6
72.3
119.
927
5.4
314.
836
6.3
129.
389
.586
.474
.516
04.7
Ad
dit
ion
al12
.8−
0.2
0.7
3.2
23.4
25.3
−20
.5−
2.8
69.0
12.0
5.3
28.9
157.
1
Tota
l56
.320
.013
.275
.514
3.3
300.
729
4.3
363.
519
8.3
101.
591
.710
3.3
1761
.8
% v
aria
tio
n29
.5−
0.9
5.2
4.4
19.5
9.2
−6.
5−
0.8
53.4
13.4
6.2
38.7
9.8
No
rth
Jan
Fe
bM
arA
pr
May
Jun
Jul
Au
gSe
pO
ctN
ov
Dec
Tota
l
Plan
31.4
50.5
44.6
71.0
131.
232
8.8
211.
725
8.6
58.1
52.0
111.
612
3.9
1473
.4
Ad
dit
ion
al−
3.7
−42
.5−
5.3
23.9
31.2
4.0
110.
7−
82.1
68.6
−21
.53.
321
.510
8.1
Tota
l27
.78.
039
.394
.916
2.4
332.
932
2.5
176.
512
6.7
30.5
114.
914
5.4
1581
.5
% v
aria
tio
n−
11.6
−84
.2−
12.0
33.6
23.8
1.2
52.3
−31
.711
8.1
−41
.32.
917
.37.
3
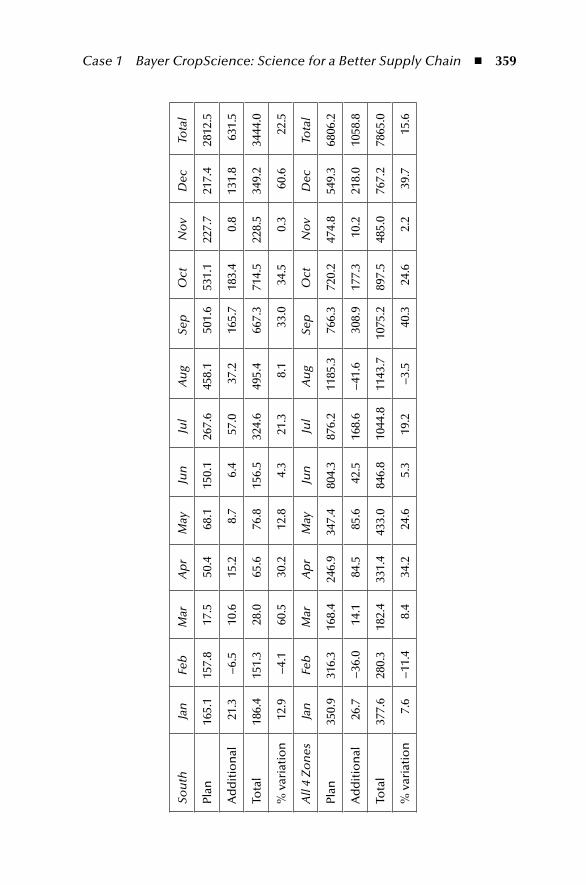
Case 1 Bayer CropScience: Science for a Better Supply Chain ◾ 359
Sou
thJa
n
Feb
Mar
Ap
rM
ayJu
nJu
lA
ug
Sep
Oct
No
vD
ecTo
tal
Plan
165.
115
7.8
17.5
50.4
68.1
150.
126
7.6
458.
150
1.6
531.
122
7.7
217.
428
12.5
Ad
dit
ion
al21
.3−
6.5
10.6
15.2
8.7
6.4
57.0
37.2
165.
718
3.4
0.8
131.
863
1.5
Tota
l18
6.4
151.
328
.065
.676
.815
6.5
324.
649
5.4
667.
371
4.5
228.
534
9.2
3444
.0
% v
aria
tio
n12
.9−
4.1
60.5
30.2
12.8
4.3
21.3
8.1
33.0
34.5
0.3
60.6
22.5
All
4 Z
on
esJa
n
Feb
Mar
Ap
rM
ayJu
nJu
lA
ug
Sep
Oct
No
vD
ecTo
tal
Plan
350.
931
6.3
168.
424
6.9
347.
480
4.3
876.
211
85.3
766.
372
0.2
474.
854
9.3
6806
.2
Ad
dit
ion
al26
.7−
36.0
14.1
84.5
85.6
42.5
168.
6−
41.6
308.
917
7.3
10.2
218.
010
58.8
Tota
l37
7.6
280.
318
2.4
331.
443
3.0
846.
810
44.8
1143
.710
75.2
897.
548
5.0
767.
278
65.0
% v
aria
tio
n7.
6−
11.4
8.4
34.2
24.6
5.3
19.2
−3.
540
.324
.62.
239
.715
.6
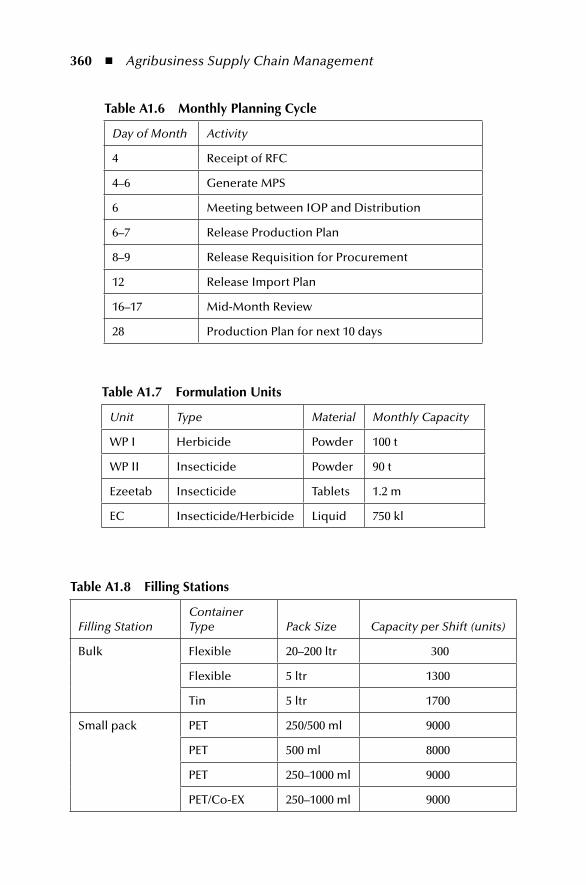
360 ◾ Agribusiness Supply Chain Management
table A1.6 monthly planning Cycle
Day of Month Activity
4 Receipt of RFC
4–6 Generate MPS
6 Meeting between IOP and Distribution
6–7 Release Production Plan
8–9 Release Requisition for Procurement
12 Release Import Plan
16–17 Mid-Month Review
28 Production Plan for next 10 days
table A1.7 Formulation units
Unit Type Material Monthly Capacity
WP I Herbicide Powder 100 t
WP II Insecticide Powder 90 t
Ezeetab Insecticide Tablets 1.2 m
EC Insecticide/Herbicide Liquid 750 kl
table A1.8 Filling Stations
Filling StationContainer Type Pack Size Capacity per Shift (units)
Bulk Flexible 20–200 ltr 300
Flexible 5 ltr 1300
Tin 5 ltr 1700
Small pack PET 250/500 ml 9000
PET 500 ml 8000
PET 250–1000 ml 9000
PET/Co-EX 250–1000 ml 9000
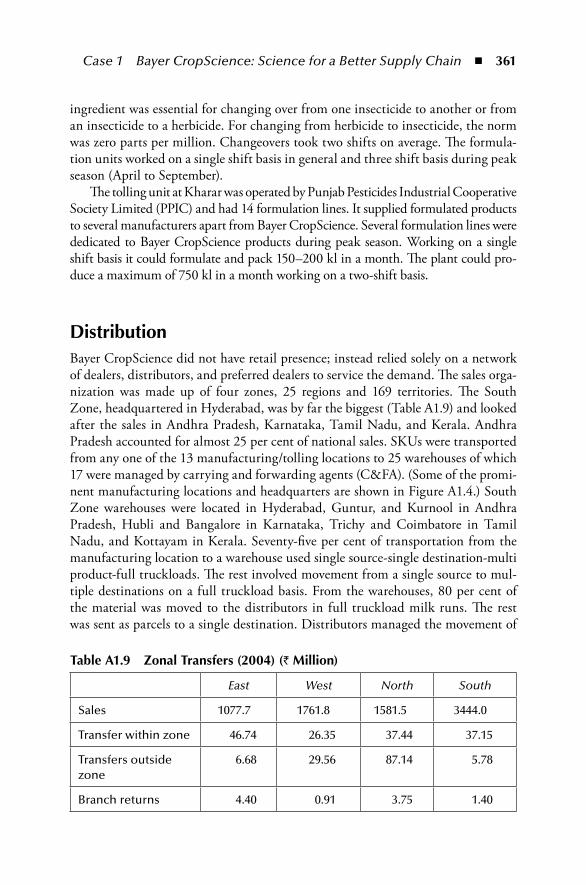
Case 1 Bayer CropScience: Science for a Better Supply Chain ◾ 361
ingredient was essential for changing over from one insecticide to another or from an insecticide to a herbicide. For changing from herbicide to insecticide, the norm was zero parts per million. Changeovers took two shifts on average. The formula-tion units worked on a single shift basis in general and three shift basis during peak season (April to September).
The tolling unit at Kharar was operated by Punjab Pesticides Industrial Cooperative Society Limited (PPIC) and had 14 formulation lines. It supplied formulated products to several manufacturers apart from Bayer CropScience. Several formulation lines were dedicated to Bayer CropScience products during peak season. Working on a single shift basis it could formulate and pack 150–200 kl in a month. The plant could pro-duce a maximum of 750 kl in a month working on a two-shift basis.
DistributionBayer CropScience did not have retail presence; instead relied solely on a network of dealers, distributors, and preferred dealers to service the demand. The sales orga-nization was made up of four zones, 25 regions and 169 territories. The South Zone, headquartered in Hyderabad, was by far the biggest (Table A1.9) and looked after the sales in Andhra Pradesh, Karnataka, Tamil Nadu, and Kerala. Andhra Pradesh accounted for almost 25 per cent of national sales. SKUs were transported from any one of the 13 manufacturing/tolling locations to 25 warehouses of which 17 were managed by carrying and forwarding agents (C&FA). (Some of the promi-nent manufacturing locations and headquarters are shown in Figure A1.4.) South Zone warehouses were located in Hyderabad, Guntur, and Kurnool in Andhra Pradesh, Hubli and Bangalore in Karnataka, Trichy and Coimbatore in Tamil Nadu, and Kottayam in Kerala. Seventy-five per cent of transportation from the manufacturing location to a warehouse used single source-single destination-multi product-full truckloads. The rest involved movement from a single source to mul-tiple destinations on a full truckload basis. From the warehouses, 80 per cent of the material was moved to the distributors in full truckload milk runs. The rest was sent as parcels to a single destination. Distributors managed the movement of
table A1.9 Zonal transfers (2004) (` million)
East West North South
Sales 1077.7 1761.8 1581.5 3444.0
Transfer within zone 46.74 26.35 37.44 37.15
Transfers outside zone
6.68 29.56 87.14 5.78
Branch returns 4.40 0.91 3.75 1.40
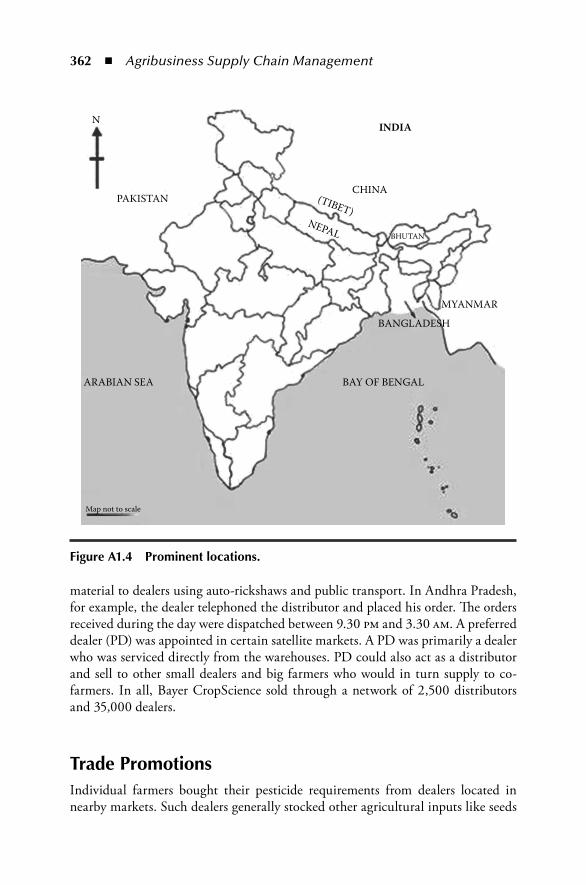
362 ◾ Agribusiness Supply Chain Management
material to dealers using auto-rickshaws and public transport. In Andhra Pradesh, for example, the dealer telephoned the distributor and placed his order. The orders received during the day were dispatched between 9.30 pm and 3.30 am. A preferred dealer (PD) was appointed in certain satellite markets. A PD was primarily a dealer who was serviced directly from the warehouses. PD could also act as a distributor and sell to other small dealers and big farmers who would in turn supply to co-farmers. In all, Bayer CropScience sold through a network of 2,500 distributors and 35,000 dealers.
trade promotionsIndividual farmers bought their pesticide requirements from dealers located in nearby markets. Such dealers generally stocked other agricultural inputs like seeds
PAKISTAN
ARABIAN SEA
Map not to scale
BAY OF BENGAL
BANGLADESH
CHINA(TIBET)
NEPAL
MYANMAR
INDIAN
BHUTAN
Figure A1.4 prominent locations.
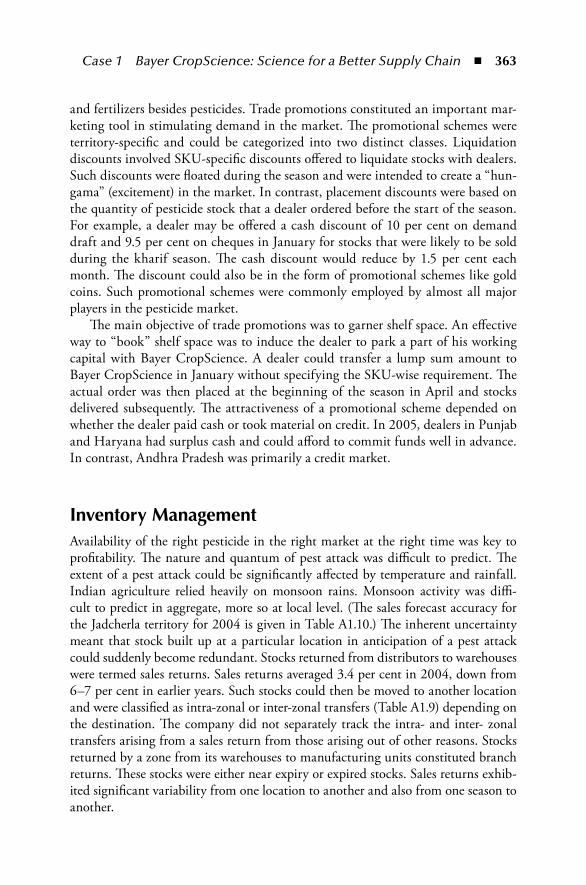
Case 1 Bayer CropScience: Science for a Better Supply Chain ◾ 363
and fertilizers besides pesticides. Trade promotions constituted an important mar-keting tool in stimulating demand in the market. The promotional schemes were territory-specific and could be categorized into two distinct classes. Liquidation discounts involved SKU-specific discounts offered to liquidate stocks with dealers. Such discounts were floated during the season and were intended to create a “hun-gama” (excitement) in the market. In contrast, placement discounts were based on the quantity of pesticide stock that a dealer ordered before the start of the season. For example, a dealer may be offered a cash discount of 10 per cent on demand draft and 9.5 per cent on cheques in January for stocks that were likely to be sold during the kharif season. The cash discount would reduce by 1.5 per cent each month. The discount could also be in the form of promotional schemes like gold coins. Such promotional schemes were commonly employed by almost all major players in the pesticide market.
The main objective of trade promotions was to garner shelf space. An effective way to “book” shelf space was to induce the dealer to park a part of his working capital with Bayer CropScience. A dealer could transfer a lump sum amount to Bayer CropScience in January without specifying the SKU-wise requirement. The actual order was then placed at the beginning of the season in April and stocks delivered subsequently. The attractiveness of a promotional scheme depended on whether the dealer paid cash or took material on credit. In 2005, dealers in Punjab and Haryana had surplus cash and could afford to commit funds well in advance. In contrast, Andhra Pradesh was primarily a credit market.
inventory managementAvailability of the right pesticide in the right market at the right time was key to profitability. The nature and quantum of pest attack was difficult to predict. The extent of a pest attack could be significantly affected by temperature and rainfall. Indian agriculture relied heavily on monsoon rains. Monsoon activity was diffi-cult to predict in aggregate, more so at local level. (The sales forecast accuracy for the Jadcherla territory for 2004 is given in Table A1.10.) The inherent uncertainty meant that stock built up at a particular location in anticipation of a pest attack could suddenly become redundant. Stocks returned from distributors to warehouses were termed sales returns. Sales returns averaged 3.4 per cent in 2004, down from 6–7 per cent in earlier years. Such stocks could then be moved to another location and were classified as intra-zonal or inter-zonal transfers (Table A1.9) depending on the destination. The company did not separately track the intra- and inter- zonal transfers arising from a sales return from those arising out of other reasons. Stocks returned by a zone from its warehouses to manufacturing units constituted branch returns. These stocks were either near expiry or expired stocks. Sales returns exhib-ited significant variability from one location to another and also from one season to another.
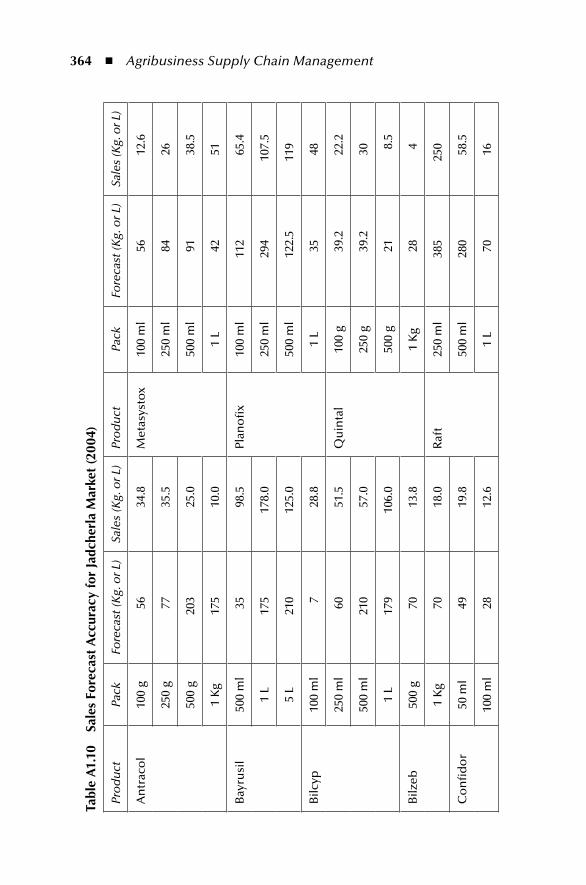
364 ◾ Agribusiness Supply Chain Management
tabl
e A
1.10
Sa
les
Fore
cast
Acc
urac
y fo
r Ja
dche
rla
mar
ket
(200
4)
Pro
du
ctPa
ckFo
reca
st (K
g. o
r L)
Sale
s (K
g. o
r L)
Pro
du
ctPa
ckFo
reca
st (K
g. o
r L)
Sale
s (K
g. o
r L)
An
trac
ol
100
g56
34.8
Met
asys
tox
100
ml
5612
.6
250
g77
35.5
250
ml
8426
500
g20
325
.050
0 m
l91
38.5
1 K
g17
510
.01
L42
51
Bay
rusi
l50
0 m
l35
98.5
Plan
ofi
x10
0 m
l11
265
.4
1 L
175
178.
025
0 m
l29
410
7.5
5 L
210
125.
050
0 m
l12
2.5
119
Bilc
yp10
0 m
l7
28.8
1 L
3548
250
ml
6051
.5Q
uin
tal
100
g39
.222
.2
500
ml
210
57.0
250
g39
.230
1 L
179
106.
050
0 g
218.
5
Bilz
eb50
0 g
7013
.81
Kg
284
1 K
g70
18.0
Raf
t25
0 m
l38
525
0
Co
nfi
do
r50
ml
4919
.850
0 m
l28
058
.5
100
ml
2812
.61
L70
16
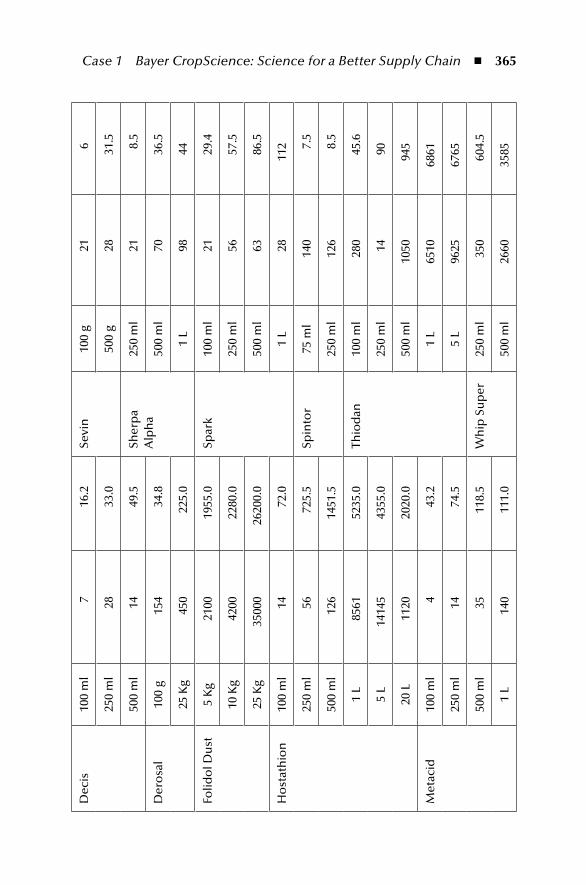
Case 1 Bayer CropScience: Science for a Better Supply Chain ◾ 365
Dec
is10
0 m
l7
16.2
Sevi
n10
0 g
216
250
ml
2833
.050
0 g
2831
.5
500
ml
1449
.5Sh
erp
a A
lph
a25
0 m
l21
8.5
Der
osa
l10
0 g
154
34.8
500
ml
7036
.5
25 K
g45
022
5.0
1 L
9844
Folid
ol D
ust
5 K
g21
0019
55.0
Spar
k10
0 m
l21
29.4
10 K
g42
0022
80.0
250
ml
5657
.5
25 K
g35
000
2620
0.0
500
ml
6386
.5
Ho
stat
hio
n10
0 m
l14
72.0
1 L
2811
2
250
ml
5672
5.5
Spin
tor
75 m
l14
07.
5
500
ml
126
1451
.525
0 m
l12
68.
5
1 L
8561
5235
.0Th
iod
an10
0 m
l28
045
.6
5 L
1414
543
55.0
250
ml
1490
20 L
1120
2020
.050
0 m
l10
5094
5
Met
acid
100
ml
443
.21
L65
1068
61
250
ml
1474
.55
L96
2567
65
500
ml
3511
8.5
Wh
ip S
up
er25
0 m
l35
060
4.5
1 L
140
111.
050
0 m
l26
6035
85
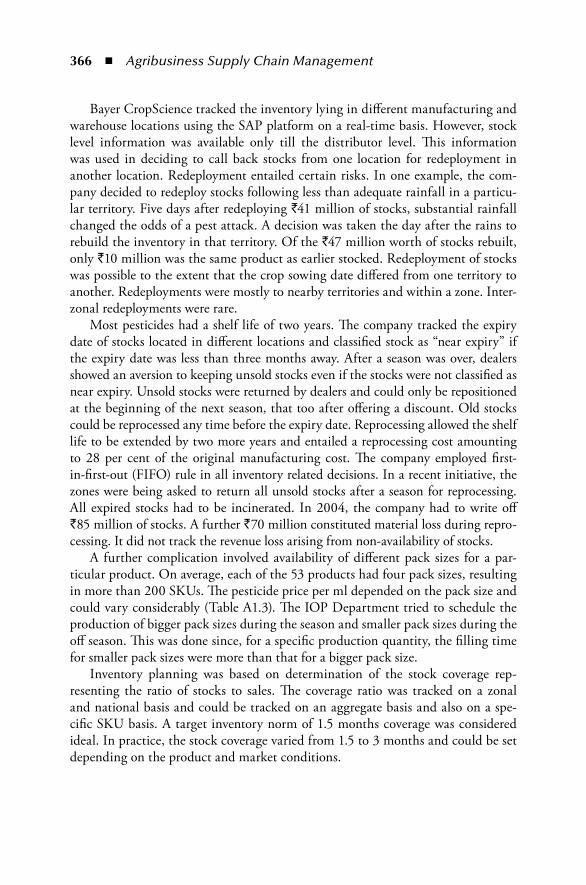
366 ◾ Agribusiness Supply Chain Management
Bayer CropScience tracked the inventory lying in different manufacturing and warehouse locations using the SAP platform on a real-time basis. However, stock level information was available only till the distributor level. This information was used in deciding to call back stocks from one location for redeployment in another location. Redeployment entailed certain risks. In one example, the com-pany decided to redeploy stocks following less than adequate rainfall in a particu-lar territory. Five days after redeploying `41 million of stocks, substantial rainfall changed the odds of a pest attack. A decision was taken the day after the rains to rebuild the inventory in that territory. Of the `47 million worth of stocks rebuilt, only `10 million was the same product as earlier stocked. Redeployment of stocks was possible to the extent that the crop sowing date differed from one territory to another. Redeployments were mostly to nearby territories and within a zone. Inter-zonal redeployments were rare.
Most pesticides had a shelf life of two years. The company tracked the expiry date of stocks located in different locations and classified stock as “near expiry” if the expiry date was less than three months away. After a season was over, dealers showed an aversion to keeping unsold stocks even if the stocks were not classified as near expiry. Unsold stocks were returned by dealers and could only be repositioned at the beginning of the next season, that too after offering a discount. Old stocks could be reprocessed any time before the expiry date. Reprocessing allowed the shelf life to be extended by two more years and entailed a reprocessing cost amounting to 28 per cent of the original manufacturing cost. The company employed first-in-first-out (FIFO) rule in all inventory related decisions. In a recent initiative, the zones were being asked to return all unsold stocks after a season for reprocessing. All expired stocks had to be incinerated. In 2004, the company had to write off `85 million of stocks. A further `70 million constituted material loss during repro-cessing. It did not track the revenue loss arising from non-availability of stocks.
A further complication involved availability of different pack sizes for a par-ticular product. On average, each of the 53 products had four pack sizes, resulting in more than 200 SKUs. The pesticide price per ml depended on the pack size and could vary considerably (Table A1.3). The IOP Department tried to schedule the production of bigger pack sizes during the season and smaller pack sizes during the off season. This was done since, for a specific production quantity, the filling time for smaller pack sizes were more than that for a bigger pack size.
Inventory planning was based on determination of the stock coverage rep-resenting the ratio of stocks to sales. The coverage ratio was tracked on a zonal and national basis and could be tracked on an aggregate basis and also on a spe-cific SKU basis. A target inventory norm of 1.5 months coverage was considered ideal. In practice, the stock coverage varied from 1.5 to 3 months and could be set depending on the product and market conditions.
Case 1 Bayer CropScience: Science for a Better Supply Chain ◾ 367
Science for a Better Supply ChainSeptember 14, 2005
Mumbai, Maharashtra
Susan D’Costa, planning executive at LDD, was updating a report on the forecast accuracy for presentation to top management. Forecast accuracy had been hotly debated in the headquarters. Earlier in the day, the report seemed to be almost com-plete when she received data regarding the sudden demand for Sherpa Alpha which was well above the sales forecast. More disturbing was the news about Spintor that came from the Hyderabad office. For a long time, D’Costa had been emphatically stating, “We need a better forecast.” She felt time had come to reinforce the need for a better forecast.
As she finished updating the forecast data, D’Costa wondered whether there were alternative forecasting techniques for the pesticide market. Could a better fore-cast be a competitive tool? Could Bayer CropScience align its supply chain to be responsive to market requirements? Such a move could actually reduce the reliance on a sales forecast. But it may need substantial changes in the manufacturing and logistics processes apart from a change in the organizational mindset. Similarly, pro-motion schemes needed to be aligned with the supply chain strategy. On her desk was a company brochure prominently displaying the mission statement adopted by Bayer worldwide: “Bayer: Science for a better life.” Perhaps the need of the hour in the Indian pesticide market was a science for a better supply chain.
AcknowledgementsWritten by Professors Saral Mukherjee and G. Raghuram.
Cases of the Indian Institute of Management, Ahmedabad, are prepared as a basis for class discussion. Cases are not designed to present illustrations of either correct or incorrect handling of administrative problems.
This case has been reproduced with permission from Indian Institute of Management, Ahmedabad. Copyright © 2007.

This page intentionally left blankThis page intentionally left blank
369
Case 2 marico: Disintermediating the Copra Supply Chain
“They have arrived!” announced the eighteen-year old son of Ranganathan as he finished giving directions on the cell phone to the two-member Marico buy-ing team. Even though the visitors were a good two kilometres away, a palpable sense of excitement filled the assembled extended family members. Ranganathan was an affluent coconut farmer-converter in the remote village of Deepalapalli in Tamil Nadu, about 90 km from Kanjikode near the border with Kerala. Apart from the coconuts from his own farm, he procured coconuts from nearby farm-ers and dried the copra in the cemented conversion yard adjacent to his house. He had been supplying copra to Marico for the last sixteen years but had made his first direct sale only three months ago. Two months ago, in February 2007, he had visited Marico’s buying office in Kozhikode and toured the coconut oil factory at Kanjikode, where he had learnt about the testing procedures for copra. During the visit he had met the buying team and invited them to visit his house. After his return, he had opened a savings bank account with ICICI Bank since it offered an Internet banking facility. A brand-new desktop computer adorned the living room. Since Ranganathan was computer illiterate, the task of tracking online account statements and copra transaction related emails using the dial-up connection fell on the eldest son. The son was much more technology savvy than his father and had already become comfortable with the process of submission of bids through SMS.
For the Marico copra buying team consisting of Sasi and Jayanth, the visit to Ranganathan’s house was an important milestone. The immediate need for the visit was to understand the special requirements of farmer-converters. For example, at noon, Jayanth had accepted the bid placed by Ranganathan and had specified the acceptance quantity as 7.5 tons while all other successful bidders were allocated
370 ◾ Agribusiness Supply Chain Management
in multiples of 10 tons. To a casual observer it might have seemed that Jayanth had discriminated against Ranganathan. In reality, the buying team made it a point to accept all reasonable bids placed by Ranganathan. Every such order was for 7.5 tons as the buying team knew that Ranganathan owned a modified tractor of 7.5 tons capacity. Other traders typically used hired trucks of 10 tons capacity.
More importantly, the visit signalled the direct sourcing of copra from farmer-converters rather than from converter-traders or middlemen. It was a significant chapter in the story of disintermediation which had started sixteen years ago with the shifting of the buying office from Mumbai to Kozhikode. What was not clear was how far the story was from its conclusion.
CompanyThe company was incorporated in 1988 as Marico Foods Ltd. and subsequently changed its name to Marico Industries Limited in 1989. By 2007, Marico was a lead-ing Indian firm in consumer products and services in the global beauty and well-ness space. It marketed well-known brands such as Parachute, Saffola, Sweekar, Hair & Care, Nihar, Shanti, Fiancee, HairCode, Silk-n-Shine, Mediker, Revive, Kaya, Sundari, Manjal, Aromatic, and Camelia. These brands and their extensions occupied leadership positions (mostly first or second) with significant market shares in coconut oil, premium refined edible oil, hair oil, post-wash hair care and conditioner, anti-lice treatment, niche fabric care, and skin care including soap categories (Table A2.1).
Marico’s branded products were marketed in Bangladesh and other SAARC countries, the Middle East, and Egypt. The overseas sales franchise of Marico’s consumer products (whether as exports from India or as local operations in a foreign country) was one of the largest among Indian companies. According to company estimates posted on the company’s website www.maricoindia.com, over 70 million consumer packs reached approximately 130 million consumers in about 23 million households every month through a widespread distribution network of more than 2.5 million outlets in India and overseas. Marico generated a turnover of about `15.6 billion (about USD 380 million) during 2006–2007. Profits were over `1 billion. The turnover and profits exhibited a compounded annual growth rate of 19 per cent during the period 2002–2003 to 2006–2007.
Coconuts, Copra, and Coconut oilIndia produced about eleven billion coconuts/year in 2005–2006, up from a little over three billion coconuts in 1950–1951. Kerala and Tamil Nadu were the major producers of coconuts, followed by Andhra Pradesh, Karnataka, and a few coastal states (Table A2.2). Coconuts were harvested most of the year, except during
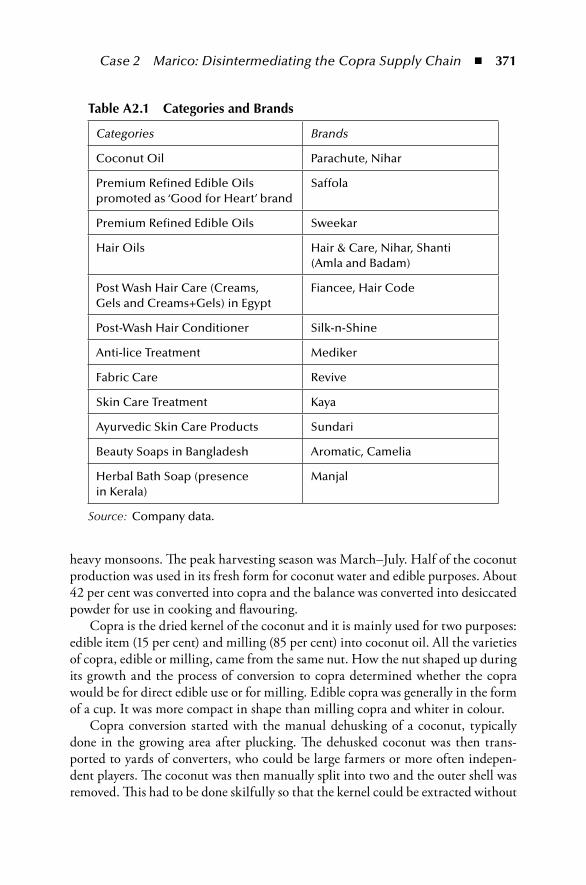
Case 2 Marico: Disintermediating the Copra Supply Chain ◾ 371
heavy monsoons. The peak harvesting season was March–July. Half of the coconut production was used in its fresh form for coconut water and edible purposes. About 42 per cent was converted into copra and the balance was converted into desiccated powder for use in cooking and flavouring.
Copra is the dried kernel of the coconut and it is mainly used for two purposes: edible item (15 per cent) and milling (85 per cent) into coconut oil. All the varieties of copra, edible or milling, came from the same nut. How the nut shaped up during its growth and the process of conversion to copra determined whether the copra would be for direct edible use or for milling. Edible copra was generally in the form of a cup. It was more compact in shape than milling copra and whiter in colour.
Copra conversion started with the manual dehusking of a coconut, typically done in the growing area after plucking. The dehusked coconut was then trans-ported to yards of converters, who could be large farmers or more often indepen-dent players. The coconut was then manually split into two and the outer shell was removed. This had to be done skilfully so that the kernel could be extracted without
table A2.1 Categories and Brands
Categories Brands
Coconut Oil Parachute, Nihar
Premium Refined Edible Oils promoted as ‘Good for Heart’ brand
Saffola
Premium Refined Edible Oils Sweekar
Hair Oils Hair & Care, Nihar, Shanti (Amla and Badam)
Post Wash Hair Care (Creams, Gels and Creams+Gels) in Egypt
Fiancee, Hair Code
Post-Wash Hair Conditioner Silk-n-Shine
Anti-lice Treatment Mediker
Fabric Care Revive
Skin Care Treatment Kaya
Ayurvedic Skin Care Products Sundari
Beauty Soaps in Bangladesh Aromatic, Camelia
Herbal Bath Soap (presence in Kerala)
Manjal
Source: Company data.
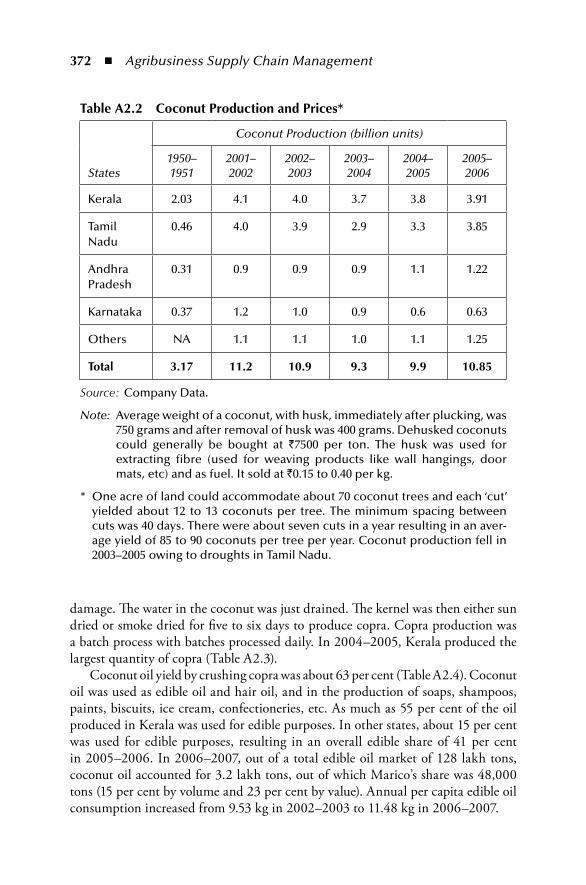
372 ◾ Agribusiness Supply Chain Management
damage. The water in the coconut was just drained. The kernel was then either sun dried or smoke dried for five to six days to produce copra. Copra production was a batch process with batches processed daily. In 2004–2005, Kerala produced the largest quantity of copra (Table A2.3).
Coconut oil yield by crushing copra was about 63 per cent (Table A2.4). Coconut oil was used as edible oil and hair oil, and in the production of soaps, shampoos, paints, biscuits, ice cream, confectioneries, etc. As much as 55 per cent of the oil produced in Kerala was used for edible purposes. In other states, about 15 per cent was used for edible purposes, resulting in an overall edible share of 41 per cent in 2005–2006. In 2006–2007, out of a total edible oil market of 128 lakh tons, coconut oil accounted for 3.2 lakh tons, out of which Marico’s share was 48,000 tons (15 per cent by volume and 23 per cent by value). Annual per capita edible oil consumption increased from 9.53 kg in 2002–2003 to 11.48 kg in 2006–2007.
table A2.2 Coconut production and prices*
States
Coconut Production (billion units)
1950–1951
2001–2002
2002–2003
2003–2004
2004–2005
2005–2006
Kerala 2.03 4.1 4.0 3.7 3.8 3.91
Tamil Nadu
0.46 4.0 3.9 2.9 3.3 3.85
Andhra Pradesh
0.31 0.9 0.9 0.9 1.1 1.22
Karnataka 0.37 1.2 1.0 0.9 0.6 0.63
Others NA 1.1 1.1 1.0 1.1 1.25
total 3.17 11.2 10.9 9.3 9.9 10.85
Source: Company Data.
Note: Average weight of a coconut, with husk, immediately after plucking, was 750 grams and after removal of husk was 400 grams. Dehusked coconuts could generally be bought at `7500 per ton. The husk was used for extracting fibre (used for weaving products like wall hangings, door mats, etc) and as fuel. It sold at `0.15 to 0.40 per kg.
* One acre of land could accommodate about 70 coconut trees and each ‘cut’ yielded about 12 to 13 coconuts per tree. The minimum spacing between cuts was 40 days. There were about seven cuts in a year resulting in an aver-age yield of 85 to 90 coconuts per tree per year. Coconut production fell in 2003–2005 owing to droughts in Tamil Nadu.
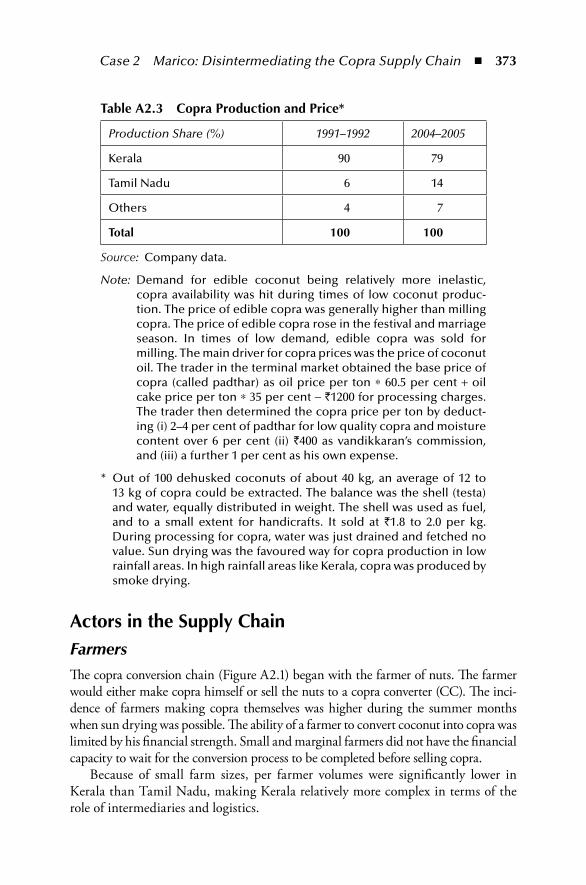
Case 2 Marico: Disintermediating the Copra Supply Chain ◾ 373
Actors in the Supply ChainFarmersThe copra conversion chain (Figure A2.1) began with the farmer of nuts. The farmer would either make copra himself or sell the nuts to a copra converter (CC). The inci-dence of farmers making copra themselves was higher during the summer months when sun drying was possible. The ability of a farmer to convert coconut into copra was limited by his financial strength. Small and marginal farmers did not have the financial capacity to wait for the conversion process to be completed before selling copra.
Because of small farm sizes, per farmer volumes were significantly lower in Kerala than Tamil Nadu, making Kerala relatively more complex in terms of the role of intermediaries and logistics.
table A2.3 Copra production and price*
Production Share (%) 1991–1992 2004–2005
Kerala 90 79
Tamil Nadu 6 14
Others 4 7
total 100 100
Source: Company data.
Note: Demand for edible coconut being relatively more inelastic, copra availability was hit during times of low coconut produc-tion. The price of edible copra was generally higher than milling copra. The price of edible copra rose in the festival and marriage season. In times of low demand, edible copra was sold for milling. The main driver for copra prices was the price of coconut oil. The trader in the terminal market obtained the base price of copra (called padthar) as oil price per ton ∗ 60.5 per cent + oil cake price per ton ∗ 35 per cent − `1200 for processing charges. The trader then determined the copra price per ton by deduct-ing (i) 2–4 per cent of padthar for low quality copra and moisture content over 6 per cent (ii) `400 as vandikkaran’s commission, and (iii) a further 1 per cent as his own expense.
* Out of 100 dehusked coconuts of about 40 kg, an average of 12 to 13 kg of copra could be extracted. The balance was the shell (testa) and water, equally distributed in weight. The shell was used as fuel, and to a small extent for handicrafts. It sold at `1.8 to 2.0 per kg. During processing for copra, water was just drained and fetched no value. Sun drying was the favoured way for copra production in low rainfall areas. In high rainfall areas like Kerala, copra was produced by smoke drying.
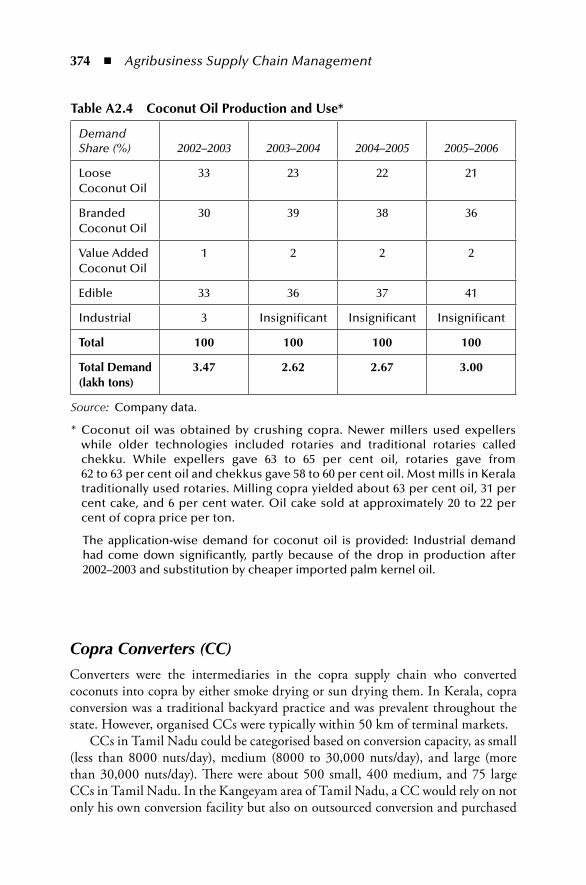
374 ◾ Agribusiness Supply Chain Management
Copra Converters (CC)Converters were the intermediaries in the copra supply chain who converted coconuts into copra by either smoke drying or sun drying them. In Kerala, copra conversion was a traditional backyard practice and was prevalent throughout the state. However, organised CCs were typically within 50 km of terminal markets.
CCs in Tamil Nadu could be categorised based on conversion capacity, as small (less than 8000 nuts/day), medium (8000 to 30,000 nuts/day), and large (more than 30,000 nuts/day). There were about 500 small, 400 medium, and 75 large CCs in Tamil Nadu. In the Kangeyam area of Tamil Nadu, a CC would rely on not only his own conversion facility but also on outsourced conversion and purchased
table A2.4 Coconut oil production and use*
Demand Share (%) 2002–2003 2003–2004 2004–2005 2005–2006
Loose Coconut Oil
33 23 22 21
Branded Coconut Oil
30 39 38 36
Value Added Coconut Oil
1 2 2 2
Edible 33 36 37 41
Industrial 3 Insignificant Insignificant Insignificant
total 100 100 100 100
total Demand (lakh tons)
3.47 2.62 2.67 3.00
Source: Company data.
* Coconut oil was obtained by crushing copra. Newer millers used expellers while older technologies included rotaries and traditional rotaries called chekku. While expellers gave 63 to 65 per cent oil, rotaries gave from 62 to 63 per cent oil and chekkus gave 58 to 60 per cent oil. Most mills in Kerala traditionally used rotaries. Milling copra yielded about 63 per cent oil, 31 per cent cake, and 6 per cent water. Oil cake sold at approximately 20 to 22 per cent of copra price per ton.
The application-wise demand for coconut oil is provided: Industrial demand had come down significantly, partly because of the drop in production after 2002–2003 and substitution by cheaper imported palm kernel oil.
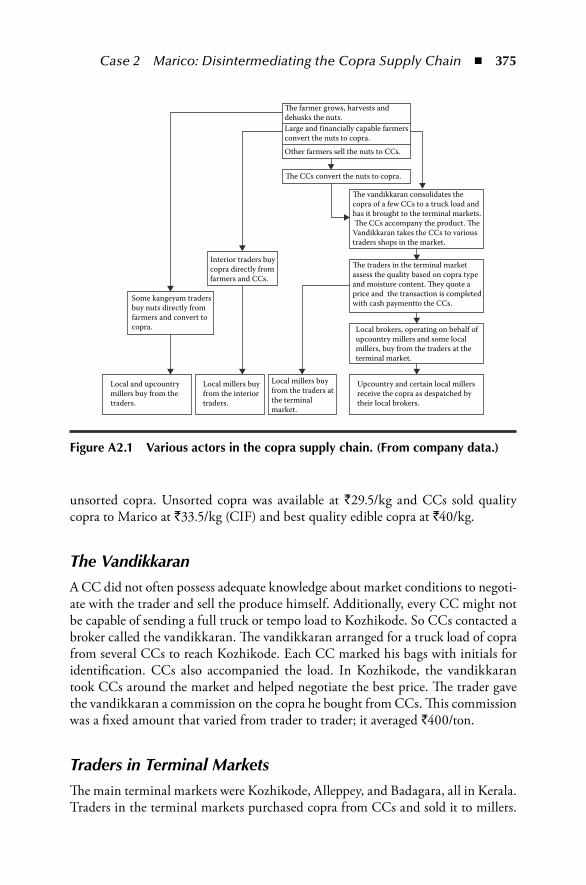
Case 2 Marico: Disintermediating the Copra Supply Chain ◾ 375
unsorted copra. Unsorted copra was available at `29.5/kg and CCs sold quality copra to Marico at `33.5/kg (CIF) and best quality edible copra at `40/kg.
The VandikkaranA CC did not often possess adequate knowledge about market conditions to negoti-ate with the trader and sell the produce himself. Additionally, every CC might not be capable of sending a full truck or tempo load to Kozhikode. So CCs contacted a broker called the vandikkaran. The vandikkaran arranged for a truck load of copra from several CCs to reach Kozhikode. Each CC marked his bags with initials for identification. CCs also accompanied the load. In Kozhikode, the vandikkaran took CCs around the market and helped negotiate the best price. The trader gave the vandikkaran a commission on the copra he bought from CCs. This commission was a fixed amount that varied from trader to trader; it averaged `400/ton.
Traders in Terminal MarketsThe main terminal markets were Kozhikode, Alleppey, and Badagara, all in Kerala. Traders in the terminal markets purchased copra from CCs and sold it to millers.
�e farmer grows, harvests anddehusks the nuts.Large and f inancially capable farmersconvert the nuts to copra.
Other farmers sell the nuts to CCs.
�e CCs convert the nuts to copra.
�e traders in the terminal market assess the quality based on copra type and moisture content. �ey quote a price and the transaction is completed with cash paymentto the CCs.
�e vandikkaran consolidates the copra of a few CCs to a truck load and has it brought to the terminal markets. �e CCs accompany the product. �eVandikkaran takes the CCs to various traders shops in the market.
Interior traders buycopra directly fromfarmers and CCs.
Local brokers, operating on behalf of upcountry millers and some local millers, buy from the traders at the terminal market.
Some kangeyam tradersbuy nuts directly fromfarmers and convert to copra.
Local and upcountrymillers buy from the traders.
Local millers buyfrom the interiortraders.
Local millers buyfrom the traders atthe terminalmarket.
Upcountry and certain local millers receive the copra as despatched by their local brokers.
Figure A2.1 Various actors in the copra supply chain. (From company data.)
376 ◾ Agribusiness Supply Chain Management
They also bought copra on a speculative basis if they saw demand rising in the near future. The ability to invest in the trade varied from trader to trader.
Terminal markets witnessed a lot of activity in the morning when the copra arrived. When the vandikkaran or CC approached a trader, he would put the copra in a rope bag for visual inspection followed by a moisture check. He would also ascertain the proportion of edible, milling, and inferior quality copra in the lot. Before sup-plying to a miller, the trader performed several operations such as fumigation, dry-ing, and sorting copra to meet the miller’s requirement. Sorting was done by worker unions and typically cost `100/ton for milling copra. The trader could either employ his own employees or use the services of a labour union called kamali to carry out activities such as filling the ready copra into sacks, stitching and marking of sacks, drying, weighing, and loading of copra. Stacking of bags in the truck was performed by another union called Atti. In all, the trader paid ̀ 500/ton for the different activities including rent for the drying yard. Gunny bags cost a further `300/ton.
Local BrokersMany millers in the upcountry coconut oil markets did not have a buying office in terminal markets. These millers contacted brokers in terminal markets to buy copra for them. Even local millers availed of the services of the brokers. A commission of `5/50 kg bag of copra was paid by the seller.
Interior TradersInterior traders were local traders of copra. They did not operate in the terminal market. They invested money in buying copra from local farmers and CCs and sup-plied to the local millers. They were not concentrated in one place like traders in a terminal market and hence their volumes tended to be higher.
Converter TradersA recent trend in Tamil Nadu was direct sourcing of nuts by some of the trad-ers from the Pollachi, Udamalpet, and Karnataka areas. They then converted the nuts to copra and sold it to both local and upcountry millers. This was aided by the low labour cost of conversion. The share of direct sourcing in the Kangeyam area increased from 12 per cent in 2001–2002 to 40 per cent in 2006–2007, with some volatility in the intervening years. In fact, during the 2004–2005 droughts in Tamil Nadu, this share was nonexistent.
MillersLocal millers in Kerala bought copra from local farmers, CCs in the terminal mar-ket, and interior traders. A small miller depended on gate buying (buying the copra
Case 2 Marico: Disintermediating the Copra Supply Chain ◾ 377
that came to his gate). A bigger miller would buy from the terminal markets and interior traders apart from some gate buying.
Local millers in Tamil Nadu bought copra from Kangeyam and Pollachi. Both Kangeyam and Pollachi did not have an organised market. The dealings were with traders, either directly or through brokers.
Upcountry millers bought copra from the terminal markets and/or larger trad-ers either directly or through brokers. Marico was one of the few upcountry buyers which had a big presence in the interior markets.
Markets for Coconut OilLocal demand for coconut oil in Kerala was satisfied by local millers spread all across the state. Demand in Tamil Nadu was primarily met by millers in the Kangeyam area. There existed small local brands in these markets.
Upcountry demand for coconut oil was mainly met by branded oil makers like Marico, Shalimar, Hindustan Unilever, Dabur, etc. In certain pockets such as Akola, Jalgaon, Kolkata, etc., there existed local millers. Oil traders in various parts of the country also met coconut oil demand by purchasing oil from the main oil trading centres in Kerala and Tamil Nadu.
Industrial demand for coconut oil was met by brokers in Cochin, Thrissur, and Kangeyam.
The main market for coconut oil was the oil exchange in Cochin organised by the Cochin Oil Millers Association (COMA). Trade at this exchange took place only through registered brokers. Even though the volume of trade in this exchange was about 5 per cent of the total coconut oil demand of India, prices set in this exchange acted as the benchmark.
Futures MarketCopra and coconut oil prices at the terminal markets exhibited significant volatility (Table A2.5). The futures market provided a mechanism to hedge against this vola-tility. Futures trading in coconut oil was possible on (i) the First Commodities Exchange of India (FCEI) from October 2001, (ii) the National Multi-Commodity Exchange of India (NMCE) from 2006, and (iii) the Multi Commodity Exchange of India (MCX) from 2006. While copra futures had been traded intermittently on FCEI and NMCE, in recent times none of the exchanges hosted copra futures transactions. Coconut oil was relatively more amenable to futures trade than copra as it was much easier to set standards and enforce quality for coconut oil.
On FCEI, one of the more successful coconut oil futures exchanges, monthly futures for the four subsequent months were open for trading on any given trading day. Trading was organised through an online platform. Each unit of trade was for two tons of coconut oil. At any point in time, the maximum open position for an operator was restricted to 200 units. The volume of trade on FCEI had grown from 2344 tons
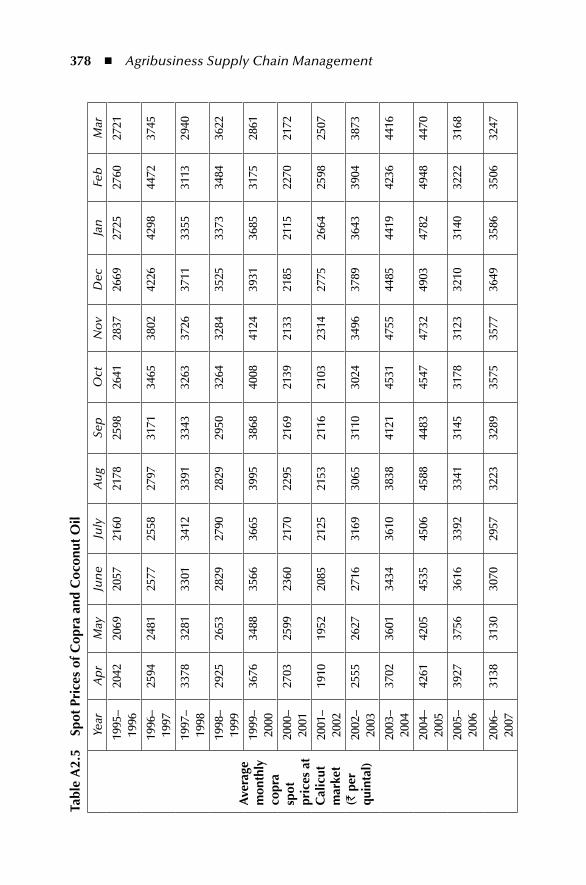
378 ◾ Agribusiness Supply Chain Management
tabl
e A
2.5
Spot
pri
ces
of C
opra
and
Coc
onut
oil
Ave
rage
m
onth
ly
copr
a sp
ot
pric
es a
t C
alic
ut
mar
ket
(` p
er
quin
tal)
Year
Ap
rM
ayJu
ne
July
Au
gSe
pO
ctN
ov
Dec
Jan
Feb
Mar
1995
–19
9620
4220
6920
5721
6021
7825
9826
4128
3726
6927
2527
6027
21
1996
–19
9725
9424
8125
7725
5827
9731
7134
6538
0242
2642
9844
7237
45
1997
–19
9833
7832
8133
0134
1233
9133
4332
6337
2637
1133
5531
1329
40
1998
–19
9929
2526
5328
2927
9028
2929
5032
6432
8435
2533
7334
8436
22
1999
–20
0036
7634
8835
6636
6539
9538
6840
0841
2439
3136
8531
7528
61
2000
–20
0127
0325
9923
6021
7022
9521
6921
3921
3321
8521
1522
7021
72
2001
–20
0219
1019
5220
8521
2521
5321
1621
0323
1427
7526
6425
9825
07
2002
–20
0325
5526
2727
1631
6930
6531
1030
2434
9637
8936
4339
0438
73
2003
–20
0437
0236
0134
3436
1038
3841
2145
3147
5544
8544
1942
3644
16
2004
–20
0542
6142
0545
3545
0645
8844
8345
4747
3249
0347
8249
4844
70
2005
–20
0639
2737
5636
1633
9233
4131
4531
7831
2332
1031
4032
2231
68
2006
–20
0731
3831
3030
7029
5732
2332
8935
7535
7736
4935
8635
0632
47
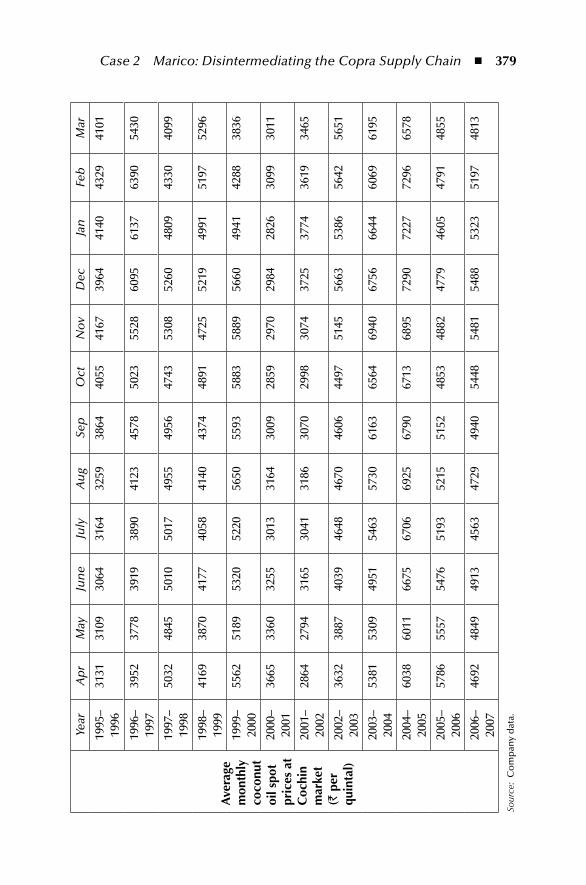
Case 2 Marico: Disintermediating the Copra Supply Chain ◾ 379
Ave
rage
m
onth
ly
coco
nut
oil s
pot
pric
es a
t C
ochi
n m
arke
t (`
per
qu
inta
l)
Year
Ap
rM
ayJu
ne
July
Au
gSe
pO
ctN
ov
Dec
Jan
Feb
Mar
1995
–19
9631
3131
0930
6431
6432
5938
6440
5541
6739
6441
4043
2941
01
1996
–19
9739
5237
7839
1938
9041
2345
7850
2355
2860
9561
3763
9054
30
1997
–19
9850
3248
4550
1050
1749
5549
5647
4353
0852
6048
0943
3040
99
1998
–19
9941
6938
7041
7740
5841
4043
7448
9147
2552
1949
9151
9752
96
1999
–20
0055
6251
8953
2052
2056
5055
9358
8358
8956
6049
4142
8838
36
2000
–20
0136
6533
6032
5530
1331
6430
0928
5929
7029
8428
2630
9930
11
2001
–20
0228
6427
9431
6530
4131
8630
7029
9830
7437
2537
7436
1934
65
2002
–20
0336
3238
8740
3946
4846
7046
0644
9751
4556
6353
8656
4256
51
2003
–20
0453
8153
0949
5154
6357
3061
6365
6469
4067
5666
4460
6961
95
2004
–20
0560
3860
1166
7567
0669
2567
9067
1368
9572
9072
2772
9665
78
2005
–20
0657
8655
5754
7651
9352
1551
5248
5348
8247
7946
0547
9148
55
2006
–20
0746
9248
4949
1345
6347
2949
4054
4854
8154
8853
2351
9748
13
Sour
ce:
Co
mp
any
dat
a.
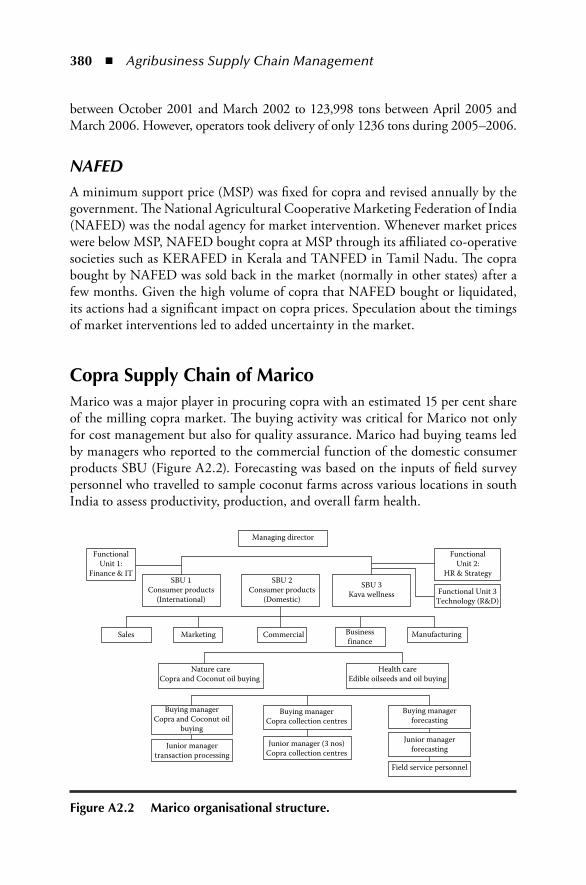
380 ◾ Agribusiness Supply Chain Management
between October 2001 and March 2002 to 123,998 tons between April 2005 and March 2006. However, operators took delivery of only 1236 tons during 2005–2006.
NAFEDA minimum support price (MSP) was fixed for copra and revised annually by the government. The National Agricultural Cooperative Marketing Federation of India (NAFED) was the nodal agency for market intervention. Whenever market prices were below MSP, NAFED bought copra at MSP through its affiliated co-operative societies such as KERAFED in Kerala and TANFED in Tamil Nadu. The copra bought by NAFED was sold back in the market (normally in other states) after a few months. Given the high volume of copra that NAFED bought or liquidated, its actions had a significant impact on copra prices. Speculation about the timings of market interventions led to added uncertainty in the market.
Copra Supply Chain of maricoMarico was a major player in procuring copra with an estimated 15 per cent share of the milling copra market. The buying activity was critical for Marico not only for cost management but also for quality assurance. Marico had buying teams led by managers who reported to the commercial function of the domestic consumer products SBU (Figure A2.2). Forecasting was based on the inputs of field survey personnel who travelled to sample coconut farms across various locations in south India to assess productivity, production, and overall farm health.
FunctionalUnit 1:
Finance & ITSBU 1
Consumer products(International)
SBU 2Consumer products
(Domestic)
SBU 3Kava wellness
Sales Marketing
Nature careCopra and Coconut oil buying
Buying managerCopra and Coconut oil
buying
Junior managertransaction processing
Buying managerCopra collection centres
Junior manager (3 nos)Copra collection centres
Buying managerforecasting
Junior managerforecasting
Field service personnel
Health careEdible oilseeds and oil buying
Managing director
FunctionalUnit 2:
HR & Strategy
Functional Unit 3Technology (R&D)
Commercial Businessf inance
Manufacturing
Figure A2.2 marico organisational structure.
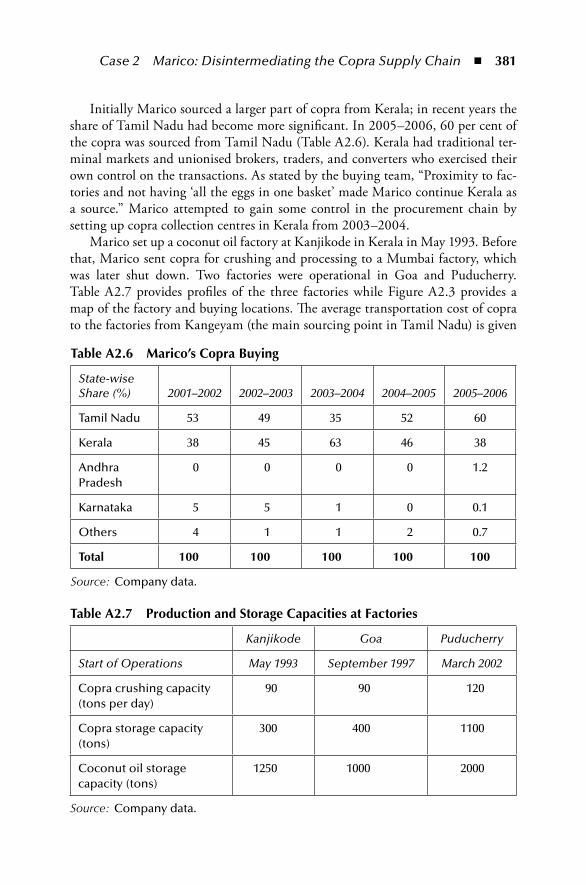
Case 2 Marico: Disintermediating the Copra Supply Chain ◾ 381
Initially Marico sourced a larger part of copra from Kerala; in recent years the share of Tamil Nadu had become more significant. In 2005–2006, 60 per cent of the copra was sourced from Tamil Nadu (Table A2.6). Kerala had traditional ter-minal markets and unionised brokers, traders, and converters who exercised their own control on the transactions. As stated by the buying team, “Proximity to fac-tories and not having ‘all the eggs in one basket’ made Marico continue Kerala as a source.” Marico attempted to gain some control in the procurement chain by setting up copra collection centres in Kerala from 2003–2004.
Marico set up a coconut oil factory at Kanjikode in Kerala in May 1993. Before that, Marico sent copra for crushing and processing to a Mumbai factory, which was later shut down. Two factories were operational in Goa and Puducherry. Table A2.7 provides profiles of the three factories while Figure A2.3 provides a map of the factory and buying locations. The average transportation cost of copra to the factories from Kangeyam (the main sourcing point in Tamil Nadu) is given
table A2.6 marico’s Copra Buying
State-wise Share (%) 2001–2002 2002–2003 2003–2004 2004–2005 2005–2006
Tamil Nadu 53 49 35 52 60
Kerala 38 45 63 46 38
Andhra Pradesh
0 0 0 0 1.2
Karnataka 5 5 1 0 0.1
Others 4 1 1 2 0.7
total 100 100 100 100 100
Source: Company data.
table A2.7 production and Storage Capacities at Factories
Kanjikode Goa Puducherry
Start of Operations May 1993 September 1997 March 2002
Copra crushing capacity (tons per day)
90 90 120
Copra storage capacity (tons)
300 400 1100
Coconut oil storage capacity (tons)
1250 1000 2000
Source: Company data.
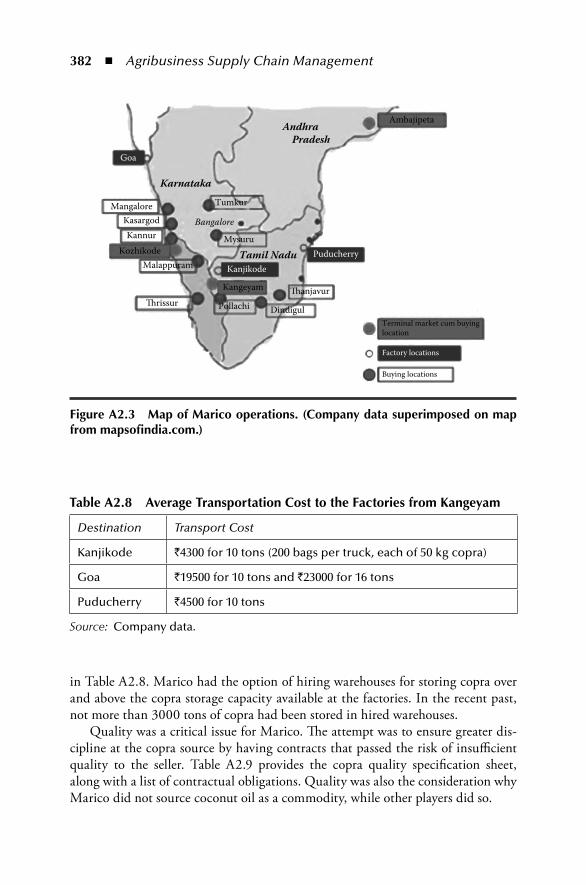
382 ◾ Agribusiness Supply Chain Management
in Table A2.8. Marico had the option of hiring warehouses for storing copra over and above the copra storage capacity available at the factories. In the recent past, not more than 3000 tons of copra had been stored in hired warehouses.
Quality was a critical issue for Marico. The attempt was to ensure greater dis-cipline at the copra source by having contracts that passed the risk of insufficient quality to the seller. Table A2.9 provides the copra quality specification sheet, along with a list of contractual obligations. Quality was also the consideration why Marico did not source coconut oil as a commodity, while other players did so.
table A2.8 Average transportation Cost to the Factories from Kangeyam
Destination Transport Cost
Kanjikode `4300 for 10 tons (200 bags per truck, each of 50 kg copra)
Goa `19500 for 10 tons and `23000 for 16 tons
Puducherry `4500 for 10 tons
Source: Company data.
Andhra Pradesh
Karnataka
Tamil Nadu
MangaloreKasargodKannur
Tumkur
Goa
Ambajipeta
KozhikodeMalappuram
�rissur Pollachi Dindigul
�anjavur
Terminal market cum buyinglocation
Factory locations
Buying locations
Kangeyam
KanjikodePuducherry
Mysuru
Bangalore
Figure A2.3 map of marico operations. (Company data superimposed on map from mapsofindia.com.)
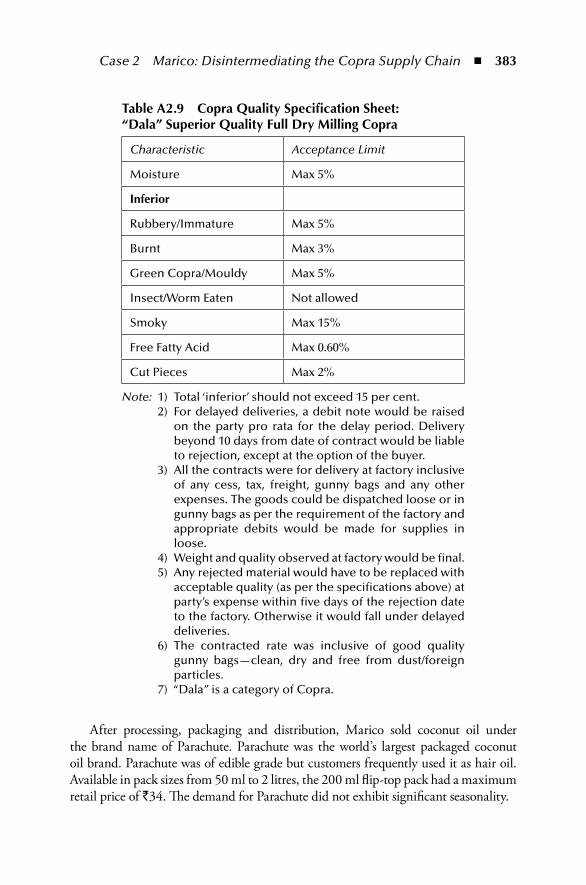
Case 2 Marico: Disintermediating the Copra Supply Chain ◾ 383
After processing, packaging and distribution, Marico sold coconut oil under the brand name of Parachute. Parachute was the world’s largest packaged coconut oil brand. Parachute was of edible grade but customers frequently used it as hair oil. Available in pack sizes from 50 ml to 2 litres, the 200 ml flip-top pack had a maximum retail price of `34. The demand for Parachute did not exhibit significant seasonality.
table A2.9 Copra Quality Specification Sheet: “Dala” Superior Quality Full Dry milling Copra
Characteristic Acceptance Limit
Moisture Max 5%
inferior
Rubbery/Immature Max 5%
Burnt Max 3%
Green Copra/Mouldy Max 5%
Insect/Worm Eaten Not allowed
Smoky Max 15%
Free Fatty Acid Max 0.60%
Cut Pieces Max 2%
Note: 1) Total ‘inferior’ should not exceed 15 per cent. 2) For delayed deliveries, a debit note would be raised
on the party pro rata for the delay period. Delivery beyond 10 days from date of contract would be liable to rejection, except at the option of the buyer.
3) All the contracts were for delivery at factory inclusive of any cess, tax, freight, gunny bags and any other expenses. The goods could be dispatched loose or in gunny bags as per the requirement of the factory and appropriate debits would be made for supplies in loose.
4) Weight and quality observed at factory would be final. 5) Any rejected material would have to be replaced with
acceptable quality (as per the specifications above) at party’s expense within five days of the rejection date to the factory. Otherwise it would fall under delayed deliveries.
6) The contracted rate was inclusive of good quality gunny bags—clean, dry and free from dust/foreign particles.
7) “Dala” is a category of Copra.
384 ◾ Agribusiness Supply Chain Management
Disintermediation initiativeEarly InitiativesThe disintermediation initiative was a long drawn affair that began in 1991. At that time, the buying office was located at the corporate headquarters in Mumbai. Marico would enter into contracts with Mumbai based brokers who would in turn contact brokers in the terminal markets in Kerala. Copra was sent to Mumbai on FOB basis. There were significant variations in quality between the copra (?) bought in the market and that reaching the factory. It was impossible to raise a debit note for quality or quantity related discrepancies. Prices and payment terms were dictated by brokers and supply disruptions were common.
The first step to solve these issues was the opening of a buying office in Kozhikode in 1991 staffed by a resident manager. Marico could now enter into contracts with traders in the copra market at Kozhikode, bypassing two layers of brokers. The terminal markets had strong labour unions. Not only were the labour charges high, there were separate unions for handling, loading, unloading, drying, stacking etc. In order to reduce dependency on the terminal markets, Marico started contacting individual traders and gradually started sourcing directly from them. The trad-ers were mainly small aggregators who sourced copra from interior villages. To strengthen the vendor development initiative, Marico formed two buying teams in 1994. One team focused on the Kozhikode market while the other focussed on North Kerala, specifically Kasargod and Cannanore areas. As a result of these ini-tiatives, ten vendors were identified in the North Kerala region and were provided dryers to dry copra during the monsoon. At this stage, Marico sourced copra on FOB basis from the terminal markets and on CIF basis through direct supply.
The 90s saw an explosive growth in coconut cultivation in Tamil Nadu. Starting from 1994, Marico focused on developing the vendor base in Tamil Nadu. The market perception was that copra from Tamil Nadu was of poor quality with respect to oil content. However, certain parts of Tamil Nadu were ideally suited for copra conver-sion. Coconut trees required adequate rainfall for growth but the copra conversion process was aided by dry weather. While Kerala received abundant rainfall, certain neighbouring pockets like Kangeyam in Tamil Nadu received almost no rainfall for eleven months in a year. Marico focussed its vendor development effort in such dry areas in Tamil Nadu. These vendors were provided moisture meters so they could objectively judge the moisture content. They were provided continuous buying support even when their volumes were low. Because of the underdeveloped nature of the mar-ket, Marico relied on brokers who represented multiple traders and copra converters.
In 1998, Marico completely discontinued sourcing from the terminal mar-kets, at that time constituting almost 45 per cent of the sourcing volume. Instead, Marico would contract with individual traders in Kerala. These traders supplied full truckload quantities directly to the factories on CIF terms. This eliminated not only the transaction fee at the exchange but also unnecessary loading and unload-ing at the exchange. Marico continued its reliance on brokers in Tamil Nadu.
Case 2 Marico: Disintermediating the Copra Supply Chain ◾ 385
The brokers received commission from traders but not from Marico. Given the large copra requirement, the contract prices entered into by Marico were not sig-nificantly different from the market-traded prices.
At this stage, the Marico buyers were involved in daily negotiations with a large number of copra traders. Each one would tell long drawn stories of supply unavail-ability and try to misdirect the buyers regarding the reasonable price of copra. Marico buyers sensed cartelisation among the copra traders. To deal with this phenomenon, efforts towards diversifying the supplier base gathered momentum. During 1999–2003, Marico focussed on developing copra traders and converters in Pollachi and Thanjavur regions of Tamil Nadu and certain pockets in Karnataka and Andhra Pradesh. The vendor base reached 80 by 2003.
In the meantime, significant changes were afoot on the information technology domain. Marico opted for a big bang implementation of an ERP system from SAP in 2001–2002. Subsequently, all Marico copra and coconut oil suppliers were con-nected to Marico through a web-based portal called Marico Connect. MINET, an online portal, was started in 2002 with the aim of gaining visibility of secondary sales. It was used for communication between the sales personnel and the distribu-tors and was integrated with SAP. The dotcom boom created awareness about the Internet and cyber cafes sprang up in towns and cities. New Age banks such as ICICI Bank started offering Internet banking on a national level. The stage was set for the next level of disintermediation.
Copra Bull RunThe need for disintermediation was felt acutely during the copra bull run of 2003–2005. From a price of `18000–20000/ton in 2001–2002, copra prices reached a high of `52000/ton in February 2005. This was due to a drastic fall in supply because of severe droughts in Tamil Nadu in 2002–2003 and cyclones in Andhra Pradesh. By this time, Marico had become a dominant player in the branded coco-nut oil market and volume requirements had shot up considerably. The copra mar-kets were characterised by increased competition from buyers, wide market access for buyers, and high networking among suppliers. Speculative traders entered the market attracted by the high price volatility. Traders would frequently refrain from bringing copra into the market when they expected a price rise. Price rises heightened the expectation of further price rises. The earlier initiatives of devel-oping a large vendor base and direct sourcing helped Marico to a large extent. Still, this episode underlined the need for decreasing the supply disruption risk.
Copra Collection CentresCopra conversion was an age old practice in Kerala, which was done primarily on a small scale in households. The low volumes meant that there was a need for an aggregator who could then supply truckloads of copra. Marico aimed at dislodging
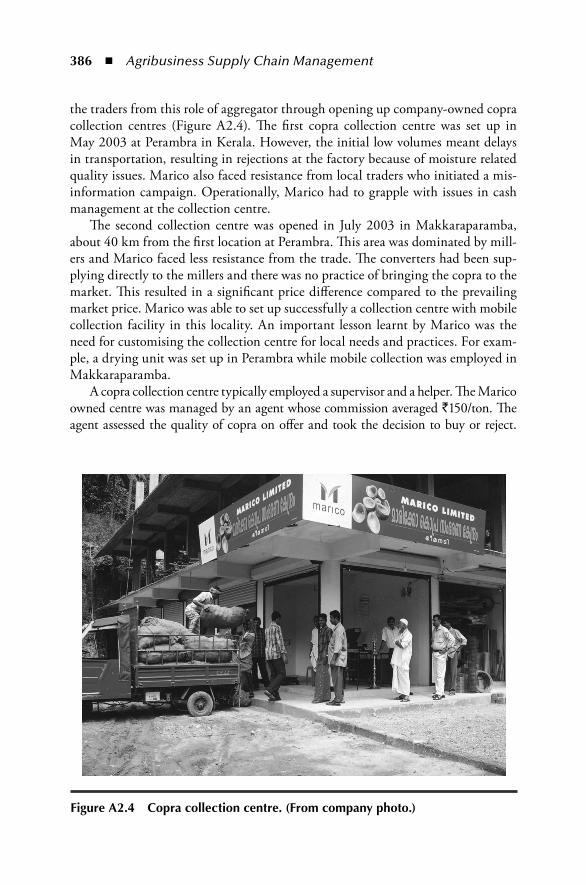
386 ◾ Agribusiness Supply Chain Management
the traders from this role of aggregator through opening up company-owned copra collection centres (Figure A2.4). The first copra collection centre was set up in May 2003 at Perambra in Kerala. However, the initial low volumes meant delays in transportation, resulting in rejections at the factory because of moisture related quality issues. Marico also faced resistance from local traders who initiated a mis-information campaign. Operationally, Marico had to grapple with issues in cash management at the collection centre.
The second collection centre was opened in July 2003 in Makkaraparamba, about 40 km from the first location at Perambra. This area was dominated by mill-ers and Marico faced less resistance from the trade. The converters had been sup-plying directly to the millers and there was no practice of bringing the copra to the market. This resulted in a significant price difference compared to the prevailing market price. Marico was able to set up successfully a collection centre with mobile collection facility in this locality. An important lesson learnt by Marico was the need for customising the collection centre for local needs and practices. For exam-ple, a drying unit was set up in Perambra while mobile collection was employed in Makkaraparamba.
A copra collection centre typically employed a supervisor and a helper. The Marico owned centre was managed by an agent whose commission averaged `150/ton. The agent assessed the quality of copra on offer and took the decision to buy or reject.
Figure A2.4 Copra collection centre. (From company photo.)
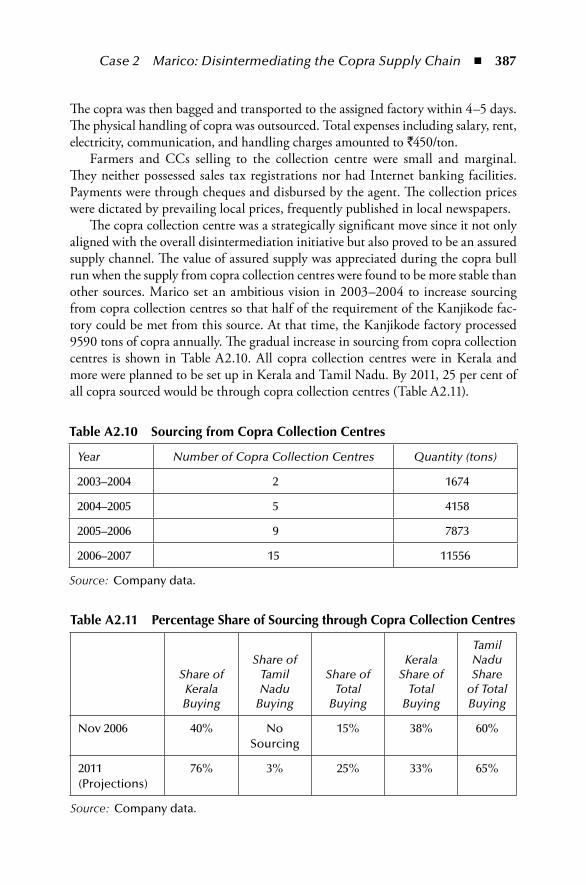
Case 2 Marico: Disintermediating the Copra Supply Chain ◾ 387
The copra was then bagged and transported to the assigned factory within 4–5 days. The physical handling of copra was outsourced. Total expenses including salary, rent, electricity, communication, and handling charges amounted to `450/ton.
Farmers and CCs selling to the collection centre were small and marginal. They neither possessed sales tax registrations nor had Internet banking facilities. Payments were through cheques and disbursed by the agent. The collection prices were dictated by prevailing local prices, frequently published in local newspapers.
The copra collection centre was a strategically significant move since it not only aligned with the overall disintermediation initiative but also proved to be an assured supply channel. The value of assured supply was appreciated during the copra bull run when the supply from copra collection centres were found to be more stable than other sources. Marico set an ambitious vision in 2003–2004 to increase sourcing from copra collection centres so that half of the requirement of the Kanjikode fac-tory could be met from this source. At that time, the Kanjikode factory processed 9590 tons of copra annually. The gradual increase in sourcing from copra collection centres is shown in Table A2.10. All copra collection centres were in Kerala and more were planned to be set up in Kerala and Tamil Nadu. By 2011, 25 per cent of all copra sourced would be through copra collection centres (Table A2.11).
table A2.10 Sourcing from Copra Collection Centres
Year Number of Copra Collection Centres Quantity (tons)
2003–2004 2 1674
2004–2005 5 4158
2005–2006 9 7873
2006–2007 15 11556
Source: Company data.
table A2.11 percentage Share of Sourcing through Copra Collection Centres
Share of Kerala Buying
Share of Tamil Nadu
Buying
Share of Total
Buying
Kerala Share of
Total Buying
Tamil Nadu Share
of Total Buying
Nov 2006 40% No Sourcing
15% 38% 60%
2011 (Projections)
76% 3% 25% 33% 65%
Source: Company data.
388 ◾ Agribusiness Supply Chain Management
Reverse AuctionsIn 2002, Marico decided to discontinue the existing process of daily negotiations with copra traders. Instead, it introduced a reverse auction based procedure. Three one-hour slots were specified every day during which the buying team would accept quotes from copra traders. The communication between traders and the buying team was restricted to the quote: quantity and price data only. At the end of the one-hour period, Marico selected the lowest bidders and informed them about the accepted quantity and the destination factory. The reverse auction based procedure offered Marico several advantages as shown in Table A2.12.
The auction process was not well received by the trading community. It tried to break the auction process by offering to sell copra after auction hours at prices lower than those accepted by Marico. Marico steadfastly refused to renege on any high priced contracts and similarly refused to enter into any contracts after auction hours irrespective of the attractiveness of the price. Unable to break the auction sys-tem, Kerala-based traders collectively refused to sell copra to Marico. This blockage lasted from August 10 to September 5, 2002. During this period Marico continued to adhere to the auction system and sourced copra from Tamil Nadu based vendors. Slowly, the trading community started to place bids during auction timings.
Web Based AuctionsMarico next wanted to replace the telephonic auction based system with a web based auction system. A related transformation was the move from a demand draft driven advance payment system to a copra-receipt based e-payment system. These changes were necessitated by the fact that a significant part of the activities of the buying team involved transaction related activities. Vendors would telephone the buying team to know whether their truck had arrived in the factory or whether the payment had been released. Payment to the vendor was in the form of demand drafts issued by the Mumbai office before the receipt of material at the factory. The drafts were couriered to the Kozhikode office, which then couriered them to the vendor on confirmation of material receipt at the factories. A separate debit note had to be generated in case a quantity or quality related discrepancy was reported. Since the vendor came to know of the discrepancy only on receipt of the debit note, further rounds of telephonic calls were the norm.
The biggest hurdle in implementing web-based auctions was the fact that almost all traders were computer illiterate. Marico decided to gradually increase the sophistication of the transaction related procedures between 2003 and 2005. Initially, Marico asked the vendors to send an email containing transaction related details such as purchase order number, dispatch quantity, bill number, truck num-ber, etc., for each transaction. However, the vendors were not prepared to send such emails. Marico facilitated the process by opening a large number of email accounts with www.rediffmail.com on behalf of the vendors. It also tied up with
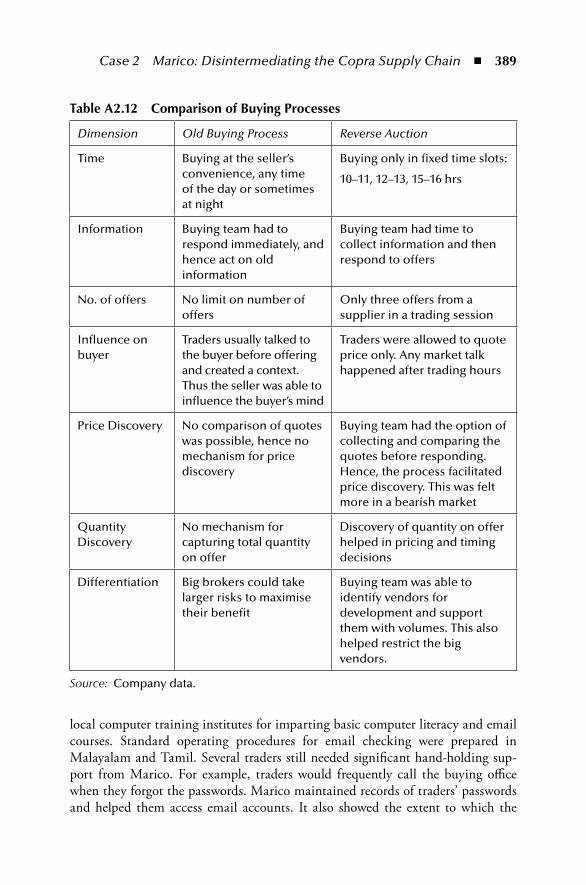
Case 2 Marico: Disintermediating the Copra Supply Chain ◾ 389
local computer training institutes for imparting basic computer literacy and email courses. Standard operating procedures for email checking were prepared in Malayalam and Tamil. Several traders still needed significant hand-holding sup-port from Marico. For example, traders would frequently call the buying office when they forgot the passwords. Marico maintained records of traders’ passwords and helped them access email accounts. It also showed the extent to which the
table A2.12 Comparison of Buying processes
Dimension Old Buying Process Reverse Auction
Time Buying at the seller’s convenience, any time of the day or sometimes at night
Buying only in fixed time slots:
10–11, 12–13, 15–16 hrs
Information Buying team had to respond immediately, and hence act on old information
Buying team had time to collect information and then respond to offers
No. of offers No limit on number of offers
Only three offers from a supplier in a trading session
Influence on buyer
Traders usually talked to the buyer before offering and created a context. Thus the seller was able to influence the buyer’s mind
Traders were allowed to quote price only. Any market talk happened after trading hours
Price Discovery No comparison of quotes was possible, hence no mechanism for price discovery
Buying team had the option of collecting and comparing the quotes before responding. Hence, the process facilitated price discovery. This was felt more in a bearish market
Quantity Discovery
No mechanism for capturing total quantity on offer
Discovery of quantity on offer helped in pricing and timing decisions
Differentiation Big brokers could take larger risks to maximise their benefit
Buying team was able to identify vendors for development and support them with volumes. This also helped restrict the big vendors.
Source: Company data.
390 ◾ Agribusiness Supply Chain Management
trading community trusted Marico. As time progressed, the traders became more comfortable in handling email accounts themselves.
To incentivise the email based system, Marico introduced the FTP (Fast Track Payment) scheme. Under this scheme, a vendor would be paid the day after receipt of copra at the factory. To avail this scheme, selected vendors needed to open an account with certain specified banks. Payment was then made electronically instead of issu-ing a demand draft. This allowed vendors to rotate their money faster than the earlier case which involved approximately nine days from copra receipt to receipt of demand draft. This benefit was offset by a 0.3 per cent discount on the bill value. Additionally, all FTP vendors had to send an email with dispatch details. FTP vendors were to be given priority service at the factory. By 2006, 95 per cent of vendors had opted for the FTP scheme and Marico stipulated that a vendor needed to send an email containing dispatch details even if the vendor was not on FTP. The 5 per cent vendors who did not opt for FTP included very large players who faced no working capital constraints.
Transformed Supply ChainBy July 2006, Marico had integrated web-based auctions with email based transaction management and e-payment based financial transactions in the portal www.e-marico.com. A vendor could now place bids, review his transaction summary, view details of purchase orders, enter shipping details, check the arrival of the truck at the factory, check payment status, bank account statements, and debit or credit notes – all from the comfort of home or a cyber café. The buying team members were provided cell phones that allowed viewing and accepting the bids placed while on the move. Once the buyer accepted a bid on his cell phone, specified the quantity and the destina-tion factory, the information was transferred to the SAP system which automatically generated the purchase orders. The buying team meanwhile could spend their time visiting markets and concentrate more on price discovery than transactional chores.
As Marico kept on transforming the supply chain, newer challenges emerged. Traders would typically congregate at a local cyber café where the cyber café owner would help the traders with the transactions. It was soon apparent that the cyber café owner provided another ‘service’ of sharing the bidding information of one vendor with another. The response of Marico was to enable placing of bids through SMS. For example, a vendor could send the SMS “MLO 10 3350” to 57575 indicat-ing a bid of 10 tons of copra at `3350 per quintal.* The SMS option for placing bids liberated the vendor from being close to a cyber café for placing bids. On a typical day, 11 out of 32 bids placed were through SMS.
The transformed supply chain was a significant departure from the past and stood out against other competitors. The sourcing profile of Dabur (which accounted for 1.3 per cent by volume and 1.6 per cent by value of coconut oil in 2006–2007), a main competitor of Marico, is provided in Box A2.1.
* 1 quintal = 100 kg = 0.1 ton.
Case 2 Marico: Disintermediating the Copra Supply Chain ◾ 391
road AheadAs dusk settled in the village, Sasi and Jayanth started the journey back to Coimbatore. They had visited several other copra converters and traders that day but none was as special as Ranganathan. He represented the face of the new sup-plier base for Marico. Yet that future face of the copra supplier was in a state of flux. Ranganathan had mentioned that several smaller converters had approached him for supplying copra. These converters did not want to supply directly to Marico as they did not want to obtain the sales tax registration required for becoming an accredited Marico supplier. Some of them were illiterate and found the Internet based bidding and banking procedures too complicated. Some held an appre-hension that a sales tax registration would invite the taxman home. These small converters were more comfortable selling copra to Ranganathan. This practically meant the creation of a new supplier category of a farmer-converter-trader.
Marico was now targeting 25 per cent of its copra sourcing to come from copra collection centres by 2011. To achieve this, new centres needed to be set up in Tamil Nadu, not just in Kerala. However, initial experiences suggested that establishing collection centres in Tamil Nadu would be more challenging given the geographic spread and sales tax related complications. It would also imply a higher level of transportation risk for Marico apart from exposing it to thefts, pilferage, and acci-dents. More importantly perhaps, the move was likely to see significant resistance from Tamil Nadu based traders.
bOx A 2.1 COMPe TITOR PROFIl e : DAbu R INDIA l IMITe D
Dabur India Limited was a marketer of value added coconut oil and one of the major organised coconut oil buyers. It bought coconut oil only, not copra. Buying was largely restricted to Kangeyam with average monthly coconut oil purchases of 400 kl. It bought only through brokers and the buying price was benchmarked against prevailing market prices. Delivery was on CIF terms and quality was inspected at the point of receipt. The payment terms specified were 15 days from the date of receipt.
Glossary
CIF—Cost, Insurance and Freight SAARC—South Asian Association for Regional CooperationERP—Enterprise Resource Planning
FTP—Fast Track Payment SBU—Strategic Business Unit
FOB—Free On Board SMS—Short Message Service
Source: Company data.
392 ◾ Agribusiness Supply Chain Management
The policy of cultivating farmer-converters and pure converters by discrimi-nating in their favour while awarding contracts was an ongoing initiative aimed at strengthening the sourcing base. The moot question was whether the farmer-converter represented the final frontier in the disintermediation initiative. Should Marico directly source coconut from farmers and convert to copra either in-house or under subcontract? Should it consider contract farming of coconut? The extreme option was to be vertically integrated from farming of coconut to selling of branded coconut oil. On the other hand, could reintermediation be an option worth consid-ering? For example, would Marico’s objective of minimisation of supply disruption be better answered by sourcing coconut oil rather than copra? In the face of an apparent trade-off between cost and risk minimisation, how could Marico reduce supply chain risk at the lowest supply chain cost? Driving through pitch darkness, the one thing clear to Sasi and Jayanth was that the solution had to provide Marico a sustainable competitive edge in future.
AcknowledgementsWritten by Professors Saral Mukherjee and G. Raghuram. We thank Mr. Vinod Kamath, Mr. Jayanth K. and Mr. Sasikumar K. of Marico for their support. Research support by Ms. Anjali Dave and Ms. Kruti Mody is acknowledged.
Cases of the Indian Institute of Management, Ahmedabad, are prepared as a basis for class discussion. Cases are not designed to present illustrations of either correct or incorrect handling of administrative problems.
This case has been reproduced with permission from Indian Institute of Management, Ahmedabad. Copyright © 2008.
393
Case 3 Hasmukhbhai K. nakum: Cold Storage entrepreneur
It was March 2006. Mr. Hasmukhbhai K. Nakum was thinking about expanding his cold storage business beyond Ahmedabad. Some of the cold storages in Ahmedabad were closing down due to high running costs and poor capacity utilization, but he was contemplating on expansion. He already had four cold storages and each one of them was running profitably. The recent years had been financially good for him, as all his cold storages had come to be known for their professional management. He attributed his success to direct management that enabled cost reduction and focusing on prod-ucts that provided maximum capacity utilization. With the continuous increase in agricultural production, this business had become an opportunity for Hasmukhbhai.
He wanted to expand beyond Ahmedabad to other cities where the demand was high. He thought he could improve his operating margins and reduce risks by geo-graphical diversification. Based on savings and debt worthiness, he estimated his per-sonal investment to be ̀ 3.5 crore. His prime concerns were real estate prices and subsidy provided by the Government. He felt that he could compete on his core competency of cost efficiency. He was considering one among the three cities in western India that could be attractive for cold storage business, namely Pune, Mumbai or Surat. He wanted the cold storage to be along highways and/or in proximity to local mandis.
Hasmukhbhai K. nakumHasmukhbhai came from a joint family which was involved in cold storage business since 1978. His uncle managed their family owned cold storage. During his school and college days, he used to observe the functions of the cold storage and learnt the
394 ◾ Agribusiness Supply Chain Management
intricacies. He always had the interest of doing something on his own and becoming independent as early as possible. In 1985, their family started two cold storages at Jamkhambhalia and Jamnagar. During this time, Hasmukhbhai completed his intermediate in commerce and was pursuing Bachelors of Commerce. He got moti-vated by one of his uncles involved in diamond business and learned the basics of business. Then he considered pursuing the family business actively, even by drop-ping out of college. He calculated the cost and benefit of this decision and decided in favour of business. He dropped out of college and went to Ahmedabad in 1990.
In 1990, he started Hira Cold Storage with his uncle. It started operating with one chamber and an initial capacity of 1500 tons (t). Gradually, they increased its capacity to 8000 t by 2006. Giving into family pressures, he got married in 1995. He had a son in 1998 and a daughter in 2002. In 1999, he started Hapa Cold Storage with his cousin brother. From an initial capacity of 1500 t, it grew to 4500 t during 2002.
In 2003, he decided to go for another cold storage, but independently this time. He purchased the required land. In 2004, the cold storage was started and by 2006, it reached a capacity of 6000 t. This cold storage operated under the name Mother Shree Cold Storage Pvt Ltd (MSCSPL). This unit costed him a total of `2.5 crore out which he borrowed `1.3 crore from Indian Overseas Bank. The balance sheet for the financial years 2003–2004 and 2004–2005 are given in Table A3.1. The profit and loss account is given in Table A3.2.
In the year 2005, he acquired a cold storage near MSCSPL from Sindhi Bhai and named it Mother Agro Cold Storage. Mr. Sindhi Bhai sold the cold storage since he was not able to professionally manage the cold storage, given its high oper-ating costs. The capacity was 2500 t. The sale price was `1.2 crore. For financing both these cold storages, he maintained a 25:75 of own equity and bank debt ratio.
Location Decision for the Cold StoragesWhen his family was initially operating at Jamnagar, Hasmukhbhai came to know about the demand in Ahmedabad. In the early 1990s, Krishna Cold Storage was the major player and it enjoyed monopoly. It offered eight hours of service. Hasmukhbhai observed that the rent charged was very high and the customers had to pay rent in advance to keep their goods. Hasmukhbhai sensed the opportunity for quality service at Ahmedabad. He also made a rough demand assessment and started searching for a suitable location for his cold storage. The various factors that he considered before zeroing in on Naroda were the following:
◾ Proximity to Madhavpura Mandi: Naroda could be easily approached by a subway on Hanuman Road and there were no hassles of traffic signals. Further, one could reach Naroda without entering Ahmedabad city. Thus the goods could reach the store fast and could be a convenience for truck drivers.
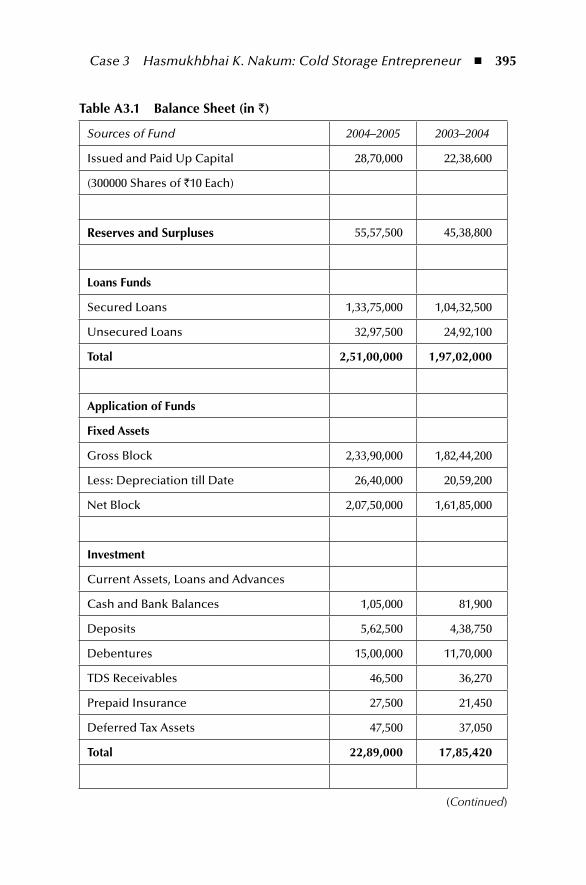
Case 3 Hasmukhbhai K. Nakum: Cold Storage Entrepreneur ◾ 395
table A3.1 Balance Sheet (in `)
Sources of Fund 2004–2005 2003–2004
Issued and Paid Up Capital 28,70,000 22,38,600
(300000 Shares of `10 Each)
reserves and Surpluses 55,57,500 45,38,800
Loans Funds
Secured Loans 1,33,75,000 1,04,32,500
Unsecured Loans 32,97,500 24,92,100
total 2,51,00,000 1,97,02,000
Application of Funds
Fixed Assets
Gross Block 2,33,90,000 1,82,44,200
Less: Depreciation till Date 26,40,000 20,59,200
Net Block 2,07,50,000 1,61,85,000
investment
Current Assets, Loans and Advances
Cash and Bank Balances 1,05,000 81,900
Deposits 5,62,500 4,38,750
Debentures 15,00,000 11,70,000
TDS Receivables 46,500 36,270
Prepaid Insurance 27,500 21,450
Deferred Tax Assets 47,500 37,050
total 22,89,000 17,85,420
(Continued)
396 ◾ Agribusiness Supply Chain Management
◾ Naroda fruit market which was a major customer of cold storage was near this location. A cold store located here would be preferred by traders as it would reduce the transportation cost.
◾ Kalupur pulses and grocery market was also quite near and could be served well from Naroda. Jaggery was the major commodity. Many of the masala items were also stored.
◾ Naroda had been riot proof all these years. ◾ It was close to NH 8. Customers could easily locate and reach the cold store. ◾ The roads connecting it were broad and well maintained, which would be of
real help during the monsoon.
By 2006, there were around 30 cold storages with an average capacity of 2500 t to 3000 t in Ahmedabad. Only ten of these were operating profitably. Of this, four were owned by Hasmukhbhai.
mSCSpLSelection of Name: Hasmukhbhai said, “I wanted a name which would be
remembered easily and have an unaided recall. Mother preserved all nutri-ents for its offspring.” Further, different names were chosen for different cold
table A3.1 (Continued) Balance Sheet (in `)
Sources of Fund 2004–2005 2003–2004
Less Current Liabilities and provision
Expenses Payable 7,500 5,850
Creditors for Capital Expenses 4,00,000 3,12,000
TDS Payable 4,375 3,412
Advances from Customers 1,35,000 1,05,300
Provision for Tax 44,000 34,320
Net Current Assets 5,90,875 4,60,882
miscellaneous expenditure (to the extent not Written off)
Preliminary Expenses 62,500 48,750
Preoperative Expenses
Source: Mr. Hasmukhbhai K. Nakum.
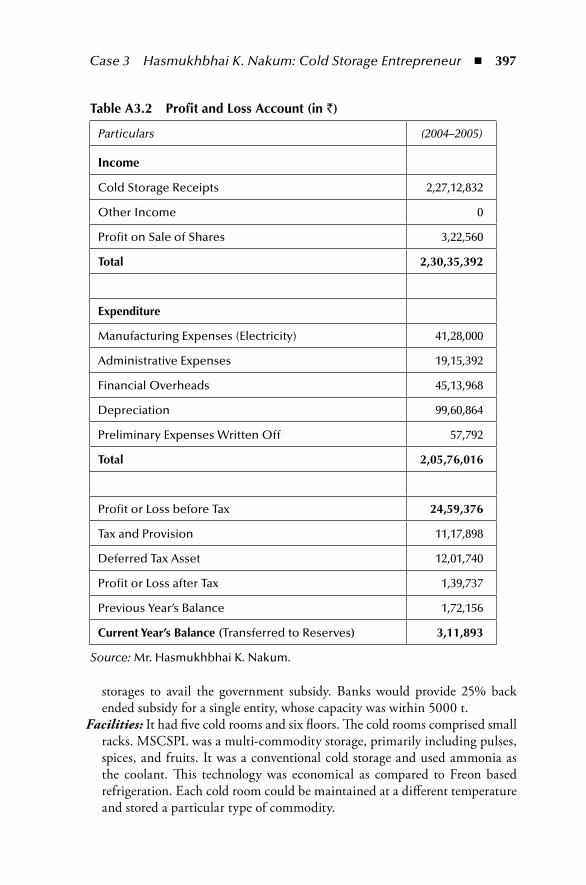
Case 3 Hasmukhbhai K. Nakum: Cold Storage Entrepreneur ◾ 397
storages to avail the government subsidy. Banks would provide 25% back ended subsidy for a single entity, whose capacity was within 5000 t.
Facilities: It had five cold rooms and six floors. The cold rooms comprised small racks. MSCSPL was a multi-commodity storage, primarily including pulses, spices, and fruits. It was a conventional cold storage and used ammonia as the coolant. This technology was economical as compared to Freon based refrigeration. Each cold room could be maintained at a different temperature and stored a particular type of commodity.
table A3.2 profit and Loss Account (in `)
Particulars (2004–2005)
income
Cold Storage Receipts 2,27,12,832
Other Income 0
Profit on Sale of Shares 3,22,560
total 2,30,35,392
expenditure
Manufacturing Expenses (Electricity) 41,28,000
Administrative Expenses 19,15,392
Financial Overheads 45,13,968
Depreciation 99,60,864
Preliminary Expenses Written Off 57,792
total 2,05,76,016
Profit or Loss before Tax 24,59,376
Tax and Provision 11,17,898
Deferred Tax Asset 12,01,740
Profit or Loss after Tax 1,39,737
Previous Year’s Balance 1,72,156
Current year’s Balance (Transferred to Reserves) 3,11,893
Source: Mr. Hasmukhbhai K. Nakum.
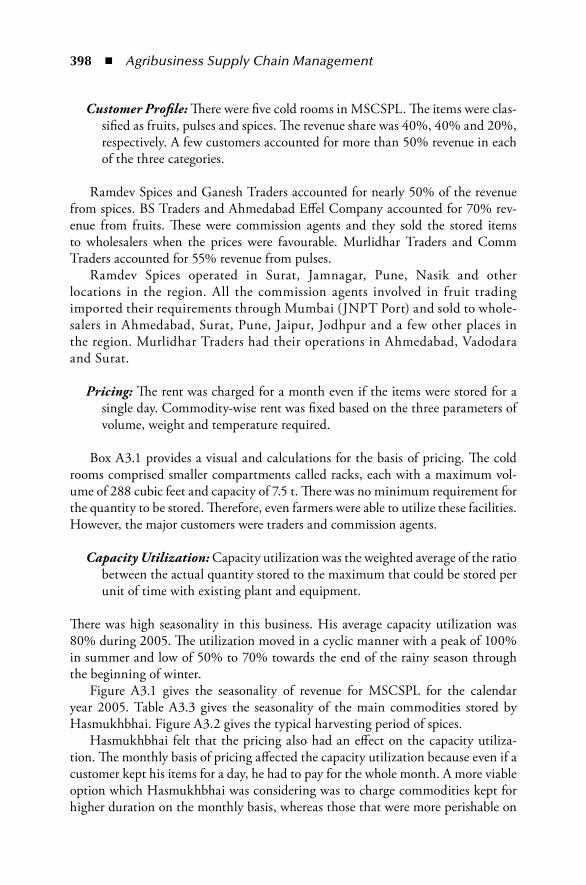
398 ◾ Agribusiness Supply Chain Management
Customer Profile: There were five cold rooms in MSCSPL. The items were clas-sified as fruits, pulses and spices. The revenue share was 40%, 40% and 20%, respectively. A few customers accounted for more than 50% revenue in each of the three categories.
Ramdev Spices and Ganesh Traders accounted for nearly 50% of the revenue from spices. BS Traders and Ahmedabad Effel Company accounted for 70% rev-enue from fruits. These were commission agents and they sold the stored items to wholesalers when the prices were favourable. Murlidhar Traders and Comm Traders accounted for 55% revenue from pulses.
Ramdev Spices operated in Surat, Jamnagar, Pune, Nasik and other locations in the region. All the commission agents involved in fruit trading imported their requirements through Mumbai (JNPT Port) and sold to whole-salers in Ahmedabad, Surat, Pune, Jaipur, Jodhpur and a few other places in the region. Murlidhar Traders had their operations in Ahmedabad, Vadodara and Surat.
Pricing: The rent was charged for a month even if the items were stored for a single day. Commodity-wise rent was fixed based on the three parameters of volume, weight and temperature required.
Box A3.1 provides a visual and calculations for the basis of pricing. The cold rooms comprised smaller compartments called racks, each with a maximum vol-ume of 288 cubic feet and capacity of 7.5 t. There was no minimum requirement for the quantity to be stored. Therefore, even farmers were able to utilize these facilities. However, the major customers were traders and commission agents.
Capacity Utilization: Capacity utilization was the weighted average of the ratio between the actual quantity stored to the maximum that could be stored per unit of time with existing plant and equipment.
There was high seasonality in this business. His average capacity utilization was 80% during 2005. The utilization moved in a cyclic manner with a peak of 100% in summer and low of 50% to 70% towards the end of the rainy season through the beginning of winter.
Figure A3.1 gives the seasonality of revenue for MSCSPL for the calendar year 2005. Table A3.3 gives the seasonality of the main commodities stored by Hasmukhbhai. Figure A3.2 gives the typical harvesting period of spices.
Hasmukhbhai felt that the pricing also had an effect on the capacity utiliza-tion. The monthly basis of pricing affected the capacity utilization because even if a customer kept his items for a day, he had to pay for the whole month. A more viable option which Hasmukhbhai was considering was to charge commodities kept for higher duration on the monthly basis, whereas those that were more perishable on
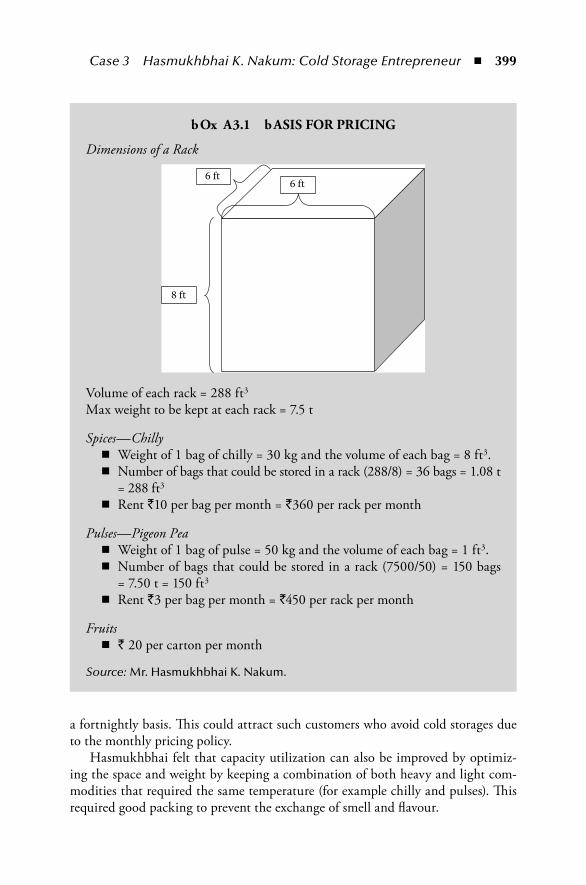
Case 3 Hasmukhbhai K. Nakum: Cold Storage Entrepreneur ◾ 399
a fortnightly basis. This could attract such customers who avoid cold storages due to the monthly pricing policy.
Hasmukhbhai felt that capacity utilization can also be improved by optimiz-ing the space and weight by keeping a combination of both heavy and light com-modities that required the same temperature (for example chilly and pulses). This required good packing to prevent the exchange of smell and flavour.
bOx A3.1 bASIS FOR PRICING
Dimensions of a Rack
6 ft6 ft
8 ft
Volume of each rack = 288 ft3
Max weight to be kept at each rack = 7.5 t
Spices—Chilly ◾ Weight of 1 bag of chilly = 30 kg and the volume of each bag = 8 ft3. ◾ Number of bags that could be stored in a rack (288/8) = 36 bags = 1.08 t
= 288 ft3
◾ Rent `10 per bag per month = `360 per rack per month
Pulses—Pigeon Pea ◾ Weight of 1 bag of pulse = 50 kg and the volume of each bag = 1 ft3. ◾ Number of bags that could be stored in a rack (7500/50) = 150 bags
= 7.50 t = 150 ft3
◾ Rent `3 per bag per month = `450 per rack per month
Fruits ◾ ` 20 per carton per month
Source: Mr. Hasmukhbhai K. Nakum.
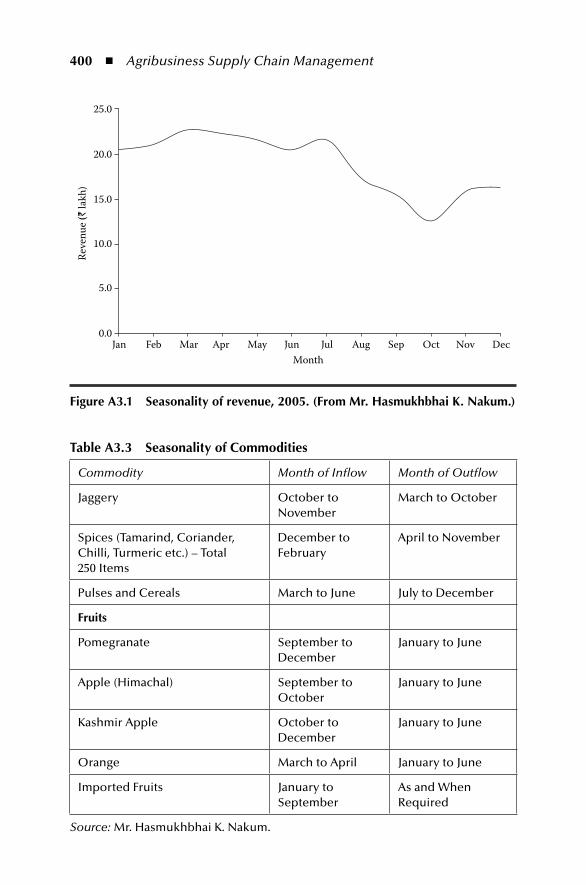
400 ◾ Agribusiness Supply Chain Management
table A3.3 Seasonality of Commodities
Commodity Month of Inflow Month of Outflow
Jaggery October to November
March to October
Spices (Tamarind, Coriander, Chilli, Turmeric etc.) – Total 250 Items
December to February
April to November
Pulses and Cereals March to June July to December
Fruits
Pomegranate September to December
January to June
Apple (Himachal) September to October
January to June
Kashmir Apple October to December
January to June
Orange March to April January to June
Imported Fruits January to September
As and When Required
Source: Mr. Hasmukhbhai K. Nakum.
25.0
20.0
15.0
10.0
5.0
0.0Jan Feb Mar Apr May Jun Jul
Month
Reve
nue (
` la
kh)
Aug Sep Oct Nov Dec
Figure A3.1 Seasonality of revenue, 2005. (From mr. Hasmukhbhai K. nakum.)
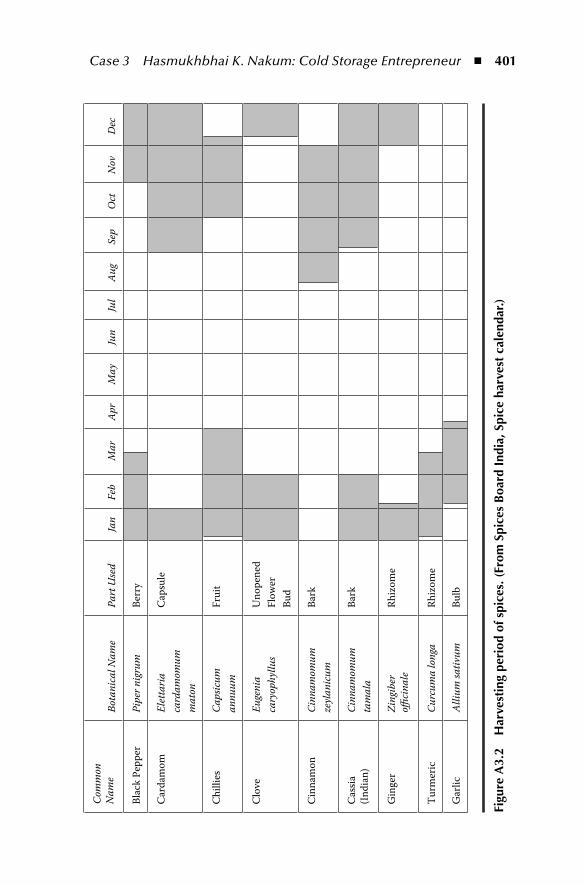
Case 3 Hasmukhbhai K. Nakum: Cold Storage Entrepreneur ◾ 401
Com
mon
Nam
e Bo
tani
cal N
ame
Part
Use
dJa
nFe
bM
arAp
r M
ayJu
nJu
lAu
g Se
pO
ctN
ov
Dec
Blac
k Pe
pper
Pipe
r nig
rum
Berr
y
Car
dam
omEl
etta
ria
card
amom
umm
aton
Cap
sule
Chi
llies
Caps
icum
an
nuum
Frui
t
Clo
veEu
geni
a ca
ryop
hyllu
sU
nope
ned
Flow
er
Bud
Cin
nam
onCi
nnam
omum
ze
ylan
icum
Bark
Cas
sia(I
ndia
n)
Cinn
amom
um
tam
ala
Bark
Gin
ger
Zing
iber
o�cin
ale
Rhiz
ome
Tur
mer
icCu
rcum
a lo
nga
Rhiz
ome
Gar
licAl
lium
sativ
umBu
lb
Figu
re A
3.2
Har
vest
ing
peri
od o
f spi
ces.
(Fr
om S
pice
s B
oard
ind
ia, S
pice
har
vest
cal
enda
r.)
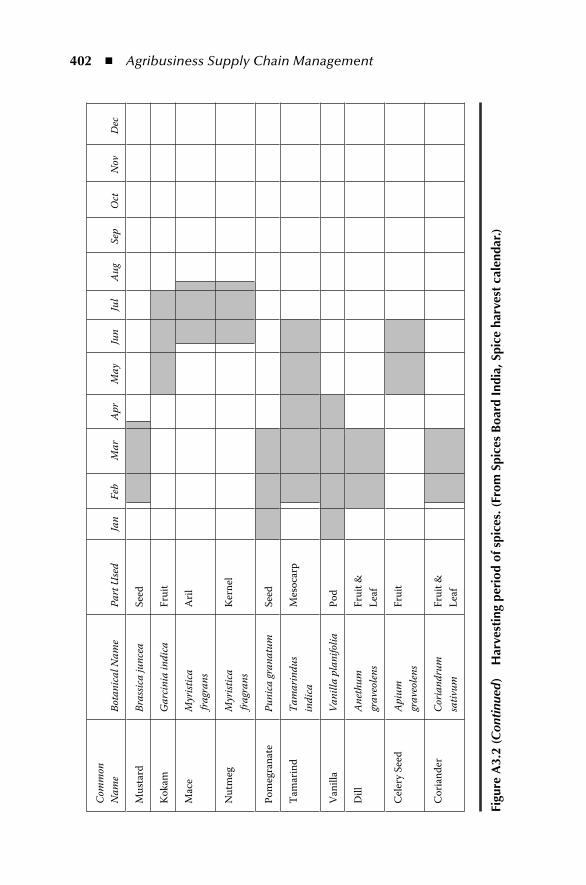
402 ◾ Agribusiness Supply Chain Management
Com
mon
N
ame
Bota
nica
l Nam
ePa
rt U
sed
Jan
Feb
Mar
Apr
May
Jun
Jul
Aug
Sep
Oct
Nov
D
ec
Mus
tard
Bras
sica
junc
eaSe
ed
Kok
amG
arcin
ia in
dica
Frui
t
Mac
eM
yrist
ica
fragr
ans
Aril
Nut
meg
Myr
istica
fra
gran
sK
erne
l
Pom
egra
nate
Puni
ca gr
anat
umSe
ed
Tam
arin
dTa
mar
indu
s in
dica
Mes
ocar
p
Van
illa
Vani
lla p
lani
folia
Pod
Dill
Anet
hum
gr
aveo
lens
Frui
t &
Leaf
Cel
ery
Seed
Apiu
m
grav
eole
nsFr
uit
Cor
iand
erCo
riand
rum
sa
tivum
Frui
t &
Leaf
Figu
re A
3.2
(Con
tinu
ed)
Har
vest
ing
peri
od o
f spi
ces.
(Fr
om S
pice
s B
oard
ind
ia, S
pice
har
vest
cal
enda
r.)
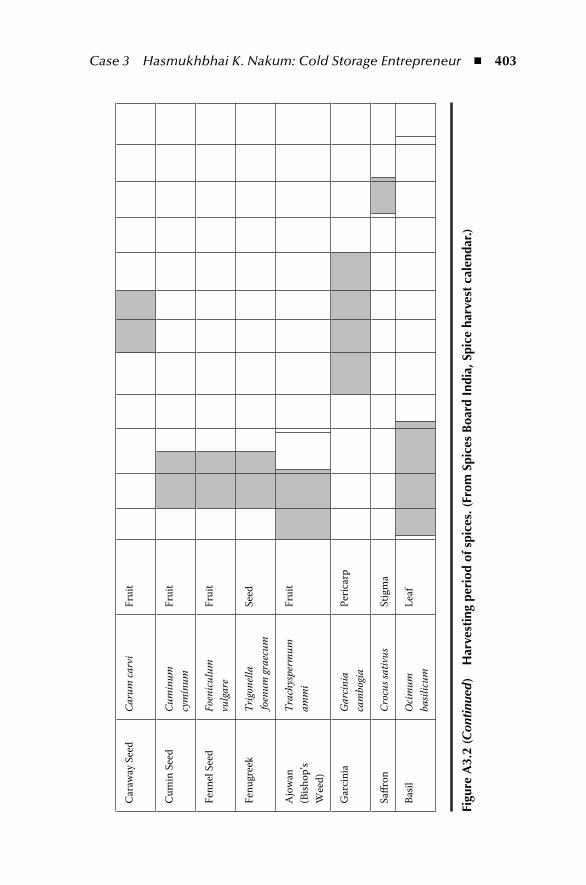
Case 3 Hasmukhbhai K. Nakum: Cold Storage Entrepreneur ◾ 403
Car
away
See
d Ca
rum
carv
iFr
uit
Cum
in S
eed
Cum
inum
cy
min
umFr
uit
Fenn
el S
eed
Foen
iculu
m
vulg
are
Frui
t
Fenu
gree
kTr
igon
ella
fo
enum
grae
cum
Seed
Ajo
wan
(B
ishop
’s W
eed)
Trac
hysp
erm
um
amm
iFr
uit
Gar
cini
aG
arcin
ia
cam
bogi
aPe
ricar
p
Sa�r
onCr
ocus
sativ
usSt
igm
a
Basil
Ocim
um
basil
icum
Leaf
Figu
re A
3.2
(Con
tinu
ed)
Har
vest
ing
peri
od o
f spi
ces.
(Fr
om S
pice
s B
oard
ind
ia, S
pice
har
vest
cal
enda
r.)
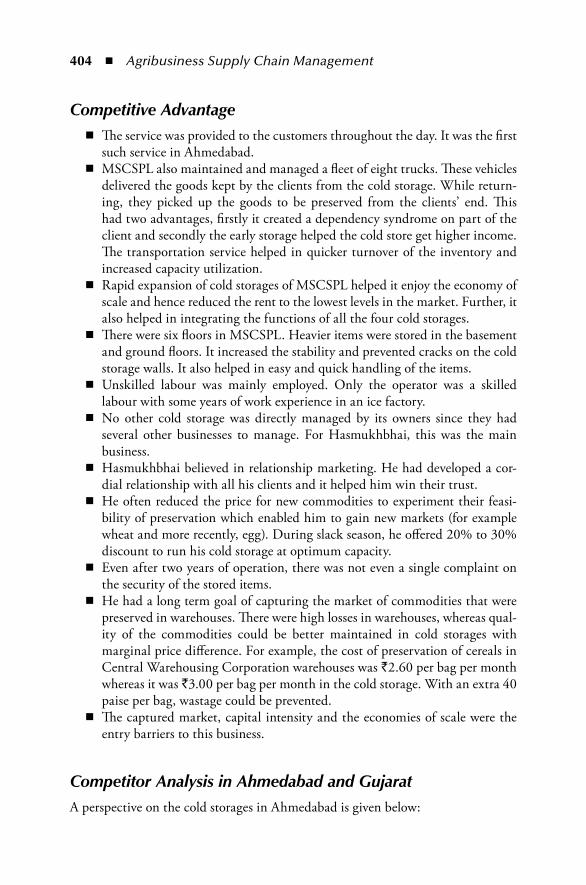
404 ◾ Agribusiness Supply Chain Management
Competitive Advantage ◾ The service was provided to the customers throughout the day. It was the first
such service in Ahmedabad. ◾ MSCSPL also maintained and managed a fleet of eight trucks. These vehicles
delivered the goods kept by the clients from the cold storage. While return-ing, they picked up the goods to be preserved from the clients’ end. This had two advantages, firstly it created a dependency syndrome on part of the client and secondly the early storage helped the cold store get higher income. The transportation service helped in quicker turnover of the inventory and increased capacity utilization.
◾ Rapid expansion of cold storages of MSCSPL helped it enjoy the economy of scale and hence reduced the rent to the lowest levels in the market. Further, it also helped in integrating the functions of all the four cold storages.
◾ There were six floors in MSCSPL. Heavier items were stored in the basement and ground floors. It increased the stability and prevented cracks on the cold storage walls. It also helped in easy and quick handling of the items.
◾ Unskilled labour was mainly employed. Only the operator was a skilled labour with some years of work experience in an ice factory.
◾ No other cold storage was directly managed by its owners since they had several other businesses to manage. For Hasmukhbhai, this was the main business.
◾ Hasmukhbhai believed in relationship marketing. He had developed a cor-dial relationship with all his clients and it helped him win their trust.
◾ He often reduced the price for new commodities to experiment their feasi-bility of preservation which enabled him to gain new markets (for example wheat and more recently, egg). During slack season, he offered 20% to 30% discount to run his cold storage at optimum capacity.
◾ Even after two years of operation, there was not even a single complaint on the security of the stored items.
◾ He had a long term goal of capturing the market of commodities that were preserved in warehouses. There were high losses in warehouses, whereas qual-ity of the commodities could be better maintained in cold storages with marginal price difference. For example, the cost of preservation of cereals in Central Warehousing Corporation warehouses was `2.60 per bag per month whereas it was `3.00 per bag per month in the cold storage. With an extra 40 paise per bag, wastage could be prevented.
◾ The captured market, capital intensity and the economies of scale were the entry barriers to this business.
Competitor Analysis in Ahmedabad and GujaratA perspective on the cold storages in Ahmedabad is given below:
Case 3 Hasmukhbhai K. Nakum: Cold Storage Entrepreneur ◾ 405
Samarpan Cold Storage (1500 t): It offered multi-commodity storage facility. Low capacity utilization had always been its problem.
Vinodh Cold Storage (3000 t): It was started in 1999 and had 10% of the total market share. Mr. Sivjibhai Patel was the owner of this multi-commodity storage facility.
Shahjanand Cold Storage (1500 t): It dealt mainly with jaggery.Laxmi Cold Storage (2000 t): It dealt mainly with jaggery.HC Cold Storage (5000 t): It was started in 1995. It stored fruits only. This cold
storage was started by HC Fruits limited by Mr. Hundraj Changomal. He integrated vertically and built this cold storage to reduce cost. It had a market share of 10%. It incurred very high construction cost and ended up spend-ing double the actual capital required for such a project. Basic reason was his inexperience in this field.
Padmavati Cold Storage (2500 t): It was a multi-commodity storage started in 1994 by an NRI, Mr. Nitin Bhawsar.
Alka Cold Storage: It does not exist now. It had a capacity of 1000 t. It was one of the few first cold storages in India. It was a multi-commodity storage.
Cold Storages managed by Hasmukhbhai in Naroda (total market share was 25%): Hira Cold Storage (8000 t), Hapa Cold Storage (4500 t), MSCSPL (6000 t) and Mother Agro Cold Storage (2500 t)
Mr. Hasmukhbhai had the following to say regarding problems faced by cold stor-ages in Ahmedabad and causes of closure of some of them. “More than 45% of the operational cost is towards electricity. The electricity charges in the state are very high. Apart from this, cold storages fall under service industry. So they are levied a duty of 20% over and above the electricity bill. The irony is even industries pay just 10% duty. Cold storages in Gujarat are treated on par with cinema houses. There is an association for cold storages in Ahmedabad and they have taken this issue with many governments but so far there has been no change. The members strongly feel that if cold storages have to pay agricultural electricity tariff, many of the existing cold storages can be turned profitable.
Twenty years back, when the electricity charge was `0.20 per unit, the rent was `0.50 per kg of potato for a season. Now the electricity charge has gone over `5.00 per unit, but the rent remains almost the same at `0.60 per kg. It is no wonder that most of the cold storages are not profitable. Also, potato cold storages are opera-tional only during March to September and rest of the period they remain idle. This is another reason for them not being profitable. Other reasons for financial problems and closure are high cost of construction due to inexperience, high cost of manpower and over heads, and competitive pricing.”
Regarding MSCSPL’s relative better performance, he said, “We dictated the market by decreasing the rent gradually as we grew more and more efficient. At such low rent, it is difficult for many of the cold storages to operate. MSCSPL managed to operate at such a low rent because of its efficient management and
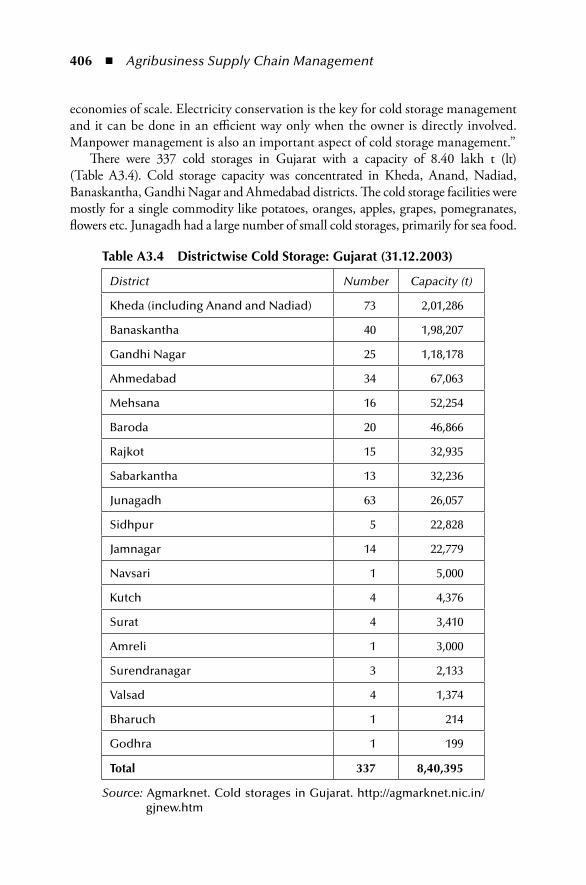
406 ◾ Agribusiness Supply Chain Management
economies of scale. Electricity conservation is the key for cold storage management and it can be done in an efficient way only when the owner is directly involved. Manpower management is also an important aspect of cold storage management.”
There were 337 cold storages in Gujarat with a capacity of 8.40 lakh t (lt) (Table A3.4). Cold storage capacity was concentrated in Kheda, Anand, Nadiad, Banaskantha, Gandhi Nagar and Ahmedabad districts. The cold storage facilities were mostly for a single commodity like potatoes, oranges, apples, grapes, pomegranates, flowers etc. Junagadh had a large number of small cold storages, primarily for sea food.
table A3.4 Districtwise Cold Storage: Gujarat (31.12.2003)
District Number Capacity (t)
Kheda (including Anand and Nadiad) 73 2,01,286
Banaskantha 40 1,98,207
Gandhi Nagar 25 1,18,178
Ahmedabad 34 67,063
Mehsana 16 52,254
Baroda 20 46,866
Rajkot 15 32,935
Sabarkantha 13 32,236
Junagadh 63 26,057
Sidhpur 5 22,828
Jamnagar 14 22,779
Navsari 1 5,000
Kutch 4 4,376
Surat 4 3,410
Amreli 1 3,000
Surendranagar 3 2,133
Valsad 4 1,374
Bharuch 1 214
Godhra 1 199
total 337 8,40,395
Source: Agmarknet. Cold storages in Gujarat. http://agmarknet.nic.in/gjnew.htm
Case 3 Hasmukhbhai K. Nakum: Cold Storage Entrepreneur ◾ 407
Globally, the most widely stored item in cold storages was carrot, followed by potato. In India, the early cold storages were built, for storing potatoes. Even now, the number of cold storages for potatoes is significantly higher than other commodities.
In 1956, the first cold storage was established in Ahmedabad for storing potato. As per Hasmukhbhai, “During those days, the production was not more than 0.25 lt in Ahmedabad. After the establishment of this cold storage, potato produc-tion went up to 10.00 lt in a few years. This increment is solely due to the establish-ment of the cold storage. The current cold storage capacity in Ahmedabad is about 0.60 lt. Cold storages for potato developed in Kheda district even though there was not much of production. People of Kheda were wealthy and made investments in cold storage projects. Potatoes grown in Deesa taluk of Banaskantha were stored in these storages for a long time. The current cold storage capacity in Kheda (includ-ing Anand and Nadiad) is 2.00 lt. The quantity of potato produced is 1.50 lt.
Later, cold storages started developing in Deesa (Banaskantha district) and now there are 40 cold storages with a total capacity of about 2.00 lt. The total potato production is around 6.00 lt. Currently, only the excess quantity goes to the Kheda district. So many cold storages are lying idle in Kheda. Single commodity storage resulted in poor capacity utilization due to their seasonality.
In the conventional cold storages, temperature can be controlled but not the humidity. However, humidity control is very vital in preserving fruits and veg-etables effectively. This is possible only in controlled atmosphere (CA) cold storages. There is only one CA storage in Gujarat and it is located in Borsad (Anand district). The location of this storage, being in the interior is inconvenient for the customers. The cost in this type of cold storage is high when compared to conventional stor-ages, making it infeasible for farmers and traders. Only traders who are involved in exports are using its services.”
Expansion into Other CitiesHaving experienced profits in the cold storage business and considering the demand for cold storages, Hasmukhbhai wanted to expand his business into other cities. He was considering three cities and wanted to choose one among the three. He had no problem with buying an old cold storage and expanding it. He wanted to purchase land with future expansion in view. He wanted to have the land in at least two clus-ters in the vicinity, since he wanted to avoid inflow/outflow congestion on expan-sion. The construction would be done phase-wise. A gradual increment in capacity would lead to early utilization of the store and its operation would generate funds to cover the interest part of the loan. He also knew that land value would increase.
For example, the lands for his operations in Ahmedabad were in a cluster, near one another. The land value for MSCSPL was `10 l and it had increased during these years. This land was in two clusters. The expansion had been carried out gradually from 1500 t to 6000 t in one and half years.
408 ◾ Agribusiness Supply Chain Management
He felt that the maximum capacity should not exceed 10000 t since it would make customer service difficult. He also wanted the minimum capacity to be 5000 t. Otherwise, there could not be an efficient utilization of labour and this could inflate the operational costs of cold storage. Always one standby machine had to be main-tained for the efficient running of any cold storage. Therefore even for 1000 t capac-ity, two machines and five operators were needed. MSCSPL managed 6000 t with just six people which was by far the most efficient management of people.
Considering his financial status, he was planning a 60:40 debt equity ratio with total investment not exceeding `3.5 crore.
Mr. Hasmukhbhai wanted to be in the western region, not only due to mana-gerial convenience, but also because many of his customers may be operating in locations within the region. This region, including Gujarat and Maharashtra, was doing well in agriculture production (Table A3.9 through Table A3.12). He also felt that the major growing metros would offer the best scope. He was considering three possible locations, Surat, Pune and Mumbai for the expansion.
Hasmukhbhai wanted to derive lessons from the overall status of cold storage indus-try in India, as given in the section, “Status of Cold Storage Industry in India” on page 424. The investment required for construction of a 5000 t capacity cold storage in the three candidate cities, along with Ahmedabad, is given in Table A3.5. His perceptions of the relative advantages and disadvantages of the three cities are given below.
Surat: There were four cold storages catering to the needs of the entire city. The main player was Surat Agro (Table A3.6). There was not much competition from other players. The neighbouring districts of Navsari, Valsad and Bharuch also had six cold storages (Table A3.4). The preservation knowledge among the traders and farmers was primitive. Hasmukhbhai felt that there was a need for three to four cold storages with a capacity of 5000 t each. Even the cost at some places was higher than the suburbs of Mumbai. He felt that managing one more cold store at Surat would not be a problem since the city was not new to him. Since the Agricultural Produce Market Committee (APMC) act was amended in Gujarat, the cold storage owners would be able to procure the goods from farmers directly without paying APMC cess. So, there would also not be any problem of inspection by APMC officials. A major challenge in the initial years could be due to his customer profile, not many of whom operated from Surat.
Pune: This region had high production of onions, grapes and flowers. The con-sumption demand was growing fast due to migration from Mumbai. Further, because of its proximity to and increasing cold storage rents in Mumbai, many of the traders shifted their base here. The initial investment required to start a cold storage at Pune was less compared to Mumbai. However, being relatively a new place both personally and in terms of customers, operation during the initial years might be difficult.

Case 3 Hasmukhbhai K. Nakum: Cold Storage Entrepreneur ◾ 409
The APMC act was not yet amended in Maharashtra. Many traders procured directly from the farmers and stored their goods in warehouses without paying APMC cess. In order to ensure that the cess was not avoided, the APMC officials frequently inspected all the cold storages. This was a common problem to all cold storages. This severely affected customer loyalty.
There were about 30 cold storages in Pune and its vicinity (Table A3.7). Frosty Refrigeration and Sunrise Cold Storage Company were the major players in the Pune market (Table A3.6). They offered cold chain facility and complete logistics solutions with their refrigerated vehicles. Thus Hasmukhbhai would have to invest not only in a cold storage, but in a cold chain.
Mumbai: The demand in Mumbai was always high and right through the year. Lots of imported perishable food items were getting unloaded every day in JNPT. There were many cold storages in the port vicinity catering to the growing demand. In spite of both domestic and import arrivals, as in other places, there was seasonality (Table A3.8). There were more than 70 cold stor-ages in Mumbai and its vicinity (Table A3.7). Some of the small players like California Humifresh India Private Limited, Trans Agrotech Limited and AA Cold Storage and Ice Factory Pvt. Limited provided complete logistics solutions apart from storage service. The initial investment here was high due to the real estate cost. Hasmukhbhai felt that he would be able to charge lesser rent than most of the existing players, giving him competitive advan-tage. Many of his existing customers had their operations in Mumbai too. This would be an advantage for him in the initial years. Issues related to APMC existed here too.
table A3.5 investment required for a 5000 t Capacity Cold Storage (` l)
Ahmedabad Surat Pune Mumbai
Land (8000 Sq m) 42 46 54 77
Building and Steel 97 106 116 127
Plant and Machinery 28 29 32 35
Insulation 18 19 21 23
total investment 185 201 223 262
Source: Data provided by Mr. Hasmukhbhai K. Nakum.
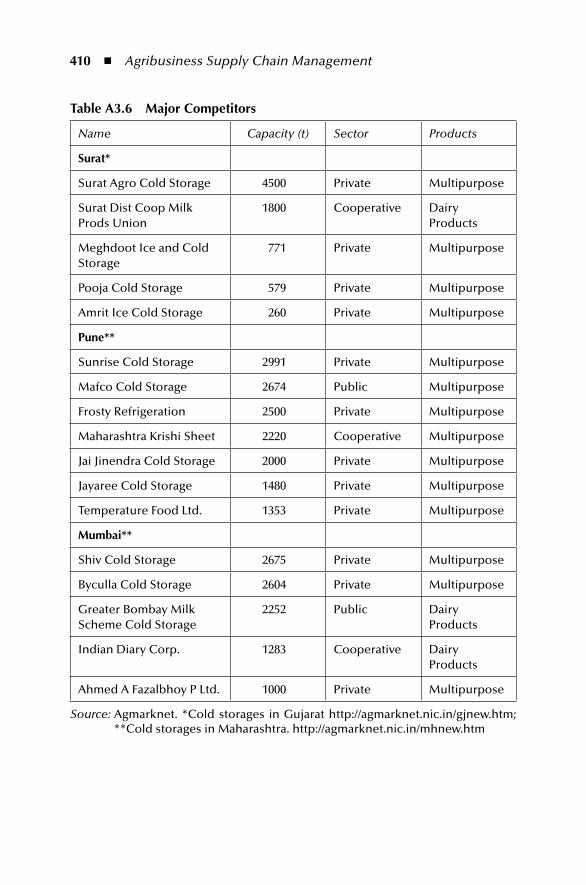
410 ◾ Agribusiness Supply Chain Management
table A3.6 major Competitors
Name Capacity (t) Sector Products
Surat*
Surat Agro Cold Storage 4500 Private Multipurpose
Surat Dist Coop Milk Prods Union
1800 Cooperative Dairy Products
Meghdoot Ice and Cold Storage
771 Private Multipurpose
Pooja Cold Storage 579 Private Multipurpose
Amrit Ice Cold Storage 260 Private Multipurpose
pune**
Sunrise Cold Storage 2991 Private Multipurpose
Mafco Cold Storage 2674 Public Multipurpose
Frosty Refrigeration 2500 Private Multipurpose
Maharashtra Krishi Sheet 2220 Cooperative Multipurpose
Jai Jinendra Cold Storage 2000 Private Multipurpose
Jayaree Cold Storage 1480 Private Multipurpose
Temperature Food Ltd. 1353 Private Multipurpose
mumbai**
Shiv Cold Storage 2675 Private Multipurpose
Byculla Cold Storage 2604 Private Multipurpose
Greater Bombay Milk Scheme Cold Storage
2252 Public Dairy Products
Indian Diary Corp. 1283 Cooperative Dairy Products
Ahmed A Fazalbhoy P Ltd. 1000 Private Multipurpose
Source: Agmarknet. *Cold storages in Gujarat http://agmarknet.nic.in/gjnew.htm; **Cold storages in Maharashtra. http://agmarknet.nic.in/mhnew.htm
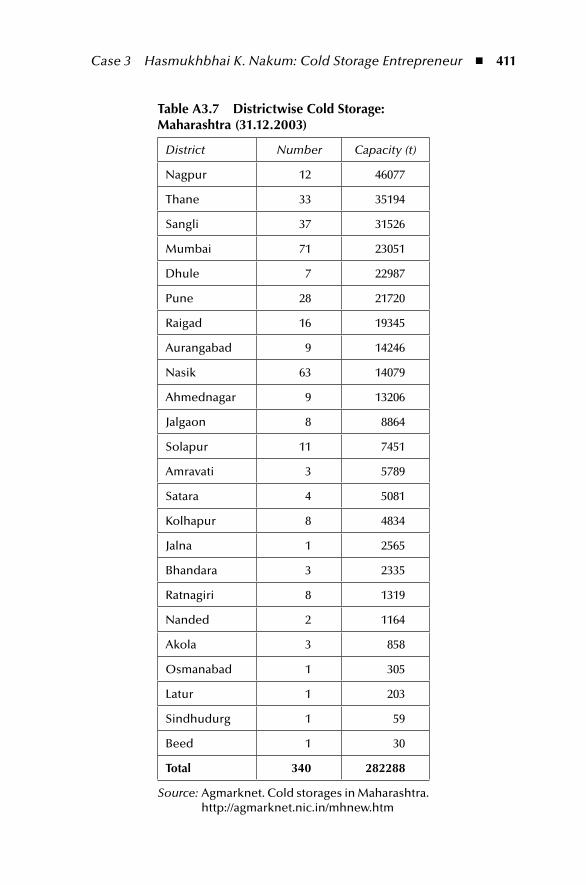
Case 3 Hasmukhbhai K. Nakum: Cold Storage Entrepreneur ◾ 411
table A3.7 Districtwise Cold Storage: maharashtra (31.12.2003)
District Number Capacity (t)
Nagpur 12 46077
Thane 33 35194
Sangli 37 31526
Mumbai 71 23051
Dhule 7 22987
Pune 28 21720
Raigad 16 19345
Aurangabad 9 14246
Nasik 63 14079
Ahmednagar 9 13206
Jalgaon 8 8864
Solapur 11 7451
Amravati 3 5789
Satara 4 5081
Kolhapur 8 4834
Jalna 1 2565
Bhandara 3 2335
Ratnagiri 8 1319
Nanded 2 1164
Akola 3 858
Osmanabad 1 305
Latur 1 203
Sindhudurg 1 59
Beed 1 30
total 340 282288
Source: Agmarknet. Cold storages in Maharashtra. http://agmarknet.nic.in/mhnew.htm
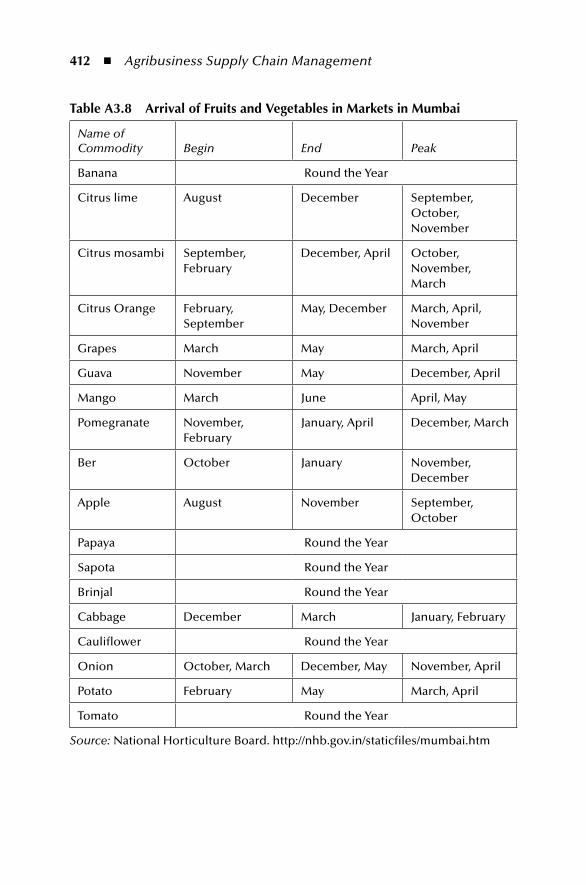
412 ◾ Agribusiness Supply Chain Management
table A3.8 Arrival of Fruits and Vegetables in markets in mumbai
Name of Commodity Begin End Peak
Banana Round the Year
Citrus lime August December September, October, November
Citrus mosambi September, February
December, April October, November, March
Citrus Orange February, September
May, December March, April, November
Grapes March May March, April
Guava November May December, April
Mango March June April, May
Pomegranate November, February
January, April December, March
Ber October January November, December
Apple August November September, October
Papaya Round the Year
Sapota Round the Year
Brinjal Round the Year
Cabbage December March January, February
Cauliflower Round the Year
Onion October, March December, May November, April
Potato February May March, April
Tomato Round the Year
Source: National Horticulture Board. http://nhb.gov.in/staticfiles/mumbai.htm
Case 3 Hasmukhbhai K. Nakum: Cold Storage Entrepreneur ◾ 413
Challenges for expansionAccording to Hasmukhbhai, the following were the challenges that he would face:
◾ Land availability is decreasing in the vicinity of the metros. Land prices are increasing
◾ Earlier the subsidy was given on the amount invested but now it is given on the volume of storage space created. It is also limited to `50 l. (See section on page 436, “Subsidy Schemes for Cold Storages.”) The subsidy does not distin-guish entrepreneurs with and without experience, across locations and other cost influencing dimensions. Many have entered this business because of the subsidy, creating a mismatch between supply and demand in certain locations
◾ Power availability is an issue as also its reliability. This has implications on maintaining the products stored. Further, the cost is high
◾ The seasonality in arrivals makes it difficult to achieve 100% utilization ◾ There are also variations in the day to day arrivals caused by speculations,
black marketing and other malpractices. This is partly due to insufficient data supplied by APMC on expected arrivals
Mr. Hasmukhbhai had to take a decision keeping in mind the relative costs and benefits involved in these three cities. This would further his cause of aggressive growth.
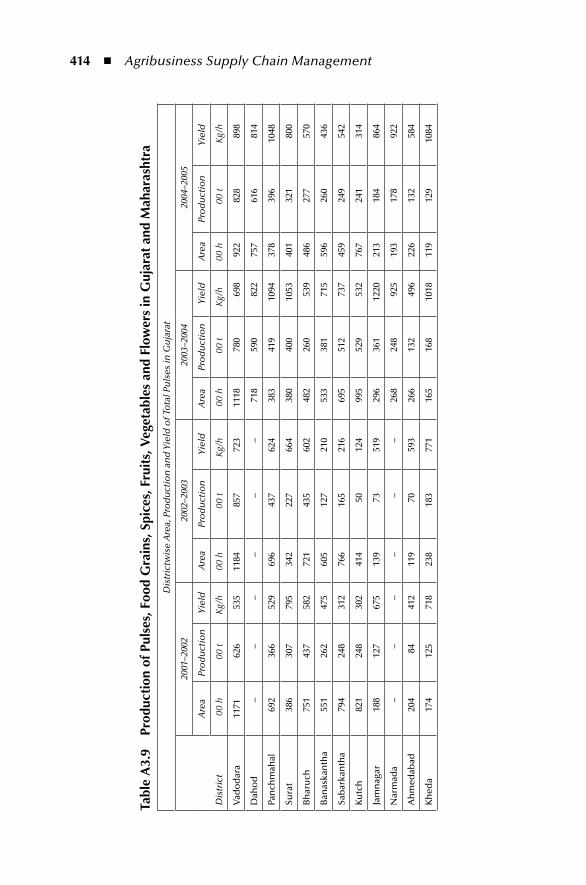
414 ◾ Agribusiness Supply Chain Management
tabl
e A
3.9
prod
ucti
on o
f pul
ses,
Foo
d G
rain
s, S
pice
s, F
ruit
s, V
eget
able
s an
d Fl
ower
s in
Guj
arat
and
mah
aras
htra
Dis
tric
twis
e A
rea,
Pro
du
ctio
n a
nd
Yie
ld o
f To
tal P
uls
es in
Gu
jara
t
Dis
tric
t
2001
–200
220
02–2
003
2003
–200
420
04–2
005
Are
aPr
od
uct
ion
Yie
ldA
rea
Pro
du
ctio
nY
ield
Are
aPr
od
uct
ion
Yie
ldA
rea
Pro
du
ctio
nY
ield
00 h
00 t
Kg/
h00
h00
tK
g/h
00 h
00 t
Kg/
h00
h00
tK
g/h
Vad
od
ara
1171
626
535
1184
857
723
1118
780
698
922
828
898
Dah
od
––
––
––
718
590
822
757
616
814
Pan
chm
ahal
692
366
529
696
437
624
383
419
1094
378
396
1048
Sura
t38
630
779
534
222
766
438
040
010
5340
132
180
0
Bh
aru
ch75
143
758
272
143
560
248
226
053
948
627
757
0
Ban
aska
nth
a55
126
247
560
512
721
053
338
171
559
626
043
6
Sab
arka
nth
a79
424
831
276
616
521
669
551
273
745
924
954
2
Ku
tch
821
248
302
414
5012
499
552
953
276
724
131
4
Jam
nag
ar18
812
767
513
973
519
296
361
1220
213
184
864
Nar
mad
a–
––
––
–26
824
892
519
317
892
2
Ah
med
abad
204
8441
211
970
593
266
132
496
226
132
584
Kh
eda
174
125
718
238
183
771
165
168
1018
119
129
1084
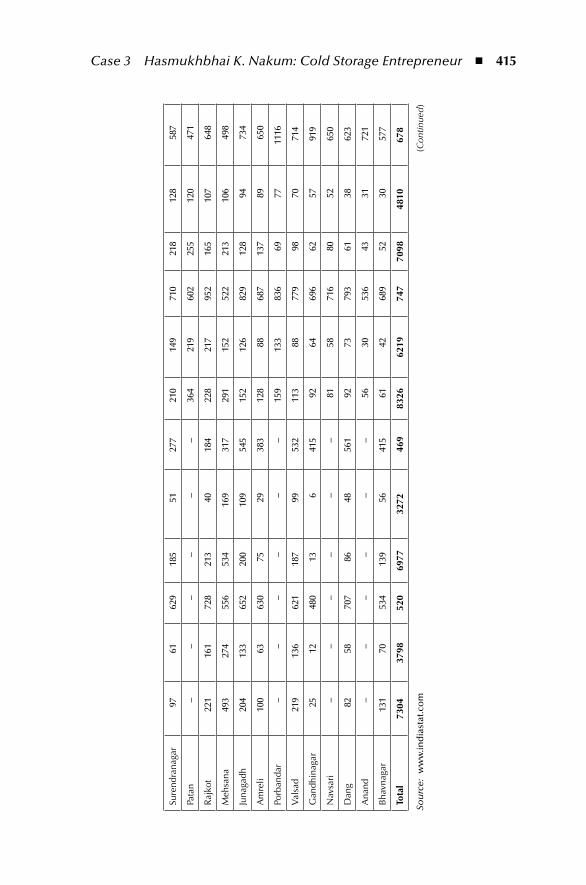
Case 3 Hasmukhbhai K. Nakum: Cold Storage Entrepreneur ◾ 415
Sure
ndra
naga
r97
6162
918
551
277
210
149
710
218
128
587
Pata
n–
––
––
–36
421
960
225
512
047
1
Raj
kot
221
161
728
213
4018
422
821
795
216
510
764
8
Meh
sana
493
274
556
534
169
317
291
152
522
213
106
498
Juna
gadh
204
133
652
200
109
545
152
126
829
128
9473
4
Am
reli
100
6363
075
2938
312
888
687
137
8965
0
Porb
anda
r–
––
––
–15
913
383
669
7711
16
Val
sad
219
136
621
187
9953
211
388
779
9870
714
Gan
dhin
agar
2512
480
136
415
9264
696
6257
919
Nav
sari
––
––
––
8158
716
8052
650
Dan
g82
5870
786
4856
192
7379
361
3862
3
Ana
nd–
––
––
–56
3053
643
3172
1
Bha
vnag
ar13
170
534
139
5641
561
4268
952
3057
7
tota
l73
0437
9852
069
7732
7246
983
2662
1974
770
9848
1067
8
Sou
rce:
w
ww
.ind
iast
at.c
om
(C
ontin
ued)
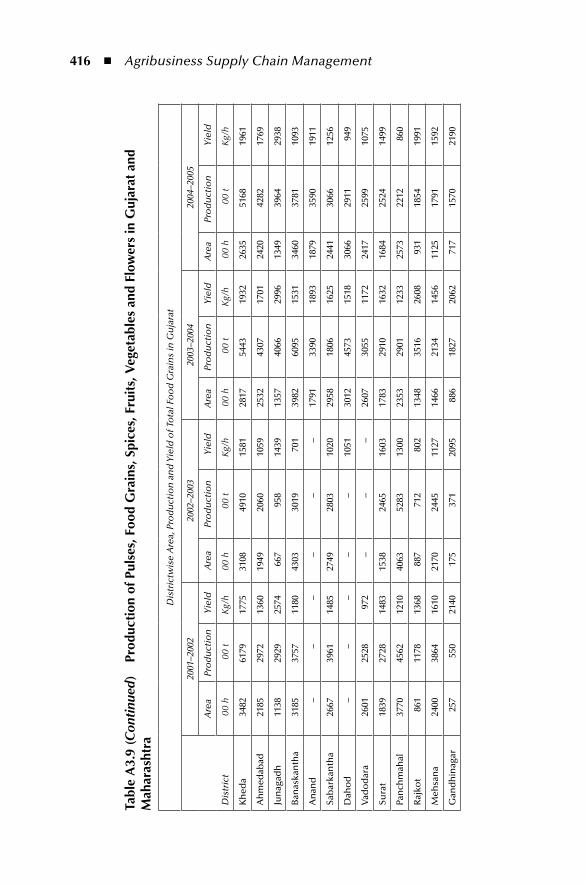
416 ◾ Agribusiness Supply Chain Management
tabl
e A
3.9
(Con
tinu
ed)
prod
ucti
on o
f pul
ses,
Foo
d G
rain
s, S
pice
s, F
ruit
s, V
eget
able
s an
d Fl
ower
s in
Guj
arat
and
m
ahar
asht
ra
Dis
tric
twis
e A
rea,
Pro
du
ctio
n a
nd
Yie
ld o
f To
tal F
oo
d G
rain
s in
Gu
jara
t
Dis
tric
t
2001
–200
220
02–2
003
2003
–200
420
04–2
005
Are
aPr
od
uct
ion
Yie
ldA
rea
Pro
du
ctio
nY
ield
Are
aPr
od
uct
ion
Yie
ldA
rea
Pro
du
ctio
nY
ield
00 h
00 t
Kg/
h00
h00
tK
g/h
00 h
00 t
Kg/
h00
h00
tK
g/h
Kh
eda
3482
6179
1775
3108
4910
1581
2817
5443
1932
2635
5168
1961
Ah
med
abad
2185
2972
1360
1949
2060
1059
2532
4307
1701
2420
4282
1769
Jun
agad
h11
3829
2925
7466
795
814
3913
5740
6629
9613
49
3964
2938
Ban
aska
nth
a31
8537
5711
8043
0330
1970
139
8260
9515
3134
6037
8110
93
An
and
––
––
––
1791
3390
1893
1879
3590
1911
Sab
arka
nth
a26
6739
6114
8527
4928
0310
2029
5818
0616
2524
41
3066
1256
Dah
od
––
––
–10
5130
1245
7315
1830
66
2911
949
Vad
od
ara
2601
2528
972
––
–26
0730
5511
7224
1725
9910
75
Sura
t18
3927
2814
8315
3824
6516
0317
8329
1016
3216
8425
2414
99
Pan
chm
ahal
3770
4562
1210
4063
5283
1300
2353
2901
1233
2573
2212
860
Raj
kot
861
1178
1368
887
712
802
1348
3516
2608
931
1854
1991
Meh
san
a24
0038
6416
1021
7024
4511
2714
6621
3414
5611
2517
9115
92
Gan
dh
inag
ar25
755
021
4017
537
120
9588
618
2720
6271
715
7021
90
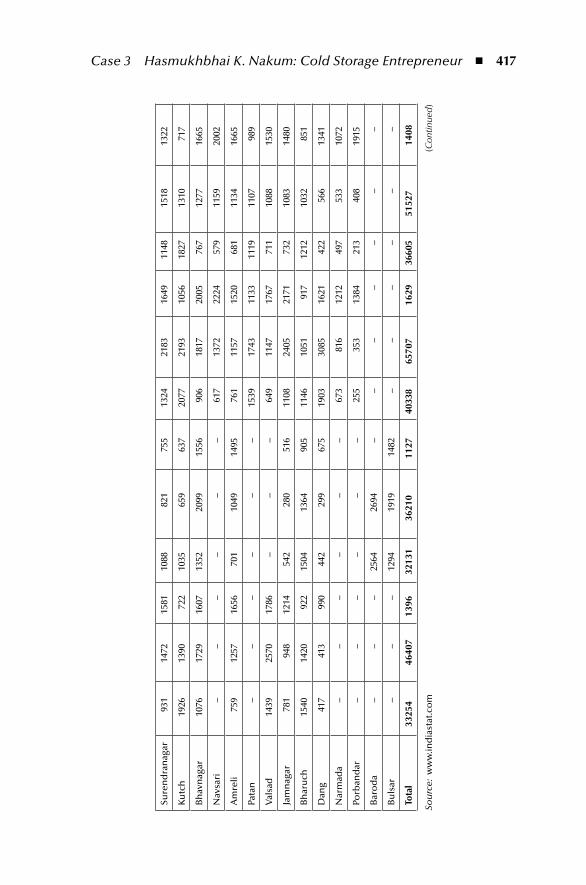
Case 3 Hasmukhbhai K. Nakum: Cold Storage Entrepreneur ◾ 417
Sure
nd
ran
agar
931
1472
1581
1088
821
755
1324
2183
1649
1148
1518
1322
Ku
tch
1926
1390
722
1035
659
637
2077
2193
1056
1827
13
1071
7
Bh
avn
agar
1076
1729
1607
1352
2099
1556
906
1817
2005
767
1277
1665
Nav
sari
––
––
––
617
1372
2224
579
1159
2002
Am
reli
759
1257
1656
701
1049
1495
761
1157
1520
681
1134
1665
Pata
n–
––
––
–15
3917
4311
3311
1911
0798
9
Val
sad
1439
2570
1786
––
–64
911
4717
6771
110
8815
30
Jam
nag
ar78
194
812
1454
228
051
611
0824
0521
7173
210
8314
80
Bh
aru
ch15
4014
2092
215
0413
6490
511
4610
5191
712
1210
3285
1
Dan
g41
741
399
044
229
967
519
0330
8516
2142
256
613
41
Nar
mad
a–
––
––
–67
381
612
1249
753
310
72
Porb
and
ar–
––
––
–25
535
313
8421
340
819
15
Bar
od
a–
––
2564
2694
––
––
––
–
Bu
lsar
––
–12
9419
1914
82–
––
––
–
tota
l33
254
4640
713
9632
131
3621
011
2740
338
6570
716
2936
605
5152
714
08
Sou
rce:
ww
w.in
dia
stat
.co
m
(Con
tinue
d)
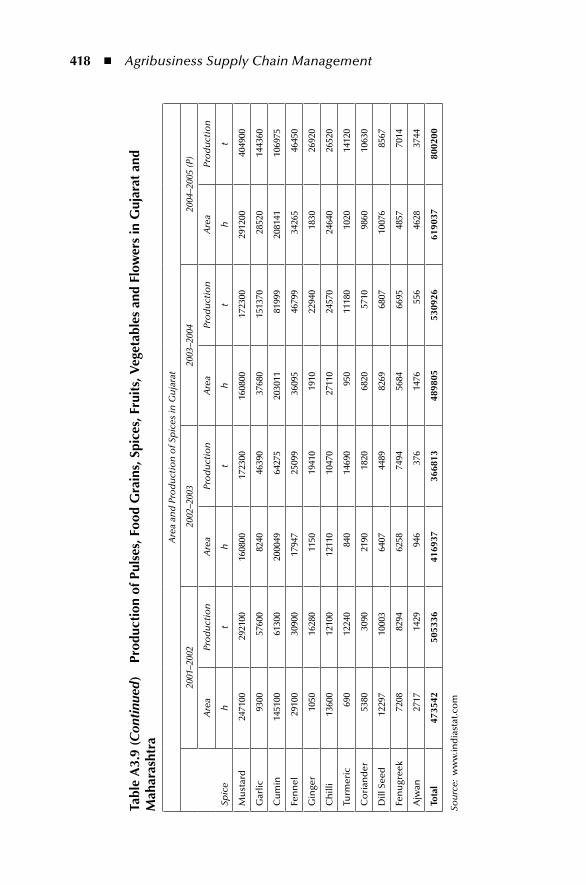
418 ◾ Agribusiness Supply Chain Management
tabl
e A
3.9
(Con
tinu
ed)
prod
ucti
on o
f pul
ses,
Foo
d G
rain
s, S
pice
s, F
ruit
s, V
eget
able
s an
d Fl
ower
s in
Guj
arat
and
m
ahar
asht
ra
Are
a an
d P
rod
uct
ion
of S
pic
es in
Gu
jara
t
Spic
e
2001
–200
220
02–2
003
2003
–200
420
04–2
005
(P)
Are
aPr
od
uct
ion
Are
aPr
od
uct
ion
Are
aPr
od
uct
ion
Are
aPr
od
uct
ion
ht
ht
ht
ht
Mu
star
d24
7100
2921
0016
0800
1723
0016
0800
1723
0029
1200
4049
00
Gar
lic93
0057
600
8240
4639
037
680
1513
7028
520
1443
60
Cu
min
1451
0061
300
2000
4964
275
2030
1181
999
2081
4110
6975
Fen
nel
2910
030
900
1794
725
099
3609
546
799
3426
546
450
Gin
ger
1050
1628
011
5019
410
1910
2294
018
3026
920
Ch
illi
1360
012
100
1211
010
470
2711
024
570
2464
026
520
Turm
eric
690
1224
084
014
690
950
1118
010
2014
120
Co
rian
der
5380
3090
2190
1820
6820
5710
9860
1063
0
Dill
See
d12
297
1000
364
0744
8982
6968
0710
076
8567
Fen
ugr
eek
7208
8294
6258
7494
5684
6695
4857
7014
Ajw
an27
1714
2994
637
614
7655
646
2837
44
tota
l47
3542
5053
3641
6937
3668
1348
9805
5309
2661
9037
8002
00
Sou
rce:
ww
w.in
dia
stat
.co
m
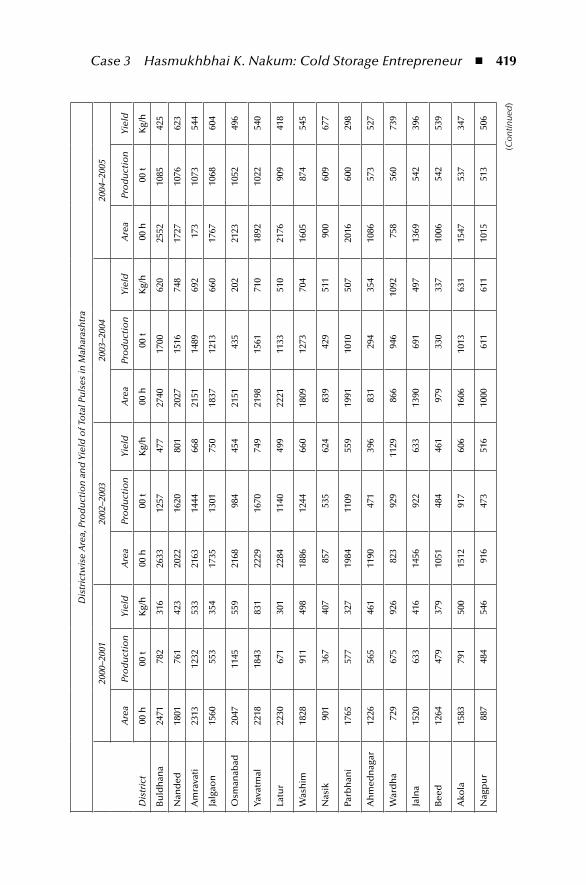
Case 3 Hasmukhbhai K. Nakum: Cold Storage Entrepreneur ◾ 419
Dis
tric
twis
e A
rea,
Pro
du
ctio
n a
nd
Yie
ld o
f To
tal P
uls
es in
Mah
aras
htr
a
Dis
tric
t
2000
–200
120
02–2
003
2003
–200
420
04–2
005
Are
aPr
od
uct
ion
Yie
ldA
rea
Pro
du
ctio
nY
ield
Are
aPr
od
uct
ion
Yie
ldA
rea
Pro
du
ctio
nY
ield
00 h
00 t
Kg/
h00
h00
tK
g/h
00 h
00 t
Kg/
h00
h00
tK
g/h
Bu
ldh
ana
2471
782
316
2633
1257
477
2740
1700
620
2552
1085
425
Nan
ded
1801
761
423
2022
1620
801
2027
1516
748
1727
1076
623
Am
rava
ti23
1312
3253
321
6314
4466
821
5114
8969
217
310
7354
4
Jalg
aon
1560
553
354
1735
1301
750
1837
1213
660
1767
1068
604
Osm
anab
ad20
4711
4555
921
6898
445
421
5143
520
221
2310
5249
6
Yava
tmal
2218
1843
831
2229
1670
749
2198
1561
710
1892
1022
540
Latu
r22
3067
130
122
8411
4049
922
2111
3351
021
7690
941
8
Was
him
1828
911
498
1886
1244
660
1809
1273
704
1605
874
545
Nas
ik90
136
740
785
753
562
483
942
951
190
060
967
7
Parb
han
i17
6557
732
719
8411
0955
919
9110
1050
720
1660
029
8
Ah
med
nag
ar12
2656
546
111
9047
139
683
129
435
410
8657
352
7
War
dh
a72
967
592
682
392
911
2986
694
610
9275
856
073
9
Jaln
a15
2063
341
614
5692
263
313
9069
149
713
6954
239
6
Bee
d12
6447
937
910
5148
446
197
933
033
710
0654
253
9
Ako
la15
8379
150
015
1291
760
616
0610
1363
115
4753
734
7
Nag
pu
r88
748
454
691
647
351
610
0061
161
110
1551
350
6
(Con
tinue
d)
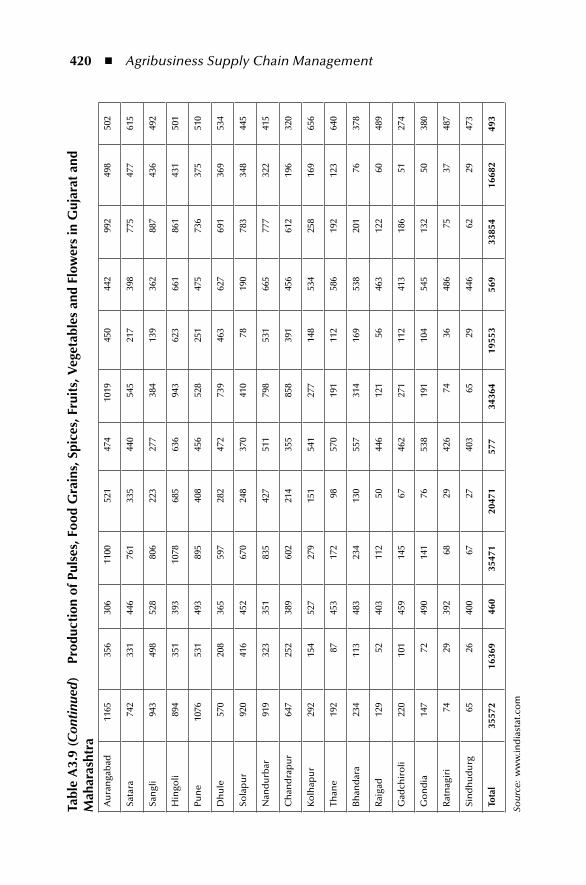
420 ◾ Agribusiness Supply Chain Management
tabl
e A
3.9
(Con
tinu
ed)
prod
ucti
on o
f pul
ses,
Foo
d G
rain
s, S
pice
s, F
ruit
s, V
eget
able
s an
d Fl
ower
s in
Guj
arat
and
m
ahar
asht
raA
ura
nga
bad
1165
356
306
1100
521
474
1019
450
442
992
498
502
Sata
ra74
233
144
676
133
544
054
521
739
877
547
761
5
San
gli
943
498
528
806
223
277
384
139
362
887
436
492
Hin
goli
894
351
393
1078
685
636
943
623
661
861
431
501
Pun
e10
7653
149
389
540
845
652
825
147
573
637
551
0
Dh
ule
570
208
365
597
282
472
739
463
627
691
369
534
Sola
pu
r92
041
645
267
024
837
041
078
190
783
348
445
Nan
du
rbar
919
323
351
835
427
511
798
531
665
777
322
415
Ch
and
rap
ur
647
252
389
602
214
355
858
391
456
612
196
320
Ko
lhap
ur
292
154
527
279
151
541
277
148
534
258
169
656
Than
e19
287
453
172
9857
019
111
258
619
212
364
0
Bh
and
ara
234
113
483
234
130
557
314
169
538
201
7637
8
Rai
gad
129
5240
311
250
446
121
5646
312
260
489
Gad
chir
oli
220
101
459
145
6746
227
111
241
318
651
274
Go
nd
ia14
772
490
141
7653
819
110
454
513
250
380
Rat
nag
iri
7429
392
6829
426
7436
486
7537
487
Sin
dh
ud
urg
6526
400
6727
403
6529
446
6229
473
tota
l35
572
1636
946
035
471
2047
157
734
364
1955
356
933
854
1668
249
3
Sou
rce:
ww
w.in
dia
stat
.co
m
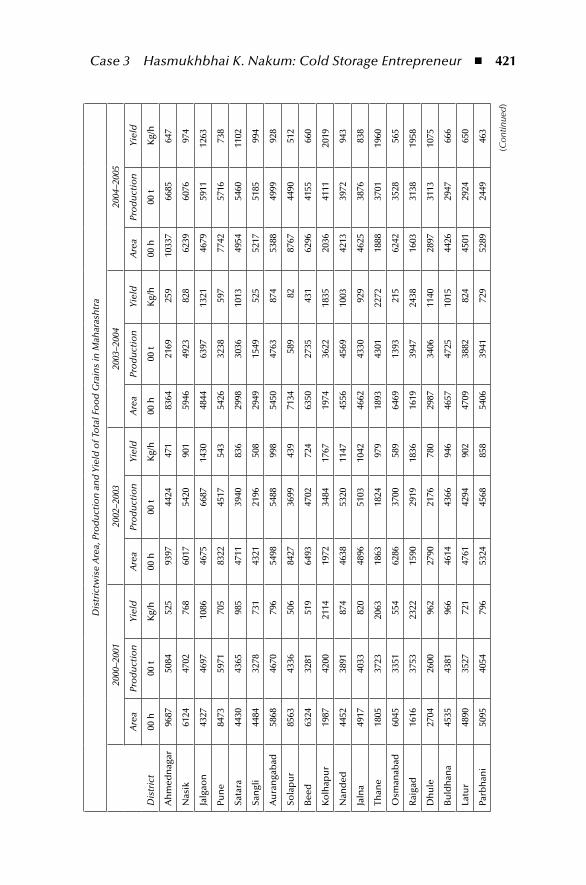
Case 3 Hasmukhbhai K. Nakum: Cold Storage Entrepreneur ◾ 421
Dis
tric
twis
e A
rea,
Pro
du
ctio
n a
nd
Yie
ld o
f To
tal F
oo
d G
rain
s in
Mah
aras
htr
a
Dis
tric
t
2000
–200
120
02–2
003
2003
–200
420
04–2
005
Are
aPr
od
uct
ion
Yie
ldA
rea
Pro
du
ctio
nY
ield
Are
aPr
od
uct
ion
Yie
ldA
rea
Pro
du
ctio
nY
ield
00 h
00 t
Kg/
h00
h00
tK
g/h
00 h
00 t
Kg/
h00
h00
tK
g/h
Ah
med
nag
ar96
8750
8452
593
9744
2447
183
6421
6925
910
337
6685
647
Nas
ik61
2447
0276
860
1754
2090
159
4649
2382
862
3960
7697
4
Jalg
aon
4327
4697
1086
4675
6687
1430
4844
6397
1321
4679
5911
1263
Pun
e84
7359
7170
583
2245
1754
354
2632
3859
777
4257
1673
8
Sata
ra44
3043
6598
547
1139
4083
629
9830
3610
1349
5454
6011
02
San
gli
4484
3278
731
4321
2196
508
2949
1549
525
5217
5185
994
Au
ran
gab
ad58
6846
7079
654
9854
8899
854
5047
6387
453
8849
9992
8
Sola
pu
r85
6343
3650
684
2736
9943
971
3458
982
8767
4490
512
Bee
d63
2432
8151
964
9347
0272
463
5027
3543
162
9641
5566
0
Ko
lhap
ur
1987
4200
2114
1972
3484
1767
1974
3622
1835
2036
4111
2019
Nan
ded
4452
3891
874
4638
5320
1147
4556
4569
1003
4213
3972
943
Jaln
a49
1740
3382
048
9651
0310
4246
6243
3092
946
2538
7683
8
Than
e18
0537
2320
6318
6318
2497
918
9343
0122
7218
8837
0119
60
Osm
anab
ad60
4533
5155
462
8637
0058
964
6913
9321
562
4235
2856
5
Rai
gad
1616
3753
2322
1590
2919
1836
1619
3947
2438
1603
3138
1958
Dh
ule
2704
2600
962
2790
2176
780
2987
3406
1140
2897
3113
1075
Bu
ldh
ana
4535
4381
966
4614
4366
946
4657
4725
1015
4426
2947
666
Latu
r48
9035
2772
147
6142
9490
247
0938
8282
445
0129
2465
0
Parb
han
i50
9540
5479
653
2445
6885
854
0639
4172
952
8924
4946
3
(Con
tinue
d)
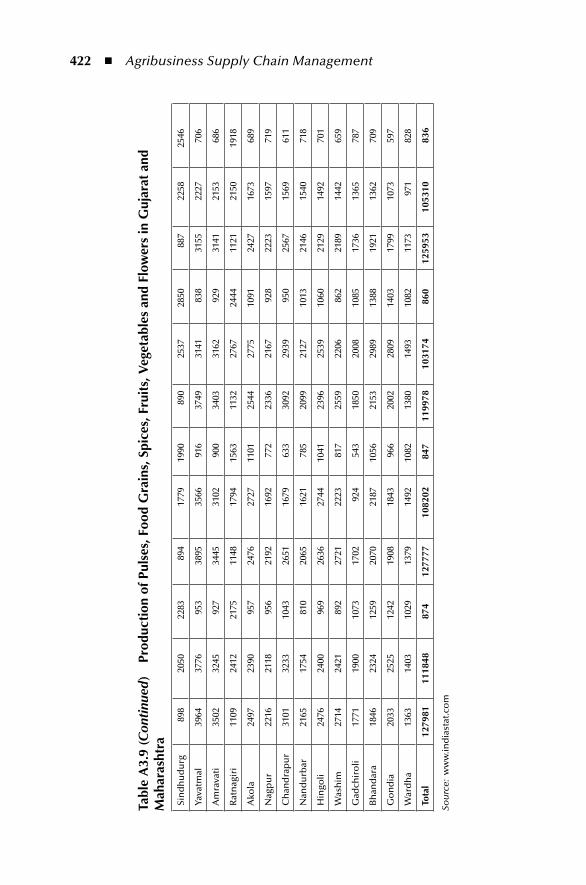
422 ◾ Agribusiness Supply Chain Management
tabl
e A
3.9
(Con
tinu
ed)
prod
ucti
on o
f pul
ses,
Foo
d G
rain
s, S
pice
s, F
ruit
s, V
eget
able
s an
d Fl
ower
s in
Guj
arat
and
m
ahar
asht
ra
Sin
dh
ud
urg
898
2050
2283
894
1779
1990
890
2537
2850
887
2258
2546
Yava
tmal
3964
3776
953
3895
3566
916
3749
3141
838
3155
2227
706
Am
rava
ti35
0232
4592
734
4531
0290
034
0331
6292
931
4121
5368
6
Rat
nag
iri
1109
2412
2175
1148
1794
1563
1132
2767
2444
1121
2150
1918
Ako
la24
9723
9095
724
7627
2711
0125
4427
7510
9124
2716
7368
9
Nag
pu
r22
1621
1895
621
9216
9277
223
3621
6792
822
2315
9771
9
Ch
and
rap
ur
3101
3233
1043
2651
1679
633
3092
2939
950
2567
1569
611
Nan
du
rbar
2165
1754
810
2065
1621
785
2099
2127
1013
2146
1540
718
Hin
goli
2476
2400
969
2636
2744
1041
2396
2539
1060
2129
1492
701
Was
him
2714
2421
892
2721
2223
817
2559
2206
862
2189
1442
659
Gad
chir
oli
1771
1900
1073
1702
924
543
1850
2008
1085
1736
1365
787
Bh
and
ara
1846
2324
1259
2070
2187
1056
2153
2989
1388
1921
1362
709
Go
nd
ia20
3325
2512
4219
0818
4396
620
0228
0914
0317
9910
7359
7
War
dh
a13
6314
0310
2913
7914
9210
8213
8014
9310
8211
7397
182
8
tota
l12
7981
1118
4887
412
7777
1082
0284
711
9978
1031
7486
012
5953
1053
1083
6
Sou
rce:
ww
w.in
dia
stat
.co
m
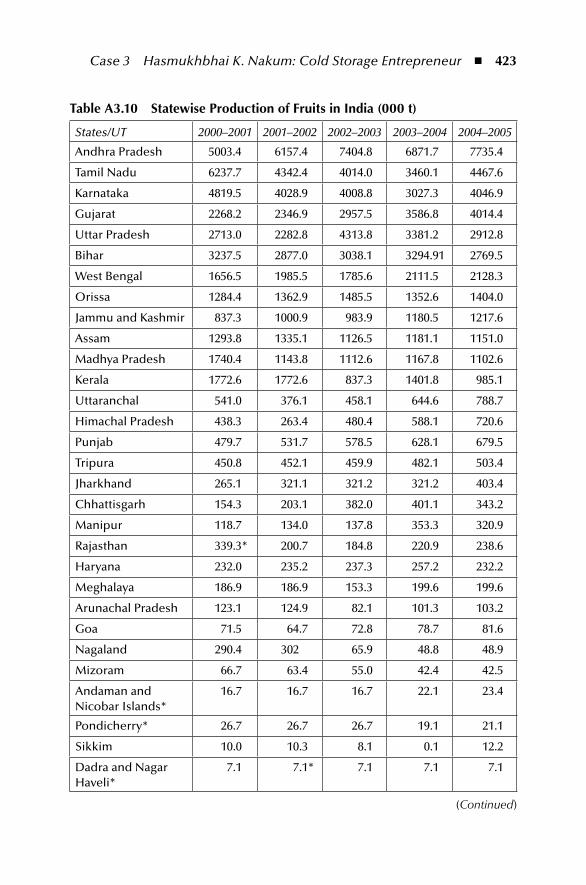
Case 3 Hasmukhbhai K. Nakum: Cold Storage Entrepreneur ◾ 423
table A3.10 Statewise production of Fruits in india (000 t)
States/UT 2000–2001 2001–2002 2002–2003 2003–2004 2004–2005
Andhra Pradesh 5003.4 6157.4 7404.8 6871.7 7735.4
Tamil Nadu 6237.7 4342.4 4014.0 3460.1 4467.6
Karnataka 4819.5 4028.9 4008.8 3027.3 4046.9
Gujarat 2268.2 2346.9 2957.5 3586.8 4014.4
Uttar Pradesh 2713.0 2282.8 4313.8 3381.2 2912.8
Bihar 3237.5 2877.0 3038.1 3294.91 2769.5
West Bengal 1656.5 1985.5 1785.6 2111.5 2128.3
Orissa 1284.4 1362.9 1485.5 1352.6 1404.0
Jammu and Kashmir 837.3 1000.9 983.9 1180.5 1217.6
Assam 1293.8 1335.1 1126.5 1181.1 1151.0
Madhya Pradesh 1740.4 1143.8 1112.6 1167.8 1102.6
Kerala 1772.6 1772.6 837.3 1401.8 985.1
Uttaranchal 541.0 376.1 458.1 644.6 788.7
Himachal Pradesh 438.3 263.4 480.4 588.1 720.6
Punjab 479.7 531.7 578.5 628.1 679.5
Tripura 450.8 452.1 459.9 482.1 503.4
Jharkhand 265.1 321.1 321.2 321.2 403.4
Chhattisgarh 154.3 203.1 382.0 401.1 343.2
Manipur 118.7 134.0 137.8 353.3 320.9
Rajasthan 339.3* 200.7 184.8 220.9 238.6
Haryana 232.0 235.2 237.3 257.2 232.2
Meghalaya 186.9 186.9 153.3 199.6 199.6
Arunachal Pradesh 123.1 124.9 82.1 101.3 103.2
Goa 71.5 64.7 72.8 78.7 81.6
Nagaland 290.4 302 65.9 48.8 48.9
Mizoram 66.7 63.4 55.0 42.4 42.5
Andaman and Nicobar Islands*
16.7 16.7 16.7 22.1 23.4
Pondicherry* 26.7 26.7 26.7 19.1 21.1
Sikkim 10.0 10.3 8.1 0.1 12.2
Dadra and Nagar Haveli*
7.1 7.1* 7.1 7.1 7.1
(Continued)
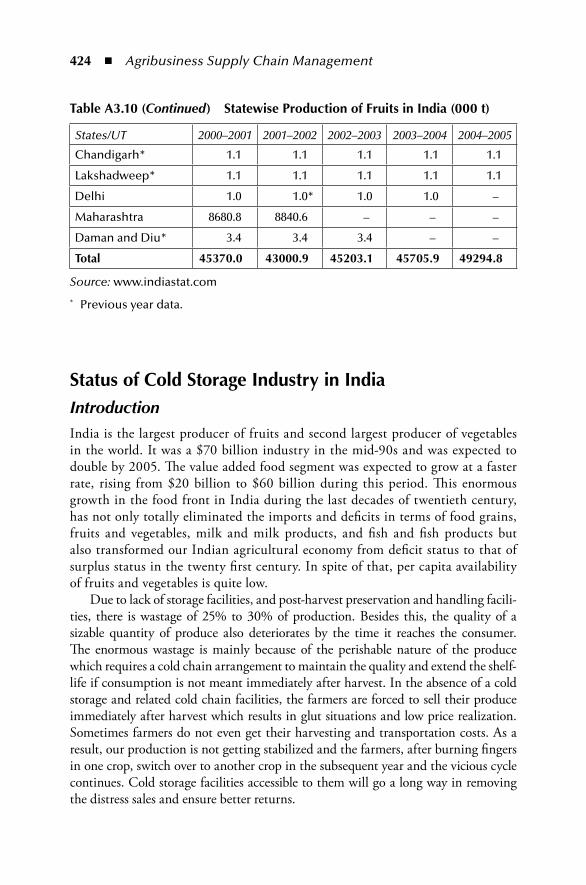
424 ◾ Agribusiness Supply Chain Management
Status of Cold Storage industry in indiaIntroductionIndia is the largest producer of fruits and second largest producer of vegetables in the world. It was a $70 billion industry in the mid-90s and was expected to double by 2005. The value added food segment was expected to grow at a faster rate, rising from $20 billion to $60 billion during this period. This enormous growth in the food front in India during the last decades of twentieth century, has not only totally eliminated the imports and deficits in terms of food grains, fruits and vegetables, milk and milk products, and fish and fish products but also transformed our Indian agricultural economy from deficit status to that of surplus status in the twenty first century. In spite of that, per capita availability of fruits and vegetables is quite low.
Due to lack of storage facilities, and post-harvest preservation and handling facili-ties, there is wastage of 25% to 30% of production. Besides this, the quality of a sizable quantity of produce also deteriorates by the time it reaches the consumer. The enormous wastage is mainly because of the perishable nature of the produce which requires a cold chain arrangement to maintain the quality and extend the shelf-life if consumption is not meant immediately after harvest. In the absence of a cold storage and related cold chain facilities, the farmers are forced to sell their produce immediately after harvest which results in glut situations and low price realization. Sometimes farmers do not even get their harvesting and transportation costs. As a result, our production is not getting stabilized and the farmers, after burning fingers in one crop, switch over to another crop in the subsequent year and the vicious cycle continues. Cold storage facilities accessible to them will go a long way in removing the distress sales and ensure better returns.
table A3.10 (Continued) Statewise production of Fruits in india (000 t)
States/UT 2000–2001 2001–2002 2002–2003 2003–2004 2004–2005
Chandigarh* 1.1 1.1 1.1 1.1 1.1
Lakshadweep* 1.1 1.1 1.1 1.1 1.1
Delhi 1.0 1.0* 1.0 1.0 –
Maharashtra 8680.8 8840.6 – – –
Daman and Diu* 3.4 3.4 3.4 – –
total 45370.0 43000.9 45203.1 45705.9 49294.8
Source: www.indiastat.com
* Previous year data.
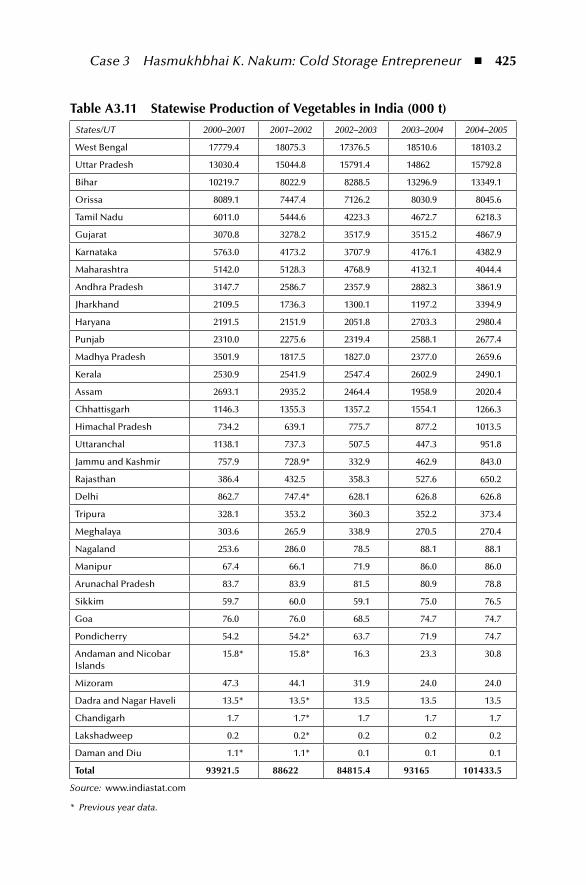
Case 3 Hasmukhbhai K. Nakum: Cold Storage Entrepreneur ◾ 425
table A3.11 Statewise production of Vegetables in india (000 t)
States/UT 2000–2001 2001–2002 2002–2003 2003–2004 2004–2005
West Bengal 17779.4 18075.3 17376.5 18510.6 18103.2
Uttar Pradesh 13030.4 15044.8 15791.4 14862 15792.8
Bihar 10219.7 8022.9 8288.5 13296.9 13349.1
Orissa 8089.1 7447.4 7126.2 8030.9 8045.6
Tamil Nadu 6011.0 5444.6 4223.3 4672.7 6218.3
Gujarat 3070.8 3278.2 3517.9 3515.2 4867.9
Karnataka 5763.0 4173.2 3707.9 4176.1 4382.9
Maharashtra 5142.0 5128.3 4768.9 4132.1 4044.4
Andhra Pradesh 3147.7 2586.7 2357.9 2882.3 3861.9
Jharkhand 2109.5 1736.3 1300.1 1197.2 3394.9
Haryana 2191.5 2151.9 2051.8 2703.3 2980.4
Punjab 2310.0 2275.6 2319.4 2588.1 2677.4
Madhya Pradesh 3501.9 1817.5 1827.0 2377.0 2659.6
Kerala 2530.9 2541.9 2547.4 2602.9 2490.1
Assam 2693.1 2935.2 2464.4 1958.9 2020.4
Chhattisgarh 1146.3 1355.3 1357.2 1554.1 1266.3
Himachal Pradesh 734.2 639.1 775.7 877.2 1013.5
Uttaranchal 1138.1 737.3 507.5 447.3 951.8
Jammu and Kashmir 757.9 728.9* 332.9 462.9 843.0
Rajasthan 386.4 432.5 358.3 527.6 650.2
Delhi 862.7 747.4* 628.1 626.8 626.8
Tripura 328.1 353.2 360.3 352.2 373.4
Meghalaya 303.6 265.9 338.9 270.5 270.4
Nagaland 253.6 286.0 78.5 88.1 88.1
Manipur 67.4 66.1 71.9 86.0 86.0
Arunachal Pradesh 83.7 83.9 81.5 80.9 78.8
Sikkim 59.7 60.0 59.1 75.0 76.5
Goa 76.0 76.0 68.5 74.7 74.7
Pondicherry 54.2 54.2* 63.7 71.9 74.7
Andaman and Nicobar Islands
15.8* 15.8* 16.3 23.3 30.8
Mizoram 47.3 44.1 31.9 24.0 24.0
Dadra and Nagar Haveli 13.5* 13.5* 13.5 13.5 13.5
Chandigarh 1.7 1.7* 1.7 1.7 1.7
Lakshadweep 0.2 0.2* 0.2 0.2 0.2
Daman and Diu 1.1* 1.1* 0.1 0.1 0.1
total 93921.5 88622 84815.4 93165 101433.5
Source: www.indiastat.com
* Previous year data.
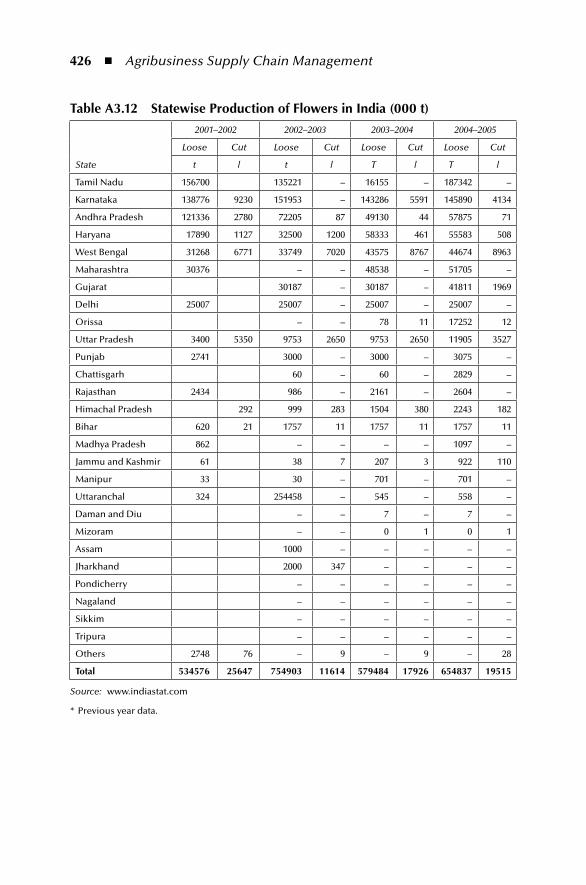
426 ◾ Agribusiness Supply Chain Management
table A3.12 Statewise production of Flowers in india (000 t)
State
2001–2002 2002–2003 2003–2004 2004–2005
Loose Cut Loose Cut Loose Cut Loose Cut
t l t l T l T l
Tamil Nadu 156700 135221 – 16155 – 187342 –
Karnataka 138776 9230 151953 – 143286 5591 145890 4134
Andhra Pradesh 121336 2780 72205 87 49130 44 57875 71
Haryana 17890 1127 32500 1200 58333 461 55583 508
West Bengal 31268 6771 33749 7020 43575 8767 44674 8963
Maharashtra 30376 – – 48538 – 51705 –
Gujarat 30187 – 30187 – 41811 1969
Delhi 25007 25007 – 25007 – 25007 –
Orissa – – 78 11 17252 12
Uttar Pradesh 3400 5350 9753 2650 9753 2650 11905 3527
Punjab 2741 3000 – 3000 – 3075 –
Chattisgarh 60 – 60 – 2829 –
Rajasthan 2434 986 – 2161 – 2604 –
Himachal Pradesh 292 999 283 1504 380 2243 182
Bihar 620 21 1757 11 1757 11 1757 11
Madhya Pradesh 862 – – – – 1097 –
Jammu and Kashmir 61 38 7 207 3 922 110
Manipur 33 30 – 701 – 701 –
Uttaranchal 324 254458 – 545 – 558 –
Daman and Diu – – 7 – 7 –
Mizoram – – 0 1 0 1
Assam 1000 – – – – –
Jharkhand 2000 347 – – – –
Pondicherry – – – – – –
Nagaland – – – – – –
Sikkim – – – – – –
Tripura – – – – – –
Others 2748 76 – 9 – 9 – 28
total 534576 25647 754903 11614 579484 17926 654837 19515
Source: www.indiastat.com
* Previous year data.
Case 3 Hasmukhbhai K. Nakum: Cold Storage Entrepreneur ◾ 427
Storage Conditions for FoodsIn low temperatures, activities of microorganisms get retarded and hence the shelf life of food items increases. Unlike high temperature, low temperature preservation cannot destroy the spoilage agents, but greatly reduces their activi-ties, providing a practical way of preserving perishable foods in their natural state which otherwise is not possible through heating. There are three groups of products:
1. Foods that are alive at the time of storage, distribution and sale, for example fruits and vegetables
2. Foods that are no longer alive and have been processed in some form, for example meat and fish products and
3. Commodities that benefit from storage at controlled temperature, for exam-ple beer, tobacco, khandsari, etc.
Living foods such as fruits and vegetables have some natural protection against the activities of microorganism. The best method of preserving these items is to keep the product alive and at the same time retard the natural enzyme activity which will retard the rate of ripening or maturity.
Preservation of non-living foods is more difficult since they are susceptible to spoilage. The problem is to preserve dead tissues from decay and putrefaction. Long term storage of meat and fish product can only be achieved by freezing and then by storing it at temperature below –15oC. Only certain fruits and vegetables can benefit from freezing. Products such as apples, tomatoes, oranges, etc., cannot be frozen and close control of temperature is necessary for long term storage. Some products can also be benefited by storing under CA and modified atmosphere (MA) conditions.
Dairy products are produced from animal fats and therefore nonliving food-stuffs. They suffer from oxidation and breakdown of their fats, causing rancidity. Packaging to exclude air and hence oxygen can extend storage life of such foodstuffs. The storage requirements of some of the important commodities are given in the following table.
Economic Size of Unit and Land RequirementsCold storage units can be used to store either a single commodity or multiple commodities. Financial viability of a unit depends upon the intended pattern of use and rental rate prevalent in an area. To set up a 5000 t capacity cold storage unit although one acre of land may be adequate, it is always better to have two acres of land to take care of future expansions and waste management. While selecting the site, care should be taken to select a site at an elevation free from
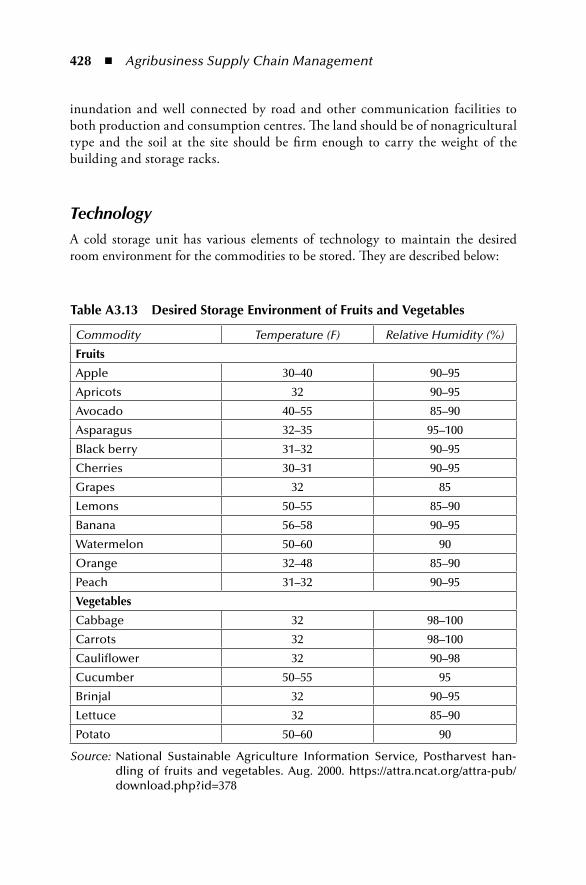
428 ◾ Agribusiness Supply Chain Management
inundation and well connected by road and other communication facilities to both production and consumption centres. The land should be of nonagricultural type and the soil at the site should be firm enough to carry the weight of the building and storage racks.
TechnologyA cold storage unit has various elements of technology to maintain the desired room environment for the commodities to be stored. They are described below:
table A3.13 Desired Storage environment of Fruits and Vegetables
Commodity Temperature (F) Relative Humidity (%)
Fruits
Apple 30–40 90–95
Apricots 32 90–95
Avocado 40–55 85–90
Asparagus 32–35 95–100
Black berry 31–32 90–95
Cherries 30–31 90–95
Grapes 32 85
Lemons 50–55 85–90
Banana 56–58 90–95
Watermelon 50–60 90
Orange 32–48 85–90
Peach 31–32 90–95
Vegetables
Cabbage 32 98–100
Carrots 32 98–100
Cauliflower 32 90–98
Cucumber 50–55 95
Brinjal 32 90–95
Lettuce 32 85–90
Potato 50–60 90
Source: National Sustainable Agriculture Information Service, Postharvest han-dling of fruits and vegetables. Aug. 2000. https://attra.ncat.org/attra-pub/download.php?id=378
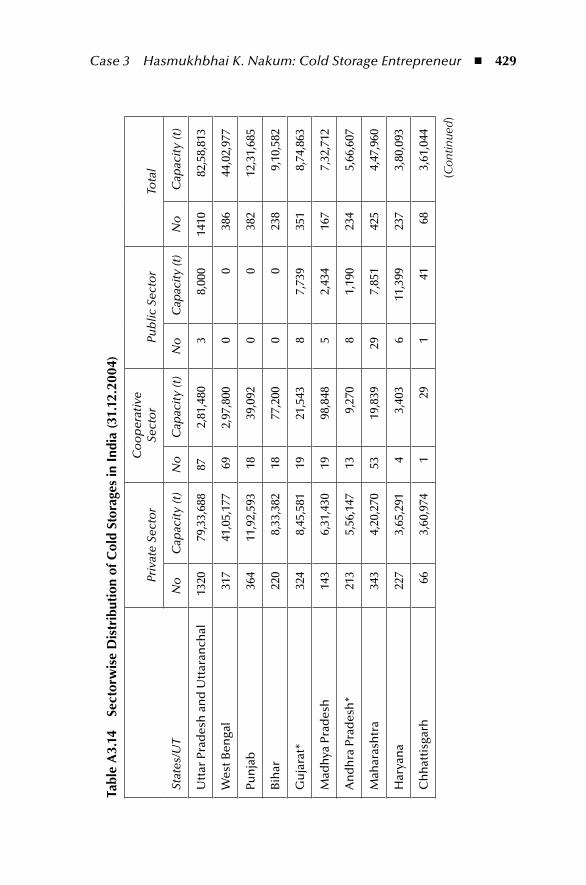
Case 3 Hasmukhbhai K. Nakum: Cold Storage Entrepreneur ◾ 429
tabl
e A
3.14
Se
ctor
wis
e D
istr
ibut
ion
of C
old
Stor
ages
in i
ndia
(31.
12.2
004)
Stat
es/U
T
Priv
ate
Sect
or
Co
op
erat
ive
Sect
or
Pub
lic S
ecto
rTo
tal
No
Cap
acit
y (t
)N
oC
apac
ity
(t)
No
Cap
acit
y (t
)N
oC
apac
ity
(t)
Utt
ar P
rad
esh
an
d U
ttar
anch
al13
2079
,33,
688
872,
81,4
803
8,00
014
1082
,58,
813
Wes
t Ben
gal
317
41,0
5,17
769
2,97
,800
00
386
44,0
2,97
7
Pun
jab
364
11,9
2,59
318
39,0
920
038
212
,31,
685
Bih
ar22
08,
33,3
8218
77,2
000
023
89,
10,5
82
Gu
jara
t*32
48,
45,5
8119
21,5
438
7,73
935
18,
74,8
63
Mad
hya
Pra
des
h14
36,
31,4
3019
98,8
485
2,43
416
77,
32,7
12
An
dh
ra P
rad
esh
*21
35,
56,1
4713
9,27
08
1,19
023
45,
66,6
07
Mah
aras
htr
a34
34,
20,2
7053
19,8
3929
7,85
142
54,
47,9
60
Har
yan
a22
73,
65,2
914
3,40
36
11,3
9923
73,
80,0
93
Ch
hat
tisg
arh
663,
60,9
741
291
4168
3,61
,044
(Con
tinue
d)
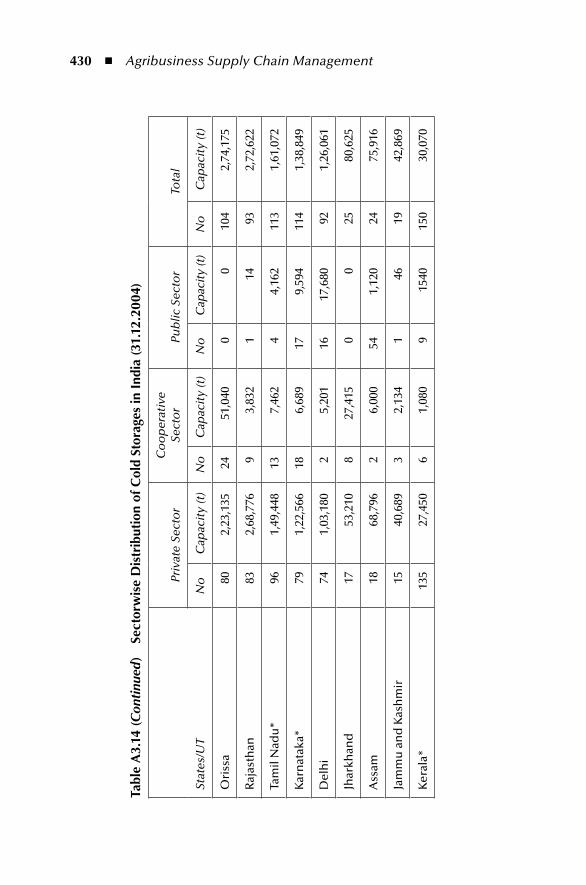
430 ◾ Agribusiness Supply Chain Management
tabl
e A
3.14
(Con
tinu
ed)
Sect
orw
ise
Dis
trib
utio
n of
Col
d St
orag
es in
ind
ia (3
1.12
.200
4)
Stat
es/U
T
Priv
ate
Sect
or
Co
op
erat
ive
Sect
or
Pub
lic S
ecto
rTo
tal
No
Cap
acit
y (t
)N
oC
apac
ity
(t)
No
Cap
acit
y (t
)N
oC
apac
ity
(t)
Ori
ssa
802,
23,1
3524
51,0
400
010
42,
74,1
75
Raj
asth
an83
2,68
,776
93,
832
114
932,
72,6
22
Tam
il N
adu
*96
1,49
,448
137,
462
44,
162
113
1,61
,072
Kar
nat
aka*
791,
22,5
6618
6,68
917
9,59
411
41,
38,8
49
Del
hi
741,
03,1
802
5,20
116
17,6
8092
1,26
,061
Jhar
khan
d17
53,2
108
27,4
150
025
80,6
25
Ass
am18
68,7
962
6,00
054
1,12
024
75,9
16
Jam
mu
an
d K
ash
mir
1540
,689
32,
134
146
1942
,869
Ker
ala*
135
27,4
506
1,08
09
1540
150
30,0
70
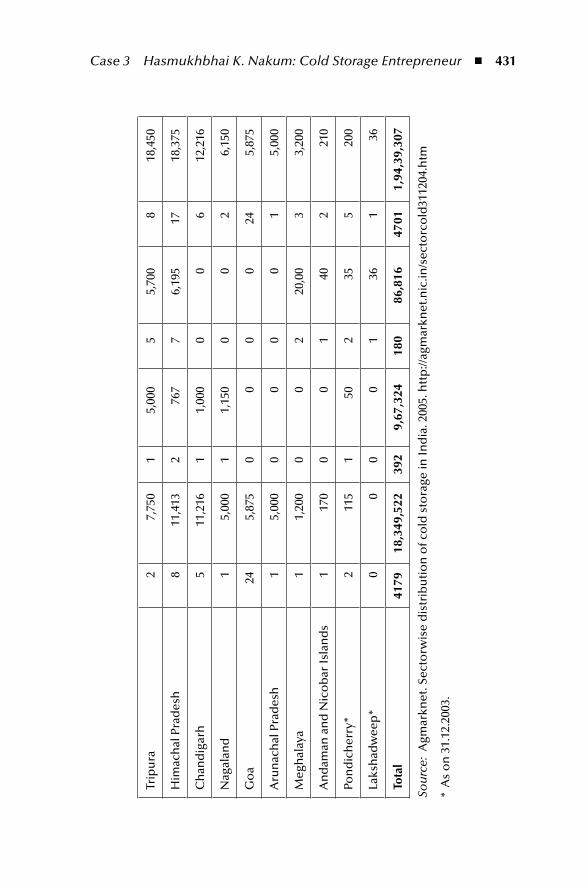
Case 3 Hasmukhbhai K. Nakum: Cold Storage Entrepreneur ◾ 431
Trip
ura
27,
750
15,
000
55,
700
818
,450
Him
ach
al P
rad
esh
811
,413
276
77
6,19
517
18,3
75
Ch
and
igar
h5
11,2
161
1,00
00
06
12,2
16
Nag
alan
d1
5,00
01
1,15
00
02
6,15
0
Go
a24
5,87
50
00
024
5,87
5
Aru
nac
hal
Pra
des
h1
5,00
00
00
01
5,00
0
Meg
hal
aya
11,
200
00
220
,00
33,
200
An
dam
an a
nd
Nic
ob
ar Is
lan
ds
117
00
01
402
210
Pon
dic
her
ry*
211
51
502
355
200
Laks
had
wee
p*
00
00
136
136
tota
l41
7918
,349
,522
392
9,67
,324
180
86,8
1647
011,
94,3
9,30
7
Sou
rce:
Agm
arkn
et. S
ecto
rwis
e d
istr
ibu
tio
n o
f co
ld s
tora
ge in
Ind
ia. 2
005.
htt
p://
agm
arkn
et.n
ic.in
/sec
torc
old
3112
04.h
tm
* A
s o
n 3
1.12
.200
3.
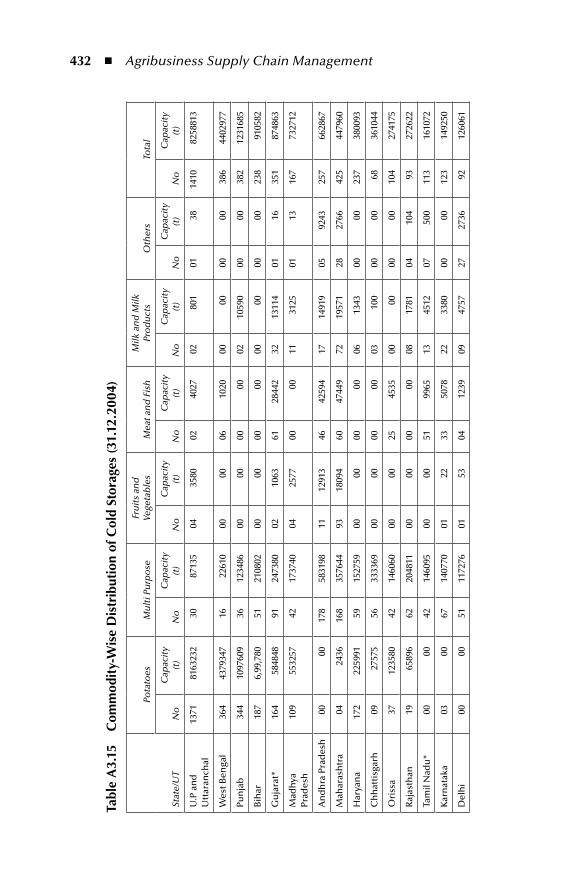
432 ◾ Agribusiness Supply Chain Management
tabl
e A
3.15
C
omm
odit
y-W
ise
Dis
trib
utio
n of
Col
d St
orag
es (3
1.12
.200
4)
Stat
e/U
T
Pota
toes
Mu
lti P
urp
ose
Fru
its
and
Ve
geta
ble
sM
eat a
nd
Fis
hM
ilk a
nd
Milk
Pr
od
uct
sO
ther
sTo
tal
No
Cap
acit
y (t
)N
oC
apac
ity
(t)
No
Cap
acit
y (t
)N
oC
apac
ity
(t)
No
Cap
acit
y (t
)N
oC
apac
ity
(t)
No
Cap
acit
y (t
)
U.P
an
d
Utt
aran
chal
1371
8163
232
3087
135
0435
8002
4027
0280
101
3814
1082
5881
3
Wes
t Ben
gal
364
4379
347
1622
610
0000
0610
2000
0000
0038
644
0297
7
Pun
jab
344
1097
609
3612
3486
0000
0000
0210
590
0000
382
1231
685
Bih
ar18
76,
99,7
8051
2108
0200
0000
0000
0000
0023
891
0582
Gu
jara
t*16
458
4848
9124
7380
0210
6361
2844
232
1311
401
1635
187
4863
Mad
hya
Pr
ades
h
109
5532
5742
1737
4004
2577
0000
1131
2501
1316
773
2712
An
dh
ra P
rad
esh
0000
178
5831
9811
1291
346
4259
417
1491
905
9243
257
6628
67
Mah
aras
htr
a04
2436
168
3576
4493
1809
460
4744
972
1957
128
2766
425
4479
60
Har
yan
a17
222
5991
5915
2759
0000
0000
0613
4300
0023
738
0093
Ch
hat
tisg
arh
0927
575
5633
3369
0000
0000
0310
000
0068
3610
44
Ori
ssa
3712
3580
4214
6060
0000
2545
3500
0000
0010
427
4175
Raj
asth
an19
6589
662
2048
1100
0000
0008
1781
0410
493
2726
22
Tam
il N
adu
*00
0042
1460
9500
0051
9965
1345
1207
500
113
1610
72
Kar
nat
aka
0300
6714
0770
0122
3350
7822
3380
0000
123
1492
50
Del
hi
0000
5111
7276
0153
0412
3909
4757
2727
3692
1260
61
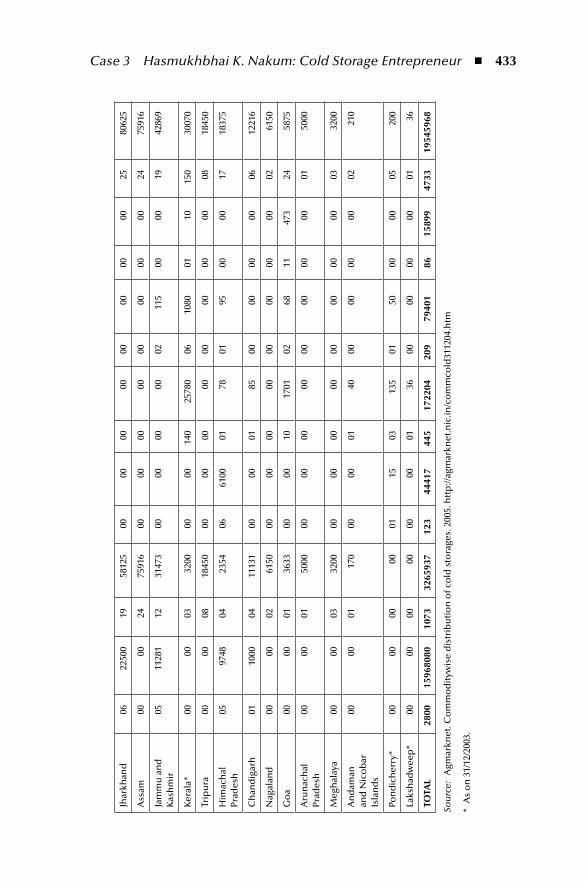
Case 3 Hasmukhbhai K. Nakum: Cold Storage Entrepreneur ◾ 433
Jhar
khan
d06
2250
019
5812
500
0000
0000
0000
0025
8062
5
Ass
am00
0024
7591
600
0000
0000
0000
0024
7591
6
Jam
mu
an
d
Kas
hm
ir05
1128
112
3147
300
0000
0002
115
0000
1942
869
Ker
ala*
0000
0332
0000
0014
025
780
0610
8001
1015
030
070
Trip
ura
0000
0818
450
0000
0000
0000
0000
0818
450
Him
ach
al
Prad
esh
0597
4804
2354
0661
0001
7801
9500
0017
1837
5
Ch
and
igar
h
0110
0004
1113
100
0001
8500
0000
0006
1221
6
Nag
alan
d00
0002
6150
0000
0000
0000
0000
0261
50
Go
a00
0001
3633
0000
1017
0102
6811
473
2458
75
Aru
nac
hal
Pr
ades
h00
0001
5000
0000
0000
0000
0000
0150
00
Meg
hal
aya
0000
0332
0000
0000
0000
0000
0003
3200
An
dam
an
and
Nic
ob
ar
Isla
nd
s
0000
0117
000
0001
4000
0000
0002
210
Pon
dic
her
ry*
0000
0000
0115
0313
501
5000
0005
200
Laks
had
wee
p*
0000
0000
0000
0136
0000
0000
0136
totA
L28
0015
9680
8010
7332
6593
712
344
417
445
1722
0420
979
401
8615
899
4733
1954
5968
Sou
rce:
A
gmar
knet
. Co
mm
od
ityw
ise
dis
trib
uti
on
of c
old
sto
rage
s. 2
005.
htt
p://
agm
arkn
et.n
ic.in
/co
mm
cold
3112
04.h
tm
* A
s o
n 3
1/12
/200
3.
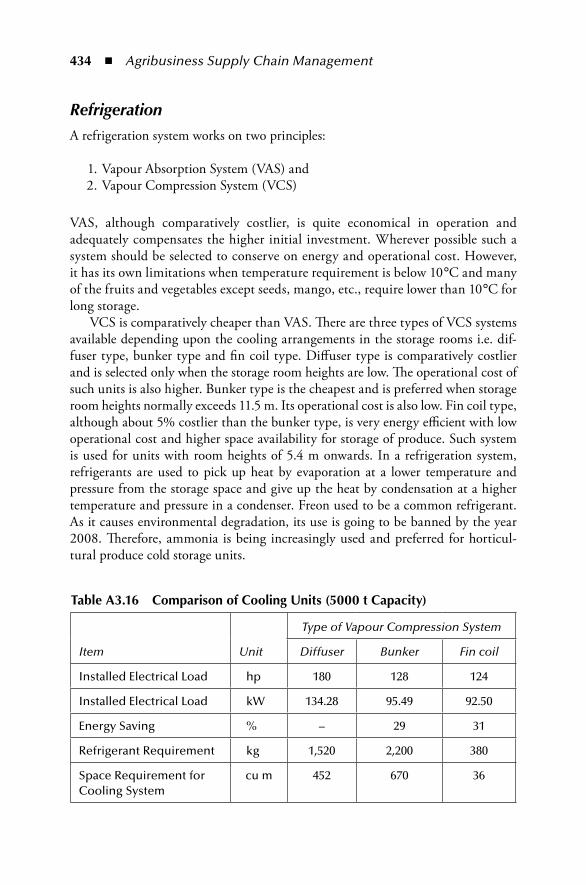
434 ◾ Agribusiness Supply Chain Management
RefrigerationA refrigeration system works on two principles:
1. Vapour Absorption System (VAS) and 2. Vapour Compression System (VCS)
VAS, although comparatively costlier, is quite economical in operation and adequately compensates the higher initial investment. Wherever possible such a system should be selected to conserve on energy and operational cost. However, it has its own limitations when temperature requirement is below 10°C and many of the fruits and vegetables except seeds, mango, etc., require lower than 10°C for long storage.
VCS is comparatively cheaper than VAS. There are three types of VCS systems available depending upon the cooling arrangements in the storage rooms i.e. dif-fuser type, bunker type and fin coil type. Diffuser type is comparatively costlier and is selected only when the storage room heights are low. The operational cost of such units is also higher. Bunker type is the cheapest and is preferred when storage room heights normally exceeds 11.5 m. Its operational cost is also low. Fin coil type, although about 5% costlier than the bunker type, is very energy efficient with low operational cost and higher space availability for storage of produce. Such system is used for units with room heights of 5.4 m onwards. In a refrigeration system, refrigerants are used to pick up heat by evaporation at a lower temperature and pressure from the storage space and give up the heat by condensation at a higher temperature and pressure in a condenser. Freon used to be a common refrigerant. As it causes environmental degradation, its use is going to be banned by the year 2008. Therefore, ammonia is being increasingly used and preferred for horticul-tural produce cold storage units.
table A3.16 Comparison of Cooling units (5000 t Capacity)
Item Unit
Type of Vapour Compression System
Diffuser Bunker Fin coil
Installed Electrical Load hp 180 128 124
Installed Electrical Load kW 134.28 95.49 92.50
Energy Saving % – 29 31
Refrigerant Requirement kg 1,520 2,200 380
Space Requirement for Cooling System
cu m 452 670 36
Case 3 Hasmukhbhai K. Nakum: Cold Storage Entrepreneur ◾ 435
Although several types of compressors and condensers are available, medium speed reciprocating compressors and atmospheric condensers are preferred because of the relatively lower cost, energy efficiency and ease in maintenance.
While selecting size of the equipment, care should be taken to assess all loads and proper provision should be made to take care of the peak demand during sum-mer loading and aging of the equipment. Heat load factors normally considered in a cold storage design are:
1. Wall, floor and ceiling heat gains due to conduction 2. Wall and ceiling heat gains from solar radiation 3. Load due to ingression of air by frequent door openings and during fresh air
charge. 4. Product load from incoming goods 5. Heat of respiration from stored product 6. Heat from workers working in the room 7. Cooler fan load 8. Light load 9. Aging of equipment 10. Miscellaneous loads, if any
CA StorageCA storage involves altering and maintaining an atmospheric composition that is different from air composition (about 78% N2, 21% O2, and 0.03% CO2) gener-ally, O2 below 8% and CO2 above 1% is used. Atmospheric modification should be considered as a supplement to maintenance of optimum ranges of temperature and relative humidity for each commodity in preserving quality and safety of fresh fruits and vegetables. The benefits of CA storage are:
◾ Retardation of senescence (including ripening) and associated biochemical and physiological changes i.e., slowing down rates of respiration, ethylene production, softening, and compositional changes.
◾ Reduction of sensitivity to ethylene action at O2
levels <8% and/or CO2
levels >1%. ◾ Alleviation of certain physiological disorders such as chilling injury and some
storage disorders, including scald of apples. ◾ CA can have a direct or indirect effect on post-harvest pathogens (bacteria
and fungi) and consequently decay incidence and severity. For example, CO2
at 10% to 15% significantly inhibit development of botrytis rot on strawber-ries, cherries, and other perishables.
◾ Low O2
(<1%) and/or elevated CO2
(40% to 60%) can be a useful tool for insect control in some fresh and dried fruits, flowers, and vegetables and dried nuts and grains.
436 ◾ Agribusiness Supply Chain Management
InsulationAll the sides of the cold storage room need to be insulated in order to maintain the required temperature inside. Various types of insulating materials are used for insulation of walls and roof. However, the most commonly used insulation material is thermocol.
UtilitiesAvailability of dependable power supply at the site needs to be ensured. Since elec-tricity is the major operational cost, running the plant solely on diesel generators may render the unit financially infeasible.
Subsidy Schemes for Cold StoragesA. National Horticulture Board
Capital Investment Subsidy for Construction/Modernization/Expansion of Cold Storage for Horticulture Produce
Projects up to a capacity of 5000 t with an average cost of ̀ 2 crore (`4000 per t) would be promoted for wider dispersal, which includes expansion of existing capacity (includ-ing CA/MA stores/Pre-cooling units). In case of modernization and rehabilitation, subsidy at 25% of the capital cost will be determined at `1000 per t capacity created.
For other storages, subsidy at 25% of the capital cost is to be determined @ `2000 per t capacity created to be 25% promoters contribution 50% term loan by banks at PLR+1% through NABARD. Refinance Banks not availing refinance may also finance such projects with the overall operational guidelines of Government of India 25% back-ended capital investment subsidy by National Horticulture Board (NHB) not exceeding `50 l per project.
The subsidy would flow from NHB and operated by NABARD, through commercial/cooperative banks, and by National Co-operative Development Corporation (NCDC) where cooperatives seek loan from NCDC. Wherever term loans are not raised from institutional sources and the promoters fund projects entirely through internal resource generation, NHB would provide subsidy directly.
B. Ministry of Food Processing Industries, Government of India
Scheme for Infrastructure Development - Integrated Cold Chain Facilities
The rate of growth in production of perishable produce is roughly twice as much as general agriculture. Accordingly, to keep pace with the need for storage of
Case 3 Hasmukhbhai K. Nakum: Cold Storage Entrepreneur ◾ 437
perishable produce so that there is no wastage and at the same time raw material supply to food processing industries is not adversely hit in the off season, enhanced cold storage capacity is essential with a view to
◾ Improve viability of existing cold storages ◾ Enhance total cold store capacity, both stationary and mobile
Consequent upon NHB’s capital subsidy scheme for cold storages, the Ministry’s assistance is limited to the following types of cold storages
◾ Cold storage for non-horticulture produce ◾ Where the cold storage is an integral part of the processing unit or of the
common facilities in food park ◾ Special type of cold storage with CA or MA facility
C. APEDA
Scheme for Infrastructure Development
Assistance to exporters/producers/growers/cooperative organizations and federa-tions for horticulture and floriculture sector for setting up of specialized storage facilities such as high humidity cold storage, deep freezers, CA or MA storage, etc., 25% of cost subject to ceiling of `10 l per beneficiary.
D. Government of Gujarat (Assistance under Agro-Industrial Policy)
Scheme for Agri Infrastructure Development (2005–2006)
The state government will offer the following incentives for projects providing com-mon infrastructure facilities in the value chain of agri-produce from farm to mar-kets as decided by Single Window Clearance (SWC) committee
◾ Back ended interest subsidy as follows − 6% pa back ended interest subsidy for first five years from commence-
ment of operations − The aggregate interest subsidy will not exceed `400 l − The interest subsidy will be available on the funds borrowed from finan-
cial institutions for capital investments only. No interest subsidy will be available towards working capital loan or any other loan which is not of the nature of term loan meant for acquiring capital assets
◾ The state government will assist in preparing pre-feasibility studies through Gujarat Infrastructure Development Board
◾ The state government intends to provide government land including agricul-ture farms on long lease basis at reasonable rates
438 ◾ Agribusiness Supply Chain Management
SWC
The state government is committed to provide SWC to ensure that entrepreneurs do not have to visit different government offices to obtain the required for setting up industrial units in the state.
For this purpose the state government has constituted an empowered com-mittee consisting of secretaries in charge of Departments of Finance, Industries, Agriculture and Managing Director, Gujarat Agro Industries Corporation Limited with a view to provide SWC to Agriculture and Food Processing Industry. The committee will also take such measure and decisions as required for proactively promoting the development of Agro Industries in the state. In view of the thrust required to this sector, the committee is chaired by Chief Secretary and also include Industries Commissioner as a member. The committee will take appropriate deci-sions to affect special assistance from Gujarat Government, if required to attract large scale investments in this sector. The decisions of the committee shall be final and no further approval will be necessary.
E. Government of MaharashtraThe Maharashtra State Agricultural Marketing Board (MSAMB), Pune, has launched ‘Cold Storage Subsidy Scheme’ from 1st of August 2005. Scheme is applicable for promoters from the Maharashtra state. The scheme details as follows:
Pattern of Assistance
Subsidy at 25% of the total project cost with maximum limit of `2.5 l per project. The beneficiary will be eligible for getting subsidy from other financial institutions/agencies. The beneficiary can get subsidy for more than one cold storage.
Features of the Scheme
Subsidy is available for capacity up to 100 t.
◾ The cost of the project is considered at `10000 per t. ◾ The subsidy rate is considered at `2500 per t. ◾ In principle approval from MSAMB for the project is necessary. ◾ The detail project report of the cold storage must be of the MSAMB. ◾ The plan and estimates of the project should be according to the norms final-
ized by the MSAMB.
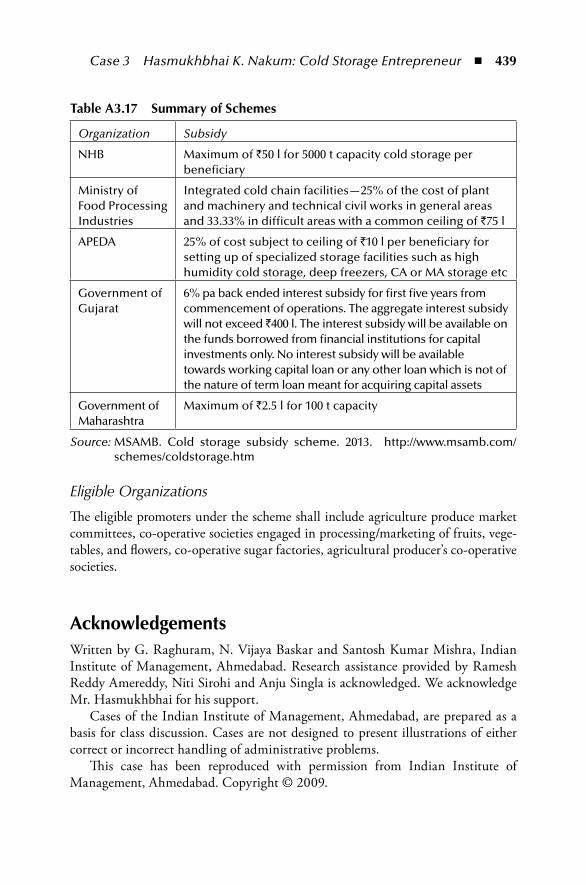
Case 3 Hasmukhbhai K. Nakum: Cold Storage Entrepreneur ◾ 439
Eligible Organizations
The eligible promoters under the scheme shall include agriculture produce market committees, co-operative societies engaged in processing/marketing of fruits, vege-tables, and flowers, co-operative sugar factories, agricultural producer’s co-operative societies.
AcknowledgementsWritten by G. Raghuram, N. Vijaya Baskar and Santosh Kumar Mishra, Indian Institute of Management, Ahmedabad. Research assistance provided by Ramesh Reddy Amereddy, Niti Sirohi and Anju Singla is acknowledged. We acknowledge Mr. Hasmukhbhai for his support.
Cases of the Indian Institute of Management, Ahmedabad, are prepared as a basis for class discussion. Cases are not designed to present illustrations of either correct or incorrect handling of administrative problems.
This case has been reproduced with permission from Indian Institute of Management, Ahmedabad. Copyright © 2009.
table A3.17 Summary of Schemes
Organization Subsidy
NHB Maximum of `50 l for 5000 t capacity cold storage per beneficiary
Ministry of Food Processing Industries
Integrated cold chain facilities—25% of the cost of plant and machinery and technical civil works in general areas and 33.33% in difficult areas with a common ceiling of `75 l
APEDA 25% of cost subject to ceiling of `10 l per beneficiary for setting up of specialized storage facilities such as high humidity cold storage, deep freezers, CA or MA storage etc
Government of Gujarat
6% pa back ended interest subsidy for first five years from commencement of operations. The aggregate interest subsidy will not exceed `400 l. The interest subsidy will be available on the funds borrowed from financial institutions for capital investments only. No interest subsidy will be available towards working capital loan or any other loan which is not of the nature of term loan meant for acquiring capital assets
Government of Maharashtra
Maximum of `2.5 l for 100 t capacity
Source: MSAMB. Cold storage subsidy scheme. 2013. http://www.msamb.com/schemes/coldstorage.htm

This page intentionally left blankThis page intentionally left blank
441
Case 4 Chilli in Soup (A)
introductionIt was a damp morning on June 10, 2003. The monsoon had arrived in Kerala a few days ago. Mr. C. J. Jose, a tall well-built man in his fifties, the Chairman of the Spices Board of India (SBI), was in his spacious office deeply engrossed in a file. It was 10 am. His phone started ringing. It was a call from the Secretary, Department of Commerce, Ministry of Commerce and Industry, Government of India. The matter was of serious concern. The Secretary seemed to be worried and conveyed to him the following message. “Yesterday evening, the Ministry received a com-munication from the Charge d’Affaires, European Union (EU), regarding a noti-fication. It came via the existing Rapid Alert System for Food and Feed (RASFF) of the EU. The notification stated that French scientists have detected traces of Sudan 1, a banned carcinogenic dye in a British food product in the last month. Further investigations revealed that the source of Sudan 1 was red chilli powder exported from India. The British firm had used it as an ingredient. The Ministry was requested to inform the competent authority in India of these findings in order to help avoid such problems in the future. My office will be sending a fax of the notification in an hour.” Closing the conversation, he said, “Considering the seri-ousness of the matter, the Ministry would like to be periodically apprised of the actions SBI would be taking in its capacity as the regulatory body for controlling and certifying the quality of spices exported out of India.”
Mr. Jose hung up the phone and brooded for some time over possible actions he could take. He called his Personal Assistant, Mr. Raphael, and asked him to cancel all his meetings and appointments for the day unless something was exigent. He then discussed the matter with Mr. S. Kannan, Director (Marketing), over the phone, and immediately decided to summon a meeting at 11 am, of all the depart-mental heads and a few other officers whose inputs were desirable. (Table A4.1 gives the functions and organisation structure of SBI.) He was expecting the fax to come before the meeting would start. He did all this within a few minutes of receiving the call.
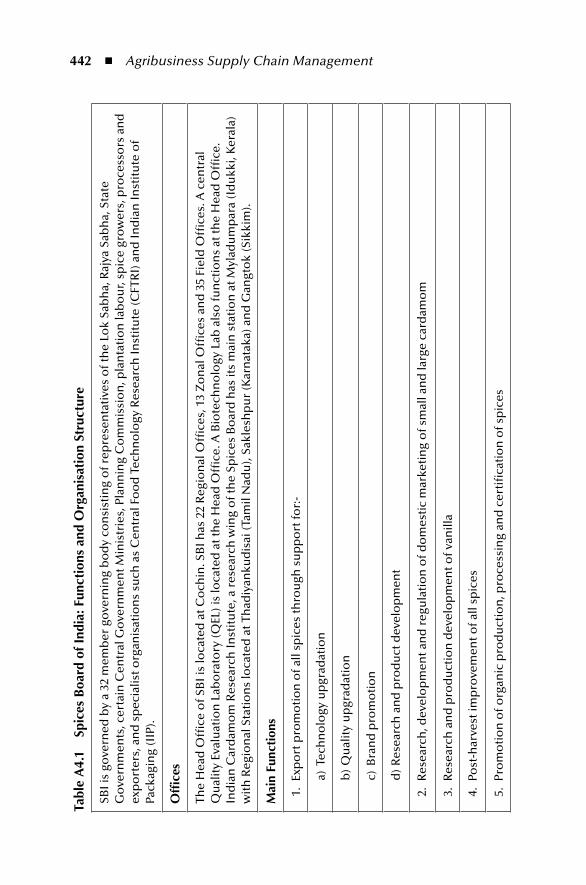
442 ◾ Agribusiness Supply Chain Management
tabl
e A
4.1
Spic
es B
oard
of i
ndia
: Fun
ctio
ns a
nd o
rgan
isat
ion
Stru
ctur
e
SBI i
s go
vern
ed b
y a
32 m
emb
er g
ove
rnin
g b
od
y co
nsi
stin
g o
f rep
rese
nta
tive
s o
f th
e Lo
k Sa
bh
a, R
ajya
Sab
ha,
Sta
te
Go
vern
men
ts, c
erta
in C
entr
al G
ove
rnm
ent M
inis
trie
s, P
lan
nin
g C
om
mis
sio
n, p
lan
tati
on
lab
ou
r, sp
ice
gro
wer
s, p
roce
sso
rs a
nd
ex
po
rter
s, a
nd
sp
ecia
list o
rgan
isat
ion
s su
ch a
s C
entr
al F
oo
d T
ech
no
logy
Res
earc
h In
stit
ute
(CFT
RI)
an
d In
dia
n In
stit
ute
of
Pack
agin
g (I
IP).
offi
ces
The
Hea
d O
ffice
of S
BI i
s lo
cate
d a
t Co
chin
. SB
I has
22
Reg
ion
al O
ffice
s, 1
3 Z
on
al O
ffice
s an
d 3
5 Fi
eld
Offi
ces.
A c
entr
al
Qu
alit
y Ev
alu
atio
n L
abo
rato
ry (Q
EL) i
s lo
cate
d a
t th
e H
ead
Offi
ce. A
Bio
tech
no
logy
Lab
als
o fu
nct
ion
s at
the
Hea
d O
ffice
. In
dia
n C
ard
amo
m R
esea
rch
Inst
itu
te, a
res
earc
h w
ing
of t
he
Spic
es B
oar
d h
as it
s m
ain
sta
tio
n a
t Myl
adu
mp
ara
(Id
ukk
i, K
eral
a)
wit
h R
egio
nal
Sta
tio
ns
loca
ted
at T
had
iyan
kud
isai
(Tam
il N
adu
), Sa
kles
hp
ur
(Kar
nat
aka)
an
d G
angt
ok
(Sik
kim
).
mai
n Fu
ncti
ons
1.
Exp
ort
pro
mo
tio
n o
f all
spic
es th
rou
gh s
up
po
rt fo
r:-
a)
Tec
hn
olo
gy u
pgr
adat
ion
b
) Q
ual
ity
up
grad
atio
n
c)
Bra
nd
pro
mo
tio
n
d
) R
esea
rch
an
d p
rod
uct
dev
elo
pm
ent
2.
Res
earc
h, d
evel
op
men
t an
d r
egu
lati
on
of d
om
esti
c m
arke
tin
g o
f sm
all a
nd
larg
e ca
rdam
om
3.
Res
earc
h a
nd
pro
du
ctio
n d
evel
op
men
t of v
anill
a
4.
Po
st-h
arve
st im
pro
vem
ent o
f all
spic
es
5.
Pro
mo
tio
n o
f org
anic
pro
du
ctio
n, p
roce
ssin
g an
d c
erti
fica
tio
n o
f sp
ices
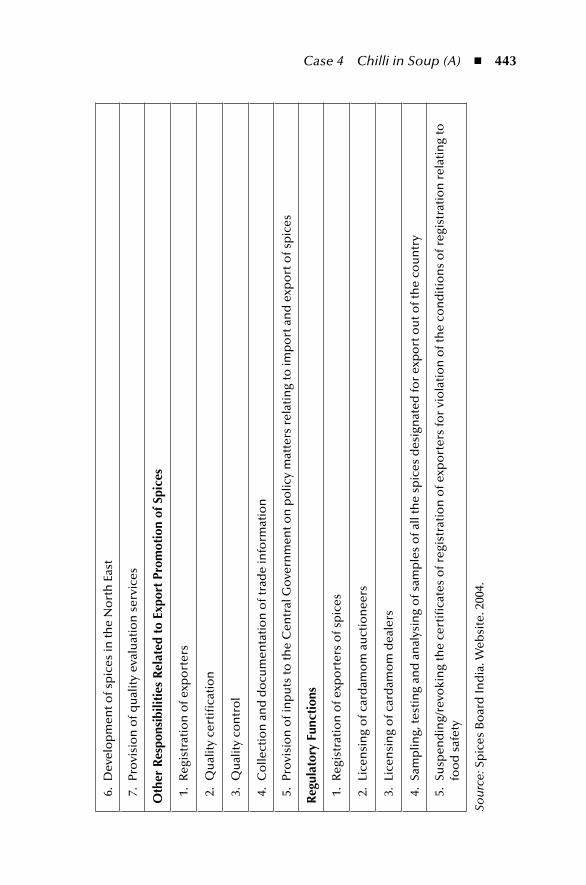
Case 4 Chilli in Soup (A) ◾ 443
6.
Dev
elo
pm
ent o
f sp
ices
in th
e N
ort
h E
ast
7.
Pro
visi
on
of q
ual
ity
eval
uat
ion
ser
vice
s
oth
er r
espo
nsib
iliti
es r
elat
ed t
o ex
port
pro
mot
ion
of S
pice
s
1.
Reg
istr
atio
n o
f exp
ort
ers
2.
Qu
alit
y ce
rtifi
cati
on
3.
Qu
alit
y co
ntr
ol
4.
Co
llect
ion
an
d d
ocu
men
tati
on
of t
rad
e in
form
atio
n
5.
Pro
visi
on
of i
np
uts
to th
e C
entr
al G
ove
rnm
ent o
n p
olic
y m
atte
rs r
elat
ing
to im
po
rt a
nd
exp
ort
of s
pic
es
reg
ulat
ory
Func
tion
s
1.
Reg
istr
atio
n o
f exp
ort
ers
of s
pic
es
2.
Lic
ensi
ng
of c
ard
amo
m a
uct
ion
eers
3.
Lic
ensi
ng
of c
ard
amo
m d
eale
rs
4.
Sam
plin
g, te
stin
g an
d a
nal
ysin
g o
f sam
ple
s o
f all
the
spic
es d
esig
nat
ed fo
r ex
po
rt o
ut o
f th
e co
un
try
5.
Su
spen
din
g/re
voki
ng
the
cert
ifica
tes
of r
egis
trat
ion
of e
xpo
rter
s fo
r vi
ola
tio
n o
f th
e co
nd
itio
ns
of r
egis
trat
ion
rel
atin
g to
fo
od
saf
ety
Sou
rce:
Sp
ices
Bo
ard
Ind
ia. W
ebsi
te. 2
004.
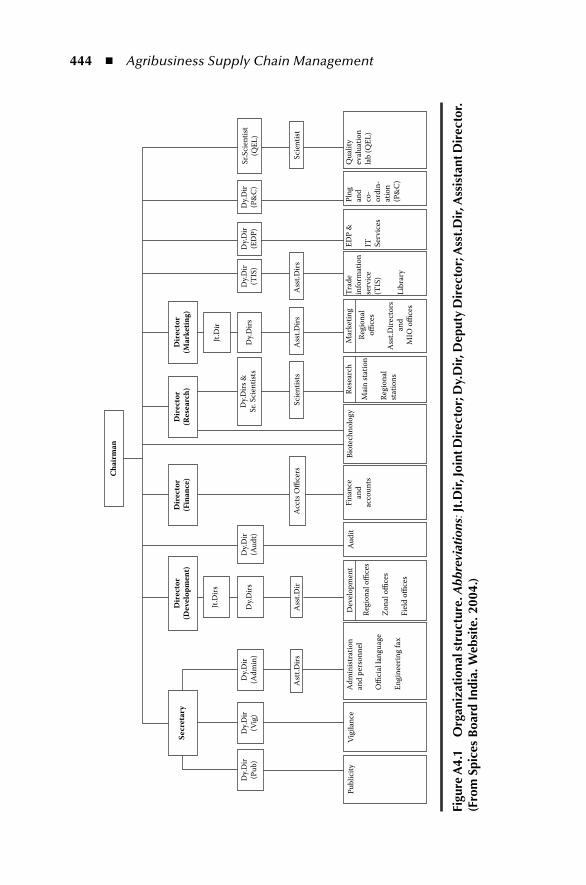
444 ◾ Agribusiness Supply Chain Management
Cha
irm
an
Secr
etar
yD
irec
tor
(Dev
elop
men
t)D
irec
tor
(Fin
ance
)D
irec
tor
(Res
earc
h)D
irec
tor
(Mar
ketin
g)
Jt.D
irsJt.
Dir
Dy.D
irs
Ass
t.Dirs
Ass
t.Dirs
Dy.D
ir(T
IS)
Dy.D
ir(E
DP)
Dy.D
ir(P
&C
)D
y.Dirs
Ast
t.Dirs
Ass
t.Dir
Acc
ts O
�ce
rs
Dy.D
ir(A
udt)
Dy.D
ir(P
ub)
Publ
icity
Vigi
lanc
eA
udit
Biot
echn
olog
yRe
sear
chM
arke
ting
EDP
&
IT Serv
ices
Plng
and
co-
ordi
n-at
ion
(P&
C)
Qua
lity
eval
uatio
nla
b (Q
EL)
Trad
ein
form
atio
nse
rvic
e(T
IS)
Libr
ary
Regi
onal
o�ce
s
Ass
t.Dire
ctor
s an
dM
IO o
�ce
s
Mai
n st
atio
n
Regi
onal
stat
ions
Fina
nce
and
acco
unts
Dev
elop
men
t
Regi
onal
o�
ces
Zona
l o�
ces
Fiel
d o�
ces
Adm
inist
ratio
nan
d pe
rson
nel
O�
cial
lang
uage
Engi
neer
ing
fax
Dy.D
ir(A
dmin
)D
y.Dirs
&Sr
. Sci
entis
ts
Scie
ntist
s
Sr.S
cien
tist
(QEL
)
Scie
ntist
Dy.D
ir(V
ig)
Figu
re A
4.1
org
aniz
atio
nal s
truc
ture
. Abb
revi
atio
ns: J
t.D
ir, J
oint
Dir
ecto
r; D
y.D
ir, D
eput
y D
irec
tor;
Ass
t.D
ir, A
ssis
tant
Dir
ecto
r.
(Fro
m S
pice
s B
oard
ind
ia. W
ebsi
te. 2
004.
)
Case 4 Chilli in Soup (A) ◾ 445
Mr. Jose had, in his long administrative service (as an officer of the Indian Administrative Services), faced many a crises in various capacities and always found these an interesting part of life. He was posted as the Chairman of SBI in April 2001. Until the previous day, it had been a relatively easy posting, doing routine regulatory work, besides looking for opportunities to enhance the markets out-side India, meeting exporters, attending meetings with similar international bodies regarding the export of Indian spices. But the call from the Ministry in the morn-ing looked like a sign of an impending crisis situation. He started thinking logically about the stakes and the possible fallouts of the incident.
The fax came before the meeting. Three Mumbai based exporters had been identified as the suppliers of the contaminated chilli powder in the RASFF (Box A4.1). During the meeting, Mr. Jose summed up the following issues which had to be addressed by SBI as the licensing authority of exporters of Indian spices:
(i) Assessing the damage done by the event and formulating strategies to control it,
(ii) Defending the brand image of Indian spices in the international market through confidence building exercises, and
(iii) Formulating strategies to avoid future recurrence of such events.
At the end of the meeting, Mr. Jose requested Mr. Kannan to verify the EU claim and collect back-up information in the next few days and report to him. He also requested Mr. K.R.K Menon, Senior Scientist, in charge of the Quality Evaluation Laboratory (QEL), to report on the quality parameters and the tests related to chilli powder that were currently being carried out in the SBI lab.
Mr. Kannan set about his task immediately, keeping in mind the issues above. Examining past correspondence and records, he gathered the following:
1. “Sudan 1 was a red dye that was used for colouring solvents, oils, waxes, petrol, and shoe and floor polishes. Under the colours in Food Regulations 1995 of EU, the red dye was illegal, and was considered to be a genotoxic carcinogen. Its presence, at any level, was not permitted in foodstuffs for any purpose. The ban came following the experimental results on rats, which sug-gested that the chemical could trigger the formation of malignant tumours. The details about its health risks (Box A4.2) mentioned a significant fact that “the risk of cancer in humans from Sudan 1 has not been proven and any risk from these foods is likely to be very small indeed.”
2. As per the RASFF (Box A4.1) dated May 9, 2003, issued by the EU, con-signments of chilli powder exported by the following firms to East West
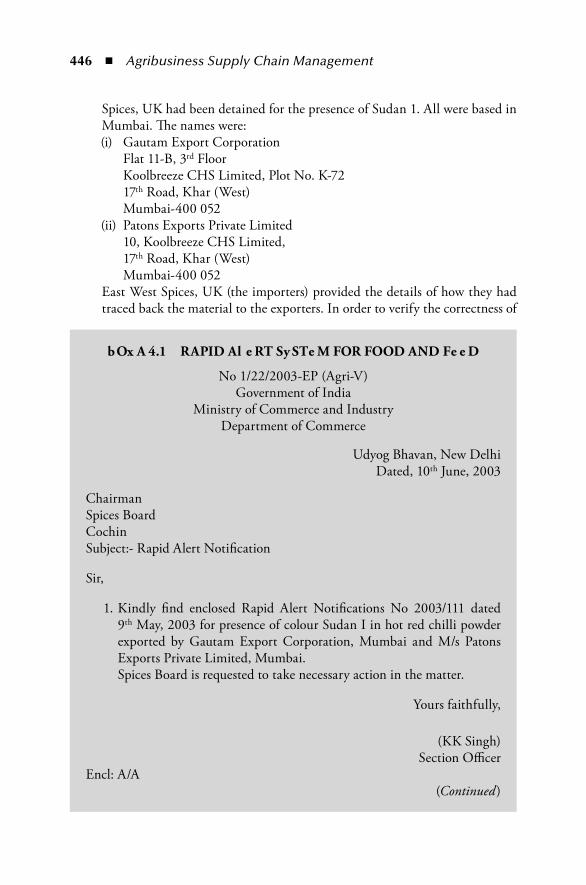
446 ◾ Agribusiness Supply Chain Management
Spices, UK had been detained for the presence of Sudan 1. All were based in Mumbai. The names were:
(i) Gautam Export Corporation Flat 11-B, 3rd Floor Koolbreeze CHS Limited, Plot No. K-72 17th Road, Khar (West) Mumbai-400 052
(ii) Patons Exports Private Limited 10, Koolbreeze CHS Limited, 17th Road, Khar (West) Mumbai-400 052 East West Spices, UK (the importers) provided the details of how they had
traced back the material to the exporters. In order to verify the correctness of
bOx A 4.1 RAPID Al e RT Sy STe M FOR FOOD AND Fe e D
No 1/22/2003-EP (Agri-V)Government of India
Ministry of Commerce and IndustryDepartment of Commerce
Udyog Bhavan, New DelhiDated, 10th June, 2003
ChairmanSpices BoardCochinSubject:- Rapid Alert Notification
Sir,
1. Kindly find enclosed Rapid Alert Notifications No 2003/111 dated 9th May, 2003 for presence of colour Sudan I in hot red chilli powder exported by Gautam Export Corporation, Mumbai and M/s Patons Exports Private Limited, Mumbai.
Spices Board is requested to take necessary action in the matter.
Yours faithfully,
(KK Singh)Section Officer
Encl: A/A(Continued)
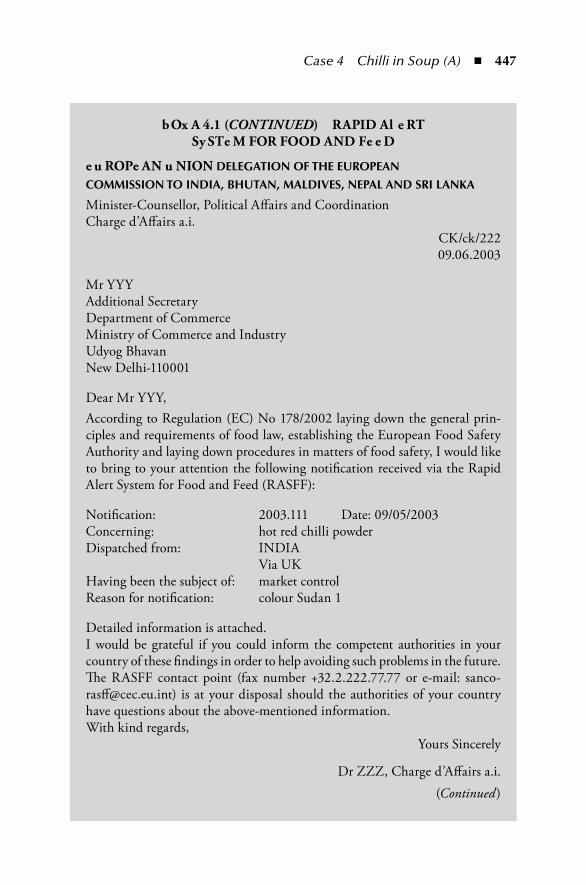
Case 4 Chilli in Soup (A) ◾ 447
bOx A 4.1 (CoNtiNUed) RAPID Al e RT Sy STe M FOR FOOD AND Fe e D
e u ROPe AN u NION DeLeGAtion oF tHe europeAn
CommiSSion to inDiA, BHutAn, mALDiVeS, nepAL AnD Sri LAnKA
Minister-Counsellor, Political Affairs and CoordinationCharge d’Affairs a.i.
CK/ck/22209.06.2003
Mr YYYAdditional SecretaryDepartment of CommerceMinistry of Commerce and IndustryUdyog BhavanNew Delhi-110001
Dear Mr YYY,According to Regulation (EC) No 178/2002 laying down the general prin-ciples and requirements of food law, establishing the European Food Safety Authority and laying down procedures in matters of food safety, I would like to bring to your attention the following notification received via the Rapid Alert System for Food and Feed (RASFF):
Notification: 2003.111 Date: 09/05/2003Concerning: hot red chilli powderDispatched from: INDIA Via UKHaving been the subject of: market controlReason for notification: colour Sudan 1
Detailed information is attached.I would be grateful if you could inform the competent authorities in your country of these findings in order to help avoiding such problems in the future.The RASFF contact point (fax number +32.2.222.77.77 or e-mail: [email protected]) is at your disposal should the authorities of your country have questions about the above-mentioned information.With kind regards,
Yours Sincerely
Dr ZZZ, Charge d’Affairs a.i.(Continued)
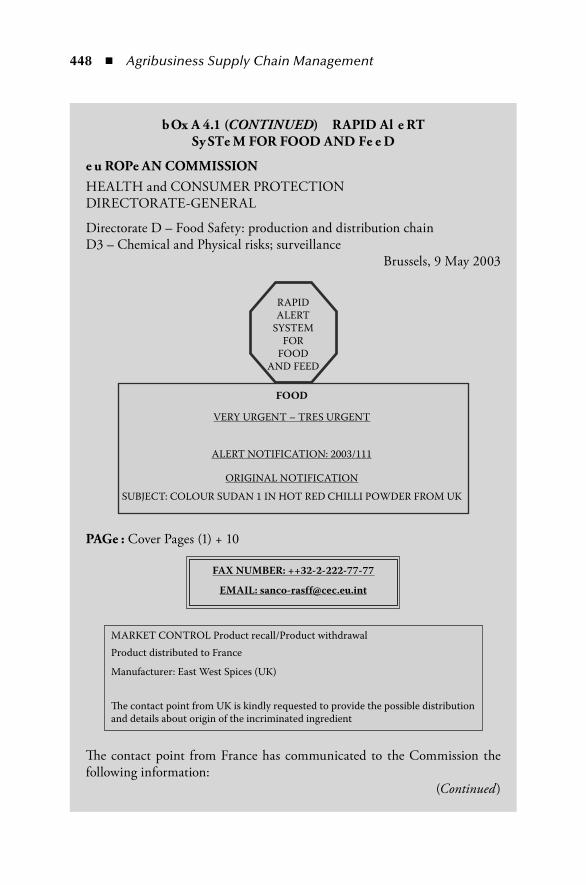
448 ◾ Agribusiness Supply Chain Management
bOx A 4.1 (CoNtiNUed) RAPID Al e RT Sy STe M FOR FOOD AND Fe e D
e u ROPe AN COMMISSIONHEALTH and CONSUMER PROTECTION DIRECTORATE-GENERAL
Directorate D – Food Safety: production and distribution chainD3 – Chemical and Physical risks; surveillance
Brussels, 9 May 2003
FOOD
SUBJECT: COLOUR SUDAN 1 IN HOT RED CHILLI POWDER FROM UK
VERY URGENT – TRES URGENT
ALERT NOTIFICATION: 2003/111
ORIGINAL NOTIFICATION
RAPIDALERT
SYSTEMFOR
FOODAND FEED
PAGe : Cover Pages (1) + 10
FAX NUMBER: ++32-2-222-77-77
EMAIL: sanco-rasf [email protected]
MARKET CONTROL Product recall/Product withdrawalProduct distributed to France
Manufacturer: East West Spices (UK)
�e contact point from UK is kindly requested to provide the possible distributionand details about origin of the incriminated ingredient
The contact point from France has communicated to the Commission the following information:
(Continued)
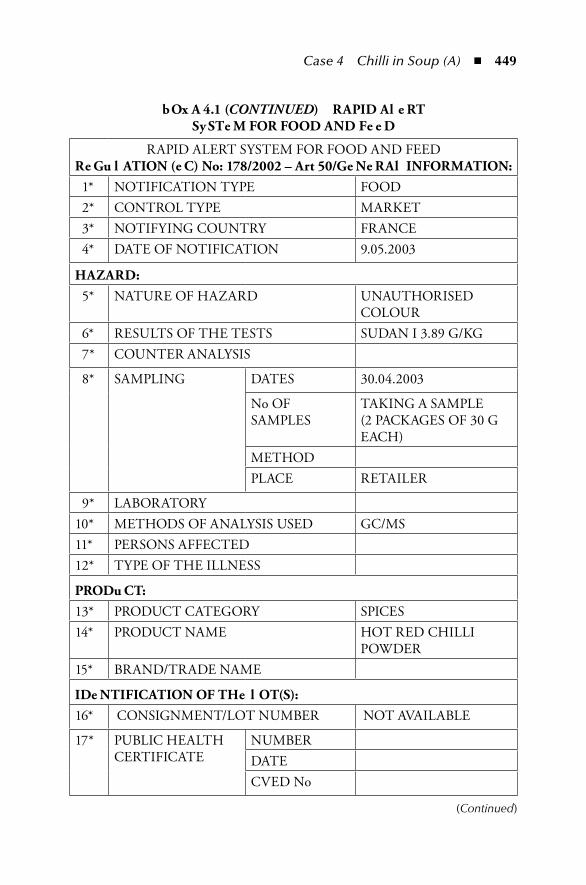
Case 4 Chilli in Soup (A) ◾ 449
bOx A 4.1 (CoNtiNUed) RAPID Al e RT Sy STe M FOR FOOD AND Fe e D
RAPID ALERT SYSTEM FOR FOOD AND FEEDRe Gu l ATION (e C) No: 178/2002 – Art 50/Ge Ne RAl INFORMATION: 1* NOTIFICATION TYPE FOOD 2* CONTROL TYPE MARKET 3* NOTIFYING COUNTRY FRANCE 4* DATE OF NOTIFICATION 9.05.2003
HAZARD: 5* NATURE OF HAZARD UNAUTHORISED
COLOUR 6* RESULTS OF THE TESTS SUDAN I 3.89 G/KG 7* COUNTER ANALYSIS
8* SAMPLING DATES 30.04.2003
No OF SAMPLES
TAKING A SAMPLE (2 PACKAGES OF 30 G EACH)
METHODPLACE RETAILER
9* LABORATORY10* METHODS OF ANALYSIS USED GC/MS11* PERSONS AFFECTED12* TYPE OF THE ILLNESS
PRODu CT:13* PRODUCT CATEGORY SPICES14* PRODUCT NAME HOT RED CHILLI
POWDER15* BRAND/TRADE NAME
IDe NTIFICATION OF THe l OT(S):16* CONSIGNMENT/LOT NUMBER NOT AVAILABLE
17* PUBLIC HEALTH CERTIFICATE
NUMBERDATECVED No
(Continued)
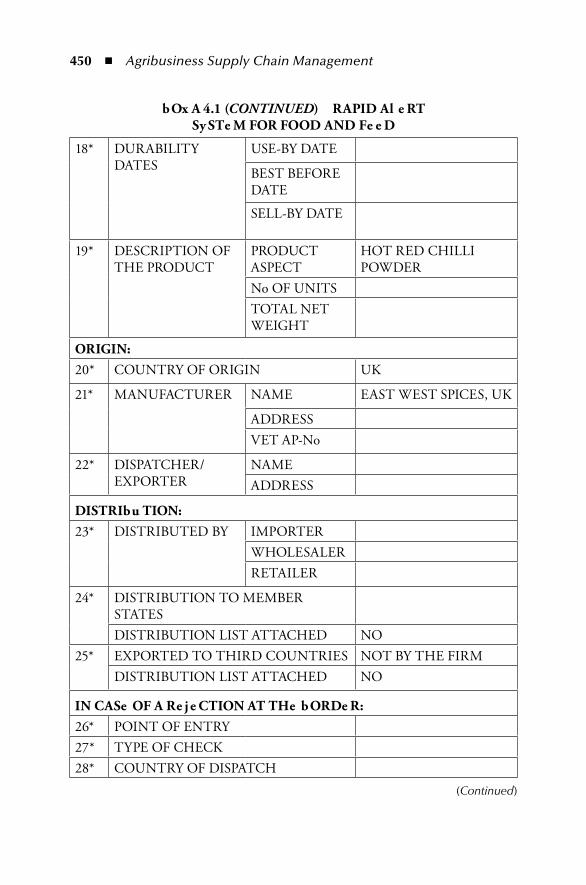
450 ◾ Agribusiness Supply Chain Management
bOx A 4.1 (CoNtiNUed) RAPID Al e RT Sy STe M FOR FOOD AND Fe e D
18* DURABILITY DATES
USE-BY DATE
BEST BEFORE DATE
SELL-BY DATE
19* DESCRIPTION OF THE PRODUCT
PRODUCT ASPECT
HOT RED CHILLI POWDER
No OF UNITSTOTAL NET WEIGHT
ORIGIN:20* COUNTRY OF ORIGIN UK
21* MANUFACTURER NAME EAST WEST SPICES, UK
ADDRESSVET AP-No
22* DISPATCHER/EXPORTER
NAMEADDRESS
DISTRIbu TION:23* DISTRIBUTED BY IMPORTER
WHOLESALERRETAILER
24* DISTRIBUTION TO MEMBER STATESDISTRIBUTION LIST ATTACHED NO
25* EXPORTED TO THIRD COUNTRIES NOT BY THE FIRMDISTRIBUTION LIST ATTACHED NO
IN CASe OF A Re je CTION AT THe bORDe R:26* POINT OF ENTRY27* TYPE OF CHECK28* COUNTRY OF DISPATCH
(Continued)
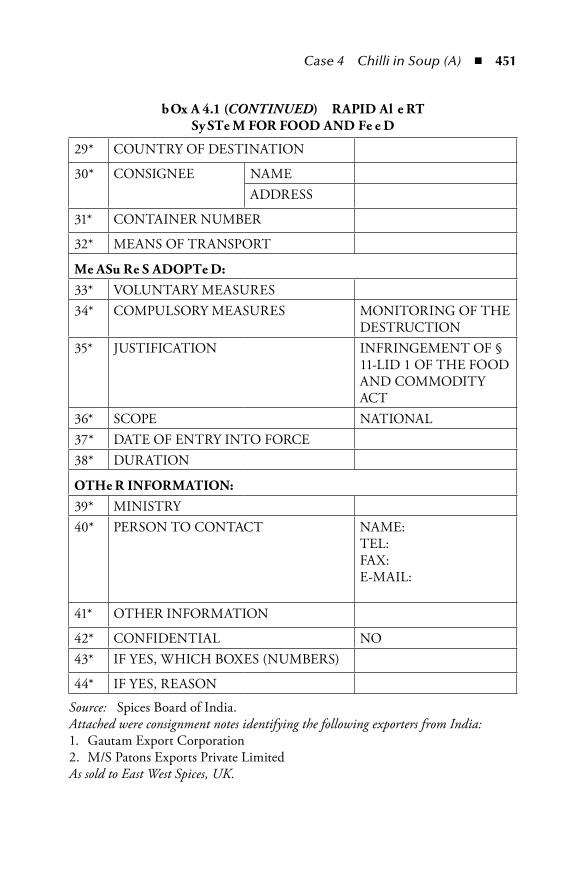
Case 4 Chilli in Soup (A) ◾ 451
bOx A 4.1 (CoNtiNUed) RAPID Al e RT Sy STe M FOR FOOD AND Fe e D
29* COUNTRY OF DESTINATION
30* CONSIGNEE NAMEADDRESS
31* CONTAINER NUMBER
32* MEANS OF TRANSPORT
Me ASu Re S ADOPTe D:33* VOLUNTARY MEASURES34* COMPULSORY MEASURES MONITORING OF THE
DESTRUCTION35* JUSTIFICATION INFRINGEMENT OF §
11-LID 1 OF THE FOOD AND COMMODITY ACT
36* SCOPE NATIONAL37* DATE OF ENTRY INTO FORCE38* DURATION
OTHe R INFORMATION:39* MINISTRY40* PERSON TO CONTACT NAME:
TEL:FAX:E-MAIL:
41* OTHER INFORMATION
42* CONFIDENTIAL NO43* IF YES, WHICH BOXES (NUMBERS)
44* IF YES, REASON
Source: Spices Board of India.Attached were consignment notes identifying the following exporters from India:1. Gautam Export Corporation2. M/S Patons Exports Private LimitedAs sold to East West Spices, UK.
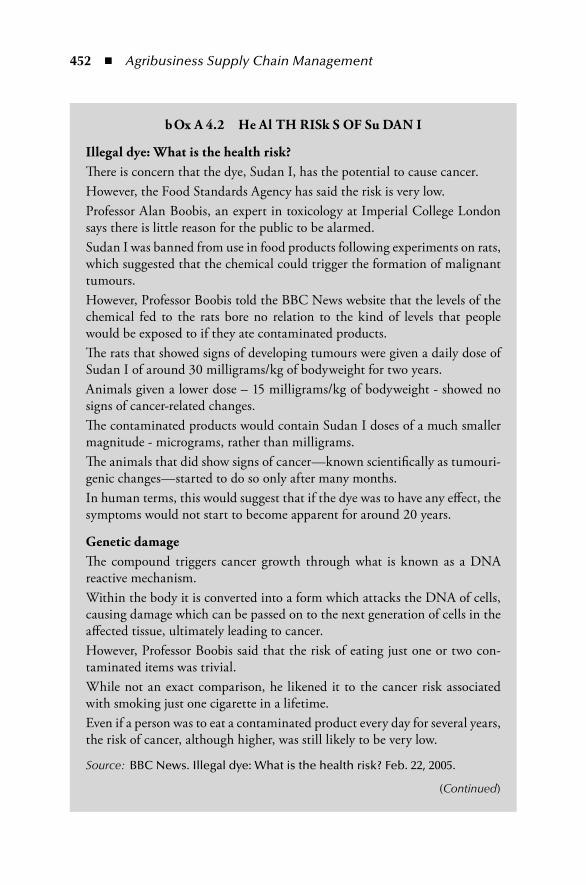
452 ◾ Agribusiness Supply Chain Management
bOx A 4.2 He Al TH RISk S OF Su DAN I
Illegal dye: What is the health risk?There is concern that the dye, Sudan I, has the potential to cause cancer.However, the Food Standards Agency has said the risk is very low.Professor Alan Boobis, an expert in toxicology at Imperial College London says there is little reason for the public to be alarmed.Sudan I was banned from use in food products following experiments on rats, which suggested that the chemical could trigger the formation of malignant tumours.However, Professor Boobis told the BBC News website that the levels of the chemical fed to the rats bore no relation to the kind of levels that people would be exposed to if they ate contaminated products.The rats that showed signs of developing tumours were given a daily dose of Sudan I of around 30 milligrams/kg of bodyweight for two years.Animals given a lower dose – 15 milligrams/kg of bodyweight - showed no signs of cancer-related changes.The contaminated products would contain Sudan I doses of a much smaller magnitude - micrograms, rather than milligrams.The animals that did show signs of cancer—known scientifically as tumouri-genic changes—started to do so only after many months.In human terms, this would suggest that if the dye was to have any effect, the symptoms would not start to become apparent for around 20 years.
Genetic damageThe compound triggers cancer growth through what is known as a DNA reactive mechanism.Within the body it is converted into a form which attacks the DNA of cells, causing damage which can be passed on to the next generation of cells in the affected tissue, ultimately leading to cancer.However, Professor Boobis said that the risk of eating just one or two con-taminated items was trivial.While not an exact comparison, he likened it to the cancer risk associated with smoking just one cigarette in a lifetime.Even if a person was to eat a contaminated product every day for several years, the risk of cancer, although higher, was still likely to be very low.
Source: BBC News. Illegal dye: What is the health risk? Feb. 22, 2005.
(Continued)
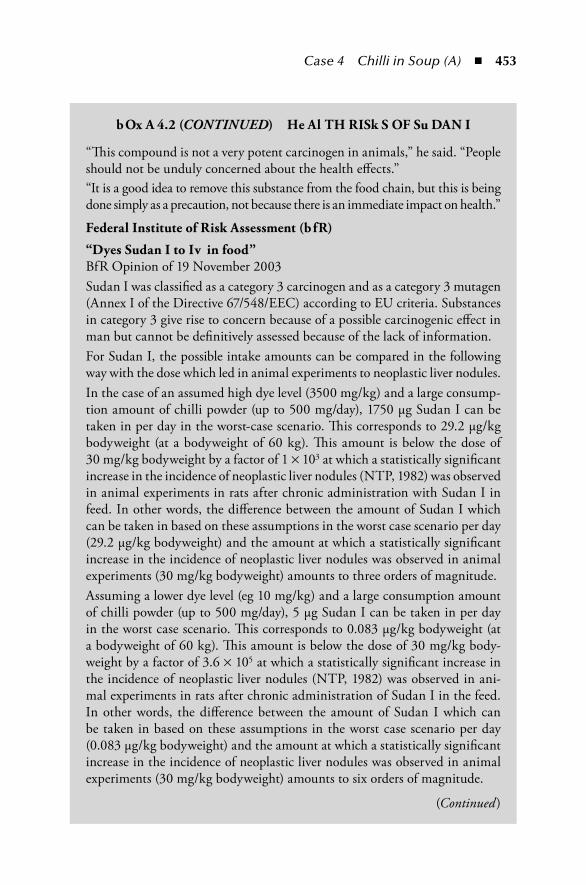
Case 4 Chilli in Soup (A) ◾ 453
bOx A 4.2 (CoNtiNUed) He Al TH RISk S OF Su DAN I
“This compound is not a very potent carcinogen in animals,” he said. “People should not be unduly concerned about the health effects.”“It is a good idea to remove this substance from the food chain, but this is being done simply as a precaution, not because there is an immediate impact on health.”
Federal Institute of Risk Assessment (bfR)
“Dyes Sudan I to Iv in food”BfR Opinion of 19 November 2003Sudan I was classified as a category 3 carcinogen and as a category 3 mutagen (Annex I of the Directive 67/548/EEC) according to EU criteria. Substances in category 3 give rise to concern because of a possible carcinogenic effect in man but cannot be definitively assessed because of the lack of information.For Sudan I, the possible intake amounts can be compared in the following way with the dose which led in animal experiments to neoplastic liver nodules.In the case of an assumed high dye level (3500 mg/kg) and a large consump-tion amount of chilli powder (up to 500 mg/day), 1750 µg Sudan I can be taken in per day in the worst-case scenario. This corresponds to 29.2 µg/kg bodyweight (at a bodyweight of 60 kg). This amount is below the dose of 30 mg/kg bodyweight by a factor of 1 × 10³ at which a statistically significant increase in the incidence of neoplastic liver nodules (NTP, 1982) was observed in animal experiments in rats after chronic administration with Sudan I in feed. In other words, the difference between the amount of Sudan I which can be taken in based on these assumptions in the worst case scenario per day (29.2 µg/kg bodyweight) and the amount at which a statistically significant increase in the incidence of neoplastic liver nodules was observed in animal experiments (30 mg/kg bodyweight) amounts to three orders of magnitude.Assuming a lower dye level (eg 10 mg/kg) and a large consumption amount of chilli powder (up to 500 mg/day), 5 µg Sudan I can be taken in per day in the worst case scenario. This corresponds to 0.083 µg/kg bodyweight (at a bodyweight of 60 kg). This amount is below the dose of 30 mg/kg body-weight by a factor of 3.6 × 10⁵ at which a statistically significant increase in the incidence of neoplastic liver nodules (NTP, 1982) was observed in ani-mal experiments in rats after chronic administration of Sudan I in the feed. In other words, the difference between the amount of Sudan I which can be taken in based on these assumptions in the worst case scenario per day (0.083 µg/kg bodyweight) and the amount at which a statistically significant increase in the incidence of neoplastic liver nodules was observed in animal experiments (30 mg/kg bodyweight) amounts to six orders of magnitude.
(Continued)
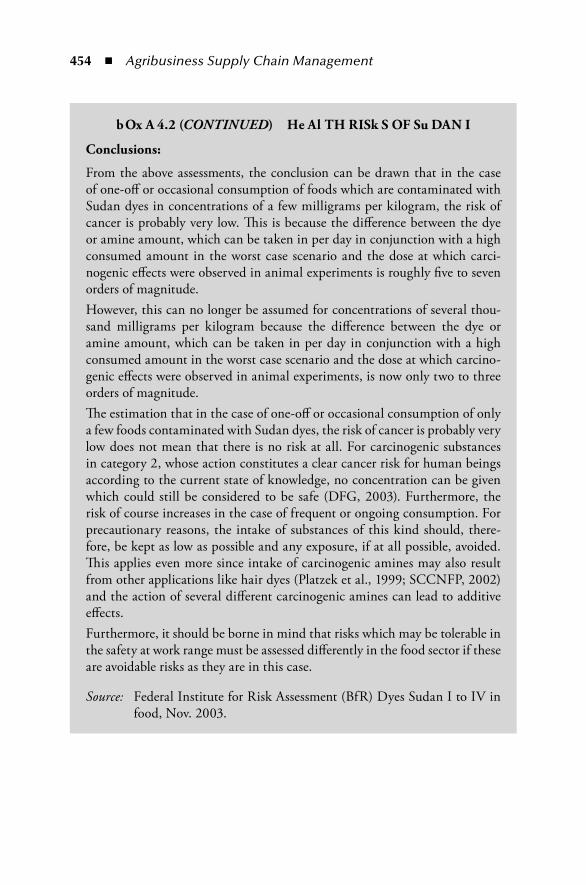
454 ◾ Agribusiness Supply Chain Management
bOx A 4.2 (CoNtiNUed) He Al TH RISk S OF Su DAN I
Conclusions:
From the above assessments, the conclusion can be drawn that in the case of one-off or occasional consumption of foods which are contaminated with Sudan dyes in concentrations of a few milligrams per kilogram, the risk of cancer is probably very low. This is because the difference between the dye or amine amount, which can be taken in per day in conjunction with a high consumed amount in the worst case scenario and the dose at which carci-nogenic effects were observed in animal experiments is roughly five to seven orders of magnitude.However, this can no longer be assumed for concentrations of several thou-sand milligrams per kilogram because the difference between the dye or amine amount, which can be taken in per day in conjunction with a high consumed amount in the worst case scenario and the dose at which carcino-genic effects were observed in animal experiments, is now only two to three orders of magnitude.The estimation that in the case of one-off or occasional consumption of only a few foods contaminated with Sudan dyes, the risk of cancer is probably very low does not mean that there is no risk at all. For carcinogenic substances in category 2, whose action constitutes a clear cancer risk for human beings according to the current state of knowledge, no concentration can be given which could still be considered to be safe (DFG, 2003). Furthermore, the risk of course increases in the case of frequent or ongoing consumption. For precautionary reasons, the intake of substances of this kind should, there-fore, be kept as low as possible and any exposure, if at all possible, avoided. This applies even more since intake of carcinogenic amines may also result from other applications like hair dyes (Platzek et al., 1999; SCCNFP, 2002) and the action of several different carcinogenic amines can lead to additive effects.Furthermore, it should be borne in mind that risks which may be tolerable in the safety at work range must be assessed differently in the food sector if these are avoidable risks as they are in this case.
Source: Federal Institute for Risk Assessment (BfR) Dyes Sudan I to IV in food, Nov. 2003.
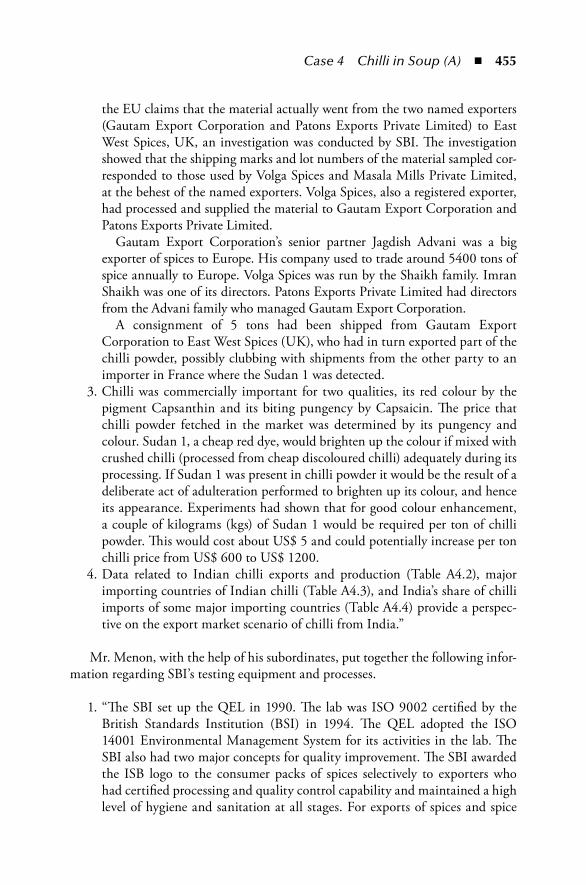
Case 4 Chilli in Soup (A) ◾ 455
the EU claims that the material actually went from the two named exporters (Gautam Export Corporation and Patons Exports Private Limited) to East West Spices, UK, an investigation was conducted by SBI. The investigation showed that the shipping marks and lot numbers of the material sampled cor-responded to those used by Volga Spices and Masala Mills Private Limited, at the behest of the named exporters. Volga Spices, also a registered exporter, had processed and supplied the material to Gautam Export Corporation and Patons Exports Private Limited.
Gautam Export Corporation’s senior partner Jagdish Advani was a big exporter of spices to Europe. His company used to trade around 5400 tons of spice annually to Europe. Volga Spices was run by the Shaikh family. Imran Shaikh was one of its directors. Patons Exports Private Limited had directors from the Advani family who managed Gautam Export Corporation.
A consignment of 5 tons had been shipped from Gautam Export Corporation to East West Spices (UK), who had in turn exported part of the chilli powder, possibly clubbing with shipments from the other party to an importer in France where the Sudan 1 was detected.
3. Chilli was commercially important for two qualities, its red colour by the pigment Capsanthin and its biting pungency by Capsaicin. The price that chilli powder fetched in the market was determined by its pungency and colour. Sudan 1, a cheap red dye, would brighten up the colour if mixed with crushed chilli (processed from cheap discoloured chilli) adequately during its processing. If Sudan 1 was present in chilli powder it would be the result of a deliberate act of adulteration performed to brighten up its colour, and hence its appearance. Experiments had shown that for good colour enhancement, a couple of kilograms (kgs) of Sudan 1 would be required per ton of chilli powder. This would cost about US$ 5 and could potentially increase per ton chilli price from US$ 600 to US$ 1200.
4. Data related to Indian chilli exports and production (Table A4.2), major importing countries of Indian chilli (Table A4.3), and India’s share of chilli imports of some major importing countries (Table A4.4) provide a perspec-tive on the export market scenario of chilli from India.”
Mr. Menon, with the help of his subordinates, put together the following infor-mation regarding SBI’s testing equipment and processes.
1. “The SBI set up the QEL in 1990. The lab was ISO 9002 certified by the British Standards Institution (BSI) in 1994. The QEL adopted the ISO 14001 Environmental Management System for its activities in the lab. The SBI also had two major concepts for quality improvement. The SBI awarded the ISB logo to the consumer packs of spices selectively to exporters who had certified processing and quality control capability and maintained a high level of hygiene and sanitation at all stages. For exports of spices and spice
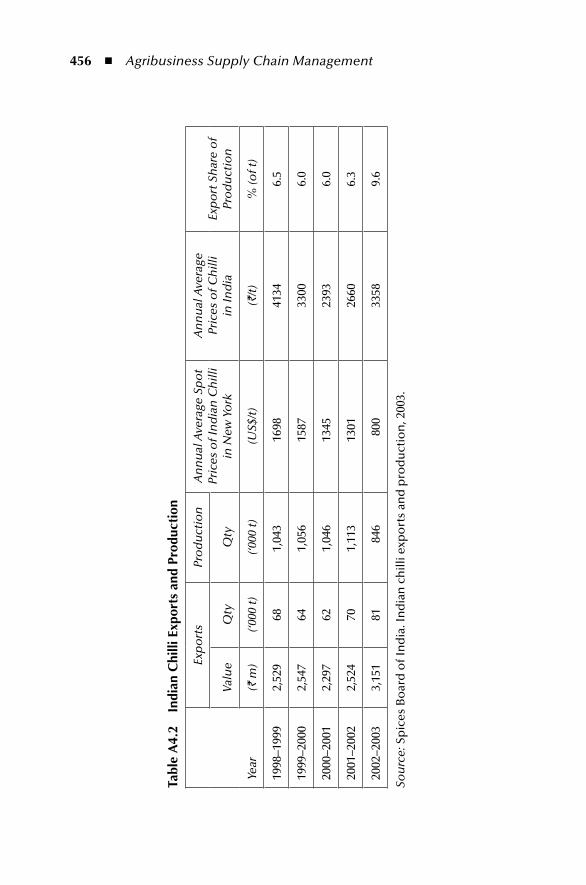
456 ◾ Agribusiness Supply Chain Management
tabl
e A
4.2
indi
an C
hilli
exp
orts
and
pro
duct
ion
Year
Exp
ort
sPr
od
uct
ion
An
nu
al A
vera
ge S
po
t Pr
ices
of I
nd
ian
Ch
illi
in N
ew Y
ork
An
nu
al A
vera
ge
Pric
es o
f Ch
illi
in In
dia
Exp
ort
Sh
are
of
Pro
du
ctio
nVa
lue
Qty
Qty
( ` m
)(‘0
00 t)
(‘000
t)(U
S$/t
)(`
/t)
% (o
f t)
1998
–199
92,
529
681,
043
1698
4134
6.5
1999
–200
02,
547
641,
056
1587
3300
6.0
2000
–200
12,
297
621,
046
1345
2393
6.0
2001
–200
22,
524
701,
113
1301
2660
6.3
2002
–200
33,
151
8184
680
033
589.
6
Sou
rce:
Sp
ices
Bo
ard
of I
nd
ia. I
nd
ian
ch
illi e
xpo
rts
and
pro
du
ctio
n, 2
003.
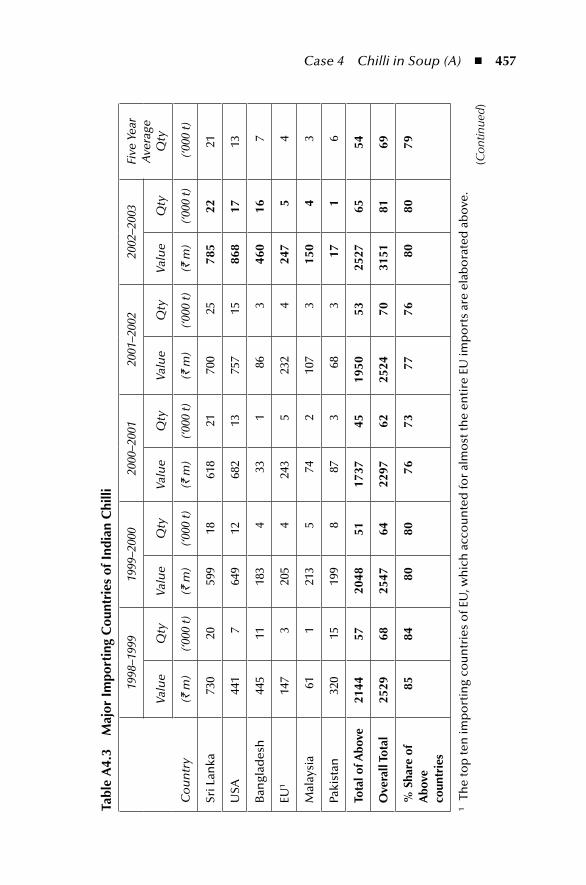
Case 4 Chilli in Soup (A) ◾ 457
tabl
e A
4.3
maj
or i
mpo
rtin
g C
ount
ries
of i
ndia
n C
hilli
Co
un
try
1998
–199
919
99–2
000
2000
–200
120
01–2
002
2002
–200
3Fi
ve Y
ear
Ave
rage
Q
tyVa
lue
Qty
Valu
eQ
tyVa
lue
Qty
Valu
eQ
tyVa
lue
Qty
( ` m
)(‘0
00 t)
(` m
)(‘0
00 t)
(` m
)(‘0
00 t)
(` m
)(‘0
00 t)
(` m
)(‘0
00 t)
(‘00
0 t)
Sri L
anka
730
2059
918
618
2170
025
785
2221
USA
441
764
912
682
1375
715
868
1713
Ban
glad
esh
445
1118
34
331
863
460
167
EU1
147
320
54
243
523
24
247
54
Mal
aysi
a61
121
35
742
107
315
04
3
Paki
stan
320
1519
98
873
683
171
6
tota
l of A
bove
2144
5720
4851
1737
4519
5053
2527
6554
ove
rall
tota
l25
2968
2547
6422
9762
2524
7031
5181
69
% S
hare
of
Abo
ve
coun
trie
s
8584
8080
7673
7776
8080
79
1 Th
e to
p te
n im
po
rtin
g co
un
trie
s o
f EU
, wh
ich
acc
ou
nte
d fo
r al
mo
st th
e en
tire
EU
imp
ort
s ar
e el
abo
rate
d a
bo
ve.
(Con
tinue
d)
458 ◾ Agribusiness Supply Chain Management
tabl
e A
4.3
(Con
tinu
ed)
maj
or i
mpo
rtin
g C
ount
ries
of i
ndia
n C
hilli
Co
un
try
1998
–199
919
99–2
000
2000
–200
120
01–2
002
2002
–200
3Fi
ve Y
ear
Ave
rage
Q
tyVa
lue
Qty
Valu
eQ
tyVa
lue
Qty
Valu
eQ
tyVa
lue
Qty
( ` m
)(‘0
00 t)
(` m
)(‘0
00 t)
(` m
)(‘0
00 t)
(` m
)(‘0
00 t)
(` m
)(‘0
00 t)
(‘000
t)
UK
80.0
1.40
87.0
1.42
92.8
1.67
104.
71.
9298
.01.
801.
64
Net
her
lan
ds
16.0
0.30
29.0
0.57
47.1
1.08
33.1
0.75
39.0
0.82
0.70
Ital
y22
.00.
3943
.00.
7541
.30.
7936
.10.
6241
.00.
690.
65
Fran
ce8.
50.
2014
.00.
3014
.90.
3716
.00.
3813
.00.
290.
31
Ger
man
y3.
50.
0911
.00.
3410
.00.
199.
50.
2211
.00.
240.
21
Spai
n3.
50.
064.
60.
0717
.60.
2717
.50.
2620
.00.
340.
20
Pola
nd
2.8
0.10
2.6
0.11
5.6
0.21
2.4
0.09
4.7
0.16
0.13
Gre
ece
3.7
0.08
12.0
0.24
5.8
0.13
5.0
0.11
5.1
0.10
0.13
Bel
giu
m4.
10.
102.
40.
053.
50.
062.
20.
046.
90.
110.
07
Swed
en3.
20.
020.
10.
004.
20.
065.
00.
058.
70.
080.
04
eu t
otal
147
320
64
243
523
24
247
54
Sour
ce:
Spic
es B
oar
d o
f In
dia
. Maj
or
imp
ort
ing
cou
ntr
ies
of I
nd
ian
ch
illi.
2003
.
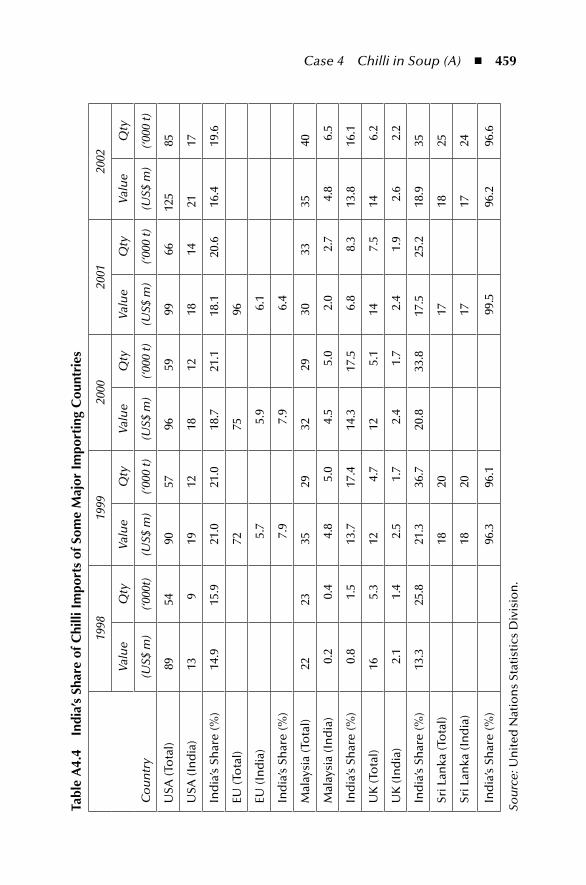
Case 4 Chilli in Soup (A) ◾ 459
tabl
e A
4.4
indi
a’s
Shar
e of
Chi
lli i
mpo
rts
of S
ome
maj
or i
mpo
rtin
g C
ount
ries
Co
un
try
1998
1999
2000
2001
2002
Valu
eQ
tyVa
lue
Qty
Valu
eQ
tyVa
lue
Qty
Valu
eQ
ty
(US$
m)
(‘000
t)(U
S$ m
)(‘0
00 t)
(US$
m)
(‘000
t)(U
S$ m
)(‘0
00 t)
(US$
m)
(‘000
t)
USA
(To
tal)
8954
9057
9659
9966
125
85
USA
(In
dia
)13
919
1218
1218
1421
17
Ind
ia’s
Sh
are
(%)
14.9
15.9
21.0
21.0
18.7
21.1
18.1
20.6
16.4
19.6
EU (T
ota
l)72
7596
EU (I
nd
ia)
5.7
5.9
6.1
Ind
ia’s
Sh
are
(%)
7.9
7.9
6.4
Mal
aysi
a (T
ota
l)22
2335
2932
2930
3335
40
Mal
aysi
a (I
nd
ia)
0.2
0.4
4.8
5.0
4.5
5.0
2.0
2.7
4.8
6.5
Ind
ia’s
Sh
are
(%)
0.8
1.5
13.7
17.4
14.3
17.5
6.8
8.3
13.8
16.1
UK
(To
tal)
165.
312
4.7
125.
114
7.5
146.
2
UK
(In
dia
)2.
11.
42.
51.
72.
41.
72.
41.
92.
62.
2
Ind
ia’s
Sh
are
(%)
13.3
25.8
21.3
36.7
20.8
33.8
17.5
25.2
18.9
35
Sri L
anka
(To
tal)
1820
1718
25
Sri L
anka
(In
dia
)18
2017
1724
Ind
ia’s
Sh
are
(%)
96.3
96.1
99.5
96.2
96.6
Sou
rce:
Un
ited
Nat
ion
s St
atis
tics
Div
isio
n.
460 ◾ Agribusiness Supply Chain Management
products in bulk, it awarded the Spice House Certificates to those processors/exporters who had a genuine commitment to sustainable quality and export growth and made investments in developing in-house processing facilities, infrastructure and had the necessary competence to ensure consistent qual-ity and reliability. These facilities should cover cleaning, grading, processing, packaging and warehousing.
2. The two important quality characteristics that determined the price of red chilli powder were its colour (measured in ASTA units) and pungency (Capsaicin percentage). Besides that, Aflatoxin (a toxic metabolite produced by certain moulds in food and feed) content was a critical parameter that should not exceed a threshold level (though different for different countries) in the exported chilli powder. Several other parameters could be tested in the SBI lab. (See Table A5.1 for the analytical services offered by SBI including the list of tests, charges and the time taken for getting the report.)
3. The lab had five High Performance Liquid Chromatographs (HPLC) machines for detecting the Aflatoxin content. HPLC was used to find the amount of a chemical compound within a mixture of other chemicals. It could detect up to the level of 5 ppm (5 gm in a ton). An HPLC machine could also be used for detecting Sudan 1. Each machine could analyse 20 samples a day.
4. Usually, the big exporters had their own testing facilities. Most of the requests for testing were received from small exporters who did not have their own facilities. On an average, around 30 samples were analysed each day by HPLC machines for various tests on different spices.”
On June 13, 2003, Mr. Jose, Mr. Kannan and Mr. Menon met to discuss the way forward. Mr. Jose asked Mr. Kannan for his views. Mr. Kannan said “I was aware of the unregulated use of banned red dyes to brighten up the color of red chilli powder in the domestic market in order to fetch good prices. But this is the first time it has happened in the export market. Maybe, it has happened in the past too, but was not detected. The quantum of Sudan 1 added by the alleged exporters at 3890 ppm was a deliberate act that needed stern action.”
Mr. Kannan further added, “The events after 9/11 had changed the world. Since then the threats of bioterrorism had been lurking in the minds of people in the USA and Europe. Consequently, the food regulatory authorities and the consumers had become more sensitive about any kind of adulteration. Checking had become more frequent and thus increased the chance of detection.”
Mr. Jose mentioned that certain sources in Europe had informed him that the EU had been seriously contemplating the imposition of some kind of restriction to ensure the import of Sudan 1-free chilli powder and chilli products to its mem-ber countries. It could lead to the requirement of an analytical report from well- established labs certifying the export consignment to be Sudan 1-free. He continued, “If such a situation actually arises,
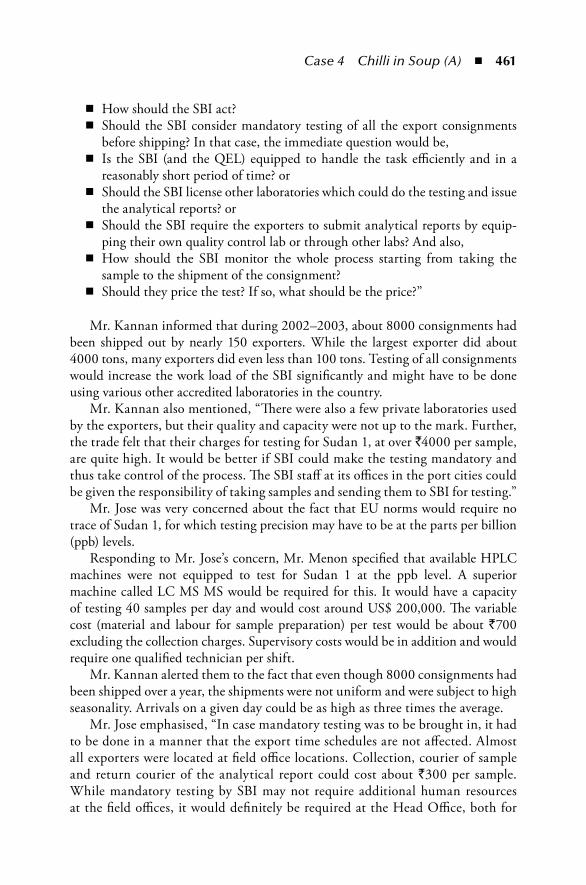
Case 4 Chilli in Soup (A) ◾ 461
◾ How should the SBI act? ◾ Should the SBI consider mandatory testing of all the export consignments
before shipping? In that case, the immediate question would be, ◾ Is the SBI (and the QEL) equipped to handle the task efficiently and in a
reasonably short period of time? or ◾ Should the SBI license other laboratories which could do the testing and issue
the analytical reports? or ◾ Should the SBI require the exporters to submit analytical reports by equip-
ping their own quality control lab or through other labs? And also, ◾ How should the SBI monitor the whole process starting from taking the
sample to the shipment of the consignment? ◾ Should they price the test? If so, what should be the price?”
Mr. Kannan informed that during 2002–2003, about 8000 consignments had been shipped out by nearly 150 exporters. While the largest exporter did about 4000 tons, many exporters did even less than 100 tons. Testing of all consignments would increase the work load of the SBI significantly and might have to be done using various other accredited laboratories in the country.
Mr. Kannan also mentioned, “There were also a few private laboratories used by the exporters, but their quality and capacity were not up to the mark. Further, the trade felt that their charges for testing for Sudan 1, at over `4000 per sample, are quite high. It would be better if SBI could make the testing mandatory and thus take control of the process. The SBI staff at its offices in the port cities could be given the responsibility of taking samples and sending them to SBI for testing.”
Mr. Jose was very concerned about the fact that EU norms would require no trace of Sudan 1, for which testing precision may have to be at the parts per billion (ppb) levels.
Responding to Mr. Jose’s concern, Mr. Menon specified that available HPLC machines were not equipped to test for Sudan 1 at the ppb level. A superior machine called LC MS MS would be required for this. It would have a capacity of testing 40 samples per day and would cost around US$ 200,000. The variable cost ( material and labour for sample preparation) per test would be about `700 excluding the collection charges. Supervisory costs would be in addition and would require one qualified technician per shift.
Mr. Kannan alerted them to the fact that even though 8000 consignments had been shipped over a year, the shipments were not uniform and were subject to high seasonality. Arrivals on a given day could be as high as three times the average.
Mr. Jose emphasised, “In case mandatory testing was to be brought in, it had to be done in a manner that the export time schedules are not affected. Almost all exporters were located at field office locations. Collection, courier of sample and return courier of the analytical report could cost about `300 per sample. While mandatory testing by SBI may not require additional human resources at the field offices, it would definitely be required at the Head Office, both for
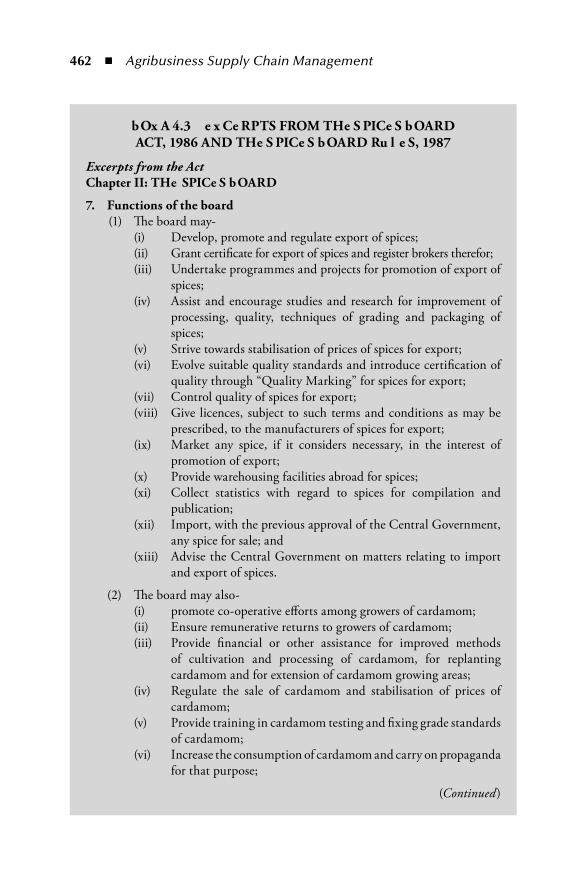
462 ◾ Agribusiness Supply Chain Management
bOx A 4.3 e x Ce RPTS FROM THe S PICe S bOARD ACT, 1986 AND THe S PICe S bOARD Ru l e S, 1987
excerpts from the ActChapter II: THe SPICe S bOARD
7. Functions of the board (1) The board may-
(i) Develop, promote and regulate export of spices; (ii) Grant certificate for export of spices and register brokers therefor; (iii) Undertake programmes and projects for promotion of export of
spices; (iv) Assist and encourage studies and research for improvement of
processing, quality, techniques of grading and packaging of spices;
(v) Strive towards stabilisation of prices of spices for export; (vi) Evolve suitable quality standards and introduce certification of
quality through “Quality Marking” for spices for export; (vii) Control quality of spices for export; (viii) Give licences, subject to such terms and conditions as may be
prescribed, to the manufacturers of spices for export; (ix) Market any spice, if it considers necessary, in the interest of
promotion of export; (x) Provide warehousing facilities abroad for spices; (xi) Collect statistics with regard to spices for compilation and
publication; (xii) Import, with the previous approval of the Central Government,
any spice for sale; and (xiii) Advise the Central Government on matters relating to import
and export of spices.
(2) The board may also- (i) promote co-operative efforts among growers of cardamom; (ii) Ensure remunerative returns to growers of cardamom; (iii) Provide financial or other assistance for improved methods
of cultivation and processing of cardamom, for replanting cardamom and for extension of cardamom growing areas;
(iv) Regulate the sale of cardamom and stabilisation of prices of cardamom;
(v) Provide training in cardamom testing and fixing grade standards of cardamom;
(vi) Increase the consumption of cardamom and carry on propaganda for that purpose;
(Continued)
Case 4 Chilli in Soup (A) ◾ 463
bOx A4.3 (CoNtiNUed) e x Ce RPTS FROM THe S PICe S bOARD ACT, 1986 AND THe S PICe S bOARD Ru l e S, 1987
(vii) Register and licence brokers (including auctioneers) of carda-mom and persons engaged in the business of cardamom;
(viii) Improve the marketing of cardamom; (ix) collect statistics from growers, dealers and such other persons
as may be prescribed on any matter relating to the cardamom industry; publish statistics so collected or portions thereof or extracts therefrom;
(x) Secure better working conditions and the provision and improve-ment of amenities and incentives for workers; and
(xi) Undertake, assist or encourage scientific, technological and eco-nomic research.
Chapter Iv : Ce RTIFICATe FOR e x PORT OF SPICe S11. No person to export spices without certificateSave as otherwise provided in this act, no person shall, after the commencement of this act, commence or carry on the business of export of any spice except under and in accordance with a certificate.Provided that a person carrying on the business of export of spices immediately before the commencement of this act, may continue to do so for a period of three months from such commencement; and if he has made an application for such certificate within the said period of three months till the disposal of such application.Explanation- The reference in this section to the commencement of this act shall be construed in relation to any spice added to the Schedule by notification under the proviso to clause (n) of section 2 as reference to the date with effect from which such spice is added to the Schedule.
12. Grant of certificate (1) An application for grant of certificate shall be made to the board in
such form and shall contain such particulars as may be prescribed and shall be accompanied by a receipt evidencing the payment of the pre-scribed fee.
(2) On receipt of such application, the board shall,- (a) if the application is not in the prescribed form or does not contain
any of the prescribed particulars, return the application to the applicant; or
(b) if the application is in the prescribed form and contains the prescribed particulars, grant the certificate subject to such terms and conditions as may be determined by regulations.
(Continued)
464 ◾ Agribusiness Supply Chain Management
bOx A4.3 (CoNtiNUed) e x Ce RPTS FROM THe S PICe S bOARD ACT, 1986 AND THe S PICe S bOARD Ru l e S, 1987
13. Cancellation, suspension, etc, of certificate (1) The board may cancel any certificate on any one or more of the following
grounds, namely:- (a) that the holder of the certificate has violated any of the terms and
conditions of the certificate; and (b) that in the opinion of the Central Government it is necessary in
the interests of general public to cancel the certificate. (2) Where the board, for reasons to be recorded in writing, is satisfied that
pending consideration of the question of cancelling the certificate on any grounds mentioned in sub-section (1), it is necessary so to do, the board may, by order in writing, suspend the operation of the certificate for such period not exceeding forty-five days as may be specified in the order and require the holder of the certificate to show cause, within fifteen days from the date of receipt of such order, as to why the suspension of the certificate should not be extended till the determination of the question as to whether the registration should be cancelled.
(3) No order of cancellation of registration under this section shall be made unless the person concerned has been given a reasonable opportunity of being heard in respect of the grounds for such cancellation.
14. Appeal (1) Any person aggrieved by an order made under section 13 may prefer
an appeal to the Central Government within such period as may be prescribed.
(2) No appeal shall be admitted if it is preferred after the expiry of the period prescribed therefore:
Provided that an appeal may be admitted after the expiry of the period prescribed therefore, if the appellant satisfies the Central Government that he had sufficient cause for not preferring the appeal within the prescribed period.
(3) Every appeal made under this section shall be made in such form and shall be accompanied by a copy of order appealed against and by such fees as may be prescribed.
(4) The procedure for disposing of an appeal shall be such as may be prescribed:
Provided that before disposing of an appeal, the appellant shall be given a reasonable opportunity of being heard.
(5) The Central Government may confirm, modify or reverse the order appealed against.
(Continued)
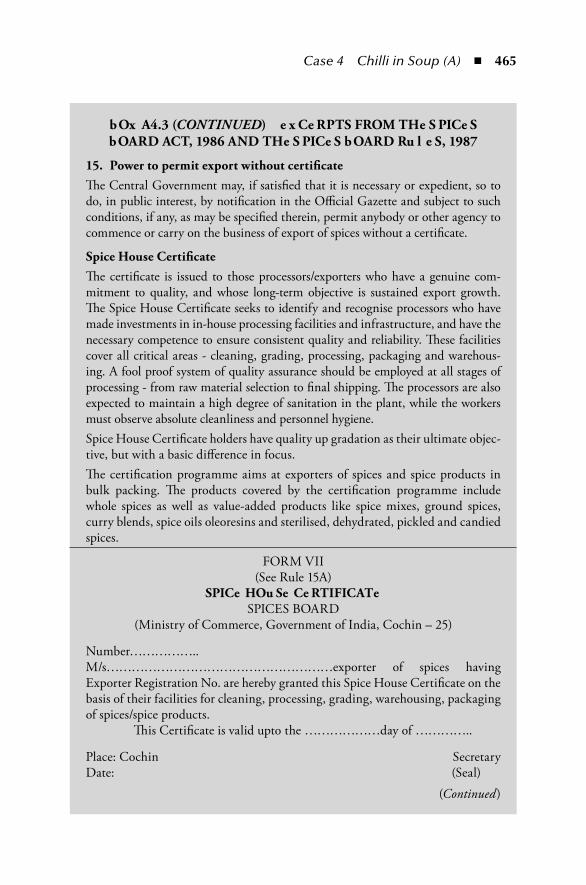
Case 4 Chilli in Soup (A) ◾ 465
bOx A4.3 (CoNtiNUed) e x Ce RPTS FROM THe S PICe S bOARD ACT, 1986 AND THe S PICe S bOARD Ru l e S, 1987
15. Power to permit export without certificateThe Central Government may, if satisfied that it is necessary or expedient, so to do, in public interest, by notification in the Official Gazette and subject to such conditions, if any, as may be specified therein, permit anybody or other agency to commence or carry on the business of export of spices without a certificate.
Spice House CertificateThe certificate is issued to those processors/exporters who have a genuine com-mitment to quality, and whose long-term objective is sustained export growth. The Spice House Certificate seeks to identify and recognise processors who have made investments in in-house processing facilities and infrastructure, and have the necessary competence to ensure consistent quality and reliability. These facilities cover all critical areas - cleaning, grading, processing, packaging and warehous-ing. A fool proof system of quality assurance should be employed at all stages of processing - from raw material selection to final shipping. The processors are also expected to maintain a high degree of sanitation in the plant, while the workers must observe absolute cleanliness and personnel hygiene.Spice House Certificate holders have quality up gradation as their ultimate objec-tive, but with a basic difference in focus.The certification programme aims at exporters of spices and spice products in bulk packing. The products covered by the certification programme include whole spices as well as value-added products like spice mixes, ground spices, curry blends, spice oils oleoresins and sterilised, dehydrated, pickled and candied spices.
FORM VII(See Rule 15A)
SPICe HOu Se Ce RTIFICATeSPICES BOARD
(Ministry of Commerce, Government of India, Cochin – 25)
Number……………..M/s………………………………………………exporter of spices having Exporter Registration No. are hereby granted this Spice House Certificate on the basis of their facilities for cleaning, processing, grading, warehousing, packaging of spices/spice products. This Certificate is valid upto the ………………day of …………..
Place: Cochin SecretaryDate: (Seal)
(Continued)
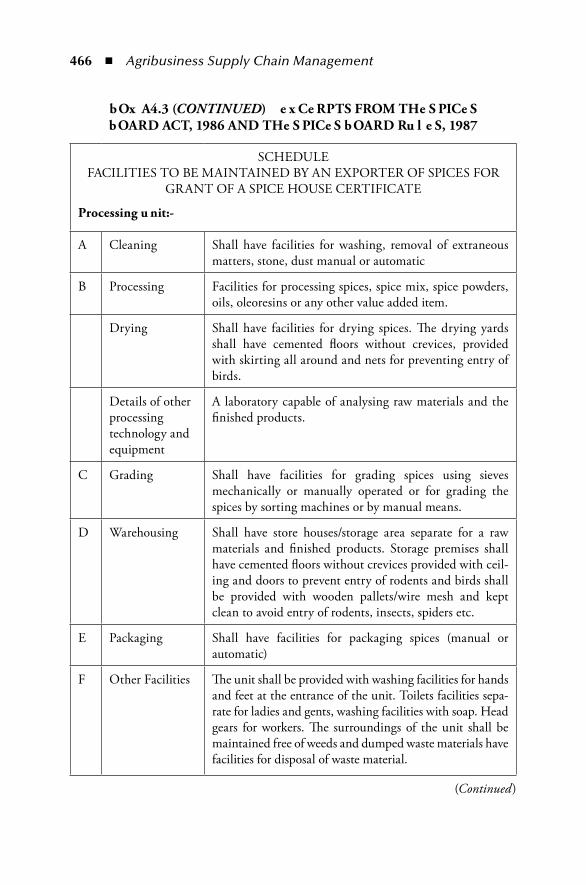
466 ◾ Agribusiness Supply Chain Management
bOx A4.3 (CoNtiNUed) e x Ce RPTS FROM THe S PICe S bOARD ACT, 1986 AND THe S PICe S bOARD Ru l e S, 1987
SCHEDULEFACILITIES TO BE MAINTAINED BY AN EXPORTER OF SPICES FOR
GRANT OF A SPICE HOUSE CERTIFICATE
Processing u nit:-
A Cleaning Shall have facilities for washing, removal of extraneous matters, stone, dust manual or automatic
B Processing Facilities for processing spices, spice mix, spice powders, oils, oleoresins or any other value added item.
Drying Shall have facilities for drying spices. The drying yards shall have cemented floors without crevices, provided with skirting all around and nets for preventing entry of birds.
Details of other processing technology and equipment
A laboratory capable of analysing raw materials and the finished products.
C Grading Shall have facilities for grading spices using sieves mechanically or manually operated or for grading the spices by sorting machines or by manual means.
D Warehousing Shall have store houses/storage area separate for a raw materials and finished products. Storage premises shall have cemented floors without crevices provided with ceil-ing and doors to prevent entry of rodents and birds shall be provided with wooden pallets/wire mesh and kept clean to avoid entry of rodents, insects, spiders etc.
E Packaging Shall have facilities for packaging spices (manual or automatic)
F Other Facilities The unit shall be provided with washing facilities for hands and feet at the entrance of the unit. Toilets facilities sepa-rate for ladies and gents, washing facilities with soap. Head gears for workers. The surroundings of the unit shall be maintained free of weeds and dumped waste materials have facilities for disposal of waste material.
(Continued)
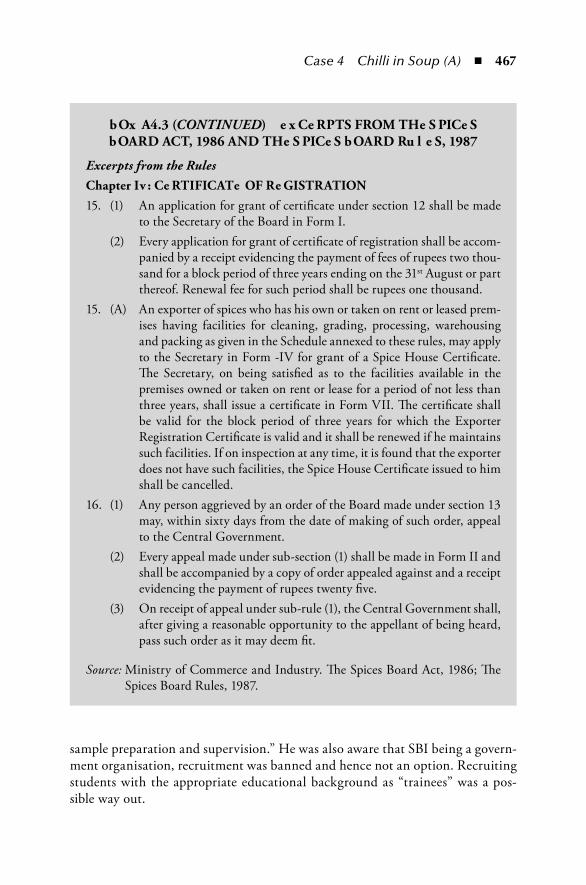
Case 4 Chilli in Soup (A) ◾ 467
sample preparation and supervision.” He was also aware that SBI being a govern-ment organisation, recruitment was banned and hence not an option. Recruiting students with the appropriate educational background as “trainees” was a pos-sible way out.
bOx A4.3 (CoNtiNUed) e x Ce RPTS FROM THe S PICe S bOARD ACT, 1986 AND THe S PICe S bOARD Ru l e S, 1987
excerpts from the Rules
Chapter Iv : Ce RTIFICATe OF Re GISTRATION15. (1) An application for grant of certificate under section 12 shall be made
to the Secretary of the Board in Form I. (2) Every application for grant of certificate of registration shall be accom-
panied by a receipt evidencing the payment of fees of rupees two thou-sand for a block period of three years ending on the 31st August or part thereof. Renewal fee for such period shall be rupees one thousand.
15. (A) An exporter of spices who has his own or taken on rent or leased prem-ises having facilities for cleaning, grading, processing, warehousing and packing as given in the Schedule annexed to these rules, may apply to the Secretary in Form -IV for grant of a Spice House Certificate. The Secretary, on being satisfied as to the facilities available in the premises owned or taken on rent or lease for a period of not less than three years, shall issue a certificate in Form VII. The certificate shall be valid for the block period of three years for which the Exporter Registration Certificate is valid and it shall be renewed if he maintains such facilities. If on inspection at any time, it is found that the exporter does not have such facilities, the Spice House Certificate issued to him shall be cancelled.
16. (1) Any person aggrieved by an order of the Board made under section 13 may, within sixty days from the date of making of such order, appeal to the Central Government.
(2) Every appeal made under sub-section (1) shall be made in Form II and shall be accompanied by a copy of order appealed against and a receipt evidencing the payment of rupees twenty five.
(3) On receipt of appeal under sub-rule (1), the Central Government shall, after giving a reasonable opportunity to the appellant of being heard, pass such order as it may deem fit.
Source: Ministry of Commerce and Industry. The Spices Board Act, 1986; The Spices Board Rules, 1987.
468 ◾ Agribusiness Supply Chain Management
Though he had raised various questions, Mr. Jose wondered whether they were overreacting. Mr. Kannan responded, “It seems that the alleged exporters get their orders through overseas middlemen. It is thus possible that parts of the same ship-ment could have gone to other processors/customers and the same could be true with other shipments.”
Mr. Jose knew that a clear message had to be sent to the industry. He also had the feeling that some of the alleged exporters had political connections. He wanted to make sure that the entire trade did not suffer due to the greed of a few. Further, in terms of regulatory powers, SBI could only suspend (pending investigation) and revoke (after investigation) the exporter’s registration for violation of conditions listed in the registration rules. (Box A4.3 gives excerpts from the Spices Board Act, 1986 and the Spices Board Rules, 1987.)
However, violation of food safety norms of the importing country or of the Prevention of Food Adulteration Act was not a listed condition for which regis-tration could be suspended or revoked by the SBI. The regulations also did not empower SBI to draw samples on a compulsory basis from the export consign-ment. To impose mandatory testing, the regulations would need to be amended.
AcknowledgementsCase prepared by Tathagata Bandyopadhyay ([email protected]), G. Raghuram ([email protected]), and Neeraj Sisodia ([email protected]), IIM, Ahmedabad.
We acknowledge the research assistance by Vishal Kashyap. We are thankful to Mr. Jose, Chairman and other senior executives of the Spices Board of India for their discussions and data support. Some data have been masked to protect sensitivities.
Teaching material of the Indian Institute of Management, Ahmedabad, is pre-pared as a basis for class discussion. Cases are not designed to present illustrations of either correct or incorrect handling of administrative problems.
This case has been reproduced with permission from Indian Institute of Management, Ahmedabad. Copyright © 2005.
referencesBBC News. Illegal dye: What is the health risk? Feb. 22, 2005. http://news.bbc.co.uk/2/hi/
health/4286847.stmFederal Institute for Risk Assessment (BfR). Dyes Sudan I to IV in food. Nov. 2003. https://
www.bfr.bund.de/cm/245/dyes_sudan_I_IV.pdfMinistry of Commerce and Industry. The Spices Board Act, 1986; The Spices Board Rules,
1987. http://www.indianspices.com/pdf/Act_Rules_English_(SB).pdfSpices Board of India. Website. 2003. http://www.indianspices.comUnited Nations Statistics Division. Accessed on Nov. 19, 2004. http://www.unstats.un.org
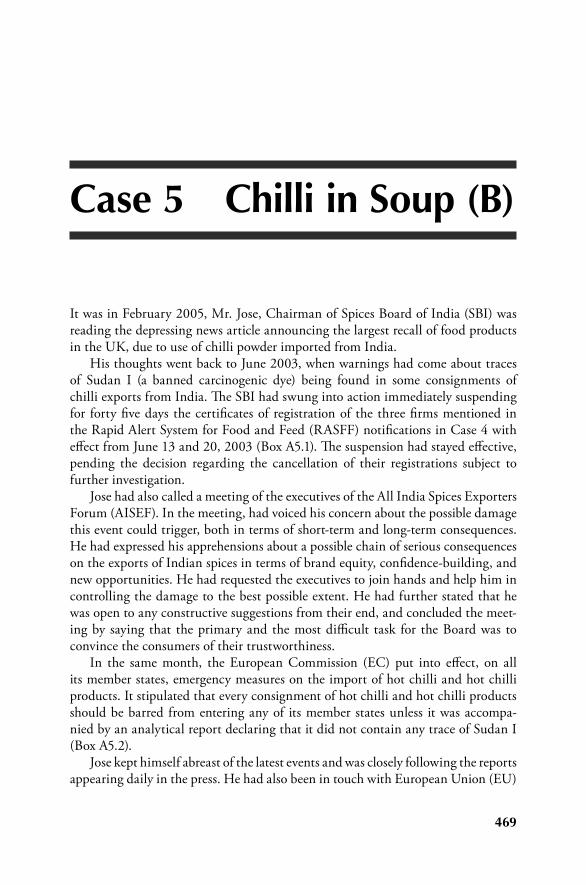
469
Case 5 Chilli in Soup (B)
It was in February 2005, Mr. Jose, Chairman of Spices Board of India (SBI) was reading the depressing news article announcing the largest recall of food products in the UK, due to use of chilli powder imported from India.
His thoughts went back to June 2003, when warnings had come about traces of Sudan I (a banned carcinogenic dye) being found in some consignments of chilli exports from India. The SBI had swung into action immediately suspending for forty five days the certificates of registration of the three firms mentioned in the Rapid Alert System for Food and Feed (RASFF) notifications in Case 4 with effect from June 13 and 20, 2003 (Box A5.1). The suspension had stayed effective, pending the decision regarding the cancellation of their registrations subject to further investigation.
Jose had also called a meeting of the executives of the All India Spices Exporters Forum (AISEF). In the meeting, had voiced his concern about the possible damage this event could trigger, both in terms of short-term and long-term consequences. He had expressed his apprehensions about a possible chain of serious consequences on the exports of Indian spices in terms of brand equity, confidence-building, and new opportunities. He had requested the executives to join hands and help him in controlling the damage to the best possible extent. He had further stated that he was open to any constructive suggestions from their end, and concluded the meet-ing by saying that the primary and the most difficult task for the Board was to convince the consumers of their trustworthiness.
In the same month, the European Commission (EC) put into effect, on all its member states, emergency measures on the import of hot chilli and hot chilli products. It stipulated that every consignment of hot chilli and hot chilli products should be barred from entering any of its member states unless it was accompa-nied by an analytical report declaring that it did not contain any trace of Sudan I (Box A5.2).
Jose kept himself abreast of the latest events and was closely following the reports appearing daily in the press. He had also been in touch with European Union (EU)
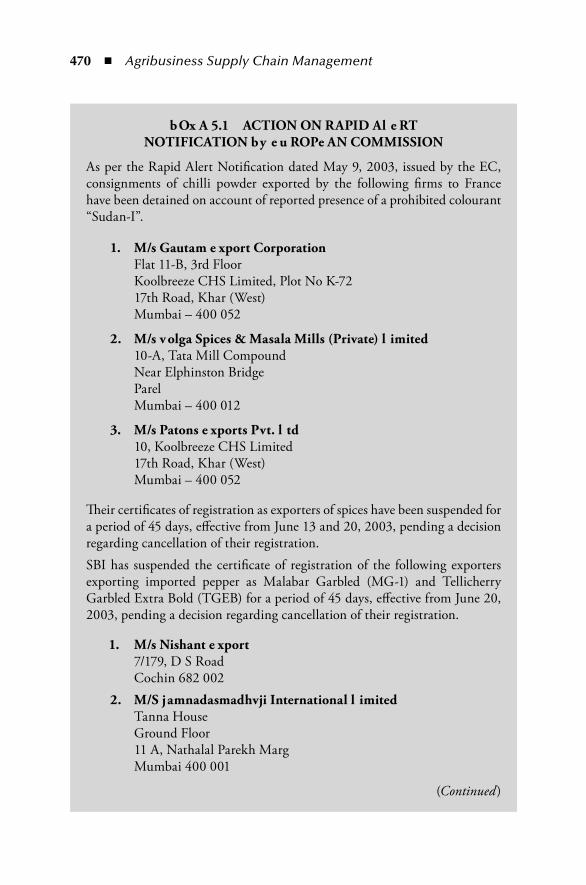
470 ◾ Agribusiness Supply Chain Management
bOx A 5.1 ACTION ON RAPID Al e RT NOTIFICATION by e u ROPe AN COMMISSION
As per the Rapid Alert Notification dated May 9, 2003, issued by the EC, consignments of chilli powder exported by the following firms to France have been detained on account of reported presence of a prohibited colourant “Sudan-I”.
1. M/s Gautam e xport Corporation Flat 11-B, 3rd Floor Koolbreeze CHS Limited, Plot No K-72 17th Road, Khar (West) Mumbai – 400 052
2. M/s v olga Spices & Masala Mills (Private) l imited 10-A, Tata Mill Compound Near Elphinston Bridge Parel Mumbai – 400 012
3. M/s Patons e xports Pvt. l td 10, Koolbreeze CHS Limited 17th Road, Khar (West) Mumbai – 400 052
Their certificates of registration as exporters of spices have been suspended for a period of 45 days, effective from June 13 and 20, 2003, pending a decision regarding cancellation of their registration.SBI has suspended the certificate of registration of the following exporters exporting imported pepper as Malabar Garbled (MG-1) and Tellicherry Garbled Extra Bold (TGEB) for a period of 45 days, effective from June 20, 2003, pending a decision regarding cancellation of their registration.
1. M/s Nishant e xport 7/179, D S Road Cochin 682 002 2. M/S jamnadasmadhvji International l imited Tanna House Ground Floor 11 A, Nathalal Parekh Marg Mumbai 400 001
(Continued)
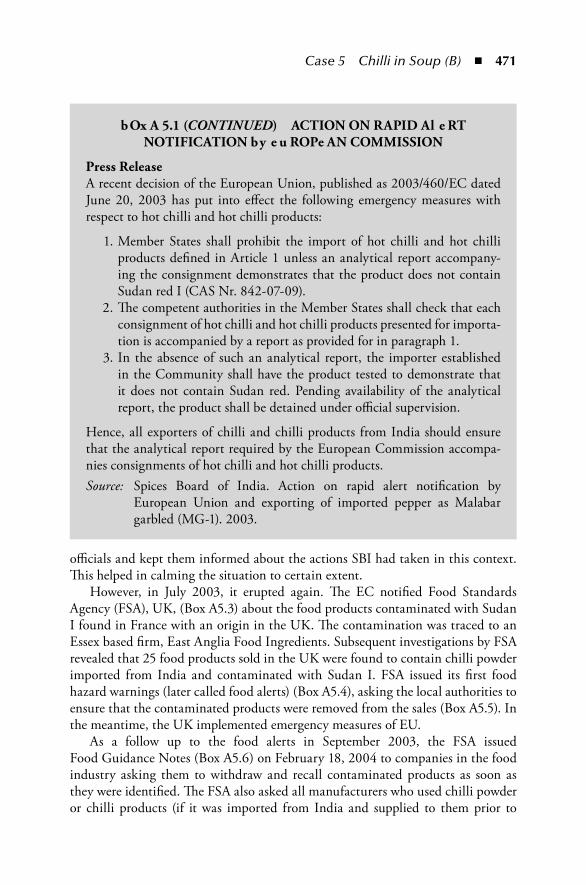
Case 5 Chilli in Soup (B) ◾ 471
officials and kept them informed about the actions SBI had taken in this context. This helped in calming the situation to certain extent.
However, in July 2003, it erupted again. The EC notified Food Standards Agency (FSA), UK, (Box A5.3) about the food products contaminated with Sudan I found in France with an origin in the UK. The contamination was traced to an Essex based firm, East Anglia Food Ingredients. Subsequent investigations by FSA revealed that 25 food products sold in the UK were found to contain chilli powder imported from India and contaminated with Sudan I. FSA issued its first food hazard warnings (later called food alerts) (Box A5.4), asking the local authorities to ensure that the contaminated products were removed from the sales (Box A5.5). In the meantime, the UK implemented emergency measures of EU.
As a follow up to the food alerts in September 2003, the FSA issued Food Guidance Notes (Box A5.6) on February 18, 2004 to companies in the food industry asking them to withdraw and recall contaminated products as soon as they were identified. The FSA also asked all manufacturers who used chilli powder or chilli products (if it was imported from India and supplied to them prior to
bOx A 5.1 (CoNtiNUed) ACTION ON RAPID Al e RT NOTIFICATION by e u ROPe AN COMMISSION
Press ReleaseA recent decision of the European Union, published as 2003/460/EC dated June 20, 2003 has put into effect the following emergency measures with respect to hot chilli and hot chilli products:
1. Member States shall prohibit the import of hot chilli and hot chilli products defined in Article 1 unless an analytical report accompany-ing the consignment demonstrates that the product does not contain Sudan red I (CAS Nr. 842-07-09).
2. The competent authorities in the Member States shall check that each consignment of hot chilli and hot chilli products presented for importa-tion is accompanied by a report as provided for in paragraph 1.
3. In the absence of such an analytical report, the importer established in the Community shall have the product tested to demonstrate that it does not contain Sudan red. Pending availability of the analytical report, the product shall be detained under official supervision.
Hence, all exporters of chilli and chilli products from India should ensure that the analytical report required by the European Commission accompa-nies consignments of hot chilli and hot chilli products.Source: Spices Board of India. Action on rapid alert notification by
European Union and exporting of imported pepper as Malabar garbled (MG-1). 2003.
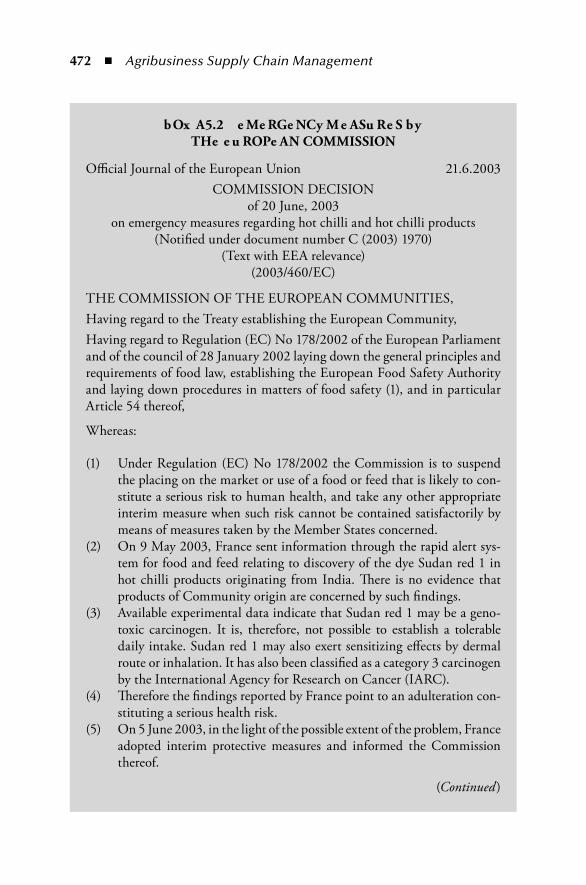
472 ◾ Agribusiness Supply Chain Management
bOx A5.2 e Me RGe NCy M e ASu Re S by THe e u ROPe AN COMMISSION
Official Journal of the European Union 21.6.2003COMMISSION DECISION
of 20 June, 2003on emergency measures regarding hot chilli and hot chilli products
(Notified under document number C (2003) 1970)(Text with EEA relevance)
(2003/460/EC)
THE COMMISSION OF THE EUROPEAN COMMUNITIES,Having regard to the Treaty establishing the European Community,Having regard to Regulation (EC) No 178/2002 of the European Parliament and of the council of 28 January 2002 laying down the general principles and require ments of food law, establishing the European Food Safety Authority and laying down procedures in matters of food safety (1), and in particular Article 54 thereof,
Whereas:
(1) Under Regulation (EC) No 178/2002 the Commission is to suspend the placing on the market or use of a food or feed that is likely to con-stitute a serious risk to human health, and take any other appropriate interim measure when such risk cannot be contained satisfactorily by means of measures taken by the Member States concerned.
(2) On 9 May 2003, France sent information through the rapid alert sys-tem for food and feed relating to discovery of the dye Sudan red 1 in hot chilli products originating from India. There is no evidence that products of Community origin are concerned by such findings.
(3) Available experimental data indicate that Sudan red 1 may be a geno-toxic carcinogen. It is, therefore, not possible to establish a tolerable daily intake. Sudan red 1 may also exert sensitizing effects by dermal route or inhalation. It has also been classified as a category 3 carcinogen by the International Agency for Research on Cancer (IARC).
(4) Therefore the findings reported by France point to an adulteration con-stituting a serious health risk.
(5) On 5 June 2003, in the light of the possible extent of the problem, France adopted interim protective measures and informed the Commission thereof.
(Continued)
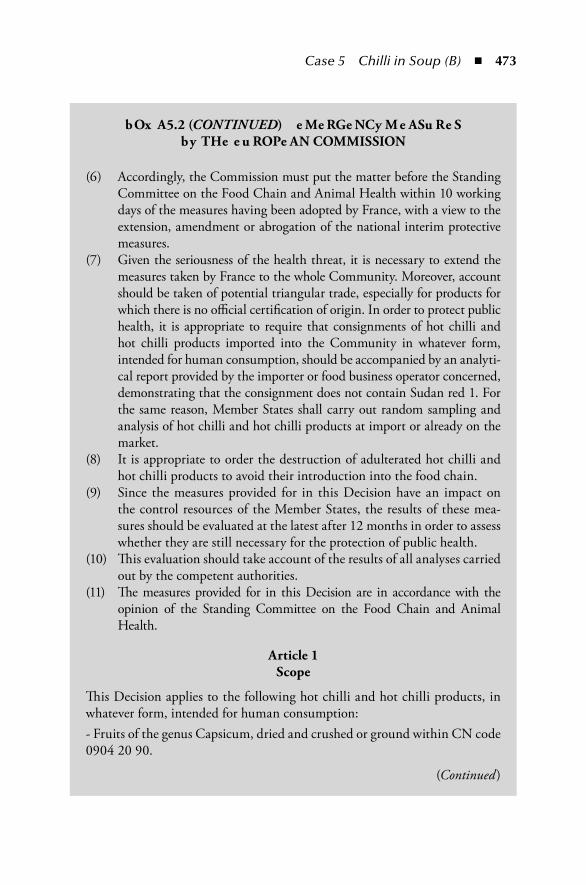
Case 5 Chilli in Soup (B) ◾ 473
bOx A5.2 (CoNtiNUed) e Me RGe NCy M e ASu Re S by THe e u ROPe AN COMMISSION
(6) Accordingly, the Commission must put the matter before the Standing Committee on the Food Chain and Animal Health within 10 working days of the measures having been adopted by France, with a view to the extension, amendment or abrogation of the national interim protective measures.
(7) Given the seriousness of the health threat, it is necessary to extend the measures taken by France to the whole Community. Moreover, account should be taken of potential triangular trade, especially for products for which there is no official certification of origin. In order to protect public health, it is appropriate to require that consignments of hot chilli and hot chilli products imported into the Community in whatever form, intended for human consumption, should be accompanied by an analyti-cal report provided by the importer or food business operator concerned, demonstrating that the consignment does not contain Sudan red 1. For the same reason, Member States shall carry out random sampling and analysis of hot chilli and hot chilli products at import or already on the market.
(8) It is appropriate to order the destruction of adulterated hot chilli and hot chilli products to avoid their introduction into the food chain.
(9) Since the measures provided for in this Decision have an impact on the control resources of the Member States, the results of these mea-sures should be evaluated at the latest after 12 months in order to assess whether they are still necessary for the protection of public health.
(10) This evaluation should take account of the results of all analyses carried out by the competent authorities.
(11) The measures provided for in this Decision are in accordance with the opinion of the Standing Committee on the Food Chain and Animal Health.
Article 1Scope
This Decision applies to the following hot chilli and hot chilli products, in whatever form, intended for human consumption:- Fruits of the genus Capsicum, dried and crushed or ground within CN code 0904 20 90.
(Continued)
474 ◾ Agribusiness Supply Chain Management
bOx A5.2 (CoNtiNUed) e Me RGe NCy M e ASu Re S by THe e u ROPe AN COMMISSION
Article 2Conditions for import of hot chilli and hot chilli products
1. Member States shall prohibit the import of hot chilli and hot chilli products defined in Article 1 unless an analytical report accompany-ing the consignment demonstrates that the product does not contain Sudan red 1 (CAS Nr 842-07-09).
2. The competent authorities in the Member States shall check that each consignment of hot chilli and hot chilli products presented for importa-tion is accompanied by a report as provided for in paragraph 1.
3. In the absence of such an analytical report, the importer established in the Community shall have the product tested to demonstrate that it does not contain Sudan red 1. Pending availability of the analytical report, the product shall be detained under official supervision.
Article 3Sampling and analysis
1. Member States shall take appropriate measures, including random sam-pling and analysis of hot chilli and hot chilli products presented for impor-tation or already on the market in order to verify the absence of Sudan red 1. They shall inform the Commission of positive (unfavourable) results through the rapid alert system for food and feed. Negative (favourable) results shall be reported to the Commission on a three-monthly basis. This report shall be submitted during the month following each quarter.1
2. Any consignment subjected to official sampling and analysis may be detained before release into the market for a maximum period of 15 working days.
Article 4Splitting of a consignment
If a consignment is split, a certified copy of the analytical report provided for in Article 2(1) shall accompany each part of the split consignment.
Article 5Adulterated consignments
Products referred to in Article 1 that are found to contain Sudan red 1 shall be destroyed.
(Continued)
Case 5 Chilli in Soup (B) ◾ 475
July 30, 2003) to ensure that it had not been contaminated with Sudan I. The guid-ance added: “These companies should consider sampling relevant batches in order to ensure that their products are not contaminated. The FSA would like to be noti-fied of all results, whether they are positive or negative, in order to obtain as much information as possible about the distribution of the contaminated chilli products.”
Since May 2003, the SBI had been receiving a number of RASFF notifications relating to the presence of Sudan I in consignments of chilli powder exported from India. Most of the RASFF notifications reported involvement of the two firms viz, Gautam Export Corporation and Volga Spices & Masala Mills Private Limited. This sudden turn of events in July 2003, worried Jose. The FSA had been regu-larly issuing food alerts as soon as new contaminated products were identified. The number was increasing every month. In view of the new developments, Jose was seriously contemplating the introduction of a number of regulatory mechanisms, to ensure that the quality of Indian chilli exports satisfied the food safety require-ments of the importing countries. For this, he had been in constant touch with
bOx A5.2 (CoNtiNUed) e Me RGe NCy M e ASu Re S by THe e u ROPe AN COMMISSION
Article 6Recovery of costs
In relation to Article 2(1), (3) and Article 5, costs resulting from analysis, stor-age and eventual destruction shall be borne by the importers or food business operators concerned.
Article 7Review of the measures
This Decision shall be reviewed by 20 June 2004 at the latest.
Article 8Addressees
This Decision is addressed to the Member States.Done at Brussels, 20 June 2003
For the CommissionDavid Byrne
Member of the Commission
Source: European Commission. Commission decision of 20 June 2003 on emergency measures regarding hot chilli and hot chilli products, Official Journal of the European Union. Accessed Nov. 12, 2005, from http://eurlex.europa.eu/LexUriServ/LexUriServ.do?uri=OJ:L:2003:154:0114:0115:EN:PDF
1 April, July, October, January.
476 ◾ Agribusiness Supply Chain Management
bOx A 5.3 FOOD STANDARDS AGe NCy
The Food Standards Agency (FSA) is an independent UK Government department set up by an Act of Parliament in 2000 to protect the public’s health and consumer interests in relation to food. Although the FSA is a Government agency, it works at ‘arm’s length’ from government because it does not report to a specific minister and is free to publish any advice it issues.FSA is led by a board appointed to act in public interest and not to repre-sent particular sectors. Board members have a wide range of relevant skills and experience. FSA is headquartered in London and has national offices in Scotland, Wales and Northern Ireland. It is accountable to Parliament through Health Ministers, and to the devolved administrations in Scotland, Wales and Northern Ireland for its activities within their areas.How FSA works
◾ It provides advice and information to the public and the Government on food safety from farm to fork, nutrition and diet. It also protects consumers through effective food enforcement and monitoring.
◾ It supports consumer choice by promoting accurate and meaningful labeling.
◾ It works with many different people and organizations, including con-sumers, consumer organizations, manufacturers, retailers, farmers, local authority enforcement teams and the catering industry. It also works with other Government departments and agencies.
k ey aims of FSA’s strategic plan during 2001–2006 ◾ Reduce food borne illness by 20% by improving food safety through
the food chain ◾ Help people to eat more healthily ◾ Promote honest and informative labeling to help consumers ◾ Promote best practices within the food industry ◾ Improve the enforcement of food law ◾ Earn people’s trust by what it does and how it does it
k ey aims of FSA’s strategic plan during 2005–2010 ◾ Continue to reduce food borne illness ◾ Reduce further the risks to consumers from chemical contamination
including radiological contamination of food ◾ Make it easier for all consumers to choose a healthy diet, and thereby
improve quality of life by reducing diet-related disease ◾ Enable consumers to make informed choices
Source: Food Standards Agency. About us. 2005. Accessed Nov. 12, 2005 from http://www.food.gov.uk/aboutus.
Case 5 Chilli in Soup (B) ◾ 477
bOx A 5.4 FOOD Al e RTS
Food Alerts are the FSA’s way of letting local authorities and consumers know about the problems associated with food and, in some cases, provide details of specific action to be taken.These are often issued in conjunction with a product withdrawal or recall by a manufacturer, retailer or distributor.Food Alerts were previously known as Food Hazard Warnings and were issued under four categories (A, B, C, and D), but the new system took effect from October 25, 2004.Now they are issued under two categories:
1. Food Alerts for Action (replacing A, B and C) 2. Food Alerts for Information (replacing Category D)
A Food Alert issued by the FSA
Chilli powder imported from India containing Sudan I dye used in Rajah brand seasoning mixes(July 31, 2003)
Category C: Action as deemed necessaryHeads of Environmental Health Services and Directors of Trading Standards will wish to be aware that contaminated chilli powder containing an illegal dye Sudan I, has been imported into the UK from India and used in products produced for BE International Foods, a division of HP Foods Limited.Sudan I is not a permitted colour under the Colours in Food regulations 1995. It is considered to be a genotoxic carcinogen and its presence, at any level, is not permitted in foodstuffs for any purpose.The Rajah brand products listed below have been identified as containing Sudan I. The company has undertaken a full trade withdrawal of the products with any Best before End dates until July 18, 2005, from all their customers.Any product with a Best Before End date of July 18, 2005, or after this date, is confirmed to be made with chilli powder that is clear of Sudan I.HP Foods Limited has set up a helpline to address customer enquiries. The Rajah Consumer Services team can be contacted on 0800 0721 122 and the company will arrange collection and reimbursement of the consumer’s costs.Only the products mentioned below are affected; no other Rajah products are affected.
(Continued)
478 ◾ Agribusiness Supply Chain Management
bOx A 5.4 (CoNtiNUed) FOOD Al e RTS
The details of the products are as follows:
◾ Rajah Tandoori Masala ◾ Rajah Natural Tandoori Masala ◾ Rajah Jerk seasoning ◾ Rajah Chilli & Lemon seasoning ◾ Rajah Oriental Noodle seasoning ◾ Rajah Chicken seasoning
These products are retailed in 100 g and 400 g packets. These sizes and larger sizes (1 kg and 8 kg) are also sold through wholesalers.
Action to be taken by local authorities were deemed necessary
The products detailed above present a health risk if consumed in sufficient quantity, and do not comply with the food safety requirements specified in the Food Safety Act 1990 due to contamination with Sudan I. In addition, Sudan I is not a permitted colour under the Colours in Food Regulations 1995.Local authorities should take action if these products are found within their area. Enforcement officers should ensure that they are withdrawn from sale and destroyed, if necessary, using powers under the Food Safety Act 1990.It is essential that all Local Authorities liaise at county level to ensure that enforcement authorities agree who will take the lead in dealing with this incident.Given the nature of the problem, and that this type of product is likely to remain for long periods in consumers’ homes between purchase and con-sumption, further local publicity may assist in preventing consumers eating any affected product they may have.Local authorities are, therefore, asked to consider providing local publicity at the next available opportunity to this issue.For that purpose, local authorities may wish to use the Food Standards Agency’s press release as a guide as to what to say in any local news release.
Source: National Archives (UK). Chilli powder imported from India containing Sudan I dye used in chutney and relish produced by Shaw’s (Huddersfield) Ltd. July 31, 2003. http://tna.europar-chive.org/20110116113217/http://www.food.gov.uk/enforcement/alerts/2003/jul/sudanichi
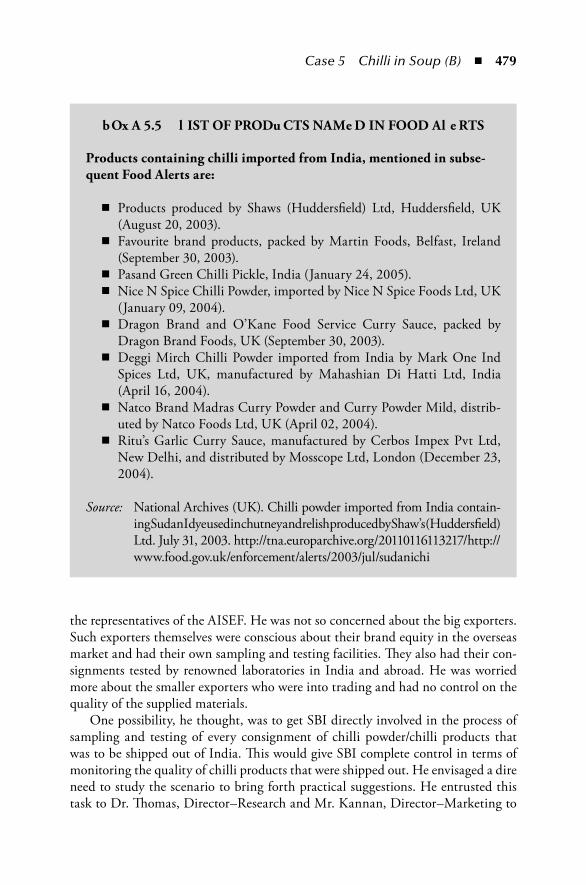
Case 5 Chilli in Soup (B) ◾ 479
the representatives of the AISEF. He was not so concerned about the big exporters. Such exporters themselves were conscious about their brand equity in the overseas market and had their own sampling and testing facilities. They also had their con-signments tested by renowned laboratories in India and abroad. He was worried more about the smaller exporters who were into trading and had no control on the quality of the supplied materials.
One possibility, he thought, was to get SBI directly involved in the process of sampling and testing of every consignment of chilli powder/chilli products that was to be shipped out of India. This would give SBI complete control in terms of monitoring the quality of chilli products that were shipped out. He envisaged a dire need to study the scenario to bring forth practical suggestions. He entrusted this task to Dr. Thomas, Director–Research and Mr. Kannan, Director–Marketing to
bOx A 5.5 l IST OF PRODu CTS NAMe D IN FOOD Al e RTS
Products containing chilli imported from India, mentioned in subse-quent Food Alerts are:
◾ Products produced by Shaws (Huddersfield) Ltd, Huddersfield, UK (August 20, 2003).
◾ Favourite brand products, packed by Martin Foods, Belfast, Ireland (September 30, 2003).
◾ Pasand Green Chilli Pickle, India (January 24, 2005). ◾ Nice N Spice Chilli Powder, imported by Nice N Spice Foods Ltd, UK
(January 09, 2004). ◾ Dragon Brand and O’Kane Food Service Curry Sauce, packed by
Dragon Brand Foods, UK (September 30, 2003). ◾ Deggi Mirch Chilli Powder imported from India by Mark One Ind
Spices Ltd, UK, manufactured by Mahashian Di Hatti Ltd, India (April 16, 2004).
◾ Natco Brand Madras Curry Powder and Curry Powder Mild, distrib-uted by Natco Foods Ltd, UK (April 02, 2004).
◾ Ritu’s Garlic Curry Sauce, manufactured by Cerbos Impex Pvt Ltd, New Delhi, and distributed by Mosscope Ltd, London (December 23, 2004).
Source: National Archives (UK). Chilli powder imported from India contain-ing Sudan I dye used in chutney and relish produced by Shaw’s (Huddersfield) Ltd. July 31, 2003. http://tna.europarchive.org/20110116113217/http://www.food.gov.uk/enforcement/alerts/2003/jul/sudanichi
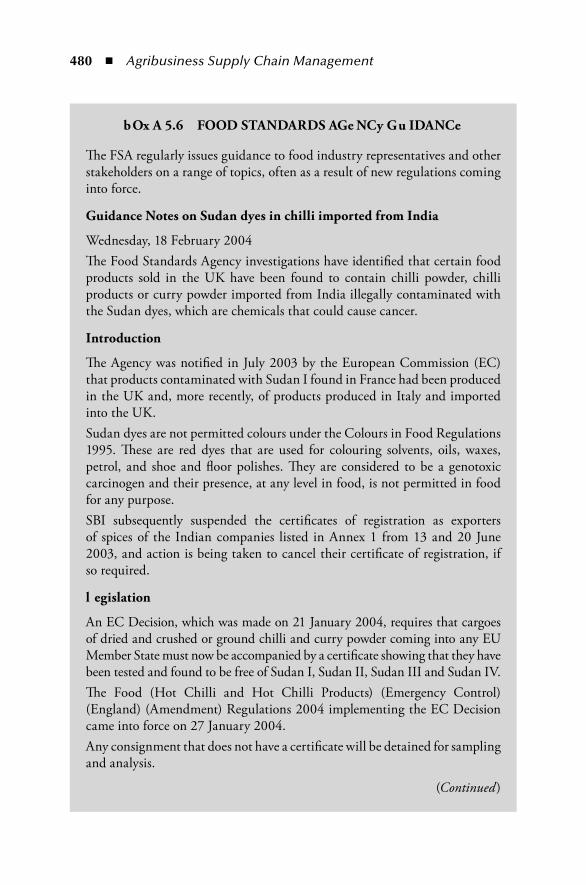
480 ◾ Agribusiness Supply Chain Management
bOx A 5.6 FOOD STANDARDS AGe NCy Gu IDANCe
The FSA regularly issues guidance to food industry representatives and other stakeholders on a range of topics, often as a result of new regulations coming into force.
Guidance Notes on Sudan dyes in chilli imported from India
Wednesday, 18 February 2004The Food Standards Agency investigations have identified that certain food products sold in the UK have been found to contain chilli powder, chilli products or curry powder imported from India illegally contaminated with the Sudan dyes, which are chemicals that could cause cancer.
Introduction
The Agency was notified in July 2003 by the European Commission (EC) that products contaminated with Sudan I found in France had been produced in the UK and, more recently, of products produced in Italy and imported into the UK.Sudan dyes are not permitted colours under the Colours in Food Regulations 1995. These are red dyes that are used for colouring solvents, oils, waxes, petrol, and shoe and floor polishes. They are considered to be a genotoxic carcinogen and their presence, at any level in food, is not permitted in food for any purpose.SBI subsequently suspended the certificates of registration as exporters of spices of the Indian companies listed in Annex 1 from 13 and 20 June 2003, and action is being taken to cancel their certificate of registration, if so required.
l egislation
An EC Decision, which was made on 21 January 2004, requires that cargoes of dried and crushed or ground chilli and curry powder coming into any EU Member State must now be accompanied by a certificate showing that they have been tested and found to be free of Sudan I, Sudan II, Sudan III and Sudan IV.The Food (Hot Chilli and Hot Chilli Products) (Emergency Control) (England) (Amendment) Regulations 2004 implementing the EC Decision came into force on 27 January 2004.Any consignment that does not have a certificate will be detained for sampling and analysis.
(Continued)
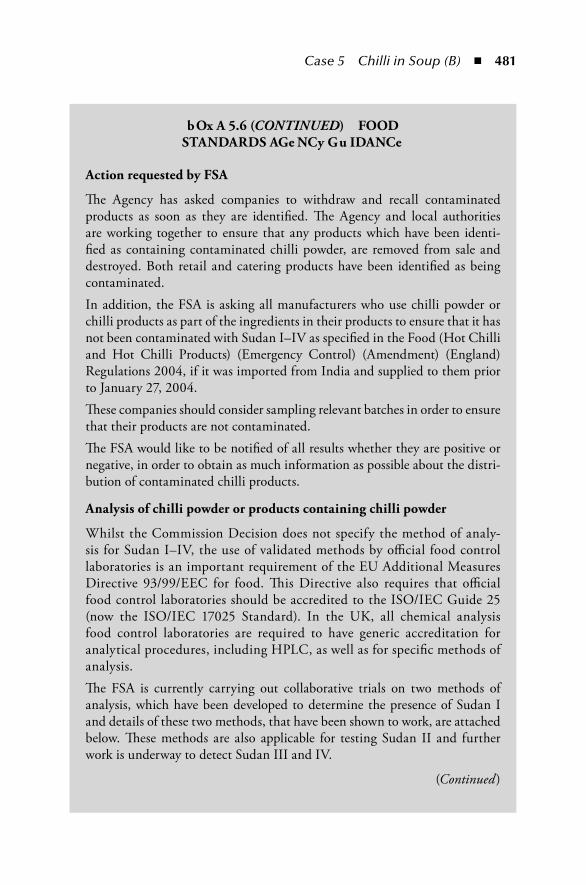
Case 5 Chilli in Soup (B) ◾ 481
bOx A 5.6 (CoNtiNUed) FOOD STANDARDS AGe NCy Gu IDANCe
Action requested by FSA
The Agency has asked companies to withdraw and recall contaminated products as soon as they are identified. The Agency and local authorities are working together to ensure that any products which have been identi-fied as containing contaminated chilli powder, are removed from sale and destroyed. Both retail and catering products have been identified as being contaminated.In addition, the FSA is asking all manufacturers who use chilli powder or chilli products as part of the ingredients in their products to ensure that it has not been contaminated with Sudan I–IV as specified in the Food (Hot Chilli and Hot Chilli Products) (Emergency Control) (Amendment) (England) Regulations 2004, if it was imported from India and supplied to them prior to January 27, 2004.These companies should consider sampling relevant batches in order to ensure that their products are not contaminated.The FSA would like to be notified of all results whether they are positive or negative, in order to obtain as much information as possible about the distri-bution of contaminated chilli products.
Analysis of chilli powder or products containing chilli powder
Whilst the Commission Decision does not specify the method of analy-sis for Sudan I–IV, the use of validated methods by official food control laboratories is an important requirement of the EU Additional Measures Directive 93/99/EEC for food. This Directive also requires that official food control laboratories should be accredited to the ISO/IEC Guide 25 (now the ISO/IEC 17025 Standard). In the UK, all chemical analysis food control laboratories are required to have generic accreditation for analytical procedures, including HPLC, as well as for specific methods of analysis.The FSA is currently carrying out collaborative trials on two methods of analysis, which have been developed to determine the presence of Sudan I and details of these two methods, that have been shown to work, are attached below. These methods are also applicable for testing Sudan II and further work is underway to detect Sudan III and IV.
(Continued)
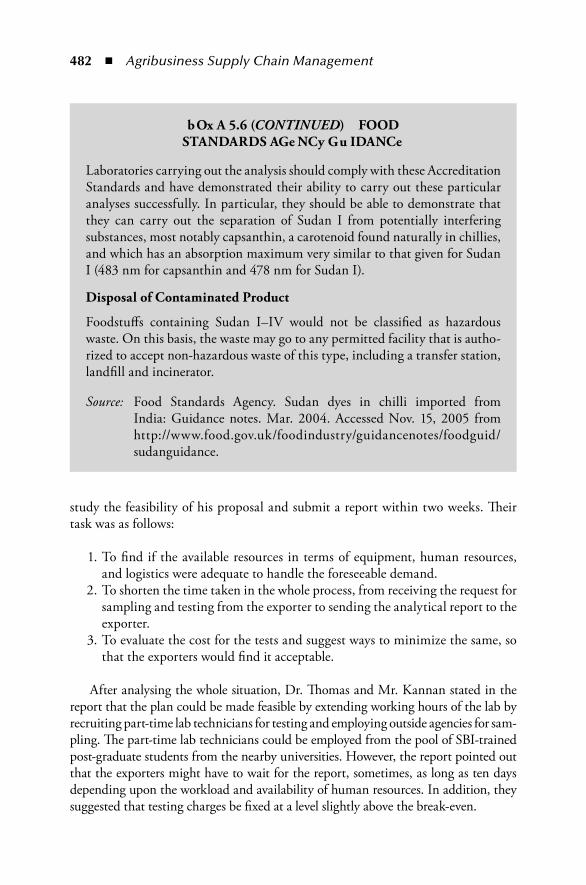
482 ◾ Agribusiness Supply Chain Management
study the feasibility of his proposal and submit a report within two weeks. Their task was as follows:
1. To find if the available resources in terms of equipment, human resources, and logistics were adequate to handle the foreseeable demand.
2. To shorten the time taken in the whole process, from receiving the request for sampling and testing from the exporter to sending the analytical report to the exporter.
3. To evaluate the cost for the tests and suggest ways to minimize the same, so that the exporters would find it acceptable.
After analysing the whole situation, Dr. Thomas and Mr. Kannan stated in the report that the plan could be made feasible by extending working hours of the lab by recruiting part-time lab technicians for testing and employing outside agencies for sam-pling. The part-time lab technicians could be employed from the pool of SBI-trained post-graduate students from the nearby universities. However, the report pointed out that the exporters might have to wait for the report, sometimes, as long as ten days depending upon the workload and availability of human resources. In addition, they suggested that testing charges be fixed at a level slightly above the break-even.
bOx A 5.6 (CoNtiNUed) FOOD STANDARDS AGe NCy Gu IDANCe
Laboratories carrying out the analysis should comply with these Accreditation Standards and have demonstrated their ability to carry out these particular analyses successfully. In particular, they should be able to demonstrate that they can carry out the separation of Sudan I from potentially interfering substances, most notably capsanthin, a carotenoid found naturally in chillies, and which has an absorption maximum very similar to that given for Sudan I (483 nm for capsanthin and 478 nm for Sudan I).
Disposal of Contaminated Product
Foodstuffs containing Sudan I–IV would not be classified as hazardous waste. On this basis, the waste may go to any permitted facility that is autho-rized to accept non-hazardous waste of this type, including a transfer station, landfill and incinerator.
Source: Food Standards Agency. Sudan dyes in chilli imported from India: Guidance notes. Mar. 2004. Accessed Nov. 15, 2005 from http://www.food.gov.uk/foodindustry/guidancenotes/foodguid/sudanguidance.
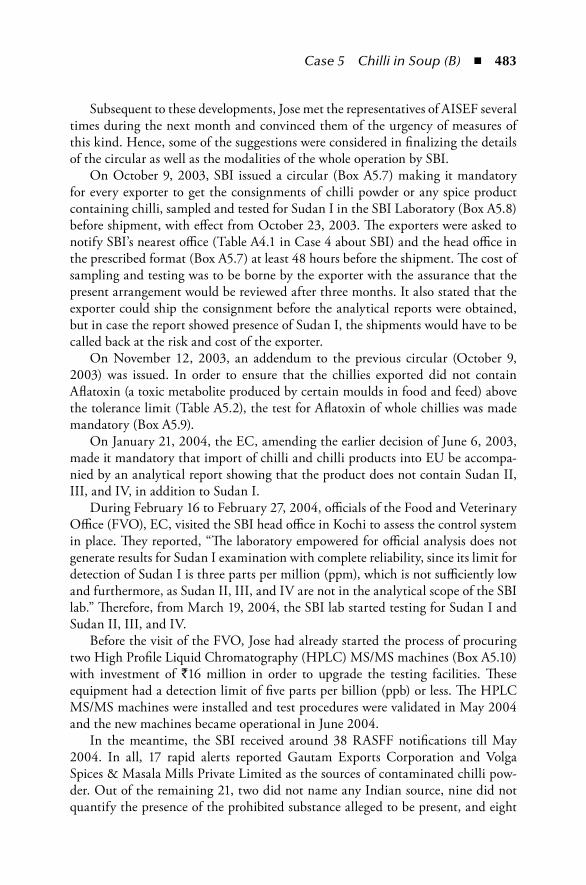
Case 5 Chilli in Soup (B) ◾ 483
Subsequent to these developments, Jose met the representatives of AISEF several times during the next month and convinced them of the urgency of measures of this kind. Hence, some of the suggestions were considered in finalizing the details of the circular as well as the modalities of the whole operation by SBI.
On October 9, 2003, SBI issued a circular (Box A5.7) making it mandatory for every exporter to get the consignments of chilli powder or any spice product containing chilli, sampled and tested for Sudan I in the SBI Laboratory (Box A5.8) before shipment, with effect from October 23, 2003. The exporters were asked to notify SBI’s nearest office (Table A4.1 in Case 4 about SBI) and the head office in the prescribed format (Box A5.7) at least 48 hours before the shipment. The cost of sampling and testing was to be borne by the exporter with the assurance that the present arrangement would be reviewed after three months. It also stated that the exporter could ship the consignment before the analytical reports were obtained, but in case the report showed presence of Sudan I, the shipments would have to be called back at the risk and cost of the exporter.
On November 12, 2003, an addendum to the previous circular (October 9, 2003) was issued. In order to ensure that the chillies exported did not contain Aflatoxin (a toxic metabolite produced by certain moulds in food and feed) above the tolerance limit (Table A5.2), the test for Aflatoxin of whole chillies was made mandatory (Box A5.9).
On January 21, 2004, the EC, amending the earlier decision of June 6, 2003, made it mandatory that import of chilli and chilli products into EU be accompa-nied by an analytical report showing that the product does not contain Sudan II, III, and IV, in addition to Sudan I.
During February 16 to February 27, 2004, officials of the Food and Veterinary Office (FVO), EC, visited the SBI head office in Kochi to assess the control system in place. They reported, “The laboratory empowered for official analysis does not generate results for Sudan I examination with complete reliability, since its limit for detection of Sudan I is three parts per million (ppm), which is not sufficiently low and furthermore, as Sudan II, III, and IV are not in the analytical scope of the SBI lab.” Therefore, from March 19, 2004, the SBI lab started testing for Sudan I and Sudan II, III, and IV.
Before the visit of the FVO, Jose had already started the process of procuring two High Profile Liquid Chromatography (HPLC) MS/MS machines (Box A5.10) with investment of `16 million in order to upgrade the testing facilities. These equipment had a detection limit of five parts per billion (ppb) or less. The HPLC MS/MS machines were installed and test procedures were validated in May 2004 and the new machines became operational in June 2004.
In the meantime, the SBI received around 38 RASFF notifications till May 2004. In all, 17 rapid alerts reported Gautam Exports Corporation and Volga Spices & Masala Mills Private Limited as the sources of contaminated chilli pow-der. Out of the remaining 21, two did not name any Indian source, nine did not quantify the presence of the prohibited substance alleged to be present, and eight
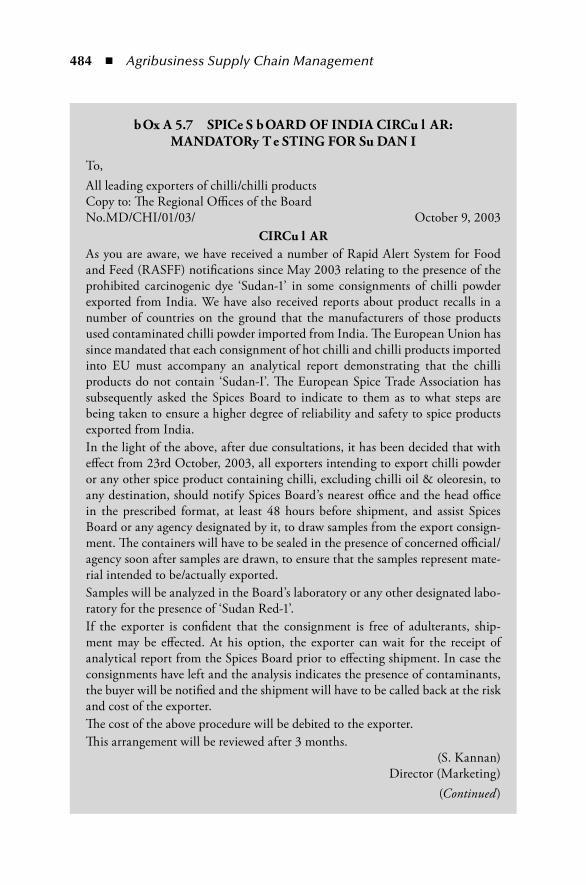
484 ◾ Agribusiness Supply Chain Management
bOx A 5.7 SPICe S bOARD OF INDIA CIRCu l AR: MANDATORy T e STING FOR Su DAN I
To,All leading exporters of chilli/chilli products Copy to: The Regional Offices of the BoardNo.MD/CHI/01/03/ October 9, 2003
CIRCu l ARAs you are aware, we have received a number of Rapid Alert System for Food and Feed (RASFF) notifications since May 2003 relating to the presence of the prohibited carcinogenic dye ‘Sudan-1’ in some consignments of chilli powder exported from India. We have also received reports about product recalls in a number of countries on the ground that the manufacturers of those products used contaminated chilli powder imported from India. The European Union has since mandated that each consignment of hot chilli and chilli products imported into EU must accompany an analytical report demonstrating that the chilli products do not contain ‘Sudan-I’. The European Spice Trade Association has subsequently asked the Spices Board to indicate to them as to what steps are being taken to ensure a higher degree of reliability and safety to spice products exported from India.In the light of the above, after due consultations, it has been decided that with effect from 23rd October, 2003, all exporters intending to export chilli powder or any other spice product containing chilli, excluding chilli oil & oleoresin, to any destination, should notify Spices Board’s nearest office and the head office in the prescribed format, at least 48 hours before shipment, and assist Spices Board or any agency designated by it, to draw samples from the export consign-ment. The containers will have to be sealed in the presence of concerned official/agency soon after samples are drawn, to ensure that the samples represent mate-rial intended to be/actually exported.Samples will be analyzed in the Board’s laboratory or any other designated labo-ratory for the presence of ‘Sudan Red-1’.If the exporter is confident that the consignment is free of adulterants, ship-ment may be effected. At his option, the exporter can wait for the receipt of analytical report from the Spices Board prior to effecting shipment. In case the consignments have left and the analysis indicates the presence of contaminants, the buyer will be notified and the shipment will have to be called back at the risk and cost of the exporter.The cost of the above procedure will be debited to the exporter.This arrangement will be reviewed after 3 months.
(S. Kannan)Director (Marketing)
(Continued)
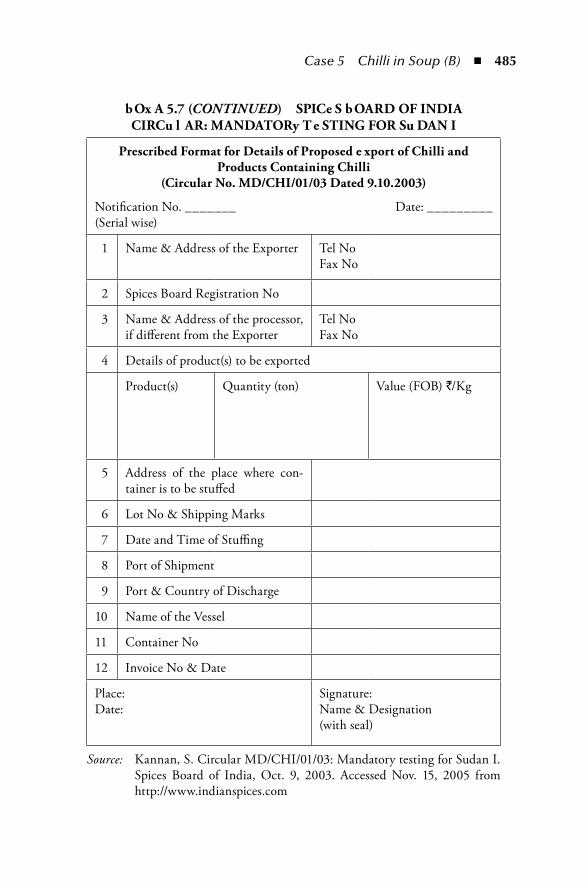
Case 5 Chilli in Soup (B) ◾ 485
bOx A 5.7 (CoNtiNUed) SPICe S bOARD OF INDIA CIRCu l AR: MANDATORy T e STING FOR Su DAN I
Prescribed Format for Details of Proposed e xport of Chilli and Products Containing Chilli
(Circular No. MD/CHI/01/03 Dated 9.10.2003)
Notification No. _______ Date: _________(Serial wise)
1 Name & Address of the Exporter Tel NoFax No
2 Spices Board Registration No
3 Name & Address of the processor, if different from the Exporter
Tel NoFax No
4 Details of product(s) to be exported
Product(s) Quantity (ton) Value (FOB) /̀Kg
5 Address of the place where con-tainer is to be stuffed
6 Lot No & Shipping Marks
7 Date and Time of Stuffing
8 Port of Shipment
9 Port & Country of Discharge
10 Name of the Vessel
11 Container No
12 Invoice No & Date
Place:Date:
Signature:Name & Designation(with seal)
Source: Kannan, S. Circular MD/CHI/01/03: Mandatory testing for Sudan I. Spices Board of India, Oct. 9, 2003. Accessed Nov. 15, 2005 from http://www.indianspices.com
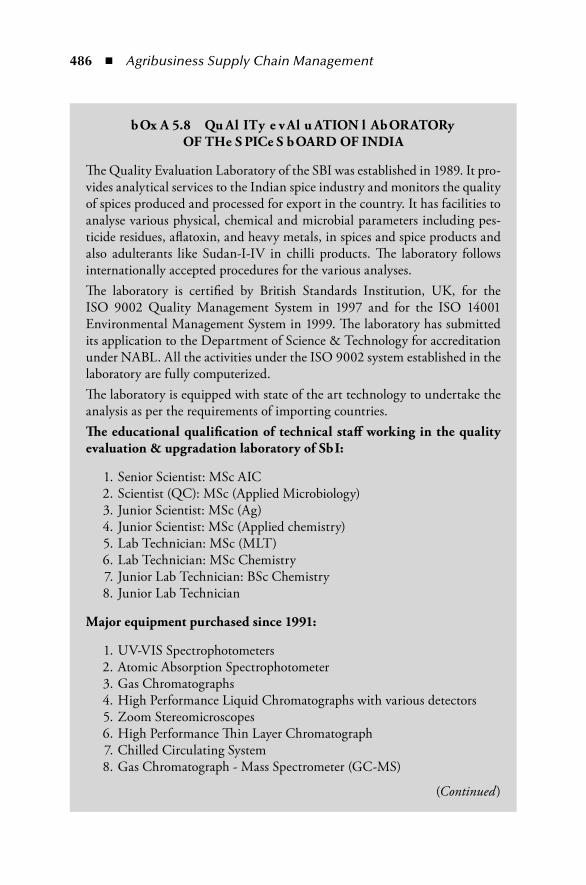
486 ◾ Agribusiness Supply Chain Management
bOx A 5.8 Qu Al ITy e v Al u ATION l AbORATORy OF THe S PICe S bOARD OF INDIA
The Quality Evaluation Laboratory of the SBI was established in 1989. It pro-vides analytical services to the Indian spice industry and monitors the quality of spices produced and processed for export in the country. It has facilities to analyse various physical, chemical and microbial parameters including pes-ticide residues, aflatoxin, and heavy metals, in spices and spice products and also adulterants like Sudan-I-IV in chilli products. The laboratory follows internationally accepted procedures for the various analyses.The laboratory is certified by British Standards Institution, UK, for the ISO 9002 Quality Management System in 1997 and for the ISO 14001 Environmental Management System in 1999. The laboratory has submitted its application to the Department of Science & Technology for accreditation under NABL. All the activities under the ISO 9002 system established in the laboratory are fully computerized.The laboratory is equipped with state of the art technology to undertake the analysis as per the requirements of importing countries.The educational qualification of technical staff working in the quality evaluation & upgradation laboratory of SbI:
1. Senior Scientist: MSc AIC 2. Scientist (QC): MSc (Applied Microbiology) 3. Junior Scientist: MSc (Ag) 4. Junior Scientist: MSc (Applied chemistry) 5. Lab Technician: MSc (MLT) 6. Lab Technician: MSc Chemistry 7. Junior Lab Technician: BSc Chemistry 8. Junior Lab Technician
Major equipment purchased since 1991:
1. UV-VIS Spectrophotometers 2. Atomic Absorption Spectrophotometer 3. Gas Chromatographs 4. High Performance Liquid Chromatographs with various detectors 5. Zoom Stereomicroscopes 6. High Performance Thin Layer Chromatograph 7. Chilled Circulating System 8. Gas Chromatograph - Mass Spectrometer (GC-MS)
(Continued)
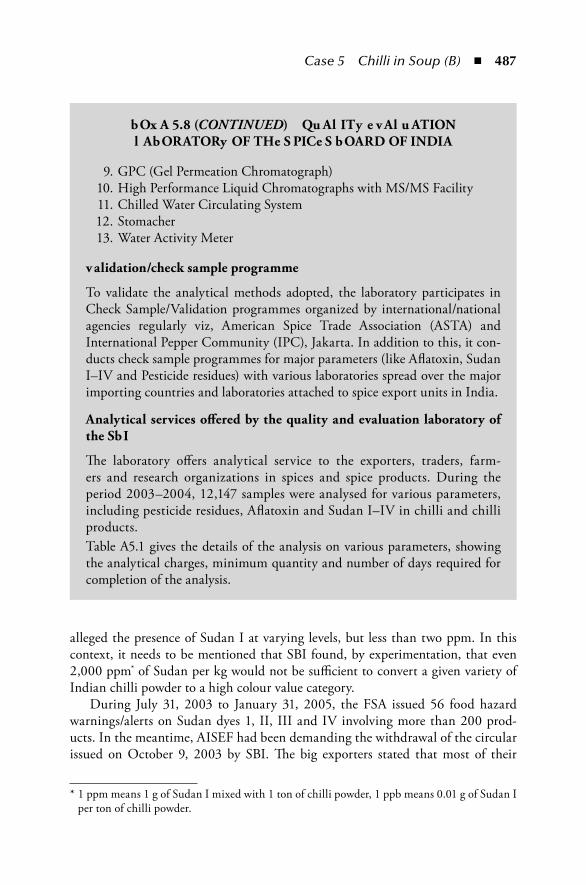
Case 5 Chilli in Soup (B) ◾ 487
alleged the presence of Sudan I at varying levels, but less than two ppm. In this context, it needs to be mentioned that SBI found, by experimentation, that even 2,000 ppm* of Sudan per kg would not be sufficient to convert a given variety of Indian chilli powder to a high colour value category.
During July 31, 2003 to January 31, 2005, the FSA issued 56 food hazard warnings/alerts on Sudan dyes 1, II, III and IV involving more than 200 prod-ucts. In the meantime, AISEF had been demanding the withdrawal of the circular issued on October 9, 2003 by SBI. The big exporters stated that most of their
* 1 ppm means 1 g of Sudan I mixed with 1 ton of chilli powder, 1 ppb means 0.01 g of Sudan I per ton of chilli powder.
bOx A 5.8 (CoNtiNUed) Qu Al ITy e v Al u ATION l AbORATORy OF THe S PICe S bOARD OF INDIA
9. GPC (Gel Permeation Chromatograph) 10. High Performance Liquid Chromatographs with MS/MS Facility 11. Chilled Water Circulating System 12. Stomacher 13. Water Activity Meter
v alidation/check sample programme
To validate the analytical methods adopted, the laboratory participates in Check Sample/Validation programmes organized by international/national agencies regularly viz, American Spice Trade Association (ASTA) and International Pepper Community (IPC), Jakarta. In addition to this, it con-ducts check sample programmes for major parameters (like Aflatoxin, Sudan I–IV and Pesticide residues) with various laboratories spread over the major importing countries and laboratories attached to spice export units in India.
Analytical services offered by the quality and evaluation laboratory of the SbI
The laboratory offers analytical service to the exporters, traders, farm-ers and research organizations in spices and spice products. During the period 2003–2004, 12,147 samples were analysed for various parameters, including pesticide residues, Aflatoxin and Sudan I–IV in chilli and chilli products.Table A5.1 gives the details of the analysis on various parameters, showing the analytical charges, minimum quantity and number of days required for completion of the analysis.
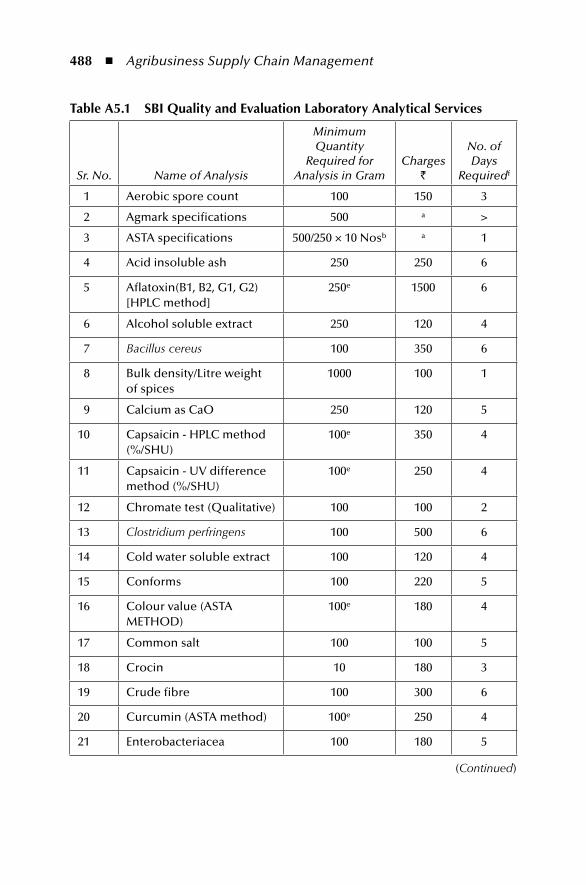
488 ◾ Agribusiness Supply Chain Management
table A5.1 SBi Quality and evaluation Laboratory Analytical Services
Sr. No. Name of Analysis
Minimum Quantity
Required for Analysis in Gram
Charges `
No. of Days
Requiredf
1 Aerobic spore count 100 150 3
2 Agmark specifications 500 a >
3 ASTA specifications 500/250 × 10 Nosb a 1
4 Acid insoluble ash 250 250 6
5 Aflatoxin(B1, B2, G1, G2) [HPLC method]
250e 1500 6
6 Alcohol soluble extract 250 120 4
7 Bacillus cereus 100 350 6
8 Bulk density/Litre weight of spices
1000 100 1
9 Calcium as CaO 250 120 5
10 Capsaicin - HPLC method (%/SHU)
100e 350 4
11 Capsaicin - UV difference method (%/SHU)
100e 250 4
12 Chromate test (Qualitative) 100 100 2
13 Clostridium perfringens 100 500 6
14 Cold water soluble extract 100 120 4
15 Conforms 100 220 5
16 Colour value (ASTA METHOD)
100e 180 4
17 Common salt 100 100 5
18 Crocin 10 180 3
19 Crude fibre 100 300 6
20 Curcumin (ASTA method) 100e 250 4
21 Enterobacteriacea 100 180 5
(Continued)
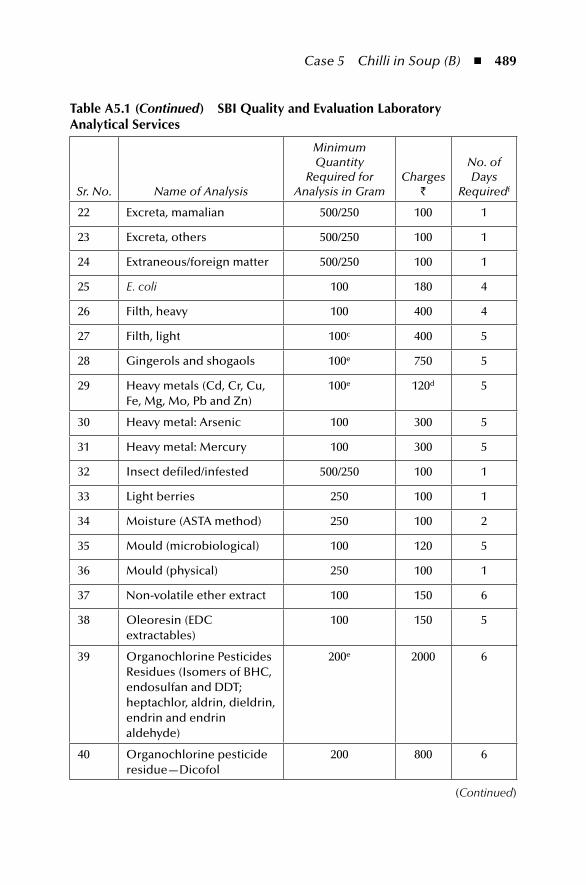
Case 5 Chilli in Soup (B) ◾ 489
table A5.1 (Continued) SBi Quality and evaluation Laboratory Analytical Services
Sr. No. Name of Analysis
Minimum Quantity
Required for Analysis in Gram
Charges `
No. of Days
Requiredf
22 Excreta, mamalian 500/250 100 1
23 Excreta, others 500/250 100 1
24 Extraneous/foreign matter 500/250 100 1
25 E. coli 100 180 4
26 Filth, heavy 100 400 4
27 Filth, light 100c 400 5
28 Gingerols and shogaols 100e 750 5
29 Heavy metals (Cd, Cr, Cu, Fe, Mg, Mo, Pb and Zn)
100e 120d 5
30 Heavy metal: Arsenic 100 300 5
31 Heavy metal: Mercury 100 300 5
32 Insect defiled/infested 500/250 100 1
33 Light berries 250 100 1
34 Moisture (ASTA method) 250 100 2
35 Mould (microbiological) 100 120 5
36 Mould (physical) 250 100 1
37 Non-volatile ether extract 100 150 6
38 Oleoresin (EDC extractables)
100 150 5
39 Organochlorine Pesticides Residues (Isomers of BHC, endosulfan and DDT; heptachlor, aldrin, dieldrin, endrin and endrin aldehyde)
200e 2000 6
40 Organochlorine pesticide residue—Dicofol
200 800 6
(Continued)
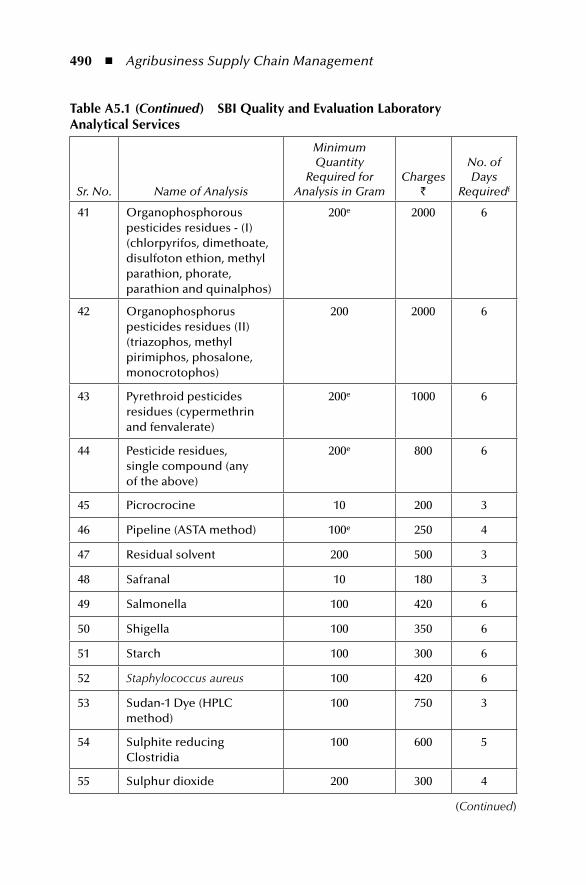
490 ◾ Agribusiness Supply Chain Management
table A5.1 (Continued) SBi Quality and evaluation Laboratory Analytical Services
Sr. No. Name of Analysis
Minimum Quantity
Required for Analysis in Gram
Charges `
No. of Days
Requiredf
41 Organophosphorous pesticides residues - (I) (chlorpyrifos, dimethoate, disulfoton ethion, methyl parathion, phorate, parathion and quinalphos)
200e 2000 6
42 Organophosphorus pesticides residues (II) (triazophos, methyl pirimiphos, phosalone, monocrotophos)
200 2000 6
43 Pyrethroid pesticides residues (cypermethrin and fenvalerate)
200e 1000 6
44 Pesticide residues, single compound (any of the above)
200e 800 6
45 Picrocrocine 10 200 3
46 Pipeline (ASTA method) 100e 250 4
47 Residual solvent 200 500 3
48 Safranal 10 180 3
49 Salmonella 100 420 6
50 Shigella 100 350 6
51 Starch 100 300 6
52 Staphylococcus aureus 100 420 6
53 Sudan-1 Dye (HPLC method)
100 750 3
54 Sulphite reducing Clostridia
100 600 5
55 Sulphur dioxide 200 300 4
(Continued)
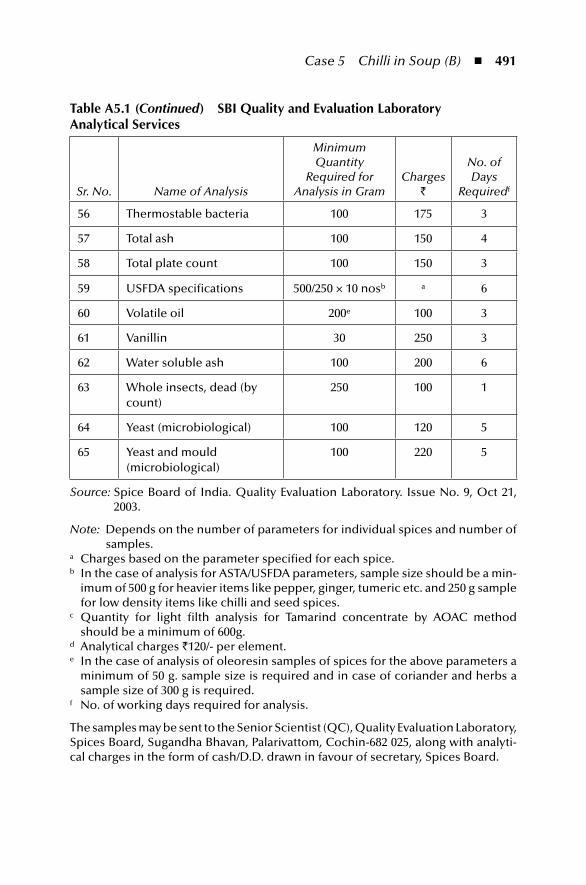
Case 5 Chilli in Soup (B) ◾ 491
table A5.1 (Continued) SBi Quality and evaluation Laboratory Analytical Services
Sr. No. Name of Analysis
Minimum Quantity
Required for Analysis in Gram
Charges `
No. of Days
Requiredf
56 Thermostable bacteria 100 175 3
57 Total ash 100 150 4
58 Total plate count 100 150 3
59 USFDA specifications 500/250 × 10 nosb a 6
60 Volatile oil 200e 100 3
61 Vanillin 30 250 3
62 Water soluble ash 100 200 6
63 Whole insects, dead (by count)
250 100 1
64 Yeast (microbiological) 100 120 5
65 Yeast and mould (microbiological)
100 220 5
Source: Spice Board of India. Quality Evaluation Laboratory. Issue No. 9, Oct 21, 2003.
Note: Depends on the number of parameters for individual spices and number of samples.
a Charges based on the parameter specified for each spice.b In the case of analysis for ASTA/USFDA parameters, sample size should be a min-
imum of 500 g for heavier items like pepper, ginger, tumeric etc. and 250 g sample for low density items like chilli and seed spices.
c Quantity for light filth analysis for Tamarind concentrate by AOAC method should be a minimum of 600g.
d Analytical charges `120/- per element.e In the case of analysis of oleoresin samples of spices for the above parameters a
minimum of 50 g. sample size is required and in case of coriander and herbs a sample size of 300 g is required.
f No. of working days required for analysis.
The samples may be sent to the Senior Scientist (QC), Quality Evaluation Laboratory, Spices Board, Sugandha Bhavan, Palarivattom, Cochin-682 025, along with analyti-cal charges in the form of cash/D.D. drawn in favour of secretary, Spices Board.
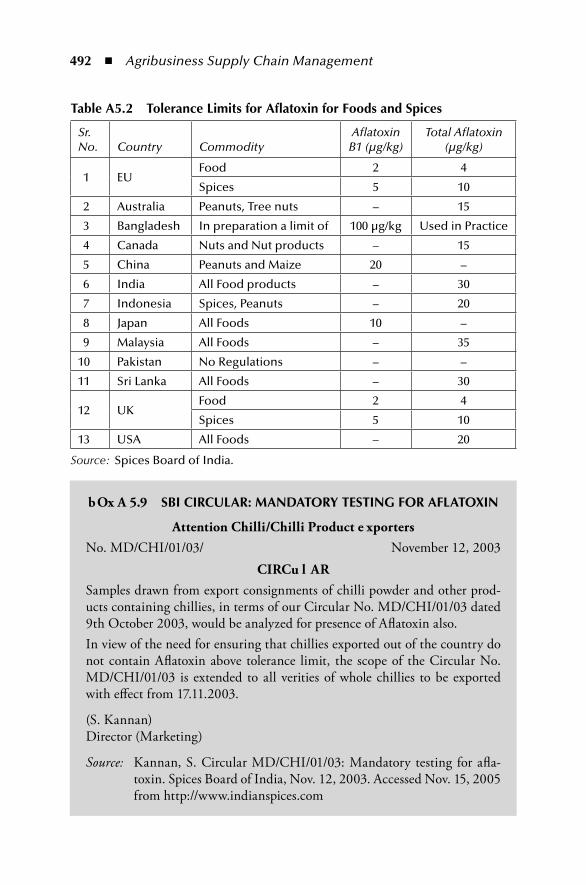
492 ◾ Agribusiness Supply Chain Management
bOx A 5.9 SBi CirCuLAr: mAnDAtory teStinG For AFLAtoxin
Attention Chilli/Chilli Product e xportersNo. MD/CHI/01/03/ November 12, 2003
CIRCu l ARSamples drawn from export consignments of chilli powder and other prod-ucts containing chillies, in terms of our Circular No. MD/CHI/01/03 dated 9th October 2003, would be analyzed for presence of Aflatoxin also.In view of the need for ensuring that chillies exported out of the country do not contain Aflatoxin above tolerance limit, the scope of the Circular No. MD/CHI/01/03 is extended to all verities of whole chillies to be exported with effect from 17.11.2003.
(S. Kannan)Director (Marketing)
Source: Kannan, S. Circular MD/CHI/01/03: Mandatory testing for afla-toxin. Spices Board of India, Nov. 12, 2003. Accessed Nov. 15, 2005 from http://www.indianspices.com
table A5.2 tolerance Limits for Aflatoxin for Foods and Spices
Sr. No. Country Commodity
Aflatoxin B1 (μg/kg)
Total Aflatoxin (μg/kg)
1 EUFood 2 4
Spices 5 10
2 Australia Peanuts, Tree nuts – 15
3 Bangladesh In preparation a limit of 100 μg/kg Used in Practice
4 Canada Nuts and Nut products – 15
5 China Peanuts and Maize 20 –
6 India All Food products – 30
7 Indonesia Spices, Peanuts – 20
8 Japan All Foods 10 –
9 Malaysia All Foods – 35
10 Pakistan No Regulations – –
11 Sri Lanka All Foods – 30
12 UKFood 2 4
Spices 5 10
13 USA All Foods – 20
Source: Spices Board of India.
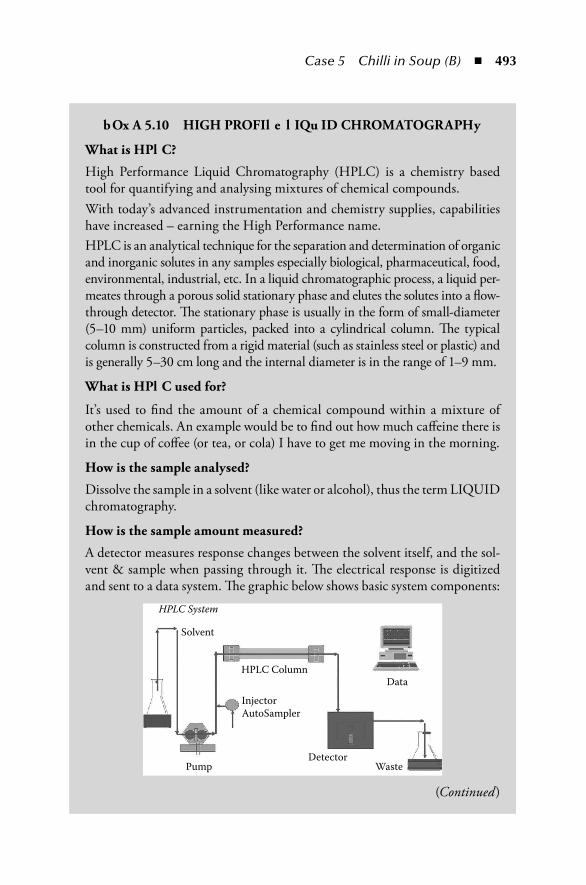
Case 5 Chilli in Soup (B) ◾ 493
bOx A 5.10 HIGH PROFIl e l IQu ID CHROMATOGRAPHy
What is HPl C?
High Performance Liquid Chromatography (HPLC) is a chemistry based tool for quantifying and analysing mixtures of chemical compounds.With today’s advanced instrumentation and chemistry supplies, capabilities have increased – earning the High Performance name.HPLC is an analytical technique for the separation and determination of organic and inorganic solutes in any samples especially biological, pharmaceutical, food, environmental, industrial, etc. In a liquid chromatographic process, a liquid per-meates through a porous solid stationary phase and elutes the solutes into a flow-through detector. The stationary phase is usually in the form of small-diameter (5–10 mm) uniform particles, packed into a cylindrical column. The typical column is constructed from a rigid material (such as stainless steel or plastic) and is generally 5–30 cm long and the internal diameter is in the range of 1–9 mm.
What is HPl C used for?
It’s used to find the amount of a chemical compound within a mixture of other chemicals. An example would be to find out how much caffeine there is in the cup of coffee (or tea, or cola) I have to get me moving in the morning.
How is the sample analysed?
Dissolve the sample in a solvent (like water or alcohol), thus the term LIQUID chromatography.
How is the sample amount measured?
A detector measures response changes between the solvent itself, and the sol-vent & sample when passing through it. The electrical response is digitized and sent to a data system. The graphic below shows basic system components:
HPLC System
Solvent
HPLC Column
InjectorAutoSampler
Pump Waste
Data
Detector
(Continued)
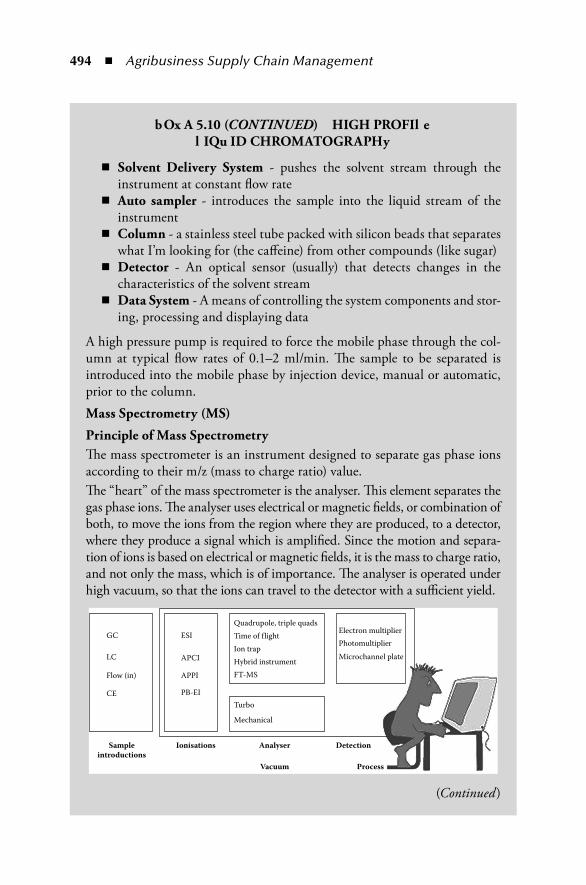
494 ◾ Agribusiness Supply Chain Management
bOx A 5.10 (CoNtiNUed) HIGH PROFIl e l IQu ID CHROMATOGRAPHy
◾ Solvent Delivery System - pushes the solvent stream through the instrument at constant flow rate
◾ Auto sampler - introduces the sample into the liquid stream of the instrument
◾ Column - a stainless steel tube packed with silicon beads that separates what I’m looking for (the caffeine) from other compounds (like sugar)
◾ Detector - An optical sensor (usually) that detects changes in the characteristics of the solvent stream
◾ Data System - A means of controlling the system components and stor-ing, processing and displaying data
A high pressure pump is required to force the mobile phase through the col-umn at typical flow rates of 0.1–2 ml/min. The sample to be separated is introduced into the mobile phase by injection device, manual or automatic, prior to the column.Mass Spectrometry (MS)
Principle of Mass SpectrometryThe mass spectrometer is an instrument designed to separate gas phase ions according to their m/z (mass to charge ratio) value.The “heart” of the mass spectrometer is the analyser. This element separates the gas phase ions. The analyser uses electrical or magnetic fields, or combination of both, to move the ions from the region where they are produced, to a detector, where they produce a signal which is amplified. Since the motion and separa-tion of ions is based on electrical or magnetic fields, it is the mass to charge ratio, and not only the mass, which is of importance. The analyser is operated under high vacuum, so that the ions can travel to the detector with a sufficient yield.
ESIQuadrupole, triple quadsTime of f light
Electron multiplierPhotomultiplier
Microchannel plateIon trapHybrid instrumentFT-MS
Turbo
Mechanical
APCI
APPI
PB-EI
Sampleintroductions
Ionisations Analyser
Vacuum
Detection
GC
CE
LC
Flow (in)
Process
(Continued)
Case 5 Chilli in Soup (B) ◾ 495
bOx A 5.10 (CoNtiNUed) HIGH PROFIl e l IQu ID CHROMATOGRAPHy
In addition to the analyser, the mass spectrometer also includes:
◾ A vacuum system ◾ Tools to introduce the sample (LC, GC) ◾ Tools to produce the gas phase ions from the sample molecules ◾ Tools to fragment the ions, in order to obtain structural information, or
to get more selective detection ◾ A detection system ◾ Software and computing.
MS/MS
It is the combination of two or more MS experiments. The aim is either to get structure information by fragmenting the ions isolated during the first exper-iment, or to achieve better selectivity and sensitivity for quantitative analysis.
MS/MS is done
◾ either by coupling multiple analysers (of the same or different kind) or, ◾ with an ion trap, by doing the various experiments within the trap.
Principles of l C/MS
LC/MS is a hyphenated technique, combining the separation power of HPLC, with the detection power of mass spectrometry. Even with a very sophisticated MS instrument, HPLC is still useful to remove the interfer-ences from the sample that would impact the ionization.Closely related to LC/MS are some other techniques, like flow injection/MS, CE or CEC/MS, capillary LC or nano LC/MS.In all cases, there is a need for an interface that will eliminate the solvent and generate gas phase ions, and then transferred to the optics of the mass spectrometer.Most instruments now use atmospheric pressure ionization (API) technique where solvent elimination and ionization steps are combined in the source and take place at atmospheric pressure.When electron impact ionization (EI) is the choice, the solvent elimination and ionization steps are separate.
(Continued)
496 ◾ Agribusiness Supply Chain Management
customers would accept analytical reports issued only by some designated over-seas labs. To them, the analytical reports issued by SBI were useless. In addition, the mandatory testing had been costing them millions of rupees annually. Apart from this, Jose had been under pressure from some influential quarters to revoke the suspension orders placed on the alleged firms. However, he chose not to wilt. However, at the same time, he was not sure how long he would be able to with-stand the pressure. Then occurred an event which had the biggest impact on this whole episode.
On February 7, 2005, Premier Foods, UK, informed the FSA that a customer sample of Worcester sauce (Crosse & Blackwell) in Italy had tested positive for Sudan I. On February 10, 2005, it confirmed that Crosse & Blackwell Worcester Sauce and a 2002 batch of chilli powder tested positive for Sudan I. Worcester Sauce was used as a flavouring agent in the manufacture of over 450 supermarket and top brand products. On February 24, 2005, the FSA published a list of 474 food products with public warning not to consume them. This triggered the biggest British food product recall off the shelves of supermarkets and departmental stores (Box A5.11).
The maze of middle-men, legal contracts, and export houses that work the world’s commodity markets, made it almost impossible to trace with certainty the source of contaminated products. However, The Guardian, a leading newspaper of the UK, could establish the tortuous supply chain. Gautam Exports Corporation supplied a five ton consignment of chilli powder adulterated with Sudan I to EW Spices, an importer of the UK. EW Spices supplied it to East Anglia Food Ingredients. The chilli was then sold to another company called Unbar Rothon, which in turn supplied it to Premier Foods. Premier Foods added the contami-nated chilli to Worcester sauce. The contaminated batch sold to Premier Foods had slipped through the lot.
bOx A 5.10 (CoNtiNUed) HIGH PROFIl e l IQu ID CHROMATOGRAPHy
The interface is a particle beam type, which separates the sample from the solvent, and allows the introduction of the sample in the form of dry particles into the high vacuum region.Electron impact is of interest for molecules which do not ionize with API technique, or when an electron impact spectrum is necessary, since it pro-vides spectral information independent of the sample introduction technique (GC or LC, or direct introduction) and instrument supplier.
Source: Waters Corporation. Website. 2005. Accessed Nov. 15, 2005 from http://www.waters.com
Case 5 Chilli in Soup (B) ◾ 497
bOx A 5.11 Ne WS ARTICl e S Re GARDING THe P RODu CT Re CAl l
PRESS TRUST OF INDIASaturday, February 19, 2005
Cancer-causing dye found in Indian chilli powder
A total of 359 food products have been taken off shop shelves in Britain after they were found contaminated with an illegal food dye and three companies in India dealing in chilli powder have been identified as the source of the contamination, the Food Standards Agency said.The Sudan I dye, linked to an increased risk of cancer, was in the chilli powder used by premier foods to make a Worcester sauce and a range of popular pasta sauces, used in other products, the agency said. According to BBC, three compa-nies in India have had their license to trade suspended by the Indian spice board pending further investigation. Sudan I, a red dye used for colouring solvents, oils and waxes, is banned for use in foodstuffs in the UK and across the EU. Since July 2003, all chilli powder imported into the UK has to be certified free of Sudan I. The brands affected include Bertolli as well as own-label sauces made for supermarket chains Sainsbury’s and Safeway. Sudan I is normally used for industrial purposes in solvents, petrol and shoe polish and is banned in food. The Food Standards Agency (FSA) has issued a warning advising people not to eat the products but said there was “no need to panic” because of the “very low risk”.Premier foods, in a statement said “the product withdrawal is a purely precau-tionary measure and the levels at which Sudan I occurs in the products con-cerned presents no immediate risk to health.” Dr. Julie Sharp, of cancer research UK, said the people who had already eaten foods that had been contaminated had no reason to panic. “The risk of cancer in humans from Sudan I has not been proven and any risk from these foods is likely to be very small indeed,” she said. The FSA is working with the industry and local authorities to ensure that any remaining affected foods are removed from the sale. It was first discovered in a consignment of the Worcester sauce exported to Italy. But authorities in France first raised the alarm in May when Sudan I was discovered in UK-made chutneys and relishes. As a result, the EU ordered member states to examine imports of ground chilli in addition to random tests on products. A spokesman for Unilever Best foods, which makes Bertolli, said: “The dye was identified by our supplier in Italy during quality assured checks and they notified us.”“The brand is certainly well known but the one we have named is the only product with chilli powder in it.”
(Continued)
498 ◾ Agribusiness Supply Chain Management
bOx A 5.11 (CoNtiNUed) Ne WS ARTICl e S Re GARDING THe P RODu CT Re CAl l
THE TIMES OF INDIA19 Feb 2005 1641 hrs IST
Indian red chilli has u k sweating
LONDON: A carcinogenic spice trail that began in several chilli grinding, packaging and exporting companies in India nearly three years ago has ended in a 15-million-pound food recall across Britain, the largest in its history, and caused panic to spread across at least 15 countries that imported foods con-taminated with the banned, cancer-causing chemical colourant SUDAN-1.The recall of hundreds of food products, ranging from British staples such as shepherd’s pie, pasta bake, chicken wings, pizza and pasta sauces, was ordered by the UK’s independent watchdog, the Food Standards Authority (FSA) late on Friday. The FSA ordered the destruction of all suspect foodstuffs manu-factured over the past 16 months using a five-tonne consignment of red chilli powder from India.Sources said the powder was thought to have been supplied by at least two western Indian companies. The powder arrived in the warehouses of Unbar Rothon in the English county of Essex and subsequently found its way into a well-known British brand of Worcester sauce manufactured by another com-pany, Premier Foods.On Saturday, Unbar Rothon admitted to STOI that it was “investigating the matter.” But a close-lipped company source insisted, “We have nothing to tell you yet because there is nothing to tell.”The chilli powder, suspiciously red from the addition of SUDAN-1, was added to the Worcester sauce, which was used to flavour popular British and European ready meals, long-life foods, frozen suppers and condiments.The sauce, with its SUDAN-1 flavouring, also found its way to the US and Canada and several European countries, including Italy.With panic-stricken Western food standards authorities under enormous public pressure to trace the contaminated food, identify the spice chain, pun-ish and possibly prosecute, the presence of SUDAN-1 in Indian chilli exports is thought to be deeply damaging.In trenchant criticism and posing a huge question for the future of Indian chilli exports to the West, British food campaigner Joanna Blythman said there was “no excuse” for a substance like Sudan 1 finding its way into food.
(Continued)
Case 5 Chilli in Soup (B) ◾ 499
bOx A 5.11 (CoNtiNUed) Ne WS ARTICl e S Re GARDING THe P RODu CT Re CAl l
The FSA told this paper that the dye is normally used in shoe polish, colour-ing solvents, oils, waxes and petrol. It has been shown to cause cancer in mice and in tests on human liver cells.On Saturday, food industry experts said the adverse publicity for Indian chilli powder could knock off-balance the recent proud boast that chilli exports are a sunshine part of the spice trade. In November, the Spice Board of India made the self-congratulatory revelation that chilli exports had increased from 38,000 tonnes in April-October 2003 to 54,000 tonnes over the same period last year.India exports spices to 120 countries. But trade experts have long pointed out the competitive challenges India faces from other spice-exporters countries, including Vietnam, Indonesia and Guatemala, unless it speedily enforces a nation-wide ban on the manufacture and sale of unregistered pesticides and the spurious use of synthetic dyes to bulk up spice quantities.The Board’s data showed that total spice export clearances were exceed-ingly strong with shipments last September nearing the 30,000 metric tonnes- per-month barrier, a whopping increase on September 2003’s total of just 18,000 metric tonnes.On Saturday, industry pundits were asking how long it could last without active Indian spice controls and image-building.The British, European and North American SUDAN-1 food alert comes just 18 months after the European Union (EU) enforced stringent emergency measures to regulate the import of chilli powder from India.The damning Brussels directive said that SUDAN red I “may be a geno-toxic carcinogen (and) may also exert sensitizing effects by dermal route or inhalation”.Just days after the EU’s Indian chilli red alert, leading British companies using Indian spices in food manufacture or supplying them to other vendors, including Shaws and BE Foods International, admitted they might be forced to seek “alternative sources” for chillies and other spices.
Rashmee Z Ahmed, TNN
(Continued)
500 ◾ Agribusiness Supply Chain Management
bOx A 5.11 (CoNtiNUed) Ne WS ARTICl e S Re GARDING THe P RODu CT Re CAl l
NDTV PROFIT.COMSunday, February 20, 2005 (London):
Indian chilli pulled off supermarket shelves in u k
Red chilli powder manufactured by three Indian companies was pulled off shelves across UK after the search for carcinogenic elements in spices unearthed alarming results.A total of 359 food products, including fast food items such as pastas and pizzas, have been taken off from supermarket shelves across London as they are found to carry the Sudan I dye.This dye, which leads to a high cancer risk, was found in commonly used foods as an ingredient in sauces. Sudan I is also said to be used in shoe polish, oils and waxes.“The risks associated with these foods are extremely small, but it’s clearly unacceptable for an illegal food dye to be in any food,” said Dr. Jon Bell, Chief Executive, Food Standards Agency.“If consumers have got any of these products in their cupboards in their houses, then they should throw them away or return them to where they bought them from,” he warned.The trade licenses of the companies supplying this ingredient have been tem-porarily suspended by the Indian Spice Board.Looks like the Indian chilli, famed for its superior quality, needs to prove just how hot it is across the European Union.
NDTV Correspondent
THE TIMES OF INDIA21 Feb 2005, 2323 hrs IST,
u k mulls action against suppliersLONDON: Seventy-two hours after the biggest food scare in British history, the message from the Food and Drink Federation (FDF), which represents the UK’s largest manufacturing sector: long-term “trusted” suppliers of the contaminated chilli powder are to blame because tests are not routinely con-ducted for the banned dye SUDAN-1.
(Continued)
Case 5 Chilli in Soup (B) ◾ 501
bOx A 5.11 (CoNtiNUed) Ne WS ARTICl e S Re GARDING THe P RODu CT Re CAl l
Even as a flurry of stringent legal claims were mooted in a bid to reclaim the millions of pounds being spent on recalling and destroying expensive food, the FDF’s comments appeared to mark a new mood to punish, prosecute and penalize long-term spice suppliers to the UK, notably Indian companies.Experts said on Monday that many established spice exporters to the UK might face the chop unless they demonstrably cleaned up their act. The FDF’s comments are considered significant because it represents key British players of an industry that exports nearly £10 billion of food and drink worldwide.Carcinogenic SUDAN-1’s presence in a five-tonne consignment of chilli pow-der imported from India in 2002, sparked a several-million-pound food recall across the UK and triggered panic across the US, Canada, New Zealand, Italy, France and other European Union countries. SUDAN-1 has been illegal in Britain for a decade but the contaminated, three-year-old Indian import is thought to be the first conclusive proof that Indian spice suppliers have contin-ued to break the rules.London lawyers said on Monday that they expected a blizzard of product lia-bility claims “up the supply chain”, possibly leading all the way back to India. But there was no indication how and if legal claims against Indian companies could be pursued, in practice. The cost of removing an estimated 360 food items from British supermarket shelves, including popular pies, pasta sauces, pizzas, casseroles, sausages and sauces, is estimated to be at least £15 million.In a knee-jerk fear at the prospect of footing part of the bill, at least some of the food companies that bought the contaminated Indian chilli powder, have begun to distance themselves from all responsibility.In a game of pass-the-parcel, several British spice importers refused to admit to the initial import of chilli powder from India. One company, East Anglian Foods Ingredients, from Essex, near London, admitted to first handling the chilli powder but claimed it bought it from another source.The chilli powder was also handled by spice and herb specialists Unbar Rothon, which insisted the “powder came straight in and straight out and we did not process it”.The chillies were then sold to Premier Foods, which fatefully used it to make the Worcestershire sauce that flavoured whole fridge-full of chilled meals, heat-and-eat suppers and snacks. On Monday, Premier Foods claimed it was “misled” by Unbar Rothon and is seeking legal advice.
(Continued)
502 ◾ Agribusiness Supply Chain Management
bOx A 5.11 (CoNtiNUed) Ne WS ARTICl e S Re GARDING THe P RODu CT Re CAl l
But because both Unbar Rothon and East Anglia Food Ingredients deny pre-liminary responsibility, legal experts said the blame could ultimately be laid to rest on the shoulders of Indian suppliers.They pointed out that the contaminated chilli powder arrived in Britain despite the Indian Spice Board’s acceptance of European Spice Association requirements, which specify that imports be “free from adulteration”.Late on Monday, a spokesperson for the British Retail Consortium said the chilli scare was affecting small convenience stores and large supermarket chains alike. Even fast-food chain McDonalds is affected because a low-fat Caesar salad dressing is seasoned with products flavoured with that initial, five-tonne Indian consignment.Meanwhile, the FDF’s deputy director-general Martin Paterson also contro-versially appeared to offer a loophole to suppliers of suspect products with the admission that checks for the banned dye SUDAN-1 were not routine on foodstuffs containing imported chilli powder.SUDAN-1 is normally used as a colouring in solvents, oils, waxes, petrol, and shoe and floor polish.
Rashmee Z Ahmed, TNN
The GuardianTuesday February 22, 2005
Watchdog under fire as cancer-dye foods top 400
More than 400 well-known processed foods are to be removed from sale because they are contaminated with an illegal red dye, which can cause cancer, it emerged yesterday.The Food Standards Agency added 59 more products through the day to its list of 359 adulterated foods first published last Friday.The agency also warned that the crisis, already the largest food alert since BSE, was likely to get worse, as it came under attack for failing to prevent the lapse in food safety and for taking too long to make the information public.The FSA’s chief executive, Dr. Jon Bell, admitted that the carcinogenic dye, Sudan 1, had been found in Crosse and Blackwell Worcester sauce only by chance.
(Continued)
Case 5 Chilli in Soup (B) ◾ 503
bOx A 5.11 (CoNtiNUed) Ne WS ARTICl e S Re GARDING THe P RODu CT Re CAl l
It had been used to colour a batch of chilli powder used as an ingredient in the sauce. The sauce in turn was sold on to hundreds of food companies for manufacture into famous brands of food and supermarket ready meals.Dr. Bell also acknowledged that the adulteration of chilli powder may have been going on undetected for years. The French authorities first raised the alarm about imports of chilli with Sudan 1 in 2003.The contamination of the Crosse and Blackwell Worcester sauce made by Premier Foods was not picked up by supermarkets, food manufactur-ers or enforcement authorities in the UK, but by a laboratory in Italy on January 28.Premier Foods told the FSA of its concerns on February 7 but it was not until February 18 that an initial list of products affected was posted on the FSA website. Supermarkets meanwhile are understood to have received informa-tion a few days before the public.The conservative health spokesman, Chris Grayling, accused the FSA of tak-ing its “eye off the ball”.“I think it is all the more regrettable that consumers were left for a period of up to 10 days still buying these products, unaware that there was an issue,” he said.The full scale of the contamination is still being uncovered. The FSA said that over 300 food companies were involved in the effort to trace how far the Worcester sauce had spread.Those identified so far include leading supermarkets Tesco, Asda, Sainsbury’s, Morrisons, Waitrose, M&S, and top brand owners such as crisp makers Walkers, Unilever, Heinz, McDonald’s and Schweppes. The FSA said it could not guarantee that there was not more adulterated chilli in circulation.Premier Foods declined to comment yesterday. It said on Friday that it had certificates from its suppliers that guaranteed that the chilli it used was free of Sudan 1. The FSA could not say who had issued these certificates or whether they had come from a properly accredited laboratory.An FSA spokesman said Premier Foods obtained the chilli powder from Essex-based spice and herb specialist Unbar Rothon which in turn received it from East Anglian Food Ingredients, also in Essex. Both these companies are brokers who may not have handled the chilli directly themselves. Unbar Rothon declined to comment last week but EAFI said: “Where contamina-tion could be established we recalled stock.”
(Continued)
504 ◾ Agribusiness Supply Chain Management
bOx A 5.11 (CoNtiNUed) Ne WS ARTICl e S Re GARDING THe P RODu CT Re CAl l
Sudan 1 is an azo dye, known to be carcinogenic in animal tests. It is not permitted for use in food in the EU. It has also been found as an adulterant in samples of palm oil imported into the UK.The FSA said Sudan 1 presented no risk of immediate illness but could increase the risk of cancer, although the risk “generally is likely to be very small”. The French food authority which uncovered the Sudan 1 in chilli powder from the UK said it “cannot exclude the possibility of a risk to human health even at low doses... all measures should be taken to ensure that the consumer is not exposed to this substance”.
FSAThursday 24 February 2005
Sudan I timeline
Sudan I was first discovered in adulterated chilli products in May 2003. Since then the Food Standards Agency has been working to ensure that it is kept out of the food chain. Read our timeline to find out what happened between May 2003 and the major recall of products in February 2005.
Friday 9 May 2003France informs the European Commission that testing has detected the ille-gal dye Sudan I in hot chilli products originating in India.
Wednesday 30 July 2003UK implementation of European Commission emergency measures comes into force covering the import of hot chilli and hot chilli products from India. All consignments must be accompanied by a certificate showing that they have been tested and are free from Sudan I. If there is no certificate, they are to be tested at the port of entry to the EU. Member states are asked to carry out random sampling and analysis of consignments at import and products already on the market.
Thursday 31 July 2003The Food Standards Agency issues its first food hazard warnings (now called food alerts) on Sudan I found in products containing hot chilli. Local author-ities are asked to ensure that 25 products are removed from sale.
(Continued)
Case 5 Chilli in Soup (B) ◾ 505
bOx A 5.11 (CoNtiNUed) Ne WS ARTICl e S Re GARDING THe P RODu CT Re CAl l
Monday 15 September 2003The Agency issues guidance to industry asking companies to withdraw and recall contaminated products as soon as they are identified. The FSA also asks all manufacturers who use chilli powder or chilli products to ensure that it has not been contaminated with Sudan dyes if it was imported from India and supplied to them prior to 30 July 2003.The guidance adds: ‘These companies should consider sampling relevant batches in order to ensure that their products are not contaminated. The FSA would like to be notified of all results whether they are positive or negative, in order to obtain as much information as possible about the distribution of contaminated chilli products.’
Wednesday 18 February 2004The Agency issues updated guidance to industry, asking companies to with-draw and recall contaminated products as soon as they are identified. The FSA also asks all manufacturers who use chilli powder or chilli products to ensure that it has not been contaminated with Sudan dyes if it was imported from India and supplied to them prior to 27 January 2004. The guidance repeats the Agency’s request for companies to sample relevant batches in order to ensure that their products are not contaminated and to notify the Agency of all results.
31 July 2003–31 January 2005In the 18 months since it first became aware of the adulteration of chilli prod-ucts with Sudan dyes, the Agency issues 56 food hazard warnings/food alerts on Sudan dyes, involving more than 200 products.
Monday 7 February 2005Premier Foods informs the FSA that a customer sample of Worcester Sauce in Italy had tested positive for Sudan I (Crosse & Blackwell Worcester Sauce). Premier Foods advises the Agency that it will carry out further tests to check the results.
Wednesday 9 February 2005Premier Foods informs the FSA that five products could be affected.
(Continued)
506 ◾ Agribusiness Supply Chain Management
bOx A 5.11 (CoNtiNUed) Ne WS ARTICl e S Re GARDING THe P RODu CT Re CAl l
Thursday 10 February 2005Test results are received by the FSA and it is informed that Crosse and Blackwell Worcester Sauce and a 2002 batch of chilli powder have tested positive for Sudan I.
Friday 11 February 2005Premier Foods informs the FSA that it is compiling a list of customers for the five products.
Monday 14 February 2005Premier Foods provides the FSA with a list of more than 160 customers in the UK. Hundreds of products are potentially affected.
Tuesday 15 February 2005The FSA meets with representatives of the food industry and requires full disclosure by companies of their affected products, their removal from sale, and appropriate publicity to inform consumers.
Wednesday 16 February 2005The FSA meets again with food industry representatives and repeats its demand for detailed product information.
Thursday 17 February 2005The bulk of the information on the affected products is received in the eve-ning via the British Retail Consortium.
Friday 18 February 2005Further product information continues to arrive. A press release is issued by the FSA and a list of some 360 products placed on the Agency website at 1.30 pm.
Monday 21 February 2005Sixty products are added to the list, a second press release is issued, a further meeting with retailers is held, and a deadline of Thursday 24 February is set for the removal from sale of all contaminated products.
Tuesday 22 February 2005Nine additional products are added to the list of food products contaminated with the illegal dye Sudan I.
(Continued)
Case 5 Chilli in Soup (B) ◾ 507
bOx A 5.11 (CoNtiNUed) Ne WS ARTICl e S Re GARDING THe P RODu CT Re CAl l
Thursday 24 February 2005The Agency announces that over the past week it has coordinated with local authorities in further inspections of companies and factories alleg-edly involved in the supply of foods contaminated with the illegal dye Sudan I. The investigation is the largest of its kind ever undertaken in the UK. The information will form part of the Agency’s wider investigation to establish how this failure in the industry’s legal duty to provide safe and fit food happened. The Agency’s advice to local authorities is that they will need to consider enforcement action on the basis of the evidence they collect.
Thursday 24 February 2005The Agency adds 146 more products to the list of food products contami-nated with the illegal dye Sudan I, taking the total to 474. The Agency says that the vast majority of products contaminated with Sudan I have been removed from sale.
Tuesday 8 March 2005The Agency is advised of a further 43 products that companies have with-drawn from the food chain as a result of Sudan I contamination, bringing the total to 580.
The TimesFebruary 26, 2005
Premier Foods faces £100 m bill for Sudan 1
PREMIER FOODS, the company at the centre of the chilli powder contami-nation scandal, faces a potential £100 million bill after experts gave warning that insurers were unlikely to cover the cost of Britain’s biggest product recall, The Times has learnt.Carcinogenic contaminants such as Sudan 1, the colourant used in the chilli powder, are excluded from standard product recall insurance cover, the world’s largest insurance brokers said yesterday.David Palmer, director of Aon Crisis Management, the broker, said: “This particular incident isn’t a covered incident, as far as I’m aware. Policies cover contaminants that manifest themselves within 120 days, not years later.”
(Continued)
508 ◾ Agribusiness Supply Chain Management
bOx A 5.11 (CoNtiNUed) Ne WS ARTICl e S Re GARDING THe P RODu CT Re CAl l
While another broker said that it was possible to buy specialized policies from offshore insurers that cover a company against being forced to recall a prod-uct at the behest of a regulator, he added that “this isn’t the type of policy the average small-to-medium food manufacturer would have”.AIG, the American insurer, is believed to have underwritten Premier’s prod-uct-recall policy. The US group declined to comment yesterday.The Food Standards Agency, the watchdog, has ordered the recall of more than 470 products that contain Worcester sauce supplied by Crosse & Blackwell. Premier Foods used Sudan 1 contaminated chilli powder in the manufacture of the sauce, which it supplied to a number of supermarkets and food producers, which in turn used it as an ingredient in their own products.Brokers said that a large-scale product recall could cost up to £50 million. However, because of the unprecedented scale of the Sudan 1 contamination, the total bill could come to as much as £100 million, they added.Premier’s market capitalization is about £686 million.A number of supermarkets, including Tesco, Somerfield, Kwik Save and the Co-op, said yesterday that they would recoup their recall costs from their supplier, which was Premier.Premier is expected to bear the brunt of the recall bill but has said that it will attempt to pass on the cost to its small, privately owned suppliers.“We believe the responsibility for any financial costs associated with the recall will rest with our suppliers and their insurers,” the company said in a state-ment on February 18.It later added: “In any event, the company is insured against such eventualities.”However, when asked yesterday whether its own product recall cover insured the group against carcinogenic contaminants, Premier declined to comment.
Christine Seib
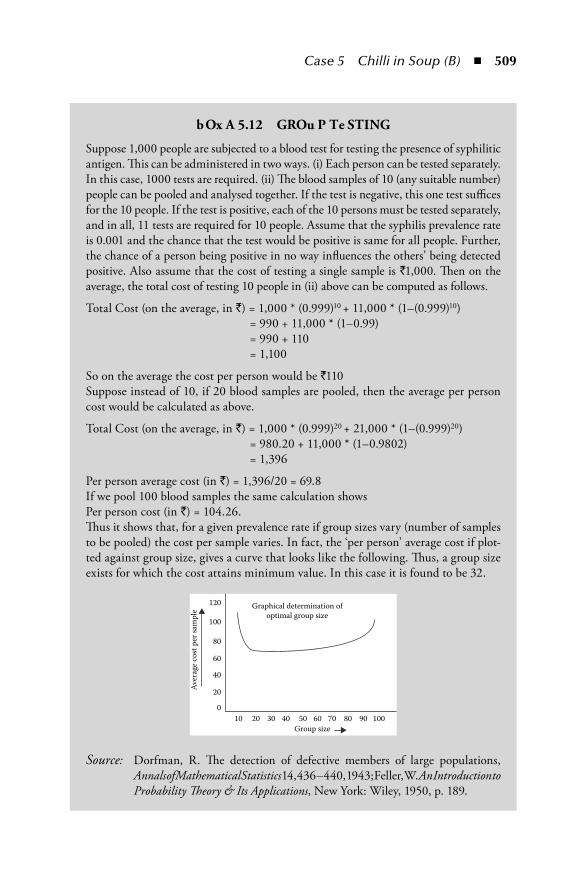
Case 5 Chilli in Soup (B) ◾ 509
bOx A 5.12 GROu P Te STING
Suppose 1,000 people are subjected to a blood test for testing the presence of syphilitic antigen. This can be administered in two ways. (i) Each person can be tested separately. In this case, 1000 tests are required. (ii) The blood samples of 10 (any suitable number) people can be pooled and analysed together. If the test is negative, this one test suffices for the 10 people. If the test is positive, each of the 10 persons must be tested separately, and in all, 11 tests are required for 10 people. Assume that the syphilis prevalence rate is 0.001 and the chance that the test would be positive is same for all people. Further, the chance of a person being positive in no way influences the others’ being detected positive. Also assume that the cost of testing a single sample is 1̀,000. Then on the average, the total cost of testing 10 people in (ii) above can be computed as follows.
Total Cost (on the average, in `) = 1,000 * (0.999)10 + 11,000 * (1–(0.999)10) = 990 + 11,000 * (1–0.99) = 990 + 110 = 1,100
So on the average the cost per person would be `110Suppose instead of 10, if 20 blood samples are pooled, then the average per person cost would be calculated as above.
Total Cost (on the average, in `) = 1,000 * (0.999)20 + 21,000 * (1–(0.999)20) = 980.20 + 11,000 * (1–0.9802) = 1,396
Per person average cost (in `) = 1,396/20 = 69.8If we pool 100 blood samples the same calculation showsPer person cost (in `) = 104.26.Thus it shows that, for a given prevalence rate if group sizes vary (number of samples to be pooled) the cost per sample varies. In fact, the ‘per person’ average cost if plot-ted against group size, gives a curve that looks like the following. Thus, a group size exists for which the cost attains minimum value. In this case it is found to be 32.
100
20
40
60
80
100
120 Graphical determination ofoptimal group size
20 30 40Group size
50 60 70 80 90 100
Aver
age
cost
per
sam
ple
Source: Dorfman, R. The detection of defective members of large populations, Annals of Mathematical Statistics 14, 436–440, 1943; Feller, W. An Introduction to Probability Theory & Its Applications, New York: Wiley, 1950, p. 189.
510 ◾ Agribusiness Supply Chain Management
bOx A 5.13 RANDOM SAMPl ING v S. Sy STe MATIC SAMPl ING
Samples are to be taken to determine the Aflatoxin level in a lot of, say, 25 tonnes of chilli powder. Suppose the chilli powder is packed into two thousand five hundred 10 kg packs. The total weight of the aggregate sam-ple should be 10 kg and the number of incremental samples should be 100. Suppose a further sample is collected in one of the following ways:
1. 100 packs are selected at random without replacement and from each pack, 100 grams of chilli powder are taken out from a few randomly selected locations.
2. First, select a pack at random from the first 25 packs and then every 25th pack is selected. For example, if the first pack selected is 10th, then the next 99 packs will be 35th, 60th,…., 2485th.
(We assume here throughout that the number of incremental samples is less than the number of packs which is the case in almost all situations in practice.)In sampling literature, the first scheme is known as random sampling and the second scheme as systematic sampling.Note, the estimate of average Aflatoxin content in the lot per 100 g = (sum of Aflatoxin contents in the incremental samples)/100It can be shown:
(i) In case of random sampling, standard error of the estimate
= lot SD/√100 = lot SD/10
(Lot SD = Standard deviation of Aflatoxin content in all 25,000 possible units of 100 g chilli powder each)
(ii) In case of systematic sampling, standard error of the estimate
= + −( ( ( )lot SD / R√100 ∗ ∗1 100 1
where R represents a measure of heterogeneity which is precisely the correla-tion coefficient between all pairs of elements in a systematic sample. R lies between –1/(100–1) to 1. R is negative in case the elements within a system-atic sample tend to be extremely different. In this case, systematic sampling will naturally be better than random sampling. On the other hand, if R is positive then the elements within a sample are fairly homogeneous and hence systematic sampling yields a higher standard error than random sampling.
Source: Scheaffer, R.L., Mendenhall, W., and Ott, R.L. Elementary Survey Sampling, Boston: Duxbury Press, 1995, p. 256.
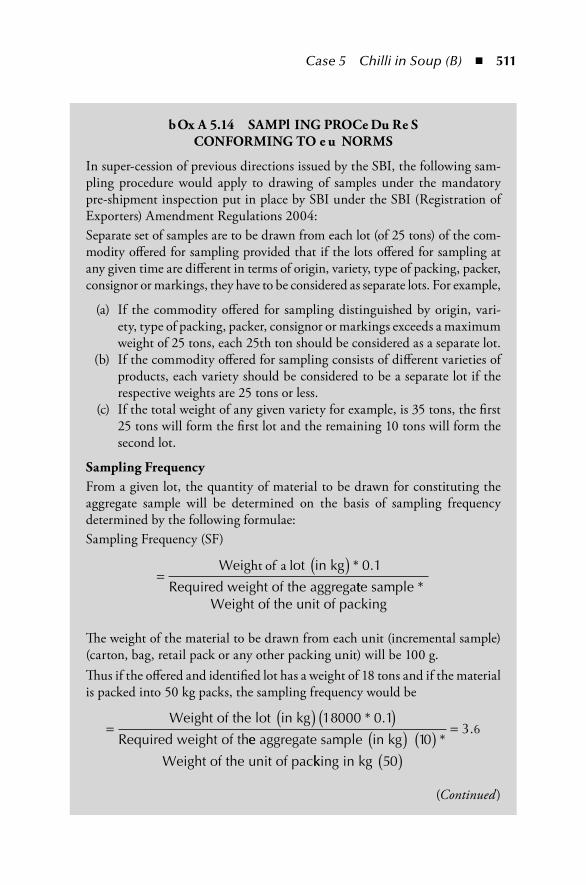
Case 5 Chilli in Soup (B) ◾ 511
bOx A 5.14 SAMPl ING PROCe Du Re S CONFORMING TO e u NORMS
In super-cession of previous directions issued by the SBI, the following sam-pling procedure would apply to drawing of samples under the mandatory pre-shipment inspection put in place by SBI under the SBI (Registration of Exporters) Amendment Regulations 2004:Separate set of samples are to be drawn from each lot (of 25 tons) of the com-modity offered for sampling provided that if the lots offered for sampling at any given time are different in terms of origin, variety, type of packing, packer, consignor or markings, they have to be considered as separate lots. For example,
(a) If the commodity offered for sampling distinguished by origin, vari-ety, type of packing, packer, consignor or markings exceeds a maximum weight of 25 tons, each 25th ton should be considered as a separate lot.
(b) If the commodity offered for sampling consists of different varieties of products, each variety should be considered to be a separate lot if the respective weights are 25 tons or less.
(c) If the total weight of any given variety for example, is 35 tons, the first 25 tons will form the first lot and the remaining 10 tons will form the second lot.
Sampling FrequencyFrom a given lot, the quantity of material to be drawn for constituting the aggregate sample will be determined on the basis of sampling frequency determined by the following formulae:Sampling Frequency (SF)
=( )Weig ot in kg 1
Required weight of the aggrega
ht of a l * .0
tte sampleWeight of the unit of packing
*
The weight of the material to be drawn from each unit (incremental sample) (carton, bag, retail pack or any other packing unit) will be 100 g.Thus if the offered and identified lot has a weight of 18 tons and if the material is packed into 50 kg packs, the sampling frequency would be
=( ) ( )Weight of the lot in kg 18 1
Required weight of th
000 0* .
ee aggregate s mple in kg 1
Weight of the unit of pac
a ( ) ( )0 *
kking in kg 50
3
( )
= .6
(Continued)
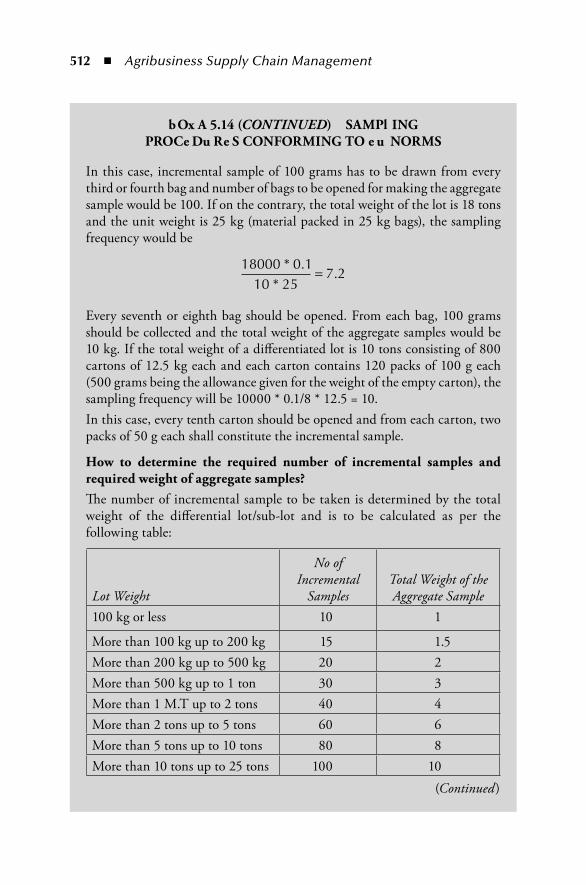
512 ◾ Agribusiness Supply Chain Management
bOx A 5.14 (CoNtiNUed) SAMPl ING PROCe Du Re S CONFORMING TO e u NORMS
In this case, incremental sample of 100 grams has to be drawn from every third or fourth bag and number of bags to be opened for making the aggregate sample would be 100. If on the contrary, the total weight of the lot is 18 tons and the unit weight is 25 kg (material packed in 25 kg bags), the sampling frequency would be
18000 0 110 25
7 2* .
*.=
Every seventh or eighth bag should be opened. From each bag, 100 grams should be collected and the total weight of the aggregate samples would be 10 kg. If the total weight of a differentiated lot is 10 tons consisting of 800 cartons of 12.5 kg each and each carton contains 120 packs of 100 g each (500 grams being the allowance given for the weight of the empty carton), the sampling frequency will be 10000 * 0.1/8 * 12.5 = 10.In this case, every tenth carton should be opened and from each carton, two packs of 50 g each shall constitute the incremental sample.
How to determine the required number of incremental samples and required weight of aggregate samples?The number of incremental sample to be taken is determined by the total weight of the differential lot/sub-lot and is to be calculated as per the following table:
Lot Weight
No of Incremental
SamplesTotal Weight of the Aggregate Sample
100 kg or less 10 1
More than 100 kg up to 200 kg 15 1.5More than 200 kg up to 500 kg 20 2More than 500 kg up to 1 ton 30 3More than 1 M.T up to 2 tons 40 4More than 2 tons up to 5 tons 60 6More than 5 tons up to 10 tons 80 8More than 10 tons up to 25 tons 100 10
(Continued)
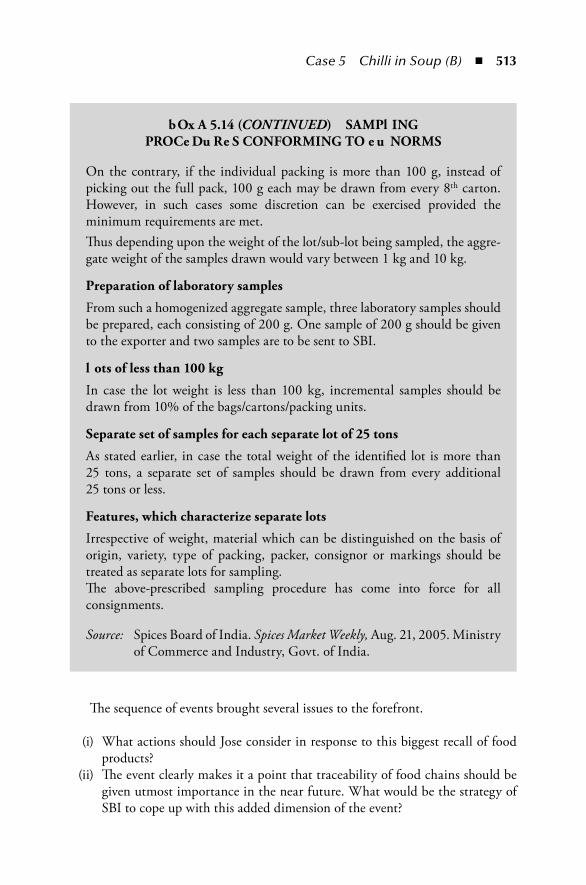
Case 5 Chilli in Soup (B) ◾ 513
The sequence of events brought several issues to the forefront.
(i) What actions should Jose consider in response to this biggest recall of food products?
(ii) The event clearly makes it a point that traceability of food chains should be given utmost importance in the near future. What would be the strategy of SBI to cope up with this added dimension of the event?
bOx A 5.14 (CoNtiNUed) SAMPl ING PROCe Du Re S CONFORMING TO e u NORMS
On the contrary, if the individual packing is more than 100 g, instead of picking out the full pack, 100 g each may be drawn from every 8th carton. However, in such cases some discretion can be exercised provided the minimum requirements are met.Thus depending upon the weight of the lot/sub-lot being sampled, the aggre-gate weight of the samples drawn would vary between 1 kg and 10 kg.
Preparation of laboratory samples
From such a homogenized aggregate sample, three laboratory samples should be prepared, each consisting of 200 g. One sample of 200 g should be given to the exporter and two samples are to be sent to SBI.
l ots of less than 100 kg
In case the lot weight is less than 100 kg, incremental samples should be drawn from 10% of the bags/cartons/packing units.
Separate set of samples for each separate lot of 25 tons
As stated earlier, in case the total weight of the identified lot is more than 25 tons, a separate set of samples should be drawn from every additional 25 tons or less.
Features, which characterize separate lots
Irrespective of weight, material which can be distinguished on the basis of origin, variety, type of packing, packer, consignor or markings should be treated as separate lots for sampling.The above-prescribed sampling procedure has come into force for all consignments.
Source: Spices Board of India. Spices Market Weekly, Aug. 21, 2005. Ministry of Commerce and Industry, Govt. of India.
514 ◾ Agribusiness Supply Chain Management
(iii) Is it possible to use group testing (Box A5.12) for Sudan dyes to minimize the cost?
(iv) As Aflatoxins are found in a highly heterogeneous manner in a lot, sampling the lots for measuring Aflatoxin should be done carefully. Such being the case, what is more appropriate: random sampling or systematic sampling of the sacks from the lot (Box A5.13 and Box A5.14)?
(v) During the shipment of the chilli powder/product, due to faulty packaging, the presence of moisture in the container would aid the growth of moulds (if present in the product) and thus, enhance the probability of rejection once it reaches the shore. What would be the possible remedies to this problem?
AcknowledgementsPrepared by Professor Tathagata Bandyopadhyay and Professor G. Raghuram, Indian Institute of Management, Ahmedabad.
Assistance and data support provided by Mr. Jose, Chairman, and other senior executives of the Spices Board of India are gratefully acknowledged. Some data has been masked to protect sensitivities.
Cases of the Indian Institute of Management, Ahmedabad, are prepared as a basis for class discussion. They are not designed to present illustrations of either correct or incorrect handling of administrative problems.
This case has been reproduced with permission from Indian Institute of Management, Ahmedabad. Copyright © 2008.
515
Case 6 Adani Wilmar Limited
It was August 2000. Sitting in his cabin, Mr. Pakarashi, the Logistics Manager of Adani Wilmar Limited (AWL), was working on the distribution network for the new brand of edible oil to be launched by the company.
Edible oil was still an important commodity in India. Since there was little difference in the raw material and processing costs for different companies, one of the major areas where one could get a competitive advantage was in managing the supply chain. Transportation accounted for approximately 70 per cent of the logistics cost. This meant setting up an optimal distribution network that focused on transportation costs.
AWL was setting up a refinery of 600 tons per day (tpd) capacity at Mundra, a port on the Gulf of Kutch, Gujarat. This was the largest refinery in the country, and was expected to be fully operational by September 2000. (The National Dairy Development Board (NDDB), a cooperative, currently owned the biggest edible oil refinery with a capacity of 250 tons per day.) Refined stocks would have to be dis-tributed to dealers in the markets selected initially in western and northern India. Issues under consideration were the location of warehouses, allocation of dealers to warehouses, and transportation mode choice from the refinery to the warehouse.
BackgroundThe Adani group started as a trading company, mainly focusing on export of commodities. After a fast growth over 10 years, it had a turnover (value of goods traded) of `35 billion in 1999–2000, with net profit of `1.2 billion. It had recently entered into the infrastructure sector, with the building of Mundra port through a 50–50 joint venture with the government of Gujarat (represented by the Gujarat Port Infrastructure Development Company Limited, promoted by the Gujarat
516 ◾ Agribusiness Supply Chain Management
Maritime Board and Gujarat Industrial Investment Corporation Limited). The port was built with an investment of `3.9 billion and was designed for a through-put of 1.7 million tons per annum (mtpa). The port started operations in October 1998 and handled a cargo of 293,000 tons in 1999–2000 and 122,000 tons during April to June, 2000. A further investment of `4 billion was being made to increase the port capacity, along with a 57 km railway siding for evacuation.
The group had formed a 50–50 joint venture with Wilmar Trading Private Limited (WTPL) of Singapore in June 1999 to enter into the edible oil business. WTPL had a turnover of US$ 2.1 billion in 1999. It was the world’s second largest player in edible oil trade, having its own plantations in Malaysia and Indonesia. It also owned a fleet of vessels to transport the products to different countries. Under this joint venture, crude edible oil was to be sourced and imported from Indonesia and Malaysia, refined in Mundra, and marketed in India for domestic consump-tion. The aim of the joint venture was to exploit the synergies offered by port ownership (Adani Group) and understanding of the international edible oil mar-ket (WTPL). In fact, WTPL had approached Adani for the joint venture, as the latter had suitable infrastructure in the form of a private captive port in Mundra.
market and CompetitionAWL was planning to market the refined edible oil in western and northern India, since this would give the company an advantage in logistics because of the ease of servicing these regions from the Mundra port. The company would find it difficult to service the eastern India markets, since higher road freight (in comparison to ocean freight) would not make it competitive, especially if a competitor sought to access this market through an east coast port. For example, road freight from Mundra to Kolkata was around `3000/ton, while ocean freight was approximately `500/ton from Singapore to west coast India. (Ocean freight to the east coast was only marginally less.) For the same reason, reaching the western and northern India markets through an east coast port (even though the edible oil was being sourced from countries located to the east of India) would not be competitive.
Consumption patterns of edible oils in India differed from one region to another depending on taste and preferences of the people. For example, in the north region, a large variety of oils such as soya, mustard, rapeseed, and sunflower were used, while in the west, groundnut, cottonseed, and soya oils were consumed. In the south region, coconut oil and to a lesser extent sesame oil was the preferred medium. Mustard oil was the primary medium in the east. Edible oil consumption was price elastic. (Geographical demand patterns for various edible oils are shown in Box A6.1.)
The company was planning to have various edible oils in its portfolio. In the short term, it was looking to focus on following distribution: 50 per cent soya, 20 per cent cottonseed, and 30 per cent others (palmolein, rapeseed, etc.) because the demand for these oils was mainly in northern and western India.
Case 6 Adani Wilmar Limited ◾ 517
bOx A 6.1 e DIbl e O Il C ONSu MPTION PATTe RNS AND GROWTH
Per capita consumption of oil in India has been increasing over the years from 6.8 kg/year in 1991 to about 10 kg/year in 1999–2000. Though this growth was high in recent years, the average was lower than that in most other coun-tries of the world. Annual per capita consumption was 24.4 kg in USA and 29.4 kg in Greece in 1997, while the world average was estimated to be more than 12.0 kg/year.a
Edible oil consumption is price elastic, tending to increase with a decrease in price.b This indicates that the consumption of oil is set to increase with increase in income, though its share in total consumption would decrease, since its elasticity is only 0.90. In the base scenario of per capita income grow-ing by 4 per cent annually, an average Indian’s yearly edible oil requirement is slated to rise from 9.81 kg in 1999–2000 to 16 kg by 2015.c If the per capita income growth is going to be 6 per cent, edible oil consumption would go up to 20.60 kg, i.e. twice the current level over the next 15 years.In recent years, the Indian edible oil market has seen a lot of changes, espe-cially in integration with the world markets. A study showed that the cor-relation coefficient between Indian and world edible oil prices was as low as 0.65 till 1995, when edible oil was put on OGL. After 1995, the Indian prices generally moved in tandem with the world prices, the differences being mainly because of varying import duties.India being a vast country, there are specific regional preferences, depend-ing largely upon the oils available in the region. For example, people in the West and South prefer groundnut oil, while those in the East and North use mustard seed or rapeseed oil. Likewise several pockets in the South have a preference for coconut or sesame oil.Preferences have also changed over time. Groundnut accounted for about three-fourths of consumption in the early 60s followed by rapeseed and mus-tard. Demand increased with increase in population and income. Initially, increased demand was met through domestic production. However with emphasis on food grain self-sufficiency, area under oilseed cultivation shifted to wheat and rice. India started importing edible oils. With increasing prices and decreasing supplies of these oils, the consumer was exposed to other oils like soya bean and sunflower. Groundnut oil now accounts for only about one-third of total oil consumption in India. Soya bean oil and sunflower together account for one–fourth of oil consumption.
(Continued)
518 ◾ Agribusiness Supply Chain Management
The market for edible oils was estimated to be 13 mtpa1 in 2000. In the orga-nized sector the main players were ITC, NDDB, Ruchi Soya, and Marico. In recent times, the market share of national brands like Godrej Sunflower, Sweekar, Saffola, etc., had decreased and regional brands had gained from them, thanks to their lower price. (Sales of various players in the edible oil market are shown in Table A6.1.) However the Edible Oils Packaging (Regulations) Order, 1998 made it obligatory for edible oil companies to sell only packed oil. Given that packing machines would require significant investment, players in the unorganized sector would in future be at a disadvantage compared to the established brands of organized sector.
AWL chose to focus on importing crude edible oil because of differential duty favourable to crude oil over refined oil. The idea behind this duty structure
bOx A 6.1 (CoNtiNUed) e DIbl e O Il CONSu MPTION PATTe RNS AND GROWTH
Edible oils are consumed in three forms: non-refined (or filtered) oils, vanas-pati (partially hydrogenated edible oil mixture), and refined oils. Non-refined oils are mainly made from groundnut and mustard seeds. Traditional cus-tomers prefer the strong and distinctive taste of these oils. Inhabitants of the northern plains have a preference for hard fat and use vanaspati for special items like sweets. Its production is about 1.3 mtpa for the oil year (November 1998 to October 1999). Vanaspati has the ability to absorb a heterogeneous variety of oils which do not generally find direct marketing opportunities because of consumers’ preference for traditional oils such as groundnut oil, mustard oil, sesame oil, etc.Newer oils like Soya bean, sunflower, rice bran, cottonseed, and oils from tree and forest sources have found their way to the edible pool largely through the vanaspati route. As a result of price, availability, and even health con-sciousness, refined edible oils have gained increasing acceptance. Through technological means such as refining, bleaching, and de-odourization, all oils could be made practically colourless, odourless, and taste free. These oils could be made from a variety of sources like cottonseed, sunflower, palm oil (or its liquid fraction palmolein), Soya bean, rice bran, etc. whose availability is in plenty. The share of raw oil, vanaspati, and refined oil in the total edible oil market is, respectively 42.0 per cent, 13.4 per cent, and 42.7 per cent (November 1997 to October 1998).d
a http://www.mpopc.org.my/newsapril2000.htmb Rakesh Jain, “Background Paper on Edible Oil Industry in India,” www.
madhyabharat.com/sopa/themec http://www.indiancommodities.com/shb.htmd http://fcamin.nic.in/sugar_edbl.htm#Consumption Pattern
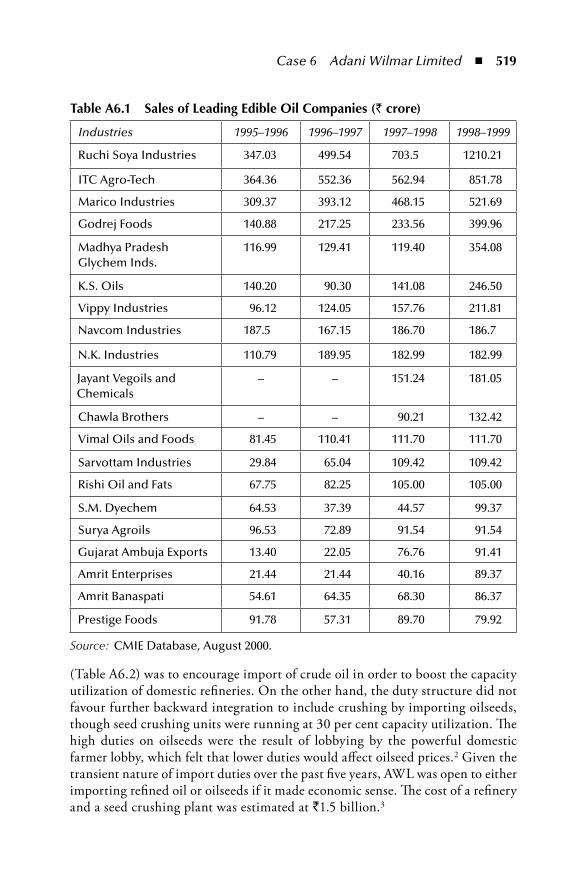
Case 6 Adani Wilmar Limited ◾ 519
(Table A6.2) was to encourage import of crude oil in order to boost the capacity utilization of domestic refineries. On the other hand, the duty structure did not favour further backward integration to include crushing by importing oilseeds, though seed crushing units were running at 30 per cent capacity utilization. The high duties on oilseeds were the result of lobbying by the powerful domestic farmer lobby, which felt that lower duties would affect oilseed prices.2 Given the transient nature of import duties over the past five years, AWL was open to either importing refined oil or oilseeds if it made economic sense. The cost of a refinery and a seed crushing plant was estimated at `1.5 billion.3
table A6.1 Sales of Leading edible oil Companies (` crore)
Industries 1995–1996 1996–1997 1997–1998 1998–1999
Ruchi Soya Industries 347.03 499.54 703.5 1210.21
ITC Agro-Tech 364.36 552.36 562.94 851.78
Marico Industries 309.37 393.12 468.15 521.69
Godrej Foods 140.88 217.25 233.56 399.96
Madhya Pradesh Glychem Inds.
116.99 129.41 119.40 354.08
K.S. Oils 140.20 90.30 141.08 246.50
Vippy Industries 96.12 124.05 157.76 211.81
Navcom Industries 187.5 167.15 186.70 186.7
N.K. Industries 110.79 189.95 182.99 182.99
Jayant Vegoils and Chemicals
– – 151.24 181.05
Chawla Brothers – – 90.21 132.42
Vimal Oils and Foods 81.45 110.41 111.70 111.70
Sarvottam Industries 29.84 65.04 109.42 109.42
Rishi Oil and Fats 67.75 82.25 105.00 105.00
S.M. Dyechem 64.53 37.39 44.57 99.37
Surya Agroils 96.53 72.89 91.54 91.54
Gujarat Ambuja Exports 13.40 22.05 76.76 91.41
Amrit Enterprises 21.44 21.44 40.16 89.37
Amrit Banaspati 54.61 64.35 68.30 86.37
Prestige Foods 91.78 57.31 89.70 79.92
Source: CMIE Database, August 2000.
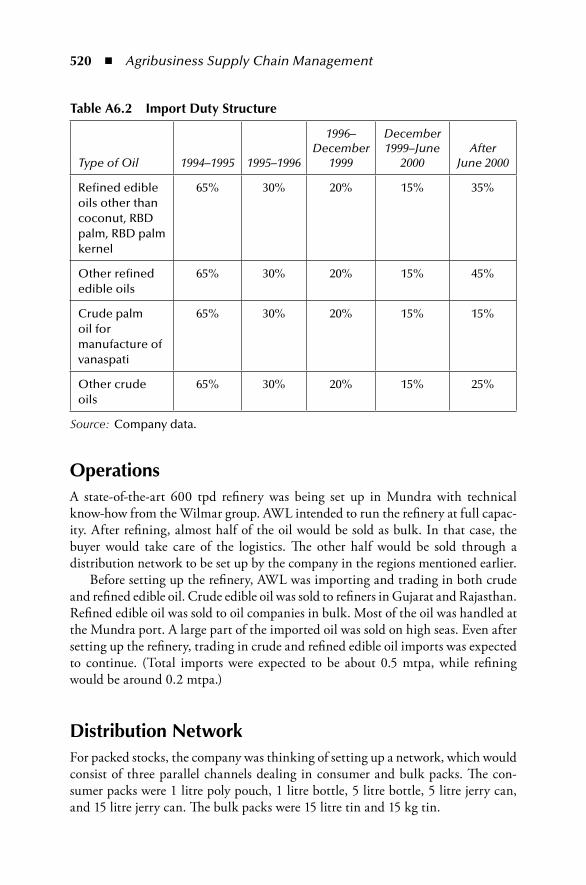
520 ◾ Agribusiness Supply Chain Management
operationsA state-of-the-art 600 tpd refinery was being set up in Mundra with technical know-how from the Wilmar group. AWL intended to run the refinery at full capac-ity. After refining, almost half of the oil would be sold as bulk. In that case, the buyer would take care of the logistics. The other half would be sold through a distribution network to be set up by the company in the regions mentioned earlier.
Before setting up the refinery, AWL was importing and trading in both crude and refined edible oil. Crude edible oil was sold to refiners in Gujarat and Rajasthan. Refined edible oil was sold to oil companies in bulk. Most of the oil was handled at the Mundra port. A large part of the imported oil was sold on high seas. Even after setting up the refinery, trading in crude and refined edible oil imports was expected to continue. (Total imports were expected to be about 0.5 mtpa, while refining would be around 0.2 mtpa.)
Distribution networkFor packed stocks, the company was thinking of setting up a network, which would consist of three parallel channels dealing in consumer and bulk packs. The con-sumer packs were 1 litre poly pouch, 1 litre bottle, 5 litre bottle, 5 litre jerry can, and 15 litre jerry can. The bulk packs were 15 litre tin and 15 kg tin.
table A6.2 import Duty Structure
Type of Oil 1994–1995 1995–1996
1996–December
1999
December 1999–June
2000After
June 2000
Refined edible oils other than coconut, RBD palm, RBD palm kernel
65% 30% 20% 15% 35%
Other refined edible oils
65% 30% 20% 15% 45%
Crude palm oil for manufacture of vanaspati
65% 30% 20% 15% 15%
Other crude oils
65% 30% 20% 15% 25%
Source: Company data.
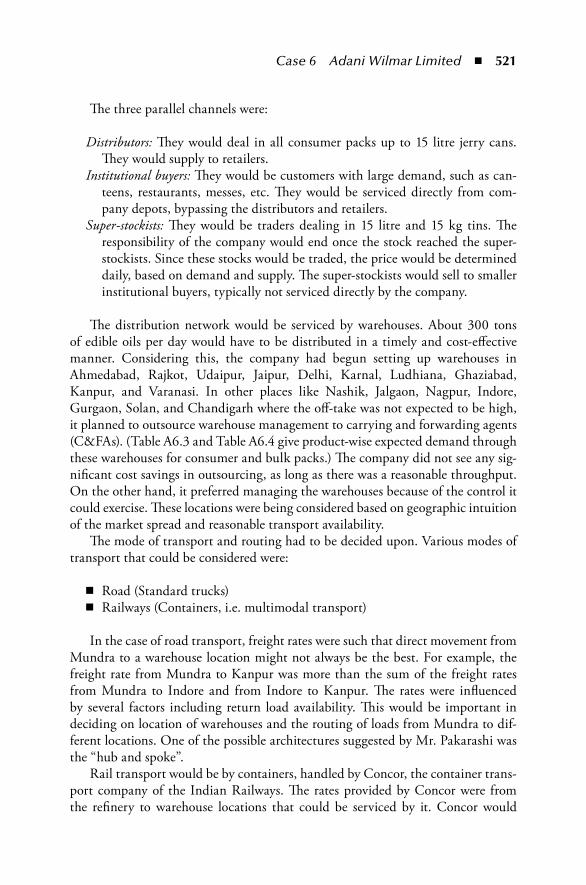
Case 6 Adani Wilmar Limited ◾ 521
The three parallel channels were:
Distributors: They would deal in all consumer packs up to 15 litre jerry cans. They would supply to retailers.
Institutional buyers: They would be customers with large demand, such as can-teens, restaurants, messes, etc. They would be serviced directly from com-pany depots, bypassing the distributors and retailers.
Super-stockists: They would be traders dealing in 15 litre and 15 kg tins. The responsibility of the company would end once the stock reached the super-stockists. Since these stocks would be traded, the price would be determined daily, based on demand and supply. The super-stockists would sell to smaller institutional buyers, typically not serviced directly by the company.
The distribution network would be serviced by warehouses. About 300 tons of edible oils per day would have to be distributed in a timely and cost-effective manner. Considering this, the company had begun setting up warehouses in Ahmedabad, Rajkot, Udaipur, Jaipur, Delhi, Karnal, Ludhiana, Ghaziabad, Kanpur, and Varanasi. In other places like Nashik, Jalgaon, Nagpur, Indore, Gurgaon, Solan, and Chandigarh where the off-take was not expected to be high, it planned to outsource warehouse management to carrying and forwarding agents (C&FAs). (Table A6.3 and Table A6.4 give product-wise expected demand through these warehouses for consumer and bulk packs.) The company did not see any sig-nificant cost savings in outsourcing, as long as there was a reasonable throughput. On the other hand, it preferred managing the warehouses because of the control it could exercise. These locations were being considered based on geographic intuition of the market spread and reasonable transport availability.
The mode of transport and routing had to be decided upon. Various modes of transport that could be considered were:
◾ Road (Standard trucks) ◾ Railways (Containers, i.e. multimodal transport)
In the case of road transport, freight rates were such that direct movement from Mundra to a warehouse location might not always be the best. For example, the freight rate from Mundra to Kanpur was more than the sum of the freight rates from Mundra to Indore and from Indore to Kanpur. The rates were influenced by several factors including return load availability. This would be important in deciding on location of warehouses and the routing of loads from Mundra to dif-ferent locations. One of the possible architectures suggested by Mr. Pakarashi was the “hub and spoke”.
Rail transport would be by containers, handled by Concor, the container trans-port company of the Indian Railways. The rates provided by Concor were from the refinery to warehouse locations that could be serviced by it. Concor would
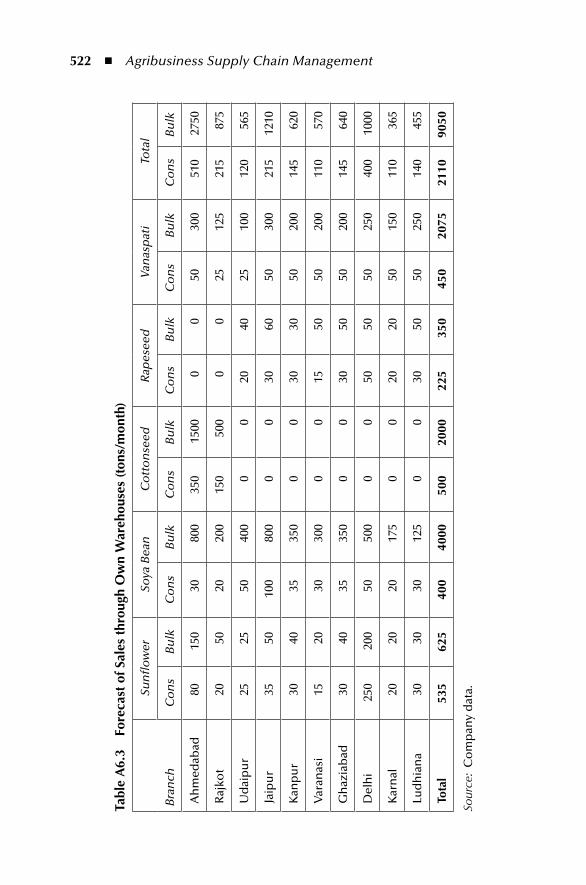
522 ◾ Agribusiness Supply Chain Management
tabl
e A
6.3
Fore
cast
of S
ales
thr
ough
ow
n W
areh
ouse
s (t
ons/
mon
th)
Bra
nch
Sun
flo
wer
Soya
Bea
nC
ott
on
seed
Rap
esee
dVa
nas
pat
iTo
tal
Co
ns
Bu
lkC
on
sB
ulk
Co
ns
Bu
lkC
on
sB
ulk
Co
ns
Bu
lkC
on
sB
ulk
Ah
med
abad
8015
030
800
350
1500
00
5030
051
027
50
Raj
kot
2050
2020
015
050
00
025
125
215
875
Ud
aip
ur
2525
5040
00
020
4025
100
120
565
Jaip
ur
3550
100
800
00
3060
5030
021
512
10
Kan
pu
r30
4035
350
00
3030
5020
014
562
0
Var
anas
i15
2030
300
00
1550
5020
011
057
0
Gh
azia
bad
3040
3535
00
030
5050
200
145
640
Del
hi
250
200
5050
00
050
5050
250
400
1000
Kar
nal
2020
2017
50
020
2050
150
110
365
Lud
hia
na
3030
3012
50
030
5050
250
140
455
tota
l53
562
540
040
0050
020
0022
535
045
020
7521
1090
50
Sour
ce: C
om
pan
y d
ata.
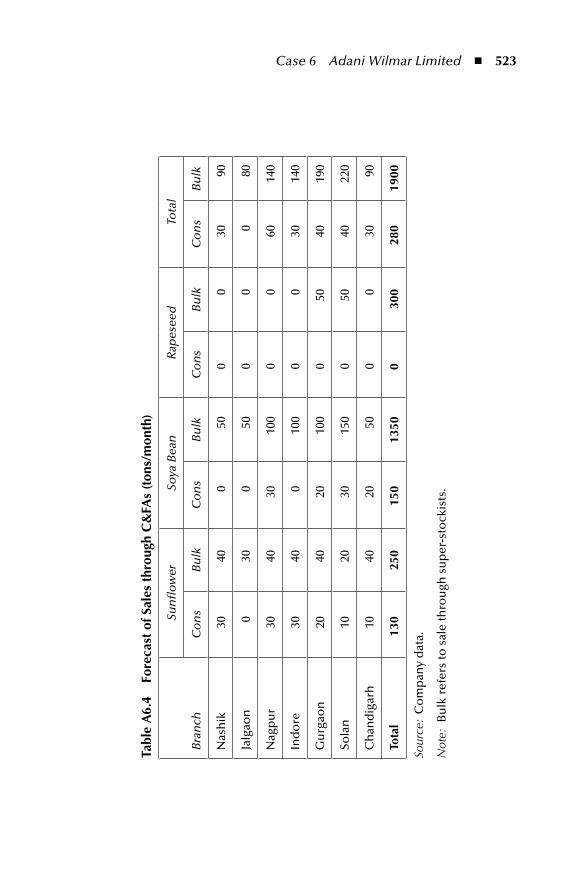
Case 6 Adani Wilmar Limited ◾ 523
tabl
e A
6.4
Fore
cast
of S
ales
thr
ough
C&
FAs
(ton
s/m
onth
)
Bra
nch
Sun
flo
wer
Soya
Bea
nR
apes
eed
Tota
l
Co
ns
Bu
lkC
on
sB
ulk
Co
ns
Bu
lkC
on
sB
ulk
Nas
hik
3040
050
00
3090
Jalg
aon
030
050
00
080
Nag
pu
r30
4030
100
00
6014
0
Ind
ore
3040
010
00
030
140
Gu
rgao
n20
4020
100
050
4019
0
Sola
n10
2030
150
050
4022
0
Ch
and
igar
h10
4020
500
030
90
tota
l13
025
015
013
500
300
280
1900
Sour
ce:
Co
mp
any
dat
a.
Not
e: B
ulk
ref
ers
to s
ale
thro
ugh
su
per
-sto
ckis
ts.
524 ◾ Agribusiness Supply Chain Management
probably move the containers by road from Mundra to the inland container depots in Kandla or Ahmedabad and then dispatch them as part of a trainload to the warehouses. However, there was some uncertainty as to from when Concor would be able to offer its service.
Apart from timeliness and cost, transit losses would inf luence mode choice and route. Transit losses could occur wherever there was direct handling of the packs. The company had experienced losses of about 0.1 per cent in handling, especially if the work was not properly supervised. The average selling price would be about `30/litre.
To understand the trade-offs and implications of some of the choices in the distribution network, Pakarashi decided to do an analysis of the UP market.
Distribution in upThe UP market was the second largest in size for AWL, after Gujarat. The total monthly offtake was expected to be about 2200 tons. The district-wise demand forecast along with dealer locations is given in Table A6.5. To service these dealers, seven potential warehouse locations were considered. Keeping in view service time considerations for the secondary movement, dealers to be serviced by a warehouse were restricted to a distance of 500 km. Table A6.6 gives dealer locations, which could be serviced by a warehouse, along with distances. The secondary transpor-tation cost along with other elements of the logistics cost is given in Table A6.7. Figure A6.1 gives a map of UP showing the potential warehouse locations and districts. The transportation cost from Mundra to various warehouse locations (including those in UP), from other warehouse locations to those in UP, and by container movement through Concor are given in Table A6.8. Given the remote-ness of Mundra and the nature of truck transport markets, direct road transport from Mundra to warehouses was not always the cheapest. Ahmedabad and Indore were more active markets. If the transportation would be through these two cit-ies, Mr. Pakarashi anticipated some additional costs in handling and coordination. Figure A6.2 gives a map of India showing Mundra and warehouse locations of interest.
Mr. Pakrashi needed to select warehouse locations out of the seven proposed, and assign dealers to warehouses. It would also be important to ensure that there were no imbalances in the workload of the warehouses, if they were to be man-aged by the company. Smaller volume warehouses could be candidates for out-sourcing to C&FAs. He also needed to decide on mode choice and routing from Mundra.
AWL was open to postponing the packing to locations closer to demand points. While this would enable better servicing of demand, the refined oil would need to be transported in tankers, which had a higher freight rate. Currently, the packing facility was to be located in the refinery itself.
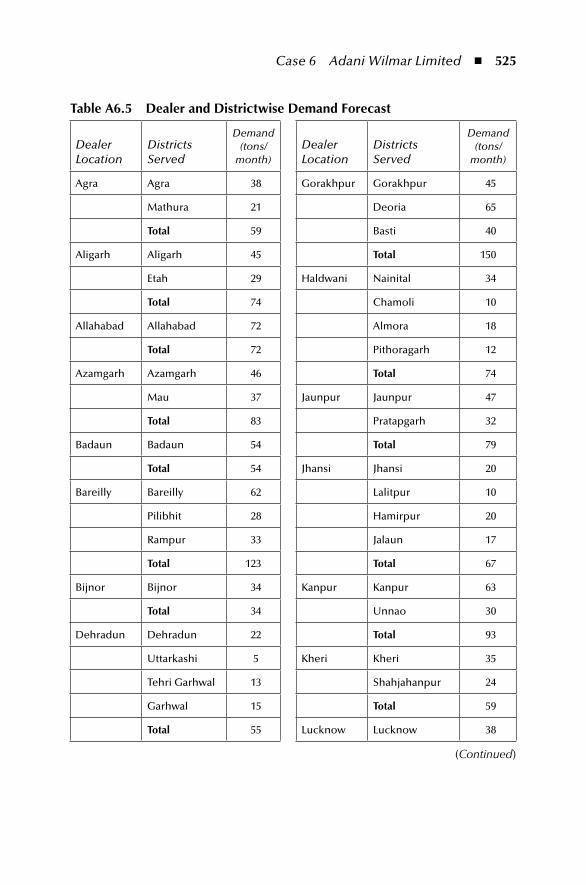
Case 6 Adani Wilmar Limited ◾ 525
table A6.5 Dealer and Districtwise Demand Forecast
DealerLocation
DistrictsServed
Demand (tons/
month)DealerLocation
DistrictsServed
Demand (tons/
month)
Agra Agra 38 Gorakhpur Gorakhpur 45
Mathura 21 Deoria 65
total 59 Basti 40
Aligarh Aligarh 45 total 150
Etah 29 Haldwani Nainital 34
total 74 Chamoli 10
Allahabad Allahabad 72 Almora 18
total 72 Pithoragarh 12
Azamgarh Azamgarh 46 total 74
Mau 37 Jaunpur Jaunpur 47
total 83 Pratapgarh 32
Badaun Badaun 54 total 79
total 54 Jhansi Jhansi 20
Bareilly Bareilly 62 Lalitpur 10
Pilibhit 28 Hamirpur 20
Rampur 33 Jalaun 17
total 123 total 67
Bijnor Bijnor 34 Kanpur Kanpur 63
total 34 Unnao 30
Dehradun Dehradun 22 total 93
Uttarkashi 5 Kheri Kheri 35
Tehri Garhwal 13 Shahjahanpur 24
Garhwal 15 total 59
total 55 Lucknow Lucknow 38
(Continued)
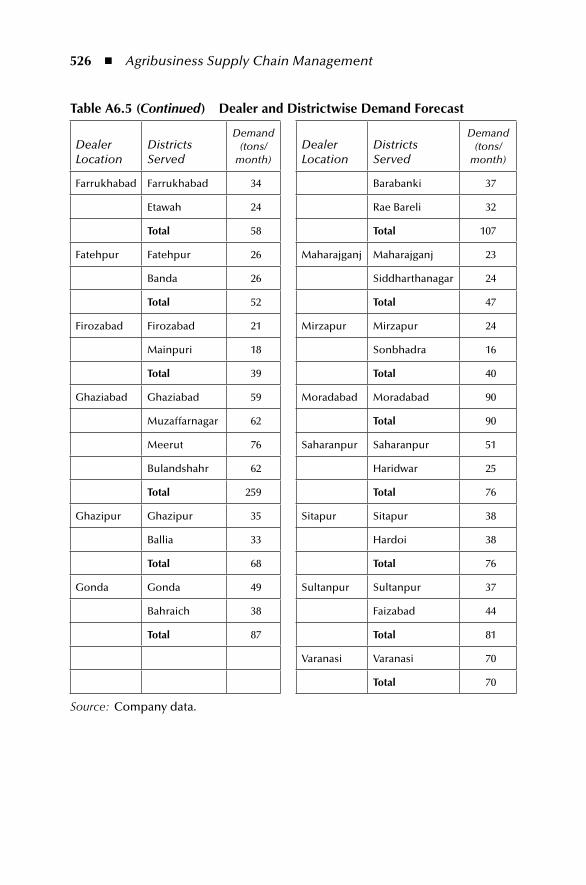
526 ◾ Agribusiness Supply Chain Management
table A6.5 (Continued) Dealer and Districtwise Demand Forecast
DealerLocation
DistrictsServed
Demand (tons/
month)DealerLocation
DistrictsServed
Demand (tons/
month)
Farrukhabad Farrukhabad 34 Barabanki 37
Etawah 24 Rae Bareli 32
total 58 total 107
Fatehpur Fatehpur 26 Maharajganj Maharajganj 23
Banda 26 Siddharthanagar 24
total 52 total 47
Firozabad Firozabad 21 Mirzapur Mirzapur 24
Mainpuri 18 Sonbhadra 16
total 39 total 40
Ghaziabad Ghaziabad 59 Moradabad Moradabad 90
Muzaffarnagar 62 total 90
Meerut 76 Saharanpur Saharanpur 51
Bulandshahr 62 Haridwar 25
total 259 total 76
Ghazipur Ghazipur 35 Sitapur Sitapur 38
Ballia 33 Hardoi 38
total 68 total 76
Gonda Gonda 49 Sultanpur Sultanpur 37
Bahraich 38 Faizabad 44
total 87 total 81
Varanasi Varanasi 70
total 70
Source: Company data.
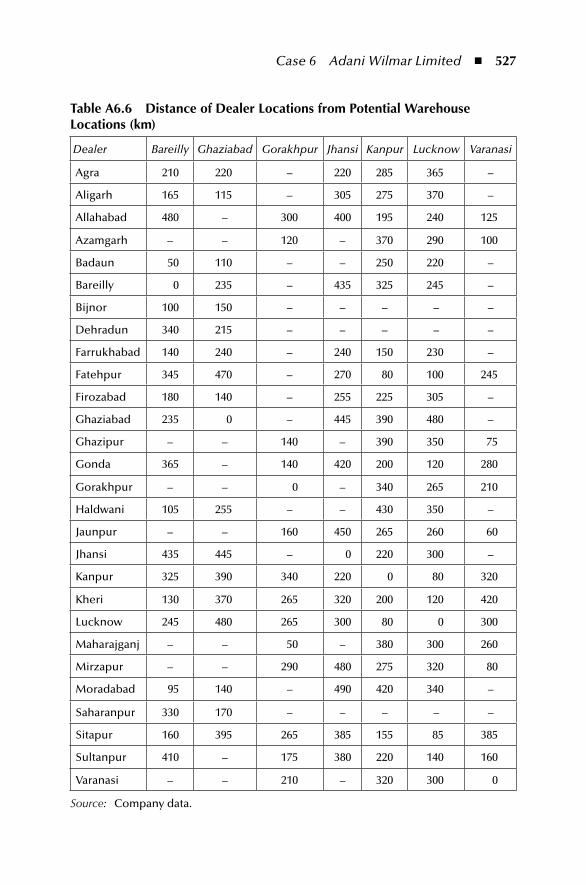
Case 6 Adani Wilmar Limited ◾ 527
table A6.6 Distance of Dealer Locations from potential Warehouse Locations (km)
Dealer Bareilly Ghaziabad Gorakhpur Jhansi Kanpur Lucknow Varanasi
Agra 210 220 – 220 285 365 –
Aligarh 165 115 – 305 275 370 –
Allahabad 480 – 300 400 195 240 125
Azamgarh – – 120 – 370 290 100
Badaun 50 110 – – 250 220 –
Bareilly 0 235 – 435 325 245 –
Bijnor 100 150 – – – – –
Dehradun 340 215 – – – – –
Farrukhabad 140 240 – 240 150 230 –
Fatehpur 345 470 – 270 80 100 245
Firozabad 180 140 – 255 225 305 –
Ghaziabad 235 0 – 445 390 480 –
Ghazipur – – 140 – 390 350 75
Gonda 365 – 140 420 200 120 280
Gorakhpur – – 0 – 340 265 210
Haldwani 105 255 – – 430 350 –
Jaunpur – – 160 450 265 260 60
Jhansi 435 445 – 0 220 300 –
Kanpur 325 390 340 220 0 80 320
Kheri 130 370 265 320 200 120 420
Lucknow 245 480 265 300 80 0 300
Maharajganj – – 50 – 380 300 260
Mirzapur – – 290 480 275 320 80
Moradabad 95 140 – 490 420 340 –
Saharanpur 330 170 – – – – –
Sitapur 160 395 265 385 155 85 385
Sultanpur 410 – 175 380 220 140 160
Varanasi – – 210 – 320 300 0
Source: Company data.
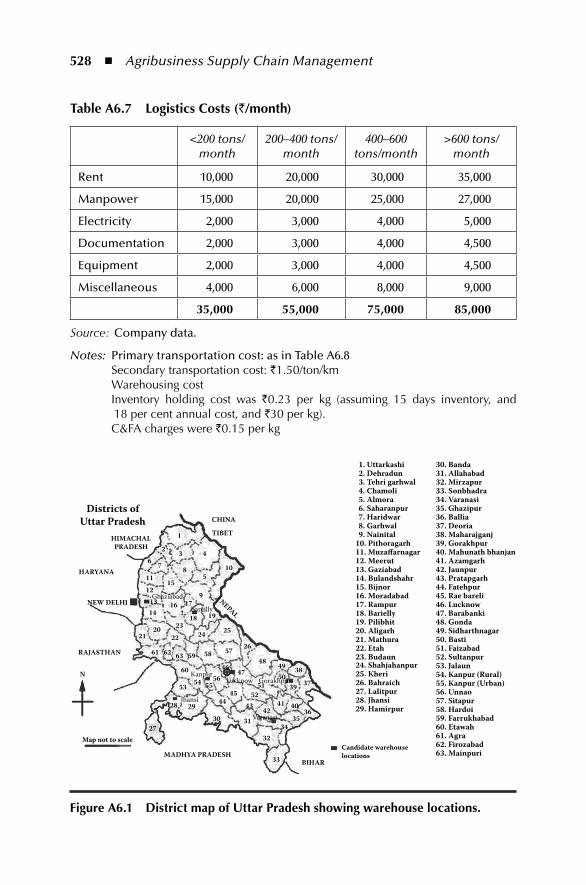
528 ◾ Agribusiness Supply Chain Management
table A6.7 Logistics Costs (`/month)
<200 tons/month
200–400 tons/month
400–600 tons/month
>600 tons/month
Rent 10,000 20,000 30,000 35,000
Manpower 15,000 20,000 25,000 27,000
Electricity 2,000 3,000 4,000 5,000
Documentation 2,000 3,000 4,000 4,500
Equipment 2,000 3,000 4,000 4,500
Miscellaneous 4,000 6,000 8,000 9,000
35,000 55,000 75,000 85,000
Source: Company data.
Notes: Primary transportation cost: as in Table A6.8 Secondary transportation cost: `1.50/ton/km Warehousing cost Inventory holding cost was `0.23 per kg (assuming 15 days inventory, and
18 per cent annual cost, and `30 per kg). C&FA charges were `0.15 per kg
Districts ofUttar Pradesh CHINA
TIBET
NEPAL
HIMACHALPRADESH
1. Uttarkashi2. Dehradun3. Tehri garhwal4. Chamoli5. Almora6. Saharanpur7. Haridwar8. Garhwal9. Nainital
10. Pithoragarh11. Muza�arnagar12. Meerut13. Gaziabad14. Bulandshahr15. Bijnor16. Moradabad17. Rampur18. Barielly19. Pilibhit20. Aligarh21. Mathura22. Etah23. Budaun24. Shahjahanpur25. Kheri26. Bahraich27. Lalitpur28. Jhansi29. Hamirpur
30. Banda31. Allahabad32. Mirzapur33. Sonbhadra34. Varanasi35. Ghazipur36. Ballia37. Deoria38. Maharajganj39. Gorakhpur40. Mahunath bhanjan41. Azamgarh42. Jaunpur43. Pratapgarh44. Fatehpur45. Rae bareli46. Lucknow47. Barabanki48. Gonda49. Sidharthnagar50. Basti51. Faizabad52. Sultanpur53. Jalaun54. Kanpur (Rural)55. Kanpur (Urban)56. Unnao57. Sitapur58. Hardoi59. Farrukhabad60. Etawah61. Agra62. Firozabad63. Mainpuri
Map not to scaleCandidate warehouselocations
1
2 3 4
5
6 7 8
9
101112
1314
15
Ghaziabad
Bareilly
Kanpur
Jhansi
Lucknow Gorakhpur
Varanasi
16 17
18 19
2021 22
2324 25
26
28 2930 31
32
33
3435
36
37
38
39
4041424344
45
46 4748
4950
5152
5354 55
56
575859
60
61 62 63
HARYANA
NEW DELHI
RAJASTHAN
N
MADHYA PRADESHBIHAR
27
Figure A6.1 District map of uttar pradesh showing warehouse locations.
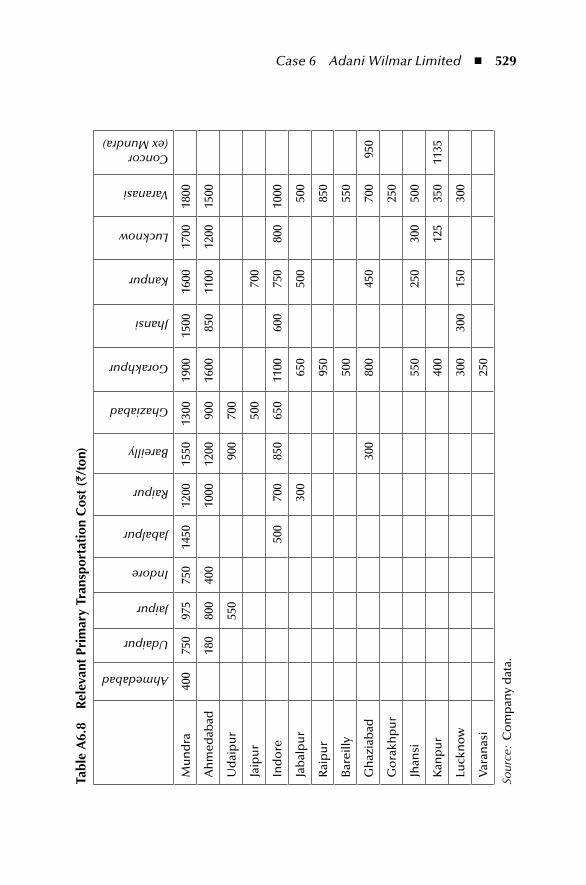
Case 6 Adani Wilmar Limited ◾ 529
tabl
e A
6.8
rel
evan
t pr
imar
y tr
ansp
orta
tion
Cos
t (`
/ton
)
Ahmedabad
Udaipur
Jaipur
Indore
Jabalpur
Raipur
Bareilly
Ghaziabad
Gorakhpur
Jhansi
Kanpur
Lucknow
Varanasi
Concor(ex Mundra)
Mu
nd
ra40
075
097
575
014
5012
0015
5013
0019
0015
0016
0017
0018
00
Ah
med
abad
180
800
400
1000
1200
900
1600
850
1100
1200
1500
Ud
aip
ur
550
900
700
Jaip
ur
500
700
Ind
ore
500
700
850
650
1100
600
750
800
1000
Jab
alp
ur
300
650
500
500
Rai
pu
r95
085
0
Bar
eilly
500
550
Gh
azia
bad
300
800
450
700
950
Go
rakh
pu
r25
0
Jhan
si55
025
030
050
0
Kan
pu
r40
012
535
011
35
Luck
no
w30
030
015
030
0
Var
anas
i25
0
Sour
ce:
Co
mp
any
dat
a.
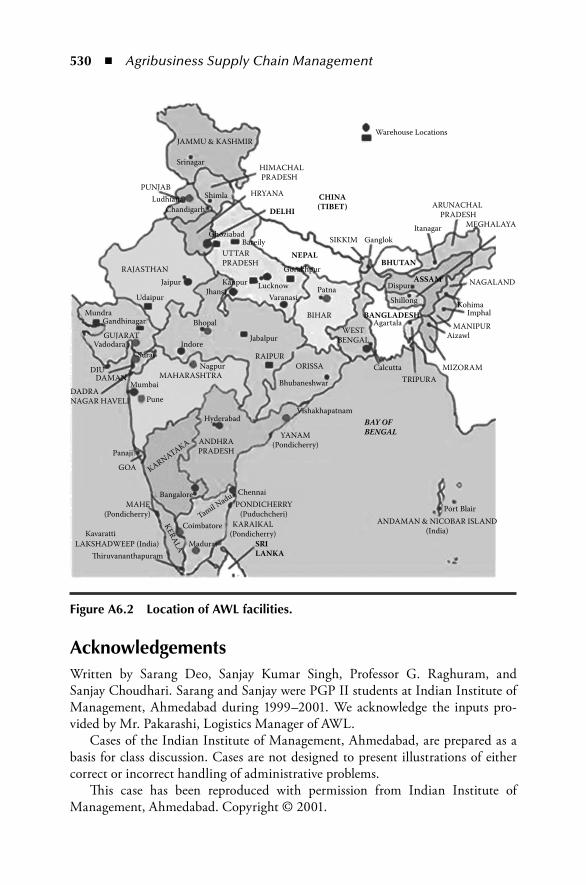
530 ◾ Agribusiness Supply Chain Management
AcknowledgementsWritten by Sarang Deo, Sanjay Kumar Singh, Professor G. Raghuram, and Sanjay Choudhari. Sarang and Sanjay were PGP II students at Indian Institute of Management, Ahmedabad during 1999–2001. We acknowledge the inputs pro-vided by Mr. Pakarashi, Logistics Manager of AWL.
Cases of the Indian Institute of Management, Ahmedabad, are prepared as a basis for class discussion. Cases are not designed to present illustrations of either correct or incorrect handling of administrative problems.
This case has been reproduced with permission from Indian Institute of Management, Ahmedabad. Copyright © 2001.
HIMACHAL PRADESH
ARUNACHAL PRADESH
MEGHALAYA
JAMMU & KASHMIR
UTTARPRADESH
HRYANA
SIKKIM Ganglok
Warehouse Locations
Itanagar
NAGALAND
Kohima
Dispur
ShillongImphal
MANIPURAizawl
PUNJAB
RAJASTHAN
MAHARASHTRA
ANDHRAPRADESH
Madurai
PONDICHERRY(Puduchcheri)
KARAIKAL(Pondicherry)
YANAM(Pondicherry)
KARNATAKA
GUJARAT
Jaipur
Udaipur
SuratIndore
Bhopal
Jabalpur
Bhubaneshwar
CalcuttaNagpur
MundraGandhinagar
Mumbai
Pune
KavarattiCoimbatore
Tamil Nadu
LAKSHADWEEP (India)�iruvananthapuram
KERALA
GOA
MAHE
Panaji
(Pondicherry)
Bangalore Chennai
Hyderabad
Port Blair
Vadodara
DIUDAMAN
DADRANAGAR HAVELI
Ludhiana
Srinagar
Shimla
Chandigarh
Ghoziabad
Kanpur
VaranasiLucknow Patna
AgartalaBIHAR
WESTBENGAL
RAIPUR
TRIPURAMIZORAMORISSA
Vishakhapatnam
ANDAMAN & NICOBAR ISLAND(India)
Gorakhpur
Jhansi
Bareily
DELHI
NEPALBHUTAN
BANGLADESH
ASSAM
SRILANKA
BAY OFBENGAL
CHINA(TIBET)
Figure A6.2 Location of AWL facilities.

Case 6 Adani Wilmar Limited ◾ 531
notes 1. Source: www.indiancommodities.com 2. Rakesh Jain, “Background Paper on the Edible Oil Industry in India,” www.
madhyabharat.com/sopa/theme. 3. www.expressindia.com, accessed on January 25, 2000.

This page intentionally left blankThis page intentionally left blank
533
Case 7 Woolworths Limited, Australia
It was December 2001. The Supply Chain Executive Team (SCET) of Woolworths Limited was called for an important meeting. This meeting was headed by the General Manager, Supply Chain, Michael Luscombe. The main focus was on Project Refresh, which had commenced in August 1999 and was being driven by this team. This project was a plan to ‘renew and reinvigorate’ the company, lever-aging initiatives in the supply chain. Since the commencement of Project Refresh, sales had improved by $2 billion and stripped $0.5 billion from Woolworth’s costs. Luscombe and his team members were pleased with these numbers. Most of the benefits were expected to come from the Supermarkets Division, which accounted for about 85% of the revenues.
The SCET reported to the Supermarkets Executive Team and also the Corporate Support Group. It also had to coordinate with the Supermarket Buying and Marketing Team. Table A7.1 gives the composition of these groups and teams. It also provides an insight into the different roles held by the Senior Management Team (related to supermarkets) over the recent five years.
A brief description of Project Refresh is given in Box A7.1, with excerpts from the company’s annual reports of 1999, 2000 and 2001. The project was envisaged as a three level initiative, with increasing sophistication, to yield an expected sav-ings of over $9 billion over 9 years, starting 1999. The initial success of Project Refresh made Luscombe and his team optimistic about advancing to level 2 initia-tives. They also decided to rechristen this initiative as Project Mercury, with an increased focus on the end-to-end supply chain and information technology (IT). The team was keen on identifying business process outsourcing (BPO) partners for this initiative. Appendix 7.1 give an overview and significant details of the project, as would be relevant for a BPO partner to work with the company.
One of the most important decisions being considered by SCET was the restruc-turing of the Distribution Centre (DC) network. Woolworths was operating 31 DCs
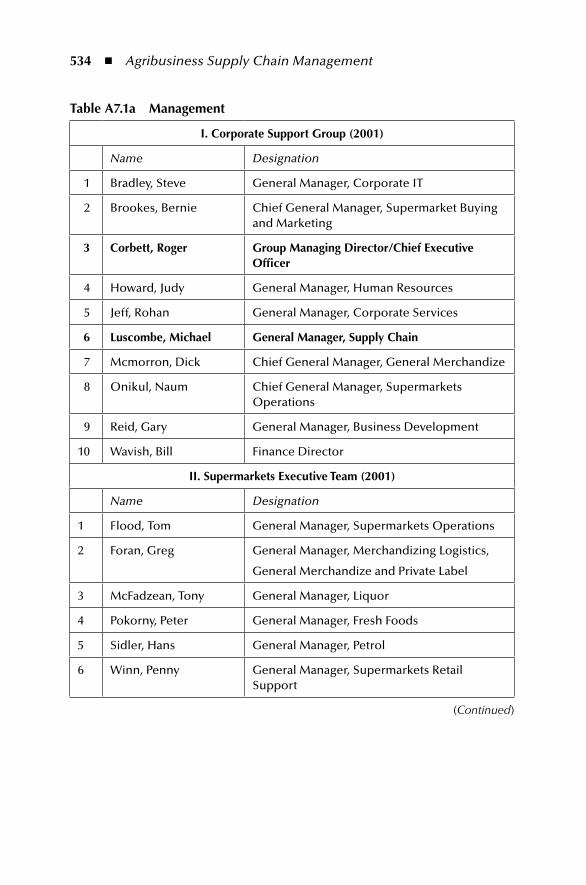
534 ◾ Agribusiness Supply Chain Management
table A7.1a management
i. Corporate Support Group (2001)
Name Designation
1 Bradley, Steve General Manager, Corporate IT
2 Brookes, Bernie Chief General Manager, Supermarket Buying and Marketing
3 Corbett, roger Group managing Director/Chief executive officer
4 Howard, Judy General Manager, Human Resources
5 Jeff, Rohan General Manager, Corporate Services
6 Luscombe, michael General manager, Supply Chain
7 Mcmorron, Dick Chief General Manager, General Merchandize
8 Onikul, Naum Chief General Manager, Supermarkets Operations
9 Reid, Gary General Manager, Business Development
10 Wavish, Bill Finance Director
ii. Supermarkets executive team (2001)
Name Designation
1 Flood, Tom General Manager, Supermarkets Operations
2 Foran, Greg General Manager, Merchandizing Logistics,
General Merchandize and Private Label
3 McFadzean, Tony General Manager, Liquor
4 Pokorny, Peter General Manager, Fresh Foods
5 Sidler, Hans General Manager, Petrol
6 Winn, Penny General Manager, Supermarkets Retail Support
(Continued)
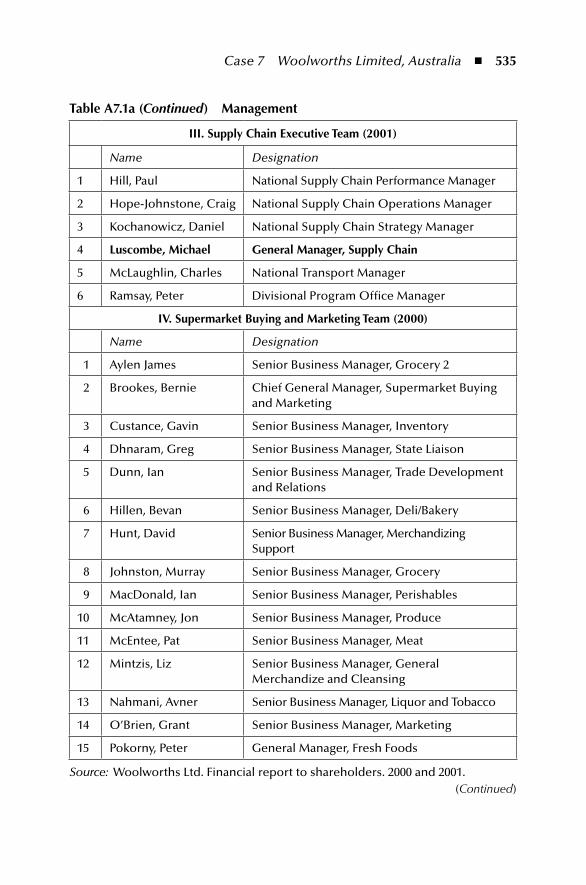
Case 7 Woolworths Limited, Australia ◾ 535
table A7.1a (Continued) management
iii. Supply Chain executive team (2001)
Name Designation
1 Hill, Paul National Supply Chain Performance Manager
2 Hope-Johnstone, Craig National Supply Chain Operations Manager
3 Kochanowicz, Daniel National Supply Chain Strategy Manager
4 Luscombe, michael General manager, Supply Chain
5 McLaughlin, Charles National Transport Manager
6 Ramsay, Peter Divisional Program Office Manager
iV. Supermarket Buying and marketing team (2000)
Name Designation
1 Aylen James Senior Business Manager, Grocery 2
2 Brookes, Bernie Chief General Manager, Supermarket Buying and Marketing
3 Custance, Gavin Senior Business Manager, Inventory
4 Dhnaram, Greg Senior Business Manager, State Liaison
5 Dunn, Ian Senior Business Manager, Trade Development and Relations
6 Hillen, Bevan Senior Business Manager, Deli/Bakery
7 Hunt, David Senior Business Manager, Merchandizing Support
8 Johnston, Murray Senior Business Manager, Grocery
9 MacDonald, Ian Senior Business Manager, Perishables
10 McAtamney, Jon Senior Business Manager, Produce
11 McEntee, Pat Senior Business Manager, Meat
12 Mintzis, Liz Senior Business Manager, General Merchandize and Cleansing
13 Nahmani, Avner Senior Business Manager, Liquor and Tobacco
14 O’Brien, Grant Senior Business Manager, Marketing
15 Pokorny, Peter General Manager, Fresh Foods
Source: Woolworths Ltd. Financial report to shareholders. 2000 and 2001.(Continued)
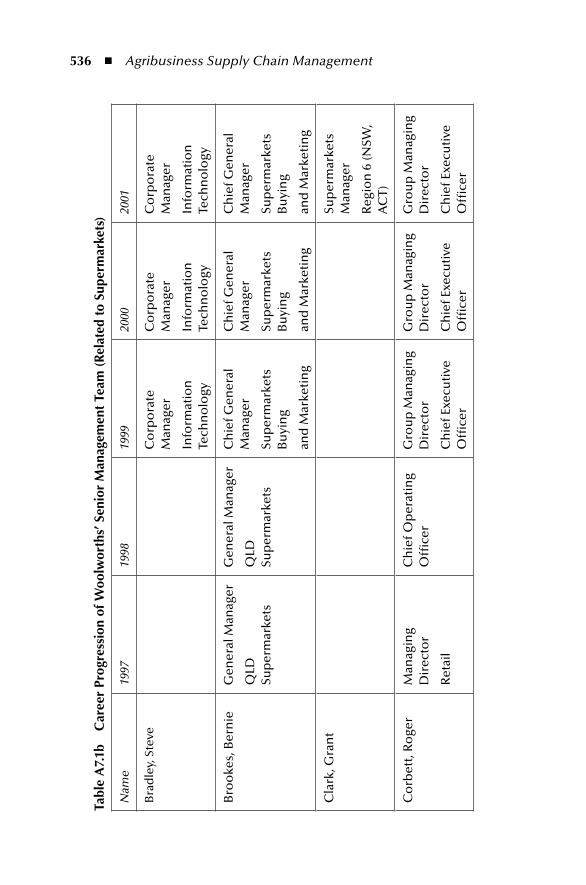
536 ◾ Agribusiness Supply Chain Management
tabl
e A
7.1b
C
aree
r pr
ogre
ssio
n of
Woo
lwor
ths’
Sen
ior
man
agem
ent
team
(r
elat
ed t
o Su
perm
arke
ts)
Nam
e 19
9719
9819
9920
0020
01
Bra
dle
y, S
teve
Co
rpo
rate
M
anag
er
Info
rmat
ion
Te
chn
olo
gy
Co
rpo
rate
M
anag
er
Info
rmat
ion
Te
chn
olo
gy
Co
rpo
rate
M
anag
er
Info
rmat
ion
Te
chn
olo
gy
Bro
oke
s, B
ern
ieG
ener
al M
anag
er
QLD
Su
per
mar
kets
Gen
eral
Man
ager
QLD
Su
per
mar
kets
Ch
ief G
ener
al
Man
ager
Sup
erm
arke
ts
Bu
yin
g
and
Mar
keti
ng
Ch
ief G
ener
al
Man
ager
Sup
erm
arke
ts
Bu
yin
g
and
Mar
keti
ng
Ch
ief G
ener
al
Man
ager
Sup
erm
arke
ts
Bu
yin
g
and
Mar
keti
ng
Cla
rk, G
ran
tSu
per
mar
kets
M
anag
er
Reg
ion
6 (N
SW,
AC
T)
Co
rbet
t, R
oge
rM
anag
ing
Dir
ecto
r
Ret
ail
Ch
ief O
per
atin
g O
ffice
rG
rou
p M
anag
ing
Dir
ecto
r
Ch
ief E
xecu
tive
O
ffice
r
Gro
up
Man
agin
g D
irec
tor
Ch
ief E
xecu
tive
O
ffice
r
Gro
up
Man
agin
g D
irec
tor
Ch
ief E
xecu
tive
O
ffice
r
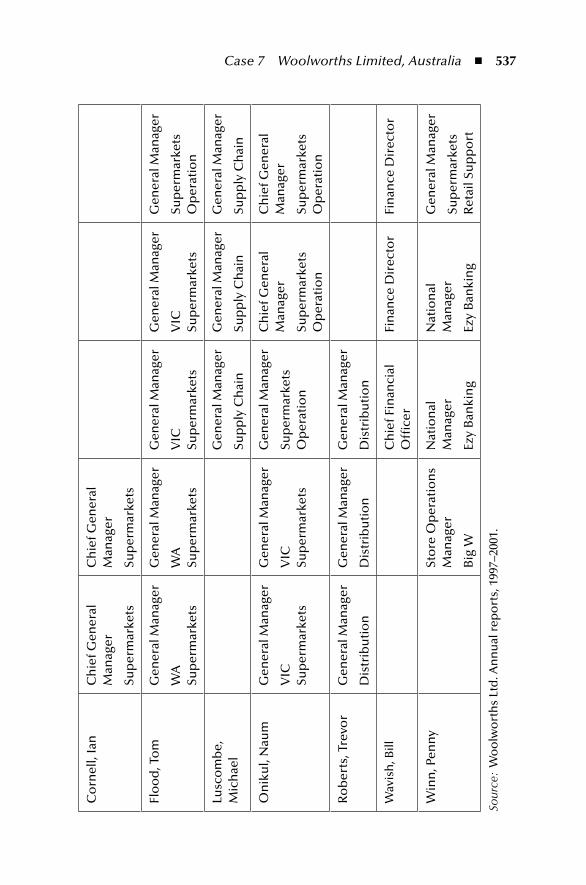
Case 7 Woolworths Limited, Australia ◾ 537
Co
rnel
l, Ia
nC
hie
f Gen
eral
M
anag
er
Sup
erm
arke
ts
Ch
ief G
ener
al
Man
ager
Sup
erm
arke
ts
Flo
od
, To
mG
ener
al M
anag
er
WA
Su
per
mar
kets
Gen
eral
Man
ager
WA
Su
per
mar
kets
Gen
eral
Man
ager
VIC
Su
per
mar
kets
Gen
eral
Man
ager
VIC
Su
per
mar
kets
Gen
eral
Man
ager
Sup
erm
arke
ts
Op
erat
ion
Lusc
om
be,
M
ich
ael
Gen
eral
Man
ager
Sup
ply
Ch
ain
Gen
eral
Man
ager
Sup
ply
Ch
ain
Gen
eral
Man
ager
Sup
ply
Ch
ain
On
iku
l, N
aum
Gen
eral
Man
ager
VIC
Su
per
mar
kets
Gen
eral
Man
ager
VIC
Su
per
mar
kets
Gen
eral
Man
ager
Sup
erm
arke
ts
Op
erat
ion
Ch
ief G
ener
al
Man
ager
Sup
erm
arke
ts
Op
erat
ion
Ch
ief G
ener
al
Man
ager
Sup
erm
arke
ts
Op
erat
ion
Ro
ber
ts, T
revo
rG
ener
al M
anag
er
Dis
trib
uti
on
Gen
eral
Man
ager
Dis
trib
uti
on
Gen
eral
Man
ager
Dis
trib
uti
on
Wav
ish
, Bill
Ch
ief F
inan
cial
O
ffice
rFi
nan
ce D
irec
tor
Fin
ance
Dir
ecto
r
Win
n, P
enn
ySt
ore
Op
erat
ion
s M
anag
er
Big
W
Nat
ion
al
Man
ager
Ezy
Ban
kin
g
Nat
ion
al
Man
ager
Ezy
Ban
kin
g
Gen
eral
Man
ager
Sup
erm
arke
ts
Ret
ail S
up
po
rt
Sour
ce:
Wo
olw
ort
hs
Ltd
. An
nu
al r
epo
rts,
199
7–20
01.
538 ◾ Agribusiness Supply Chain Management
bOx A 7.1 PROje CT Re FRe SH
In the 1999 Annual Report (published in October 1999), Chairman, john Dahlsen wrote:In August 1999, we announced Project Refresh, an exciting and important program which identified the developing trends in the retail environment and the need for changes designed to deliver increased customer focus and shareholder wealth.Project Refresh will give management the opportunity to build on the orga-nization’s market position, by a rigorous focus on customer needs, a more responsive management team, better supplier relationships and best practices in cost control, cost measurement and tracking.Critically, Project Refresh will see the divestment of non-core assets and the focusing of attention and funds on the core businesses. It will result in important structural changes and the need to continue the process of review and re-invigo-ration of the organizations’ core value proposition–a Customer Centric Business.
The 2000 Annual Report stated the following:
In August last year, we announced the implementation of Project Refresh. It is a significant and far reaching initiative which covers all aspects of our business as we re-examine everything we do.Whilst the supermarkets’ central Shared Service Buying function is the most recognizable change for our suppliers, Project Refresh also covers supply chain, IT, human resources, organizational redesign and cost of doing busi-ness programmes.The initial benefits will be extended to all areas of our businesses and will become part of our operational and corporate culture. Every effort is being made to achieve our gains without redundancies, by retraining and redeploy-ment. The members of the teams working on Project Refresh are drawn from every state in Australia with around 30 people working on the various initiatives at any one time.
Supermarkets Shared Services
The change to central shared service buying and marketing was the result of a restructure of the business from a state based buying and marketing structure to a single functionally based business. Some of the main building blocks for the new structure–which we have called ‘Shared Services’–were developed by examining best practices in supermarkets operations from around Australia and the world.
(Continued)
Case 7 Woolworths Limited, Australia ◾ 539
bOx A 7.1 (CoNtiNUed) PROje CT Re FRe SH
The new structure replaces a system of six state buying and marketing opera-tions and enables us to buy most products centrally, while still maintaining state buying in some fresh foods categories. It has the capacity to consider-ably increase efficiency, eliminate duplication, improve supplier relations and drive supply chain economies.The new shared services function allows us to buy more effectively, to offer more consistent quality fresh food and increase value through better buying and reduced pricing. Our decisions will also be better informed because of the establishment of cross-functional teams, made up of people with experi-ence in buying, marketing, stock control and store management. The new structure will further encourage a strong service culture, enabling business managers to provide quicker service and better support to store managers and their teams.
Supply Chain
As the year progressed, the considerable strategic advantages of our major new warehousing and distribution facilities became more apparent. We saw improved in-stock positions, particularly at the Christmas and Easter peak trading periods. Following a comprehensive review of our supply chain man-agement, we have formed a single supply chain structure which applies both technology and logistics as one function for the total company. It is expected that this will bring significant advantages to the company, in stock flow, stock turns and in-stocks. Much more remains to be done in this area and the financial rewards we will generate from a total supply chain management strategy are considerable.
The 2001 Annual Report stated the following:
This far reaching initiative covers all aspects of our business as we examine everything we do with a view to saving costs, increasing sales and improving effectiveness. In particular, the areas of cost savings cover:
◾ Examination of all line item expenses ◾ Improvements to the total supply chain and its over-arching IT ◾ Functional reorganization to a national or shared service basis whilst
increasing regional and in-store empowerment.
(Continued)
540 ◾ Agribusiness Supply Chain Management
bOx A 7.1 (CoNtiNUed) PROje CT Re FRe SH
Earlier this year we announced that we expect annual savings as a result of this initiative to reach $185 million, of which $50 million had been realized. In the global environment which influences all aspects of our business and against which we continuously benchmark ourselves, change and cost saving are perpetual. Initially, as a result of Project Refresh and increasingly as a consequence of continuous change, we now expect annual savings over the next five years to increase to approximately 1% of sales. That is further savings exceeding $200 million per annum.
Supermarkets Buying and Marketing
The Project Refresh changes began in August 1999 with a review of how we conduct our supermarkets buying and operations. This resulted in a deci-sion to change our organizational structure from a divisionally based group of businesses in each state to a single, functionally based business. The first concrete realization of this structural change was effected in June 2000, when supermarkets moved to a national shared service environment for buying and marketing.In line with our objectives of improving the ranging, layout, competitive pric-ing and promotional offer to our customers, this was the first major approach to a centralized management environment in supermarkets. It laid the foun-dation for a streamlined management structure in finance, human resources, operations and supply chain.In its first full year of operations, supermarkets buying and marketing put in place new measures to improve communication throughout stores, including the in-house television programme WOW TV, and Merchant of the Year competitions to encourage competition between store teams to build the best store displays and gain the best incremental sales.
Supplier Relations
The quality of our relationship with our supplier partners is an important ingre-dient in providing a continually improving offer to our customers.Our supplier focus groups that have been run each quarter demonstrate an improving supplier relationship and a genuine focus on sales with our suppliers. Suppliers have been pleased with the consistency and uniformity of our interac-tion. Feedback shows improving supplier relationships with a genuine mutual focus on increasing sales.
(Continued)
Case 7 Woolworths Limited, Australia ◾ 541
bOx A 7.1 (CoNtiNUed) PROje CT Re FRe SH
Later in the year, we will be hosting a dinner to thank our suppliers and present the Suppliers of the Year Awards. These awards provide us with a great opportunity to recognize the outstanding teamwork between Woolworths and its many suppliers.
Supply Chain
Our supply chain is defined as the ‘end to end’ linkage of the activities of buying and marketing and store operations. In simple terms, the supply chain strategy focus is on being store friendly. This will ensure that the appropriate products get on the shelf faster and cheaper whilst using less inventory.A high level strategy for the Woolworths supply chain has been based upon Woolworths’ strong existing supply chain network, and on world’s best prac-tice, developed during study tours of major retailers in Europe and the USA. Implementation plans for the strategy are being developed, and will be phased in over the next five years.A significant amount of supply chain work in the financial year revolved around the development of IT systems to support inventory management in the Supermarkets Division. Four major projects underway are IT systems to support:
◾ Ordering or merchandize into our DCs ◾ Ordering of merchandize into our stores ◾ Better visibility of stock holding across the company ◾ Better management of stock delivered directly to our stores from
suppliers
Other projects undertaken in the year under review include:
◾ Development, and implementation of supply chain integration plans for the converted former Franklins stores
◾ Rationalization of the Victorian distribution facilities, including closure of one site and a major upgrade to the Mulgrave Distribution Centre
◾ Centralization of the Dick Smith Electronics (DSE) distribution facili-ties from a multi-site to a one-site operation, based at Chullora in Sydney
◾ Development of integration plans for the Tandy Electronics supply chain into the DSE business
◾ Extension of the BIG W Warwick, Queensland distribution facility to handle increased volumes as this business expands
◾ Brismeat operation – design, tender and commencement of works to refurbish and extend the Ipswich Meat Facility.
(Continued)
542 ◾ Agribusiness Supply Chain Management
bOx A 7.1 (CoNtiNUed) PROje CT Re FRe SH
Merchandize l ogisticsDuring the financial year, the Woolworths supply chain merchandize logis-tics department was formed, with the aim of working with our suppliers to improve the flow of their merchandize through the supply chain. This is an area with potential to remove substantial costs, for both suppliers and for Woolworths.
Woolworths Transport
The Woolworths National Transport Department was formed as part of the new supply chain structure. This group has identified a number of strate-gic initiatives that will be positive for the Woolworths group and work has commenced on implementation of these initiatives. The National Transport Department has also provided a national approach to transport contract management, with performance based service level agreements, which are providing immediate benefits to the company.
it
Supply chain system improvement was the main focus of IT. We have a major development programme underway over the next three years, that enables and supports our overall supply chain strategy. The main achievements in the last year were:
◾ The implementation of a new warehouse replenishment system (StockSMART) to better control the inventory levels of our everyday stock
◾ The pilot of a promotional warehouse replenishment system ◾ The pilot of an AutoStockR ◾ The development of more sophisticated systems to control the ordering
and delivery of DSD
We are confident that in the next year, as we roll out the pilot systems, we will gain significant improvements in our in-stock positions, as well as a reduction in our overall stock levels. We have rolled out new stores back-office infrastructure to over 600 super-markets. This provides a standard, Microsoft Windows Platform, in every supermarket which will be the basis for many new in-store IT applications in the coming years.
Source: Woolworths Ltd. Financial reports to shareholders for years 1999–2001.
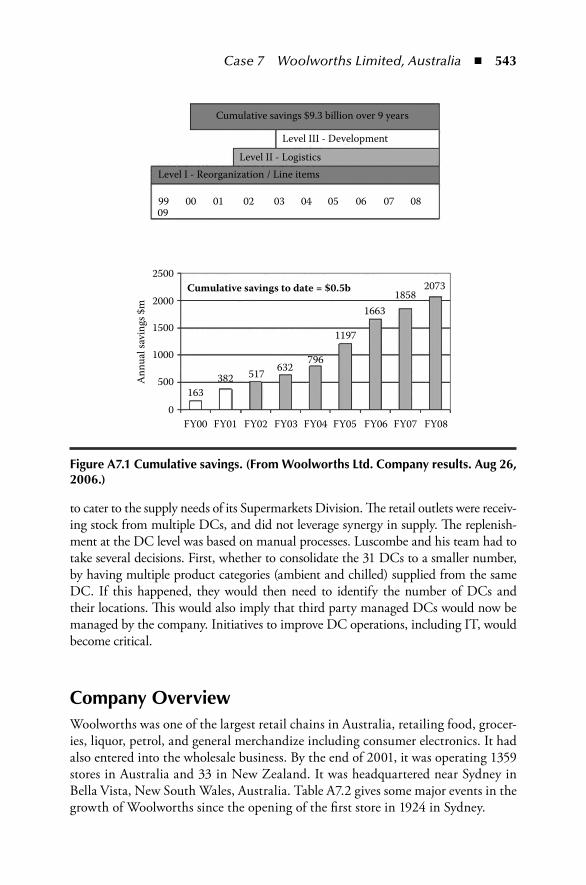
Case 7 Woolworths Limited, Australia ◾ 543
to cater to the supply needs of its Supermarkets Division. The retail outlets were receiv-ing stock from multiple DCs, and did not leverage synergy in supply. The replenish-ment at the DC level was based on manual processes. Luscombe and his team had to take several decisions. First, whether to consolidate the 31 DCs to a smaller number, by having multiple product categories (ambient and chilled) supplied from the same DC. If this happened, they would then need to identify the number of DCs and their locations. This would also imply that third party managed DCs would now be managed by the company. Initiatives to improve DC operations, including IT, would become critical.
Company overviewWoolworths was one of the largest retail chains in Australia, retailing food, grocer-ies, liquor, petrol, and general merchandize including consumer electronics. It had also entered into the wholesale business. By the end of 2001, it was operating 1359 stores in Australia and 33 in New Zealand. It was headquartered near Sydney in Bella Vista, New South Wales, Australia. Table A7.2 gives some major events in the growth of Woolworths since the opening of the first store in 1924 in Sydney.
Cumulative savings $9.3 billion over 9 years
Level III - Development
Level II - Logistics
Cumulative savings to date = $0.5b
Ann
ual s
avin
gs $
m
20731858
1663
1197
796632517382
163
FY00 FY01 FY02 FY03 FY04 FY05 FY06 FY07 FY080
500
1000
1500
2000
2500
Level I - Reorganization / Line items
99 0009
01 02 03 04 05 06 07 08
Figure A7.1 Cumulative savings. (From Woolworths Ltd. Company results. Aug 26, 2006.)
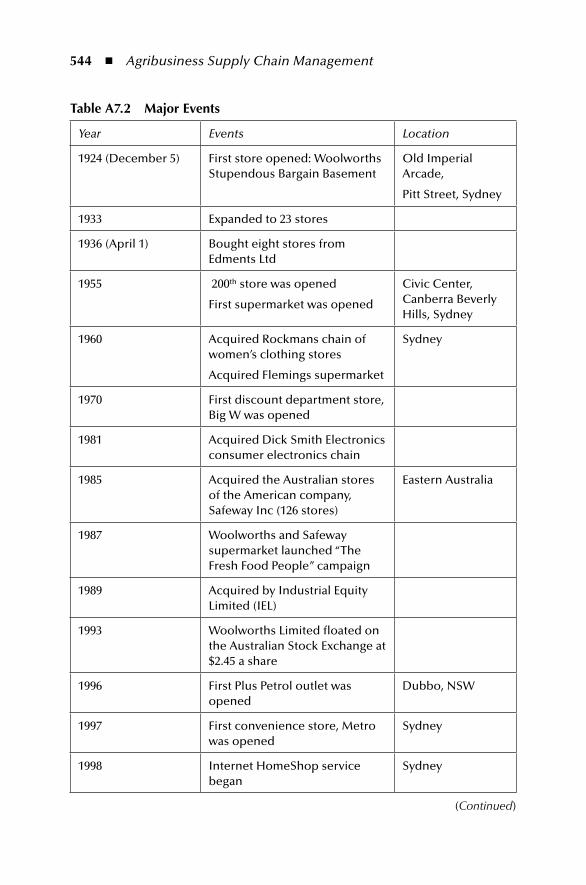
544 ◾ Agribusiness Supply Chain Management
table A7.2 major events
Year Events Location
1924 (December 5) First store opened: Woolworths Stupendous Bargain Basement
Old Imperial Arcade,
Pitt Street, Sydney
1933 Expanded to 23 stores
1936 (April 1) Bought eight stores from Edments Ltd
1955 200th store was opened
First supermarket was opened
Civic Center, Canberra Beverly Hills, Sydney
1960 Acquired Rockmans chain of women’s clothing stores
Acquired Flemings supermarket
Sydney
1970 First discount department store, Big W was opened
1981 Acquired Dick Smith Electronics consumer electronics chain
1985 Acquired the Australian stores of the American company, Safeway Inc (126 stores)
Eastern Australia
1987 Woolworths and Safeway supermarket launched “The Fresh Food People” campaign
1989 Acquired by Industrial Equity Limited (IEL)
1993 Woolworths Limited floated on the Australian Stock Exchange at $2.45 a share
1996 First Plus Petrol outlet was opened
Dubbo, NSW
1997 First convenience store, Metro was opened
Sydney
1998 Internet HomeShop service began
Sydney
(Continued)
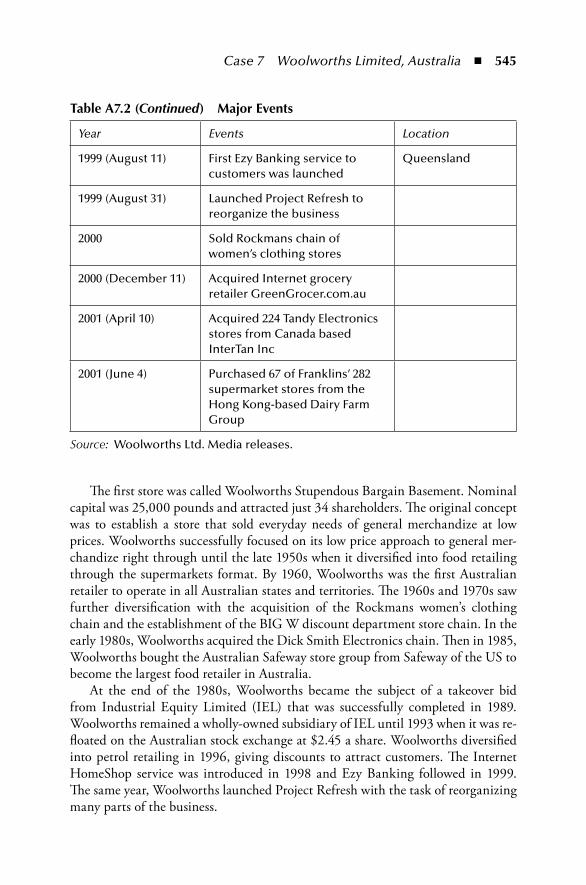
Case 7 Woolworths Limited, Australia ◾ 545
The first store was called Woolworths Stupendous Bargain Basement. Nominal capital was 25,000 pounds and attracted just 34 shareholders. The original concept was to establish a store that sold everyday needs of general merchandize at low prices. Woolworths successfully focused on its low price approach to general mer-chandize right through until the late 1950s when it diversified into food retailing through the supermarkets format. By 1960, Woolworths was the first Australian retailer to operate in all Australian states and territories. The 1960s and 1970s saw further diversification with the acquisition of the Rockmans women’s clothing chain and the establishment of the BIG W discount department store chain. In the early 1980s, Woolworths acquired the Dick Smith Electronics chain. Then in 1985, Woolworths bought the Australian Safeway store group from Safeway of the US to become the largest food retailer in Australia.
At the end of the 1980s, Woolworths became the subject of a takeover bid from Industrial Equity Limited (IEL) that was successfully completed in 1989. Woolworths remained a wholly-owned subsidiary of IEL until 1993 when it was re-floated on the Australian stock exchange at $2.45 a share. Woolworths diversified into petrol retailing in 1996, giving discounts to attract customers. The Internet HomeShop service was introduced in 1998 and Ezy Banking followed in 1999. The same year, Woolworths launched Project Refresh with the task of reorganizing many parts of the business.
table A7.2 (Continued) major events
Year Events Location
1999 (August 11) First Ezy Banking service to customers was launched
Queensland
1999 (August 31) Launched Project Refresh to reorganize the business
2000 Sold Rockmans chain of women’s clothing stores
2000 (December 11) Acquired Internet grocery retailer GreenGrocer.com.au
2001 (April 10) Acquired 224 Tandy Electronics stores from Canada based InterTan Inc
2001 (June 4) Purchased 67 of Franklins’ 282 supermarket stores from the Hong Kong-based Dairy Farm Group
Source: Woolworths Ltd. Media releases.
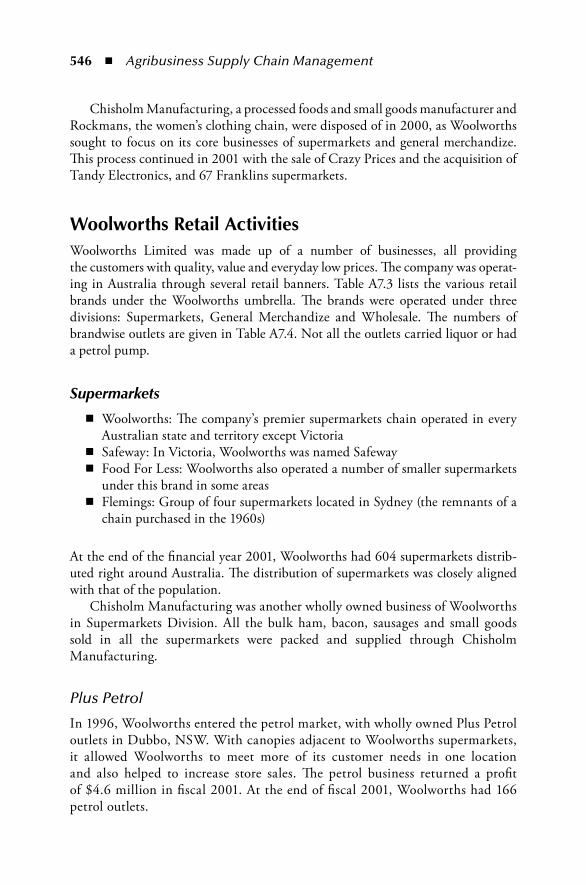
546 ◾ Agribusiness Supply Chain Management
Chisholm Manufacturing, a processed foods and small goods manufacturer and Rockmans, the women’s clothing chain, were disposed of in 2000, as Woolworths sought to focus on its core businesses of supermarkets and general merchandize. This process continued in 2001 with the sale of Crazy Prices and the acquisition of Tandy Electronics, and 67 Franklins supermarkets.
Woolworths retail ActivitiesWoolworths Limited was made up of a number of businesses, all providing the customers with quality, value and everyday low prices. The company was operat-ing in Australia through several retail banners. Table A7.3 lists the various retail brands under the Woolworths umbrella. The brands were operated under three divisions: Supermarkets, General Merchandize and Wholesale. The numbers of brandwise outlets are given in Table A7.4. Not all the outlets carried liquor or had a petrol pump.
Supermarkets
◾ Woolworths: The company’s premier supermarkets chain operated in every Australian state and territory except Victoria
◾ Safeway: In Victoria, Woolworths was named Safeway ◾ Food For Less: Woolworths also operated a number of smaller supermarkets
under this brand in some areas ◾ Flemings: Group of four supermarkets located in Sydney (the remnants of a
chain purchased in the 1960s)
At the end of the financial year 2001, Woolworths had 604 supermarkets distrib-uted right around Australia. The distribution of supermarkets was closely aligned with that of the population.
Chisholm Manufacturing was another wholly owned business of Woolworths in Supermarkets Division. All the bulk ham, bacon, sausages and small goods sold in all the supermarkets were packed and supplied through Chisholm Manufacturing.
Plus Petrol
In 1996, Woolworths entered the petrol market, with wholly owned Plus Petrol outlets in Dubbo, NSW. With canopies adjacent to Woolworths supermarkets, it allowed Woolworths to meet more of its customer needs in one location and also helped to increase store sales. The petrol business returned a profit of $4.6 million in fiscal 2001. At the end of fiscal 2001, Woolworths had 166 petrol outlets.
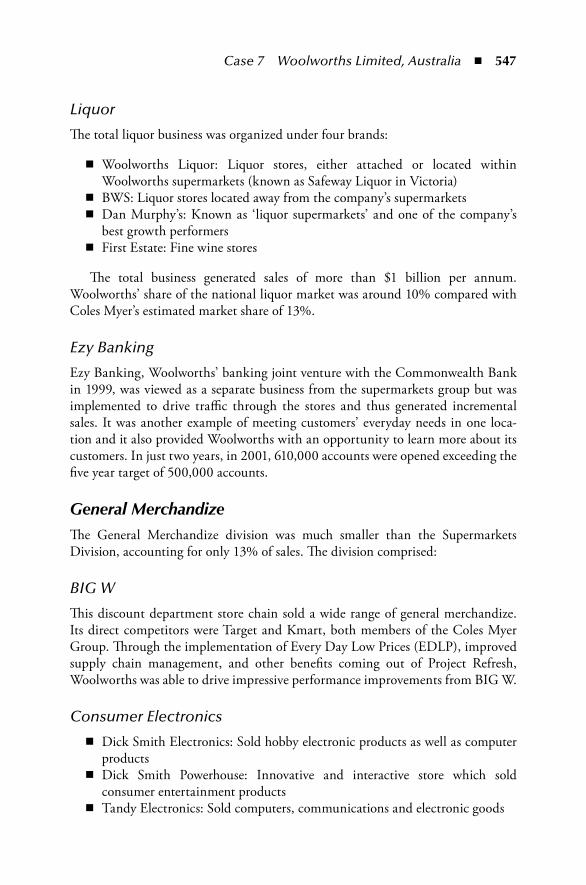
Case 7 Woolworths Limited, Australia ◾ 547
Liquor
The total liquor business was organized under four brands:
◾ Woolworths Liquor: Liquor stores, either attached or located within Woolworths supermarkets (known as Safeway Liquor in Victoria)
◾ BWS: Liquor stores located away from the company’s supermarkets ◾ Dan Murphy’s: Known as ‘liquor supermarkets’ and one of the company’s
best growth performers ◾ First Estate: Fine wine stores
The total business generated sales of more than $1 billion per annum. Woolworths’ share of the national liquor market was around 10% compared with Coles Myer’s estimated market share of 13%.
Ezy Banking
Ezy Banking, Woolworths’ banking joint venture with the Commonwealth Bank in 1999, was viewed as a separate business from the supermarkets group but was implemented to drive traffic through the stores and thus generated incremental sales. It was another example of meeting customers’ everyday needs in one loca-tion and it also provided Woolworths with an opportunity to learn more about its customers. In just two years, in 2001, 610,000 accounts were opened exceeding the five year target of 500,000 accounts.
General MerchandizeThe General Merchandize division was much smaller than the Supermarkets Division, accounting for only 13% of sales. The division comprised:
BIG W
This discount department store chain sold a wide range of general merchandize. Its direct competitors were Target and Kmart, both members of the Coles Myer Group. Through the implementation of Every Day Low Prices (EDLP), improved supply chain management, and other benefits coming out of Project Refresh, Woolworths was able to drive impressive performance improvements from BIG W.
Consumer Electronics
◾ Dick Smith Electronics: Sold hobby electronic products as well as computer products
◾ Dick Smith Powerhouse: Innovative and interactive store which sold consumer entertainment products
◾ Tandy Electronics: Sold computers, communications and electronic goods
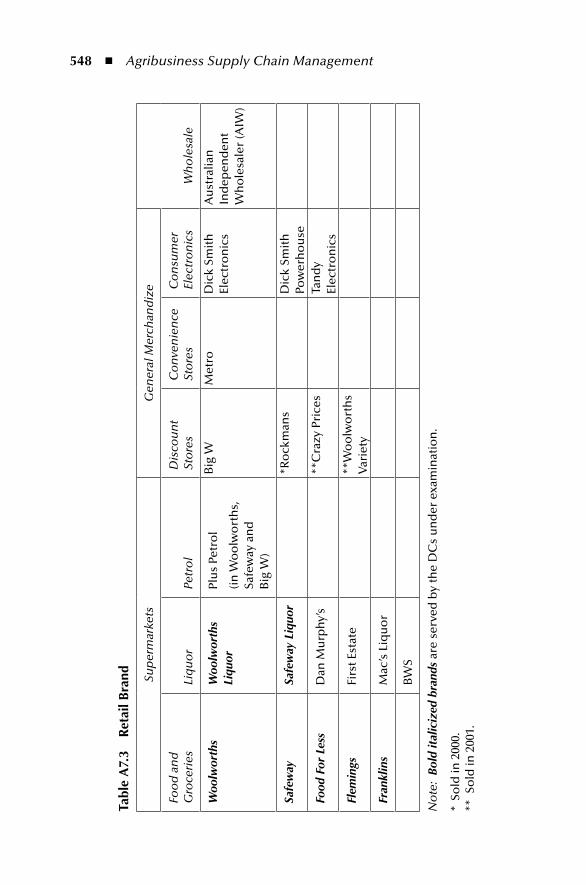
548 ◾ Agribusiness Supply Chain Management
tabl
e A
7.3
ret
ail B
rand Su
per
mar
kets
Gen
eral
Mer
chan
diz
e
Wh
ole
sale
Foo
d a
nd
G
roce
ries
Liq
uo
rPe
tro
lD
isco
un
t St
ore
sC
on
ven
ien
ce
Sto
res
Co
nsu
mer
El
ectr
on
ics
Woo
lwor
ths
Woo
lwor
ths
Liqu
orPl
us
Petr
ol
(in
Wo
olw
ort
hs,
Sa
few
ay a
nd
B
ig W
)
Big
WM
etro
Dic
k Sm
ith
El
ectr
on
ics
Au
stra
lian
In
dep
end
ent
Wh
ole
sale
r (A
IW)
Safe
way
Safe
way
Liq
uor
*Ro
ckm
ans
Dic
k Sm
ith
Po
wer
ho
use
Food
For
Les
sD
an M
urp
hy’
s**
Cra
zy P
rice
sTa
nd
y El
ectr
on
ics
Flem
ings
Firs
t Est
ate
**W
oo
lwo
rth
s V
arie
ty
Fran
klin
sM
ac’s
Liq
uo
r
BW
S
No
te:
Bol
d it
alic
ized
bra
nds
are
serv
ed b
y th
e D
Cs
un
der
exa
min
atio
n.
* So
ld in
200
0.
** S
old
in 2
001.
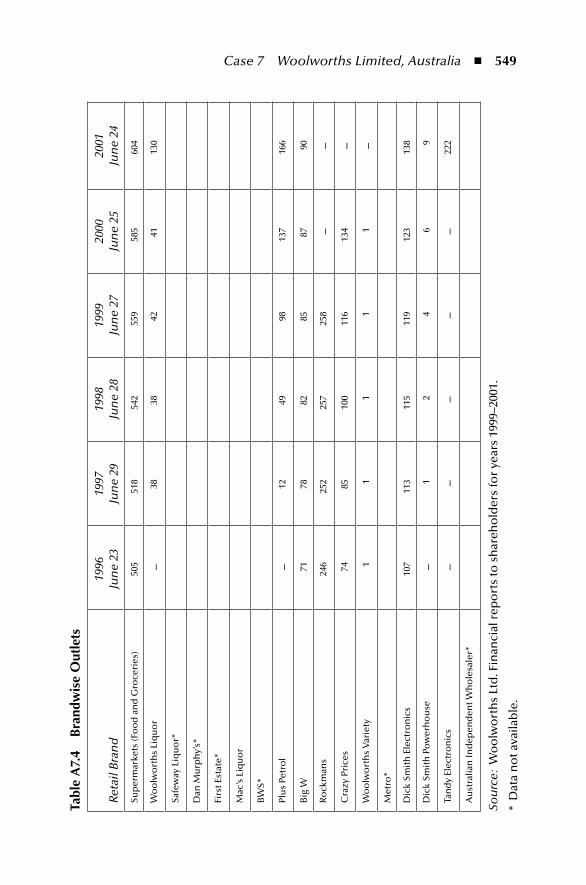
Case 7 Woolworths Limited, Australia ◾ 549
tabl
e A
7.4
Bra
ndw
ise
out
lets
Reta
il B
ran
d19
96Ju
ne
2319
97Ju
ne
2919
98Ju
ne
2819
99Ju
ne
2720
00Ju
ne
2520
01Ju
ne
24
Sup
erm
arke
ts (F
oo
d a
nd
Gro
ceri
es)
505
518
542
559
585
604
Wo
olw
ort
hs
Liq
uo
r–
3838
4241
130
Safe
way
Liq
uo
r*
Dan
Mu
rph
y’s*
Firs
t Est
ate*
Mac
’s L
iqu
or
BW
S*
Plu
s Pe
tro
l–
1249
9813
716
6
Big
W
7178
8285
8790
Ro
ckm
ans
246
252
257
258
––
Cra
zy P
rice
s74
8510
011
613
4–
Wo
olw
ort
hs
Var
iety
11
11
1–
Met
ro*
Dic
k Sm
ith
Ele
ctro
nic
s10
711
311
511
912
313
8
Dic
k Sm
ith
Po
wer
ho
use
–1
24
69
Tan
dy
Elec
tro
nic
s–
––
––
222
Au
stra
lian
Ind
epen
den
t Wh
ole
sale
r*
Sou
rce:
Wo
olw
ort
hs
Ltd
. Fin
anci
al r
epo
rts
to s
har
eho
lder
s fo
r ye
ars
1999
–200
1.
* D
ata
no
t ava
ilab
le.
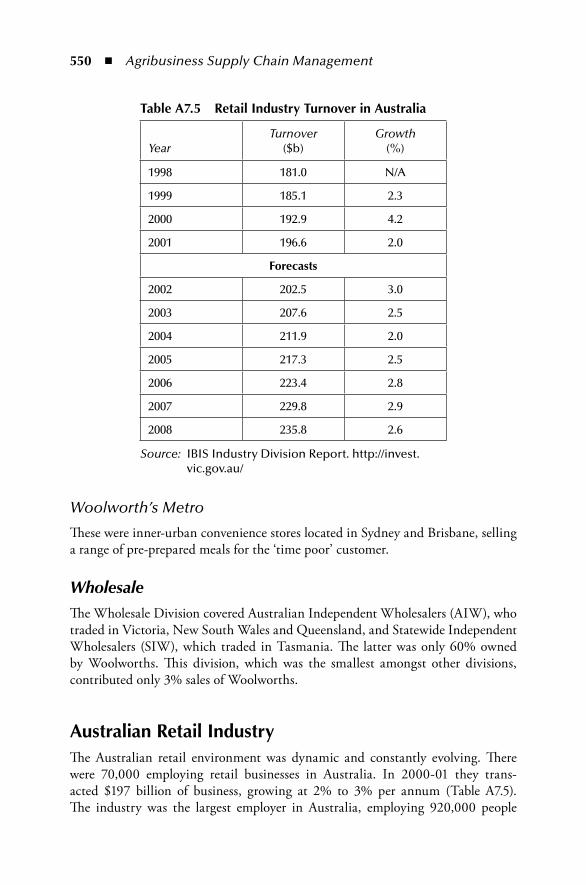
550 ◾ Agribusiness Supply Chain Management
Woolworth’s Metro
These were inner-urban convenience stores located in Sydney and Brisbane, selling a range of pre-prepared meals for the ‘time poor’ customer.
WholesaleThe Wholesale Division covered Australian Independent Wholesalers (AIW), who traded in Victoria, New South Wales and Queensland, and Statewide Independent Wholesalers (SIW), which traded in Tasmania. The latter was only 60% owned by Woolworths. This division, which was the smallest amongst other divisions, contributed only 3% sales of Woolworths.
Australian retail industryThe Australian retail environment was dynamic and constantly evolving. There were 70,000 employing retail businesses in Australia. In 2000-01 they trans-acted $197 billion of business, growing at 2% to 3% per annum (Table A7.5). The industry was the largest employer in Australia, employing 920,000 people
table A7.5 retail industry turnover in Australia
YearTurnover
($b)Growth
(%)
1998 181.0 N/A
1999 185.1 2.3
2000 192.9 4.2
2001 196.6 2.0
Forecasts
2002 202.5 3.0
2003 207.6 2.5
2004 211.9 2.0
2005 217.3 2.5
2006 223.4 2.8
2007 229.8 2.9
2008 235.8 2.6
Source: IBIS Industry Division Report. http://invest.vic.gov.au/
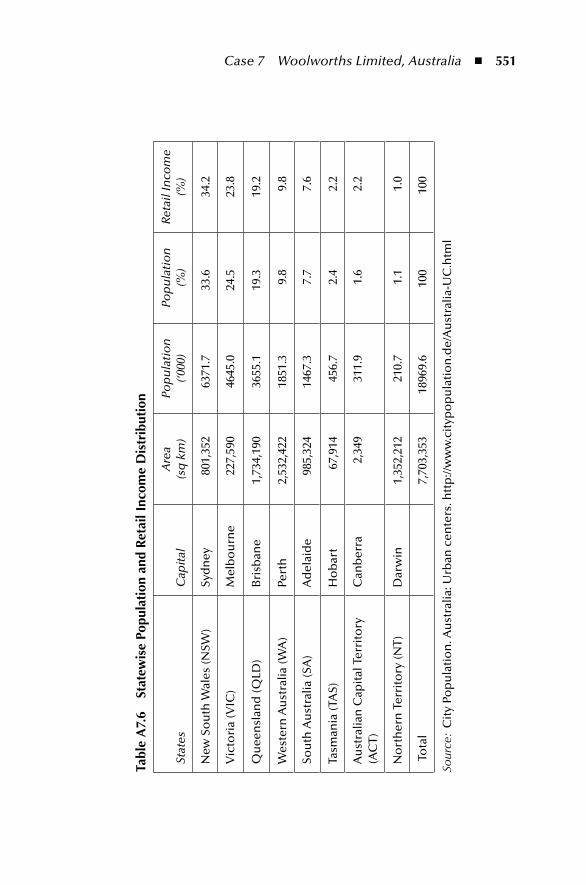
Case 7 Woolworths Limited, Australia ◾ 551
tabl
e A
7.6
Stat
ewis
e po
pula
tion
and
ret
ail i
ncom
e D
istr
ibut
ion
Stat
esC
apit
alA
rea
(sq
km
)Po
pu
lati
on
(‘000
)Po
pu
lati
on
(%)
Reta
il In
com
e (%
)
New
So
uth
Wal
es (N
SW)
Syd
ney
801,
352
6371
.733
.634
.2
Vic
tori
a (V
IC)
Mel
bo
urn
e22
7,59
046
45.0
24.5
23.8
Qu
een
slan
d (Q
LD)
Bri
sban
e1,
734,
190
3655
.119
.319
.2
Wes
tern
Au
stra
lia (W
A)
Pert
h2,
532,
422
1851
.39.
89.
8
Sou
th A
ust
ralia
(SA
)A
del
aid
e98
5,32
414
67.3
7.7
7.6
Tasm
ania
(TA
S)H
ob
art
67,9
1445
6.7
2.4
2.2
Au
stra
lian
Cap
ital
Ter
rito
ry
(AC
T)C
anb
erra
2,34
931
1.9
1.6
2.2
No
rth
ern
Ter
rito
ry (N
T)D
arw
in1,
352,
212
210.
71.
11.
0
To
tal
7,70
3,35
318
969.
610
010
0
Sour
ce:
Cit
y Po
pu
lati
on
. Au
stra
lia: U
rban
cen
ters
. htt
p://
ww
w.c
ityp
op
ula
tio
n.d
e/A
ust
ralia
-UC
.htm
l
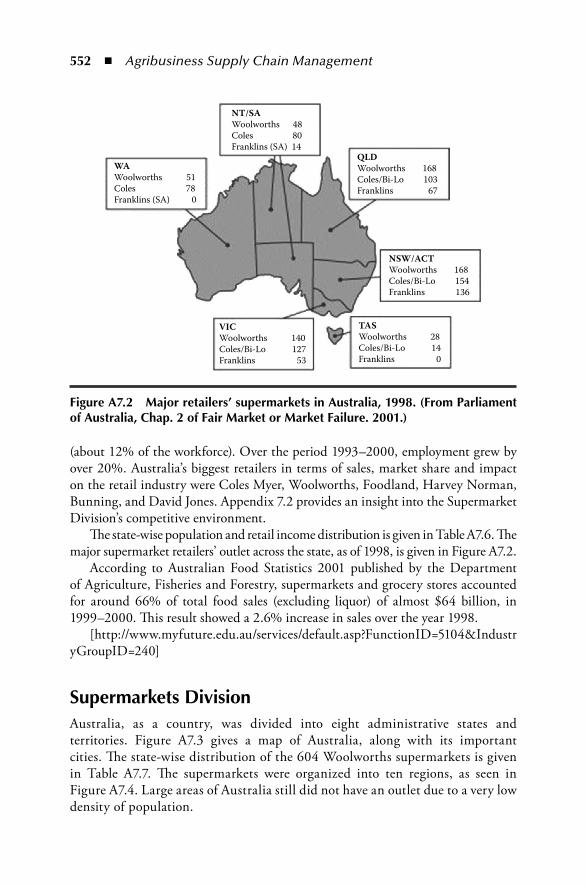
552 ◾ Agribusiness Supply Chain Management
(about 12% of the workforce). Over the period 1993–2000, employment grew by over 20%. Australia’s biggest retailers in terms of sales, market share and impact on the retail industry were Coles Myer, Woolworths, Foodland, Harvey Norman, Bunning, and David Jones. Appendix 7.2 provides an insight into the Supermarket Division’s competitive environment.
The state-wise population and retail income distribution is given in Table A7.6. The major supermarket retailers’ outlet across the state, as of 1998, is given in Figure A7.2.
According to Australian Food Statistics 2001 published by the Department of Agriculture, Fisheries and Forestry, supermarkets and grocery stores accounted for around 66% of total food sales (excluding liquor) of almost $64 billion, in 1999–2000. This result showed a 2.6% increase in sales over the year 1998.
[http://www.myfuture.edu.au/services/default.asp?FunctionID=5104&IndustryGroupID=240]
Supermarkets DivisionAustralia, as a country, was divided into eight administrative states and territories. Figure A7.3 gives a map of Australia, along with its important cities. The state-wise distribution of the 604 Woolworths supermarkets is given in Table A7.7. The supermarkets were organized into ten regions, as seen in Figure A7.4. Large areas of Australia still did not have an outlet due to a very low density of population.
NT/SAWoolworths 48Coles 80Franklins (SA) 14
WAWoolworths 51Coles 78Franklins (SA) 0
VICWoolworths 140Coles/Bi-Lo 127Franklins 53
TASWoolworths 28Coles/Bi-Lo 14Franklins 0
QLDWoolworths 168Coles/Bi-Lo 103Franklins 67
NSW/ACTWoolworths 168Coles/Bi-Lo 154Franklins 136
Figure A7.2 major retailers’ supermarkets in Australia, 1998. (From parliament of Australia, Chap. 2 of Fair market or market Failure. 2001.)
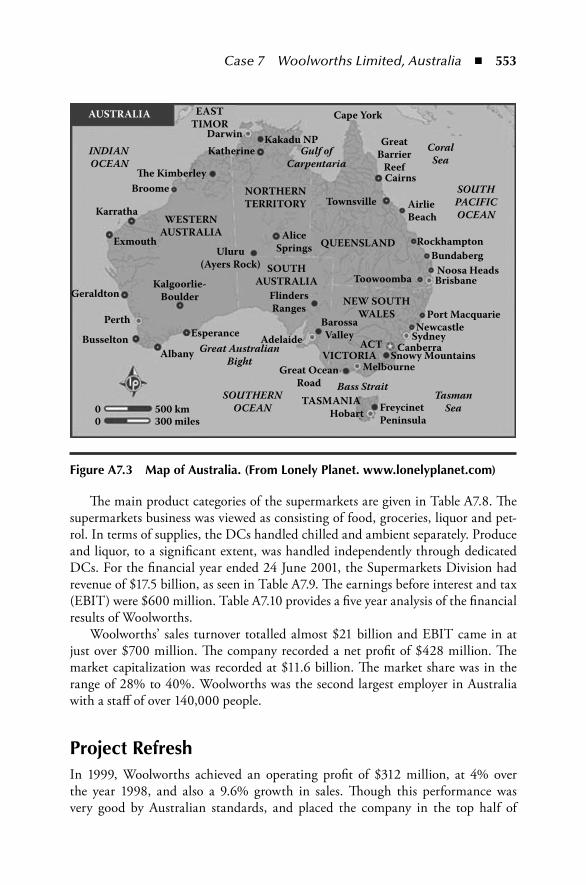
Case 7 Woolworths Limited, Australia ◾ 553
The main product categories of the supermarkets are given in Table A7.8. The supermarkets business was viewed as consisting of food, groceries, liquor and pet-rol. In terms of supplies, the DCs handled chilled and ambient separately. Produce and liquor, to a significant extent, was handled independently through dedicated DCs. For the financial year ended 24 June 2001, the Supermarkets Division had revenue of $17.5 billion, as seen in Table A7.9. The earnings before interest and tax (EBIT) were $600 million. Table A7.10 provides a five year analysis of the financial results of Woolworths.
Woolworths’ sales turnover totalled almost $21 billion and EBIT came in at just over $700 million. The company recorded a net profit of $428 million. The market capitalization was recorded at $11.6 billion. The market share was in the range of 28% to 40%. Woolworths was the second largest employer in Australia with a staff of over 140,000 people.
project refreshIn 1999, Woolworths achieved an operating profit of $312 million, at 4% over the year 1998, and also a 9.6% growth in sales. Though this performance was very good by Australian standards, and placed the company in the top half of
EASTTIMOR
AUSTRALIA
DarwinCape York
Cairns
AirlieBeach
RockhamptonBundaberg
Brisbane
Port MacquarieNewcastle
SydneyCanberra
Snowy MountainsMelbourne
FreycinetPeninsulaHobart
Noosa Heads
Kakadu NPKatherineINDIAN
OCEANGulf of
Carpentaria
SOUTHPACIFICOCEAN
SOUTHERNOCEAN
Great AustralianBight
Bass StraitTasman
Sea
CoralSea
�e KimberleyBroome
Karratha
Geraldton
Perth
BusseltonAlbany
500 km300 miles
00
Esperance
Kalgoorlie-Boulder
Toowoomba
Uluru(Ayers Rock)
AliceSprings
Townsville
GreatBarrier
Reef
BarossaValley
Great OceanRoad
Adelaide
Exmouth
FlindersRanges
NORTHERNTERRITORY
WESTERNAUSTRALIA
QUEENSLAND
SOUTHAUSTRALIA
NEW SOUTHWALES
ACTVICTORIA
TASMANIA
Figure A7.3 map of Australia. (From Lonely planet. www.lonelyplanet.com)
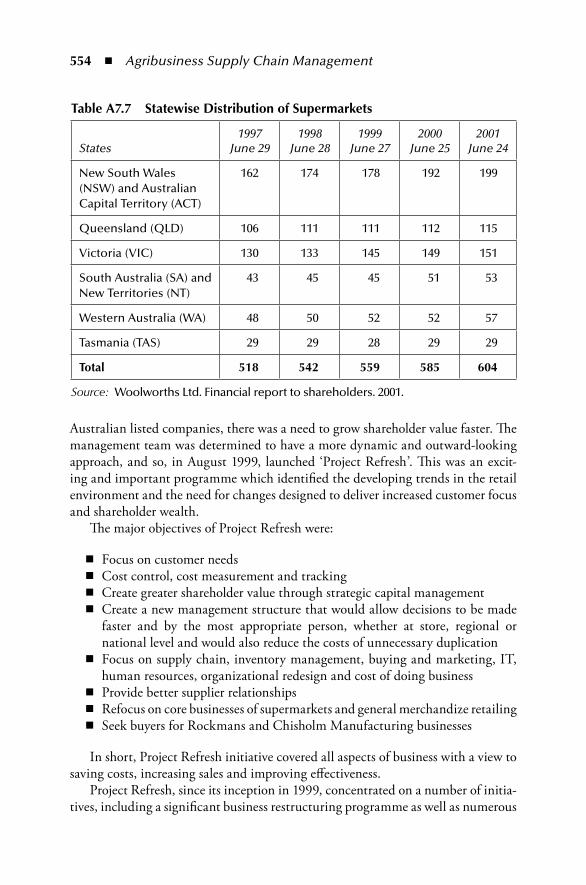
554 ◾ Agribusiness Supply Chain Management
Australian listed companies, there was a need to grow shareholder value faster. The management team was determined to have a more dynamic and outward-looking approach, and so, in August 1999, launched ‘Project Refresh’. This was an excit-ing and important programme which identified the developing trends in the retail environment and the need for changes designed to deliver increased customer focus and shareholder wealth.
The major objectives of Project Refresh were:
◾ Focus on customer needs ◾ Cost control, cost measurement and tracking ◾ Create greater shareholder value through strategic capital management ◾ Create a new management structure that would allow decisions to be made
faster and by the most appropriate person, whether at store, regional or national level and would also reduce the costs of unnecessary duplication
◾ Focus on supply chain, inventory management, buying and marketing, IT, human resources, organizational redesign and cost of doing business
◾ Provide better supplier relationships ◾ Refocus on core businesses of supermarkets and general merchandize retailing ◾ Seek buyers for Rockmans and Chisholm Manufacturing businesses
In short, Project Refresh initiative covered all aspects of business with a view to saving costs, increasing sales and improving effectiveness.
Project Refresh, since its inception in 1999, concentrated on a number of initia-tives, including a significant business restructuring programme as well as numerous
table A7.7 Statewise Distribution of Supermarkets
States1997
June 291998
June 281999
June 272000
June 252001
June 24
New South Wales (NSW) and Australian Capital Territory (ACT)
162 174 178 192 199
Queensland (QLD) 106 111 111 112 115
Victoria (VIC) 130 133 145 149 151
South Australia (SA) and New Territories (NT)
43 45 45 51 53
Western Australia (WA) 48 50 52 52 57
Tasmania (TAS) 29 29 28 29 29
total 518 542 559 585 604
Source: Woolworths Ltd. Financial report to shareholders. 2001.
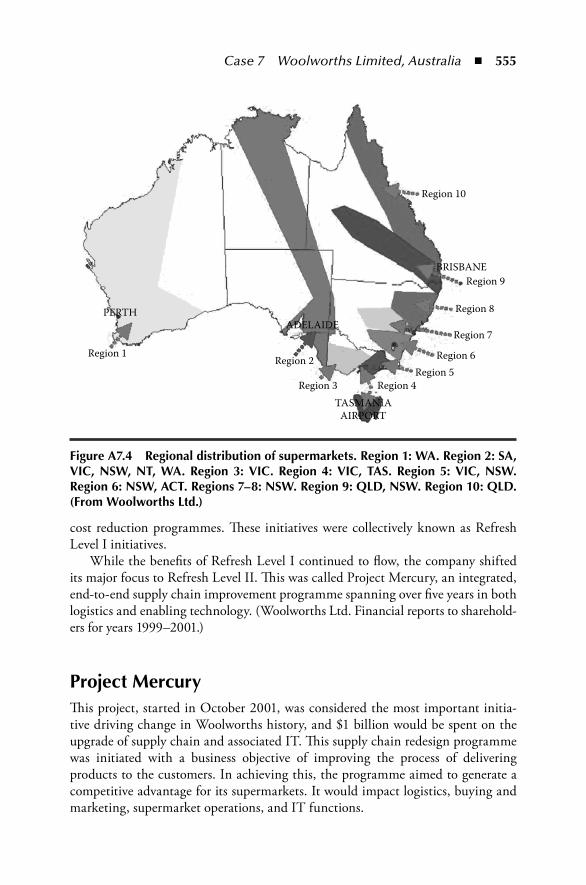
Case 7 Woolworths Limited, Australia ◾ 555
cost reduction programmes. These initiatives were collectively known as Refresh Level I initiatives.
While the benefits of Refresh Level I continued to flow, the company shifted its major focus to Refresh Level II. This was called Project Mercury, an integrated, end-to-end supply chain improvement programme spanning over five years in both logistics and enabling technology. (Woolworths Ltd. Financial reports to sharehold-ers for years 1999–2001.)
project mercuryThis project, started in October 2001, was considered the most important initia-tive driving change in Woolworths history, and $1 billion would be spent on the upgrade of supply chain and associated IT. This supply chain redesign programme was initiated with a business objective of improving the process of delivering products to the customers. In achieving this, the programme aimed to generate a competitive advantage for its supermarkets. It would impact logistics, buying and marketing, supermarket operations, and IT functions.
Region 10
Region 9
Region 8
Region 7
Region 6Region 5
Region 4TASMANIA
AIRPORT
Region 3
Region 2Region 1
PERTHADELAIDE
BRISBANE
Figure A7.4 regional distribution of supermarkets. region 1: WA. region 2: SA, ViC, nSW, nt, WA. region 3: ViC. region 4: ViC, tAS. region 5: ViC, nSW. region 6: nSW, ACt. regions 7–8: nSW. region 9: QLD, nSW. region 10: QLD. (From Woolworths Ltd.)
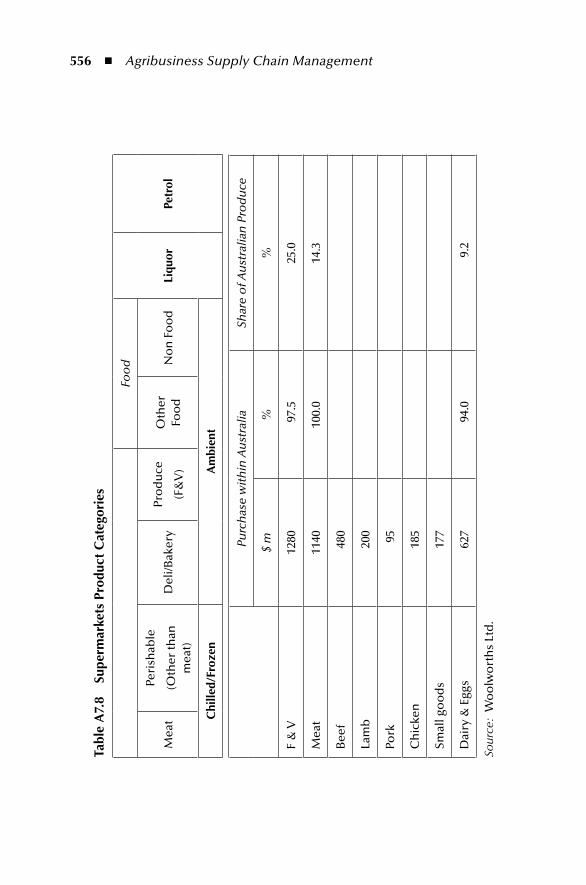
556 ◾ Agribusiness Supply Chain Management
tabl
e A
7.8
Supe
rmar
kets
pro
duct
Cat
egor
ies
Foo
d
Liqu
orpe
trol
Mea
t
Peri
shab
le
(Oth
er th
an
mea
t)
Del
i/Bak
ery
Pro
du
ce
(F&
V)
Oth
er
Foo
dN
on
Fo
od
Chi
lled/
Froz
enA
mbi
ent
Purc
has
e w
ith
in A
ust
ralia
Shar
e o
f Au
stra
lian
Pro
du
ce
$ m
%%
F &
V12
80 9
7.5
25.0
Mea
t11
4010
0.0
14.3
Bee
f48
0
Lam
b20
0
Pork
95
Ch
icke
n18
5
Smal
l go
od
s17
7
Dai
ry &
Egg
s62
7 9
4.0
9.2
Sour
ce:
Wo
olw
ort
hs
Ltd
.
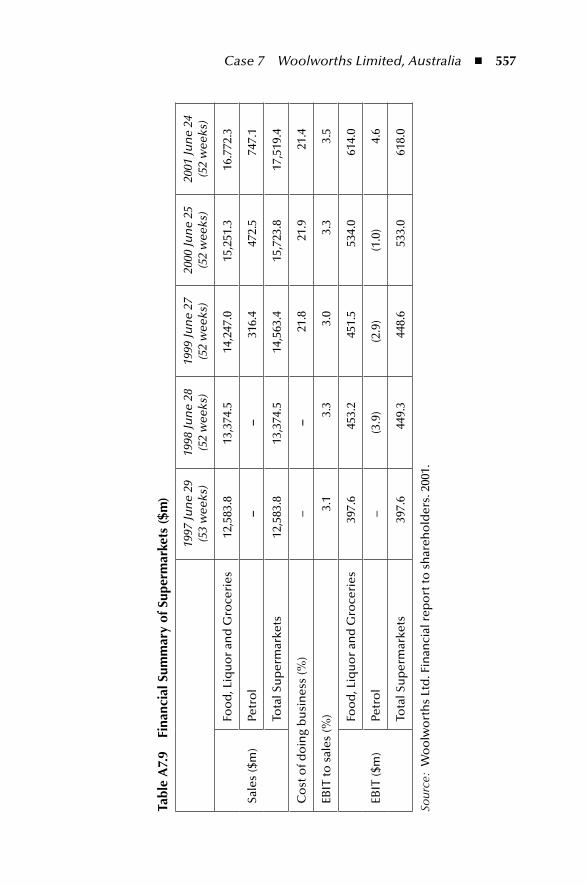
Case 7 Woolworths Limited, Australia ◾ 557
tabl
e A
7.9
Fina
ncia
l Sum
mar
y of
Sup
erm
arke
ts (
$m)
1997
Jun
e 29
(53
wee
ks)
1998
Jun
e 28
(52
wee
ks)
1999
Jun
e 27
(52
wee
ks)
2000
Jun
e 25
(52
wee
ks)
2001
Jun
e 24
(52
wee
ks)
Sale
s ($
m)
Foo
d, L
iqu
or
and
Gro
ceri
es12
,583
.813
,374
.514
,247
.015
,251
.316
.772
.3
Petr
ol
––
316.
447
2.5
747.
1
Tota
l Su
per
mar
kets
12,5
83.8
13,3
74.5
14,5
63.4
15,7
23.8
17,5
19.4
Co
st o
f do
ing
bu
sin
ess
(%)
––
21.8
21.9
21.4
EBIT
to s
ales
(%)
3.1
3.3
3.0
3.3
3.5
EBIT
($m
)
Foo
d, L
iqu
or
and
Gro
ceri
es39
7.6
453.
245
1.5
534.
061
4.0
Petr
ol
–(3
.9)
(2.9
)(1
.0)
4.6
Tota
l Su
per
mar
kets
397.
644
9.3
448.
653
3.0
618.
0
Sour
ce:
Wo
olw
ort
hs
Ltd
. Fin
anci
al r
epo
rt to
sh
areh
old
ers.
200
1.
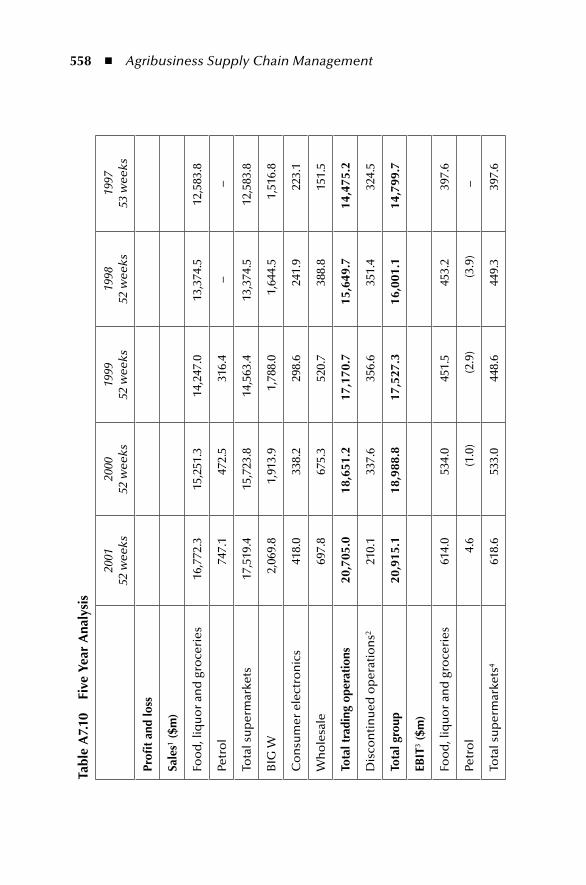
558 ◾ Agribusiness Supply Chain Management
tabl
e A
7.10
Fi
ve y
ear
Ana
lysi
s
2001
52 w
eeks
2000
52 w
eeks
1999
52 w
eeks
1998
52 w
eeks
1997
53 w
eeks
profi
t an
d lo
ss
Sale
s1 ($m
)
Foo
d, l
iqu
or
and
gro
ceri
es16
,772
.3
15,2
51.3
14,2
47.0
13,3
74.5
12,5
83.8
Petr
ol
747.
147
2.5
316.
4–
–
Tota
l su
per
mar
kets
17,5
19.4
15,7
23.8
14,5
63.4
13,3
74.5
12,5
83.8
BIG
W2,
069.
81,
913.
91,
788.
01,
644.
51,
516.
8
Co
nsu
mer
ele
ctro
nic
s41
8.0
338.
229
8.6
241.
922
3.1
Wh
ole
sale
697.
867
5.3
520.
738
8.8
151.
5
tota
l tra
ding
ope
rati
ons
20,7
05.0
18,6
51.2
17,1
70.7
15,6
49.7
14,4
75.2
Dis
con
tin
ued
op
erat
ion
s221
0.1
337.
635
6.6
351.
432
4.5
tota
l gro
up20
,915
.118
,988
.817
,527
.316
,001
.114
,799
.7
eBit
3 ($m
)
Foo
d, l
iqu
or
and
gro
ceri
es61
4.0
534.
045
1.5
453.
239
7.6
Petr
ol
4.6
(1.0
)(2
.9)
(3.9
)–
Tota
l su
per
mar
kets
461
8.6
533.
044
8.6
449.
339
7.6
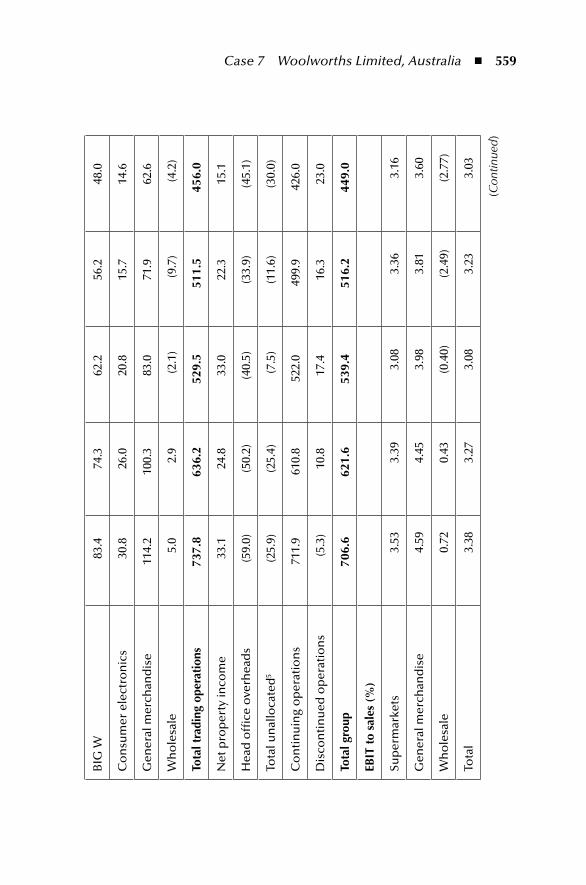
Case 7 Woolworths Limited, Australia ◾ 559
BIG
W83
.474
.362
.256
.248
.0
Co
nsu
mer
ele
ctro
nic
s30
.826
.020
.815
.714
.6
Gen
eral
mer
chan
dis
e11
4.2
100.
383
.071
.962
.6
Wh
ole
sale
5.0
2.9
(2.1
)(9
.7)
(4.2
)
tota
l tra
ding
ope
rati
ons
737.
863
6.2
529.
551
1.5
456.
0
Net
pro
per
ty in
com
e33
.124
.833
.022
.315
.1
Hea
d o
ffice
ove
rhea
ds
(59.
0)(5
0.2)
(40.
5)(3
3.9)
(45.
1)
Tota
l un
allo
cate
d5
(25.
9)(2
5.4)
(7.5
)(1
1.6)
(30.
0)
Co
nti
nu
ing
op
erat
ion
s71
1.9
610.
852
2.0
499.
942
6.0
Dis
con
tin
ued
op
erat
ion
s(5
.3)
10.8
17.4
16.3
23.0
tota
l gro
up70
6.6
621.
653
9.4
516.
244
9.0
eBit
to
sale
s (%
)
Sup
erm
arke
ts3.
533.
393.
083.
363.
16
Gen
eral
mer
chan
dis
e4.
594.
453.
983.
813.
60
Wh
ole
sale
0.72
0.43
(0.4
0)(2
.49)
(2.7
7)
Tota
l3.
383.
273.
083.
233.
03
(Con
tinue
d)
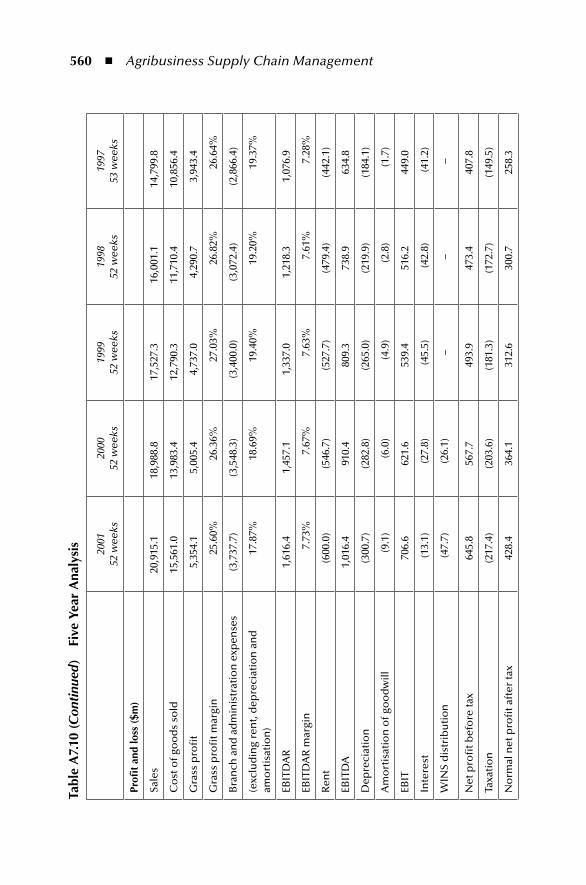
560 ◾ Agribusiness Supply Chain Management
tabl
e A
7.10
(Con
tinu
ed)
Five
yea
r A
naly
sis
2001
52 w
eeks
2000
52 w
eeks
1999
52 w
eeks
1998
52 w
eeks
1997
53 w
eeks
profi
t an
d lo
ss (
$m)
Sale
s20
,915
.118
,988
.817
,527
.316
,001
.114
,799
.8
Co
st o
f go
od
s so
ld15
,561
.013
,983
.412
,790
.311
,710
.410
,856
.4
Gra
ss p
rofi
t5,
354.
15,
005.
44,
737.
04,
290.
73,
943.
4
Gra
ss p
rofi
t mar
gin
25.6
0%26
.36%
27.0
3%26
.82%
26.6
4%
Bra
nch
an
d a
dm
inis
trat
ion
exp
ense
s(3
,737
.7)
(3,5
48.3
)(3
,400
.0)
(3,0
72.4
)(2
,866
.4)
(exc
lud
ing
ren
t, d
epre
ciat
ion
an
d
amo
rtis
atio
n)
17.8
7%18
.69%
19.4
0%19
.20%
19.3
7%
EBIT
DA
R1,
616.
41,
457.
11,
337.
01,
218.
31,
076.
9
EBIT
DA
R m
argi
n7.
73%
7.67
%7.
63%
7.61
%7.
28%
Ren
t(6
00.0
)(5
46.7
)(5
27.7
)(4
79.4
)(4
42.1
)
EBIT
DA
1,01
6.4
910.
480
9.3
738.
963
4.8
Dep
reci
atio
n(3
00.7
)(2
82.8
)(2
65.0
)(2
19.9
)(1
84.1
)
Am
ort
isat
ion
of g
oo
dw
ill(9
.1)
(6.0
)(4
.9)
(2.8
)(1
.7)
EBIT
706.
662
1.6
539.
451
6.2
449.
0
Inte
rest
(13.
1)(2
7.8)
(45.
5)(4
2.8)
(41.
2)
WIN
S d
istr
ibu
tio
n(4
7.7)
(26.
1)–
––
Net
pro
fit b
efo
re ta
x64
5.8
567.
749
3.9
473.
440
7.8
Taxa
tio
n(2
17.4
)(2
03.6
)(1
81.3
)(1
72.7
)(1
49.5
)
No
rmal
net
pro
fit a
fter
tax
428.
436
4.1
312.
630
0.7
258.
3
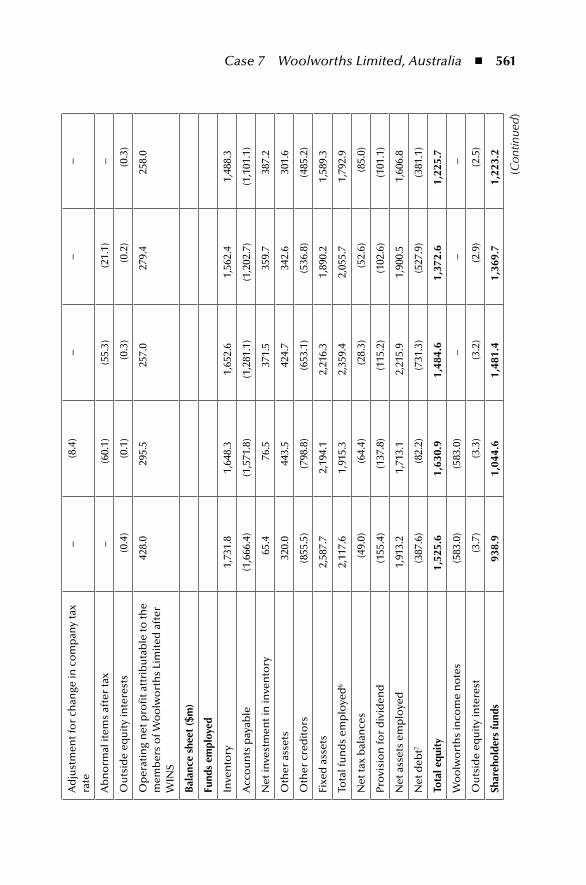
Case 7 Woolworths Limited, Australia ◾ 561
Ad
just
men
t fo
r ch
ange
in c
om
pan
y ta
x ra
te–
(8.4
)–
––
Ab
no
rmal
item
s af
ter
tax
–(6
0.1)
(55.
3)(2
1.1)
–
Ou
tsid
e eq
uit
y in
tere
sts
(0.4
)(0
.1)
(0.3
)(0
.2)
(0.3
)
Op
erat
ing
net
pro
fit a
ttri
bu
tab
le to
the
mem
ber
s o
f Wo
olw
ort
hs
Lim
ited
aft
er
WIN
S
428.
029
5.5
257.
027
9.4
258.
0
Bal
ance
she
et (
$m)
Fund
s em
ploy
ed
Inve
nto
ry1,
731.
81,
648.
31,
652.
61,
562.
41,
488.
3
Acc
ou
nts
pay
able
(1,6
66.4
)(1
,571
.8)
(1,2
81.1
)(1
,202
.7)
(1,1
01.1
)
Net
inve
stm
ent i
n in
ven
tory
65.4
76.5
371.
535
9.7
387.
2
Oth
er a
sset
s32
0.0
443.
542
4.7
342.
630
1.6
Oth
er c
red
ito
rs(8
55.5
)(7
98.8
)(6
53.1
)(5
36.8
)(4
85.2
)
Fixe
d a
sset
s2,
587.
72,
194.
12,
216.
31,
890.
21,
589.
3
Tota
l fu
nd
s em
plo
yed
62,
117.
61,
915.
32,
359.
42,
055.
71,
792.
9
Net
tax
bal
ance
s(4
9.0)
(64.
4)(2
8.3)
(52.
6)(8
5.0)
Pro
visi
on
for
div
iden
d(1
55.4
)(1
37.8
)(1
15.2
)(1
02.6
)(1
01.1
)
Net
ass
ets
emp
loye
d1,
913.
21,
713.
12,
215.
91,
900.
51,
606.
8
Net
deb
t7(3
87.6
)(8
2.2)
(731
.3)
(527
.9)
(381
.1)
tota
l equ
ity
1,52
5.6
1,63
0.9
1,48
4.6
1,37
2.6
1,22
5.7
Wo
olw
ort
hs
inco
me
no
tes
(583
.0)
(583
.0)
––
–
Ou
tsid
e eq
uit
y in
tere
st(3
.7)
(3.3
)(3
.2)
(2.9
)(2
.5)
Shar
ehol
ders
fund
s93
8.9
1,04
4.6
1,48
1.4
1,36
9.7
1,22
3.2
(Con
tinue
d)
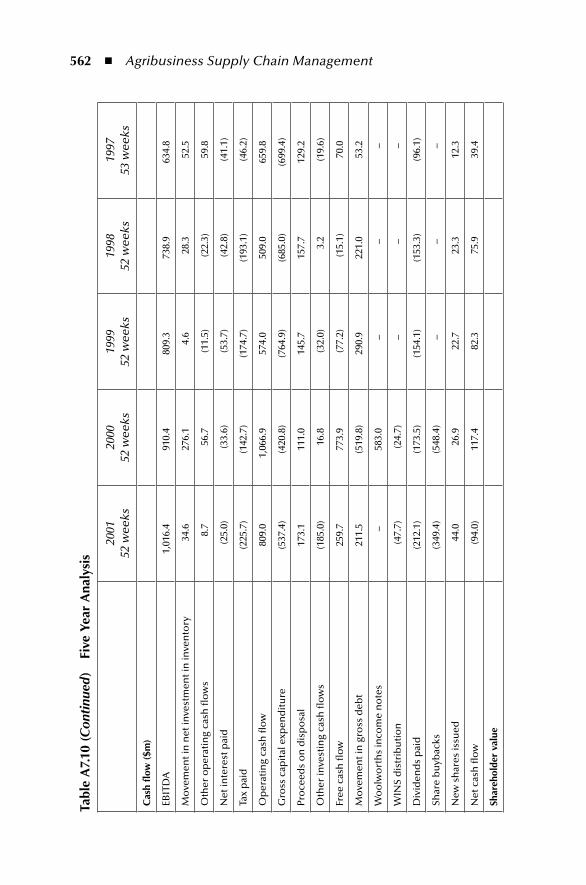
562 ◾ Agribusiness Supply Chain Management
tabl
e A
7.10
(Con
tinu
ed)
Five
yea
r A
naly
sis
2001
52 w
eeks
2000
52 w
eeks
1999
52 w
eeks
1998
52 w
eeks
1997
53 w
eeks
Cas
h fl
ow (
$m)
EBIT
DA
1,01
6.4
910.
480
9.3
738.
963
4.8
Mo
vem
ent i
n n
et in
vest
men
t in
inve
nto
ry34
.627
6.1
4.6
28.3
52.5
Oth
er o
per
atin
g ca
sh fl
ow
s8.
756
.7(1
1.5)
(22.
3)59
.8
Net
inte
rest
pai
d(2
5.0)
(33.
6)(5
3.7)
(42.
8)(4
1.1)
Tax
pai
d(2
25.7
)(1
42.7
)(1
74.7
)(1
93.1
)(4
6.2)
Op
erat
ing
cash
flo
w80
9.0
1,06
6.9
574.
050
9.0
659.
8
Gro
ss c
apit
al e
xpen
dit
ure
(537
.4)
(420
.8)
(764
.9)
(685
.0)
(699
.4)
Pro
ceed
s o
n d
isp
osa
l17
3.1
111.
014
5.7
157.
712
9.2
Oth
er in
vest
ing
cash
flo
ws
(185
.0)
16.8
(32.
0)3.
2(1
9.6)
Free
cas
h fl
ow
259.
777
3.9
(77.
2)(1
5.1)
70.0
Mo
vem
ent i
n g
ross
deb
t21
1.5
(519
.8)
290.
922
1.0
53.2
Wo
olw
ort
hs
inco
me
no
tes
–58
3.0
––
–
WIN
S d
istr
ibu
tio
n(4
7.7)
(24.
7)–
––
Div
iden
ds
pai
d(2
12.1
)(1
73.5
)(1
54.1
)(1
53.3
)(9
6.1)
Shar
e b
uyb
acks
(349
.4)
(548
.4)
––
–
New
sh
ares
issu
ed44
.026
.922
.723
.312
.3
Net
cas
h fl
ow
(94.
0)11
7.4
82.3
75.9
39.4
Shar
ehol
der
valu
e
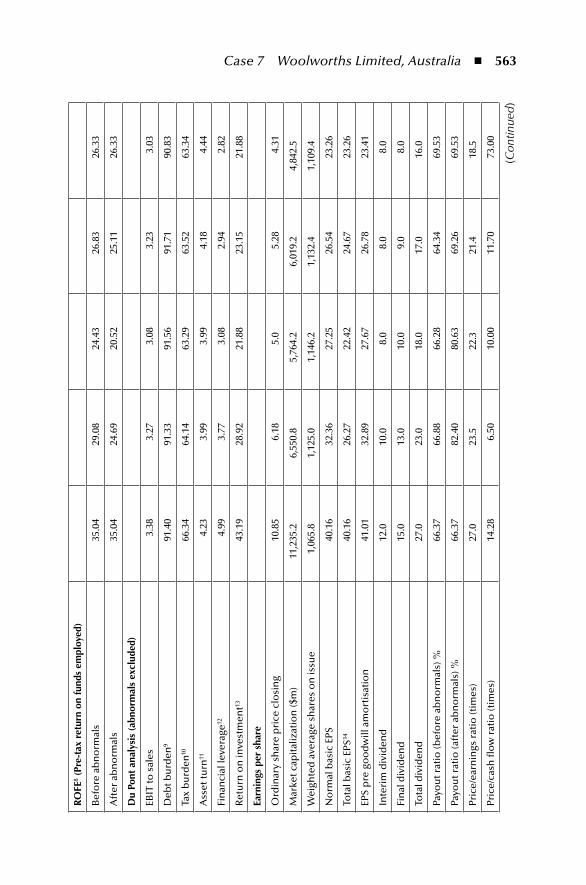
Case 7 Woolworths Limited, Australia ◾ 563
ro
Fe8 (
pre-
tax
retu
rn o
n fu
nds
empl
oyed
)
Bef
ore
ab
no
rmal
s35
.04
29.0
824
.43
26.8
326
.33
Aft
er a
bn
orm
als
35.0
424
.69
20.5
225
.11
26.3
3
Du
pont
ana
lysi
s (a
bnor
mal
s ex
clud
ed)
EBIT
to s
ales
3.38
3.27
3.08
3.23
3.03
Deb
t bu
rden
991
.40
91.3
391
.56
91.7
190
.83
Tax
bu
rden
1066
.34
64.1
463
.29
63.5
263
.34
Ass
et tu
rn11
4.23
3.99
3.99
4.18
4.44
Fin
anci
al le
vera
ge12
4.99
3.77
3.08
2.94
2.82
Ret
urn
on
inve
stm
ent13
43.1
928
.92
21.8
823
.15
21.8
8
earn
ings
per
sha
re
Ord
inar
y sh
are
pri
ce c
losi
ng
10.8
56.
185.
05.
284.
31
Mar
ket c
apit
aliz
atio
n ($
m)
11,2
35.2
6,55
0.8
5,76
4.2
6,01
9.2
4,84
2.5
Wei
ghte
d a
vera
ge s
har
es o
n is
sue
1,06
5.8
1,12
5.0
1,14
6.2
1,13
2.4
1,10
9.4
No
rmal
bas
ic E
PS40
.16
32.3
627
.25
26.5
423
.26
Tota
l bas
ic E
PS14
40.1
626
.27
22.4
224
.67
23.2
6
EPS
pre
go
od
will
am
ort
isat
ion
41.0
132
.89
27.6
726
.78
23.4
1
Inte
rim
div
iden
d12
.010
.08.
08.
08.
0
Fin
al d
ivid
end
15.0
13.0
10.0
9.0
8.0
Tota
l div
iden
d27
.023
.018
.017
.016
.0
Payo
ut r
atio
(bef
ore
ab
no
rmal
s) %
66.3
766
.88
66.2
864
.34
69.5
3
Payo
ut r
atio
(aft
er a
bn
orm
als)
%66
.37
82.4
080
.63
69.2
669
.53
Pric
e/ea
rnin
gs r
atio
(tim
es)
27.0
23.5
22.3
21.4
18.5
Pric
e/ca
sh fl
ow
rat
io (t
imes
)14
.28
6.50
10.0
011
.70
73.0
0
(Con
tinue
d)
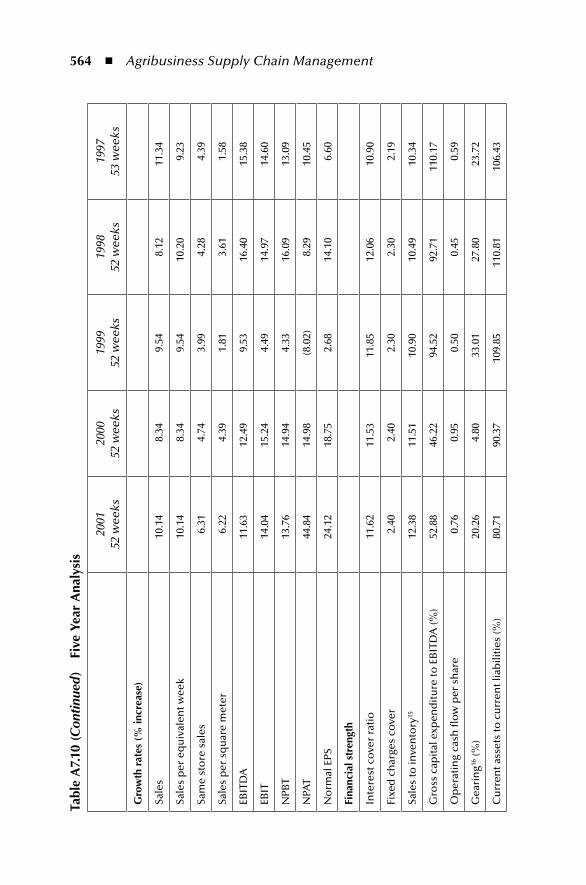
564 ◾ Agribusiness Supply Chain Management
tabl
e A
7.10
(Con
tinu
ed)
Five
yea
r A
naly
sis
2001
52 w
eeks
2000
52 w
eeks
1999
52 w
eeks
1998
52 w
eeks
1997
53 w
eeks
Gro
wth
rat
es (
% in
crea
se)
Sale
s10
.14
8.34
9.54
8.12
11.3
4
Sale
s p
er e
qu
ival
ent w
eek
10.1
48.
349.
5410
.20
9.23
Sam
e st
ore
sal
es6.
314.
743.
994.
284.
39
Sale
s p
er s
qu
are
met
er6.
224.
391.
813.
611.
58
EBIT
DA
11.6
312
.49
9.53
16.4
015
.38
EBIT
14.0
415
.24
4.49
14.9
714
.60
NPB
T13
.76
14.9
44.
3316
.09
13.0
9
NPA
T44
.84
14.9
8(8
.02)
8.29
10.4
5
No
rmal
EPS
24.1
218
.75
2.68
14.1
06.
60
Fina
ncia
l str
engt
h
Inte
rest
co
ver
rati
o11
.62
11.5
311
.85
12.0
610
.90
Fixe
d c
har
ges
cove
r2.
402.
402.
302.
302.
19
Sale
s to
inve
nto
ry15
12.3
811
.51
10.9
010
.49
10.3
4
Gro
ss c
apit
al e
xpen
dit
ure
to E
BIT
DA
(%)
52.8
846
.22
94.5
292
.71
110.
17
Op
erat
ing
cash
flo
w p
er s
har
e0.
760.
950.
500.
450.
59
Gea
rin
g16 (%
)20
.26
4.80
33.0
127
.80
23.7
2
Cu
rren
t ass
ets
to c
urr
ent l
iab
iliti
es (%
)80
.71
90.3
710
9.85
110.
8110
6.43
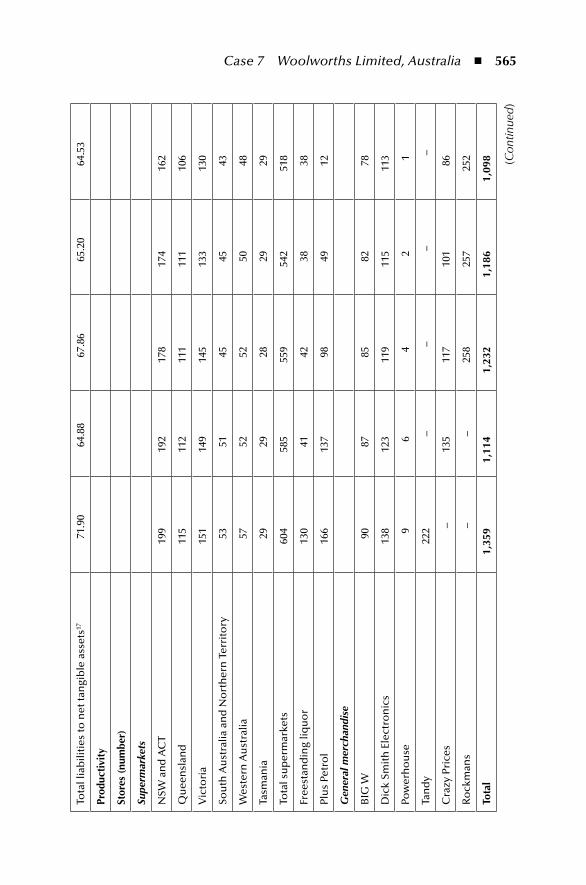
Case 7 Woolworths Limited, Australia ◾ 565
Tota
l lia
bili
ties
to n
et ta
ngi
ble
ass
ets17
71.9
064
.88
67.8
665
.20
64.5
3
prod
ucti
vity
Stor
es (
num
ber)
Supe
rmar
kets
NSW
an
d A
CT
199
192
178
174
162
Qu
een
slan
d11
511
211
111
110
6
Vic
tori
a15
114
914
513
313
0
Sou
th A
ust
ralia
an
d N
ort
her
n T
erri
tory
5351
4545
43
Wes
tern
Au
stra
lia57
5252
5048
Tasm
ania
2929
2829
29
Tota
l su
per
mar
kets
604
585
559
542
518
Free
stan
din
g liq
uo
r13
041
4238
38
Plu
s Pe
tro
l16
613
798
4912
Gen
eral
mer
chan
dise
BIG
W90
8785
8278
Dic
k Sm
ith
Ele
ctro
nic
s13
812
311
911
511
3
Pow
erh
ou
se9
64
21
Tan
dy
222
––
––
Cra
zy P
rice
s–
135
117
101
86
Ro
ckm
ans
––
258
257
252
tota
l1,
359
1,11
41,
232
1,18
61,
098 (C
ontin
ued)
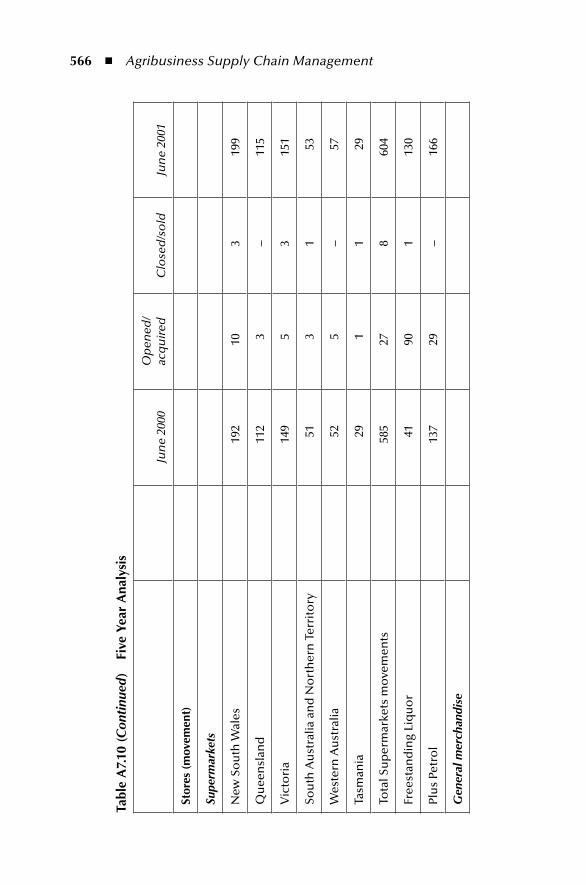
566 ◾ Agribusiness Supply Chain Management
tabl
e A
7.10
(Con
tinu
ed)
Five
yea
r A
naly
sis
Jun
e 20
00O
pen
ed/
acq
uir
edC
lose
d/s
old
Jun
e 20
01
Stor
es (
mov
emen
t)
Supe
rmar
kets
New
So
uth
Wal
es19
210
319
9
Qu
een
slan
d11
23
–11
5
Vic
tori
a14
95
315
1
Sou
th A
ust
ralia
an
d N
ort
her
n T
erri
tory
513
153
Wes
tern
Au
stra
lia52
5–
57
Tasm
ania
291
129
Tota
l Su
per
mar
kets
mo
vem
ents
585
278
604
Free
stan
din
g Li
qu
or
4190
113
0
Plu
s Pe
tro
l13
729
–16
6
Gen
eral
mer
chan
dise
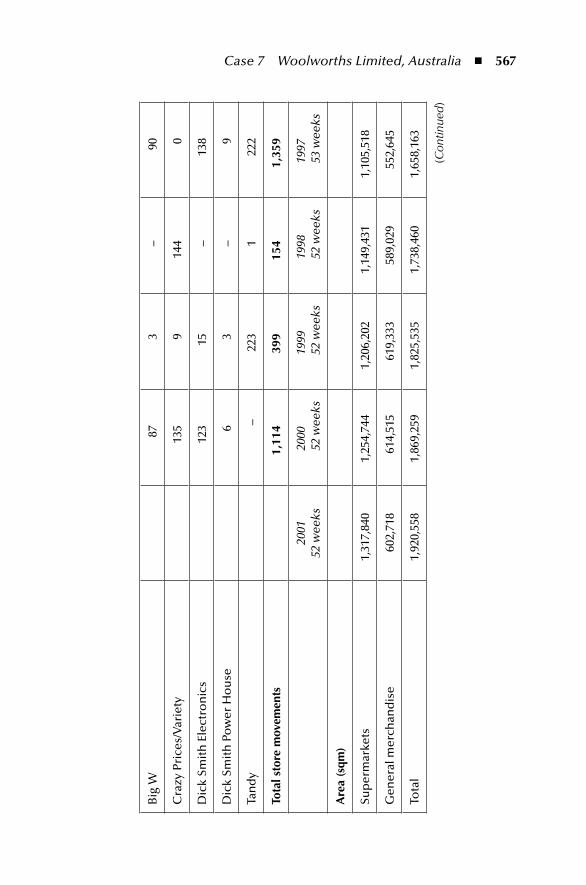
Case 7 Woolworths Limited, Australia ◾ 567
Big
W87
3–
90
Cra
zy P
rice
s/V
arie
ty13
59
144
0
Dic
k Sm
ith
Ele
ctro
nic
s12
315
–13
8
Dic
k Sm
ith
Po
wer
Ho
use
63
–9
Tan
dy
–22
31
222
tota
l sto
re m
ovem
ents
1,11
439
915
41,
359
2001
52 w
eeks
2000
52 w
eeks
1999
52 w
eeks
1998
52 w
eeks
1997
53 w
eeks
Are
a (s
qm)
Sup
erm
arke
ts1,
317,
840
1,25
4,74
41,
206,
202
1,14
9,43
11,
105,
518
Gen
eral
mer
chan
dis
e60
2,71
861
4,51
561
9,33
358
9,02
955
2,64
5
Tota
l1,
920,
558
1,86
9,25
91,
825,
535
1,73
8,46
01,
658,
163
(Con
tinue
d)
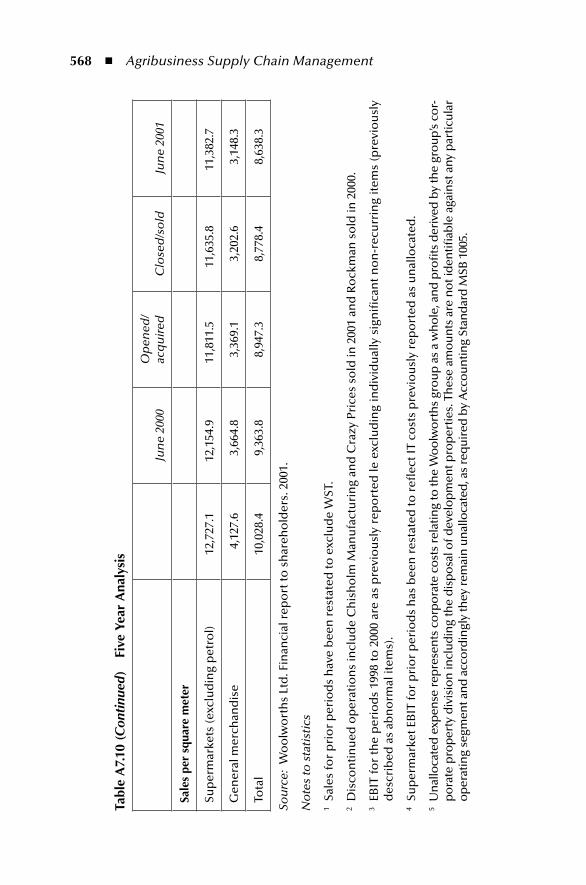
568 ◾ Agribusiness Supply Chain Management
tabl
e A
7.10
(Con
tinu
ed)
Five
yea
r A
naly
sis
Jun
e 20
00O
pen
ed/
acq
uir
edC
lose
d/s
old
Jun
e 20
01
Sale
s pe
r sq
uare
met
er
Sup
erm
arke
ts (e
xclu
din
g p
etro
l)12
,727
.112
,154
.911
,811
.511
,635
.811
,382
.7
Gen
eral
mer
chan
dis
e4,
127.
63,
664.
83,
369.
13,
202.
63,
148.
3
Tota
l10
,028
.49,
363.
88,
947.
38,
778.
48,
638.
3
Sou
rce:
Wo
olw
ort
hs
Ltd
. Fin
anci
al r
epo
rt to
sh
areh
old
ers.
200
1.
No
tes
to s
tati
stic
s
1 Sa
les
for
pri
or
per
iod
s h
ave
bee
n r
esta
ted
to e
xclu
de
WST
.
2 D
isco
nti
nu
ed o
per
atio
ns
incl
ud
e C
his
ho
lm M
anu
fact
uri
ng
and
Cra
zy P
rice
s so
ld in
200
1 an
d R
ock
man
so
ld in
200
0.
3 EB
IT f
or
the
per
iod
s 19
98 t
o 2
000
are
as p
revi
ou
sly
rep
ort
ed le
exc
lud
ing
ind
ivid
ual
ly s
ign
ifica
nt
no
n-r
ecu
rrin
g it
ems
(pre
vio
usl
y d
escr
ibed
as
abn
orm
al it
ems)
.
4 Su
per
mar
ket E
BIT
for
pri
or
per
iod
s h
as b
een
res
tate
d to
refl
ect I
T co
sts
pre
vio
usl
y re
po
rted
as
un
allo
cate
d.
5 U
nal
loca
ted
exp
ense
rep
rese
nts
co
rpo
rate
co
sts
rela
ting
to th
e W
oo
lwo
rth
s gr
ou
p a
s a
wh
ole
, an
d p
rofi
ts d
eriv
ed b
y th
e gr
ou
p’s
cor-
po
rate
pro
per
ty d
ivis
ion
incl
ud
ing
the
dis
po
sal o
f dev
elo
pm
ent p
rop
ertie
s. T
hes
e am
ou
nts
are
no
t id
entifi
able
aga
inst
any
par
ticu
lar
op
erat
ing
segm
ent a
nd
acc
ord
ingl
y th
ey r
emai
n u
nal
loca
ted
, as
req
uir
ed b
y A
cco
un
ting
Stan
dar
d M
SB 1
005.
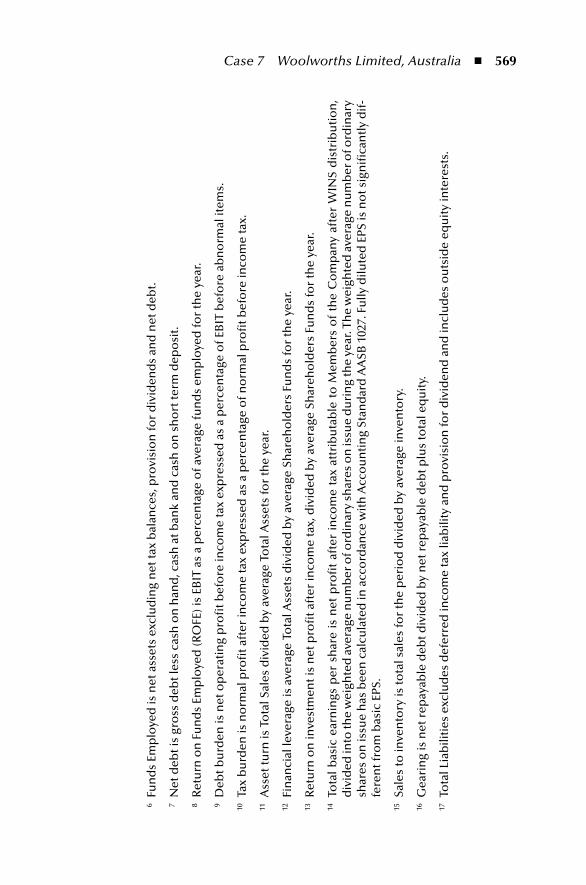
Case 7 Woolworths Limited, Australia ◾ 569
6 F
un
ds
Emp
loye
d is
net
ass
ets
excl
ud
ing
net
tax
bal
ance
s, p
rovi
sio
n fo
r d
ivid
end
s an
d n
et d
ebt.
7 N
et d
ebt i
s gr
oss
deb
t les
s ca
sh o
n h
and
, cas
h a
t ban
k an
d c
ash
on
sh
ort
term
dep
osi
t.
8 R
etu
rn o
n F
un
ds
Emp
loye
d (R
OFE
) is
EBIT
as
a p
erce
nta
ge o
f ave
rage
fun
ds
emp
loye
d fo
r th
e ye
ar.
9 D
ebt b
urd
en is
net
op
erat
ing
pro
fit b
efo
re in
com
e ta
x ex
pre
ssed
as
a p
erce
nta
ge o
f EB
IT b
efo
re a
bn
orm
al it
ems.
10 T
ax b
urd
en is
no
rmal
pro
fit a
fter
inco
me
tax
exp
ress
ed a
s a
per
cen
tage
of n
orm
al p
rofi
t bef
ore
inco
me
tax.
11 A
sset
turn
is T
ota
l Sal
es d
ivid
ed b
y av
erag
e To
tal A
sset
s fo
r th
e ye
ar.
12 F
inan
cial
leve
rage
is a
vera
ge T
ota
l Ass
ets
div
ided
by
aver
age
Shar
eho
lder
s Fu
nd
s fo
r th
e ye
ar.
13 R
etu
rn o
n in
vest
men
t is
net
pro
fit a
fter
inco
me
tax,
div
ided
by
aver
age
Shar
eho
lder
s Fu
nd
s fo
r th
e ye
ar.
14 T
ota
l b
asic
ear
nin
gs p
er s
har
e is
net
pro
fit
afte
r in
com
e ta
x at
trib
uta
ble
to
Mem
ber
s o
f th
e C
om
pan
y af
ter
WIN
S d
istr
ibu
tio
n,
div
ided
into
the
wei
ghte
d a
vera
ge n
um
ber
of o
rdin
ary
shar
es o
n is
sue
du
rin
g th
e ye
ar. T
he
wei
ghte
d a
vera
ge n
um
ber
of o
rdin
ary
shar
es o
n is
sue
has
bee
n c
alcu
late
d in
acc
ord
ance
wit
h A
cco
un
tin
g St
and
ard
AA
SB 1
027.
Fu
lly d
ilute
d E
PS is
no
t sig
nifi
can
tly
dif
-fe
ren
t fro
m b
asic
EPS
.
15 S
ales
to in
ven
tory
is to
tal s
ales
for
the
per
iod
div
ided
by
aver
age
inve
nto
ry.
16 G
eari
ng
is n
et r
epay
able
deb
t div
ided
by
net
rep
ayab
le d
ebt p
lus
tota
l eq
uit
y.
17 T
ota
l Lia
bili
ties
exc
lud
es d
efer
red
inco
me
tax
liab
ility
an
d p
rovi
sio
n fo
r d
ivid
end
an
d in
clu
des
ou
tsid
e eq
uit
y in
tere
sts.
570 ◾ Agribusiness Supply Chain Management
Supply chain strategy was developed after evaluating systems and logistics features of leading global retailers following which the company determined an appropriate and optimum solution for Woolworths. This solution would address the following key design considerations:
◾ Common integrated systems required to support supply chain operations ◾ Store supply chain costs (from the supermarkets’ back dock to the shelf) ◾ DC location and numbers ◾ DC function (cross-docking and flow-through) ◾ Composite supply chain (integrating cold and ambient) ◾ Transport management (primary and secondary freight) ◾ Process improvement across the network ◾ Improve buying and supply chain systems to help make cost savings in these areas ◾ Make distribution process easier and much efficient for the stores
The Mercury Programme would be the umbrella term for all projects across the business that impacted the way in which products were supplied from vendors to customers. It would be the consolidation of many projects already underway within supply chain, buying & marketing, and supermarket operations, with the support of IT and human resources.
One of the important decisions was about consolidating the 31 DCs into a more responsive and cost efficient supply system. Figure A7.5 gives the current DC network. Table A7.12 gives the specific locations of the DCs and product types being supplied. The proposed DC network and locations are given in Figure A7.6. This network would consist of nine regional DCs (RDCs) and two national DCs (NDCs). Figure A7.7 gives the before and after structure of flows between DCs and outlets. The rationale for this proposal is given in Appendix 7.1.
The NDCs would distribute to over 700 stores nationally. The most significant change and challenge for NDC was to convert its operations from servicing just over 238 NSW stores to servicing nine RDCs and over 700 stores nationally.
For example, the Sydney NDC was one of the two NDCs in Australia. The other was Mulgrave Grocery in Melbourne. Sydney NDC would range ambient products such as slow moving grocery and general merchandize lines. It would service Sydney and Melbourne Metro stores directly from the NDC and service all other stores via their respective RDCs.
Delivery frequencies would change from daily store deliveries to once or twice a week. For example, Yennora DC would move 700,000 cartons in a seven day oper-ation. Sydney NDC would move 1.3 million cartons, previously a six day operation.
The RDCs, such as Sydney and Wyong RDCs, would service supermarkets with fast moving lines. They would be a composite facility, providing fast moving grocery, general merchandize, frozen, locally manufactured and all chilled and fresh products to stores. Two-third of the goods supplied would be from Sydney or Melbourne NDCs. Reducing the 31 DCs into 11 multi-temperature sites would reduce DC operating costs by $14 m in FY08.
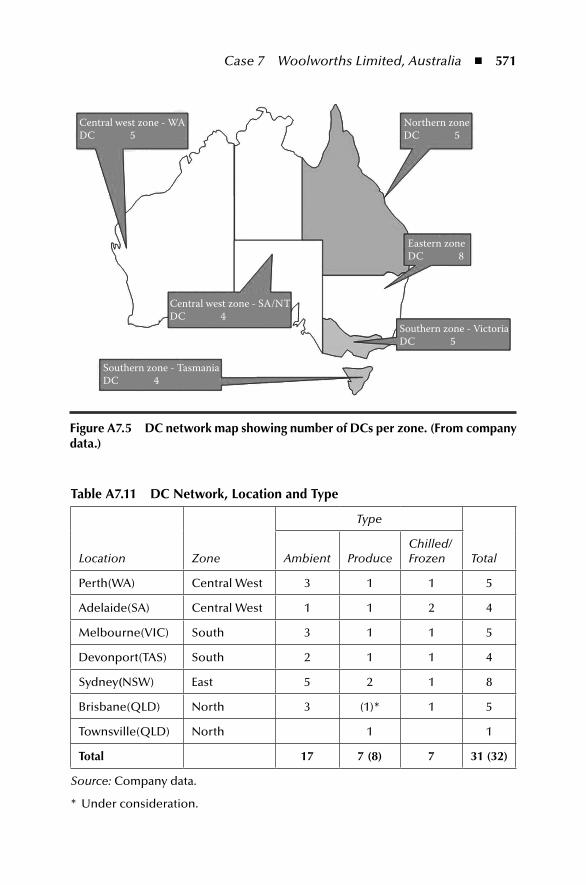
Case 7 Woolworths Limited, Australia ◾ 571
table A7.11 DC network, Location and type
Location Zone
Type
TotalAmbient ProduceChilled/Frozen
Perth(WA) Central West 3 1 1 5
Adelaide(SA) Central West 1 1 2 4
Melbourne(VIC) South 3 1 1 5
Devonport(TAS) South 2 1 1 4
Sydney(NSW) East 5 2 1 8
Brisbane(QLD) North 3 (1)* 1 5
Townsville(QLD) North 1 1
total 17 7 (8) 7 31 (32)
Source: Company data.
* Under consideration.
Central west zone - WADC 5
Central west zone - SA/NTDC 4
Southern zone - TasmaniaDC 4
Northern zoneDC 5
Eastern zoneDC 8
Southern zone - VictoriaDC 5
Figure A7.5 DC network map showing number of DCs per zone. (From company data.)
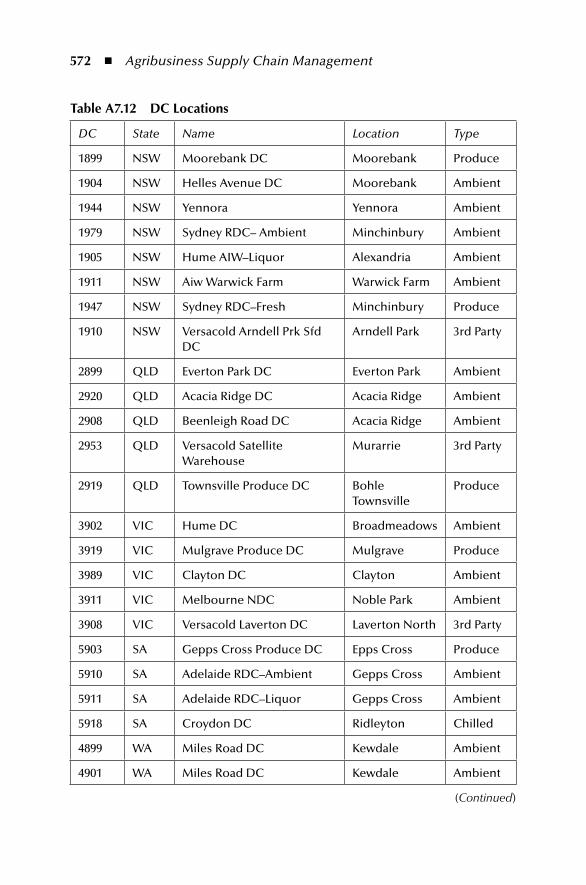
572 ◾ Agribusiness Supply Chain Management
table A7.12 DC Locations
DC State Name Location Type
1899 NSW Moorebank DC Moorebank Produce
1904 NSW Helles Avenue DC Moorebank Ambient
1944 NSW Yennora Yennora Ambient
1979 NSW Sydney RDC– Ambient Minchinbury Ambient
1905 NSW Hume AIW–Liquor Alexandria Ambient
1911 NSW Aiw Warwick Farm Warwick Farm Ambient
1947 NSW Sydney RDC–Fresh Minchinbury Produce
1910 NSW Versacold Arndell Prk Sfd DC
Arndell Park 3rd Party
2899 QLD Everton Park DC Everton Park Ambient
2920 QLD Acacia Ridge DC Acacia Ridge Ambient
2908 QLD Beenleigh Road DC Acacia Ridge Ambient
2953 QLD Versacold Satellite Warehouse
Murarrie 3rd Party
2919 QLD Townsville Produce DC Bohle Townsville
Produce
3902 VIC Hume DC Broadmeadows Ambient
3919 VIC Mulgrave Produce DC Mulgrave Produce
3989 VIC Clayton DC Clayton Ambient
3911 VIC Melbourne NDC Noble Park Ambient
3908 VIC Versacold Laverton DC Laverton North 3rd Party
5903 SA Gepps Cross Produce DC Epps Cross Produce
5910 SA Adelaide RDC–Ambient Gepps Cross Ambient
5911 SA Adelaide RDC–Liquor Gepps Cross Ambient
5918 SA Croydon DC Ridleyton Chilled
4899 WA Miles Road DC Kewdale Ambient
4901 WA Miles Road DC Kewdale Ambient
(Continued)
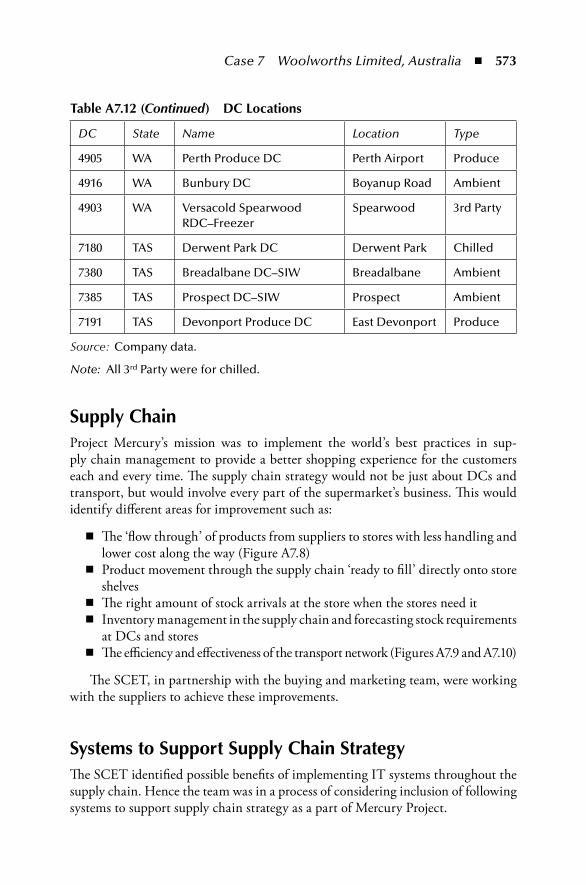
Case 7 Woolworths Limited, Australia ◾ 573
Supply ChainProject Mercury’s mission was to implement the world’s best practices in sup-ply chain management to provide a better shopping experience for the customers each and every time. The supply chain strategy would not be just about DCs and transport, but would involve every part of the supermarket’s business. This would identify different areas for improvement such as:
◾ The ‘flow through’ of products from suppliers to stores with less handling and lower cost along the way (Figure A7.8)
◾ Product movement through the supply chain ‘ready to fill’ directly onto store shelves
◾ The right amount of stock arrivals at the store when the stores need it ◾ Inventory management in the supply chain and forecasting stock requirements
at DCs and stores ◾ The efficiency and effectiveness of the transport network (Figures A7.9 and A7.10)
The SCET, in partnership with the buying and marketing team, were working with the suppliers to achieve these improvements.
Systems to Support Supply Chain StrategyThe SCET identified possible benefits of implementing IT systems throughout the supply chain. Hence the team was in a process of considering inclusion of following systems to support supply chain strategy as a part of Mercury Project.
table A7.12 (Continued) DC Locations
DC State Name Location Type
4905 WA Perth Produce DC Perth Airport Produce
4916 WA Bunbury DC Boyanup Road Ambient
4903 WA Versacold Spearwood RDC–Freezer
Spearwood 3rd Party
7180 TAS Derwent Park DC Derwent Park Chilled
7380 TAS Breadalbane DC–SIW Breadalbane Ambient
7385 TAS Prospect DC–SIW Prospect Ambient
7191 TAS Devonport Produce DC East Devonport Produce
Source: Company data.
Note: All 3rd Party were for chilled.
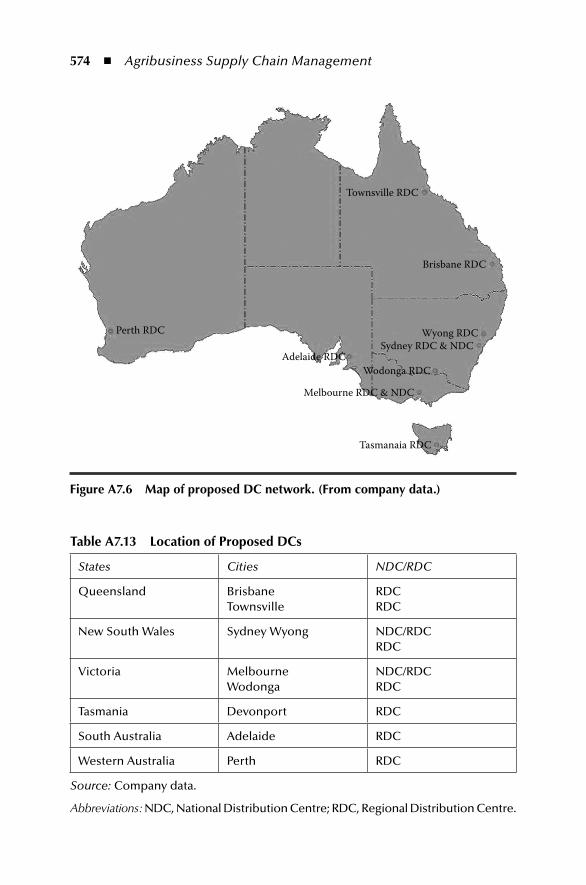
574 ◾ Agribusiness Supply Chain Management
table A7.13 Location of proposed DCs
States Cities NDC/RDC
Queensland BrisbaneTownsville
RDCRDC
New South Wales Sydney Wyong NDC/RDCRDC
Victoria MelbourneWodonga
NDC/RDCRDC
Tasmania Devonport RDC
South Australia Adelaide RDC
Western Australia Perth RDC
Source: Company data.
Abbreviations: NDC, National Distribution Centre; RDC, Regional Distribution Centre.
Perth RDC
Adelaide RDC
Tasmanaia RDC
Melbourne RDC & NDC
Wodonga RDC
Wyong RDC
Brisbane RDC
Townsville RDC
Sydney RDC & NDC
Figure A7.6 map of proposed DC network. (From company data.)
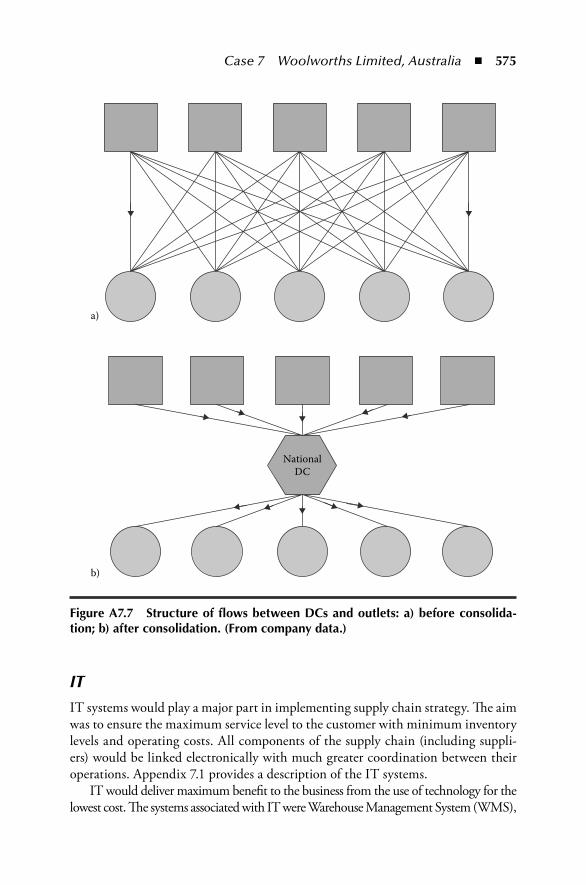
Case 7 Woolworths Limited, Australia ◾ 575
ITIT systems would play a major part in implementing supply chain strategy. The aim was to ensure the maximum service level to the customer with minimum inventory levels and operating costs. All components of the supply chain (including suppli-ers) would be linked electronically with much greater coordination between their operations. Appendix 7.1 provides a description of the IT systems.
IT would deliver maximum benefit to the business from the use of technology for the lowest cost. The systems associated with IT were Warehouse Management System (WMS),
a)
b)
NationalDC
Figure A7.7 Structure of flows between DCs and outlets: a) before consolida-tion; b) after consolidation. (From company data.)
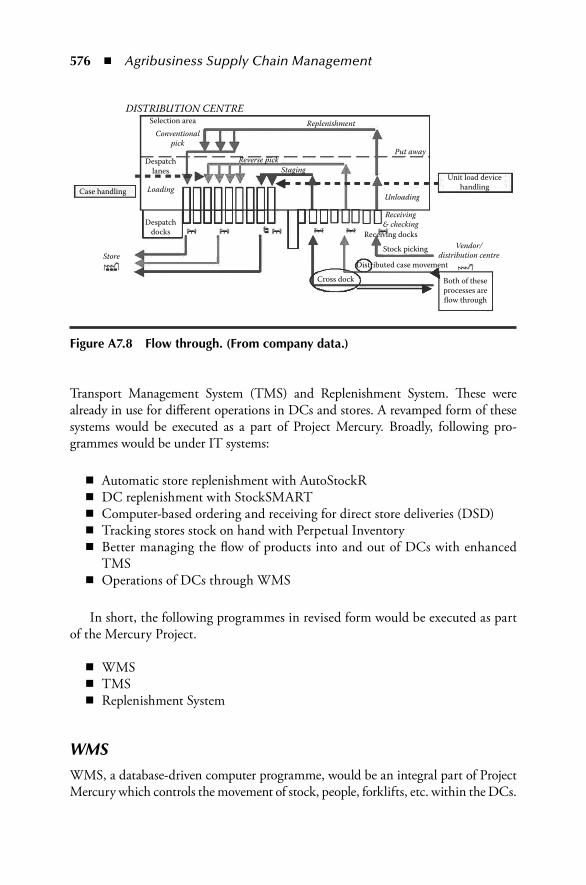
576 ◾ Agribusiness Supply Chain Management
Transport Management System (TMS) and Replenishment System. These were already in use for different operations in DCs and stores. A revamped form of these systems would be executed as a part of Project Mercury. Broadly, following pro-grammes would be under IT systems:
◾ Automatic store replenishment with AutoStockR ◾ DC replenishment with StockSMART ◾ Computer-based ordering and receiving for direct store deliveries (DSD) ◾ Tracking stores stock on hand with Perpetual Inventory ◾ Better managing the flow of products into and out of DCs with enhanced
TMS ◾ Operations of DCs through WMS
In short, the following programmes in revised form would be executed as part of the Mercury Project.
◾ WMS ◾ TMS ◾ Replenishment System
WMSWMS, a database-driven computer programme, would be an integral part of Project Mercury which controls the movement of stock, people, forklifts, etc. within the DCs.
DISTRIBUTION CENTRESelection area
Despatchlanes
Stock picking
Case handling
Unit load devicehandling
Both of theseprocesses are�ow through
Distributed case movement
Cross dock
Despatchdocks
ReplenishmentConventional
pick
Reverse pickStaging
Put away
Unloading
Receiving& checking
Vendor/distribution centre
Receiving docks
Loading
Store
Figure A7.8 Flow through. (From company data.)
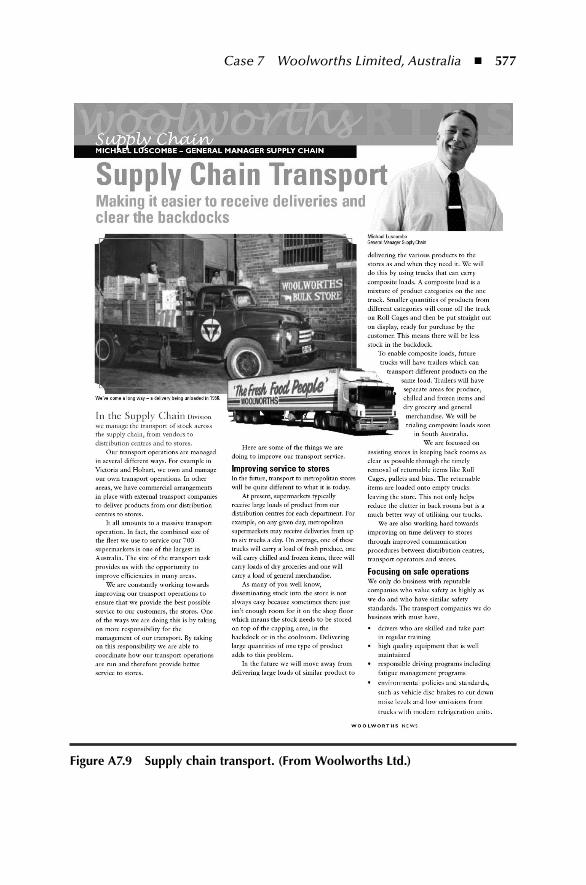
Case 7 Woolworths Limited, Australia ◾ 577
Figure A7.9 Supply chain transport. (From Woolworths Ltd.)
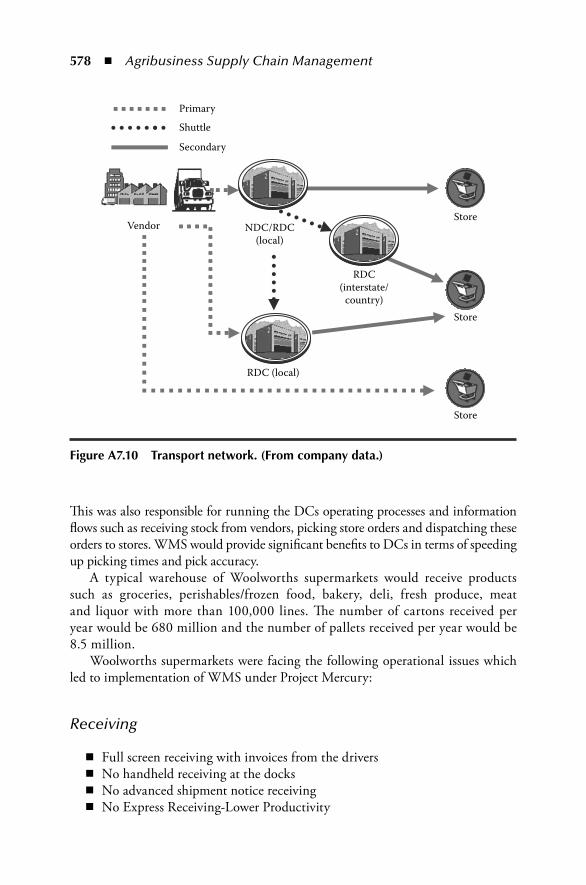
578 ◾ Agribusiness Supply Chain Management
This was also responsible for running the DCs operating processes and information flows such as receiving stock from vendors, picking store orders and dispatching these orders to stores. WMS would provide significant benefits to DCs in terms of speeding up picking times and pick accuracy.
A typical warehouse of Woolworths supermarkets would receive products such as groceries, perishables/frozen food, bakery, deli, fresh produce, meat and liquor with more than 100,000 lines. The number of cartons received per year would be 680 million and the number of pallets received per year would be 8.5 million.
Woolworths supermarkets were facing the following operational issues which led to implementation of WMS under Project Mercury:
Receiving
◾ Full screen receiving with invoices from the drivers ◾ No handheld receiving at the docks ◾ No advanced shipment notice receiving ◾ No Express Receiving-Lower Productivity
Primary
Shuttle
Secondary
VendorStore
Store
Store
NDC/RDC(local)
RDC(interstate/
country)
RDC (local)
Figure A7.10 transport network. (From company data.)
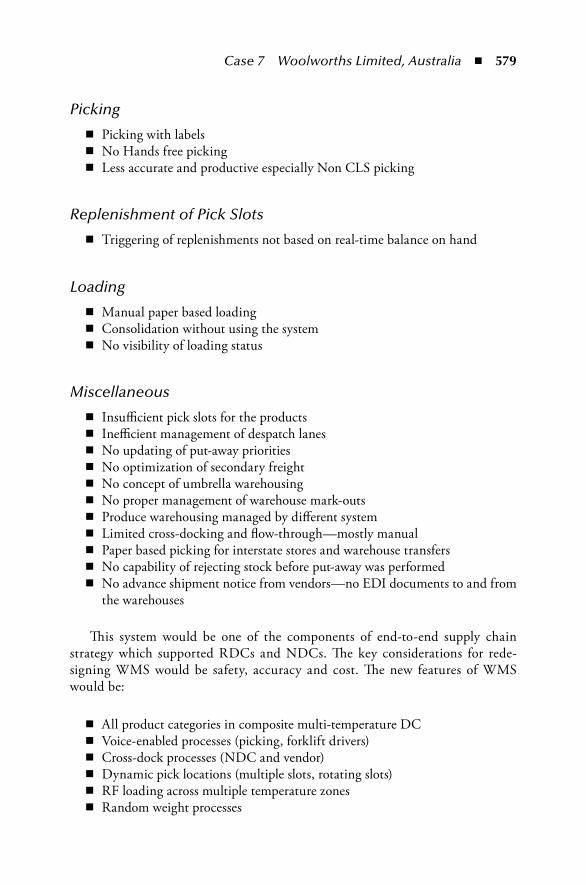
Case 7 Woolworths Limited, Australia ◾ 579
Picking
◾ Picking with labels ◾ No Hands free picking ◾ Less accurate and productive especially Non CLS picking
Replenishment of Pick Slots
◾ Triggering of replenishments not based on real-time balance on hand
Loading
◾ Manual paper based loading ◾ Consolidation without using the system ◾ No visibility of loading status
Miscellaneous
◾ Insufficient pick slots for the products ◾ Inefficient management of despatch lanes ◾ No updating of put-away priorities ◾ No optimization of secondary freight ◾ No concept of umbrella warehousing ◾ No proper management of warehouse mark-outs ◾ Produce warehousing managed by different system ◾ Limited cross-docking and flow-through—mostly manual ◾ Paper based picking for interstate stores and warehouse transfers ◾ No capability of rejecting stock before put-away was performed ◾ No advance shipment notice from vendors—no EDI documents to and from
the warehouses
This system would be one of the components of end-to-end supply chain strategy which supported RDCs and NDCs. The key considerations for rede-signing WMS would be safety, accuracy and cost. The new features of WMS would be:
◾ All product categories in composite multi-temperature DC ◾ Voice-enabled processes (picking, forklift drivers) ◾ Cross-dock processes (NDC and vendor) ◾ Dynamic pick locations (multiple slots, rotating slots) ◾ RF loading across multiple temperature zones ◾ Random weight processes
580 ◾ Agribusiness Supply Chain Management
WMS strategy would also be set up for pilot site selection and rollout.Following would be the business benefits of implementing WMS:
◾ A single integrated WMS would be implemented to support the future net-work of multi-temperature distribution centres (RDCs)
◾ QA management would allow quality assurance of pallets received at the DC and rejection of low quality produce products
◾ Products would be maintained with quality suffix and inter item transfers would be performed
◾ Increased picking accuracy ◾ Increased labour productivity ◾ Reduced cost of printing and distributing picking documents ◾ Reduced cost of re-keying order amendments, picking confirmations ◾ Hands free and eyes free–makes picking easier (helpful for items like frozen
foods which were handled through gloves) ◾ Real time stock updates ◾ Would enable business to inquire and maintain the cross dock information by
transport order, thus enhancing the visibility of the incoming cross dock Unit Load Devices (ULDs) from NDC and the cross dock ULDs that had arrived in RDC but were not yet loaded, thus giving the RDC a better planning capability
◾ Reduced manual intervention required to manage cross dock ULDs in the warehouse
◾ Automation of pallet handling (put away, replenishment, empty pallet handling) in ambient component of the facility
◾ Would satisfy a 2011 design year OM (Other than Meat) throughput of approximately 225 million cartons per year across all categories
DCs would also consider ‘voice picking–hands and eyes free’ technology that eliminates need for paper during the order picking process. It would be the best method for improving picking in DCs. It was expected that accuracy of picking would increase substantially. This would be a step towards store friendly principles.
Company DataTMS
Primary Transport
Primary transport means movement of product from vendors:
◾ to the NDC/RDC network ◾ into an interstate DC for full truck load (FTL) deliveries from vendors ◾ DSD
Case 7 Woolworths Limited, Australia ◾ 581
Shuttle Transport
This was a movement of product between DCs (local, intrastate and interstate DCs).
Secondary Transport
This was a movement of product from the RDCs or NDCs to the stores and the return of ULDs, i.e. roll cages, dollies, crates, etc.
TMS, a web-based software would help manage primary freight (movement of goods from vendors to DCs). It would keep track of the shipments in the transporta-tion process. This would enable the operators to plan accurately and direct the move-ment of trucks to get the stock arriving in the DCs at the right time for the lowest cost. This system was used by Walmart, Tesco and other large retailers overseas.
TMS would be introduced in Project Mercury’s supply chain strategy after identifying the following benefits:
◾ Improved delivery to DCs ◾ Utilization of Woolworths’ volumes to consolidate shipments ◾ Greater control over flow-through and cross-docking ◾ Improved visibility of product movement in the supply chain ◾ Lower inventory
The SCET would manage the transport of stock across the supply chain, from vendors to DCs and to stores. The transport operations, serving 700 supermarkets would be one of the largest in Australia.
CAPs, a Vehicle Scheduling and Routing System would help plan the transport to stores in case of access restrictions to stores due to curfews or physical restrictions. The system would map out the best possible routes and sequences for trucks to take.
Replenishment SystemVarious replenishment programmes would be initiated as part of the Mercury initiative:
◾ Automation of the existing replenishment system ◾ Fresh Food, Produce and DSD integration into automated replenishment system ◾ Integration of DC forecasting process and store replenishment process
Following would be the major replenishment systems considered for implementation:
◾ StockSMART–Improved DC level forecasting including promotions ◾ AutoStockR–Store forecasting and replenishment ◾ WOWLink–Improved information to vendors ◾ DSD Conversion Project ◾ Self-Ready Trays ◾ Roll Cages
582 ◾ Agribusiness Supply Chain Management
A major task would be to build the link between store and DC replenishment to support an integrated solution.
Following would be the future considerations of replenishment system:
◾ Store level promotional forecasting/replenishment ◾ Mix of aggregated store forecasts (fast movers) and DC-level forecasts (slow
movers) for DC replenishment ◾ Introduction of system forecasting and replenishment into fresh food categories ◾ Closer relationships with key vendors to support flow-through
StockSMART (DC Forecast Based Replenishment)
StockSMART would be an automated forecasting and replenishment system for stock in DCs. It would be implemented in all DCs for grocery and general mer-chandize items. Service levels would be expected to improve by over 2% while 3 days’ worth of inventory would be removed from the DCs.
AutoStockR (Store Forecast Based Replenishment)
AutostockR or Automated Stock Replenishment would be a computer assisted ordering system that would order stocks for departments in supermarkets, including liquor. This system would be a key foundation of the Mercury Project. AutostockR would provide a forecast for each item in every supermarket across the country. This forecast would enable supply chain to gain greater vision of store requirements, improving DC service levels and the way in which stock would deliver to super-markets. AutostockR would be running in over 100 supermarkets. The potential benefits of this system would be improved productivity, reduction in store out of stocks, unnecessary inventory in stores, and double handling in stores.
WOW Link
WOW Link would be an electronic resource, via internet to monitor Woolworths information from across the buying and supply chain areas. This would provide Woolworths and its trading partners access to:
◾ Forecast Replenishment plans ◾ DCs inventories ◾ Details of vendor’s purchase orders ◾ Upcoming promotions ◾ Service level information ◾ Allocation details and Woolworths’ product records ◾ A vendor’s logistics performance (via scorecards and alert messages)
Case 7 Woolworths Limited, Australia ◾ 583
Developed in collaboration with a pilot team of 8 trading partners, WOW Link would be a three phased system. The initial phase would provide a basic one way flow of information between Woolworths and its trading partners. The second phase would enable some interaction between the two in terms of exchanging a range of information. The third phase would provide full interaction and collabo-ration between Woolworths and its trading partners.
DSD Conversion Project
Woolworths’ 15% of volume was supplied direct to stores from the vendors. Another valuable component of the Mercury Programme would be the DSD Conversion Project. This project was aimed at converting 50% of DSD vendors over to ware-house supply through Woolworths’ DCs. Benefits would be experienced not only for Woolworths but also for the vendors. There would be an increase in delivery fre-quency to the stores, the removal of congestion at stores’ back docks and reduction in the number of invoices to be processed.
Shelf Ready Trays
Shelf Ready Trays were packed trays wrapped with film or a cardboard sleeve that could directly be fitted on the shelf for display. These would be identified as efficient shelf replenishment methods which would improve productivity as well as occupational health and safety at store level and reduce the end-to-end supply chain costs.
Roll Cages
Roll Cages were ULDs for transporting products from the DCs to the stores, rather than using a pallet. Roll Cages reduced the number of times stock was touched at the store and thus reduced the handling costs. Roll Cages would be introduced in Woolworths DCs and stores in Perth and WA. The SCET would proceed with the next stage of the Roll Cage implementation to other parts of the country.
The rationalization of DCs, combined with new cross-dock and flow-through processes, supported by the new WMS, would utilize the site advantages and further reduce both cost and stock levels, and the cost of transport from DCs to stores. Reducing the volume of DSD and introducing electronic store delivery would reduce costs by utilizing DC’s infrastructures as well as eliminating administration costs. For stores, the introduction of phased replenishment store restocking capabili-ties, along with store ready ULDs (eg. shelf ready trays and roll cages) would reduce overall costs. (myfuture: http://www.myfuture.edu.au/)
584 ◾ Agribusiness Supply Chain Management
Looking ForwardMichael Luscombe was looking for a BPO service provider for his company. He expected that the BPO partner should not only see from the IT perspective but should also have a strategic insight for analyzing the financials of the company. The BPO service provider should be able to visualize the implications of restructuring the distribution network along with implementation of various IT systems. Most important was the position of the company in the competitive world of other retail companies in terms of service and cost.
Appendix 7.1Mercury ProgrammeThe Mercury Programme would be considered as a business transformation for Woolworths supermarkets.
Following were some of the objectives of Mercury Programme:
◾ Changes to business to support the Supply Chain Development Programme (SCDP) are wider than just “Supply Chain” Operations
◾ Significant changes required across supply chain, buying & marketing, IT, stores, vendors
◾ Co-ordinate cross-divisional activities and make it a total business strategy
◾ Currently stores receive stock from multiple DCs ◾ A Regional Distribution Centre consolidates these sites into a single point of
supply for a group of stores ◾ These new Distribution Centres process all merchandize categories, requiring
multiple temperature environments ◾ $14M result from fractionalizing DC labour cost ◾ Together with composite transport, these facilities provide improved service
to stores by enabling multiple deliveries for all product categories ◾ 100% control of DC network ◾ Transport benefits result from reduced number of distribution nodes
As a part of Mercury programme WMS, TMS and Replenishment systems would be implemented. The respective objectives were:
WMS Project ObjectivesDevelop WMS Business Requirements required to support NDCs and RDCs of the future - for all categories.
Case 7 Woolworths Limited, Australia ◾ 585
◾ New Processes: Cross Dock, Carton Flow Through, Voice Picking, optimized system directed work sequencing, etc.
◾ User requirements as defined by current WMS business users ◾ Requirements to support existing processes (interface and integration)
Develop WMS strategy for existing DCs
◾ What should be done with existing DCs from a WMS perspective ◾ Pilot Site selection
TMS Project Objectives
◾ Execution: Support the management and execution of all freight within the organization
◾ Visibility: Provide visibility of freight movement to buyers, vendors, carriers, DC’s, stores and transport operations
◾ Optimization: Optimize freight movement for both inbound (from vendors) and outbound (to stores)
◾ Automation: Remove much of the administrative overhead currently associated with managing transport
◾ Reporting and Monitoring Decision Support: Provide comprehensive reporting and monitoring capability for tracking operational performance and cost.
◾ Make decisions regarding product flows to support the new NDC/RDC flow through network
Replenishment Project ObjectivesKey business requirements to be fulfilled by the future replenishment capability:
◾ Support store service level requirements while reducing store inventory and out-of-stocks
◾ Support delivery flexibility and one touch initiatives to minimize store labour ◾ Standardize processes/systems for store and DC replenishment across all
categories ◾ Warehouse demand forecasting based on aggregated store demand ◾ Responsive to merchandizing strategies such as promotions, events, alloca-
tions, seasonality ◾ Key input for transport planning ◾ Support of flow through (Cross Dock/Reverse Pick) processes ◾ Provide tool to centrally manage service levels and presentation level policies ◾ Support alternate source of supply to provide disaster contingency ◾ Providing medium and long range forecasts to vendors ◾ Provide visibility and measurement of replenishment activities
586 ◾ Agribusiness Supply Chain Management
Network Model ProjectLeading retailer of Australia executed network optimization project and came to a conclusion on the number of DCs to be operated.
Project Brief:
◾ Determine the location and number of RDC and NDC facilities. ◾ Capital costing of proposed DCs infrastructure. ◾ Determine the optimal range configuration and capacity in each facility. ◾ Determine the annual throughput levels guidelines on range in facilities (tak-
ing into account flow through/XD). ◾ Be available for iterative use in the event that input data becomes more accu-
rate or identified constraint conditions deem it appropriate. ◾ The model is required to provide multi period outputs, to be utilized as an
ongoing tool as required.
The Network Modelling Project delivered:The expected number, location and size of the RDCs and NDCs:
◾ The estimated cost of the network ◾ Insights into 2008 DC network and flows ◾ A network data set ◾ Issues for other project teams ◾ Next steps for network modelling process
Key Assumptions:
◾ Five product categories: Ambient, Chilled, Frozen, Meat and fish, Produce ◾ Management of peaks and range changeovers incorporated into network
flows and DC design projects ◾ All produce, chilled, and meat and fish ranged in RDCs ◾ All national frozen lines ranged in NDCs ◾ All local SKUs (including frozen) ranged in RDCs ◾ Each market area serviced by only one RDC ◾ RDCs are allocated the fastest XX Ambient SKUs ◾ Some of which will be ranged and some of which will flow-through
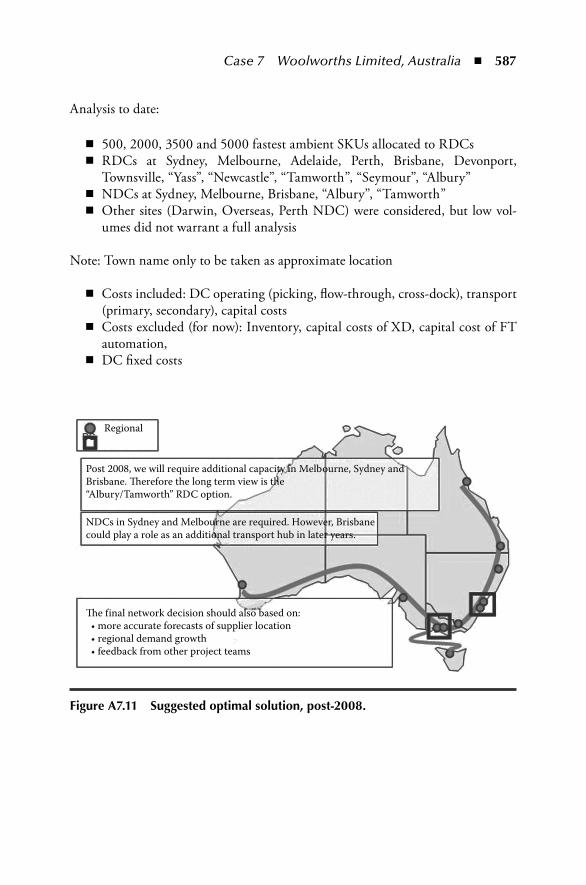
Case 7 Woolworths Limited, Australia ◾ 587
Analysis to date:
◾ 500, 2000, 3500 and 5000 fastest ambient SKUs allocated to RDCs ◾ RDCs at Sydney, Melbourne, Adelaide, Perth, Brisbane, Devonport,
Townsville, “Yass”, “Newcastle”, “Tamworth”, “Seymour”, “Albury” ◾ NDCs at Sydney, Melbourne, Brisbane, “Albury”, “Tamworth” ◾ Other sites (Darwin, Overseas, Perth NDC) were considered, but low vol-
umes did not warrant a full analysis
Note: Town name only to be taken as approximate location
◾ Costs included: DC operating (picking, flow-through, cross-dock), transport (primary, secondary), capital costs
◾ Costs excluded (for now): Inventory, capital costs of XD, capital cost of FT automation,
◾ DC fixed costs
Regional
Post 2008, we will require additional capacity in Melbourne, Sydney and Brisbane. �erefore the long term view is the“Albury/Tamworth” RDC option.
NDCs in Sydney and Melbourne are required. However, Brisbanecould play a role as an additional transport hub in later years.
�e f inal network decision should also based on: • more accurate forecasts of supplier location • regional demand growth • feedback from other project teams
Figure A7.11 Suggested optimal solution, post-2008.
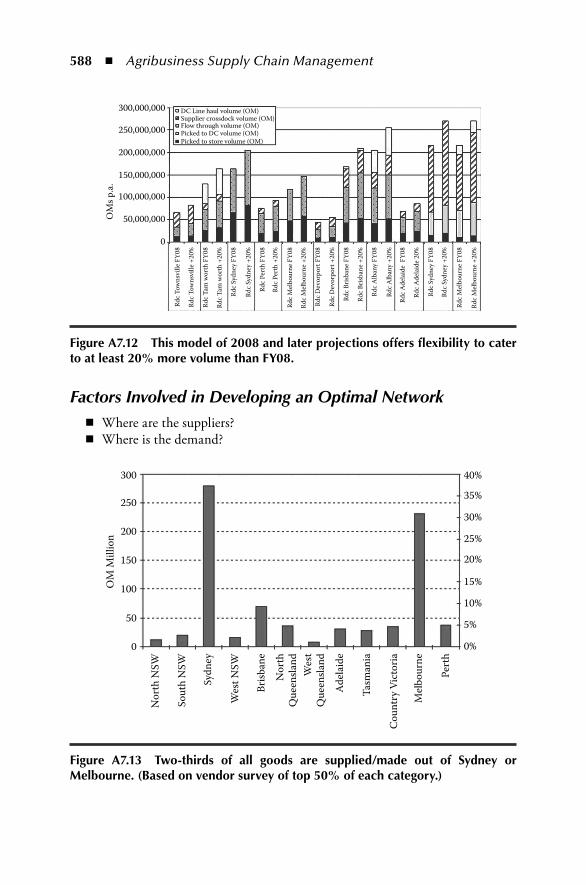
588 ◾ Agribusiness Supply Chain Management
Factors Involved in Developing an Optimal Network ◾ Where are the suppliers? ◾ Where is the demand?
300,000,000
Rdc
Tow
nsvi
lle F
Y08
Rdc
Tow
nsvi
lle +
20%
Rdc
Tam
wor
th F
Y08
Rdc
Tam
wor
th +
20%
Rdc
Sydn
ey F
Y08
Rdc
Sydn
ey +
20%
Rdc
Pert
h FY
08
Rdc
Pert
h +2
0%
Rdc
Mel
bour
ne F
Y08
Rdc
Mel
bour
ne +
20%
Rdc
Dev
orpo
rt F
Y08
Rdc
Dev
orpo
rt +
20%
Rdc
Brisb
ane
FY08
Rdc
Brisb
ane
+20%
Rdc
Alb
any
FY08
Rdc
Ade
laid
e F
Y08
Rdc
Sydn
ey F
Y08
Rdc
Sydn
ey +
20%
Rdc
Mel
bour
ne F
Y08
Rdc
Mel
bour
ne +
20%
Rdc
Ade
laid
e 20
%
Rdc
Alb
any
+20%
Supplier crossdock volume (OM)DC Line haul volume (OM)
Flow through volume (OM)Picked to DC volume (OM)Picked to store volume (OM)
250,000,000
200,000,000
150,000,000
100,000,000
50,000,000
0
OM
s p.a
.
Figure A7.12 this model of 2008 and later projections offers flexibility to cater to at least 20% more volume than Fy08.
300 40%
35%
30%
25%
20%
15%
10%
5%
0%
250
200
150
100OM
Mill
ion
50
0
Nor
th N
SW
Sout
h N
SW
Wes
t NSW
Brisb
ane
Nor
thQ
ueen
sland
Wes
tQ
ueen
sland
Ade
laid
e
Tasm
ania
Cou
ntry
Vic
toria
Mel
bour
ne
Pert
h
Sydn
ey
Figure A7.13 two-thirds of all goods are supplied/made out of Sydney or melbourne. (Based on vendor survey of top 50% of each category.)
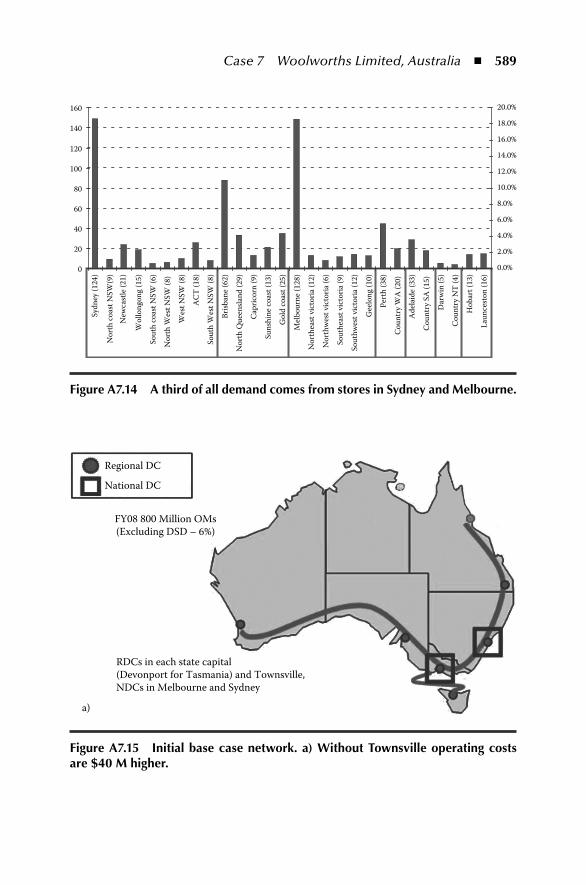
Case 7 Woolworths Limited, Australia ◾ 589
0
20
40
60
80
100
120
140
160
Sydn
ey (1
24)
Nor
th c
oast
NSW
(9)
New
cast
le (2
1)
Wol
long
ong
(15)
Sout
h co
ast N
SW (6
)
Nor
th W
est N
SW (8
)
Wes
t NSW
(8)
AC
T (1
8)
Sout
h W
est N
SW (8
)
Brisb
ane
(62)
Nor
th Q
ueen
sland
(29)
Cap
ricor
n (9
)
Suns
hine
coa
st (1
3)
Gol
d co
ast (
25)
Mel
bour
ne (1
28)
Nor
thw
est v
icto
ria (6
)
Nor
thea
st v
icto
ria (1
2)
Sout
heas
t vic
toria
(9)
Sout
hwes
t vic
toria
(12)
Gee
long
(10)
Pert
h (3
8)
Cou
ntry
WA
(20)
Ade
laid
e (3
3)
Cou
ntry
SA
(15)
Dar
win
(5)
Cou
ntry
NT
(4)
Hob
art (
13)
Laun
cest
on (1
6)
0.0%
2.0%
4.0%
6.0%
8.0%
10.0%
12.0%
14.0%
16.0%
18.0%
20.0%
Figure A7.14 A third of all demand comes from stores in Sydney and melbourne.
Regional DC
National DC
FY08 800 Million OMs(Excluding DSD – 6%)
RDCs in each state capital(Devonport for Tasmania) and Townsville,NDCs in Melbourne and Sydney
a)
Figure A7.15 initial base case network. a) Without townsville operating costs are $40 m higher.
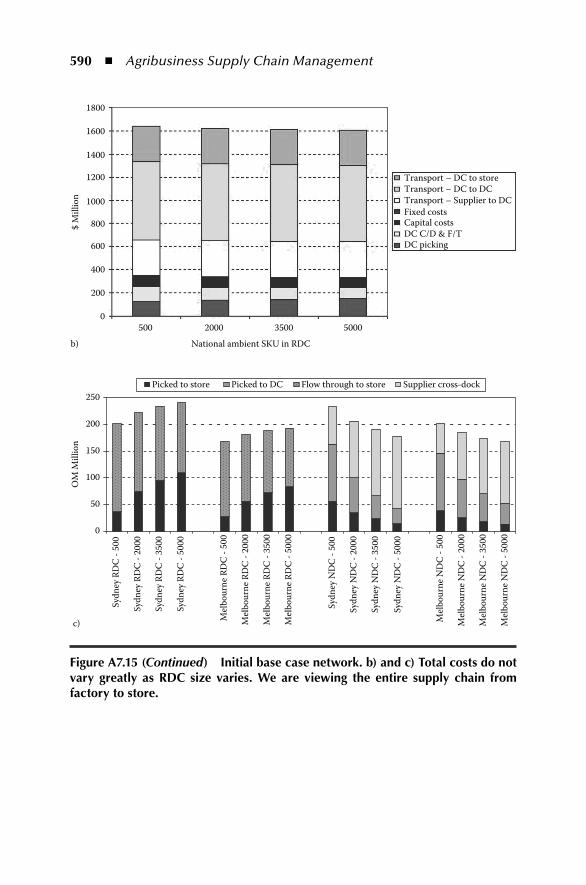
590 ◾ Agribusiness Supply Chain Management
1800
1600
1400
1200
1000
800
600
400
200
0500 2000 3500
Transport – DC to storeTransport – DC to DCTransport – Supplier to DCFixed costsCapital costsDC C/D & F/TDC picking
5000
National ambient SKU in RDC
$ M
illio
n
b)
0
50
100
150
200
250
Sydn
ey R
DC
- 50
0
Sydn
ey R
DC
- 20
00
Sydn
ey R
DC
- 35
00
Sydn
ey R
DC
- 50
00
Mel
bour
ne R
DC
- 50
0
Mel
bour
ne R
DC
- 20
00
Mel
bour
ne R
DC
- 35
00
Mel
bour
ne R
DC
- 50
00
Sydn
ey N
DC
- 50
0
Sydn
ey N
DC
- 20
00
Sydn
ey N
DC
- 35
00
Sydn
ey N
DC
- 50
00
Mel
bour
ne N
DC
- 50
0
Mel
bour
ne N
DC
- 20
00
Mel
bour
ne N
DC
- 35
00
Mel
bour
ne N
DC
- 50
00
OM
Mill
ion
Picked to store Picked to DC Flow through to store Supplier cross-dock
c)
Figure A7.15 (Continued) initial base case network. b) and c) total costs do not vary greatly as rDC size varies. We are viewing the entire supply chain from factory to store.
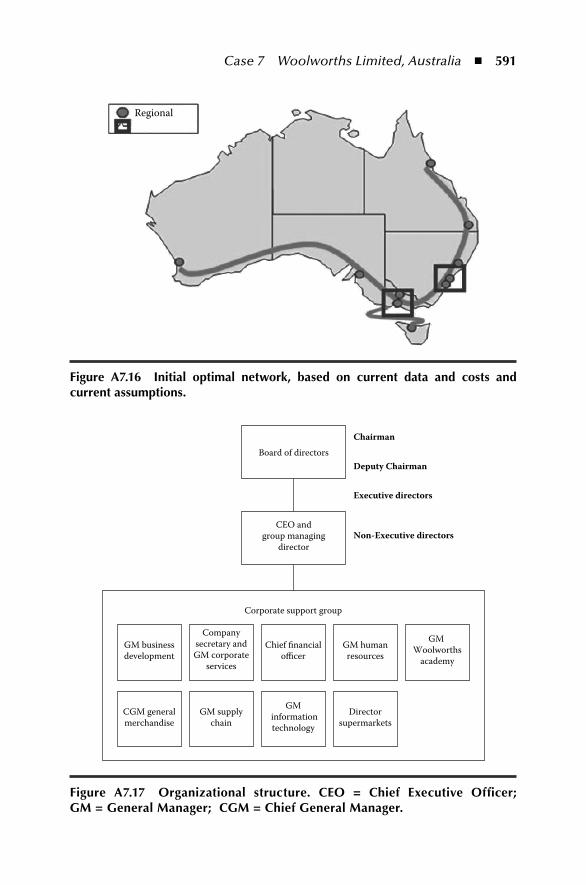
Case 7 Woolworths Limited, Australia ◾ 591
Regional
Figure A7.16 initial optimal network, based on current data and costs and current assumptions.
Board of directors
Chairman
Deputy Chairman
Executive directors
Non-Executive directorsCEO and
group managingdirector
Corporate support group
GM businessdevelopment
Companysecretary andGM corporate
services
Chief �nancialo�cer
GM humanresources
GM Woolworths
academy
CGM generalmerchandise
GM supplychain
GM informationtechnology
Directorsupermarkets
Figure A7.17 organizational structure. Ceo = Chief executive officer; Gm = General manager; CGm = Chief General manager.
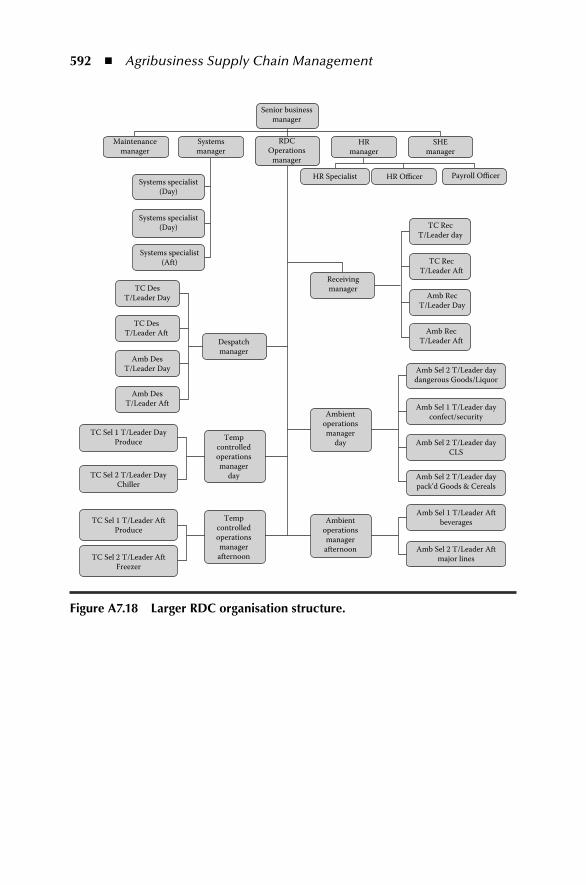
592 ◾ Agribusiness Supply Chain Management
Maintenancemanager
Systems specialist(Day)
Systems specialist(Day)
Systems specialist(Aft)
TC DesT/Leader Day
TC DesT/Leader Aft
Despatchmanager
Tempcontrolledoperationsmanager
day
Ambientoperationsmanager
day
Ambientoperationsmanagerafternoon
Receivingmanager
Tempcontrolledoperationsmanagerafternoon
Amb DesT/Leader Day
Amb DesT/Leader Aft
TC Sel 1 T/Leader DayProduce
TC Sel 2 T/Leader DayChiller
TC Sel 1 T/Leader AftProduce
TC Sel 2 T/Leader AftFreezer
Systemsmanager
RDCOperations
manager
HRmanager
HR Specialist HR O�cer
TC RecT/Leader day
TC RecT/Leader Aft
Amb RecT/Leader Day
Amb RecT/Leader Aft
Amb Sel 2 T/Leader daydangerous Goods/Liquor
Amb Sel 1 T/Leader dayconfect/security
Amb Sel 2 T/Leader dayCLS
Amb Sel 2 T/Leader daypack’d Goods & Cereals
Amb Sel 1 T/Leader Aftbeverages
Amb Sel 2 T/Leader Aftmajor lines
Payroll O�cer
SHEmanager
Senior businessmanager
Figure A7.18 Larger rDC organisation structure.
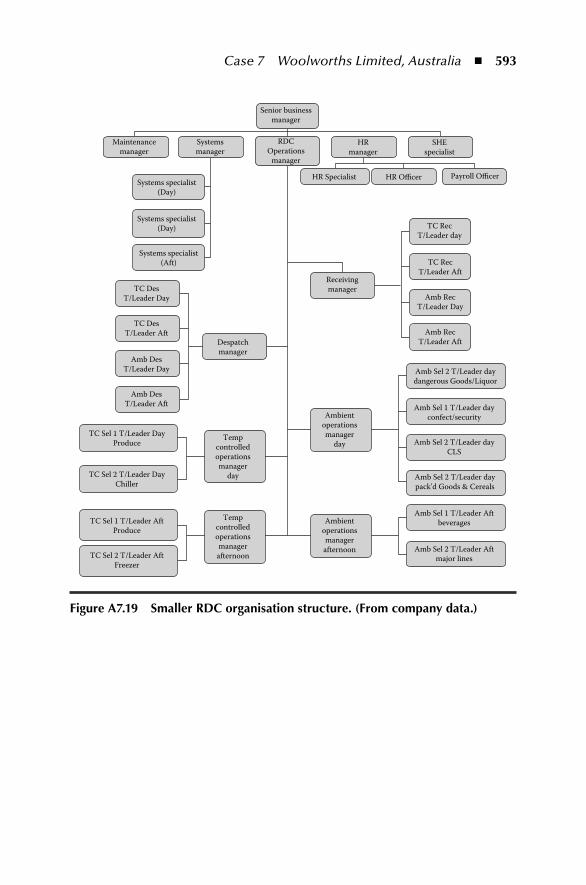
Case 7 Woolworths Limited, Australia ◾ 593
Maintenancemanager
Systems specialist(Day)
Systems specialist(Day)
Systems specialist(Aft)
TC DesT/Leader Day
TC DesT/Leader Aft
Despatchmanager
Tempcontrolledoperationsmanager
day
Ambientoperationsmanager
day
Ambientoperationsmanagerafternoon
Receivingmanager
Tempcontrolledoperationsmanagerafternoon
Amb DesT/Leader Day
Amb DesT/Leader Aft
TC Sel 1 T/Leader DayProduce
TC Sel 2 T/Leader DayChiller
TC Sel 1 T/Leader AftProduce
TC Sel 2 T/Leader AftFreezer
Systemsmanager
RDCOperations
manager
HRmanager
HR Specialist HR O�cer
TC RecT/Leader day
TC RecT/Leader Aft
Amb RecT/Leader Day
Amb RecT/Leader Aft
Amb Sel 2 T/Leader daydangerous Goods/Liquor
Amb Sel 1 T/Leader dayconfect/security
Amb Sel 2 T/Leader dayCLS
Amb Sel 2 T/Leader daypack’d Goods & Cereals
Amb Sel 1 T/Leader Aftbeverages
Amb Sel 2 T/Leader Aftmajor lines
Payroll O�cer
SHEspecialist
Senior businessmanager
Figure A7.19 Smaller rDC organisation structure. (From company data.)
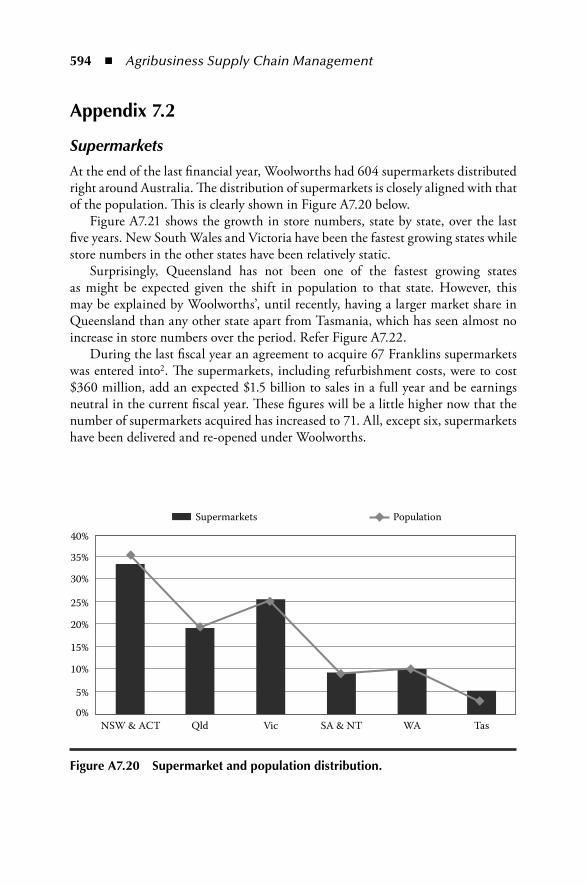
594 ◾ Agribusiness Supply Chain Management
Appendix 7.2
Supermarkets
At the end of the last financial year, Woolworths had 604 supermarkets distributed right around Australia. The distribution of supermarkets is closely aligned with that of the population. This is clearly shown in Figure A7.20 below.
Figure A7.21 shows the growth in store numbers, state by state, over the last five years. New South Wales and Victoria have been the fastest growing states while store numbers in the other states have been relatively static.
Surprisingly, Queensland has not been one of the fastest growing states as might be expected given the shift in population to that state. However, this may be explained by Woolworths’, until recently, having a larger market share in Queensland than any other state apart from Tasmania, which has seen almost no increase in store numbers over the period. Refer Figure A7.22.
During the last fiscal year an agreement to acquire 67 Franklins supermarkets was entered into2. The supermarkets, including refurbishment costs, were to cost $360 million, add an expected $1.5 billion to sales in a full year and be earnings neutral in the current fiscal year. These figures will be a little higher now that the number of supermarkets acquired has increased to 71. All, except six, supermarkets have been delivered and re-opened under Woolworths.
40%
35%
30%
25%
20%
15%
10%
5%
0%NSW & ACT Qld Vic SA & NT WA Tas
Supermarkets Population
Figure A7.20 Supermarket and population distribution.
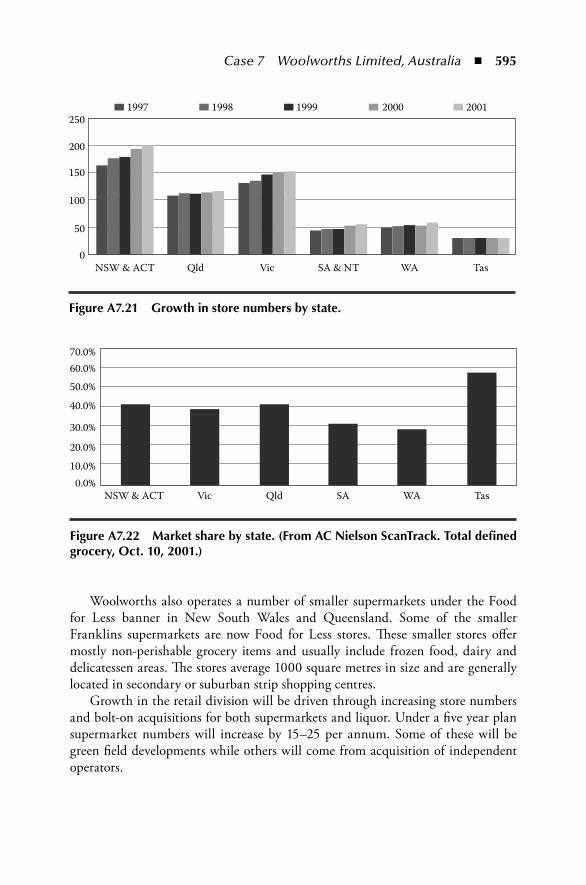
Case 7 Woolworths Limited, Australia ◾ 595
Woolworths also operates a number of smaller supermarkets under the Food for Less banner in New South Wales and Queensland. Some of the smaller Franklins supermarkets are now Food for Less stores. These smaller stores offer mostly non-perishable grocery items and usually include frozen food, dairy and delicatessen areas. The stores average 1000 square metres in size and are generally located in secondary or suburban strip shopping centres.
Growth in the retail division will be driven through increasing store numbers and bolt-on acquisitions for both supermarkets and liquor. Under a five year plan supermarket numbers will increase by 15–25 per annum. Some of these will be green field developments while others will come from acquisition of independent operators.
2501997 1998 1999 2000 2001
NSW & ACT Qld Vic SA & NT WA Tas
200
150
100
50
0
Figure A7.21 Growth in store numbers by state.
70.0%60.0%
50.0%
40.0%
30.0%
20.0%
10.0%0.0%
NSW & ACT Vic Qld SA WA Tas
Figure A7.22 market share by state. (From AC nielson Scantrack. total defined grocery, oct. 10, 2001.)
596 ◾ Agribusiness Supply Chain Management
Retail Strategy and Supply Chain ManagementWoolworths’ retail strategy can be defined as every day, low price (EDLP). The EDLP strategy is sometimes referred to as the Wal-Mart approach. Wal-Mart is the world’s largest and most successful supermarket retailer. EDLP means seeking the best prices from suppliers and maintaining minimum profit margins on every product sold—constantly. It is not about 25% off store wide sales, or rotating specials on selected items, and then maintaining higher prices the rest of the time. With EDLP, Woolworths only has specials when the supplier provides the cost reduction.
A critical aspect of supply chain management is relationships with suppliers. Under the old state based buying function, relationships with suppliers were frag-mented and varied. The move to a single, national buying function provided an opportunity for all supplier contracts to be re-negotiated, delivering cost savings to Woolworths and its suppliers and stronger relationships. Where Woolworths did not always rate highly with its suppliers previously, it is now rated No.1.
While buying and marketing have moved to a national shared services plat-form, distribution, by necessity, is a zone based function. Distribution centres are maintained in each zone with transportation from distribution centres to stores being undertaken by transport contractors in each state except Victoria, where Woolworths maintains its own fleet—a legacy from Safeway.
Two high velocity distribution centres are operated in NSW and Victoria, these being the Minchinbury and Hume Distribution centres. These centres receive and distribute to Woolworths supermarkets the 4,500 fastest moving grocery items, excluding fresh, chilled and frozen foods. Minchinbury and Hume service their own states and some of the needs of Tasmania. This amounts to 180 stores for Hume and more than 200 for Minchinbury.
The distribution centres are hi-tech, fully automated, dedicated facilities where the primary objective is to move product through the centre as quickly as possible, thus minimising the investment in inventory. Bulk buys of goods do not go into storage but will be held on the distribution floor as ‘cross stock’. In other words, the goods are moved from the arrivals bays to the departure bays within two to three days or preferably less.
Other goods move into a high rise warehouse, serviced by robotic cranes for storage for periods of three to six weeks, before being moved to the stock picking area prior to distribution to the supermarkets. Cross stock goods remain on pallets while stored goods are removed from pallets in the stock picking area for distribu-tion in smaller quantities.
At the present time it is necessary to maintain sizeable goods inventories in distribution centres to avoid stock-out problems in stores. The existing inventory management systems employ computerisation and bar code and scanning technol-ogy but the ability for stores to re-order from check-out scanners and suppliers to deliver, just in time, is some way off. This ability should be established within three to four years and lead to significant annual supply chain savings.
Case 7 Woolworths Limited, Australia ◾ 597
Lower volume product is processed through separate distribution centres that are less dependent on technology and more labour intensive. These centres handle 9,000 slower moving items including some general merchandise. There are separate distributions facilities again for fruit and vegetable produce and frozen and chilled foods are handled by P&O Cold Stores.
There is also a national distribution centre at Moorebank in NSW that handles 4,000 lines of general merchandise goods and imported goods for the supermarkets that are not particularly time sensitive.
Plus PetrolThe first Plus Petrol site was opened in Dubbo in 1996. The business has steadily expanded to the point where it generated 4% of the Supermarket division’s sales but less than 1% of EBIT, last year. Woolworths views the petrol business as an adjunct to its retail offering, creating incremental store sales. Petrol retailing fits with Woolworths’ core competency being a high volume, low margin business and, with canopies located adjacent to supermarkets, it allows Woolworths to meet more of its customers’ needs in the one location.
The petrol business returned a profit of $4.6 million in fiscal 2001, before allowing for the cost of the discount given to Woolworths shoppers and the value of incremental sales. While no figures are provided, Woolworths says incremental sales exceed the cost of the discount. An independent analysis undertaken by Jebb, Holland, Dimasi showed that there is a significant incremental sales benefit for stores with adjacent canopies.
Moreover, more volume from existing and new outlets will improve the eco-nomics of the petrol business. With currently 212 canopies, Woolworths says it is close to achieving breakeven on a standalone basis.
The number of Plus Petrol outlets has rapidly increased as Figure A7.23 shows. At the end of fiscal 2001, Woolworths had 166 petrol outlets and expects to have 250 by year end. Some of the growth will come from 69 ex-Liberty Oil outlets to be added to the chain under a lease arrangement. Woolworths has already taken delivery of 35 of the outlets.
LiquorWoolworths stand-alone liquor business has been much slower to develop. Until fiscal 2001, stand-alone stores numbers had been constant at around 40 but 90 stores were added last year to bring the total to 130 by year end. The growth came mostly from a buying spree that saw Woolworths acquire the 13 store Booze Bros chain in South Australia, the 11 store Toohey Bros chain in NSW and the 45 store Liberty Liquor chain was acquired during the year at a cost of $72 million.
The total liquor business has been reorganised under four brands: Dan Murphy, destination outlets; Woolworths Liquor, attached to supermarkets; BWS,
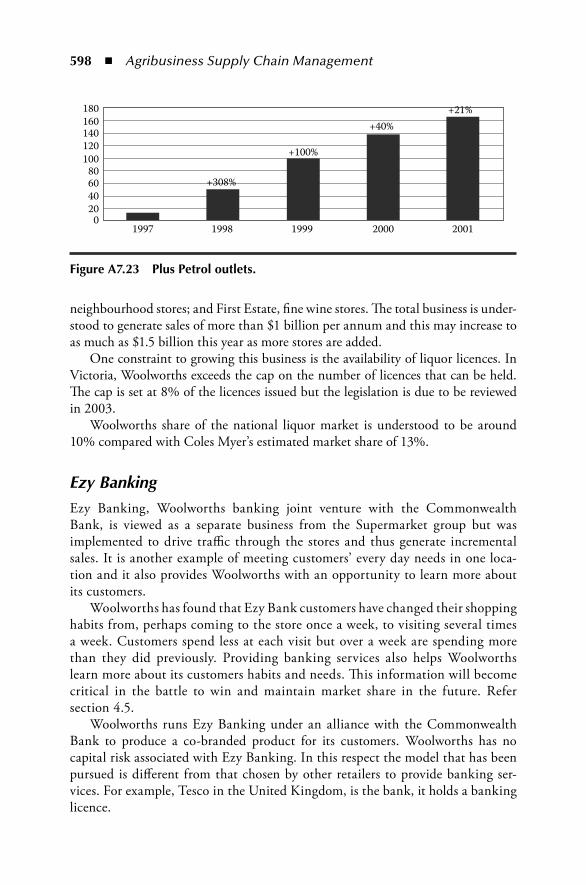
598 ◾ Agribusiness Supply Chain Management
neighbourhood stores; and First Estate, fine wine stores. The total business is under-stood to generate sales of more than $1 billion per annum and this may increase to as much as $1.5 billion this year as more stores are added.
One constraint to growing this business is the availability of liquor licences. In Victoria, Woolworths exceeds the cap on the number of licences that can be held. The cap is set at 8% of the licences issued but the legislation is due to be reviewed in 2003.
Woolworths share of the national liquor market is understood to be around 10% compared with Coles Myer’s estimated market share of 13%.
Ezy BankingEzy Banking, Woolworths banking joint venture with the Commonwealth Bank, is viewed as a separate business from the Supermarket group but was implemented to drive traffic through the stores and thus generate incremental sales. It is another example of meeting customers’ every day needs in one loca-tion and it also provides Woolworths with an opportunity to learn more about its customers.
Woolworths has found that Ezy Bank customers have changed their shopping habits from, perhaps coming to the store once a week, to visiting several times a week. Customers spend less at each visit but over a week are spending more than they did previously. Providing banking services also helps Woolworths learn more about its customers habits and needs. This information will become critical in the battle to win and maintain market share in the future. Refer section 4.5.
Woolworths runs Ezy Banking under an alliance with the Commonwealth Bank to produce a co-branded product for its customers. Woolworths has no capital risk associated with Ezy Banking. In this respect the model that has been pursued is different from that chosen by other retailers to provide banking ser-vices. For example, Tesco in the United Kingdom, is the bank, it holds a banking licence.
180160140120100
80604020
01997 1998
+308%
+100%
+40%+21%
1999 2000 2001
Figure A7.23 plus petrol outlets.
Case 7 Woolworths Limited, Australia ◾ 599
At the moment Ezy Banking product range extends to a savings and transaction account, a credit card, and rewards scheme. The rewards are vouchers redeemable in the supermarkets and provided by suppliers. The product range will be extended and may include insurance and home loans, over time.
In the meantime, in just two years 610,000 accounts have been opened exceeding the five year target of 500,000 accounts.
e-CommerceHomeShop is Woolworths internet shopping service. During fiscal 2001 Woolworths acquired a 38% interest in Greengocer.com to expand its internet offering and recently moved to 100% ownership.
HomeShop utilises a store based model, in other words, customer orders are supplied and delivered from their local store. Greengrocer.com utilises a central picking model, operating from purpose built facilities. Owning both operations provides Woolworths with back office synergies and the opportunity to experiment with different operating models.
The capital invested to date is not significant.
Financial PerformanceThe recent financial performance of the whole Supermarket division is presented in Table A7.14 below. Note EBIT margin is fine as would be expected for this division but return on funds employed is substantial and exceeds that of the other divisions.
The supermarket division enjoyed strong revenue growth over the last year, including the contribution from Plus Petrol (without this, revenue growth would have been only 10%). Sales growth was facilitated by an improved product offering and reduced costs, which also enabled Woolworths to increase market share of ABS measured Food Liquor and Grocery to 25.6% from 24.6%. Project Refresh allowed costs to be reduced by 0.52%, of which 0.38% was passed on to customers and the balance to shareholders.
Supermarkets in all states performed strongly with South Australia benefiting from the acquisition of the Booze Bros liquor chain ($12 million). Western Australia from the acquisition of Advantage Supermarkets ($21 million) and Tasmania from the realigning of Roelf Vos and Purity branding with Woolworths.
A five year summary of sales growth for the division (excluding petrol) is presented in Figure A7.24 along with the key drivers; sales per square metre and store numbers. Note growth in sales per square metre has been steadily increas-ing since 1999. This is the result of improving productivity, and in fiscal 2001, the demise of Franklins and vastly increased liquor store numbers, with higher sales per square metre value. These factors all combined to take the growth rate to almost 5% last year.
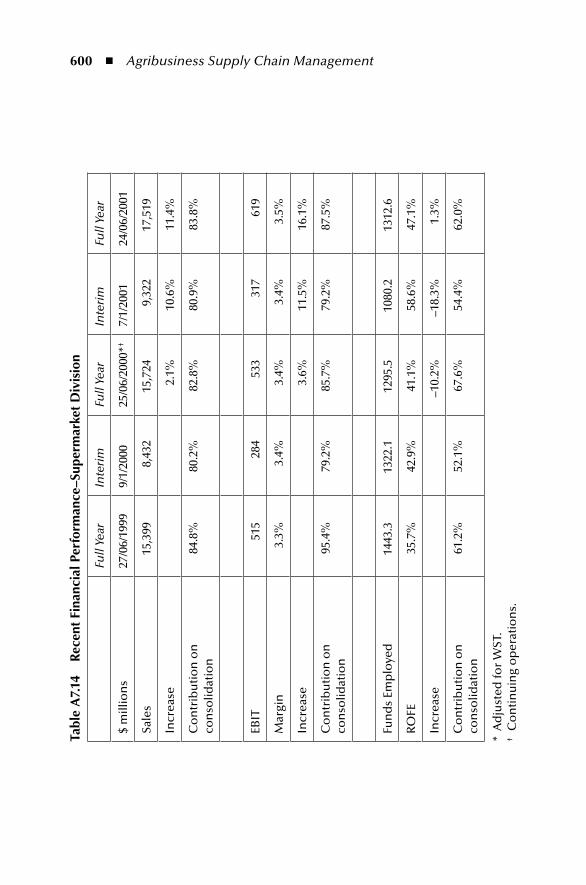
600 ◾ Agribusiness Supply Chain Management
tabl
e A
7.14
r
ecen
t Fi
nanc
ial p
erfo
rman
ce–S
uper
mar
ket
Div
isio
n
Full
Year
Inte
rim
Full
Year
Inte
rim
Full
Year
$ m
illio
ns
27/0
6/19
999/
1/20
0025
/06/
2000
*†7/
1/20
0124
/06/
2001
Sale
s15
,399
8,43
215
,724
9,32
217
,519
Incr
ease
2.1%
10.6
%11
.4%
Co
ntr
ibu
tio
n o
n
con
solid
atio
n84
.8%
80.2
%82
.8%
80.9
%83
.8%
EBIT
515
284
533
317
619
Mar
gin
3.3%
3.4%
3.4%
3.4%
3.5%
Incr
ease
3.6%
11.5
%16
.1%
Co
ntr
ibu
tio
n o
n
con
solid
atio
n95
.4%
79.2
%85
.7%
79.2
%87
.5%
Fun
ds
Emp
loye
d14
43.3
1322
.112
95.5
1080
.213
12.6
RO
FE35
.7%
42.9
%41
.1%
58.6
%47
.1%
Incr
ease
–10.
2%–1
8.3%
1.3%
Co
ntr
ibu
tio
n o
n
con
solid
atio
n61
.2%
52.1
%67
.6%
54.4
%62
.0%
* A
dju
sted
for
WST
.†
Co
nti
nu
ing
op
erat
ion
s.
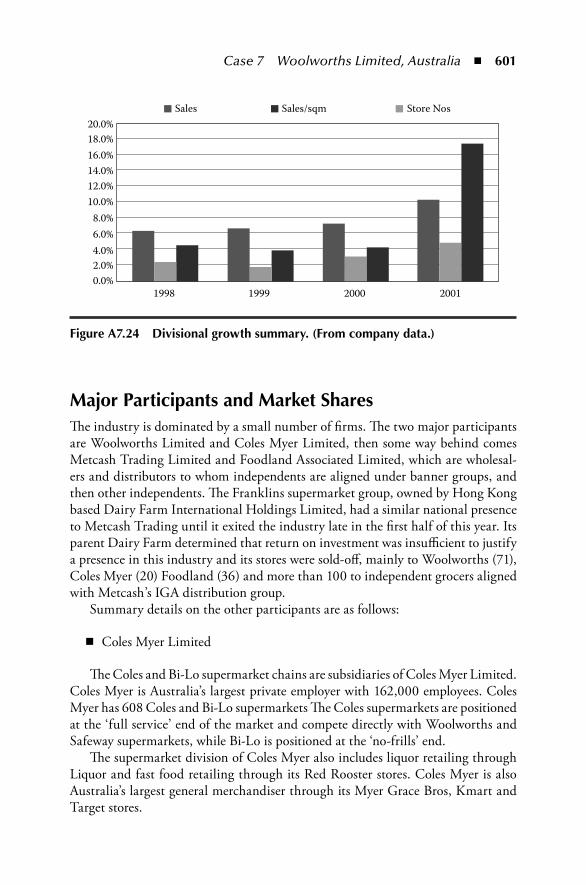
Case 7 Woolworths Limited, Australia ◾ 601
major participants and market SharesThe industry is dominated by a small number of firms. The two major participants are Woolworths Limited and Coles Myer Limited, then some way behind comes Metcash Trading Limited and Foodland Associated Limited, which are wholesal-ers and distributors to whom independents are aligned under banner groups, and then other independents. The Franklins supermarket group, owned by Hong Kong based Dairy Farm International Holdings Limited, had a similar national presence to Metcash Trading until it exited the industry late in the first half of this year. Its parent Dairy Farm determined that return on investment was insufficient to justify a presence in this industry and its stores were sold-off, mainly to Woolworths (71), Coles Myer (20) Foodland (36) and more than 100 to independent grocers aligned with Metcash’s IGA distribution group.
Summary details on the other participants are as follows:
◾ Coles Myer Limited
The Coles and Bi-Lo supermarket chains are subsidiaries of Coles Myer Limited. Coles Myer is Australia’s largest private employer with 162,000 employees. Coles Myer has 608 Coles and Bi-Lo supermarkets The Coles supermarkets are positioned at the ‘full service’ end of the market and compete directly with Woolworths and Safeway supermarkets, while Bi-Lo is positioned at the ‘no-frills’ end.
The supermarket division of Coles Myer also includes liquor retailing through Liquor and fast food retailing through its Red Rooster stores. Coles Myer is also Australia’s largest general merchandiser through its Myer Grace Bros, Kmart and Target stores.
20.0%Sales Sales/sqm Store Nos
18.0%16.0%14.0%12.0%10.0%
8.0%6.0%4.0%2.0%0.0%
1998 1999 2000 2001
Figure A7.24 Divisional growth summary. (From company data.)
602 ◾ Agribusiness Supply Chain Management
Coles Myer has a market capitalisation of approximately $9.6 billion.Metcash Trading LimitedMetcash is around 75% owned by South African company, Metro Cash and
Carry Limited. Metcash is the successor to the former Davids Limited, and has maintained its position as Australia’s largest grocery wholesaler and distributor operating in all states and territories except Western Australia. Metro Cash and Carry acquired its interest in Davids in 1998 following the company’s floatation in 1994.
Metcash’s IGA distribution business services more than 1,100 independently owned IGA aligned supermarkets. Employees total 5,220.
Market capitalisation is approximately $880 million.
◾ Foodland Associated Limited − Foodland is the major distributor and sole independent wholesaler in
Western Australia. Apart from the provision of wholesale grocery prod-ucts, Foodland provides financial incentives and marketing support to FAL franchise and other independent supermarkets. Foodland is the fourth largest retailer listed on the Australian Stock Exchange. With a market capitalisation of approximately $1.2 billion and employs 15,000 people.
◾ Independents − Independent retailers form the remainder of the sector. The National
Association of Retail Grocers of Australia (NARGA) is the main repre-sentative body for this group and its figures indicate that there are more than 3,000 independent supermarkets and grocers around Australia.
The independents vary in size from corner stores to full size supermarkets and many operate within the banner groups aligned with the wholesalers, Metcash and Foodland. The number of non-aligned independents is not accurately known but is thought to be around 50% of the total NARGA membership.
The vertically integrated structure of the supermarket operations of Woolworths and Coles Myer provides a number of advantages in purchasing, warehousing and distribution, and pricing over the independent operators. Centralised buy-ing allows opportunistic purchases of larger volumes than normal before known price increases or as part of joint promotional exercises or pricing campaigns with the producer. This also allows greater scale to co-ordinate promotional activities and exploit generic advertising advantages.
Centrally co-ordinated store orders allow larger warehouse pick-up runs enabling efficiencies in distribution to be exploited. Average store orders for inde-pendents are much smaller and as a general rule smaller stores are more labour intensive and costly to run. Economies of scale allow larger stores to utilise labour, energy and floor space more efficiently.
Case 7 Woolworths Limited, Australia ◾ 603
Finally, Woolworths and Coles Myer supermarkets often have the privilege of being anchor tenants in major shopping centres which means they pay sub-stantially less rent per square metre than other tenants and often enjoy more flexible terms and conditions under their lease agreement with the landlord. In addition, prime positions for extended hours trading and high volume customer flows are secured.
With intense competitive pressures such as these, rationalisation of the inde-pendents will continue. Only larger independents with the capital to refurbish stores and to incorporate the new technologies used by their major competitors are likely to survive. However, unlike metropolitan areas, less competition in rural and regional Australia is likely to protect many smaller independents.
Market share for each of the participants can be measured in different ways. Chart 4.4 presents market share as measured by the AC Nielson survey, on a moving annual turnover basis to 28 October 2001. The market share figures are sourced from AC Nielson’s ScanTrack service, which uses scanned supermarket sales for Woolworths, Coles Myer and Franklins and warehouse withdrawal data for Metcash, Foodland and other independents.
The product range covered is broad including packaged groceries, dairy and frozen food but excludes fresh meat and vegetables, delicatessen and bakery goods, milk and potato chips. The survey also excludes convenience stores, route trade and direct store delivery, about one-third of all grocery categories according to Woolworths.
peer ComparisonsA comparison of Woolworths domestic and international peers, based on Standard & Poor’s statistics, is provided in Table A7.15 below.
AcknowledgementPrepared by Professor G. Raghuram, Indian Institute of Management, Ahmedabad, and G. Kuberkar.
All data, except those mentioned as ‘company data’, has been sourced from the Internet. Support rendered by TCS is gratefully acknowledged.
Cases of the Indian Institute of Management, Ahmedabad, are prepared as a basis for class discussion. Cases are not designed to present illustrations of either correct or incorrect handling of administrative problems.
This case has been reproduced with permission from Indian Institute of Management, Ahmedabad. Copyright © 2008.
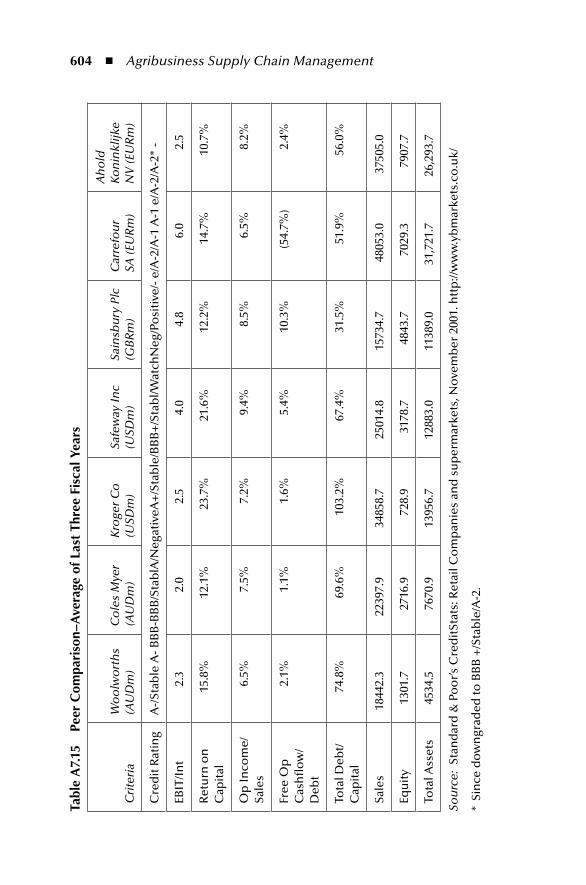
604 ◾ Agribusiness Supply Chain Management
tabl
e A
7.15
pe
er C
ompa
riso
n–A
vera
ge o
f Las
t th
ree
Fisc
al y
ears
Cri
teri
aW
oo
lwo
rth
s (A
UD
m)
Co
les
Mye
r (A
UD
m)
Kro
ger C
o
(USD
m)
Safe
way
Inc
(USD
m)
Sain
sbu
ry P
lc
(GB
Rm
)C
arre
fou
r SA
(EU
Rm
)
Ah
old
Ko
nin
klijk
e N
V (E
UR
m)
Cre
dit
Rat
ing
A-/
Stab
le A
- BB
B-B
BB
/Sta
blA
/Neg
ativ
eA+
/Sta
ble
/BB
B+
/Sta
bl/W
atch
Neg
/Po
siti
ve/-
e/A
-2/A
-1 A
-1 e
/A-2
/A-2
* -
EBIT
/In
t2.
32.
02.
54.
04.
86.
02.
5
Ret
urn
on
C
apit
al15
.8%
12.1
%23
.7%
21.6
%12
.2%
14.7
%10
.7%
Op
Inco
me/
Sale
s6.
5%7.
5%7.
2%9.
4%8.
5%6.
5%8.
2%
Free
Op
C
ash
flo
w/
Deb
t
2.1%
1.1%
1.6%
5.4%
10.3
%(5
4.7%
)2.
4%
Tota
l Deb
t/C
apit
al74
.8%
69.6
%10
3.2%
67.4
%31
.5%
51.9
%56
.0%
Sale
s18
442.
322
397.
934
858.
725
014.
815
734.
748
053.
037
505.
0
Equ
ity
1301
.727
16.9
728.
931
78.7
4843
.770
29.3
7907
.7
Tota
l Ass
ets
4534
.576
70.9
1395
6.7
1288
3.0
1138
9.0
31,7
21.7
26,2
93.7
Sou
rce:
Sta
nd
ard
& P
oo
r’s C
red
itSt
ats:
Ret
ail C
om
pan
ies
and
su
per
mar
kets
, No
vem
ber
200
1. h
ttp
://w
ww
.yb
mar
kets
.co
.uk/
* Si
nce
do
wn
grad
ed to
BB
B +
/Sta
ble
/A-2
.

Case 7 Woolworths Limited, Australia ◾ 605
referencesCity Population. Australia: Urban centers. http://www.citypopulation.de/Australia-UC.htmlIBIS Industry Division Report. http://invest.vic.gov.au/Parliament of Australia, Joint Committee, The retailing sector, Chapter 2 of Fair Market or
Market Failure. 2001. http://www.aph.gov.au/Parliamentary_Business/Committees/Joint/Former_Committees/retail/report/~/media/wopapub/senate/committee/retail_ctte/report/c02_pdf.ashx
Woolworths Ltd. Financial reports to shareholders for years 1999–2001. http://www. woolworthslimited.com.au/
Woolworths Ltd. Media releases. http://www.woolworthslimited.com.au/

This page intentionally left blankThis page intentionally left blank
607
Case 8 Akshaya patra, Gandhinagar
Akshaya Patra’s nutritious meal gives a lot of pleasure to small children. And it provides a foundation for successful life.
—Narendra Modi, Chief Minister of Gujarat
It was September 18, 2010. Jaganmohan Krishna Dasa, President of The Akshaya Patra Foundation (TAPF), Gandhinagar, was reviewing their activities and perfor-mance in the school mid-day meals programme. They were being asked to increase the number of beneficiaries and move into other domains.
The review was also to help him conceptualise the terms and conditions for serv-ing food to the patients in the Civil Hospitals of Ahmedabad and Gandhinagar. This was in response to the offer made by the Government of Gujarat (GoG) to TAPF on August 15, 2010. It was a bid to serve healthy and hygienic food to the patients of the Civil Hospitals. A milestone achieved rarely by any other Non-Governmental Organisation (NGO) encompassing mid-day meals program, TAPF was awarded the offer merely based on the success rate it had acquired by serving nutritious and delicious food to nearly 2.30 lakh children in Gujarat. The Gandhinagar kitchen worth `210 lakhs had the capacity to feed around 1,50,000 children. A similar kitchen in Vadodara which was opened a couple of months earlier had the capacity to feed around 80,000 children.
At 7:00 am, the Gandhinagar kitchen was alive with workers with cap-covered heads and gloved hands brewing rice and curry in the behemoth cauldrons. Some of them moved the cooked rice for packing into containers; some others stirred the curry, while rest of them managed filling the containers with the mechanized meal in accordance with the delivery requirement. Specially insulated vehicles were parked just outside near a platform waiting to be loaded, where the containers were placed route-wise for delivery.
608 ◾ Agribusiness Supply Chain Management
Back in one of the schools, the children waited eagerly for the blue van to arrive. As soon as the food arrived, they scampered to get their plates and formed a queue to wash them. All of them gathered to sit cross-legged in a shed with their plates in front of them, waiting to be served their share. For some of them, it was the only wholesome meal they could savour in a day. They continuously kept chanting “Hare Krishna Hare Ram” (a mantra preached by International Society for Krishna Consciousness (ISKCON), the parent body of TAPF) as an act of thanking the deity before eating. United as they seemed, each of them touched the food only after the last child was served.
mid-Day meal Scheme in GujaratMid-Day Meal (MDM) scheme introduced in 53 talukas of Gujarat in 1962, cov-ered the age group of 6–11 years. In 1984, the GoG extended the programme to the entire state, covering all the students in that age group. The scheme was discon-tinued during 1990 and 1991, and replaced by the Food for Education Programme. This programme provided 10 kilograms (kg) of food grains free-of-cost every month to children with 70 per cent attendance in school. The MDM scheme, how-ever, was reintroduced from January 15, 1992.
In 1995, the Government of India (GoI) launched the National Programme - Nutritional Support to Primary Education (NP-NSPE) scheme where all the chil-dren of the primary schools (run by GoI/local bodies) from Standard (Std) I to V were given 100 grams and Std VI to VII were given 150 grams of free food grains (wheat/rice) on the basis of enrolment. Gujarat was one of the pioneer states to introduce the concept of providing hot cooked mid-day meals to all children from Std I to VII of primary schools run by State Government and Municipal Corporations (Table A8.1 and Figure A8.1 present coverage comparison and administrative structure of MDM in Gujarat). The total budget for 2009–2010 was `461.84 crores (GoI–`301.84 crores and GoG–`160.00 crores).
The GoG entrusted the work of running the MDM scheme in Ahmedabad Municipal Corporation and Gandhinagar taluka to TAPF in June 2006. The Vadodara Municipal Corporation and Kalol and Mansa talukas of Gandhinagar district were assigned to TAPF in October 2009.
Akshaya patraAn initiative of ISKCON, the program commenced in the year 2000. It served nutritious food to 1,500 children in five schools in Bangalore. The original idea was to extend the concept of prasadam, usually food items given to devotees, from just in their temple to a more meaningful and needy segment like poor school children. By August 20, 2010, they were feeding about 12,28,580 children in around 8,261 government schools in India across nine states.
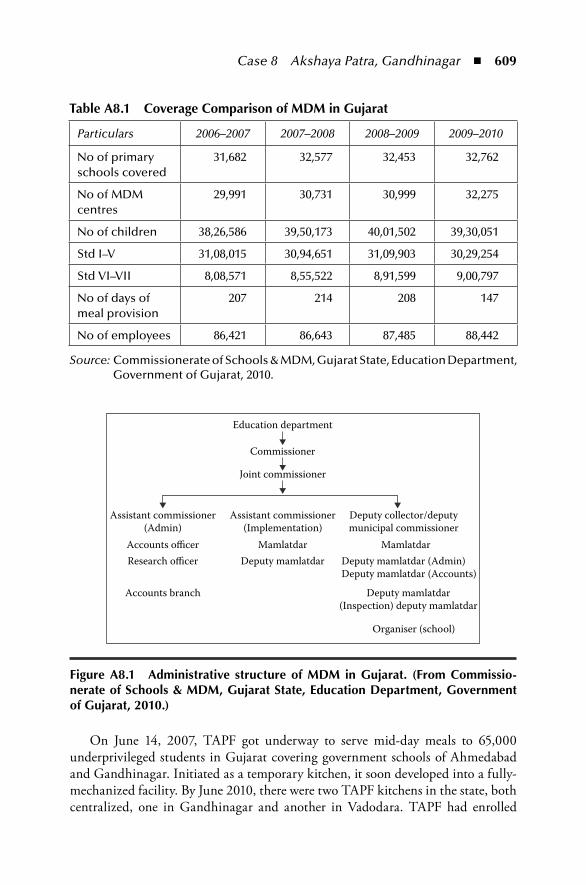
Case 8 Akshaya Patra, Gandhinagar ◾ 609
On June 14, 2007, TAPF got underway to serve mid-day meals to 65,000 underprivileged students in Gujarat covering government schools of Ahmedabad and Gandhinagar. Initiated as a temporary kitchen, it soon developed into a fully-mechanized facility. By June 2010, there were two TAPF kitchens in the state, both centralized, one in Gandhinagar and another in Vadodara. TAPF had enrolled
Education department
Commissioner
Joint commissioner
Assistant commissioner(Admin)
Assistant commissioner(Implementation)
Deputy collector/deputymunicipal commissioner
Accounts o�cer Mamlatdar MamlatdarDeputy mamlatdar Deputy mamlatdar (Admin)
Deputy mamlatdar (Accounts)
Deputy mamlatdar(Inspection) deputy mamlatdar
Research o�cer
Accounts branch
Organiser (school)
Figure A8.1 Administrative structure of mDm in Gujarat. (From Commissio-nerate of Schools & mDm, Gujarat State, education Department, Government of Gujarat, 2010.)
table A8.1 Coverage Comparison of mDm in Gujarat
Particulars 2006–2007 2007–2008 2008–2009 2009–2010
No of primary schools covered
31,682 32,577 32,453 32,762
No of MDM centres
29,991 30,731 30,999 32,275
No of children 38,26,586 39,50,173 40,01,502 39,30,051
Std I–V 31,08,015 30,94,651 31,09,903 30,29,254
Std VI–VII 8,08,571 8,55,522 8,91,599 9,00,797
No of days of meal provision
207 214 208 147
No of employees 86,421 86,643 87,485 88,442
Source: Commissionerate of Schools & MDM, Gujarat State, Education Department, Government of Gujarat, 2010.
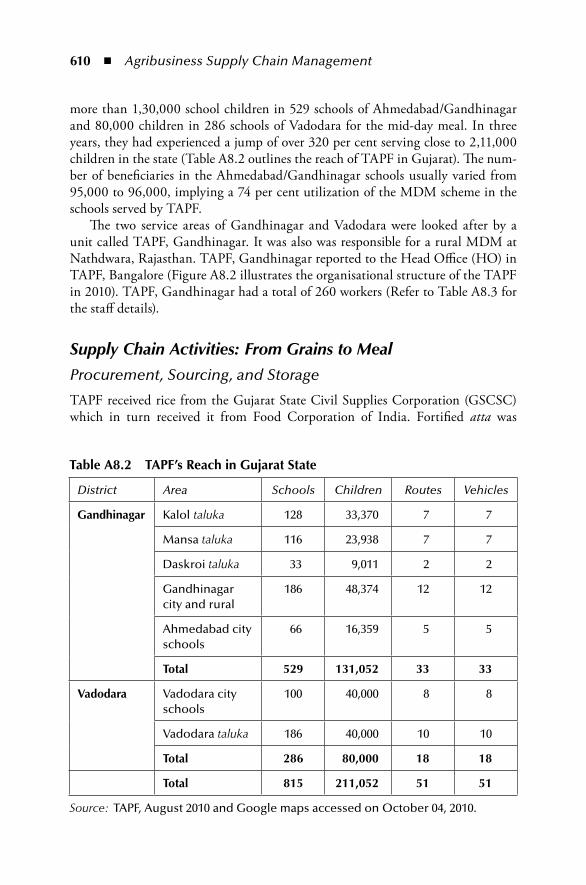
610 ◾ Agribusiness Supply Chain Management
more than 1,30,000 school children in 529 schools of Ahmedabad/Gandhinagar and 80,000 children in 286 schools of Vadodara for the mid-day meal. In three years, they had experienced a jump of over 320 per cent serving close to 2,11,000 children in the state (Table A8.2 outlines the reach of TAPF in Gujarat). The num-ber of beneficiaries in the Ahmedabad/Gandhinagar schools usually varied from 95,000 to 96,000, implying a 74 per cent utilization of the MDM scheme in the schools served by TAPF.
The two service areas of Gandhinagar and Vadodara were looked after by a unit called TAPF, Gandhinagar. It was also was responsible for a rural MDM at Nathdwara, Rajasthan. TAPF, Gandhinagar reported to the Head Office (HO) in TAPF, Bangalore (Figure A8.2 illustrates the organisational structure of the TAPF in 2010). TAPF, Gandhinagar had a total of 260 workers (Refer to Table A8.3 for the staff details).
Supply Chain Activities: From Grains to Meal
Procurement, Sourcing, and Storage
TAPF received rice from the Gujarat State Civil Supplies Corporation (GSCSC) which in turn received it from Food Corporation of India. Fortified atta was
table A8.2 tApF’s reach in Gujarat State
District Area Schools Children Routes Vehicles
Gandhinagar Kalol taluka 128 33,370 7 7
Mansa taluka 116 23,938 7 7
Daskroi taluka 33 9,011 2 2
Gandhinagar city and rural
186 48,374 12 12
Ahmedabad city schools
66 16,359 5 5
total 529 131,052 33 33
Vadodara Vadodara city schools
100 40,000 8 8
Vadodara taluka 186 40,000 10 10
total 286 80,000 18 18
total 815 211,052 51 51
Source: TAPF, August 2010 and Google maps accessed on October 04, 2010.
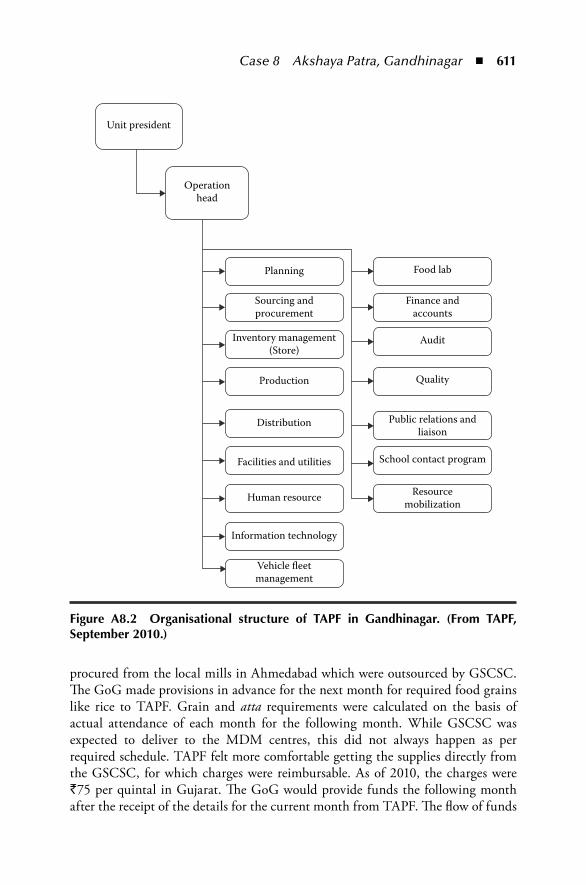
Case 8 Akshaya Patra, Gandhinagar ◾ 611
procured from the local mills in Ahmedabad which were outsourced by GSCSC. The GoG made provisions in advance for the next month for required food grains like rice to TAPF. Grain and atta requirements were calculated on the basis of actual attendance of each month for the following month. While GSCSC was expected to deliver to the MDM centres, this did not always happen as per required schedule. TAPF felt more comfortable getting the supplies directly from the GSCSC, for which charges were reimbursable. As of 2010, the charges were `75 per quintal in Gujarat. The GoG would provide funds the following month after the receipt of the details for the current month from TAPF. The flow of funds
Unit president
Operationhead
Planning Food lab
Finance andaccounts
Audit
Quality
Public relations andliaison
School contact program
Resourcemobilization
Sourcing andprocurement
Inventory management(Store)
Production
Distribution
Facilities and utilities
Human resource
Information technology
Vehicle �eetmanagement
Figure A8.2 organisational structure of tApF in Gandhinagar. (From tApF, September 2010.)
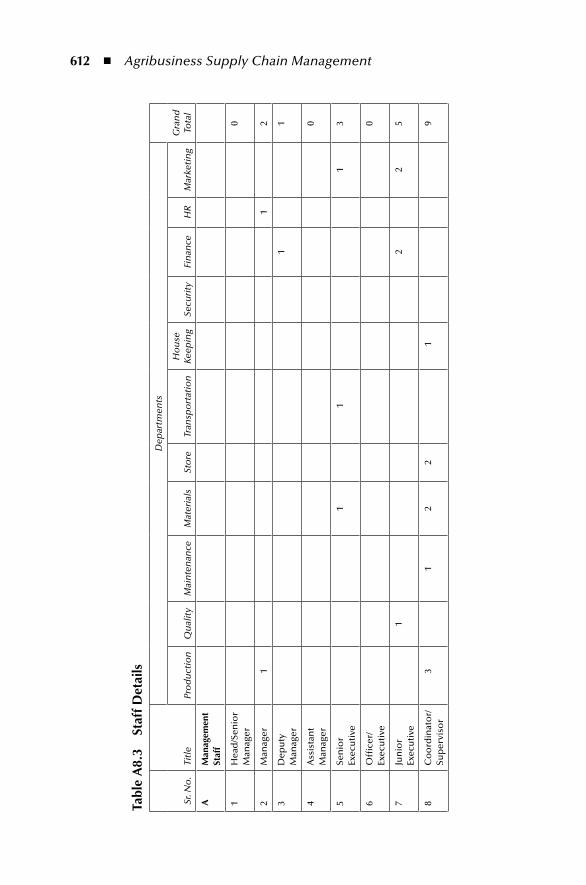
612 ◾ Agribusiness Supply Chain Management
tabl
e A
8.3
Staf
f Det
ails
Sr. N
o.
Titl
e
Dep
artm
ents
Gra
nd
To
tal
Pro
du
ctio
nQ
ual
ity
Mai
nte
nan
ceM
ater
ials
Sto
reTr
ansp
ort
atio
nH
ou
se
Keep
ing
Secu
rity
Fin
ance
HR
M
arke
tin
g
Am
anag
emen
t St
aff
1H
ead
/Sen
ior
Man
ager
0
2M
anag
er1
12
3D
epu
ty
Man
ager
11
4A
ssis
tan
t M
anag
er0
5Se
nio
r Ex
ecu
tive
11
13
6O
ffice
r/Ex
ecu
tive
0
7Ju
nio
r Ex
ecu
tive
12
25
8C
oo
rdin
ato
r/Su
per
viso
r3
12
21
9
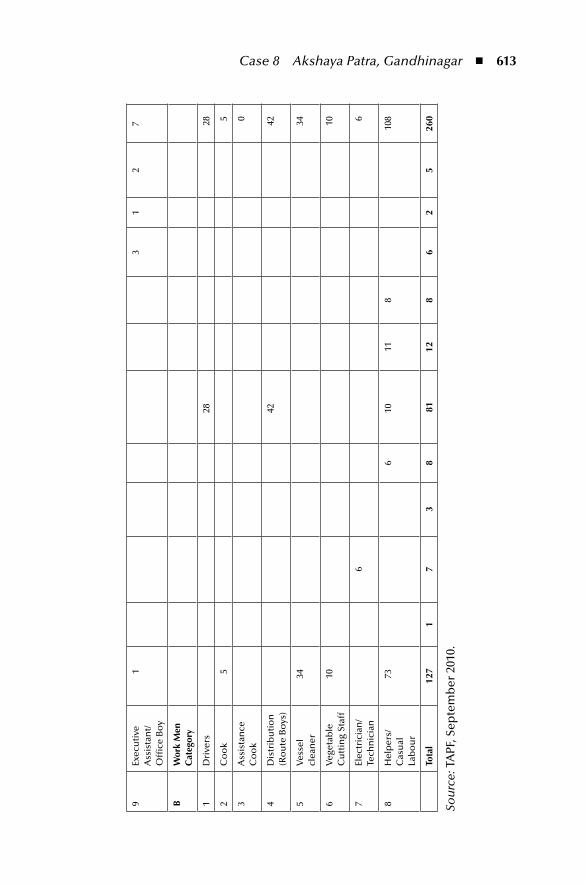
Case 8 Akshaya Patra, Gandhinagar ◾ 613
9Ex
ecu
tive
A
ssis
tan
t/O
ffice
Bo
y
13
12
7
BW
ork
men
C
ateg
ory
1D
rive
rs28
28
2C
oo
k5
5
3A
ssis
tan
ce
Co
ok
0
4D
istr
ibu
tio
n
(Ro
ute
Bo
ys)
4242
5V
esse
l cl
ean
er34
34
6V
eget
able
C
utt
ing
Staf
f10
10
7El
ectr
icia
n/
Tech
nic
ian
66
8H
elp
ers/
Cas
ual
La
bo
ur
736
1011
810
8
tota
l12
71
73
881
128
62
526
0
Sou
rce:
TA
PF, S
epte
mb
er 2
010.
614 ◾ Agribusiness Supply Chain Management
seemed to be a concern as bills were pending for the last three years which totalled to approximately `15 lakhs.
Vegetables, pulses, oil, and spices were purchased locally as per requirement from Kalupur and Madhupura mandis in Ahmedabad at subsidized rates. Prices negoti-ated with the vendors were 10–12 per cent lower than the market price. For instance, the market price of moong mogar was `70 per kg but vendor’s supply price inclusive of delivery was `64 per kg. In June 2010, turmeric, chilli, coriander, and cumin seeds, etc., were centrally procured from different markets in India to have savings in purchases. Mutter dal was procured from the retail chain of Reliance for its superior quality (Reliance imported Mutter dal from Australia). Among the various raw mate-rials, moong dal, oil, turmeric, cumin seeds, and tomatoes were the high-value items.
On account of the inflation in 2009, central procurement in bulk was done by the TAPF HO to hedge against price increases of items like potato, mutter dal, chilli, turmeric, and coriander. These items were kept in cold storages and released to different TAPF units. However, their forecasting seemed to be fallacious as the prices came down drastically in 2010. Therefore, local purchasing was preferred to centralized procurement as the rates of these items varied across the country. Further, the storage facility in the Gandhinagar kitchen had space constraints.
Inventory at the storehouse mainly comprised food grains, provisions, and vita-min supplements. Inventories received as government grants were determined at the lower of the market price or regulated price for accounting purposes and a purchase requisition was raised by the store department when the stocks reached their reorder level (refer to Table A8.4 for the minimum stock, maximum stock, reorder level, and shelf life of some of the items). In case the lead time of the items exceeded the nor-mal delivery time and the stocks hit their minimum level, emergency purchases were made to continue operations smoothly. Accordingly, the purchase department col-lected samples and quotations from different suppliers. (Table A8.5 provides a detailed grocery rate comparison at Gandhinagar). The samples were checked by the quality control executives and the supervisor-in-charge of operations. The criteria for the selec-tion of vendors were governed by market rate, offer rate, quality of samples based on the raw material specification, and the past performance of the supplier’s commitment for delivery on a given date, time, requirement, and quality as per the sample.
There was a reasonable level of automation in the preparation of meals. The necessary equipment and spare parts were procured from different vendors as per specific requirements (Table A8.6 shows the spare parts purchased, their purpose, and the frequency of procurement). To maintain hygiene at the storehouse, the Pest Control of India was contracted to carry out fly management operations every day, rodent check three times in a month, and fumigation once a year.
Production
TAPF developed the menu keeping in mind the local tastes and preferences of the children. The menu was primarily designed to fulfil the norms of providing a
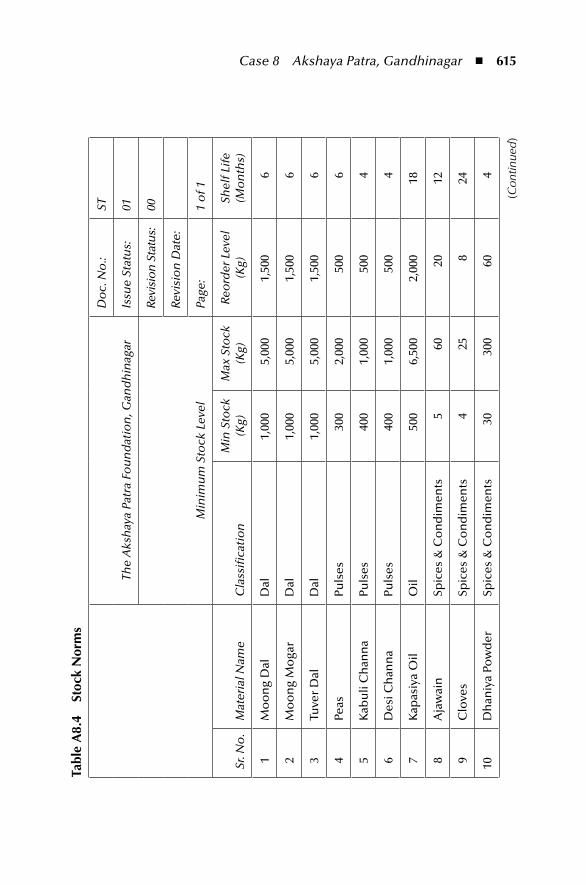
Case 8 Akshaya Patra, Gandhinagar ◾ 615
tabl
e A
8.4
Stoc
k n
orm
s
The
Aks
hay
a Pa
tra
Fou
nd
atio
n, G
and
hin
agar
Do
c. N
o.:
ST
Issu
e St
atu
s:
01
Min
imu
m S
tock
Lev
el
Revi
sio
n S
tatu
s:
00
Revi
sio
n D
ate:
Page
: 1
of 1
Sr. N
o.
Mat
eria
l Nam
eC
lass
ifica
tio
nM
in S
tock
(K
g)M
ax S
tock
(K
g)Re
ord
er L
evel
(K
g)Sh
elf L
ife
(Mo
nth
s)
1M
oo
ng
Dal
Dal
1,00
05,
000
1,50
06
2M
oo
ng
Mo
gar
Dal
1,00
05,
000
1,50
06
3Tu
ver
Dal
Dal
1,00
05,
000
1,50
06
4Pe
asPu
lses
300
2,00
050
06
5K
abu
li C
han
na
Puls
es40
01,
000
500
4
6D
esi C
han
na
Puls
es40
01,
000
500
4
7K
apas
iya
Oil
Oil
500
6,50
02,
000
18
8A
jaw
ain
Spic
es &
Co
nd
imen
ts5
6020
12
9C
love
sSp
ices
& C
on
dim
ents
425
824
10D
han
iya
Pow
der
Spic
es &
Co
nd
imen
ts30
300
604
(Con
tinue
d)
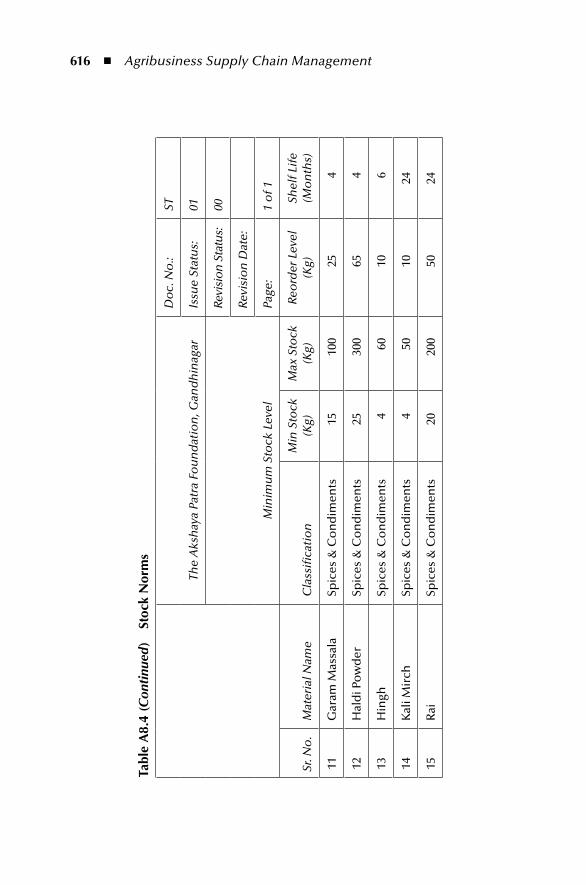
616 ◾ Agribusiness Supply Chain Management
tabl
e A
8.4
(Con
tinu
ed)
Stoc
k n
orm
s
The
Aks
hay
a Pa
tra
Fou
nd
atio
n, G
and
hin
agar
Do
c. N
o.:
ST
Issu
e St
atu
s:
01
Min
imu
m S
tock
Lev
el
Revi
sio
n S
tatu
s:
00
Revi
sio
n D
ate:
Page
: 1
of 1
Sr. N
o.
Mat
eria
l Nam
eC
lass
ifica
tio
nM
in S
tock
(K
g)M
ax S
tock
(K
g)Re
ord
er L
evel
(K
g)Sh
elf L
ife
(Mo
nth
s)
11G
aram
Mas
sala
Spic
es &
Co
nd
imen
ts15
100
254
12H
ald
i Po
wd
erSp
ices
& C
on
dim
ents
2530
065
4
13H
ingh
Spic
es &
Co
nd
imen
ts4
6010
6
14K
ali M
irch
Spic
es &
Co
nd
imen
ts4
5010
24
15R
aiSp
ices
& C
on
dim
ents
2020
050
24
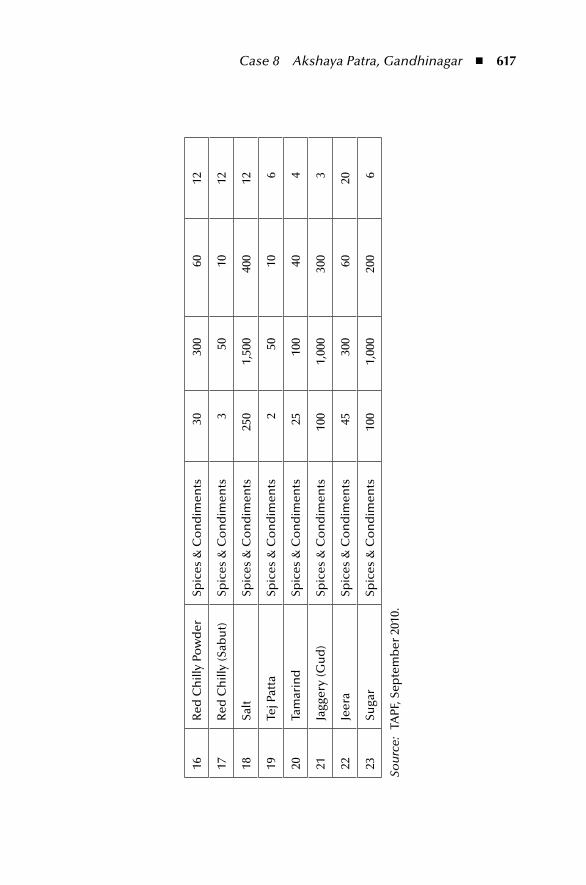
Case 8 Akshaya Patra, Gandhinagar ◾ 617
16R
ed C
hill
y Po
wd
erSp
ices
& C
on
dim
ents
3030
060
12
17R
ed C
hill
y (S
abu
t)Sp
ices
& C
on
dim
ents
350
1012
18Sa
ltSp
ices
& C
on
dim
ents
250
1,50
040
012
19Te
j Pat
taSp
ices
& C
on
dim
ents
250
106
20Ta
mar
ind
Spic
es &
Co
nd
imen
ts25
100
404
21Ja
gger
y (G
ud
)Sp
ices
& C
on
dim
ents
100
1,00
030
03
22Je
era
Spic
es &
Co
nd
imen
ts45
300
6020
23Su
gar
Spic
es &
Co
nd
imen
ts10
01,
000
200
6
Sou
rce:
TA
PF, S
epte
mb
er 2
010.
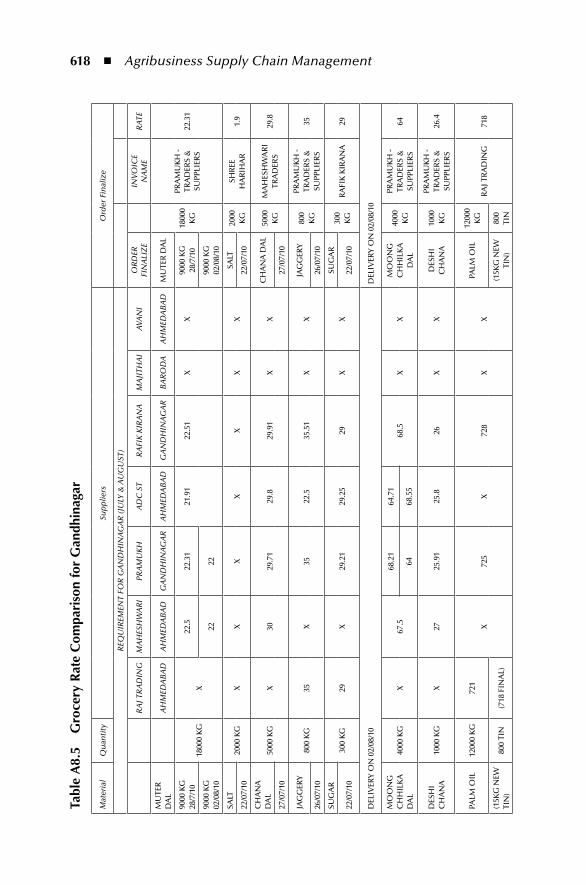
618 ◾ Agribusiness Supply Chain Management
tabl
e A
8.5
Gro
cery
rat
e C
ompa
riso
n fo
r G
andh
inag
ar
Mat
eria
lQ
uan
tity
Sup
plie
rsO
rder
Fin
aliz
e
REQ
UIR
EMEN
T FO
R G
AN
DH
INA
GA
R (J
ULY
& A
UG
UST
)
RA
J TR
AD
ING
MA
HES
HW
AR
IPR
AM
UK
HA
DC
ST
RA
FIK
KIR
AN
AM
AJI
THA
IA
VAN
IO
RD
ER
FIN
ALI
ZE
INVO
ICE
NA
ME
RA
TE
MU
TER
D
AL
AH
MED
AB
AD
AH
MED
AB
AD
GA
ND
HIN
AG
AR
AH
MED
AB
AD
GA
ND
HIN
AG
AR
BA
RO
DA
AH
MED
AB
AD
MU
TER
DA
L
1800
0 K
G
PRA
MU
KH
- TR
AD
ERS
&
SUPP
LIER
S22
.31
9000
KG
28
/7/1
018
000
KG
X
22.5
22.3
121
.91
22.5
1X
X90
00 K
G
28/7
/10
9000
KG
02
/08/
1022
2290
00 K
G
02/0
8/10
SALT
2000
KG
XX
XX
XX
XSA
LT20
00
KG
SHR
EE
HA
RIH
AR
1.9
22/0
7/10
22/0
7/10
CH
AN
A
DA
L50
00 K
GX
3029
.71
29.8
29.9
1X
XC
HA
NA
DA
L50
00
KG
MA
HES
HW
AR
I TR
AD
ERS
29.8
27/0
7/10
27/0
7/10
JAG
GER
Y80
0 K
G35
X35
22.5
35.5
1X
XJA
GG
ERY
800
KG
PRA
MU
KH
- TR
AD
ERS
&
SUPP
LIER
S35
26/0
7/10
26/0
7/10
SUG
AR
300
KG
29X
29.2
129
.25
29X
XSU
GA
R30
0 K
GR
AFI
K K
IRA
NA
2922
/07/
1022
/07/
10
DEL
IVER
Y O
N 0
2/08
/10
DEL
IVER
Y O
N 0
2/08
/10
MO
ON
G
CH
HIL
KA
D
AL
4000
KG
X67
.568
.21
64.7
168
.5X
XM
OO
NG
C
HH
ILK
A
DA
L
4000
K
G
PRA
MU
KH
- TR
AD
ERS
&
SUPP
LIER
S64
6468
.55
DES
HI
CH
AN
A10
00 K
GX
2725
.91
25.8
26X
XD
ESH
I C
HA
NA
1000
K
G
PRA
MU
KH
- TR
AD
ERS
&
SUPP
LIER
S26
.4
PALM
OIL
1200
0 K
G72
1
X72
5X
728
XX
PALM
OIL
1200
0 K
GR
AJ T
RA
DIN
G71
8
(15K
G N
EW
TIN
) 80
0 TI
N(7
18 F
INA
L)(1
5KG
NEW
TI
N)
800
TIN
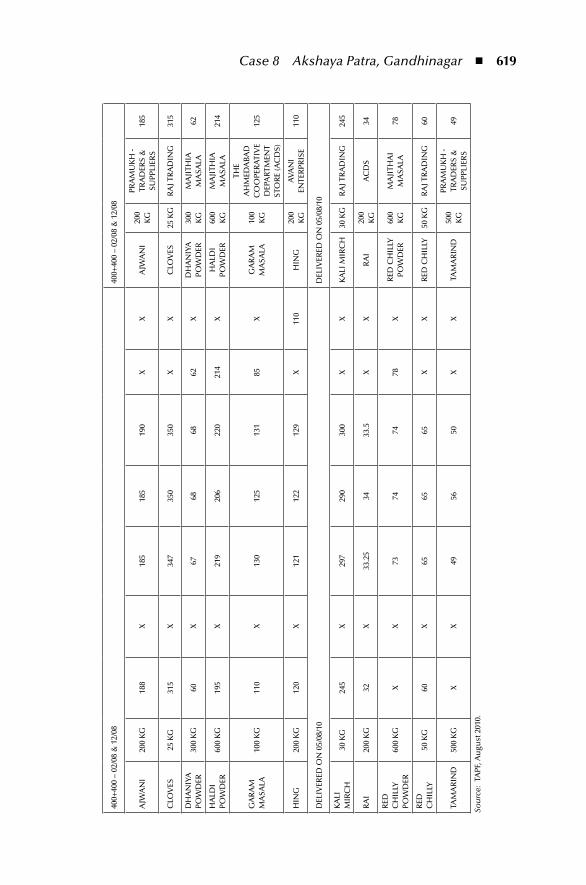
Case 8 Akshaya Patra, Gandhinagar ◾ 619
400+
400
– 02
/08
& 1
2/08
400+
400
– 02
/08
& 1
2/08
AJW
AN
I20
0 K
G18
8X
185
185
190
XX
AJW
AN
I20
0 K
G
PRA
MU
KH
- TR
AD
ERS
&
SUPP
LIER
S18
5
CLO
VES
25 K
G31
5X
347
350
350
XX
CLO
VES
25 K
GR
AJ T
RA
DIN
G31
5
DH
AN
IYA
PO
WD
ER30
0 K
G60
X67
6868
62X
DH
AN
IYA
PO
WD
ER30
0 K
GM
AJI
THIA
M
ASA
LA62
HA
LDI
POW
DER
600
KG
195
X21
920
622
021
4X
HA
LDI
POW
DER
600
KG
MA
JITH
IA
MA
SALA
214
GA
RA
M
MA
SALA
100
KG
110
X13
012
513
185
XG
AR
AM
M
ASA
LA10
0 K
G
THE
AH
MED
AB
AD
C
OO
PER
ATI
VE
DEP
AR
TMEN
T ST
OR
E (A
CD
S)
125
HIN
G20
0 K
G12
0X
121
122
129
X11
0H
ING
200
KG
AV
AN
I EN
TER
PRIS
E11
0
DEL
IVER
ED O
N 0
5/08
/10
DEL
IVER
ED O
N 0
5/08
/10
KA
LI
MIR
CH
30 K
G24
5X
297
290
300
XX
KA
LI M
IRC
H30
KG
RA
J TR
AD
ING
245
RA
I20
0 K
G32
X33
.25
3433
.5X
XR
AI
200
KG
AC
DS
34
RED
C
HIL
LY
POW
DER
600
KG
XX
7374
7478
XR
ED C
HIL
LY
POW
DER
600
KG
MA
JITH
AI
MA
SALA
78
RED
C
HIL
LY50
KG
60X
6565
65X
XR
ED C
HIL
LY50
KG
RA
J TR
AD
ING
60
TAM
AR
IND
500
KG
XX
4956
50X
XTA
MA
RIN
D50
0 K
G
PRA
MU
KH
- TR
AD
ERS
&
SUPP
LIER
S49
Sou
rce:
TA
PF, A
ugu
st 2
010.
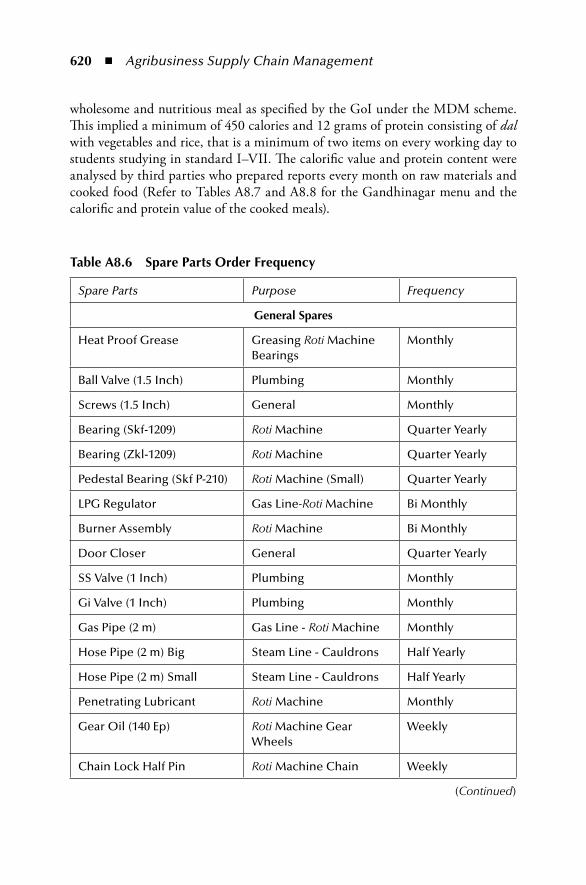
620 ◾ Agribusiness Supply Chain Management
wholesome and nutritious meal as specified by the GoI under the MDM scheme. This implied a minimum of 450 calories and 12 grams of protein consisting of dal with vegetables and rice, that is a minimum of two items on every working day to students studying in standard I–VII. The calorific value and protein content were analysed by third parties who prepared reports every month on raw materials and cooked food (Refer to Tables A8.7 and A8.8 for the Gandhinagar menu and the calorific and protein value of the cooked meals).
table A8.6 Spare parts order Frequency
Spare Parts Purpose Frequency
General Spares
Heat Proof Grease Greasing Roti Machine Bearings
Monthly
Ball Valve (1.5 Inch) Plumbing Monthly
Screws (1.5 Inch) General Monthly
Bearing (Skf-1209) Roti Machine Quarter Yearly
Bearing (Zkl-1209) Roti Machine Quarter Yearly
Pedestal Bearing (Skf P-210) Roti Machine (Small) Quarter Yearly
LPG Regulator Gas Line-Roti Machine Bi Monthly
Burner Assembly Roti Machine Bi Monthly
Door Closer General Quarter Yearly
SS Valve (1 Inch) Plumbing Monthly
Gi Valve (1 Inch) Plumbing Monthly
Gas Pipe (2 m) Gas Line - Roti Machine Monthly
Hose Pipe (2 m) Big Steam Line - Cauldrons Half Yearly
Hose Pipe (2 m) Small Steam Line - Cauldrons Half Yearly
Penetrating Lubricant Roti Machine Monthly
Gear Oil (140 Ep) Roti Machine Gear Wheels
Weekly
Chain Lock Half Pin Roti Machine Chain Weekly
(Continued)
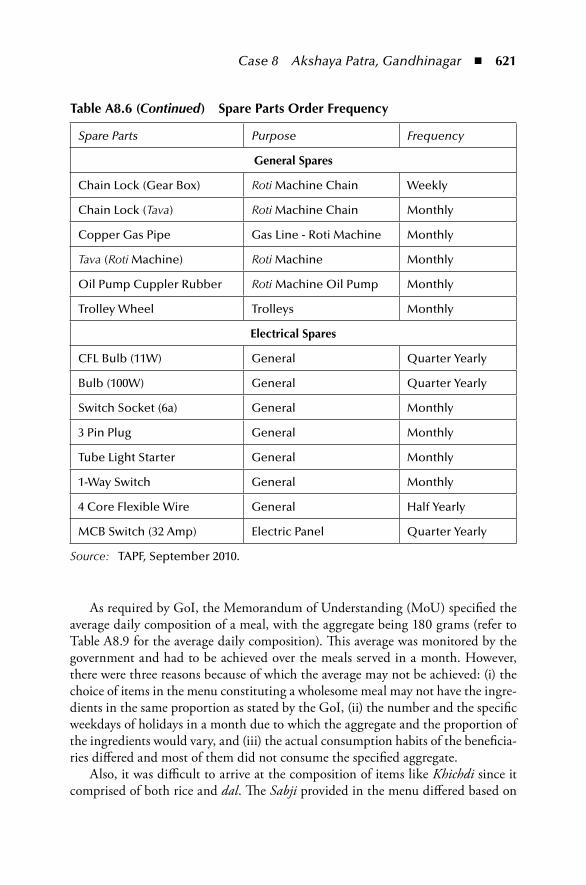
Case 8 Akshaya Patra, Gandhinagar ◾ 621
As required by GoI, the Memorandum of Understanding (MoU) specified the average daily composition of a meal, with the aggregate being 180 grams (refer to Table A8.9 for the average daily composition). This average was monitored by the government and had to be achieved over the meals served in a month. However, there were three reasons because of which the average may not be achieved: (i) the choice of items in the menu constituting a wholesome meal may not have the ingre-dients in the same proportion as stated by the GoI, (ii) the number and the specific weekdays of holidays in a month due to which the aggregate and the proportion of the ingredients would vary, and (iii) the actual consumption habits of the beneficia-ries differed and most of them did not consume the specified aggregate.
Also, it was difficult to arrive at the composition of items like Khichdi since it comprised of both rice and dal. The Sabji provided in the menu differed based on
table A8.6 (Continued) Spare parts order Frequency
Spare Parts Purpose Frequency
General Spares
Chain Lock (Gear Box) Roti Machine Chain Weekly
Chain Lock (Tava) Roti Machine Chain Monthly
Copper Gas Pipe Gas Line - Roti Machine Monthly
Tava (Roti Machine) Roti Machine Monthly
Oil Pump Cuppler Rubber Roti Machine Oil Pump Monthly
Trolley Wheel Trolleys Monthly
electrical Spares
CFL Bulb (11W) General Quarter Yearly
Bulb (100W) General Quarter Yearly
Switch Socket (6a) General Monthly
3 Pin Plug General Monthly
Tube Light Starter General Monthly
1-Way Switch General Monthly
4 Core Flexible Wire General Half Yearly
MCB Switch (32 Amp) Electric Panel Quarter Yearly
Source: TAPF, September 2010.
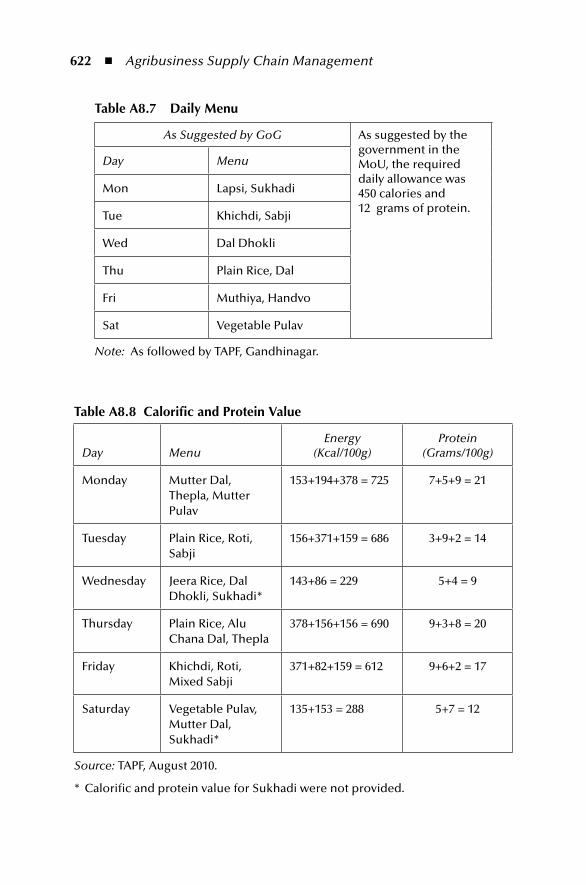
622 ◾ Agribusiness Supply Chain Management
table A8.8 Calorific and protein Value
Day MenuEnergy
(Kcal/100g)Protein
(Grams/100g)
Monday Mutter Dal, Thepla, Mutter Pulav
153+194+378 = 725 7+5+9 = 21
Tuesday Plain Rice, Roti, Sabji
156+371+159 = 686 3+9+2 = 14
Wednesday Jeera Rice, Dal Dhokli, Sukhadi*
143+86 = 229 5+4 = 9
Thursday Plain Rice, Alu Chana Dal, Thepla
378+156+156 = 690 9+3+8 = 20
Friday Khichdi, Roti, Mixed Sabji
371+82+159 = 612 9+6+2 = 17
Saturday Vegetable Pulav, Mutter Dal, Sukhadi*
135+153 = 288 5+7 = 12
Source: TAPF, August 2010.
* Calorific and protein value for Sukhadi were not provided.
table A8.7 Daily menu
As Suggested by GoG As suggested by the government in the MoU, the required daily allowance was 450 calories and 12 grams of protein.
Day Menu
Mon Lapsi, Sukhadi
Tue Khichdi, Sabji
Wed Dal Dhokli
Thu Plain Rice, Dal
Fri Muthiya, Handvo
Sat Vegetable Pulav
Note: As followed by TAPF, Gandhinagar.
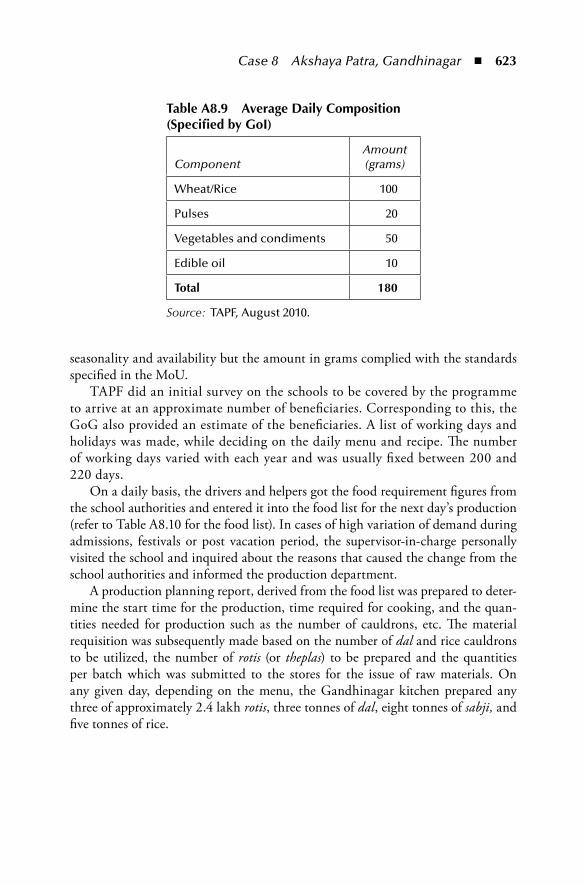
Case 8 Akshaya Patra, Gandhinagar ◾ 623
seasonality and availability but the amount in grams complied with the standards specified in the MoU.
TAPF did an initial survey on the schools to be covered by the programme to arrive at an approximate number of beneficiaries. Corresponding to this, the GoG also provided an estimate of the beneficiaries. A list of working days and holidays was made, while deciding on the daily menu and recipe. The number of working days varied with each year and was usually fixed between 200 and 220 days.
On a daily basis, the drivers and helpers got the food requirement figures from the school authorities and entered it into the food list for the next day’s production (refer to Table A8.10 for the food list). In cases of high variation of demand during admissions, festivals or post vacation period, the supervisor-in-charge personally visited the school and inquired about the reasons that caused the change from the school authorities and informed the production department.
A production planning report, derived from the food list was prepared to deter-mine the start time for the production, time required for cooking, and the quan-tities needed for production such as the number of cauldrons, etc. The material requisition was subsequently made based on the number of dal and rice cauldrons to be utilized, the number of rotis (or theplas) to be prepared and the quantities per batch which was submitted to the stores for the issue of raw materials. On any given day, depending on the menu, the Gandhinagar kitchen prepared any three of approximately 2.4 lakh rotis, three tonnes of dal, eight tonnes of sabji, and five tonnes of rice.
table A8.9 Average Daily Composition (Specified by Goi)
ComponentAmount (grams)
Wheat/Rice 100
Pulses 20
Vegetables and condiments 50
Edible oil 10
total 180
Source: TAPF, August 2010.

624 ◾ Agribusiness Supply Chain Management
tabl
e A
8.10
Fo
od L
ist
for
thur
sday
Sep
tem
ber
9, 2
010,
as
obta
ined
on
Sept
embe
r 8,
201
0
The
Aks
hay
a Pa
tra
Fou
nd
atio
n, G
and
hin
agar
Do
c. N
o.:
DIS
T-09
Rev.
No
.:00
FOO
D L
IST
& B
ATC
H N
UM
BER
DET
AIL
SRe
v. D
ate:
Ah
med
abad
Cit
y
9-9-
2010
Rou
te N
o. 1
Tim
ing:
8.3
0 (A
.M.)
VD
NFJ
FN; L
8LD
rive
r Nam
e: A
lpes
h Ja
ni/H
elp
er’s
Nam
e: B
ala
Bh
arw
ad (9
9747
848
60)
Sup
ervi
sor N
ame:
Par
esh
So
lan
ki M
o.:
9274
3249
51(A
’bad
Cit
y) M
orn
ing
Thu
rsd
ay
Sr. N
o.
Sch
oo
l Nam
eA
vg.
Thep
la
Thep
laB
atch
N
o.
Ric
eB
atch
N
o.
Dal
Bat
ch
No
.Ve
ssel
sB
igM
ediu
mB
igM
ediu
mSm
all
Big
Med
ium
Smal
l
1La
xmin
agar
185
200
01
00
10
01
3
2Sa
bar
mat
i (H
ind
i - 1
)15
040
00
10
10
01
03
3Sa
bar
mat
i - 5
200
400
01
01
00
10
3
4Sa
bar
mat
i (G
uja
rati
- 7)
250
400
01
01
00
10
3
5Sa
bar
mat
i (G
uja
rati
- 3)
195
400
01
01
00
10
3
6Sa
bar
mat
i (H
ind
i - 3
)19
240
00
10
11
01
15
7D
har
mn
agar
V
idh
yala
y84
400
01
01
00
10
3
8K
esh
avn
agar
(G
uja
rati
- 1)
250
400
01
10
01
00
3
9M
ahat
ma
Gan
dh
i (G
uja
rati
- 1)
400
800
10
02
10
21
7
10V
adaj
(Hin
di -
1)
100
400
01
01
00
10
3
11V
adaj
- 1
350
400
01
01
00
10
3
12V
adaj
(G
uja
rati
- 3)
320
400
01
01
00
10
3
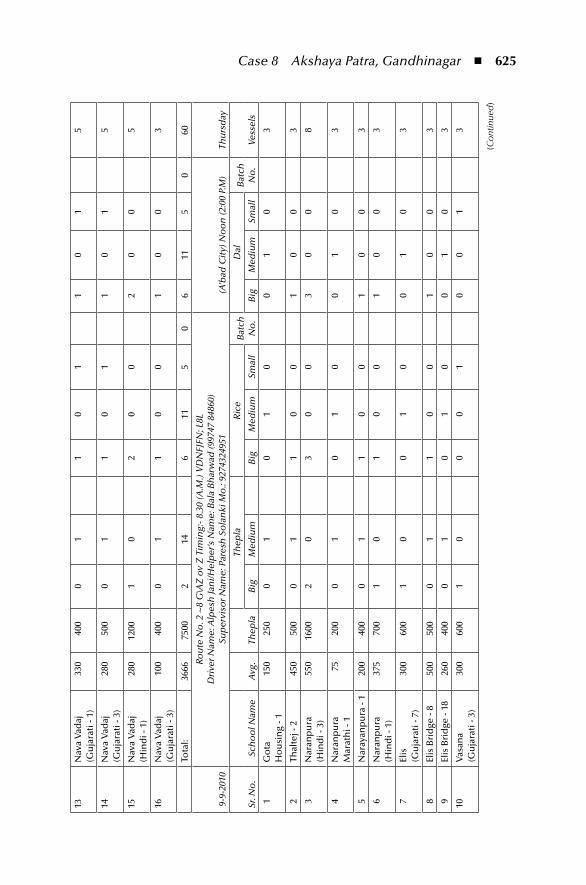
Case 8 Akshaya Patra, Gandhinagar ◾ 625
13N
ava
Vad
aj
(Gu
jara
ti -
1)33
040
00
11
01
10
15
14N
ava
Vad
aj
(Gu
jara
ti -
3)28
050
00
11
01
10
15
15N
ava
Vad
aj
(Hin
di -
1)
280
1200
10
20
02
00
5
16N
ava
Vad
aj
(Gu
jara
ti -
3)10
040
00
11
00
10
03
Tota
l:36
6675
002
146
115
06
115
060
9-9-
2010
Rou
te N
o. 2
~8
G\A
Z o
v Z
Tim
ing:
- 8.3
0 (A
.M.)
VD
NFJ
FN; L
8LD
rive
r Nam
e: A
lpes
h Ja
ni/H
elp
er’s
Nam
e: B
ala
Bh
arw
ad (9
9747
848
60)
Sup
ervi
sor N
ame:
Par
esh
So
lan
ki M
o.:
9274
3249
51(A
’bad
Cit
y) N
oo
n (2
:00
P.M
)Th
urs
day
Sr. N
o.
Sch
oo
l Nam
eA
vg.
Thep
la
Thep
laR
ice
Bat
ch
No
.
Dal
Bat
ch
No
.Ve
ssel
sB
igM
ediu
mB
igM
ediu
mSm
all
Big
Med
ium
Smal
l
1G
ota
H
ou
sin
g - 1
150
250
01
01
00
10
3
2Th
alte
j - 2
450
500
01
10
01
00
3
3N
aran
pu
ra
(Hin
di -
3)
550
1600
20
30
03
00
8
4N
aran
pu
ra
Mar
ath
i - 1
7520
00
10
10
01
03
5N
aray
anp
ura
- 1
200
400
01
10
01
00
3
6N
aran
pu
ra
(Hin
di -
1)
375
700
10
10
01
00
3
7El
is
(Gu
jara
ti -
7)30
060
01
00
10
01
03
8El
is B
rid
ge -
850
050
00
11
00
10
03
9El
is B
rid
ge -
1826
040
00
10
10
01
03
10V
asan
a (G
uja
rati
- 3)
300
600
10
00
10
01
3
(Con
tinue
d)
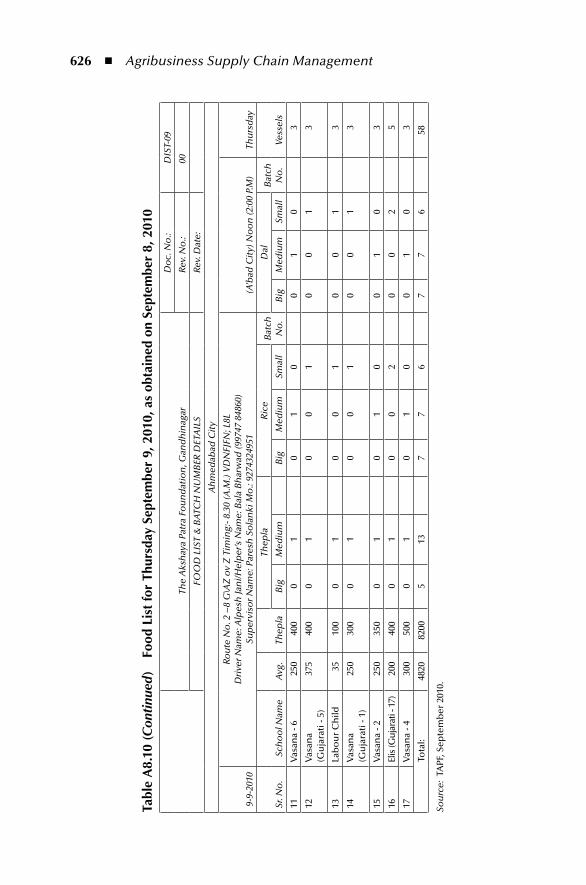
626 ◾ Agribusiness Supply Chain Management
tabl
e A
8.10
(Con
tinu
ed)
Food
Lis
t fo
r th
ursd
ay S
epte
mbe
r 9,
201
0, a
s ob
tain
ed o
n Se
ptem
ber
8, 2
010
The
Aks
hay
a Pa
tra
Fou
nd
atio
n, G
and
hin
agar
Do
c. N
o.:
DIS
T-09
Rev.
No
.:00
FOO
D L
IST
& B
ATC
H N
UM
BER
DET
AIL
SRe
v. D
ate:
Ah
med
abad
Cit
y
9-9-
2010
Rou
te N
o. 2
~8
G\A
Z o
v Z
Tim
ing:
- 8.3
0 (A
.M.)
VD
NFJ
FN; L
8LD
rive
r Nam
e: A
lpes
h Ja
ni/H
elp
er’s
Nam
e: B
ala
Bh
arw
ad (9
9747
848
60)
Sup
ervi
sor N
ame:
Par
esh
So
lan
ki M
o.:
9274
3249
51(A
’bad
Cit
y) N
oo
n (2
:00
P.M
)Th
urs
day
Sr. N
o.
Sch
oo
l Nam
eA
vg.
Thep
la
Thep
laR
ice
Bat
ch
No
.
Dal
Bat
ch
No
.Ve
ssel
sB
igM
ediu
mB
igM
ediu
mSm
all
Big
Med
ium
Smal
l
11V
asan
a - 6
250
400
01
01
00
10
3
12V
asan
a (G
uja
rati
- 5)
375
400
01
00
10
01
3
13La
bo
ur
Ch
ild35
100
01
00
10
01
3
14V
asan
a (G
uja
rati
- 1)
250
300
01
00
10
01
3
15V
asan
a - 2
250
350
01
01
00
10
3
16El
is (G
ujar
ati -
17)
200
400
01
00
20
02
5
17V
asan
a - 4
300
500
01
01
00
10
3
Tota
l:48
2082
005
137
76
77
658
Sou
rce:
TA
PF, S
epte
mb
er 2
010.
Case 8 Akshaya Patra, Gandhinagar ◾ 627
Pre-processing and Cooking
The kitchen was set in motion around 9:30 pm with the precooking activities such as washing and cutting of vegetables. The masala-making process started at 4:30 am followed by cooking at 5:00 am. The total production and cook-to-consume times varied between 6 and 7 hours and 5 and 6 hours, respectively.
Being a centralized kitchen, mechanization facilitated reduced human han-dling, thereby ensuring quality. Grains, pulses, and spices were washed, sorted, and stored. Vegetables were washed, sorted, peeled, and cut using specifically designed vegetable-cutting machines and then stored. Cutting was done in different patterns either by machine or manually. It was preferred to cut the vegetables into small shapes so that the children could consume them easily. Condiments were sorted, cleaned, ground, mixed, and stored. Oil was stored in cans and used either directly for certain items or poured into tanks for usage on tap or as a spray.
The rice-cleaning machine had a capacity of five tons per hour. It was divided into three sections. The first section separated metal adulterants such as nails, iron filings, etc. The second section filtered out dust, moth, chaff, husk, and broken rice grains while the third section removed stones from the rice.
Steam was the medium of cooking. It was generated using boilers and then passed into the cauldrons for cooking. There were separate cauldrons for cook-ing rice or rice-based items and for dal or dal-based items. Rice cauldrons had the capacity to cook 100 kg of rice in 20 minutes for 1,000 children. Each dal cauldron had the capacity to prepare 1,200 litres of dal in under two hours for 6,000 children. The Gandhinagar kitchen had deployed eight rice cauldrons and five dal cauldrons for total production.
One of the innovations of the TAPF kitchens was the roti-making machine which could yield up to 40,000 rotis per hour. Water was added to flour in vessels to make the dough mechanically. The dough was fed manually to the machine whose first step was flattening the dough through rollers. The flattened dough was cut into round shapes using the rotary cutting die. The rotis were further moved into a burner for cooking them on both the sides. The rotis were then sprayed with oil through a mesh, to keep them soft and tasty.
It was observed that, in general, children did not consume more than two rotis (some did not even consume more than one roti). This resulted in insufficient wheat intake. The two rotis which totalled 40 grams did not meet the norm for minimum wheat consumption set at 50 grams per day. To help the situation, a new item Sukhadi, a popular sweet made from fortified atta, was introduced in the menu. TAPF designed and procured a special machine to prepare it. The approxi-mate cost of the machine was `1.6 lakhs and it produced Sukhadi at the rate of 150 kg per hour. (Figures A8.3 through A8.10 display the equipment used in the kitchen for cooking.)
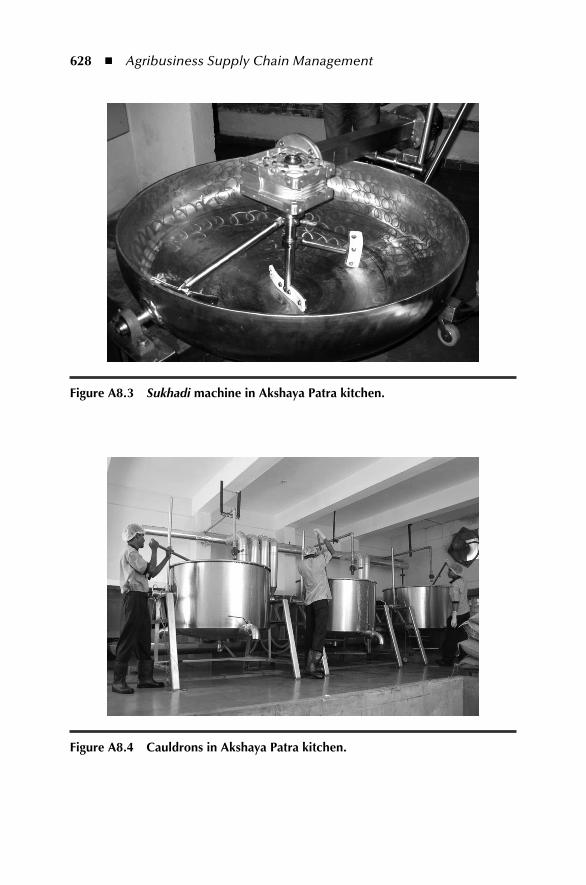
628 ◾ Agribusiness Supply Chain Management
Figure A8.3 Sukhadi machine in Akshaya patra kitchen.
Figure A8.4 Cauldrons in Akshaya patra kitchen.
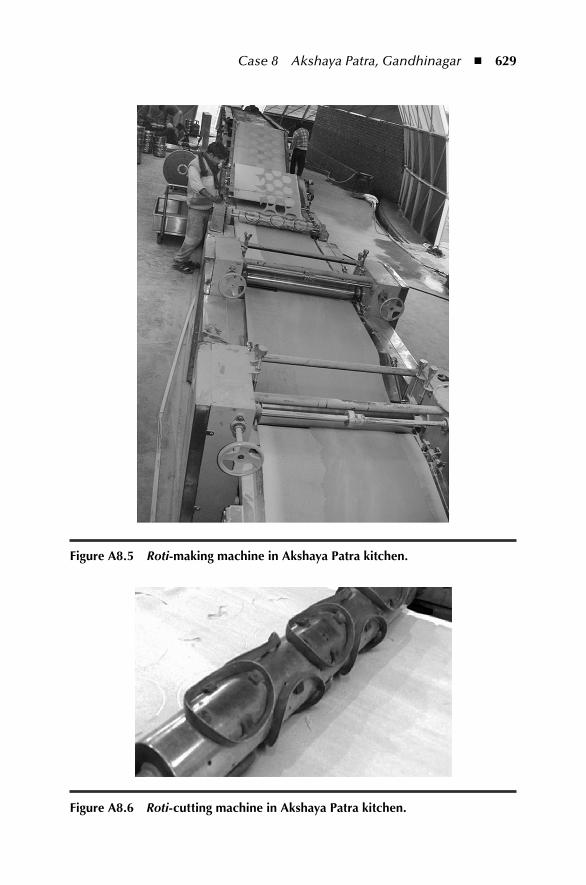
Case 8 Akshaya Patra, Gandhinagar ◾ 629
Figure A8.5 Roti-making machine in Akshaya patra kitchen.
Figure A8.6 Roti-cutting machine in Akshaya patra kitchen.
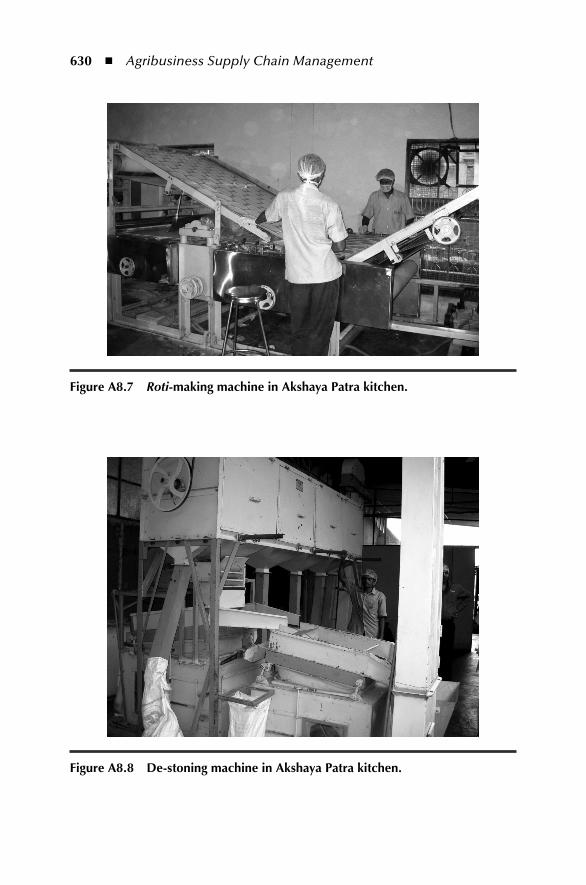
630 ◾ Agribusiness Supply Chain Management
Figure A8.7 Roti-making machine in Akshaya patra kitchen.
Figure A8.8 De-stoning machine in Akshaya patra kitchen.
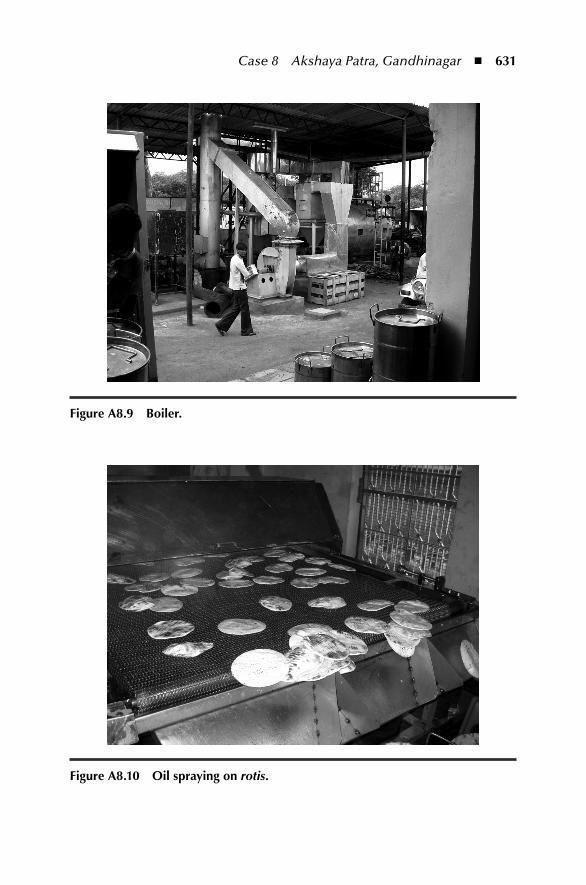
Case 8 Akshaya Patra, Gandhinagar ◾ 631
Figure A8.9 Boiler.
Figure A8.10 oil spraying on rotis.
632 ◾ Agribusiness Supply Chain Management
Packing
The prepared food was packed into stainless steel containers with tight-fitting lids that prevented pilferage, leakages, and retained heat. The expenditure on contain-ers was borne by TAPF, while other utensils and plates in schools were supplied by the GoG. By 2010, TAPF had spent approximately `50 lakhs on containers. The containers were in three different sizes—small, medium, and big, with the capacity to accommodate food (other than rotis) for about 50, 100, and 200 beneficiaries, respectively. The requirement for each school was determined in units of containers based on the average beneficiaries, but moderated based on the actual requirements for the next day. However, even this led to supply mismatches since per capita con-sumption of each school varied, affected by factors such as heavy rains, festivals, local events, etc. In general the supply was more than less.
For packing rotis, medium and big containers with the capacity of about 600 and 1,200 rotis respectively were generally used. This was because of insufficient num-ber of small containers, whose usage was preferred for dal, Sabji or rice. After the rotis were produced, they were packed school-wise (and thus not necessarily to its full capacity), using a weighing machine. Since each roti weighed 25 grams, the medium and big containers would weigh about 15 kg and 30 kg, respectively.
Each container was labelled after packing. The label comprised the name of the school and route number, and in the case of rotis, the equivalent number packed. The packed containers were then placed on a platform route-wise next to the vehicle allotted for that route. When all the containers for a route were packed, a food-packing report was prepared, giving the number of containers and the packing time for each route. (Refer to Table A8.11 for the food-packing report. This report does not have the Sukhadi details, an item being introduced recently.)
Distribution
Each vehicle was assigned a driver, helper, and a supervisor. The driver was respon-sible for ensuring that the vehicle was loaded properly and kept a copy of the food list and the packing report. The containers were loaded into the vehicles in the ‘Last In First Out’ (LIFO) order, meaning containers for the last school were placed inside and those for the first school were placed near the door. After unloading, the driver/helper verified the required quantity needed for the next day from the school authorities. The supervisor had the responsibility of ensuring that the food reached every school safely as per the requirement and would often make surprise visits to schools.
The vehicles dropped the containers in the schools (about 14 to 18 schools per vehicle) and on their return trip, picked up the empty containers. Since schools had different timings, they were categorized into early morning and late morn-ing deliveries. The vehicles departed at 7 am for early morning delivery around
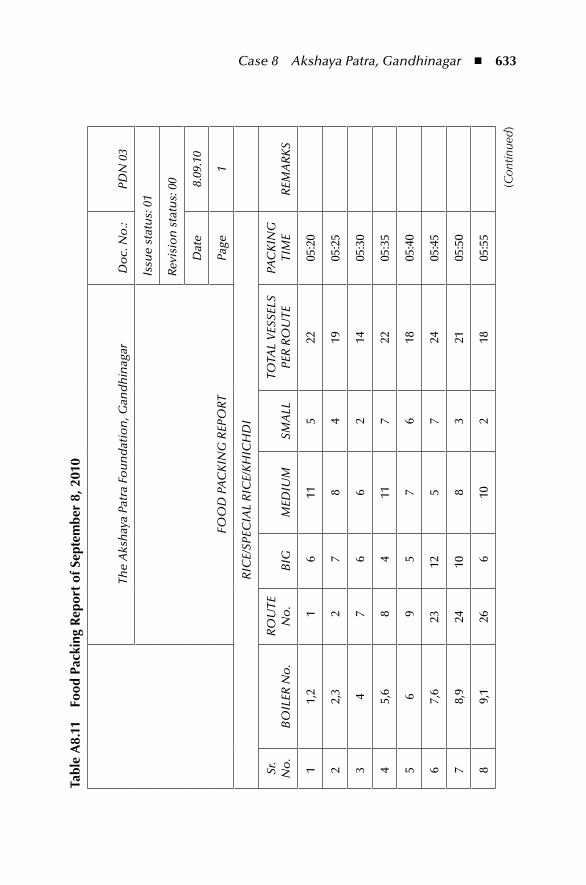
Case 8 Akshaya Patra, Gandhinagar ◾ 633
tabl
e A
8.11
Fo
od p
acki
ng r
epor
t of
Sep
tem
ber
8, 2
010
The
Aks
hay
a Pa
tra
Fou
nd
atio
n, G
and
hin
agar
Do
c. N
o.:
PDN
03
FOO
D P
AC
KIN
G R
EPO
RT
Issu
e st
atu
s: 0
1
Revi
sio
n s
tatu
s: 0
0
Dat
e8.
09.1
0
Page
1
RIC
E/SP
ECIA
L R
ICE/
KH
ICH
DI
Sr.
No
.B
OIL
ER N
o.
RO
UTE
N
o.
BIG
MED
IUM
SMA
LLTO
TAL
VES
SELS
PE
R R
OU
TEPA
CK
ING
TI
ME
REM
AR
KS
11,
21
611
522
05:2
0
22,
32
78
419
05:2
5
34
76
62
1405
:30
45,
68
411
722
05:3
5
56
95
76
1805
:40
67,
623
125
724
05:4
5
78,
924
108
321
05:5
0
89,
126
610
218
05:5
5
(Con
tinue
d)
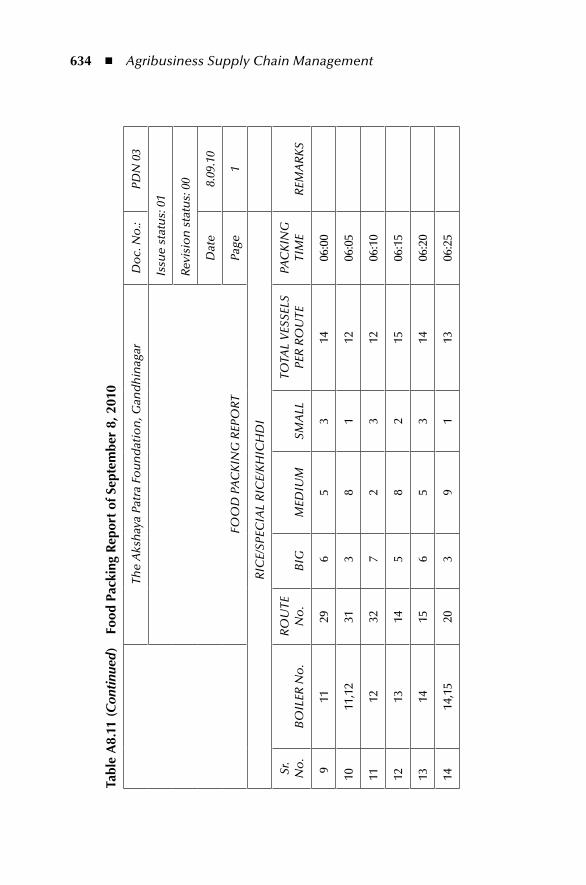
634 ◾ Agribusiness Supply Chain Management
tabl
e A
8.11
(Con
tinu
ed)
Food
pac
king
rep
ort
of S
epte
mbe
r 8,
201
0
The
Aks
hay
a Pa
tra
Fou
nd
atio
n, G
and
hin
agar
Do
c. N
o.:
PDN
03
FOO
D P
AC
KIN
G R
EPO
RT
Issu
e st
atu
s: 0
1
Revi
sio
n s
tatu
s: 0
0
Dat
e8.
09.1
0
Page
1
RIC
E/SP
ECIA
L R
ICE/
KH
ICH
DI
Sr.
No
.B
OIL
ER N
o.
RO
UTE
N
o.
BIG
MED
IUM
SMA
LLTO
TAL
VES
SELS
PE
R R
OU
TEPA
CK
ING
TI
ME
REM
AR
KS
911
296
53
1406
:00
1011
,12
313
81
1206
:05
1112
327
23
1206
:10
1213
145
82
1506
:15
1314
156
53
1406
:20
1414
,15
203
91
1306
:25
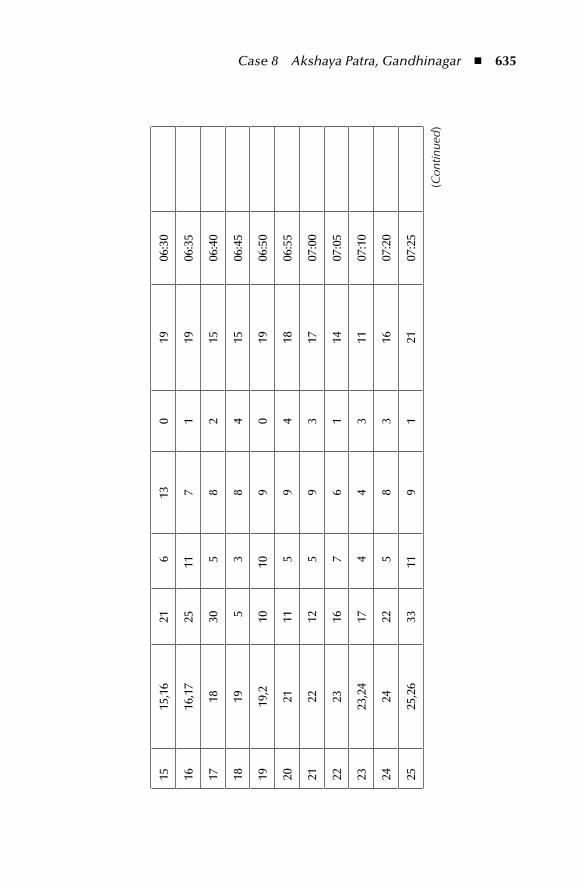
Case 8 Akshaya Patra, Gandhinagar ◾ 635
1515
,16
216
130
1906
:30
1616
,17
2511
71
1906
:35
1718
305
82
1506
:40
1819
53
84
1506
:45
1919
,210
109
019
06:5
0
2021
115
94
1806
:55
2122
125
93
1707
:00
2223
167
61
1407
:05
2323
,24
174
43
1107
:10
2424
225
83
1607
:20
2525
,26
3311
91
2107
:25
(Con
tinue
d)
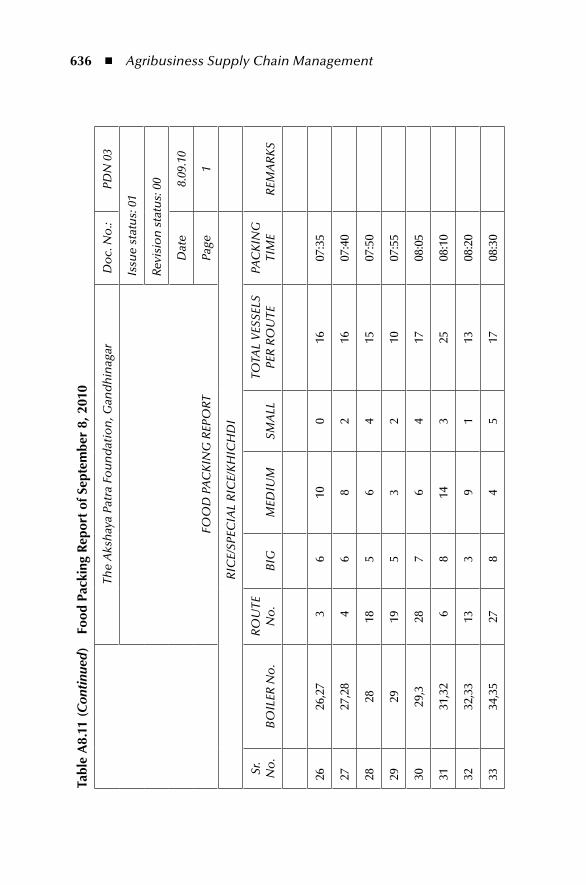
636 ◾ Agribusiness Supply Chain Management
tabl
e A
8.11
(Con
tinu
ed)
Food
pac
king
rep
ort
of S
epte
mbe
r 8,
201
0
The
Aks
hay
a Pa
tra
Fou
nd
atio
n, G
and
hin
agar
Do
c. N
o.:
PDN
03
FOO
D P
AC
KIN
G R
EPO
RT
Issu
e st
atu
s: 0
1
Revi
sio
n s
tatu
s: 0
0
Dat
e8.
09.1
0
Page
1
RIC
E/SP
ECIA
L R
ICE/
KH
ICH
DI
Sr.
No
.B
OIL
ER N
o.
RO
UTE
N
o.
BIG
MED
IUM
SMA
LLTO
TAL
VES
SELS
PE
R R
OU
TEPA
CK
ING
TI
ME
REM
AR
KS
2626
,27
36
100
1607
:35
2727
,28
46
82
1607
:40
2828
185
64
1507
:50
2929
195
32
1007
:55
3029
,328
76
417
08:0
5
3131
,32
68
143
2508
:10
3232
,33
133
91
1308
:20
3334
,35
278
45
1708
:30
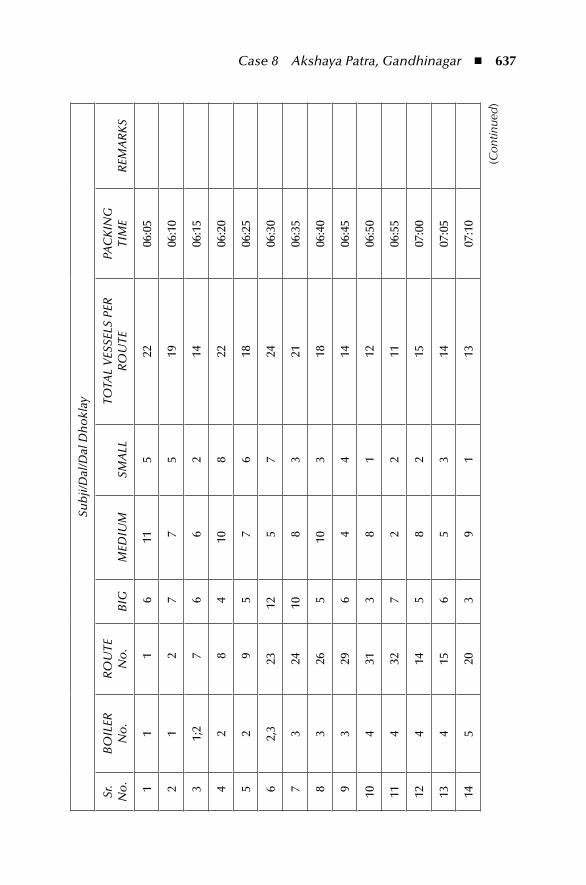
Case 8 Akshaya Patra, Gandhinagar ◾ 637
Sub
ji/D
al/D
al D
ho
klay
Sr.
No
.B
OIL
ER
No
.R
OU
TE
No
.B
IGM
EDIU
MSM
ALL
TOTA
L V
ESSE
LS P
ER
RO
UTE
PAC
KIN
G
TIM
ER
EMA
RK
S
11
16
115
2206
:05
21
27
75
1906
:10
31;
27
66
214
06:1
5
42
84
108
2206
:20
52
95
76
1806
:25
62,
323
125
724
06:3
0
73
2410
83
2106
:35
83
265
103
1806
:40
93
296
44
1406
:45
104
313
81
1206
:50
114
327
22
1106
:55
124
145
82
1507
:00
134
156
53
1407
:05
145
203
91
1307
:10
(Con
tinue
d)
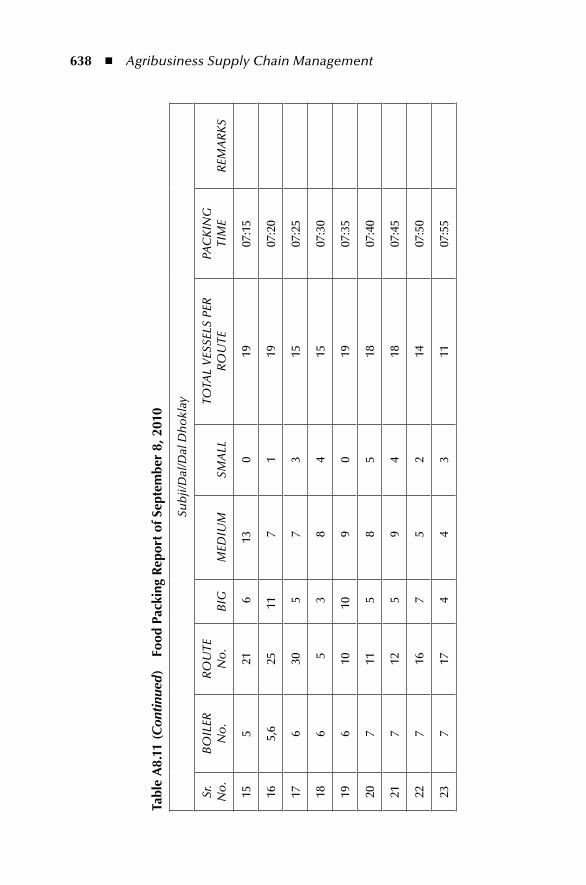
638 ◾ Agribusiness Supply Chain Management
tabl
e A
8.11
(Con
tinu
ed)
Food
pac
king
rep
ort
of S
epte
mbe
r 8,
201
0
Sub
ji/D
al/D
al D
ho
klay
Sr.
No
.B
OIL
ER
No
.R
OU
TE
No
.B
IGM
EDIU
MSM
ALL
TOTA
L V
ESSE
LS P
ER
RO
UTE
PAC
KIN
G
TIM
ER
EMA
RK
S
155
216
130
1907
:15
165,
625
117
119
07:2
0
176
305
73
1507
:25
186
53
84
1507
:30
196
1010
90
1907
:35
207
115
85
1807
:40
217
125
94
1807
:45
227
167
52
1407
:50
237
174
43
1107
:55
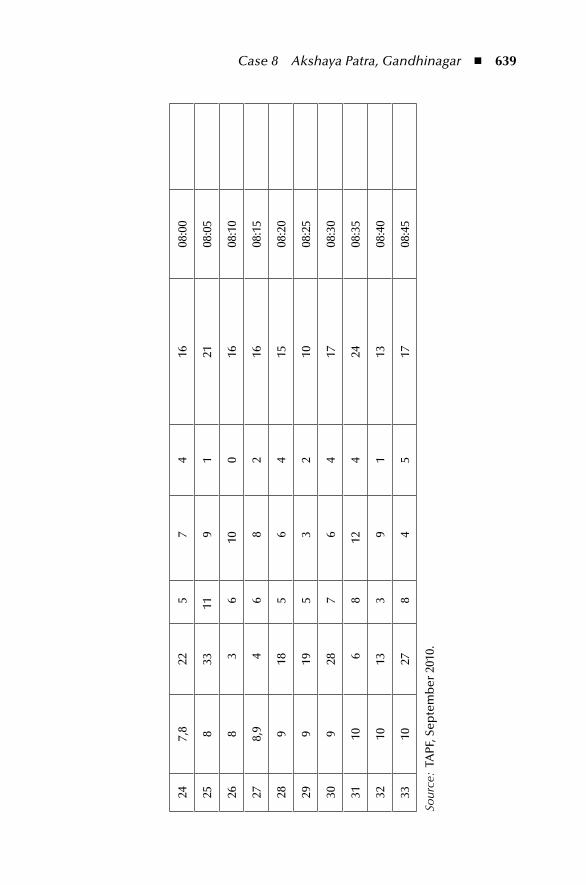
Case 8 Akshaya Patra, Gandhinagar ◾ 639
247,
822
57
416
08:0
0
258
3311
91
2108
:05
268
36
100
1608
:10
278,
94
68
216
08:1
5
289
185
64
1508
:20
299
195
32
1008
:25
309
287
64
1708
:30
3110
68
124
2408
:35
3210
133
91
1308
:40
3310
278
45
1708
:45
Sour
ce:
TAPF
, Sep
tem
ber
201
0.
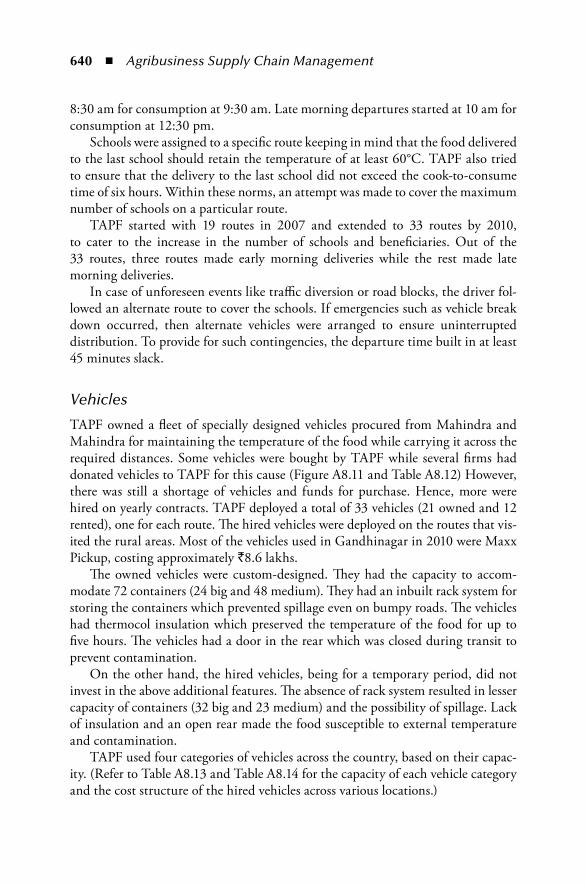
640 ◾ Agribusiness Supply Chain Management
8:30 am for consumption at 9:30 am. Late morning departures started at 10 am for consumption at 12:30 pm.
Schools were assigned to a specific route keeping in mind that the food delivered to the last school should retain the temperature of at least 60°C. TAPF also tried to ensure that the delivery to the last school did not exceed the cook-to-consume time of six hours. Within these norms, an attempt was made to cover the maximum number of schools on a particular route.
TAPF started with 19 routes in 2007 and extended to 33 routes by 2010, to cater to the increase in the number of schools and beneficiaries. Out of the 33 routes, three routes made early morning deliveries while the rest made late morning deliveries.
In case of unforeseen events like traffic diversion or road blocks, the driver fol-lowed an alternate route to cover the schools. If emergencies such as vehicle break down occurred, then alternate vehicles were arranged to ensure uninterrupted distribution. To provide for such contingencies, the departure time built in at least 45 minutes slack.
Vehicles
TAPF owned a fleet of specially designed vehicles procured from Mahindra and Mahindra for maintaining the temperature of the food while carrying it across the required distances. Some vehicles were bought by TAPF while several firms had donated vehicles to TAPF for this cause (Figure A8.11 and Table A8.12) However, there was still a shortage of vehicles and funds for purchase. Hence, more were hired on yearly contracts. TAPF deployed a total of 33 vehicles (21 owned and 12 rented), one for each route. The hired vehicles were deployed on the routes that vis-ited the rural areas. Most of the vehicles used in Gandhinagar in 2010 were Maxx Pickup, costing approximately `8.6 lakhs.
The owned vehicles were custom-designed. They had the capacity to accom-modate 72 containers (24 big and 48 medium). They had an inbuilt rack system for storing the containers which prevented spillage even on bumpy roads. The vehicles had thermocol insulation which preserved the temperature of the food for up to five hours. The vehicles had a door in the rear which was closed during transit to prevent contamination.
On the other hand, the hired vehicles, being for a temporary period, did not invest in the above additional features. The absence of rack system resulted in lesser capacity of containers (32 big and 23 medium) and the possibility of spillage. Lack of insulation and an open rear made the food susceptible to external temperature and contamination.
TAPF used four categories of vehicles across the country, based on their capac-ity. (Refer to Table A8.13 and Table A8.14 for the capacity of each vehicle category and the cost structure of the hired vehicles across various locations.)
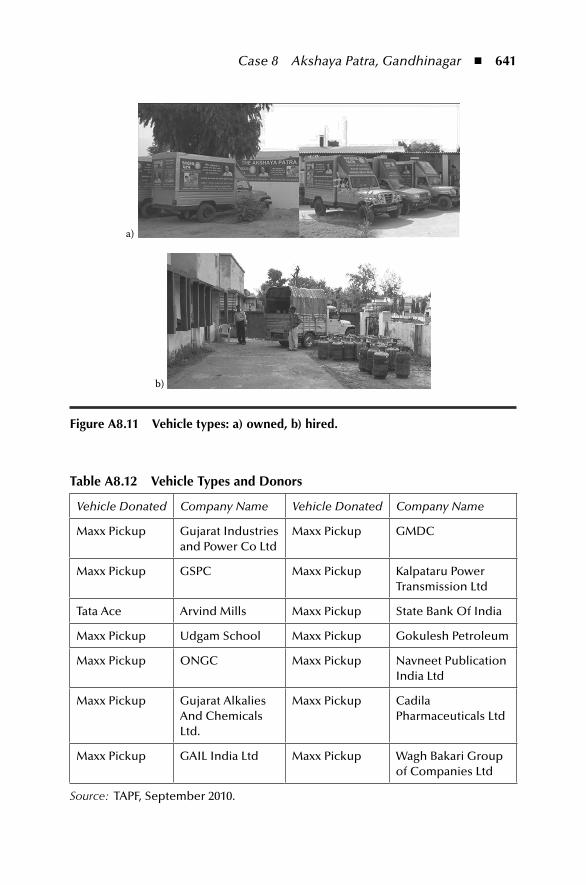
Case 8 Akshaya Patra, Gandhinagar ◾ 641
table A8.12 Vehicle types and Donors
Vehicle Donated Company Name Vehicle Donated Company Name
Maxx Pickup Gujarat Industries and Power Co Ltd
Maxx Pickup GMDC
Maxx Pickup GSPC Maxx Pickup Kalpataru Power Transmission Ltd
Tata Ace Arvind Mills Maxx Pickup State Bank Of India
Maxx Pickup Udgam School Maxx Pickup Gokulesh Petroleum
Maxx Pickup ONGC Maxx Pickup Navneet Publication India Ltd
Maxx Pickup Gujarat Alkalies And Chemicals Ltd.
Maxx Pickup Cadila Pharmaceuticals Ltd
Maxx Pickup GAIL India Ltd Maxx Pickup Wagh Bakari Group of Companies Ltd
Source: TAPF, September 2010.
a)
b)
Figure A8.11 Vehicle types: a) owned, b) hired.
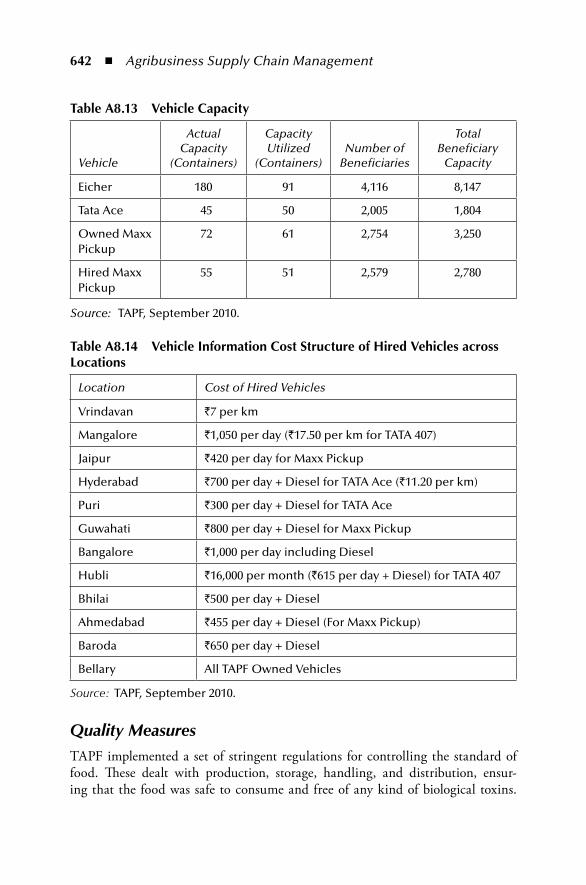
642 ◾ Agribusiness Supply Chain Management
Quality MeasuresTAPF implemented a set of stringent regulations for controlling the standard of food. These dealt with production, storage, handling, and distribution, ensur-ing that the food was safe to consume and free of any kind of biological toxins.
table A8.13 Vehicle Capacity
Vehicle
Actual Capacity
(Containers)
Capacity Utilized
(Containers)Number of
Beneficiaries
Total Beneficiary
Capacity
Eicher 180 91 4,116 8,147
Tata Ace 45 50 2,005 1,804
Owned Maxx Pickup
72 61 2,754 3,250
Hired Maxx Pickup
55 51 2,579 2,780
Source: TAPF, September 2010.
table A8.14 Vehicle information Cost Structure of Hired Vehicles across Locations
Location Cost of Hired Vehicles
Vrindavan `7 per km
Mangalore `1,050 per day (`17.50 per km for TATA 407)
Jaipur `420 per day for Maxx Pickup
Hyderabad `700 per day + Diesel for TATA Ace (`11.20 per km)
Puri `300 per day + Diesel for TATA Ace
Guwahati `800 per day + Diesel for Maxx Pickup
Bangalore `1,000 per day including Diesel
Hubli `16,000 per month (`615 per day + Diesel) for TATA 407
Bhilai `500 per day + Diesel
Ahmedabad `455 per day + Diesel (For Maxx Pickup)
Baroda `650 per day + Diesel
Bellary All TAPF Owned Vehicles
Source: TAPF, September 2010.

Case 8 Akshaya Patra, Gandhinagar ◾ 643
Mechanization of the facility had helped them in achieving the highest standards of hygiene by minimizing human handling of food. The parameters defined by them for food safety and hygiene were:
Good Hygiene Practices
◾ Personal Hygiene: Safety gloves, shoe covers, foot wears, aprons, hand sanitizers, and proper hand washing
◾ Equipment Hygiene: Washing of equipment with soap solution, cauldron sterilization, and distribution containers sterilization
Good Manufacturing Practices
◾ Adhering to the Prerequisite Program for food safety and following the pro-duction process stated in the Standard Operating Process. (The program and process had been evolved and codified by TAPF to be followed by all kitchens).
◾ Cooking as per standards of ISO 22000:2005, and monitoring the critical control points through temperature control.
Good Storage Practices
◾ Maintaining good storage conditions for the raw material: Cool, dry, and clean
◾ Following the rule of First Expiry First Out (FEFO) ◾ Pest infestation control
Good Distribution Practices
◾ Proper packing ◾ Tight-fitting lids ◾ Hygienic containers
In terms of procurement, they insisted that the raw materials be packed properly in clean gunny bags or any other food grade/safe plastic materials and not be in contact with any bags of cement, chemicals, soap powders or non-vegetarian items etc. They also ensured that raw materials were delivered in neat and clean, closed or covered vehicles. The acceptance and rejection criteria were based on the quality and safety of the raw material. (Refer to Table A8.15 for the quality checks imposed on some of the raw materials.) The rejected goods were sent back to the supplier, in case quality checks turned out to be negative.
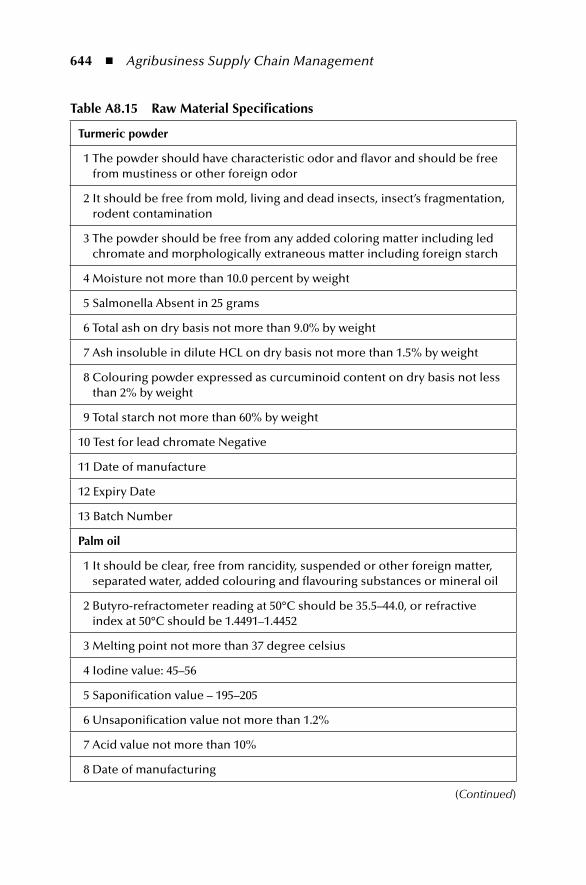
644 ◾ Agribusiness Supply Chain Management
table A8.15 raw material Specifications
turmeric powder
1 The powder should have characteristic odor and flavor and should be free from mustiness or other foreign odor
2 It should be free from mold, living and dead insects, insect’s fragmentation, rodent contamination
3 The powder should be free from any added coloring matter including led chromate and morphologically extraneous matter including foreign starch
4 Moisture not more than 10.0 percent by weight
5 Salmonella Absent in 25 grams
6 Total ash on dry basis not more than 9.0% by weight
7 Ash insoluble in dilute HCL on dry basis not more than 1.5% by weight
8 Colouring powder expressed as curcuminoid content on dry basis not less than 2% by weight
9 Total starch not more than 60% by weight
10 Test for lead chromate Negative
11 Date of manufacture
12 Expiry Date
13 Batch Number
palm oil
1 It should be clear, free from rancidity, suspended or other foreign matter, separated water, added colouring and flavouring substances or mineral oil
2 Butyro-refractometer reading at 50°C should be 35.5–44.0, or refractive index at 50°C should be 1.4491–1.4452
3 Melting point not more than 37 degree celsius
4 Iodine value: 45–56
5 Saponification value – 195–205
6 Unsaponification value not more than 1.2%
7 Acid value not more than 10%
8 Date of manufacturing
(Continued)
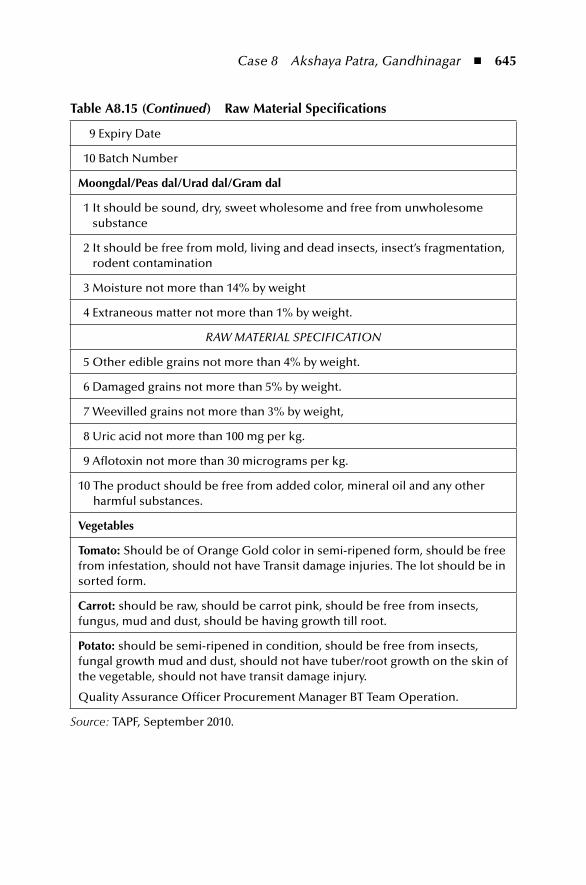
Case 8 Akshaya Patra, Gandhinagar ◾ 645
table A8.15 (Continued) raw material Specifications
9 Expiry Date
10 Batch Number
moongdal/peas dal/urad dal/Gram dal
1 It should be sound, dry, sweet wholesome and free from unwholesome substance
2 It should be free from mold, living and dead insects, insect’s fragmentation, rodent contamination
3 Moisture not more than 14% by weight
4 Extraneous matter not more than 1% by weight.
RAW MATERIAL SPECIFICATION
5 Other edible grains not more than 4% by weight.
6 Damaged grains not more than 5% by weight.
7 Weevilled grains not more than 3% by weight,
8 Uric acid not more than 100 mg per kg.
9 Aflotoxin not more than 30 micrograms per kg.
10 The product should be free from added color, mineral oil and any other harmful substances.
Vegetables
tomato: Should be of Orange Gold color in semi-ripened form, should be free from infestation, should not have Transit damage injuries. The lot should be in sorted form.
Carrot: should be raw, should be carrot pink, should be free from insects, fungus, mud and dust, should be having growth till root.
potato: should be semi-ripened in condition, should be free from insects, fungal growth mud and dust, should not have tuber/root growth on the skin of the vegetable, should not have transit damage injury.
Quality Assurance Officer Procurement Manager BT Team Operation.
Source: TAPF, September 2010.
646 ◾ Agribusiness Supply Chain Management
Assistance towards Funding the MealTAPF received subsidy from the GoG. As of June 2010, this was ̀ 2.00 + 100 grams of grains (a total equivalent of `2.42) per capita for students in standard I to VII. During 2009–2010, the average cost of a meal provided by TAPF was ̀ 4.69. Hence, there was a gap of `2.27. In addition, there was capital expenditure including, set-ting up of the kitchen. (Refer to Table A8.16 for the breakup of the average cost of a meal and capital expenditure in 2009–2010.)
To cover the gap, TAPF raised donations from the general public and organisations towards the meal costs of the 1.3 lakh children. Donations were raised through five main channels: ISKCON, preachers’ efforts, TAPF India mar-keting effort, Trustees, and abroad (primarily, TAPF, USA). (Refer to Table A8.17 for the donations received for Gandhinagar.)
Augmenting Employment OpportunitiesThe minimum wage policy was enforced in the Gandhinagar and Vadodara units. There was also an attempt to ensure retention. Minimum wages for unskilled work-ers started at `3,513 per month and for skilled labour at `3,578 per month. The Gandhinagar unit had 260 workers: 28 women and 232 men. The women worked from 10 am to 6:30 pm and engaged in vessel washing, vegetable cutting, dal cleaning etc. The men worked in multiple shifts in administration, production, and housekeeping departments. The workers were trained to function in accordance with the quality requirements.
Attrition was a major challenge. Workers would leave the job for better wages or to engage themselves in farming during the agricultural season. Some of the employees were addicted to tobacco and liquor consumption. However, the strin-gent culture at TAPF forbade them from this, resulting in turnover.
To address the situation, apart from the minimum wage policy, TAPF con-tributed an additional 12.5 per cent wages towards provident fund and insurance under the Provident Fund Act and Employees State Insurance Corporation. Even though the kitchen remained unutilised during the April to June vacation period, the workers were paid 50 per cent of their salary.
ConcernsEffective management solutions were implemented such as the deployment of Tally for purchase requisitions and payables, and biometric Employees State Insurance card to all the employees. Department-wise task lists and schedules were provided to every employee by the Human Resource Department. It also consisted of task tracking sheets which were filled out by the employees and reviewed every week. TAPF also maintained an operations dashboard which gave a comprehensive view of the activities. This was used for planning and monitoring. (Refer to Table A8.18
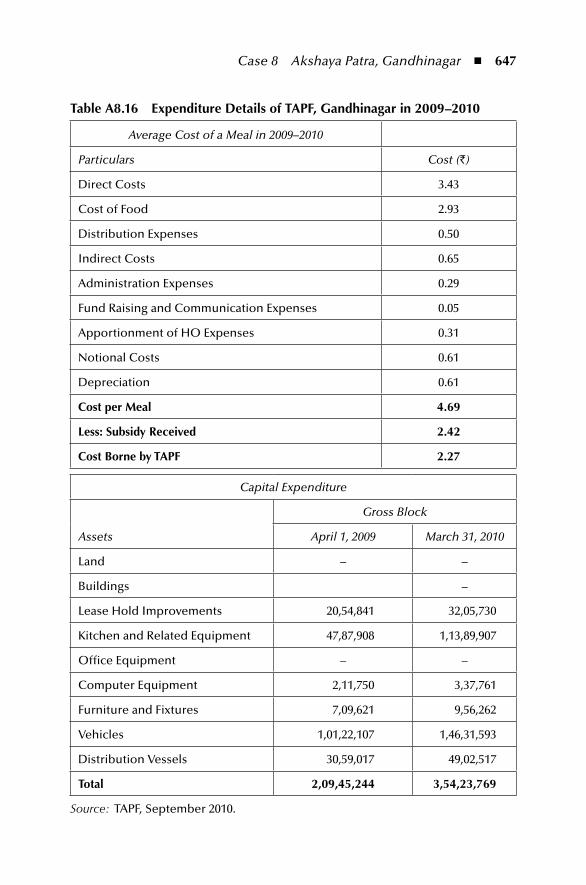
Case 8 Akshaya Patra, Gandhinagar ◾ 647
table A8.16 expenditure Details of tApF, Gandhinagar in 2009–2010
Average Cost of a Meal in 2009–2010
Particulars Cost (`)
Direct Costs 3.43
Cost of Food 2.93
Distribution Expenses 0.50
Indirect Costs 0.65
Administration Expenses 0.29
Fund Raising and Communication Expenses 0.05
Apportionment of HO Expenses 0.31
Notional Costs 0.61
Depreciation 0.61
Cost per meal 4.69
Less: Subsidy received 2.42
Cost Borne by tApF 2.27
Capital Expenditure
Assets
Gross Block
April 1, 2009 March 31, 2010
Land – –
Buildings –
Lease Hold Improvements 20,54,841 32,05,730
Kitchen and Related Equipment 47,87,908 1,13,89,907
Office Equipment – –
Computer Equipment 2,11,750 3,37,761
Furniture and Fixtures 7,09,621 9,56,262
Vehicles 1,01,22,107 1,46,31,593
Distribution Vessels 30,59,017 49,02,517
total 2,09,45,244 3,54,23,769
Source: TAPF, September 2010.
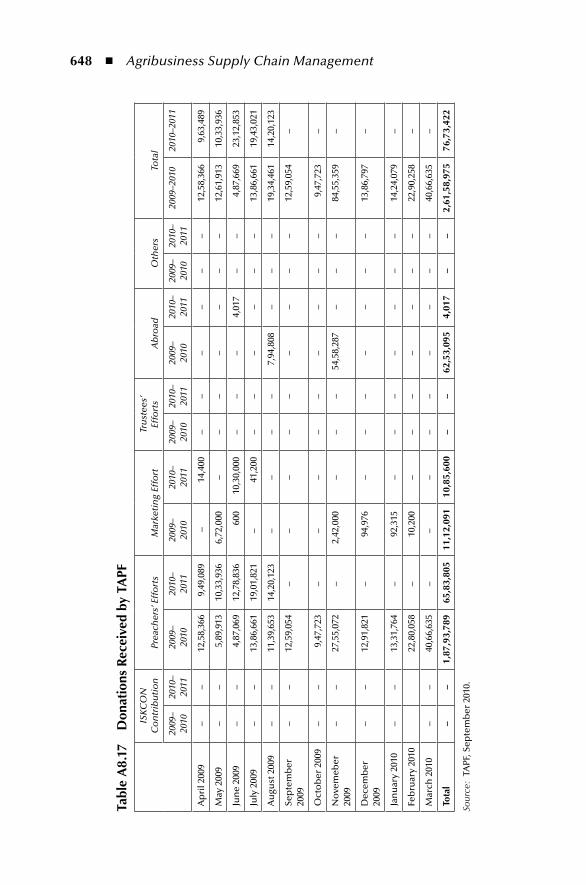
648 ◾ Agribusiness Supply Chain Management
tabl
e A
8.17
D
onat
ions
rec
eive
d by
tA
pF
ISKC
ON
C
on
trib
uti
on
Prea
cher
s’ E
ffo
rts
Mar
keti
ng
Effo
rtTr
ust
ees’
Ef
fort
sA
bro
adO
ther
sTo
tal
2009
–20
1020
10–
2011
2009
–20
1020
10–
2011
2009
–20
1020
10–
2011
2009
–20
1020
10–
2011
2009
–20
1020
10–
2011
2009
–20
1020
10–
2011
2009
–201
020
10–2
011
Ap
ril 2
009
––
12,5
8,36
69,
49,0
89–
14,4
00–
––
––
–12
,58,
366
9,63
,489
May
200
9–
–5,
89,9
1310
,33,
936
6,72
,000
––
––
––
–12
,61,
913
10,3
3,93
6
Jun
e 20
09–
–4,
87,0
6912
,78,
836
600
10,3
0,00
0–
––
4,01
7–
–4,
87,6
6923
,12,
853
July
200
9–
–13
,86,
661
19,0
1,82
1–
41,2
00–
––
––
–13
,86,
661
19,4
3,02
1
Au
gust
200
9–
–11
,39,
653
14,2
0,12
3–
––
–7,
94,8
08–
––
19,3
4,46
114
,20,
123
Sep
tem
ber
20
09–
–12
,59,
054
––
––
––
––
–12
,59,
054
–
Oct
ob
er 2
009
––
9,47
,723
––
––
––
––
–9,
47,7
23–
No
vem
eber
20
09–
–27
,55,
072
–2,
42,0
00–
––
54,5
8,28
7–
––
84,5
5,35
9–
Dec
emb
er
2009
––
12,9
1,82
1–
94,9
76–
––
––
––
13,8
6,79
7–
Jan
uar
y 20
10–
–13
,31,
764
–92
,315
––
––
––
–14
,24,
079
–
Feb
ruar
y 20
1022
,80,
058
–10
,200
––
––
––
–22
,90,
258
–
Mar
ch 2
010
––
40,6
6,63
5–
––
––
––
––
40,6
6,63
5–
tota
l–
–1,
87,9
3,78
965
,83,
805
11,1
2,09
110
,85,
600
––
62,5
3,09
54,
017
––
2,61
,58,
975
76,7
3,42
2
Sour
ce:
TAPF
, Sep
tem
ber
201
0.
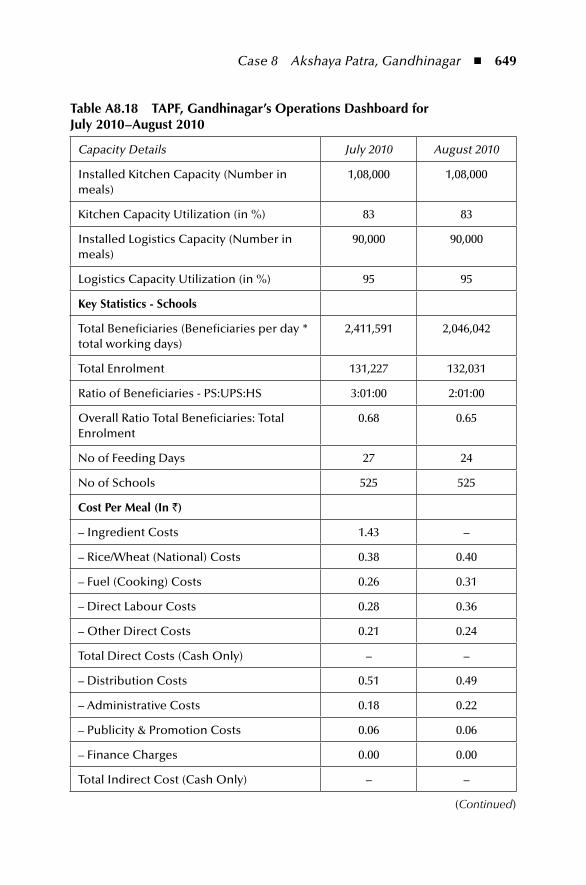
Case 8 Akshaya Patra, Gandhinagar ◾ 649
table A8.18 tApF, Gandhinagar’s operations Dashboard for July 2010–August 2010
Capacity Details July 2010 August 2010
Installed Kitchen Capacity (Number in meals)
1,08,000 1,08,000
Kitchen Capacity Utilization (in %) 83 83
Installed Logistics Capacity (Number in meals)
90,000 90,000
Logistics Capacity Utilization (in %) 95 95
Key Statistics - Schools
Total Beneficiaries (Beneficiaries per day * total working days)
2,411,591 2,046,042
Total Enrolment 131,227 132,031
Ratio of Beneficiaries - PS:UPS:HS 3:01:00 2:01:00
Overall Ratio Total Beneficiaries: Total Enrolment
0.68 0.65
No of Feeding Days 27 24
No of Schools 525 525
Cost per meal (in `)
– Ingredient Costs 1.43 –
– Rice/Wheat (National) Costs 0.38 0.40
– Fuel (Cooking) Costs 0.26 0.31
– Direct Labour Costs 0.28 0.36
– Other Direct Costs 0.21 0.24
Total Direct Costs (Cash Only) – –
– Distribution Costs 0.51 0.49
– Administrative Costs 0.18 0.22
– Publicity & Promotion Costs 0.06 0.06
– Finance Charges 0.00 0.00
Total Indirect Cost (Cash Only) – –
(Continued)
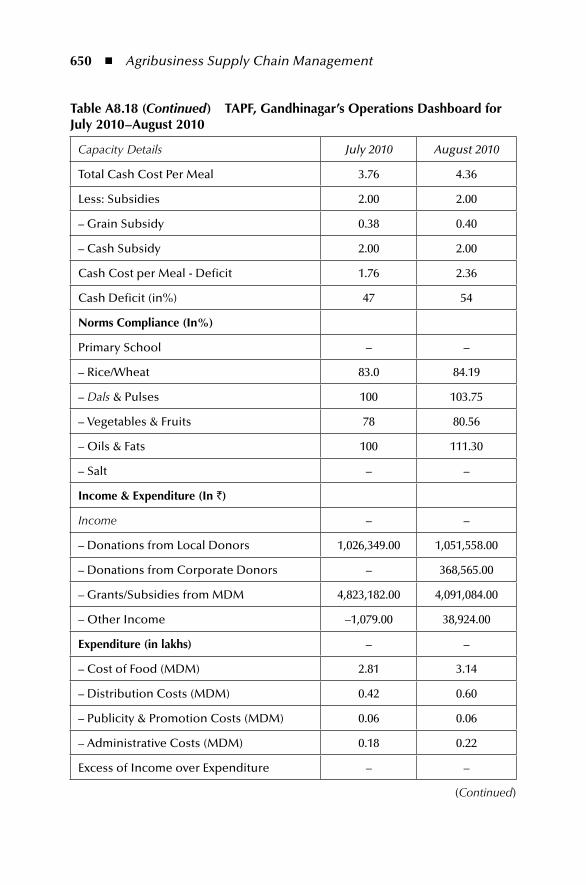
650 ◾ Agribusiness Supply Chain Management
table A8.18 (Continued) tApF, Gandhinagar’s operations Dashboard for July 2010–August 2010
Capacity Details July 2010 August 2010
Total Cash Cost Per Meal 3.76 4.36
Less: Subsidies 2.00 2.00
– Grain Subsidy 0.38 0.40
– Cash Subsidy 2.00 2.00
Cash Cost per Meal - Deficit 1.76 2.36
Cash Deficit (in%) 47 54
norms Compliance (in%)
Primary School – –
– Rice/Wheat 83.0 84.19
– Dals & Pulses 100 103.75
– Vegetables & Fruits 78 80.56
– Oils & Fats 100 111.30
– Salt – –
income & expenditure (in `)
Income – –
– Donations from Local Donors 1,026,349.00 1,051,558.00
– Donations from Corporate Donors – 368,565.00
– Grants/Subsidies from MDM 4,823,182.00 4,091,084.00
– Other Income –1,079.00 38,924.00
expenditure (in lakhs) – –
– Cost of Food (MDM) 2.81 3.14
– Distribution Costs (MDM) 0.42 0.60
– Publicity & Promotion Costs (MDM) 0.06 0.06
– Administrative Costs (MDM) 0.18 0.22
Excess of Income over Expenditure – –
(Continued)
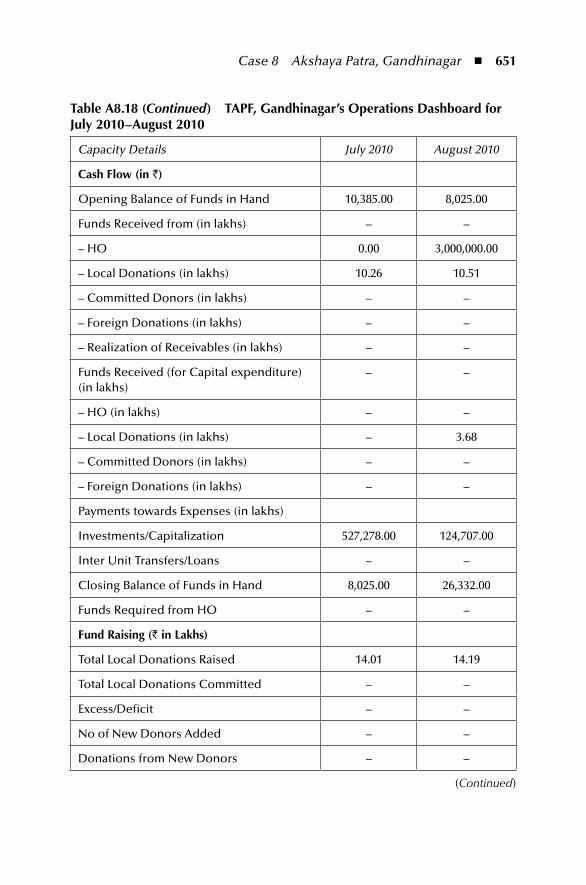
Case 8 Akshaya Patra, Gandhinagar ◾ 651
table A8.18 (Continued) tApF, Gandhinagar’s operations Dashboard for July 2010–August 2010
Capacity Details July 2010 August 2010
Cash Flow (in `)
Opening Balance of Funds in Hand 10,385.00 8,025.00
Funds Received from (in lakhs) – –
– HO 0.00 3,000,000.00
– Local Donations (in lakhs) 10.26 10.51
– Committed Donors (in lakhs) – –
– Foreign Donations (in lakhs) – –
– Realization of Receivables (in lakhs) – –
Funds Received (for Capital expenditure) (in lakhs)
– –
– HO (in lakhs) – –
– Local Donations (in lakhs) – 3.68
– Committed Donors (in lakhs) – –
– Foreign Donations (in lakhs) – –
Payments towards Expenses (in lakhs)
Investments/Capitalization 527,278.00 124,707.00
Inter Unit Transfers/Loans – –
Closing Balance of Funds in Hand 8,025.00 26,332.00
Funds Required from HO – –
Fund raising (` in Lakhs)
Total Local Donations Raised 14.01 14.19
Total Local Donations Committed – –
Excess/Deficit – –
No of New Donors Added – –
Donations from New Donors – –
(Continued)
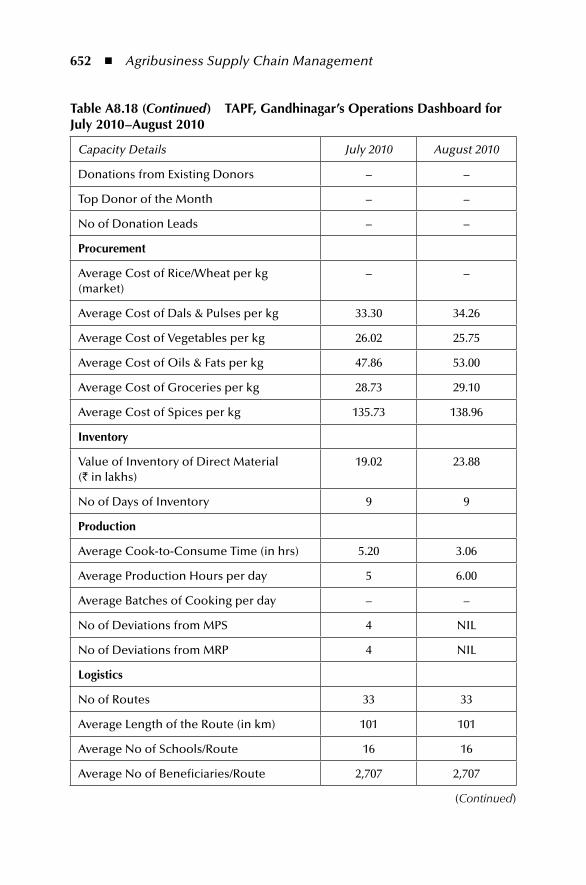
652 ◾ Agribusiness Supply Chain Management
table A8.18 (Continued) tApF, Gandhinagar’s operations Dashboard for July 2010–August 2010
Capacity Details July 2010 August 2010
Donations from Existing Donors – –
Top Donor of the Month – –
No of Donation Leads – –
procurement
Average Cost of Rice/Wheat per kg (market)
– –
Average Cost of Dals & Pulses per kg 33.30 34.26
Average Cost of Vegetables per kg 26.02 25.75
Average Cost of Oils & Fats per kg 47.86 53.00
Average Cost of Groceries per kg 28.73 29.10
Average Cost of Spices per kg 135.73 138.96
inventory
Value of Inventory of Direct Material (` in lakhs)
19.02 23.88
No of Days of Inventory 9 9
production
Average Cook-to-Consume Time (in hrs) 5.20 3.06
Average Production Hours per day 5 6.00
Average Batches of Cooking per day – –
No of Deviations from MPS 4 NIL
No of Deviations from MRP 4 NIL
Logistics
No of Routes 33 33
Average Length of the Route (in km) 101 101
Average No of Schools/Route 16 16
Average No of Beneficiaries/Route 2,707 2,707
(Continued)
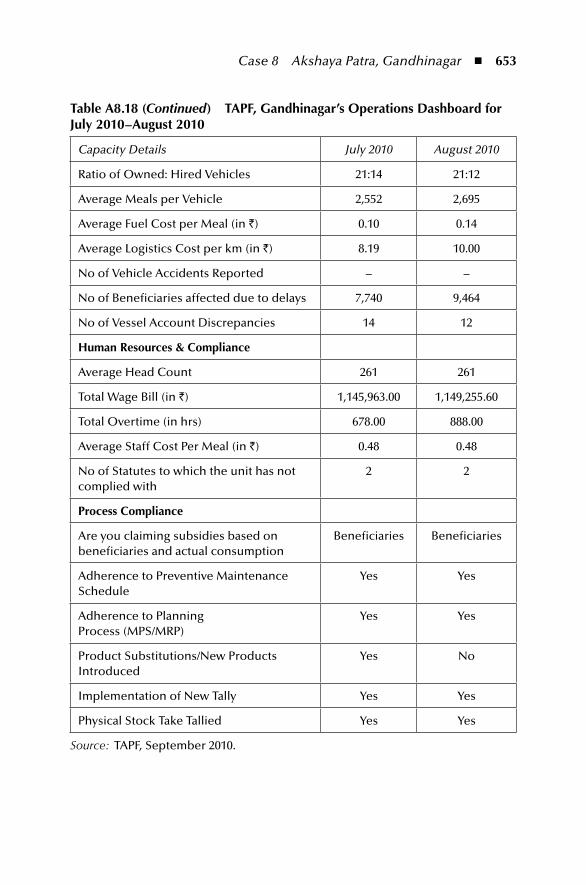
Case 8 Akshaya Patra, Gandhinagar ◾ 653
table A8.18 (Continued) tApF, Gandhinagar’s operations Dashboard for July 2010–August 2010
Capacity Details July 2010 August 2010
Ratio of Owned: Hired Vehicles 21:14 21:12
Average Meals per Vehicle 2,552 2,695
Average Fuel Cost per Meal (in `) 0.10 0.14
Average Logistics Cost per km (in `) 8.19 10.00
No of Vehicle Accidents Reported – –
No of Beneficiaries affected due to delays 7,740 9,464
No of Vessel Account Discrepancies 14 12
Human resources & Compliance
Average Head Count 261 261
Total Wage Bill (in `) 1,145,963.00 1,149,255.60
Total Overtime (in hrs) 678.00 888.00
Average Staff Cost Per Meal (in `) 0.48 0.48
No of Statutes to which the unit has not complied with
2 2
process Compliance
Are you claiming subsidies based on beneficiaries and actual consumption
Beneficiaries Beneficiaries
Adherence to Preventive Maintenance Schedule
Yes Yes
Adherence to Planning Process (MPS/MRP)
Yes Yes
Product Substitutions/New Products Introduced
Yes No
Implementation of New Tally Yes Yes
Physical Stock Take Tallied Yes Yes
Source: TAPF, September 2010.
654 ◾ Agribusiness Supply Chain Management
for an abridged version of the operations dashboard.) In order to make the process lean, they implemented Kaizen in the Vadodara kitchen.
TAPF was considered to be a role model due to its innovations in technology and processes, quality of food, variety provided in the meal, large scale production, and timely delivery. However, according to Dasa, there was scope for improvement in the supply chain ranging from procurement to distribution. Some of the specific concerns were:
◾ How much to produce was based on the estimate given by the school authori-ties every day. However, this still led to food wastage.
◾ Supplier selection and price fluctuations were major challenges for purchase decisions.
◾ Storage posed a concern because of space crunch. The raw materials had to be used up within two weeks.
◾ The rotis were prepared in one building while rice and sabji were prepared in another. This resulted in loading of containers at two places.
◾ Rotis cut in squares or triangles would have served to be more efficient than rotis cut in the classic round shape. However, especially in case of square rotis, the question of acceptability of the shape posed a doubt. With a square or triangle shape, the left over in one cycle of the atta sheet would reduce. This would save the recycling costs of the unused portion of the atta sheet.
◾ The width of the atta sheet being inserted into the roti-making machine was always aligned with the width of the rotary cutting die. Strips of the atta sheet were being continuously cut out from the corner to ensure alignment. These were also recycled.
◾ The cut roti in the atta sheet was not always round or had some folds in them. These were manually inspected, removed, and recycled. Due to this, instead of 40,000 rotis per hour, approximately 35,000 rotis were produced per hour.
◾ Undercooked or overcooked rotis were discarded by two workers stationed at the end of the roti machine. Since this was being done manually, some inap-propriately cooked rotis went unnoticed and got packed into the containers.
◾ Breakdown in the equipment being used in the kitchen caused delay in the cooking time, thereby leading to late distribution of food to the schools. (For photos, refer to Figure A8.12.) There was not sufficient standby equipment, and even when there was, they were not always ready for quick and easy start up for use.
◾ The kitchen area where the vegetables were being cooked had an open section to facilitate the movement of the containers to the vehicles which could lead to contamination of the food. Air curtains were considered a possible solu-tion. Also, the vegetables were being stirred in open containers. (For photos, refer to Figure A8.12.)
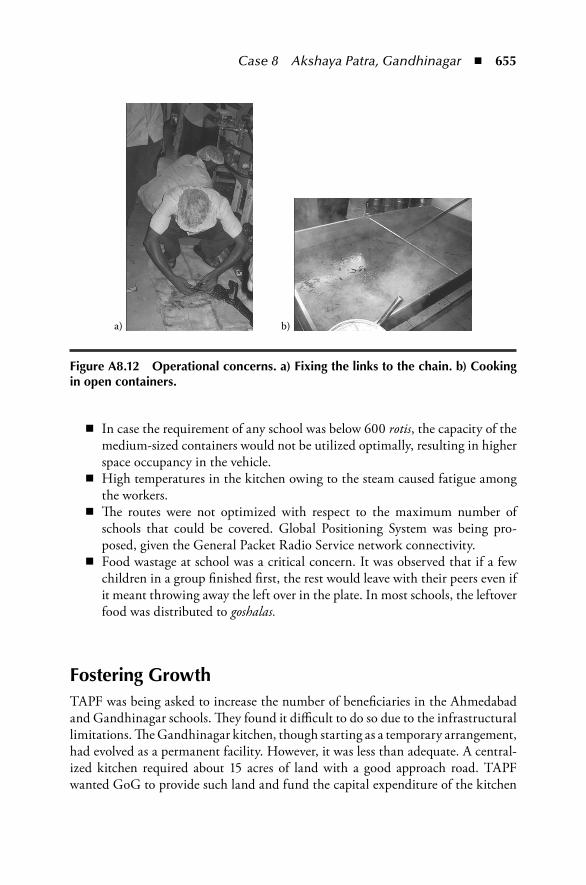
Case 8 Akshaya Patra, Gandhinagar ◾ 655
◾ In case the requirement of any school was below 600 rotis, the capacity of the medium-sized containers would not be utilized optimally, resulting in higher space occupancy in the vehicle.
◾ High temperatures in the kitchen owing to the steam caused fatigue among the workers.
◾ The routes were not optimized with respect to the maximum number of schools that could be covered. Global Positioning System was being pro-posed, given the General Packet Radio Service network connectivity.
◾ Food wastage at school was a critical concern. It was observed that if a few children in a group finished first, the rest would leave with their peers even if it meant throwing away the left over in the plate. In most schools, the leftover food was distributed to goshalas.
Fostering GrowthTAPF was being asked to increase the number of beneficiaries in the Ahmedabad and Gandhinagar schools. They found it difficult to do so due to the infrastructural limitations. The Gandhinagar kitchen, though starting as a temporary arrangement, had evolved as a permanent facility. However, it was less than adequate. A central-ized kitchen required about 15 acres of land with a good approach road. TAPF wanted GoG to provide such land and fund the capital expenditure of the kitchen
a) b)
Figure A8.12 operational concerns. a) Fixing the links to the chain. b) Cooking in open containers.
656 ◾ Agribusiness Supply Chain Management
(possibly in collaboration with any corporate). TAPF were also looking for exemp-tions in sales tax/value-added tax on the procured items and motor vehicle tax on the vehicles. TAPF was included as a destination in the government conducted educational tours of Gujarat.
GoG felt that the need of the hour was to make people aware of the feeding programs and to reach out to a larger section of the needy population. Therefore, TAPF was getting ready to serve food to the patients in the Civil Hospitals by October 2010. Lunch was to be priced at `25 and dinner at `20. The menu would be designed in consultation with the doctors and the dieticians.
Discerning the exigency that needed to be addressed, Dasa reflected on how to expand the noble cause of the program. Enthusiastic about the possibilities, he hoped to erase the meaning of classroom hunger in the cities of Gujarat, aligned with the TAPF’s vision ‘No child in India shall be deprived of education because of hunger’.
GlossaryAtta – Whole wheat flourDal – Stew prepared from lentils, peas or beansGoshalas – Protective shelters for cows in IndiaKaizen – Refers to the practices of continuous improvement of processesKhichdi – Mixture of rice and lentilsMandi – Vegetable marketMoong mogar – A lentil prepared using green beansMutter dal – A stew prepared from peasPrasadam – A religious offering, usually an eatable, that is first offered to the deity and then offered to the devoteesRoti – Unleavened flatbread made from whole wheat flourSabji – Cooked vegetablesSukhadi – A popular sweet made from fortified attaTaluka – Administrative and geographical block consisting of some villagesTava – A name for the roti making equipmentThepla – A roti, where the dough is mixed with greens
AbbreviationsESIC – Employees State Insurance CorporationGoG – Government of GujaratGoI – Government of IndiaGPRS – General Packet Radio ServiceGPS – Global Positioning System
Case 8 Akshaya Patra, Gandhinagar ◾ 657
GSCSC – Gujarat State Civil Supplies CorporationHS – Higher SecondaryINR – Indian RupeesISKCON – International Society for Krishna ConsciousnessISO – International Organisation for StandardizationFEFO – First Expiry First OutFIFO – First In First OutLIFO – Last In First OutMDM – Mid-Day MealMoU – Memorandum of UnderstandingNGO – Non-Governmental OrganisationNP-NSPE – National Programme-Nutritional Support to Primary EducationPS – Primary SchoolStd – StandardTAPF – The Akshaya Patra FoundationUPS – Upper Primary School
AcknowledgementsPrepared by Shravanti Mitra, Professors G. Raghuram, and Atanu Ghosh, Indian Institute of Management, Ahmedabad. Research assistance provided by Shivani Shukla is acknowledged.
The authors acknowledge the access, time, and help provided by TAPF and particularly thank Chanchalapathi Dasa, Shridhar Venkat, Jaganmohan Krishna Dasa, Adi Keshava Dasa, Sushant Shetty, Chirag Seth, Rohit Agrawal, Nilesh Mehta, Vinay Kumar, and Ashwin Trivedi.
Cases of the Indian Institute of Management, Ahmedabad, are prepared as a basis for class discussion. They are not designed to present illustrations of either correct or incorrect handling of administrative problems.
This case has been reproduced with permission from Indian Institute of Management, Ahmedabad. Copyright © 2011.

This page intentionally left blankThis page intentionally left blank