Embed Size (px)
Citation preview
NeuroImage 80 (2013) 190–201
Contents lists available at SciVerse ScienceDirect
NeuroImage
j ourna l homepage: www.e lsev ie r .com/ locate /yn img
Adding dynamics to the Human Connectome Project with MEG
L.J. Larson-Prior a,b,⁎, R. Oostenveld c, S. Della Penna d, G. Michalareas e, F. Prior a, A. Babajani-Feremi f,J.-M. Schoffelen c,i, L. Marzetti d, F. de Pasquale d, F. Di Pompeo d, J. Stout h, M. Woolrich g, Q. Luo h,R. Bucholz h, P. Fries e, V. Pizzella d, G.L. Romani d, M. Corbetta a,b,A.Z. Snyder a,b for the WU-Minn HCP Consortiuma Department of Radiology, Washington University, St. Louis, MO, USAb Department of Neurology, Washington University, St. Louis, MO, USAc Radboud University Nijmegen, Donders Institute for Brain, Cognition and Behaviour, Nijmegen, The Netherlandsd Department of Neuroscience and Imaging and Institute for Advanced Biomedical Technologies, University G. D'Annunzio, Chieti, Italye Ernst Strüngmann Institute (ESI) in cooperation with Max Planck Society, Frankfurt, Germanyf Department of Anatomy and Neurobiology, Washington University, St. Louis, MO, USAg Oxford Centre for Human Brain Activity (OHBA), Oxford University, Oxford, UKh Department of Neurosurgery, St. Louis University, St. Louis, MO, USAi Max Planck Institute for Psycholinguistics, Nijmegen, The Netherlands
⁎ Corresponding author at: Departments of RadiologyUniversity School of Medicine, 660 S. Euclid Ave., St. Lo
E-mail address: [email protected] (L.J. Larson-P
1053-8119/$ – see front matter © 2013 Elsevier Inc. Allhttp://dx.doi.org/10.1016/j.neuroimage.2013.05.056
a b s t r a c t
a r t i c l e i n f oArticle history:Accepted 8 May 2013Available online 20 May 2013
Keywords:Magnetoencephalography (MEG)ConnectomeProcessing pipelineFunctional connectivity
The Human Connectome Project (HCP) seeks to map the structural and functional connections between net-work elements in the human brain. Magnetoencephalography (MEG) provides a temporally rich source of in-formation on brain network dynamics and represents one source of functional connectivity data to beprovided by the HCP. High quality MEG data will be collected from 50 twin pairs both in the resting stateand during performance of motor, working memory and language tasks. These data will be available to thegeneral community. Additionally, using the cortical parcellation scheme common to all imaging modalities,the HCP will provide processing pipelines for calculating connection matrices as a function of time and fre-quency. Together with structural and functional data generated using magnetic resonance imaging methods,these data represent a unique opportunity to investigate brain network connectivity in a large cohort of nor-mal adult human subjects. The analysis pipeline software and the dynamic connectivity matrices that it gen-erates will all be made freely available to the research community.
© 2013 Elsevier Inc. All rights reserved.
Introduction
The connectome was conceived as a comprehensive structural de-scription of the network elements and connections comprising thehuman brain (Sporns et al., 2005). This connectome theoreticallyconstitutes the structural support for brain function. While such aconnectome could be conceived at multiple scales, the HumanConnectome Project (HCP) has chosen to work at the macroscalelevel, in which distinct brain regions comprising large neuronal popula-tions are defined as network nodes (whether based on individual voxelsor on voxel clusters derived from functional imaging studies) betweenwhich both structural and functional connections are defined (VanEssen et al., 2013, 2012).
and Neurology, Washingtonuis, MO, USA.rior).
rights reserved.
For macroscopic connectome representation, the primary source ofstructural connection data lies in diffusion weighted magnetic reso-nance imaging (dMRI) methods (Sporns, 2011) which return a staticmap of resolvable anatomical connections between brain regions.While brain activity is underpinned by anatomical connectivity, it can-not be understood in those terms alone. Thus, for example, functionalconnectivity may be seen in the absence of direct anatomical connec-tions (Deco et al., 2011; Honey et al., 2009; Vincent et al., 2007). Thevalue of correlating structural and functional connectivity has been rec-ognized formany years (Rubinov et al., 2009; Sporns et al., 2005). Func-tional information is provided to theHCP from two sources,whichdifferin their spatial and temporal resolution as well as on the basis of theirsignal generation (see Table 1). While fMRI provides a vascular surro-gate for neural activity that broadly correlates with anatomical connec-tivity (Honey et al., 2010; Rubinov et al., 2009; Skudlarski et al., 2008),MEG represents population neuronal activity, which is likely to have aless straightforward correspondence to dMRI-derived anatomical map-pings due to the rapid transit of information through indirect pathways(Rubinov et al., 2009). Inclusion of MEG data provides a measure of
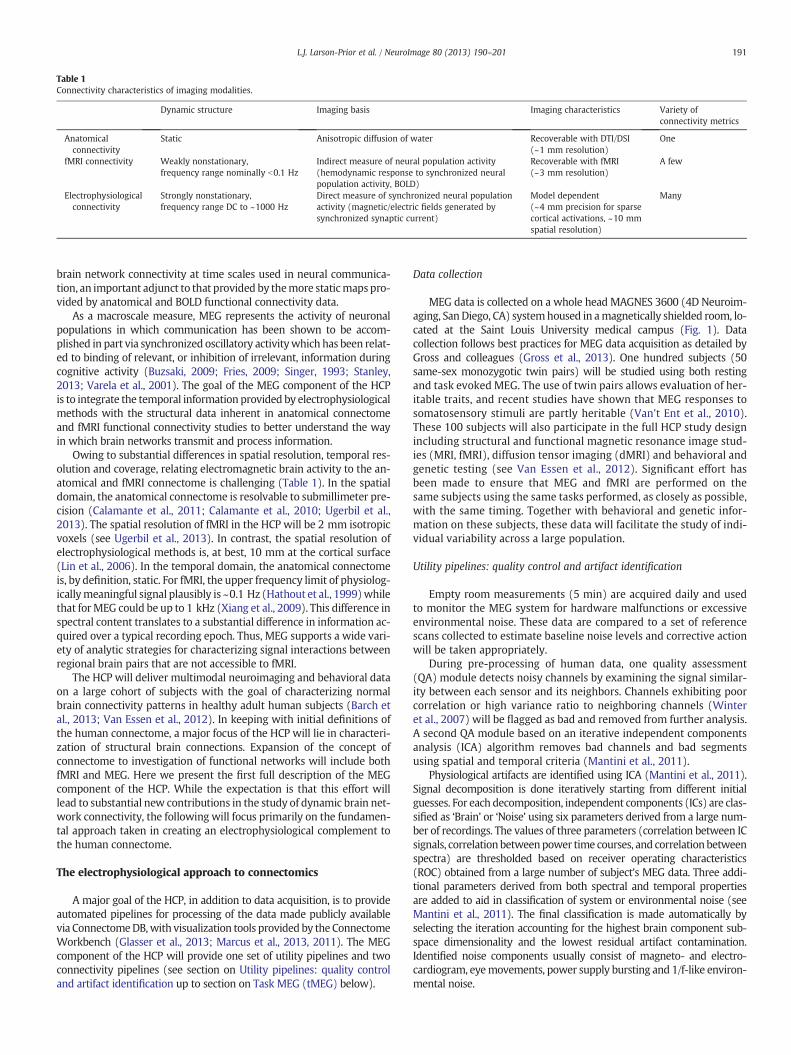
Table 1Connectivity characteristics of imaging modalities.
Dynamic structure Imaging basis Imaging characteristics Variety ofconnectivity metrics
Anatomicalconnectivity
Static Anisotropic diffusion of water Recoverable with DTI/DSI(~1 mm resolution)
One
fMRI connectivity Weakly nonstationary,frequency range nominally b0.1 Hz
Indirect measure of neural population activity(hemodynamic response to synchronized neuralpopulation activity, BOLD)
Recoverable with fMRI(~3 mm resolution)
A few
Electrophysiologicalconnectivity
Strongly nonstationary,frequency range DC to ~1000 Hz
Direct measure of synchronized neural populationactivity (magnetic/electric fields generated bysynchronized synaptic current)
Model dependent(~4 mm precision for sparsecortical activations, ~10 mmspatial resolution)
Many
191L.J. Larson-Prior et al. / NeuroImage 80 (2013) 190–201
brain network connectivity at time scales used in neural communica-tion, an important adjunct to that provided by themore staticmapspro-vided by anatomical and BOLD functional connectivity data.
As a macroscale measure, MEG represents the activity of neuronalpopulations in which communication has been shown to be accom-plished in part via synchronized oscillatory activitywhich has been relat-ed to binding of relevant, or inhibition of irrelevant, information duringcognitive activity (Buzsaki, 2009; Fries, 2009; Singer, 1993; Stanley,2013; Varela et al., 2001). The goal of the MEG component of the HCPis to integrate the temporal information provided by electrophysiologicalmethods with the structural data inherent in anatomical connectomeand fMRI functional connectivity studies to better understand the wayin which brain networks transmit and process information.
Owing to substantial differences in spatial resolution, temporal res-olution and coverage, relating electromagnetic brain activity to the an-atomical and fMRI connectome is challenging (Table 1). In the spatialdomain, the anatomical connectome is resolvable to submillimeter pre-cision (Calamante et al., 2011; Calamante et al., 2010; Ugerbil et al.,2013). The spatial resolution of fMRI in the HCP will be 2 mm isotropicvoxels (see Ugerbil et al., 2013). In contrast, the spatial resolution ofelectrophysiological methods is, at best, 10 mm at the cortical surface(Lin et al., 2006). In the temporal domain, the anatomical connectomeis, by definition, static. For fMRI, the upper frequency limit of physiolog-icallymeaningful signal plausibly is ~0.1 Hz (Hathout et al., 1999)whilethat forMEG could be up to 1 kHz (Xiang et al., 2009). This difference inspectral content translates to a substantial difference in information ac-quired over a typical recording epoch. Thus, MEG supports a wide vari-ety of analytic strategies for characterizing signal interactions betweenregional brain pairs that are not accessible to fMRI.
The HCP will deliver multimodal neuroimaging and behavioral dataon a large cohort of subjects with the goal of characterizing normalbrain connectivity patterns in healthy adult human subjects (Barch etal., 2013; Van Essen et al., 2012). In keeping with initial definitions ofthe human connectome, a major focus of the HCP will lie in characteri-zation of structural brain connections. Expansion of the concept ofconnectome to investigation of functional networks will include bothfMRI and MEG. Here we present the first full description of the MEGcomponent of the HCP. While the expectation is that this effort willlead to substantial new contributions in the study of dynamic brain net-work connectivity, the following will focus primarily on the fundamen-tal approach taken in creating an electrophysiological complement tothe human connectome.
The electrophysiological approach to connectomics
A major goal of the HCP, in addition to data acquisition, is to provideautomated pipelines for processing of the data made publicly availablevia ConnectomeDB,with visualization tools provided by the ConnectomeWorkbench (Glasser et al., 2013; Marcus et al., 2013, 2011). The MEGcomponent of the HCP will provide one set of utility pipelines and twoconnectivity pipelines (see section on Utility pipelines: quality controland artifact identification up to section on Task MEG (tMEG) below).
Data collection
MEG data is collected on a whole head MAGNES 3600 (4D Neuroim-aging, SanDiego, CA) systemhoused in amagnetically shielded room, lo-cated at the Saint Louis University medical campus (Fig. 1). Datacollection follows best practices for MEG data acquisition as detailed byGross and colleagues (Gross et al., 2013). One hundred subjects (50same-sex monozygotic twin pairs) will be studied using both restingand task evoked MEG. The use of twin pairs allows evaluation of her-itable traits, and recent studies have shown that MEG responses tosomatosensory stimuli are partly heritable (Van't Ent et al., 2010).These 100 subjects will also participate in the full HCP study designincluding structural and functional magnetic resonance image stud-ies (MRI, fMRI), diffusion tensor imaging (dMRI) and behavioral andgenetic testing (see Van Essen et al., 2012). Significant effort hasbeen made to ensure that MEG and fMRI are performed on thesame subjects using the same tasks performed, as closely as possible,with the same timing. Together with behavioral and genetic infor-mation on these subjects, these data will facilitate the study of indi-vidual variability across a large population.
Utility pipelines: quality control and artifact identification
Empty room measurements (5 min) are acquired daily and usedto monitor the MEG system for hardware malfunctions or excessiveenvironmental noise. These data are compared to a set of referencescans collected to estimate baseline noise levels and corrective actionwill be taken appropriately.
During pre-processing of human data, one quality assessment(QA) module detects noisy channels by examining the signal similar-ity between each sensor and its neighbors. Channels exhibiting poorcorrelation or high variance ratio to neighboring channels (Winteret al., 2007) will be flagged as bad and removed from further analysis.A second QA module based on an iterative independent componentsanalysis (ICA) algorithm removes bad channels and bad segmentsusing spatial and temporal criteria (Mantini et al., 2011).
Physiological artifacts are identified using ICA (Mantini et al., 2011).Signal decomposition is done iteratively starting from different initialguesses. For each decomposition, independent components (ICs) are clas-sified as ‘Brain’ or ‘Noise’ using six parameters derived from a large num-ber of recordings. The values of three parameters (correlation between ICsignals, correlationbetweenpower time courses, and correlationbetweenspectra) are thresholded based on receiver operating characteristics(ROC) obtained from a large number of subject's MEG data. Three addi-tional parameters derived from both spectral and temporal propertiesare added to aid in classification of system or environmental noise (seeMantini et al., 2011). The final classification is made automatically byselecting the iteration accounting for the highest brain component sub-space dimensionality and the lowest residual artifact contamination.Identified noise components usually consist of magneto- and electro-cardiogram, eyemovements, power supply bursting and 1/f-like environ-mental noise.
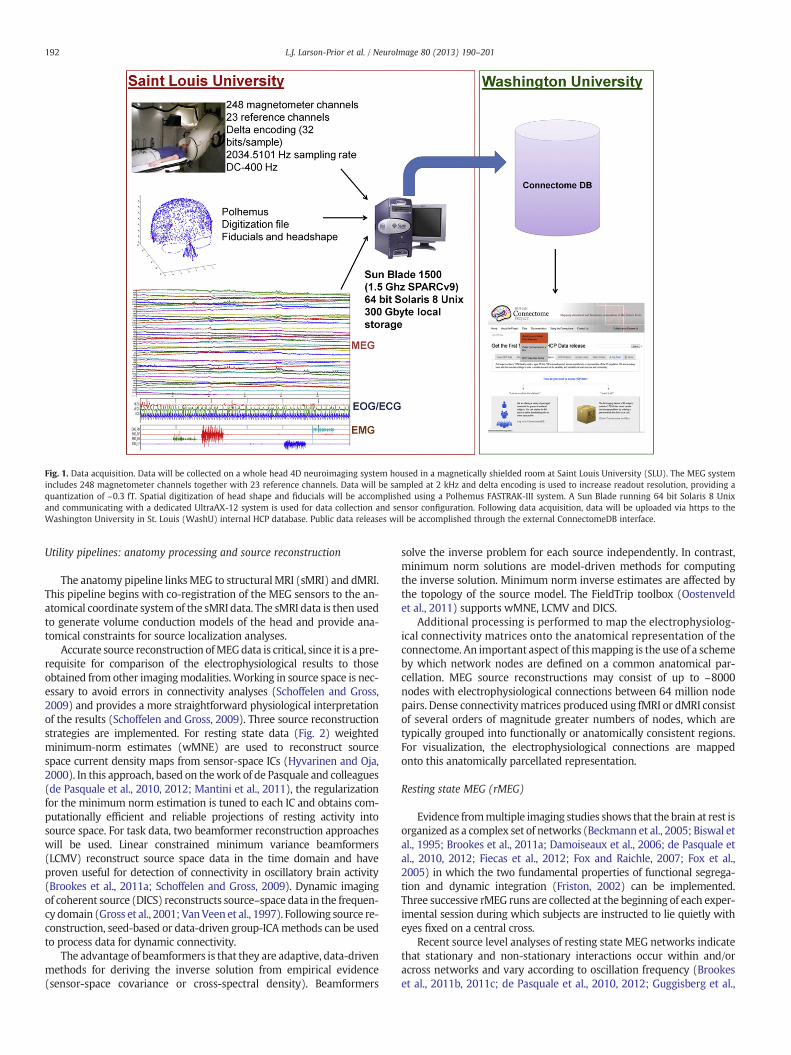
Fig. 1. Data acquisition. Data will be collected on a whole head 4D neuroimaging system housed in a magnetically shielded room at Saint Louis University (SLU). The MEG systemincludes 248 magnetometer channels together with 23 reference channels. Data will be sampled at 2 kHz and delta encoding is used to increase readout resolution, providing aquantization of ~0.3 fT. Spatial digitization of head shape and fiducials will be accomplished using a Polhemus FASTRAK-III system. A Sun Blade running 64 bit Solaris 8 Unixand communicating with a dedicated UltraAX-12 system is used for data collection and sensor configuration. Following data acquisition, data will be uploaded via https to theWashington University in St. Louis (WashU) internal HCP database. Public data releases will be accomplished through the external ConnectomeDB interface.
192 L.J. Larson-Prior et al. / NeuroImage 80 (2013) 190–201
Utility pipelines: anatomy processing and source reconstruction
The anatomy pipeline linksMEG to structuralMRI (sMRI) and dMRI.This pipeline begins with co-registration of the MEG sensors to the an-atomical coordinate systemof the sMRI data. The sMRI data is then usedto generate volume conduction models of the head and provide ana-tomical constraints for source localization analyses.
Accurate source reconstruction ofMEGdata is critical, since it is a pre-requisite for comparison of the electrophysiological results to thoseobtained from other imagingmodalities.Working in source space is nec-essary to avoid errors in connectivity analyses (Schoffelen and Gross,2009) and provides a more straightforward physiological interpretationof the results (Schoffelen and Gross, 2009). Three source reconstructionstrategies are implemented. For resting state data (Fig. 2) weightedminimum-norm estimates (wMNE) are used to reconstruct sourcespace current density maps from sensor-space ICs (Hyvarinen and Oja,2000). In this approach, based on thework of de Pasquale and colleagues(de Pasquale et al., 2010, 2012; Mantini et al., 2011), the regularizationfor the minimum norm estimation is tuned to each IC and obtains com-putationally efficient and reliable projections of resting activity intosource space. For task data, two beamformer reconstruction approacheswill be used. Linear constrained minimum variance beamformers(LCMV) reconstruct source space data in the time domain and haveproven useful for detection of connectivity in oscillatory brain activity(Brookes et al., 2011a; Schoffelen and Gross, 2009). Dynamic imagingof coherent source (DICS) reconstructs source–space data in the frequen-cy domain (Gross et al., 2001; VanVeen et al., 1997). Following source re-construction, seed-based or data-driven group-ICAmethods can be usedto process data for dynamic connectivity.
The advantage of beamformers is that they are adaptive, data-drivenmethods for deriving the inverse solution from empirical evidence(sensor-space covariance or cross-spectral density). Beamformers
solve the inverse problem for each source independently. In contrast,minimum norm solutions are model-driven methods for computingthe inverse solution. Minimum norm inverse estimates are affected bythe topology of the source model. The FieldTrip toolbox (Oostenveldet al., 2011) supports wMNE, LCMV and DICS.
Additional processing is performed to map the electrophysiolog-ical connectivity matrices onto the anatomical representation of theconnectome. An important aspect of thismapping is the use of a schemeby which network nodes are defined on a common anatomical par-cellation. MEG source reconstructions may consist of up to ~8000nodes with electrophysiological connections between 64 million nodepairs. Dense connectivitymatrices produced using fMRI or dMRI consistof several orders of magnitude greater numbers of nodes, which aretypically grouped into functionally or anatomically consistent regions.For visualization, the electrophysiological connections are mappedonto this anatomically parcellated representation.
Resting state MEG (rMEG)
Evidence frommultiple imaging studies shows that the brain at rest isorganized as a complex set of networks (Beckmann et al., 2005; Biswal etal., 1995; Brookes et al., 2011a; Damoiseaux et al., 2006; de Pasquale etal., 2010, 2012; Fiecas et al., 2012; Fox and Raichle, 2007; Fox et al.,2005) in which the two fundamental properties of functional segrega-tion and dynamic integration (Friston, 2002) can be implemented.Three successive rMEG runs are collected at the beginning of each exper-imental session during which subjects are instructed to lie quietly witheyes fixed on a central cross.
Recent source level analyses of resting state MEG networks indicatethat stationary and non-stationary interactions occur within and/oracross networks and vary according to oscillation frequency (Brookeset al., 2011b, 2011c; de Pasquale et al., 2010, 2012; Guggisberg et al.,
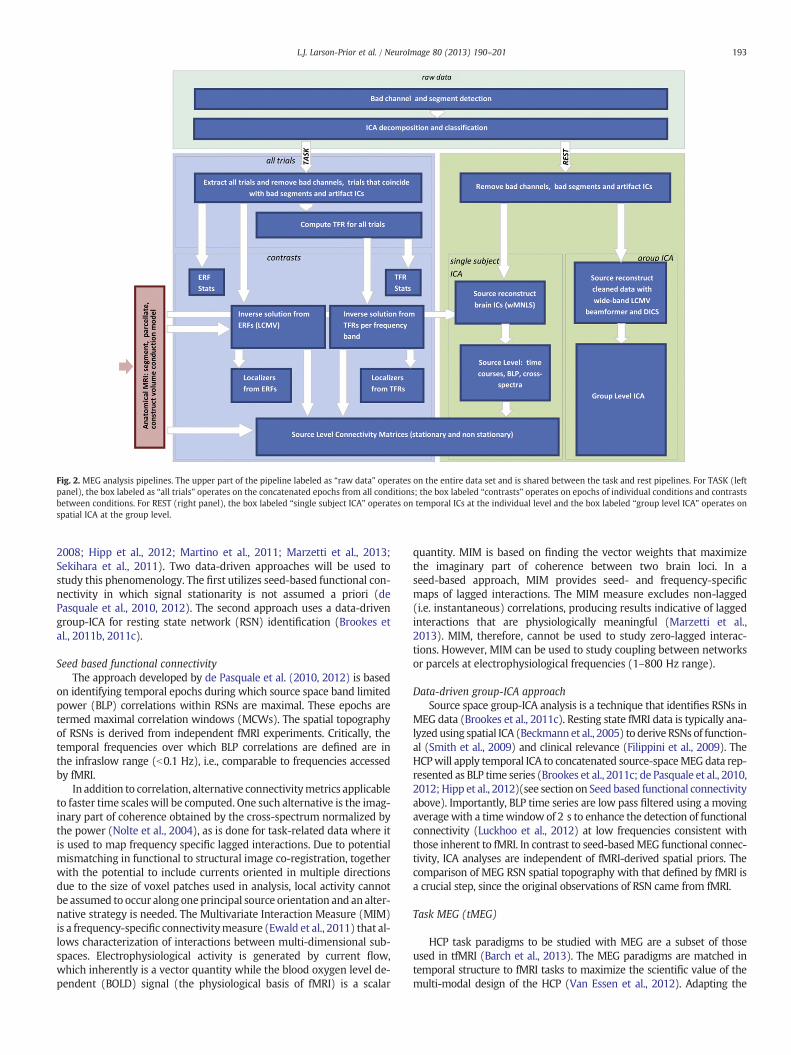
Fig. 2. MEG analysis pipelines. The upper part of the pipeline labeled as “raw data” operates on the entire data set and is shared between the task and rest pipelines. For TASK (leftpanel), the box labeled as “all trials” operates on the concatenated epochs from all conditions; the box labeled “contrasts” operates on epochs of individual conditions and contrastsbetween conditions. For REST (right panel), the box labeled “single subject ICA” operates on temporal ICs at the individual level and the box labeled “group level ICA” operates onspatial ICA at the group level.
193L.J. Larson-Prior et al. / NeuroImage 80 (2013) 190–201
2008; Hipp et al., 2012; Martino et al., 2011; Marzetti et al., 2013;Sekihara et al., 2011). Two data-driven approaches will be used tostudy this phenomenology. The first utilizes seed-based functional con-nectivity in which signal stationarity is not assumed a priori (dePasquale et al., 2010, 2012). The second approach uses a data-drivengroup-ICA for resting state network (RSN) identification (Brookes etal., 2011b, 2011c).
Seed based functional connectivityThe approach developed by de Pasquale et al. (2010, 2012) is based
on identifying temporal epochs during which source space band limitedpower (BLP) correlations within RSNs are maximal. These epochs aretermed maximal correlation windows (MCWs). The spatial topographyof RSNs is derived from independent fMRI experiments. Critically, thetemporal frequencies over which BLP correlations are defined are inthe infraslow range (b0.1 Hz), i.e., comparable to frequencies accessedby fMRI.
In addition to correlation, alternative connectivitymetrics applicableto faster time scales will be computed. One such alternative is the imag-inary part of coherence obtained by the cross-spectrum normalized bythe power (Nolte et al., 2004), as is done for task-related data where itis used to map frequency specific lagged interactions. Due to potentialmismatching in functional to structural image co-registration, togetherwith the potential to include currents oriented in multiple directionsdue to the size of voxel patches used in analysis, local activity cannotbe assumed to occur along oneprincipal source orientation and an alter-native strategy is needed. The Multivariate Interaction Measure (MIM)is a frequency-specific connectivitymeasure (Ewald et al., 2011) that al-lows characterization of interactions between multi-dimensional sub-spaces. Electrophysiological activity is generated by current flow,which inherently is a vector quantity while the blood oxygen level de-pendent (BOLD) signal (the physiological basis of fMRI) is a scalar
quantity. MIM is based on finding the vector weights that maximizethe imaginary part of coherence between two brain loci. In aseed-based approach, MIM provides seed- and frequency-specificmaps of lagged interactions. The MIM measure excludes non-lagged(i.e. instantaneous) correlations, producing results indicative of laggedinteractions that are physiologically meaningful (Marzetti et al.,2013). MIM, therefore, cannot be used to study zero-lagged interac-tions. However, MIM can be used to study coupling between networksor parcels at electrophysiological frequencies (1–800 Hz range).
Data-driven group-ICA approachSource space group-ICA analysis is a technique that identifies RSNs in
MEG data (Brookes et al., 2011c). Resting state fMRI data is typically ana-lyzed using spatial ICA (Beckmann et al., 2005) to derive RSNs of function-al (Smith et al., 2009) and clinical relevance (Filippini et al., 2009). TheHCPwill apply temporal ICA to concatenated source-spaceMEG data rep-resented as BLP time series (Brookes et al., 2011c; de Pasquale et al., 2010,2012; Hipp et al., 2012)(see section on Seed based functional connectivityabove). Importantly, BLP time series are low pass filtered using a movingaveragewith a timewindow of 2 s to enhance the detection of functionalconnectivity (Luckhoo et al., 2012) at low frequencies consistent withthose inherent to fMRI. In contrast to seed-basedMEG functional connec-tivity, ICA analyses are independent of fMRI-derived spatial priors. Thecomparison of MEG RSN spatial topography with that defined by fMRI isa crucial step, since the original observations of RSN came from fMRI.
Task MEG (tMEG)
HCP task paradigms to be studied with MEG are a subset of thoseused in tfMRI (Barch et al., 2013). The MEG paradigms are matched intemporal structure to fMRI tasks to maximize the scientific value of themulti-modal design of the HCP (Van Essen et al., 2012). Adapting the
194 L.J. Larson-Prior et al. / NeuroImage 80 (2013) 190–201
paradigms for MEG requires increasing the total number of trials to over-come the lower signal-to-noise properties of non-invasiveelectrophysiology.
Experimental paradigms for tMEGThree experimental paradigms will be used to provide data on
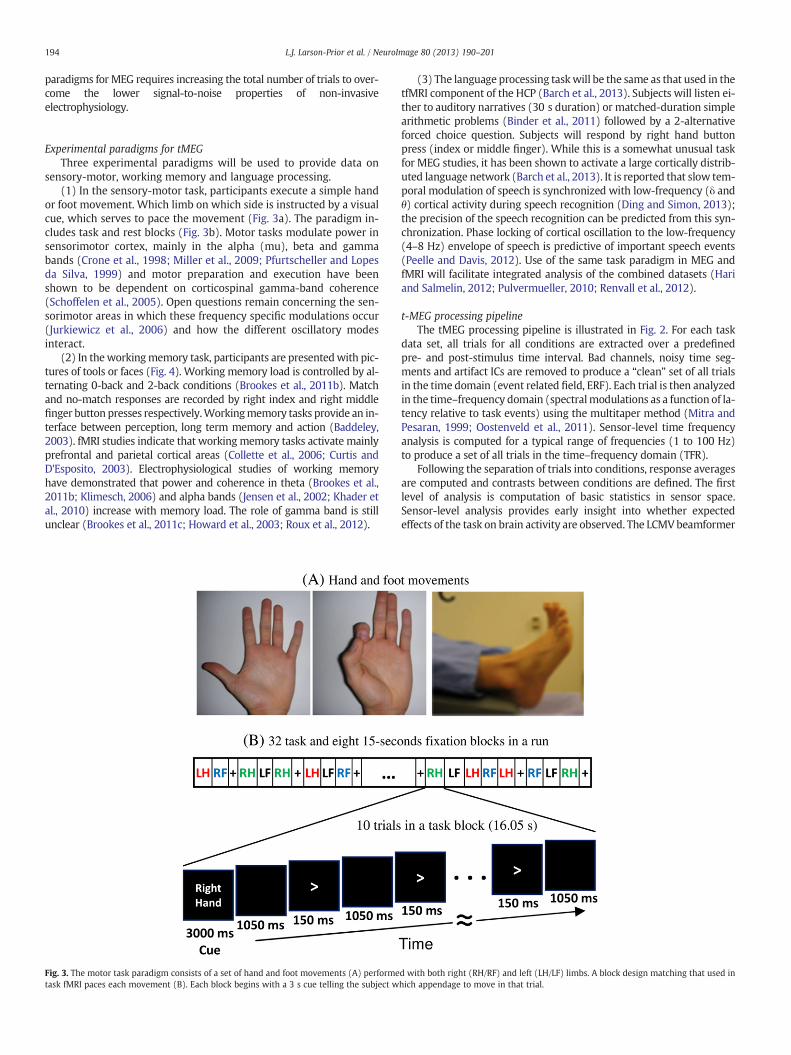
sensory-motor, working memory and language processing.(1) In the sensory-motor task, participants execute a simple hand
or foot movement. Which limb on which side is instructed by a visualcue, which serves to pace the movement (Fig. 3a). The paradigm in-cludes task and rest blocks (Fig. 3b). Motor tasks modulate power insensorimotor cortex, mainly in the alpha (mu), beta and gammabands (Crone et al., 1998; Miller et al., 2009; Pfurtscheller and Lopesda Silva, 1999) and motor preparation and execution have beenshown to be dependent on corticospinal gamma-band coherence(Schoffelen et al., 2005). Open questions remain concerning the sen-sorimotor areas in which these frequency specific modulations occur(Jurkiewicz et al., 2006) and how the different oscillatory modesinteract.
(2) In theworkingmemory task, participants are presentedwith pic-tures of tools or faces (Fig. 4). Working memory load is controlled by al-ternating 0-back and 2-back conditions (Brookes et al., 2011b). Matchand no-match responses are recorded by right index and right middlefinger button presses respectively.Workingmemory tasks provide an in-terface between perception, long term memory and action (Baddeley,2003). fMRI studies indicate that working memory tasks activate mainlyprefrontal and parietal cortical areas (Collette et al., 2006; Curtis andD'Esposito, 2003). Electrophysiological studies of working memoryhave demonstrated that power and coherence in theta (Brookes et al.,2011b; Klimesch, 2006) and alpha bands (Jensen et al., 2002; Khader etal., 2010) increase with memory load. The role of gamma band is stillunclear (Brookes et al., 2011c; Howard et al., 2003; Roux et al., 2012).
Fig. 3. The motor task paradigm consists of a set of hand and foot movements (A) performetask fMRI paces each movement (B). Each block begins with a 3 s cue telling the subject w
(3) The language processing taskwill be the same as that used in thetfMRI component of the HCP (Barch et al., 2013). Subjects will listen ei-ther to auditory narratives (30 s duration) or matched-duration simplearithmetic problems (Binder et al., 2011) followed by a 2-alternativeforced choice question. Subjects will respond by right hand buttonpress (index or middle finger). While this is a somewhat unusual taskfor MEG studies, it has been shown to activate a large cortically distrib-uted language network (Barch et al., 2013). It is reported that slow tem-poral modulation of speech is synchronized with low-frequency (δ andθ) cortical activity during speech recognition (Ding and Simon, 2013);the precision of the speech recognition can be predicted from this syn-chronization. Phase locking of cortical oscillation to the low-frequency(4–8 Hz) envelope of speech is predictive of important speech events(Peelle and Davis, 2012). Use of the same task paradigm in MEG andfMRI will facilitate integrated analysis of the combined datasets (Hariand Salmelin, 2012; Pulvermueller, 2010; Renvall et al., 2012).
t-MEG processing pipelineThe tMEG processing pipeline is illustrated in Fig. 2. For each task
data set, all trials for all conditions are extracted over a predefinedpre- and post-stimulus time interval. Bad channels, noisy time seg-ments and artifact ICs are removed to produce a “clean” set of all trialsin the time domain (event related field, ERF). Each trial is then analyzedin the time–frequency domain (spectralmodulations as a function of la-tency relative to task events) using the multitaper method (Mitra andPesaran, 1999; Oostenveld et al., 2011). Sensor-level time frequencyanalysis is computed for a typical range of frequencies (1 to 100 Hz)to produce a set of all trials in the time–frequency domain (TFR).
Following the separation of trials into conditions, response averagesare computed and contrasts between conditions are defined. The firstlevel of analysis is computation of basic statistics in sensor space.Sensor-level analysis provides early insight into whether expectedeffects of the task on brain activity are observed. The LCMVbeamformer
d with both right (RH/RF) and left (LH/LF) limbs. A block design matching that used inhich appendage to move in that trial.
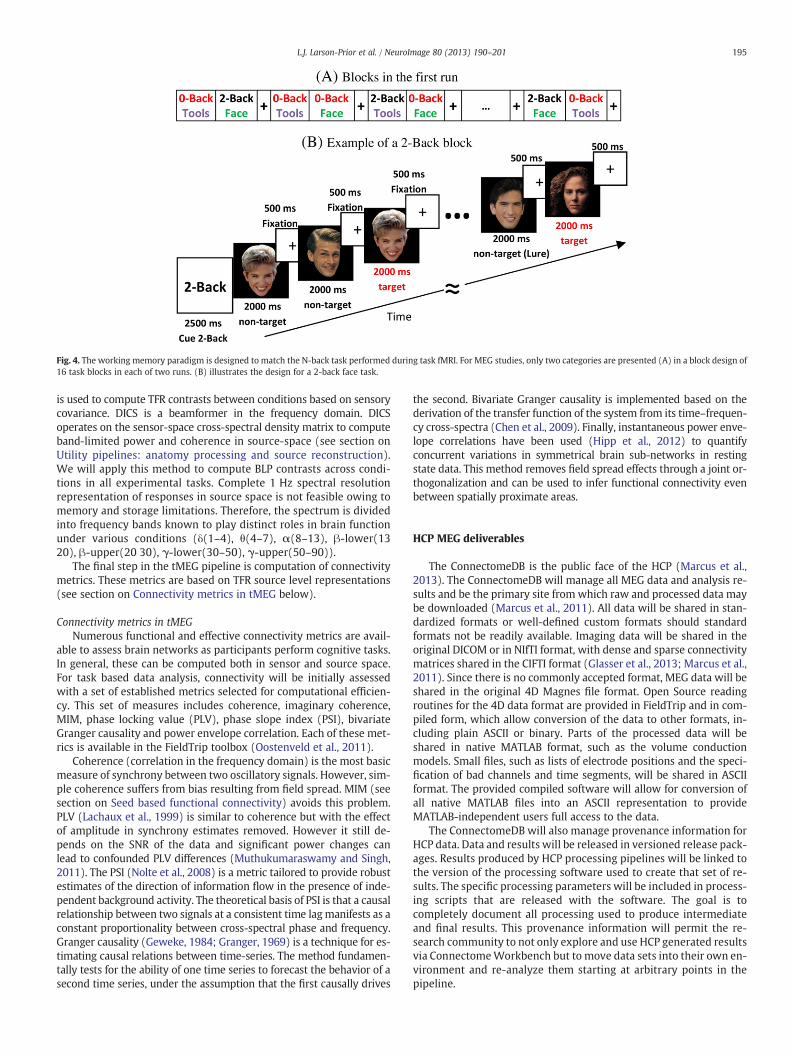
Fig. 4. The working memory paradigm is designed to match the N-back task performed during task fMRI. For MEG studies, only two categories are presented (A) in a block design of16 task blocks in each of two runs. (B) illustrates the design for a 2-back face task.
195L.J. Larson-Prior et al. / NeuroImage 80 (2013) 190–201
is used to compute TFR contrasts between conditions based on sensorycovariance. DICS is a beamformer in the frequency domain. DICSoperates on the sensor-space cross-spectral density matrix to computeband-limited power and coherence in source-space (see section onUtility pipelines: anatomy processing and source reconstruction).We will apply this method to compute BLP contrasts across condi-tions in all experimental tasks. Complete 1 Hz spectral resolutionrepresentation of responses in source space is not feasible owing tomemory and storage limitations. Therefore, the spectrum is dividedinto frequency bands known to play distinct roles in brain functionunder various conditions (δ(1–4), θ(4–7), α(8–13), β-lower(1320), β-upper(20 30), γ-lower(30–50), γ-upper(50–90)).
The final step in the tMEG pipeline is computation of connectivitymetrics. These metrics are based on TFR source level representations(see section on Connectivity metrics in tMEG below).
Connectivity metrics in tMEGNumerous functional and effective connectivity metrics are avail-
able to assess brain networks as participants perform cognitive tasks.In general, these can be computed both in sensor and source space.For task based data analysis, connectivity will be initially assessedwith a set of established metrics selected for computational efficien-cy. This set of measures includes coherence, imaginary coherence,MIM, phase locking value (PLV), phase slope index (PSI), bivariateGranger causality and power envelope correlation. Each of these met-rics is available in the FieldTrip toolbox (Oostenveld et al., 2011).
Coherence (correlation in the frequency domain) is the most basicmeasure of synchrony between two oscillatory signals. However, sim-ple coherence suffers from bias resulting from field spread. MIM (seesection on Seed based functional connectivity) avoids this problem.PLV (Lachaux et al., 1999) is similar to coherence but with the effectof amplitude in synchrony estimates removed. However it still de-pends on the SNR of the data and significant power changes canlead to confounded PLV differences (Muthukumaraswamy and Singh,2011). The PSI (Nolte et al., 2008) is a metric tailored to provide robustestimates of the direction of information flow in the presence of inde-pendent background activity. The theoretical basis of PSI is that a causalrelationship between two signals at a consistent time lagmanifests as aconstant proportionality between cross-spectral phase and frequency.Granger causality (Geweke, 1984; Granger, 1969) is a technique for es-timating causal relations between time-series. The method fundamen-tally tests for the ability of one time series to forecast the behavior of asecond time series, under the assumption that the first causally drives
the second. Bivariate Granger causality is implemented based on thederivation of the transfer function of the system from its time–frequen-cy cross-spectra (Chen et al., 2009). Finally, instantaneous power enve-lope correlations have been used (Hipp et al., 2012) to quantifyconcurrent variations in symmetrical brain sub-networks in restingstate data. This method removes field spread effects through a joint or-thogonalization and can be used to infer functional connectivity evenbetween spatially proximate areas.
HCP MEG deliverables
The ConnectomeDB is the public face of the HCP (Marcus et al.,2013). The ConnectomeDB will manage all MEG data and analysis re-sults and be the primary site from which raw and processed data maybe downloaded (Marcus et al., 2011). All data will be shared in stan-dardized formats or well-defined custom formats should standardformats not be readily available. Imaging data will be shared in theoriginal DICOM or in NIfTI format, with dense and sparse connectivitymatrices shared in the CIFTI format (Glasser et al., 2013; Marcus et al.,2011). Since there is no commonly accepted format, MEG data will beshared in the original 4D Magnes file format. Open Source readingroutines for the 4D data format are provided in FieldTrip and in com-piled form, which allow conversion of the data to other formats, in-cluding plain ASCII or binary. Parts of the processed data will beshared in native MATLAB format, such as the volume conductionmodels. Small files, such as lists of electrode positions and the speci-fication of bad channels and time segments, will be shared in ASCIIformat. The provided compiled software will allow for conversion ofall native MATLAB files into an ASCII representation to provideMATLAB-independent users full access to the data.
The ConnectomeDB will also manage provenance information forHCP data. Data and results will be released in versioned release pack-ages. Results produced by HCP processing pipelines will be linked tothe version of the processing software used to create that set of re-sults. The specific processing parameters will be included in process-ing scripts that are released with the software. The goal is tocompletely document all processing used to produce intermediateand final results. This provenance information will permit the re-search community to not only explore and use HCP generated resultsvia ConnectomeWorkbench but to move data sets into their own en-vironment and re-analyze them starting at arbitrary points in thepipeline.
196 L.J. Larson-Prior et al. / NeuroImage 80 (2013) 190–201
MEG data
MEG data and associatedmetadata (e.g., sampling rate, event timing,bad channels and data segments with excessivemotion artifacts) will bemanaged in the ConnectomeDB. These datawill be linked to descriptionsof the experimental protocols and results of quality control processes.The utility pipeline identifies bad channels and segments for each runand each subject. These results will be shared in the form of ASCII filescontaining the bad channel names and the start and end times of eachof the bad temporal segments in the respective run. Thesewill be accom-panied by figures (bitmap imagefiles) presenting the topology and char-acteristics of the bad segments.
One utility pipeline step consists of multiple fastICA iterations usedin automatic classification of signal into Brain and Noise components.The results of the best iteration will be provided to the user in theform of a mixing and unmixing matrix with the classification of eachIC noted. Additionally, figures characterizing each component will beprovided that include the IC sensor map and its corresponding time-course and power spectral density.
Software pipelines
In addition to providing access to raw MEG data, the HCP will alsoshare the software that comprises the analysis pipelines. This willallowusers of theHCP to reanalyze the shared data, optionally using dif-ferent parameters with the various algorithms. Additionally, the soft-ware allows for the same analyses to be performed on MEG data thatis or will be acquired outside the HCP.
All MEG analysis software will be implemented in MATLAB(Mathworks, Natick, MA), using the FieldTrip toolbox (Oostenveld et al.,2011). Most of the analyses will be implemented in scripts that callFieldTrip functions and custom written HCP functions. The scripts com-prise the HCP MEG analysis pipelines and extend the FieldTrip toolboxaccording to the requirements of this project. The FieldTrip toolbox isfreely available as Open Source under the General Public License(GPLv2) and analysis pipelines will be available for download.
Although all analysis scripts and functions are to be made availablefree of charge, the MATLAB environment on which they are built is acommercial software package thatmight not be available to all externalHCP users. To enable all researchers to use the software, wewill providecompiled versions of all pipelines using the MATLAB Compiler toolbox.The compiled executables use the MATLAB Compiler Runtime (MCR),which can be shared with the compiled executables and is availableroyalty-free fromMathworks. The executable andMCRwill be providedfor the 64 bit versions of the Linux, Mac OS X and Windows operatingsystems. The Linux version of these compiled applications, running onthe Washington University Center for High Performance Computing(CHPC) system (Marcus et al., 2011), are the instantiation of the MEGpipelines used by the HCP team.
Anatomical data
Anatomical models are used to define the locations in the brain atwhich electrical source activity are estimated. Because HCP MRI datahas been processed to remove facial features for subject privacy(Milchenko and Marcus, 2012) pre-computed head models will bemade available for each subject.
The anatomy pipeline will generate three types of output: headmodels, source models and coregistration information. For forwardmodeling, a single shell model will be provided for MEG (Nolte,2003). The BEM system matrix, computed with OpenMEEG (Gramfortet al., 2011) will be provided for source modeling. The models for dis-tributed sources in the HCP are based on high-quality extracted corticalsheets. The volumetric source models for beamformer reconstructionare based on regular 3Dgrids inMNI space, constructed from a templatebrain. Individual anatomies are (non-linearly) warped to this template
brain, and we apply the inverse of this warp to the template sourcemodel. The individually warped 3D volumetric grid facilitates groupanalysis, as it allows for computationally efficient averaging in normal-ized space without the need for interpolation. Coregistration informa-tion is provided to link subject-specific head coordinate systems tothe standard coordinate system provided by the HCP. Co-registrationis accomplished using FSL's linear registration tool [FLIRT; (Greve andFischl, 2009; Jenkinson et al., 2002; Jenkinson and Smith, 2001)].
rMEG results
The processing pipeline for rMEG data is modular, allowing for theapplication of different source projection algorithms. Sensor level analy-ses are used to identify independent components of brain origin, whichare then projected onto source space using the source model providedby the anatomy pipeline. The single subject branch of the rMEG pipelineprovides source level network information based on a wMNE algorithm(see section on t-MEG processing pipeline). As noted in the section onthe electrophysiological approach to connectomics, these data are thenanalyzed for connectivity using either a correlation approach, or MIM(Ewald et al., 2011).
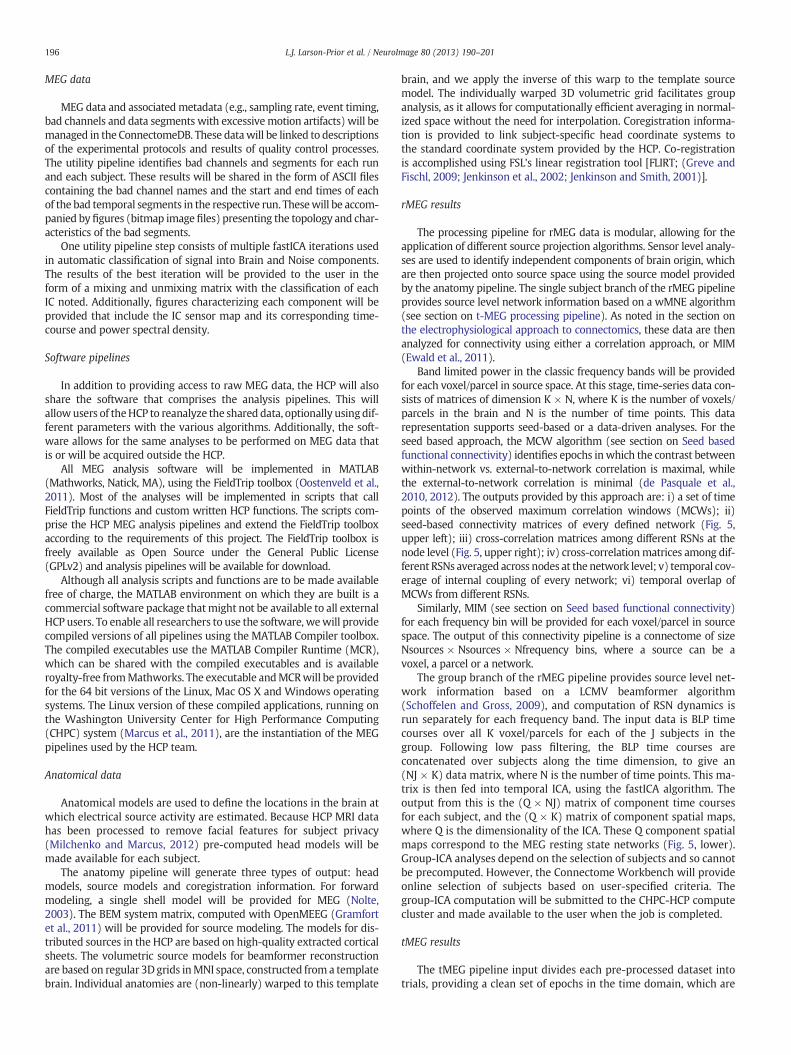
Band limited power in the classic frequency bands will be providedfor each voxel/parcel in source space. At this stage, time-series data con-sists of matrices of dimension K × N, where K is the number of voxels/parcels in the brain and N is the number of time points. This datarepresentation supports seed-based or a data-driven analyses. For theseed based approach, the MCW algorithm (see section on Seed basedfunctional connectivity) identifies epochs inwhich the contrast betweenwithin-network vs. external-to-network correlation is maximal, whilethe external-to-network correlation is minimal (de Pasquale et al.,2010, 2012). The outputs provided by this approach are: i) a set of timepoints of the observed maximum correlation windows (MCWs); ii)seed-based connectivity matrices of every defined network (Fig. 5,upper left); iii) cross-correlation matrices among different RSNs at thenode level (Fig. 5, upper right); iv) cross-correlationmatrices among dif-ferent RSNs averaged across nodes at the network level; v) temporal cov-erage of internal coupling of every network; vi) temporal overlap ofMCWs from different RSNs.
Similarly, MIM (see section on Seed based functional connectivity)for each frequency bin will be provided for each voxel/parcel in sourcespace. The output of this connectivity pipeline is a connectome of sizeNsources × Nsources × Nfrequency bins, where a source can be avoxel, a parcel or a network.
The group branch of the rMEG pipeline provides source level net-work information based on a LCMV beamformer algorithm(Schoffelen and Gross, 2009), and computation of RSN dynamics isrun separately for each frequency band. The input data is BLP timecourses over all K voxel/parcels for each of the J subjects in thegroup. Following low pass filtering, the BLP time courses areconcatenated over subjects along the time dimension, to give an(NJ × K) data matrix, where N is the number of time points. This ma-trix is then fed into temporal ICA, using the fastICA algorithm. Theoutput from this is the (Q × NJ) matrix of component time coursesfor each subject, and the (Q × K) matrix of component spatial maps,where Q is the dimensionality of the ICA. These Q component spatialmaps correspond to the MEG resting state networks (Fig. 5, lower).Group-ICA analyses depend on the selection of subjects and so cannotbe precomputed. However, the Connectome Workbench will provideonline selection of subjects based on user-specified criteria. Thegroup-ICA computation will be submitted to the CHPC-HCP computecluster and made available to the user when the job is completed.
tMEG results
The tMEG pipeline input divides each pre-processed dataset intotrials, providing a clean set of epochs in the time domain, which are
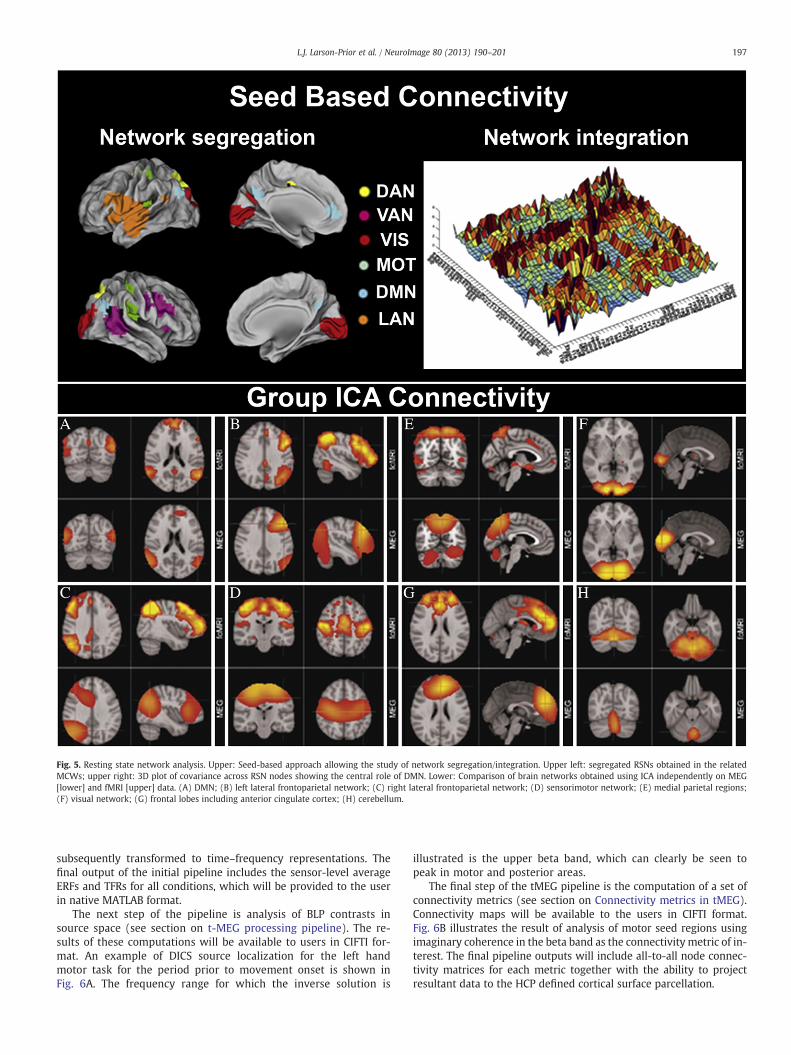
Fig. 5. Resting state network analysis. Upper: Seed-based approach allowing the study of network segregation/integration. Upper left: segregated RSNs obtained in the relatedMCWs; upper right: 3D plot of covariance across RSN nodes showing the central role of DMN. Lower: Comparison of brain networks obtained using ICA independently on MEG[lower] and fMRI [upper] data. (A) DMN; (B) left lateral frontoparietal network; (C) right lateral frontoparietal network; (D) sensorimotor network; (E) medial parietal regions;(F) visual network; (G) frontal lobes including anterior cingulate cortex; (H) cerebellum.
197L.J. Larson-Prior et al. / NeuroImage 80 (2013) 190–201
subsequently transformed to time–frequency representations. Thefinal output of the initial pipeline includes the sensor-level averageERFs and TFRs for all conditions, which will be provided to the userin native MATLAB format.
The next step of the pipeline is analysis of BLP contrasts insource space (see section on t-MEG processing pipeline). The re-sults of these computations will be available to users in CIFTI for-mat. An example of DICS source localization for the left handmotor task for the period prior to movement onset is shown inFig. 6A. The frequency range for which the inverse solution is
illustrated is the upper beta band, which can clearly be seen topeak in motor and posterior areas.
The final step of the tMEG pipeline is the computation of a set ofconnectivity metrics (see section on Connectivity metrics in tMEG).Connectivity maps will be available to the users in CIFTI format.Fig. 6B illustrates the result of analysis of motor seed regions usingimaginary coherence in the beta band as the connectivity metric of in-terest. The final pipeline outputs will include all-to-all node connec-tivity matrices for each metric together with the ability to projectresultant data to the HCP defined cortical surface parcellation.
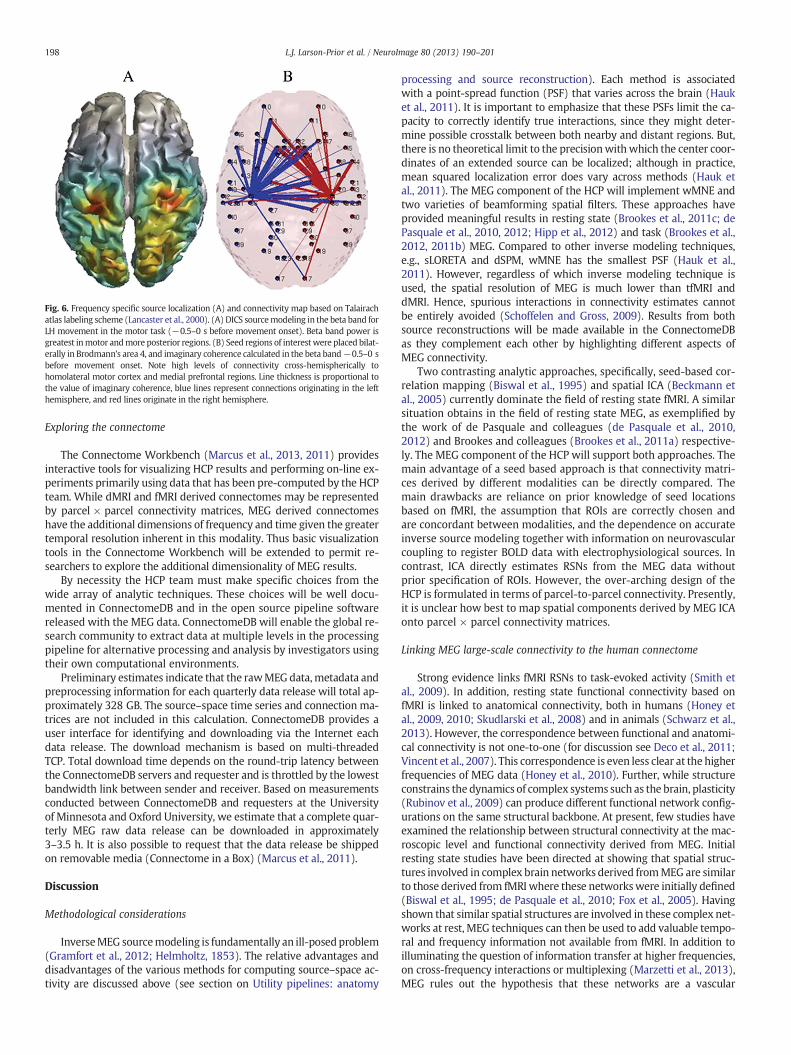
Fig. 6. Frequency specific source localization (A) and connectivity map based on Talairachatlas labeling scheme (Lancaster et al., 2000). (A) DICS sourcemodeling in the beta band forLH movement in the motor task (−0.5–0 s before movement onset). Beta band power isgreatest inmotor andmore posterior regions. (B) Seed regions of interestwere placed bilat-erally in Brodmann's area 4, and imaginary coherence calculated in the beta band−0.5–0 sbefore movement onset. Note high levels of connectivity cross-hemispherically tohomolateral motor cortex and medial prefrontal regions. Line thickness is proportional tothe value of imaginary coherence, blue lines represent connections originating in the lefthemisphere, and red lines originate in the right hemisphere.
198 L.J. Larson-Prior et al. / NeuroImage 80 (2013) 190–201
Exploring the connectome
The Connectome Workbench (Marcus et al., 2013, 2011) providesinteractive tools for visualizing HCP results and performing on-line ex-periments primarily using data that has been pre-computed by the HCPteam. While dMRI and fMRI derived connectomes may be representedby parcel × parcel connectivity matrices, MEG derived connectomeshave the additional dimensions of frequency and time given the greatertemporal resolution inherent in this modality. Thus basic visualizationtools in the Connectome Workbench will be extended to permit re-searchers to explore the additional dimensionality of MEG results.
By necessity the HCP team must make specific choices from thewide array of analytic techniques. These choices will be well docu-mented in ConnectomeDB and in the open source pipeline softwarereleased with the MEG data. ConnectomeDB will enable the global re-search community to extract data at multiple levels in the processingpipeline for alternative processing and analysis by investigators usingtheir own computational environments.
Preliminary estimates indicate that the rawMEGdata,metadata andpreprocessing information for each quarterly data release will total ap-proximately 328 GB. The source–space time series and connection ma-trices are not included in this calculation. ConnectomeDB provides auser interface for identifying and downloading via the Internet eachdata release. The download mechanism is based on multi-threadedTCP. Total download time depends on the round-trip latency betweenthe ConnectomeDB servers and requester and is throttled by the lowestbandwidth link between sender and receiver. Based on measurementsconducted between ConnectomeDB and requesters at the Universityof Minnesota and Oxford University, we estimate that a complete quar-terly MEG raw data release can be downloaded in approximately3–3.5 h. It is also possible to request that the data release be shippedon removable media (Connectome in a Box) (Marcus et al., 2011).
Discussion
Methodological considerations
InverseMEG sourcemodeling is fundamentally an ill-posedproblem(Gramfort et al., 2012; Helmholtz, 1853). The relative advantages anddisadvantages of the various methods for computing source–space ac-tivity are discussed above (see section on Utility pipelines: anatomy
processing and source reconstruction). Each method is associatedwith a point-spread function (PSF) that varies across the brain (Hauket al., 2011). It is important to emphasize that these PSFs limit the ca-pacity to correctly identify true interactions, since they might deter-mine possible crosstalk between both nearby and distant regions. But,there is no theoretical limit to the precisionwithwhich the center coor-dinates of an extended source can be localized; although in practice,mean squared localization error does vary across methods (Hauk etal., 2011). The MEG component of the HCP will implement wMNE andtwo varieties of beamforming spatial filters. These approaches haveprovided meaningful results in resting state (Brookes et al., 2011c; dePasquale et al., 2010, 2012; Hipp et al., 2012) and task (Brookes et al.,2012, 2011b) MEG. Compared to other inverse modeling techniques,e.g., sLORETA and dSPM, wMNE has the smallest PSF (Hauk et al.,2011). However, regardless of which inverse modeling technique isused, the spatial resolution of MEG is much lower than tfMRI anddMRI. Hence, spurious interactions in connectivity estimates cannotbe entirely avoided (Schoffelen and Gross, 2009). Results from bothsource reconstructions will be made available in the ConnectomeDBas they complement each other by highlighting different aspects ofMEG connectivity.
Two contrasting analytic approaches, specifically, seed-based cor-relation mapping (Biswal et al., 1995) and spatial ICA (Beckmann etal., 2005) currently dominate the field of resting state fMRI. A similarsituation obtains in the field of resting state MEG, as exemplified bythe work of de Pasquale and colleagues (de Pasquale et al., 2010,2012) and Brookes and colleagues (Brookes et al., 2011a) respective-ly. The MEG component of the HCP will support both approaches. Themain advantage of a seed based approach is that connectivity matri-ces derived by different modalities can be directly compared. Themain drawbacks are reliance on prior knowledge of seed locationsbased on fMRI, the assumption that ROIs are correctly chosen andare concordant between modalities, and the dependence on accurateinverse source modeling together with information on neurovascularcoupling to register BOLD data with electrophysiological sources. Incontrast, ICA directly estimates RSNs from the MEG data withoutprior specification of ROIs. However, the over-arching design of theHCP is formulated in terms of parcel-to-parcel connectivity. Presently,it is unclear how best to map spatial components derived by MEG ICAonto parcel × parcel connectivity matrices.
Linking MEG large-scale connectivity to the human connectome
Strong evidence links fMRI RSNs to task-evoked activity (Smith etal., 2009). In addition, resting state functional connectivity based onfMRI is linked to anatomical connectivity, both in humans (Honey etal., 2009, 2010; Skudlarski et al., 2008) and in animals (Schwarz et al.,2013). However, the correspondence between functional and anatomi-cal connectivity is not one-to-one (for discussion see Deco et al., 2011;Vincent et al., 2007). This correspondence is even less clear at the higherfrequencies of MEG data (Honey et al., 2010). Further, while structureconstrains the dynamics of complex systems such as the brain, plasticity(Rubinov et al., 2009) can produce different functional network config-urations on the same structural backbone. At present, few studies haveexamined the relationship between structural connectivity at the mac-roscopic level and functional connectivity derived from MEG. Initialresting state studies have been directed at showing that spatial struc-tures involved in complex brain networks derived fromMEG are similarto those derived from fMRI where these networkswere initially defined(Biswal et al., 1995; de Pasquale et al., 2010; Fox et al., 2005). Havingshown that similar spatial structures are involved in these complex net-works at rest, MEG techniques can then be used to add valuable tempo-ral and frequency information not available from fMRI. In addition toilluminating the question of information transfer at higher frequencies,on cross-frequency interactions or multiplexing (Marzetti et al., 2013),MEG rules out the hypothesis that these networks are a vascular
199L.J. Larson-Prior et al. / NeuroImage 80 (2013) 190–201
phenomena. Further, MEG directly reflects the dynamics of neural pop-ulations at behaviorally meaningful temporal scales. Thus, integrationof MEG functional connectivity with the fMRI and dMRI componentsof the HCP offers the potential for increased understanding of humanbrain functions.
Because MEG and fMRI have complementary spatiotemporal charac-teristics, integration of these twomodalities theoretically should increaseour understanding of the functional organization of brain networkdynamics (see Rosa et al., 2010; Snyder and Raichle, 2010 for reviews).However, integration ofMEG and fMRI data remains elusive, despite con-siderable efforts by several laboratories (Babajani and Soltanian-Zadeh,2006; Dale et al., 2000; Debener et al., 2006; Larson-Prior et al., 2011;Rosa et al., 2010; Sotero and Trujillo-Barreto, 2008). A fully integratedanalysis of MEG and fMRI requires a single biophysical model that de-scribes data from both modalities (Babajani and Soltanian-Zadeh, 2006;Riera et al., 2006; Sotero and Trujillo-Barreto, 2008). While such a bot-tom–up approach symmetrically utilizes data from both modalities, it ismathematically complicated. More commonly, an asymmetric approachis taken in which data from one modality are used as prior informationfor the other. For example, several studies have used fMRI-driven spatialpriors to inform the MEG inverse problem (Ahlfors and Simpson, 2004;Dale et al., 2000; Henson et al., 2009).
The relation between the hemodynamic response and neuronalactivity is still not fully understood (Logothetis, 2008; Magri et al.,2012). Recent evidence indicates that astrocytic processes govern thedynamics of “neuro-vascular coupling” (Schummers et al., 2008). Vari-ous studies have shown that trial-by-trial BOLD fluctuations during taskperformance correlate negatively with power in the alpha and beta fre-quency bands and positively in the gamma band (Feige et al., 2005;Moosmann et al., 2003; Scheeringa et al., 2011; Yuan et al., 2010). Nev-ertheless BOLD activation maps with their high spatial resolution areused in many studies as priors for MEG inverse solutions.
The first part of this paper discussed the very different spatialand temporal scales that characterize the domains of MEG, fMRIand dMRI. Hence, integrating connectivity across these domainsis challenging. The HCP approach to meeting this challenge isparcellation and measurement of parcel × parcel connectivity ma-trices. Anatomical parcellations might provide the spatial smooth-ing and integration required to confidently fuse the differentmodalities. Atlases have been used in MEG analysis (Hillebrand etal., 2012) to parcellate and examine connectivity of the entirecortex. Source level group-ICA can be used to produce MEGdata-derived network parcellations, which can be used to interro-gate different subpopulations of the HCP database. Alternatively,parcels may be defined from ICA, resting-state fMRI, task-basedfMRI, or MEG data and used as seed regions for connectivity analy-ses. It might be argued that high spatial resolution modalities, e.g.,resting-state fMRI, should be used to define the parcels used in MEGfunctional connectivity analyses. However, MEG derived parcellationsare adapted to the characteristics of the MEG data, and as such may bemore appropriate to use in subsequent analyses within this modality.
Future directions
The availability of resting and task MEG data in the ConnectomeDBwill enable the exploration of multiple features of the data usingboth existing and yet to be developed analysis techniques. In thefuture, more elaborate connectivity metrics are likely to becomeavailable. Metrics such as those based onmultivariate autoregressivemodels, e.g. Partial Directed Coherence (PDC) (Baccala andSameshima, 2001) and Directed Transfer Function (DTF) (Kaminskiet al., 2001), adopt a semi arbitrary normalization (making connec-tivity comparisons meaningful only with the same starting or endingvoxel) and are generally sensitive to noise (Baccala and Sameshima,2001; Michalareas et al., 2012). Metrics based on non-parametricspectral factorization can be adopted to study directionality, such
as spectrally resolved Granger causality (Bosman et al., 2012).These metrics are planned for implementation in the HCP at a laterstage, after initial evaluation. Other methods of inferring effectiveconnectivity such Dynamic Causal Modeling (DCM) (Friston et al.,2003; Kiebel et al., 2008) or Transfer Entropy (TE) (Wibral et al.,2011) are computationally limited to a few nodes. These methodsare best suited to studies where clear data- or theory-driven hypoth-eses define the regions participating in a functional network. DCMmay be implemented if indicated by initial results.
Conflict of interest
The authors declare no conflict of interest.
References
Ahlfors, S.P., Simpson, G.V., 2004. Geometrical interpretation of fMRI-guided MEG/EEGinverse estimates. Neuroimage 22, 323–332.
Babajani, A., Soltanian-Zadeh, H., 2006. Integrated MEG/EEG and fMRI model based onneural masses. IEEE Trans. Biomed. Eng. 53, 1794–1801.
Baccala, L.A., Sameshima, K., 2001. Partial directed coherence: a new concept in neuralstructure determination. Biol. Cybern. 84, 463–474.
Baddeley, A., 2003. Working memory: looking back and looking forward. Nat. Rev.Neurosci. 4, 829–839.
Barch, D.M., Burgess, G.C., Harms, M.P., Petersen, S.E., Schlaggar, B.L., Corbetta, M.,Glasser, M.F., Curtiss, S., Dixit, S., Feldt, C., Nolan, D., Bryant, E., Hartley, T., Footer,O., Bjork, J.M., Poldrack, R., Smith, S., Johansen-Berg, H., Snyder, A.Z., Van Essen,D.C, for the WU-Minn HCP Consortium, 2013. Function in the human connectome:Task-fMRI and individual differences in behavior. NeuroImage 80, 169–189 (Spe-cial Issue “Mapping the Connectome”).
Beckmann, C.F., DeLuca, M., Devlin, J.T., Smith, S.M., 2005. Investigations into resting-state connectivity using independent component analysis. Phil. Trans. R. Soc. B-Biol. Sci. 360, 1001–1013.
Binder, J.R., Gross, W.L., Allendorfer, J.B., Bonilha, L., Chapin, J., Edwards, J.C.,Grabowski, T.J., Langfitt, J.T., Loring, D.W., Lowe, M.J., Koenig, K., Morgan, P.S.,Ojemann, J.G., Rorden, C., Szaflarski, J.P., Tivarus, M.E., Weaver, K.E., 2011. Map-ping anterior temporal lobe language areas with fMRI: a multicenter normativestudy. Neuroimage 54, 1465–1475.
Biswal, B., Yetkin, F.Z., Haughton, V.M., Hyde, J.S., 1995. Functional connectivity in themotor cortex of resting human brain using echo-planar MRI. Magn. Reson. Med. 34,537–541.
Bosman, C., Schoffelen, J.-M., Brunet, N., Oostenveld, R., Bastos, A.,Womelsdorf, T., Rubehn,B., Stieglitz, T., De Weerd, P., Fries, P., 2012. Attentional stimulus selection throughselective synchronization between monkey visual areas. Neuron 75, 875–888.
Brookes, M.J., Hale, J.R., Zumer, J.M., Stevenson, C.M., Francis, S.T., Barnes, G.R., Owen,J.P., Morris, P.G., Nagarajan, S.S., 2011. Measuring functional connectivity usingMEG: methodology and comparison with fcMRI. Neuroimage 56, 1082–1104.
Brookes, M.J., Wood, J.R., Stevenson, C.M., Zumer, J.M., White, T.P., Liddle, P.F., Morris,P.G., 2011. Changes in brain network activity during working memory tasks: amagnetoencephalography study. Neuroimage 55, 1804–1815.
Brookes, M.J., Woolrich, M., Luckhoo, H., Price, D., Hale, J.R., Stephenson, M.C., Barnes, G.R.,Smith, S.M., Morris, P.G., 2011. Investigating the electrophysiological basis of restingstate networks using magnetoencephalography. Proc. Natl. Acad. Sci. U. S. A. 108,16783–16788.
Brookes, M., Liddle, E., Hale, J., Woolrich, M., Luckhoo, H., Liddle, P., Morris, P., 2012.Task Induced modulation of neural oscillations in electrophysiological brain net-works. Neuroimage 63, 1918–1930.
Buzsaki, G., 2009. Rhythms of the Brain. Oxford University Press, USA.Calamante, F., Tournier, J.-D., Jackson, G.D., Connelly, A., 2010. Track-density imaging
(TDI): super-resolution white matter imaging using whole-brain track-densitymapping. Neuroimage 53, 1233–1243.
Calamante, F., Tournier, J.-D., Heidemann, R.M., Anwander, A., Jackson, G.D., Connelly,A., 2011. Track density imaging (TDI): validation of super resolution property.Neuroimage 56, 1259–1266.
Chen, Y., Bressler, S.L., Ding, M., 2009. Dynamics on networks: assessing functional con-nectivity with Granger causality. Comput. Math. Organ. Theory 15, 329–350.
Collette, F., Hogge, M., Salmon, E., Van der Linden, M., 2006. Exploration of the neu-ral substrates of executive functioning by functional neuroimaging. Neurosci-ence 139, 209–221.
Crone, N.E., Miglioretti, D.L., Gordon, B., Sieracki, J.M., Wilson, M.T., Uematsu, S., Lesser, R.P.,1998. Functional mapping of human sensorimotor cortex with electrocorticographicspectral analysis. I. Alpha and beta event-related desynchronization. Brain 121,2271–2299.
Curtis, C.E., D'Esposito, M., 2003. Persistent activity in the prefrontal cortex duringworking memory. Trends Cogn. Sci. 7, 415–423.
Dale, A.M., Liu, A.K., Fischl, B.R., Buckner, R.L., Belliveau, J.W., Lewine, J.D., Halgren, E.,2000. Dynamic statistical parametric neurotechnique mapping: combining fMRIand MEG for high-resolution imaging of cortical activity. Neuron 26, 55–67.
Damoiseaux, J.S., Rombouts, S.A., Barkhof, F., Scheltens, P., Stam, C.J., Smith, S.M.,Beckmann, C.F., 2006. Consistent resting-state networks across healthy subjects.Proc. Natl. Acad. Sci. U. S. A. 103, 13848–13853.
200 L.J. Larson-Prior et al. / NeuroImage 80 (2013) 190–201
de Pasquale, F., Della Penna, S., Snyder, A.Z., Lewis, C., Mantini, D., Marzetti, L.,Belardinelli, P., Ciancetta, L., Pizzella, V., Romani, G.L., Corbetta, M., 2010. Tempo-ral dynamics of spontaneous MEG activity in brain networks. Proc. Natl. Acad. Sci.107, 6040–6045.
de Pasquale, F., Della Penna, S., Snyder, A.Z., Marzetti, L., Pizzella, V., Romani, G.L.,Corbetta, M., 2012. A cortical core for dynamic integration of functional networksin the resting human brain. Neuron 74, 753–764.
Deco, G., Jirsa, V.K., McIntosh, A.R., 2011. Emerging concepts for the dynamical organi-zation of resting-state activity in the brain. Nat. Rev. Neurosci. 12, 43–56.
Ding, N., Simon, J.Z., 2013. Adaptive temporal encoding leads to a background insensi-tive cortical representation of speech. J. Neurosci. 33, 5728–5735.
Ewald, A., Marzetti, L., Zappasodi, F., Meinecke, F.C., Nolte, G., 2011. Estimating truebrain connectivity from EEG/MEG data invariant to linear and static transforma-tions in sensor space. Neuroimage 60, 476–488.
Feige, B., Scheffler, K., Esposito, F., Di Salle, F., Hennig, J., Seifritz, E., 2005. Cortical andsubcortical correlates of electroencephalographic alpha rhythm modulation. J.Neurophysiol. 93, 2864–2872.
Fiecas, M., Ombao, H., van Lunen, D., Baumgartner, R., Coimbra, A., Feng, D., 2012.Quantifying temporal correlations: a test–retest evaluation of functional connec-tivity in resting-state fMRI. Neuroimage 65, 231–241.
Filippini, N., MacIntosh, B.J., Hough, M.G., Goodwin, G.M., Frisoni, G.B., Smith, S.M.,Matthews, P.M., Beckmann, C.F., Mackay, C.E., 2009. Distinct patterns of brain ac-tivity in young carriers of the APOE-e4 allele. Proc. Natl. Acad. Sci. 106, 7209–7214.
Fox, M.D., Raichle, M.E., 2007. Spontaneous fluctuations in brain activity observed withfunctional magnetic resonance imaging. Nat. Rev. Neurosci. 8, 700–711.
Fox, M.D., Snyder, A.Z., Vincent, J.L., Corbetta, M., Van Essen, D.C., Raichle, M.E., 2005.The human brain is intrinsically organized into dynamic, anticorrelated functionalnetworks. Proc. Natl. Acad. Sci. U. S. A. 102, 9673–9678.
Fries, P., 2009. Neuronal gamma-band synchronization as a fundamental process incortical computation. Annu. Rev. Neurosci. 32, 209–224.
Friston, K., 2002. Beyond phrenology: what can neuroimaging tell us about distributedcircuitry? Annu. Rev. Neurosci. 25, 221–250.
Friston, K.J., Harrison, L., Penny, W., 2003. Dynamic causal modelling. Neuroimage 19,1273–1302.
Geweke, J.F., 1984. Measures of conditional linear dependence and feedback betweentime series. J. Am. Stat. Assoc. 79, 907–915.
Glasser, M.F., Sotiropoulos, S.N., Wilson, J.A., Coalson, T.S., Fischl, B., Andersson, J.L., Xu,J., Jbabdi, S., Webster, M., Polimeni, J.R., Van Essen, D.C., Jenkinson, M., for the WU-Minn HCP Consortium, 2013. The minimal preprocessing pipelines for the HumanConnectome Project. NeuroImage 80, 105–124 (Special Issue “Mapping theConnectome”).
Gramfort, A., Papadopoulo, T., Olivi, E., Clerc, M., 2011. Forward field computation withOpenMEEG. Comput. Intell. Neurosci. 2011.
Gramfort, A., Kowalski, M., Hämäläinen, M., 2012. Mixed-norm estimates for the M/EEGinverse problem using accelerated gradient methods. Phys. Med. Biol. 57, 1937.
Granger, C.W.J., 1969. Investigating causal relations by econometric models and cross-spectral methods. Econometrica 37, 424–438.
Greve, D.N., Fischl, B., 2009. Accurate and robust brain image alignment usingboundary-based registration. Neuroimage 48, 63.
Gross, J., Kujala, J., Hamalainen, M., Timmermann, L., Schnitzler, A., Salmelin, R., 2001.Dynamic imaging of coherent sources: studying neural interactions in the humanbrain. Proc. Natl. Acad. Sci. 98, 694–699.
Gross, J., Baillet, S., Barnes, G., Henson, R., Hillebrand, A., Jensen, O., Jerbi, K., Litvak, V.,Maess, B., Oostenveld, R., 2013. Good practice for conducting and reporting MEGresearch. Neuroimage 65, 349–363.
Guggisberg, A.G., Honma, S.M., Findlay, A.M., Dalal, S.S., Kirsch, H.E., Berger, M.S.,Nagarajan, S.S., 2008. Mapping functional connectivity in patients with brain le-sions. Ann. Neurol. 63, 193–203.
Hari, R., Salmelin, R., 2012. Magnetoencephalography: from SQUIDs to neuroscience:Neuroimage 20th anniversary special edition. Neuroimage 61, 386–396.
Hathout, G.M., Gopi, R.K., Bandettini, P., Gambhir, S.S., 1999. The lag of cerebral hemo-dynamics with rapidly alternating periodic stimulation: modeling for functionalMRI. Magn. Reson. Imaging 17, 9–20.
Hauk, O., Wakeman, D.G., Henson, R., 2011. Comparison of noise-normalized minimumnorm estimates for MEG analysis using multiple resolution metrics. Neuroimage54, 1966–1974.
Helmholtz, H.v, 1853. Ueber einige Gesetze der Vertheilung elektrischer Strome inkoerperlichen Leitern mit Anwendung auf die thierisch-elektrischen Versuche.Ann. Phys. 165, 211–233.
Henson, R.N., Mouchlianitis, E., Friston, K.J., 2009. MEG and EEG data fusion: simulta-neous localisation of face-evoked responses. Neuroimage 47, 581–589.
Hillebrand, A., Barnes, G.R., Bosboom, J.L., Berendse, H.W., Stam, C.J., 2012. Frequency-dependent functional connectivity within resting-state networks: an atlas-basedMEG beamformer solution. Neuroimage 59, 3909–3921.
Hipp, J.F., Hawellek, D.J., Corbetta, M., Siegel, M., Engel, A.K., 2012. Large-scale cortical cor-relation structure of spontaneous oscillatory activity. Nat. Neurosci. 15, 884–890.
Honey, C., Sporns, O., Cammoun, L., Gigandet, X., Thiran, J.P., Meuli, R., Hagmann, P.,2009. Predicting human resting-state functional connectivity from structural con-nectivity. Proc. Natl. Acad. Sci. 106, 2035–2040.
Honey, C.J., Thivierge, J.P., Sporns, O., 2010. Can structure predict function in the humanbrain? Neuroimage 52, 766.
Howard, M.W., Rizzuto, D.S., Caplan, J.B., Madsen, J.R., Lisman, J., Aschenbrenner-Scheibe, R., Schulze-Bonhage, A., Kahana, M.J., 2003. Gamma oscillations correlatewith working memory load in humans. Cereb. Cortex 13, 1369–1374.
Hyvarinen, A., Oja, E., 2000. Independent component analysis: algorithms and applica-tions. Neural. Netw. 13, 411–430.
Jenkinson, M., Smith, S., 2001. A global optimisation method for robust affine registra-tion of brain images. Med. Image Anal. 5, 143–156.
Jenkinson, M., Bannister, P., Brady, M., Smith, S., 2002. Improved optimization for therobust and accurate linear registration and motion correction of brain images.Neuroimage 17, 825–841.
Jensen, O., Gelfand, J., Kounios, J., Lisman, J.E., 2002. Oscillations in the alpha band(9–12 Hz) increase with memory load during retention in a short-term memorytask. Cereb. Cortex 12, 877–882.
Jurkiewicz, M.T., Gaetz, W.C., Bostan, A.C., Cheyne, D., 2006. Post-movement beta re-bound is generated in motor cortex: evidence from neuromagnetic recordings.Neuroimage 32, 1281.
Kaminski, M., Ding, M., Truccolo, W.A., Bressler, S.L., 2001. Evaluating causal relationsin neural systems: Granger causality, directed transfer function and statistical as-sessment of significance. Biol. Cybern. 85, 145–157.
Khader, P.H., Jost, K., Ranganath, C., Rosler, F., 2010. Theta and alpha oscillations duringworking-memory maintenance predict successful long-term memory encoding.Neurosci. Lett. 468, 339–343.
Kiebel, S.J., Garrido, M.I., Moran, R.J., Friston, K.J., 2008. Dynamic causal modelling forEEG and MEG. Cogn. Neurodyn. 2, 121–136.
Klimesch, W., 2006. Binding principles in the theta frequency range. In: Zimmer, H.D.,Mecklinger, A., Lindenberger, U. (Eds.), Handbook of Binding and Memory. OxfordUniversity Press, Oxford, pp. 115–144.
Lachaux, J.P., Rodriguez, E., Martinerie, J., Varela, F.J., 1999. Measuring phase synchronyin brain signals. Hum. Brain Mapp. 8, 194–208.
Lancaster, J.L., Woldorff, M.G., Parsons, L.M., Liotti, M., Freitas, C.S., Rainey, L., Kochunov,P.V., Nickerson, D., Mikiten, S.A., Fox, P.T., 2000. Automated Talairach atlas labelsfor functional brain mapping. Hum. Brain Mapp. 10, 120–131.
Larson-Prior, L.J., Power, J.D., Vincent, J.L., Nolan, T.S., Coalson, R.S., Zempel, J., Snyder,A.Z., Schlaggar, B.L., Raichle, M.E., Petersen, S.E., 2011. Modulation of the brain'sfunctional network architecture in the transition from wake to sleep. Progress inBrain Research. Elsevier, pp. 277–294. Chapter 18.
Lin, F.-H., Witzel, T., Ahlfors, S.P., Stufflebeam, S.M., Belliveau, J.W., Hamalainen, M.S.,2006. Assessing and improving the spatial accuracy in MEG source localizationby depth-weighted minimum-norm estimates. Neuroimage 31, 160–171.
Logothetis, N.K., 2008. What we can do and what we cannot do with fMRI. Nature 453,869–878.
Luckhoo, H., Hale, J., Stokes, M., Nobre, A., Morris, P., Brookes, M., Woolrich, M., 2012.Inferring task-related networks using independent component analysis in magne-toencephalography. Neuroimage 62, 530–541.
Magri, C., Schridde, U., Murayama, Y., Panzeri, S., Logothetis, N.K., 2012. The amplitudeand timing of the BOLD signal reflects the relationship between local field potentialpower at different frequencies. J. Neurosci. 32, 1395–1407.
Mantini, D., Della Penna, S., Marzetti, L., de Pasquale, F., Pizzella, V., Corbetta, M.,Romani, G.L., 2011. A signal-processing pipeline for magnetoencephalographyresting-state networks. Brain Cogn. 1, 49–59.
Marcus, D., Harwell, J., Olsen, T., Hodge, M., Glasser, M., Prior, F., Jenkinson, M.,Laumann, T., Curtiss, S., Van Essen, D., 2011. Informatics and data mining toolsand strategies for the Human Connectome Project. Front. neuroinformatics 5.
Marcus, D., Harms, M.P., Snyder, A.Z., Jenkinson, M., Wilson, J.A., Glasser, M.F., Barch,D.M., Archie, K.A., Burgess, G.C., Ramaratnam, M., Hodge, M., Horton, W., Herrick,R., Olsen, T., McKay, M., House, M., Hileman, M., Reid, E., Harwell, J., Coalson, T.S.,Schindler, J., Elam, J., Curtis, C., Van Essen, D., for the WU-Minn HCP Consortium,2013. Human Connectome Project informatics: Quality control, database services,and data visualization. NeuroImage 80, 202–219 (Special Issue “Mapping theConnectome”).
Martino, J., Honma, S.M., Findlay, A.M., Guggisberg, A.G., Owen, J.P., Kirsch, H.E., Berger,M.S., Nagarajan, S.S., 2011. Resting functional connectivity in patients with braintumors in eloquent areas. Ann. Neurol. 69, 521–532.
Marzetti, L., Della Penna, S., Snyder, A., Pizzella, V., Nolte, G., de Pasquale, F., Romani, G.,Corbetta, M., 2013. Frequency specific interactions of MEG resting state activitywithin and across brain networks as revealed by the Multivariate Interaction Mea-sure. Neuroimage 79C, 172–183.
Michalareas, G., Schoffelen, J.M., Paterson, G., Gross, J., 2012. Investigating causality be-tween interacting brain areas with multivariate autoregressive models of MEGsensor data. Hum. Brain Mapp. 34, 890–913.
Milchenko, M., Marcus, D., 2012. Obscuring surface anatomy in volumetric imagingdata. Neuroinformatics 1–11.
Miller, K., Zanos, S., Fetz, E., Den Nijs, M., Ojemann, J., 2009. Decoupling the corticalpower spectrum reveals real-time representation of individual finger movementsin humans. J. Neurosci. 29, 3132–3137.
Mitra, P.P., Pesaran, B., 1999. Analysis of dynamic brain imaging data. Biophys. J. 76, 691–708.Moosmann, M., Ritter, P., Krastel, I., Brink, A., Thees, S., Blankenburg, F., Taskin, B.,
Obrig, H., Villringer, A., 2003. Correlates of alpha rhythm in functional magneticresonance imaging and near infrared spectroscopy. Neuroimage 20, 145–158.
Muthukumaraswamy, S.D., Singh, K.D., 2011. A cautionary note on the interpretation ofphase-locking estimates with concurrent changes in power. Clin. Neurophysiol.122, 2324–2325.
Nolte, G., 2003. The magnetic lead field theorem in the quasi-static approximation andits use for magnetoencephalography forward calculation in realistic volume con-ductors. Phys. Med. Biol. 48, 3637.
Nolte, G., Bai, O., Wheaton, L., Mari, Z., Vorbach, S., Hallett, M., 2004. Identifying truebrain interaction from EEG data using the imaginary part of coherency. Clin.Neurophysiol. 115, 2292–2307.
Nolte, G., Ziehe, A., Nikulin, V.V., Schlogl, A., Kramer, N., Brismar, T., Muller, K.R., 2008.Robustly estimating the flow direction of information in complex physical systems.Phys. Rev. Lett. 100, 234101.
201L.J. Larson-Prior et al. / NeuroImage 80 (2013) 190–201
Oostenveld, R., Fries, P., Maris, E., Schoffelen, J.M., 2011. FieldTrip: open source soft-ware for advanced analysis of MEG, EEG, and invasive electrophysiological data.Comput. Intell. Neurosci. 2011, 156869.
Peelle, J.E., Davis, M.H., 2012. Neural oscillations carry speech rhythm through to com-prehension. Front. Psychol. 3.
Pfurtscheller, G., Lopes da Silva, F., 1999. Event-related EEG/MEG synchronization anddesynchronization: basic principles. Clin. Neurophysiol. 110, 1842–1857.
Pulvermueller, F., 2010. Brain embodiment of syntax and grammar: discrete combina-torial mechanisms spelt out in neuronal circuits. Brain Lang. 112, 167–179.
Renvall, H., Formisano, E., Parviainen, T., Bonte, M., Vihla, M., Salmelin, R., 2012. Para-metric merging of MEG and fMRI reveals spatiotemporal differences in corticalprocessing of spoken words and environmental sounds in background noise.Cereb. Cortex 22, 132–143.
Riera, J.J., Wan, X., Jimenez, J.C., Kawashima, R., 2006. Nonlinear local electrovascularcoupling. I: a theoretical model. Hum. Brain Mapp. 27, 896–914.
Rosa, M., Daunizeau, J., Friston, K., 2010. EEG-fMRI integration: a critical review of bio-physical modeling and data analysis approaches. J. Integr. Neurosci. 9, 453–476.
Roux, F., Wibral, M., Mohr, H.M., Singer, W., Uhlhaas, P.J., 2012. Gamma-band activity inhuman prefrontal cortex codes for the number of relevant items maintained inworking memory. J. Neurosci. 32, 12411–12420.
Rubinov, M., Sporns, O., Van Leeuwen, C., Breakspear, M., 2009. Symbiotic relationshipbetween brain structure and dynamics. BMC Neurosci. 10, 55.
Scheeringa, R., Fries, P., Petersson, K.-M., Oostenveld, R., Grothe, I., Norris, D.G., Hagoort,P., Bastiaansen, M.C.M., 2011. Neuronal dynamics underlying high- and low-frequency EEG oscillations contribute independently to the human BOLD signal.Neuron 69, 572–583.
Schoffelen, J.M., Gross, J., 2009. Source connectivity analysis with MEG and EEG. Hum.Brain Mapp. 30, 1857–1865.
Schoffelen, J.M., Oostenveld, R., Fries, P., 2005. Neuronal coherence as a mechanism ofeffective corticospinal interaction. Sci. Signal. 308, 111.
Schummers, J., Yu, H., Sur, M., 2008. Tuned responses of astrocytes and their influenceon hemodynamic signals in the visual cortex. Sci. Signal. 320, 1638.
Schwarz, A.J., Gass, N., Sartorius, A., Zheng, L., Spedding, M., Schenker, E., Risterucci, C.,Meyer-Lindenberg, A., Weber-Fahr, W., 2013. The low-frequency BOLD functionalconnectivity signature of the hippocampal-prefrontal network in the rat brain.Neuroscience 228, 243–258.
Sekihara, K., Owen, J.P., Trisno, S., Nagarajan, S.S., 2011. Removal of spurious coher-ence in MEG source-space coherence analysis. IEEE Trans. Biomed. Eng. 58,3121–3129.
Singer, W., 1993. Synchronization of cortical activity and its putative role in informa-tion processing and learning. Annu. Rev. Physiol. 55, 349–374.
Skudlarski, P., Jagannathan, K., Calhoun, V.D., Hampson, M., Skudlarska, B.A., Pearlson,G., 2008. Measuring brain connectivity: diffusion tensor imaging validates restingstate temporal correlations. Neuroimage 43, 554–561.
Smith, S.M., Fox, P.T., Miller, K.L., Glahn, D.C., Fox, P.M., Mackay, C.E., Filippini, N.,Watkins, K.E., Toro, R., Laird, A.R., 2009. Correspondence of the brain's functionalarchitecture during activation and rest. Proc. Natl. Acad. Sci. 106, 13040–13045.
Snyder, A.Z., Raichle, M.E., 2010. Studies of the human brain combining functional neu-roimaging and electrophysiological methods: Simultaneous EEG and fMRI: Record-ing, Analysis, and Application: Recording, Analysis, and Application, 47.
Sotero, R.C., Trujillo-Barreto, N.J., 2008. Biophysical model for integrating neuronal ac-tivity, EEG, fMRI and metabolism. Neuroimage 39, 290–309.
Sporns, O., 2011. The human connectome: a complex network. Ann. N. Y. Acad. Sci.1224, 109–125.
Sporns, O., Tononi, G., Kötter, R., 2005. The human connectome: a structural descriptionof the human brain. PLoS Comput. Biol. 1, e42.
Stanley, G.B., 2013. Reading and writing the neural code. Nat. Neurosci. 16, 259–263.Uğurbil, K., Xu, J., Auerbach, E.J., Moeller, S., Vu, A.T., Duarte-Carvajalino, J.M., Lenglet,
C., Wu, X., Schmitter, S., Van de Moortele, P.F., Strupp, J., Sapiro, G., De Martino,F., Wang, D., Harel, N., Garwood, M., Chen, L., Feinberg, D.A., Smith, S.M., Miller,K.L., Sotiropoulos, S.N., Jbabdi, S., Andersson, J.L.R., Behrens, T.E.J., Glasser, M.F.,Van Essen, D.C., Yacoub, E., for the WU-Minn HCP Consortium, 2013. Pushing spa-tial and temporal resolution for functional and diffusion MRI in the HumanConnectome Project. NeuroImage 80, 80–104 (Special Issue “Mapping theConnectome”).
Van Essen, D.C., Ugurbil, K., Auerbach, E., Barch, D., Behrens, T.E.J., Bucholz, R., Chang, A.,Chen, L., Corbetta, M., Curtiss, S.W., Della Penna, S., Feinberg, D., Glasser, M.F.,Harel, N., Heath, A.C., Larson-Prior, L., Marcus, D., Michalareas, G., Moeller, S.,Oostenveld, R., Petersen, S.E., Prior, F., Schlaggar, B.L., Smith, S.M., Snyder, A.Z.,Xu, J., Yacoub, E., 2012. The Human Connectome Project: a data acquisition per-spective. Neuroimage 62, 2222–2231.
Van Essen, D.C., Smith, S.M., Barch, D.M., Behrens, T.E.J., Yacoub, E., Ugurbil, K., forthe WU-Minn HCP Consortium, 2013. The WU-Minn Human ConnectomeProject: An Overview. NeuroImage 80, 62–79 (Special Issue “Mapping theConnectome”).
Van Veen, B.D., van Drongelen, W., Yuchtman, M., Suzuki, A., 1997. Localization of brainelectrical activity via linearly constrained minimum variance spatial filtering. IEEETrans. Biomed. Eng. 44, 867–880.
Van't Ent, D., Van Soelen, I.L., Stam, K.J., De Geus, E.J., Boomsma, D.I., 2010. Genetic in-fluence demonstrated for MEG‐recorded somatosensory evoked responses. Psy-chophysiology 47, 1040–1046.
Varela, F., Lachaux, J.P., Rodriguez, E., Martinerie, J., 2001. The brainweb: phase syn-chronization and large-scale integration. Nat. Rev. Neurosci. 2, 229–239.
Vincent, J.L., Patel, G.H., Fox, M.D., Snyder, A.Z., Baker, J.T., Van Essen, D.C., Zempel, J.M.,Snyder, L.H., Corbetta, M., Raichle, M.E., 2007. Intrinsic functional architecture inthe anaesthetized monkey brain. Nature 447, 83–86.
Wibral, M., Rahm, B., Rieder, M., Lindner, M., Vicente, R., Kaiser, J., 2011. Transfer entro-py in magnetoencephalographic data: quantifying information flow in cortical andcerebellar networks. Prog. Biophys. Mol. Biol. 105, 80–97.
Winter, W.R., Nunez, P.L., Ding, J., Srinivasan, R., 2007. Comparison of the effect of vol-ume conduction on EEG coherence with the effect of field spread on MEG coher-ence. Stat. Med. 26, 3946–3957.
Xiang, J., Liu, Y., Wang, Y., Kotecha, R., Kirtman, E.G., Chen, Y., Huo, X., Fujiwara, H.,Hemasilpin, N., deGrauw, T., 2009. Neuromagnetic correlates of developmentalchanges in endogenous high-frequency brain oscillations in children: a wavelet-based beamformer study. Brain Res 1274, 28–39.
Yuan, H., Liu, T., Szarkowski, R., Rios, C., Ashe, J., He, B., 2010. Negative covariation be-tween task-related responses in alpha/beta-band activity and BOLD in human sen-sorimotor cortex: an EEG and fMRI study of motor imagery and movements.Neuroimage 49, 2596.


