Embed Size (px)
Citation preview

Session 1 1 Explain the difference between accounting, an account, and accountability.
Accounting is a collection of systems and processes used to record, report and interpret business transactions. An account is an explanation or report in financial terms about those transactions. Accountability arises from the stewardship function, that managers have to provide an account to other stakeholders in the business.
2 Summarise the main activities of management accountants.
The main activities of management accountants includes participation in planning, primarily through budgets; generating, analysing, presenting and interpreting information to support decision-making, and monitoring and controlling performance.
3 Explain how the role of management accounting has changed over the last few decades.
The origin of management accounting was cost accounting in factories, where accountants were close to the business and advised non-financial managers. Management accountants have advised on economies of scale as well as of scope as businesses grew and diversified as divisionalization, conglomerates and multinational organizations increased the demand for accounting information. Non-financial performance information has come to challenge management accounting information. Although new techniques have been developed, new manufacturing technologies and the growth of service industries has not been matched by the changing role of management accountants. Management accounting is increasingly decentred in organizations, with IT carrying out the bulk of routine transaction processing. Organizations are increasingly looking for management accountants to use their financial expertise to contribute to strategy formulation and implementation.
4 Explain the idea of value-based management and how shareholder value relates to the interaction between product and capital markets.
Value-based management uses a variety of techniques to measure increases in shareholder value, which is assumed to be the primary goal of all business organizations. Shareholder value refers to the economic value of an investment by discounting future cash flows to their present value using the cost of capital for the business. To achieve shareholder value, a business must generate profits in their markets for goods and services (product markets) that exceed the cost of capital (the weighted average cost of equity and borrowings) in the capital market.
5 Explain the key issues in corporate governance as they relate to accounting.

The responsibilities of the Board include setting the company’s strategic goals, providing leadership to senior management, monitoring business performance and reporting to shareholders. The last two of these explicitly relate to accounting, and the first two implicitly do so. In the UK the Combined Code and in the US the Sarbanes-Oxley Act include important responsibilities of the Board in relation to financial statements and performance management. The role of a Board is to provide leadership of the company within a framework of prudent and effective controls which enables risk to be assessed and managed. These controls include many accounting controls including budgets, capital expenditure evaluations, etc. The financial reports of a company are the responsibility of the Board which must ensure that the company keeps proper accounting records which disclose with reasonable accuracy the financial position of the company at any time and ensure that financial reports comply with the Companies Act. The Board is also responsible for safeguarding the company’s assets and for taking reasonable steps to prevent and detect fraud.
6 Explain the key differences between a shareholder value and a stakeholder approach to the accountability of organisation.
Accountability of a board tends to be exclusively towards shareholders as they are the owners of the company and they appoint the board. Recently, and driven to a large extent by the increased size of the largest companies in the world, with the resulting increase in relevance to society as a whole, there has been a drive for boards to be accountable to all stakeholders. This is driven by stakeholder theory. Shareholders continue nevertheless to be the most important of the stakeholder groups and there is an argument that what is best for shareholders (as high as possible returns, which requires long term good performance) can only be achieved by ensuring all stakeholders are looked after and therefore being accountable and delivering to shareholders means the board is being accountable and delivering for all stakeholders.
Session 2 1 An accounting system comprises accounts that can be grouped into:
a) income, expenses, and profitb) balance sheet, profit and cash flowc) assets, liabilities, income and expensesd) profit, capital, assets and cash flow
2 A transaction to record the sale of goods on credit would involve a double entry for the sales value to the following accounts:a) increase sales and reduce inventoryb) increase sales and increase inventoryc) increase creditors and increase salesd) increase debtors and increase sales

Don’t forget that a sale of goods implies two entries, the first one being the one in bold and the second being an increase in expenses and a reduction in inventory. Answer a, which some of you probably thought about is half of each of the entries that need to be made. Don’t forget also that sales is accounted for at the sale price while the cost of sales is accounted for at the price originally paid for the stick when it was bought.
3 A retail business has sales of £100,000 cost of goods sold of £35,000 salaries of £15,000 rental of £4,000 and advertising of £8,000. All of the income and expenses have been paid out of the owner’s initial capital of £25,000. In addition, the business paid cash of £30,000 for stock (which remains unsold) and purchased equipment on credit for £20,000. The financial statements of the business would show:
a) Profit of £38,000 cash of £13,000 and capital of £25,000b) Profit of £38,000 cash of £33,000 and capital of £63,000c) Profit of £65,000 cash of £3,000 and capital of £38,000d) Profit of £63,000 cash of £33,000 and capital of £38,000
Profit Sales 100,000Cost of sales -35,000Salaries -15,000Rent - 4,000Advertising - 8,000
£38,000
Cash Capital £25,000Plus profit 38,000- Inventory -30,000
£33,000
Capital Initial £25,000Plus profit 38,000
£63,000
Assets Cash 33,000 + Equipment 20,000 + Inventory 30,000 = 83,000LiabilitiesCreditors (Equipment) 20,000 + Capital 63,000 = 83,000
Note: please note that in the Q3 of the book, the £40,000 figure indicated for stock is the total, not the unsold stock as in the version on the file uploaded on Moodle, thus the different accounting treatment.
4 A Balance Sheet shows liabilities of £125,000 and assets of £240,000. The Income Statement shows income of £80,000 and expenses of £35,000. Capital is:
a) £45,000
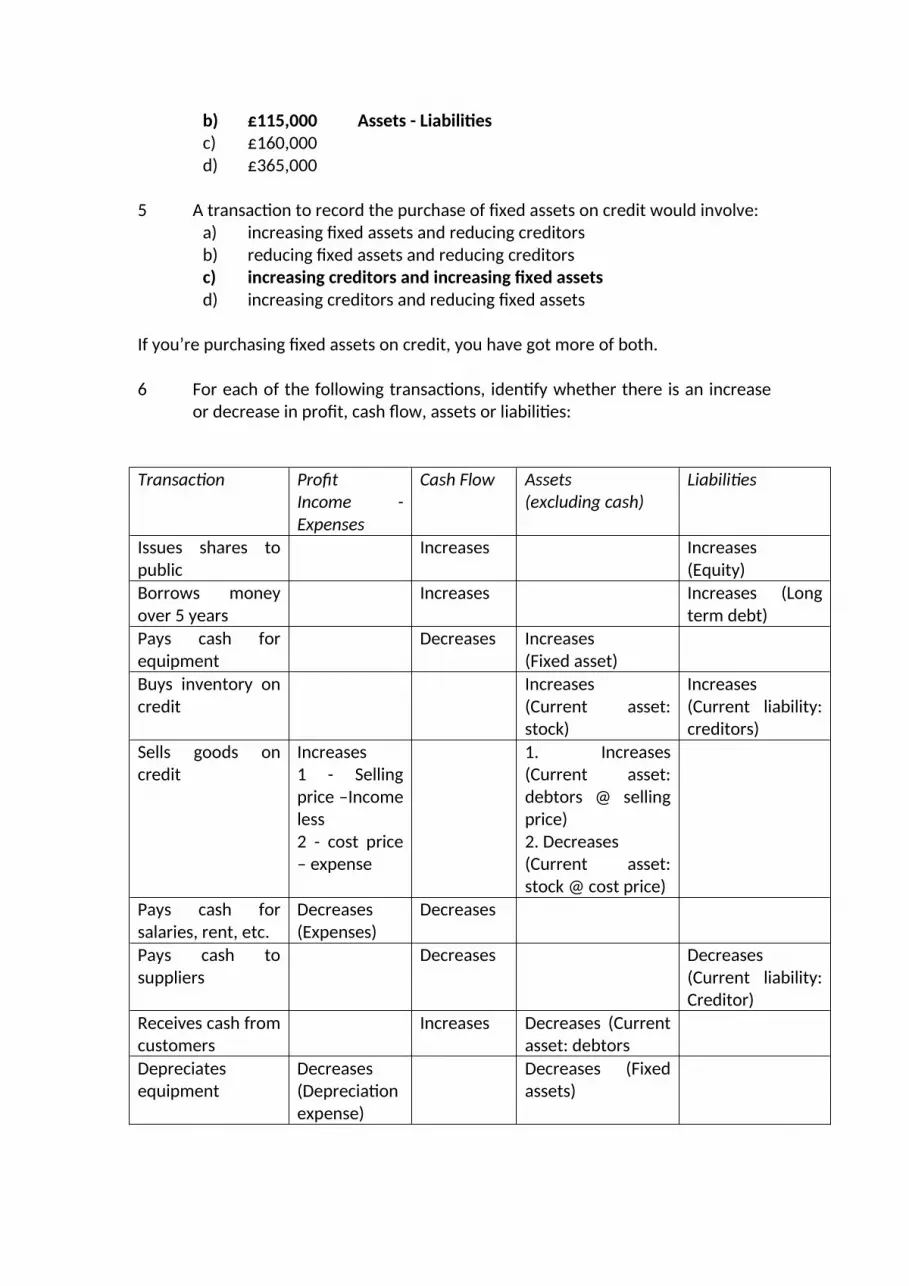
b) £115,000 Assets - Liabilitiesc) £160,000d) £365,000
5 A transaction to record the purchase of fixed assets on credit would involve:a) increasing fixed assets and reducing creditorsb) reducing fixed assets and reducing creditorsc) increasing creditors and increasing fixed assetsd) increasing creditors and reducing fixed assets
If you’re purchasing fixed assets on credit, you have got more of both.
6 For each of the following transactions, identify whether there is an increase or decrease in profit, cash flow, assets or liabilities:
Transaction ProfitIncome - Expenses
Cash Flow Assets(excluding cash)
Liabilities
Issues shares to public
Increases Increases(Equity)
Borrows money over 5 years
Increases Increases (Long term debt)
Pays cash for equipment
Decreases Increases(Fixed asset)
Buys inventory on credit
Increases(Current asset: stock)
Increases(Current liability: creditors)
Sells goods on credit
Increases1 - Selling price –Income less2 - cost price – expense
1. Increases (Current asset: debtors @ selling price)2. Decreases(Current asset: stock @ cost price)
Pays cash for salaries, rent, etc.
Decreases(Expenses)
Decreases
Pays cash to suppliers
Decreases Decreases (Current liability: Creditor)
Receives cash from customers
Increases Decreases (Current asset: debtors
Depreciates equipment
Decreases (Depreciation expense)
Decreases (Fixed assets)

7 The following balances are shown in alphabetical order in a professional service firm’s ledger at the end of a financial year:
Advertising 15,000Bank 5,000Capital 71,000Creditors 11,000Debtors 12,000Fixed assets 100,000Income 135,000Rent 10,000Salaries 75,000
Calculatea. the profit for the yearb. the capital at the end of the year
Profit Income 135,000Advertising 15,000Rent 10,000Salaries 75,000 100,000Profit 35,000
Balance Sheet Fixed assets 100,000Debtors 12,000Bank 5,000
117,000Creditors 11,000Capital 106,000
Opening capital 71,000Plus profit 35,000
106,000
8 Explain (with reasons) whether managers are included as users of financial statements.
Users of financial statements are defined by the Framework for the Preparation and Presentation of Financial Statements as investors, employees, lenders, suppliers and trade creditors, customers, government and the public. Management is not defined as a user because management has the ability to determine the form and content of the information it needs. The reporting of information to meet the needs of management is beyond the scope of the Framework.
Managers are internal users of accounting information, who will use information from the management accounting system.

9 The cost of sales is:a) The cost of providing a service; b) The cost of buying goods sold by a retailer; c) The cost of production for a manufacturer;d) All of the above (Exactly the same concept for different types of companies)
10 Operating profit is the same as:a) Operating profitb) EBIT (Earnings before interest and taxes)c) PBIT (Profit before interest and taxes)d) All of the above (Simply different names for the same calculation)
11 Inventory is an example of:a) a fixed assetb) a current assetc) a current liability d) a long term debt
12 If a business has fixed assets of £750,000 working capital of £150,000 and long term debt of £300,000 its shareholders’ funds can be calculated as:
a) £1,200,000b) £1,050,000c) £900,000d) £600,000 (Fixed Assets + Working Capital - LTD)
13 A business has agreed to undertake an advertising campaign that will cost £240,000 to be carried out equally over the financial year beginning 1 st
January. Half of the annual cost is to be paid six-monthly in advance on the first days of January and July. At 31st March the financial statements would show:
a) an expense of £120,000 and an accrual of £120,000b) an expense of £60,000 and a prepayment of £60,000c) an expense of £120,000 and a prepayment of £120,000d) an expense of £60,000 and an accrual of £60,000
Matching Principle is key in answering this question, i.e. you should match the action with the accounting of the action. The monthly cost of advertising is £20,000 (£240,000/12). At 31st March £120,000 has been paid in advance (a prepayment on 1st January) but this has been reduced by 3 months expenditure of £20,000 a total of £60,000. The balance of £60,000 paid in advance for the period April to June remains a prepayment.
14 Virko PLC buys a new computer system for £180,000 on 1st January. It expects the system to last for four years. If the company’s financial year is from 1 st
January to 31st December, the value of the computer system in Virko’s Balance Sheet at 31st December of the same year will be:

a) £180,000b) £135,000c) £90,000d) £45,000
Depreciation of £180,000 over 4 years is £45,000 per annum. At the end of the year the asset will be valued at £180,000 - £45,000 = £135,000.
15 Thomas Investments has an operating profit for the year of £185,000. An examination of the Income Statement and Balance Sheet shows that depreciation was £65,000 taxation was £40,000 new capital investment was £100,000 and repayment of borrowings was £65,000. The change in cash over the period was:
a) an increase of £45,000b) a decrease of £85,000c) a decrease of £20,000d) an increase of £120,000
Operating profit 185,000+ Depreciation 65,000 A non-cash expense previously
deducted from profit250,000
Less Taxation 40,000Capital 100,000Borrowings 65,000 205,000
Increase in cash 45,000
16 The amounts shown as taxation and dividends in the Income Statement and cash Flow Statement:
a) are always the sameb) are different because of the timings of cash inflowsc) are different because they are prepaymentsd) are different because of the timings of cash outflows
Amounts for these two elements in the Income Statement refer to the amounts calculated (taxation) or proposed (dividends) relative to the year to which the Financial Statements refer to. Payments (outflows) of either of these will take place in the subsequent year, so the amounts showing in the Cash Flow Statement will be the actual amounts paid during the year to which the Financial Statements, which are relative to the previous year.
17 A company pays its insurance policy for the calendar year of £78,000 on 1 st
January. On 31st March, what is the impact on the Income Statement, Balance Sheet and Cash Flow?
£78,000 / 12 = £6,500 per monthAt 31st March, expense of £6,500 x 3 = £19,500

Prepayment (Current asset) is £6,500 x 9 = £58,500Cash has reduced by £78,000
18 A company incurs gas costs for heating of £12,000 per year, although three-quarters of the annual cost is incurred between January and June. Bills are received quarterly at the end of March, June, September & December and paid two weeks later. What is the accrual at the end of June and where does this appear in the financial statements?
Average cost is £12,000 / 12 = £1,000 per month BUT effect of timing!January – June ¾ of £12,000 = £9,000 / 6 = £1,500 per monthAccrual is £1,500 x 3 = £4,500 – expense and accrual, as it won’t be paid until two weeks into July. It will show as a current liability, as this amount is owed to a third party.
19 A company has bought a new computer system for cash at the beginning of its financial year at a cost of £30,000. It is expected to last 4 years with no value at the end of that period. What is the impact on the Income Statement, Balance Sheet and Cash Flow at the end of the year?
Depreciation is £30,000 / 4 = £7,500 per annum – expense in Income StatementCash flow is negative by £30,000 (purchase price)Balance Sheet shows asset cost of £30,000 less depreciation of £7,500 = £22,500 net (book value or written down value).
20 Regal Farms Ltd has sales of £2.5 million, a gross profit of £1.7 million and expenses of £800,000. Regal has paid interest of £72,000 and has to provide for Corporations Tax of £310,000 and dividends of £300,000. Calculate the EBIT, profit after tax and retained profits for the year.
Sales 2,500,000Gross profit 1,700,000Expenses 800,000EBIT 900,000Interest 72,000Profit before tax 828,000Income tax 310,000Profit after tax 518,000Dividends _ 300,000Retained profits 218,000
21 A professional services firm has income of £1,750,000. It incurs salaries of £1.6 million of which 60% is allocated as a cost of sales and the balance as selling and administration. The only other cost charged to cost of sales is travelling of £50,000. Other administration costs are £80,000. Calculate the gross profit and net profit.

Sales 1,750,000Cost of sales
60% of 1,600,000 960,000Travel 50,000
1,010,000Gross profit 740,000Salaries 40% of 1,600,000 640,000Other administration costs 80,000
720,000Net profit 20,000
22 On 1st January, QRS Ltd is formed with capital of £250,000, all of which is held in the company’s bank account. On the same day, QRS purchases an existing business from Taylor plc for £400,000. An independent valuer has valued the assets as follows:Plant & Equipment £100,000Trade receivables £ 50,000Inventory £ 75,000
QRS funds the acquisition by a long-term borrowing of £150,000 and using its available cash. a. Show the Balance Sheet of QRS after these transactions have taken place.
Fixed assetsGoodwill 175,000Plant & Equipment 100,000
275,000Current assets
Bank -Debtors 50,000Inventory 75,000
125,000Total assets 400,000Long term debt 150,000-
Equity 250,000
b. If QRS wishes to amortise its goodwill over 10 years, how will goodwill appear in the Balance Sheet at the end of the first year?
Amortise £175,000 / 10 = £17,500 p.a.At end of year 1, Balance Sheet shows:
Goodwill 175,000Less provision for amortization 17,500
157,500

Session 3 1. National Retail Stores has identified the following data from its accounting
records for the year ended 31st December: sales £1,100,000; purchases £650,000; expenses £275,000. It had an opening stock of £150,000 and a closing stock of £200,000. Based on this information, the gross profit and operating profit/loss is:
a) a gross profit of £450,000 and an operating profit of £185,000b) a gross profit of £500,000 and an operating profit of £225,000c) a gross profit of £400,000 and an operating profit of £125,000d) a gross profit of £500,000 and an operating loss of £185,000
Sales 1,100,000Less cost of salesOpening stock 150,000Purchases 650,000
800,000- Closing stock 200,000Cost of sales 600,000Gross profit 500,000- Expenses 275,000Operating profit 225,000
2 Opening stock is £350,000. Closing stock is £325,000. Purchases are £650,000. Sales are £1,000,000. The cost of sales is:a) £350,000b) £625,000c) £650,000d) £675,000
Sales 1,000,000Op stock 350,000Purchases 650,000
1,000,000Cl stock 325,000Cost of sales 675,000GP 325,000
3 In a retail organization, sales:a) increase inventory and increase cost of salesb) increase inventory and decrease cost of salesc) decrease inventory and decrease cost of salesd) decrease inventory and increase cost of sales
Use the following information for Questions 4 & 5 Premium Products purchases inventory during the month of April as follows:

On 25th April, 3,000 units are sold.
4 Using the information provided above, calculate the cost of sales and inventory value using the weighted average method.
Cost of Sales = (2,500*12 + 1,500*11.50 + 1,000 * 11) / 5,000 * 3,000 = 34,950Inventory Value = (2,500*12 + 1,500*11.50 + 1,000 * 11) / 5,000 * 2,000 = 23,300
5 Using the information provided above, calculate the cost of sales and inventory value using the FIFO method.
Cost of Sales = 2,500*12 + 500*11.50 = 35,750Inventory Value = 1,000*11.50 + 1,000*11 = 22,500
6 The Big Table Co. Produced a batch of 20 tables during June on Job 2487. The following materials were issued to Job 2487:
20 hours of labour were charged to the job. The labour cost is £20 per hour. Overhead is charged to jobs on the basis of £20 per labour hour.After Job 2487 was completed and placed into finished goods inventory, 15 tables were sold at a unit price of £450.Calculate: The total job cost and the cost per table
Total Job Cost = 100*12 + 70*20 + 15*35 + 20*40 = 3,925Cost per table = 3,925 / 20 = 196.25
The cost of sales
Cost of Sales = 196.25 * 15 = 2,943.75
The value of inventory
Cost of Sales = 196.25 * 5 = 981.25
The gross profit for the tables that were sold
Gross profit = 450 * 15 - 2,943.75 = 3,806.25Summarising in a single table:

Units Unit cost Total costPlastic 100 12 1,200Timber 70 20 1,400Metal 15 35 525
3,125Labour 20 20 400Overhead 20 20 400Total job cost 3,925Cost per table 20 196.25
Cost of sales 15 2,943.75
Inventory 5 981.25
Sales 15 450 6,750.00Cost of sales 2,943.75Gross profit 3,806.25
7 The Massive Mining Co refines iron ore for export markets. The following data relates to the company’s mine for the month of April:
25,000 units of work in process existed at 1st April, the costs for which were:Direct materials £18,500Conversion £36,750
35,000 units commenced production during April. The costs incurred during the month for refining were:
Direct material £300,000 Conversion £230,000
The closing work in progress at 30th April was 15000 units. Materials were added at the beginning of the refining process and conversion was 1/3 rd complete at month end.
a. Calculate the cost per equivalent unit for the month of April using the weighted average method of process costing.
b. Calculate the value of work in progress and the value of completed stock transferred to finished goods during the month
See last page.

8 The Gargantuan Company has the following transactions during December. Prepare a combined cost of goods sold and Income Statement showing all these transactions and identify the value of inventory to be included in the Balance Sheet at the end of December.
Inventory 1 December 120,000Rental 30,000Salaries & Wages 45,000Sales 435,000Depreciation 12,000Inventory 31 December 150,000Marketing expenses 15,000Gross profit 165,000
Sales 435,000Opening stock 120,000Purchases 300,000
420,000Closing stock 150,000 270,000Gross profit 165,000Rental 30,000Salaries & wages 45,000Depreciation 12,000Marketing expenses 15,000 102,000Net profit 63,000
Inventory in Balance Sheet = 150,000
Solution Exercise 7:
UnitsOpening WIP 25,000Units commenced 35,000
60,000Closing WIP 15,000 33.3% complete as to conversionCompleted 45,000
Cost per unit:Opening WIP £
Cost for month £
Total £ Completed units
WIP Equivalent units
Total equivalent units
Cost per equivalent unit £
Material 18,500 300,000 318,500 45,000 15,000 60,000 £5.31Conversion 36,750 230,000 266,750 45,000 5,000 50,000 £5.34Total £55,250 530,000 £585,250 £10.65
(150,000 + (435,000 - 165,000) - 120,000)

Work in progress:Materials 15,000 @ £5.31 £79,650Conversion 5,000 @ £5.34 £26,700
£106,350
Finished goods:45,000 units @ £10.65 £479,250Total costs £585,600 Rounding differences ignore
Sessions 4 and 5 1 XYZ Ltd’s Income Statement shows the following:
2006 2005Sales 1,250,000 1,175,000Cost of sales 787,000 715,000Selling & Admin. Expenses 324,000 323,000
Based on these figures, which of the following statements is true:a) Sales, cost of sales and expenses have all increased, therefore operating
profit, gross margin and operating margin have all increasedb) Although the operating profit has decreased, the operating margin has
increased as a result of sales growth and an increase in gross profitc) The operating profit has decreased due to lower gross margins and
higher expenses, despite sales growthd) Although the operating profit has increased, the operating margin has
decreased as a result of a reduction in the gross margin and higher expenses, despite sales growth
Although the operating profit has increased, the operating margin has decreased as a result of a reduction in the gross margin and higher expenses, despite sales growth
Although the operating profit has increased (from £137,000 to £139,000), the operating margin has decreased (from 11.6% to 11.1%) as a result of a reduction in the gross margin (from 39% to 37%) and higher expenses (from £323,000 to £324,000), despite sales growth (of 6.4%).
Please use the following financial information for Monitor Services PLC to answer Questions 2 & 3: INCOME STATEMENT FOR THE YEAR ENDED 31st MARCH
2008 2007
£'000 £'000REVENUE 227,138 227,778OPERATING PROFIT 54,094 38,507PROFIT ON ORDINARY ACTIVITIES BEFORE TAXATION
54,616 38,205
BALANCE SHEET AS AT 31 MARCH 2008 2007

£'000 £'000NON-CURRENT ASSETSTangible fixed assets 88,720 77,934
CURRENT ASSETSTrade receivables 134,860 107,612Cash at bank 90 4,205
134,950 111,817TOTAL ASSETS 223,670 189,751
NON-CURRENT LIABILITIESLoans after one year 2,088 12,264
CURRENT LIABILITIESTrade payables 127,799 94,301 TOTAL LIABILITIES 129,887 106,565
NET ASSETS 93,783 83,186
SHAREHOLDERS' FUNDS 93,783 83,186
2 Using the above information for Monitor Services PLC, the Return on Capital Employed a) has improved from 40.3% to 56.4%b) has worsened from 56.4% to 40.3%c) has improved from 46.3% to 57.6%d) has worsened from 57.6% to 40.3%
Total capital employed = shareholders’ funds plus long term debtPBIT
Shareholders' funds + Long term debt
2008 2007
54,094 = 56.4% 38,507 = 40.3%95,871 95,450
3 In reviewing liquidity and gearing ratios for Monitor Services PLC, we can say thata) long term debt has increased as a proportion of total capital employed,
and liquidity has improved due to the decrease in current liabilitiesb) long term debt has reduced as a proportion of total capital employed,
and liquidity has declined due to the increase in current liabilitiesc) long term debt has increased as a proportion of total capital employed,
and liquidity has worsened due to the increase in current liabilitiesd) long term debt has reduced as a proportion of total capital employed,
and liquidity has improved due to the decrease in current liabilities

Liquidity is current assets/current liabilities (i.e. creditors)2008 2007Liquidity134,950 = 1.06 111,817 = 1.18127,799 94,301
Gearing is long term debtshareholders funds plus long term debt
Gearing2,088 = 2.2% 12,264 = 12.8%95,871 95,450Therefore, long term debt has reduced as a proportion of total capital employed, and liquidity has declined due to the increase in current liabilities (relative to the increase in current assets).
4 Tubular Steel has 1 million shares issued that have a market price of £5.00 each. After tax profits are £350,000 and the dividend paid is 25p per share.
a) Dividend payout ratio is 71.4%b) Earnings per share are 35 pencec) Price/earnings ratio is 14.3d) All of the above
Dividend paid is 25p x 1 million = £250,000Dividend payout ratio = dividend paid/after tax profits = 250,000/350,000 = 71.4%Earnings per share = after tax profits/number of shares = 350,000/1 million = 35 penceP/E ratio = market value/EPS = 5.00/.35 = 14.3
5 When considering the working capital ratio for a company with inventory, the acid test ratio will:
a) always be betterb) always be worsec) always be the samed) may be better or worse
As current assets will be reduced by the value of inventory
6 If ROCE declines from 12% to 10% from one year to the next and shareholders’ funds have remained constant, it is most likely because:
a) PBIT is higher and/or long-term debt is lowerb) PBIT is lower and/or long-term debt is lowerc) PBIT is lower and/or long-term debt is higher - although b and d are
also possibled) PBIT is higher and/or long-term debt is higher

7 Sales have increased since the previous year and the gross profit to sales ratio has increased but the operating profit to sales ratio has fallen. This is most likely because
a) expenses have increasedb) taxes are higherc) selling price is lowerd) cost of sales have not been effectively controlled
8 Risk is highest when:a) gearing ratio is lower and interest cover ratio is lowerb) gearing ratio is higher and the interest cover ratio is higherc) gearing ratio is lower and interest cover ratio is higherd) gearing ratio is higher and the interest cover ratio is lower
9 The asset turnover ratio represents:a) how long assets are kept before they are soldb) the efficiency of use of assets to generate salesc) new capital expenditured) the period over which assets are depreciated
10 Brigand Ltd has 2 million shares issued with a market price of £2.50 each. The company wants to pay a dividend of 60% of its after-tax profits of £1,750,000. The dividend yield would bea) 60%b) 52.5%c) 25%d) 21%
1,750,000 x 60% = dividend of £1,050,000/2,000,000 shares = 52.5 pence per shareDividend yield = .525/2.50 = 21%
11 The financial statements of Voyager Productions Ltd are shown below:Income Statementfor the year ended 31st DecemberIn £Mill 2008 2007Turnover 141.1 138.4Cost of sales -58.9 -54.9Gross profit 82.2 83.5Selling & administrative costs -55.0 -54.0Operating profit 27.2 29.5Interest payable -6.1 -7.5Profit before tax 21.1 22.0Tax on profit -7.3 -5.7Profit after tax 13.8 16.3Dividends -8.0 -8.0Retained profit 5.8 8.3

Balance Sheetas at 31st DecemberIn £Mill 2008 2007Non-current assets Tangible assets 266.7 265.3
Current assets Inventory 5.3 5.8 Trade Receivables 15.7 20.9 Other Receivables & Prepayments 2.4 2.0 Bank 4.9 6.3
28.3 35.0Total Assets 295.0 300.3
Non-current liabilitiesLoans falling due after one year 96.7 146.1Current liabilitiesTrade payables 66.8 27.6Total liabilities 163.5 173.7
Net assets 131.5 126.6
EquityCapital and reservesShare capital 81.9 82.8Retained profits 49.6 43.8Shareholders’ funds 131.5 126.6Calculate the following ratios:
o Return on investment (ROI)o Return on capital employed (ROCE)o Operating margin o Gross margino Sales growtho Working capital to saleso Gearingo Asset turnover
2008 2007Return on (shareholders’) investment/equity (ROI/ROE)net profit after tax 13.8 = 10.5% 16.3 = 12.9%shareholders’ funds 131.5 126.6
Return on capital employed (ROCE)profit before interest & tax 27.2 / (131.5+96.7)=11.9% 29.5 / (126.6+146.1)=10.8%S’h funds + long term debt

Operating margin (profit/sales)profit before interest & tax 27.2 = 19.3% 29.5 = 21.3%sales 141.1 138.4
Gross marginGross profit 82.2 = 58.2% 83.5 = 60.3%Sales 141.1 138.4
Sales growthSales year 2 – Sales year 1 141.1-138.4=2.7 = +1.95%Sales year 1 138.4
Working capital/salesWorking capital -38.5 = -27.3% 7.4 = 5.3%sales 141.1 138.4
Gearing ratiolong term debt 96.7 = 42.4% 146.1 = 53.6%s’h funds + long term debt 131.5+96.7=228.2 126.6+146.1=272.7
Asset turnoversales 141.1 = 47.8% 138.4 =
46.1%total assets 266.7+28.3=295 265.3+35=300.3
12 Fortune Stationers is open 250 days each year and achieved sales of £9 million with a gross profit of 60% of sales. At the end of the year, Fortune’s Balance Sheet showed
Debtors 1,200,000Stock 450,000Creditors 1,400,000
Calculate the days’ sales outstanding, stock turn, days’ stock held and days’ purchases outstanding.
Average daily sales is 9,000,000/250 = £36,000Days’ sales outstanding = 1,200,000/36,000 = 33.33 days
Cost of sales is 40% of 9,000,000 = £3,600,000Stock turn is Cost of sales/ stock = 3,600,000/450,000 = 8Days’ stock held is 250/8 = 31.25 days
Average daily purchases is 3,600,000/250 = 14,400Days’ purchases outstanding = 1,400,000/14,400 = 97.2 days

13 Tamalan plc is a retail chain with 160 stores and 14,000 employees. Its financial statements for 2008 are shown below:
Income Statement 2008 2007£m £m
Turnover 1,021.5 847.4Cost of sales -855.3 -710.4Gross profit 166.2 137.0Administrative expenses -47.9 -29.1Operating profit 118.3 107.9Net interest payable -0.9 -0.3Profit on ordinary activities before taxation 117.4 107.6Taxation -30.7 -33.5Profit on ordinary activities after taxation 86.7 74.1Dividends -33.3 -29.3Profit retained for the period 53.4 44.8
Additional information:Earnings per share 21.3p 18.4pThere are 440 million shares issued of 10p eachMarket value of shares £1.50 £1.40
Balance Sheet 2008 2007£m £m
Fixed assets Intangible assets - goodwill 37.3 32.3 Tangible assets 167.6 132.3 Investments 22.5 25.7
227.4 190.3Current assets Inventory 135.0 105.3 Trade Receivables 22.5 20.8 Cash at bank 16.2 17.8
173.7 143.9Total assets 401.1 334.2
Non-current liabilitiesLong term loans 14.8 13.4Provision for deferred taxation 9.5 7.6
24.3 21.0Current liabilitiesTrade payables 159.8 149.6
Total liabilities 184.1 170.6
Net assets 217.0 163.6

EquityShare capital 44.0 44.0Profit and loss account 173.0 119.6Shareholders' funds 217.0 163.6
Calculate sufficient ratios for both 2008 and 2007 to demonstrate the changes in profitability, liquidity, efficiency, gearing and shareholder return of Tamalan plc and comment on the most important changes between 2008 and 2007.
Ratios:2008 2007
Sales growth 20.5% ((1021.5-847.4)/847.4)Gross profit/sales 16.3% (166.2/1021.5) 16.2%Expenses growth 64.6% ((47.9-29.1)/29.1)Operating profit/sales 11.6% (118.3/1021.5) 12.7%ROCE 51.0% (118.3/(217+14.8)) 61.0%ROI 40.0% (86.7/217) 45.3%Interest cover 131.4x (118.3/0.9) 360xDividend per share 0.0757 or 7.57p (33.3/440) 0.0660Dividend payout ratio 38.4% (33.3/86.7) 39.5%Dividend yield 5.0% (0.0757/1.5) 4.7%
Asset turnover 254.7% (1021.5/401.1) 253.6%Stock Turn/Days 6.3x/57.6days (135/855.3*365) 6.7x/54.1daysDSO 8days (22.5/1021.5*365) 9daysWorking capital/Current 1.09 (173.7/159.8) 0.96Acid test 0.24 ((173.7-135)/159.8) 0.26Days purchases 68.2days (159.8/855.3*365) 76.9Cash Conversion (WC) Cycle -2.6 (57.6+8-68.2) -13.8Gearing 6.8% (14.8/217) 8.2%P/E Ratio 7.0 (1.5/.213) 7.6
Main comments: High sales growth with margin retained but large expense increase and reduced
rate of operating profit Significantly lower ROCE and ROI due largely to increase in shareholders’ funds
(retained profits) Virtually no borrowings so very low gearing and insignificant interest cover Dividend ratios show slight improvement Very high asset turnover (typical for retail) Slightly reduced stock turn, as retail DSO not applicable Working capital finely balanced, acid test demonstrates need to sell stock to pay
creditors which are quite high, although slight improvement – pressure from creditors?
P/E over 7 years.

14 Corollary plc is a stock exchange listed company that manufactures and sells office furniture to business customers. A ratio analysis of its Income Statement and Balance Sheet over the last four years has identified the following trends:
2008 2007 2006 2005Sales growth 10.0% 8.5% 8.0% 7.0%
Return on shareholders' investment (ROI) 5.0% 4.8% 4.5% 4.1%Return on capital employed (ROCE) 4.0% 4.5% 5.0% 5.3%Operating profit/sales 6.0% 6.3% 6.5% 6.7%Gross profit/sales 28.0% 27.0% 26.5% 25.0%
Working capital 104.0% 108.0% 111.0% 112.0%Acid test (quick ratio) 68.0% 72.0% 73.0% 77.0%
Gearing 65.0% 62.0% 60.0% 56.0%Interest cover 1.7 1.9 2.1 2.3
Asset turnover 108.0% 105.0% 99.0% 94.0%Days' sales outstanding 61.0 58.0 55.0 57.0Stock turn 15.0 13.0 13.0 12.0Days' purchases outstanding 72.0 68.0 64.0 61.0
Dividend per share 10p 10p 10p 10pDividend payout ratio 65.0% 60.0% 58.0% 58.0%Dividend yield 4.0% 3.8% 3.5% 3.2%Price/earnings ratio 9.6 8.5 8.2 7.7
a. Explain how ratio analysis can be used to interpret business performance, with an emphasis on the different types of ratios that can be used.
b. Use the above ratios to explain the strengths and weaknesses of the financial performance of Corollary plc over the last four years.
Ratio CommentSales growth Increasing sales growth
Return on shareholders' investment (ROI) Increasing, due to dependence on LT debtReturn on capital employed (ROCE) Reduced (therefore more LT debt)Operating profit/sales Increased GP but higher overheadsGross profit/sales Increasing GP (prices or CoS)
Working capital Reducing, close to 100%Acid test (quick ratio) Reducing, reliance on stock

Gearing Increasing debtInterest cover Lower coverage
Asset turnover Stronger level of sales for asset baseDays' sales outstanding Poor credit controlStock turn Higher stock turnoverDays' purchases outstanding Taking longer to pay creditors
Dividend per shareDividend payout ratio Paying higher ppn of profit to maintain constant DPSDividend yield Constant DPS so falling share price
Price/earnings ratioDeclining operating profit; share price may be declining
Overall, sales are increasing but profits are declining, mainly due to expense increases despite increases in GP. There is more LT debt and working capital is tight with the company facing risk in paying its debts and covering its interest charges. Although stock turn has improved, there seems to be poor management of debtors contributing to this. Dividends are being maintained by paying out a higher proportion of profits but the share price may be falling in recognition of risk and declining profitability.
Session 6
1 Godfrey’s target selling price per hour is:c) £50.88
Direct labour costs 25.00Variable costs 4.00Fixed costs £250,000/20,000 12.50Target return (750,000 x 25%)/20,000 9.38Price 50.88
2 Assuming that both activity levels are within the relevant range, the semi-variable costs for December are:c) £25,000
Variable costs are £2 per unit (£10,000/5,000) for December 10,000 @ £2 = £20,000Fixed costs do not change with activity, for December £30,000As total costs are £75,000 semi-variable costs for December are £25,000 (£75,000 - £20,000 - £30,000)
3 A business sells a single product and incurs fixed costs of £60,000. The average selling price is £45 and variable costs are £20. The total sales revenue to achieve a profit of £20,000 is closes to:b) £144,000

Using CVP analysis -60,000 + 20,000 = 80,000 = 3,200(45-20) 25 3,200 @ £45 is £144,000or unit contribution as a% of sales is (45-20) / 45 = 0.5555 (60,000 + 20,000) / 0.5555 = £144,144
4 Within its relevant range, MaxiVent sells its highest volume of 150,000 units at a total cost of £85,000. Selling its lowest volume of 100,000 units incurs total costs of £75,000. Variable costs per unit are:b) £0.20
Hi 150,000 £85,000Lo 100,000 £75,000
50,000 £10,000VC = £10,000/50,000 = £0.20Proof:100,000 @ .20 = £20,000 – 75,000 therefore FC = £55,000150,000 @ .20 = £30,000 – 85,000 therefore FC = £55,000
5 A business has fixed costs of £100,000, an average selling price of £15 and a unit contribution of 40% of sales. The number of units that need to be sold to breakeven is:d) 16,667Contribution = £6 (40% of £15)B/Even = 100,000/6 = 16,667 units
6 Budgeted sales are 100,000 units and the breakeven level of sales are 80,000. The selling price is £18 per unit. The margin of safety is:c) 20%100,000 – 80,000 = 20,000/100,000 = 20%
7 The effect on Travesty’s operating profit of deleting the Porcelain product line will be to:d) make it worse by £500
Cutlery Glassware Porcelain TotalSales 30,000 35,000 10,000 75,000Variable costs 15,000 20,000 7,000 42,000Avoidable product-related fixed costs
5,000 7,500 2,500 15,000
Contribution to corporate fixed overhead
10,000 7,500 500if product
discontinued will lose this contribution
18,000
Allocated corporate fixed
5,000 5,833 1,667 12,500

costsOperating profit
5,000 1,667 -1,167 5,500
8 The level of sales (in units) that will maximise profits is:c) 30,000
Units Price per unit Revenue Costs Contribution
25,000 £10 250,000 150,000 100,00030,000 £9 270,000 160,000 110,000 MAX.35,000 £8 280,000 175,000 105,00040,000 £7 280,000 190,000 90,000
9 The business-wide overhead recovery rate and the cost-centre overhead recovery rate for Division 1 are, respectively:a) £55.55 and £62.50
Division1 2 3 Total
Overheads 50%250,000
30%150,000
20%100,000 500,000
Hours 4,000 2,000 3,000 9,000Hourly rate £62.50 £75 £33.33 £55.55
10 The main proposal made by Cooper & Kaplan in their article “How cost accounting distorts product costs” is that:b) nearly all product costs are variable and cost systems need to reflect the variability of these costs in terms of the number of transactions.
11 Fixed production costs must be included in the valuation of inventory because:c) it is a requirement of SSAP9
While the other answers may be correct, only SSAP9 is a mandatory requirement.
12 If set-up costs are driven by the number of production runs, what is the set-up cost per unit traced to product A?a) £7.92
66,000 = 2640 x 12 = 31,680 = 7.9212 + 5 + 8 4,000
13 Use the following costs per unit to identify the prime cost, total production cost and total cost for a product:c) 36, 72 & 85
£ per unitDirect materials 12Direct labour 24

Prime cost 36Indirect materials 6Indirect labour 8Variable production overhead10Fixed production overhead 12 22 Total production cost 72Variable selling & admin expense 5Fixed selling & admin expense 8Total cost 85
14 The business-wide overhead absorption rate is:c) £4.55
Dept A Dept B Dept C TotalLabour hours 5,000 7,000 10,000 22,000Budgeted overhead £25,000 £45,000 £30,000 £100,000Overhead per labour hour £5 £6.43 £3 £4.55
15 A customer has ordered a custom-made product that will require 5 purchase orders, 6 material issues, 2 production orders and 4 deliveries. The overhead to be allocated to the product is:b) £760
Cost pool Cost driver Cost per driver
Number for order
Cost for order
Purchasing 300,000 5,000 £60 5 £300Material issues
400,000 10,000 £40 6 £240
Scheduling 300,000 10,000 £30 2 £60Delivery 200,000 5,000 £40 4 £160
1,200,000 £760
16 The method of determining overhead allocation using absorption costing and that under activity-based costing differs because:c) Activity-based costing allocates costs to cost pools and traces costs to products based on cost drivers whereas absorption costing allocates costs to cost centres and then to products based on a measure of activity such as direct labour hours.
17a. Calculate the possible price/quantity combinations within the relevant
range of production and the permissible pricing range and determine the optimum level of sales that will maximise profitability.
b. What will be Webster’s net profit for that optimum price/quantity combination?
c. What is the number of units that must be sold, at the optimum selling price to achieve Webster’s target profit of £3.5 million?
a. & b.

Price per unit Quantity
Revenue (£’000)
Variable costs
(£’000) ContributionPrice x
Qty @ £85250 33750
300 30500
O/SIDE RELEV RANGE
350 27250 9537.5 2316.25 7221.25400 24000 9600.0 2040.00 7560.00450 20750 9337.5 1763.75 7573.75 ** MAX500 17500 8750.0 1487.50 7262.50550 14250 7837.5 1211.25 6626.25
600 11000
O/SIDE RELEV RANGE
b. As fixed costs are the same at each level of activity they can be ignored in the above Table as the maximum contribution is also the maximum profit. Optimum sales are at price of £450, selling 20,750 units for a maximum contribution of £7,573,750 less fixed costs of £4,500,000 is a profit of £3,073,750
c. The contribution per unit at the optimum sales level is £365 (£450 - £85). The breakeven sales units to generate a profit of £3.5 million is 4,500,000 + 3,500,000 = 21,918 units
36518
a. By how much does the average cost change between processing 10,000 and 20,000 documents? Why?
b. Does the marginal cost change in the same way?
Volume Variable Fixed Total Avg cost/unit 10,000 70,000 100,000 170,000 £1720,000 140,000 100,000 240,000 £12
a. The average cost reduces by £5 from £17 to £12. This is because the fixed costs of £100,000 are spread over 20,000 documents (£5 per document) rather than 10,000 documents (£10 per document).b. The marginal cost is £7, i.e. the variable cost. It does not change per unit irrespective of volume within the relevant range.
19 Terrier Financial Services has fixed costs of £12,500,000. Shareholders expect a profit return before interest and taxes of £5,000,000. Terrier achieves an average margin of 1.5% on the volume of client money handled. What is the volume of money that has to be handled to achieve the profit target?
Contribution is 1.5% (0.015)Fixed costs + Target profit = 12,500,000 + 5,000,000 = £1,166,666,667 Unit contribution as a % of sales .015

(i.e. £1.167 billion or £1,167 million)
20 The national Hospital Purchasing Authority is negotiating with Clinical Services to reduce its selling price by 20% although a volume of at least 1,200 kits per month has been promised. Should Clinical Services accept this offer? If so, why? If not, what would be your suggestion in order for Clinical Services to maintain its current level of profitability?If selling price reduces by 20% to £120 -
Sales 1,200 @ £120 £144,000Cost of sales 1,200 @ £85 102,000Gross profit 42,000Fixed costs 50,000Net loss 8,000
Clinical Services should not accept this offer. However, if it loses the contract, the company will need to look for a replacement customer to cover its fixed costs.
To maintain the current level of profitability:The new margin is £35 per kit (£120 - £85). To cover fixed costs of £50,000 and the current profits of £25,000, Clinical Services would need to sell £75,000 = 2,143 kits£35/unitClinical Services should therefore negotiate over the minimum number of kits to be sold to hospitals.
21 What is the profitability of Unfocused Books’ three departments and what recommendations would you make to the owners?
Fiction Non-Fiction Children’s TotalSales 250,000 100,000 75,000 425,000Cost of sales 45%
112,50050%
50,00055%
41,250 203,750Gross profit 137,500 50,000 33,750 221,250Departmental costs
50,000 35,000 35,000 120,000
Contribution to shared fixed costs
87,500 15,000 -1,250 101,250
Shared fixed costs
30,000 30,000 30,000 90,000
Net profit 57,500 -15,000 -31,250 11,250
Unfocused Books makes substantial profits from fiction books and at least makes a positive contribution toward shared fixed costs from non-fiction sales. However it is losing money on Children’s books. Unless sales can be increased (breakeven for children’s books before contributing to shared fixed costs is £77,778 (£35,000/0.45)) the children’s department should be closed, to improve profits by £1,250. If the shared fixed costs cannot be reduced, they will need to be covered from the remaining two departments. As fiction books have the highest sales value and lowest cost of sales, it

may be that sales can be increased by using the Children’s department space to sell more fiction books.
22 a. If the average selling price is £21, calculate the breakeven point in
quantity and money terms and draw a rough sketch of a cost-volume-profit (CVP) graph that shows the relationships between the elements of CVP.
Breakeven FC/CMpu = 150,000/(21-7) = 10,714 services10714 @ £21 = £224,995 (£225,000)
b. Ignoring any market demand or capacity limitations, calculate the optimum selling price for Greentown Industries and identify which customer group is most profitable
Selling price
Quantity Revenue Variable costs @ £7
Contribution Ranking
MNC £19 13,000 247,000 91,000 156,000 5CORP £20 12,500 250,000 87,500 162,500 3SM BUS
£2112,000 252,000 84,000 168,000 ** 1
GOV £22 11,000 242,000 77,000 165,000 2PVT £23 10,000 230,000 70,000 160,000 4
Optimum selling price is Small Business £21
c. Based on the calculation of optimum selling prices in (b) above but with the capacity and demand assumptions taken into consideration, calculate the maximum profits that Greentown can earn and the customer mix and quantity by which that profit can be achieved.
Ranking as above
1. 20,000 Small Business @ £21 = £420K - £140K = £280K2. 20,000 Govt @ £22 = £440K - £140K = £300K3. 20,000 Corporate @ £20 = £400K - £140K = £260K
FC £150K
VC £7pu
Total costs
Revenue
Breakeven 10714
Breakeven£225,000

Total contribution = £840K – FC £150K = PBIT £690K max profits
23a. Present the financial information in a more meaningful form, showing the
contribution each division makes to total profitability(in £’000) I.T. Finance Strategy M&A Total
Income 1,200 1,700 900 1,500 5,300 % of total 22.6% 32.1% 17% 28.3% 100%Variable staff costs 600 900 350 600 2,450Contribution margin
600 800 550 900 2,850
Margin % 50% 47% 61% 60% 53.8%Fixed staff costs identifiable with segment
200 500 600 150 1,450
Contribution to business-wide costs
400 300 (50) 750 1,400
Business-wide costs (allocated as % of income)
271 385 204 340 1,200
Operating profit/(loss)
129 (85) (254) 410 200
b. Ignoring any redundancy payments, advise the senior partners as to i. which, if any, divisions should be closed, and
ii. the likely profit, assuming constant sales, if those divisions were closed
As the unavoidable fixed costs for Strategy division exceed the contribution, this division should be closed, increasing profits by £50K. As Finance makes a positive contribution to business-wide costs, it should be retained.
c. By re-presenting the financial information, explain the consequences to remaining divisional profitability if any division is closed
(in £’000) I.T. Finance M&A TotalIncome 1,200 1,700 1,500 4,400 % of total 27.3% 38.6% 34.1% 100%Variable staff costs 600 900 600 2,100Contribution margin
600 800 900 2,300
Margin % 50% 47% 60% 53.8%Fixed staff costs identifiable with segment
200 500 150 850
Contribution to business-wide costs
400 300 750 1,450 + 50
Business-wide costs (allocated as
328 463 409 1,200

% of income)Operating profit/(loss)
72 (163) 341 250 + 50
Note effect on divisional profits is to reduce each, due to allocation of overhead previously charged to Strategy division.
24a. Calculate the total budgetb. Calculate cost driver ratesc. Estimate the cost for a job requiring 15 days of design and 150 screens,
records and reports
a. Total budgeted costs are:No. £ per annum
Design 6 £180,000Programming 4 £100,000Testing 2 £ 40,000Direct labour cost £320,000Manager 1 £ 45,000Accommodation £100,000Computer lease costs £ 25,000Travel £ 10,000Total budget £500,000
b. As the drivers for programming and testing are the same, these can be grouped into a single cost pool. Overheads can then be allocated to each cost pool.
Design Programming & Testing
Total
Direct costs 180,000 140,000 320,000Allocate manager’s costs equally
15,000 30,000 45,000
Accommodation and computer lease costs
125,000 125,000
Travel costs 10,000 10,000Total costs 205,000 295,000 500,000Cost drivers 1,000 days 10,000 recordsCost per cost driver
£205 per day £29.50 per record
c. Job cost estimate:15 days’ design @ £205 = £3,075150 screens etc. @ £29.50 = £4,425Total cost of job = £7,500
25

a. Calculate the amount of overhead allocated to small and large advertising campaigns under existing methods
b. Apply activity-based costing to calculate the cost per cost driver for each of the cost pools
c. Use the costs per cost driver to calculate the activity-based overhead applicable to small and large campaigns
d. Calculate the percentage to be added to direct advertising costs to recover overhead costs under activity-based costing
a. Current allocation of costs over small/large ‘won’ campaigns
Campaign mix Direct advertising
costs per campaign
Number of campaigns
Overhead costs allocated to
each campaign
Small 4,000 325 1,300,000Large 28,000 25 700,000Total 2,000,000
b. Overheads cost pools and drivers under ABCCost pool Budget costs Share of
rental etc.Total cost pool
Cost driver
Cost per driver
Creative 500,000 150,000 650,000 800 £812Production 750,000 150,000 900,000 350 £2,571Admin & support
300,000 150,000 450,000 400 £1,125
Total costs 2,000,000c. i. ABC allocation of creative costs over creative ‘bids’
Campaign mix No. bids ABC costs per bid
Total costs
Small 400 812 324,800 rounded to 325,000 Large 400 812 324,800 rounded to 325,000
800 649,600 rounded to 650,000
c. ii.ABC allocation of production costs over production ‘wins’
Campaign mix No. campaigns ABC costs per campaign
Total costs
Small 325 2,571 835,575 rounded to 835,000Large 25 2,571 64,275 rounded to 65,000
350 899,850 rounded to 900,000
c. iii ABC allocation of admin & support costs over number of customers
Campaign mix No. customers ABC costs per customer
Total costs
Small 300 1,125 337,500Large 100 1,125 112,500

400 450,000
c. iv ABC costing of campaign mix
Campaign mix
Creative costs
Production costs
Admin & support costs
Total costs
Number of campaigns
Cost per campaign
Small 325,000 835,000 337,500 1,497,500 325 £4,607Large 325,000 65,000 112,500 502,500 25 £20,100
650,000 900,000 450,000 2,000,000 350
d. Current allocation of costs over small/large ‘won’ campaigns
Campaign mix Direct advertising
costs per campaign
ABC costs per campaign
Overhead allocation as a
% of direct advertising
costs Small 4,000 4,607 115%Large 28,000 20,100 71.8%
26a. Calculate the overhead rate for each of departments A, B and C and
calculate the product cost for HiVol and LoVol.b. Calculate the activity-based overhead rate for each cost pool and calculate
the product cost for HiVol and LoVol. c. Compare the product costs using activity-based costing with the product
cost that allocates overhead on the basis of direct labour hours. Why is there a difference?
a. Overhead hourly rate per department:
Departmental overhead costs
A B C Total
Total Overhead 150,000 250,000 200,000 600,000Planned labour hours
50,000 40,000 20,000 110,000
Overhead rate per labour hour
£3 £6.25 £10
HiVol:
A B C TotalLabour hours in each department
8 7 3
Overhead cost based on labour hours
£24 £43.75 £30 £97.75
Direct materials £300.00Direct labour £180.00Total product £577.75

cost
LoVol:
A B C TotalLabour hours in each department
10 5 5
Overhead cost based on labour hours
£30 £31.25 £50 £111.25
Direct materials £150.00Direct labour £200.00Total product cost
£461.25
b. Activity-based overhead per cost driver
Business Process Purchasing Scheduling Materials handling
Total
Total costs 100,000 125,000 375,000 600,000Cost driver 20,000
purchase orders5,000
production orders
25,000 material issues
Activity-based cost per cost driver
£5 £25 £15
HiVol:
Purchasing Scheduling Materials handling
Total
Number of cost drivers for each process
10,000 1,500 18,000
Overhead cost based on cost drivers
£50,000 £37,500 £270,000 357,500
No. of products produced
5,000
Activity-based overhead per unit of product
£71.50
Direct materials £300.00Direct labour £180.00Total product cost £551.50
LoVol:
Purchasing Scheduling Materials handling
Total
Number of cost drivers for each process
10,000 3,500 7,000
Overhead cost based on cost drivers
£50,000 £87,500 £105,000 242,500
No. of products 1,000

producedActivity-based overhead per unit of product
£242.50
Direct materials £150.00Direct labour £200.00Total product cost £592.50
c. Comparison of two methods:
Total product cost HiVol LoVolAllocating overhead against direct labour hours
£577.75 £461.25
Allocating overhead based on activity-based costing
£551.50 £592.50
HiVol and LoVol have similar labour costs per unit but because there is a higher quantity of HiVol produced, HiVol incurs a disproportionate amount of overhead when it is a result of the allocation of overheads by direct labour hours.
Under activity-based costing, LoVol incurs high overheads, evidenced by the disproportionate number of cost drivers for each business process (given the relatively small volume). This overhead is spread over the low number of units produced which increases the cost per unit.
HiVol has been subsidising the cost of LoVol under the absorption costing method. The activity-based method more accurately traces the overhead costs incurred to the products based on the cost drivers – the causes of activity that consumes overhead.27
a. Calculate the total cost of each Product H using:i. Absorption costing using a business-wide overhead recovery
rateii. Absorption costing using departmental overhead ratesiii. Activity-based costing
b. Explain the principles underlying the basis of calculation of each of the three above-mentioned methods and the most likely reasons for any similarity or difference between the results in applying the three methods in this case.
c. Explain the overhead allocation problem, particularly with regard to the issues raised by Cooper and Kaplan in their article “How cost accounting distorts product costs”
i. Absorption costingProduction Assembly Despatch Total
Overheads 432,000 220,000 140,000 792,000Direct labour hours
12,000 10,000 7,000 29,000
Ohead cost per lab hr
£36 £22 £20 £27.31
Product H 8 12 4 24

Ohead alloc £288 £264 £80 £655.44Total £632
A (i). Absorption costing based on business-wide overhead costs is £740 + £655 = £1,395A (ii). Absorption costing plus departmental overhead rates is £740 + £632 = £1,372
iii. Activity-based costing
Cost pool Cost driver Cost per driver
Cost for Product H
Order processing 100,000 25,000 customer orders
£4 1,000 @ £4£4,000
Purchasing 200,000 10,000 Purchase orders
£20 700 @ £20£14,000
Operations 450,000 60,000 direct labour hours
£7.50 29,000 @ £7.50£217,500
Distribution 42,000 5,000 deliveries
£8.40 2,000 @ £8.40£16,800
792,000 £252,300Number of products 400Overhead per product H £630.75
Costing based on ABC is £740 + £631 = £1,371
b. Need to differentiate departmental costs from cost pools and drivers and the difference between an arbitrary use of labour hours and a cause-effect relationship used in ABC. In this case, similarity of results may lie in direct labour being a good proxy for overheads and an even spread of use of resource usage over the three departments.
c. Overhead allocation problemGiven a range of product/services and/or different production processes and the increase in overhead as a component of business costs, the underlying assumptions as to how overheads are allocated over product/services and the impact on profitability of that decision, and whether this is done at all (variable costing), on the basis of hours (absorption costing) or cost drivers (ABC).
Cooper & Kaplan: labour-based method is arbitrary method, and does not reflect demands on resources, bias costs of individual products, subsidisation problem, cost of unused capacity not identified, subservient to the needs of external financial reporting, costs treated as fixed do vary with batches, number of products, etc.
28a. Calculate the overhead per direct labour hour using a departmental rate.

b. Calculate the total overhead cost allocated to each of the four product groups using the departmental rate
c. Calculate the costs per cost driver under activity-based costingd. Calculate the total overhead cost allocated to each of the four product
groups using activity-based costing
e. Comment on the approaches to costing and the differences between your answer to (b) and (d) above.
(a) Overhead per DLH
Design Machining Assembly & Distribution
Total
Overhead costs (£)
150,000 250,000 200,000 600,000
Direct labour hours
10,000 12,500 20,000 42,500
Overhead per DLH
£15 £20 £10
(b) Overhead allocated to product groups using departmental rate
Design Machining Assembly & Distribution
Total
Liggles 2,000@ £1530,000
1,500@ £2030,000
10,000@ £10
100,000 160,000Widgets 3,000
@ £1545,000
1,000@ £2020,000
5,000@ £1050,000 115,000
Zonnets 3,000@ £1545,000
7,000@ £20
140,000
2,000@ £1020,000 205,000
Carusos 2,000@ £1530,000
3,000@ £2060,000
3,000@ £1030,000 120,000
Total £150,000 £250,000 £200,000 £600,000
(c)Calculation of costs per cost driverCost pool £ Cost driver No. of drivers Cost per
driverOrder entry 100,000 Customer orders 5,000 £20Production 350,000 Production orders 2,000 £175Delivery 150,000 Delivery orders 5,000 £30Total £600,000
(d)

Overhead allocated to products under ABCNo drivers Cost per driver Subtotal Total cost
Liggles 1500 500
1000
@ £20@ £175@ £30
30,00087,50030,000 147,500
Widgets 50010001000
@ £20@ £175@ £30
10,000175,00030,000 215,000
Zonnets 1000250
1000
@ £20@ £175@ £30
20,00043,75030,000 93,750
Carusos 2000250
2000
@ £20@ £175@ £30
40,00043,75060,000 143,750
Total £600,000
(e)The limitations of applying the departmental overhead rate is that overheads are allocated to departments using often simplistic assumptions such as floor area, number of employees, etc. and the assumption is that DLH is representative of how overheads are consumed by different products, i.e. the more DLH, the more overhead is allocated. While this may be true for some overheads, it is unlikely to be true for all overheads.
The ABC method, by tracing overheads more accurately to products shows that Widgets are undercosted using the departmental DLH rate whilst Zonnets are overcosted. A similar but less significant situation is evident with Carusos and Liggles. This cross-subsidisation of products is a common feature of DLH-based overhead allocations and leads to skewed pricing and sales. This kind of problem is frequently identified by the introduction of ABC systems. However, ABC is expensive to implement due to the need for specialist accounting software and the time involved in ascertaining cost pools, cost drivers and activity volumes for each cost driver.
DLH-based overhead
ABC-based overhead
% difference
Liggles 160,000 147,500 -7.8%Widgets 115,000 215,000 +87%Zonnets 205,000 93,750 -54.3%Carusos 120,000 143,750 +19.8%Total £600,000 £600,000

29
a.Dept
ADept
BDept
C Mtce Total BasisDept
ADept
BDept
C MtceRent 32000 16000 24000 8000 80,000 100 40 20 30 10Supervision 10000 10000 10000 10000 40000 equallyElectricity 7895 3158 3947 0 15000 9500 5000 2000 2500
Depreciation 12500 1250 10000 1250 25000% alloc 50% 5% 40% 5%
62395 30408 47947 19250 160000
Alloc mtce 10132 4053 5066-
19250 9500 5000 2000 2500Total overhead 72526 34461 53013 0 160000
Labour hours 5000 2000 2500 9500Overhead per DLH $14.51 $17.23 $21.21 $16.84
b. Cost centre BlanketDirect material 5,500 5,500Direct labour Hours Rate Total A 12 $25 300 B 6 $30 180 C 8 $18 144Direct labour 26 624 624Prime cost 6,124 6,124
Overhead A 12 $14.51 174 B 6 $17.23 103 C 8 $21.21 170Overhead 26 447 438Total product cost $6,571 $6,562
c. There is almost no difference between the product cost and overhead costattributed under the blanket or cost centre rates. This is because there is noapparent difference between the cost structure or utilisation in each cost centreor in the extent to which the product uses the resources of different cost centres.

d. ABC

Direct material 5,500Direct labour 624Prime cost 6,124 Product
Cost poolCost per driver
No. drivers
ABC cost
Overhead 735Customer orders $45 4 180
Total product cost $6,859Production orders $75 3 225Deliver orders $30 7 210Materials handling $60 2 120
735e. The product causes overhead costs to be incurred over and above that which is allocatedusing the DLH rate. The cost drivers show the overhead consumption to produce the product.Using DLH for overhead allocation results in under pricing of the product.
Session 7
1 Zero based budgeting is a technique where a department:a) is required to make a case for its budget as if its activities were new
2 The process whereby annual budgets are spread over a number of accounting periods is called:c) phasing or profiling
3 A company’s annual sales budget is for 120,000 units, spread equally through the year. It needs to have one and a half months stock at the end of each month. If opening stock is 12,000 units, the number of units to be produced in the first month of the budget year is:c) 13,000
Sales 10,000 (120,000/12)+ Closing stock 15,000 (10,000 + 5,000)
25,000- Opening stock 12,000Production 13,000
4 The standard costs for a manufacturing business are £12 per unit for direct materials, £8 per unit for direct labour and £5 per unit for manufacturing overhead. The sales projection is for 5,000 units, 3,500 units need to be in stock at the end of the period and 1,500 units are in stock at the beginning of the period. The production budget will show costs for that period of:a) £175,000
Standard production costs £25 per unit (£12 + £8 + £5)Production is for 7,000 units (5,000 + 3,500 – 1,500)7,000 @ £25 = £175,000

5 Debtors increase by £15,000 and creditors increase by £11,000. The effect on cash flow of the change in working capital is an:c) decrease of £4,000
Increase in debtors increases working capital and consumes cash Increase in creditors reduces working capital and improves cash flowTherefore a net decrease in cash of £4000 (£15,000 - £11,000)
6a. Produce a budget that shows the contribution for each of the three
services. Rank the three services as to the greatest contributions to profitability. What are the constraints?
b. The marketing manager has asked your advice as to whether to accept EITHER 200 people attending a conference and staying for dinner in two sittings but with no hotel accommodation (which will make it very difficult to sell hotel rooms) OR to refuse the conference booking but to maintain the average 60% hotel occupancy, of which half use the dining room.
a. Jaguar Hotel’s budget:
Hotel Dining Room Conference Centre
Total
Capacity 100 rooms 100 seats 200 seatsSelling price/unit
£75 £35 £40
Revenue 7,500 3,500 8,000 19,000Material costs/unit
£5 laundry £15 food £5 refreshments
Material costs 500 1,500 1,000 3,000Throughput contribution
7,000 2,000 7,000 16,000
Throughput contribution per unit of limited capacity
£70 £20 £35
Other variable costs/unit
£5 cleaning £10 labour £1 light & heat
Variable costs 500 1,000 200 1,700Maximum contribution
6,500 1,000 6,800 14,300
Contribution per unit
£65 £10 £34
Ranking 1 3 2
Both the contribution per unit and the throughput contribution identify the appropriate ranking as hotel rooms, conference centre and dining. The optimum product mix is to sell the conference facility with as many attendees

staying overnight and using the dining facility. However, the dining facility and hotel capacity (100) may be a limiting factor if all (200) conference attendees want to use those facilities.
b. If 200 people attend a conference and stay for dinner in 2 sittings, the maximum contribution is:Conference £6,800Dining 2 @ £1,000 £2,000Total £8,800
If there is no conference but 60% occupancy is achieved on hotel rooms, half of whom have dinner in dining room, the maximum contribution is:Hotel 60 @ £65 £3,900Dining 30 @ £10 £300Total £4,200
The best option is the conference, by a large margin.
7 Jethro Turnbull Ltd is a privately owned business. It has budgeted for profits (after deducting depreciation of £35,000) of £125,000. Debtors are expected to increase by £20,000, inventory is planned to increase by £5,000 and creditors should increase by £8,000. Capital expenditure is planned of £50,000, income tax of £35,000 has to be paid and loan repayments are due totalling £25,000. What is the forecast cash position of Jethro Turnbull at the end of the budget year, assuming a current bank overdraft of £15,000?
Operating profit 125,000+ Depreciation 35,000
160,000
- Working capital increase:Debtors increase 20,000Inventory increase 5,000Creditors increase (8,000) -17,000
- Capital expenditure -50,000- Income tax -35,000- Loan repayments -25,000Net increase in cash 33,000Opening bank overdraft -15,000Forecast cash at end of year 18,000
8 Bridgeport PLC has produced the following summary profit budget and cash forecast for the next six months. What assumptions can you make about the business based on these figures? What questions would you want to ask in relation to the figures?

Bridgeport has produced a very simple set of figures. Certain assumptions are implied by these figures:1. That sales are seasonal as they double in the second quarter.2. That cost of sales is a constant 40% throughout the period, i.e. that there is no
change in the relationship between costs and prices during the period.3. That overheads are constant throughout the period.
It is unusual that all costs remain constant, especially when volume doubles, especially so suddenly. It is not apparent whether the business sells goods or services. If goods, we would expect a build up in stock to be reflected in the cash forecast. If services, we would expect the cost of sales or overheads to change in the second quarter to reflect additional overhead costs.
The business is presumably a cash business as the cash flow shows no change in debtors, as would be expected when sales suddenly increase. Similarly, all costs appear to be on a cash basis as no change in creditors is shown.
Although there is capital expenditure planned in the cash forecast, there is no depreciation adjustment to the profit in the cash forecast. This may be an error or the business may not previously have had any depreciable assets. As the cash forecast shows a loan repayment it would be interesting to know what the loan was used for as there seems to be no fixed or current assets at all.
9 a. Produce a
i. Profit budget for each of the five years, showing both gross profit and operating profit;
ii. Cash flow for each of the five years, andiii. Apply a discounted cash flow technique and use this to recommend
whether the new division and capital investment should proceed.
b. What does theory tell us about the strengths and limitations of budgeting and the discounted cash flow technique?
a. Investment 10,000,000
Year 1 2 3 4 5Sales revenue 4,000,000 6,000,000 8,000,000 6,000,000 4,000,000Cost of sales 30% 1,200,000 1,800,000 2,400,000 1,800,000 1,200,000Gross profit 2,800,000 4,200,000 5,600,000 4,200,000 2,800,000Rent & office expenses 300,000 300,000 300,000 300,000 300,000Selling & admin salaries (+5%)
400,000 420,000 441,000 463,050 486,203
Repairs & maintenance 100,000 100,000 200,000 200,000 300,000Depreciation 25% 2,500,000 2,500,000 2,500,000 2,500,000 0Operating profit (a) -500,000 880,000 2,159,000 736,950 1,713,798Add back depreciation 2,500,000 2,500,000 2,500,000 2,500,000 0Cash flow(b) 2,000,000 3,380,000 4,659,000 3,236,950 1,713,798
.8929 .7972 .7118 .6355 .56741,785,800 2,694,536 3,316,276 2,057,081 972,409

PV 10,826,010Less initial investment 10,000,000NPV at 12% © 826,010
Proceed as NPV is positive.
b. Strengths and limitations of budgeting and the discounted cash flow:Strengths: Link to strategy. Method of resource allocation decisions. Co-ordination/ communication. Motivation (with incentives). Control mechanism. Evaluate performance (SBU & manager). Time value of money (in capital expenditure). Link to shareholder value.
Limitations: Difficulty of predicting (esp. for capital expenditure). Change in competition, new technologies, demand etc. Bias. Aggregation. Risk (content v. process). Beyond Budgeting movement. High hurdle rates for capital expenditure, and. Shank’s broader strategic cost management approach.


