Embed Size (px)
Citation preview
A
STUDY
ON
FOOD AND DAIRY INDUSTRY
Management Research Project -I
Submitted
In the partial fulfillment of the Degree of
Master of Business Administration
Semester-III
By
Name Exam No.
Shikha Modi 12044311052 Vishal Patel 12044311119 Priyanka Prajapati 12044311131 Zalak Prajapati 12044311133 Dhara Shah 12044311146 Vishesh Shah 12044311147
Under the Guidance of:
Prof. (Dr.) Mahendra Sharma
Prof. & Head,
V. M. Patel Institute of Management.
&
Prof Harsha Jariwala, Asst. Professor
Prof. Abhishek Parikh, Asst. Professor
V. M. Patel Institute of Management.
Submitted To:
V. M. Patel Institute of Management,
Ganpat University,
Kherva.
(2013)
i
CERTIFICATE BY THE GUIDE
This is to certify that the contents of this report entitled “Food And Dairy Industry” by
ShikhaMod(12044311052),VishalPatel(12044311119),PriyankaPrajapati(12044311131),Zala
kPrajapati(12044311133),DharaShah (12044311146),Vishesh Shah (12044311147)submitted
to V. M. Patel Institute of Management for the Award of Master of Business Administration
(MBA Semester -III) is original research work carried out by them under my supervision.
This report has not been submitted either partly or fully to any other University or Institute
for award of any degree or diploma.
Prof. (Dr.) Mahendra Sharma,
(Professor & Head)
V. M. Patel Institute Of Management,
Ganpat University.
Date:
Place: Kherva
ii
CANDIDATE’S STATEMENT
We hereby declare that the work incorporated in this report entitled “Food And Dairy
Industry” in partial fulfillment of the requirements for the award of Master of Business
Administration (Semester - III ) is the outcome of original study undertaken by us and it has
not been submitted earlier to any other University or Institution for the award of any Degree
or Diploma.
Date:
Place: Kherva
Shikha Modi
Vishal Patel
Priyanka Prajapati
Zalak Prajapati
Dhara Shah
Vishesh Shah
iii
PREFACE
Industrial activity plays an important role in economic development of our country. The
knowledge of present market scenario is very much essential and keeping that in view, our
college gave us a very good opportunity of industrial interaction in terms
of Management Research Project-I.
As a part of Our Academic requirement of MBA program, we have selected FOOD AND
DAIRY INDUSTRYas the industry to be analyzed under the subject named MRP-1. The
reason to choose Food and Dairy Industry is very obvious. One, that industry has very
interesting history and background. It is concerned with basic Infrastructure development as
well as continuous changing advanced technology. Secondly, it has opportunistic future and
directly impact on economy. Industry has a very rich area of analyzing. Through this kind of
Industry Analysis we can have good exercise of learning and also help us to understand
current trend of industry with its all-possible dimensions.
The report covers all the landmark changes in Dairy industry and competitive markets being
driven by globalization. It would also provide you the idea of analyzing, crafting,
formulating, evaluating, implementing and executing business strategies related to the Food
and DairyIndustry in today’s volatile markets.
iv
ACKNOWLEDGEMENT
We would like to take this opportunity, to express our most sincere gratitude to Dr.
Mahendra Sharma Professor & Head, V.M.Patel institute of management for his assistant to
give chance for prepare MRP-I reports.
We would also like to thanks to Ms. HarshaJariwalafor her assistant and support without
which this project would not successfully completed. She provides us all necessary guidance.
We are heartily thankful Mr. Abhishek K Parikhfor them support in preparing this report.
We would also like to thanks to all faculty members of V.M. Patel Institute of Management,
Ganpat University. Kherva, Mehsana.
v
EXECUTIVE SUMMERY Objective of the Study:
The project is taken with an objective to analyze various product offered by Food andDairy
industry provider and to study Food and Dairy industry in depth .To know the functioning of
Food and Dairy industry in Gujarat.To analyze the Food and Dairy industry, taking in to
accounts the intensity of competition amongst the companies. To do the comparative
assessment of selected dairies based on various perimeter current ratios, Inventory turnover
ratio,Debt equity ratio for analyzing Food and Dairy industry in Gujarat.
Through the presence of such industries, a wider range of food products could be sold and
distributed to the distant locations. The term 'food and dairy' is mainly defined as a process of
value addition to the agricultural or horticultural produce by various methods like grading,
sorting and packaging.Benefits of food and dairy include toxin removal, preservation, easing
marketing and distribution tasks, and increasing food consistency. In addition, it increases
seasonal availability of many foods, enables transportation of delicate perishable foods across
long distances and makes many kinds of foods safe to eat by de-activating spoilage and
pathogenic micro-organisms.The industry is becoming increasingly automated, and is
therefore seeing labour costs decline. The advantages of food and dairy include greater food
consistency, longer shelf life, removal of toxins, reduction of food borne diseases and cheaper
food. The global fresh meat market is expected to produce 300 million tons by 2015. A rising
global population and extensive urbanization are driving forces for the market.
The company has also introduced the major areas like Nestle India Limited, Cadbury India
Limited, Jubilant Food works Limited, Britannia Industries Limited, GlaxoSmithKline
Consumer healthcare Limited.
In strategic analysis we include Economic Features, Porter’s five force model, Driving Force
Model, Strategy Group Mapping, PEST Analyses, SWOT Analysis.
Financial analysis is an assessment of the effectiveness with which are employed in a firm,
efficiency and profitability of its operations, andvalue and safety of debtors' claims against
the firm'sassets. We also analyze Ratio Analysis and Trend analysis.
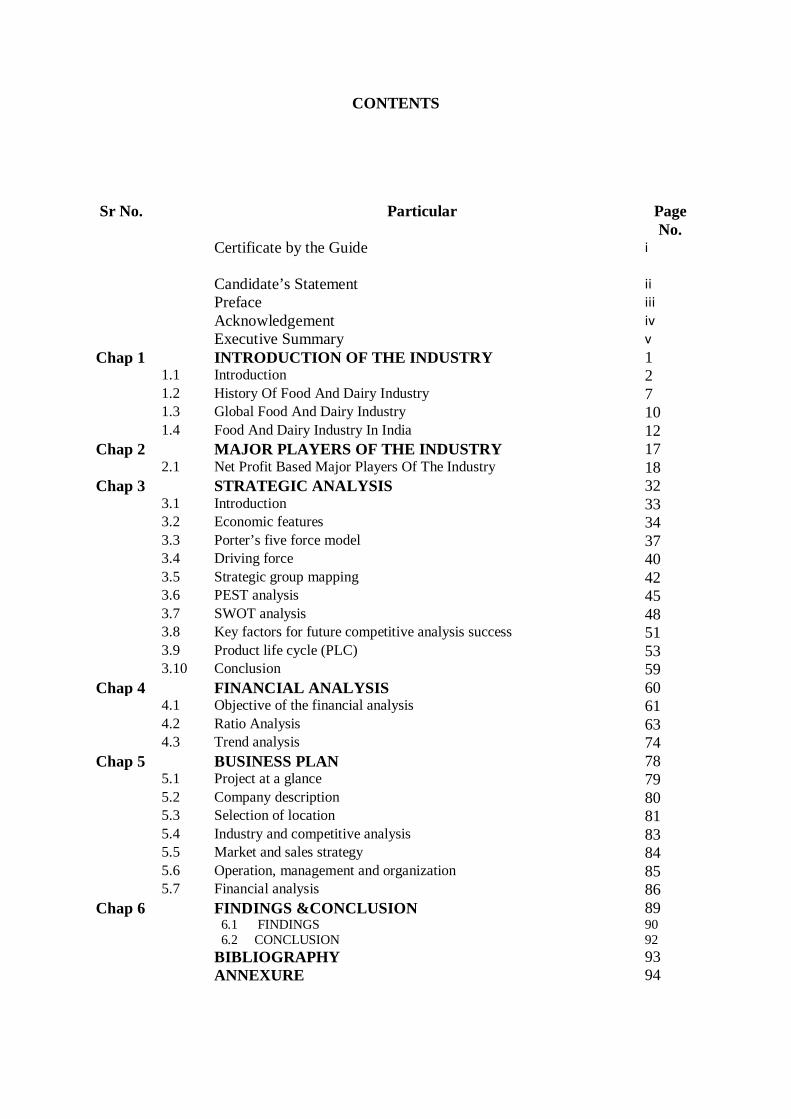
CONTENTS
Sr No. Particular Page No.
Certificate by the Guide i
Candidate’s Statement ii Preface iii Acknowledgement iv Executive Summary v Chap 1 INTRODUCTION OF THE INDUSTRY 1 1.1 Introduction 2 1.2 History Of Food And Dairy Industry 7 1.3 Global Food And Dairy Industry 10 1.4 Food And Dairy Industry In India 12 Chap 2 MAJOR PLAYERS OF THE INDUSTRY 17 2.1 Net Profit Based Major Players Of The Industry 18 Chap 3 STRATEGIC ANALYSIS 32 3.1 Introduction 33 3.2 Economic features 34 3.3 Porter’s five force model 37 3.4 Driving force 40 3.5 Strategic group mapping 42 3.6 PEST analysis 45 3.7 SWOT analysis 48 3.8 Key factors for future competitive analysis success 51 3.9 Product life cycle (PLC) 53 3.10 Conclusion 59 Chap 4 FINANCIAL ANALYSIS 60 4.1 Objective of the financial analysis 61 4.2 Ratio Analysis 63 4.3 Trend analysis 74 Chap 5 BUSINESS PLAN 78 5.1 Project at a glance 79 5.2 Company description 80 5.3 Selection of location 81 5.4 Industry and competitive analysis 83 5.5 Market and sales strategy 84 5.6 Operation, management and organization 85 5.7 Financial analysis 86 Chap 6 FINDINGS &CONCLUSION 89 6.1 FINDINGS
6.2 CONCLUSION 90 92
BIBLIOGRAPHY 93 ANNEXURE 94
1
CHAPTER 1
INTRODUCTION TO INDUSTRY
1.1 Introduction
1.1.1 Major Areas
1.1.2 Benefits Of Food and Dairy Industry
1.1.3 Food and Dairy Nutshell
1.2 History Of Food And Dairy Industry
1.2.1 History of Food Laws
1.3 Global Food And Dairy Industry
1.4 Food And Dairy Industry In India
1.4.1 Key Growth Drivers Of Food And Dairy Sector In India
1.4.2 Key Opportunities In Food and Dairy Sector
1.4.3 Challenges Faced By The Industry
2
1. 1 INTRODUCTION
Food and dairy sector is indispensable for the overall development of an economy as it
provides a vital linkage and synergy between the agriculture and industry. It helps to
diversify and commercialise farming; enhance income of farmers; create markets for
export of agro foods as well as generate greater employment opportunities.
Through the presence of such industries, a wider range of food products could be sold
and distributed to the distant locations. The term 'food and dairy' is mainly defined as a
process of value addition to the agricultural or horticultural produce by various methods
like grading, sorting and packaging. In other words, it is a technique of manufacturing
and preserving food substances in an effective manner with a view to enhance their shelf
life; improve quality as well as make them functionally more useful. It covers spectrum
of products from sub-sectors comprising agriculture, horticulture, plantation, animal
husbandry and fisheries.
Food and dairy industry is one of the largest industry in India and is ranked 5th in terms
of production, consumption and export. Earlier, food and dairy industry was largely
confined to the food preservation, packaging and transportation, which mainly involved
salting, curdling, drying, pickling, etc. However, over the years, with emerging new
markets and technologies, the sector has widened its scope. It has started producing many
new items like ready-to-eat food, beverages, processed and frozen fruit and vegetable
products, marine and meat products, etc. It also includes establishment of post-harvest
infrastructure for processing of various food items like cold storage facilities, food parks,
packaging centres, value added centres, irradiation facilities and modernised abattoir.
The food and dairy sector comprises of two segments- Primary processed food and Value
added food. Primary segment comprises of packaged fruit and vegetables, milk, flour,
rice, spices etc. and constitutes around 62% in value terms of the processed foods. Value
added segment includes processed fruits and vegetables, juices, jam &jelly etc and holds
around 38% share in the total processed food.
3
In an emerging country like India, where growth with equity is a primary policy thrust,
the optimum development of the food and dairy sector will contribute significantly in
tackling several developmental concerns such as disguised unemployment in agriculture,
rural poverty, food security, food inflation, improved nutrition, prevention of wastage of
food etc. By serving as a bridge between agriculture and manufacturing and by dealing
with a basic need of all Indian citizens – the assured supply of healthy and affordable
food at all locations in the country, this sector has the potential to be a major driver in
India‘s growth in the coming years. In fact the food and dairy sector has been growing
faster than the agriculture sector.
The food and dairy industry includes a diverse group of companies involved in the
processing of products like fish, meat, milk, crops and water. It includes millions of
Small & Medium Enterprises (SMEs) worldwide and also some of the largest companies
in the world. Many of these companies deliver products directly to consumers, while
others specialize in Business-to-Business activities (ingredients, commodity markets).
Some companies directly participate in all areas of food production, from farming
activities through to final production and retail. Others are concentrated more at the top
end of the production chain or buy through commodity markets.
In fact, Food and dairy one of the world‘s largest industries from the perspective of the
number of companies involved in the sector, as well as in terms of its total economic
value.
4
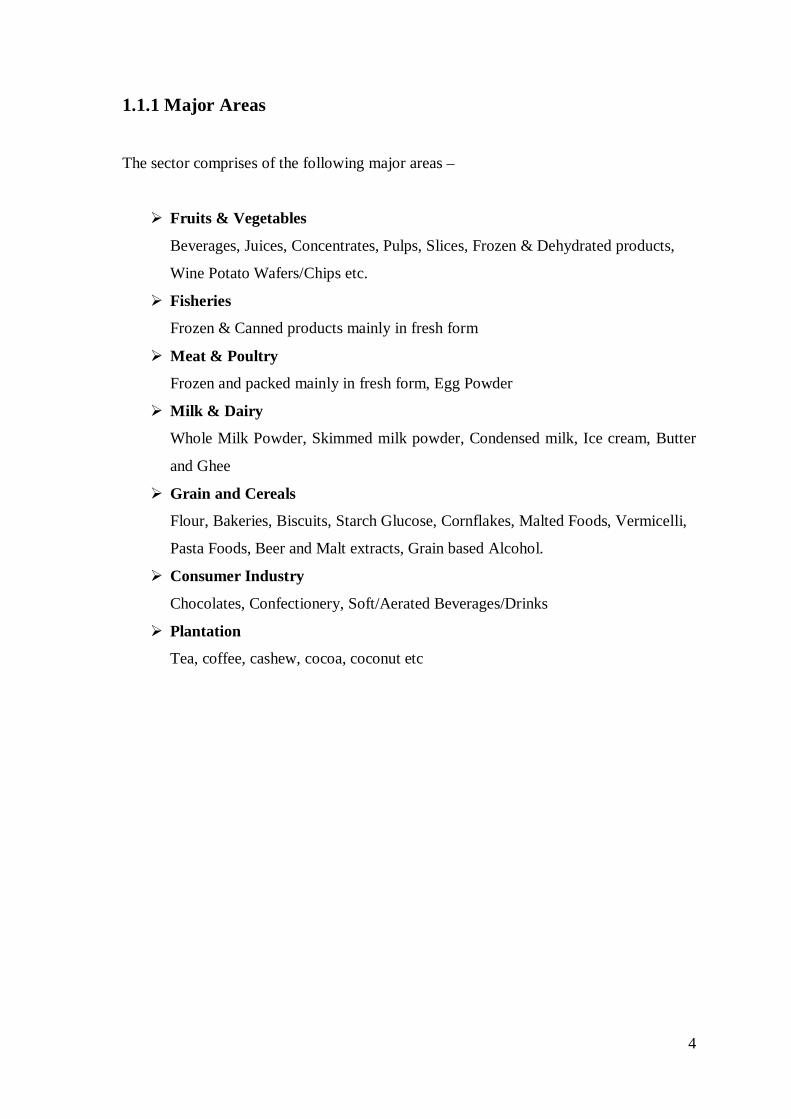
1.1.1 Major Areas
The sector comprises of the following major areas –
Fruits & Vegetables
Beverages, Juices, Concentrates, Pulps, Slices, Frozen & Dehydrated products,
Wine Potato Wafers/Chips etc.
Fisheries
Frozen & Canned products mainly in fresh form
Meat & Poultry
Frozen and packed mainly in fresh form, Egg Powder
Milk & Dairy
Whole Milk Powder, Skimmed milk powder, Condensed milk, Ice cream, Butter
and Ghee
Grain and Cereals
Flour, Bakeries, Biscuits, Starch Glucose, Cornflakes, Malted Foods, Vermicelli,
Pasta Foods, Beer and Malt extracts, Grain based Alcohol.
Consumer Industry
Chocolates, Confectionery, Soft/Aerated Beverages/Drinks
Plantation
Tea, coffee, cashew, cocoa, coconut etc
5
1.1.2. Benefits of Food and dairy industry
Benefits of food and dairy include toxin removal, preservation, easing marketing and
distribution tasks, and increasing food consistency. In addition, it increases seasonal
availability of many foods, enables transportation of delicate perishable foods across long
distances and makes many kinds of foods safe to eat by de-activating spoilage and
pathogenic micro-organisms. Modern supermarkets would not exist without modern food
and dairy techniques, long voyages would not be possible and military campaigns would
be significantly more difficult and costly to execute. Processed foods are usually less
susceptible to early spoilage than fresh foods and are better suited for long distance
transportation from the source to the consumer. When they were first introduced, some
processed foods helped to alleviate food shortages and improved the overall nutrition of
populations as it made many new foods available to the masses. Modern food and dairy
product also improves the quality of life for people with allergies, diabetics, and other
people who cannot consume some common food elements. Food and dairy products can
also add extra nutrients such as vitamins.
The significant benefits for different stakeholders involved in food and dairy are:
Farmer – higher yield, better farm realization, lower risk
Consumer – greater variety, lower prices, new products
Companies – new business opportunities, demand growth
Economy/Government – Employment generation, reduced rural migration
6
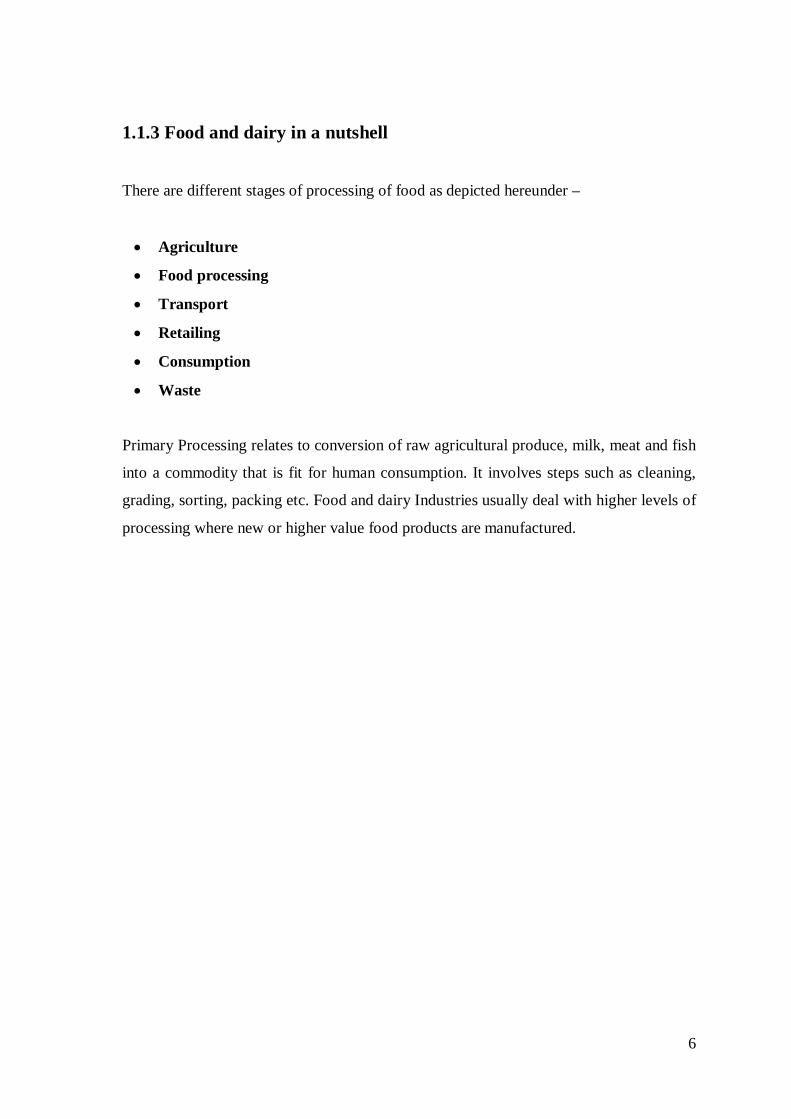
1.1.3 Food and dairy in a nutshell
There are different stages of processing of food as depicted hereunder –
• Agriculture
• Food processing
• Transport
• Retailing
• Consumption
• Waste
Primary Processing relates to conversion of raw agricultural produce, milk, meat and fish
into a commodity that is fit for human consumption. It involves steps such as cleaning,
grading, sorting, packing etc. Food and dairy Industries usually deal with higher levels of
processing where new or higher value food products are manufactured.
7
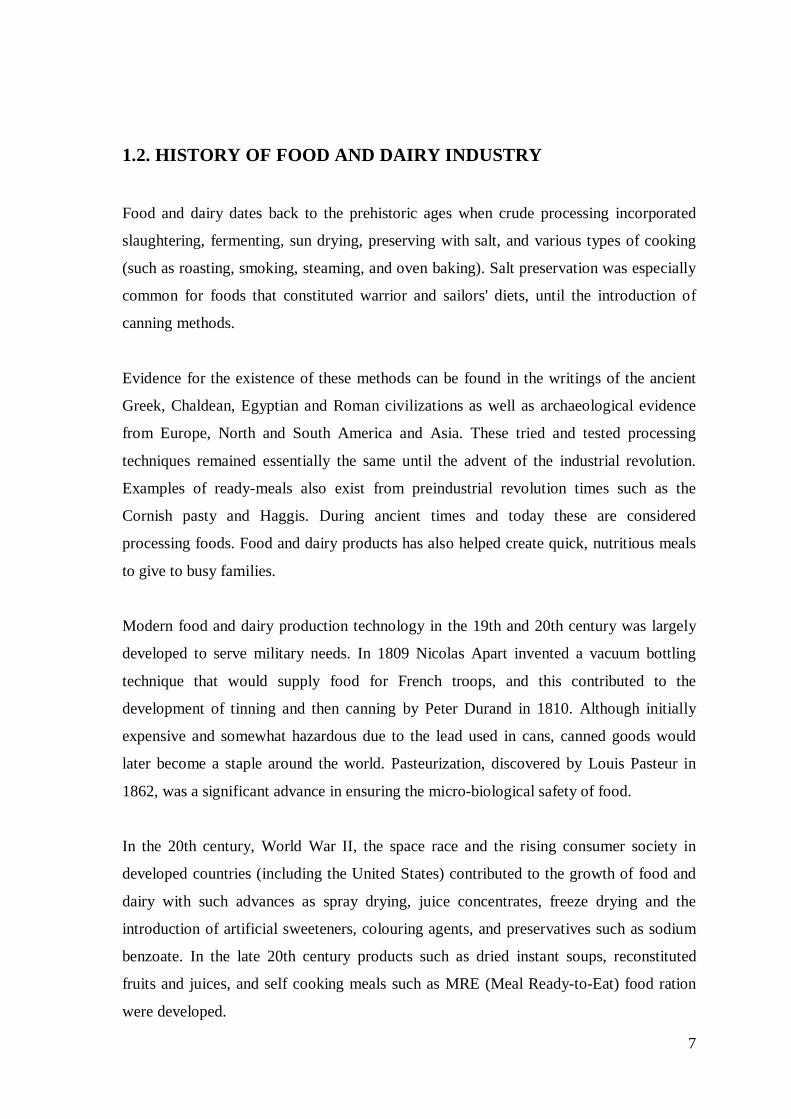
1.2. HISTORY OF FOOD AND DAIRY INDUSTRY
Food and dairy dates back to the prehistoric ages when crude processing incorporated
slaughtering, fermenting, sun drying, preserving with salt, and various types of cooking
(such as roasting, smoking, steaming, and oven baking). Salt preservation was especially
common for foods that constituted warrior and sailors' diets, until the introduction of
canning methods.
Evidence for the existence of these methods can be found in the writings of the ancient
Greek, Chaldean, Egyptian and Roman civilizations as well as archaeological evidence
from Europe, North and South America and Asia. These tried and tested processing
techniques remained essentially the same until the advent of the industrial revolution.
Examples of ready-meals also exist from preindustrial revolution times such as the
Cornish pasty and Haggis. During ancient times and today these are considered
processing foods. Food and dairy products has also helped create quick, nutritious meals
to give to busy families.
Modern food and dairy production technology in the 19th and 20th century was largely
developed to serve military needs. In 1809 Nicolas Apart invented a vacuum bottling
technique that would supply food for French troops, and this contributed to the
development of tinning and then canning by Peter Durand in 1810. Although initially
expensive and somewhat hazardous due to the lead used in cans, canned goods would
later become a staple around the world. Pasteurization, discovered by Louis Pasteur in
1862, was a significant advance in ensuring the micro-biological safety of food.
In the 20th century, World War II, the space race and the rising consumer society in
developed countries (including the United States) contributed to the growth of food and
dairy with such advances as spray drying, juice concentrates, freeze drying and the
introduction of artificial sweeteners, colouring agents, and preservatives such as sodium
benzoate. In the late 20th century products such as dried instant soups, reconstituted
fruits and juices, and self cooking meals such as MRE (Meal Ready-to-Eat) food ration
were developed.

8
In Western Europe and North America, the second half of the 20th century witnessed a
rise in the pursuit of convenience. Food and dairy companies marketed their products
especially towards middle-class working wives and mothers. Frozen foods (often credited
to Clarence Birdseye) found their success in sales of juice concentrates and "TV dinners".
Processors utilised the perceived value of time to appeal to the post-war population, and
this same appeal contributes to the success of convenience foods today.
9
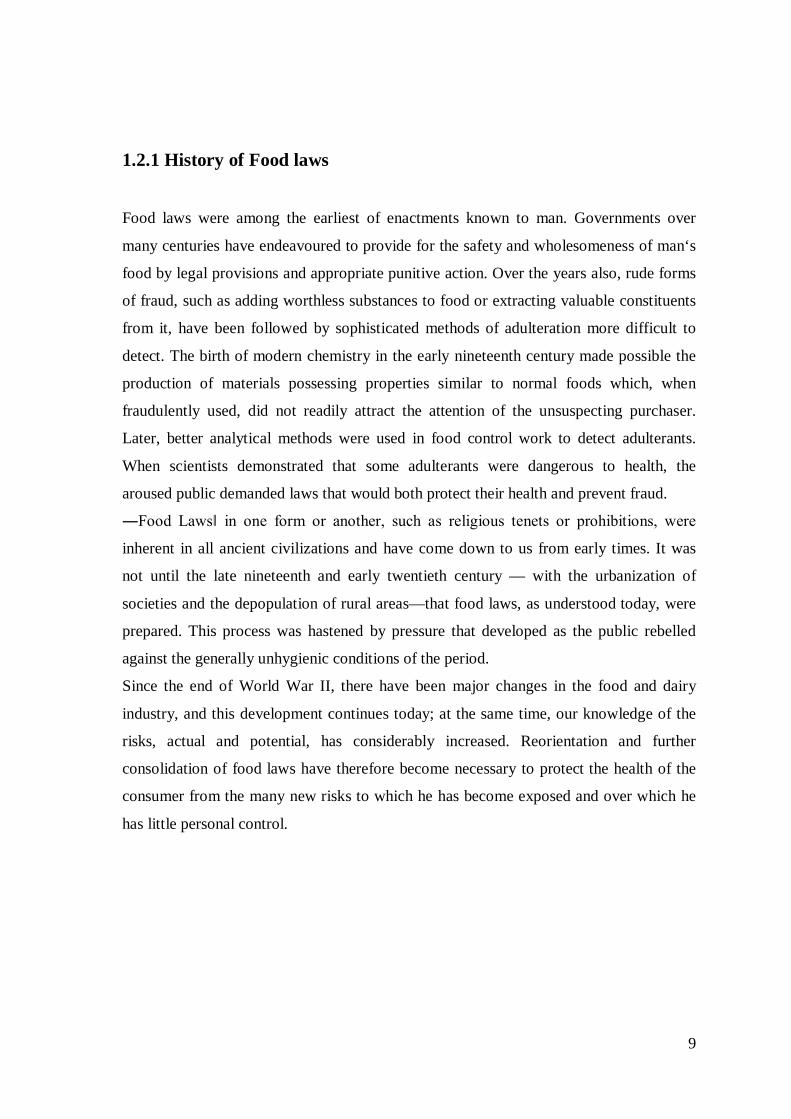
1.2.1 History of Food laws
Food laws were among the earliest of enactments known to man. Governments over
many centuries have endeavoured to provide for the safety and wholesomeness of man‘s
food by legal provisions and appropriate punitive action. Over the years also, rude forms
of fraud, such as adding worthless substances to food or extracting valuable constituents
from it, have been followed by sophisticated methods of adulteration more difficult to
detect. The birth of modern chemistry in the early nineteenth century made possible the
production of materials possessing properties similar to normal foods which, when
fraudulently used, did not readily attract the attention of the unsuspecting purchaser.
Later, better analytical methods were used in food control work to detect adulterants.
When scientists demonstrated that some adulterants were dangerous to health, the
aroused public demanded laws that would both protect their health and prevent fraud.
―Food Laws‖ in one form or another, such as religious tenets or prohibitions, were
inherent in all ancient civilizations and have come down to us from early times. It was
not until the late nineteenth and early twentieth century — with the urbanization of
societies and the depopulation of rural areas—that food laws, as understood today, were
prepared. This process was hastened by pressure that developed as the public rebelled
against the generally unhygienic conditions of the period.
Since the end of World War II, there have been major changes in the food and dairy
industry, and this development continues today; at the same time, our knowledge of the
risks, actual and potential, has considerably increased. Reorientation and further
consolidation of food laws have therefore become necessary to protect the health of the
consumer from the many new risks to which he has become exposed and over which he
has little personal control.
10
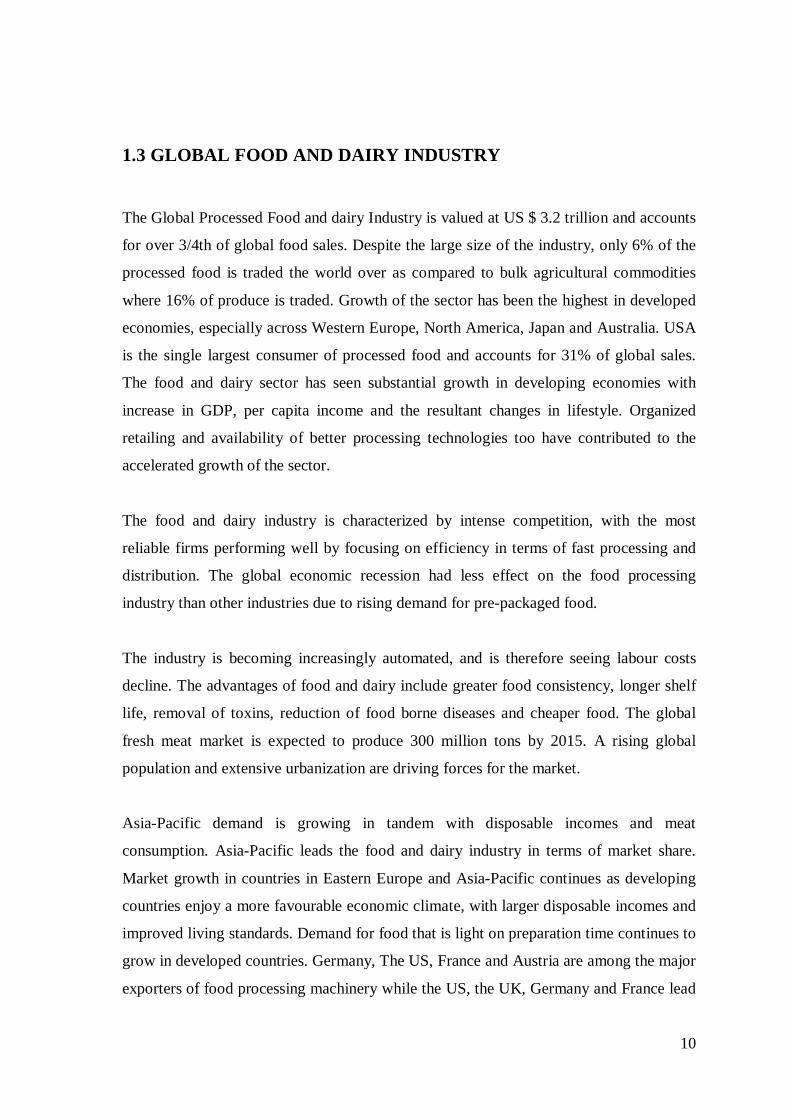
1.3 GLOBAL FOOD AND DAIRY INDUSTRY
The Global Processed Food and dairy Industry is valued at US $ 3.2 trillion and accounts
for over 3/4th of global food sales. Despite the large size of the industry, only 6% of the
processed food is traded the world over as compared to bulk agricultural commodities
where 16% of produce is traded. Growth of the sector has been the highest in developed
economies, especially across Western Europe, North America, Japan and Australia. USA
is the single largest consumer of processed food and accounts for 31% of global sales.
The food and dairy sector has seen substantial growth in developing economies with
increase in GDP, per capita income and the resultant changes in lifestyle. Organized
retailing and availability of better processing technologies too have contributed to the
accelerated growth of the sector.
The food and dairy industry is characterized by intense competition, with the most
reliable firms performing well by focusing on efficiency in terms of fast processing and
distribution. The global economic recession had less effect on the food processing
industry than other industries due to rising demand for pre-packaged food.
The industry is becoming increasingly automated, and is therefore seeing labour costs
decline. The advantages of food and dairy include greater food consistency, longer shelf
life, removal of toxins, reduction of food borne diseases and cheaper food. The global
fresh meat market is expected to produce 300 million tons by 2015. A rising global
population and extensive urbanization are driving forces for the market.
Asia-Pacific demand is growing in tandem with disposable incomes and meat
consumption. Asia-Pacific leads the food and dairy industry in terms of market share.
Market growth in countries in Eastern Europe and Asia-Pacific continues as developing
countries enjoy a more favourable economic climate, with larger disposable incomes and
improved living standards. Demand for food that is light on preparation time continues to
grow in developed countries. Germany, The US, France and Austria are among the major
exporters of food processing machinery while the US, the UK, Germany and France lead
11
in importing. China‘s processed food industry is expected to continue showing close to
35% yearly growth from 2010 through 2013, mainly due to higher standards of living and
improved economic conditions. China‘s processed food market was left relatively
unscathed by the economic downturn. Growth will continue to be lead by meat
processing, with a forecast yearly growth of more than 15% for the next few years. Other
leading food market segments in China are dairy products and ready meals. Growth will
likely continue as China‘s 25% rate of processed food production catches up with the
average 80% rate in developed nations such as the US.
The main driving force behind the global food industry is technological innovation,
which concentrates on satisfying consumer demand for more tastes and easy-
topreparefoods. Companies are focusing on innovation to boost profits, with 60% of large
companies and over 40% of medium sized enterprises investing in process and product
innovation. Over 99% of the EU food and beverage industry is comprised of small-and-
medium-sized enterprises. Danish, French and Greek food and dairy companies dedicate
a sizeable part of their profit to research and development, while other countries such as
Austria, Hungary and the Czech Republic lag further behind. The main aims of research
and development within the food and dairy industry are better quality food, enhanced
taste, cheaper prices and greater convenience. Other industries recruited in the process
include nanotechnology, biotechnology and other advanced information technology
fields. Companies cut production costs by: reducing waste; employing effective
manufacturing techniques used in other industries; optimizing automation to cut back on
labor costs; and finding ways to cut down on input materials such as energy.
12
1.4 FOOD AND DAIRY INDUSTRY IN INDIA
The Indian food and dairy industry stands at $135 billion and is estimated to grow with a
CAGR of 10 per cent to reach $200 billion by 2015. The food and dairy industry
contributed 7% to India‘s GDP. The industry employs around 13 million workers directly
and about 35 million indirectly. The industry is segmented into sectors namely, milk and
allied products (dairy), meat and poultry, seafood, bakery and confectionery, fruit and
vegetables, grain, pulses and oilseeds (staple) products, alcoholic and non-alcoholic
products (beverages), and packaged foods. The classification is not distinct as many
processed products overlap different segments.
India ranks No. 1 in the world in production of Milk (Fresh, whole, buffalo), Pulses,
Ginger, Chick Peas, Bananas Guavas, Papayas and Mangoes. Further, India ranks No. 2
in the world in production of Rice, Wheat, Potatoes, Garlic, Cashew Nuts, Groundnuts,
Dry Onion, Green Peas, Pumpkins, Gourds, and cauliflowers. With the huge production
base India can easily become the leading food supplier to the world and at the same time
serving its vast growing domestic market with over a billion people.
Investments in the registered food and dairy units have been growing in the recent years.
In 2007-08 the fixed capital of registered food and dairy units have increased by 18.93%
over the previous year. Food and dairy industry in India is increasingly seen as a potential
source for driving rural economy as it brings synergy between industry and agriculture.
A developed food and dairy industry is expected to lead increase in farm gate prices
translating into increased rural incomes, reduce wastages, ensure value addition, promote
crop diversification, generate employment opportunities as well as export earnings. With
such a large and diversified production base coupled with low manpower cost and
modern technology, the Indian food processing sector is poised for growth, if the
advantages are leveraged optimally.
The growth is driven by the fact that the central government has given a priority status to
all agro-processing businesses. Government incentives in the field of mega food parks,
cold chain and exports benefits are also playing an important role in promoting food and
dairy.
13
The major challenges are investments at different points of the supply and value chain,
proper research, farm and lab connectivity, up gradation of technology, increase in farm
holding, skill and manpower training, backend and front-end integration and cold chain
integration.
The opportunities in the food and dairy industry are vast. However, there is a need to
improve technology and productivity to be competitive globally. As the economy grows,
the food and dairy industry will offer bigger opportunities to the new as well as the
existing players.
India has the second largest arable land of 161 million hectares and has the highest
acreage under irrigation. Next to China, India ranks second largest food producer in the
world and has the potential to immerge the biggest with its food and agricultural sector.
India accounts for less than 1.5% of international food trade despite being one of the
world‘s major food producers, which indicates huge potential for both investors and
exporters.
Advantage India
India is one of the largest food producers in the world.
India has diverse agro-climatic conditions and has a large and diverse raw
material base suitable for food processing companies.
India is looking for investment in infrastructure, packaging and marketing.
India has huge scientific and research talent pool.
Well developed infrastructure and distribution network.
Rapid urbanization, increased literacy, changing life style, increased number of
women in workforce, rising per capita income leading to rapid growth and new
opportunities in food and beverages sector.
50 per cent of household expenditure by Indians is on food items.
Strategic geographic location (proximity of India to markets in Europe and Far
East, South East and West Asia).
14
1.4.1 Key growth drivers of Food and dairy Sector in India
Increasing spending on health and nutritional foods.
Increasing number of nuclear families and working women
Changing lifestyle
Functional foods, fresh or processed foods
Organized retail and private label penetration
Changing demographics and rising disposable incomes
15
1.4.2 Key opportunities in Food and dairy Sector
Processable varieties of crop
Contract farming
Investments in infrastructure through Public Private partnership (PPP)
Mega Food parks
Logistics and cold chain infrastructure
Food safety Management Systems
Machinery and packaging
16
1.4.3 Challenges faced by the industry
High level of wastage of agricultural produces is primarily on account of the inherent
disadvantages faced by the sector. This sector is characterized by preponderance of small
farmers, small scale & tiny processors, outdated technology, poor infrastructure and a
maze of middle men. Therefore, this sector needs support in terms of creation and
strengthening of infrastructure which individual farmers and processors will not be in a
position to create and sustain. Further, there is also a need for strengthening R&D
activities in food and dairy sector for innovation of technology which suits local needs,
popularization of appropriate technology, skill development and creation of an
institutional framework supportive of the industry. The major challenges facing the sector
are illustrated below:
17
CHAPTER 2
MAJOR PLAYERS OF
THE INDUSTRY
2.1 Net Profit Based Major Players Of The Industry
2.1.1 Nestle India Limited
2.1.2 Jubliant Food works Limited
2.1.3 Britannia Industry Limited
2.1.4 Cadbury India Limited
2.1.5 Glaxosmithkline Consumer Healthcare Limited
18
2.1 NET PROFIT BASED MAJOR PLAYER OF INDUSTRY
2.1.1 Nestle India Ltd.
Nestle India Ltd, one the biggest players in FMCG segment, has a presence in milk &
nutrition, beverages, prepared dishes & cooking aids & chocolate & confectionery
segments. The company is engaged in the food business. The food business incorporates
product groups, such as milk products and nutrition, beverages, prepared dishes and
cooking aids, chocolates and confectionery. Nestle India manufactures products under
brand names, such as Nescafe, Maggi, Milky bar, Milo, Kit Kat, Bar-One, Milkmaid and
Nestea.
The company has also introduced products of daily consumption and use, such as Nestle
Milk, Nestle Slim Milk, Nestle Fresh 'n' Natural Dahi and Nestle Jeera Raita. The
company's brands include milk products and nutrition, prepared dishes and cooking aids,
beverages, and chocolates and confectionery. Their milk products and nutrition includes
Nestle Everyday Dairy Whitener, Nestle Everyday Ghee, Nestle Milk, Nestle Slim Milk
and Nestle Dahi. Beverages Include Nescafe Classic, Nescafe Sunrise Premium, Nescafe
Sunrise Special and Nescafe Cappuccino. Nestle India is a subsidiary of Nestle S.A.
The company has presence across India with 7 manufacturing facilities and four branch
offices spread across the region. The four branch offices in the country help facilitate the
sales and marketing of its products. They are in Delhi, Mumbai, Chennai and Kolkata.
The company's head office is located in Gurgaon , Haryana.
Nestle India Ltd was incorporated in the year 1956. The company set up their first
production facility in the year 1961 at Moga in Punjab. In the year 1967, they set up their
second plant at Choladi in Tamil Nadu as a pilot plant to process the tea grown in the
area into soluble tea. In the year 1989, they set up a factory at Nanjangud in Karnataka.
In the year 1990, the company entered into the chocolate business by introducing Nestle
Premium Chocolate. In the year 1991, they entered in joint venture floated by the parent
in collaboration with BM Khaitan group to set up facilities to manufacturing a range of
Soya based products. In the year 1993, they set up a factory at Samalkha in Haryana. In
the year 1995, the company launched the company's worldwide legendary brand
chocolate, Kitkat.
19
The company commissioned two factories in Goa at Ponda and Bicholim in the year
1995 and 1997 respectively. In the year 1999, the company launched the product, Nestle
Growing Up Milk nationally. In April 2000, they forayed into the Ultra Heat Treated
(UHT) liquid milk market. In the year 2001, the company launched Nestle Pure Life
bottled water. Within few months, they again launched their second water brand-San
Pellegrino - in the Indian market. The company also made their foray into the iced tea
segment.
In the year 2004, a project has been initiated to upgrade the production technology for
infant nutrition products at the Samalkha factory. Nestle India Ltd recognised for its
outstanding performance in Exports by the Coffee Board of India in the Export Awards
2004-05 as the Best Exporter of Instant Coffee, Best Exporter to Russia & CIS Countries
(coffee) and Best Exporter for Far East Countries (coffee). The company bestowed the
UDYOG RATNA award by the PHD Chamber of Commerce and Industry to recognise
Nestle's significant contribution to the economic development of Punjab for the year
2005. The company set up a new department -the Channel & Category Sales
Development (CCSD) to develop new solutions for the various channels and customers
and improve the implementation of commercial plans in the market.
In the year 2006, the company set up their seventh factory at Pantnagar in Uttarakhand.
In the year 2007, CNBC Asia presented the company with the India Innovator of the year
award. The company's four factories were awarded the internationally recognised
external certification ISO 14001 for adherence to environmental processes and OSHAS
18001 for Health and Safety.
In the year 2008, the company launched Nestle Nesvita Pro-Heart Milk with Omega-3 in
Mumbai. Nestle Nesvita Pro-Heart is part of daily diet and has Omega-3 heart friendly
nutrients scientifically known to help manage cholestrol. As part of their ongoing
commitment to offering best in class nutrition products to Indian consumers, the
company launched NESTLE NAN 3, a follow-up formula for older infants.
During the year, MAGGI PICHKOO Tomato Ketchup was launched in a unique easy to
handle day pack to drive affordability, taste and convenience for a larger number of
20
consumers. The company also launched another pioneering product, MAGGI Bhuna
Masala, to cook tasty and healthy everyday meals, more conveniently. The company also
launched Nestle Kitkat Mini and Nestle Bar One Mini, at Rs 3 price to expand the
repertoire of offerings. Similarly, they launched Nestle Kitkat Chunky at Rs15 to
strengthen the range of wellness oriented Nestle products that consumers can choose
from. The company's three more factories were awarded the internationally recognized
external certification ISO 14001 for adherence to environmental processes and OSHAS
18001 for Health and Safety. With this, all the seven factories of the company now have
ISO 14001 and ISO 18001 certifications. In the year 2009, the company provided inputs
to the group R&D for development of an innovative product Maggi Bhuna Masala. They
launched Maggi Nutri-Licious Pazzta. During the year, Maggi further leveraged their
strengths to drive affordable nutrition and launched two new products, namely, Maggi
Rasile Chow and Maggi Masala-ae-Magic. They launched Nestle Kitkat in a new unique
single finger format and Nestle Much Guru pack at the higher price point.
The company acquired the Healthcare Nutrition business of Speciality Foods India Pvt
Ltd with effect from January 1, 2010. In the year 2010, the company expanded the
installed capacity of Milk Products and Nutrition by 3,983 MT to 147,546 MT. Also,
they increased the installed capacity of Prepared Dishes & Cooking aids by 14,028 MT to
205,017 MT.
In the year 2011, the company increased the installed capacity of Milk Products &
Nutrition by 14,561 MT to 162,107 MT, Prepared dishes & Cooking aids by 21,430 MT
to 226,447 MT and Chocolate & Confectionery by 3,283 MT to 36,052 MT.
21
1.2.2 Jubilant food works Limited
Jubilant Food works Ltd, a Jubilant Bhartia Group Company is a food service company.
The company offers a menu of quality pizza and side dishes to their customers. They
operate their stores pursuant to a Master Franchise Agreement with Domino's
International, which provides them with the exclusive right to develop and operate
Domino's pizza delivery stores and the associated trademarks in the operation of stores in
India, Nepal, Bangladesh and Sri Lanka. The pizza stores in Sri Lanka are operated by
their sub-franchisee, DP Lanka. There are currently five Domino's stores in Sri Lanka, all
in Colombo.
The company was the largest pizza chain in India and one of the fastest growing multi-
national fast food chains between 2006-2007 and 2008-2009, in terms of number of
stores. Their Domino's pizza stores in India are generally located in neighbourhood
markets in urban areas. They also operate pizza stores located in food courts in shopping
malls and in institutional campuses.
Jubilant Food works Ltd was incorporated on March 16, 1995 as a private limited
company with the name Domino's Pizza India Pvt Ltd. The company entered into a
master franchise agreement with Domino's International for north and west regions in
India.
In January 1996, the company opened their first Domino's pizza store. In September 14,
1996, the company was converted into a public limited company and the name was
changed to Domino's Pizza India Ltd. In the year 1998, they extended master franchise
agreement with Domino's International to whole of India and Nepal.
In the year 2001, the company made a tie-up with Hindustan Coca-Cola Beverages Pvt
Ltd. In the year 2003, they became the subsidiary of Jubilant Enpro Pvt Ltd. In the year
2004, they launched '30 minutes or free' campaign. In the year 2005, the company
entered into master franchise agreement for Sri Lanka and Bangladesh.
22
In the year 2009, the company launched 'Pizza Mania'. Also, they began to offer pasta
and choco lava cake to their customers as a side item. They opened 60 new stores during
the financial year 2008-09.
In September 17, 2009, the company entered into a trademark license agreement with
Domino's International whereby Domino's International conferred on the company a non-
exclusive right to use the trademarks and service marks ('Domino's Trademarks') in India.
In September 23, 2009, the company entered into an agreement with Domino's
International for the grant of the exclusive right and license to establish and operate a
commissary and to sell and distribute products using the know-how in the Territory and
the exclusive right and license to prepare, process and produce Products using the
technical knowledge in the Territory.
In September 24, 2009, the company changed their name from Domino's Pizza India Ltd
to Jubilant Foodworks Ltd. The company plans to open between 65 and 70 stores during
the financial year 2009-10, of which they opened 31 stores as of November 30, 2009 in
the existing cities.
As of November 30, 2009, the company operated 286 stores in India located in 22 states
and union territories, including in 59 cities across the country, and, through a sub-
franchisee, DP Lanka, five stores in Sri Lanka. As of November 30, 2009, we did not
operate any stores in Nepal and Bangladesh.
The company plans to expand their presence by entering into new cities and towns where
they currently have no operations. They plan to open new stores in cities and towns
which would be located within less than one day travel distance from their existing
commissaries in order to minimize additional capital expenditure and ensure quality
control.
Further, the company's Master Franchise Agreement with Domino's International
requires them to open 25 stores each, in 2011 and 2012 and they continue to evaluate
various new locations for further expansion. They are also exploring the possibility of
opening stores in the New Delhi and Mumbai airports on sub-franchise or sub-lease
basis.
23
2.1.3 Britannia Industry Limited.
Britannia Industries Limited (BIL) is a major player in the Indian Foods market with
leadership position in Bakery category. Its brand portfolio includes Tiger, Marie Gold,
Good Day, 50:50 and Treat. The Company was born in 21st March of the year 1918 as a
public limited company. The Company's plants are situated in Kolkata, Delhi, Chennai,
Mumbai and Uttarakhand. In 1921, it became the first company east of the Suez Canal to
use imported gas ovens. Britannia's business was flourishing. But, more importantly,
Britannia was acquiring a reputation for quality and value. As a result, during the tragic
World War II, the Government reposed its trust in Britannia by contracting it to supply
large quantities of 'service biscuits' to the armed forces.
A new factory was established in the year 1924 at Kasara Pier Road in Mumbai. In the
same year, the Company became a subsidiary of Peek, Frean & Company Limited, U.K.,
a leading biscuit manufacturing company, and further strengthened its position by
expanding the factories at Calcutta and Mumbai. In 1952, the Kolkata factory was shifted
from Dum Dum to spacious grounds at Taratola Road in the suburbs of Kolkata. During
the same year automatic plants were installed in Calcutta and later in 1954 the automatic
plants were installed in Mumbai plant, also in the same year the development of high
quality sliced and wrapped bread in India was initiated by the company and was first
manufactured at Delhi and a new bread bakery was set up at Delhi in the year 1965.
Britannia Biscuit Company takes over biscuit distribution from Parry's during the year
1975. In 1976, the company had introduced Britannia bread in Calcutta and Chennai.
During the year 1978, the company made Public issue, in that Indian shareholding
crossed 60%.
The Company re-christened from Britannia Biscuit Company Limited to Britannia
Industries Limited with effect from 3rd October of the year 1979. The Company had
signed a 10-year technical collaboration agreement with Nebico Pvt Ltd., Nepal during
the year 1980 for the supply of know-how relating to manufacturing, packaging and
marketing of biscuits and selection of plant and machinery. During the year 1989, BIL's
24
Executive Office was relocated to Bangalore. During the year 1990, two new brands of
biscuits, Elaichi Creamand and Petit Beurre were launched. Also, in the same year a new
cashew badam variant of the brand Milk Bikis and brand extension of pure magic biscuit
Vanilla cream were launched, Fruit bread was launched in Delhi. The Company launched
two new speciality brands in the year 1991 viz., Britannia milk bread and Britannia
brown bread in Delhi and extended nationally its main brands Petit Beurre and Elaichi
Cream. In 17th August of the year 1991, the Company handed over its Soya unit at
Vidisha, MP to SM Dychem Ltd. BIL had celebrated its Platinum Jubilee in the year
1992. After a year in 1993, Wadia Group had acquired the stake in ABIL, UK and
becomes an equal partner with Group Danone in BIL. The Company was in re birth
phase during the year 1997, new corporate identity 'Eat Healthy, Think Better' leads to
new mission of 'Make every third Indian a Britannia consumer' and in the same year BIL
entered into the dairy products market. In 1998, BIL had launched Half/Half, a soft cake
filled with cream in two variants, chocolate-vanilla and vanilla-orange. The Company
had rolled out its flavored milk brand Zip-Sip' in tetrapaks in the year 1999. Zip-Sip had
been launched in Mumbai and some markets in the South.
Forbes Global Ranking was rated the company during the year 2000, Britannia among
Top 300 small companies. In the same year, the company had launched Britannia
Milkman Butter, a product under the Milkman brand. BIL made its fund in-principle
agreement to acquire 49 per cent of Kwality Biscuits in the year 2001 through internal
accruals. During the year 2002, the company had entered into a joint venture with the
Fonterra Cooperative Group, New Zealand's biggest company and one of the leading
diary co-operative groups in the world and the Britannia New Zealand Foods Pvt. Ltd
was born. Pure Magic, the company's product was winner of the Worldstar, Asiastar and
Indiastar award for packaging in the same year 2002. After a year, in 2003, BIL had
launched 'Treat Duet', most successful of the year and Britannia Khao World Cup Jao
rocks the consumer lives yet again. During the year 2004, Britannia accorded the status
of being a 'Superbrand' and the brand Good Day added a new variant Choconut in its
range. Reviewed marketing alliance with the Kolkata-based Thacker Dairy Products Pvt
Ltd.
25
In the year 2005, Britannia New Zealand had launched health drink for adult. The new
plant in Uttaranchal, commissioned during the year 2005, it was ahead of schedule. In the
same year, launched yet another exciting snacking option the Britannia 50-50 Pepper
Chakkar. BIL had forged a strategic alliance with CCD Daily Bread Pvt Ltd in the year
2006, a Bangalore based Company engaged in manufacturing and retailing of premium
breads, cakes snacks and high end ready to eat foods. In the year 2007, Britannia
industries formed a joint venture with the Khimji Ramdas Group and acquired a 70
percent beneficial stake in the Dubai-based Strategic Foods International Co. LLC and
65.4% in the Oman-based Al Sallan Food Industries Co. SAOG. The company was rated
as the No 1 Most Trusted Food Brand in a survey conducted by AC Nielsen ORGO-
MARG and published in Economic Times in the year 2007. Britannia launched Iron
fortified 'Tiger Banana' biscuits, 'Good Day Classic Cookies', Low Fat Dahi and
renovated 'MarieGold' during the period of 2008. BIL was ranked 27th place in the list of
India's Fastest Growing Large Companies by Business Today, Special on June of the year
2008.
26
2.1.4 Cadbury India Limited.
Cadbury India Ltd, a subsidiary of Cadbury Schweppes Overseas Ltd is a leading global
confectionery company with an outstanding portfolio of chocolate, gum and candy
brands. The company manufactures and sells chocolate blocks, slabs, or bars; coated
wafer biscuits; malted food; and sugar confectionery. They also export their products to
Sri Lanka, Dubai, Ghana and Maldives.
The company has manufacturing facilities at Thane and Induri in Maharashtra, Malanpur
in Madhya Pradesh, Bangalore in Karnataka and Baddi in Himachal Pradesh and 4 sales
offices at Mumbai, Kolkata, New Delhi, and Chennai. The corporate office is in Mumbai.
The company operates in four categories namely, Chocolate Confectionery, Milk Food
Drinks, Candy and Gum category.
In the Chocolate Confectionery business, the company has maintained their undisputed
leadership over the years, which has some key brands, namely Cadbury Dairy Milk, 5
Star, Perk, Eclairs and Celebrations. In the Milk Food drinks segment, the main product
is Bournvita, which is the leading Malted Food Drink in the country. In the medicated
candy category Halls is the undisputed leader and in the gums category the company
launched the worldwide dominant bubble gum, with the name Bubbaloo.
Cadbury India Ltd was incorporated in the year 1948 as a private limited company with
the name Cadbury Fry (India) Pvt Ltd. The company began their operations in India by
importing chocolates. In the year 1950s, the company started the manufacture of
Chocolate and Bournvita. Also, they launched Cadbury's Fruit & Nut.
In the year 1960s, the company set up a Cocoa Research Centre in Kerala. They set up
their first plant in India at Thane in Maharashtra. Also, they launched Cadbury's Tiffins,
Nut Butterscotch, Caramels, Crackle, 5 Star and Gems.
27
In the year 1970s, the company commissioned the Malt Extract Plant at Induri in
Maharashtra. The name of the company was changed from Cadbury Fry (India) Pvt Ltd
to Cadbury India Ltd. They launched Cadbury's Eclairs during this period. In the year
1980s, the company was converted into a public limited company. In the year 1990s, the
company launched the Sugar Confectionery business with Trebor Googly. They launched
Cadbury's Perk, Cadbury's Truffle and Picnic during this period.
In the year 2002, the company increased the production of Malted Foods from 6,570
tonnes to 7,900 tonnes. In December 2002, Cadbury Schweppes Plc UK acquired the
global non-chocolate confectionary business of Pfizer Inc, USA namely Warner Lambert
India Pvt Ltd. In the year 2003, Halls and Clorets were manufactured and successfully
marketed by the company. Also, the company increased the production capacity of
Malted Foods by 700 tonnes to 8,600 tonnes.
Cadbury Schweppes Plc through their subsidiaries, Cadbury Schweppes Overseas Ltd
and Cadbury Schweppes Mauritius Ltd acquired equity shares of the company in excess
of 90% with led to delisting of the company's equity shares from The Stock Exchange,
Mumbai with effect from January 20, 2003 and National Stock Exchange Ltd, Mumbai
with effect from February 7, 2003. In the year 2005, the company increased the production capacity of Malted Foods by
4,600 tonnes to 13,200 tonnes and Hard Boiled confectionery & Gums by 1,026 tonnes to
8,651 tonnes. In the year 2006, they increased the production capacity of Malted Foods
by 9,000 tonnes to 22,200 tonnes and Hard Boiled confectionery & Gums by 1,489
tonnes to 10,140 tonnes. In the year 2007, the company expanded the production
capacity of Malted Foods by 4,200 tonnes to 26,400 tonnes and Hard Boiled
confectionery & Gums by 6,630 tonnes to 16,770 tonnes and in the year 2008, they
expanded the production capacity of Hard Boiled confectionery & Gums by 7,830 tonnes
to 24600 tonnes.
28
In March 2008, the company launched Cadbury Lite for consumers with diabetes, which
contains a sugar substitute called Maltilol that ensures a low glycemic index in the
product. In May 2008, the company joined hands with Tamil Nadu Agricultural
University for a research project to promote Cocoa cultivation in Tamilnadu.
In October 2008, the company launched their dark chocolate Cadbury Bournville Fine
Dark Chocolate in India, which is the fastest growing segment in the confectionary
category. The chocolate is available in four different variants namely, Rich Cocoa,
Almond, Hazelnut and Raisin & Nut. In February 2009, they launched Cadbury Bourn
vita Li'l Champs, their latest offerings for children.
The company is setting up a new manufacturing facility (Unit 2) at Baddi, Himachal
Pradesh. The construction of the unit is progressing well and is expected to be fully
operational in the year 2009.
29
2.1.5 GlaxoSmithKline Consumer health care Limited
GlaxoSmithKline Consumer Healthcare Ltd is one of the largest players in the Health
Food Drinks industry in India. The company is an Indian associate of GlaxoSmithKline
plc, UK. The company's principal activities are to manufacture and distribute a wide
range of healthcare foods, drugs, pharmaceuticals and dairy products. The products
include malted milk food, malted foods, biscuits, energy and protein foods, milk
powders, ghee, milk fluid and milk cream. The company has their manufacturing
facilities located at Nabha in Punjab, Rajahmundry in Andhra Pradesh and Sonepat in
Haryana.
The products of GSK Consumer are categorized as Nutritional and Over the Counter
(OTC) products. The Nutritional division includes health food drinks like Horlicks,
which includes Junior Horlicks, Mother's Horlicks, Women's Horlicks, Horlicks Lite, and
Horlicks biscuits, Boost, Viva and Maltova. The OTC division promotes and distributes a
number of products in diverse categories, including prominent brands such as, Crocin,
Eno and Iodex.
GlaxoSmithKline Consumer Healthcare Ltd was incorporated in the year 1958 as
Hindustan Milkfood Manufacturers Pvt Ltd and was promoted by Horlicks Ltd. The
company became public in the year 1961. In the year 1969, Beecham plc acquired
Horlicks Ltd and became the majority shareholder in Hindustan Milkfood Manufactures
Ltd and in the year 1979, Beecham India Pvt Ltd merged with the company. In the year
1991, the name of the company was changed to HMM Ltd.
In the year 1989, Beecham plc, UK and SmithKline, USA merged to form SmithKline
Beecham plc. The company became part of SmithKline Beecham and the name was
changed to SmithKline Beecham Brands Ltd. Again, in March 1994, the company name
was changed to SmithKline Beecham Consumer Healthcare Ltd, reasserting their
promise of providing healthcare to consumers.
30
In the financial year 2000, the company acquired two new brands Viva and Maltova
along with their patents and trademarks from Jagatjit Industries Ltd. The company also
tied up the manufacturing capacity of Jagatjit Industries Ltd for the manufacture of Viva
and Maltova on a long term contract.
Glao Wellcom plc and SmithKline Beecham plc merged and form a global organization
GlaxoSmithKline plc. As the company is an associate company of GlaxoSmithKline plc,
the name of the company was changed from SmithKline Beecham Consumer Healthcare
Ltd to GlaxoSmithKline Consumer Healthcare Ltd with effect from April 23, 2002.
In the year 2002, the company commissioned their new Spray Drier plant at Sonepat and
the commercial production was started form July 1, 2002. Also, Gussetted Pouch packing
operations were relocated from Nabha factory to a 'State of Art' greenfield facility set up
by a contracted third party at Mangaldoi, Assam. As a result of restructuring process, the
company's packing facility at Kolkata was closed with effect from September 2002.
The company is a consignment sales agent for marketing, selling & distribution of the
brand Iodex with effect form January 1, 2002. In the year 2004, the company has
launched Junior and Mother's Horlicks, Ready-to-Drink Horlicks & Boost and Hot
Vending Machines. In July 2004, they launched Boost Energy Shake, a new chilled
ready-to-drink variant of Boost in Tamil Nadu. Boost Energy Shake will be available in a
200 ml tetra pack.
In the year 2005, the company opened a new secondary manufacturing site (Legacy
Foods) at Baddi in Himachal Pradesh. In February 2005, they launched Horlicks in a new
Toffee flavour. Toffee Horlicks is the sixth flavour in the Horlicks portfolio. The other
flavours are Chocolate, Vanilla, Honey Buzz, Standard and Elaichi.
In the year 2006, the company increased their installed capacity of Malt Based
Foods/Malted Foods and Ghee by 3260 MT and 924 MT respectively. With this
expansion the total installed capacity of Malt Based Foods/Malted Foods and Ghee
increased to 94060 MT and 4000 MT respectively.
31
In the year 2007, the company increased their installed capacity of Malt Based Foods
and Milkrose Baby Foods by 340 MT and 760 MT respectively. With this expansion, the
total installed capacity of Malt Based Foods and Milkrose Baby Foods increased to
94400 MT and 2200 MT respectively.
In the year 2008, the company launched Women's Horlicks, which is specially
formulated for women. New Women's Horlicks is scientifically designed with a unique
combination of Hemocaltm nutrients which provides 100% of the daily requirement of
iron, calcium, Vitamins B2, B6, B12 & C for healthy blood and its normal function. New
Women's Horlicks has no added sugar and is low-fat. It is available in two exciting
flavors- Chocolate and Caramel in a jar with a unique flip top cap. Also, they launched
Active Base and Boost White during the year. In January 2009, the company launched
'Activ Grow', which is a nutritious product launched for infant population. The product
will be sold through prescription only.
In the year 2009, the company relaunched Boost with a clinically proven claim to
increase stamina by three times recorded a growth of 16.2%. They launched a series of
new products. They launched Horlicks Nutribar, which is a nutritious snack. Horlicks
Biscuits was relaunched with a new strategy and packaging. The company also launched
ActiGrow under the GlaxoNutrition umbrella to tap into the fast growing specialist
nutrition segment. The company also entered the noodles segment with the launch of
Horlicks Foodles, instant noodles with seasoning.
32
CHAPTER 3
STRATEGIC ANALYSIS
3.1 INTRODUCTION
3.2 ECONOMIC FEATURES
3.3 PORTER’S FIVE FORCE MODEL
3.4 DRIVING FORCE
3.5 STRATEGIC GROUP MAPPING
3.6 PEST ANALYSES
3.7 SWOT ANALYSIS
3.8 CONCLUSION
33
3.1 INTRODUCTION OF STRATEGIC ANALYSIS
Strategic analysis is a critical component of the strategic planning process. An integral
part of a company’s evaluation and control program, it provides managers with a
comprehensive assessment of the organization’s capabilities and market factors;
revealing growth opportunities and vulnerabilities. Armed with this information,
managers can more effectively choose from among today’s strategic alternatives to create
the greatest future reward potential.
Strategic analysis is critical for analyzing the competitive context in which an
organization operates and for making reasoned and reasonable recommendations for how
that organization should position itself and what actions it should take to maximize value
creation.
34
3.2 ECONOMIC FETURES
Number Of Rivals: As we seen above, there are major more companies in India which are working in Food
And Dairy industry. Yet Food And Dairy industry is dominated by main four companies
namely :
1) Nestle India Ltd.
2) Cadbury India Ltd.
3) GlaxoSmithKline Consumer Healthcare Ltd.
4) Jubliant Food works Ltd
Buyer Need and Requirements:
Dairy foods are extremely healthy, filling and tasty. Dairy producers and marketers are
making sure the public is aware of the healthfulness of dairy products by marketing their
products worldwide. On Monday, March 6, a dairy marketing research symposium was
held at the Renaissance Hotel in Fort Worth, in which people from the dairy industry
discussed new marketing techniques, as well as new research about the dairy industry.
Dairy products that would appeal to the Hispanic population are milk shakes, liquid
yogurt, flavored milk, coffee with milk and kid-oriented products. "These are products
that are untapped in the United States, but are successful in Latin America," Esch said.
"These products should have duel language on the packets."
The drivers for people to buy organic produce are freshness, taste and lack of pesticides.
The drivers for buying organic dairy products are lack of growth hormones and lack of
antibiotics."Three member families have the highest eating index for organic milk,"
McLaughlin said. "It's the highest in families with kids under six years of age."
Dairy producers and dairy processors are doing their best to protect their interests, as they
should. But they are going to have to cooperate because their fates are intertwined.
35
Degree of Product Differentiation:
While the treatment of an agricultural commodity such as wheat, rice, beef, wool, cheese,
maize and wine as a homogeneous good appears to be reasonable in theory, in practice
differences in production practices, seeds, geographical locations of production, sanitary
and phyto-sanitary measures and food safety requirements make the quality of these
commodities (at least, as they are perceived by consumers) different.
The most prominent forms of product differentiation in international trade in recent years
have been horizontal and vertical product differentiations which are related to differences
in product attributes and quality not just perceived by consumers but also due to
differences in factor contents in each product. While significant progress has been made
during the 1980s in terms of developing the theoretical framework to guide empirical
research aimed at explaining intra industry trade, the progress in applying these models in
international trade in food products has been slow.
Product Innovation:
Opening the world Dairy Leaders Forum at the international Dairy Federation (IDF).
First we must innovate constantly to respond to rapidly changing and increasingly diverse
consumer needs. Secondly, we must harness the power of technology to decrease food
waste, maximize food safety and more people with high-quality dairy products.
And thirdly we must work together to ensure not only the economic future of our
industry, but the social and environmental sustainability of our planet.
36
Supply/ Demand Condition:
The Food And Dairy products has traditionally been unique amongst large countries in
that it has depended to varying degrees on imports to satisfy consumer demand. Milk as a
drink, both in and out of the home, has suffered relentless competition from soft drinks.
Their range of product, packaging and availability has increased and the low raw material
costs enable them to be extensively promoted. The consumption of soft drinks by
children in particular has significantly increased and efforts have been made to
modernize the image of milk in order to compete in this sector.
Milk has traditionally had a good image with most consumers, especially house wives
,but in recent years it has seen a decline. Milk is not now seen to be as essential a part of
the diet as it used to be and there is concern and misunderstanding about its fat content.
Pace Of Technological Change:
In the Food And Dairy industry opening the world Dairy Leaders Forum at the
international Dairy Federation (IDF). First we must innovate constantly to respond to
rapidly changing and increasingly diverse consumer needs. Secondly, we must harness
the power of technology to decrease food waste, maximize food safety and more people
with high-quality dairy products.
And thirdly we must work together to ensure not only the economic future of our
industry, but the social and environmental sustainability of our planet.
Economics Of Scale:
The dairy industry together with the dairy farms produces essential products to meet
nutritional needs of the whole population. This paper defines the dairy industry as the
branch of the food industry that includes enterprises processing milk and producing
various dairy products.
37
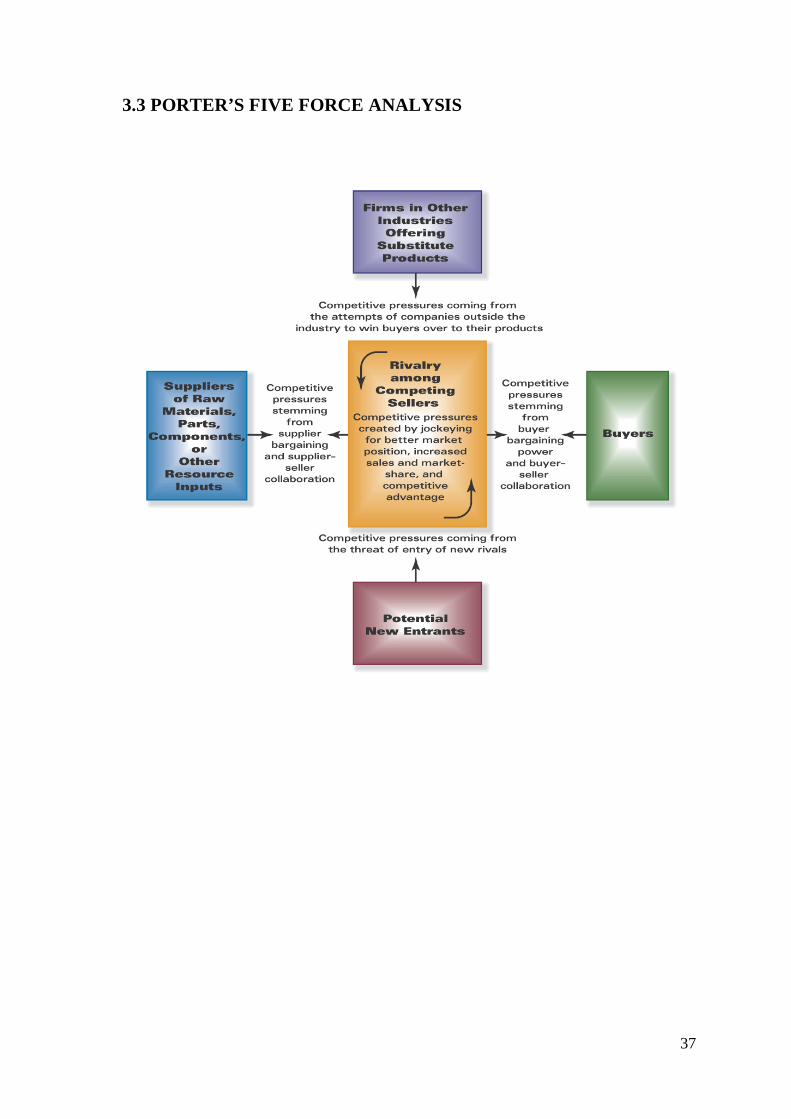
3.3 PORTER’S FIVE FORCE ANALYSIS
38
1) Threats of New Entrants:
In the food and dairy industry there are many restriction of the government and the
barriers to entry in the food and dairy industry.
The barriers to entry in the food and dairy industry are initially low and it is easy for
small local and regional companies to enter into the market, but the barriers to enter the
market nationally are very high. The economies at scale in manufacturing, distribution
costs, and marketing at the national level make it very difficult for start-up companies to
enter into the national market. There are substantial costs in raising the capital needed to
build manufacturing facilities that can mass-produce food and dairy products at the
national level.
In the food and dairy industry the buyer demand is growing rapidly so entry threats are
strong. In this industry the new comers can expect to earn attractive profit. So, entry
threats are stronger.
2) Threats Of Substitutes:
In the food and dairy industry good substitutes are rapidly available or new once are
emerging so competitive pressure from the substitute are stronger. In the food and dairy
industry end users have low cost is switching to substitute so competitive pressure from
substitutes are stronger.
3) Competitive Rivalry among existing players :
In the dairy industry the demand of buyer is growing rapidly so there is rivalry is weaker
in food and dairy industry. In the food and dairy industry there is the buyer cost to
switching brands are very law.
So, it may affect the industry very strongly and in this case rivalry journal stronger.
39
3) Bargaining Power Of Supplier:
The food and dairy product is ready available from many suppliers at the going market
price so supplier bargaining power is weak.
In food and dairy industry seller switching cost to alternative suppliers are low. So
supplier bargaining power is weak. It is directly affected to industry.
In the food and dairy industry the input is easily available from the other supplier so the
bargaining power of supplier is low.
4) Bargaining Power Of Buyer:
The buyer switching cost to competing brands or substitutes products are law so buyer
bargaining power is high in this industry.
Buyers in the food and dairy industry are greatly affected by the economy and the level
of their disposable income. Whenever a buyer’s disposable income declines, they are
more likely to purchase cheaper brands of tobacco, and if a buyer’s disposable income
increases, then they are more likely to buy more expensive brands.
Consumers in the India are now increasingly becoming more concerned with health
issues. Consumer health awareness has hurt the market for tobacco sellers and has also
led to the increase for government regulation.
40
3.4 DRIVING FORCE
Future strategies and innovations:-
It is clear that dairy faces several challenges, especially in the short term. The prospects
for the market in the longer term are still quite good. In general, development of resilient
farming systems and strategies are required. The strategy has to be able to cope with
fluctuations in costs and prices. Looking at the current systems the low input pasture
based systems seem to be the best option. This does not mean that other food and dairy
product will disappear, but they will have to adapt. The footloose This can also be done
by other financial models or by participating in the chain to spread risk. The
development and implementation of these innovations, however, will require time and
funds, so they will not be available very soon.
Globalization:-
Prices of food and dairy commodities were high but dropped at the end of year. The
general expectation is that demand will increase more than production so prices will be
higher in the future, but bigger fluctuations in price are also expected.
Increase in scale:-
The increase in scale seems to be an autonomous process, the current situation, however,
has taught us that not all food and dairy products are resilient in the face of current
circumstances.
Regional trends/driving forces:-
In western regions there is pressure on the consumption of animal-based food products
due to discussion about environmental issues or animal wel-fare, for example. In other
regions consumption of food and dairy will increase because the economy is growing and
income of especially poor people will increase.
41
Abundant availability of raw material:-
India has varied agro climatic conditions it has a wide-ranging and large raw material
base suitable for food and dairy industries. It has a vast coastline of 8000 km, vast marine
land with 10 major ports. India produces annually 90 million tone of milk (highest in the
world), 150 million tone of fruits and vegetables (second largest), 485 million livestock
(largest), 204 million tones food grain (third largest), 6.3 million tones fish (third largest),
489 million poultry and 45,200 million eggs. India's agricultural production base is huge.
42
3.5 STRATEGIC GROUP MAPPING
A strategic group is a concept used in strategic management that groups companies
within an industry that have similar business models or similar combinations of
strategies. For example, the restaurant industry can be divided into several strategic
groups including fast-food and fine-dining based on variables such as preparation time,
pricing, and presentation. The number of groups within an industry and their composition
depends on the dimensions used to define the groups. Strategic management professors
and consultants often make use of a two dimensional grid to position firms along an
industry's two most important dimensions in order to distinguish direct rivals (those with
similar strategies or business models) from indirect rivals. Strategy is the direction and
scope of an organization over the long term which achieves advantages for the
organization while business model refers to how the firm will generate revenues or make
money.
Strategic Group Analysis
Strategic Group Analysis (SGA) aims to identify organizations with similar strategic
characteristics, following similar strategies or competing on similar bases.
Such groups can usually be identified using two or perhaps three sets of characteristics as
the bases of competition.
Examples of Characteristics
• Extent of product (or service) diversity
• Extent of Geographic coverage
• Number of Market segments served
• Distribution Channels used
• Extent of Branding
• Marketing Effort
• Product (or service) quality
• Pricing policy
43
Use of Strategic Group Analysis
This analysis is useful in several ways:
• Helps identify who the most direct competitors are and on what basis they
compete.
• Raises the question of how likely or possible it is for another organization to
move from one strategic group to another.
• Strategic Group mapping might also be used to identify opportunities.
• Can also help identify strategic problems.
There are five steps to make strategy group:
1. Identify two important competitive characteristics that strategically differentiate
firms in an industry from one another:
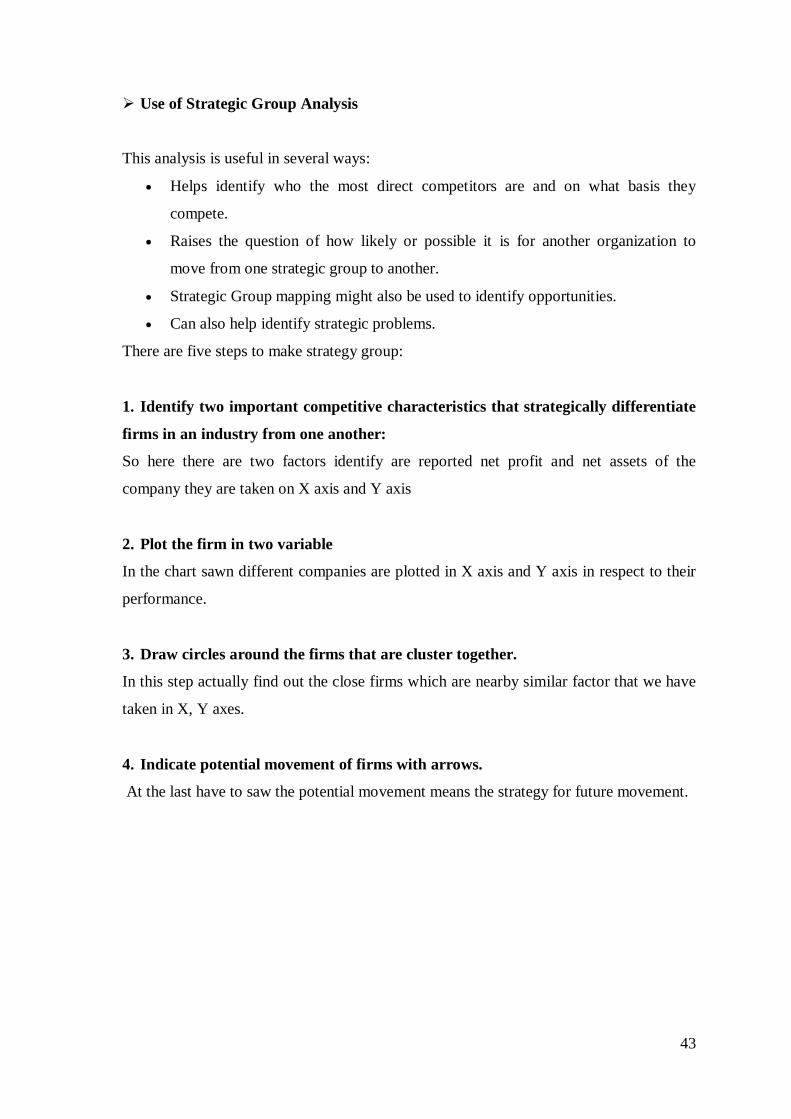
So here there are two factors identify are reported net profit and net assets of the
company they are taken on X axis and Y axis
2. Plot the firm in two variable
In the chart sawn different companies are plotted in X axis and Y axis in respect to their
performance.
3. Draw circles around the firms that are cluster together.
In this step actually find out the close firms which are nearby similar factor that we have
taken in X, Y axes.
4. Indicate potential movement of firms with arrows.
At the last have to saw the potential movement means the strategy for future movement.
44
(Year 2012) Reported net profit Net sales
Britannia Industries Ltd 233.87 17.21
Glaxosmithkline Consumer Healthcare Ltd
436.76 951.9
Jubliant foodworks ltd 135.11 -111.78
Cadbury India ltd 303.46 221.61
Nestle India ltd 1067.93 -2.93
45
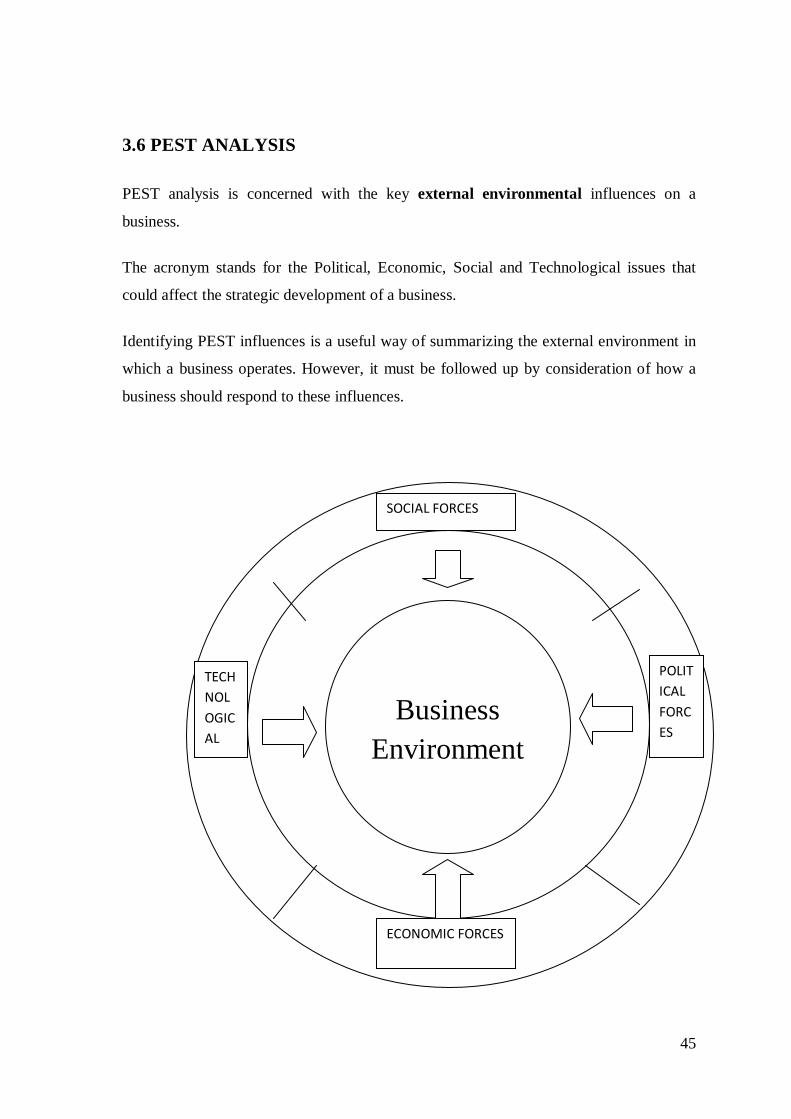
3.6 PEST ANALYSIS
PEST analysis is concerned with the key external environmental influences on a
business.
The acronym stands for the Political, Economic, Social and Technological issues that
could affect the strategic development of a business.
Identifying PEST influences is a useful way of summarizing the external environment in
which a business operates. However, it must be followed up by consideration of how a
business should respond to these influences.
Business Environment
SOCIAL FORCES
POLITICAL FORCES
ECONOMIC FORCES
TECHNOLOGICAL
46
P:-Political
E:-Economical
S:-Social
T:-Technological
Political
Political factors are how and to what degree a government intervenes in the economy.
Specifically, political factors include areas such as tax policy, labour law, environmental
law, trade restrictions, tariffs, political stability .Political factor may also include goods
and services which the government wants to be provide or be provided (merit goods) and
those that the government does not want to be provided(demerit goods or merit
bads).Further more governments have great influence on the health ,education and
infrastructure of nation .
• Government regulation
Economic
Economic factors include economic growth interest rate, exchange rates and the inflation
rate. These factors have major impact on how businesses operate and make decisions for
example, interest rates affect a firm’s cost of capital and there for to what extent a
business grows and expands. Exchange rates affect the cost of exporting goods and the
supply and price of imported goods in an economy.
• Tax Rate
• Service Tax
47
Social
Social factor include the cultural aspects and include health consciousness, population
growth rate, age distribution, career attitudes and emphasis on safety. Trends in social
factors affect the demand for company’s products and how that company operates. for
example, an aging population may imply a smaller and less –willing workforce (thus
increasing the cost of labour).furthermore, companies may change various management
strategies to adapt to this social trends(such as recruiting older works).
Technological
Technological factors include technological aspects such as R&D activity, automation,
technology incentives and the rate of technological change. They can determine barriers
to entry. Furthermore, technological shifts can affect costs, quality and lead to
innovation.
• Technologies used in industry
48
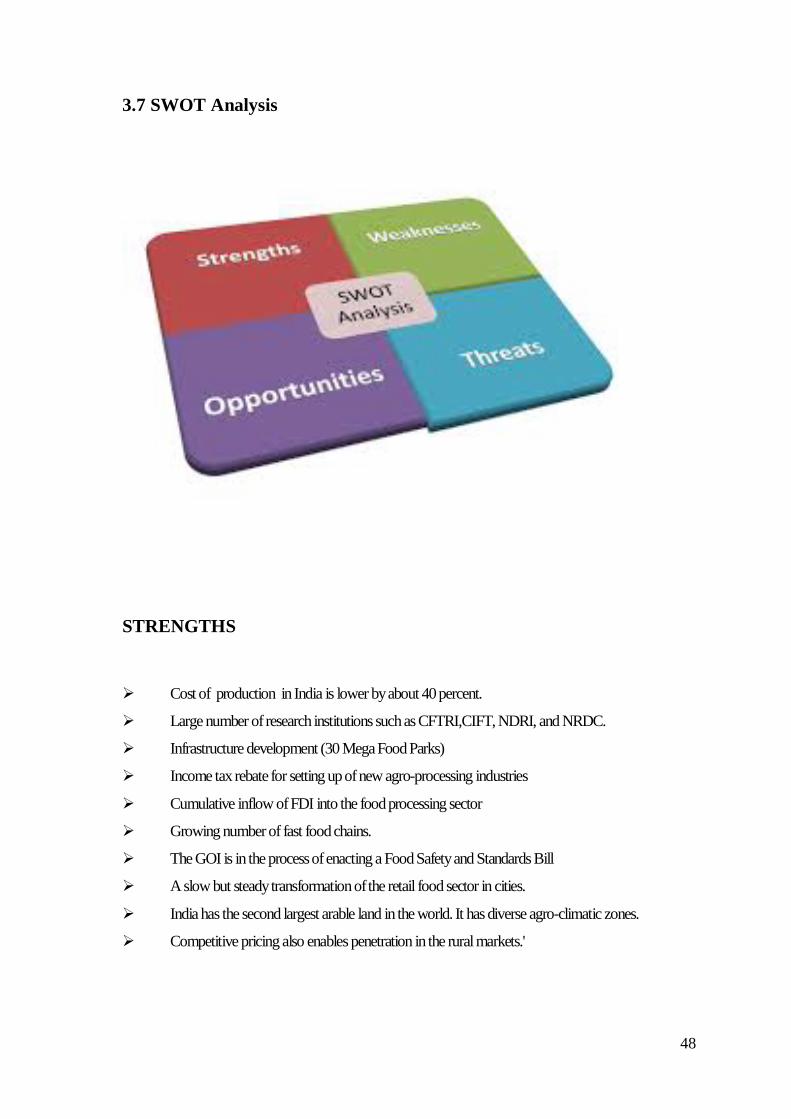
3.7 SWOT Analysis
STRENGTHS
Cost of production in India is lower by about 40 percent.
Large number of research institutions such as CFTRI,CIFT, NDRI, and NRDC.
Infrastructure development (30 Mega Food Parks)
Income tax rebate for setting up of new agro-processing industries
Cumulative inflow of FDI into the food processing sector
Growing number of fast food chains.
The GOI is in the process of enacting a Food Safety and Standards Bill
A slow but steady transformation of the retail food sector in cities.
India has the second largest arable land in the world. It has diverse agro-climatic zones.
Competitive pricing also enables penetration in the rural markets.'
49
WEAKNESSES
Poor infrastructure still poses a serious challenge to FDI.
Heavily bureaucratic investment processes, government inefficiency, and corruption have also
discouraged foreign investors.
India is still not holding its laws high for protecting copyright issues.
Divergent food habits.
High tariffs, dated food laws, and unscientific sanitary and phytosanitary restrictions.
Lack of grading and standards, poor distribution channels, and onerous government policies.
Low penetration of processed food in domestic markets.
Out of the entire agricultural produce of India only 1% is converted into value added products.
Lacks economies of scale, skilled man power.
OPPORTUNITIES
GOI, in line with its Vision 2015 for the food processing sector, in its 11Th Five Year Plan proposes to
give greater thrust on infrastructure development.
GOI envisages an investment of Rs. 1 trillion in the industry over the next five years, mostly from
private sector and financial institution.
Rising disposable income levels.
Increasing urbanization and exposure to Western culture.
Growing health consciousness among the middle class.
Growing consumerism.
Changing age profile.
Increasing availability of cheap consumer credit.
India is in the middle of two big markets the Middle East and the Far East and we can
help French companies reach out to these markets.

50
THREATS
FDI and other routes of investments by MNC’s pose a potential threat to a large number of Indian
players in the coming years.
Gradual decrease in no. of farmers practicing agriculture.
Religious sentiments for different foods.
51
3.8 KEY FACTORS FOR FUTURE COMPETITIVE SUCCESS
The key success factors of the food-dairy industry are;
Market position
Market share and the customer profile are the main features of any food-dairy
company to define a market position. Indian food and industry is characterized by
fragmentation, particularly in the downstream segment, with a large number of
unorganized players.
Customer Profile
Customer profile in any segment of the food-dairy industry determines its business
position
The intensity of the competition is influenced by the demand and supply of the
company’s product and their concentration in different geographies. The demand
pattern of the food-dairy industry is highly cyclical according to the end user
industry.
Product mix
The nature of products produced, industries sold to, and the mix between commodity
and value-added products are an important part of the rating criteria. Value product
offers high realisation of the company which in turn boost the company profitability.
Technology
It was recognized that small and medium enterprises not only need greater awareness
but also technical, financial and institutional support in order to develop and adopt
efficient technologies. The art of using efficient technology can enable company to
achieve a competitive cost position.
Operating Efficiencies
Given the industry characteristics of underlying pricing volatility, limited producer
pricing power, sensitivity to underlying economic conditions, and a relatively high
fixed-cost base, particularly at the integrated producers; elements that are within a
company's ability to manage, such as cost structure and operating efficiency, are
important considerations in the rating analysis. Factors that measure costs and
52
operating efficiency help in assessing a company's ability to operate through
economic downturns and its ability to not only continue servicing its debt, but meet
other obligations, which can vary extensively on a geographic basis due to regulatory,
environmental compliance and other differences.
The cost structures of the integrated food-dairy companies or the backward
integration companies are different from the secondary food-dairy product producers.
The raw material volatility does not materially impact the integrated food-dairy
product producer as they have control over prices.
53
3.9 Product Life Cycle (PLC)
A new product passes through set of stages known as product life cycle. Product life
cycle applies to both brand and category of products. Its time period vary from product
to product. Modern product life cycles are becoming shorter and shorter as products in
mature stages are being renewed by market segmentation and product differentiation.
Companies always attempt to maximize the profit and revenues over the entire life cycle
of a product. In order to achieving the desired level of profit, the introduction of the new
product at the proper time is crucial. If new product is appealing to consumer and no stiff
competition is out there, company can charge high prices and earn high profits.
Stages of Product Life Cycle
Product life cycle comprises four stages:
1. Introduction stage
2. Growth stage
3. Maturity stage
4. Decline stage
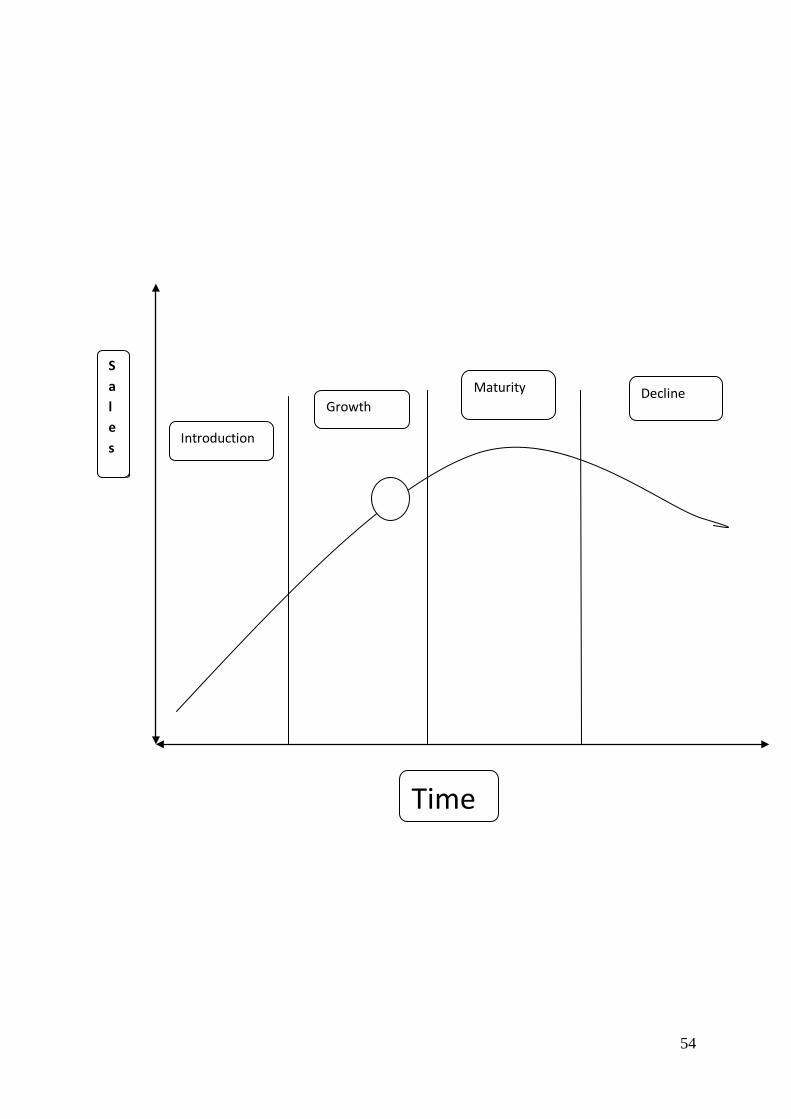
54
S
Sales
Time
Introduction
Growth Maturity Decline
55
Introduction stage
Product is introduced in the market with intention to build a clear identity and heavy
promotion is done for maximum awareness. Before actual offering of the product to
customers, product passes through product development, involves prototype and market
tests. Companies incur more costs in this phase and also bear additional cost for
distribution. On the other hand, there are a few customers at this stage, means low sales
volume. So, during introductory stage company’s profits shows a negative figure
because of huge cost but low sales volume.
At introduction stage, the company core focus is on establishing a market and arising
demand for the product. So, the impact on market mix is as follows:
• Product
Branding, Quality level and intellectual property and protections are obtained to
stimulate consumers for the entire product category. Product is under more
consideration, as first impression is the last impression.
• Price
High(skim) pricing is used for making high profits with intention to cover initial
cost in a short period and low pricing is used to penetrate and gain the market share.
company choice of pricing strategy depends on their goals.
• Place
Distribution at this stage is usually selective and scattered.
• Promotion
At introductory stage, promotion is done with intention to build brand awareness.
Samples/trials are provided that is fruitful in attracting early adopters and potential
customers. Promotional programs are more essential in this phase. It is as much
important as to produce the product because it positions the product.
56
Growth Stage
In this stage, company’s sales and profits starts increasing and competition also begin to
increase. The product becomes well recognized at this stage and some of the buyers
repeat the purchase patterns. During this stage, firms focus on brand preference and
gaining market share. It is market acceptance stage. But due to competition, company
invest more in advertisement to convince customers so profits may decline near the end
of growth stage.
Affect on 4 p's of marketing is as under:
• Product
Along with maintaining the existing quality, new features and improvements in
product quality may be done. All this is done to compete and maintain the market
share.
• Price
Price is maintained or may increase as company gets high demand at low
competition or it may be reduced to grasp more customers.
• Distribution
Distribution becomes more significant with the increase demand and acceptability
of product. More channels are added for intensive distribution in order to meet
increasing demand. On the other hand resellers start getting interested in the
product, so trade discounts are also minimal.
• Promotion
At growth stage, promotion is increased. When acceptability of product increases,
more efforts are made for brand preference and loyalty.
Maturity stage
At maturity stage, brand awareness is strong so sale continues to grow but at a declining
rate as compared to past. At this stage, there are more competitors with the same
products. So, companies defend the market share and extending product life cycle, rather
than making the profits, By offering sales promotions to encourage retailer to give more
57
shelf space to the product than that of competitors. At this stage usually loyal customers
make purchases.
Marketing mix decisions include:
• Product At maturity stage, companies add features and modify the product in
order to compete in market and differentiate the product from competition. At this
stage, it is best way to get dominance over competitors and increase market share.
• Price
Because of intense competition, at maturity stage, price is reduced in order to
compete. It attracts the price conscious segment and retain the customers.
• Distribution
New channels are added to face intense competition and incentives are offered to
retailers to get shelf preference over competitors.
• Promotion
Promotion is done in order to create product differentiation and loyalty. Incentives
are also offered to attract more customers.
Decline stage
Decline in sales, change in trends and unfavorable economic conditions explains decline
stage. At this stage market becomes saturated so sales declines. It may also be due
technical obsolescence or customer taste has been changed.
At decline stage company has three options:
1. Maintain the product, Reduce cost and finding new uses of product.
2. Harvest the product by reducing marketing cost and continue offering the product
to loyal niche until zero profit.
3. Discontinue the product when there’s no profit or a successor is available. Selling
out to competitors who want to keep the product.
58
At declining stage, marketing mix decisions depends on company’s strategy. For
example, if company want to harvest, the product will remain same and price will be
reduced. In case of liquidation, supply will be reduced dramatically.
Life Cycle Stage of Food and Dairy Industry:
The industry has exhibited a growth of about 30% over the past four years and is
expected to grow at 25% for the next two to three years, making it one of the fastest
growing segments in the transportation of cargo. It is forecasted to reach 40% by 2017.
so from the above figure we can analyze that in this particular industry, the stage of
introduction has been already completed. It is in its growing stage. This shows increasing
competition, demand, and requires higher investment on the other hand it will also give
good return to market player of the industry.
59
3.10 CONCLUSION
Strategy Analysis Strategy analysis may be looked upon as the starting point of the
strategic management process. It consists of the “advance work” that must be done in
order to effectively formulate and implement strategies. Many strategies fail because
managers may want to formulate and implement strategies without a careful analysis of
the overarching goals of the organization and without a thorough analysis of its external
and internal environment.
There are many things and analysis are important in strategy analysis. According to
strategy analysis there are many models are also useful like Porter’s five force model,
PEST analysis, Industries strength Weaknesses, Opportunities and Threats, Strategy
group mapping, Driving force. So it is the one of the best part of report.
60
CHAPTER-4
FINANCIAL ANALYSIS
4.1 OBJECTIVE OF FINANCIAL ANALYSIS
4.2 RATIO ANALYSIS
4.2.1 Current Ratio
4.2.2 Debt Equity Ratio
4.2.3 Inventory Turnover Ratio
4.2.4 Debtor Turnover Ratio
4.2.5 Fixed Assets Turnover Ratio
4.2.6 Return On Capital Employee
4.2.7 Return On Net worth
4.2.8 P/E Ratio
4.3 TREND ANALYSIS
4.3.1 Total share holder fund
4.3.2 Net sale
4.3.3 Profit after tax
4.4.4 total assets

61
4.1 OBJECTIVE OF FINANCIAL ANALYSIS
The objective of financial statements is to provide information about the financial
position, performance and changes in financial position of an enterprise that is useful to a
wide range of users in making economic decisions.
Managers require Financial Statements to manage the affairs of the company by
assessing its financial performance and position and taking important business decisions.
Shareholders use Financial Statements to assess the risk and return of their investment in
the company and take investment decisions based on their analysis.
Prospective Investors need Financial Statements to assess the viability of investing in a
company. Investors may predict future dividends based on the profits disclosed in the
Financial Statements. Furthermore, risks associated with the investment may be gauged
from the Financial Statements. For instance, fluctuating profits indicate higher risk.
Therefore, Financial Statements provide a basis for the investment decisions of potential
investors.
Financial Institutions (e.g. banks) use Financial Statements to decide whether to grant a
loan or credit to a business. Financial institutions assess the financial health of a business
to determine the probability of a bad loan. Any decision to lend must be supported by a
sufficient asset base and liquidity.
Suppliers need Financial Statements to assess the credit worthiness of a business and
ascertain whether to supply goods on credit. Suppliers need to know if they will be
repaid. Terms of credit are set according to the assessment of their customers' financial
health.
Customers use Financial Statements to assess whether a supplier has the resources to
ensure the steady supply of goods in the future. This is especially vital where a customer
is dependant on a supplier for a specialized component.
Employees use Financial Statements for assessing the company's profitability and its
consequence on their future remuneration and job security.
62
Competitors compare their performance with rival companies to learn and develop
strategies to improve their competitiveness.
General Public may be interested in the effects of a company on the economy,
environment and the local community.
Governments require Financial Statements to determine the correctness of tax declared in
the tax returns. Government also keeps track of economic progress through analysis of
Financial Statements of businesses from different sectors of the economy.
Tools of financial analysis
• Ratio analysis
• Trend analysis.
63
4.2 RATIO ANALYSIS:-
Ratio analysis involves establishing a relevant financial relationship between
components of financial statement. Two companies may have earned the same
amount of profit in a year, but unless the profit is related to sales or total assets, it is
not possible to conclude which of them is more profitable. Ratio analysis helps in
identifying significant relationship between financial statement items for further
investigation. If used with understanding of industry factor and general economic
conditions, it can be powerful tool for recognizing a company’s strengths as well as
its potential trouble spots.
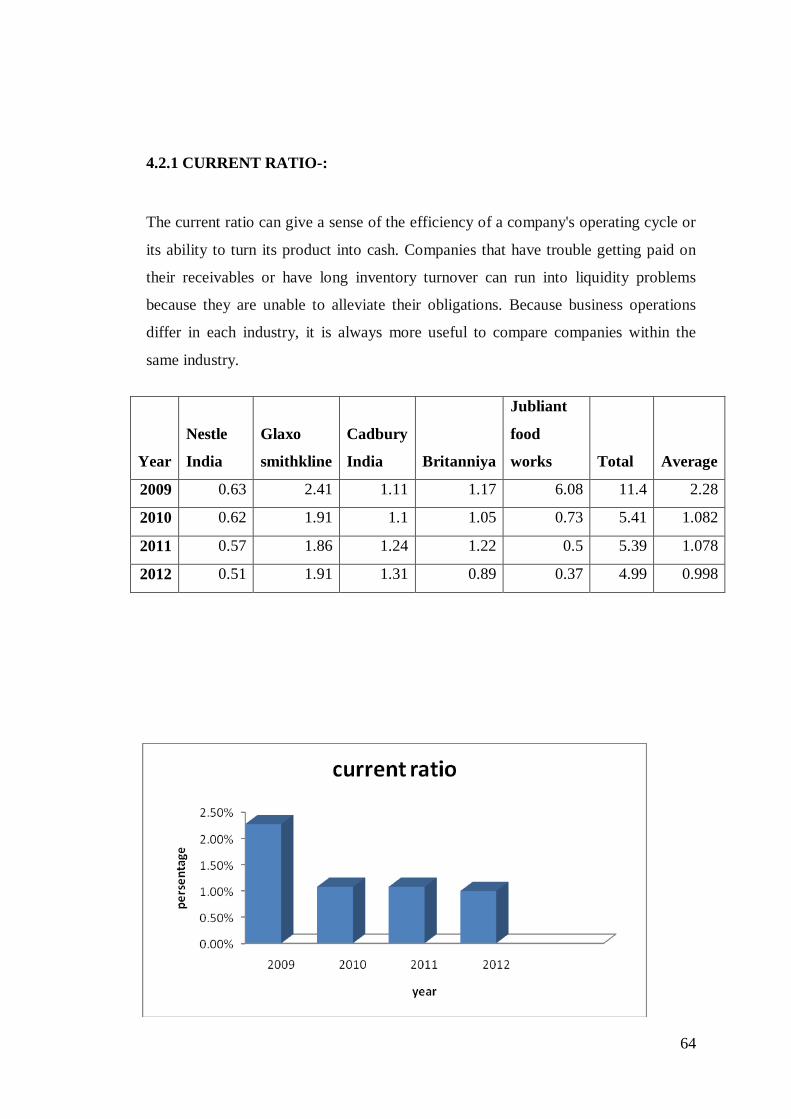
64
4.2.1 CURRENT RATIO-:
The current ratio can give a sense of the efficiency of a company's operating cycle or
its ability to turn its product into cash. Companies that have trouble getting paid on
their receivables or have long inventory turnover can run into liquidity problems
because they are unable to alleviate their obligations. Because business operations
differ in each industry, it is always more useful to compare companies within the
same industry.
Year
Nestle
India
Glaxo
smithkline
Cadbury
India Britanniya
Jubliant
food
works Total Average
2009 0.63 2.41 1.11 1.17 6.08 11.4 2.28
2010 0.62 1.91 1.1 1.05 0.73 5.41 1.082
2011 0.57 1.86 1.24 1.22 0.5 5.39 1.078
2012 0.51 1.91 1.31 0.89 0.37 4.99 0.998

65
Interpretation:-From the above graph we can conclude that current assets ratio is
decreasing from year 2009 to 2012.in year 2009 the Average current ratio is 2.28%.than
it is decreasing and 1.08 In year 2010.Same as it is decreasing and 0.998 in 2012.
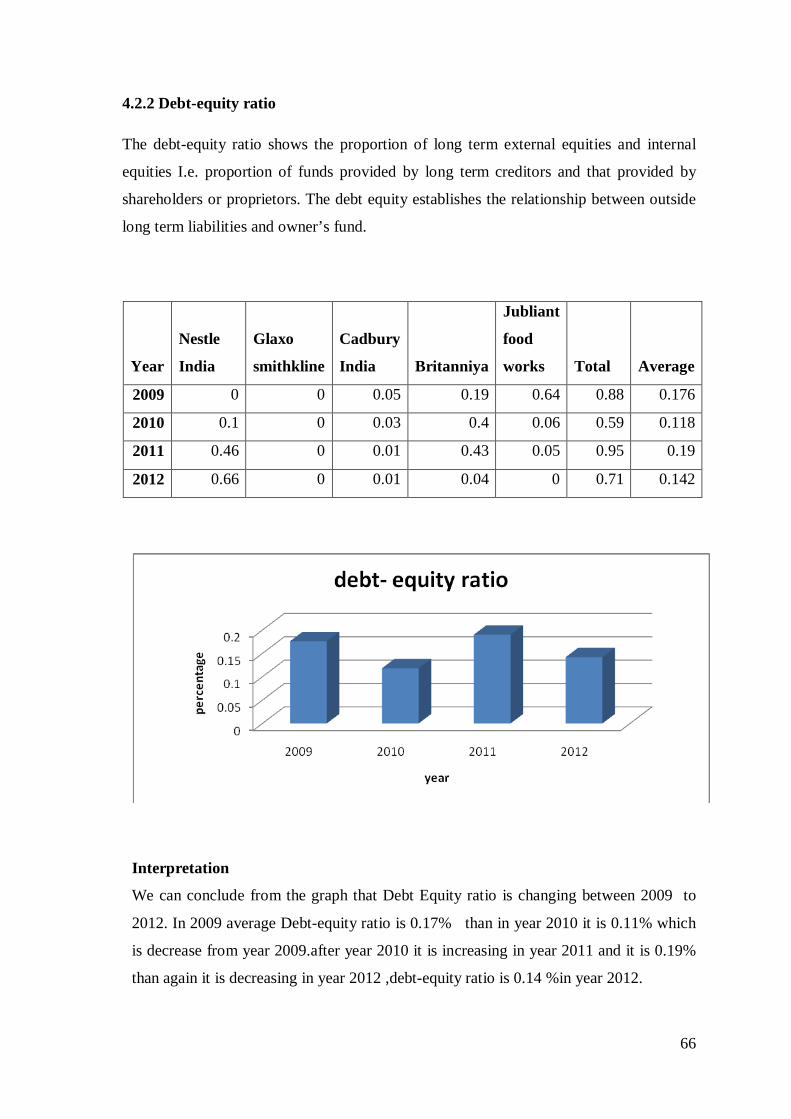
66
4.2.2 Debt-equity ratio
The debt-equity ratio shows the proportion of long term external equities and internal
equities I.e. proportion of funds provided by long term creditors and that provided by
shareholders or proprietors. The debt equity establishes the relationship between outside
long term liabilities and owner’s fund.
Interpretation
We can conclude from the graph that Debt Equity ratio is changing between 2009 to
2012. In 2009 average Debt-equity ratio is 0.17% than in year 2010 it is 0.11% which
is decrease from year 2009.after year 2010 it is increasing in year 2011 and it is 0.19%
than again it is decreasing in year 2012 ,debt-equity ratio is 0.14 %in year 2012.
Year
Nestle
India
Glaxo
smithkline
Cadbury
India Britanniya
Jubliant
food
works Total Average
2009 0 0 0.05 0.19 0.64 0.88 0.176
2010 0.1 0 0.03 0.4 0.06 0.59 0.118
2011 0.46 0 0.01 0.43 0.05 0.95 0.19
2012 0.66 0 0.01 0.04 0 0.71 0.142
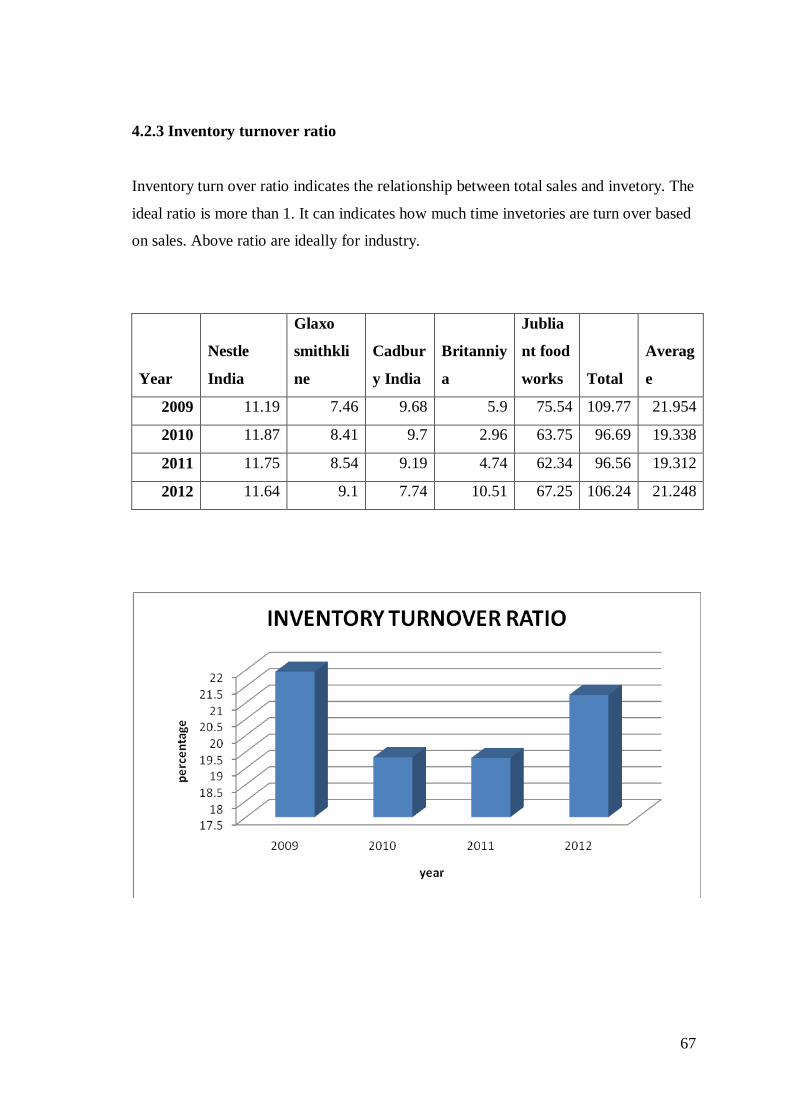
67
4.2.3 Inventory turnover ratio
Inventory turn over ratio indicates the relationship between total sales and invetory. The
ideal ratio is more than 1. It can indicates how much time invetories are turn over based
on sales. Above ratio are ideally for industry.
Year
Nestle
India
Glaxo
smithkli
ne
Cadbur
y India
Britanniy
a
Jublia
nt food
works Total
Averag
e
2009 11.19 7.46 9.68 5.9 75.54 109.77 21.954
2010 11.87 8.41 9.7 2.96 63.75 96.69 19.338
2011 11.75 8.54 9.19 4.74 62.34 96.56 19.312
2012 11.64 9.1 7.74 10.51 67.25 106.24 21.248

68
Interpretation
From the above graph we can conclude that inventory turnover ratio is high in
year 2009 and it is continuously decreasing in year 2010 and 2011. After year
2011 inventory turnover ratio is increasing and it 21.24% in this year.
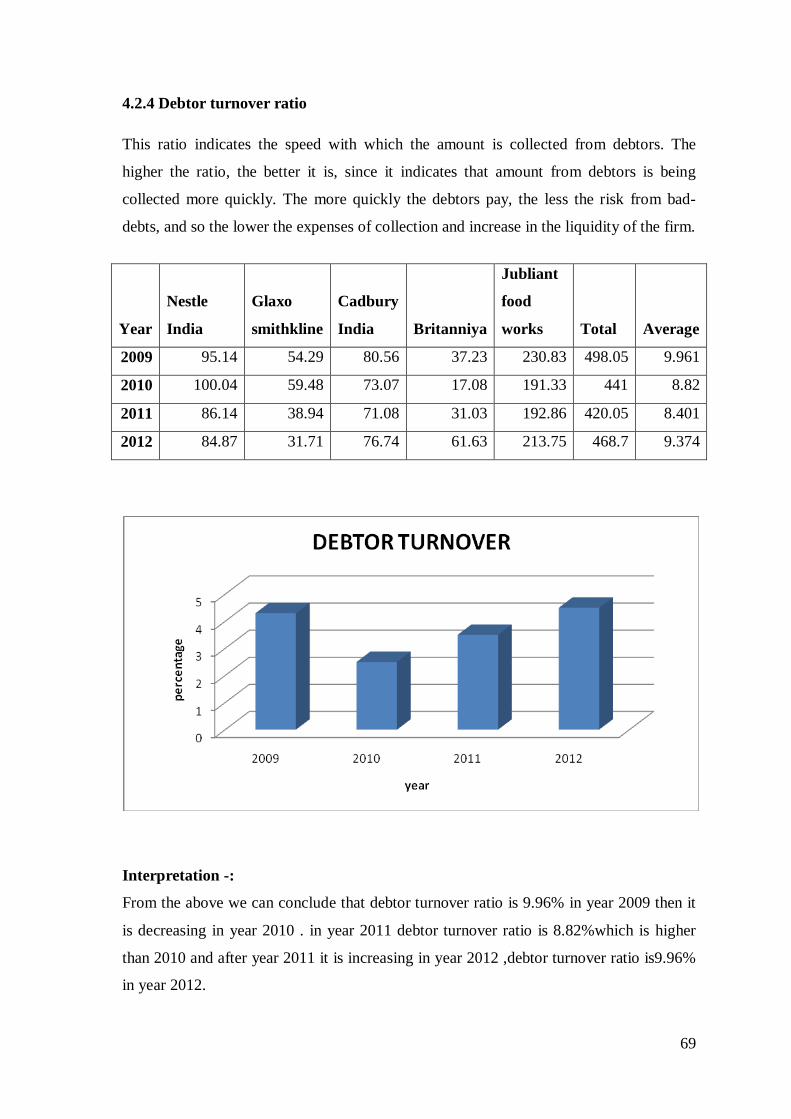
69
4.2.4 Debtor turnover ratio
This ratio indicates the speed with which the amount is collected from debtors. The
higher the ratio, the better it is, since it indicates that amount from debtors is being
collected more quickly. The more quickly the debtors pay, the less the risk from bad-
debts, and so the lower the expenses of collection and increase in the liquidity of the firm.
Interpretation -:
From the above we can conclude that debtor turnover ratio is 9.96% in year 2009 then it
is decreasing in year 2010 . in year 2011 debtor turnover ratio is 8.82%which is higher
than 2010 and after year 2011 it is increasing in year 2012 ,debtor turnover ratio is9.96%
in year 2012.
Year
Nestle
India
Glaxo
smithkline
Cadbury
India Britanniya
Jubliant
food
works Total Average
2009 95.14 54.29 80.56 37.23 230.83 498.05 9.961
2010 100.04 59.48 73.07 17.08 191.33 441 8.82
2011 86.14 38.94 71.08 31.03 192.86 420.05 8.401
2012 84.87 31.71 76.74 61.63 213.75 468.7 9.374

70
4.2.5 Fixed Assets Turnover Ratio
The Fixed asset turnover ratio indicates the relationship between turnover and utilization
of fixed assets like building, plant and machinery, land etc. Higher the ratio, higher the
utilization of fixed assets. Meanwhile industry is able to utilize more and more fixed
assets to generate sales.
Interpretation -:
From the above graph we can see that in year 2009 fixed asset turnover ratio of this
industry is 2.97% and in the year 2010 it is 2.91% ,after the year 2011 it is increasing
,and it is 3.29%.fixed asset turnover ratio is 3.56% in year 2012 which is higher than
2011.
Year
Nestle
India
Glaxo
smithkline
Cadbury
India Britanniya
Jubliant
food
works Total Average
2009 3.43 3.69 3.12 2.25 2.39 14.88 2.976
2010 3.65 4.2 3.22 0.89 2.62 14.58 2.916
2011 3.49 4.71 3.78 1.48 2.99 16.45 3.29
2012 2.47 5.21 4.08 3.12 2.94 17.82 3.564
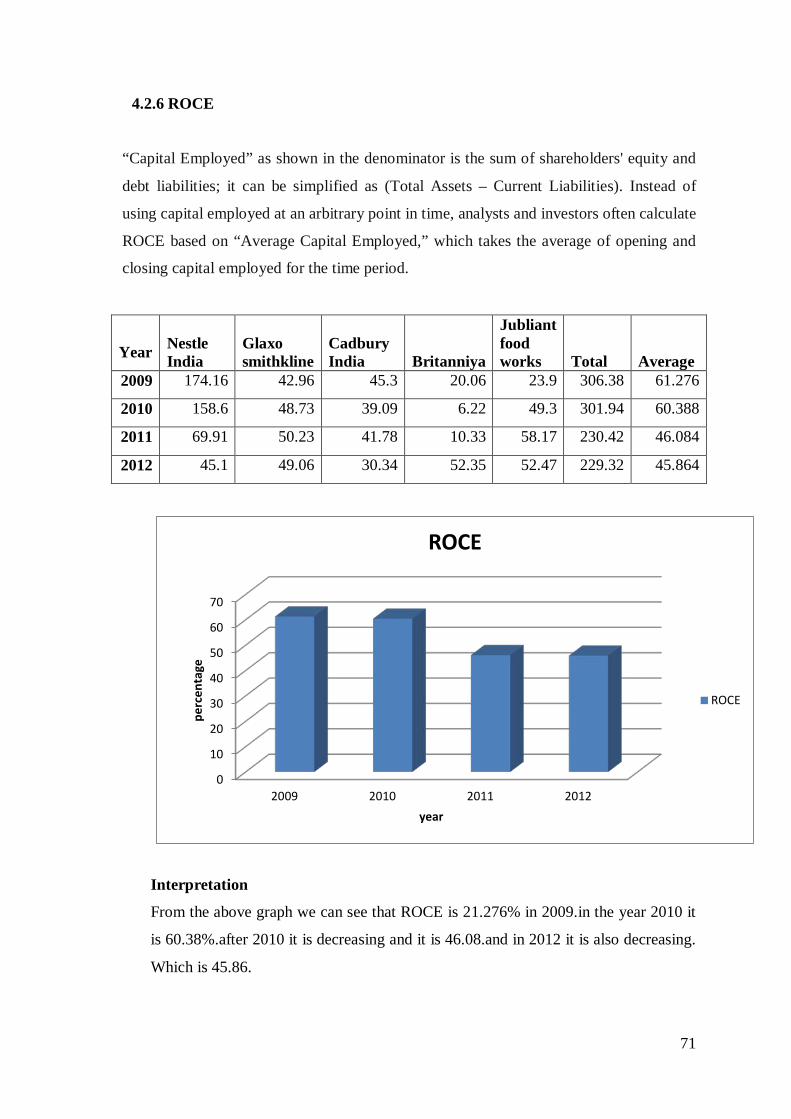
71
4.2.6 ROCE
“Capital Employed” as shown in the denominator is the sum of shareholders' equity and
debt liabilities; it can be simplified as (Total Assets – Current Liabilities). Instead of
using capital employed at an arbitrary point in time, analysts and investors often calculate
ROCE based on “Average Capital Employed,” which takes the average of opening and
closing capital employed for the time period.
0
10
20
30
40
50
60
70
2009 2010 2011 2012
perc
enta
ge
year
ROCE
ROCE
Interpretation
From the above graph we can see that ROCE is 21.276% in 2009.in the year 2010 it
is 60.38%.after 2010 it is decreasing and it is 46.08.and in 2012 it is also decreasing.
Which is 45.86.
Year Nestle India
Glaxo smithkline
Cadbury India Britanniya
Jubliant food works Total Average
2009 174.16 42.96 45.3 20.06 23.9 306.38 61.276
2010 158.6 48.73 39.09 6.22 49.3 301.94 60.388
2011 69.91 50.23 41.78 10.33 58.17 230.42 46.084
2012 45.1 49.06 30.34 52.35 52.47 229.32 45.864
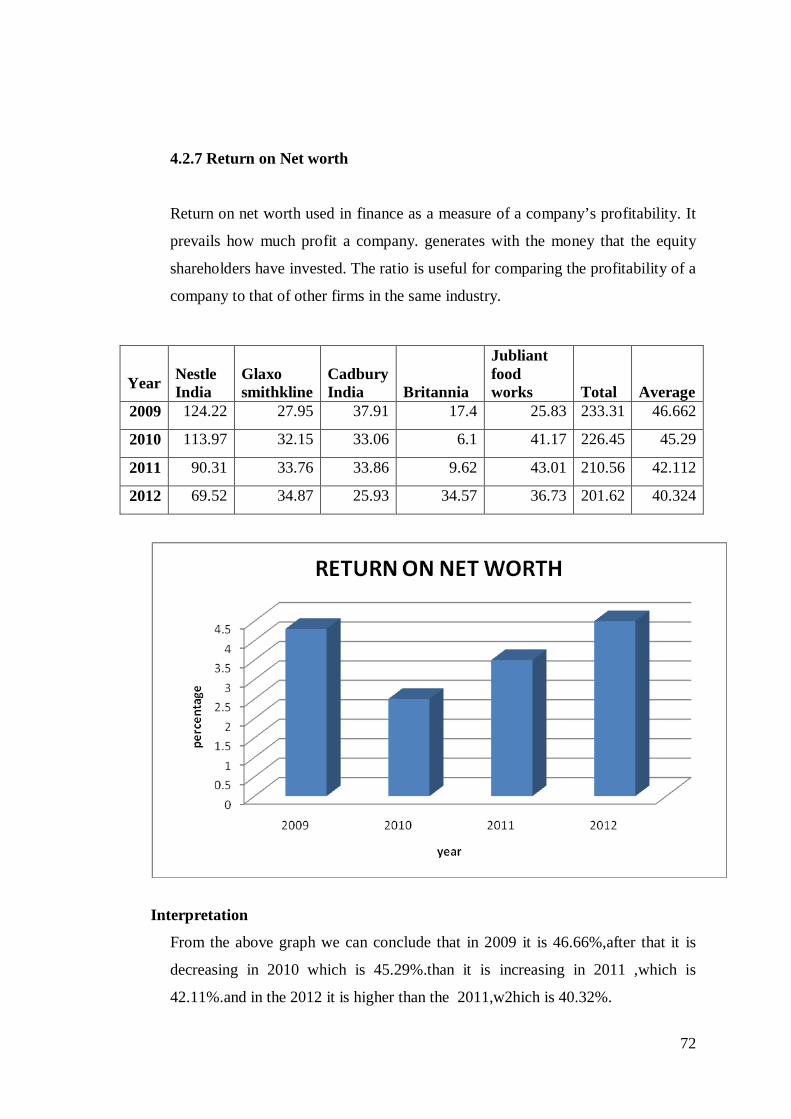
72
4.2.7 Return on Net worth
Return on net worth used in finance as a measure of a company’s profitability. It
prevails how much profit a company. generates with the money that the equity
shareholders have invested. The ratio is useful for comparing the profitability of a
company to that of other firms in the same industry.
Interpretation
From the above graph we can conclude that in 2009 it is 46.66%,after that it is
decreasing in 2010 which is 45.29%.than it is increasing in 2011 ,which is
42.11%.and in the 2012 it is higher than the 2011,w2hich is 40.32%.
Year Nestle India
Glaxo smithkline
Cadbury India Britannia
Jubliant food works Total Average
2009 124.22 27.95 37.91 17.4 25.83 233.31 46.662
2010 113.97 32.15 33.06 6.1 41.17 226.45 45.29
2011 90.31 33.76 33.86 9.62 43.01 210.56 42.112
2012 69.52 34.87 25.93 34.57 36.73 201.62 40.324
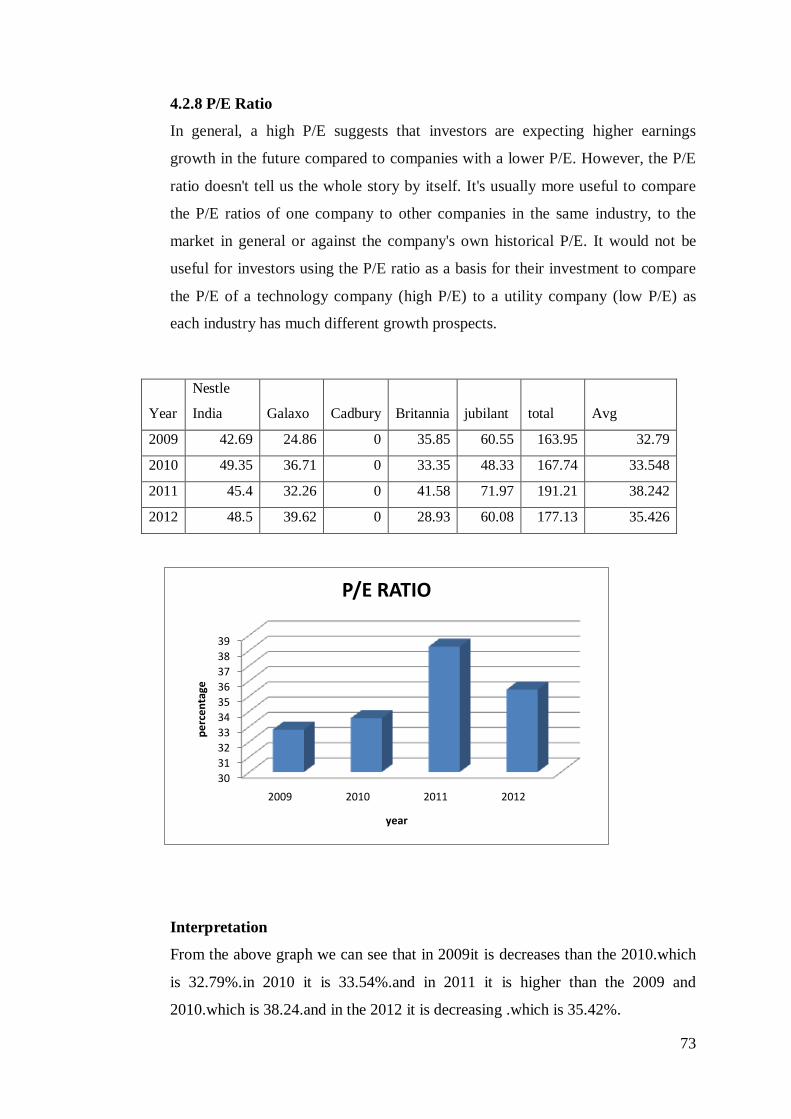
73
4.2.8 P/E Ratio
In general, a high P/E suggests that investors are expecting higher earnings
growth in the future compared to companies with a lower P/E. However, the P/E
ratio doesn't tell us the whole story by itself. It's usually more useful to compare
the P/E ratios of one company to other companies in the same industry, to the
market in general or against the company's own historical P/E. It would not be
useful for investors using the P/E ratio as a basis for their investment to compare
the P/E of a technology company (high P/E) to a utility company (low P/E) as
each industry has much different growth prospects.
30313233343536373839
2009 2010 2011 2012
perc
enta
ge
year
P/E RATIO
Interpretation
From the above graph we can see that in 2009it is decreases than the 2010.which
is 32.79%.in 2010 it is 33.54%.and in 2011 it is higher than the 2009 and
2010.which is 38.24.and in the 2012 it is decreasing .which is 35.42%.
Year
Nestle
India Galaxo Cadbury Britannia jubilant total Avg
2009 42.69 24.86 0 35.85 60.55 163.95 32.79
2010 49.35 36.71 0 33.35 48.33 167.74 33.548
2011 45.4 32.26 0 41.58 71.97 191.21 38.242
2012 48.5 39.62 0 28.93 60.08 177.13 35.426
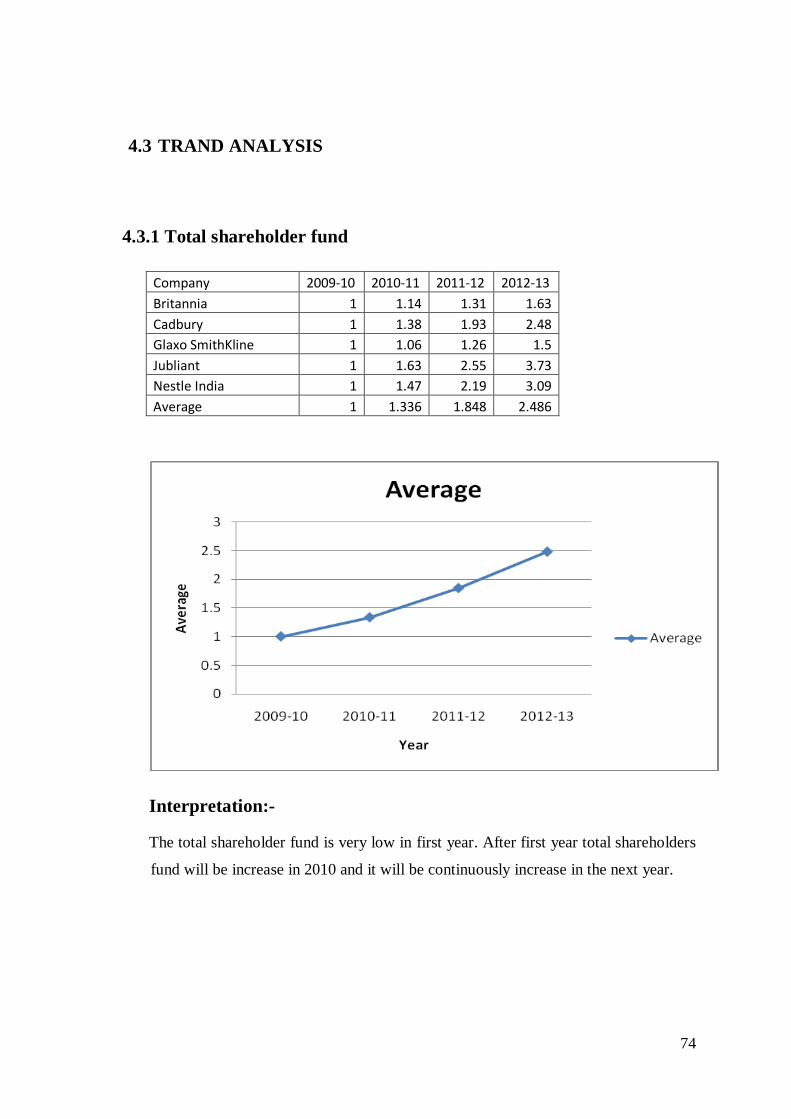
74
4.3 TRAND ANALYSIS
4.3.1 Total shareholder fund
Company 2009-10 2010-11 2011-12 2012-13 Britannia 1 1.14 1.31 1.63 Cadbury 1 1.38 1.93 2.48 Glaxo SmithKline 1 1.06 1.26 1.5 Jubliant 1 1.63 2.55 3.73 Nestle India 1 1.47 2.19 3.09 Average 1 1.336 1.848 2.486
Interpretation:-
The total shareholder fund is very low in first year. After first year total shareholders
fund will be increase in 2010 and it will be continuously increase in the next year.
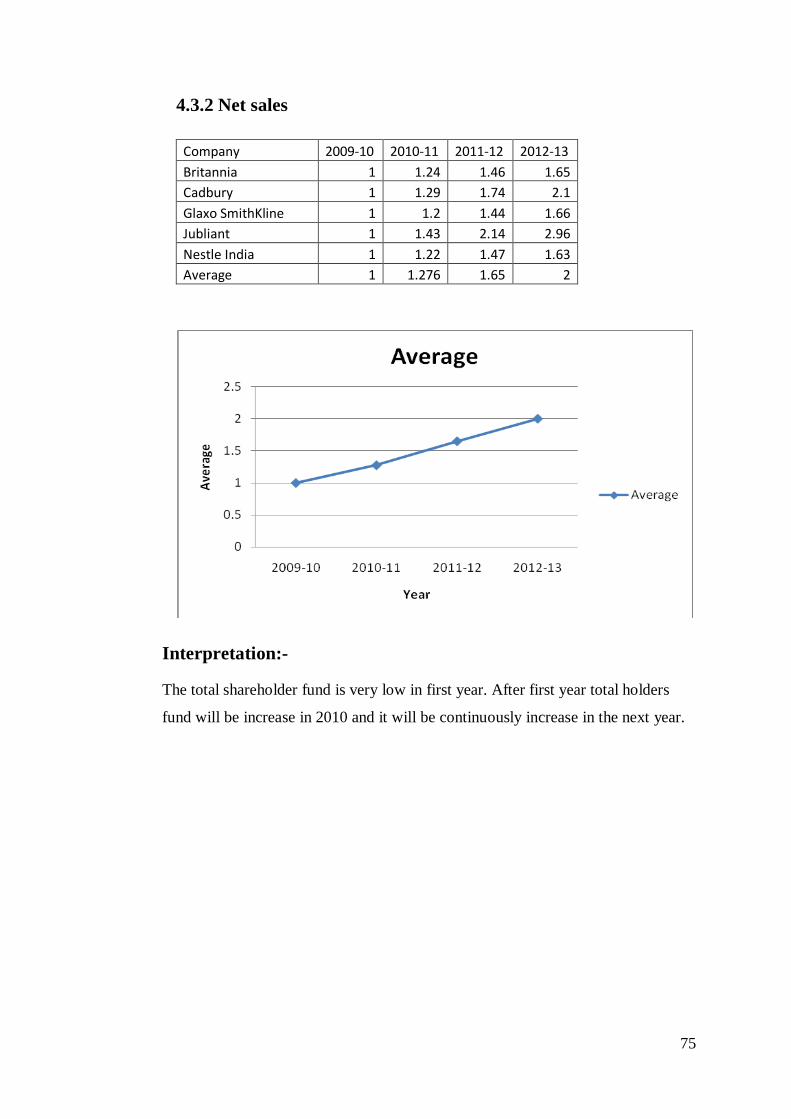
75
4.3.2 Net sales
Company 2009-10 2010-11 2011-12 2012-13 Britannia 1 1.24 1.46 1.65 Cadbury 1 1.29 1.74 2.1 Glaxo SmithKline 1 1.2 1.44 1.66 Jubliant 1 1.43 2.14 2.96 Nestle India 1 1.22 1.47 1.63 Average 1 1.276 1.65 2
Interpretation:-
The total shareholder fund is very low in first year. After first year total holders
fund will be increase in 2010 and it will be continuously increase in the next year.
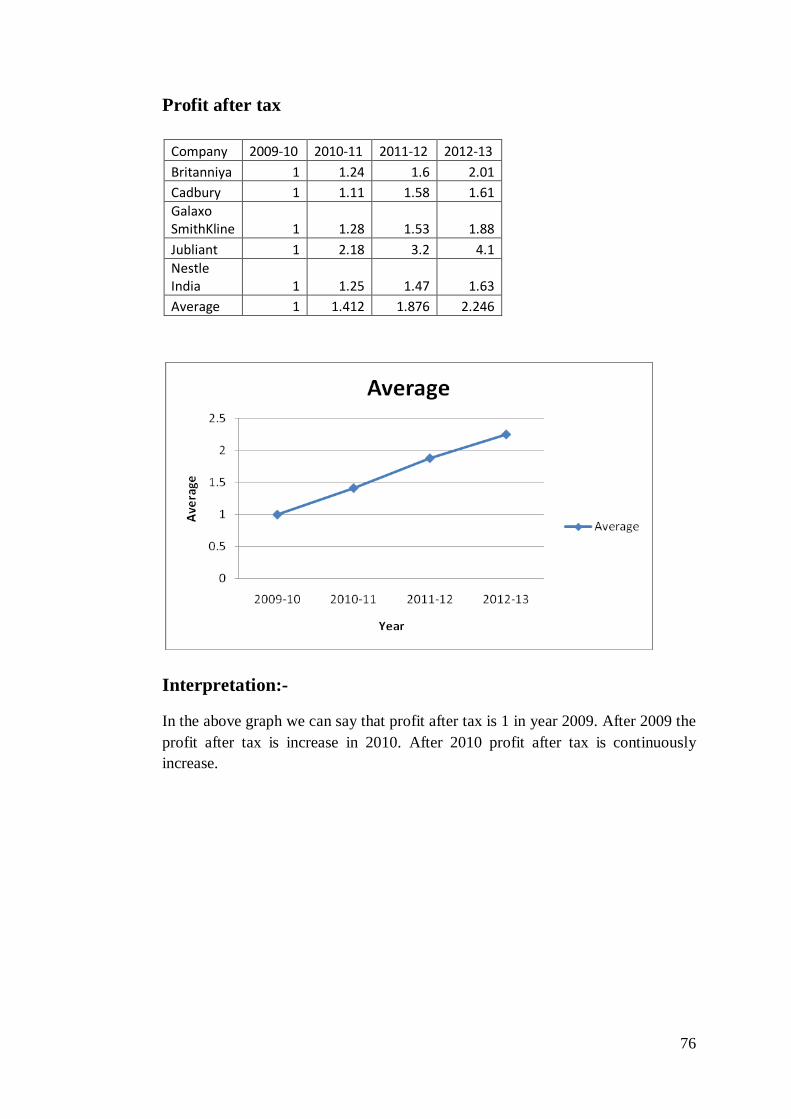
76
Profit after tax
Company 2009-10 2010-11 2011-12 2012-13 Britanniya 1 1.24 1.6 2.01 Cadbury 1 1.11 1.58 1.61 Galaxo SmithKline 1 1.28 1.53 1.88 Jubliant 1 2.18 3.2 4.1 Nestle India 1 1.25 1.47 1.63 Average 1 1.412 1.876 2.246
Interpretation:-
In the above graph we can say that profit after tax is 1 in year 2009. After 2009 the profit after tax is increase in 2010. After 2010 profit after tax is continuously increase.
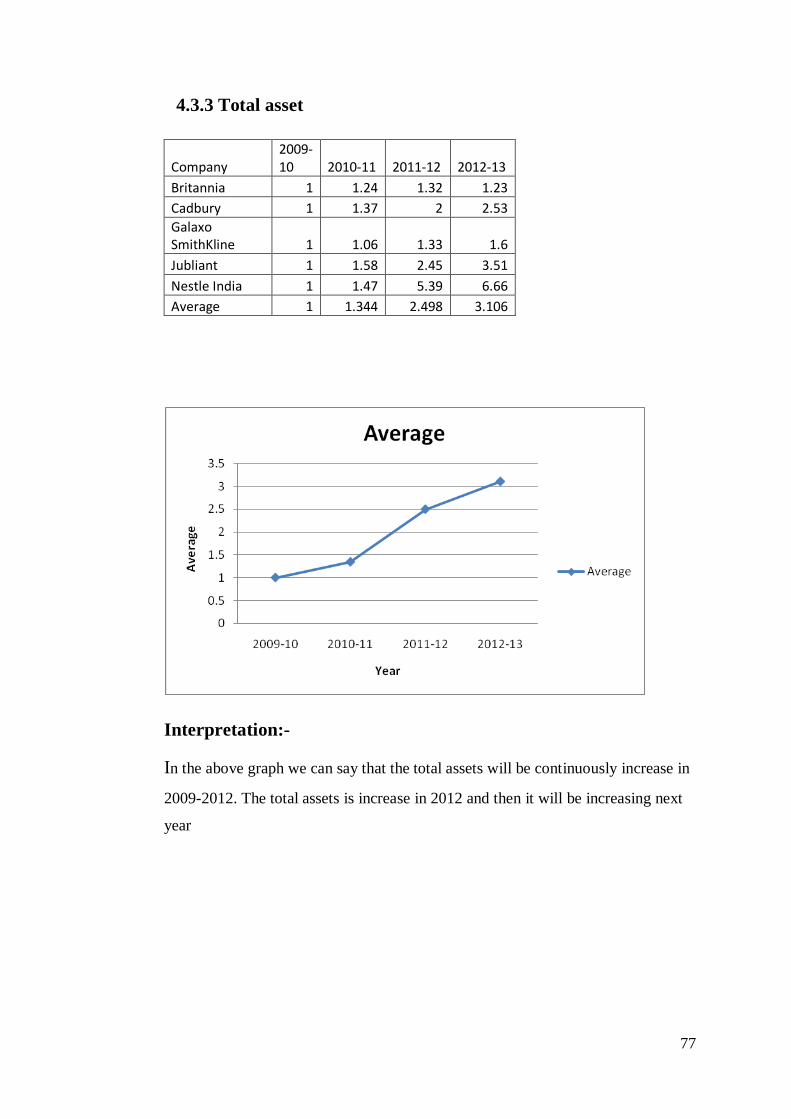
77
4.3.3 Total asset
Company 2009-10 2010-11 2011-12 2012-13
Britannia 1 1.24 1.32 1.23 Cadbury 1 1.37 2 2.53 Galaxo SmithKline 1 1.06 1.33 1.6 Jubliant 1 1.58 2.45 3.51 Nestle India 1 1.47 5.39 6.66 Average 1 1.344 2.498 3.106
Interpretation:-
In the above graph we can say that the total assets will be continuously increase in
2009-2012. The total assets is increase in 2012 and then it will be increasing next
year
78
CHAPTER-5
BUSINESS PLAN
5.1 Project at a glance
5.2 Company description
5.3 Selection of location
5.4 Industry and competitive analysis
5.5 Market and sales strategy
5.6 Operation, management and organisation
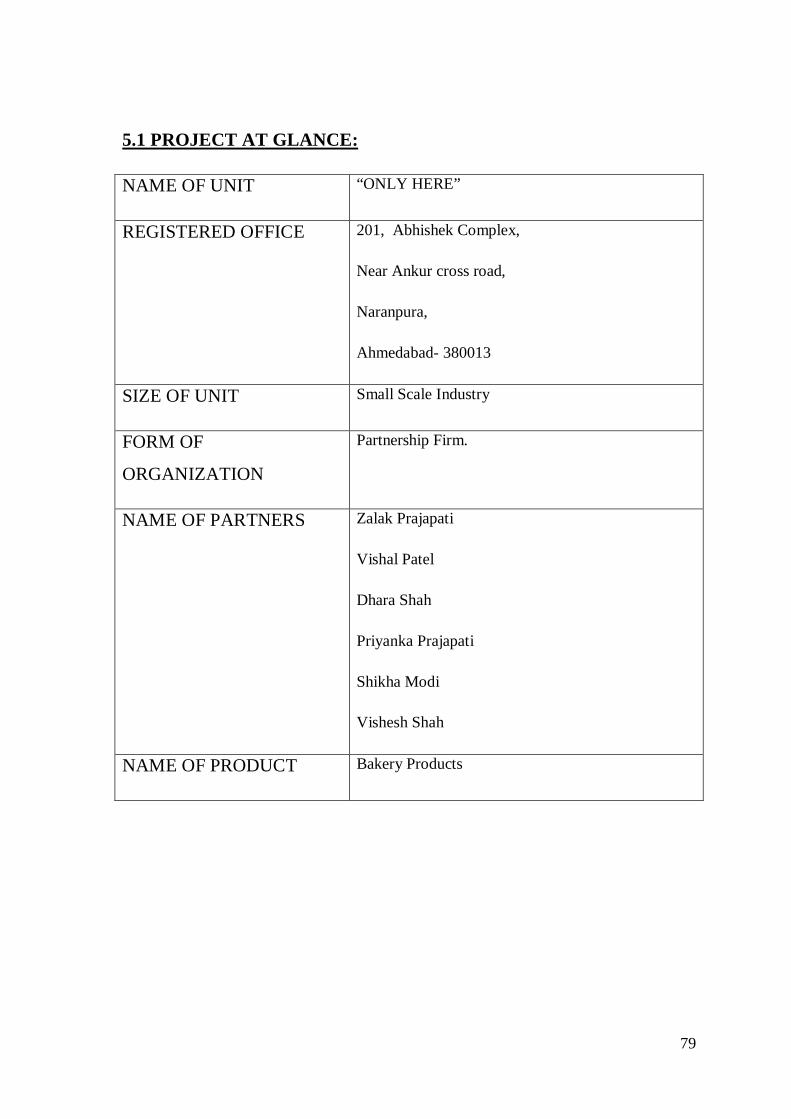
79
5.1 PROJECT AT GLANCE:
NAME OF UNIT “ONLY HERE”
REGISTERED OFFICE 201, Abhishek Complex,
Near Ankur cross road,
Naranpura,
Ahmedabad- 380013
SIZE OF UNIT Small Scale Industry
FORM OF
ORGANIZATION
Partnership Firm.
NAME OF PARTNERS Zalak Prajapati
Vishal Patel
Dhara Shah
Priyanka Prajapati
Shikha Modi
Vishesh Shah
NAME OF PRODUCT Bakery Products
80
5.2 Company Description:
Name of the company – “ONLY HERE” Bakery Products
Location – Plot no. 27 Naroda GIDC
Naroda,
Ahmedabad.
Product - Bakery Products
Market for Sale: Ahmedabad, Anand ,Nadiad, Baroda
Company Objective:
The objectives for the first three years of operation include:
• To create a start-up business whose primary goal is to exceed customer's
expectations.
• To increase the number of clients through superior performance.
• To develop a sustainable business, surviving off of its own cash flow.
Mission
ONLY HERE’s mission is to provide the customer with quality of Bakery product that
Customers like. We exist to attract and maintain customers. Our product test and quality
will exceed the expectations of our customers.
Vision
To be leading Our Bakery Products in the Gujarat by gaining more than 30% market
share with variety of Products for the whole family.
81
5.3 SELECTION OF LOCATION:
Factory location is the decision regarding the geographical situation of the plant. This
decision is very crucial because it is not easily reversible and involves huge amount of
investment. The factory location plays an important role in the success or failure of the
business. But this design is affected by many factors which are kept in mind while
selecting the location.
I have selected the following site for the manufacturing of Bakery Products.
Location – Plot no. 27 Naroda GIDC
Naroda,
Ahmedabad.
The correctness of this decision regarding the site can be justified on the following points
.
1. Industrial area: The factory is situated at the “Naroda GIDC”. As our Business of
Bakery product manufacturing and wholesaler, it will be easy for us to get
customers and suppliers nearby area which help to keep our cost low.
2. Transportation Easiness: As we have business located in the industrial area near
to city area market, the Transportation is easy.
3. Market proximity: It is very important as being businessman to locate
manufacturing plant near to market so that it is easy to fulfill the requirement of
customers quickly. We get Retailers from near area of our business.
4. Rapid Sales: Now a days Bakery Products are in trend. Because it is most
probably use in fast food. The sales of our product are thus increased rapidly.

82
5. Opportunity to grow: We can expand our business by doing backward integration
or Forward integration by selecting Ahmedabad, Aanand, Nadiad, Baroda city as
our location.
83
5.4 Industry and competitive analysis
5.4.1 Analysis of textile industry:
India has a huge; relatively inexpensive and skilled labor force.
It has impressive design expertise
It is among the world's largest producers of fabrics and it produces a wide range of
apparel articles and is considered a particularly competitive source for home textiles
(bed linens, towels, etc).
One of the largest producers of cotton yarn, jute, silk and manmade fabrics.
Availability of Low Cost and Skilled Manpower provides competitive advantage to
industry.
Availability of large varieties of cotton fiber and has a fast growing synthetic fiber
industry.
5.4.2 Competitors in the market
Our competition is in internal market after sometime we will go for external market.
5.4.3 How to compete
To provide best quality bakery items.
To provide in variety of bakery items.
Advertising
Give product for testing
84
5.5 Marketing and sales strategy:
5.5.1 Where to sale: Ahmedabad, Nadiad, Anand and Baroda
5.5.2 Marketing
We will be dealing with the intermediary sellers more than with general public, so
direct business to business sales will be more important than general marketing
and Advertising.
• Segmentation:
A company discovers different needs and groups in the market place and targets
that needs and groups that it can satisfy in a superior way. The Marketer than
decides, which segments present the greatest opportunity – which is target
market.
Geographic Segmentation:
Here, we are focusing in our State only and especially in major area of
Ahmedabad, Anand, Nadiad, Baroda.
Region: Initially we are focusing on Ahmedabad, Anand, Nadiad
and Baroda.
City: Ahmedabad, Nadiad, Anand and Baroda .
• Demographic Segmentation:
Life cycle stage: Supplier, whole seller, retailer.
class: Lower to Upper Class.
• Psychographics Segmentation:
Lifestyle: Any time you wont
Personalize: want to experience the best.
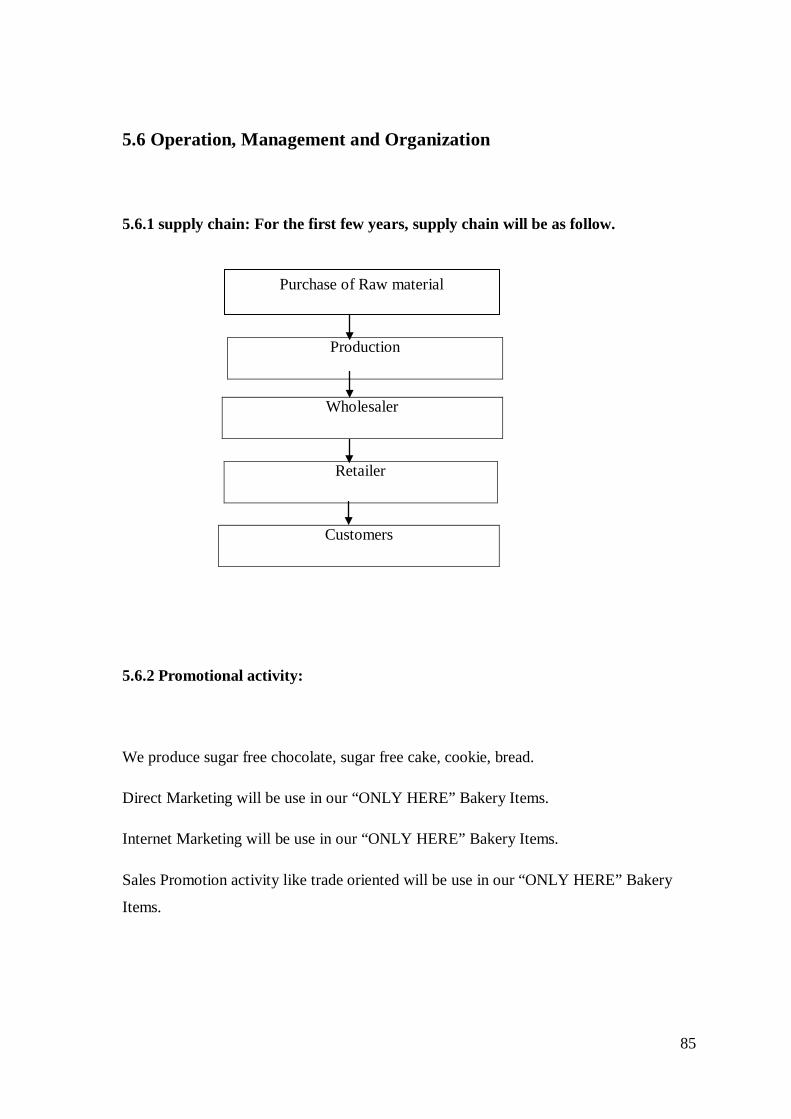
85
5.6 Operation, Management and Organization
5.6.1 supply chain: For the first few years, supply chain will be as follow.
Production
Retailer
5.6.2 Promotional activity:
We produce sugar free chocolate, sugar free cake, cookie, bread.
Direct Marketing will be use in our “ONLY HERE” Bakery Items.
Internet Marketing will be use in our “ONLY HERE” Bakery Items.
Sales Promotion activity like trade oriented will be use in our “ONLY HERE” Bakery
Items.
Wholesaler
Customers
Purchase of Raw material
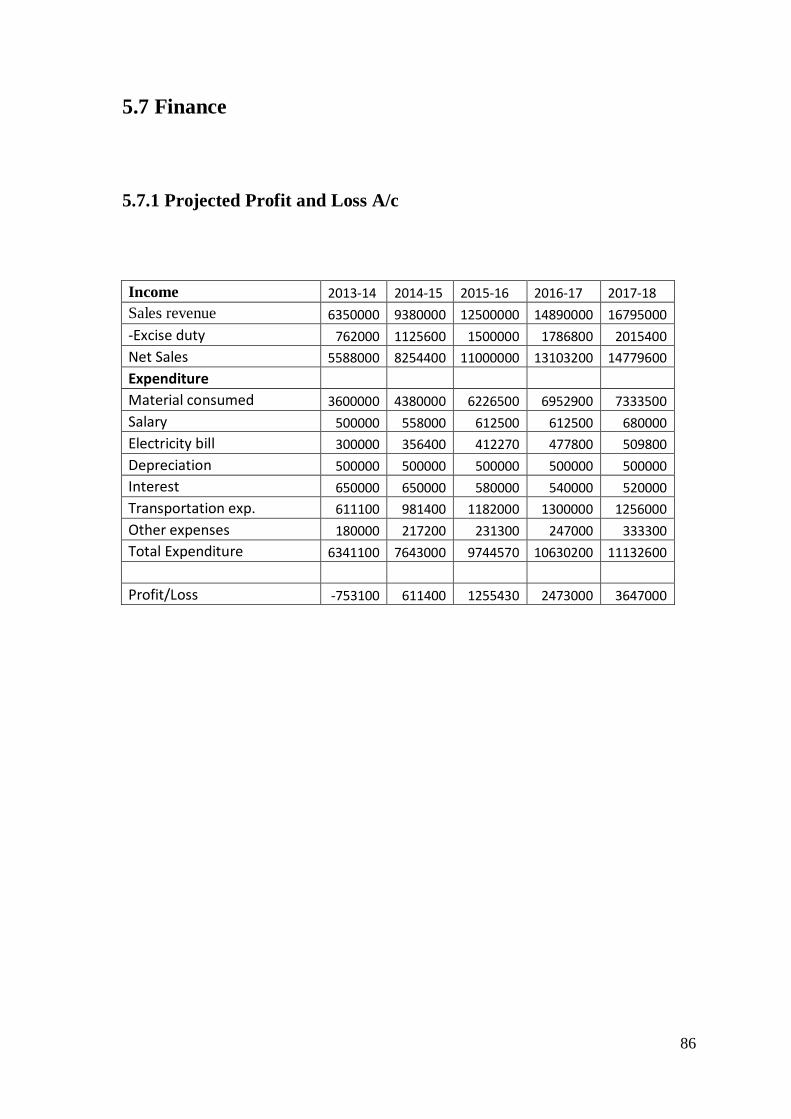
86
5.7 Finance
5.7.1 Projected Profit and Loss A/c
Income 2013-14 2014-15 2015-16 2016-17 2017-18 Sales revenue 6350000 9380000 12500000 14890000 16795000 -Excise duty 762000 1125600 1500000 1786800 2015400 Net Sales 5588000 8254400 11000000 13103200 14779600 Expenditure
Material consumed 3600000 4380000 6226500 6952900 7333500 Salary 500000 558000 612500 612500 680000 Electricity bill 300000 356400 412270 477800 509800 Depreciation 500000 500000 500000 500000 500000 Interest 650000 650000 580000 540000 520000 Transportation exp. 611100 981400 1182000 1300000 1256000 Other expenses 180000 217200 231300 247000 333300 Total Expenditure 6341100 7643000 9744570 10630200 11132600
Profit/Loss -753100 611400 1255430 2473000 3647000
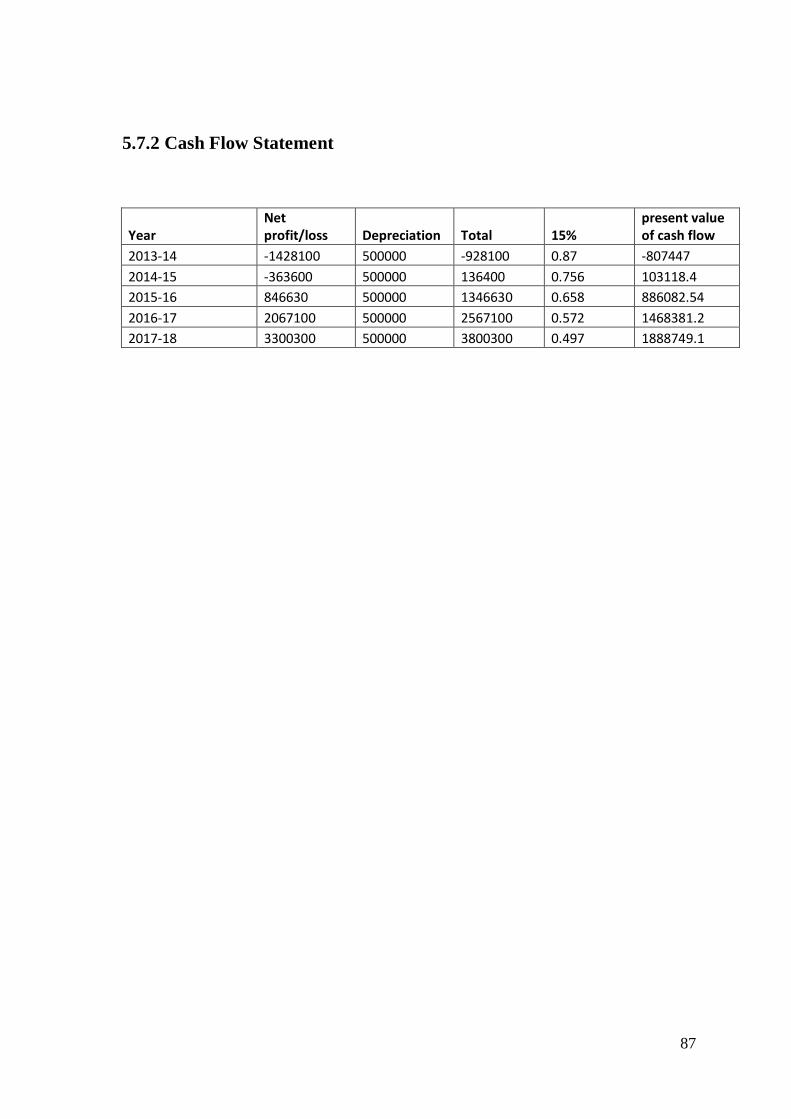
87
5.7.2 Cash Flow Statement
Year Net profit/loss Depreciation Total 15%
present value of cash flow
2013-14 -1428100 500000 -928100 0.87 -807447 2014-15 -363600 500000 136400 0.756 103118.4 2015-16 846630 500000 1346630 0.658 886082.54 2016-17 2067100 500000 2567100 0.572 1468381.2 2017-18 3300300 500000 3800300 0.497 1888749.1
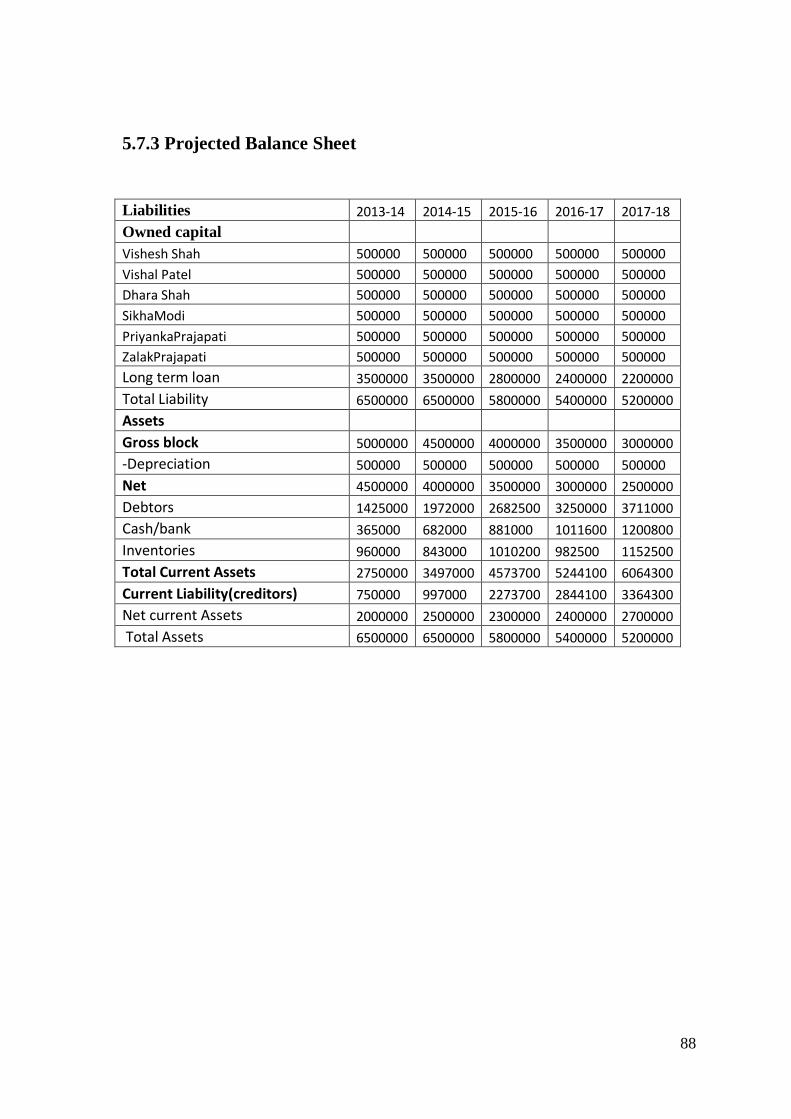
88
5.7.3 Projected Balance Sheet
Liabilities 2013-14 2014-15 2015-16 2016-17 2017-18 Owned capital
Vishesh Shah 500000 500000 500000 500000 500000 Vishal Patel 500000 500000 500000 500000 500000 Dhara Shah 500000 500000 500000 500000 500000 SikhaModi 500000 500000 500000 500000 500000 PriyankaPrajapati 500000 500000 500000 500000 500000 ZalakPrajapati 500000 500000 500000 500000 500000 Long term loan 3500000 3500000 2800000 2400000 2200000 Total Liability 6500000 6500000 5800000 5400000 5200000 Assets
Gross block 5000000 4500000 4000000 3500000 3000000 -Depreciation 500000 500000 500000 500000 500000 Net 4500000 4000000 3500000 3000000 2500000 Debtors 1425000 1972000 2682500 3250000 3711000 Cash/bank 365000 682000 881000 1011600 1200800 Inventories 960000 843000 1010200 982500 1152500 Total Current Assets 2750000 3497000 4573700 5244100 6064300 Current Liability(creditors) 750000 997000 2273700 2844100 3364300 Net current Assets 2000000 2500000 2300000 2400000 2700000 Total Assets 6500000 6500000 5800000 5400000 5200000

89
CHAPTER-6
FINDINGS AND CONCLUSION
6.1 FINDINGS
6.2 CONCLUSION
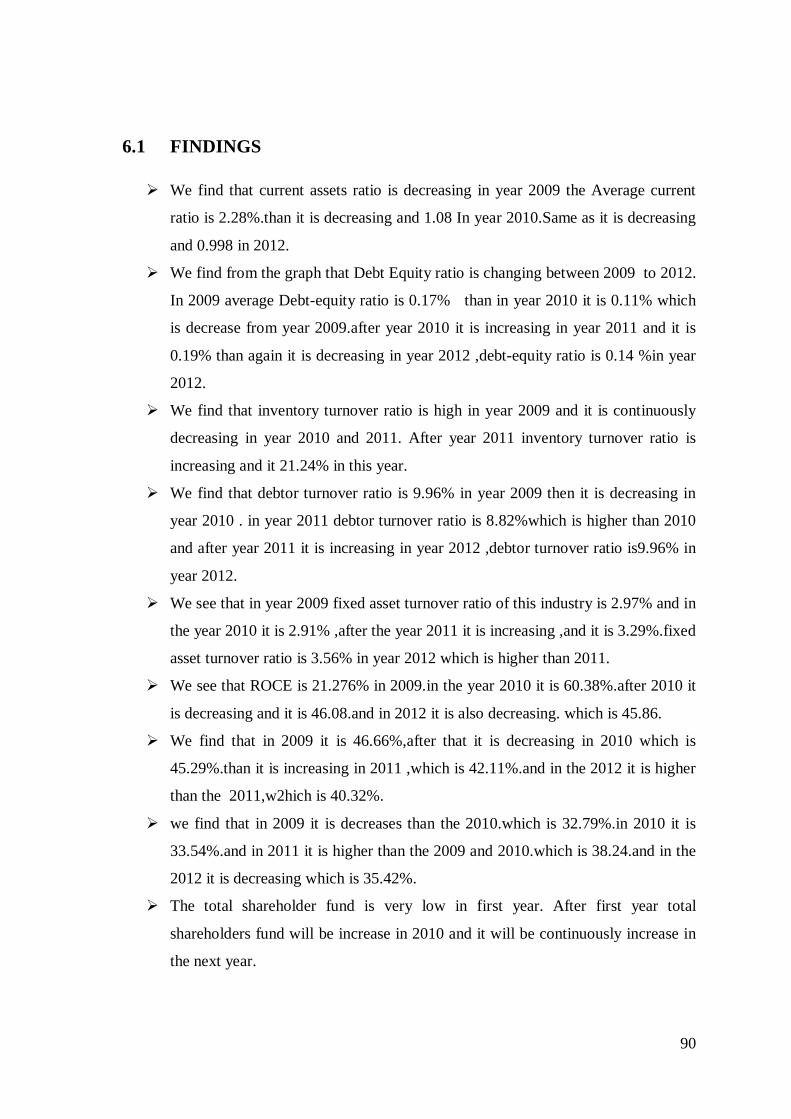
90
6.1 FINDINGS
We find that current assets ratio is decreasing in year 2009 the Average current
ratio is 2.28%.than it is decreasing and 1.08 In year 2010.Same as it is decreasing
and 0.998 in 2012.
We find from the graph that Debt Equity ratio is changing between 2009 to 2012.
In 2009 average Debt-equity ratio is 0.17% than in year 2010 it is 0.11% which
is decrease from year 2009.after year 2010 it is increasing in year 2011 and it is
0.19% than again it is decreasing in year 2012 ,debt-equity ratio is 0.14 %in year
2012.
We find that inventory turnover ratio is high in year 2009 and it is continuously
decreasing in year 2010 and 2011. After year 2011 inventory turnover ratio is
increasing and it 21.24% in this year.
We find that debtor turnover ratio is 9.96% in year 2009 then it is decreasing in
year 2010 . in year 2011 debtor turnover ratio is 8.82%which is higher than 2010
and after year 2011 it is increasing in year 2012 ,debtor turnover ratio is9.96% in
year 2012.
We see that in year 2009 fixed asset turnover ratio of this industry is 2.97% and in
the year 2010 it is 2.91% ,after the year 2011 it is increasing ,and it is 3.29%.fixed
asset turnover ratio is 3.56% in year 2012 which is higher than 2011.
We see that ROCE is 21.276% in 2009.in the year 2010 it is 60.38%.after 2010 it
is decreasing and it is 46.08.and in 2012 it is also decreasing. which is 45.86.
We find that in 2009 it is 46.66%,after that it is decreasing in 2010 which is
45.29%.than it is increasing in 2011 ,which is 42.11%.and in the 2012 it is higher
than the 2011,w2hich is 40.32%.
we find that in 2009 it is decreases than the 2010.which is 32.79%.in 2010 it is
33.54%.and in 2011 it is higher than the 2009 and 2010.which is 38.24.and in the
2012 it is decreasing which is 35.42%.
The total shareholder fund is very low in first year. After first year total
shareholders fund will be increase in 2010 and it will be continuously increase in
the next year.

91
The total shareholder fund is very low in first year. After first year total
shareholders fund will be increase in 2010 and it will be continuously increase in
the next year.
We find that profit after tax is 1 in year 2009. After 2009 the profit after tax is
increase in 2010. After 2010 profit after tax is continuously increase.
In the above graph we can say that the total assets will be continuously increase in
2009-2012. The total assets is increase in 2012 and then it will be increasing next
year.
92
6.2 CONCLUSION
After preparing a MRP-I report on In Depth Study of Food And Dairy Industry, we have
finally reached to the following conclusions;
As the apparel manufacturing industry has become more labour intensive and
requires less capital investment.
The Food And Dairy Industry accounts for over 20 percent of industrial production
and is closely linked with the agricultural and rural economy.
With liberalization in investment and the subsequent the removal of quantitative
restrictions on several Food and Dairy products, the Indian market now has the
presence of several international brands.
India is recognized as a biggest and fastest growing market in the world for milk
and milk products.
So all the countries are looking at Indian dairy industry markets for exports. As
per the WTO norms, the milk produced in India is yet to get the certificate for
high quality.
As per GATT agreement, the export subsidy is reducing. Because of this, we are
expecting major changes in dairy industry of North America, Europe and
Australia.
India may also get some advantage in this situation. After reduction in subsidies
given by other countries, India would be able to compete with their products
efficiently on price in international markets.
93
BIBLIOGRAPHY
http://www.scribd.com/doc/68462150/Dairy-Industry
http://kids.britannica.com/comptons/article-199398/dairy-
industryhttp://www.indianmirror.com/indian-industries/dairy.html
http://www.rncos.com/Report/IM368.htm
http://www.dsir.gov.in/reports/ittp_tedo/agro/AF_Animals_Milk_Dairy_Intro.pdf
http://www.unnati-dairy.com/indian_dairy_scenario.htm
http://www.dairyfarmguide.com/scenario-of-dairy-production-0100.html
http://www.nddb.org/English/statistics/Pages/Statistics.aspx
http://www.thefinancialexpress-bd.com/more.php?date=2012-03-10&news_id=122867
http://business.mapsofindia.com/food-industry/dairy/
www.Capitaline.com
www.nestleindia.com
www.cadburyindia.com
www.jubliantfoodworks.com
www.glaxosmith.com
www.britanniainds.com
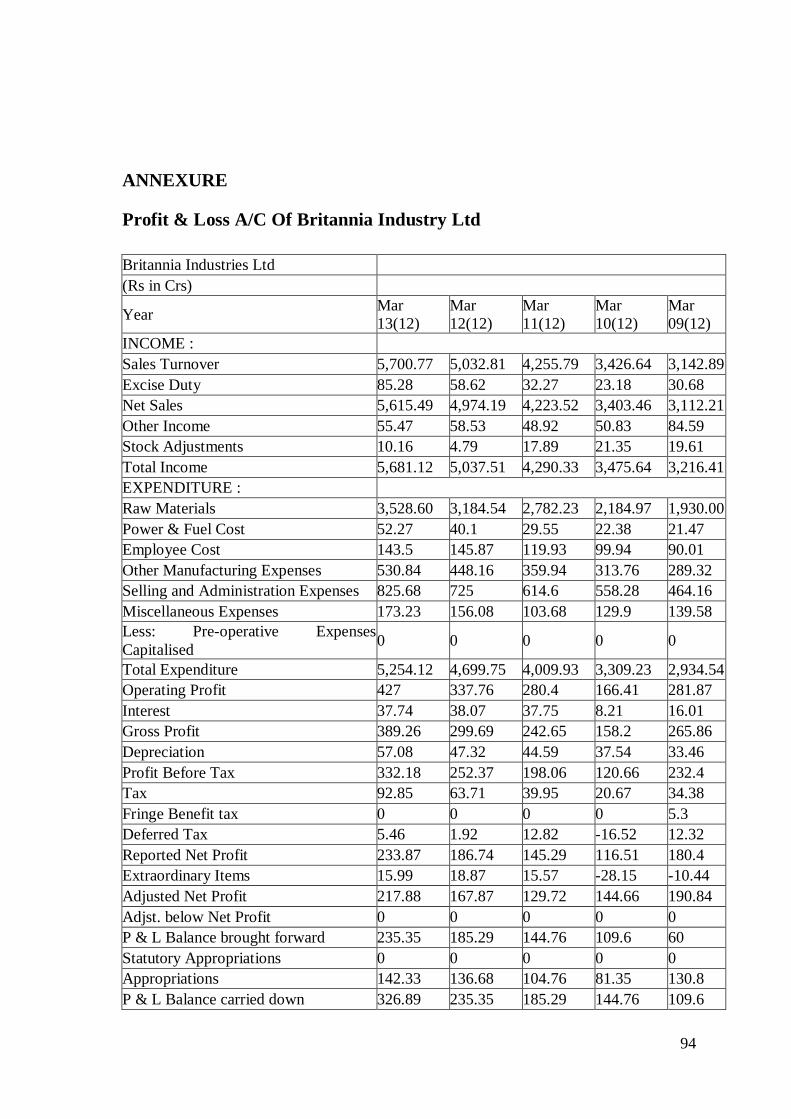
94
ANNEXURE Profit & Loss A/C Of Britannia Industry Ltd
Britannia Industries Ltd (Rs in Crs) Year Mar
13(12) Mar 12(12)
Mar 11(12)
Mar 10(12)
Mar 09(12)
INCOME : Sales Turnover 5,700.77 5,032.81 4,255.79 3,426.64 3,142.89 Excise Duty 85.28 58.62 32.27 23.18 30.68 Net Sales 5,615.49 4,974.19 4,223.52 3,403.46 3,112.21 Other Income 55.47 58.53 48.92 50.83 84.59 Stock Adjustments 10.16 4.79 17.89 21.35 19.61 Total Income 5,681.12 5,037.51 4,290.33 3,475.64 3,216.41 EXPENDITURE : Raw Materials 3,528.60 3,184.54 2,782.23 2,184.97 1,930.00 Power & Fuel Cost 52.27 40.1 29.55 22.38 21.47 Employee Cost 143.5 145.87 119.93 99.94 90.01 Other Manufacturing Expenses 530.84 448.16 359.94 313.76 289.32 Selling and Administration Expenses 825.68 725 614.6 558.28 464.16 Miscellaneous Expenses 173.23 156.08 103.68 129.9 139.58 Less: Pre-operative Expenses Capitalised 0 0 0 0 0
Total Expenditure 5,254.12 4,699.75 4,009.93 3,309.23 2,934.54 Operating Profit 427 337.76 280.4 166.41 281.87 Interest 37.74 38.07 37.75 8.21 16.01 Gross Profit 389.26 299.69 242.65 158.2 265.86 Depreciation 57.08 47.32 44.59 37.54 33.46 Profit Before Tax 332.18 252.37 198.06 120.66 232.4 Tax 92.85 63.71 39.95 20.67 34.38 Fringe Benefit tax 0 0 0 0 5.3 Deferred Tax 5.46 1.92 12.82 -16.52 12.32 Reported Net Profit 233.87 186.74 145.29 116.51 180.4 Extraordinary Items 15.99 18.87 15.57 -28.15 -10.44 Adjusted Net Profit 217.88 167.87 129.72 144.66 190.84 Adjst. below Net Profit 0 0 0 0 0 P & L Balance brought forward 235.35 185.29 144.76 109.6 60 Statutory Appropriations 0 0 0 0 0 Appropriations 142.33 136.68 104.76 81.35 130.8 P & L Balance carried down 326.89 235.35 185.29 144.76 109.6
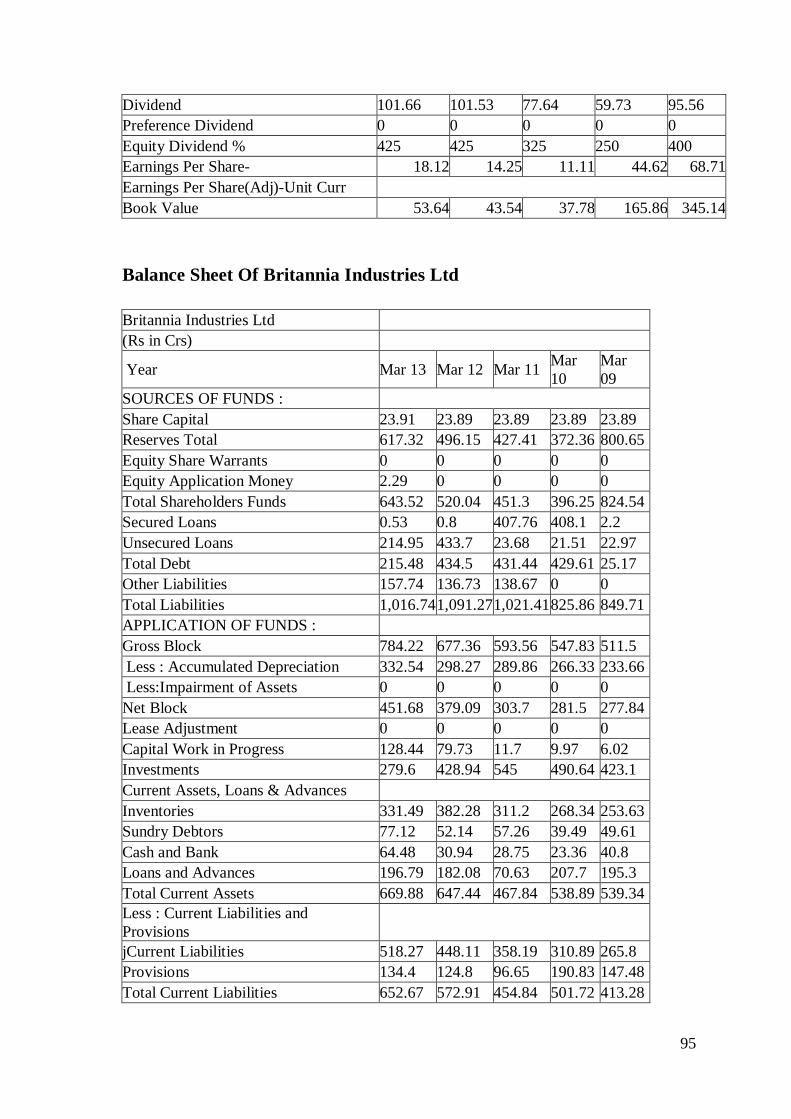
95
Dividend 101.66 101.53 77.64 59.73 95.56 Preference Dividend 0 0 0 0 0 Equity Dividend % 425 425 325 250 400 Earnings Per Share- 18.12 14.25 11.11 44.62 68.71 Earnings Per Share(Adj)-Unit Curr Book Value 53.64 43.54 37.78 165.86 345.14
Balance Sheet Of Britannia Industries Ltd
Britannia Industries Ltd (Rs in Crs) Year Mar 13 Mar 12 Mar 11 Mar
10 Mar 09
SOURCES OF FUNDS : Share Capital 23.91 23.89 23.89 23.89 23.89 Reserves Total 617.32 496.15 427.41 372.36 800.65 Equity Share Warrants 0 0 0 0 0 Equity Application Money 2.29 0 0 0 0 Total Shareholders Funds 643.52 520.04 451.3 396.25 824.54 Secured Loans 0.53 0.8 407.76 408.1 2.2 Unsecured Loans 214.95 433.7 23.68 21.51 22.97 Total Debt 215.48 434.5 431.44 429.61 25.17 Other Liabilities 157.74 136.73 138.67 0 0 Total Liabilities 1,016.74 1,091.27 1,021.41 825.86 849.71 APPLICATION OF FUNDS : Gross Block 784.22 677.36 593.56 547.83 511.5 Less : Accumulated Depreciation 332.54 298.27 289.86 266.33 233.66 Less:Impairment of Assets 0 0 0 0 0 Net Block 451.68 379.09 303.7 281.5 277.84 Lease Adjustment 0 0 0 0 0 Capital Work in Progress 128.44 79.73 11.7 9.97 6.02 Investments 279.6 428.94 545 490.64 423.1 Current Assets, Loans & Advances Inventories 331.49 382.28 311.2 268.34 253.63 Sundry Debtors 77.12 52.14 57.26 39.49 49.61 Cash and Bank 64.48 30.94 28.75 23.36 40.8 Loans and Advances 196.79 182.08 70.63 207.7 195.3 Total Current Assets 669.88 647.44 467.84 538.89 539.34 Less : Current Liabilities and Provisions jCurrent Liabilities 518.27 448.11 358.19 310.89 265.8 Provisions 134.4 124.8 96.65 190.83 147.48 Total Current Liabilities 652.67 572.91 454.84 501.72 413.28
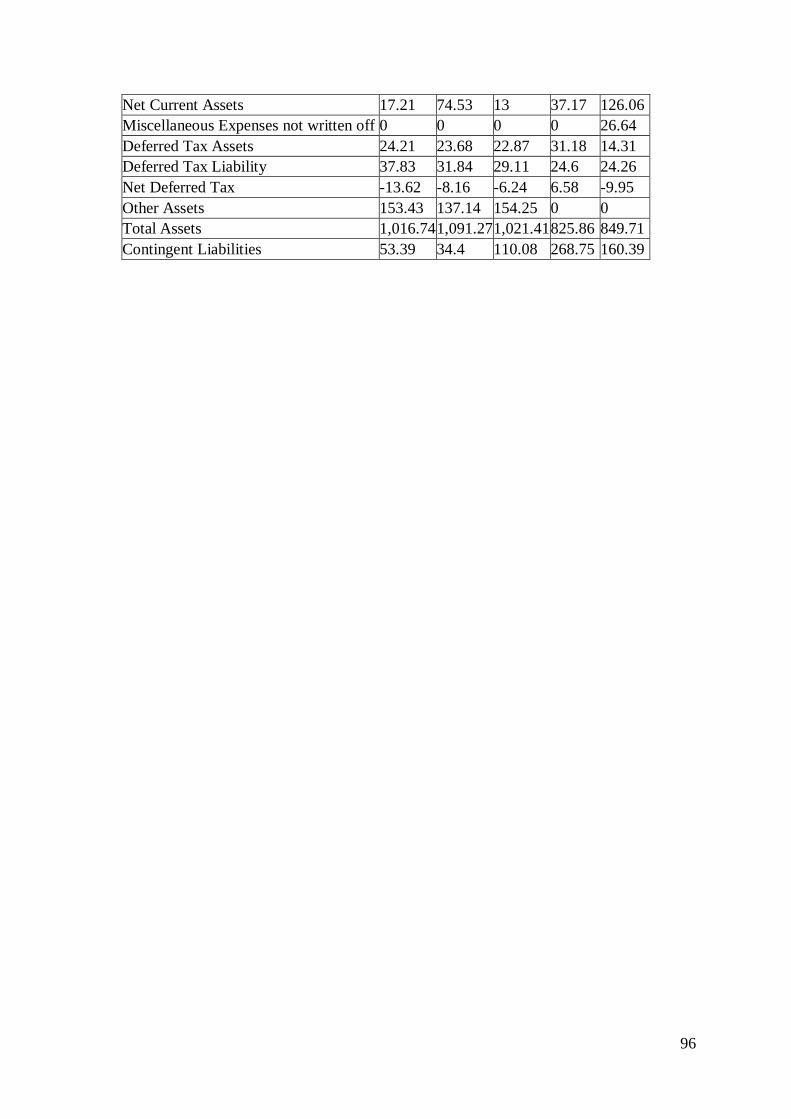
96
Net Current Assets 17.21 74.53 13 37.17 126.06 Miscellaneous Expenses not written off 0 0 0 0 26.64 Deferred Tax Assets 24.21 23.68 22.87 31.18 14.31 Deferred Tax Liability 37.83 31.84 29.11 24.6 24.26 Net Deferred Tax -13.62 -8.16 -6.24 6.58 -9.95 Other Assets 153.43 137.14 154.25 0 0 Total Assets 1,016.74 1,091.27 1,021.41 825.86 849.71 Contingent Liabilities 53.39 34.4 110.08 268.75 160.39
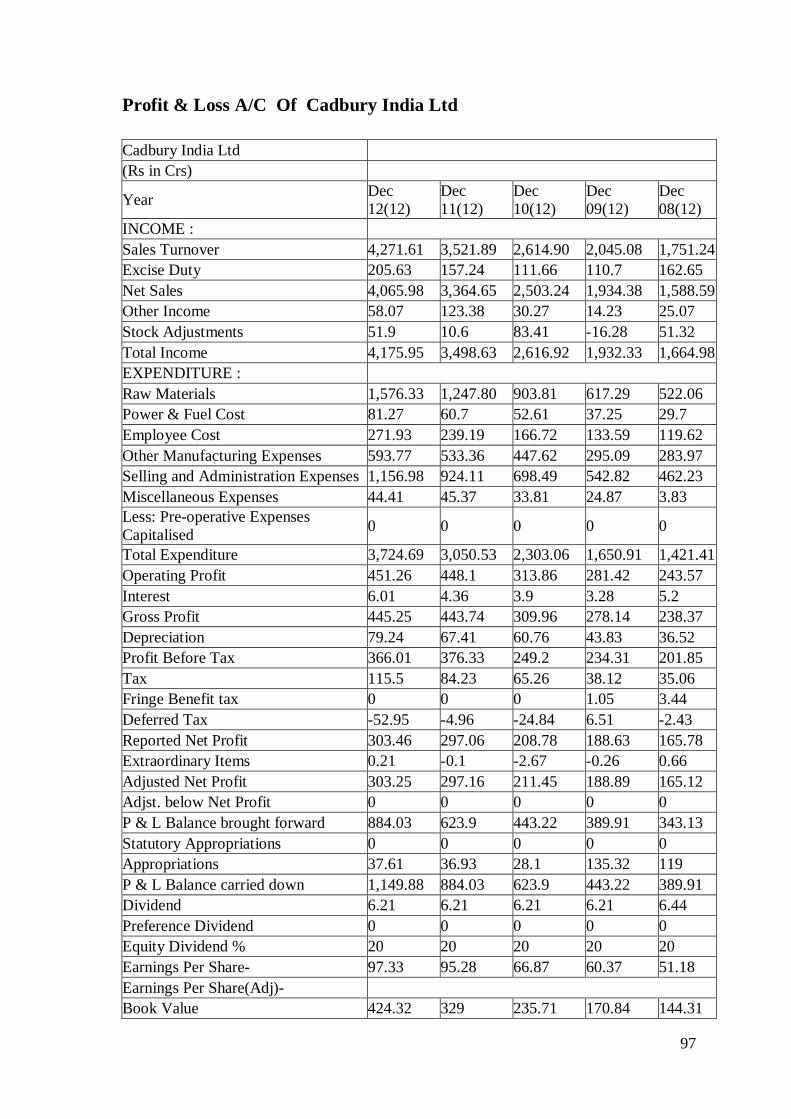
97
Profit & Loss A/C Of Cadbury India Ltd
Cadbury India Ltd (Rs in Crs) Year Dec
12(12) Dec 11(12)
Dec 10(12)
Dec 09(12)
Dec 08(12)
INCOME : Sales Turnover 4,271.61 3,521.89 2,614.90 2,045.08 1,751.24 Excise Duty 205.63 157.24 111.66 110.7 162.65 Net Sales 4,065.98 3,364.65 2,503.24 1,934.38 1,588.59 Other Income 58.07 123.38 30.27 14.23 25.07 Stock Adjustments 51.9 10.6 83.41 -16.28 51.32 Total Income 4,175.95 3,498.63 2,616.92 1,932.33 1,664.98 EXPENDITURE : Raw Materials 1,576.33 1,247.80 903.81 617.29 522.06 Power & Fuel Cost 81.27 60.7 52.61 37.25 29.7 Employee Cost 271.93 239.19 166.72 133.59 119.62 Other Manufacturing Expenses 593.77 533.36 447.62 295.09 283.97 Selling and Administration Expenses 1,156.98 924.11 698.49 542.82 462.23 Miscellaneous Expenses 44.41 45.37 33.81 24.87 3.83 Less: Pre-operative Expenses Capitalised 0 0 0 0 0
Total Expenditure 3,724.69 3,050.53 2,303.06 1,650.91 1,421.41 Operating Profit 451.26 448.1 313.86 281.42 243.57 Interest 6.01 4.36 3.9 3.28 5.2 Gross Profit 445.25 443.74 309.96 278.14 238.37 Depreciation 79.24 67.41 60.76 43.83 36.52 Profit Before Tax 366.01 376.33 249.2 234.31 201.85 Tax 115.5 84.23 65.26 38.12 35.06 Fringe Benefit tax 0 0 0 1.05 3.44 Deferred Tax -52.95 -4.96 -24.84 6.51 -2.43 Reported Net Profit 303.46 297.06 208.78 188.63 165.78 Extraordinary Items 0.21 -0.1 -2.67 -0.26 0.66 Adjusted Net Profit 303.25 297.16 211.45 188.89 165.12 Adjst. below Net Profit 0 0 0 0 0 P & L Balance brought forward 884.03 623.9 443.22 389.91 343.13 Statutory Appropriations 0 0 0 0 0 Appropriations 37.61 36.93 28.1 135.32 119 P & L Balance carried down 1,149.88 884.03 623.9 443.22 389.91 Dividend 6.21 6.21 6.21 6.21 6.44 Preference Dividend 0 0 0 0 0 Equity Dividend % 20 20 20 20 20 Earnings Per Share- 97.33 95.28 66.87 60.37 51.18 Earnings Per Share(Adj)- Book Value 424.32 329 235.71 170.84 144.31
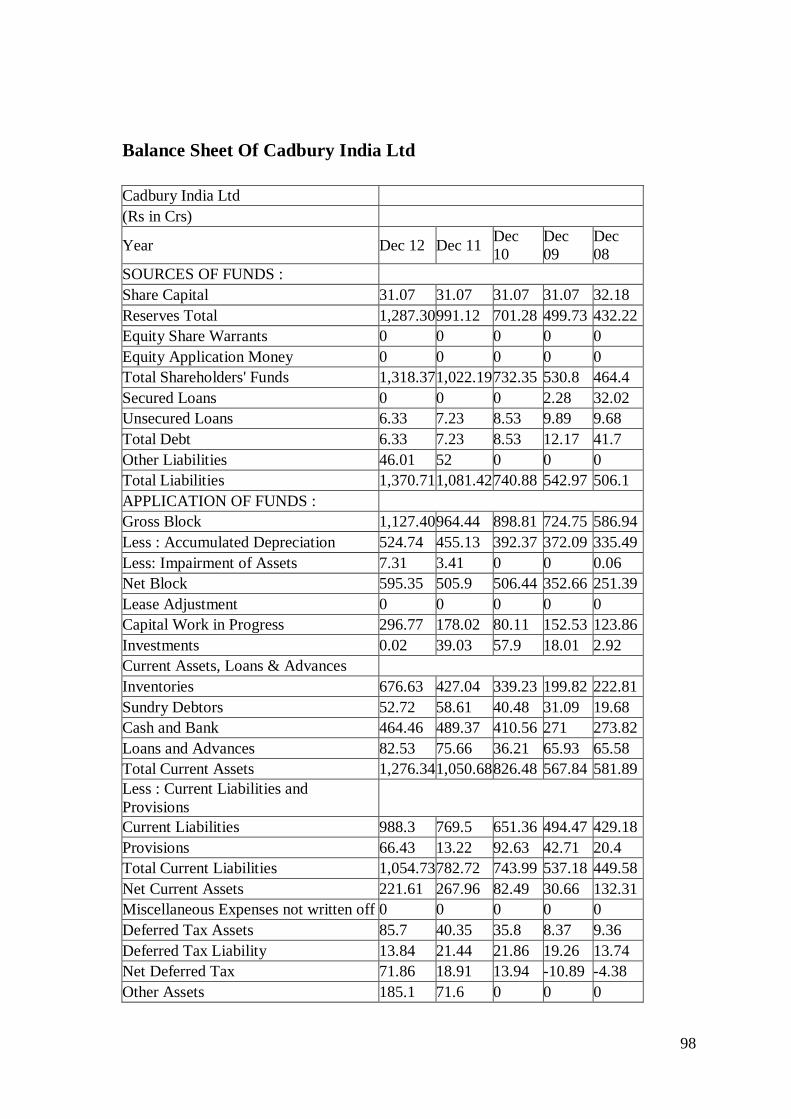
98
Balance Sheet Of Cadbury India Ltd
Cadbury India Ltd (Rs in Crs) Year Dec 12 Dec 11 Dec
10 Dec 09
Dec 08
SOURCES OF FUNDS : Share Capital 31.07 31.07 31.07 31.07 32.18 Reserves Total 1,287.30 991.12 701.28 499.73 432.22 Equity Share Warrants 0 0 0 0 0 Equity Application Money 0 0 0 0 0 Total Shareholders' Funds 1,318.37 1,022.19 732.35 530.8 464.4 Secured Loans 0 0 0 2.28 32.02 Unsecured Loans 6.33 7.23 8.53 9.89 9.68 Total Debt 6.33 7.23 8.53 12.17 41.7 Other Liabilities 46.01 52 0 0 0 Total Liabilities 1,370.71 1,081.42 740.88 542.97 506.1 APPLICATION OF FUNDS : Gross Block 1,127.40 964.44 898.81 724.75 586.94 Less : Accumulated Depreciation 524.74 455.13 392.37 372.09 335.49 Less: Impairment of Assets 7.31 3.41 0 0 0.06 Net Block 595.35 505.9 506.44 352.66 251.39 Lease Adjustment 0 0 0 0 0 Capital Work in Progress 296.77 178.02 80.11 152.53 123.86 Investments 0.02 39.03 57.9 18.01 2.92 Current Assets, Loans & Advances Inventories 676.63 427.04 339.23 199.82 222.81 Sundry Debtors 52.72 58.61 40.48 31.09 19.68 Cash and Bank 464.46 489.37 410.56 271 273.82 Loans and Advances 82.53 75.66 36.21 65.93 65.58 Total Current Assets 1,276.34 1,050.68 826.48 567.84 581.89 Less : Current Liabilities and Provisions Current Liabilities 988.3 769.5 651.36 494.47 429.18 Provisions 66.43 13.22 92.63 42.71 20.4 Total Current Liabilities 1,054.73 782.72 743.99 537.18 449.58 Net Current Assets 221.61 267.96 82.49 30.66 132.31 Miscellaneous Expenses not written off 0 0 0 0 0 Deferred Tax Assets 85.7 40.35 35.8 8.37 9.36 Deferred Tax Liability 13.84 21.44 21.86 19.26 13.74 Net Deferred Tax 71.86 18.91 13.94 -10.89 -4.38 Other Assets 185.1 71.6 0 0 0

99
Total Assets 1,370.71 1,081.42 740.88 542.97 506.1 Contingent Liabilities 280.51 176.04 157.79 142.99 73.52
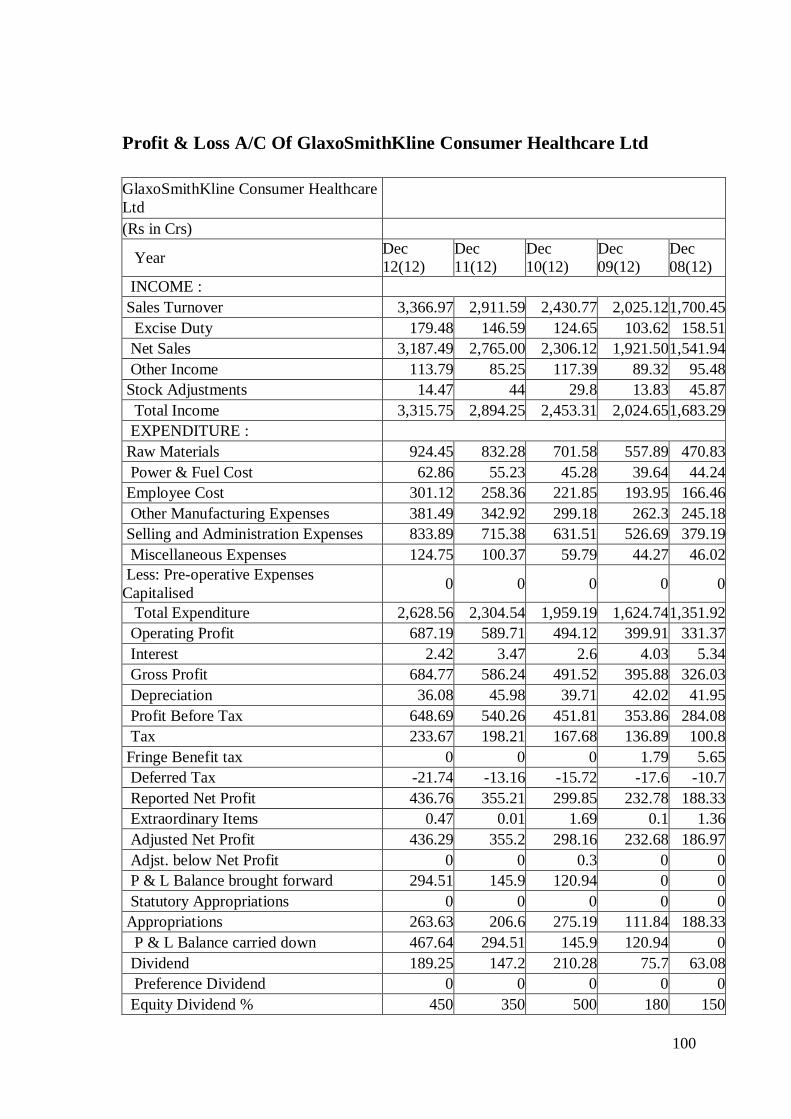
100
Profit & Loss A/C Of GlaxoSmithKline Consumer Healthcare Ltd
GlaxoSmithKline Consumer Healthcare Ltd (Rs in Crs) Year Dec
12(12) Dec 11(12)
Dec 10(12)
Dec 09(12)
Dec 08(12)
INCOME : Sales Turnover 3,366.97 2,911.59 2,430.77 2,025.12 1,700.45 Excise Duty 179.48 146.59 124.65 103.62 158.51 Net Sales 3,187.49 2,765.00 2,306.12 1,921.50 1,541.94 Other Income 113.79 85.25 117.39 89.32 95.48 Stock Adjustments 14.47 44 29.8 13.83 45.87 Total Income 3,315.75 2,894.25 2,453.31 2,024.65 1,683.29 EXPENDITURE : Raw Materials 924.45 832.28 701.58 557.89 470.83 Power & Fuel Cost 62.86 55.23 45.28 39.64 44.24 Employee Cost 301.12 258.36 221.85 193.95 166.46 Other Manufacturing Expenses 381.49 342.92 299.18 262.3 245.18 Selling and Administration Expenses 833.89 715.38 631.51 526.69 379.19 Miscellaneous Expenses 124.75 100.37 59.79 44.27 46.02 Less: Pre-operative Expenses Capitalised 0 0 0 0 0
Total Expenditure 2,628.56 2,304.54 1,959.19 1,624.74 1,351.92 Operating Profit 687.19 589.71 494.12 399.91 331.37 Interest 2.42 3.47 2.6 4.03 5.34 Gross Profit 684.77 586.24 491.52 395.88 326.03 Depreciation 36.08 45.98 39.71 42.02 41.95 Profit Before Tax 648.69 540.26 451.81 353.86 284.08 Tax 233.67 198.21 167.68 136.89 100.8 Fringe Benefit tax 0 0 0 1.79 5.65 Deferred Tax -21.74 -13.16 -15.72 -17.6 -10.7 Reported Net Profit 436.76 355.21 299.85 232.78 188.33 Extraordinary Items 0.47 0.01 1.69 0.1 1.36 Adjusted Net Profit 436.29 355.2 298.16 232.68 186.97 Adjst. below Net Profit 0 0 0.3 0 0 P & L Balance brought forward 294.51 145.9 120.94 0 0 Statutory Appropriations 0 0 0 0 0 Appropriations 263.63 206.6 275.19 111.84 188.33 P & L Balance carried down 467.64 294.51 145.9 120.94 0 Dividend 189.25 147.2 210.28 75.7 63.08 Preference Dividend 0 0 0 0 0 Equity Dividend % 450 350 500 180 150
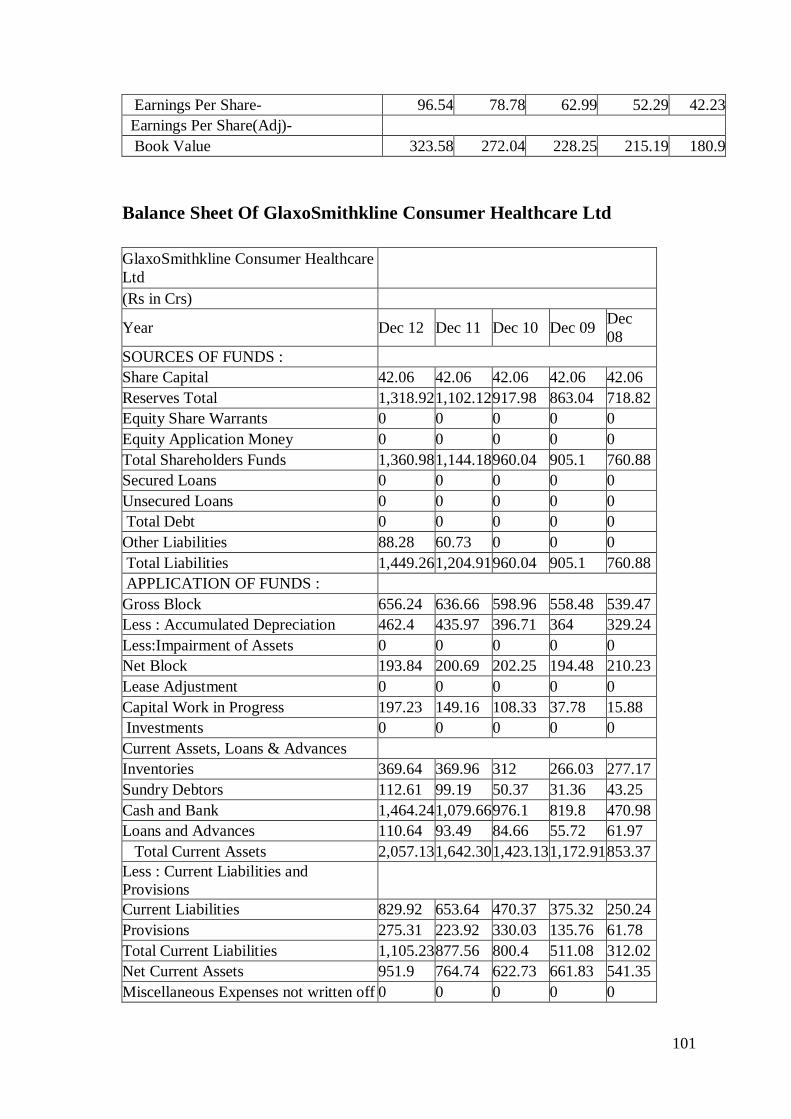
101
Earnings Per Share- 96.54 78.78 62.99 52.29 42.23 Earnings Per Share(Adj)- Book Value 323.58 272.04 228.25 215.19 180.9
Balance Sheet Of GlaxoSmithkline Consumer Healthcare Ltd
GlaxoSmithkline Consumer Healthcare Ltd (Rs in Crs) Year Dec 12 Dec 11 Dec 10 Dec 09 Dec
08 SOURCES OF FUNDS : Share Capital 42.06 42.06 42.06 42.06 42.06 Reserves Total 1,318.92 1,102.12 917.98 863.04 718.82 Equity Share Warrants 0 0 0 0 0 Equity Application Money 0 0 0 0 0 Total Shareholders Funds 1,360.98 1,144.18 960.04 905.1 760.88 Secured Loans 0 0 0 0 0 Unsecured Loans 0 0 0 0 0 Total Debt 0 0 0 0 0 Other Liabilities 88.28 60.73 0 0 0 Total Liabilities 1,449.26 1,204.91 960.04 905.1 760.88 APPLICATION OF FUNDS : Gross Block 656.24 636.66 598.96 558.48 539.47 Less : Accumulated Depreciation 462.4 435.97 396.71 364 329.24 Less:Impairment of Assets 0 0 0 0 0 Net Block 193.84 200.69 202.25 194.48 210.23 Lease Adjustment 0 0 0 0 0 Capital Work in Progress 197.23 149.16 108.33 37.78 15.88 Investments 0 0 0 0 0 Current Assets, Loans & Advances Inventories 369.64 369.96 312 266.03 277.17 Sundry Debtors 112.61 99.19 50.37 31.36 43.25 Cash and Bank 1,464.24 1,079.66 976.1 819.8 470.98 Loans and Advances 110.64 93.49 84.66 55.72 61.97 Total Current Assets 2,057.13 1,642.30 1,423.13 1,172.91 853.37 Less : Current Liabilities and Provisions Current Liabilities 829.92 653.64 470.37 375.32 250.24 Provisions 275.31 223.92 330.03 135.76 61.78 Total Current Liabilities 1,105.23 877.56 800.4 511.08 312.02 Net Current Assets 951.9 764.74 622.73 661.83 541.35 Miscellaneous Expenses not written off 0 0 0 0 0
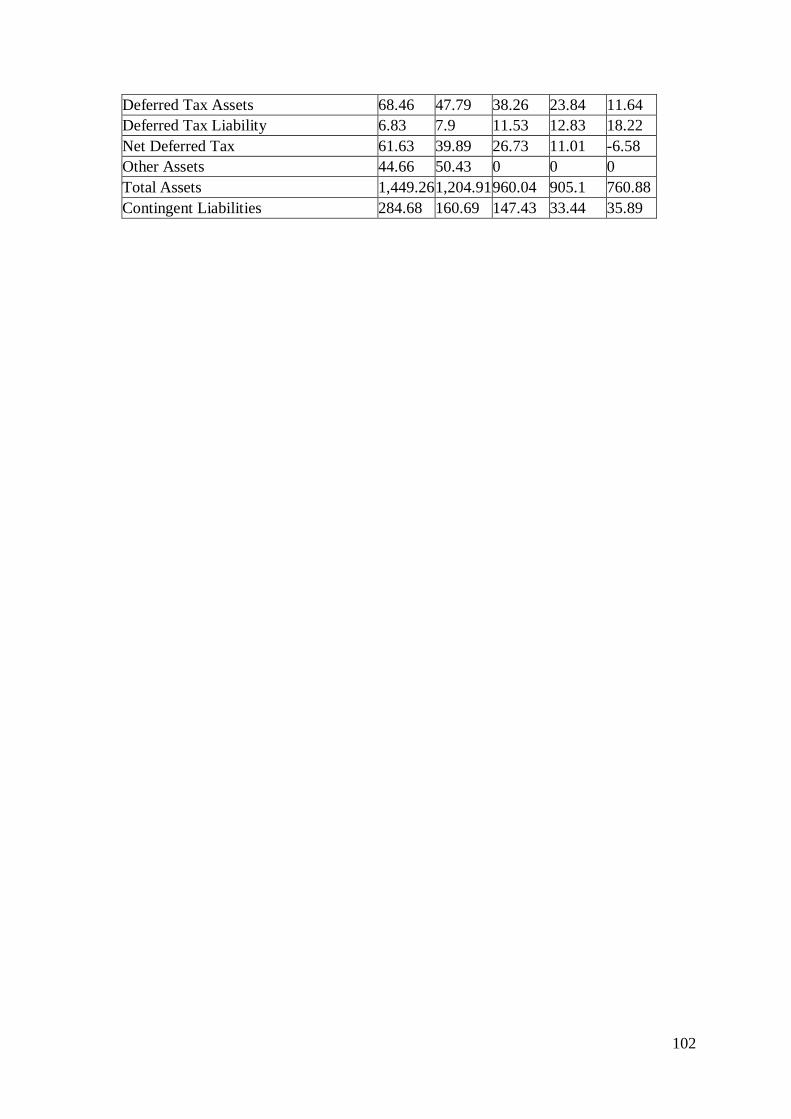
102
Deferred Tax Assets 68.46 47.79 38.26 23.84 11.64 Deferred Tax Liability 6.83 7.9 11.53 12.83 18.22 Net Deferred Tax 61.63 39.89 26.73 11.01 -6.58 Other Assets 44.66 50.43 0 0 0 Total Assets 1,449.26 1,204.91 960.04 905.1 760.88 Contingent Liabilities 284.68 160.69 147.43 33.44 35.89
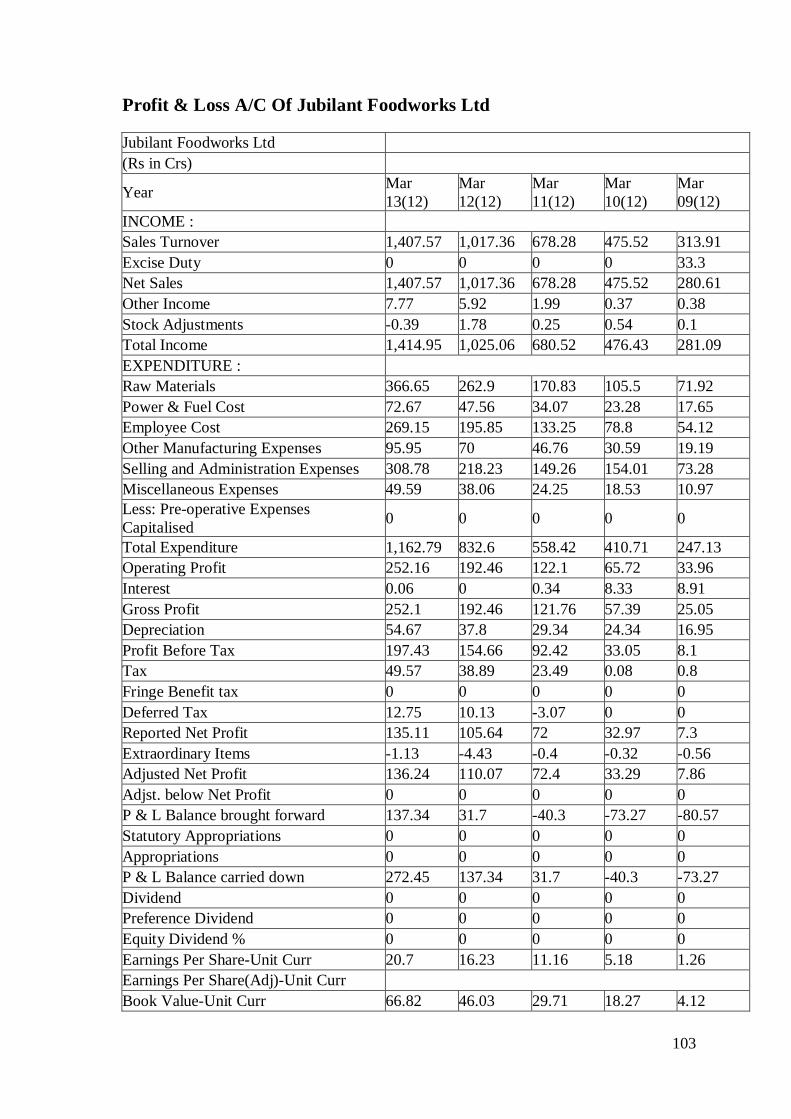
103
Profit & Loss A/C Of Jubilant Foodworks Ltd
Jubilant Foodworks Ltd (Rs in Crs) Year Mar
13(12) Mar 12(12)
Mar 11(12)
Mar 10(12)
Mar 09(12)
INCOME : Sales Turnover 1,407.57 1,017.36 678.28 475.52 313.91 Excise Duty 0 0 0 0 33.3 Net Sales 1,407.57 1,017.36 678.28 475.52 280.61 Other Income 7.77 5.92 1.99 0.37 0.38 Stock Adjustments -0.39 1.78 0.25 0.54 0.1 Total Income 1,414.95 1,025.06 680.52 476.43 281.09 EXPENDITURE : Raw Materials 366.65 262.9 170.83 105.5 71.92 Power & Fuel Cost 72.67 47.56 34.07 23.28 17.65 Employee Cost 269.15 195.85 133.25 78.8 54.12 Other Manufacturing Expenses 95.95 70 46.76 30.59 19.19 Selling and Administration Expenses 308.78 218.23 149.26 154.01 73.28 Miscellaneous Expenses 49.59 38.06 24.25 18.53 10.97 Less: Pre-operative Expenses Capitalised 0 0 0 0 0
Total Expenditure 1,162.79 832.6 558.42 410.71 247.13 Operating Profit 252.16 192.46 122.1 65.72 33.96 Interest 0.06 0 0.34 8.33 8.91 Gross Profit 252.1 192.46 121.76 57.39 25.05 Depreciation 54.67 37.8 29.34 24.34 16.95 Profit Before Tax 197.43 154.66 92.42 33.05 8.1 Tax 49.57 38.89 23.49 0.08 0.8 Fringe Benefit tax 0 0 0 0 0 Deferred Tax 12.75 10.13 -3.07 0 0 Reported Net Profit 135.11 105.64 72 32.97 7.3 Extraordinary Items -1.13 -4.43 -0.4 -0.32 -0.56 Adjusted Net Profit 136.24 110.07 72.4 33.29 7.86 Adjst. below Net Profit 0 0 0 0 0 P & L Balance brought forward 137.34 31.7 -40.3 -73.27 -80.57 Statutory Appropriations 0 0 0 0 0 Appropriations 0 0 0 0 0 P & L Balance carried down 272.45 137.34 31.7 -40.3 -73.27 Dividend 0 0 0 0 0 Preference Dividend 0 0 0 0 0 Equity Dividend % 0 0 0 0 0 Earnings Per Share-Unit Curr 20.7 16.23 11.16 5.18 1.26 Earnings Per Share(Adj)-Unit Curr Book Value-Unit Curr 66.82 46.03 29.71 18.27 4.12
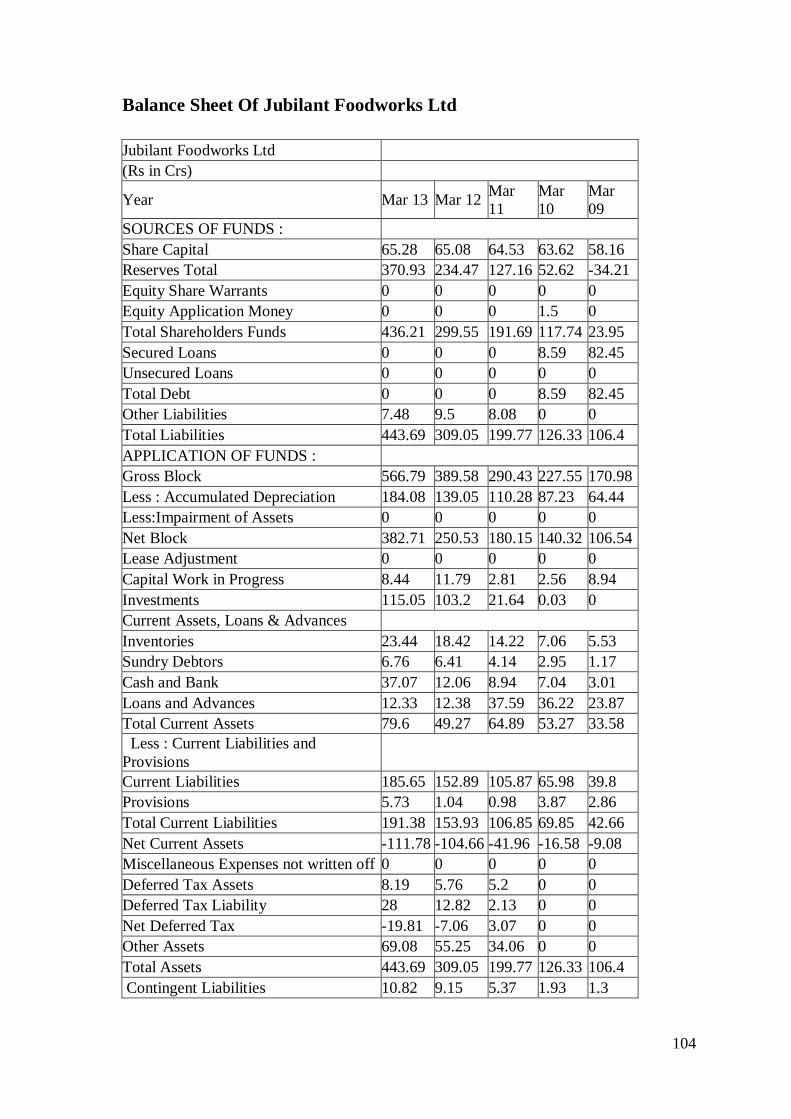
104
Balance Sheet Of Jubilant Foodworks Ltd
Jubilant Foodworks Ltd (Rs in Crs) Year Mar 13 Mar 12 Mar
11 Mar 10
Mar 09
SOURCES OF FUNDS : Share Capital 65.28 65.08 64.53 63.62 58.16 Reserves Total 370.93 234.47 127.16 52.62 -34.21 Equity Share Warrants 0 0 0 0 0 Equity Application Money 0 0 0 1.5 0 Total Shareholders Funds 436.21 299.55 191.69 117.74 23.95 Secured Loans 0 0 0 8.59 82.45 Unsecured Loans 0 0 0 0 0 Total Debt 0 0 0 8.59 82.45 Other Liabilities 7.48 9.5 8.08 0 0 Total Liabilities 443.69 309.05 199.77 126.33 106.4 APPLICATION OF FUNDS : Gross Block 566.79 389.58 290.43 227.55 170.98 Less : Accumulated Depreciation 184.08 139.05 110.28 87.23 64.44 Less:Impairment of Assets 0 0 0 0 0 Net Block 382.71 250.53 180.15 140.32 106.54 Lease Adjustment 0 0 0 0 0 Capital Work in Progress 8.44 11.79 2.81 2.56 8.94 Investments 115.05 103.2 21.64 0.03 0 Current Assets, Loans & Advances Inventories 23.44 18.42 14.22 7.06 5.53 Sundry Debtors 6.76 6.41 4.14 2.95 1.17 Cash and Bank 37.07 12.06 8.94 7.04 3.01 Loans and Advances 12.33 12.38 37.59 36.22 23.87 Total Current Assets 79.6 49.27 64.89 53.27 33.58 Less : Current Liabilities and Provisions Current Liabilities 185.65 152.89 105.87 65.98 39.8 Provisions 5.73 1.04 0.98 3.87 2.86 Total Current Liabilities 191.38 153.93 106.85 69.85 42.66 Net Current Assets -111.78 -104.66 -41.96 -16.58 -9.08 Miscellaneous Expenses not written off 0 0 0 0 0 Deferred Tax Assets 8.19 5.76 5.2 0 0 Deferred Tax Liability 28 12.82 2.13 0 0 Net Deferred Tax -19.81 -7.06 3.07 0 0 Other Assets 69.08 55.25 34.06 0 0 Total Assets 443.69 309.05 199.77 126.33 106.4 Contingent Liabilities 10.82 9.15 5.37 1.93 1.3
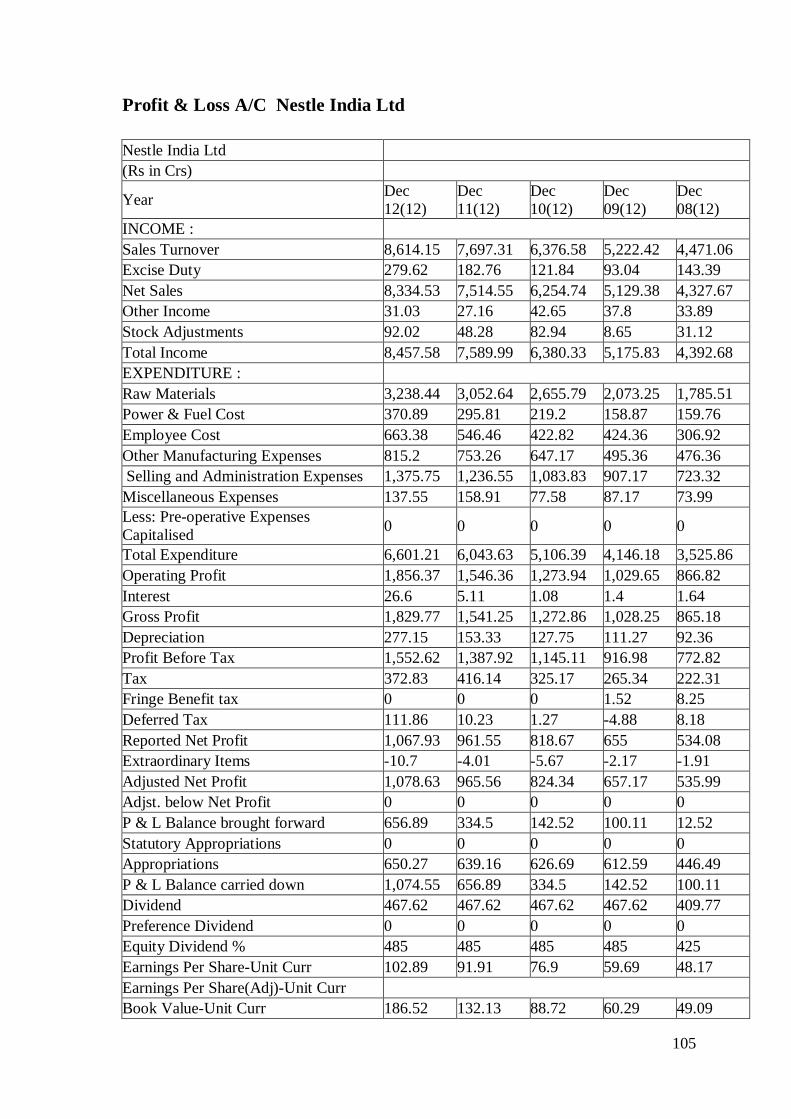
105
Profit & Loss A/C Nestle India Ltd
Nestle India Ltd (Rs in Crs) Year Dec
12(12) Dec 11(12)
Dec 10(12)
Dec 09(12)
Dec 08(12)
INCOME : Sales Turnover 8,614.15 7,697.31 6,376.58 5,222.42 4,471.06 Excise Duty 279.62 182.76 121.84 93.04 143.39 Net Sales 8,334.53 7,514.55 6,254.74 5,129.38 4,327.67 Other Income 31.03 27.16 42.65 37.8 33.89 Stock Adjustments 92.02 48.28 82.94 8.65 31.12 Total Income 8,457.58 7,589.99 6,380.33 5,175.83 4,392.68 EXPENDITURE : Raw Materials 3,238.44 3,052.64 2,655.79 2,073.25 1,785.51 Power & Fuel Cost 370.89 295.81 219.2 158.87 159.76 Employee Cost 663.38 546.46 422.82 424.36 306.92 Other Manufacturing Expenses 815.2 753.26 647.17 495.36 476.36 Selling and Administration Expenses 1,375.75 1,236.55 1,083.83 907.17 723.32 Miscellaneous Expenses 137.55 158.91 77.58 87.17 73.99 Less: Pre-operative Expenses Capitalised 0 0 0 0 0
Total Expenditure 6,601.21 6,043.63 5,106.39 4,146.18 3,525.86 Operating Profit 1,856.37 1,546.36 1,273.94 1,029.65 866.82 Interest 26.6 5.11 1.08 1.4 1.64 Gross Profit 1,829.77 1,541.25 1,272.86 1,028.25 865.18 Depreciation 277.15 153.33 127.75 111.27 92.36 Profit Before Tax 1,552.62 1,387.92 1,145.11 916.98 772.82 Tax 372.83 416.14 325.17 265.34 222.31 Fringe Benefit tax 0 0 0 1.52 8.25 Deferred Tax 111.86 10.23 1.27 -4.88 8.18 Reported Net Profit 1,067.93 961.55 818.67 655 534.08 Extraordinary Items -10.7 -4.01 -5.67 -2.17 -1.91 Adjusted Net Profit 1,078.63 965.56 824.34 657.17 535.99 Adjst. below Net Profit 0 0 0 0 0 P & L Balance brought forward 656.89 334.5 142.52 100.11 12.52 Statutory Appropriations 0 0 0 0 0 Appropriations 650.27 639.16 626.69 612.59 446.49 P & L Balance carried down 1,074.55 656.89 334.5 142.52 100.11 Dividend 467.62 467.62 467.62 467.62 409.77 Preference Dividend 0 0 0 0 0 Equity Dividend % 485 485 485 485 425 Earnings Per Share-Unit Curr 102.89 91.91 76.9 59.69 48.17 Earnings Per Share(Adj)-Unit Curr Book Value-Unit Curr 186.52 132.13 88.72 60.29 49.09
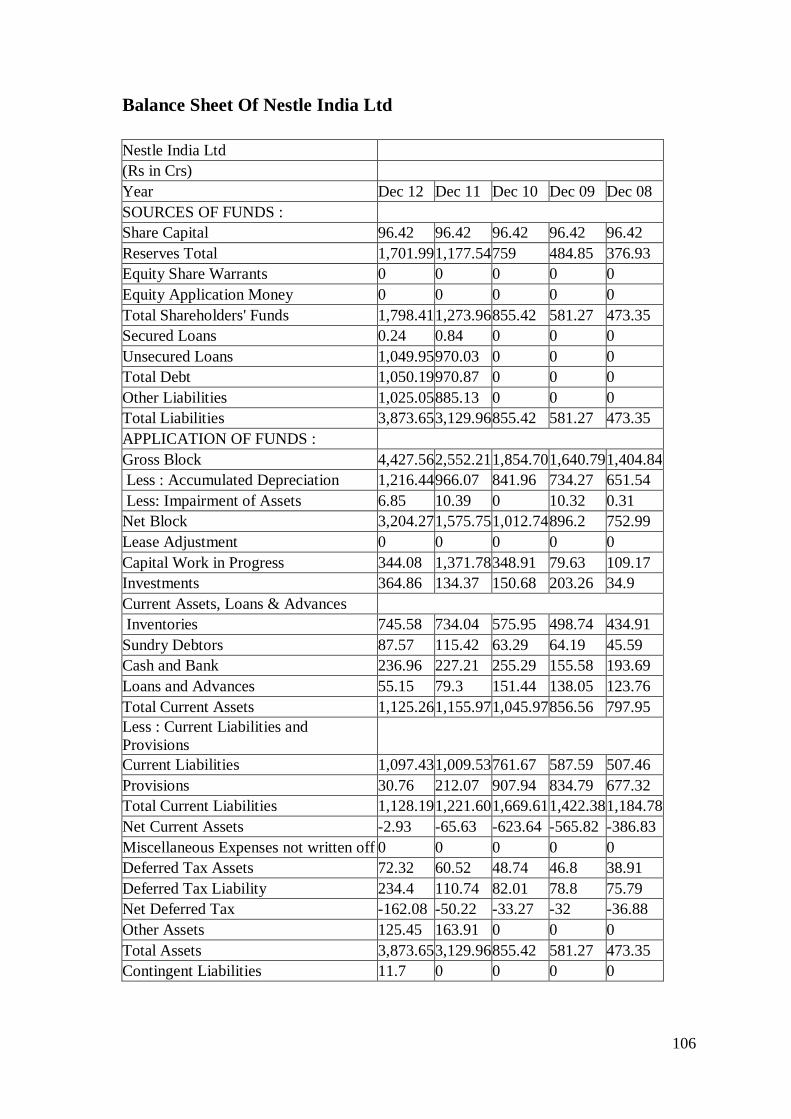
106
Balance Sheet Of Nestle India Ltd
Nestle India Ltd (Rs in Crs) Year Dec 12 Dec 11 Dec 10 Dec 09 Dec 08 SOURCES OF FUNDS : Share Capital 96.42 96.42 96.42 96.42 96.42 Reserves Total 1,701.99 1,177.54 759 484.85 376.93 Equity Share Warrants 0 0 0 0 0 Equity Application Money 0 0 0 0 0 Total Shareholders' Funds 1,798.41 1,273.96 855.42 581.27 473.35 Secured Loans 0.24 0.84 0 0 0 Unsecured Loans 1,049.95 970.03 0 0 0 Total Debt 1,050.19 970.87 0 0 0 Other Liabilities 1,025.05 885.13 0 0 0 Total Liabilities 3,873.65 3,129.96 855.42 581.27 473.35 APPLICATION OF FUNDS : Gross Block 4,427.56 2,552.21 1,854.70 1,640.79 1,404.84 Less : Accumulated Depreciation 1,216.44 966.07 841.96 734.27 651.54 Less: Impairment of Assets 6.85 10.39 0 10.32 0.31 Net Block 3,204.27 1,575.75 1,012.74 896.2 752.99 Lease Adjustment 0 0 0 0 0 Capital Work in Progress 344.08 1,371.78 348.91 79.63 109.17 Investments 364.86 134.37 150.68 203.26 34.9 Current Assets, Loans & Advances Inventories 745.58 734.04 575.95 498.74 434.91 Sundry Debtors 87.57 115.42 63.29 64.19 45.59 Cash and Bank 236.96 227.21 255.29 155.58 193.69 Loans and Advances 55.15 79.3 151.44 138.05 123.76 Total Current Assets 1,125.26 1,155.97 1,045.97 856.56 797.95 Less : Current Liabilities and Provisions Current Liabilities 1,097.43 1,009.53 761.67 587.59 507.46 Provisions 30.76 212.07 907.94 834.79 677.32 Total Current Liabilities 1,128.19 1,221.60 1,669.61 1,422.38 1,184.78 Net Current Assets -2.93 -65.63 -623.64 -565.82 -386.83 Miscellaneous Expenses not written off 0 0 0 0 0 Deferred Tax Assets 72.32 60.52 48.74 46.8 38.91 Deferred Tax Liability 234.4 110.74 82.01 78.8 75.79 Net Deferred Tax -162.08 -50.22 -33.27 -32 -36.88 Other Assets 125.45 163.91 0 0 0 Total Assets 3,873.65 3,129.96 855.42 581.27 473.35 Contingent Liabilities 11.7 0 0 0 0


