Embed Size (px)
Citation preview
�����������������
Citation: Selalame, T.W.; Patel, R.;
Mujtaba, I.M.; John, Y.M. A Review of
Modelling of the FCC Unit—Part II:
The Regenerator. Energies 2022, 15,
388. https://doi.org/10.3390/
en15010388
Academic Editor: Dmitri A.
Bulushev
Received: 21 October 2021
Accepted: 28 December 2021
Published: 5 January 2022
Publisher’s Note: MDPI stays neutral
with regard to jurisdictional claims in
published maps and institutional affil-
iations.
Copyright: © 2022 by the authors.
Licensee MDPI, Basel, Switzerland.
This article is an open access article
distributed under the terms and
conditions of the Creative Commons
Attribution (CC BY) license (https://
creativecommons.org/licenses/by/
4.0/).
energies
Review
A Review of Modelling of the FCC Unit—Part II:The RegeneratorThabang W. Selalame, Raj Patel, Iqbal M. Mujtaba and Yakubu M. John *
Department of Chemical Engineering, Faculty of Engineering and Informatics, University of Bradford,Bradford BD7 1DP, UK; [email protected] (T.W.S.); [email protected] (R.P.);[email protected] (I.M.M.)* Correspondence: [email protected]
Abstract: Heavy petroleum industries, including the Fluid Catalytic Cracking (FCC) unit, are amongsome of the biggest contributors to global greenhouse gas (GHG) emissions. The FCC unit’s regenera-tor is where these emissions originate mostly, meaning the operation of FCC regenerators has comeunder scrutiny in recent years due to the global mitigation efforts against climate change, affectingboth current operations and the future of the FCC unit. As a result, it is more important than ever todevelop models that are accurate and reliable at predicting emissions of various greenhouse gases tokeep up with new reporting guidelines that will help optimise the unit for increased coke conversionand lower operating costs. Part 1 of this paper was dedicated to reviewing the riser section of the FCCunit. Part 2 reviews traditional modelling methodologies used in modelling and simulating the FCCregenerator. Hydrodynamics and kinetics of the regenerator are discussed in terms of experimentaldata and modelling. Modelling of constitutive parts that are important to the FCC unit, such asgas–solid cyclones and catalyst transport lines, are also considered. This review then identifies areaswhere the current generation of models of the regenerator can be improved for the future. Parts 1and 2 are such that a comprehensive review of the literature on modelling the FCC unit is presented,showing the guidance and framework followed in building models for the unit.
Keywords: fluid catalytic cracking; regenerator; hydrodynamics; kinetics; modelling; coke combustion
1. Introduction
Process modelling and simulation have been widely used in a vast number of indus-tries to analyse, control and optimise the behaviour of different processes. The fundamentalrequirement for a model is that it be efficient and accurate at making the predictions thatthe end user is interested in. The deactivated catalyst is sent to the regenerator, where thecoke on the catalyst is burned off. It has two main functions: (i) to burn off the coke on thecatalyst to regain the catalyst’s activity; (ii) to provide the heat needed to drive the endother-mic cracking reactions in the riser-reactor via the exothermic combustion reactions [1]. TheFCC regenerator is a complex fluidised bed reactor that is used for air combustions ofcatalytic coke deposited on catalyst during catalytic cracking of gas oil feedstock. Theregenerator operates in the bubbling/turbulent regime of fluidisation, which results incomplex hydrodynamics in terms of mass, momentum and energy transport phenomena,making it a difficult process to model [2,3]. The FCC regeneration process also results inthe production of GHG emissions, mainly carbon dioxide, which makes it a significantcontributor to climate change [4]. The recent global effort, through the Paris Agreement [5]and global treaties on the combat of climate change [6,7], mean it is more important thanever to build models of units such as the FCC regenerator that can accurately predict theemissions of GHGs. Such models allow for the optimisation of the unit so that emissions ofvarious GHGs are minimised.
Energies 2022, 15, 388. https://doi.org/10.3390/en15010388 https://www.mdpi.com/journal/energies
Energies 2022, 15, 388 2 of 38
In Part 1 of this paper, we reviewed the literature on the modelling of the FCC riser;the current paper will present a similar analysis for the regenerator. The normal operatingconditions of the regenerator are shown in Table 1.
Table 1. Dimensions and Operating conditions of FCC unit [8–12].
Regenerator Dimensions
Height 30–40 m
Diameter 1–2 m
Operating Conditions
Gas oil inlet T 150–300 ◦C
Catalyst inlet T 675–750 ◦C
Catalyst exit T 500–550 ◦C
Coke entering 0.5–1.5 wt%
Coke leaving 0.15–0.35 wt%
Pressure 200–400 KPa
Solid Residence ∼≤ 1 h
The literature on modelling the regenerator is vast and extensive. Because of the sheercomplexity of the unit, many papers published on the topic have taken different approachesand to varying degrees of detail. Since much of the complexity in the system is a resultof the hydrodynamics, models of the unit have usually benefitted from advancementsin the modelling of cold flow bubbling and turbulent beds. Early work in this field wasaimed at understanding such beds, such as developments of two-phase theory by Toomeyand Johnstone [13]. This was followed by extensions to include the cloud and wakephase and incorporation of downflow of solids at the wall of the bed through back-mixingmodels [14–17]. These models were extensively used by various workers to model theregenerator hydrodynamics [1,10,18–20]. The reaction kinetics of the chemical reactionstaking place in the regenerator has also been well studied and documented. Early workin this field dates back to Arthur [21], who studied the rates of combustion of uninhibitedcarbon in the form of graphite in air, establishing the existence of a temperature-dependentratio of carbon monoxide (CO) to carbon dioxide (CO2) produced when carbon burns in theair. Subsequent work studied the rates of combustion of catalytic coke deposited in porousalumina–silica particles, which were used as FCC catalysts in the 1960s [22–25]. Post-1970,there was a change in FCC catalyst that saw the replacement of alumina–silica catalystby zeolitic catalysts. Subsequently, more kinetic studies using spent zeolite were publishedmeasuring the rates of the combustion reactions in these then-new catalysts [26–28]. Both setsof studies reported that the presence of some metals in the catalyst tended to affect the ratesof oxidation reported catalytically. Workers have routinely coupled the hydrodynamicsand the kinetics to produce regenerator models that can predict the conversion of coke andemissions of gases from the system. Post-2000, driven by the increase in computationalpower available to researchers and the need to understand the flow patterns involved inthe gas–solid flow of the regenerator, saw the explosion in the number of papers usingcomputational fluid dynamics (CFD) to simulate the regenerator [29–31]. These CFDmodels seem to represent the highest conceivable amount of rigor that is possible for anyFCC regenerator model [18]. However, this current review is not concerned with CFDmodels, but only the classical models that average flow over the reactor cross section toproduce one-dimensional (1D) or two-dimensional models (2D) is discussed here.
In Part 1 of this paper, we showed that there are already a few reviews of the FCCmodelling literature; however, a comprehensive review of traditional FCC unit modellingapproaches was found to be lacking in the literature. Of note was the lack of reviewsthat link experimental findings of operations of FCC unit to the traditional modelling
Energies 2022, 15, 388 3 of 38
approaches and the simulation results obtained from said models. The current studypresents a review of the modelling of the regenerator and analysing the experimental datathat has led to the assumptions made in modelling. The modelling was divided in terms ofkinetics, where treatments of reaction rate equations, rate constants and orders of reactionsare considered, and in terms of hydrodynamics, where gas–solid mixing behaviour, flow,heat and mass transfer in the reactor are considered. Phase description is explained inthe regenerator, and the issue of bubbles in the bed is also explained. In the end, thedeficiencies of current regenerator models are identified, and recommendations for furtherwork are made.
2. FCC Regenerator2.1. Regenerator Kinetics
A review of the literature on the combustion of coke on the catalyst in a regeneratorreactor finds that there are generally four levels of complexity or considerations, i.e.,(i) definition/composition of coke, (ii) rates and orders of reactions, (iii) the issue ofconversion of CO to CO2 and (iv) action from transition metals. All of these are discussedbelow. The main aim of the regenerator is to burn off the coke-on-catalyst in order to regainthe activity of the spent catalyst. Additionally, the heat produced from these combustionreactions is used to power the endothermic cracking reactions in the riser. Kinetic studiesin the regenerator are much simpler compared to that of the riser because, except forcoke, the reacting species are generally known, and therefore, it is easier to generate thestoichiometric equations for the reactions taking place. This greatly simplifies the analysis inkinetic studies. During normal operation of the regenerator, two main combustion reactionsoccur: the combustion of coke and combustion of carbon monoxide that is produced viaincomplete combustion of coke [25,27,28].
It has been long known that coke formed during catalytic cracking reactions in an FCCriser-reactor is a complex mixture of various chemical compounds, including hydrocarbons,sulphuric and nitrogenous compounds [10,32]. The exact nature and composition of cokehave historically been difficult to ascertain, mainly because [33] (i) coke components arelargely involatile and complex in nature, (ii) components are strongly adsorbed to thesurface of the catalyst, and difficult to separate by conventional methods and (iii) cokeconcentration on the catalyst is very low (< 1%), which leads to sensitivity issues duringcharacterisations. Nevertheless, several experimental techniques, such as elemental analy-sis, temperature-programmed oxidation (TPO), Fourier transform infrared spectroscopy(FT/IR), X-ray photoelectron spectroscopy (XPS), Thermogravimetric analysis, carbon-13nuclear magnetic resonance (13C NMR), supercritical fluid extraction (SFE) and mass spec-trometry and Raman spectroscopy, have been used by researchers to understand the natureand composition of coke better. Qian et al. [33] found chemical shift data in 13C NMRthat distinguished between two types of carbon atoms in coke, namely aromatic (whichmakes up 70–90% of the coke) and aliphatic carbons. They also found, after deconvolu-tion of the C1s profiles in their XPS analysis, that carbon in the coke is primarily bondedto hydrogen, and that the existence of nitrogen is in both polar and no-polar functionalgroups. Nitrogen is typically present in the form of substituted polyaromatic compoundssuch as pyrroles (= C–NH2), pyridines (–C–NC =) or anilines (= C–NH2). Elementalanalysis of Luan et al. [34] found that sulphur, present in the form of thiophene and thiols,is also a major component of coke. All these studies confirmed the complexity of cokein terms of structure and composition. However, for the purposes of modelling, in orderto predict the evolution of gases released from coke combustion in the regenerator, theexact nature of the components of coke is not required as such an undertaking would begreatly tedious but to very little utility. Generally, only the elemental composition of cokeis required. The relative elemental composition of coke is known to depend on the typeof gas oil feed used for cracking and the cracking catalyst; therefore, these compositionsare expected to vary depending on the specific operating parameters at a refinery [35]. Itis also common practice that nitrogen and sulphur are considered negligible since their
Energies 2022, 15, 388 4 of 38
molar composition is small compared to both hydrogen and carbon [1,32,36,37]. However,recent results from FT/IR elemental analysis by Luan et al. [34] may question the validityof this assumption as they have found spent catalyst to have a composition of 0.82 wt%carbon, 0.32% nitrogen, 0.71 wt% hydrogen and 0.76% sulphur, from analysis of flue gasemissions of the regenerator. These emission results show that both sulphur and nitrogenmay be significant for some feeds and need to be included in the model description of coke.Another common assumption is the neglect of hydrogen so that coke is simplified to beequivalent to carbon. Bai et al. [37] argued that the hydrogen reaction’s contribution tocombustion in the regenerator should not be ignored as the burning rate of hydrogen canbe up to two times that of carbon, and since the temperature is an important part of theFCC unit, it is, therefore, necessary to include hydrogen in the coke. Hence, most modelsof FCC units will model coke as CHn, where n is the molar ratio of hydrogen to carbon inthe coke. TPO studies of commercial spent equilibrium FCC catalysts by Bayraktar andKugler [38] showed that n ranges from 0.45 to 0.96 (depending on the catalyst used andmethod of spent catalyst pre-treatment) for cracking of sour gas oil. This range is consistentwith the range of 0.4–2.0 given by Hashimoto et al. [39].
The coke combustion inside an FCC regenerator can typically be described using asimple reaction scheme consisting of the following reactions in Equations (1)–(3):
CHn +
[β + 2
2(β + 1)+
n4
]O2 →
β
β + 1CO +
1β + 1
CO2 +n2
H2O (1)
CO +12
O2homogeneous→ CO2 (2)
CO +12
O2heterogeneous→ CO2 (3)
where n is the molar ratio of hydrogen to carbon in the coke and β is the molar ratio of COto CO2. The subsequent oxidation of carbon monoxide is assumed to occur both on thesurface of the catalyst (heterogeneous) and in the gaseous phase (homogeneous), with thereactions having different rates and hence the separate chemical reaction equations. Somestudies noted the independent oxidation of carbon and hydrogen in the coke, allowing forthe coke combustion equation to be split into two with separate equations for the oxidationof hydrogen and carbon [25]. Furthermore, several workers only consider carbon in cokeand assume that the hydrogen is negligible [22,27,40]. Rate equations for the reactions aredeveloped using the simple power law, where the rate of the reaction is a product of thekinetic parameter (given by the Arrhenius equation) and the concentrations (or partialpressures) of the reacting species raised to some order, n. The purpose of the kinetic studiesis to determine kinetic parameter, which includes the frequency factor and activation energyof the reaction and the orders of the reactions, which are all determined empirically fromfitting reaction model to experimental data. However, it was noticed early on by Weiszand Goodwin that kinetic studies on the combustion of coke in porous catalyst particlesencountered some mass transfer effects that affected the apparent rates of reaction. Weiszand Goodwin, in a series of publications [22–24], presented some significant work in thecombustion of coke in porous silica-alumina catalysts. Their work essentially defines twomodes, determined by temperature and the size of the porous particle, that control the rateof combustion of the coke: (1) intrinsic chemical kinetics-controlled region and (2) diffusionor mass transfer limited region. They report that for any sized particle, there exists atemperature beyond which the rate of combustion is limited by how quickly oxygen candiffuse to the reaction site. This is the type 2 combustion region. Below that temperature, thereaction can be assumed to be in region 1. In this mode, the ‘true’ temperature-dependentrate of reaction can be determined in the abundance of reactants. In order to achieve higherconversions of coke in the regenerator, it is desirable that operating conditions are suchthat no mass transfer limitations are present, which is the fundamental assumption madeby most researchers modelling the regenerator.
Energies 2022, 15, 388 5 of 38
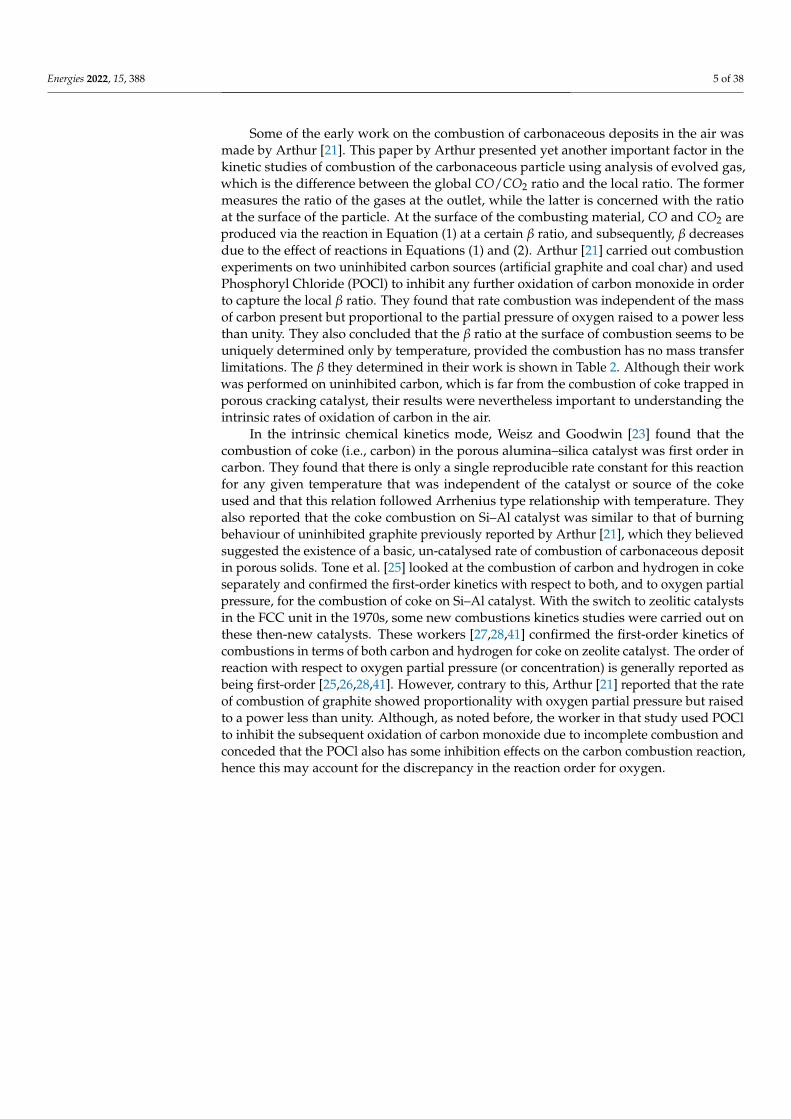
Some of the early work on the combustion of carbonaceous deposits in the air wasmade by Arthur [21]. This paper by Arthur presented yet another important factor in thekinetic studies of combustion of the carbonaceous particle using analysis of evolved gas,which is the difference between the global CO/CO2 ratio and the local ratio. The formermeasures the ratio of the gases at the outlet, while the latter is concerned with the ratioat the surface of the particle. At the surface of the combusting material, CO and CO2 areproduced via the reaction in Equation (1) at a certain β ratio, and subsequently, β decreasesdue to the effect of reactions in Equations (1) and (2). Arthur [21] carried out combustionexperiments on two uninhibited carbon sources (artificial graphite and coal char) and usedPhosphoryl Chloride (POCl) to inhibit any further oxidation of carbon monoxide in orderto capture the local β ratio. They found that rate combustion was independent of the massof carbon present but proportional to the partial pressure of oxygen raised to a power lessthan unity. They also concluded that the β ratio at the surface of combustion seems to beuniquely determined only by temperature, provided the combustion has no mass transferlimitations. The β they determined in their work is shown in Table 2. Although their workwas performed on uninhibited carbon, which is far from the combustion of coke trapped inporous cracking catalyst, their results were nevertheless important to understanding theintrinsic rates of oxidation of carbon in the air.
In the intrinsic chemical kinetics mode, Weisz and Goodwin [23] found that thecombustion of coke (i.e., carbon) in the porous alumina–silica catalyst was first order incarbon. They found that there is only a single reproducible rate constant for this reactionfor any given temperature that was independent of the catalyst or source of the cokeused and that this relation followed Arrhenius type relationship with temperature. Theyalso reported that the coke combustion on Si–Al catalyst was similar to that of burningbehaviour of uninhibited graphite previously reported by Arthur [21], which they believedsuggested the existence of a basic, un-catalysed rate of combustion of carbonaceous depositin porous solids. Tone et al. [25] looked at the combustion of carbon and hydrogen in cokeseparately and confirmed the first-order kinetics with respect to both, and to oxygen partialpressure, for the combustion of coke on Si–Al catalyst. With the switch to zeolitic catalystsin the FCC unit in the 1970s, some new combustions kinetics studies were carried out onthese then-new catalysts. These workers [27,28,41] confirmed the first-order kinetics ofcombustions in terms of both carbon and hydrogen for coke on zeolite catalyst. The order ofreaction with respect to oxygen partial pressure (or concentration) is generally reported asbeing first-order [25,26,28,41]. However, contrary to this, Arthur [21] reported that the rateof combustion of graphite showed proportionality with oxygen partial pressure but raisedto a power less than unity. Although, as noted before, the worker in that study used POClto inhibit the subsequent oxidation of carbon monoxide due to incomplete combustion andconceded that the POCl also has some inhibition effects on the carbon combustion reaction,hence this may account for the discrepancy in the reaction order for oxygen.
Energies 2022, 15, 388 6 of 38
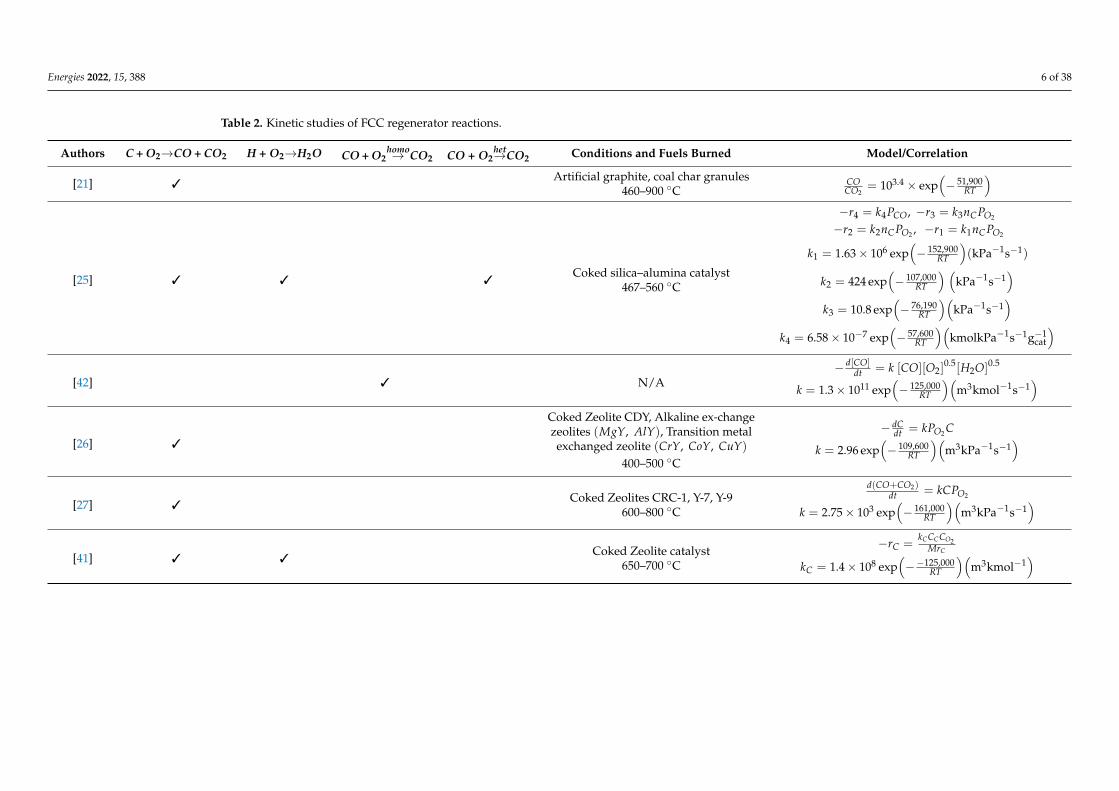
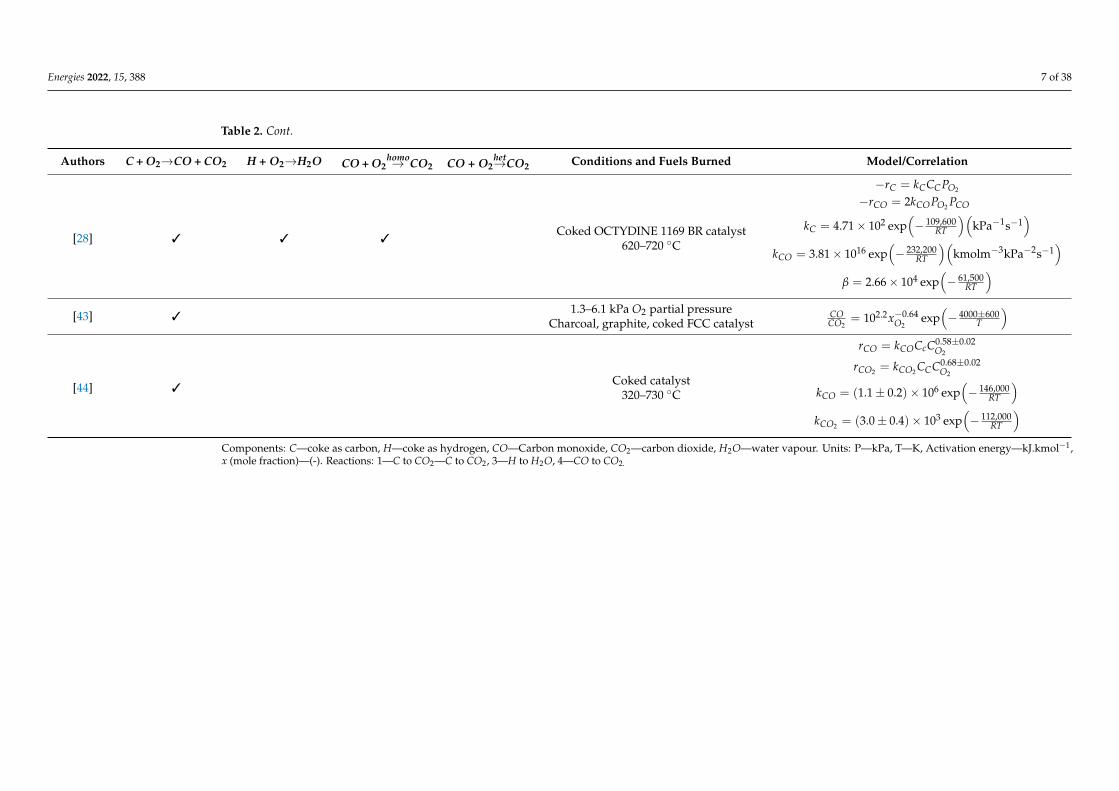
Table 2. Kinetic studies of FCC regenerator reactions.
Authors C + O2→CO + CO2 H + O2→H2O CO + O2homo→ CO2 CO + O2
het→CO2 Conditions and Fuels Burned Model/Correlation
[21] 3Artificial graphite, coal char granules
460–900 ◦CCOCO2
= 103.4 × exp(− 51,900
RT
)
[25] 3 3 3Coked silica–alumina catalyst
467–560 ◦C
−r4 = k4PCO, −r3 = k3nCPO2
−r2 = k2nCPO2 , −r1 = k1nCPO2
k1 = 1.63× 10⁶ exp(− 152,900
RT
)(kPa−1s−1)
k2 = 424 exp(− 107,000
RT
) (kPa−1s−1
)k3 = 10.8 exp
(− 76,190
RT
)(kPa−1s−1
)k4 = 6.58× 10⁻⁷ exp
(− 57,600
RT
)(kmolkPa−1s−1g−1
cat
)
[42] 3 N/A− d[CO]
dt = k [CO][O2]0.5[H2O]0.5
k = 1.3× 10¹¹ exp(− 125,000
RT
)(m3kmol−1s−1
)
[26] 3
Coked Zeolite CDY, Alkaline ex-changezeolites (MgY, AlY), Transition metalexchanged zeolite (CrY, CoY, CuY)
400–500 ◦C
− dCdt = kPO2 C
k = 2.96 exp(− 109,600
RT
)(m3kPa−1s−1
)
[27] 3Coked Zeolites CRC-1, Y-7, Y-9
600–800 ◦C
d(CO+CO2)dt = kCPO2
k = 2.75× 10³ exp(− 161,000
RT
)(m3kPa−1s−1
)
[41] 3 3Coked Zeolite catalyst
650–700 ◦C
−rC =kCCCCO2
MrC
kC = 1.4× 10⁸ exp(−−125,000
RT
)(m3kmol−1
)
Energies 2022, 15, 388 7 of 38
Table 2. Cont.
Authors C + O2→CO + CO2 H + O2→H2O CO + O2homo→ CO2 CO + O2
het→CO2 Conditions and Fuels Burned Model/Correlation
[28] 3 3 3Coked OCTYDINE 1169 BR catalyst
620–720 ◦C
−rC = kCCCPO2
−rCO = 2kCOPO2 PCO
kC = 4.71× 10² exp(− 109,600
RT
)(kPa−1s−1
)kCO = 3.81× 10¹⁶ exp
(− 232,200
RT
)(kmolm−3kPa−2s−1
)β = 2.66× 10⁴ exp
(− 61,500
RT
)[43] 3
1.3–6.1 kPa O2 partial pressureCharcoal, graphite, coked FCC catalyst
COCO2
= 102.2x−0.64O2
exp(− 4000±600
T
)
[44] 3Coked catalyst
320–730 ◦C
rCO = kCOCcC0.58±0.02O2
rCO2 = kCO2 CCC0.68±0.02O2
kCO = (1.1± 0.2)× 106 exp(− 146,000
RT
)kCO2 = (3.0± 0.4)× 103 exp
(− 112,000
RT
)Components: C—coke as carbon, H—coke as hydrogen, CO—Carbon monoxide, CO2—carbon dioxide, H2O—water vapour. Units: P—kPa, T—K, Activation energy—kJ.kmol−1,x (mole fraction)—(-). Reactions: 1—C to CO2—C to CO2, 3—H to H2O, 4—CO to CO2.
Energies 2022, 15, 388 8 of 38
The understanding of the oxidation of carbon monoxide to carbon dioxide is far lessstraightforward, mostly because it is difficult to measure the concentrations of gaseousproducts at the surface of the catalyst in the catalyst pores. It is generally accepted that thisoxidation occurs both heterogeneously (on the surface of the catalyst) and homogenously(in the gas phase in the intra particle spaces or pores, and in the bulk gas phase); however, towhat extent each of these reactions is significant is not entirely clear. Early workers [45–49]carried out studies towards the development of a global carbon monoxide burnout ratein the gaseous form, in the temperature range 770–2400 K using a variety of fuels such aspropane and methane. Although their experiments are not directly on FCC regeneration,they still present a good understanding of the homogenous carbon monoxide oxidationreaction. Experiments were based on combustions of different types of fuel and in vastlydifferent conditions (temperature and pressure ranges), some experiments in the presenceof water vapour [49] and others in dry conditions [45,46]. There is general agreement inthis literature that oxidation is first order in carbon monoxide. Data across the literaturesuggest there is some dependency on the temperature in the order with respect to watervapour, with work in the region 770–1500 K [45] seeming to be in support of a half orderwith respect to water vapour, and those in the range 1500–2400 K reporting lower orders ofzero or close to it. There is little agreement in the order of oxygen; Ghazal [50] reporteda value of 0.75. Other workers reported different values for the order of oxygen; 0.5 [45]and 0.2 or 1 [49]. Howard et al. [42] collated data from various authors in order to definea global carbon monoxide burning rate, and their results are reported in Table 2. Theynote that their choices for orders for carbon monoxide and water are because these agreewith some of the previously published work. However, they also note that the value forthe oxygen order is only chosen because it performs no better or worse than any of theother values reported in the literature. Nevertheless, Howard et al. [42] had confidencein their kinetic rate equation because the data used to produce it were representative ofdifferent types of burners, reactors, fuels, equivalence ratios, pressures and temperatures.For the problem of ‘afterburn’ in the FCC unit, data collated by Howard and co seemto suggest their rate equation is sufficient in describing the homogenous oxidation ofcarbon monoxide. This is because significant deviations from this rate equations were onlyobserved beyond the 1500 K temperature mark, which is beyond the operating temperaturefor modern FCC regenerators. In this regard, Howard proposed that the mechanism for thisreaction can be thought of as an equilibrium reaction involving free radicals of hydroxyl,oxygen and hydrogen. On the other hand, studies conducted to measure this homogenouscondition under FCC regeneration conditions [25,41] reported that the overall contributionof this homogenous reaction to the overall carbon monoxide oxidation in the regenerator isnegligible. In fact, Tone et al. [25] reported that they found no evidence for this reactionwhen the reactor is operated at the same temperature and pressure while running carbonmonoxide and oxygen stream through the reactor in the absence of the catalyst.
Regarding the catalytic oxidation of carbon monoxide, Tone et al. [25] proposed areaction mechanism for the regeneration of coked Si–Al cracking catalyst involving theparallel oxidation of carbon in the coke to both carbon oxides, followed by the oxidationof carbon monoxide to carbon dioxide on the surface of the catalyst. They essentiallyassume that the homogenous oxidation of carbon monoxide is negligible after it wasfound that the concentration of carbon dioxide in the affluent gas stayed the same whenthe combustion reactions are conducted without the catalyst present in the reactor. Thisobservation suggested that significant oxidation of CO only occurred in the presence ofcatalysts particles, meaning only the heterogeneous oxidation is significant to the kineticstudy. This result is consistent with the work from Morley and de Lasa [51] which foundthat of the two oxidations of carbon monoxide, the homogenous reaction was negligiblecompared to the heterogeneous version. Tone et al. [25] reported the heterogeneous reactionto be first-order in carbon monoxide partial pressure and independent of oxygen partialpressure in the range 0.05–0.15 atm. On the other hand, Arandes et al. [28] also reportedrates for this reaction and confirmed that the reaction is first order in carbon monoxide;
Energies 2022, 15, 388 9 of 38
however, they reported an order of one with respect to oxygen partial pressure. It is worthnoting that the two workers reported similar values for the activation energy of the carbonmonoxide reaction, 57.6 kJ/mol [25] and 51.5± 0.5 kJ/mol [28]. The small difference islikely due to the variations in the catalyst structure and transition metal composition. It wasdemonstrated that oxides of transition metals such as copper and nickel promote catalyticcarbon monoxide oxidation [25]. This variability brought about by transition metal oxidesinevitably means that the rate equations and kinetic constants for this reaction will varyacross different studies, and therefore, it is difficult to produce a universal rate equationfor the FCC regeneration as FCC catalysts are widely different in their transition metalcontent. The same problem is encountered when dealing with the rate equations for cokecombustion, as it was also shown that transition metals on the catalyst or in the coke couldcatalyse the reaction to varying degrees [26].
Thus far, the kinetic studies discussed only involved models that describe the overallconversion of coke to gaseous oxides without regard for the mechanism involved in theconversions or the reaction intermediates. Several workers studied the rate of combustionof unsaturated coke on FCC catalyst by explicitly including the carbon oxide complexesformed on the catalyst surface in the reaction mechanism. These ‘surface complexes’ canthen transform to produce CO or CO2. Generally, two types of such studies exist in theliterature [44]: the first is such that direct conversion of coke and oxygen to form surfacecomplexes, and the second uses the Langmuir-type model for dissociative adsorption. Thetype of model used determines the forms of the rate equations. In the first case, the chemicaland rate equations (shown in Equations (4)–(6) may be written as follows [44]:
C +12
O2 → C(O)∗; r0 = k0 exp(− E0
RT
)S∗[O2]
n0 (4)
C(O)∗ → CO; r1 = k1 exp(− E1
RT
)S∗[O2]
n1 (5)
C(O)∗ +12
O2 → CO2; r2 = k2 exp(− E2
RT
)S∗[O2]
n2 (6)
where S∗ is the molar amount of surface intermediate complex, C(O)∗, and n is the reac-tion order with respect to oxygen concentration. Equations (4)–(6) show one suggestedmechanism for oxidation; however, the exact mechanism has been debated for years inthe literature. Some of the main issues of contention are the formation, or lack thereof,of C(O2)
∗ complex and whether or not the carbon oxides (CO and CO2) are formed asprimary products of coke combustion [43]. As a result, many workers developed kineticmodels that show alternative mechanisms for this coke oxidation reaction [43,52,53]. In theLangmuir-type model, Equation (4) to form the carbon oxide complex is replaced by anequilibrium reaction shown Equation (7), while the other reactions remain unchanged [44]:
2C + O2 ↔ 2C(O)∗ (7)
r1 and r2 (Equations (8) and (9), respectively), which are the rate equations for theformation of CO and CO2, respectively, can be written in the following forms [44]:
r1 =k1 exp
(− E1
RT
)[k0 exp
(−∆H
RT
)[O2]
] 12
1 +[k0 exp
(−∆H
RT
)[O2]
] 12
S∗ (8)
r2 =k2 exp
(− E2
RT
)[k0 exp
(−∆H
RT
)[O2]
] 12
1 +[k0 exp
(−∆H
RT
)[O2]
] 12
S∗[O2]n (9)
Energies 2022, 15, 388 10 of 38
where ∆H is the adsorption enthalpy, and everything else is as defined previously. Thesetwo models described here have the advantage of incorporating the effect of adsorptionexplicitly at the surface to the rate of oxidation, but this comes at the cost of an increasein the number of parameters being estimated from experimental data. Kanervo et al. [44]applied all three models described here to kinetic studies of spent FCC catalyst regeneration.They found that all three models adequately described the coke oxidation experimental datawell, meaning no considerable advantage is gained from explicitly including the surfacecomplexes into the reaction scheme. This result also meant it was difficult to ascertainwhich mechanism accurately described the system definitively; hence, this remains an openquestion. However, for the purposes of FCC regenerator modelling, researchers seldomuse kinetic models that describe the formation of surface complexes, opting instead for thesimpler model described in Equations (1)–(3), which capture all the necessary informationwithout losing much accuracy.
Table 2 summarises some kinetic studies that are relevant to the modelling of the FCCunit regenerator. In conclusion, the literature of kinetic studies related to the regeneratoris vast, and the main reactions occurring in the unit are well known. Generally, coke isunderstood to be a complex mixture of carbon and hydrogen, based on its hydrocarbonorigins, with varying H/C ratios depending on feed. The coke combustion reaction isgenerally believed to follow simple first-order kinetics with respect to both carbon andhydrogen and with respect to oxygen. Carbon monoxide formed proceeds to be oxidisedto carbon dioxide both homogeneously and heterogeneously, but there is some debate overwhich of the two carbon monoxide reactions is more important to the conversions of theunit. Therefore, for completeness, both reactions can be used in the model. It is difficult tocompare various kinetic studies on regenerator reactions because some metals may catalysethe reactions, and their varied composition in FCC catalysts results in varied kineticparameters. The rich literature in this area means that researchers are spoilt for choice whenit comes to choosing a kinetic scheme and kinetic parameters for their regenerator model.However, it is important that the choice be based on the range of operating conditions inwhich the kinetic model is valid and on the type of catalysts that are used in the study sincehow well kinetic parameters extrapolate beyond their range of validity is not known, andthe effect of catalyst variations was already described.
2.2. Hydrodynamics of the Regenerator2.2.1. Axial Profiles
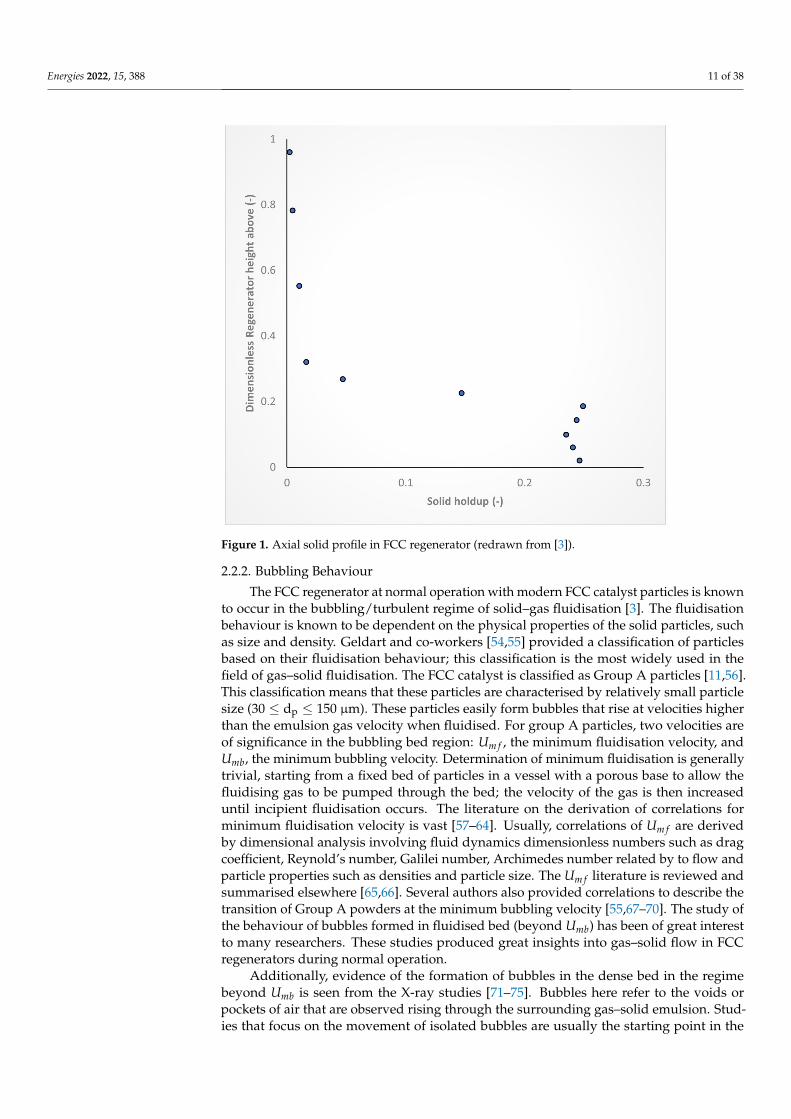
Experimental data of axial profiles of solid holdup in an FCC regenerator from Kimand Kim [3] are shown in Figure 1. The profile resembles an ‘S-shape’ profile with threevisible regions: (a) the region near the distributor which has a high volume of solid, (b) theregion at the top which has a small volume of solid, and (c) the short transition region inbetween. The difference in the solid holdup between the top and the bottom of the bedcreates two discernible regions in the bed. The dense bed, region (a), consists of most of thesolids and gases, and the freeboard (or lean phase), region (b), consists of the gas leavingthe bed and the small fraction of solid particles entrained in that gas. Gases and particlesleaving the freeboard region are separated in the cycles at the top of the regenerator, wherecatalysts are returned to the dense bed while the gas can leave the regenerator chamber.Since the dense bed region is the region containing most of the solids and gas, it is generallyaccepted that this is where most of the combustion of coke on catalyst takes place. Formodelling purposes, an understanding of the mixing and flow behaviour inside the densebed is required.
Energies 2022, 15, 388 11 of 38
Figure 1. Axial solid profile in FCC regenerator (redrawn from [3]).
2.2.2. Bubbling Behaviour
The FCC regenerator at normal operation with modern FCC catalyst particles is knownto occur in the bubbling/turbulent regime of solid–gas fluidisation [3]. The fluidisationbehaviour is known to be dependent on the physical properties of the solid particles, suchas size and density. Geldart and co-workers [54,55] provided a classification of particlesbased on their fluidisation behaviour; this classification is the most widely used in thefield of gas–solid fluidisation. The FCC catalyst is classified as Group A particles [11,56].This classification means that these particles are characterised by relatively small particlesize (30 ≤ dp ≤ 150 µm). These particles easily form bubbles that rise at velocities higherthan the emulsion gas velocity when fluidised. For group A particles, two velocities areof significance in the bubbling bed region: Um f , the minimum fluidisation velocity, andUmb, the minimum bubbling velocity. Determination of minimum fluidisation is generallytrivial, starting from a fixed bed of particles in a vessel with a porous base to allow thefluidising gas to be pumped through the bed; the velocity of the gas is then increaseduntil incipient fluidisation occurs. The literature on the derivation of correlations forminimum fluidisation velocity is vast [57–64]. Usually, correlations of Um f are derivedby dimensional analysis involving fluid dynamics dimensionless numbers such as dragcoefficient, Reynold’s number, Galilei number, Archimedes number related by to flow andparticle properties such as densities and particle size. The Um f literature is reviewed andsummarised elsewhere [65,66]. Several authors also provided correlations to describe thetransition of Group A powders at the minimum bubbling velocity [55,67–70]. The study ofthe behaviour of bubbles formed in fluidised bed (beyond Umb) has been of great interestto many researchers. These studies produced great insights into gas–solid flow in FCCregenerators during normal operation.
Additionally, evidence of the formation of bubbles in the dense bed in the regimebeyond Umb is seen from the X-ray studies [71–75]. Bubbles here refer to the voids orpockets of air that are observed rising through the surrounding gas–solid emulsion. Stud-ies that focus on the movement of isolated bubbles are usually the starting point in the
Energies 2022, 15, 388 12 of 38
understanding of bubble motion in the dense bed. These studies are divided into two:(i) two-dimensional beds (formed from two thinly separated parallel-sided transparentplates) and three-dimensional beds. Bubbles in two-dimensional beds were observed tobe shaped liked spherical caps, while bubbles in three-dimensional beds appear sphericalwith indented bases [56]. Both studies show bubbles rising through the emulsion beforeeventually erupting at the surface of the dense bed. This observation is important for mod-elling because it establishes the inherent heterogeneity that is found in the dense bed for afreely bubbling bed operating beyond Umb, so that this dense bed region can be thought ofas being made up of two distinct phases. Consequently, the famous two-phase theory byToomey and Johnstone [13] of fluidisation was developed to describe this observed flowbehavior, and it postulated that the two regions are the emulsion, which is the continuousphase where the solid particles are found, and the bubble phase, which is essentially asolid free void containing gas. According to this theory, the emulsion is static at incipientfluidisation conditions while any gas in excess of that required for minimum fluidisationtravels through the bed in the form of bubbles. The theory provided a framework formathematically describing the flow in bubbling/turbulent beds and has been widely usedin the modelling of gas–solid beds in this regime, including the FCC regenerator. Further-more, the tracer experiments of Rowe [76] provided great insights into the flow aroundthe rising bubble phase, showing a region of penetration of bubble gas into the emulsion;this region is seen around the rising bubble and is clearly discernible from the bubble andthe emulsion phases. The distinct nature of this region meant it was hydrodynamicallydifferent from the two phases described by the two-phase theory. This region was termedthe cloud. Additionally, these tracer experiments also showed that the indented base of thebubbles is filled with a cluster or conglomerate of particles that are drawn by the bubblesas they rise to the surface. This mechanism of particles being drawn by rising bubbles, as isdescribed later, has been identified as the prime mechanism for solid mixing in the bed [65].This leads to the conclusion that an extra phase can be identified (i.e., the cloud and wakephase) between the emulsion and the bubble, an observation that led to the bubbling bedmodel by Kunii and Levenspiel [15]. Unlike in gas–liquid systems where the interphaseis a continuous film surrounding the bubble, no such film exists in gas–solid systems.Bubbles are prevented from collapsing by pressure exerted on the particles by enclosedgas; however, the interphase is permeable to gas [56]. The significance of this observationfor heterogeneous systems such as combustion of coke on the catalyst in the regenerator isthat gas in the bubble is not in contact with the solid or catalyst particles meaning bubblesmay lead to a significant bypass of gas. The transport of gas such as oxygen from withinthe bubbles to the emulsion encounters resistance through the cloud–wake region on bothsides, i.e., at the interphase with the emulsion and with the bubble. Therefore, under certainconditions, such as high superficial gas velocity, bypass is a likely phenomenon [56].
The velocity and size of the rising bubble are important parameters when modellingthe dense bed because, as was explained above, the large velocity of bubbles may result inpoor gas–solid contact and bypassing. Photographic studies of rising bubbles are quite clearthat bubbles are seen rising, and their size changes as they rise [77]. Two processes, whichoccur in parallel for any freely bubbling bed, are responsible for the change in the size ofbubbles as they rise: (i) coalescence and (ii) bubble splitting. Coalescence is identified as themain reason for bubble growth, the other being that the decrease in hydrostatic pressurewith height above the base of the dense bed; however, the effect of hydrostatic pressure isassumed insignificant compared to coalescence [78]. Coalescence is a nucleation processthat occurs when two bubbles merge with one another to produce a bigger bubble, and itwas observed in two-dimensional beds. Evidence of coalescence in freely bubbling bedsis seen through the existence of two different bubble profiles at the top and bottom of thedense bed; the top consists of a small number of relatively large bubbles, whereas at thebottom of the dense bed, a large number of small bubbles is observed [56]. This suggeststhat bubbles merge and grow as they rise. From this observation, several studies werecarried to correlate the size of the bubble to some operating parameters, such as the height
Energies 2022, 15, 388 13 of 38
of the bed above the distributor plate [71,77,79–85]. On the other hand, Rowe [86] observedrising bubbles developing cusps on the roof and then subsequently splitting to form twosmaller bubbles. Usually, the smaller of the two bubbles are seen being reabsorbed, butin some instances, especially for fine particles (diameter < 45 µm), the two bubbles thencontinue to rise separately [11]. As a result of both the growth and splitting of bubblesoccurring simultaneously in the bed, Davidson and Harrison [87,88] theorised that theremust exist a limit on the size of the growing bubbles inside the bed. Basically, for a givenbed and flow conditions, bubbles rising in the bed will not grow past a particular size.This theory is based on the assumption that as a bubble rises, the drag exerted by particlesmoving downward relative to the bubble (in the surrounding cloud and emulsion phases)sets in motion internal circulation currents of the gas within the bubble, and that velocity ofsaid circulation, Uc, approximates the bubble rise velocity, Ub. As Uc (∼ Ub) increases, dueto coalescence, such that Uc > Ut (where Ut is the terminal fall velocity of the particles inthe bed), then the solids in the wake are drawn up inside the bubble resulting in splitting.Therefore, the limit on the bubble size is reached when db corresponding to bubble risevelocity equal to Ut is reached. An alternative theory to bubble splitting states that thebreakage of bubbles is primarily a result of the development of instabilities at the roof ofthe bubble, allowing particles ahead of the bubble to fall through the void and divide it intotwo [89–91]. It is not exactly clear in the literature which of these theories is correct, but it isdeductible that the likely reason for splitting is the entry of solid particles into the bubbleand that the best predictor of whether or not this occurs is the velocity of the rising bubble.Since Ub is connected to db [92], these two properties of the bubble have been correlated inexperiments [72,73] so that bubble splitting can be predicted from bubble rise velocity.
Davidson and Harrison [88] drew similarities in the rise of air bubbles in liquid systemsto that of gas bubbles in gas–solid systems. They found that the famous [93] correlation inEquation (10) for rising air bubbles in gas–liquid fluid beds predicted the Ub of an isolatedbubble in gas–solid systems reasonably well. The reason why this equation is valid forsolid systems is not clear.
Ub = 0.711√
gdb (10)
Sit and Grace [94] studied oxygen gas bubbles in two-dimensional beds and found thatbubbles in proximity affect each other’s rise velocities. They found that during the processof coalescence, the trailing bubble in a pair accelerates towards the leading bubble untilthe encroachment period. It is clear from this that the rise velocity of a swarm of bubblesin a freely bubbling bed will be different from that given by Equation (10). Davidsonand Harrison [88] then proposed a theory that the average velocity of a bubble in a freelybubbling bed is the sum of the velocity the bubble would have rising in isolation, seeEquation (10), plus the upward velocity of the particulate phase between the bubbles. Thisis summarised in Equation (11).
Ub = 0.711√
gdp +(
U −Um f
)(11)
Equation (11) is widely used in reactor modelling and design [11]; however, its validityhas been questioned [84]. Other similar equations for bubble velocity in freely bubblingbeds were proposed by various workers [95–97]; however, there is little agreement betweenthem [56]. As a result, it is usually sufficient, at least in the initial stages of design, touse Equation (11) for bubble rise velocity. Where a correlation for bubble size with bedheight is available, Equation (11) then gives the variation in the velocity of the bubbles in aswarm with the height of the bed. Equations (10) and (11) show that the rise velocity of thebubbles, either in isolation or in a freely bubbling bed, is correlated to the size of the bubble,hence the multitudes of studies that have been devoted to producing these correlations fordifferent process conditions [92].
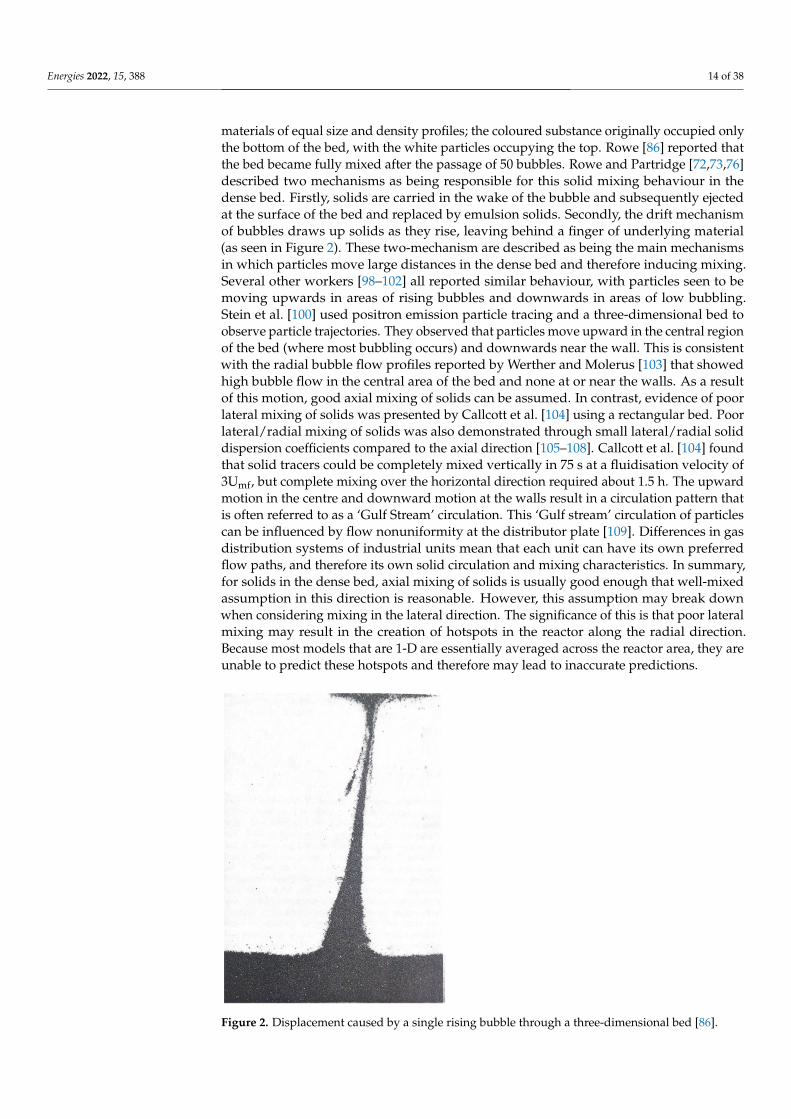
The issue of solid and gas mixing in the dense bed is also of significance, especiallyfor the purposes of modelling. Rowe [86] in Figure 2 showed the displacement causedby the passage of a single bubble. Originally the bed contained two differently coloured
Energies 2022, 15, 388 14 of 38
materials of equal size and density profiles; the coloured substance originally occupied onlythe bottom of the bed, with the white particles occupying the top. Rowe [86] reported thatthe bed became fully mixed after the passage of 50 bubbles. Rowe and Partridge [72,73,76]described two mechanisms as being responsible for this solid mixing behaviour in thedense bed. Firstly, solids are carried in the wake of the bubble and subsequently ejectedat the surface of the bed and replaced by emulsion solids. Secondly, the drift mechanismof bubbles draws up solids as they rise, leaving behind a finger of underlying material(as seen in Figure 2). These two-mechanism are described as being the main mechanismsin which particles move large distances in the dense bed and therefore inducing mixing.Several other workers [98–102] all reported similar behaviour, with particles seen to bemoving upwards in areas of rising bubbles and downwards in areas of low bubbling.Stein et al. [100] used positron emission particle tracing and a three-dimensional bed toobserve particle trajectories. They observed that particles move upward in the central regionof the bed (where most bubbling occurs) and downwards near the wall. This is consistentwith the radial bubble flow profiles reported by Werther and Molerus [103] that showedhigh bubble flow in the central area of the bed and none at or near the walls. As a resultof this motion, good axial mixing of solids can be assumed. In contrast, evidence of poorlateral mixing of solids was presented by Callcott et al. [104] using a rectangular bed. Poorlateral/radial mixing of solids was also demonstrated through small lateral/radial soliddispersion coefficients compared to the axial direction [105–108]. Callcott et al. [104] foundthat solid tracers could be completely mixed vertically in 75 s at a fluidisation velocity of3Umf, but complete mixing over the horizontal direction required about 1.5 h. The upwardmotion in the centre and downward motion at the walls result in a circulation pattern thatis often referred to as a ‘Gulf Stream’ circulation. This ‘Gulf stream’ circulation of particlescan be influenced by flow nonuniformity at the distributor plate [109]. Differences in gasdistribution systems of industrial units mean that each unit can have its own preferredflow paths, and therefore its own solid circulation and mixing characteristics. In summary,for solids in the dense bed, axial mixing of solids is usually good enough that well-mixedassumption in this direction is reasonable. However, this assumption may break downwhen considering mixing in the lateral direction. The significance of this is that poor lateralmixing may result in the creation of hotspots in the reactor along the radial direction.Because most models that are 1-D are essentially averaged across the reactor area, they areunable to predict these hotspots and therefore may lead to inaccurate predictions.
Figure 2. Displacement caused by a single rising bubble through a three-dimensional bed [86].
Energies 2022, 15, 388 15 of 38
2.3. Reactor Models for Bubbling Beds
Grace [110] emphasised the importance of the hydrodynamic factors (such as gasdistribution, bubble size, residence time distribution, phase division and interphase ex-change, etc.) and kinetic factors (such as stoichiometry, reaction orders and kinetic con-stants, etc.) to modelling of reactors. In order to predict the contact and flow inside theFCC regenerator, the development of a model to describe the flow is required. Severalclassifications for hydrodynamic models of fluidised beds exist in the literature. The famousclassification is by Harris and Davidson [111], who classify models into three categories, i.e.,(i) models that predict the radial variation in solid suspension but not axial, (ii) models thatpredict axial solid suspension but not radial and (iii) models that employ fundamental fluiddynamic equations for two-phase gas–solid flow. Yates [56] classified models as (i) simpleor arbitrary models based on empirical correlations obtained from small-scale experimentsand (ii) models based on bubble dynamics that describe reactor behaviour in terms ofthe known physics and hydrodynamics of fluid beds. Ultimately model classification isdifficult because the objectives of the classifications differ, and there is so much overlapthat it becomes a strenuous task to group them. For the present work, the classificationby Yang [78] based on phase description is employed. This is chosen here because thisclassification is straightforward as balance equations are developed for each phase withouthaving to worry about what happens within the same phase. Phase description allowsmass, energy and momentum balances for each phase assumed present in the reactor tobe carried out, and therefore, the behaviour of properties of each phase can be predicted.By this classification, three classes of models are identified; (i) homogeneous models, two-phase models and three-phase/bubbling bed models. An extra class is discussed where thephases in some regions cannot be assumed to be consistent with phases in the rest of thedense bed.
The primary postulate of two-phase models is their treatment of gas division amongthe two phases. As mentioned before, traditionally, it was assumed that all gas in excessof that required for minimum fluidisation passed through the bed in the form of bubbles.However, several investigators found that this assumption greatly overestimates the so-called visible gas flow (or flow through the bed in bubble form) and underestimates theflow of gas in the emulsion [71,112–114]. Rowe [115] showed that higher conversionis achieved than predicted by conventional two-phase theory as a result of higher thanpredicted interstitial gas flow. As a result, corrections are usually employed to account forthis deviation from the ideal two-phase flow. The commonly used corrections are in theform [112] as seen in Equations (12) and (13):
εbUb = Y(
U −Um f
)(12)
Ub = (U −Ub)(1 + kεb) (13)
where Y and k represent the deviation from the ideal two-phase flow. The primary differ-ence between bubble velocity predicted by Equations (12) and (13) to that predicted bycorrelations such as that shown in Equation (11) is that the former only predicts bubblevelocity using Um f and makes no reference to bubble size. It is reasonable to assume thatthe latter would be more representative of the real system as they are capable of predictingacceleration caused by bubble growth. Nevertheless, both types of correlations have beenused in modelling bubbling beds in the literature.
One of the earliest two-phase models was by Davidson and Harrison [88]. It madethe following assumptions: (a) gas in emulsion at Um f and is either well mixed or plugflow, (b) bubbles exist through the bed with uniform size and (c) interphase gas exchangeis by diffusion and through flow between emulsion and bubbles. Although this modelagreed well with some experimental data, it has been criticised for its simplistic definitionof the gas–solid bubble and was later updated by other workers [56,116] to account forbubble growth in beds of fine particles. Since then, more work has been published usingthis model to account for axial gas dispersion.
Energies 2022, 15, 388 16 of 38
Kunii and Levenspiel’s [15] bubbling bed model is one of the earliest incorporations ofthe cloud and wake region. The assumptions of this model are: (a) most reactant gas travelsup the bed in uniform size bubbles surrounded by cloud and wake, and interstitial gasflow is negligibly small in comparison, (b) plug flow in bubble phase, and (c) interchangebetween emulsion and bubble phase is through the cloud and wake, through two resistancesto transport. As with the previous model, many variations in the bubbling bed model nowexist in the literature to account for such things as the gas flow through the emulsion, thegrowth of bubbles up the bed and the dispersion of gas up the reactor. Such models includeStephens et al.’s [16] counter-current back mixing model, which updated the bubbling bedmodel by including emulsion phase back mixing, downflow of solids during circulationand linear increase in bubble diameter. Kato and Wen’s [17] model updated the bubblingbed model by assuming bubble size growth is given by a correlation and that bubbleand emulsion phases in the bed are represented by a series of well-mixed tanks whoseheights are equal to the bubble diameter corresponding to that vertical position abovethe distributor.
Grid enhanced models vary from the above models in that the region near the dis-tributor is considered to show a different flow pattern to the rest of the bed. It is assumedgas penetrates the bed in the form of jets [117]. Photographic studies of the grid regionshowed that the term ‘jet’ refers to a variety of flow patterns near the gas inlet, such as elon-gated cavities forming above the orifice and leaving as bubbles [118], plumes developingnecks which divide into a series of bubbles [119], chains of bubbles emanating from theorifice [120] and permanent flame-like dilute phase regions penetrating into the bed [121].In their model, Behie and Kehoe [117] made no distinction between these flow patternsand assumed that these jets could generally be taken as plug flow in the axial directionand perfectly mixed radially/laterally. The jetting effect is thought to produce enoughturbulence in its vicinity that the phase surrounding the jet is assumed to be a well-mixedemulsion. Of course, some variations to this jet transport model near the grid exist, forexample, the tubular jet model [122] and the sink and source model [123,124]. The jetpenetration height (referred to as h in Table 3) was also studied in detail and correlationsexists to find it. Davidson et al. [65] reviewed and published some of this literature intheir book.
In the general case, the energy balance for the system (in Equations (14) and (15) couldbe written for each phase, assuming a two-phase flow model:
Bubble phase:
ρb∂(εbhb)
∂t+ ρb
∂(εbUbhb)
∂z= ∆Qreaction + ∆Qbe + Sb (14)
Emulsion phase (for a well-mixed emulsion with thermodynamic equilibrium):
ρb∂(εehe)
∂t= ∆Qreaction + ∆Qeb + Se (15)
where the εb and εe are volume fractions of the bubble and emulsion, respectively, hb and heare the specific enthalpies of the bubble and emulsion phases, respectively, ∆Qreaction is theheat of reaction in the phase which depends on the rates of reactions and their associatedheats of reaction, ∆Qbe and ∆Qeb are the heat exchanges between the bubble and emulsionphases, respectively, which depend on the heat transfer coefficient between the two phases,the interphase area and the temperature difference between the phases. Sb and Se are theenergy source/sink terms in the bubble and emulsion phases, respectively.
Energies 2022, 15, 388 17 of 38
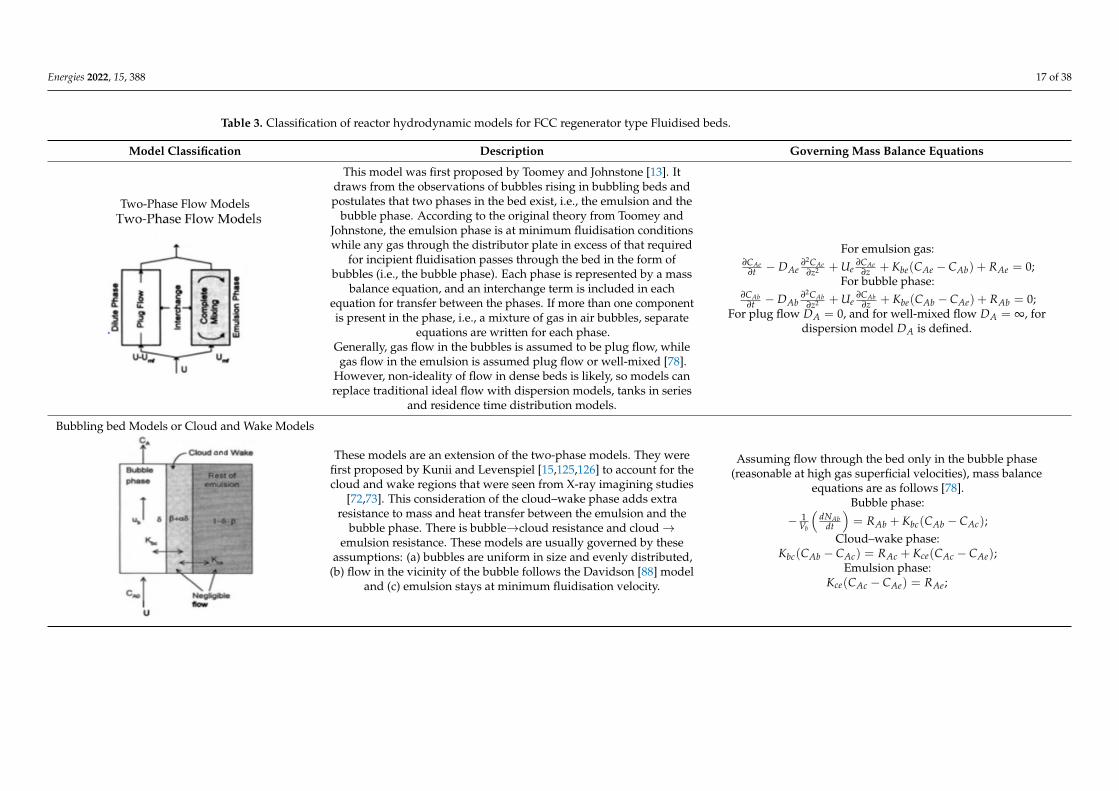
Table 3. Classification of reactor hydrodynamic models for FCC regenerator type Fluidised beds.
Model Classification Description Governing Mass Balance Equations
Two-Phase Flow Models
This model was first proposed by Toomey and Johnstone [13]. Itdraws from the observations of bubbles rising in bubbling beds andpostulates that two phases in the bed exist, i.e., the emulsion and the
bubble phase. According to the original theory from Toomey andJohnstone, the emulsion phase is at minimum fluidisation conditionswhile any gas through the distributor plate in excess of that required
for incipient fluidisation passes through the bed in the form ofbubbles (i.e., the bubble phase). Each phase is represented by a mass
balance equation, and an interchange term is included in eachequation for transfer between the phases. If more than one componentis present in the phase, i.e., a mixture of gas in air bubbles, separate
equations are written for each phase.Generally, gas flow in the bubbles is assumed to be plug flow, whilegas flow in the emulsion is assumed plug flow or well-mixed [78].
However, non-ideality of flow in dense beds is likely, so models canreplace traditional ideal flow with dispersion models, tanks in series
and residence time distribution models.
For emulsion gas:∂CAe
∂t − DAe∂2CAe
∂z2 + Ue∂CAe
∂z + Kbe(CAe − CAb) + RAe = 0;For bubble phase:
∂CAb∂t − DAb
∂2CAb∂z2 + Ue
∂CAb∂z + Kbe(CAb − CAe) + RAb = 0;
For plug flow DA = 0, and for well-mixed flow DA = ∞, fordispersion model DA is defined.
Bubbling bed Models or Cloud and Wake Models
These models are an extension of the two-phase models. They werefirst proposed by Kunii and Levenspiel [15,125,126] to account for thecloud and wake regions that were seen from X-ray imagining studies
[72,73]. This consideration of the cloud–wake phase adds extraresistance to mass and heat transfer between the emulsion and the
bubble phase. There is bubble→cloud resistance and cloud→emulsion resistance. These models are usually governed by these
assumptions: (a) bubbles are uniform in size and evenly distributed,(b) flow in the vicinity of the bubble follows the Davidson [88] model
and (c) emulsion stays at minimum fluidisation velocity.
Assuming flow through the bed only in the bubble phase(reasonable at high gas superficial velocities), mass balance
equations are as follows [78].Bubble phase:
− 1Vb
(dNAb
dt
)= RAb + Kbc(CAb − CAc);
Cloud–wake phase:Kbc(CAb − CAc) = RAc + Kce(CAc − CAe);
Emulsion phase:Kce(CAc − CAe) = RAe;
Energies 2022, 15, 388 18 of 38
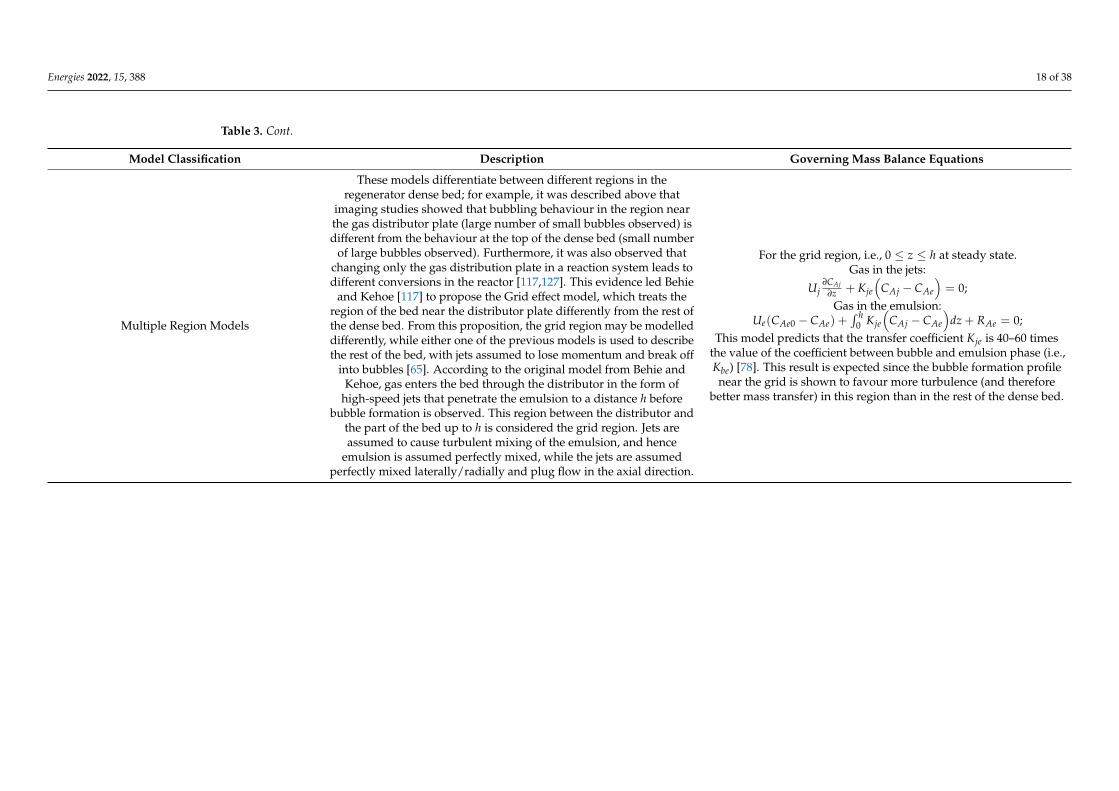
Table 3. Cont.
Model Classification Description Governing Mass Balance Equations
Multiple Region Models
These models differentiate between different regions in theregenerator dense bed; for example, it was described above that
imaging studies showed that bubbling behaviour in the region nearthe gas distributor plate (large number of small bubbles observed) isdifferent from the behaviour at the top of the dense bed (small number
of large bubbles observed). Furthermore, it was also observed thatchanging only the gas distribution plate in a reaction system leads todifferent conversions in the reactor [117,127]. This evidence led Behie
and Kehoe [117] to propose the Grid effect model, which treats theregion of the bed near the distributor plate differently from the rest ofthe dense bed. From this proposition, the grid region may be modelleddifferently, while either one of the previous models is used to describethe rest of the bed, with jets assumed to lose momentum and break off
into bubbles [65]. According to the original model from Behie andKehoe, gas enters the bed through the distributor in the form of
high-speed jets that penetrate the emulsion to a distance h beforebubble formation is observed. This region between the distributor and
the part of the bed up to h is considered the grid region. Jets areassumed to cause turbulent mixing of the emulsion, and hence
emulsion is assumed perfectly mixed, while the jets are assumedperfectly mixed laterally/radially and plug flow in the axial direction.
For the grid region, i.e., 0 ≤ z ≤ h at steady state.Gas in the jets:
Uj∂CAj
∂z + Kje
(CAj − CAe
)= 0;
Gas in the emulsion:Ue(CAe0 − CAe) +
∫ h0 Kje
(CAj − CAe
)dz + RAe = 0;
This model predicts that the transfer coefficient Kje is 40–60 timesthe value of the coefficient between bubble and emulsion phase (i.e.,Kbe) [78]. This result is expected since the bubble formation profilenear the grid is shown to favour more turbulence (and therefore
better mass transfer) in this region than in the rest of the dense bed.
Energies 2022, 15, 388 19 of 38
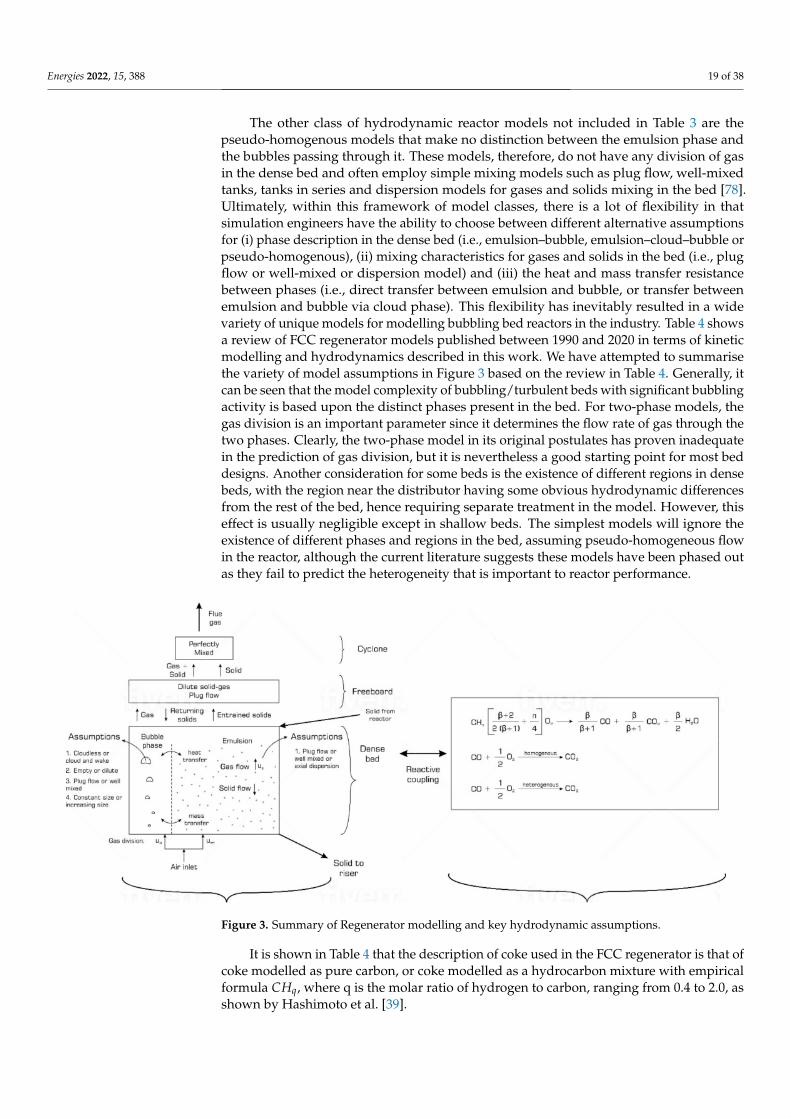
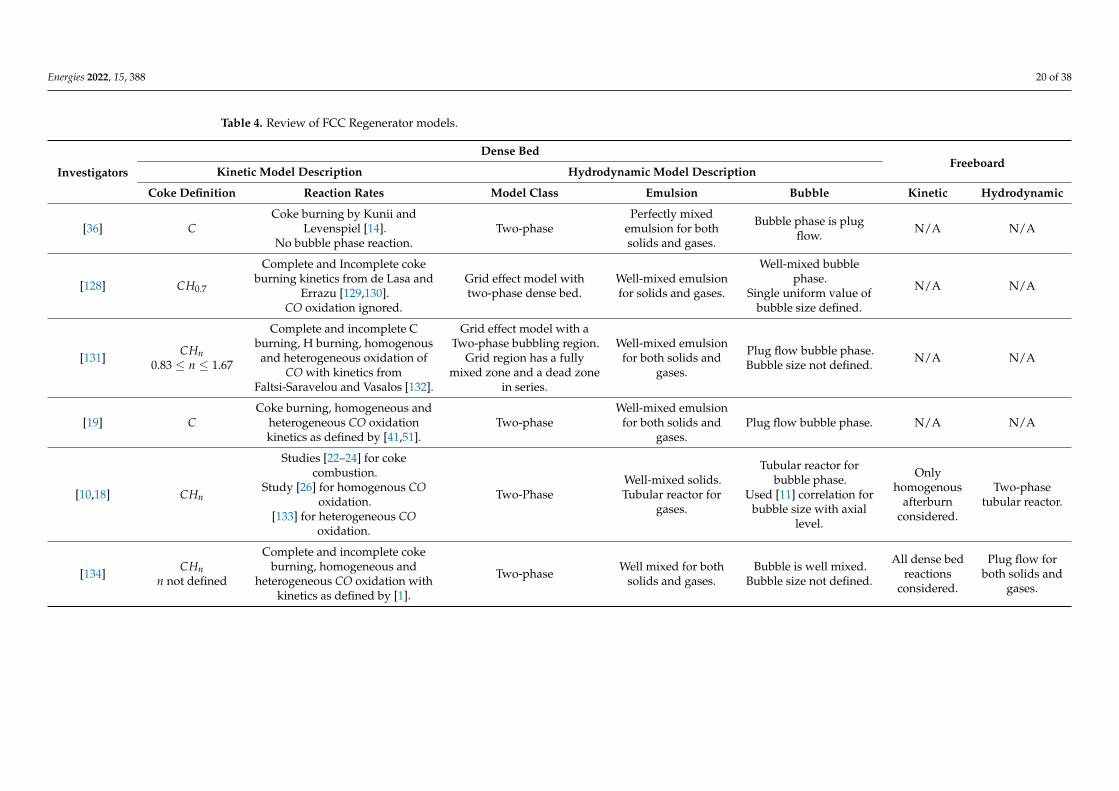
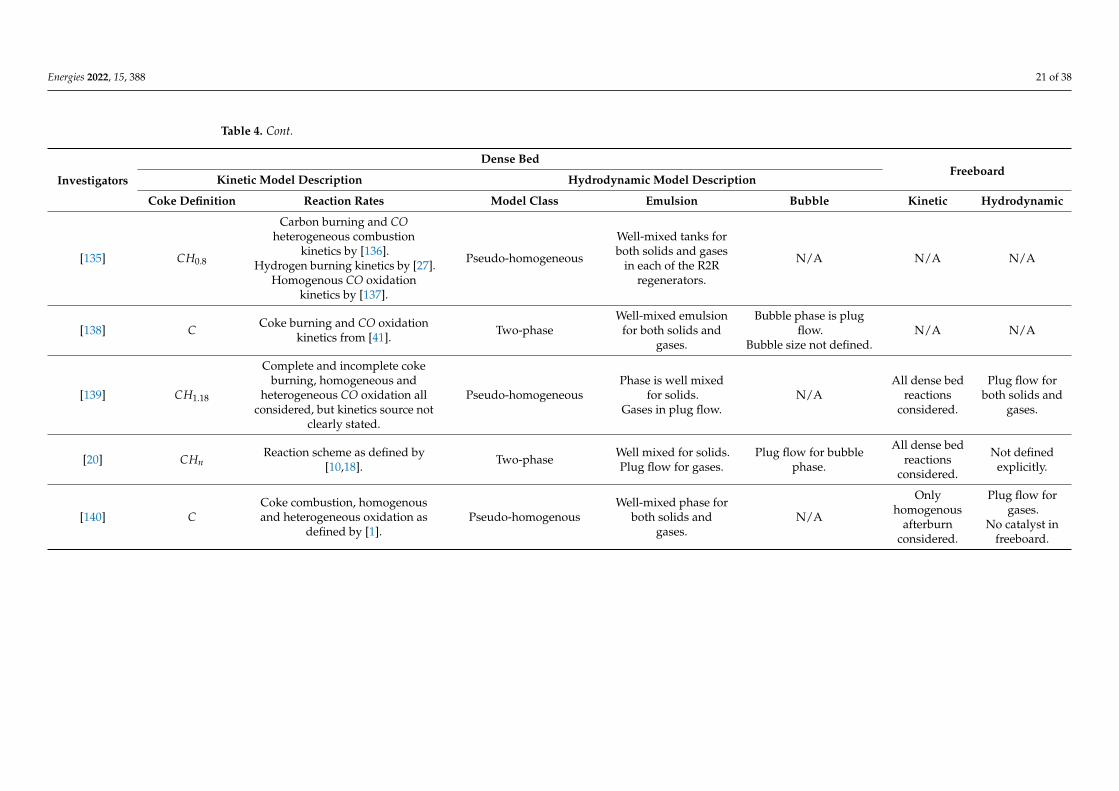
The other class of hydrodynamic reactor models not included in Table 3 are thepseudo-homogenous models that make no distinction between the emulsion phase andthe bubbles passing through it. These models, therefore, do not have any division of gasin the dense bed and often employ simple mixing models such as plug flow, well-mixedtanks, tanks in series and dispersion models for gases and solids mixing in the bed [78].Ultimately, within this framework of model classes, there is a lot of flexibility in thatsimulation engineers have the ability to choose between different alternative assumptionsfor (i) phase description in the dense bed (i.e., emulsion–bubble, emulsion–cloud–bubble orpseudo-homogenous), (ii) mixing characteristics for gases and solids in the bed (i.e., plugflow or well-mixed or dispersion model) and (iii) the heat and mass transfer resistancebetween phases (i.e., direct transfer between emulsion and bubble, or transfer betweenemulsion and bubble via cloud phase). This flexibility has inevitably resulted in a widevariety of unique models for modelling bubbling bed reactors in the industry. Table 4 showsa review of FCC regenerator models published between 1990 and 2020 in terms of kineticmodelling and hydrodynamics described in this work. We have attempted to summarisethe variety of model assumptions in Figure 3 based on the review in Table 4. Generally, itcan be seen that the model complexity of bubbling/turbulent beds with significant bubblingactivity is based upon the distinct phases present in the bed. For two-phase models, thegas division is an important parameter since it determines the flow rate of gas through thetwo phases. Clearly, the two-phase model in its original postulates has proven inadequatein the prediction of gas division, but it is nevertheless a good starting point for most beddesigns. Another consideration for some beds is the existence of different regions in densebeds, with the region near the distributor having some obvious hydrodynamic differencesfrom the rest of the bed, hence requiring separate treatment in the model. However, thiseffect is usually negligible except in shallow beds. The simplest models will ignore theexistence of different phases and regions in the bed, assuming pseudo-homogeneous flowin the reactor, although the current literature suggests these models have been phased outas they fail to predict the heterogeneity that is important to reactor performance.
Figure 3. Summary of Regenerator modelling and key hydrodynamic assumptions.
It is shown in Table 4 that the description of coke used in the FCC regenerator is that ofcoke modelled as pure carbon, or coke modelled as a hydrocarbon mixture with empiricalformula CHq, where q is the molar ratio of hydrogen to carbon, ranging from 0.4 to 2.0, asshown by Hashimoto et al. [39].
Energies 2022, 15, 388 20 of 38
Table 4. Review of FCC Regenerator models.
Investigators
Dense BedFreeboard
Kinetic Model Description Hydrodynamic Model Description
Coke Definition Reaction Rates Model Class Emulsion Bubble Kinetic Hydrodynamic
[36] CCoke burning by Kunii and
Levenspiel [14].No bubble phase reaction.
Two-phasePerfectly mixed
emulsion for bothsolids and gases.
Bubble phase is plugflow. N/A N/A
[128] CH0.7
Complete and Incomplete cokeburning kinetics from de Lasa and
Errazu [129,130].CO oxidation ignored.
Grid effect model withtwo-phase dense bed.
Well-mixed emulsionfor solids and gases.
Well-mixed bubblephase.
Single uniform value ofbubble size defined.
N/A N/A
[131] CHn0.83 ≤ n ≤ 1.67
Complete and incomplete Cburning, H burning, homogenousand heterogeneous oxidation of
CO with kinetics fromFaltsi-Saravelou and Vasalos [132].
Grid effect model with aTwo-phase bubbling region.
Grid region has a fullymixed zone and a dead zone
in series.
Well-mixed emulsionfor both solids and
gases.
Plug flow bubble phase.Bubble size not defined. N/A N/A
[19] CCoke burning, homogeneous and
heterogeneous CO oxidationkinetics as defined by [41,51].
Two-phaseWell-mixed emulsion
for both solids andgases.
Plug flow bubble phase. N/A N/A
[10,18] CHn
Studies [22–24] for cokecombustion.
Study [26] for homogenous COoxidation.
[133] for heterogeneous COoxidation.
Two-PhaseWell-mixed solids.Tubular reactor for
gases.
Tubular reactor forbubble phase.
Used [11] correlation forbubble size with axial
level.
Onlyhomogenous
afterburnconsidered.
Two-phasetubular reactor.
[134] CHnn not defined
Complete and incomplete cokeburning, homogeneous and
heterogeneous CO oxidation withkinetics as defined by [1].
Two-phase Well mixed for bothsolids and gases.
Bubble is well mixed.Bubble size not defined.
All dense bedreactions
considered.
Plug flow forboth solids and
gases.
Energies 2022, 15, 388 21 of 38
Table 4. Cont.
Investigators
Dense BedFreeboard
Kinetic Model Description Hydrodynamic Model Description
Coke Definition Reaction Rates Model Class Emulsion Bubble Kinetic Hydrodynamic
[135] CH0.8
Carbon burning and COheterogeneous combustion
kinetics by [136].Hydrogen burning kinetics by [27].
Homogenous CO oxidationkinetics by [137].
Pseudo-homogeneous
Well-mixed tanks forboth solids and gases
in each of the R2Rregenerators.
N/A N/A N/A
[138] C Coke burning and CO oxidationkinetics from [41]. Two-phase
Well-mixed emulsionfor both solids and
gases.
Bubble phase is plugflow.
Bubble size not defined.N/A N/A
[139] CH1.18
Complete and incomplete cokeburning, homogeneous and
heterogeneous CO oxidation allconsidered, but kinetics source not
clearly stated.
Pseudo-homogeneousPhase is well mixed
for solids.Gases in plug flow.
N/AAll dense bed
reactionsconsidered.
Plug flow forboth solids and
gases.
[20] CHnReaction scheme as defined by
[10,18]. Two-phase Well mixed for solids.Plug flow for gases.
Plug flow for bubblephase.
All dense bedreactions
considered.
Not definedexplicitly.
[140] CCoke combustion, homogenousand heterogeneous oxidation as
defined by [1].Pseudo-homogenous
Well-mixed phase forboth solids and
gases.N/A
Onlyhomogenous
afterburnconsidered.
Plug flow forgases.
No catalyst infreeboard.
Energies 2022, 15, 388 22 of 38
Although the homogenous carbon monoxide oxidation was generally found to benegligible compared to the heterogeneous version, such as in the work of Morley andde Lasa [51], both reactions were included in models of the FCC regenerators to varyingdegrees. This allows models to be subdivided into three categories with respect to COoxidation: (1) models that consider only the heterogeneous reaction [138], (ii) models thatconsider only the homogenous reaction and (iii) models that consider both reactions [1,10,140].Models that ignore the post-combustion CO oxidation reactions completely, such as [36],were generally phased out, which shows the significance of these so-called afterburnreactions. Ultimately, the level of detail included in the kinetic model depends on theend-use of the model and the accuracy required. In recent times, with stricter regulationssurrounding emissions, it is advisable to include all the important reactions so that moreaccurate predictions of emissions can be made.
Models increase in complexity from homogeneous to two-phase models to grid effectmodels. Table 4 shows that the simple pseudo-homogeneous models are seldom usedto model FCC regenerators. One reason for this is that pseudo homogeneity in fluidisedbeds is usually observed at a smooth fluidisation regime, and the homogeneity decreasestowards the turbulent regime. In the bubbling/turbulent regime, the bubbles rising throughthe bed are seen dispersed in the ‘continuous phase’ or emulsion, indicating that the flowmixture is highly non-homogeneous. Comparative studies were conducted to compare theperformance of hydrodynamic models of the FCC regenerator. Lee et al. [32] comparedthree different models for describing the FCC regenerator, namely the grid effect model,the two-phase model and the bubbling bed model, and compared the simulation resultsto data from a working refinery FCC unit. They found that the bubbling bed model gavethe smallest error in relation to the coke conversion and exit catalyst temperature plantdata when the emulsion is considered perfectly mixed for solids, and the dense bed and thefreeboard are assumed two thermally uniform stages in series for heat balance. However,they have noted that although the bubbling bed outperformed the two other models, itstill was not an exact description of the regenerator. The work of Lee et al. [32] has givenresults that suggest that the grid effect model is generally more suited for shallow beds(where D
L ∼ 1) as it was originally developed for such cases [117]. This is in line with thereview in Table 4 that shows that only a few researchers have used this model to simulatethe regenerator. The more perplexing observation from Table 4, in light of the resultsfrom Lee et al. [32], is the limited adoption of the bubbling bed model as opposed to thetwo-phase model, which was outperformed by the former in terms of both coke conversionand catalyst outlet temperature. One reason for this could be that the two-phase model ismuch simpler and less computationally expensive. Another reason is that the complexity ofthe model used is very much linked to the purpose of the model. Models used in the initialdesign stages are usually shortcut and simple models, whereas control and optimisationmodels can generally be more involved.
Another issue of note is the treatment of emulsion phase gas mixing or flow. Grace [141]noted that no other feature in fluidised bed reactor modelling has been subject to as manyalternative assumptions as the axial mixing of emulsion gas. Table 4 shows that in terms ofmodelling the FCC regenerator, the behaviour of emulsion phase gas remains unresolved.The assumption for gas in emulsion alternates between well mixed and plug flow in theaxial direction. For comparison, Table 4 shows there is some consensus in assuming gasin the bubble phase is plug flow while particles in the emulsion are assumed well mixed.This assumption of plug flow in the bubbles is consistent with the experimental evidencediscussed, which suggested that gas starts to deviate from plug flow when solids are intro-duced to the flow. Because bubbles are assumed to be essentially solid-free, the plug flowof gas is reasonable. However, the emulsion is different because both gas and solids arepresent in the suspension. While both plug flow and well-mixed assumptions have beenused with great utility when describing gas in the emulsion, they are two different flowpatterns and therefore mean the understanding of gas mixing in the emulsion as an openquestion. Levenspiel [142] thoroughly reviewed the problem of emulsion phase gas mixing
Energies 2022, 15, 388 23 of 38
in bubbling fluidised beds. They compared results from thirty-nine experiments conductedon group A-type particles by five different reactor groups in various flow reactors, wherethe extent of conversion was measured during the experiments. They conclude that gasflow in the dense bed cannot be modelled using simple plug flow or well-mixed flowmodels, and in some cases, these assumptions can be highly inaccurate. Of interest isthat parameters can be adjusted in the models so that both sets of assumptions produceresults that match measured reactor outlet temperatures, and this is usually sufficient forindustrial purposes. The downside is that conditions such as conversion within the densebed cannot be definitively predicted. Nevertheless, it usually does not affect the exit resultswhich description of emulsion gas is chosen, and until such a time when experiments wereconducted to study gas mixing conclusively, this will remain an unsolved aspect of FCCregenerator modelling.
Treatment of bubbles in the bed is also poorly addressed in the regenerator, as canbe seen, that many workers of two-phase models have not clearly defined the bubble sizeor have provided insufficient information for this detail to be discernible to the reader.It may be that this parameter was accounted for in their models but not published intheir papers, or it was not treated at all. Workers that properly accounted for bubble sizeeither used a Davidson theory type assumption with uniform bubble size through thebed [128,132,143] or used a correlation for bubble size with height to account for bubblegrowth through the bed [10,18]. Levenspiel [142] showed that bubble size, for a uniformbubble description in a bubbling bed model, does affect the conversion through the bed.This is consistent with the earlier work [132], which studied the effect of bubble size onoxygen exchange between the emulsion and bubble phase. They reported that smallerbubbles (in the range 5–10 cm) increased the interchange of oxygen between the emulsionand bubble phase resulting in more oxygen being carried to the reacting catalyst surfacein the dense bed, while larger bubbles (≥ 20 cm) resulted in lower oxygen interchangeand lower coke conversion. Faltsi-Saravelou et al. [132], however, have not addressed theissue of bubble growth through the bed. Nevertheless, a proper description of bubble sizeneeds to be incorporated into dense bed models employing either two-phase or bubblingbed models.
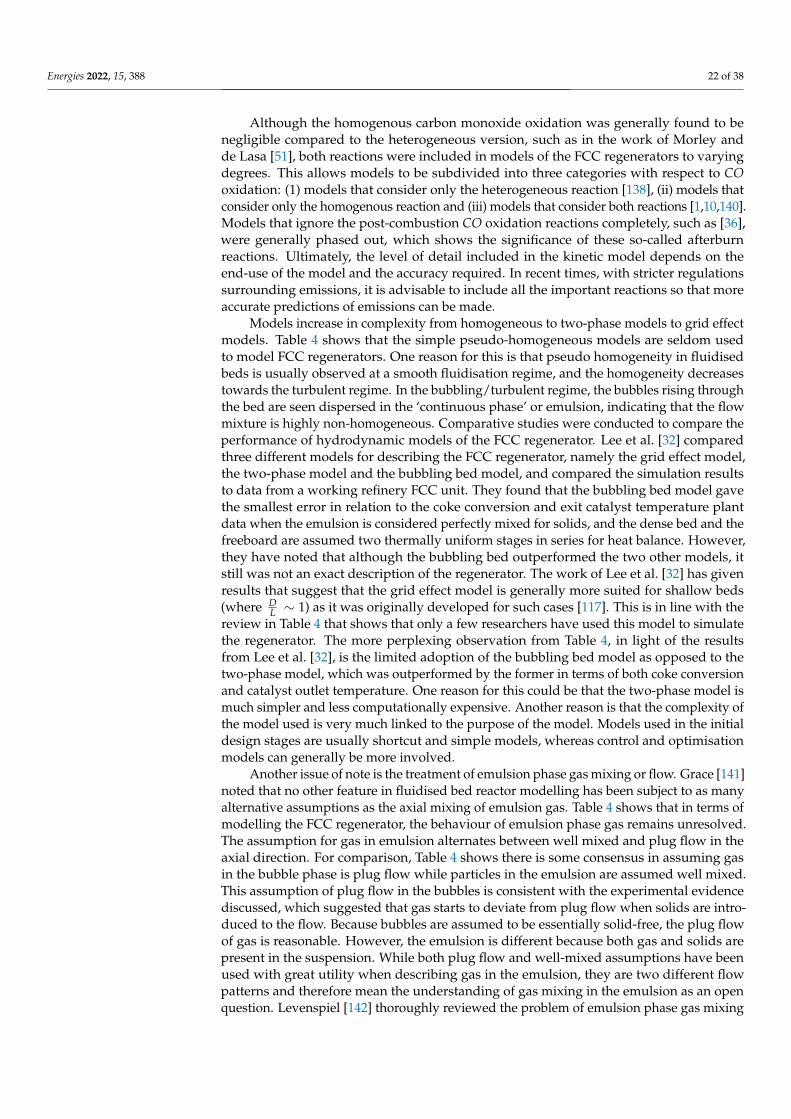
2.4. FCC Regenerator Performance Predictions
Several studies of FCC regenerator modelling have provided simulation results forthe axial distribution of gas in the regenerator, the temperature in the bed and the cokeconversion. Some of these results are presented in Figure 4 and discussed.
Figure 4. Cont.
Energies 2022, 15, 388 24 of 38
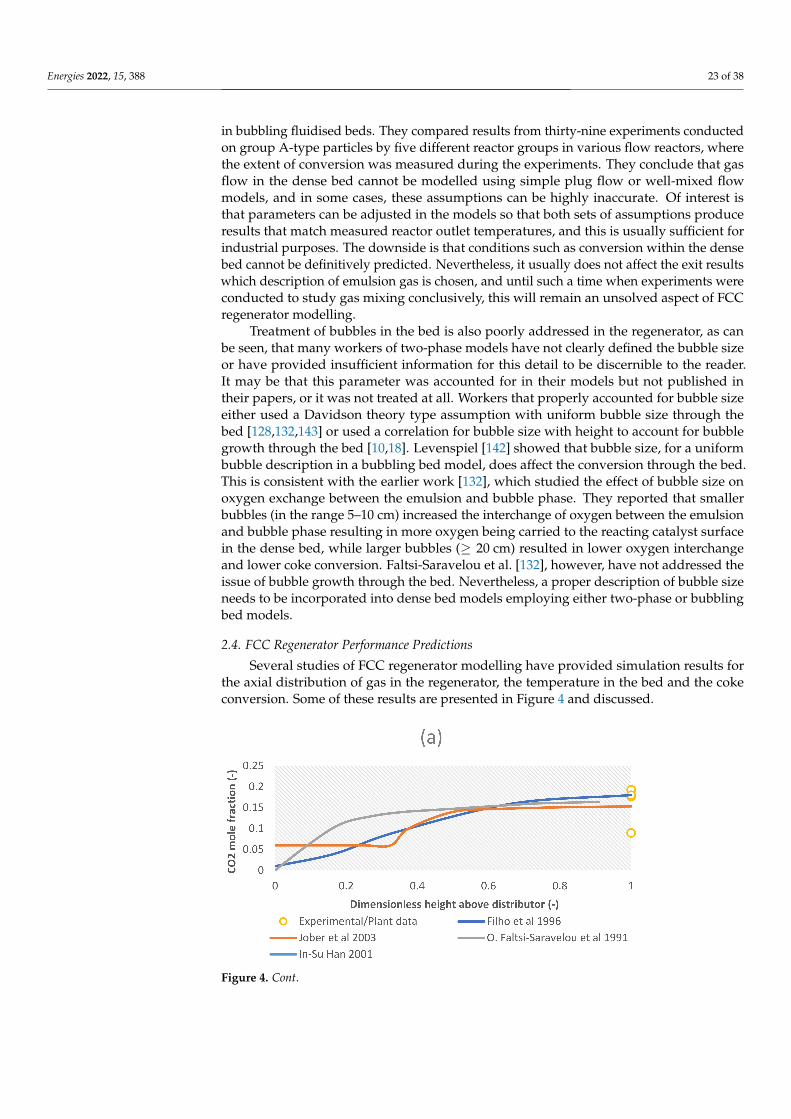
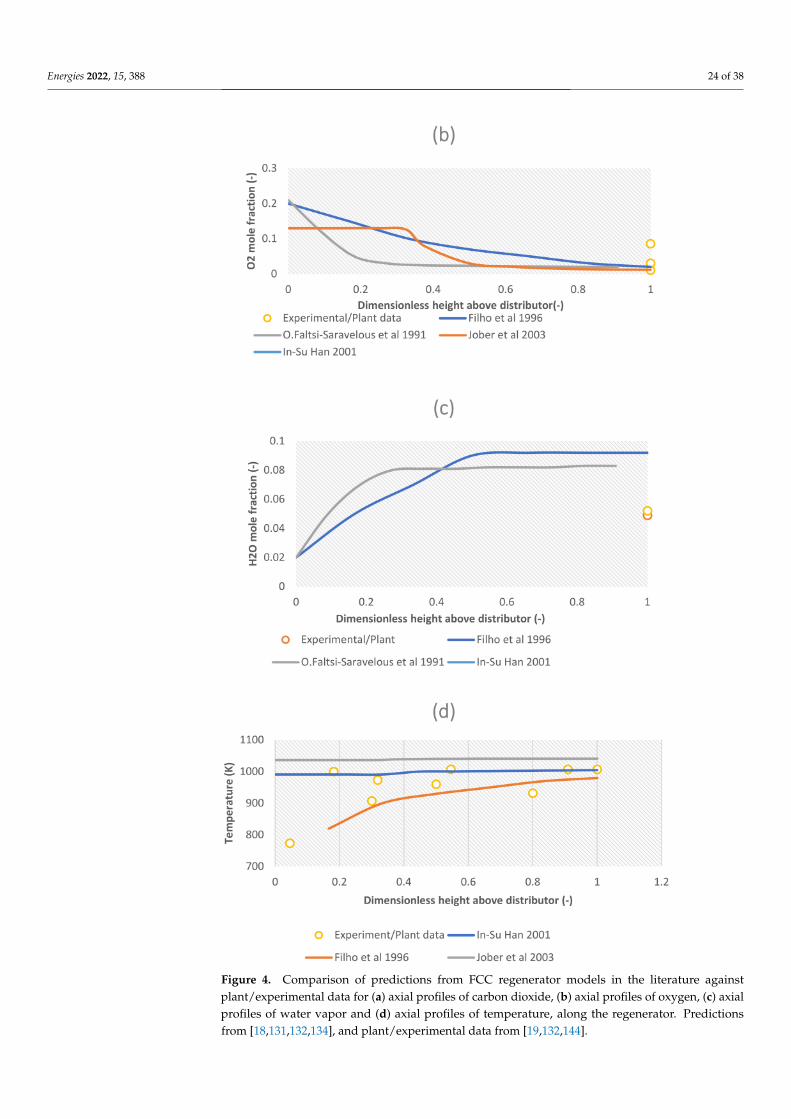
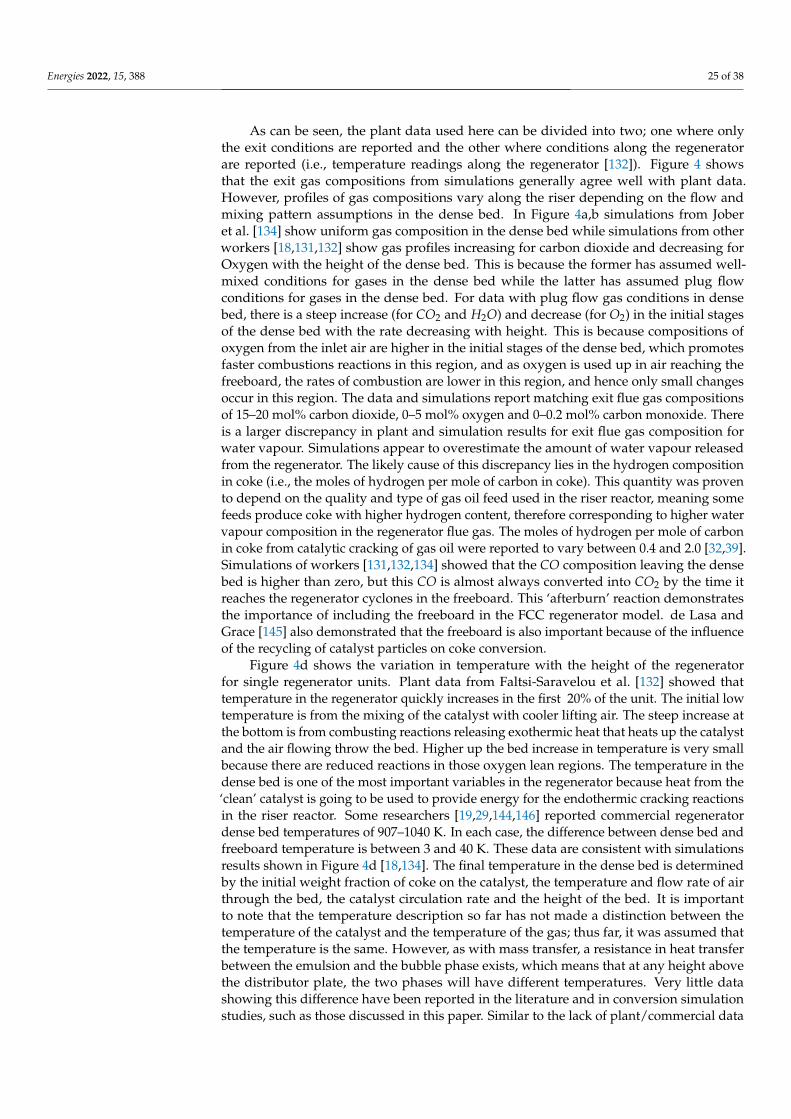
Figure 4. Comparison of predictions from FCC regenerator models in the literature againstplant/experimental data for (a) axial profiles of carbon dioxide, (b) axial profiles of oxygen, (c) axialprofiles of water vapor and (d) axial profiles of temperature, along the regenerator. Predictionsfrom [18,131,132,134], and plant/experimental data from [19,132,144].
Energies 2022, 15, 388 25 of 38
As can be seen, the plant data used here can be divided into two; one where onlythe exit conditions are reported and the other where conditions along the regeneratorare reported (i.e., temperature readings along the regenerator [132]). Figure 4 showsthat the exit gas compositions from simulations generally agree well with plant data.However, profiles of gas compositions vary along the riser depending on the flow andmixing pattern assumptions in the dense bed. In Figure 4a,b simulations from Joberet al. [134] show uniform gas composition in the dense bed while simulations from otherworkers [18,131,132] show gas profiles increasing for carbon dioxide and decreasing forOxygen with the height of the dense bed. This is because the former has assumed well-mixed conditions for gases in the dense bed while the latter has assumed plug flowconditions for gases in the dense bed. For data with plug flow gas conditions in densebed, there is a steep increase (for CO2 and H2O) and decrease (for O2) in the initial stagesof the dense bed with the rate decreasing with height. This is because compositions ofoxygen from the inlet air are higher in the initial stages of the dense bed, which promotesfaster combustions reactions in this region, and as oxygen is used up in air reaching thefreeboard, the rates of combustion are lower in this region, and hence only small changesoccur in this region. The data and simulations report matching exit flue gas compositionsof 15–20 mol% carbon dioxide, 0–5 mol% oxygen and 0–0.2 mol% carbon monoxide. Thereis a larger discrepancy in plant and simulation results for exit flue gas composition forwater vapour. Simulations appear to overestimate the amount of water vapour releasedfrom the regenerator. The likely cause of this discrepancy lies in the hydrogen compositionin coke (i.e., the moles of hydrogen per mole of carbon in coke). This quantity was provento depend on the quality and type of gas oil feed used in the riser reactor, meaning somefeeds produce coke with higher hydrogen content, therefore corresponding to higher watervapour composition in the regenerator flue gas. The moles of hydrogen per mole of carbonin coke from catalytic cracking of gas oil were reported to vary between 0.4 and 2.0 [32,39].Simulations of workers [131,132,134] showed that the CO composition leaving the densebed is higher than zero, but this CO is almost always converted into CO2 by the time itreaches the regenerator cyclones in the freeboard. This ‘afterburn’ reaction demonstratesthe importance of including the freeboard in the FCC regenerator model. de Lasa andGrace [145] also demonstrated that the freeboard is also important because of the influenceof the recycling of catalyst particles on coke conversion.
Figure 4d shows the variation in temperature with the height of the regeneratorfor single regenerator units. Plant data from Faltsi-Saravelou et al. [132] showed thattemperature in the regenerator quickly increases in the first 20% of the unit. The initial lowtemperature is from the mixing of the catalyst with cooler lifting air. The steep increase atthe bottom is from combusting reactions releasing exothermic heat that heats up the catalystand the air flowing throw the bed. Higher up the bed increase in temperature is very smallbecause there are reduced reactions in those oxygen lean regions. The temperature in thedense bed is one of the most important variables in the regenerator because heat from the‘clean’ catalyst is going to be used to provide energy for the endothermic cracking reactionsin the riser reactor. Some researchers [19,29,144,146] reported commercial regeneratordense bed temperatures of 907–1040 K. In each case, the difference between dense bed andfreeboard temperature is between 3 and 40 K. These data are consistent with simulationsresults shown in Figure 4d [18,134]. The final temperature in the dense bed is determinedby the initial weight fraction of coke on the catalyst, the temperature and flow rate of airthrough the bed, the catalyst circulation rate and the height of the bed. It is importantto note that the temperature description so far has not made a distinction between thetemperature of the catalyst and the temperature of the gas; thus far, it was assumed thatthe temperature is the same. However, as with mass transfer, a resistance in heat transferbetween the emulsion and the bubble phase exists, which means that at any height abovethe distributor plate, the two phases will have different temperatures. Very little datashowing this difference have been reported in the literature and in conversion simulationstudies, such as those discussed in this paper. Similar to the lack of plant/commercial data
Energies 2022, 15, 388 26 of 38
about axial profiles of gas composition in the regenerator, the reason for this is likely linkedto the difficulty of making these measurements during the normal operation of the unit.However, regenerator models employing computational fluid dynamics (CFD) tackled thisproblem correctly [29–31,62,147].
2.5. Shortcomings and Future Recommendations
The following shortcomings were identified from the review of FCC regenerator models:
(a) Axial mixing: Table 4 shows that the mixing of solids and gas in the bed is usuallyassumed to be either plug flow or well mixed in the axial direction. Considering theresults from Callcott et al. [104] that showed that tracer solids could be completelymixed in the axial direction in 75 s, and also noting that the characteristic residencetime for solids in the FCC regenerator is in the range of minutes to an hour (see Table 1),then it is totally reasonable to assume complete mixing for solids in the axial direction.However, gas mixing is more complex, as was explained earlier. It has now beenestablished that the motion of bubbles up the bed causes a rise to circulation patternsof solids in the bed so that solids are moving up the bed in bubbling regions andmoving down the bed in regions of low bubbling activity. It was suggested by severalworkers [16,148] that the regions of downflow of solids drag down the interstitial gasso that downflow of gas is possible in the bed. Stephens et al. [16] suggested that thedownflow of gas occurs when the downflow velocity of solids exceeds the velocityof rising emulsion gas. Consequently, this is what has led to back-mixing modelsfor bubbling fluidised beds. The review in Table 4 shows that back-mixing modelsand their applicability to the FCC regenerator has yet to be explored, and since it hasbeen clear from Levenspiel [142] that plug flow or well-mixed assumptions do notaccurately predict gas mixing in the dense bed, it is worth exploring back-mixingmodels for their performance in describing gas flow in FCC dense beds;
(b) Radial mixing: According to Grace [141], knowledge of lateral/axial mixing can befar more important than axial mixing in predicting the performance of fluidised units.The FCC regenerator models reviewed in Table 4 are all 1-D models that assumeperfect axial mixing of both solids and gases so that any variation that occurs is onlyin the axial direction. It was described [104] that solids mixing is poor in the lateral(or radial) direction and that complete mixing is only achieved in the time scale in theorder of 1.5 h, which exceeds the normal time scale for the residence time of solids inthe FCC regenerator (see Table 1). Therefore, it seems unreasonable to assume perfectradial mixing of solids in the regenerator. In order to understand lateral/radial solidmixing better, a lateral dispersion coefficient was used to encompass all the solidsmixing processes identified by Rowe and other workers [72,73,149] i.e., emulsion drift,bubble wake lift and bubble eruption scattering. Determination of the dispersioncoefficient was generally performed in two ways; (i) a diffusion-type [101,150], whereexperimental data are fitted to a model that is based on the analogy that solid particlesbehave similar to gas molecules travelling in a continuous isotropic environment,and (ii) a stochastic-type model [105,151,152] that assumes a solid particle in a bubbleinduced mixing cell can randomly jump between adjacent mixing cells, and that thisjumping is governed by a probability distribution. There has been some success inusing these dispersion models, especially in the fields of bubbling fluidised gasifica-tion and combustion of coal and biomass, but so far, there is limited literature on theirapplication for FCC regenerator modelling;
(c) Emissions: in the last three decades, there has been increased scrutiny and regulationson the anthropogenic emissions of GHGs, such as CO, CO2, SOx, CH4 and NOx,case in point the Kyoto Protocol of 1997 [7] and the Paris Agreement of 2015 [5].European countries will report their greenhouse gas emissions reductions as per theapproved United Nations Framework Convention on Climate Change (UNFCCC)transparency framework as well as the Intergovernmental Panel on Climate Change(IPCC) methodology guidelines [153]. The reason for such global actions is the
Energies 2022, 15, 388 27 of 38
influence of human-made emissions on climate. Fossil Fuel emissions, of which theemissions from the FCC regenerator are a part of, were reported to account for 87% ofall the carbon (i.e., CO, CO2, CH4 etc) emissions from anthropogenic sources [154].Therefore, the ability to predict the emissions of GHGs from the FCC unit is ofimportance towards the global goals of mitigation of climate change by a reductionin anthropogenic emissions. The current generation of FCC regenerator models(discussed in Table 4) can predict the emissions of carbon-based GHGs because cokeburned in the regenerator unit is described as CHn. However, since other importantelements such as nitrogen and sulphur that are precursors to GHGs ( NOx and SOx,respectively) and are present in coke but have been ignored in modelling, whichmeans the current models are unable to predict these emissions. Hence, consideringthe gravity of the climate change problem, it is recommended that future modelsinclude kinetics for the combustion of sulphur and nitrogen so that their emissiongases can be monitored and addressed;
(d) Temperature: A common assumption in modelling is to assume that there is ther-modynamic equilibrium between the gas and the solids in the emulsion phase. Thistreats any resistance to heat transfer at the solid–gas interphase as negligible. Sincethe temperature of the catalyst is an important parameter in the FCC regenerator, therate of heat transfer between the catalyst particle and the gas plays an important rolein the performance of the unit since it determines the energy balance. For designpurposes, this assumption is usually sufficient [155]. However, since the heat capacityand thermal conductivity values for the catalyst are usually appreciably higher thanthat of the gas, for cases where a more detailed description of the temperature of gasand catalyst is required, arguably in the case of the FCC regenerator for its influenceon riser thermal balance, the loosening of the thermal equilibrium assumption maybe worth exploring;
(e) Bubble properties: from examining Table 4, it is easy to see that the bubbles risingthrough the dense bed of the FCC regenerator have generally been poorly describedin the models. Bubbles affect the gas–solid contact in the bed and therefore controlmass and heat transfer in the bed; hence, their modelling in two-phase or bubblingbeds is of great importance to the prediction of coke conversion and thermal balancein the regenerator. Although the understanding of bubble size, growth and frequencyis highly empirical, these empirical correlations provide a great understanding of thebubbling phenomena in the dense bed and should be included in the modelling of theFCC regenerator.
3. Modelling FCC Unit Constitutive Components3.1. Cyclones
Cyclones are usually used in both the reactor and the regenerator systems of an FCCunit. They are the conventional industry equipment used to separate gas–solid two-phaseflow. In the FCC reactor system, the cyclones are used in the disengaging section to separateentrained catalyst particles from the wet gases going to the main fractionating column.In the FCC regenerator, the cyclones are used to separate any entrained catalyst particlesescaping at the top of the freeboard from the flue gases leaving the regenerator system. Themost used type of cyclone in these systems is the tangential inlet cyclone that uses turbulentswirling flow to separate the high-density entrained phase (the catalyst particulate phase)from the low-density carrier phase (the gas) [156]. The swirling flow pattern usuallyconsists of a double vortex flow pattern; an outer vortex with downward axial velocity andan inner vortex with upward axial velocity, shown in Figure 5a. The outer vortex losesits downward momentum towards the bottom of the cyclone and subsequently changesdirection to flow upwards, resulting in the inner vortex being formed [156]. Because ofthe complex nature of the flow inside the cyclone, this flow pattern influences some ofthe important operational parameters, such as the separation efficiency and the pressuredrop [156]. For this reason, these parameters are usually estimated using CFD, where
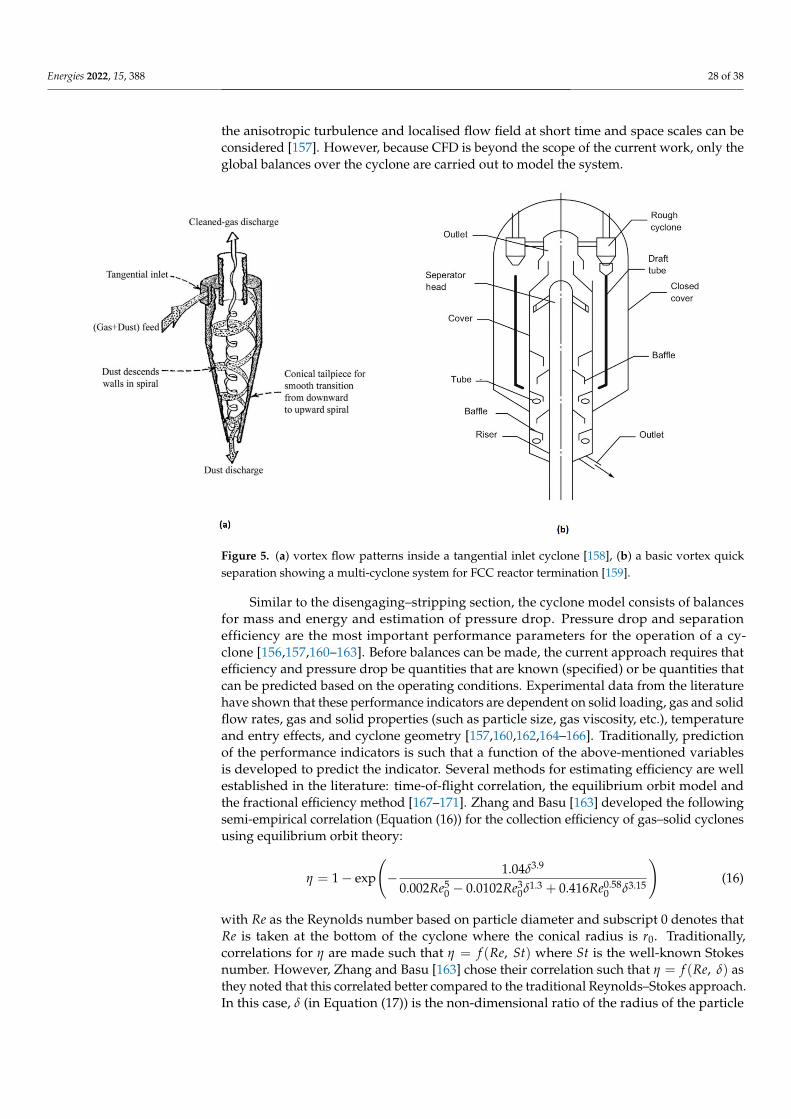
Energies 2022, 15, 388 28 of 38
the anisotropic turbulence and localised flow field at short time and space scales can beconsidered [157]. However, because CFD is beyond the scope of the current work, only theglobal balances over the cyclone are carried out to model the system.
Figure 5. (a) vortex flow patterns inside a tangential inlet cyclone [158], (b) a basic vortex quickseparation showing a multi-cyclone system for FCC reactor termination [159].
Similar to the disengaging–stripping section, the cyclone model consists of balancesfor mass and energy and estimation of pressure drop. Pressure drop and separationefficiency are the most important performance parameters for the operation of a cy-clone [156,157,160–163]. Before balances can be made, the current approach requires thatefficiency and pressure drop be quantities that are known (specified) or be quantities thatcan be predicted based on the operating conditions. Experimental data from the literaturehave shown that these performance indicators are dependent on solid loading, gas and solidflow rates, gas and solid properties (such as particle size, gas viscosity, etc.), temperatureand entry effects, and cyclone geometry [157,160,162,164–166]. Traditionally, predictionof the performance indicators is such that a function of the above-mentioned variablesis developed to predict the indicator. Several methods for estimating efficiency are wellestablished in the literature: time-of-flight correlation, the equilibrium orbit model andthe fractional efficiency method [167–171]. Zhang and Basu [163] developed the followingsemi-empirical correlation (Equation (16)) for the collection efficiency of gas–solid cyclonesusing equilibrium orbit theory:
η = 1− exp
(− 1.04δ3.9
0.002Re50 − 0.0102Re3
0δ1.3 + 0.416Re0.580 δ3.15
)(16)
with Re as the Reynolds number based on particle diameter and subscript 0 denotes thatRe is taken at the bottom of the cyclone where the conical radius is r0. Traditionally,correlations for η are made such that η = f (Re, St) where St is the well-known Stokesnumber. However, Zhang and Basu [163] chose their correlation such that η = f (Re, δ) asthey noted that this correlated better compared to the traditional Reynolds–Stokes approach.In this case, δ (in Equation (17)) is the non-dimensional ratio of the radius of the particle
Energies 2022, 15, 388 29 of 38
orbit in the cyclone to the radius at the exit (i.e., rr0
). Without much loss of accuracy, theworkers [163] found that:
δ =
(2πSt
B2
) 12α
(17)
For:
B =
11−α
((Rr0
)1−α− 1)
Rr0− 1
(18)
where α is an exponent of the velocity distribution of the free vortex and can be obtainedempirically from different sizes of cyclones. Zhang and Basu found a value of α = −0.65.Thus, from the above analysis, for known process and stream conditions of the cyclone, thecollection efficiency can be predicted. In both the reactor and the regenerator systems, theentrained catalyst is separated from the gas phase using a multi-stage cyclone system ratherthan just a single cyclone to maximise the separation and the throughput. In order to carryout the conservation balance equations, it is usually assumed that all cyclones are identical(both in terms of dimensions and flow conditions) for simplicity, the flow rate throughthe cyclone dipleg is controlled by the holdup in the cyclone, no reactions occur in thecyclone because the flows are considered dilute with small solid loadings and cyclones arein thermal equilibrium with the disengaging section since this is where they are located [10].Therefore, only material balances are required in this case for modelling the cyclone systems.The temperature of flow into and out of the cyclones is therefore constant and is determinedby energy balances in the disengaging section. The thermal equilibrium assumption isvalid because no reactions are assumed to occur in the cyclone, no new streams are present,and at a steady state, the cyclone body approaches the surrounding (disengaging section)temperature; hence, it is reasonable to assume that temperature does not change in thecyclone. Considering the mentioned assumptions, Han and Chung [10] showed that for areactor system with NCY cyclones, the pseudo-steady state catalyst balance for the cyclonesunder continuous stirred tank assumption is given by Equation (19):
wcCY =ρbNCYACYd
(ηCYvcCYwcST ACYi
kvCYVST
)2(19)
where ACY is the area of the cyclone at the inlet (i) and at the dipleg (d), and vcCY is thevelocity at the inlet of the cyclone, which may be calculated using the Rosin, Rammler andIntelmann equation in Equation (20) [172]:
vcCY =9µg ACYi
dcmπNCYt
(ρc −
wgSTVgST
)hCYi
(20)
where dcm is the minimum particle diameter completely separated by the cyclone system,and NCYt is the number of 360◦ turns made spirally down the cyclone. For typical industrialcyclones, NCYt ranges from 1 to 10 and can be estimated from the cyclone geometry byEquation (21) [173]:
NCYt =1H
Lb +(
Lc2
)H
(21)
where H is the height of the cyclone inlet mouth, and Lb and Lc are heights of the cyclonebody and conical base, respectively. Since the holdup, inlet velocity of the catalyst andthe cyclone separation efficiency are known, the flow rate of catalyst entrained with gasthat is not captured by the cyclone, FcMF, that flows to the main fractionating unit and the
Energies 2022, 15, 388 30 of 38
flow rate gas from the cyclone to the main fractionating unit, FgMF, can be determined byEquations (22) and (23), respectively [10]:
FcMF = (1− ηCY)vcCY ACYi
(wcCYVST
)NCY (22)
FgMF = KvMF√
PST − PMF (23)
Note that for flow rates in the regenerator cyclones, the above equations wouldcalculate the flow rate of catalyst and gas that make up the flue gas stack. Flow ratesthrough the dipleg can be calculated via simple balances between inlet flow rates intothe cyclone and the flow rates leaving at the top of the cyclone for steady state operation.As previously stated, a pressure drop is also an important performance indicator forcyclone operation. Pressure loss in a cyclone is usually divided according to differentcontributions [174,175]: head losses at the cyclone inlet, losses in the separation spacedue to gas flow and the wall and losses in the vortex finder mainly due to gas reversaland contraction at the exit. The relative magnitudes of the losses depend on the cycloneclassification as either low-loaded or high-loaded [171,176]. It was already establishedthat solid loading for the FCC cyclones might be assumed to be small; therefore, it can beassumed to be low-loaded. For low-loaded conditions, Chen and Shi [175] and Li et al. [177]showed that the contributions of outlet pressure losses might be ignored. Chen and Shi [175]developed a ‘universal’ method that predicts the pressure losses of a cyclone, the so-calledC-S method, and this method is now widely used in the literature and was subsequentlyimproved for better accuracy by Li et al. [177], especially for high-loaded cases. The C-Smodel predicts that from Equation (24):
∆PCY =12
ρgξCYUg (24)
where Ug is either the inlet or the outlet gas velocity and ξCY is the dimensionless pressuredrop parameter. In the literature, two main methods of determining ξ are usually used [171]:the first method accounts for effects of cyclone geometry and solid loading on pressurelosses (e.g., ξCY = ξgeometry × ξsolid) [178], and the second method sums the individualcontributions to pressure loss (e.g., ξCY = ξin + ξbody + ξvortex + ξout) [170,175]. Chen andShi [175] proposed Equation (25) for ξCY for dust-laden flows:
ξCY = (1 +Ciρg
)(1−
2ki∼b
1 + 1.33∼b −
∼dr
2
+ 1.11 f KA∼Fs∼Vθw
∼d−1.5n
r +
∼V
2
θw(∼r c∼dr
)n +1
K2A
(∼d
2
r −∼r
2c
)2 (25)
where the (∼) indicates a nondimensional variable. Ci is the inlet solid loading (kg of inletsolid/m3 of inlet gas), ki is a correction coefficient of expansion loss (≈ 0.3) [162], f is thefriction coefficient (≈ 0.005 for steel cyclones) [162] and KA is the inlet area ratio (= πD2
4ab ;for D cyclone barrel diameter and a, b for cyclone inlet width and height). Non-dimensional
variables are such that∼b is dimensional width (= b
D ),∼Fs dimensionless contact area,
∼r c
is the dimensionless radius of core flow (= rcR ),
∼dr is the dimensionless cyclone outlet
diameter (= deD ) and
∼Vθw is the dimensionless tangential velocity at radius R (= Vθw
Ug). Chen
and Shi [175] correlated∼r c with
∼dr in Equation (26):
∼r c = 0.38
∼dr + 0.5
∼d
2
r (26)
Energies 2022, 15, 388 31 of 38
Additionally, the dimensionless tangential velocity at the cyclone wall is given byEquation (27) [162]:
∼Vθw =
1.11K−0.21A
∼d
0.16
r Re0.06
1 + f∼Fs
√KA∼dr
(27)
For
Re =ρgUgD
µgKA∼dr
(28)
Note that different workers in the literature and no doubt in the industry have devel-
oped alternative equations for ξCY and∼Vθw. Therefore, the choice of expression must be
based on their ranges of applicability, especially in terms of solid loading, which has a greatimpact on the pressure drop of a cyclone.
3.2. Catalyst Transport Lines
The transport lines carry catalysts between the reactor and the regenerator systems.The catalyst circulation rate within the transport lines is controlled by a slide valve thatshould be attached to the line [10,18]. In terms of the dynamics of both units, the circulationrate with the transport lines affects the holdup of catalyst in the regenerator and thedisengaging–stripper section of the reactor; hence, it affects the coupling of the two systems.This coupling makes the catalyst transport line and associated valves important features forany model of the FCC unit. By taking the pressure across the slide valve into account, theflow rate of catalyst through the transport line can be calculated from Equation (29) [10,18]:
FcV = kv fv(xv)√
∆P (29)
where FcV is the catalyst flow rate through the valve, kv is the valve flow rating factorand fv(xv) is the valve flow characteristic function. ∆P is the pressure drop across thevalve, which depends on the direction of catalyst flow; for example, for the spent catalysttransport line, the ∆P is the pressure difference between the bottom of the stripper andthe regenerator dense bed. In this example, FcV is catalyst flow rate out of the stripperand the catalyst flow rate into the dense bed. Because the catalyst residence time insidethe transport lines is in the order of a few seconds, its influence on the regenerator, andtherefore the whole FCC unit, is small so that the transport lag may be ignored [10,135].This assumption therefore leads to negligible energy loss through the transport line so thatcatalyst retains the temperature of the vessel it is leaving so that no further energy balanceis required. However, some workers have explicitly described the valve characteristics intheir model but instead provided catalyst circulation rate as a specification based on plantdata [19]. In such cases, models are unsuitable to use to study the effects of changes inflow conditions on the unit dynamics because the coupling of the pressure drop across thevessels and valve characteristics with the rest of the unit has been removed, which couldlead to inaccurate predictions. Nevertheless, such studies presented useful results in termsof conversions in both reactor systems.
4. Conclusions
Overall, modelling of the FCC unit using traditional reaction engineering approacheshas certainly come a long way. The kinetics of the regenerator is now well understood, withmodels published able to predict the emissions of carbon monoxide and carbon dioxidethat are produced during the combustion reactions. Additionally, analytical technologyhad come a long way since the early 1960s when FCC modelling first began, with toolsnow able to characterise coke at the elemental level. This means researchers are now ableto incorporate elements such as sulphur and nitrogen into their kinetic models to predictgreenhouse gas emissions such as SOx and NOx that are also directly produced during thecombustion reactions in the regenerator. Due to the current global action against climate,
Energies 2022, 15, 388 32 of 38
we recommend that future models make necessary changes to incorporate the combustionof sulphur and nitrogenous compounds, which are also present in the coke. In terms ofhydrodynamics, both the fluidised bed reactor vessels of the FCC unit have significant flowheterogeneity during their normal operation. In the regenerator, the heterogeneity arisesfrom bubbles rising through the emulsion, whereas in the riser clusters of catalyst particlesare observed in the suspension. This heterogeneity is important to the conversion in bothvessels and has been modelled to varying degrees by researchers. More recently, the studyof such flow patterns is being conducted via CFD, providing detail that is seldom capturedexperimentally or via traditional modelling simulations.
Author Contributions: Conceptualization, T.W.S., R.P., I.M.M. and Y.M.J.; methodology, T.W.S.and Y.M.J.; software, T.W.S.; validation, T.W.S. and Y.M.J.; formal analysis, T.W.S., R.P., I.M.M.,Y.M.J.; investi-gation, T.W.S. and Y.M.J.; resources, T.W.S., R.P., I.M.M., Y.M.J.; data curation, T.W.S.;writing—original draft preparation, T.W.S.; writing—review and editing, T.W.S., R.P., I.M.M., Y.M.J.;visualization, T.W.S.; supervision, R.P., I.M.M., Y.M.J. All authors have read and agreed to thepublished version of the manuscript.
Funding: This research received no external funding.
Institutional Review Board Statement: Not applicable.
Informed Consent Statement: Not applicable.
Acknowledgments: The main author (T.W.S.) would like to acknowledge the Government ofBotswana for funding his Ph.D. research studies.
Conflicts of Interest: There is no conflict of interest regarding the publication of this research.
Nomenclature
Symbol Description UnitsC Molar concentration kmolm−3
D Dispersion coefficient m2.s−1
dp Particle diameter mdcm Smallest particle diameter separated by cyclone mF Mass flow rate kg.s−1
g Acceleration due to gravity ms−2
hHeight of jet penetration through the bedEnthalpy of the phase
mkJ.kg−1
kDeviation coefficient from ideal two-phase flowReaction rate constant
(−)varied
K Interphase mass transfer coefficient ms−1
nReaction orderMolar ratio of hydrogen to Carbon in coke
(−)(−)
NMolar fluxNumber of cyclones
kmol.m−2s−1(−)
NCYt Number of 360◦ turns made spirally down a cyclone (−)P Pressure kPar Reaction rate kmolm−3s−1kPa.s−1
RComponent reaction rateIdeal gas constant
kmol.m−3.s−1kJ.kmol−1.K−1
Re Reynolds number (−)S Energy source term kJ.s−1
T Temperature KUb Bubble rise velocity m.s−1
Uc Gas circulation velocity inside rising bubbles m.s−1
Umb Minimum bubbling velocity m.s−1
Um f Minimum fluidisation velocity m.s−1
Ut Terminal velocity of particles in the bed m.s−1
V Volume m3
Energies 2022, 15, 388 33 of 38
w Mass of holdup in reactor or cyclone kgx Mole fraction (−)Y Deviation coefficient from ideal two-phase flow (−)Greek letters and other symbolsε Volume fraction (−)α Exponent of velocity distribution in a cyclone vortex (−)β Molar ratio of CO to CO2 (−)ρ Density kg.m−3
δ Ratio of particle radius to radius of the cyclone (−)η Cyclone separation efficiency (−)ξ Cyclone Pressure drop parameter (−)∼Vθw Dimensionless tangential velocity at cyclone wall (−)∆Q Heat of reaction kJ.s−1
∆P Pressure drop kPa∆H Enthalpy change of reaction kJ.kmol−1
Subscriptse Emulsionb Bubble phasebe Bubble to emulsioneb Emulsion to bubbleCO Carbon monoxideC CokeCO2 Carbon dioxideH2O Water vaporc Catalystg Gas
References1. Arbel, A.; Huang, Z.; Rinard, I.H.; Shinnar, R.; Sapre, A.V. Dynamic and Control of Fluidized Catalytic Crackers. 1. Modeling of
the Current Generation of FCC’s. Ind. Eng. Chem. Res. 1995, 34, 1228–1243. [CrossRef]2. Sadeghbeigi, R. Fluid Catalytic Cracking Handbook: An Expert Guide to the Practical Operation, Design, and Optimization of FCC Units;
Butterworth-Heinemann: Oxford, UK, 2012. [CrossRef]3. Kim, S.W.; Kim, S.D. Void properties in dense bed of cold-flow fluid catalytic cracking regenerator. Processes 2018, 6, 80. [CrossRef]4. Wetherald, R.T.; Manabe, S. Sensitivity Studies of Climate Involving Changes in Co2 Concentration. Dev. Atmos. Sci. 1979, 10,
57–64. [CrossRef]5. UNFCCC. Paris Agreement. Int. Leg. Mater. 2016, 55, 740–755. [CrossRef]6. UNFCCC. National Inventory Submissions 2020|UNFCCC n.d. Available online: https://unfccc.int/ghg-inventories-annex-i-
parties/2020 (accessed on 28 June 2021).7. UNFCCC. Kyoto Protocol to the United Nations Framework Convention on Climate Change. Am. J. Int. Law 1998, 92, 315–331.
[CrossRef]8. Berruti, F.; Pugsley, T.S.; Godfroy, L.; Chaouki, J.; Patience, G.S. Hydrodynamics of circulating fluidized bed risers: A review. Can.
J. Chem. Eng. 1995, 73, 579–602. [CrossRef]9. Grace, J.R.; Avidan, A.A.; Knowlton, T.M. Circulating Fluidized Beds; Blackie Academic & Professional: London, UK, 1997.10. Han, I.S.; Chung, C.B. Dynamic modeling and simulation of a fluidized catalytic cracking process. Part I: Process modeling. Chem.
Eng. Sci. 2001, 56, 1951–1971. [CrossRef]11. Kunii, D.; Levenspiel, O. Fluidization Engineering; Butterworth-Heinemann: Oxford, UK, 1991.12. Shah, M.; Utikar, R.; Pareek, V.; Evans, G.; Joshi, J. Computational fluid dynamic modelling of FCC riser: A review. Chem. Eng.
Res. Des. 2016, 1, 403–448. [CrossRef]13. Toomey, R.D.; Johnstone, H.F. Gas Fluidization of Solid Particles. Chem. Eng. Prog. Vol. 1952, 48, 220–226.14. Kunii, D.; Levenspiel, O. Fluidization Engineering; John Wiley and Sons: New York, NY, USA, 1969.15. Kunii, D.; Levenspiel, O. Bubbling bed model: Model for the Flow of Gas through a Fluidized Bed. Ind. Eng. Chem. Fundam. 1968,
7, 446–452. [CrossRef]16. Stephens, G.K.; Sinclair, R.J.; Potter, O.E. Gas exchange between bubbles and dense phase in a fluidised bed. Powder Technol. 1967,
1, 157–166. [CrossRef]17. Kato, K.; Wen, C.Y. Bubble assemblage model for fluidized bed catalytic reactors. Chem. Eng. Sci. 1969, 24, 1351–1369. [CrossRef]18. Han, I.S.; Chung, C.B. Dynamic modeling and simulation of a fluidized catalytic cracking process. Part II: Property estimation
and simulation. Chem. Eng. Sci. 2001, 56, 1973–1990. [CrossRef]
Energies 2022, 15, 388 34 of 38
19. Ali, H.; Rohani, S.; Corriou, J.P. Modelling and control of a riser type fluid catalytic cracking (FCC) unit. Chem. Eng. Res. Des.1997, 75, 401–412. [CrossRef]
20. Yakubu, J.M.; Patel, R.; Mujtaba, I.M. Optimization of fluidized catalytic cracking unit regenerator to minimize CO2 emissions.Chem. Eng. Trans. 2017, 57, 1531–1536. [CrossRef]
21. Arthur, J.R. Reactions between Carbon and Oxygen. Trans. Faraday Soc. 1951, 47, 164–178. [CrossRef]22. Weisz, P.B. Corn bustion of Carbonaceous Deposits within Porous Catalyst Particles III. The CO2CO Product Ratio. J. Catal. 1966,
6, 425–430. [CrossRef]23. Weisz, P.B.; Goodwin, R.B. Combustion of Carbonaceous Deposits within Porous Catalyst Particles II. Intrinsic Burning Rate. J.
Catal. 1966, 6, 227–236. [CrossRef]24. Weisz, P.B.; Goodwin, I.D. Combustion of Carbonaceous Deposits within Porous Catalyst Particles I. Diffusion-Controlled
Kinetics. J. Catal. 1963, 2, 397–404. [CrossRef]25. Tone, S.; Miura, S.-I.; Otake, T. Kinetics of Oxidation of Coke on Silica-Alumina Catalysts. Bull. Jpn. Pet. Inst. 1972, 14, 76–82.
[CrossRef]26. Hano, T.; Nakashio, F.; Kusunoki, K. The burning rate of coke deposited on zeolite catalyst. J. Chem. Eng. Jpn. 1975, 8, 127–130.
[CrossRef]27. Wang, G.X.; Lin, S.X.; Mo, W.J.; Peng, C.L.; Yang, G.H. Kinetics of Combustion of Carbon and Hydrogen in Carbonaceous
Deposits on Zeolite-Type Cracking Catalysts. Ind. Eng. Chem. Process Des. Dev. 1986, 25, 626–630. [CrossRef]28. Arandes, J.M.; Abajo, I.; Fernández, I.; López, D.; Bilbao, J. Kinetics of gaseous product formation in the coke combustion of a
fluidized catalytic cracking catalyst. Ind. Eng. Chem. Res. 1999, 38, 3255–3260. [CrossRef]29. Amblard, B.; Singh, R.; Gbordzoe, E.; Raynal, L. CFD modeling of the coke combustion in an industrial FCC regenerator. Chem.
Eng. Sci. 2017, 170, 731–742. [CrossRef]30. Hosseini, S.H.; Rahimi, R.; Zivdar, M.; Samimi, A. CFD simulation of gas-solid bubbling fluidized bed containing FCC particles.
Korean J. Chem. Eng. 2009, 26, 1405–1413. [CrossRef]31. Azarnivand, A.; Behjat, Y.; Safekordi, A.A. CFD simulation of gas-solid flow patterns in a downscaled combustor-style FCC
regenerator. Particuology 2018, 39, 96–108. [CrossRef]32. Lee, L.S.; Yu, S.W.; Cheng, C.T.; Pan, W.Y. Fluidized-bed catalyst cracking regenerator modelling and analysis. Chem. Eng. J. 1989,
40, 71–82. [CrossRef]33. Qian, K.; Tomczak, D.C.; Rakiewicz, E.F.; Harding, R.H.; Yaluris, G.; Cheng, W.C.; Zhao, X.; Peters, A.W. Coke formation in the
fluid catalytic cracking process by combined analytical techniques. Energy Fuels 1997, 11, 596–600. [CrossRef]34. Luan, H.; Lin, J.; Xiu, G.; Ju, F.; Ling, H. Study on compositions of FCC flue gas and pollutant precursors from FCC catalysts.
Chemosphere 2020, 245, 125528. [CrossRef]35. Ibarra, Á.; Veloso, A.; Bilbao, J.; Arandes, J.M.; Castaño, P. Dual coke deactivation pathways during the catalytic cracking of raw
bio-oil and vacuum gasoil in FCC conditions. Appl. Catal. B Environ. 2016, 182, 336–346. [CrossRef]36. Elshishini, S.S.; Elnashaie, S.S.E.H. Digital simulation of industrial fluid catalytic cracking units: Bifurcation and its implications.
Chem. Eng. Sci. 1990, 45, 553–559. [CrossRef]37. Bai, D.; Zhu, J.X.; Jin, Y.; Yu, Z. Simulation of FCC catalyst regeneration in a riser regenerator. Chem. Eng. J. 1998, 71, 97–109.
[CrossRef]38. Bayraktar, O.; Kugler, E.L. Coke content of spent commercial fluid catalytic cracking (FCC) catalysts: Determination by
temperature-programmed oxidation. J. Therm. Anal. Calorim. 2003, 71, 867–874. [CrossRef]39. Hashimoto, K.; Takatani, K.; Iwasa, H.; Masuda, T. A multiple-reaction model for burning regeneration of coked catalysts. Chem.
Eng. J. 1983, 27, 177–186. [CrossRef]40. Dimitriadis, V.D.; Lappas, A.A.; Vasalos, I.A. Kinetics of combustion of carbon in carbonaceous deposits on zeolite catalysts
for fluid catalytic cracking units (FCCU). Comparison between Pt and non Pt-containing catalysts. Fuel 1998, 77, 1377–1383.[CrossRef]
41. Morley, K.; De, L. On the Determination of Regeneration of Kinetic Parameters for the Craclung Catalyst. Can. J. Chem. Eng. 1987,65, 773–777. [CrossRef]
42. Howard, J.B.; Williams, G.C.; Fine, D.H. Kinetics of Carbon Monoxide Oxidation in Postflame Gases. In Symposium (International)on Combustion; Elsevier: Amsterdam, The Netherlands, 1973.
43. Li, C.; Brown, T.C. Carbon oxidation kinetics from evolved carbon oxide analysis during temperature-programmed oxidation.Carbon 2001, 39, 725–732. [CrossRef]
44. Kanervo, J.M.; Krause, A.O.I.; Aittamaa, J.R.; Hagelberg, P.H.; Lipiäinen, K.J.T.; Eilos, I.H.; Hiltunen, J.S.; Niemi, V.M. Kinetics ofthe regeneration of a cracking catalyst derived from TPO measurements. Chem. Eng. Sci. 2001, 56, 1221–1227. [CrossRef]
45. Williams, G.C.; Hottel, H.C.; Morgan, A.C. The Combustion of Methane in a Jet-Mixed Reactor. In Symposium (International) onCombustion; Elsevier: Amsterdam, The Netherlands, 1969; Volume 12, pp. 913–925. [CrossRef]
46. Schneider, G.R. Kinetics of Propane Combustion in a Well Stirred Reactor. Ph.D. Thesis, Massachusetts Institute of Technology,Department of Nuclear Engineering, Cambridge, MA, USA, 1961.
47. Friedman, R.; Cyphers, J.A. Flame structure studies. III. Gas sampling in a low-pressure propane-air flame. J. Chem. Phys. 1955,23, 1875–1880. [CrossRef]

Energies 2022, 15, 388 35 of 38
48. Singh, T.; Sawyer, R.F. CO Reactions in the Afterflame Region of Ethylene/Oxygen and Ethane/Oxygen Flames. In Symposium(International) on Combustion; Elsevier: Amsterdam, The Netherlands, 1971; Volume 13, pp. 403–416. [CrossRef]
49. Sobolev, G.K. High-Temperature Oxidation and Burning of Carbon Monoxide. In Symposium (International) on Combustion;Elsevier: Amsterdam, The Netherlands, 1958; Volume 7, pp. 386–391. [CrossRef]
50. Ghazal, F.P.H. Kinetics of Carbon Monoxide Oxidation in Combustion Products. Ph.D. Thesis, Massachusetts Institute ofTechnology, Cambridge, MA, USA, 1971.
51. Morley, K.; de Lasa, H.I. Regeneration of cracking catalyst influence of the homogeneous CO postcombustion reaction. Can. J.Chem. Eng. 1988, 66, 428–432. [CrossRef]
52. Ahmed, S.; Back, M.H. The role of the surface complex in the kinetics of the reaction of oxygen with carbon. Carbon 1985, 23,513–524. [CrossRef]
53. Tucker, B.G.; Mulcahy, M.F.R. Formation and decomposition of surface oxide in carbon combustion. Trans. Faraday Soc. 1969, 65,274–286. [CrossRef]
54. Geldart, D. Types of gas fluidization. Powder Technol. 1973, 7, 285–292. [CrossRef]55. Baeyens, J.; Geldart, D. Predictive Calculations of Flow Parameters in Gas Fluidized Beds and Fluidization Behaviour of Various
Powders. In Proceedings the International Symposium Fluidization and Its Applications; Cepadues Edition: Toulouse, France, 1973;p. 263.
56. Yates, J.G. Fundamentals of Fluidized-Bed Chemical Processes: Butterworths Monographs in Chemical Engineering; Butterworth-Heinemann: Oxford, UK, 1983.
57. Kumar, A.; sen Gupta, P. Prediction of minimum fluidization velocity for multicomponent mixtures. Indian J. Technol. 1974, 12,225–227.
58. Mawatari, Y.; Tatemoto, Y.; Noda, K. Prediction of minimum fluidization velocity for vibrated fluidized bed. Powder Technol. 2003,131, 66–70. [CrossRef]
59. Rowe, P.N.; Nienow, A.W. Minimum fluidisation velocity of multi-component particle mixtures. Chem. Eng. Sci. 1975, 30,1365–1369. [CrossRef]
60. Asif, M. Predicting minimum fluidization velocities of multi-component solid mixtures. Particuology 2013, 11, 309–316. [CrossRef]61. Delebarre, A. Revisiting the Wen and Yu equations for minimum fluidization velocity prediction. Chem. Eng. Res. Des. 2004, 82,
587–590. [CrossRef]62. Amarasinghe, W.S.; Jayarathna, C.K.; Ahangama, B.S.; Tokheim, L.A.; Moldestad, B.M.E. Experimental Study and CFD Modelling
of Minimum Fluidization Velocity for Geldart A, B and D Particles. Int. J. Model. Optim. 2017, 7, 152–156. [CrossRef]63. Zhang, X.; Zhou, Y.; Zhu, J. Enhanced fluidization of group A particles modulated by group C powder. Powder Technol. 2021, 377,
684–692. [CrossRef]64. Lee, J.R.; Lee, K.S.; Hasolli, N.; Park, Y.O.; Lee, K.Y.; Kim, Y.H. Fluidization and mixing behaviors of Geldart groups A, B and C
particles assisted by vertical vibration in fluidized bed. Chem. Eng. Process. Process Intensif. 2020, 149, 107856. [CrossRef]65. Frank, D.J.; Roland, C.; David, H. Fluidization, 2nd ed.; Academic Press Inc.: Cambridge, MA, USA, 1985.66. Anantharaman, A.; Cocco, R.A.; Chew, J.W. Evaluation of correlations for minimum fluidization velocity (Umf) in gas-solid
fluidization. Powder Technol. 2018, 323, 454–485. [CrossRef]67. Shaul, S.; Rabinovich, E.; Kalman, H. Generalized flow regime diagram of fluidized beds based on the height to bed diameter
ratio. Powder Technol. 2012, 228, 264–271. [CrossRef]68. Shaul, S.; Rabinovich, E.; Kalman, H. Typical fluidization characteristics for Geldart’s classification groups. Part. Sci. Technol.
2014, 32, 197–205. [CrossRef]69. Kong, W.; Tan, T.; Baeyens, J.; Flamant, G.; Zhang, H. Bubbling and Slugging of Geldart Group A Powders in Small Diameter
Columns. Ind. Eng. Chem. Res. 2017, 56, 4136–4144. [CrossRef]70. Abrahamsen, A.R.; Geldart, D. Behaviour of gas-fluidized beds of fine powders part I. Homogeneous expansion. Powder Technol.
1980, 26, 35–46. [CrossRef]71. Rowe, P.N.; Yacono, C.X.R. The bubbling behaviour of fine powders when fluidised. Chem. Eng. Sci. 1976, 31, 1179–1192.
[CrossRef]72. Rowe, P.N.; Partridge, B.A. X-ray study of bubbles in fluidized beds. Process Saf. Environ. Prot. Trans. Inst. Chem. Eng. Part B 1965,
43, 157–175.73. Rowe, P.N.; Partridge, B.A. An X-ray study of bubbles in fluidised beds. Chem. Eng. Res. Des. 1997, 75, S116–S134. [CrossRef]74. Rowe, P.N.; Everett, D.J. Fluidised bed bubbles viewed by X-rays. Part I: Experimental details and the interaction of bubbles with
solid surfaces. Trans. Inst. Chem. Eng. 1972, 50, 42–48.75. Yacono, C.X.R. An X-Ray Study of Bubbles in Gas-Fluidised Beds of Small Particles. Ph.D. Thesis, University College London,
London, UK, 1975.76. Rowe, P.N. A note on the motion of a bubble rising through a fluidized bed. Chem. Eng. Sci. 1964, 19, 75–77. [CrossRef]77. Rowe, P.N. Prediction of bubble size in a gas fluidised bed. Chem. Eng. Sci. 1976, 31, 285–288. [CrossRef]78. Yang, W. Handbook of Fluidization and Fluid-Particle Systems; CRC Press: New York, NY, USA, 2003.79. Whitehead, A.B.; Gartside, G.; Dent, D.C. Fluidization studies in large gas-solid systems. Part III. The effect of bed depth and
fluidizing velocity on solids circulation patterns. Powder Technol. 1976, 14, 61–70. [CrossRef]

Energies 2022, 15, 388 36 of 38
80. Geldart, D. The size and frequency of bubbles in two- and three-dimensional gas-fluidised beds. Powder Technol. 1970, 4, 41–55.[CrossRef]
81. Werther, J. Bubble growth in large diameter fluidized beds. Fluid Technol. 1975, 1, 215.82. Mori, S.; Wen, C.Y. Estimation of bubble diameter in gaseous fluidized beds. AIChE J. 1975, 21, 109–115. [CrossRef]83. Cai, P.; Schiavetti, M.; de Michele, G.; Grazzini, G.C.; Miccio, M. Quantitative estimation of bubble size in PFBC. Powder Technol.
1994, 80, 99–109. [CrossRef]84. Darton, R.C.; Nauze, R.; Harrison, D.; Davidson, J. Bubble Growth due to Coalescence in Fluidised Beds. In Chemical Reactor
Theory; Lapidus, I., Amundson, N.R., Eds.; Prentice-Hall: New York, NY, USA, 1977.85. Horio, M.; Nonaka, A. A generalized bubble diameter correlation for gas-solid fluidized beds. AIChE J. 1987, 33, 1865–1872.
[CrossRef]86. Rowe, P.N. Experimental Properties of Bubbles. Fluidization; Academic Press: New York, NY, USA, 1971; p. 121.87. Harrison, D.; Davidson, J.F.; de Kock, J.W. Bubble growth theory in fluidized beds. Chem. Eng. Sci. 1961, 39, 202.88. Davidson, J.F.; Harrison, D. Fluidized Particles; Cambridge University Press: Cambridge, NY, USA, 1963.89. Upson, P.C.; Pyle, D.L. The Stability of Bubbles in Fluidized Beds. In Fluidization and its Applications: Proceedings of the International
Symposium; Cepadues Edition: Toulouse, France, 1973; pp. 207–222.90. Clift, R.; Grace, J.R.; Weber, M.E. Stability of Bubbles in Fluidized Beds. Ind. Eng. Chem. Fundam. 1974, 13, 45–51. [CrossRef]91. Rice, W.J.; Wilhelm, R.H. Surface dynamics of fluidized beds and quality of fluidization. AIChE J. 1958, 4, 423–429. [CrossRef]92. Karimipour, S.; Pugsley, T. A critical evaluation of literature correlations for predicting bubble size and velocity in gas–solid
fluidized beds. Powder Technol. 2011, 205, 1–14. [CrossRef]93. Davies, R.M.; Taylor, G.I. The mechanics of large bubbles rising through extended liquids and through liquids in tubes. Proc. R.
Soc. Lond. Ser. A Math. Phys. Sci. 1950, 200, 375–390. [CrossRef]94. Sit, S.P.; Grace, J.R. Effect of bubble interaction on interphase mass transfer in gas fluidized beds. Chem. Eng. Sci. 1981, 36, 327–335.
[CrossRef]95. Chiba, T.; Kobayashi, H. Solid exchange between the bubble wake and the emulsion phase in a gas-fluidised bed. J. Chem. Eng.
Jpn. 1977, 10, 206–210. [CrossRef]96. Pyle, D.L.; Harrison, D. An experimental investigation of the two-phase theory of fluidization. Chem. Eng. Sci. 1967, 22, 1199–1207.
[CrossRef]97. Pyle, D.L.; Harrison, D. The rising velocity of bubbles in two-dimensional fluidised beds. Chem. Eng. Sci. 1967, 22, 531–535.
[CrossRef]98. Marsheck, R.M.; Gomezplata, A. Particle flow patterns in a fluidized bed. AIChE J. 1965, 11, 167–173. [CrossRef]99. Gabor, J.D. On the mechanics of fluidized particle movement. Chem. Eng. J. 1972, 4, 118–126. [CrossRef]100. Stein, M.; Ding, Y.L.; Seville, J.P.K.; Parker, D.J. Solids motion in bubbling gas fluidized beds. Chem. Eng. Sci. 2000, 55, 5291–5300.
[CrossRef]101. Mostoufi, N.; Chaouki, J. Local solid mixing in gas–solid fluidized beds. Powder Technol. 2001, 114, 23–31. [CrossRef]102. Shabanian, J.; Chaouki, J. Influence of interparticle forces on solids motion in a bubbling gas-solid fluidized bed. Powder Technol.
2016, 299, 98–106. [CrossRef]103. Werther, J.; Molerus, O. The local structure of gas fluidized beds -II. The spatial distribution of bubbles. Int. J. Multiph. Flow 1973,
1, 123–138. [CrossRef]104. Callcott, T.G.; Rigby, G.R.; Singh, B. Experiences in the handling of particulate materials. BHP Tech. Bull. 1975, 19, 20.105. Gabor, J.D. Lateral solids mixing in fludized-packed beds. AIChE J. 1964, 10, 345–350. [CrossRef]106. Hirama, T.; Ishida, M.; Shirai, T. The Lateral Dispersion of Solid Particles in Fluidized Beds. Kagaku Kogaku Ronbunshu 1975, 1,
272–276. [CrossRef]107. Mori, Y.; Nakamura, K. Solid Mixing in Fluidised Bed. Chem. Eng. 1965, 29, 868–875. [CrossRef]108. Fan, L.T.; Shl, Y.F. Lateral Mixing of Solids in Batch Gas-Solids Fluidized Beds. Ind. Eng. Chem. Process Des. Dev. 1984, 23, 337–341.
[CrossRef]109. Merry, J. Gulf stream circulation in shallow fluidized beds. Trans. Inst. Chem. Eng. 1973, 51, 361–368.110. Grace, J.R. Processes. In AIChE Symposium Series; McGill Univ.: Montreal, QC, Canada, 1974.111. Harris, B.J. Modeling options for circulating fluidized beds: A core/annulus deposition model. Circ. Fluid. Bed Technol. 1994,
32–39.112. Grace, J.R.; Clift, R. On the two-phase theory of fluidization. Chem. Eng. Sci. 1974, 29, 327–334. [CrossRef]113. Rowe, P.N. A model for chemical reaction in the entry region of a gas fluidised-bed reactor. Chem. Eng. Sci. 1993, 48, 2519–2524.
[CrossRef]114. Sane, S.U.; Haynes, H.W.; Agarwal, P.K. An experimental and modelling investigation of gas mixing in bubbling fluidized beds.
Chem. Eng. Sci. 1996, 51, 1133–1147. [CrossRef]115. Rowe, P.N. Two-Phase Theory and Fluidized Bed Reactor Models; ACS Symposium Series; ACS: Houston, TX, USA, 1978; Volume 65,
pp. 436–446. [CrossRef]116. Darton, R. A Bubble growth theory of fluidised bed reactors. Trans. Inst. Chem. Eng. 1979, 57, 134–138.117. Behie, L.A.; Kehoe, P. The grid region in a fluidized bed reactor. AIChE J. 1973, 19, 1070–1072. [CrossRef]
Energies 2022, 15, 388 37 of 38
118. Markhevka, V.I.; Basov, V.A.; Melik-Akhnazarov, T.K.; Orochko, D.I. The flow of a gas jet into a fluidized bed. Theor. Found. Chem.Eng. 1971, 5, 80.
119. Kececioglu, I.; Yang, W.-C.; Keairns, D.L. Fate of solids fed pneumatically through a jet into a fluidized bed. AIChE J. 1984, 30,99–110. [CrossRef]
120. Rowe, P.N.; MacGillivray, H.J.; Cheesman, D. Gas discharge from an orifice into a gas fluidised bed. Trans. Inst. Chem. Eng. 1979,57, 194–199.
121. Kozin, V.E.; Baskakov, A.P. A study of the grating region of fluidized bed above bubble-cap-type gas-distributors. Chem. Technol.Fuels Oils 1967, 3, 544–547. [CrossRef]
122. Baerns, M.; Fetting, F. Quenching of a Hot Gas Stream in a Gas Fluidized Bed. Chem. Eng. Sci. 1964, 20, 273–280. [CrossRef]123. Merry, J.M.D. Fluid and particle entrainment into vertical jets in fluidized beds. AIChE J. 1976, 22, 315–323. [CrossRef]124. Merry, J.M.D. Penetration of vertical jets into fluidized beds. AIChE J. 1975, 21, 507–510. [CrossRef]125. Kunii, D.; Levenspiel, O.; Levenspiel, O. Fluidized Reactor Models. 1. For Bubbling Beds of Fine, Intermediate, and Large
Particles. 2. For the Lean Phase: Freeboard and Fast Fluidization. Ind. Eng. Chem. Res. 1990, 29, 1226–1234. [CrossRef]126. Levenspiel, O.; Kunii, D.; Fitzgerald, T. The processing of solids of changing size in bubbling fluidized beds. Powder Technol. 1968,
2, 87–96. [CrossRef]127. Cooke, M.J.; Harris, W.; Highley, J.; Williams, D.F. Kinetics of oxygen consumption in fluidized bed carbonizers. Tripart. Chem.
Eng. Conf. Symp. Fluid. I 1968, 30, 14–20.128. Kumar, S.; Chadha, A.; Gupta, R.; Sharma, R. CATCRAK: A Process Simulator for an Integrated FCC-Regenerator System. Ind.
Eng. Chem. Res. 1995, 34, 3737–3748. [CrossRef]129. de Lasa, H.I.; Errazu, A.; Barreiro, E.; Solioz, S. Analysis of fluidized bed catalytic cracking regenerator models in an industrial
scale unit. Can. J. Chem. Eng. 1981, 59, 549–553. [CrossRef]130. Errazu, A.F.; de Lasa, H.I.; Sarti, F. Fluidized bed catalytic cracking regenerator model: Grid effects. Can. J. Chem. Eng. 1979, 57, 2.131. Filho, R.M.; Batista, L.M.F.L.; Fusco, M. A fast fluidized bed reactor for industrial FCC regenerator. Chem. Eng. Sci. 1996, 51,
1807–1816. [CrossRef]132. Faltsi-Saravelou, O.; Vasalos, I.A.; Dimogiorgas, G. FBSim: A model for fluidized bed simulation-II. Simulation of an industrial
fluidized catalytic cracking regenerator. Comput. Chem. Eng. 1991, 15, 647–656. [CrossRef]133. Krishna, A.S.; Parkin, E.S. Modeling the regenerator in commercial fluid catalytic cracking units. Chem. Eng. Prog. 1985, 81, 55–62.134. Penteado, J.C.; Rossi, L.F.; Negrão, C.O. Numerical Modelling of a FCC Regenerator. In Proceedings of the 17th International
Congress of Mechanical Engineering (COBEM), Sao Paulo, Brazil, 10–14 November 2003.135. Fernandes, J.L.; Verstraete, J.J.; Pinheiro, C.I.C.; Oliveira, N.M.C.; Ramôa Ribeiro, F. Dynamic modelling of an industrial R2R FCC
unit. Chem. Eng. Sci. 2007, 62, 1184–1198. [CrossRef]136. Daly, C.; Tidjani, N.; Martin, G.; Roesler, J. Détermination des Paramétres Cinétiques dans la Régénération des Catalyseurs de FCC;
Technical Report No. 56010; Institut Français du Pétrole (IFP): Paris, France, 2001.137. Zwinkels, M. FCC Regenerator Simulation Model. Ph.D. Thesis, Institute Francais du Pétrole (IFP), Paris, France, 1997.138. Shaikh, A.A.; Al-Mutairi, E.M.; Ino, T. Modeling and simulation of a downer-type HS-FCC unit. Ind. Eng. Chem. Res. 2008, 47,
9018–9024. [CrossRef]139. Dasila, P.K.; Choudhury, I.; Saraf, D.; Chopra, S.; Dalai, A. Parametric Sensitivity Studies in a Commercial FCC Unit. Adv. Chem.
Eng. Sci. 2012, 2, 136–149. [CrossRef]140. Kim, S.; Urm, J.; Kim, D.S.; Lee, K.; Lee, J.M. Modeling, simulation and structural analysis of a fluid catalytic cracking (FCC)
process. Korean J. Chem. Eng. 2018, 35, 2327–2335. [CrossRef]141. Grace, J.R. Fluidized Bed Reactor Modeling; ACS Symposium Series; ACS: Washington, DC, USA, 1981; Volume 22, pp. 3–18.
[CrossRef]142. Levenspiel, O. Difficulties in trying to model and scale-up the Bubbling Fluidized Bed (BFB) reactor. Ind. Eng. Chem. Res. 2008, 47,
273–277. [CrossRef]143. Faltsi-Saravelou, O.; Vasalos, I.A. FBSim: A model for fluidized bed simulation-I. Dynamic modeling of an adiabatic reacting
system of small gas fluidized particles. Comput. Chem. Eng. 1991, 15, 639–646. [CrossRef]144. Singh, R.; Gbordzoe, E. Modeling FCC spent catalyst regeneration with computational fluid dynamics. Powder Technol. 2017, 316,
560–568. [CrossRef]145. de Lasa, H.I.; Grace, J.R. The influence of the freeboard region in a fluidized bed catalytic cracking regenerator. AIChE J. 1979, 25,
984–991. [CrossRef]146. Cao, B.; Zhang, P.; Zheng, X.; Xu, C.; Gao, J. Numerical simulation of hydrodynamics and coke combustions in FCC regenerator.
Pet. Sci. Technol. 2008, 26, 256–269. [CrossRef]147. Wu, C.; Cheng, Y.; Ding, Y.; Jin, Y. CFD-DEM simulation of gas-solid reacting flows in fluid catalytic cracking (FCC) process.
Chem. Eng. Sci. 2010, 65, 542–549. [CrossRef]148. Latham, R.; Potter, O.E. Back-mixing of gas in a 6-in diameter fluidised bed. Chem. Eng. J. 1970, 1, 152–162. [CrossRef]149. Rowe, P.N.; Partridge, B.A.; Cheney, A.G.; Henwood, G.A.; Lyall, E. Mechanisms of solids mixing in fluidised beds. Trans. Inst.
Chem. Eng. Chem. Eng. 1965, 43, T271.150. Liu, D.; Chen, X. Lateral solids dispersion coefficient in large-scale fluidized beds. Combust. Flame 2010, 157, 2116–2124. [CrossRef]
Energies 2022, 15, 388 38 of 38
151. Olsson, J.; Pallarès, D.; Johnsson, F. Lateral fuel dispersion in a large-scale bubbling fluidized bed. Chem. Eng. Sci. 2012, 74,148–159. [CrossRef]
152. Fan, L.T.; Song, J.C.; Yutani, N. Radial particle mixing in gas-solids fluidized beds. Chem. Eng. Sci. 1986, 41, 117–122. [CrossRef]153. IPCC. Climate Change and Land an IPCC Special Report on Climate Change, Desertification, Land Degradation, Sustainable Land
Management, Food Security, and Greenhouse Gas Fluxes in Terrestrial Ecosystems; IPCC: Geneva, Switzerland, 2019.154. le Quéré, C.; Andrew, R.M.; Friedlingstein, P.; Sitch, S.; Hauck, J.; Pongratz, J.; Pickers, P.A.; Korsbakken, J.; Peters, G.P.;
Canadell, J.G.; et al. Global Carbon Budget 2018. Earth Syst. Sci. Data 2018, 10, 2141–2194. [CrossRef]155. Scala, F. Fluidized Bed Technologies for Near-Zero Emission Combustion and Gasification; Woodhead Publishing Limited: Cambridge,
UK, 2013.156. Nakhaei, M.; Lu, B.; Tian, Y.; Wang, W.; Dam-Johansen, K.; Wu, H. CFD Modeling of Gas–Solid Cyclone Separators at Ambient
and Elevated Temperatures. Processes 2020, 8, 228. [CrossRef]157. Wang, B.; Xu, D.L.; Chu, K.W.; Yu, A.B. Numerical study of gas–solid flow in a cyclone separator. Appl. Math. Model. 2006, 30,
1326–1342. [CrossRef]158. Hashemi Shahraki, B. The Development and Validation of New Equations for Prediction of the Performance of Tangential
Cyclones. Int. J. Eng. 2003, 16, 109–124.159. Lu, C.-X. FCC riser quick separation system: A review. Pet. Sci. 2016, 13, 776–781. [CrossRef]160. Wei, Q.; Sun, G.; Yang, J. A model for prediction of maximum-efficiency inlet velocity in a gas-solid cyclone separator. Chem. Eng.
Sci. 2019, 204, 287–297. [CrossRef]161. Chu, K.W.; Wang, B.; Xu, D.L.; Chen, Y.X.; Yu, A.B. CFD–DEM simulation of the gas–solid flow in a cyclone separator. Chem. Eng.
Sci. 2011, 66, 834–847. [CrossRef]162. Masnadi, M.S.; Grace, J.R.; Elyasi, S.; Bi, X. Distribution of multi-phase gas–solid flow across identical parallel cyclones: Modeling
and experimental study. Sep. Purif. Technol. 2010, 72, 48–55. [CrossRef]163. Zhang, R.; Basu, P. A simple model for prediction of solid collection efficiency of a gas–solid separator. Powder Technol. 2004, 147,
86–93. [CrossRef]164. Jiang, Y.; Qiu, G.; Wang, H. Modelling and experimental investigation of the full-loop gas–solid flow in a circulating fluidized bed
with six cyclone separators. Chem. Eng. Sci. 2014, 109, 85–97. [CrossRef]165. Baltrrnas, P.; Vaitiekunas, P.; Jakštonienn, I.; Konoverskytt, S. Study of gas-solid flow in a multichannel cyclone. J. Environ. Eng.
Landsc. Manag. 2012, 20, 129–137. [CrossRef]166. Su, Y.; Mao, Y. Experimental study on the gas–solid suspension flow in a square cyclone separator. Chem. Eng. J. 2006, 121, 51–58.
[CrossRef]167. Lapple, C.E. Gravity and Centrifugal Separation. Am. Ind. Hyg. Assoc. Q. 1950, 11, 40–48. [CrossRef]168. Gimbun, J.; Chuah, T.G.; Choong, T.S.Y.; Fakhru’l-Razi, A. A CFD Study on the Prediction of Cyclone Collection Efficiency. Int. J.
Comput. Methods Eng. Sci. Mech. 2006, 6, 161–168. [CrossRef]169. Dirgo, J.; Leith, D. Aerosol Science and Technology Cyclone Collection Efficiency: Comparison of Experimental Results with
Theoretical Predictions. Exp. Results Theor. Predict. Aerosol Sci. Technol. 2007, 4, 401–415. [CrossRef]170. Cortés, C.; Gil, A. Modeling the gas and particle flow inside cyclone separators. Prog. Energy Combust. Sci. 2007, 33, 409–452.
[CrossRef]171. Morin, M.; Raynal, L.; Karri, S.B.R.; Cocco, R. Effect of solid loading and inlet aspect ratio on cyclone efficiency and pressure drop:
Experimental study and CFD simulations. Powder Technol. 2021, 377, 174–185. [CrossRef]172. Rosin, P.; Rammler, E.; Intelmann, W. Principles and limits of cyclone dust removal. Zeit Ver Dtsch. Ing. 1932, 76, 433–437.173. Maheshwari, F.; Parmar, A. A Review Study on Gas-Solid Cyclone Separator using Lapple Model. J. Res. 2018, 4, 1–5.174. Hoffmann, A.C.; Stein, L.E. Computational Fluid Dynamics. Gas Cyclones and Swirl Tubes, Berlin, Heidelberg; Springer:
Berlin/Heidelberg, Germany, 2002; pp. 123–135. [CrossRef]175. Chen, J.; Shi, M. A universal model to calculate cyclone pressure drop. Powder Technol. 2007, 171, 184–191. [CrossRef]176. Knowlton, T.; Karri, R.S.B. Differences in cyclone operation at low and high solids loading. In Proceedings of the International
Fluidization South Africa Conference, Johannesburg, South Africa, 19–20 November 2008; pp. 119–160.177. Li, S.; Yang, H.; Wu, Y.; Zhang, H. Improved cyclone pressure drop model at high inlet solid concentrations. Chem. Eng. Technol.
2011, 34, 1507–1513. [CrossRef]178. Casal, J.; Martinez-Benet, J.M. A better way to calculate cyclone pressure drop. Chem. Eng. 1983, 90, 99–100.


