Embed Size (px)
Citation preview

A New Dissimilarity Measure for Clustering
Seismic Signals
Francesco Benvegna1, Antonino D’Alessando3, Giosue Lo Bosco1,Dario Luzio2, Luca Pinello1, and Domenico Tegolo1
1 Dipartimento di Matematica e Informaticavia Archirafi 34, 90123 Palermo, Italy
2 Dipartimento di Fisica e Chimica della terraVia Archirafi 36, 90123 Palermo, Italy
3 Istituto Nazionale di Geofisica e VulcanologiaCentro Nazionale Terremoti, Italy
[email protected], [email protected],
[email protected], [email protected], [email protected],
Abstract. Hypocenter and focal mechanism of an earthquake can bedetermined by the analysis of signals, named waveforms, related to thewave field produced and recorded by a seismic network. Assuming thatwaveform similarity implies the similarity of focal parameters, the anal-ysis of those signals characterized by very similar shapes can be usedto give important details about the physical phenomena which havegenerated an earthquake. Recent works have shown the effectiveness ofcross-correlation and/or cross-spectral dissimilarities to identify clustersof seismic events. In this work we propose a new dissimilarity measurebetween seismic signals whose reliability has been tested on real seis-mic data by computing external and internal validation indices on theobtained clustering. Results show its superior quality in terms of clusterhomogeneity and computational time with respect to the largely adoptedcross correlation dissimilarity.
1 Introduction
In seismically active areas often occurred earthquakes that produce very similarwaveforms (multiplets). A high level of similarity between the waveforms is aclear indication of events generated in a small seismogenetic volume, with simi-lar source mechanisms. These events can be associated with both tectonic [1,2]and volcanic activity [4]. Based on the similarity between complete seismogramsof microearthquakes occurred on the San Andreas Fault, Geller and Mueller de-duced that their hypocenters can’t be distant from each other by more than aquarter of the dominant wavelength [3].
The definition of the new dissimilarity was inspired by a simple observation: aseismic signal is characterized by the overlapping of several wave trains (seismicphases) which, because of their different travel path, arrive at the recording
G. Maino and G.L. Foresti (Eds.): ICIAP 2011, Part II, LNCS 6979, pp. 434–443, 2011.c© Springer-Verlag Berlin Heidelberg 2011
A New Dissimilarity Measure for Clustering Seismic Signals 435
point at different times. They relate to both body waves and surface waves. Thebody waves concerning the irrotational component of the displacement field (P)propagate faster than those concerning the solenoidal one (S) and even morethan the surface or guided waves.
The common hypocentral location methods, based on P and S phases arrivaltimes inversion, are generally not accurate enough for a reliable relative locationof very close hypocenters (hypocentral spacing much smaller than the typicaldistance between the stations of the seismic network) and modeling of the focalmechanisms distribution in the source region. To determine differential arrivaltimes with high accuracy, techniques exploiting waveform similarities have beenproposed [1,7].
The dissimilarity functions based on signal cross correlation have been usedto measure the difference degree between seismic events [8,9] and to providemore precise estimates of the differences in arrival times of P and S phases ofsimilar events [10,11]. A new challenge needs to identify, some groups containingsimilar signals with respect to a predetermined criterion, in a large set of three-component signals.
Clustering technique and the related algorithms can be adopted to face thatchallenge. In the general case, cluster analysis play a central role in the designof data analysis systems [12]. Moreover, clustering allows analysts to discoverthe nature of the data for further analysis. Dissimilarity (similarity) functionsare a fundamental ingredient of clustering procedures, and their discriminationability can be measured by means of clustering validation indices [13]. Clusteringvalidation indices can be divided into internal and external ones: the former givesa reliable indication of how well a partitioning solution captures the inherentseparation of the data into clusters, the latter measures how well a clusteringsolution agrees with the gold solution for a given data set [15]. A gold solutionof a generic dataset, can be also inferred by analyzing the data, i.e., by the useof internal knowledge via data analysis tools such as clustering algorithms.
A basic consideration about cross-correlation and/or cross-spectral dissim-ilarities, is that they are effective in forming subsets of similar events just ifearthquakes included in each set are very close in space, magnitude and focalparameters domains and the waveforms recorded have a good signal to noiseratio. Another of its drawback is the computation time, that will necessary af-fect the adopted clustering algorithm. This is a very important point since thedevelopment of dense seismic networks, with 3 components broadband sensors,permit to collect a lot of seismological data that should be processed by cluster-ing techniques.
In this paper we propose a new dissimilarity measure able to catch differencein shapes between waveforms. It has been used in conjunction with a hierarchi-cal clustering algorithm and applied to a dataset of earthquakes waveforms andto another dataset of signals generated by bursts, both recorded by an OceanBottom Seismometers with Hydrophone (OBS/H) deployed in the southernTyrrhenian sea. We compared its discrimination ability with that of a cross

436 F. Benvegna et al.
correlation based dissimilarity. Results show the effectiveness of using the pro-posed dissimilarity, in terms of cluster homogeneity validation index and com-putational time.
2 Dissimilarities Definitions
In this section the two dissimilarity measures used in this work are described.The first one is the classical cross correlation dissimilarity, the other one is thenew designed mesure called cumulative shape dissimilarity.
We recall that the cross correlation between two vectors x1 and x2, both oflength n, is so defined
Rx1,x2(k) =
��n−k−1i=0 (x1(i + k) − μx1) × (x2(i) − μx2) if k ≥ 0
Rx2,x1(−k) otherwise
for k = 1 − n, .., n − 1, and where μx1 and μx2 indicate the means of x1 and x2
respectively. Consequently, the cross correlation dissimilarity between x1 and x2
is
δR(x1, x2) = 1 − 1σxσy
maxk=1,..,2n−1
Rx1,x2(k − n). (1)
Where σx and σy are the standard deviations of x1 and x2 respectively. Suchdissimilarity is largely used to catch difference in shape between seismic signals,but in this context it has also shown some drawbacks. In fact, it is ineffective informing subsets of similar events if earthquakes included in each set are not veryclose in space, magnitude and focal parameters domain, and noise is presentin the recorded signal. Moreover, for a signal of length n its computationaltime is O(n2). The definition of the new dissimilarity was inspired by a simpleobservation: a seismic signal is characterized by two types of waves: body wavesand surface waves. The body wave, especially the first P and S arrival times, areless sensitive to the travel path and clearly have no phase overlapping. Moreover,these seismic phases have often the better signal to noise ratio, so we can usethem to discriminate one wave from the others. A seismic dataset is often a set ofaligned (or not1) signals which contain the two types of body waves: P wave and Swave. Both waves have a magnitude peak with high energy. Consideration aboutthe nature of the data, leads to state the main properties of a good dissimilaritymeasure for seismic signals :
– it should give high weight to the difference among the initial part of thesignals;
– it should be low sensitive to background and impulsive noise;– it should be capable of detecting where two wave shapes are similar regardless
of magnitude.1 Many technics are used to cut and to align the signals: a common phase is the
pre-processing of the signal with denoising, P phase identification and cut.

A New Dissimilarity Measure for Clustering Seismic Signals 437
0 500 1000 1500 2000 2500 3000−4
−2
0
2
4
6
(a)0 500 1000 1500 2000 2500 3000
−6
−4
−2
0
2
4
6
8
(b)0 500 1000 1500 2000 2500 3000
−10
−5
0
5
10
15
(c)0 500 1000 1500 2000 2500 3000
−6
−4
−2
0
2
4
6
(d)
Fig. 1. (a) event 1 (b) event 6 (c) event 32 (d) event 79
0 500 1000 1500 2000 2500 30000
0.1
0.2
0.3
0.4
0.5
0.6
0.7
0.8
0.9
1
En
erg
y
energy(ev1)energy(ev6) energy(ev32) energy(ev79)
(a)
0 500 1000 1500 2000 2500 30000
0.1
0.2
0.3
0.4
0.5
0.6
0.7
energy(ev1) − energy(ev6) energy(ev1) − energy(ev79) energy(ev1) − energy(ev32)
(b)
Fig. 2. (a) cumulative energy of the events; (b) difference between cumulative energies
The first two properties, can be satisfied by a dissimilarity acting on thecumulative energy of the signals rather than on their original waveforms. Ofcourse, the peaks of the P wave and S wave are well visible on cumulative energyplot whereas the tail of the signal has a tiny impact. All the properties are finallysatisfied by a dissimilarity that take into account the evaluation of the differencebetween cumulative energies.
Given two vectors x1 and x2 both of the same length n, and let s1 and s2 be
their cumulative sums si(k) =�
k
r=1x2
i (r)�n
r=1x2
i(r)
(i = 1, 2), we can calculate their abso-
lute difference sd(k) = |s1(k) − s2(k)|. Finally, the new proposed dissimilarity,called cumulative shape dissimilarity δs is defined as:
δs(x1, x2) =�
k
|sd(k + 1) − sd(k)|maxj |sd(j + 1) − sd(j)| . (2)
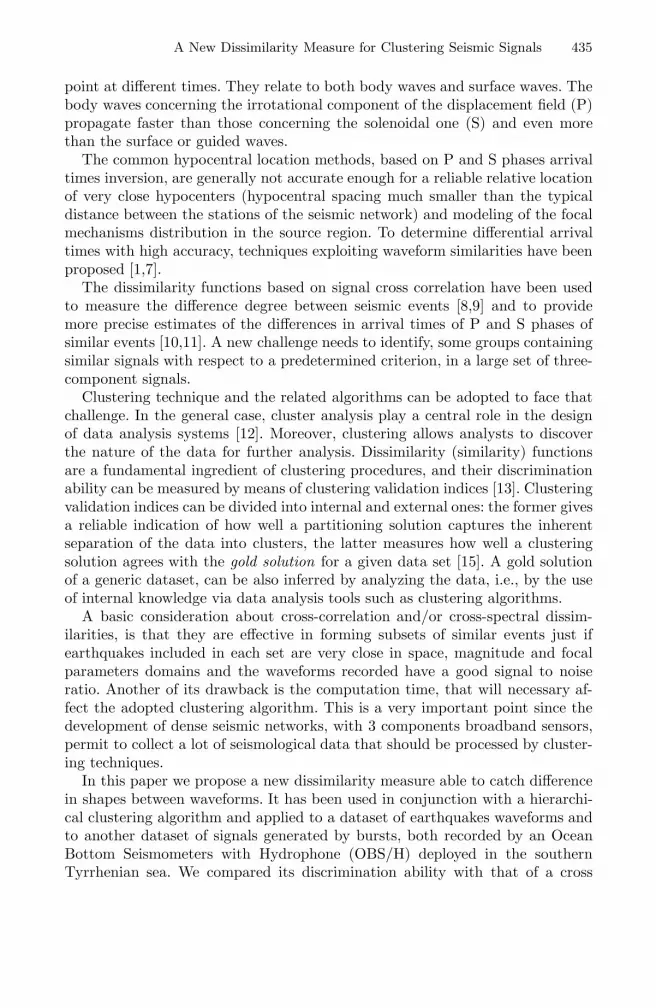
Note that δs represents the sum of the derivative of the difference between thecumulative sums of x1 and x2. In figure 1 we report 4 examples of signal, in figure2 their cumulative sums and the pairwise dissimilarities. Finally, in figure 3 weshow the value of |sd(i + 1) − sd(i)| used to compute δs(x1, x2). Such exampleshows how similar shapes have lower dissimilarity values. It is important to notethat the new measure δs have a remarkable computational time of O(n).
438 F. Benvegna et al.
0 500 1000 1500 2000 2500 30000
0.005
0.01
0.015
0.02
0.025
0.03
0.035
0.04
(a)0 500 1000 1500 2000 2500 3000
(b)0 500 1000 1500 2000 2500 3000
(c)
Fig. 3. Derivative at sample point i of the difference between cumulative energies(|sd(i + 1) − sd(i)|) (a) event 1 - event 32 (b) event 1 - event 79 (c) event 1 - event 6
3 Evaluation of a Dissimilarity Measure
In order to evaluate the performance of a dissimilarity, we have adopted threedifferent indices. Two of them are related to the partitioning inducted by aclustering algorithm which make use of the dissimilarity, while the other onedoes not consider any partitioning information.
When using a dissimilarity measure in conjunction with a clustering algo-rithm, it is possible to evaluate its performance by means of clustering internaland external indices : the former gives a reliable indication of how well a parti-tioning solution captures the inherent separation of the data into clusters [15],the latter measures how well a clustering solution agrees with the gold solutionfor a given data set. A gold solutions for a dataset is a partition based on externalknowledge of the data in classes, that can be also inferred by the use of internalknowledge via data analysis tools such as clustering algorithms. When the goldsolution is not known, the internal criteria must give a reliable indication of howwell a partitioning solution, and indirectly the used dissimilarity, captures theinherent separation of the data into clusters.
Let X a set of generic items X = {x1, . . . , xN}, and P = {p1, · · · , pt} apartitioning of X .
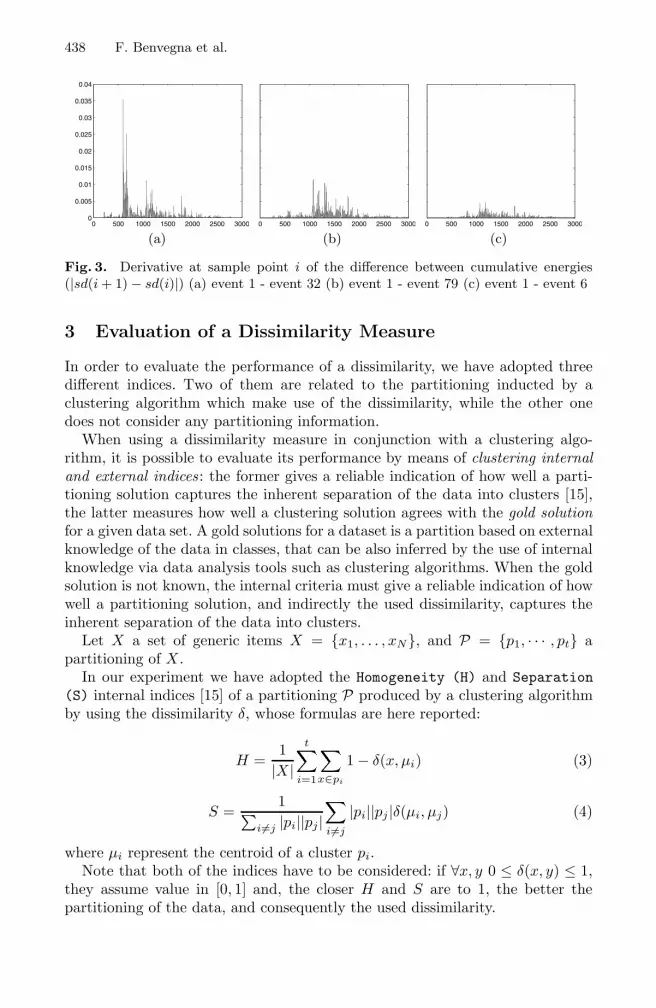
In our experiment we have adopted the Homogeneity (H) and Separation(S) internal indices [15] of a partitioning P produced by a clustering algorithmby using the dissimilarity δ, whose formulas are here reported:
H =1|X |
t�i=1
�x∈pi
1 − δ(x, μi) (3)
S =1�
i�=j |pi||pj|�i�=j
|pi||pj |δ(μi, μj) (4)
where μi represent the centroid of a cluster pi.Note that both of the indices have to be considered: if ∀x, y 0 ≤ δ(x, y) ≤ 1,
they assume value in [0, 1] and, the closer H and S are to 1, the better thepartitioning of the data, and consequently the used dissimilarity.

A New Dissimilarity Measure for Clustering Seismic Signals 439
When the gold solution is known, the so called external indices can be com-puted. Giving the partitioning C = {c1, · · · , cr} corresponding to the gold solu-tion for the dataset, an external index measures the level of agreement betweenC and P . External indices are usually defined via a r × t contingency table T ,where Tij represents the number of items in both ci and pj , 1 ≤ i ≤ r and1 ≤ j ≤ t. For our experiment we have used the Adjusted Rand index[14].
RA =
�i,j
�Tij
2
�− [�
i(Ti.
2 )�
j(T.j
2 )](N
2 )
12 [�
i
�Ti.
2
�+�
j
�T.j
2
�] − [
�i(Ti.
2 )�
j(T.j
2 )](N
2 )
(5)
where Ti. = |ci| and T.j = |pj |. Also in this case, the closer RA is to 1, the betterthe partitioning of the data, and consequently the used dissimilarity.
Besides the assessment of a dissimilarity function by making use of cluster-ing validation indices, it is also possible to use an a priori information differ-ent form the gold solution. In the following, we will define a new index, calledDissimilarity Optimality index which make use of the sort of data items.
Let us assume now that X is a partially ordered set of generic items, whosesorting permutation P = (i1, i2, . . . , iN ) is known. In this case, the goodness ofa generic dissimilarity δ on X can be established by comparing the sorting itinduces on X with the sorting permutation P . In particular, what we expectfrom a good dissimilarity δ is that for each item xi, its closest item with respectto δ is xi+k with a small |k| ≥ 1. The Dissimilarity Optimality index is so defined:
do =n�
i=1
|i − j − 1|N − 2
with j = argmin1≤k≤N,k �=i
δ(xi, xk) (6)
do ≈ 0 is what we expect in case of good dissimilarity measure.
4 Experimental Results
On the 6th September 2002, at 01:21 UTC, a strong earthquake (MW 5.9) oc-curred in the northern Sicilian offshore. The seismic event was recorded by theIstituto Nazionale di Geofisica e Vulcanologia (INGV ) network and located atabout 50 km in NNE direction, from the Palermo city. In the following months,more than a thousand of aftershocks were located in the same epicentral area[17]. In December 2009, to better monitoring the seismicity of the Palermo 2002epicentral area, the Gibilmanna OBSLab of INGV installed an Ocean BottomSeismometers with Hydrophone (OBS/H ) near the epicentral area of the main-shock, at a depth of about 1500 m. The 3 Component velocity signals (Up-Down,Nord-Sud, East-West) was digitized with a 21 bit datalogger with a samplingfrequency of 200 Hz. The OBS/H recorded several teleseismic and regional earth-quakes and about 250 local micro-events not located by the on land network.The magnitude of the local events ranges between −0.5 and 2.5 ML, and thedelay between the S wave and P wave arrival times (TS − TP ) ranges between
440 F. Benvegna et al.
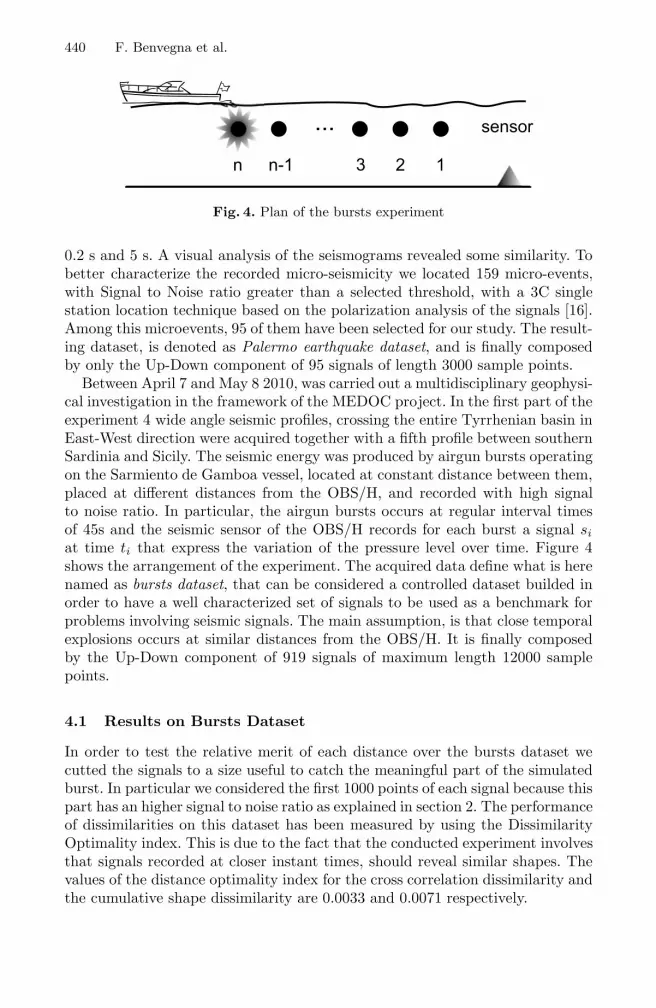
Fig. 4. Plan of the bursts experiment
0.2 s and 5 s. A visual analysis of the seismograms revealed some similarity. Tobetter characterize the recorded micro-seismicity we located 159 micro-events,with Signal to Noise ratio greater than a selected threshold, with a 3C singlestation location technique based on the polarization analysis of the signals [16].Among this microevents, 95 of them have been selected for our study. The result-ing dataset, is denoted as Palermo earthquake dataset, and is finally composedby only the Up-Down component of 95 signals of length 3000 sample points.
Between April 7 and May 8 2010, was carried out a multidisciplinary geophysi-cal investigation in the framework of the MEDOC project. In the first part of theexperiment 4 wide angle seismic profiles, crossing the entire Tyrrhenian basin inEast-West direction were acquired together with a fifth profile between southernSardinia and Sicily. The seismic energy was produced by airgun bursts operatingon the Sarmiento de Gamboa vessel, located at constant distance between them,placed at different distances from the OBS/H, and recorded with high signalto noise ratio. In particular, the airgun bursts occurs at regular interval timesof 45s and the seismic sensor of the OBS/H records for each burst a signal si
at time ti that express the variation of the pressure level over time. Figure 4shows the arrangement of the experiment. The acquired data define what is herenamed as bursts dataset, that can be considered a controlled dataset builded inorder to have a well characterized set of signals to be used as a benchmark forproblems involving seismic signals. The main assumption, is that close temporalexplosions occurs at similar distances from the OBS/H. It is finally composedby the Up-Down component of 919 signals of maximum length 12000 samplepoints.
4.1 Results on Bursts Dataset
In order to test the relative merit of each distance over the bursts dataset wecutted the signals to a size useful to catch the meaningful part of the simulatedburst. In particular we considered the first 1000 points of each signal because thispart has an higher signal to noise ratio as explained in section 2. The performanceof dissimilarities on this dataset has been measured by using the DissimilarityOptimality index. This is due to the fact that the conducted experiment involvesthat signals recorded at closer instant times, should reveal similar shapes. Thevalues of the distance optimality index for the cross correlation dissimilarity andthe cumulative shape dissimilarity are 0.0033 and 0.0071 respectively.
A New Dissimilarity Measure for Clustering Seismic Signals 441
0 1 2 3 4 5 6 7 8 9 10 11 12 13 14 15 16 1775
80
85
90
95
100
w − size of the window
rate
cross−correlationcumulative shape
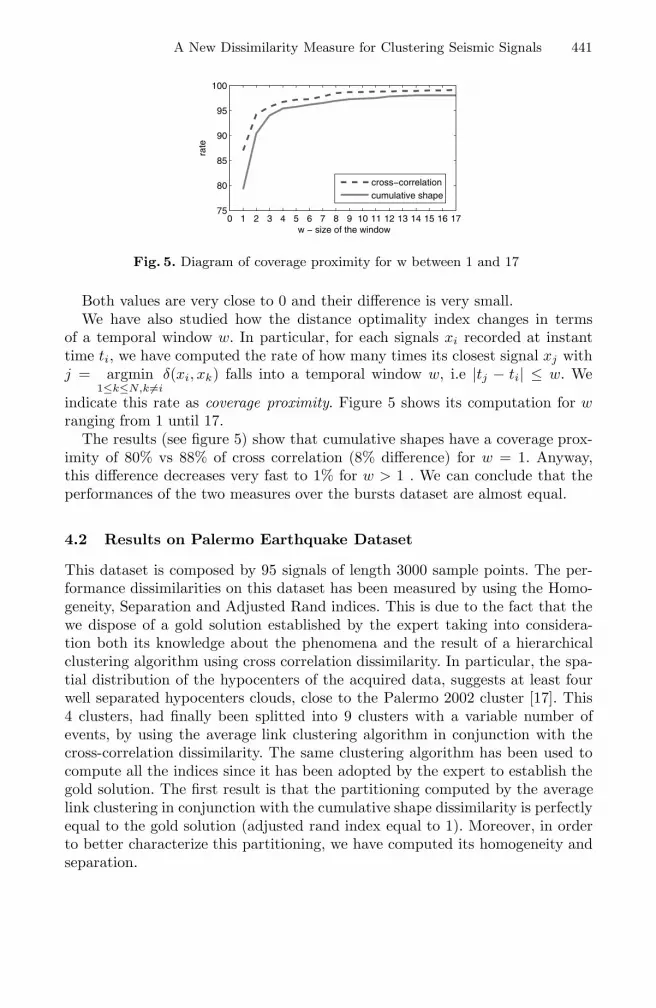
Fig. 5. Diagram of coverage proximity for w between 1 and 17
Both values are very close to 0 and their difference is very small.We have also studied how the distance optimality index changes in terms
of a temporal window w. In particular, for each signals xi recorded at instanttime ti, we have computed the rate of how many times its closest signal xj withj = argmin
1≤k≤N,k �=iδ(xi, xk) falls into a temporal window w, i.e |tj − ti| ≤ w. We
indicate this rate as coverage proximity. Figure 5 shows its computation for wranging from 1 until 17.
The results (see figure 5) show that cumulative shapes have a coverage prox-imity of 80% vs 88% of cross correlation (8% difference) for w = 1. Anyway,this difference decreases very fast to 1% for w > 1 . We can conclude that theperformances of the two measures over the bursts dataset are almost equal.
4.2 Results on Palermo Earthquake Dataset
This dataset is composed by 95 signals of length 3000 sample points. The per-formance dissimilarities on this dataset has been measured by using the Homo-geneity, Separation and Adjusted Rand indices. This is due to the fact that thewe dispose of a gold solution established by the expert taking into considera-tion both its knowledge about the phenomena and the result of a hierarchicalclustering algorithm using cross correlation dissimilarity. In particular, the spa-tial distribution of the hypocenters of the acquired data, suggests at least fourwell separated hypocenters clouds, close to the Palermo 2002 cluster [17]. This4 clusters, had finally been splitted into 9 clusters with a variable number ofevents, by using the average link clustering algorithm in conjunction with thecross-correlation dissimilarity. The same clustering algorithm has been used tocompute all the indices since it has been adopted by the expert to establish thegold solution. The first result is that the partitioning computed by the averagelink clustering in conjunction with the cumulative shape dissimilarity is perfectlyequal to the gold solution (adjusted rand index equal to 1). Moreover, in orderto better characterize this partitioning, we have computed its homogeneity andseparation.

442 F. Benvegna et al.
2 3 4 5 6 7 8 9 10 11 12 13 14 15 16 17 18 19 200
0.1
0.2
0.3
0.4
0.5
0.6
0.7
0.8
0.9
11
K − number of clusters
Ho
mo
gen
eity
cross−correlationcumulative shape
(a)
2 3 4 5 6 7 8 9 10 11 12 13 14 15 16 17 18 19 200
0.1
0.2
0.3
0.4
0.5
0.6
0.7
0.8
0.9
11
K − number of clusters
Sep
arat
ion
cumulative shapecross−correlation
(b)
Fig. 6. Internal indices for the considered dissimilarities: (a) Homogeneity; (b) Sepa-ration
We report in figure 6(a,b) the homogeneity and separation indices of the twodissimilarities for different partitionings of K clusters ranging between 2 and 20.
The results show that the cumulative shape outperforms the cross-correlationin term of homogeneity and performs almost equally on separation.
5 Conclusion and Future Work
In this paper, a new dissimilarity measure between seismic signals called cumu-lative shape dissimilarity has been proposed. A number of tests have been doneon two different dataset of earthquake events. The former is characterized bysynthetic signal without gold solution in spite of the latter that, due to its realnature, have a gold solution proposed by an expert providing 9 cluster with avariable number of elements. Such datasets have been used to compare the cumu-lative shape dissimilarity with the cross correlation dissimilarity, that is actuallylargely adopted to differentiate waveforms in the context of seismic signals. In or-der to evaluate the goodness of the proposed measure, due to the heterogeneity ofthe two dataset, several indices have been considered (Dissimilarity Optimality,Homogeneity, Separation and Adjusted Rand). The test returns that the pro-posed measure have Dissimilarity Optimality and a Separation indices almostequal to the cross correlation ones, and a superior Homogeneity for all clustersvalues ranging from 2 to 20 (in average 1%). Anyway, the relevant differencehas to be noted on the computational time, in particular cumulative shape mea-sure is faster than cross-correlation (O(n) vs O(n2)). Future developments willbe devoted to an extension of the cumulative shape on all the three-componentsignals, a new version taking into account weights for the signal samples, and tothe study of the better conjunction between the new proposed dissimilarity andseveral kind of clustering algorithms.

A New Dissimilarity Measure for Clustering Seismic Signals 443
References
1. Scherbaum, F., Wendler, J.: Cross spectral analysis of Swabian Jura (SW Germany)threecomponent microearthquake recordings. J. Geophys. 60, 157–166 (1986)
2. Console, R., Di Giovambattista, R.: Local earthquake relative location by digitalrecords. Phys. Earth Planet. Inter. 47, 43–49 (1987)
3. Geller, R.J., Mueller, C.S.: Four similar earthquakes in central California. Geophys.Res. Lett. 7, 821–824 (1980)
4. Got, J.L., Frechet, M., Klein, F.W.: Deep fault plane geometry inferred from multi-plet relative relocation beneath the south flank of Kilauea. J. Geophys. Res. 99(15),375–386 (1994)
5. Aster, R.C., Scott, J.: Comprehensive Characterization of Waveform Similarity inMicroeartquake data sets. Bulletin of the Seismological Society of America 83(4),1307–1314 (1993)
6. Maurer, H.R., Deichmann, N.: Microearthquake cluster detection based on wave-form similarities with an application to the western Swiss Alps. Geoph. J. Int. 123,588–600 (1995)
7. Deichmann, N., Garcia-Fernandez, M.: Rupture geometry from high-precision rel-ative hypocenter locations of microearthquake clusters. Geophys. J. Int. 110, 501–517 (1992)
8. Mezcua, J., Rueda, J.: Earthquake relative location based on waveform similarity.Tectonophysics 233, 253–263 (1994)
9. Menke, W.: Using waveform similarity to constrain earthquake locations. Bull.Seismol. Soc. Am. 89, 1143–1146 (1999)
10. Gillard, D., Rubin, A.M., Okubom, P.: Highly concentrated seismicity caused bydeformation of Kilauea’s depp magma system. Nature 384, 343–346 (1996)
11. Phillips, W.S., House, L.S., Feheler, J.: Detailed joint structure in a geothermalreservoir from studies of induced microearthquake studies. Journal of GeophysicalResearch 102, 745–763 (1997)
12. Jain, A.K., Murty, M.N., Flynn, P.J.: Data clustering: a review. ACM Comput.Surv. 31(3), 264–323 (1999)
13. Giancarlo, R., Lo Bosco, G., Pinello, L.: Distance Functions, Clustering Algorithmsand Microarray Data Analysis. In: Blum, C., Battiti, R. (eds.) LION 4. LNCS,vol. 6073, pp. 125–138. Springer, Heidelberg (2010)
14. Hubert, L., Arabie, P.: Comparing partitions. Journal of Classification 2, 193–218(1985)
15. Shamir, R., Sharan, R.: Algorithmic approaches to clustering gene expression data.Current Topics in Computational Biology, 269–299 (2002)
16. D’Alessandro, A., Luzio, D., D’Anna, G., Mangano, G., Panepinto, S.: Single sta-tion location of small-magnitude seismic events recorded by OBS in the IonianSea. Geophysical Research Abstracts, EGU General Assembly, Vienna, Austria,12, EGU2010-8840 (2010)
17. Giunta, G., Luzio, D., Tondi, E., De Luca, L., Giorgiani, A., D’Anna, G., Renda, P.,Cello, G., Nigro, F., Vitale, M.: The Palermo (Siciliy) seismic cluster of Septermber2002, in the seismotectonic framework of the Tyrrhenian Sea-Sicily border area.Ann. of Geoph. 47(6), 1755–1770 (2004)


