Embed Size (px)
Citation preview

RESEARCH ARTICLE
A Multiscale Model Evaluates Screening forNeoplasia in Barrett’s EsophagusKit Curtius1*, William D. Hazelton2, Jihyoun Jeon3, E. Georg Luebeck2
1Department of Applied Mathematics, University of Washington, Seattle, Washington, United States ofAmerica, 2 Program in Computational Biology, Fred Hutchinson Cancer Research Center, Seattle,Washington, United States of America, 3 Program in Biostatistics and Biomathematics, Fred HutchinsonCancer Research Center, Seattle, Washington, United States of America
AbstractBarrett’s esophagus (BE) patients are routinely screened for high grade dysplasia (HGD)
and esophageal adenocarcinoma (EAC) through endoscopic screening, during which multi-
ple esophageal tissue samples are removed for histological analysis. We propose a compu-
tational method called the multistage clonal expansion for EAC (MSCE-EAC) screening
model that is used for screening BE patients in silico to evaluate the effects of biopsy sam-
pling, diagnostic sensitivity, and treatment on disease burden. Our framework seamlessly
integrates relevant cell-level processes during EAC development with a spatial screening
process to provide a clinically relevant model for detecting dysplastic and malignant clones
within the crypt-structured BE tissue. With this computational approach, we retain spatio-
temporal information about small, unobserved tissue lesions in BE that may remain unde-
tected during biopsy-based screening but could be detected with high-resolution imaging.
This allows evaluation of the efficacy and sensitivity of current screening protocols to detect
neoplasia (dysplasia and early preclinical EAC) in the esophageal lining. We demonstrate
the clinical utility of this model by predicting three important clinical outcomes: (1) the proba-
bility that small cancers are missed during biopsy-based screening, (2) the potential gains
in neoplasia detection probabilities if screening occurred via high-resolution tomographic
imaging, and (3) the efficacy of ablative treatments that result in the curative depletion of
metaplastic and neoplastic cell populations in BE in terms of the long-term impact on reduc-
ing EAC incidence.
Author Summary
Endoscopic screening for detecting cancer and cancer precursors in Barrett’s esophagus(BE) is currently informed by repeated systematic biopsying of the metaplastic BE tissue.Here we present a comprehensive multiscale model of the natural history of esophagealadenocarcinoma (EAC), which describes the entire multistage process beginning with theconversion event of normal squamous esophageal tissue to BE metaplasia, the spatio-tem-poral formation of independent dysplastic and malignant clones at the cell level, and
PLOS Computational Biology | DOI:10.1371/journal.pcbi.1004272 May 22, 2015 1 / 22
a11111
OPEN ACCESS
Citation: Curtius K, Hazelton WD, Jeon J, LuebeckEG (2015) A Multiscale Model Evaluates Screeningfor Neoplasia in Barrett’s Esophagus. PLoS ComputBiol 11(5): e1004272. doi:10.1371/journal.pcbi.1004272
Editor: James A Glazier, Indiana University, UNITEDSTATES
Received: October 1, 2014
Accepted: April 7, 2015
Published: May 22, 2015
Copyright: © 2015 Curtius et al. This is an openaccess article distributed under the terms of theCreative Commons Attribution License, which permitsunrestricted use, distribution, and reproduction in anymedium, provided the original author and source arecredited.
Data Availability Statement: All data files includingdocumented R code for the Methods and exampleparameter values used in the Results are available inan open source repository (https://github.com/yosoykit/MSCE_EAC_Screening_Model).
Funding: This research was supported by theNational Cancer Institute (www.cancer.gov) undergrants U01 CA152926 (CISNET) (to EGL, JJ, andWDH) and U01 CA182940 (BG-U01) (to EGL andWDH). Also, this research was supported by theNational Science Foundation (www.nsf.gov) undergrant no. DGE-0718124 (to KC). The funders had no

finally the appearance of symptomatic EAC in BE. This model lends itself to a systematicexploration of the efficacy and sensitivity of current biopsy-based screening methods todetect neoplasia in BE patients, as well as alternative screening techniques based on high-resolution imaging of the BE tissue. Moreover, the model can also be used to predict theimpact of ablative treatments on the risk of occurrence or recurrence of dysplasia or can-cer. Due to the lack of studies that attempt to explicitly model the physical and biologicaldimensions of the screening process itself, our computational model provides a unique,publicly-available tool to improve understanding of factors that limit the efficacy of cur-rent screening protocols for BE patients.
This is a PLOS Computational BiologyMethods paper.
IntroductionThe incidence of esophageal adenocarcinoma (EAC) has increased dramatically over the pastfew decades in the US and other Western countries, prompting numerous epidemiological andclinical studies to characterize etiologic, genetic, and environmental factors that may contributeto this alarming trend [1, 2]. EAC arises primarily (if not exclusively) in Barrett’s esophagus(BE), a metaplastic tissue alteration in the esophageal lining. Screening is targeted toward iden-tifying BE patients who are at the highest risk of developing dysplasia and cancer. Although therisk of BE progressing to EAC is estimated to be low (around 0.2–0.5% per year [3]), clinical ev-idence suggests that the risk of neoplastic progression in BE varies significantly between indi-viduals depending on age, gender, race/ethnicity, gastroesophageal reflux disease (GERD) andwhether or not dysplasia is present in BE.
High grade dysplasia (HGD) occurring in BE is generally non-invasive but carries a highrisk of progression to EAC. Low grade dysplasia (LGD) also occurs, but its clinical relevance isless certain. Most patients diagnosed with HGD undergo endoscopic mucosal resection (EMR)or treatment with radio frequency ablation (RFA) to remove HGD tissue and, in the case ofRFA, to reduce the amount of underlying metaplastic BE tissue. Genetic and genomic studies,including longitudinal studies with multiple BE tissue samples from individual patients in theSeattle BE cohort [4], also implicate specific genomic alterations in the neoplastic progressionprocess. Frequently observed alterations in BE include epigenetic silencing or loss of heterozy-gosity (LOH) of the P16INK4A and/or TP53 tumor suppressor genes [5–8]. Whether these al-terations necessarily lead to the clinical presentation of dysplasia and other cellular andarchitectural changes associated with this diagnosis is presently unknown. However, our work-ing hypothesis is that fields of HGD are comprised of clonal populations of premalignant cellsthat originate from distinct progenitors in the BE tissue.
Because dysplasia (in particular HGD) continues to be a widely used clinical predictor forprogression to EAC, most BE patients are recommended to undergo periodic endoscopic sur-veillance with biopsies taken at specified spatial locations in BE to detect neoplastic changes(dysplasia and/or cancer). However, due to the large number of adults with BE in the generalpopulation (* 1–3% [9, 10]), excessive or ineffective BE screening and surveillance that do notsignificantly reduce EAC incidence and mortality are a considerable public health concern.
Screening Model for Neoplasia in Barrett’s Esophagus
PLOS Computational Biology | DOI:10.1371/journal.pcbi.1004272 May 22, 2015 2 / 22
role in study design, data collection and analysis,decision to publish, or preparation of the manuscript.
Competing Interests: The authors have declaredthat no competing interests exist.

To examine these issues, we developed a mathematical and computational framework thatallows concurrent modeling of the BE-to-EAC progression and endoscopic screening for dys-plasia and preclinical cancer prior to EAC diagnosis. We will present the screening model asthree cohesive modules. First, we present the stochastic model for EAC at the cell level captur-ing key events of the random, GERD-dependent onset of BE, the initiation and stochasticgrowth of premalignant clones, malignant transformations in premalignant clones, and sto-chastic growth of malignant clones prior to (symptomatic) cancer detection. This frameworkprovides a bridge between the cell and population scales and has previously been described formodeling EAC incidence data in the US [11, 12]. The following two, novel parts of the modelutilize and improve on this prior work and are essential for describing the screening process.
The second module is an explicit computational method to efficiently simulate the entirecell model in an individual BE patient until the time of a hypothetical screen. This requirescomputation of the joint size distribution of premalignant and malignant clones in the BE tis-sue prior to development of an incident, symptomatic cancer. The method captures the clonalprogression of an idealized, 2D in silico tissue composed of intestinal crypts and can generate avariety of spatial patterns (from circular to very diffuse shapes) of both premalignant and ma-lignant clones within the BE segment of a patient.
The third module simulates an endoscopic screen of a patient’s BE segment. For a biopsy-based screen, the model mimics the Seattle standard protocol for screening patients with BE,probing the tissue every 1–2 cm with 4 quadrant biopsies for the presence of dysplasia andsigns of invasive cancer. We show that the efficacy of this protocol is highly variable and depen-dent on the sensitivity of detecting neoplastic abnormalities within a biopsy. This sensitivityalso affects the amount of dysplastic patients predicted to harbor undetected malignancy attime of screening. The outcomes of biopsy-based screens are then compared with the model’sprediction for screening outcomes when using high-resolution imaging, a new screening tech-nology not yet widely in use. With information about the amount of small neoplasms that goundetected during biopsy-based screening, the model quantifies the potential advantages thatimage-based screening might offer. Finally, this module simulates ablative treatment of BE pa-tients with detected dysplasia during screening. By explicitly modeling the curative effects ofablative treatment, we gain insights into the critical factors that may prevent treatment success.
MethodsHere we describe the modular design of the multistage clonal expansion for EAC (MSCE-EAC)screening model. The first module provides a likelihood-based method for modeling the sto-chastic process of EAC formation used previously for model calibration to incidence data. Thesecond module explicitly simulates the cell model outcomes and spatial organization of prema-lignant and malignant lesions in a Barrett’s esophagus (BE) segment. Lastly, the third modulesimulates an endoscopic screen, whether biopsy-based or image-based, at the tissue level toevaluate the number of BE patients who are positive for neoplasia. These latter tissue levelmodules require two new spatial parameters that can be calibrated to reproduce publishedscreening prevalences of high grade dysplasia (HGD), and then used to predict other outcomesat the tissue and population scales. Fig 1 depicts each level of detail in our multiscale model forscreening an individual BE patient: cell, tissue, and organ.
MSCE-EAC Cell ModuleThe multistage clonal expansion for EAC (MSCE-EAC) cellular model assumes that the step-wise progression to cancer, formulated mathematically as a continuous-time Markov process,involves tissue alteration whereby part of the distal normal esophageal squamous epithelium
Screening Model for Neoplasia in Barrett’s Esophagus
PLOS Computational Biology | DOI:10.1371/journal.pcbi.1004272 May 22, 2015 3 / 22

(with variable extent) undergoes metaplastic transformation resulting in a columnar-lined epi-thelium called Barrett’s esophagus (BE). This tissue alteration provides a natural starting pointfor a cell-level description of the neoplastic progression to EAC.
Because gastroesophageal reflux disease (GERD) increases the risk of BE [13–15], we as-sume that the rate of conversion of normal esophageal tissue to BE metaplasia is GERD-depen-dent. Here we define symptomatic GERD (sGERD) patients as those with GERD symptomsoccurring weekly or more frequently. This represents an extension of an earlier model that didnot include the effects of GERD [16]. Specifically, we model the exponential BE rate, ν(t), as afunction of the prevalence of symptomatic GERD at age t, such that
nðtÞ ¼ n0 ðð1� psGERD
ðtÞÞ þ RR � psGERD
ðtÞÞ; ð1Þ
where psGERD(t) is the prevalence of GERD symptoms at age t and RR is the relative risk RR ofGERD for BE. The time-dependent cumulative distribution for BE onset is then given by
FBEðtÞ ¼ Pr ½T
BE� t� ¼ 1� e�
R t
0nðsÞ ds : ð2Þ
See S1 Text for details on modeling psGERD(t) and S1 and S2 Figs for values of psGERD(t) and BEprevalence, FBE(t), for males and females, respectively.
Once a tissue conversion occurs resulting in BE at exponentially distributed age TBE, themodel continues as a multi-type branching process that includes stem cell counts of three dif-ferent types: pre-initiated, initiated (premalignant), and malignant. This cellular description ofcarcinogenesis begins with the initiation of stem cells, enabling them to undergo clonal expan-sion. In the current formulation of the model, initiation occurs as a result of two rate-limitingevents (e.g., bi-allelic inactivation of a tumor suppressor, such as TP53) due to previous likeli-hood-based model selection [16]. Once a stem cell is initiated, it undergoes clonal expansion
Fig 1. Themultiscale nature of BE screening. Biopsy screening for BE scales from stem cells in the crypt (left) to the BE cylindrical segment of theesophagus depicted (right) with rectangles representing biopsy samples taken during endoscopy via the Seattle biopsy protocol. The BE segment may havedysplasia and/or malignant tissue patches that remain untouched after biopsying. During histological preparation, portions of each biopsy are sliced bymicrotome and placed on slides for pathologic assessment. Diagnosis is made by microscopic interpretation of crypt and cellular architecture, reflecting themost severe tissue grade found from all slides.
doi:10.1371/journal.pcbi.1004272.g001
Screening Model for Neoplasia in Barrett’s Esophagus
PLOS Computational Biology | DOI:10.1371/journal.pcbi.1004272 May 22, 2015 4 / 22
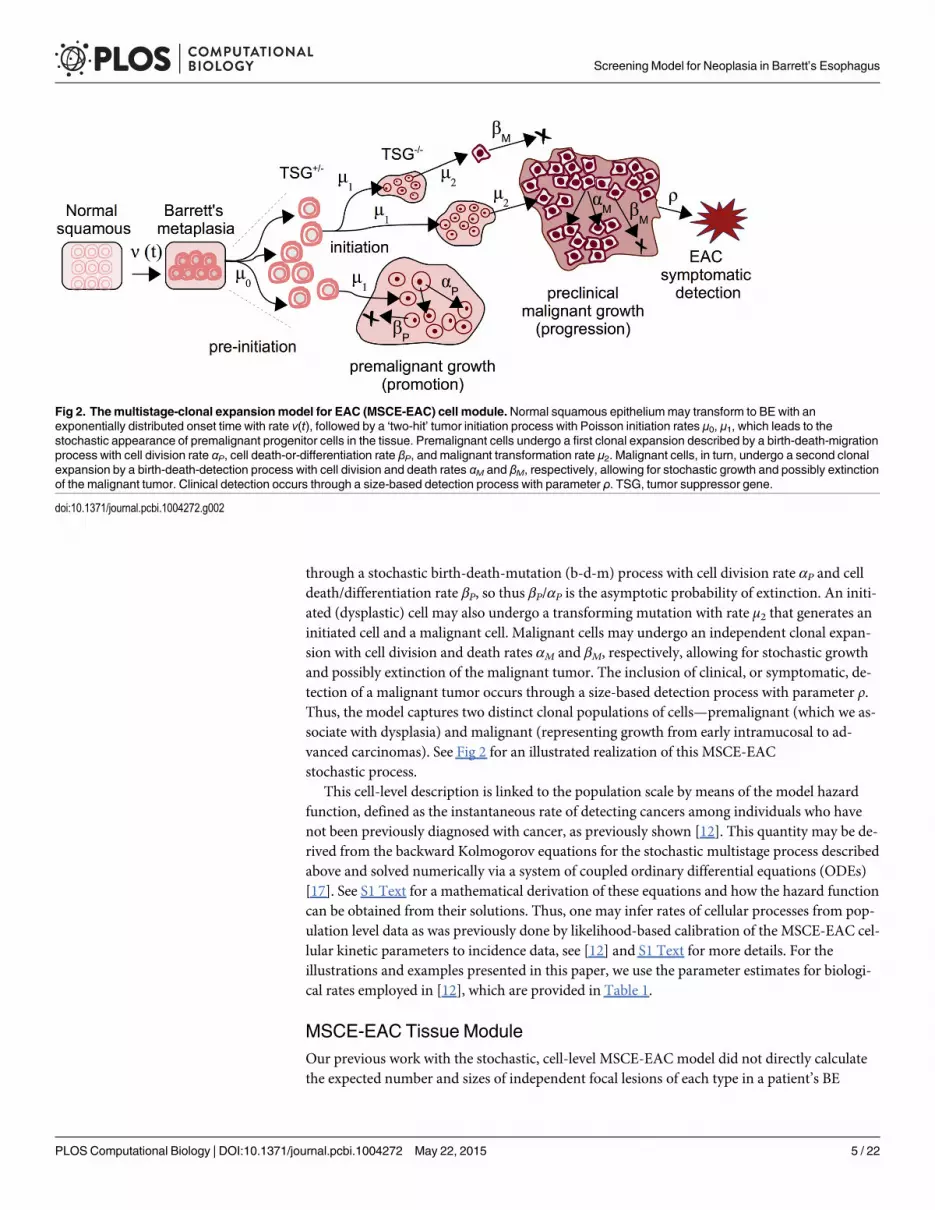
through a stochastic birth-death-mutation (b-d-m) process with cell division rate αP and celldeath/differentiation rate βP, so thus βP/αP is the asymptotic probability of extinction. An initi-ated (dysplastic) cell may also undergo a transforming mutation with rate μ2 that generates aninitiated cell and a malignant cell. Malignant cells may undergo an independent clonal expan-sion with cell division and death rates αM and βM, respectively, allowing for stochastic growthand possibly extinction of the malignant tumor. The inclusion of clinical, or symptomatic, de-tection of a malignant tumor occurs through a size-based detection process with parameter ρ.Thus, the model captures two distinct clonal populations of cells—premalignant (which we as-sociate with dysplasia) and malignant (representing growth from early intramucosal to ad-vanced carcinomas). See Fig 2 for an illustrated realization of this MSCE-EACstochastic process.
This cell-level description is linked to the population scale by means of the model hazardfunction, defined as the instantaneous rate of detecting cancers among individuals who havenot been previously diagnosed with cancer, as previously shown [12]. This quantity may be de-rived from the backward Kolmogorov equations for the stochastic multistage process describedabove and solved numerically via a system of coupled ordinary differential equations (ODEs)[17]. See S1 Text for a mathematical derivation of these equations and how the hazard functioncan be obtained from their solutions. Thus, one may infer rates of cellular processes from pop-ulation level data as was previously done by likelihood-based calibration of the MSCE-EAC cel-lular kinetic parameters to incidence data, see [12] and S1 Text for more details. For theillustrations and examples presented in this paper, we use the parameter estimates for biologi-cal rates employed in [12], which are provided in Table 1.
MSCE-EAC Tissue ModuleOur previous work with the stochastic, cell-level MSCE-EAC model did not directly calculatethe expected number and sizes of independent focal lesions of each type in a patient’s BE
Fig 2. Themultistage-clonal expansionmodel for EAC (MSCE-EAC) cell module.Normal squamous epitheliummay transform to BE with anexponentially distributed onset time with rate ν(t), followed by a ‘two-hit’ tumor initiation process with Poisson initiation rates μ0, μ1, which leads to thestochastic appearance of premalignant progenitor cells in the tissue. Premalignant cells undergo a first clonal expansion described by a birth-death-migrationprocess with cell division rate αP, cell death-or-differentiation rate βP, and malignant transformation rate μ2. Malignant cells, in turn, undergo a second clonalexpansion by a birth-death-detection process with cell division and death rates αM and βM, respectively, allowing for stochastic growth and possibly extinctionof the malignant tumor. Clinical detection occurs through a size-based detection process with parameter ρ. TSG, tumor suppressor gene.
doi:10.1371/journal.pcbi.1004272.g002
Screening Model for Neoplasia in Barrett’s Esophagus
PLOS Computational Biology | DOI:10.1371/journal.pcbi.1004272 May 22, 2015 5 / 22

segment at any given age in his/her lifetime, as depicted in Fig 2. However, this knowledge isclinically relevant for effectively monitoring progression to EAC in a BE patient. In this mod-ule, we first describe the computational tool developed to obtain the MSCE-EAC stochastic re-alizations of the number and sizes of premalignant and malignant lesions in a BE patient at anygiven age. Next, we use these model-derived outcomes of initiated stem cell numbers to simu-late their spatial configuration as lesions in the BE tissue, which is important given the spatialnature of the biopsy screening protocols.
Because the mathematical complexity of this multistage model makes it difficult to derivetractable analytic size distributions for all cell types through time we resort to direct simula-tions of sample populations of individual lifetime trajectories to track clone number and sizesas progeny from certain cell types. Recent advances in stochastic simulation allow further effi-ciency in computation of cell counts, enabling rapid model testing and examination of manypossible scenarios. See S1 Text for the full algorithm and implementation of the MSCE-EAChybrid simulation of the number of clones and their sizes for all cell types present at time tsduring a hypothetical screening. We call this a ‘hybrid’ simulation because it employs stochas-tic simulation when necessary but also makes use of samples from analytical distributionswhen possible. For the simulation of premalignant (dysplastic) clones, we employ two meth-ods. The first is an exact method, the stochastic simulation algorithm (SSA), first described byGillespie [18], that simulates every jump in cell count and exponential waiting times betweenevents. The second is a highly efficient approximation to SSA called τ-leaping. S1 Text explainsthese two methods and describes how the MSCE-EAC simulation uses them cooperatively in ahighly efficient approach. The accuracy of both the size distributions generated by the SSA andthe τ-leaping method are shown in S3 Fig as Q-Q plots for the size distributions of non-extinctpremalignant clones compared to the analytical distribution for an independent b-d-m process.
With cell module parameters as input, the MSCE-EAC hybrid algorithm simulates themulti-type branching process for an individual’s cellular progression from birth until time(age) ts, which can be repeated to generate (synthetic) data for a sample population. In summa-ry, for those individuals who are found to have BE by time of screening, each patient has a spe-cific number of BE stem cells (X), number of pre-initiated cells (P�), a number of non-extinctpremalignant (P) clones with respective sizes, a number of non-extinct malignant (M) cloneswith respective sizes and information about the parental P clones from which theM clones
Table 1. MSCE-EACmodel biological parameters.
Value (95% CI) Males Females
ν0 3.65 (3.19–4.13) × 10−4 7.48 (4.87–10.29) × 10−5
μ0(μ1) 7.99 (6.38–9.83) × 10−4 7.05 (6.13–12.25) × 10−4
μ2 4.54 (3.65–6.47) × 10−5 6.89 (3.16–14.28) × 10−5
gP,0 * 9.91 (9.28–10.99) × 10−2 1.23 (1.06–1.35) × 10−1
g1 * 5.09 (2.75–5.90) × 10−1 6.40 (2.16–8.44) × 10−1
g2 * 5.38 (4.83–5.72) × 10−2 2.98 (2.47–3.44) × 10−2
g3 * 1912.5 (1909.1–1914.1) 1945.3 (1923.9–1954.4)
All parameter estimates fit to SEER incidence data and have the units of per cell per year. Markov Chain
Monte Carlo 95% confidence intervals provided beside the maximum likelihood estimates.
*Parameters are elements of sigmoidal function for clonal proliferation (see S1 Text).
doi:10.1371/journal.pcbi.1004272.t001
Screening Model for Neoplasia in Barrett’s Esophagus
PLOS Computational Biology | DOI:10.1371/journal.pcbi.1004272 May 22, 2015 6 / 22

originated, and lastly whether the patient is a prevalent, clinical EAC case by time ts. Note, thestochastic model captures the possibility that the ancestor premalignant clone may go extinctwhile the malignant clone is still growing at the time of screening ts. Fig 3A shows the randomtrajectories for a simulated BE patient’s clones obtained via this algorithm for the five years oflife prior to initial screening at age ts = 60.
Crypt-structured spatial modeling of neoplasia. Thus far, the MSCE-EAC tissue modulehas employed the cell-level rate parameters, described and fitted to population data in theMSCE-EAC cell module, to obtain realizations of the multi-type branching process for a BE pa-tient until time of screening. In this section, we translate the size, in terms of the number ofstem cells, in each neoplastic lesion simulated by the hybrid algorithm to the actual 3D size ofthe neoplasm within the BE segment, which is important for predicting what is detected duringan endoscopic screen. This translation requires us to consider the known spatial characteristicsof BE tissue biology. The metaplasia that defines BE is made up of a monolayer of epithelialcells that form crypt-like depressions in the underlying connective tissue of the lamina propriathat are considered the basic functional unit of BE tissue [19]. These units (or crypts) are re-newed through asymmetric divisions that produce differentiated cells, which eventually die orare sloughed off the surface epithelium. Putative stem cells found at or near the crypt base ap-pear to escape this flow. Thus, under homeostatic conditions, the stem cell populations are as-sumed to remain immortal in the tissue before initiation of dysplasia. However, once a stemcell is initiated (which required two-rate limiting events in the MSCE-EAC model), it may un-dergo stochastic clonal expansion through symmetric divisions that produce two identical initi-ated stem cells or two cells committed to differentiation, or it may undergo cell death(apoptosis).
Although the mechanisms regulating neoplastic growth across crypt structured tissues arenot well understood [20], it is generally assumed that initiated stem cells either spill over andinvade neighboring crypts (“top-down” hypothesis) or that bifurcation of crypts may occur ina process called crypt fission that leads to clonal expansion at the crypt level (“bottom-up” hy-pothesis) [20]. Recent studies favor clonal expansion by crypt fission as the dominant mode ofgenerating mutated crypts in the human colon that form adenomas [20]. Our computationalmodel includes the assumption that crypt fission drives the spatial growth of neoplastic lesionsin BE.
Due to this spatial structure of crypt openings at the epithelial surface, we can represent theneoplastic clones on a 2D plane even though the crypts in BE constitute a 3D tissue as depictedin Fig 1. We introduce a single adjustable parameter for stem cell area density, σ, which equalsthe number of stem cells per mm2. To translate this parameter into numbers highlighting thecryptal organization of the BE segment, this area density can be defined as σ = cσ � k, where cσ isthe number of crypts per mm2 and k is the number of BE stem cells maintaining each crypt. Al-though σ is the parameter we will vary in our model, we introduce this representation becauseexperimental estimates are reported in terms of crypts and stem cells in each crypt. Estimatesfor the crypt density cσ in BE epithelium appear to show large inter-individual variation. Forexample, a recent study following a cohort of BE patients found cσ to range from 3 to 100(10,000–400,000 crypts per* 38cm2) [21]. The cause and significance of this variationremains unclear.
Similarly, the stem cell population size kmaintaining the crypt’s stem cell niche is also high-ly uncertain according to estimates provided in the literature on epithelial crypts. For coloniccrypts, Nicolas and colleagues estimated there are between 8 and 20 stem cells per crypt [22],yet earlier methylation studies reported* 64 per crypt [23]. There is also evidence that stemcell numbers may be significantly higher in dysplastic crypts in the colon [24]. Combined,these estimates of cσ and k provide us with an estimated range of σ 2 [24, 6400]. Because of the
Screening Model for Neoplasia in Barrett’s Esophagus
PLOS Computational Biology | DOI:10.1371/journal.pcbi.1004272 May 22, 2015 7 / 22

Fig 3. MSCE-EAC tissuemodule. A) Premalignant (dysplastic) clone growth stochastic trajectories are depicted for a sample male BE patient from the1930 birth cohort, beginning five years before time of initial screen at age 60. Most dysplastic cell progenies from a single initiated cell went extinct beforeexamination by endoscopy (trajectories depicted by gray lines and an ‘x’ at time of extinction). The dysplastic clone trajectories that did not go extinct beforeindex screen are shown in dark pink with final sizes intersecting the vertical dotted line. The dots on trajectory lines correspond to times of asymmetricdivision of a dysplastic cell to produce one dysplastic cell and one malignant cell. Malignant transformations produce both clones that quickly went extinctbefore age 60 (black dots) and non-extinct malignancies (red dot). B) BE segment at time of screening. Same simulated male patient from (A) with BE oflength 5.1 cm. Dysplastic clones (dark pink), malignant clone (red), and biopsies (black dashed rectangles) are pictured at time of biopsy-based screening,age 60. Clone diffusivity parameter is γ = −2.
doi:10.1371/journal.pcbi.1004272.g003
Screening Model for Neoplasia in Barrett’s Esophagus
PLOS Computational Biology | DOI:10.1371/journal.pcbi.1004272 May 22, 2015 8 / 22

high experimental uncertainty for the parameter σ, we allow this to be a variable parameter inour model (see Results for our calibration of σ).
To generate the spatial representation of the clones, each premalignant clone is randomlyplaced on a hexagonal grid representing the crypt-structured BE tissue. While the overall areaoccupied by a clone is controlled by the number of stem cells it contains and the stem cell den-sity σ, the spatial appearance of the clones is independently controlled by a diffusivity parame-ter γ. Briefly, clones are compact when γ> 0, becoming nearly circular when γ approaches 1.Alternatively, clones are made increasingly more diffuse and branching when γ< 0. Like σ, thespatial irregularity of neoplasm growth in BE tissue is not well known. Thus, like σ, we will con-sider γ as a second spatial variable parameter in our model.
Under our model, any premalignant ancestor cell may generate a neoplastic clone includinga simulated number of premalignant cells and possibly an embedded population of indepen-dently expanding malignant cells that originate from malignant transformation(s) with rate μ2.To accommodate malignant tumor growth, we assume that malignant crypts simply displacethe pre-existing premalignant crypts, a circumstance that is often seen in esophagectomy speci-mens [25].
In summary, for each BE patient, the MSCE-EAC tissue module first obtains the numberand sizes of both premalignant and malignant clones (at time ts) randomly generated by theMSCE-EAC hybrid simulation and then translates these numbers to a spatial configuration ofneoplasms within a patient’s BE segment. To illustrate this, we use the simulated patient’s cellu-lar information provided fromMSCE-EAC simulation shown in Fig 3A, and show in Fig 3Bthe corresponding ‘rolled out’ BE cylindrical segment generated with the spatial representationof the clones as described above, using the choices of σ = 3300 stem cells/mm2 and γ = −2. Sim-ulated premalignant and malignant lesions are depicted in dark pink and red, respectively. Theblack, dotted line rectangles represent the location of biopsies taken from the tissue under acertain screening protocol that we will explain in the following section.
MSCE-EAC Screening ModuleThe MSCE-EAC tissue module computes the number of stem cells in each neoplastic cloneand generates the shapes of these clones within a BE segment at any given age of a patient. TheMSCE-EAC screening module takes this information and performs an endoscopic screen onthis realized BE segment. Here we outline the methodology for generating model predictionsrelated to three specific screening outcomes: (1) the probability that small cancers are missedduring biopsy-based screening, (2) the potential gains in neoplasia detection probabilities ifscreening occurred via high-resolution tomographic imaging, and (3) the efficacy of ablativetreatments that result in the curative depletion of metaplastic and neoplastic cell populations inBE in terms of the long-term impact on reducing EAC incidence. These model predictions aredescribed in Results.
Biopsy screens and diagnostic sensitivity. In 1998 the American College of Gastroenter-ology (ACG) recommended the use of a systematic sampling method known as the Seattle bi-opsy protocol rather than random biopsy sampling of BE tissue during endoscopic screening.This systematic biopsy protocol specifies 4 jumbo quadrant biopsies (* 15mm2 of tissue each)every 1–2 cm of the BE length to achieve increased sensitivity for detection of dysplasia [26–28]. However, a multi-center study from 34 US states on BE surveillance found that adherenceto guidelines was only seen in 51.2% of cases [29]. The authors also found that longer segmentBE, which is more time-consuming to biopsy, was significantly associated with reduced adher-ence even though risk of EAC is considered proportional to the length of the BE segment. Inthe examples described here, we model endoscopic screening performed by the Seattle
Screening Model for Neoplasia in Barrett’s Esophagus
PLOS Computational Biology | DOI:10.1371/journal.pcbi.1004272 May 22, 2015 9 / 22
protocol, although the methods may be applied to any protocol of biopsy placement and/or bi-opsy size during upper endoscopy. Therefore, the model may be utilized for comparing simu-lated efficacies of different screening protocols. As we will see in the scenarios that follow, foran average esophageal circumference of 75 mm, even the rigorous Seattle biopsy protocol re-sults in large sampling errors due to the fact that biopsies only sample 4–6% of the total BE mu-cosal surface for pathologic assessment.
Nearly half of BE surveillance endoscopies in the US are not performed in adherence to theSeattle biopsy protocol [29] because less tissue is actually sampled than prescribed due to use ofsmaller forceps or fewer biopsies taken. Specimens for histology are typically fixed in formalin,embedded in paraffin, and tissue profiles are cut at 4–5μm and stained with haematoxylin andeosin (H&E) [25], but only few histological slides are actually examined for neoplastic changesper biopsy and the precise method of examining specimens is usually not described in publica-tions. All of the aforementioned factors may account for the large range of estimates found forprevalences of dysplasia and/or intramucosal cancer [25, 30–34].
To account for different biopsy protocols, incompletely described histological methods, andinterobserver variation of neoplasia grade, we present results from the computational modelfor different levels of diagnostic sensitivity based on the minimum number of neoplastic (pre-malignant/malignant) crypts within a simulated biopsy specimen required for pathologic diag-nosis of dysplasia/malignancy among BE patients without prior diagnosis of EAC. As depictedin the simulated BE segment of Fig 3B, some biopsy specimens taken via the Seattle protocolcontain varying numbers of neoplastic crypts while missing sizable neoplastic areas or even en-tire neoplastic clones. Since the pathologist usually assesses less than 1/10 of the actual speci-men after histologic sectioning, there is high probability that, even if neoplastic crypts exist in abiopsy specimen, no neoplastic crypts are contained on a histologic slide after sectioning. As away to capture this sensitivity, we estimated prevalences of neoplastic tissue for a range of biop-sy thresholds, i.e., the minimal proportion of neoplastic stem cells in a single biopsy needed forthe neoplasm to be detectable at time ts. Let nf be the fraction of neoplastic stem cells presentout of the total number of BE cells within a single biopsy that are required for a positive diagno-sis of neoplasia. Recall that the spatial parameter σ defines the relationship between numbers ofcells in each clone and geometric clone size. As an example, if nf = 1/2, then a simulated patientmust have at least one biopsy (among all of the biopsies obtained via the Seattle protocol) thatcontains at least 15
2s neoplastic cells (50% of stem cells in a single 15mm2 biopsy) for a positive
diagnosis of neoplasia. Therefore, the biopsy sensitivity of a screen simulated by theMSCE-EAC screening model is interpreted as (1 − nf) � 100%.
High-resolution imaging screens. Beyond different biopsy-based protocols, the screeningmodule within the MSCE-EAC screening model allows the user to also choose to simulate anyscreen using high-resolution imaging within the esophagus. The model can perform an opticalcoherence tomography (OCT) screen in which a positive detection of HGD and/or malignancyoccurs if the geometric size of a clone on image is greater than a resolution area threshold,aOCT. Thus, we no longer need to consider neoplastic proportion thresholds as we exploredpreviously for biopsy-based screening, but rather consider a fixed area or caliber threshold ofany imaged clone. The results of an imaged-based screen will again depend on parameter σ todetermine if the geometric size of a clone is above or below an imaging resolution.
Ablative treatment and impact on EAC incidence. After a simulated screen of BE pa-tients for detection of dysplasia and preclinical EAC at age ts, the MSCE-EAC screening mod-ule can be used to further simulate an intervention such as an ablative treatment using radiofrequency. To replicate current practice with radio frequency ablation (RFA), we simulate RFAtreatment on positively screened, non-EAC patients with dysplasia. The MSCE-EAC screening
Screening Model for Neoplasia in Barrett’s Esophagus
PLOS Computational Biology | DOI:10.1371/journal.pcbi.1004272 May 22, 2015 10 / 22
module then projects the EAC incidence into the future after an ablative treatment. Ablation isassumed to curatively reduce all clonal populations and the number of BE crypts by certainpercentages. As a simple example, we consider the model’s EAC incidence predictions after asingle ablative treatment when indicated by the presence of high grade dysplasia on futureEAC incidence.
For all times t> 0, we can compute the cumulative hazard ΛMSCE(t),
LMSCE
ðtÞ ¼ � ln ðSMSCE
ðtÞÞ ¼ � ln 1�Z t
0
fMSCE
ðsÞ ds� �
ð3Þ
where TC is the random variable for EAC cancer detection and fMSCE(s) is the correspondingMSCE-EAC density function. For the initial scenario of screening all individuals at time ts, wederived the MSCE-EAC cumulative hazard function that includes contributions from the sub-population of individuals found to have BE at time ts who, immediately following HGD diag-nosis, receive treatment at time ts; and the subpopulation without BE. For any time t> ts andBE cumulative distribution FBE given in Eq (2), we compute fMSCE(s) as follows
fMSCE
ðsÞ ¼ fMSCE
ðsjTBE� tsÞ � Pr ½TBE
� ts� þ fMSCE
ðsjTBE> tsÞ � Pr ½TBE
> ts�: ð4Þ
For the screened BE population we follow the method of Jeon et al. [35] to simulate the fourpossible types of cells present in a patient at screening time t�s (where the minus superscript de-notes cell populations present prior to any intervention): X = number of BE stem cells in theBE segment, P�ðt�s Þ ¼ number of preinitiated P� cells, Pðt�s Þ ¼ number of initiated, dysplasticP cells (all clones combined),Mðt�s Þ ¼ number of malignant, preclinical cancer cells (all clonescombined). The MSCE-EAC tissue module simulates realizations of these random variables foreach patient up to the instance of screening t�s , before intervention occurs. After simulating nindependent and identically distributed realizations of individuals (by gender) and performingthe Seattle biopsy screening protocol in silico on those with BE as described earlier, the screen-ing module provides the vector Ai ¼ fXi; P
�i ðt�s Þ; Piðt�s Þ;Miðt�s Þg for each patient i with BE,
i = 1, . . ., n.Next, RFA intervention may be simulated for patients diagnosed with dysplasia by introduc-
ing the following ablation proportion vector, ω = {ωX, ωP�, ωP, ωM}, that describes the cell-typespecific depletion of BE tissue. For example, to simulate a perfect ablation of all lesions in BEand of BE metaplasia itself, we set ω = {0, 0, 0, 0}. For those patients who have a positive screen,we simulate an RFA treatment by adjusting the patient’s (simulated) cell count vector Ai
through component-wise multiplication by ω. Thus, the post-RFA numbers of cells in eachstage of the MSCE process immediately after screening and treatment (denoted by time tþs ) are
given by the adjusted cell type vector Ai
Ai � o � Ai ¼ foX� Xi;oP� � P�
i ðt�s Þ;oP� Piðt�s Þ;oM
�Miðt�s Þg ð5Þ
¼ fXiðtþs Þ; P�i ðtþs Þ; Piðtþs Þ;Miðtþs Þg: ð6Þ
BE patients with a negative screen for neoplasia sustain the same (before and after) Ai � Ai
vector as was computed at time t�s since no RFA treatment is performed on these patients. Dueto the Markovian renewal property of branching processes, the survival and hazard functionsfor each screened patient i = 1, . . ., n for some time t> ts are computed using the adjustednumbers for each cell type post screen. These survival and hazard functions for the 4-stagemodel after BE onset are easily computed using the Kolmogorov backward equations for the
Screening Model for Neoplasia in Barrett’s Esophagus
PLOS Computational Biology | DOI:10.1371/journal.pcbi.1004272 May 22, 2015 11 / 22

stochastic multistage process. See S1 Text for the full derivation of all individual contributionsto ΛMSCE(t) defined by Eq (3).
Open Source CodeThe methods outlined in this section are implemented by the comprehensive MSCE-EACscreening model consisting of three modules: cell, tissue, and screening. All necessary tools toemploy this method, including examples of user inputs used in the upcoming Results, are avail-able in documented R code at https://github.com/yosoykit/MSCE_EAC_Screening_Model.
ResultsClinical studies that assess the efficacy of screening Barrett’s esophagus (BE) patients are natu-rally limited by the amount of BE tissue that can be sampled for histopathological analysis. Togain insights into how this limitation affects screening efficacy we used the described EACmul-tiscale method to compute the unobserved proportion of precursor lesions and early cancers,quantities of clinical relevance for early cancer detection. As shown here, the multistage clonalexpansion for EAC (MSCE-EAC) screening model predicts all lesions in BE during a patient’slifetime, including their numbers and sizes. The explicit calculation of the numbers of stemcells in these lesions is functionally dependent on the model parameters that, with the excep-tion of the spatial parameters introduced the Methods section, were previously estimatedthrough model calibrations to EAC incidence data in the US [12]. For each simulated BE pa-tient, we performed a pre-specified screening protocol to ascertain a patient’s clinical diagnosis,while also retaining concurrent information on any undiagnosed, potentiallydetectable lesions.
In the following results, we first calibrated the two unknown spatial parameters (neoplasticlesion shape diffusivity parameter γ and stem cell density parameter σ) to achieve consistencywith current literature findings on the prevalence of the most important neoplastic precursor,high grade dysplasia (HGD), in BE patients, without changing the parameters that determinethe fits to EAC incidence data reported in [12]. Thus fully calibrated, we then applied theMSCE-EAC screening model to predict three important clinical outcomes, including biopsyand imaging diagnostic sensitivities and the impact of ablative treatment on the risk of develop-ing EAC.
Calibration to High Grade Dysplasia Prevalence DataIn the current epidemiological literature, studies beginning with a biopsy-based index screen ofBE patients (i.e., the screen when a patient is first diagnosed with BE) provide widely variableestimates of the prevalence of HGD, ranging from* 2.75–8.25% [25, 30–34]. To compare thiswith model-derived predictions, we simulated an index endoscopic screen on a sample popula-tion of patients with BE and computed the prevalences of both premalignancy (HGD) andscreen-detected (non symptomatic) malignancy. For an illustrative example of the MSCE-EACscreening model outputs, we simulated an index endoscopy for all males and females at screen-ing time (age) ts = 60 in the year 1990 (indicative of index screens from prospective studies thatestimate the BE to EAC progression rate). With the BE prevalence given in Eq (2), these resultsfocus on expected observations in output regarding the subpopulation of individuals foundwith BE, for whom the MSCE-EAC screening model provides screening results (see Methods).
Because the detection of a neoplastic lesion may involve both premalignant and malignantcells transformed within the lesion, we first consider the (random) sum of the two cell types todetermine the efficacy of the biopsy protocol to detect a neoplastic lesion in BE. The biopsysensitivity was varied from 10% to 95%, as seen in Figs 4 and 5, to allow for systematic
Screening Model for Neoplasia in Barrett’s Esophagus
PLOS Computational Biology | DOI:10.1371/journal.pcbi.1004272 May 22, 2015 12 / 22

exploration of sensitivity effects (see Methods). If a neoplasm is detected on a biopsy, we dou-bled the biopsy sensitivity for malignant content because the biopsy is under closer inspection.
Parameter estimation and sensitivity. To compute the prevalence of HGD without con-current malignancy, we adjusted the BE population denominator to not include those withscreen-detected cancer on index endoscopy. We then computed the probability of detectingHGD for a range of values for σ and γ. We found that when σ is assumed to be in the range of2000 to 5000 mm2, the model produces HGD prevalence estimates that are broadly consistentwith the range of published estimates for the span of biopsy sensitivities (see Fig 4) [25, 30–34].In particular, the model estimated an expected range of 2.1%–8.7% for HGD prevalenceamong men and an expected range of .85%–6.1% for HGD prevalence among women whenusing a density of σ = 3300 stem cells/mm2. For each choice of σ, the results were mostly insen-sitive to the choice of diffusivity parameter γ (see right panel of Fig 4).
We present forthcoming results using the cell-level parameters found in Table 1, σ = 3300 (σ2 [2000, 5000] shown for sensitivity illustration), and γ = 1. The model parameters reproducepopulation-level EAC incidence data (obtained through symptomatic detection [12]) andHGD prevalence data (obtained from biopsying BE tissue at specific locations using a standardprotocol).
Fig 4. High grade dysplasia prevalences in BE estimated with the MSCE-EAC screeningmodel. (Left panel) Probability of high grade dysplasiadetection among BE patients simulated by the MSCE-EAC screening model for males (red, solid) and females (blue, dash-dotted) at initial screen at age 60for biopsy sensitivities ranging from 10%–95% and assumed density of σ = 3300 stem cells/mm2 (shaded regions represent sensitivity of results for σ 2[2000, 5000]). Since the sensitivity of each study is unknown, literature values for the corresponding probability of HGD detection are depicted as horizontalgrey dotted lines at a single percentage level [25, 30–34]. Expected prevalences produced by 100K simulation size of BE patients, shown for males andfemales. Simulation standard error is less than .001 for all Results. (Right panel) Male HGD prevalences produced by diffusive clone growth on hexagonal BEgrid, for diffusivity parameter γ ranging from 1 to −8, versus isotropic, circular clone assumption (red, solid). Solid curve is the same as that shown for males inleft panel. Probabilities of finding HGD for spatially simulated diffusive clone growth are shown for σ = 3300 stem cells/mm2 and identical biopsy sensitivitiesas shown in left panel. As explained in Methods, the assumption of γ = 1 results in almost identical prevalences to the circular clonal growth assumption.Overall, the results from 10K simulated male BE patients yield very similar prevalences regardless of clone shape for mid-range biopsy sensitivities.
doi:10.1371/journal.pcbi.1004272.g004
Screening Model for Neoplasia in Barrett’s Esophagus
PLOS Computational Biology | DOI:10.1371/journal.pcbi.1004272 May 22, 2015 13 / 22

By estimating the same breadth of HGD prevalences as studies have reported [25, 30–34],Fig 4 illustrates our prediction that HGD detection is strongly dependent on nf, the minimumneoplastic tissue fraction for detection in a single biopsy (see Methods). Specifically, by increas-ing biopsy sensitivity from 10% to 95%, our model predicted that the prevalence of HGD in-creases 4-fold. Further, even though most clones remain undetected, the mean number of non-extinct premalignant clones in this cohort was 6.6 per BE patient (See S4–S7 Figs). This model-ing result highlights the prediction that even with rigorous adherence to the Seattle protocol,the majority of BE patients with concurrent HGD will not be detected nor considered prevalentHGD cases.
Missed EACMalignancies in HGD PatientsAlong with difficulties in first detecting dyplasia present in BE during endoscopic screening,several studies suggest that many BE patients who are diagnosed with HGD without malignan-cy actually have an undetected cancer that was missed during biopsy screening [36, 37]. TheMSCE-EAC screening model estimates the probability that a positive HGD patient actuallyharbors a synchronous, occult malignant clone that is not screen-detected either because it wascompletely missed in a biopsy sample (e.g. see the small malignancy depicted in Fig 3B) or be-cause it was undetected in a biopsy for a particular biopsy sensitivity, perhaps due to insuffi-cient histologic sectioning. This is an interesting, clinically relevant feature of our modeling.The model predicted the expected fraction of undetected EAC in BE patients diagnosed withHGD to be between 3.2%–14.2% for men and 4.3%–19.3% for women (see Fig 5). We concludethat the higher probability of missed malignancy in women is due to the lower probability offinding any neoplasia (due to smaller clone sizes, S4–S7 Figs) in women during index endosco-py (see Fig 4).
These predicted ranges are compared with studies of HGD patients found with concurrentadenocarcinoma, which remained undetected even by rigorous biopsy protocols but are laterdiscovered during resection of the esophagus [38–42]. However, from these esophagectomystudies conducted over the past two decades, the reported prevalence of synchronous malig-nancy among HGD patients widely varies from 0–75%. With strict adherence to the Seattleprotocol, our model generated a lower estimate of concurrent EAC risk in HGD patients thanmost published studies, yet it is consistent with the most recent study by Konda et al. whenbiopsy sensitivity is low [41]. It is also possible that the studies with high estimates of concur-rent malignancy were biased because cancer was suspected in these patients indicatingesophagectomy.
Predicted HGD Prevalence with Image-based ScreeningHigh-resolution imaging of BE (a technology still in infancy and not yet widely utilized) mayprovide a benefit through the early detection and endoscopic resection of small premalignantand malignant lesions. The MSCE-EAC screening model can explore the potential quantitativeimprovements of screening for neoplasia when diagnosed via optical endomicroscopy com-pared with a less sensitive biopsy protocol.
To this end, we simulated the results from an optical coherence tomography (OCT) screenin which a positive detection of HGD and/or malignancy occurs if the geometric size of a cloneon image is greater than a resolution area threshold, aOCT (see Methods). Assuming aOCT =1mm2 and the same assumption for stem cell density σ that was used in previous results, theHGD prevalence (excluding incident EAC cases) rose to an expected 27.89% for the BE cohortused in the previous examples (1930 birth year, ts = 60). Therefore, for the range of probabili-ties of HGD detection shown in Fig 4, the MSCE-EAC screening model estimated an expected
Screening Model for Neoplasia in Barrett’s Esophagus
PLOS Computational Biology | DOI:10.1371/journal.pcbi.1004272 May 22, 2015 14 / 22

68.7% to 92.8% increase in HGD detection probability using a sensitive imaging technology forscreening rather than biopsy-based screening. This modeling exercise reinforces the conclusionthat many neoplastic clones of detectable size are being missed with current biopsy protocolscreening endoscopies.
Predicted EAC Incidence after TreatmentAs a third example demonstrating the utility of the MSCE-EAC screening model, we computedthe projected cumulative hazard ΛMSCE(t) in Eq (3) after a single index screen of BE patients attime ts = 60, removal of screen-detected EAC patients, and subsequent RFA treatment of HGDpositive patients. We explored RFA efficacy under various assumptions about the impact of ab-lation on cell counts, as specified by the ablation proportion vector ω (see Methods). Whencomparing to the background incidence (in which no screening occurs), we predicted the effecton EAC cumulative incidence based on a range of RFA effectiveness assumptions (See Fig 6). If
Fig 5. Predicted probability of missedmalignancy in positive high grade dysplasia population atindex screen. Percentages of patients diagnosed with HGD during index endoscopy (denominator ispopulation plotted in Fig 4) who concurrently harbored missed, malignant clone(s) present on their BEsegments that were not detected on biopsy screen. Since the sensitivity of each study is unknown, literaturevalues for the corresponding probability of missed malignancy are depicted as horizontal grey dotted lines ata single percentage level [25, 30–34]. One publication included percentage of occult malignancy after HGDwas diagnosed with either standard or jumbo forcep sizes, as indicated [38]. Expected proportions producedwith 100K BE patient simulations each for males (red, solid) and females (blue, dash-dotted) with assumeddensity of σ = 3300 stem cells/mm2 (shaded regions represent sensitivity of results for σ 2 [2000, 5000]).
doi:10.1371/journal.pcbi.1004272.g005
Screening Model for Neoplasia in Barrett’s Esophagus
PLOS Computational Biology | DOI:10.1371/journal.pcbi.1004272 May 22, 2015 15 / 22

patients that were positively detected with HGD at index screen (6% with 60% biopsy sensitivi-ty) receive RFA, the MSCE-EAC screening model predicted that by year 2030, expected EACcumulative incidence will be reduced by 17.1% if 50% of all BE cell types are effectively re-moved (ω = {.5, .5, .5, .5}) and be reduced by 32.1% if 99% of all BE cell types are effectively re-moved (ω = {.01, .01, .01, .01}). To explore the future influence of missed malignancies, themodel predicted that if RFA removed all malignancies (ω = {1, 1, 1, 0}) but left behind theHGD tissue, then treatment would only moderately reduce future EAC cumulative incidenceby an expected 15.7% before 2030. However, removing the HGD tissue as well as preclinicalmalignancies (ω = {1, 1, 0, 0}) during treatment would create a more significant average reduc-tion in EAC cumulative incidence of an expected 38.7%. The model’s predictions of the possi-ble RFA effects on cell populations seem to support the hypothesis that the effectiveness ofRFA is determined by its ability to ablate premalignant (dysplastic) tissue.
Fig 6. Predicted EAC cumulative age-specific incidence by the MSCE-EAC screeningmodel after RFAtreatment of HGD patients at index screen. EAC cumulative age-specific incidence for four differentablation efficiencies of detected HGD patients at screening of 60 year old males in year 2010. Survival for thefour cell types following ablation modeled are represented by ablation proportion vectorω, withω = {1, 1, 1, 1}(no treatment, blue line),ω = {.5, .5, .5, .5} (red, circles),ω = {.01, .01, .01, .01} (purple, diamonds),ω = {1, 1,1, 0} (light blue, triangles),ω = {1, 1, 0, 0} (green, squares). Scenarios plotted for σ = 3300 stem cells/mm2
and 60% biopsy sensitivity, resulting in 6% HGD cases, without detected malignancy, in the non EACpopulation at screening time (100K BE patient simulation size).
doi:10.1371/journal.pcbi.1004272.g006
Screening Model for Neoplasia in Barrett’s Esophagus
PLOS Computational Biology | DOI:10.1371/journal.pcbi.1004272 May 22, 2015 16 / 22

Interestingly, even the biopsy procedure on all BE patients offers a slight therapeutic effect(EAC cumulative incidence will not return to background) by the mere chance of endoscopi-cally removing, at times, significant amounts of neoplastic tissue in a biopsy specimen, assum-ing no negative effects from wounding associated with tissue removal. These results are clearlya simplification of a highly variable and complex clinical procedure, representing only a basicexample, but the model is poised to incorporate realistic RFA touch-ups throughout surveil-lance, as it occurs in current practice, to give increasingly realistic projections.
DiscussionAlthough few Barrett’s esophagus (BE) patients progress to EAC in their lifetime, the cancerburden is considerable due to generally poor treatment outcomes and survival. EAC contrib-utes approximately 4% to all male cancer deaths in the US [43] with a flattening but still in-creasing trend in mortality according to recent projections based on Surveillance,Epidemiology, and End Results (SEER) data [12]. Because BE is an actionable EAC precursorwith a considerable prevalence of 1–3% in the general population [9, 10] (translating into alarge number of individuals) and an annual risk of progressing to EAC of approximately 0.2–0.5% per year [3], optimal surveillance for neoplastic alterations in BE and effective treatmentstrategies are a major challenge to clinicians given the current lack of evidence-based decisiontools. Thus we have developed a detailed multiscale model of EAC to better understand thenatural history and impact of screening, intervention, and prevention of EAC.
The mathematical framework of our multistage clonal expansion for EAC (MSCE-EAC)screening model describes the step-wise progression and transformation from normal squa-mous esophageal tissue to a columnar crypt-structured metaplastic tissue in which clonal ex-pansions of dysplastic and malignant cells can occur. Because the description is fully stochastic,it affords predictions of important clinical endpoints that reflect the intrinsic (inter-individual)heterogeneity in the disease process that explains, at least in part, why some individuals prog-ress to cancer in their life-time while others do not.
In contrast to earlier formulations of the multistage clonal expansion (MSCE) model forEAC [16, 17], which analyzed patterns of EAC incidence in the general population, the presentmodel includes two novel modules for exploration of clinical endpoints before symptomaticdetection of EAC. The tissue module explicitly computes the number and sizes of neoplasticclones in a BE patient and quantifies their spatial structure within an idealized crypt-structuredBE segment at time of screening. With this patient-specific information, we then employ ascreening module to perform a screen in silico at a specified screening age. As our BE screeningexamples demonstrate, this model extension makes it possible to explicitly explore current BEscreening efficacy while controlling the operational characteristics of the screening protocol.We show that the detection of high grade dysplasia (HGD) or cancer using the standard (Seat-tle) biopsy protocol is strongly dependent on the minimum neoplastic tissue fraction needed tobe detectable in the biopsy. This sensitivity would be further affected by altering the spacing be-tween biopsy levels and size of the biopsy forceps according to different protocols. Additional-ly, our MSCE-EAC screening model predicts that over 10% of BE patients screened whoreceive a diagnosis of HGD with biopsy-based screening also harbor a missed preclinical malig-nancy with mid-range biopsy sensitivity. We find that the overall efficacy of the biopsy proto-col is highly uncertain due to variability in tissue sampling between practitioners and due toconsiderable uncertainties in the histological assessment of the biopsied tissues.
Our results also suggest that even the best current biopsy protocols may miss between 70%–
90% of small HGD lesions that are detectable when using high-resolution optical coherence to-mography (OCT) imaging at 1mm resolution. While not yet widely available, high-resolution
Screening Model for Neoplasia in Barrett’s Esophagus
PLOS Computational Biology | DOI:10.1371/journal.pcbi.1004272 May 22, 2015 17 / 22

OCT allows a more complete (wide-field) examination of the BE segment. Our results suggestthat OCT could surpass the biopsy-based protocols in efficacy to detect neoplastic lesions.However, because quantitative data with OCT are still lacking, the results remain speculative,but serve to demonstrate the potential gains of OCT screening over the standardbiopsy protocol.
Finally, the present framework also allows for the modeling of treatment, such as radio fre-quency ablation (RFA). Ablation attempts to remove the intestinal metaplasia together with allneoplastic cells. Assuming that ablation simply decimates the number of BE, dysplastic, andmalignant crypts by specific fractions, we computed the residual cancer risk of EAC after RFA(see Fig 6). This ‘decimation by fraction’ approach also lends itself to modeling the curative ef-fect of multiple RFA ‘touch-ups’ delivered over a span of time to improve RFA efficacy. Fromthe results derived from simulating an ablative treatment on a population of BE patients foundto be positive for HGD during screening, we found that it was crucial to ablate dysplastic andnot only preclinical malignant tissue to achieve the most significant impact on future EAC inci-dence. Although the example given in this study is somewhat simplistic and does not includethe random spatial characteristics of the ablation process, the model framework can accommo-date more complex assumptions regarding the biological effects of RFA, including random spa-tial effects of the ablation ‘burn’ and localized presence of intestinal metaplasia hidden beneaththe neosquamous tissue after RFA treatment.
In summary, the MSCE-EAC screening model introduced in this paper offers a comprehen-sive multiscale method to model the neoplastic processes unfolding in BE together with amechano-spatial modeling of the screening process and treatment. Our results demonstratethe limitations of the standard biopsy-based protocol for the detection of HGD and early can-cer due to a highly heterogeneous distribution of dysplastic precursors and malignant foci thatcan arise in dysplasia. We further demonstrate that these limitations could be overcome byhigh-resolution OCT imaging which may provide additional biological details and insightsinto the cancer process, including the growth dynamics of neoplastic clones (in particular theirnumbers and sizes over time), information that can easily be incorporated into the multiscaledescription of EAC development and screening presented here.
Supporting InformationS1 Fig. Male symptomatic GERD and BE prevalences in the MSCE-EAC screening model.(Left panel) GERD symptom prevalence psGERD(t). (Right panel) BE prevalence FBE(t) formales, assuming RR = 5 relative risk for symptomatic GERD patients.(TIFF)
S2 Fig. Female symptomatic GERD and BE prevalences in the MSCE-EAC screeningmodel. (Left panel) GERD symptom prevalence psGERD(t). (Right panel) BE prevalence FBE(t)for females, assuming RR = 5 relative risk for symptomatic GERD patients.(TIFF)
S3 Fig. Comparison of neoplastic clone growth simulation accuracies using stochastic sim-ulation algorithm (SSA) and τ-leaping. Quantile-quantile plots of simulated non-extinctbirth-death-mutation processes with ε = .0005, stopped at time t = 30 years after first P cell ini-tiated. Left, SSA sizes vs. geometric distribution sizes. Right, τ-leap sizes vs. geometric distribu-tion sizes. Black triangles denote 10th, 50th, and 90th percentiles. Results shown for 100Ksimulations for each of the three types. Both SSA and τ-leap reproduce the theoretical geomet-ric distribution very well.(TIFF)
Screening Model for Neoplasia in Barrett’s Esophagus
PLOS Computational Biology | DOI:10.1371/journal.pcbi.1004272 May 22, 2015 18 / 22

S4 Fig. Simulated distributions of number and sizes of non-extinct premalignant clones,males. (Left panel) Histogram of number of non-extinct premalignant clones in BE segment attime of screening. (Right panel) Histogram of number of premalignant stem cells in each of theindependent premalignant clones accounted for in left panel. Example shown for 100K maleswith BE, age 60 from the 1930 birth cohort. Median and mean values are depicted by dashedand dotted lines, respectively. Assuming σ = 3300 stem cells/mm2, the dashed-dotted line onthe right graph gives the number of cells in a 1mm2 surface area of tissue.(TIFF)
S5 Fig. Simulated distributions of number and sizes of non-extinct malignant clones,males. (Left panel) Histogram of number of non-extinct malignant clones in BE segment attime of screening, each originating from unique premalignant ancestor clone. (Right panel)Histogram of number of malignant stem cells in each of the independent malignant clones ac-counted for in left panel. Example shown for 100K males with BE, age 60 from the 1930 birthcohort. Median and mean values are depicted by dashed and dotted lines, respectively. Assum-ing σ = 3300 stem cells/mm2, the dashed-dotted line on the right graph gives the number ofcells in a 1mm2 surface area of tissue.(TIFF)
S6 Fig. Simulated distributions of number and sizes of non-extinct premalignant clones, fe-males. (Left panel) Histogram of number of non-extinct premalignant clones in BE segment attime of screening. (Right panel) Histogram of number of premalignant stem cells in each of theindependent premalignant clones accounted for in left panel. Example shown for 100K femaleswith BE, age 60 from the 1930 birth cohort. Median and mean values are depicted by dashedand dotted lines, respectively. Assuming σ = 3300 stem cells/mm2, the dashed-dotted line onthe right graph gives the number of cells in a 1mm2 surface area of tissue.(TIFF)
S7 Fig. Simulated distributions of number and sizes of non-extinct malignant clones, fe-males. (Left panel) Histogram of number of non-extinct malignant clones in BE segment attime of screening, each originating from unique premalignant ancestor clone. (Right panel)Histogram of number of malignant stem cells in each of the independent malignant clones ac-counted for in left panel. Example shown for 100K females with BE, age 60 from the 1930 birthcohort. Median and mean values are depicted by dashed and dotted lines, respectively. Assum-ing σ = 3300 stem cells/mm2, the dashed-dotted line on the right graph gives the number ofcells in a 1mm2 surface area of tissue.(TIFF)
S1 Text. Additional mathematical methods and derivations for the MSCE-EAC screeningmodel. This includes derivations and equations for MSCE-EAC model hazard functions, de-tails about parameter estimation, and steps for hybrid algorithm for simulatingcell populations.(PDF)
AcknowledgmentsWe thank our colleagues Dr. John Inadomi (University of Washington), Dr. Chin Hur (Massa-chusetts General Hospital), Dr. Melissa Upton (University of Washington), and Dr. Tom Paul-son (FHCRC) for helpful discussions.
Screening Model for Neoplasia in Barrett’s Esophagus
PLOS Computational Biology | DOI:10.1371/journal.pcbi.1004272 May 22, 2015 19 / 22

Author ContributionsConceived and designed the experiments: KCWDH JJ EGL. Performed the experiments: KCWDH. Analyzed the data: KCWDH JJ EGL. Contributed reagents/materials/analysis tools: KCWDH JJ EGL. Wrote the paper: KCWDH EGL.
References1. Thrift AP, Whiteman DC (2012) The incidence of esophageal adenocarcinoma continues to rise: analy-
sis of period and birth cohort effects on recent trends. Ann Oncol 23: 3155–3162. PMID: 22847812
2. Hur C, Miller M, Kong CY, Dowling EC, Nattinger KJ, et al. (2013) Trends in esophageal adenocarcino-ma incidence and mortality. Cancer 119: 1149–1158. doi: 10.1002/cncr.27834 PMID: 23303625
3. Prasad G, Bansal A, Sharma P, Wang K (2010) Predictors of progression in Barrett’s esophagus: cur-rent knowledge and future directions. Am J Gastroenterol 105: 1490–1502. doi: 10.1038/ajg.2010.2PMID: 20104216
4. Reid BJ, Li X, Galipeau PC, Vaughan TL (2010) Barrett’s oesophagus and oesophageal adenocarcino-ma: time for a new synthesis. Nat Rev Cancer 10: 87–101. doi: 10.1038/nrc2773 PMID: 20094044
5. Barrett M, Sanchez C, Prevo L, Wong D, Galipeau P, et al. (1999) Evolution of neoplastic cell lineagesin Barrett oesophagus. Nat Genet 22: 106–109. doi: 10.1038/8816 PMID: 10319873
6. Maley C (2007) Multistage carcinogenesis in Barrett’s esophagus. Cancer Lett 245: 22–32. doi: 10.1016/j.canlet.2006.03.018 PMID: 16713672
7. Neshat K, Sanchez C, Galipeau P, Cowan D, Ramel S, et al. (1994) Barrett’s esophagus: A model ofhuman neoplastic progression. Cold Spring Harb Symp Quant Biol 59: 577–583. doi: 10.1101/SQB.1994.059.01.065 PMID: 7587115
8. Paulson T, Maley C, Xiaohong L (2009) Chromosomal instability and copy number alterations in Bar-rett’s esophagus and esophageal adenocarcinoma. Clin Cancer Res 15: 3305–3314. doi: 10.1158/1078-0432.CCR-08-2494 PMID: 19417022
9. Ronkainen J, Aro P, Storskrubb T, Johansson S, Lind T, et al. (2005) Prevalence of Barrett’s esopha-gus in the general population: an endoscopic study. Gastroenterology 129: 1825–1831. doi: 10.1053/j.gastro.2005.08.053 PMID: 16344051
10. Cameron A, Zinsmeister A, Ballard D, Carney J (1990) Prevalence of columnar-lined (Barrett’s) esoph-agus. comparison of population-based clinical and autopsy findings. Gastroenterology 99: 918–922.PMID: 2394347
11. Surveillance, Epidemiology, and End Results (SEER) Program (www.seer.cancer.gov) SEER*Stat Da-tabase: Incidence—SEER 9 Regs Research Data, Nov 2013 Sub (1973–2011) Katrina/Rita PopulationAdjustment—Linked To County Attributes—Total U.S., 1969–2012 Counties, National Cancer Institute,DCCPS, Surveillance Research Program, Surveillance Systems Branch, released April 2014, basedon the November 2013 submission.
12. Kong CY, Kroep S, Curtius K, HazeltonWD, Jeon J, et al. (2014) Exploring the recent trend in esoph-ageal adenocarcinoma incidence and mortality using comparative simulation modeling. Cancer Epide-miol Biomarkers Prev 23: 997–1006. doi: 10.1158/1055-9965.EPI-13-1233 PMID: 24692500
13. Taylor J, Rubenstein J (2010) Meta-analyses of the effect of symptoms of gastroesophageal reflux onthe risk of Barrett’s esophagus. Am J Gastroenterol 105: 1730–1737. doi: 10.1038/ajg.2010.194
14. Falk GW, Jacobson BC, Riddell RH, Rubenstein JH, El-Zimaity H, et al. (2011) Barrett’s esophagus:prevalence-incidence and etiology-origins. Ann NY Acad Sci 1232: 1–17. doi: 10.1111/j.1749-6632.2011.06042.x PMID: 21950804
15. Thrift A, Kramer J, Qureshi Z, Richardson P, El-Serag H (2013) Age at onset of gerd symptoms predictsrisk of Barrett’s esophagus. Am J Gastroenterol 108: 915–922. doi: 10.1038/ajg.2013.72 PMID:23567358
16. Jeon J, Luebeck E, Moolgavkar S (2006) Age effects and temporal trends in adenocarcinoma of theesophagus and gastric cardia (united states). Cancer Cause Control 17: 971–981. doi: 10.1007/s10552-006-0037-3
17. Luebeck E, Curtius K, Jeon J, HazeltonW (2013) Impact of tumor progression on cancer incidencecurves. Cancer Res 73: 1086–1096. doi: 10.1158/0008-5472.CAN-12-2198 PMID: 23054397
18. Gillespie D (1977) Exact stochastic simulation of coupled chemical reactions. J Phys Chem 81: 2340–2361. doi: 10.1021/j100540a008
Screening Model for Neoplasia in Barrett’s Esophagus
PLOS Computational Biology | DOI:10.1371/journal.pcbi.1004272 May 22, 2015 20 / 22

19. Reya T, Clevers H (2005) Wnt signaling in stem cells and cancer. Nature 434: 843–850. doi: 10.1038/nature03319 PMID: 15829953
20. Humphries A, Wright N (2008) Colonic crypt organization and tumorigenesis. Nature 8: 415–424.
21. Kostadinov RL, Kuhner MK, Li X, Sanchez CA, Galipeau PC, et al. (2013) Nsaids modulate clonal evo-lution in barrett’s esophagus. PLoS Genet 9: e1003553. doi: 10.1371/journal.pgen.1003553 PMID:23785299
22. Nicolas P, Kim K, Shibata D, Tavare S (2007) The stem cell population of the human colon crypt: Analy-sis via methylation patterns. PLoS Comput Biol 3: e28. doi: 10.1371/journal.pcbi.0030028 PMID:17335343
23. Yatabe Y, Tavaré S, Shibata D (2001) Investigating stem cells in human colon by using methylation pat-terns. Proc Natl Acad Sci U S A 98: 10839–10844. doi: 10.1073/pnas.191225998 PMID: 11517339
24. Baker AM, Cereser B, Melton S, Fletcher AG, Rodriguez-Justo M, et al. (2014) Quantification of Cryptand Stem Cell Evolution in the Normal and Neoplastic Human Colon. Cell Rep 8: 940–947. doi: 10.1016/j.celrep.2014.07.019 PMID: 25127143
25. Miros M, Kerlin P, Walker N (1991) Only patients with dysplasia progress to adenocarcinoma in Bar-rett’s oesophagus. Gut 32: 1441–1446. doi: 10.1136/gut.32.12.1441 PMID: 1773946
26. Abela J, Going J, Mackenzie J, McKernan M, O’Mahoney M, et al. (2008) Systematic four-quadrant bi-opsy detects Barrett’s dysplasia in more patients than nonsystematic biopsy. Am J Gastroenterol 103:850–855. doi: 10.1111/j.1572-0241.2007.01746.x PMID: 18371135
27. Peters F, Curvers W, RosmolenW, de Vries C, Ten Kate F, et al. (2008) Surveillance history of endo-scopically treated patients with early Barrett’s neoplasia: nonadherence to the Seattle biopsy protocolleads to sampling error. Dis Esophagus 21: 475–479. doi: 10.1111/j.1442-2050.2008.00813.x PMID:18430186
28. Reid B, Weinstein W, Lewin K, Haggit R, VanDeventer G, et al. (1988) Endoscopic biopsy can detecthigh-grade dysplasia or early adenocarcinoma in Barrett’s esophagus without grossly recognizableneoplastic lesions. Gastroenterology 94: 81–90. PMID: 3335302
29. Abrams JA, Kapel RC, Lindberg GM, Saboorian MH, Genta RM, et al. (2009) Adherence to biopsyguidelines for Barrett’s esophagus surveillance in the community setting in the United States. Clin Gas-troenterol Hepatol 7: 736–742. doi: 10.1016/j.cgh.2008.12.027 PMID: 19268726
30. O’Connor J, Falk G, Richter J (1999) The incidence of adenocarcinoma and dysplasia in Barrett’sesophagus report on the cleveland clinic barrett’s esophagus registry. Am J Gastroenterol 94: 2037–2042. doi: 10.1016/S0002-9270(99)00331-7 PMID: 10445525
31. Conio M, Blanchi S, Lapertosa G, Ferraris R, Sablich R, et al. (2003) Long-term endoscopic surveil-lance of patients with Barrett’s esophagus. incidence of dysplasia and adenocarcinoma: A prospectivestudy. Am J Gastroenterol 98: 1931–1939. doi: 10.1111/j.1572-0241.2003.07666.x PMID: 14499768
32. Sharma P, Falk G, Weston A, Reker D, Johnston M, et al. (2006) Dysplasia and cancer in a large multi-center cohort of patients with Barrett’s esophagus. Clin Gastroeneterol H 4: 566–572. doi: 10.1016/j.cgh.2006.03.001
33. Guardino J, Khandwala F, Lopez R, Wachsberger D, Richter J, et al. (2006) Barrett’s esophagus at atertiary care center: Association of age on incidence and prevalence of dysplasia and adenocarcinoma.Am J Gastroenterol 101: 2187–2193. doi: 10.1111/j.1572-0241.2006.00736.x PMID: 17032182
34. Weston A, Badr A, Hassanein R (1999) Prospective multivariate analysis of clinical, endoscopic, andhistological factors predictive of the development of Barrett’s multifocal high-grade dysplasia or adeno-carcinoma. Am J Gastroenterol 94: 3413–3419. doi: 10.1111/j.1572-0241.1999.01602.x PMID:10606296
35. Jeon J, Meza R, Moolgavkar S, Luebeck G (2008) Evaluation of screening strategies for pre-malignantlesions using a biomathematical approach. Math Biosci 213: 56–70. doi: 10.1016/j.mbs.2008.02.006PMID: 18374369
36. Reid B, Blount P, Feng Z (2000) Optimizing endoscopic biopsy detection of early cancers in Barrett’shigh-grade dysplasia. Am J Gastroenterol 95: 3089–3096. doi: 10.1111/j.1572-0241.2000.03182.xPMID: 11095322
37. Tschanz E (2005) Do 40% of patients resected for Barrett esophagus with high-grade dysplasia haveunsuspected adenocarcinoma? Arch Pathol Lab Med 129: 177–180. PMID: 15679415
38. Falk G, Rice T, Goldblum J, Richter J (1999) Jumbo biopsy forceps protocol still misses unsuspectedcancer in Barrett’s esophagus with high-grade dysplasia. Gastrointest Endosc 49: 170–176. doi: 10.1016/S0016-5107(99)70482-7 PMID: 9925694
39. Cameron A, Carpenter H (1997) Barrett’s esophagus, high-grade dysplasia, and early adenocarcino-ma: A pathological study. Am J Gastroenterol 92: 586–591. PMID: 9128304
Screening Model for Neoplasia in Barrett’s Esophagus
PLOS Computational Biology | DOI:10.1371/journal.pcbi.1004272 May 22, 2015 21 / 22

40. Peters JH, Clark G, Ireland AP, Chandrasoma P, Smyrk TC, et al. (1994) Outcome of adenocarcinomaarising in Barrett’s esophagus in endoscopically surveyed and nonsurveyed patients. J Thorac Cardio-vasc Surg 108: 813–21. PMID: 7967662
41. Konda V, Waxman I (2011) Low risk of prevalent submucosal invasive cancer among patients undergo-ing esophagectomy for treatment of Barrett’s esophagus with high grade dysplasia. J GastrointestOncol 2: 1–4. doi: 10.3978/j.issn.2078-6891.2011.005 PMID: 22811818
42. Heitmiller R, RedmondM, Hamilton S (1996) Barrett’s esophagus with high-grade dysplasia, an indica-tion for prophylactic esophagectomy. Ann Surg 224: 66–71. doi: 10.1097/00000658-199607000-00010 PMID: 8678620
43. (2014). URL http://www.cancer.org/.
Screening Model for Neoplasia in Barrett’s Esophagus
PLOS Computational Biology | DOI:10.1371/journal.pcbi.1004272 May 22, 2015 22 / 22


