Embed Size (px)
Citation preview
BioMed CentralMolecular Cancer
ss
Open AcceResearchSimilarity of aberrant DNA methylation in Barrett's esophagus and esophageal adenocarcinomaEric Smith1, Neville J De Young1, Sandra J Pavey2, Nicholas K Hayward2, Derek J Nancarrow2, David C Whiteman3, B Mark Smithers4, Andrew R Ruszkiewicz5, Andrew D Clouston4, David C Gotley4, Peter G Devitt1, Glyn G Jamieson1 and Paul A Drew*6Address: 1Discipline of Surgery, School of Medicine, The University of Adelaide, Royal Adelaide Hospital, Adelaide, South Australia, 5005, Australia, 2Oncogenomics, Queensland Institute of Medical Research, Brisbane, 4006, Australia, 3Division of Population Studies and Human Genetics, Queensland Institute of Medical Research, Brisbane, 4006, Australia, 4School of Medicine, University of Queensland, Brisbane, Queensland, 4072, Australia, 5Division of Tissue Pathology, Institute of Medical and Veterinary Science, Adelaide, South Australia, 5000, Australia and 6School of Nursing and Midwifery, Flinders University, Bedford Park, South Australia, 5042, Australia
Email: Eric Smith - [email protected]; Neville J De Young - [email protected]; Sandra J Pavey - [email protected]; Nicholas K Hayward - [email protected]; Derek J Nancarrow - [email protected]; David C Whiteman - [email protected]; B Mark Smithers - [email protected]; Andrew R Ruszkiewicz - [email protected]; Andrew D Clouston - [email protected]; David C Gotley - [email protected]; Peter G Devitt - [email protected]; Glyn G Jamieson - [email protected]; Paul A Drew* - [email protected]
* Corresponding author
AbstractBackground: Barrett's esophagus (BE) is the metaplastic replacement of squamous with columnar epithelium in the esophagus,as a result of reflux. It is the major risk factor for the development of esophageal adenocarcinoma (EAC). Methylation of CpGdinucleotides of normally unmethylated genes is associated with silencing of their expression, and is common in EAC. This studywas designed to determine at what stage, in the progression from BE to EAC, methylation of key genes occurs.
Results: We examined nine genes (APC, CDKN2A, ID4, MGMT, RBP1, RUNX3, SFRP1, TIMP3, and TMEFF2), frequentlymethylated in multiple cancer types, in a panel of squamous (19 biopsies from patients without BE or EAC, 16 from patientswith BE, 21 from patients with EAC), BE (40 metaplastic, seven high grade dysplastic) and 37 EAC tissues. The methylationfrequency, the percentage of samples that had any extent of methylation, for each of the nine genes in the EAC (95%, 59%, 76%,57%, 70%, 73%, 95%, 74% and 83% respectively) was significantly higher than in any of the squamous groups. The methylationfrequency for each of the nine genes in the metaplastic BE (95%, 28%, 78%, 48%, 58%, 48%, 93%, 88% and 75% respectively) wassignificantly higher than in the squamous samples except for CDKN2A and RBP1. The methylation frequency did not differbetween BE and EAC samples, except for CDKN2A and RUNX3 which were significantly higher in EAC. The methylation extentwas an estimate of both the number of methylated alleles and the density of methylation on these alleles. This was significantlygreater in EAC than in metaplastic BE for all genes except APC, MGMT and TIMP3. There was no significant difference inmethylation extent for any gene between high grade dysplastic BE and EAC.
Conclusion: We found significant methylation in metaplastic BE, which for seven of the nine genes studied did not differ infrequency from that found in EAC. This is also the first report of gene silencing by methylation of ID4 in BE or EAC. This studysuggests that metaplastic BE is a highly abnormal tissue, more similar to cancer tissue than to normal epithelium.
Published: 2 October 2008
Molecular Cancer 2008, 7:75 doi:10.1186/1476-4598-7-75
Received: 19 March 2008Accepted: 2 October 2008
This article is available from: http://www.molecular-cancer.com/content/7/1/75
© 2008 Smith et al; licensee BioMed Central Ltd. This is an Open Access article distributed under the terms of the Creative Commons Attribution License (http://creativecommons.org/licenses/by/2.0), which permits unrestricted use, distribution, and reproduction in any medium, provided the original work is properly cited.
Page 1 of 12(page number not for citation purposes)
Molecular Cancer 2008, 7:75 http://www.molecular-cancer.com/content/7/1/75
BackgroundThe incidence of esophageal adenocarcinoma (EAC) isincreasing rapidly and patient outcomes remain poor.Known risk factors for EAC include obesity, gastro-esophageal reflux, and the presence of Barrett's esophagus(BE). Repeated injury from gastro-duodenal reflux isthought to result in the replacement of the esophagealsquamous mucosa with a metaplastic columnar lined epi-thelium. The presence of goblet cells within columnar epi-thelium is diagnostic for BE. Approximately 0.5 – 1% ofpatients with BE will develop EAC each year and patientswith BE have a 50- to 100-fold increased risk of EAC com-pared to the general population [1,2].
The progression from BE to EAC is generally accepted toproceed via the histological stages of low-grade and high-grade dysplasia. Progress along this pathway appears tomirror the accumulation of genetic abnormalities, with anumber of reports suggesting a stepwise progression ofgenetic changes. Abnormalities in CDKN2A, seen in BEmetaplastic tissue, followed by altered TP53 expression,generally reported in dysplastic tissue, have been associ-ated with the transition from BE to EAC [3,4]. Alterationsin the expression of many other genes have also beendescribed at different stages of the progression to cancer[5,6].
Genes can be aberrantly down-regulated as a result ofgenomic alterations such as mutation, deletion, or DNAmethylation. In humans, methylation of cytosines gener-ally occurs in the context of a CpG dinucleotide. Regionsof relatively high CpG content, termed CpG islands, arefound in the promoter region of many genes. Methylationwithin these regions is associated with suppression of theexpression of certain genes, for example the switching offof key developmental genes in adult tissues. However,aberrant methylation of normally unmethylated CpGislands is a common cause of altered gene expression incancer. As esophageal biopsies are easily obtained atendoscopy, it is possible to determine at what stage meth-ylation occurs during the progression to cancer. In thisstudy we compared the methylation of nine genes, fre-
quently methylated in other cancers, between squamous,BE and EAC tissues.
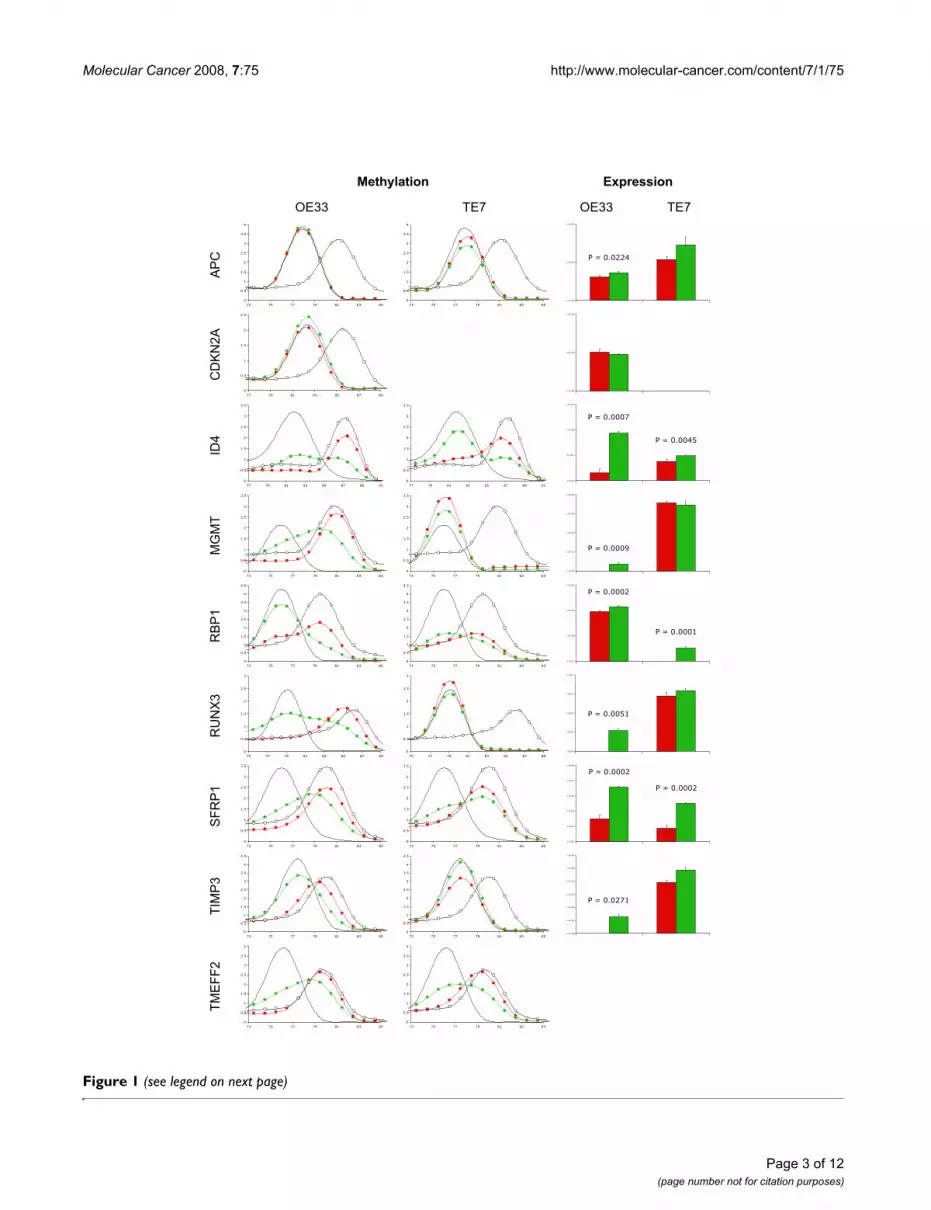
ResultsGene methylation and expression in esophageal cancer cell linesMethylation and expression of the nine genes listed inTable 1 were measured in triplicate cultures of the esopha-geal cancer cell lines OE33 and TE7, following treatmentwith either 5-aza-2'-deoxycytidine (aza-dC) or vehicle(Figure 1). Methylation was observed in all genes inOE33, except APC and CDKN2A, while in TE7 it was onlyobserved in ID4, RBP1, SFRP1, and TMEFF2. Treatmentwith aza-dC reduced methylation and significantlyincreased the expression of all methylated genes exceptTMEFF2, which was undetected in either cell line.CDKN2A was not detected in TE7 by methylation PCR orquantitative real-time reverse-transcription PCR (qRT-PCR), suggesting that the gene was deleted in this cell line.Following treatment with aza-dC, transcript levels werenot significantly increased for any unmethylated genes,except for APC in OE33.
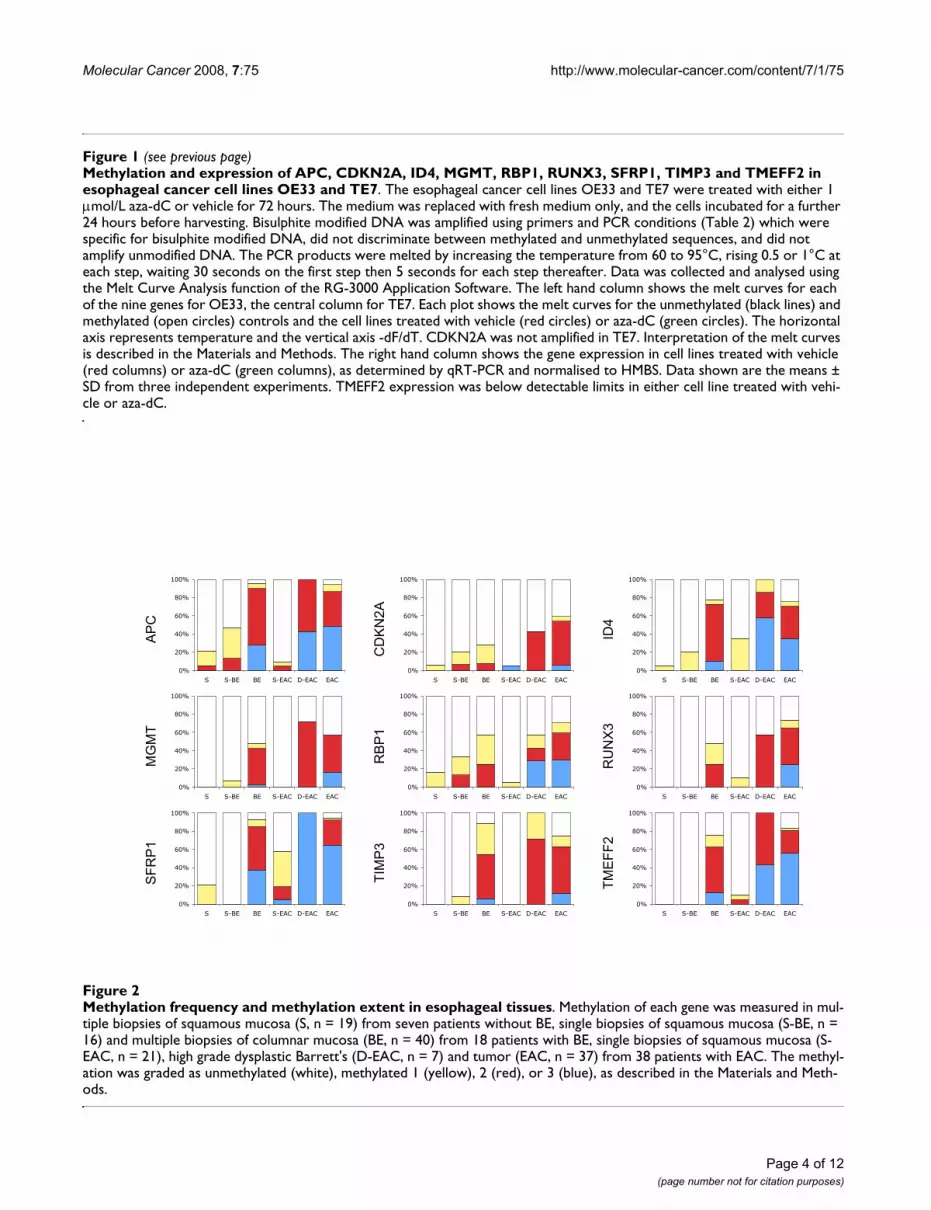
Methylation in esophageal adenocarcinoma and Barrett's esophagusThe results in Figure 2 show the methylation frequency,the percentage of samples that had any extent of methyla-tion, for each of the nine genes, in squamous tissues fromeither patients with no known history of BE (S), orpatients with BE (S-BE) or patients with adenocarcinoma(S-EAC), in metaplastic Barrett's from patients with BE butno dysplasia or adenocarcinoma (BE), in high grade dys-plastic Barrett's from patients with adenocarcinoma (D-EAC), and in adenocarcinoma (EAC). In squamous tis-sues the methylation frequency for each gene did not dif-fer significantly between S and S-BE, while in S-EACmethylation was significantly higher for SFRP1 (com-pared to either S or S-BE) and ID4 (compared to S) andlower for APC (compared to S-BE). For all nine genes themethylation frequency in BE and D-EAC was significantlyhigher than each of the squamous tissues (S, S-BE and S-EAC) with the exception of CDKN2A (no difference
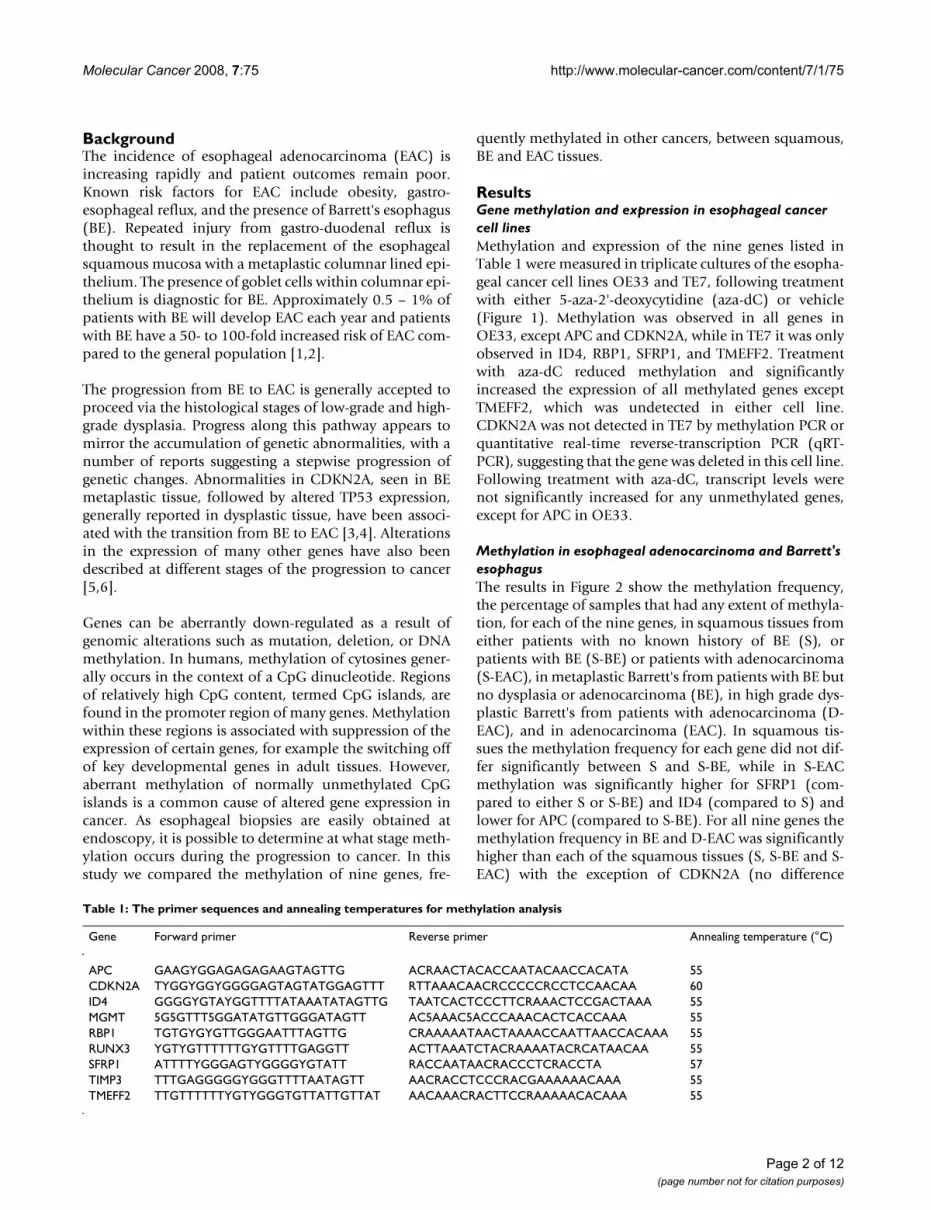
Table 1: The primer sequences and annealing temperatures for methylation analysis
Gene Forward primer Reverse primer Annealing temperature (°C)
APC GAAGYGGAGAGAGAAGTAGTTG ACRAACTACACCAATACAACCACATA 55CDKN2A TYGGYGGYGGGGAGTAGTATGGAGTTT RTTAAACAACRCCCCCRCCTCCAACAA 60ID4 GGGGYGTAYGGTTTTATAAATATAGTTG TAATCACTCCCTTCRAAACTCCGACTAAA 55MGMT 5G5GTTT5GGATATGTTGGGATAGTT AC5AAAC5ACCCAAACACTCACCAAA 55RBP1 TGTGYGYGTTGGGAATTTAGTTG CRAAAAATAACTAAAACCAATTAACCACAAA 55RUNX3 YGTYGTTTTTTGYGTTTTGAGGTT ACTTAAATCTACRAAAATACRCATAACAA 55SFRP1 ATTTTYGGGAGTYGGGGYGTATT RACCAATAACRACCCTCRACCTA 57TIMP3 TTTGAGGGGGYGGGTTTTAATAGTT AACRACCTCCCRACGAAAAAACAAA 55TMEFF2 TTGTTTTTTYGTYGGGTGTTATTGTTAT AACAAACRACTTCCRAAAAACACAAA 55
Page 2 of 12(page number not for citation purposes)
Molecular Cancer 2008, 7:75 http://www.molecular-cancer.com/content/7/1/75
Figure 1 (see legend on next page)
Methylation Expression
OE33 TE7 OE33 TE7AP
C
0
0.5
1
1.5
2
2.5
3
3.5
4
73 75 77 79 81 83 850
0.5
1
1.5
2
2.5
3
3.5
4
73 75 77 79 81 83 85
1.E+02
1.E+03
1.E+04
P = 0.0224
CD
KN2A
0
0.5
1
1.5
2
2.5
77 79 81 83 85 87 89
1.E+00
1.E+01
1.E+02
ID4
0
0.5
1
1.5
2
2.5
3
3.5
77 79 81 83 85 87 89 910
0.5
1
1.5
2
2.5
3
3.5
77 79 81 83 85 87 89 91
1.E-02
1.E-01
1.E+00
1.E+01
P = 0.0007
P = 0.0045
MG
MT
0
0.5
1
1.5
2
2.5
3
3.5
73 75 77 79 81 83 850
0.5
1
1.5
2
2.5
3
3.5
73 75 77 79 81 83 85
1.E+00
1.E+01
1.E+02
1.E+03
1.E+04
P = 0.0009
RBP
1
0
0.5
1
1.5
2
2.5
3
3.5
4
4.5
73 75 77 79 81 83 850
0.5
1
1.5
2
2.5
3
3.5
4
4.5
73 75 77 79 81 83 85
1.E-01
1.E+00
1.E+01
1.E+02
P = 0.0002
P = 0.0001
RU
NX3
0
0.5
1
1.5
2
2.5
3
75 77 79 81 83 85 87 890
0.5
1
1.5
2
2.5
3
75 77 79 81 83 85 87 89
1.E-06
1.E-05
1.E-04
1.E-03
1.E-02
P = 0.0051
SFR
P1
0
0.5
1
1.5
2
2.5
3
3.5
73 75 77 79 81 83 850
0.5
1
1.5
2
2.5
3
3.5
73 75 77 79 81 83 85
1.E-05
1.E-04
1.E-03
1.E-02
1.E-01
1.E+00
P = 0.0002
P = 0.0002
TIM
P3
0
0.5
1
1.5
2
2.5
3
3.5
4
4.5
73 75 77 79 81 83 850
0.5
1
1.5
2
2.5
3
3.5
4
4.5
73 75 77 79 81 83 851.E+00
1.E+01
1.E+02
1.E+03
1.E+04
1.E+05
1.E+06
P = 0.0271
TMEF
F2
0
0.5
1
1.5
2
2.5
3
3.5
4
73 75 77 79 81 83 850
0.5
1
1.5
2
2.5
3
3.5
4
73 75 77 79 81 83 85
Page 3 of 12(page number not for citation purposes)
Molecular Cancer 2008, 7:75 http://www.molecular-cancer.com/content/7/1/75
Methylation and expression of APC, CDKN2A, ID4, MGMT, RBP1, RUNX3, SFRP1, TIMP3 and TMEFF2 in esophageal cancer cell lines OE33 and TE7Figure 1 (see previous page)Methylation and expression of APC, CDKN2A, ID4, MGMT, RBP1, RUNX3, SFRP1, TIMP3 and TMEFF2 in esophageal cancer cell lines OE33 and TE7. The esophageal cancer cell lines OE33 and TE7 were treated with either 1 μmol/L aza-dC or vehicle for 72 hours. The medium was replaced with fresh medium only, and the cells incubated for a further 24 hours before harvesting. Bisulphite modified DNA was amplified using primers and PCR conditions (Table 2) which were specific for bisulphite modified DNA, did not discriminate between methylated and unmethylated sequences, and did not amplify unmodified DNA. The PCR products were melted by increasing the temperature from 60 to 95°C, rising 0.5 or 1°C at each step, waiting 30 seconds on the first step then 5 seconds for each step thereafter. Data was collected and analysed using the Melt Curve Analysis function of the RG-3000 Application Software. The left hand column shows the melt curves for each of the nine genes for OE33, the central column for TE7. Each plot shows the melt curves for the unmethylated (black lines) and methylated (open circles) controls and the cell lines treated with vehicle (red circles) or aza-dC (green circles). The horizontal axis represents temperature and the vertical axis -dF/dT. CDKN2A was not amplified in TE7. Interpretation of the melt curves is described in the Materials and Methods. The right hand column shows the gene expression in cell lines treated with vehicle (red columns) or aza-dC (green columns), as determined by qRT-PCR and normalised to HMBS. Data shown are the means ± SD from three independent experiments. TMEFF2 expression was below detectable limits in either cell line treated with vehi-cle or aza-dC.
Page 4 of 12(page number not for citation purposes)
Methylation frequency and methylation extent in esophageal tissuesFigure 2Methylation frequency and methylation extent in esophageal tissues. Methylation of each gene was measured in mul-tiple biopsies of squamous mucosa (S, n = 19) from seven patients without BE, single biopsies of squamous mucosa (S-BE, n = 16) and multiple biopsies of columnar mucosa (BE, n = 40) from 18 patients with BE, single biopsies of squamous mucosa (S-EAC, n = 21), high grade dysplastic Barrett's (D-EAC, n = 7) and tumor (EAC, n = 37) from 38 patients with EAC. The methyl-ation was graded as unmethylated (white), methylated 1 (yellow), 2 (red), or 3 (blue), as described in the Materials and Meth-ods.
AP
C
0%
20%
40%
60%
80%
100%
S S-BE BE S-EAC D-EAC EAC
CD
KN
2A
0%
20%
40%
60%
80%
100%
S S-BE BE S-EAC D-EAC EAC
ID4
0%
20%
40%
60%
80%
100%
S S-BE BE S-EAC D-EAC EAC
MG
MT
0%
20%
40%
60%
80%
100%
S S-BE BE S-EAC D-EAC EAC
RB
P1
0%
20%
40%
60%
80%
100%
S S-BE BE S-EAC D-EAC EAC
RU
NX
3
0%
20%
40%
60%
80%
100%
S S-BE BE S-EAC D-EAC EAC
SFR
P1
0%
20%
40%
60%
80%
100%
S S-BE BE S-EAC D-EAC EAC
TIM
P3
0%
20%
40%
60%
80%
100%
S S-BE BE S-EAC D-EAC EAC
TME
FF2
0%
20%
40%
60%
80%
100%
S S-BE BE S-EAC D-EAC EAC
Molecular Cancer 2008, 7:75 http://www.molecular-cancer.com/content/7/1/75
between BE or D-EAC and S or S-BE), RBP1 (BE vs S-BEand D-EAC vs S or S-BE) and SFRP1 (D-EAC vs S-EAC).There were no differences between BE and D-EAC. Themethylation frequency for all nine genes was significantlyhigher in EAC than any squamous tissue. There were nodifferences between EAC and D-EAC. There were no dif-ferences between EAC and BE, except for CDKN2A andRUNX3, which were significantly higher in EAC than BE(P = 0.0104 and 0.0358 respectively).
The methylation extent, which reflects the combination ofboth the number of methylated alleles and the density ofmethylation of those alleles, was graded on a scale of 1–3,with 1 being low and 3 being high methylation (Figure 2).The methylation extent in EAC was significantly greaterthan in BE for all genes, except for APC, MGMT andTIMP3. There were no significant differences in methyla-tion extent between EAC and D-EAC.
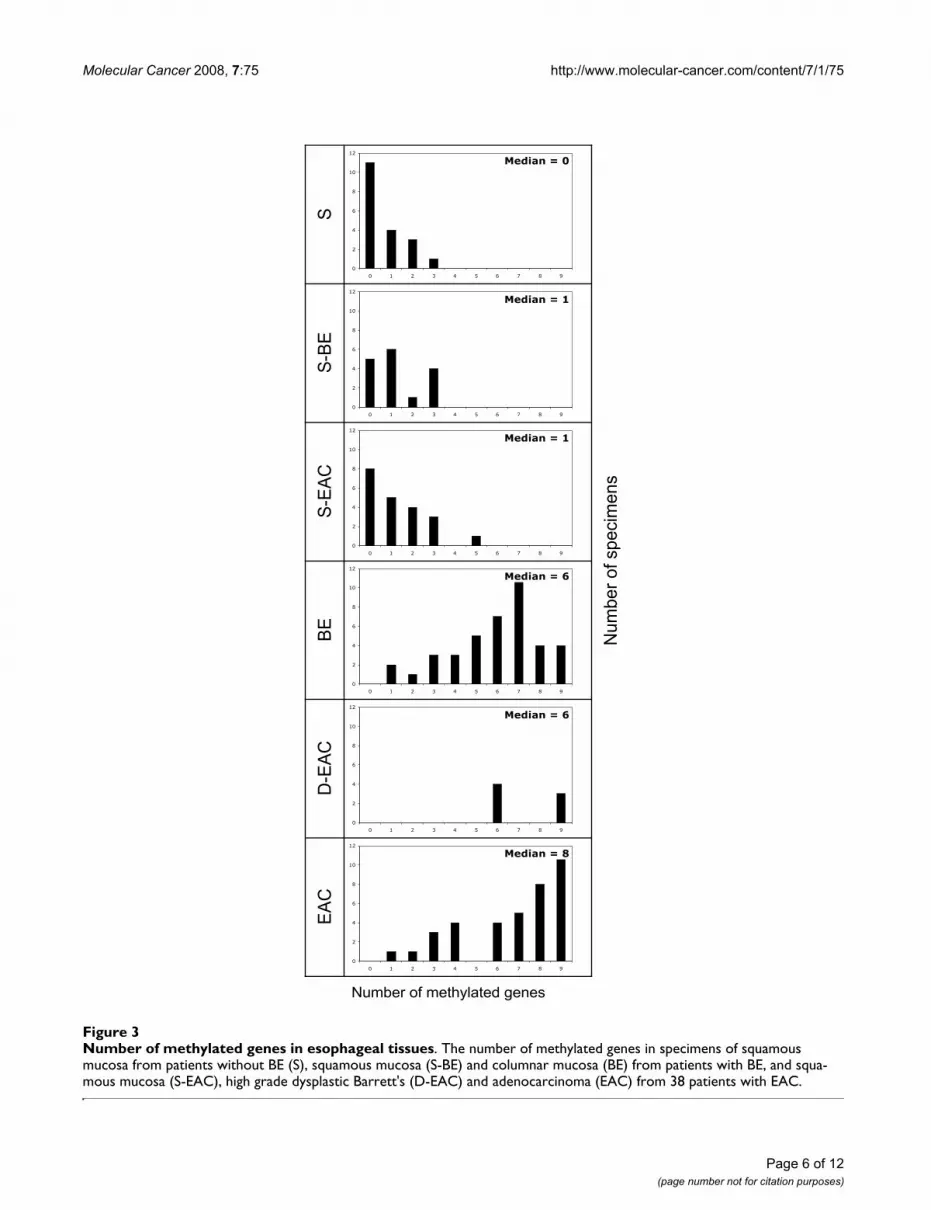
The number of genes methylated in each specimen isshown in Figure 3. Significantly more genes were methyl-ated in specimens of BE, D-EAC and EAC, compared toany of the squamous tissues (P < 0.01 for each compari-son). There were no significant differences between any ofthe squamous tissues, nor between BE, D-EAC and EAC.
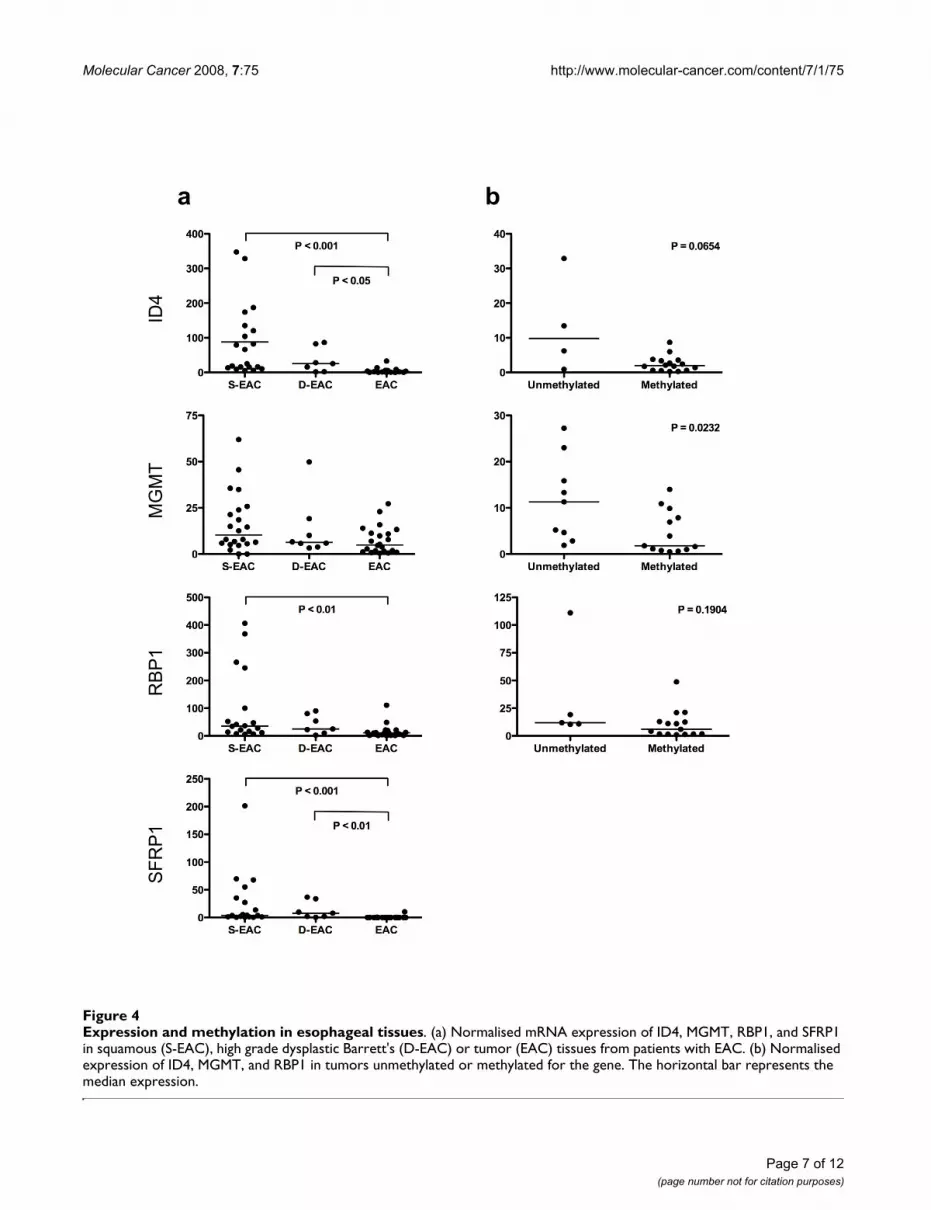
Methylation and gene expression in esophageal tissuesWe examined the relationship between methylation andgene expression in tissues from patients with EAC, fromwhich sufficient RNA was available (Figure 4). The expres-sion of APC, CDKN2A, MGMT, RUNX3, TIMP3 andTMEFF2 did not differ significantly between EAC, D-EACand S-EAC. There was significantly less expression of ID4,RBP1 and SFRP1 in EAC compared to S-EAC, and of ID4and SFRP1 in EAC compared to D-EAC (Figure. 4a).
We then looked for an association between the presenceof methylation and a reduction in gene expression withinthe EAC tissues. There was no significant difference inAPC, CDKN2A, ID4, RBP1, RUNX3 and TIMP3 expres-sion levels between methylated and unmethylatedtumors. There were too few SFRP1 unmethylated tissuesfor this analysis. There was significantly less expression ofMGMT in methylated tumors compared to unmethylatedtumors (Figure. 4b). Furthermore, the expression ofMGMT did not differ between unmethylated squamousand unmethylated tumor tissues, suggesting that theobserved reduction in EAC was primarily due to methyla-tion, not phenotypic differences.
DiscussionMethylation is an important mechanism for the silencingof genes in the development of cancer. We compared thefrequency and extent of methylation of APC, CDKN2A,ID4, MGMT, RBP1, RUNX3, SFRP1, TIMP3, and TMEFF2
in esophageal adenocarcinoma (EAC), high grade dys-plastic Barrett's from patients with adenocarcinoma (D-EAC), metaplastic Barrett's from patients without dyspla-sia or adenocarcinoma (BE), and histologically normalesophageal squamous epithelium. All nine genes showedan increase in frequency of methylation in EAC comparedto squamous epithelium. We found that for seven of thesegenes there was no difference in the frequency of methyl-ation between the BE and EAC. For only CDKN2A andRUNX3 was there a significant increase in frequency ofmethylation in EAC compared to BE. The extent of meth-ylation in EAC was significantly greater than in BE for sixof the nine genes (CDKN2A, ID4, RBP1, RUNX3, SFRP1and TMEFF2) but was not different to D-EAC for any gene.This suggests that methylation of these genes can occurearly in the development of Barrett's metaplasia, and foronly some of these genes does the extent of methylationincreases during the progression to cancer.
In the technique we used to analyse methylation, bisul-phite modified DNA is amplified using primers and con-ditions that do not discriminate between methylated andunmethylated sequences. Amplification is therefore inde-pendent of the presence or extent of methylation withinthe region being assessed. Unlike two common methodsfor measuring methylation, Methylation-Specific PCR [7]or MethyLight [8], the method we used will detect smallamounts of methylation anywhere along the targetsequence. Thus the methylation frequency we measuremay differ from that reported by others. The methylationextent reflects a combination of the percentage of the alle-les that are methylated, and the density of methylation oneach allele. To determine if there was a relationshipbetween the methylation measured in our assays and tran-scriptional silencing we measured gene expression inesophageal cell lines treated with the demethylating drugaza-dC. There was an increase in expression of ID4,MGMT, RBP1, RUNX3, SFRP1 and TIMP3, suggesting anassociation between methylation and silencing of expres-sion for these genes. A relationship could not be deter-mined for APC or CDKN2A, which were unmethylated, orTMEFF2, for which we could not measure any transcript ineither cell line. For these three genes we have shown usingcell lines established from other cancers that methylationof the regions we amplified are associated with genesilencing (unpublished observations). In our EAC tissuesonly methylation of MGMT was associated with a signifi-cant reduction in mRNA expression. The lack of a signifi-cant difference in gene expression for the other genes maybe due to methylation of only one allele, or the presenceof unmethylated cells in the tissue, such as clonal variantsof the tumor, or stromal or infiltrating cells. Methylationin the cancer tissues was always greater than in the squa-mous epithelium of patients without cancer, so even if
Page 5 of 12(page number not for citation purposes)
Molecular Cancer 2008, 7:75 http://www.molecular-cancer.com/content/7/1/75
Page 6 of 12(page number not for citation purposes)
Number of methylated genes in esophageal tissuesFigure 3Number of methylated genes in esophageal tissues. The number of methylated genes in specimens of squamous mucosa from patients without BE (S), squamous mucosa (S-BE) and columnar mucosa (BE) from patients with BE, and squa-mous mucosa (S-EAC), high grade dysplastic Barrett's (D-EAC) and adenocarcinoma (EAC) from 38 patients with EAC.
S
0
2
4
6
8
10
12
0 1 2 3 4 5 6 7 8 9
Median = 0
S-BE
0
2
4
6
8
10
12
0 1 2 3 4 5 6 7 8 9
Median = 1
S-EA
C
0
2
4
6
8
10
12
0 1 2 3 4 5 6 7 8 9
Median = 1
BE
0
2
4
6
8
10
12
0 1 2 3 4 5 6 7 8 9
Median = 6
D-E
AC
0
2
4
6
8
10
12
0 1 2 3 4 5 6 7 8 9
Median = 6
EAC
0
2
4
6
8
10
12
0 1 2 3 4 5 6 7 8 9
Median = 8
Num
ber o
f spe
cim
ens
Number of methylated genes
Molecular Cancer 2008, 7:75 http://www.molecular-cancer.com/content/7/1/75
Page 7 of 12(page number not for citation purposes)
Expression and methylation in esophageal tissuesFigure 4Expression and methylation in esophageal tissues. (a) Normalised mRNA expression of ID4, MGMT, RBP1, and SFRP1 in squamous (S-EAC), high grade dysplastic Barrett's (D-EAC) or tumor (EAC) tissues from patients with EAC. (b) Normalised expression of ID4, MGMT, and RBP1 in tumors unmethylated or methylated for the gene. The horizontal bar represents the median expression.
a bID
4M
GM
TR
BP1
SFR
P1
Molecular Cancer 2008, 7:75 http://www.molecular-cancer.com/content/7/1/75
methylation did not result in gene silencing, it was stillassociated with cancer.
The processes involved in the transition from squamousepithelium to Barrett's metaplasia are unknown, althoughchronic gastro-esophageal reflux is widely believed to bethe main trigger, with approximately 10% of gastro-esophageal reflux patients having BE [9]. It is acceptedthat BE is a pre-malignant condition, which over time, asa result of the accumulation of multiple genetic and epi-genetic modifications, can progress through dysplasia toEAC in a percentage of patients. A large number of suchmolecular changes have been reported in BE and EAC,although the sequence of these changes appear not to beas predictable as in some other cancers such as in thecolon [6].
It is not clear from the literature when aberrant DNAmethylation occurs during the progression to EAC. Theremay be differences in molecular profile of BE tissueobtained from cancer resection specimens, compared toBE tissue obtained from patients with metaplasia only.Our samples of BE were obtained from patients with nodetectable dysplasia or cancer, and were compared to can-cer tissue from different patients. High levels of methyla-tion in such BE specimens have been reported by others,such as methylation of SFRP1 being as frequent in BE (81– 100% of samples) as it is in EAC (93 – 100%) [10,11].In several studies high levels of methylation have beenfound in BE for many genes, but a few have reported lowmethylation in BE and then high in EAC tissues. Eads et alexamined a single biopsy of metaplastic tissue from sixpatients with BE without associated EAC and reportedmethylation of APC, MGMT and TIMP3 in BE and also incancers from other patients, but they did not compare theamounts of methylation in each [12]. They also reportedfour genes, CDKN2A, ESR1 and MYOD1 and CALCA asunmethylated in these BE patients, and methylated in thecancers. Schulmann et al, using MethyLight, measuredmethylation in 93 biopsies of BE from an undisclosednumber of patients [13]. Methylation was as frequent insamples of EAC (n = 77) as in BE for APC, MGMT, RBP1and TIMP3, but was significantly greater in EAC comparedto BE for CDKN2A, RUNX3 and TMEFF2. Furthermore,the methylation level, their measure of the number ofextensively methylated or hypermethylated molecules inthe specimen, increased significantly from BE to dysplasiafor these three genes. Clement reported that APC, TIMP3and TERT were significantly more methylated in BE ofpatients who progressed to EAC compared to patientswith BE which had not progressed during a follow-up ofbetween four to ten years [10]. Of the nine genes whichwe studied, only methylation of CDKN2A and RUNX3appeared to increase in frequency in the progression from
BE to cancer, and only six of the nine genes increased inthe extent of methylation.
The underlying mechanisms that cause aberrant DNAmethylation in Barrett's metaplasia and cancer areunknown. Our study confirms that aberrant methylationof multiple genes is an early event, and mostly occursindependently of dysplasia or EAC. Thus, we speculatethat methylation of some genes occurs at or shortly afterthe transition from squamous to columnar metaplasia. Todate there are no longitudinal studies investigating meth-ylation changes during metaplasia.
This is the first report of ID4 methylation in BE or EAC.The other genes in this study have previously beenreported to be methylated in esophageal disease. ID4 is amember of the inhibitor of DNA binding (ID) family ofproteins that inhibit the binding of basic helix-loop helixtranscription factors to DNA. It regulates the transcriptionof genes important in development and differentiation,and is a candidate tumor suppressor gene [14,15]. Meth-ylation of ID4 has been reported in and associated withthe silencing of gene transcription and loss of proteinexpression in lymphoma [16], and gastric [17], colorectal[18] and breast carcinoma [19,20]. Methylation of ID4correlated with increased risk of lymph node metastasis inT1 stage breast cancer [20], and histopathological tumorgrade and poorer prognosis in colorectal carcinoma [18].Our findings that ID4 is frequently methylated in BE andEAC but not in the normal squamous mucosa and thatdemethylation of cancer cell lines significantly increasesexpression, suggests loss of ID4 expression is important inthe neoplastic progression of BE, supporting its role as atumor suppressor.
DNA methylation is not the only abnormality reported inthe genome of metaplastic Barrett's epithelium of patientswithout dysplasia or EAC. Using gene expression microar-rays, Wang et al reported that the gene expression profileof BE more closely resembled EAC than esophageal squa-mous epithelium. Rather than BE being a benign tissue,they concluded that it was biologically closer to cancerthan to normal squamous epithelium [21]. Genomic loss,chromosomal gains and amplifications, mutations, andaneuploidy are observed in BE [22,23], and loss of heter-ozygosity of CDKN2A is reported in 47 – 75% of patientswith BE, in the absence of dysplasia or EAC [24-26]. Inmetaplastic epithelium from patients with dysplasia orEAC, 5q (APC), 13q (RB1), 17p (TP53), and 18q (DCC)are commonly lost, whilst 8q, 8p, and 6p are frequentlygained [27-29]. In contrast, mutations in BE are relativelyuncommon. Mutations in CDKN2A have been reportedin up to 7% of patients with metaplasia [24,30], but mostreports suggest that mutations are absent in BE frompatients without dysplasia or EAC [31].
Page 8 of 12(page number not for citation purposes)
Molecular Cancer 2008, 7:75 http://www.molecular-cancer.com/content/7/1/75
In this study of methylation in esophageal disease we havemeasured little methylation in any esophageal squamousepithelium, but in BE tissues there was significant methyl-ation which for all but two of the nine genes examined didnot increase in frequency in the progression from BE toEAC. We have also reported methylation of ID4 for thefirst time in BE or EAC. Together these findings confirmthat BE is a precancerous tissue, and that aberrant pro-moter methylation occurs early in metaplasia before his-tological evidence of progression towards cancer, and thatmetaplastic BE is nearly as abnormal epigenetically asEAC.
MethodsPatient samplesSingle samples of primary esophageal adenocarcinoma(EAC, n = 37), dysplastic Barrett's (D-EAC, n = 7) and his-tologically normal squamous mucosa from the proximalresection margin (S-EAC, n = 21) from 38 patients withEAC were collected into liquid nitrogen or into RNAlater(Ambion, Austin, TX, USA). Multiple biopsies every 2 cmfrom within circumferential columnar lined esophagus(BE, n = 40) and a single biopsy of squamous mucosaproximal to the squamo-columnar junction (S-BE, n = 16)from 18 patients with BE were collected into RNAlater.The presence of goblet cells in at least one biopsy from thecolumnar lined esophagus was confirmed in all patientswith BE. Up to three biopsies of squamous mucosa (S, n =19) from each of seven patients without a known historyof BE, but who had undergone a fundoplication for gas-tro-esophageal reflux disease more than five years earlier,were collected into RNAlater. Clinicopathological detailsof all patients are summarised in Table 2, and details ofeach patient are described in Additional Files Tables S1 –S3. The study complied with the appropriate institutionalguidelines.
Demethylation of cell lines with 5-aza-2'-deoxycytidineTo study the effects of demethylation, triplicate cultures ofthe esophageal cancer cell lines OE33 and TE7 [32] weregrown in RPMI 1640 supplemented with 10% foetalbovine serum at 37°C in 5% CO2. The OE33 cell line wasestablished from a Barrett's associated adenocarcinoma ofthe lower esophagus, and the TE7 is thought to be derivedfrom a squamous cell carcinoma of the esophagus [33].Cells were seeded into flasks and cultured for 24 hoursbefore they were treated with either 1 μmol/L 5-aza-2'-
deoxycytidine (aza-dC, Sigma-Aldrich, Saint Louis, MO)or vehicle (0.0027% v/v final concentration acetic acid).Following a further 72 hours incubation, time for the cellsto undergo at least two cycles of division [34], themedium was replaced with fresh medium not containingeither aza-dC or vehicle, and the cells incubated for a fur-ther 24 hours before harvesting.
Isolation of RNA and DNA from cell lines and patient samplesTissues were disrupted using either disposable pestles(Edwards Instruments, Narellan, NSW, Australia) or Tis-sueLyser with 5 mm Stainless Steel Beads (Qiagen,Hilden, Germany). RNA and DNA were isolated from celllines and tissues from patients with EAC using Trizol (Inv-itrogen, Carlsbad, CA). RNA and DNA were isolated fromall other biopsies using either the RNA/DNA Kit or the All-Prep DNA/RNA Mini Kit (Qiagen).
Methylation analysisBisulphite modified DNA was prepared as described pre-viously [34,35], and amplified using primer sets whichdid not discriminate between methylated and unmethyl-ated sequences. The PCR primers (GeneWorks, Thebar-ton, SA, Australia) and conditions were specific forbisulphite modified DNA, and did not amplify unmodi-fied DNA. All methylation analysis PCRs were performedusing the QuantiTect SYBR Green PCR Kit (Qiagen) in afinal volume of 15 μL, containing 1 μL of bisulphite mod-ified DNA and a final concentration of 0.5 μmol/L of eachforward and reverse primer. Bisulphite modified lym-phocyte DNA, CpG methyltransferase (M.SssI) (New Eng-land Biolabs Inc., Ipswich, MA) treated lymphocyte DNAand unmodified DNA were included in each PCR run andserved as unmethylated, methylated and negative controlsrespectively. Reactions were incubated in a Rotor-Gene3000 (RG-3000) (Corbett Life Science, Sydney, NSW, Aus-tralia) at 95°C for 15 minutes, then 45 cycles of 95°C for30 seconds and 60 seconds at the annealing temperaturespecified in Table 2, followed by a final extension of 72°Cfor 4 minutes. At the end of the amplification cycle thePCR products were melted by increasing the temperaturefrom 60 to 95°C, rising 0.5 or 1°C at each step, waiting 30seconds on the first step then 5 seconds for each stepthereafter. Data was collected and analysed using the MeltCurve Analysis function of the RG-3000 Application Soft-ware v6 (Corbett Life Science) which converts the raw flu-
Table 2: Demographic characteristics of patients
EAC BE Without BE or EAC
Number of patients 38 18 7M:F 34:4 18:4 2:7Median age, yr (range) 64 (51 – 78) 56 (38 – 71) 60 (37 – 76)
Page 9 of 12(page number not for citation purposes)

Molecular Cancer 2008, 7:75 http://www.molecular-cancer.com/content/7/1/75
Page 10 of 12(page number not for citation purposes)
Table 3: The primer sequences and annealing temperatures for qRT-PCR
Gene Forward primer Reverse primer Annealing temperature (°C)
APC TGGAGAACTCAAATCTTCGACA CAATCTGTCCAGAAGAAGCCATA 62CDKN2A GAGGCCGATCCAGGTCAT CCAGCGTGTCCAGGAAG 62HMBS ACATGCCCTGGAGAAGAATG TTGGGTGAAAGACAACAGCA 57ID4 CCGAGCCAGGAGCACTAGAG CTTGGAATGACGAATGAAAACG 60MGMT TGGAGCTGTCTGGTTGTGAG GCTGGTGGAAATAGGCATTC 60RBP1 AGGCATAGATGACCGCAAG CTCATCACCCTCGATCCAC 62RUNX3 GCAGGCAATGACGAGAACTA CAGTGATGGTCAGGGTGAAA 57SFRP1 TTGAGGAGAGCACCCTAGGC TGTGTATCTGCTGGCAACAGG 60TIMP3 CCAGGACGCCTTCTGCAAC CCTCCTTTACCAGCTTCTTCCC 60TMEFF2 CAATGGGGAGAGCTACCAGA TGGACTCCATCTCCAGATCC 62
Table 4: Table S1 – Demographic details of patients with EAC.
Patient Gender Age(yr) Differentiationa S-EACb D-EACb EACb
0226 M 53 P + - +0227 M 58 M + + -0230 M 77 M-P + + +0235 M 61 M + - +0246 F 62 W + + +0250 M 68 M-P + + +0253 M 77 M-P + - +0292 M 55 M + - +0306 M 68 P + - +0307 M 58 M + - +0316 M 69 P + + +0329 M 67 P - - +0339 F 63 P + - +0343 F 62 P - - +0347 M 56 P + - +0355 F 62 P + - +0369 M 75 M + - +0374 M 65 M + - +0375 M 72 M + - +0380 M 57 M + - +0385 M 70 M + - +0406 F 53 M + - +0410 M 62 M + - +0415 M 56 P - + +0417 M 73 P - + +40320 M 61 M - - +40323 M 60 P - - +40325 M 61 M-P - - +40328 M 65 M - - +40331 M 64 P - - +40337 M 70 P - - +40338 M 71 W - - +40341 M 78 P - - +40345 M 60 M - - +40355 M 65 M-P - - +40357 M 65 M-P - - +53145 M 51 M - - +54017 M 76 P - - +
aW, well; M, moderate; P, poorb+ tissue available; – no tissue available
Molecular Cancer 2008, 7:75 http://www.molecular-cancer.com/content/7/1/75
orescence data to melt curves by plotting the negative firstderivative of the fluorescence with respect to temperature(-dF/dT), against temperature. The melt curve of the sam-ple was compared to those of the unmethylated andmethylated controls. A sample was considered methylatedwhen there was a visible shift to the right of the unmeth-ylated melt curve. The methylation extent, a function ofboth the number of alleles which are methylated and thedensity of methylation in each allele, was graded as 0(unmethylated), 1 (low), 2 (moderate), or 3 (high meth-ylation) according to the degree of the shift [35]. Briefly, acurve which was almost identical to the methylated con-trol was scored as 3, a curve whose melting temperaturewas closer to methylated control than the unmethylatedcontrol was scored as 2, a curve which was almost identi-cal to unmethylated control was scored 0 and the rest werescored as 1. All assessment was undertaken independentlyby two investigators (E.S. and P.A.D.), and if their opin-ions differed, consensus was reached by discussion.
Measurement of gene expression by quantitative real-time reverse-transcription PCRTo measure gene expression, cDNA was synthesised usingSuperScript II (Invitrogen) from 2 μg of RNA which hadbeen treated with the TURBO DNA-free Kit (Ambion).Quantitative real-time reverse-transcription PCR (qRT-PCR) was performed using the QuantiTect SYBR GreenPCR Kit in a final volume of 10 μL, containing 1 μL of 1/5 diluted cDNA and a final concentration of 0.5 μmol/Lof each forward and reverse primer. Triplicate reactionswere incubated in an RG-3000 at 95°C for 15 minutes,then 45 cycles of 95°C for 15 seconds and 45 seconds atthe annealing temperature specified in Table 3, followedby a final extension of 72°C for 4 minutes. Data was col-lected and analysed using the RG-3000 Application Soft-ware. Threshold cycle Ct values were determined on auto-threshold settings with reference to a standard dilutioncurve. All mRNA quantitation data was normalised tohydroxymethylbilane synthase (HMBS) [34]. Followingthe PCR, the products were melted to confirm specificity,and electrophoresed on 1.5% (w/v) agarose gels stainedwith ethidium bromide to confirm expected product size.
Statistical analysesStatistics were performed using GraphPad InStat version3.0a or Prism version 5.0a for Macintosh (GraphPad Soft-ware, San Diego California USA, http://www.graphpad.com). Gene expression in cell lines treated with eitheraza-dC or vehicle was compared using Student's t-test.Methylation frequency in tissues was compared usingFisher's exact test. The number of methylated genes in aspecimen and gene expression was compared usingKruskal-Wallis with Dunn's post-test. Methylation extentand gene expression in unmethylated and methylated tis-sues was compared using the Mann-Whitney test. All sta-tistics were considered significant when the two tailed P ≤0.05.
ConclusionWe have measured methylation of genes in BE and EACand found significant methylation in metaplastic BE,which for seven of the nine genes studied did not differ infrequency from that found in EAC. This study providesimportant confirmatory evidence to support the conceptthat BE is a highly abnormal tissue, more similar to cancertissue than to normal squamous epithelium.
Competing interestsThe authors declare that they have no competing interests.
Additional filesAcknowledgementsThis study was supported by the NHMRC Project grant 275504 and the U.S. National Cancer Institute grant CA 001833-03. The Barrett's associ-ated adenocarcinoma cell line OE33 was a gift from Associate Professor Wayne A. Phillips, Peter MacCallum Cancer Research Centre, Melbourne,
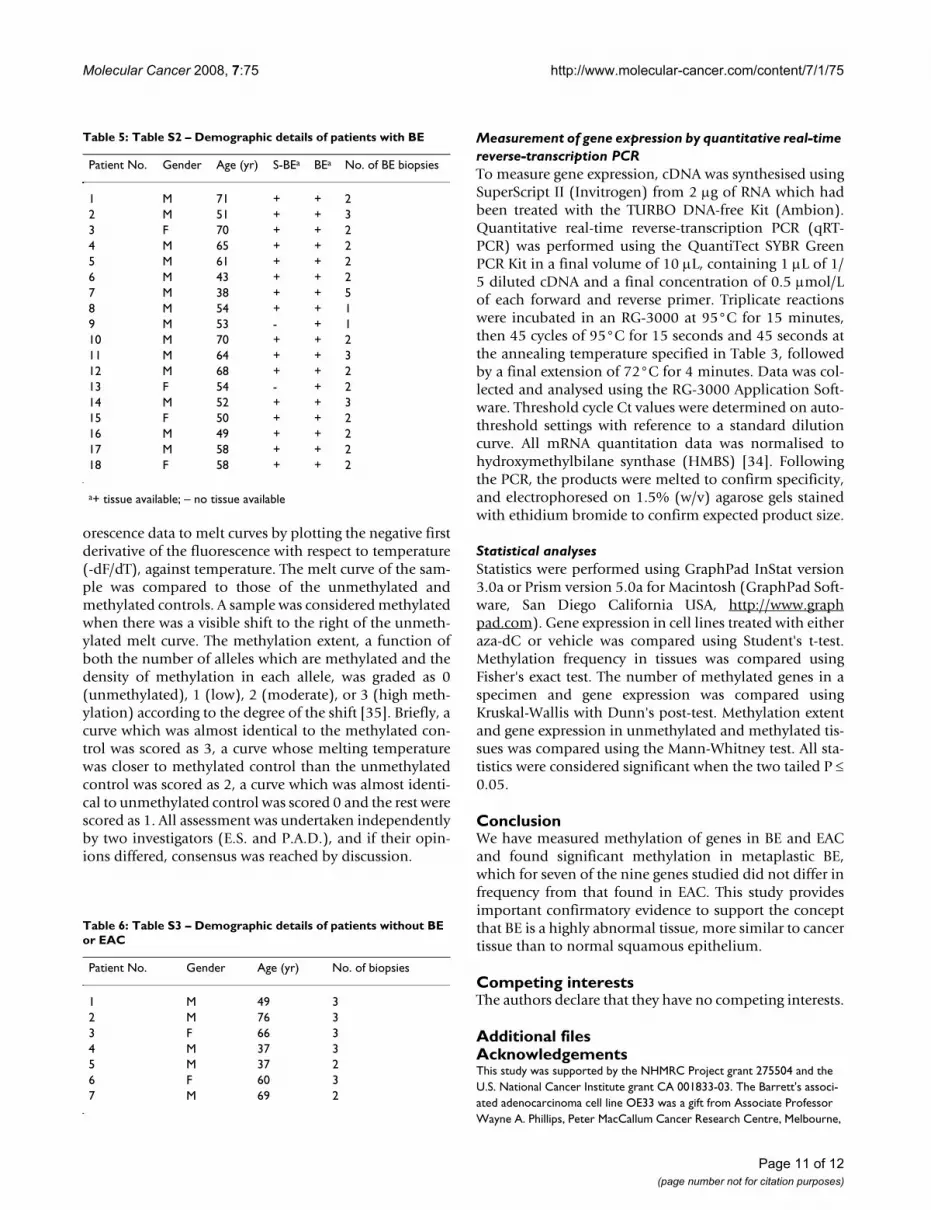
Table 5: Table S2 – Demographic details of patients with BE
Patient No. Gender Age (yr) S-BEa BEa No. of BE biopsies
1 M 71 + + 22 M 51 + + 33 F 70 + + 24 M 65 + + 25 M 61 + + 26 M 43 + + 27 M 38 + + 58 M 54 + + 19 M 53 - + 110 M 70 + + 211 M 64 + + 312 M 68 + + 213 F 54 - + 214 M 52 + + 315 F 50 + + 216 M 49 + + 217 M 58 + + 218 F 58 + + 2
a+ tissue available; – no tissue available
Table 6: Table S3 – Demographic details of patients without BE or EAC
Patient No. Gender Age (yr) No. of biopsies
1 M 49 32 M 76 33 F 66 34 M 37 35 M 37 26 F 60 37 M 69 2
Page 11 of 12(page number not for citation purposes)
Molecular Cancer 2008, 7:75 http://www.molecular-cancer.com/content/7/1/75
Publish with BioMed Central and every scientist can read your work free of charge
"BioMed Central will be the most significant development for disseminating the results of biomedical research in our lifetime."
Sir Paul Nurse, Cancer Research UK
Your research papers will be:
available free of charge to the entire biomedical community
peer reviewed and published immediately upon acceptance
cited in PubMed and archived on PubMed Central
yours — you keep the copyright
Submit your manuscript here:http://www.biomedcentral.com/info/publishing_adv.asp
BioMedcentral
Australia. The squamous cell carcinoma cell line TE7 was obtained from Dr. Tetsuro Nishihira, Tohoku University School of Medicine, Sendai, Japan.
References1. Shaheen NJ, Crosby MA, Bozymski EM, Sandler RS: Is there publi-
cation bias in the reporting of cancer risk in Barrett'sesophagus? Gastroenterology 2000, 119:333-338.
2. Murray L, Watson P, Johnston B, Sloan J, Mainie IM, Gavin A: Risk ofadenocarcinoma in Barrett's oesophagus: population basedstudy. BMJ 2003, 327:534-535.
3. Galipeau PC, Li X, Blount PL, Maley CC, Sanchez CA, Odze RD, AyubK, Rabinovitch PS, Vaughan TL, Reid BJ: NSAIDs modulateCDKN2A, TP53, and DNA content risk for progression toesophageal adenocarcinoma. PLoS Med 2007, 4:e67.
4. Keswani RN, Noffsinger A, Waxman I, Bissonnette M: Clinical useof p53 in Barrett's esophagus. Cancer Epidemiol Biomarkers Prev2006, 15:1243-1249.
5. Tannapfel A: Molecular findings in Barrett's epithelium. Dig Dis2004, 22:126-133.
6. Peters CJ, Fitzgerald RC: Systematic review: the application ofmolecular pathogenesis to prevention and treatment ofoesophageal adenocarcinoma. Aliment Pharmacol Ther 2007,25:1253-1269.
7. Herman JG, Graff JR, Myohanen S, Nelkin BD, Baylin SB: Methyla-tion-specific PCR: a novel PCR assay for methylation statusof CpG islands. Proc Natl Acad Sci USA 1996, 93:9821-9826.
8. Eads CA, Danenberg KD, Kawakami K, Saltz LB, Blake C, Shibata D,Danenberg PV, Laird PW: MethyLight: a high-throughput assayto measure DNA methylation. Nucleic Acids Res 2000, 28:E32.
9. Paulson TG, Reid BJ: Focus on Barrett's esophagus and esopha-geal adenocarcinoma. Cancer Cell 2004, 6:11-16.
10. Clement G, Braunschweig R, Pasquier N, Bosman FT, Benhattar J:Methylation of APC, TIMP3, and TERT: a new predictivemarker to distinguish Barrett's oesophagus patients at riskfor malignant transformation. J Pathol 2006, 208:100-107.
11. Zou H, Molina JR, Harrington JJ, Osborn NK, Klatt KK, Romero Y,Burgart LJ, Ahlquist DA: Aberrant methylation of secreted friz-zled-related protein genes in esophageal adenocarcinomaand Barrett's esophagus. Int J Cancer 2005, 116:584-591.
12. Eads CA, Lord RV, Wickramasinghe K, Long TI, Kurumboor SK,Bernstein L, Peters JH, DeMeester SR, DeMeester TR, Skinner KA,Laird PW: Epigenetic patterns in the progression of esopha-geal adenocarcinoma. Cancer Res 2001, 61:3410-3418.
13. Schulmann K, Sterian A, Berki A, Yin J, Sato F, Xu Y, Olaru A, WangS, Mori Y, Deacu E, et al.: Inactivation of p16, RUNX3, and HPP1occurs early in Barrett's-associated neoplastic progressionand predicts progression risk. Oncogene 2005, 24:4138-4148.
14. Coppe JP, Smith AP, Desprez PY: Id proteins in epithelial cells.Exp Cell Res 2003, 285:131-145.
15. Norton JD: ID helix-loop-helix proteins in cell growth, differ-entiation and tumorigenesis. J Cell Sci 2000, 113(Pt22):3897-3905.
16. Hagiwara K, Nagai H, Li Y, Ohashi H, Hotta T, Saito H: FrequentDNA methylation but not mutation of the ID4 gene in malig-nant lymphoma. J Clin Exp Hematop 2007, 47:15-18.
17. Chan AS, Tsui WY, Chen X, Chu KM, Chan TL, Chan AS, Li R, So S,Yuen ST, Leung SY: Downregulation of ID4 by promoter hyper-methylation in gastric adenocarcinoma. Oncogene 2003,22:6946-6953.
18. Umetani N, Takeuchi H, Fujimoto A, Shinozaki M, Bilchik AJ, HoonDS: Epigenetic inactivation of ID4 in colorectal carcinomascorrelates with poor differentiation and unfavorable progno-sis. Clin Cancer Res 2004, 10:7475-7483.
19. Dahl C, Guldberg P: A ligation assay for multiplex analysis ofCpG methylation using bisulfite-treated DNA. Nucleic AcidsRes 2007, 35:e144.
20. Umetani N, Mori T, Koyanagi K, Shinozaki M, Kim J, Giuliano AE,Hoon DS: Aberrant hypermethylation of ID4 gene promoterregion increases risk of lymph node metastasis in T1 breastcancer. Oncogene 2005, 24:4721-4727.
21. Wang S, Zhan M, Yin J, Abraham JM, Mori Y, Sato F, Xu Y, Olaru A,Berki AT, Li H, et al.: Transcriptional profiling suggests thatBarrett's metaplasia is an early intermediate stage inesophageal adenocarcinogenesis. Oncogene 2006,25(23):3346-3356.
22. Jenkins GJ, Doak SH, Parry JM, D'Souza FR, Griffiths AP, Baxter JN:Genetic pathways involved in the progression of Barrett'smetaplasia to adenocarcinoma. Br J Surg 2002, 89:824-837.
23. Lin L, Wang Z, Prescott MS, van Dekken H, Thomas DG, GiordanoTJ, Chang AC, Orringer MB, Gruber SB, Moran JV, et al.: Multipleforms of genetic instability within a 2-Mb chromosomal seg-ment of 3q26.3-q27 are associated with development ofesophageal adenocarcinoma. Genes Chromosomes Cancer 2006,45:319-331.
24. Wong DJ, Paulson TG, Prevo LJ, Galipeau PC, Longton G, Blount PL,Reid BJ: p16(INK4a) lesions are common, early abnormalitiesthat undergo clonal expansion in Barrett's metaplastic epi-thelium. Cancer Res 2001, 61:8284-8289.
25. Fahmy M, Skacel M, Gramlich TL, Brainard JA, Rice TW, Goldblum JR,Connor JT, Casey G, Legator MS, Tubbs RR, Falk GW: Chromo-somal gains and genomic loss of p53 and p16 genes in Bar-rett's esophagus detected by fluorescence in situhybridization of cytology specimens. Mod Pathol 2004.
26. Barrett MT, Sanchez CA, Galipeau PC, Neshat K, Emond M, Reid BJ:Allelic loss of 9p21 and mutation of the CDKN2/p16 genedevelop as early lesions during neoplastic progression in Bar-rett's esophagus. Oncogene 1996, 13:1867-1873.
27. Walch AK, Zitzelsberger HF, Bruch J, Keller G, Angermeier D,Aubele MM, Mueller J, Stein H, Braselmann H, Siewert JR, et al.:Chromosomal imbalances in Barrett's adenocarcinoma andthe metaplasia-dysplasia-carcinoma sequence. Am J Pathol2000, 156:555-566.
28. Barrett MT, Sanchez CA, Prevo LJ, Wong DJ, Galipeau PC, PaulsonTG, Rabinovitch PS, Reid BJ: Evolution of neoplastic cell lineagesin Barrett oesophagus. Nat Genet 1999, 22:106-109.
29. Dolan K, Garde J, Walker SJ, Sutton R, Gosney J, Field JK: LOH atthe sites of the DCC, APC, and TP53 tumor suppressorgenes occurs in Barrett's metaplasia and dysplasia adjacentto adenocarcinoma of the esophagus. Hum Pathol 1999,30:1508-1514.
30. Hardie LJ, Darnton SJ, Wallis YL, Chauhan A, Hainaut P, Wild CP,Casson AG: p16 expression in Barrett's esophagus andesophageal adenocarcinoma: association with genetic andepigenetic alterations. Cancer Lett 2005, 217:221-230.
31. Novotna K, Trkova M, Pazdro A, Smejkal M, Soukupova A, KodetovaD, Smejkal P, Sedlacek Z: TP53 gene mutations are rare in non-dysplastic Barrett's esophagus. Dig Dis Sci 2006, 51:110-113.
32. Nishihira T, Hashimoto Y, Katayama M, Mori S, Kuroki T: Molecularand cellular features of esophageal cancer cells. J Cancer ResClin Oncol 1993, 119:441-449.
33. Boonstra JJ, Velden AW van der, Beerens EC, van Marion R, Morita-Fujimura Y, Matsui Y, Nishihira T, Tselepis C, Hainaut P, Lowe AW,et al.: Mistaken identity of widely used esophageal adenocar-cinoma cell line TE-7. Cancer Res 2007, 67:7996-8001.
34. Smith E, Drew PA, Tian ZQ, De Young NJ, Liu JF, Mayne GC, Ruszk-iewicz AR, Watson DI, Jamieson GG: Metallothionien 3 expres-sion is frequently down-regulated in oesophageal squamouscell carcinoma by DNA methylation. Mol Cancer 2005, 4:42.
35. Smith E, De Young NJ, Tian ZQ, Caruso M, Ruszkiewicz AR, Liu JF,Jamieson GG, Drew PA: Methylation of TIMP3 in esophagealsquamous cell carcinoma. World J Gastroenterol 2008,14:203-210.
Page 12 of 12(page number not for citation purposes)


