Embed Size (px)
Citation preview
energies
Article
A Hierarchical Optimisation of a Compressed NaturalGas Station for Energy and Fuelling Efficiency undera Demand Response Program
Charles Kagiri, Lijun Zhang and Xiaohua Xia *
Centre of New Energy Systems, Department of Electrical, Electronic and Computer Engineering, University ofPretoria, Pretoria 0002, South Africa; [email protected] (C.K.); [email protected] (L.Z.)* Correspondence: [email protected]; Tel.: +27-815-476-363
Received: 17 April 2019; Accepted: 15 May 2019; Published: 6 June 2019�����������������
Abstract: Compressed natural gas stations serve customers who have chosen compressed naturalgas powered vehicles as an alternative to diesel and petrol based ones, for cost or environmentalreasons. The interaction between the compressed natural gas station and electricity grid requiresan energy management strategy to minimise a significant component of the operating costs of thestation where demand response programs exist. Such a strategy when enhanced through integrationwith a control strategy for optimising gas delivery can raise the appeal of the compressed naturalgas, which is associated with reduced criteria air pollutants. A hierarchical operation optimisationapproach adopted in this study seeks to achieve energy cost reduction for a compressed natural gasstation in a time-of-use electricity tariff environment as well as increase the vehicle fuelling efficiency.This is achieved by optimally controlling the gas dispenser and priority panel valve function underan optimised schedule of compressor operation. The results show that electricity cost savings of upto 60.08% are achieved in the upper layer optimisation while meeting vehicle gas demand over thecontrol horizon. Further, a reduction in filling times by an average of 16.92 s is achieved through alower layer model predictive control of the pressure-ratio-dependent fuelling process.
Keywords: optimal scheduling; demand response; model predictive control; hierarchical control;compressed natural gas
1. Introduction
1.1. Background
Global efforts to minimise environmental pollution have become a priority of many governments,with the transport industry targeted to replace diesel and petrol fuels with less polluting alternativessuch as compressed natural gas (CNG) [1]. The use of CNG correlates with the lowest emissions ofparticulate matter, non-methane organic gases (NMOG), nitrogen oxides (NOx), carbon monoxide (CO)and other air toxics, among hydrocarbon fuels [2] as well as lower carbon dioxide emission for thesame quantity of energy delivered [3]. The availability of the infrastructure to deliver CNG to vehicularcustomers is a major success factor in the growth of CNG as an alternative fuel for the transportationsector [4] because of fuelling convenience considerations [5]. There has been steady growth in thenumber of commercial fuelling stations in both developing [6] and developed [7] countries, which hascorresponded to the increase in number of CNG vehicles on roads. For commercial fuelling stations,vehicles needing refuelling arrive randomly and are required to be filled quickly, hence the fast-fillCNG fuelling configuration has been the prominent design of choice [8]. In fast-fill stations, gas fromthe utility line is compressed into a pressurised cascade storage consisting of gas tanks in three pressurelevels, from which arriving vehicles are filled [9]. In this type of operation, the compressor is cycled
Energies 2019, 12, 2165; doi:10.3390/en12112165 www.mdpi.com/journal/energies
Energies 2019, 12, 2165 2 of 24
between the upper and lower limits of the cascade storage capacity [10]. Given that the compressor isthe main electrical load in a CNG fast-fill station, the cycling of the compressor and its potential forbeing scheduled present opportunities for the improvement of operation efficiency.
1.2. Improving the CNG Station Operation Efficiency
The improvement of operation efficiency encompasses both energy cost reduction and ensuringperformance levels in product delivery are sustained or improved, under the optimised energy costoperation. Operation optimisation for energy cost efficiency through equipment scheduling is amajor area of consideration in demand response research [11]. Given the significant consequencesof compressor energy consumption on the operating costs of the CNG station [12], it is necessary tostudy how proposed interventions for energy cost reduction, interact with other operation efficiencyimprovements at the gas dispensing level. Vehicle fuelling time has been studied as one of the majorfactors customers consider when deciding whether or not to transition to alternative fuels [13].
Kountz et al. [14] initiated the evaluation of the fast-fill CNG station with a study which involvedthe development of a model for the flow of gas from one of the cascade storage tanks into the targetvehicle tank. Kountz [15] further developed an approach to the design of dispenser algorithm, toensure correct quantities of gas are dispensed into the target vehicle tank with compensation fortemperature effect [16]. Studies of the effects of other components of the CNG station on gas flowsuch as the hoses [17] and dispensers [18], have aided in developing a basis for their standardisation.Farzaneh et al. [19] developed a numerical method of analysing thermodynamic characteristics of gasflow in the reservoir filling process. The ratio of target vehicle tank pressure to the pressure of thestorage tank and the evolution of this ratio as the vehicle tank gets filled are shown to have an effecton the vehicle filling time and profile [20]. Further, studies to determine the optimal location of CNGstations in a network that also includes petrol and diesel fuelling stations [21] have been carried out.Kuby [5] took a deeper look at evaluating the location problem for stations serving alternative fuelvehicles (AFVs) by reviewing the state of relevant research work, and thereby concluded that driversof AFVs exhibit deliberate behaviour in choosing where to refuel within sparse refuelling networks,with convenience weighing more significantly than price.
Bang et al. [22] modelled the CNG residential refuelling system, and demonstrated the potentialeffects of an increase in the number of such systems on the existing electricity grid. The study of theseeffects is especially important, given the significant size of the compressor motor as an electric load incomparison with regular loads of petrol and diesel fuelling stations [23]. Cycling of the compressor ina fast-fill station to replenish the cascade storage may present an opportunity to minimise the energycost of the CNG station, if the CNG station is located in an area where demand response programshave been implemented through time differentiated pricing [24]. Demand response programs areimplemented with an overall goal of achieving lower fluctuations in electricity demand which hasbeen shown to lead to more efficient operation of the grid [25] and to increase the reliability andstability of the grid network [11]. Electricity consumption patterns are modified by raising the pricecharge per unit of electricity at times when the system reliability is compromised by high demand [26].This encourages consumers to shift their flexible loads to times when the rates charged are favourable,achieving for them lower overall energy costs [27].
In [12,28], a strategy to minimise electricity cost for a CNG fast fill station was undertaken fora station operating under a time-of-use (TOU) electricity tariff. The station was modelled as a massbalance system where the storage was modelled as a single reservoir with an outflow from a knowndemand profile and inflow from an optimally scheduled compressor. Further, in [29], an optimalcontrol to determine the operation of the priority panel valves under a known demand profile for eachof the three reservoirs of the cascade storage was carried out. These studies considered only the flow ofquantity of gas in mass from the compressor to satisfy mass of gas demand at the dispenser. Withoutevaluating and optimising the pressure conditions during the flow of gas from the cascade storage tothe vehicle tanks, it is impossible to guarantee that the level of fuelling time performance is maintained
Energies 2019, 12, 2165 3 of 24
after energy cost saving operation interventions. Disruption of fuelling time performance threatensconvenience and could sour consumer sentiment on use of CNG, even when costs are lowered [5].
In the present work, a novel study for the efficient operation of a CNG fast-fill station is presented.The hierarchical model includes an upper layer, which is an optimisation of compressor schedulingto minimise energy cost, and a lower layer to control the valves of the priority panel and the gasdispenser so as to achieve desirable conditions of pressure for minimum vehicle filling time. On theupper layer, the scheduling of the compressor operation to minimise electricity cost incurred undera TOU tariff is realised while minimising compressor switching frequency and meeting the gasdemand in the control horizon. The compressor operation schedule obtained is implemented onthe lower layer as an input for the optimal control of vehicle fuelling to achieve minimum fillingtime using a model predictive control strategy (MPC). MPC strategies are popular in modern controlapplications with demonstrated benefits of their closed loop robustness and stability [30,31], and theability handle constraints in complex applications [32]. This study presents the first attempt to combinethe optimal minimisation of CNG station energy cost through compressor scheduling, with the optimalcontrol of the vehicle filling pressure conditions from the cascade storage to achieve minimum fillingtimes. This proposed approach will safeguard the gains from energy cost savings, by ensuring asimultaneous improvement in gas transfer performance which is of great importance to fuellingconvenience. The current work and case study highlight how adoption of alternative fuels intersectswith electricity demand response programs, and how the operation optimisation for demand responsemust be enhanced with performance optimisation to secure the resulting complementary benefits.
This article is laid out as follows: In Section 2, the models for the upper and lower layers arepresented. The case study considered for the proposed strategy is described in Section 3. Results anddiscussions for the outcomes of the study are reported in Section 4. Section 5 concludes the study.
2. System Modelling and Formulation
2.1. The Energy Cost Minimisation Layer
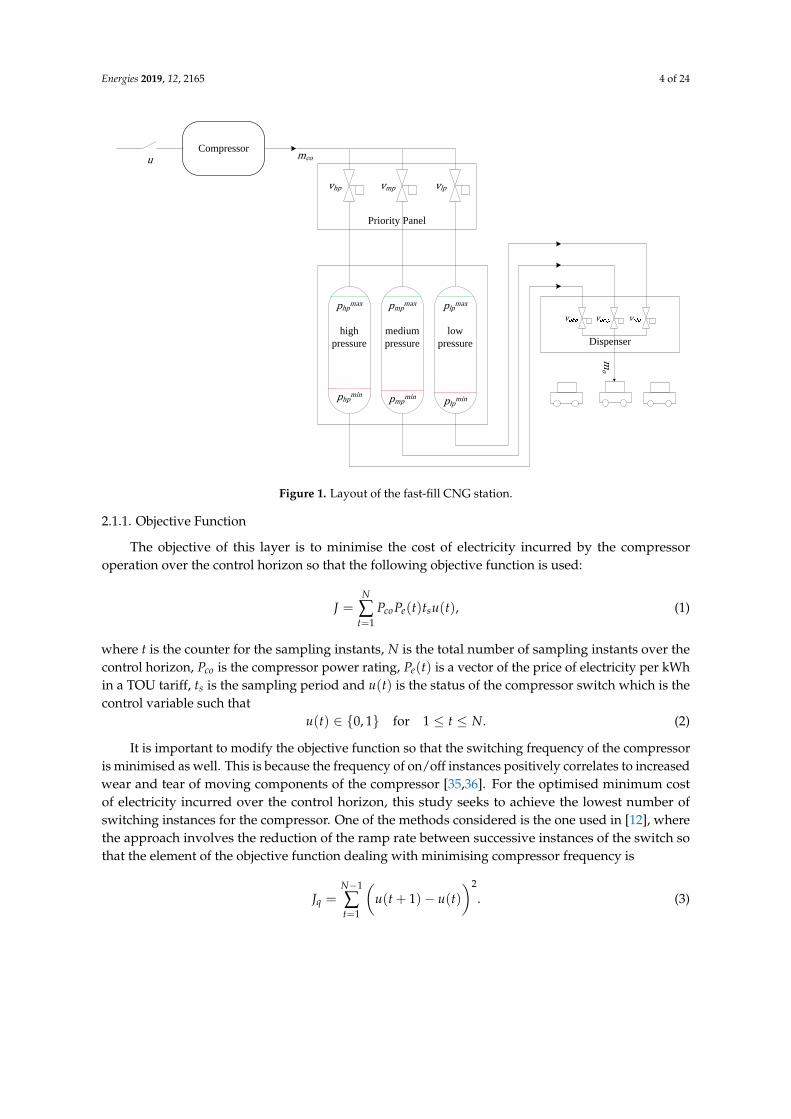
Figure 1 shows the configuration of the CNG fast-fill station. Under normal operation, thecompressor receives natural gas from the utility’s distribution pipeline at low to medium pressure,approximately 4–15 bar [20], and compresses it into a three level cascade storage system. The gas beingcompressed passes through a priority panel valve system that alternates the flow of CNG between thethree levels of the cascade storage usually called the high pressure, medium pressure and low pressurelevels according to their minimum allowed operating pressures [18]. The series of valves vhp, vmp
and vlp in the priority panel represent the inlet valves to the high pressure, medium pressure and lowpressure tanks of the cascade storage respectively. When the upper pressure limit for all the cascadestorage level is achieved, the compressor switch u is turned off so that no more gas flows into thecascade storage. Vehicles arriving at the dispenser have their tanks filled through the dispenser valvesvohp, vomp and volp for the high pressure, medium pressure and low pressure cascade storage tanks,respectively. The gas flow is alternated so that a lower limit of flow rate determines the tank from whichthe vehicle is filled, starting with the lowest pressure tank to the medium pressure tank as the vehicletank fills up and topping off with the high pressure tank [33]. As CNG leaves the cascade storage,the pressure in storage drops and when the minimum pressure limits are reached, the compressorswitch u comes on to replenish the storage [34] and the cycle is repeated. The gas demand at thedispenser, mo, determines the cycling of the compressor and thus the total cost of electricity incurred ina TOU electricity tariff [24]. The energy cost minimisation layer is formulated as a mass flow problem,as we proposed in our previous study [29]. This means that the scheduling of the compressor operationis optimised around mass inflow to the cascade storage from the municipal supply line and massoutflow as determined by mass of gas demand at the dispenser over the control horizon.
Energies 2019, 12, 2165 4 of 24
Compressor
Priority Panel
high pressure
medium pressure
low pressure Dispenser
Figure 1. Layout of the fast-fill CNG station.
2.1.1. Objective Function
The objective of this layer is to minimise the cost of electricity incurred by the compressoroperation over the control horizon so that the following objective function is used:
J =N
∑t=1
PcoPe(t)tsu(t), (1)
where t is the counter for the sampling instants, N is the total number of sampling instants over thecontrol horizon, Pco is the compressor power rating, Pe(t) is a vector of the price of electricity per kWhin a TOU tariff, ts is the sampling period and u(t) is the status of the compressor switch which is thecontrol variable such that
u(t) ∈ {0, 1} for 1 ≤ t ≤ N. (2)
It is important to modify the objective function so that the switching frequency of the compressoris minimised as well. This is because the frequency of on/off instances positively correlates to increasedwear and tear of moving components of the compressor [35,36]. For the optimised minimum costof electricity incurred over the control horizon, this study seeks to achieve the lowest number ofswitching instances for the compressor. One of the methods considered is the one used in [12], wherethe approach involves the reduction of the ramp rate between successive instances of the switch sothat the element of the objective function dealing with minimising compressor frequency is
Jq =N−1
∑t=1
(u(t + 1)− u(t)
)2
. (3)
Energies 2019, 12, 2165 5 of 24
Elsewhere, in [29], the approach is based on the introduction of an auxiliary variable s(t) [37,38]that assumes a value of 1 when a switch-on occurs and tries to minimise the summation of the auxiliaryvariable over the control horizon such that
Jpr =N
∑t=1
s(t), (4)
andu(1)− s(1) ≤ 0, (5)
u(t)− u(t− i)− s(t) ≤ 0. (6)
Although both methods have been found to be effective, in the present study, we propose tointroduce a new method where the operation is optimised to prefer the occurrence of on-instances insuccession of each other by minimising the summation of the negative product of successive instancesof the solution to the control variable u, so that the objective function becomes
JU = $N
∑t=1
PcoPetsu(t) + (1− $)N−1
∑t=1−(
u(t)u(t + 1))
, (7)
where $ is a weighting factor. The weighting factor can be set to reduce the number of switchinginstances so that the minimum number possible is attained for the same energy cost incurred suchas was the case in [29]. The method proposed in the current study for minimising the frequency ofcompressor switching involves a single mathematical operation and no additional constraints whichreduces the computational complexity of the problem when compared with Equations (3) and (4).
2.1.2. Constraints
The constraints for this upper layer minimising energy cost are based on the total mass storagecapacity of the cascade storage as well as the terminal conditions so that
mmin ≤ m(t) ≤ mmax, (8)
where mmax is the maximum mass limit of gas for the cascade storage corresponding to the maximumpressure limits, mmin is the minimum mass limit of gas for the cascade storage at the minimum pressurelimits and the mass of gas in the cascade storage m(t) is
m(t) = m(0) + ts
t−1
∑i=0
mcou(i)−t−1
∑i=0
mo(i), (9)
where mo(i) is the gas flowing out of the cascade storage into a vehicle in a sampling instant and mco isthe mass flow rate of the compressor which is obtained as [39]
mco = ρstd ×Qstd = (Mwg
Mwa)× ρa,std ×Qstd, (10)
where ρstd is the density of CNG under standard conditions (0 ◦C temperature and 105 pascalspressure) [40], Mwg is the molecular weight of the CNG, Mwa is the molecular weight of air, ρa,stdis the air density under standard conditions and Qstd is the capacity of the compressor understandard conditions.
The mass limits of gas for the cascade storage capacity constraints mmin and mmax are derivedfrom working pressure limits of the cascade storage and the physical properties of the gas
PV = znRT, (11)
Energies 2019, 12, 2165 6 of 24
where P is the value of the pressure rating, V is the total volume of the cascade storage, z is thecompressibility factor, R is the ideal gas constant and n the quantity of gas in moles which is correlatedwith the mass as
n =mM
, (12)
where M is the molar mass. The working mass limits for the cascade storage therefore become
mmax =MVPmax
zRTmmin =
MVPminzRT
. (13)
2.1.3. Algorithm
To solve the problem using OPTI toolbox SCIP solver interfaced in Matlab, the upper layer energycost minimisation layer problem is formulated in the form
minimisex f (x), (14)
subject to Ax ≤ b, (15)
lb ≤ x ≤ ub, (16)
x ∈ {0, 1}. (17)
The objective function in Equation (1) is expressed as
f (x) =
($PcoPets ×
(u(1) + u(2) + · · ·+ u(N)
))−((1− $)×
(u(1)× u(2) + u(2)× u(3) + · · ·+ u(N − 1)× u(N)
)). (18)
From the constraint in Equation (8) and the dynamic equation of mass in Equation (9), these linearinequalities can be expressed as
Ax ≤ b1, (19)
−Ax ≤ b2, (20)
where
A =
−tsmco 0 · · · 0−tsmco −tsmco · · · 0
......
. . ....
−tsmco −tsmco · · · −tsmco
N×N
, (21)
b1 =
m(0)−mmin−mo(1)
m(0)−mmin−(
mo(1)+mo(2))
...
m(0)−mmin−(
mo(1)+mo(2)+· · ·+mo(N))
N×1
, (22)
b2 =
mmax−m(0)+mo(1)
mmax−m(0)+(
mo(1)+mo(2))
...
mmax−m(0)+(
mo(1)+mo(2)+· · ·+mo(N))
N×1
. (23)
The linear inequality constraints in the form of Ax ≤ b become
A =
[A−A
]2N×N
, b =
[b1
b2
]2N×1
. (24)
Energies 2019, 12, 2165 7 of 24
The control vector for the problem, x, can be written in the standard form
x = [u(1), u(2) · · · u(N)]TN×1. (25)
2.2. Gas Flow Optimisation Layer
A model predictive control (MPC) strategy is implemented on the lower layer with a predictionhorizon Np and the sampling time tss. The status of the compressor switch u is obtained from thesolution of optimisation of the upper layer. Whenever switch u is on, gas flows into the three tankstorage via valves vhp, vmp and vlp of the priority panel. The gas flows in from the compressor at aconstant mass flow rate mco. Each of the three tanks has maximum and minimum pressures, pmax
hp ,
pmaxmp , pmax
lp and pminhp , and pmin
mp and pminlp , respectively. Gas flows into the vehicle from the storage tanks
via the dispenser valves vohp, vomp and volp. The initial pressure for each vehicle tank pveh is a knownquantity from the demand data while the initial pressure for the high pressure tank php, mediumpressure tank pmp and low pressure tank plp are measured from the final conditions after the previouscontrol action.
2.2.1. Objective Function
The objective of this layer is to minimise the difference between the vehicle tank pressurepveh(k + j) and the target pressure pT(k + j) which corresponds to the quantity of gas ordered by thecustomer for the vehicle at step j based on the current sampling instant k. This ensures continuous flowof gas from the cascade storage tanks to the vehicle tank. Additionally, we minimise the summation ofdispenser valve action instances, which ensures minimisation of filling time. This is because loweringthe total number of instances required for the dispenser valves to be on in order to fill the vehicle tank,corresponds to a shorter filling time of the vehicle tank. Therefore, the controller prefers the cascadefilling profile with the least number of total dispenser valve open instances. The objective functionbased on the current sampling instant k is therefore to minimise
JL(k) = (ς)Np−1
∑j=0
(pT(k + j)− pveh(k + j)
)+ (1− ς)
Np−1
∑j=0
(vohp(k + j) + vomp(k + j) + volp(k + j)
), (26)
where ς is a weighting factor and vohp(k + j), vomp(k + j) and volp(k + j) are the dispenser statuses forthe high pressure, medium pressure and low pressure cascade storage tanks, respectively. Gas flowfrom the cascade storage tanks to the vehicle tank, mveh(k + j) ensures that the vehicle pressureapproaches the target pressure value and is the sum of flow rates from the three tanks, so that basedon the current sampling instant k
mveh(k + j) = mhp(k + j)vohp(k + j) + mmp(k + j)vomp(k + j) + mlp(k + j)volp(k + j). (27)
The equations for the instantaneous flow rates mhp(k + j), mmp(k + j) and mlp(k + j) betweenthe high, medium and low pressure tanks of the cascade storage, respectively, and the vehicle tank,are based on the ideal gas model for an adiabatic system [41] and are governed by the pressure ratiosbetween the storage tanks and the vehicle tank. i.e.,
mhp(k + j) =Cdρhp(k + j)Aori f ice
(pveh(k + j)php(k + j)
) 1γ
{(
2γ
γ− 1)(
php(k + j)ρhp(k + j)
)
(1− (
pveh(k + j)php(k + j)
)γ−1
γ
)} 12
forpveh(k + j)php(k + j)
≤(
2γ + 1
) γγ−1
,
(28)
and
mhp(k + j) = Cd
√γphp(k + j)ρhp(k + j)Aori f ice
(2
γ + 1
) γ+12(γ−1)
forpveh(k + j)php(k + j)
≥(
2γ + 1
) γγ−1
, (29)
Energies 2019, 12, 2165 8 of 24
and similarly for the mmp(k + j)
mmp(k + j) =Cdρmp(k + j)Aori f ice
(pveh(k + j)pmp(k + j)
) 1γ
{(
2γ
γ− 1)(
pmp(k + j)ρmp(k + j)
)
(1− (
pveh(k + j)pmp(k + j)
)γ−1
γ
)} 12
forpveh(k + j)pmp(k + j)
≤(
2γ + 1
) γγ−1
,
(30)
and
mmp(k + j) = Cd
√γpmp(k + j)ρmp(k + j)Aori f ice
(2
γ + 1
) γ+12(γ−1)
forpveh(k + j)pmp(k + j)
≥(
2γ + 1
) γγ−1
, (31)
and for mlp(k + j)
mlp(k + j) =Cdρlp(k + j)Aori f ice
(pveh(k + j)plp(k + j)
) 1γ
{(
2γ
γ− 1)(
plp(k + j)ρlp(k + j)
)
(1− (
pveh(k + j)plp(k + j)
)γ−1
γ
)} 12
forpveh(k + j)plp(k + j)
≤(
2γ + 1
) γγ−1
,
(32)
and
mlp(k + j) = Cd
√γplp(k + j)ρlp(k + j)Aori f ice
(2
γ + 1
) γ+12(γ−1)
forpveh(k + j)plp(k + j)
≥(
2γ + 1
) γγ−1
, (33)
where γ is the ratio of specific heats
γ =cp
cv, (34)
and cp is the specific heat capacity of the gas at constant pressure while cv is specific heat capacityof the gas at constant volume. Cd is the coefficient of discharge of the dispenser valve orifice, Aori f iceis the area of the dispenser valve orifice and ρhp, ρmp and ρlp are the densities of the gas in the highpressure ,medium pressure and low pressure reservoirs, respectively.
2.2.2. Constraints
The valves at the dispenser and the priority panel, as the control variables, are subject tooperational constraints. The valves of the priority panel open one at a time when the compressoris filling the cascade storage reservoirs which gives the constraint in Equation (35). The valves ofthe dispenser also open one at a time during the filling of the vehicle from the cascade storage asrepresented by the constraint in Equation (36).
vhp(k + j) + vmp(k + j) + vlp(k + j)− u(k + j) = 0, (35)
vohp(k + j) + vomp(k + j) + volp(k + j) ≤ 1, (36)
vohp(k + j), vomp(k + j), volp(k + j), vhp(k + j), vmp(k + j), vlp(k + j), u(k + j) ∈ {0, 1}.
Energies 2019, 12, 2165 9 of 24
Further, the vehicle tank pressure pveh and the pressure in the three cascade reservoirs php, pmp
and plp, as the states of the gas flow optimisation layer, are also subject to operational constraints.The limits of pressure for the vehicle tank and each of the reservoirs of the cascade storage are such that
pminhp ≤ php(k + j) ≤ pmax
hp , (37)
pminmp ≤ pmp(k + j) ≤ pmax
mp , (38)
pminlp ≤ plp(k + j) ≤ pmax
lp , (39)
pveh(k + Np + 1− j) ≥ pT(k), (40)
Equations (37)–(39) ensure that the maximum and minimum working pressures of the cascadestorage tanks are not exceeded, while Equation (40) ensures that, at the end of the control horizon,the vehicle tank is filled to the target pressure corresponding to the requested quantity of gas bythe customer.
Based on the described flow of gas for the proposed approach, the general differential equationsfor pressure change in the vehicle and cascade storage reservoirs are
ddt
pveh(t) = mveh(t)K1, (41)
ddt
php(t) = −mhp(t)Khpvohp(t) + mcovhp(t), (42)
ddt
pmp(t) = −mmp(t)Kmpvomp(t) + mcovmp(t), (43)
ddt
plp(t) = −mlp(t)Klpvolp(t) + mcovlp(t), (44)
where the constants K1, Khp, Kmp and Klp are
K1 = T(
cp
cv
RVveh
), Khp = T
(cp
cv
RVhp
), Kmp = T
(cp
cv
RVmp
)and Klp = T
(cp
cv
RVlp
), (45)
where Vveh, Vhp, Vmp and Vlp are the volumes of the vehicle tank, high pressure reservoir, mediumpressure reservoir and low pressure reservoir, respectively. This yields the following discrete equationsof pressure, for the current sampling instant k
pveh(k + j) = pveh(k) + tssK1
k+j
∑τ=k
mveh(τ), (46)
php(k + j) = php(k)− tssKhp
k+j
∑τ=k
mveh(τ)vohp(τ) + tssmco
k+j
∑τ=k
vhp(τ), (47)
pmp(k + j) = pmp(k)− tssKmp
k+j
∑τ=k
mveh(τ)vomp(τ) + tssmco
k+j
∑τ=k
vmp(τ), (48)
plp(k + j) = plp(k)− tssKlp
k+j
∑τ=k
mveh(τ)volp(τ) + tssmco
k+j
∑τ=k
vlp(τ). (49)
Energies 2019, 12, 2165 10 of 24
2.2.3. Algorithm
To solve the gas flow optimisation layer problem using the Mixed Integer Distributed Ant ColonyOptimisation (MIDACO) solver, the components of the problem have to be formulated as
minimise f (x) (objective function) (50)
subject to g(x) = 0 (equality constraints) (51)
h(x) ≥ 0 (inequality constraints) (52)
The control vector consists of the conditions of the three priority panel valves and the threedispenser valves, and for each sampling instant k, x can be written in the standard form
x = [vhp(k + 1), vhp(k + 2), · · · vhp(k + Np), vmp(k + 1), vmp(k + 2), · · · vmp(k + Np), vlp(k + 1),
vlp(k + 2), · · · vlp(k + Np), vohp(k + 1), vohp(k + 2), · · · vohp(k + Np), vomp(k + 1),
vomp(k + 2), · · · vomp(k + Np), volp(k + 1), volp(k + 2), · · · volp(k + Np), ]T6Np×1.
(53)
The objective function in Equation (26),
f = [ς×(
PT − Pveh(k + 1) + PT − Pveh(k + 2) · · · PT − Pveh(k + Np))+ (1− ς)×
(vohp(k + 1)+
vomp(k + 1) + volp(k + 1) + vohp(k + 2) + vomp(k + 2) + volp(k + 2) · · ·
vohp(k + Np) + vomp(k + Np) + volp(k + Np))].
(54)
The equality constraint in Equation (35) yields the g(x) = 0 set for the algorithm so that
g(x) =
vhp(k+1)+vmp(k+1)+vlp(k+1)−u(k+1)vhp(k+2)+vmp(k+2)+vlp(k+2)−u(k+2)
...vhp(k+Np)+vmp(k+Np)+vlp(k+Np)−u(k+Np)
Np×1
, (55)
while the inequality in Equation (36) yields the first set of h(x) ≥ 0 such that
h1(x) =
1−(
vohp(k+1)+vomp(k+1)+volp(k+1))
1−(
vohp(k+2)+vomp(k+2)+volp(k+2))
...
1−(
vohp(k+Np)+vomp(k+Np)+volp(k+Np))
Np×1
. (56)
Energies 2019, 12, 2165 11 of 24
The next set of inequality constraints is derived from Equations (37)–(39) such that
h2(x) =
pmaxhp −php(k+1)
...pmax
hp −php(k+Np)
pmaxmp −pmp(k+1)
...pmax
mp −pmp(k+Np)
pmaxlp −plp(k+1)
...pmax
lp −plp(k+Np)
php(k+1)−pminhp
...php(k+Np)−pmin
hppmp(k+1)−pmin
mp...
pmp(k+Np)−pminmp
plp(k+1)−pminlp
...plp(k+Np)−pmin
lp
6Np×1
. (57)
The final element of the inequality constraints is derived from Equation (40), yielding
h3(x) =[
pveh(k+N+1− j)−pT(k)]
1×1. (58)
The combined set of inequality constraints therefore becomes
h(x) =
h1(x)h2(x)h3(x)
(7Np+1)×1
. (59)
At the current sampling instant k, an open loop optimisation problem is solved by the controllerfor the prediction horizon Np. Only the first elements of the control variables vhp, vmp, vlp, vohp, vomp
and volp are implemented on the CNG filling station plant. The vehicle pressure pveh and the pressurein the cascade storage tanks php, pmp and plp, which are the system states, are measured and the valuesfed back to the MPC controller, forming the initial states for the following sampling instant k + 1.The input variables are then updated and the cycle repeated until all control actions for the intendedperiod are implemented.
The MPC controller workflow is such that:
1. For the current sampling instant k, the controller minimises the objective function in Equation (26)and finds an optimum solution for the control variables vhp, vmp, vlp, vohp, vomp and volp, subjectto the constraints set out in Section 2.2.2.
2. From the solution, only the first elements of the solution vhp(k|k), vmp(k|k), vlp(k|k), vohp(k|k),vomp(k|k) and volp(k|k) are implemented.
3. The states pveh(k + 1), php(k + 1), pmp(k + 1) and plp(k + 1) are measured to be fed back.4. The value of k is set to k = k + 1 and system states, inputs and outputs are updated.5. Steps 1–4 are repeated until k reaches a value predetermined to mark the end of the control period.
Energies 2019, 12, 2165 12 of 24
3. Case Study
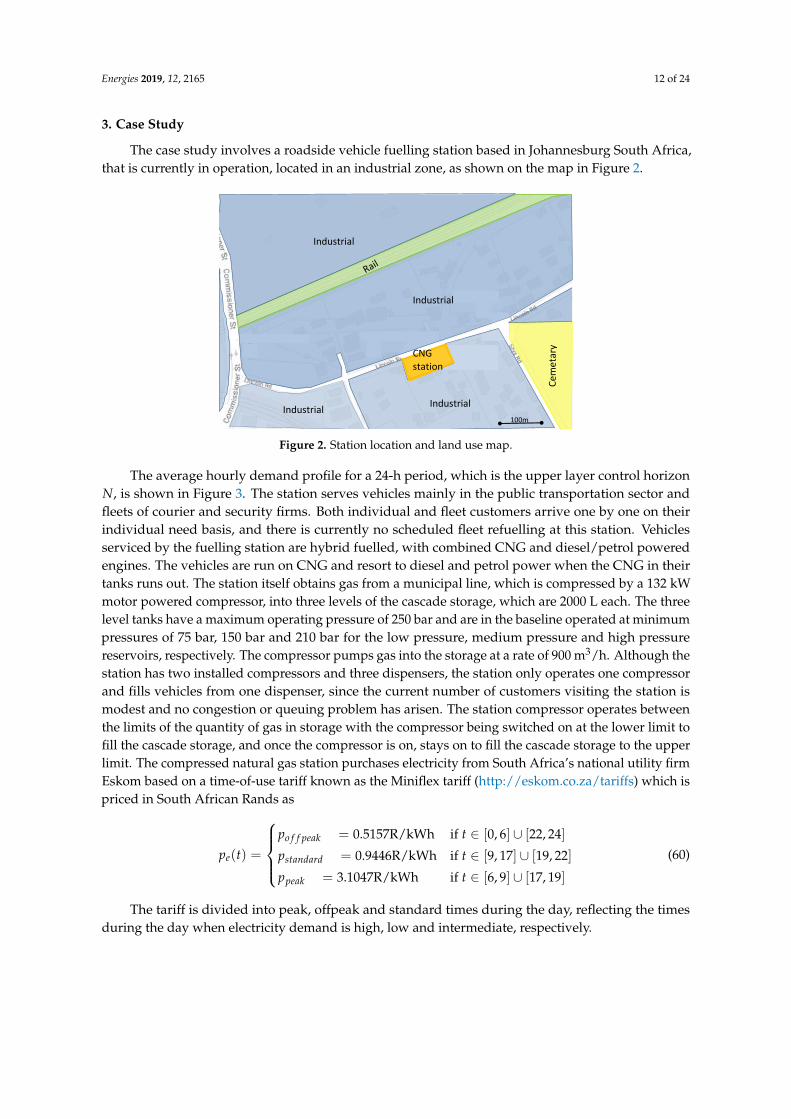
The case study involves a roadside vehicle fuelling station based in Johannesburg South Africa,that is currently in operation, located in an industrial zone, as shown on the map in Figure 2.
Industrial
Industrial
Industrial Industrial
Cem
etar
y
CNG station
100m
Figure 2. Station location and land use map.
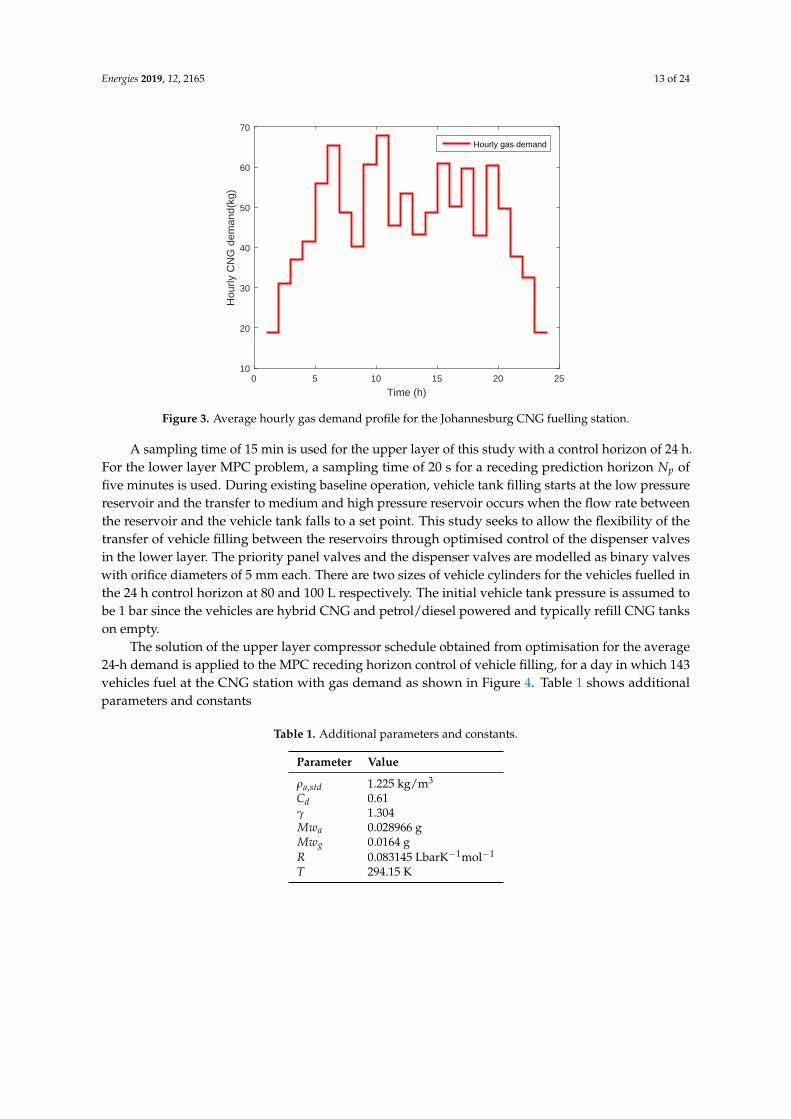
The average hourly demand profile for a 24-h period, which is the upper layer control horizonN, is shown in Figure 3. The station serves vehicles mainly in the public transportation sector andfleets of courier and security firms. Both individual and fleet customers arrive one by one on theirindividual need basis, and there is currently no scheduled fleet refuelling at this station. Vehiclesserviced by the fuelling station are hybrid fuelled, with combined CNG and diesel/petrol poweredengines. The vehicles are run on CNG and resort to diesel and petrol power when the CNG in theirtanks runs out. The station itself obtains gas from a municipal line, which is compressed by a 132 kWmotor powered compressor, into three levels of the cascade storage, which are 2000 L each. The threelevel tanks have a maximum operating pressure of 250 bar and are in the baseline operated at minimumpressures of 75 bar, 150 bar and 210 bar for the low pressure, medium pressure and high pressurereservoirs, respectively. The compressor pumps gas into the storage at a rate of 900 m3/h. Although thestation has two installed compressors and three dispensers, the station only operates one compressorand fills vehicles from one dispenser, since the current number of customers visiting the station ismodest and no congestion or queuing problem has arisen. The station compressor operates betweenthe limits of the quantity of gas in storage with the compressor being switched on at the lower limit tofill the cascade storage, and once the compressor is on, stays on to fill the cascade storage to the upperlimit. The compressed natural gas station purchases electricity from South Africa’s national utility firmEskom based on a time-of-use tariff known as the Miniflex tariff (http://eskom.co.za/tariffs) which ispriced in South African Rands as
pe(t) =
po f f peak = 0.5157R/kWh if t ∈ [0, 6] ∪ [22, 24]
pstandard = 0.9446R/kWh if t ∈ [9, 17] ∪ [19, 22]
ppeak = 3.1047R/kWh if t ∈ [6, 9] ∪ [17, 19]
(60)
The tariff is divided into peak, offpeak and standard times during the day, reflecting the timesduring the day when electricity demand is high, low and intermediate, respectively.
Energies 2019, 12, 2165 13 of 24
0 5 10 15 20 25
Time (h)
10
20
30
40
50
60
70
Hou
rly C
NG
dem
and(
kg)
Hourly gas demand
Figure 3. Average hourly gas demand profile for the Johannesburg CNG fuelling station.
A sampling time of 15 min is used for the upper layer of this study with a control horizon of 24 h.For the lower layer MPC problem, a sampling time of 20 s for a receding prediction horizon Np offive minutes is used. During existing baseline operation, vehicle tank filling starts at the low pressurereservoir and the transfer to medium and high pressure reservoir occurs when the flow rate betweenthe reservoir and the vehicle tank falls to a set point. This study seeks to allow the flexibility of thetransfer of vehicle filling between the reservoirs through optimised control of the dispenser valvesin the lower layer. The priority panel valves and the dispenser valves are modelled as binary valveswith orifice diameters of 5 mm each. There are two sizes of vehicle cylinders for the vehicles fuelled inthe 24 h control horizon at 80 and 100 L respectively. The initial vehicle tank pressure is assumed tobe 1 bar since the vehicles are hybrid CNG and petrol/diesel powered and typically refill CNG tankson empty.
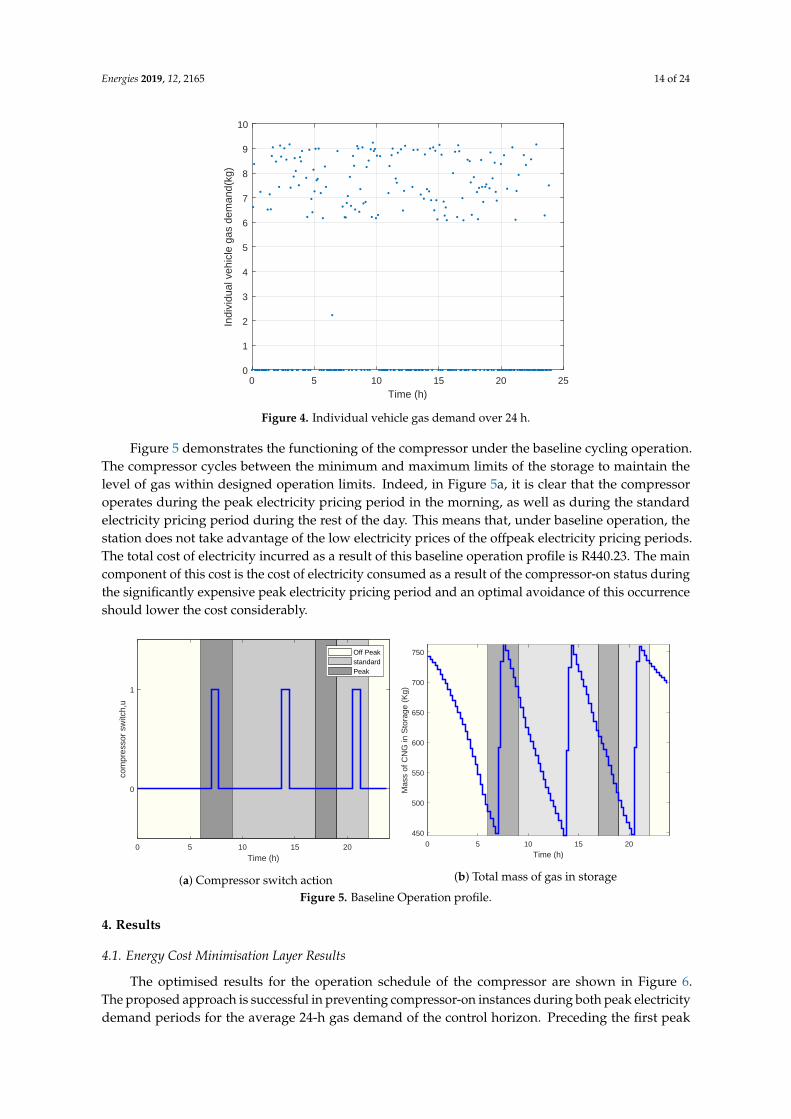
The solution of the upper layer compressor schedule obtained from optimisation for the average24-h demand is applied to the MPC receding horizon control of vehicle filling, for a day in which 143vehicles fuel at the CNG station with gas demand as shown in Figure 4. Table 1 shows additionalparameters and constants
Table 1. Additional parameters and constants.
Parameter Value
ρa,std 1.225 kg/m3
Cd 0.61γ 1.304Mwa 0.028966 gMwg 0.0164 gR 0.083145 LbarK−1mol−1
T 294.15 K
Energies 2019, 12, 2165 14 of 24
0 5 10 15 20 25
Time (h)
0
1
2
3
4
5
6
7
8
9
10
Indi
vidu
al v
ehic
le g
as d
eman
d(kg
)
Figure 4. Individual vehicle gas demand over 24 h.
Figure 5 demonstrates the functioning of the compressor under the baseline cycling operation.The compressor cycles between the minimum and maximum limits of the storage to maintain thelevel of gas within designed operation limits. Indeed, in Figure 5a, it is clear that the compressoroperates during the peak electricity pricing period in the morning, as well as during the standardelectricity pricing period during the rest of the day. This means that, under baseline operation, thestation does not take advantage of the low electricity prices of the offpeak electricity pricing periods.The total cost of electricity incurred as a result of this baseline operation profile is R440.23. The maincomponent of this cost is the cost of electricity consumed as a result of the compressor-on status duringthe significantly expensive peak electricity pricing period and an optimal avoidance of this occurrenceshould lower the cost considerably.
0 5 10 15 20
Time (h)
0
1
com
pres
sor
switc
h,u
Off PeakstandardPeak
(a) Compressor switch action
0 5 10 15 20
Time (h)
450
500
550
600
650
700
750
Mas
s of
CN
G in
Sto
rage
(K
g)
(b) Total mass of gas in storage
Figure 5. Baseline Operation profile.
4. Results
4.1. Energy Cost Minimisation Layer Results
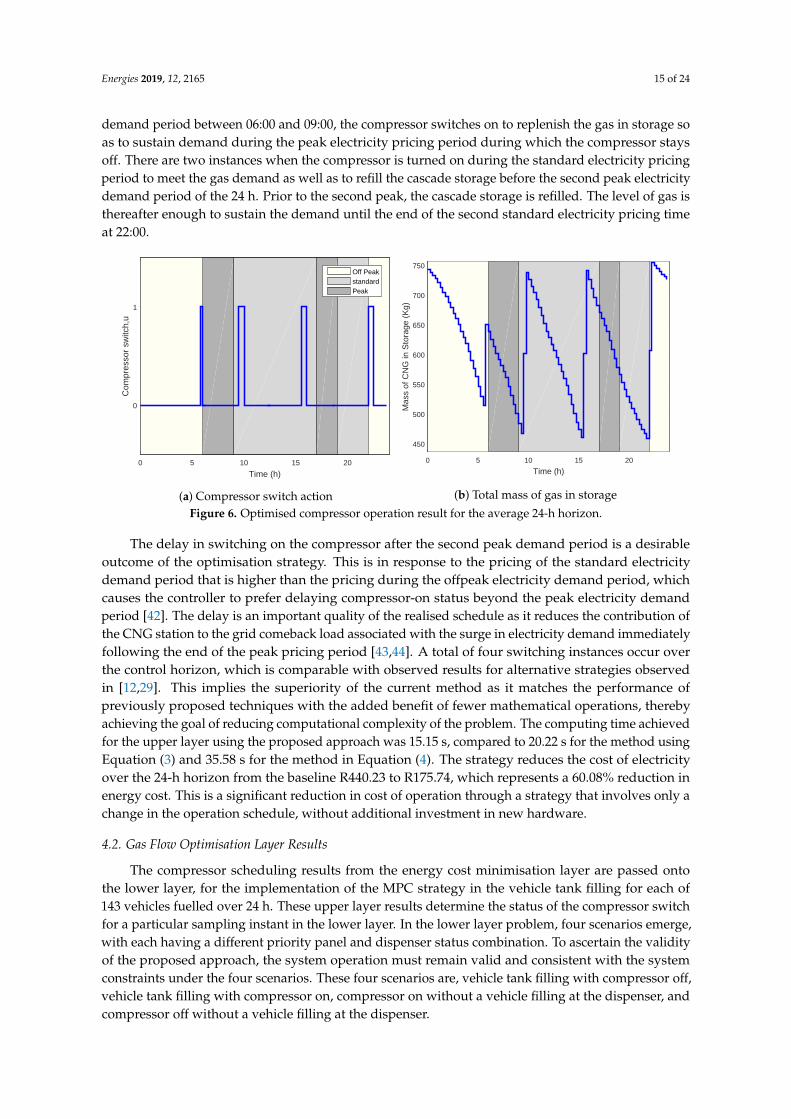
The optimised results for the operation schedule of the compressor are shown in Figure 6.The proposed approach is successful in preventing compressor-on instances during both peak electricitydemand periods for the average 24-h gas demand of the control horizon. Preceding the first peak
Energies 2019, 12, 2165 15 of 24
demand period between 06:00 and 09:00, the compressor switches on to replenish the gas in storage soas to sustain demand during the peak electricity pricing period during which the compressor staysoff. There are two instances when the compressor is turned on during the standard electricity pricingperiod to meet the gas demand as well as to refill the cascade storage before the second peak electricitydemand period of the 24 h. Prior to the second peak, the cascade storage is refilled. The level of gas isthereafter enough to sustain the demand until the end of the second standard electricity pricing timeat 22:00.
0 5 10 15 20
Time (h)
0
1
Com
pres
sor
switc
h,u
Off PeakstandardPeak
(a) Compressor switch action
0 5 10 15 20
Time (h)
450
500
550
600
650
700
750
Mas
s of
CN
G in
Sto
rage
(K
g)
(b) Total mass of gas in storage
Figure 6. Optimised compressor operation result for the average 24-h horizon.
The delay in switching on the compressor after the second peak demand period is a desirableoutcome of the optimisation strategy. This is in response to the pricing of the standard electricitydemand period that is higher than the pricing during the offpeak electricity demand period, whichcauses the controller to prefer delaying compressor-on status beyond the peak electricity demandperiod [42]. The delay is an important quality of the realised schedule as it reduces the contribution ofthe CNG station to the grid comeback load associated with the surge in electricity demand immediatelyfollowing the end of the peak pricing period [43,44]. A total of four switching instances occur overthe control horizon, which is comparable with observed results for alternative strategies observedin [12,29]. This implies the superiority of the current method as it matches the performance ofpreviously proposed techniques with the added benefit of fewer mathematical operations, therebyachieving the goal of reducing computational complexity of the problem. The computing time achievedfor the upper layer using the proposed approach was 15.15 s, compared to 20.22 s for the method usingEquation (3) and 35.58 s for the method in Equation (4). The strategy reduces the cost of electricityover the 24-h horizon from the baseline R440.23 to R175.74, which represents a 60.08% reduction inenergy cost. This is a significant reduction in cost of operation through a strategy that involves only achange in the operation schedule, without additional investment in new hardware.
4.2. Gas Flow Optimisation Layer Results
The compressor scheduling results from the energy cost minimisation layer are passed ontothe lower layer, for the implementation of the MPC strategy in the vehicle tank filling for each of143 vehicles fuelled over 24 h. These upper layer results determine the status of the compressor switchfor a particular sampling instant in the lower layer. In the lower layer problem, four scenarios emerge,with each having a different priority panel and dispenser status combination. To ascertain the validityof the proposed approach, the system operation must remain valid and consistent with the systemconstraints under the four scenarios. These four scenarios are, vehicle tank filling with compressor off,vehicle tank filling with compressor on, compressor on without a vehicle filling at the dispenser, andcompressor off without a vehicle filling at the dispenser.
Energies 2019, 12, 2165 16 of 24
4.2.1. Vehicle Filling with the Compressor Off
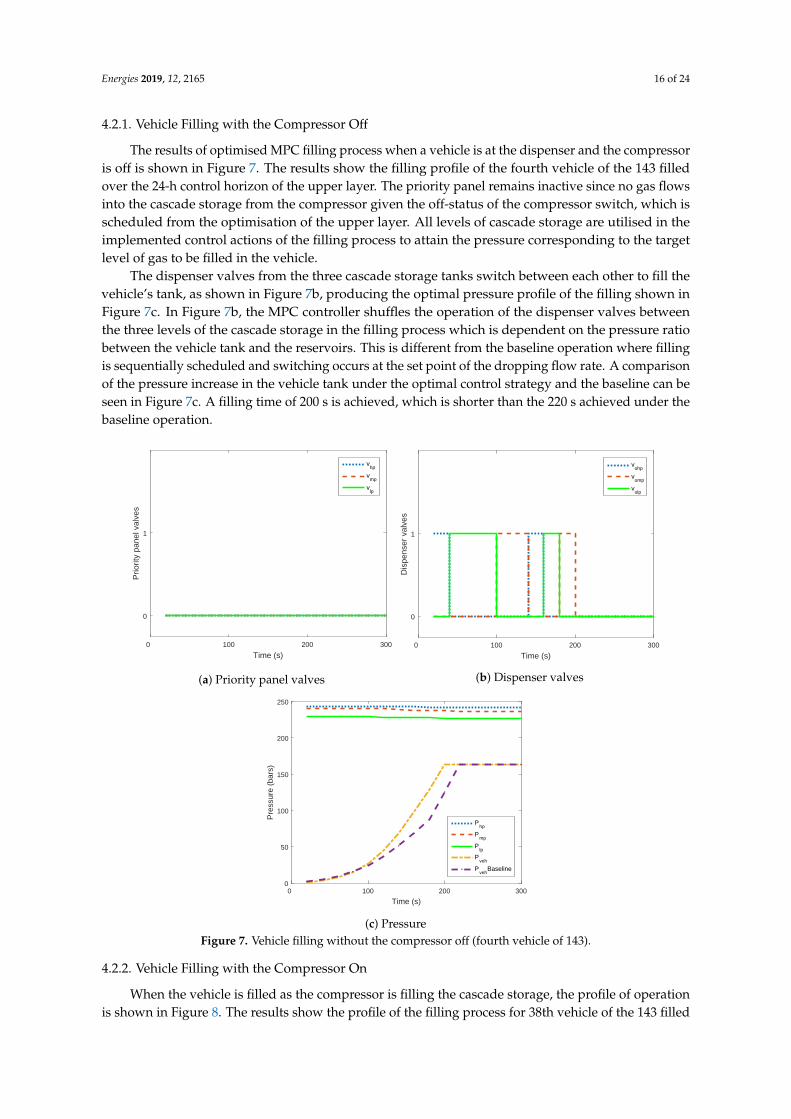
The results of optimised MPC filling process when a vehicle is at the dispenser and the compressoris off is shown in Figure 7. The results show the filling profile of the fourth vehicle of the 143 filledover the 24-h control horizon of the upper layer. The priority panel remains inactive since no gas flowsinto the cascade storage from the compressor given the off-status of the compressor switch, which isscheduled from the optimisation of the upper layer. All levels of cascade storage are utilised in theimplemented control actions of the filling process to attain the pressure corresponding to the targetlevel of gas to be filled in the vehicle.
The dispenser valves from the three cascade storage tanks switch between each other to fill thevehicle’s tank, as shown in Figure 7b, producing the optimal pressure profile of the filling shown inFigure 7c. In Figure 7b, the MPC controller shuffles the operation of the dispenser valves betweenthe three levels of the cascade storage in the filling process which is dependent on the pressure ratiobetween the vehicle tank and the reservoirs. This is different from the baseline operation where fillingis sequentially scheduled and switching occurs at the set point of the dropping flow rate. A comparisonof the pressure increase in the vehicle tank under the optimal control strategy and the baseline can beseen in Figure 7c. A filling time of 200 s is achieved, which is shorter than the 220 s achieved under thebaseline operation.
0 100 200 300
Time (s)
0
1
Prio
rity
pane
l val
ves
vhp
vmp
vlp
(a) Priority panel valves
0 100 200 300
Time (s)
0
1
Dis
pens
er v
alve
s
vohp
vomp
volp
(b) Dispenser valves
0 100 200 300
Time (s)
0
50
100
150
200
250
Pre
ssur
e (b
ars)
Php
Pmp
Plp
Pveh
Pveh
Baseline
(c) PressureFigure 7. Vehicle filling without the compressor off (fourth vehicle of 143).
4.2.2. Vehicle Filling with the Compressor On
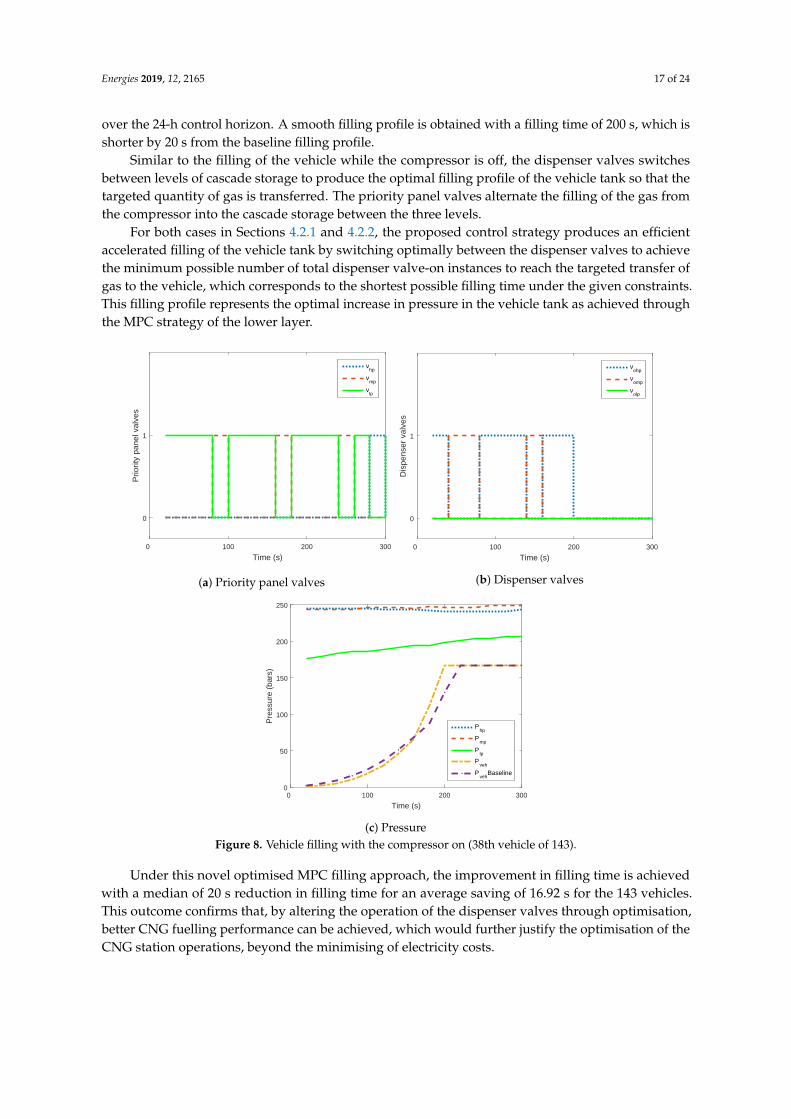
When the vehicle is filled as the compressor is filling the cascade storage, the profile of operationis shown in Figure 8. The results show the profile of the filling process for 38th vehicle of the 143 filled
Energies 2019, 12, 2165 17 of 24
over the 24-h control horizon. A smooth filling profile is obtained with a filling time of 200 s, which isshorter by 20 s from the baseline filling profile.
Similar to the filling of the vehicle while the compressor is off, the dispenser valves switchesbetween levels of cascade storage to produce the optimal filling profile of the vehicle tank so that thetargeted quantity of gas is transferred. The priority panel valves alternate the filling of the gas fromthe compressor into the cascade storage between the three levels.
For both cases in Sections 4.2.1 and 4.2.2, the proposed control strategy produces an efficientaccelerated filling of the vehicle tank by switching optimally between the dispenser valves to achievethe minimum possible number of total dispenser valve-on instances to reach the targeted transfer ofgas to the vehicle, which corresponds to the shortest possible filling time under the given constraints.This filling profile represents the optimal increase in pressure in the vehicle tank as achieved throughthe MPC strategy of the lower layer.
0 100 200 300
Time (s)
0
1
Prio
rity
pane
l val
ves
vhp
vmp
vlp
(a) Priority panel valves
0 100 200 300
Time (s)
0
1
Dis
pens
er v
alve
s
vohp
vomp
volp
(b) Dispenser valves
0 100 200 300
Time (s)
0
50
100
150
200
250
Pre
ssur
e (b
ars)
Php
Pmp
Plp
Pveh
Pveh
Baseline
(c) PressureFigure 8. Vehicle filling with the compressor on (38th vehicle of 143).
Under this novel optimised MPC filling approach, the improvement in filling time is achievedwith a median of 20 s reduction in filling time for an average saving of 16.92 s for the 143 vehicles.This outcome confirms that, by altering the operation of the dispenser valves through optimisation,better CNG fuelling performance can be achieved, which would further justify the optimisation of theCNG station operations, beyond the minimising of electricity costs.
Energies 2019, 12, 2165 18 of 24
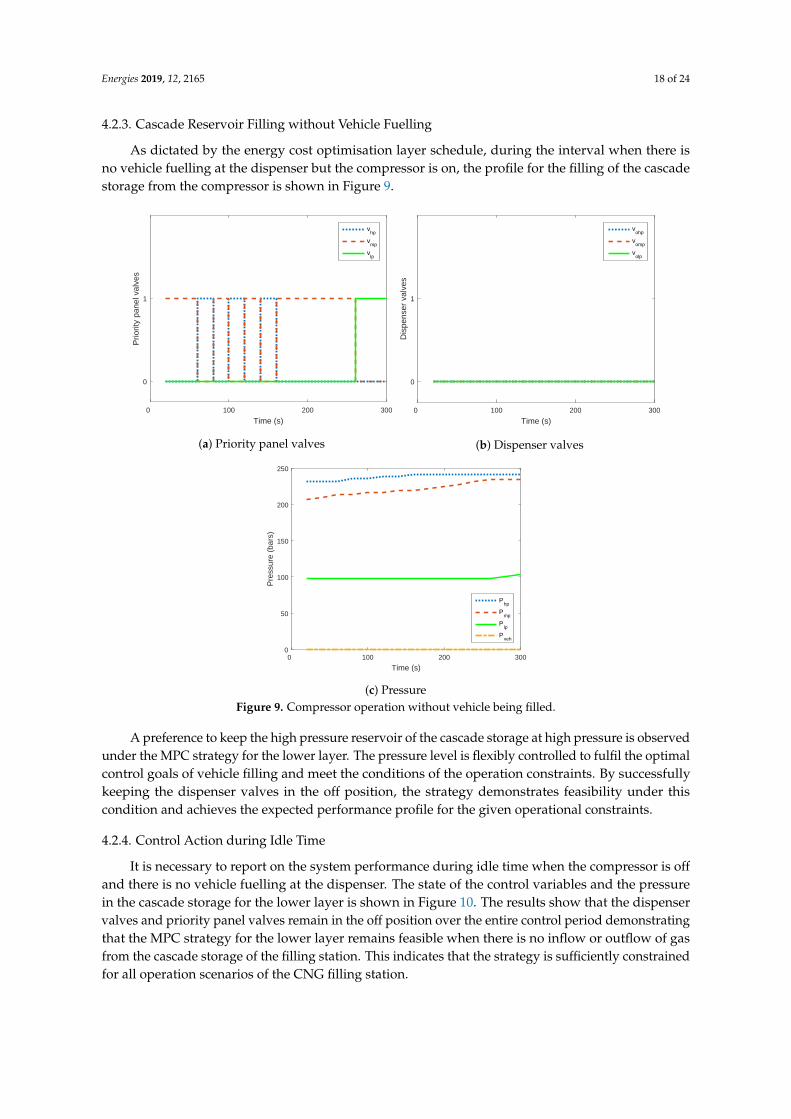
4.2.3. Cascade Reservoir Filling without Vehicle Fuelling
As dictated by the energy cost optimisation layer schedule, during the interval when there isno vehicle fuelling at the dispenser but the compressor is on, the profile for the filling of the cascadestorage from the compressor is shown in Figure 9.
0 100 200 300
Time (s)
0
1
Prio
rity
pane
l val
ves
vhp
vmp
vlp
(a) Priority panel valves
0 100 200 300
Time (s)
0
1
Dis
pens
er v
alve
s
vohp
vomp
volp
(b) Dispenser valves
0 100 200 300
Time (s)
0
50
100
150
200
250
Pre
ssur
e (b
ars)
Php
Pmp
Plp
Pveh
(c) PressureFigure 9. Compressor operation without vehicle being filled.
A preference to keep the high pressure reservoir of the cascade storage at high pressure is observedunder the MPC strategy for the lower layer. The pressure level is flexibly controlled to fulfil the optimalcontrol goals of vehicle filling and meet the conditions of the operation constraints. By successfullykeeping the dispenser valves in the off position, the strategy demonstrates feasibility under thiscondition and achieves the expected performance profile for the given operational constraints.
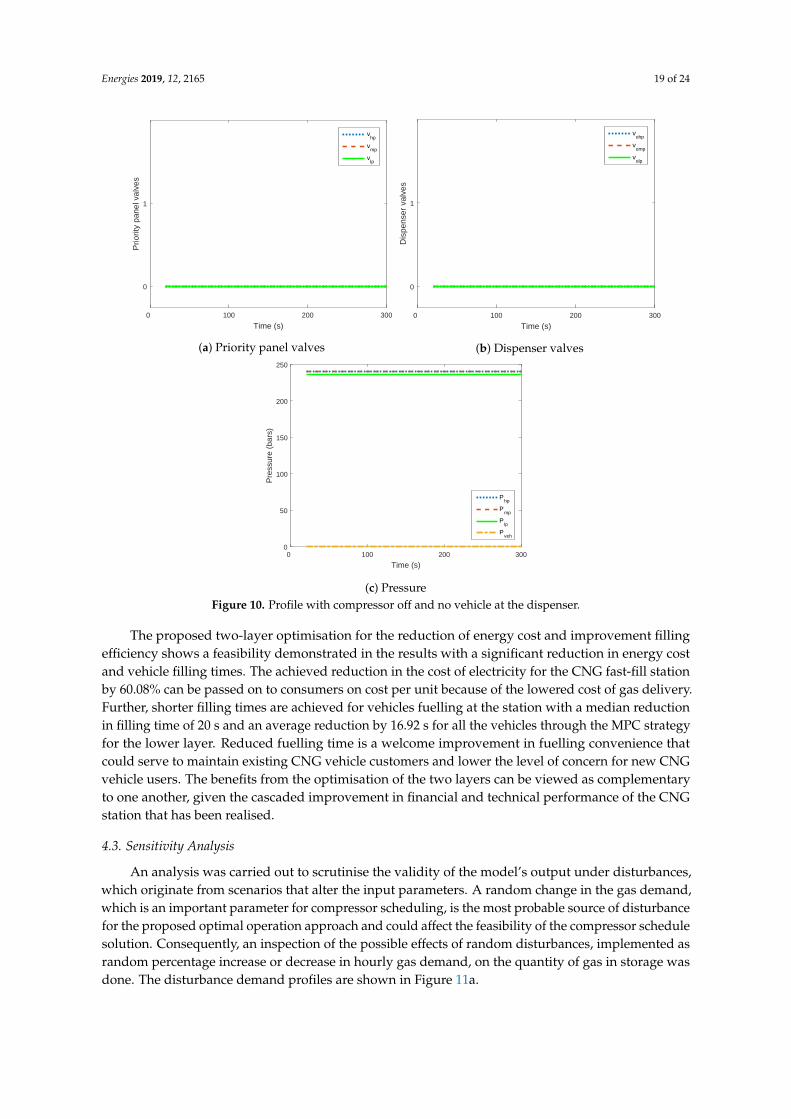
4.2.4. Control Action during Idle Time
It is necessary to report on the system performance during idle time when the compressor is offand there is no vehicle fuelling at the dispenser. The state of the control variables and the pressurein the cascade storage for the lower layer is shown in Figure 10. The results show that the dispenservalves and priority panel valves remain in the off position over the entire control period demonstratingthat the MPC strategy for the lower layer remains feasible when there is no inflow or outflow of gasfrom the cascade storage of the filling station. This indicates that the strategy is sufficiently constrainedfor all operation scenarios of the CNG filling station.
Energies 2019, 12, 2165 19 of 24
0 100 200 300
Time (s)
0
1
Prio
rity
pane
l val
ves
vhp
vmp
vlp
(a) Priority panel valves
0 100 200 300
Time (s)
0
1
Dis
pens
er v
alve
s
vohp
vomp
volp
(b) Dispenser valves
0 100 200 300
Time (s)
0
50
100
150
200
250
Pre
ssur
e (b
ars)
Php
Pmp
Plp
Pveh
(c) PressureFigure 10. Profile with compressor off and no vehicle at the dispenser.
The proposed two-layer optimisation for the reduction of energy cost and improvement fillingefficiency shows a feasibility demonstrated in the results with a significant reduction in energy costand vehicle filling times. The achieved reduction in the cost of electricity for the CNG fast-fill stationby 60.08% can be passed on to consumers on cost per unit because of the lowered cost of gas delivery.Further, shorter filling times are achieved for vehicles fuelling at the station with a median reductionin filling time of 20 s and an average reduction by 16.92 s for all the vehicles through the MPC strategyfor the lower layer. Reduced fuelling time is a welcome improvement in fuelling convenience thatcould serve to maintain existing CNG vehicle customers and lower the level of concern for new CNGvehicle users. The benefits from the optimisation of the two layers can be viewed as complementaryto one another, given the cascaded improvement in financial and technical performance of the CNGstation that has been realised.
4.3. Sensitivity Analysis
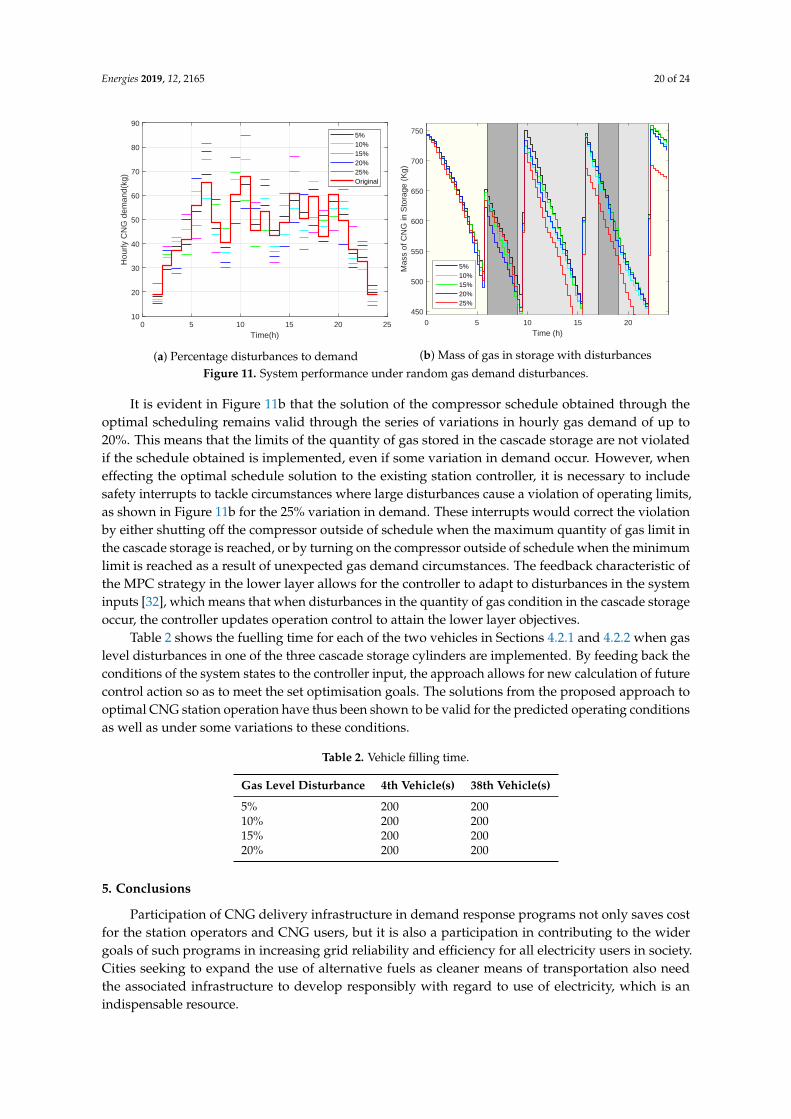
An analysis was carried out to scrutinise the validity of the model’s output under disturbances,which originate from scenarios that alter the input parameters. A random change in the gas demand,which is an important parameter for compressor scheduling, is the most probable source of disturbancefor the proposed optimal operation approach and could affect the feasibility of the compressor schedulesolution. Consequently, an inspection of the possible effects of random disturbances, implemented asrandom percentage increase or decrease in hourly gas demand, on the quantity of gas in storage wasdone. The disturbance demand profiles are shown in Figure 11a.
Energies 2019, 12, 2165 20 of 24
0 5 10 15 20 25
Time(h)
10
20
30
40
50
60
70
80
90H
ourly
CN
G d
eman
d(kg
)
5%10%15%20%25%Original
(a) Percentage disturbances to demand
0 5 10 15 20
Time (h)
450
500
550
600
650
700
750
Mas
s of
CN
G in
Sto
rage
(K
g)
5%10%15%20%25%
(b) Mass of gas in storage with disturbances
Figure 11. System performance under random gas demand disturbances.
It is evident in Figure 11b that the solution of the compressor schedule obtained through theoptimal scheduling remains valid through the series of variations in hourly gas demand of up to20%. This means that the limits of the quantity of gas stored in the cascade storage are not violatedif the schedule obtained is implemented, even if some variation in demand occur. However, wheneffecting the optimal schedule solution to the existing station controller, it is necessary to includesafety interrupts to tackle circumstances where large disturbances cause a violation of operating limits,as shown in Figure 11b for the 25% variation in demand. These interrupts would correct the violationby either shutting off the compressor outside of schedule when the maximum quantity of gas limit inthe cascade storage is reached, or by turning on the compressor outside of schedule when the minimumlimit is reached as a result of unexpected gas demand circumstances. The feedback characteristic ofthe MPC strategy in the lower layer allows for the controller to adapt to disturbances in the systeminputs [32], which means that when disturbances in the quantity of gas condition in the cascade storageoccur, the controller updates operation control to attain the lower layer objectives.
Table 2 shows the fuelling time for each of the two vehicles in Sections 4.2.1 and 4.2.2 when gaslevel disturbances in one of the three cascade storage cylinders are implemented. By feeding back theconditions of the system states to the controller input, the approach allows for new calculation of futurecontrol action so as to meet the set optimisation goals. The solutions from the proposed approach tooptimal CNG station operation have thus been shown to be valid for the predicted operating conditionsas well as under some variations to these conditions.
Table 2. Vehicle filling time.
Gas Level Disturbance 4th Vehicle(s) 38th Vehicle(s)
5% 200 20010% 200 20015% 200 20020% 200 200
5. Conclusions
Participation of CNG delivery infrastructure in demand response programs not only saves costfor the station operators and CNG users, but it is also a participation in contributing to the widergoals of such programs in increasing grid reliability and efficiency for all electricity users in society.Cities seeking to expand the use of alternative fuels as cleaner means of transportation also needthe associated infrastructure to develop responsibly with regard to use of electricity, which is anindispensable resource.
Energies 2019, 12, 2165 21 of 24
This study provides an expansive perspective of the operation profile of an optimised CNGfast-fill station, which is the major component of gas delivery infrastructure, incorporating both energysavings and pressure conditions management. The proposed approach achieves a huge reduction inthe cost of electricity for the CNG fast-fill station, and delivers on shorter filling times for vehiclesfuelling at the station. The results demonstrate savings of up to 60.08% in electricity cost for the upperlayer as well as average savings of 16.92 s in vehicle fuelling times for the lower layer. Further, thesensitivity analysis shows an ability of the solutions obtained to withstand some disturbances in theinputs, which is important for the station operation reliability.
Implementation of energy cost reduction strategies by energy users should remain sensitive toother performance considerations that may affect the business under consideration. For compressednatural gas vehicle users, vehicle fuelling time cannot be jeopardised as it is one of the mainconsideration consumers make when deciding on adoption of cleaner gaseous alternative fuels.The study demonstrates that benefits associated with adoption of CNG can be amplified byoptimally operating delivery infrastructure with respect to existing demand response programs whilesimultaneously improving customer convenience. As an introductory study on the implementation ofa combined energy cost and filling time optimisation, this study is a timely highlight to an importantintersection between different approaches to better use of energy and system performance.
Author Contributions: The research work and manuscript drafting was done by C.K. under the guidance andsupervision of L.Z. and X.X., who also provided critical review of the manuscript.
Funding: This research received no external funding.
Conflicts of Interest: The authors declare no conflict of interest.
Nomenclature
Aori f ice Area of dispenser valve orifice (m2)Cd Co-efficient of discharge of dispenser valve orificecp Specific heat capacity of CNG at constant pressure (J/KgK)cv Specific heat capacity of CNG at constant volume (J/KgK)JU Objective function of the upper layerJL Objective function of the lower layerm Mass of gas (kg)mmax Maximum mass of gas for the cascade storage (kg)mmin Minimum mass of gas for the cascade storage (kg)mo Gas demand (kg)mmax
hp , mmaxmp , mmax
lp Instantaneous mass flow rate from high pressure, medium pressure and low
pressure reservoirs to vehicle tank (kg/h)mveh Instantaneous total mass flow rate from cascade storage to vehicle tank (kg/h)mco Compressor outlet mass flow rate (kg/h)M Molar mass (kg)Mwa Molecular weight of the air (g)Mwg Molecular weight of the gas (g)N Upper layer control horizonNp Lower layer model predictive control prediction horizonn Gas quantity (moles)
Energies 2019, 12, 2165 22 of 24
P Pressure (bars)pco Compressor motor power rating (kW)pe Price of electricity under TOU tariff (currency/kW h)Php, Pmp, Plp Pressure in high, medium and low pressure reservoirs (bars)Pmax
hp , Pmaxmp , Pmax
lp Maximum pressure for high pressure, medium pressure and low pressure reservoirs (bars)
Pminhp , Pmin
mp , Pminlp Minimum pressure for high pressure, medium pressure and low pressure reservoirs (bars)
PT Target vehicle pressure (bars)Pveh Vehicle pressure (bars)Qstd Capacity of the compressor under standard conditions (Nm3/h)R Universal gas constant (L bar/K mol)ts Sampling period (s)T Absolute temperature (K)u State of compressor switchvhp, vmp, vlp State of priority panel valves for high pressure, medium pressure and low pressure reservoirsvohp, vomp, volp State of dispenser valves for high pressure, medium pressure and low pressure reservoirsV Volume of cascade reservoir tanks (L)Vhp, Vmp, Vlp Volume of high, medium and low pressure reservoirs (L)z Compressibility factor of CNG$ Weighting factor for the upper layerς Weighting factor for the lower layerγ ratio of specific heatsρa,std Density of air under standard conditions (kg/m3)ρhp, ρmp, ρlp Density of gas in high pressure, medium pressure and low pressure reservoirs (kg/m3)
References
1. Davies, J.; Grant, M.; Venezia, J.; Aamidor, J. US Transportation Sector Greenhouse Gas Emissions: Trends,Uncertainties and Methodological Improvements. In TRB 2007 Annual Meeting; Transport Research Board:Washington, DC, USA, 2007.
2. Yeh, S. An empirical analysis on the adoption of alternative fuel vehicles: The case of natural gas vehicles.Energy Policy 2007, 35, 5865–5875. [CrossRef]
3. Ou, X.; Zhang, X.; Zhang, X.; Zhang, Q. Life cycle GHG of NG-based fuel and electric vehicle in China.Energies 2013, 6, 2644–2662. [CrossRef]
4. Mikolajková-Alifov, M.; Pettersson, F.; Björklund-Sänkiaho, M.; Saxén, H. A Model of Optimal Gas Supplyto a Set of Distributed Consumers. Energies 2019, 12, 351. [CrossRef]
5. Kuby, M. The opposite of ubiquitous: How early adopters of fast-filling alt-fuel vehicles adapt to the sparsityof stations. J. Transp. Geogr. 2019, 75, 46–57. [CrossRef]
6. Chala, G.; Abd Aziz, A.; Hagos, F. Natural Gas Engine Technologies: Challenges and Energy SustainabilityIssue. Energies 2018, 11, 2934. [CrossRef]
7. Greene, D.L. Survey evidence on the importance of fuel availability to the choice of alternative fuels andvehicles. Energy Stud. Rev. 1998, 8, 215–231. [CrossRef]
8. Newhouse, N.L.; Liss, W.E. Fast Silling of NGV Fuel Containers; Technical Report; SAE Technical Paper; SAE:Warrendale, PA, USA, 1999.
9. Chen, S.; Xie, G.; LI, Q.; Chang, K. Comparison among LNG, CNG and L-CNG Filling Stations. Gas Heat2007, 7, 006.
10. Khadem, J.; Saadat-Targhi, M.; Farzaneh-Gord, M. Mathematical modeling of fast filling process at CNGrefueling stations considering connecting pipes. J. Nat. Gas Sci. Eng. 2015, 26, 176–184. [CrossRef]
11. Albadi, M.H.; El-Saadany, E. A summary of demand response in electricity markets. Electr. Power Syst. Res.2008, 78, 1989–1996. [CrossRef]
12. Kagiri, C.; Zhang, L.; Xia, X. Optimal energy cost management of a CNG fuelling station. In Proceedings ofthe Control Conference Africa, Johannesburg, South Africa, 7–8 December 2017; Volume 50, pp. 94–97.
13. Khamforoush, M.; Moosavi, R.; Hatami, T. Compressed natural gas behavior in a natural gas vehicle fueltank during fast filling process: Mathematical modeling, thermodynamic analysis, and optimization. J. Nat.Gas Sci. Eng. 2014, 20, 121–131. [CrossRef]
Energies 2019, 12, 2165 23 of 24
14. Kountz, K.; Blazek, C.; Liss, W. A new natural gas dispenser control system. In International Gas ResearchConference; Government Institutes Inc.: Rockville, MD, USA, 1998; Volume 4, pp. 135–145.
15. Kountz, K.J.; Blazek, C.F.; Christopher, F. NGV Fuelling Station and Dispenser Control Systems; TechnicalReport; Gas Research Institute: Chicago, IL, USA, 1997.
16. Kountz, K. Modeling the fast fill process in natural gas vehicle storage cylinders. In 207th ACS NationalMeeting-Division of Fuel Chemistry; American Chemical Society: San Diego, CA, USA, 1994.
17. Farzaneh-Gord, M. Compressed natural gas-Single reservoir filling process. Int. Gas Eng. Manag. 2008,48, 16–18.
18. Thomas, G.; Goulding, J.; Munteam, C. Measurement, Approval and Verification of CNG Dispensers; TechnicalReport; National Weights and Measures Laboratory: London, UK, 1999.
19. Farzaneh-gord, M.; Hashemi, S.; Farzaneh-kord, A. Thermodynamics Analysis of Cascade Reserviors FillingProcess of Natural Gas Vehicle Cylinders. World Appl. Sci. 2008, 5, 143–149.
20. Deymi-Dashtebayaz, M.; Gord, M.F.; Rahbari, H.R. Studying transmission of fuel storage bank to NGVcylinder in CNG fast filling station. J. Braz. Soc. Mech. Sci. Eng. 2012, 34, 429–435. [CrossRef]
21. Frick, M.; Axhausen, K.W.; Carle, G.; Wokaun, A. Optimization of the distribution of compressed natural gas(CNG) refueling stations: Swiss case studies. Transp. Res. Part D Transp. Environ. 2007, 12, 10–22. [CrossRef]
22. Bang, H.J.; Stockar, S.; Muratori, M.; Rizzoni, G. Modeling and analysis of a CNG residential refuelingsystem. In ASME 2014 Dynamic Systems and Control Conference; American Society of Mechanical Engineers:New York, NY, USA, 2014.
23. Smith, M.; Gonzales, J. Costs Associated with Compressed Natural Gas Vehicle Fueling Infrastructure; TechnicalReport; National Renewable Energy Laboratory (NREL): Golden, CO, USA, 2014.
24. Kagiri, C.; Zhang, L.; Xia, X. Compressor and priority panel optimization for an energy efficient CNGfuelling station. In Proceedings of the IEEE 11th Asian Control Conference (ASCC), Gold Coast, QLD,Australia, 17–20 December 2017; pp. 2200–2203.
25. Xia, X.; Zhang, J.; Cass, W. Energy management of commercial buildings-a case study from a POETperspective of energy efficiency. J. Energy S. Afr. 2012, 23, 23–31.
26. Spees, K.; Lave, L.B. Demand response and electricity market efficiency. Electr. J. 2007, 20, 69–85. [CrossRef]27. Xia, X.; Zhang, L. Industrial energy systems in view of energy efficiency and operation control. Annu. Rev.
Control 2016, 42, 299–308. [CrossRef]28. Kagiri, C.; Zhang, L.; Xia, X. Optimization of a compressed natural gas station operation to minimize energy
cost. In Proceedings of the 9th International Conference on Applied Energy, Cardiff, UK, 21–24 August 2017;pp. 2003–2008.
29. Kagiri, C.; Wanjiru, E.M.; Zhang, L.; Xia, X. Optimized response to electricity time-of-use tariff of acompressed natural gas fuelling station. Appl. Energy 2018, 222, 244–256. [CrossRef]
30. Allgöwer, F.; Zheng, A. Nonlinear Model Predictive Control; Birkhäuser: Basel, Switzerland, 2012; Volume 26.31. Qin, S.J.; Badgwell, T.A. A survey of industrial model predictive control technology. Control Eng. Pract. 2003,
11, 733–764. [CrossRef]32. Xia, X.; Zhang, J. Operation efficiency optimisation modelling and application of model predictive control.
IEEE/CAA J. Autom. Sin. 2015, 2, 166–172.33. Kountz, K.J.; Liss, W.E.; Blazek, C.F. Automated Process and System for Dispensing Compressed Natural
Gas. U.S. Patent 5,810,058, 22 September 1998.34. Shipley, E. Study of Natural Gas Vehicles (NGV) during the Fast Fill Process. Master’s Thesis, West Virginia
University, Morgantown, WV, USA, 2002.35. Nguyen, H.H.; Uraikul, V.; Chan, C.W.; Tontiwachwuthikul, P. A comparison of automation techniques for
optimization of compressor scheduling. Adv. Eng. Softw. 2008, 39, 178–188. [CrossRef]36. Nguyen, H.H.; Chan, C.W. Applications of artificial intelligence for optimization of compressor scheduling.
Eng. Appl. Artif. Intell. 2006, 19, 113–126. [CrossRef]37. Mathaba, T.; Xia, X.; Zhang, J. Analysing the economic benefit of electricity price forecast in industrial load
scheduling. Electr. Power Syst. Res. 2014, 116, 158–165. [CrossRef]38. Wanjiru, E.M.; Xia, X. Energy-water optimization model incorporating rooftop water harvesting for lawn
irrigation. Appl. Energy 2015, 160, 521–531. [CrossRef]39. Saadat-Targhi, M.; Khadem, J.; Farzaneh-Gord, M. Thermodynamic analysis of a CNG refueling station
considering the reciprocating compressor. J. Nat. Gas Sci. Eng. 2016, 29, 453–461. [CrossRef]
Energies 2019, 12, 2165 24 of 24
40. Calvert, J.G. Glossary of atmospheric chemistry terms (Recommendations 1990). Pure Appl. Chem. 1990,62, 2167–2219. [CrossRef]
41. Farzaneh-Gord, M.; Deymi-Dashtebayaz, M. Optimizing natural gas fueling station reservoirs pressurebased on ideal gas model. Pol. J. Chem. Technol. 2013, 15, 88–96. [CrossRef]
42. Cilliers, C.; van der Zee, L.; Kleingeld, M. Cost savings on mine dewatering pumps by reducingpreparation-and comeback loads. In Proceedings of the IEEE International Conference on the Industrial andCommercial Use of Energy (ICUE), Cape Town, South Africa, 19–20 August 2014; pp. 1–8.
43. Cilliers, C. Cost Savings on Mine Dewatering Pumps by Reducing Preparation- and Comeback Loads.Master’s Thesis, North West University, Potchefstroom, South Africa, 2014.
44. van Tonder, A.; Kleingeld, M.; Marais, J. Investigating demand response potential in a mining group.In Proceedings of the IEEE Industrial and Commercial Use of Energy Conference (ICUE), Cape Town,South Africa, 20–21 August 2013; pp. 1–5.
© 2019 by the authors. Licensee MDPI, Basel, Switzerland. This article is an open accessarticle distributed under the terms and conditions of the Creative Commons Attribution(CC BY) license (http://creativecommons.org/licenses/by/4.0/).