Embed Size (px)
Citation preview
Computers & Operations Research 39 (2012) 863–873
Contents lists available at ScienceDirect
Computers & Operations Research
0305-05
doi:10.1
� Corr
E-m
journal homepage: www.elsevier.com/locate/caor
A general methodology for data-based rule building and its application tonatural disaster management
J. Tinguaro Rodrıguez �, Begona Vitoriano, Javier Montero
Department of Statistics and Operational Research, Faculty of Mathematics, Complutense University of Madrid, Plaza de Ciencias 3, 28040 Madrid, Spain
a r t i c l e i n f o
Available online 26 November 2009
Keywords:
Decision support systems
Data-based inductive reasoning
Humanitarian logistics
Natural disaster risk management
Emergency management
48/$ - see front matter & 2009 Elsevier Ltd. A
016/j.cor.2009.11.014
esponding author. Tel.: +34 91 394 45 35.
ail address: [email protected] (J. Tinguaro
a b s t r a c t
Risks derived from natural disasters have a deeper impact than the sole damage suffered by the affected
zone and its population. Because disasters can affect geostrategic stability and international safety,
developed countries invest a huge amount of funds to manage these risks. A large portion of these funds
are channeled through United Nations agencies and international non-governmental organizations
(NGOs), which at the same time are carrying out more and more complex operations. For these reasons,
technological support for these actors is required, all the more so because the global economic crisis is
placing emphasis on the need for efficiency and transparency in the management of (relatively limited)
funds. Nevertheless, currently available sophisticated tools for disaster management do not fit well into
these contexts because their infrastructure requirements usually exceed the capabilities of such
organizations. In this paper, a general methodology for inductive rule building is described and applied
to natural-disaster management. The application is a data-based, two-level knowledge decision support
system (DSS) prototype which provides damage assessment for multiple disaster scenarios to support
humanitarian NGOs involved in response to natural disasters. A validation process is carried out to
measure the accuracy of both the methodology and the DSS.
& 2009 Elsevier Ltd. All rights reserved.
1. Introduction
Factors such as climate change and the growing populationdensity of many cities and countries are putting more and morepeople throughout the world at risk of suffering due to naturaldisasters [17]. Recent tragic events such as the April 2009 L’Aquilaearthquake in Italy or Hurricane Katrina in 2005 remind us that,even inside developed countries, there exist many populationgroups which are vulnerable to the impact of adverse naturalphenomena [19].
Natural disasters have consequences not only for the popula-tion which is directly affected. They can also have profoundimplications for large sectors of the economy and the politicalsystem of the affected region, especially in developing countries.As shown in [20], the impact of a disaster in a region, if notmanaged properly, can produce political and social instabilityand affect international security and relations. Therefore, thedevelopment of models and tools to mitigate the consequencesand risks of natural disasters is a key issue in today’s globalworld.
This paper continues the basic discussion initiated in [22],presenting a new version of SEDD (an acronym for expert system
ll rights reserved.
Rodrıguez).
for disaster diagnosis in Spanish) which uses fuzzy logic. SEDD is adecision support system (DSS) prototype designed to providesupport to non-governmental organizations (NGOs) involved inresponse to natural disasters. As shall be seen in the next section,NGOs currently play a crucial role in mitigating the consequencesof disasters, especially in developing countries. Moreover, they areclamoring for better technological support for their decisionprocesses, a field in which, quite surprisingly, almost nothing hasbeen done.
The SEDD methodology is based on an inductive data-basedapproach (in the sense described in [29]) in which a largedatabase of historical disaster instances is scanned and analyzedto create rules which can be used to assess the consequences ofalmost every possible disaster scenario.
The remainder of this paper is organized as follows: theproblem addressed and its importance in natural-disaster riskmanagement is discussed in Section 2, where a review of state-of-the-art DSS addressing similar problems is also carried out. Theknowledge representation model and the algorithms used bySEDD are described in Section 3. In particular, this sectionpresents a general inductive methodology for building fuzzy rulesfrom data. Rule aggregation and inference are then performed bymeans of a weighted averaging operators approach. Section 4describes and discusses the computational experiments carriedout to assess the accuracy of the model. Finally, conclusions arepresented in Section 5.
J. Tinguaro Rodrıguez et al. / Computers & Operations Research 39 (2012) 863–873864
2. NGOs and natural-disaster risk management
As stated above, mitigating the effects of disasters is an issue ofgrowing importance in the current globalized world, and not onlyfor humanitarian reasons. It is stated in [20] that developedcountries invest a huge amount of funds in developmentassistance and other disaster-mitigation policies to avoid therisks of geostrategic destabilization produced by natural andanthropogenic disasters. Most of these aid funds are channeled todeveloping countries through United Nations (UN) agencies andinternational NGOs. These actors are involved because of theirsupposed political neutrality and their links with target popula-tions, which enable them to access politically unstable countrieswhich otherwise would not authorize any external interference.In fact, NGOs and UN international relief agencies channel morethan 60% of the total funding devoted to humanitarian aidthroughout the world, as shown for instance in [26].
In recent years, the budgets and organizations devoted toemergency and humanitarian aid have experienced substantialgrowth, i.e., this sector of strategic activity is getting bigger overtime [26]. As often occurs, this continuous growth has entailedthe emergence of management difficulties and efficiency pro-blems as the complexity of the actions and operations developedby the actors has increased.
On the other hand, the current global crisis is placing emphasison the need for management transparency and efficiency inpractically all fields of human activity. Lavish, uncontrolledspending is no longer allowed. Consequently, efficiency in disastermanagement becomes crucial. For these reasons, humanitarianlogistics is an emerging field which is becoming more and morerelevant [30] and which is also drawing attention to someinteresting problems in operations research.
Disaster management and mitigation [10,19,32] is not an easytask and usually requires much analysis and many resources todesign the right policy (to reduce vulnerability) at the right place(the vulnerable groups). This complexity suggests the use of thedecision support (DSS) methodology, for example, to assessvulnerability [15] or to develop emergency plans [31]. In fact,main NGOs claim for specific technology to support such acomplex decision making. There is a crying need to developmodels and tools to address the specific problems of theseorganizations.
In particular, this paper will focus on decision and assessmentproblems arising in the context of NGOs involved in response tonatural disasters.
2.1. Problem formulation
The main objective of SEDD is to support NGO decision-makersinvolved in international response and relief to people affected bya natural disaster. As soon as the NGO receives the first notice ofthe occurrence of a potential disaster, it starts a decision processwhich is intended to reach a conclusion about whether or notsuitable conditions exist to initiate a relief operation. It could bethat a particular disaster scenario does not fit the NGO’srequirements or constraints regarding the nature of an interven-tion, size of disaster, or logistical capabilities. This decisionprocess, usually under time pressure, must be based on the NGO’sown internal information (funding, stockpiled resources, availablepersonnel, etc.) as well as on knowledge and informationavailable about the disaster case under study. Because informa-tion in the first moments just after a disaster occurs tends to beconfused, imprecise, or incomplete, uncertainty about what isreally happening is a component which must be modeled. Despiteall this uncertainty, a quick decision is needed.
It should be recalled at this point that NGOs are normallyspecialized in one or more basic components of the relief task(such as health care, water and sanitation, or shelter and sitemanagement), but they are not specialized in responding toearthquakes, floods, or any other specific disaster scenario. Rather,NGOs are concerned with helping people, regardless of whetherthese people are suffering because of a drought or a hurricane.Moreover, international relief operations carried out by theseNGOs are assumed to follow the quality standards and guidelinesestablished by the Humanitarian Charter of the Sphere Project.These standards are set up by the United Nations (UN) andrelevant international NGOs and contain a set of minimumstandards for disaster response that sets out, for the first timeever, what people affected by a disaster have the right to expectfrom humanitarian assistance in the basic components of aid:water and sanitation, nutrition, food security, shelter, and healthcare [14]. These standards also emphasize a correct and preciseassessment of needs as a critical step for success in reliefoperations.
Therefore, in order to decide on the appropriateness of anintervention which meets these quality standards, NGOs need aninitial assessment of disaster consequences being as precise aspossible. It should be stressed that it is in view of this assessmentthat the decision-maker can determine what kind of interventionis going to be necessary and whether or not the NGO can meet itsrequirements. Moreover, this decision must be made for everycombination of disaster type and place. Furthermore, this initialassessment has to be done in a context of uncertainty and timepressure. Because all these factors normally appear together,expertize is needed to infer what is really going on and therebysupport this urgent decision process.
The main objective of the SEDD project is to assist interna-tional relief operations, supporting decision-makers by means ofan inference tool capable of assessing the consequences of almostevery combination of adverse phenomena and location, based onavailable information and taking into account the reliability ofthat information. In addition, SEDD should provide an estimate ofthe percentage of assistance effort which, as a consequence of theprevious assessment, needs to be directed towards each of thebasic relief components referred to in the Humanitarian Charter ofthe Sphere Project. It should be pointed that this problemformulation comes from the authors’ encounters with the staffof the International Federation of Red Cross and Red CrescentSocieties (IFRC) of Spain.
On the other hand, it is obvious that constraints must beimposed on the infrastructure requirements of a decision supporttool operating in this context. As will become apparent in the nextsection, it is necessary to make realistic assumptions in this area ifthe DSS will have to be used in organizations or countries wherethe operational infrastructure cannot support highly sophisticatedand precise methodology. In this sense, SEDD is intended to be aweb-available (see for instance [22]), low-cost, tailor-madesolution that should fit specific NGO constraints such as ease ofuse, low computational and personnel requirements, and notrelying on highly sophisticated and precise data (that in additionmight not be available on time).
2.2. DSS for disaster management
This section is devoted to a review of the state of the art indisaster management DSS (DSS-DM). In particular, the focus willbe on DSS which address the problem formulated above. In thissense, the main point of discussion is that current DSS-DM do notmeet the needs of NGOs for two main reasons: first, they are notdesigned to address the specific problem of response to any
J. Tinguaro Rodrıguez et al. / Computers & Operations Research 39 (2012) 863–873 865
possible natural disaster in any place; second, their sophisticationand infrastructure requirements usually exceed those available inNGOs and in countries requiring humanitarian aid.
As stated above, the difficulties of disaster-mitigation tasks ledto the introduction of decision support tools in the public sphereof emergency management [31,12,13]. In fact, such tools havebecome widely used by decision-makers in the public adminis-trations of developed countries because of their ability tointegrate multiple sources of information and to provide arepresentation of disaster scenarios to assess vulnerability andemergency response policies and/or to support decisions in thepreparation and relief phases.
Because of this dependence on public administrators, in a firststage, the scope of research was restricted to modeling the actionof one phenomenon in a specific place (earthquakes in California[11], hurricanes in Florida [28], floods in Italy [27], etc.). However,it has gradually become clear [6,9] that integration of models andmethodologies is necessary to develop more useful and flexiblesystems. However, few practical systems based on this perspec-tive are already in operation. One of them [24] is HAZUS, theFEMA solution for hurricanes, floods, and earthquakes. Anotherproposal is that described in [4], where a modular approach isused to devise a dynamic integrated model for a DSS-DM whichalso takes environmental variables into account.
In this paper, an alternative data-based approach is proposedto assess potential damage arising from various combinations ofphenomena and locations.
Together with other complex data structures and models, adistinctive feature of current DSS-DM is the use of geographicalinformation systems (GIS). Because GIS are designed to supportspatial decision making, they are very useful tools in theemergency management field, where there is a strong need toaddress a number of spatial decisions [24]. In this way, a GISshould make possible a more precise assessment of vulnerabilityunder various possible scenarios and a better response imple-mentation. In fact, a GIS is already present in almost everyDSS-DM (see [7] for a survey, and also [1]). This trend makescurrent DSS-DM sophisticated and powerful tools that havebecome certainly indispensable in developed countries.
Nevertheless, the high sophistication of these systems requireslarge computational and information resources, such as trainedpersonnel or precise data, which could be unrealistic expectationsin some contexts because they clearly exceed the infrastructureavailable. For instance, the expertise and precision needed to use aGIS could make the system much more complicated for end users.Furthermore, complex data such as a building census or precisemeteorological information could be unavailable or unreliable.This is the main reason why HAZUS [24] and other highlysophisticated DSS methodologies have not been implemented inmost developing countries or in most NGOs. In this sense, someauthors (see [1], for example) are clamoring for flexible, low-costdecision support tools to be developed for such contexts. A keycharacteristic of future emergency decision support systemsshould be high adaptability [16].
In conclusion, although a wide variety of DSS-DM are beingused by public-sector managers in developed countries, not muchcan be found which addresses the particular problems experi-enced by NGOs and described above. Moreover, some methodol-ogies which have been designed for extensive application, likeHAZUS, fail to meet these needs because of a lack of adaptabilityto particular infrastructure requirements.
The SEDD project developed in this paper represents an originaland specific decision support system that provides a suitable tool foruse in an NGO decision-making context and enables the assessmentof multiple disaster scenarios, similarly in this sense to HAZUS or tothe integrated approach presented in [4].
3. A general methodology for building rules from data
This section first describes the SEDD knowledge representationmodel, which takes a database as input and produces, by means ofa set of classes (crisp or fuzzy), a matrix representing historicalknowledge about disasters. Next, the approach used to build upthree types of inference rules, using this matrix along with theraw data as input, is described. These two levels of knowledge arestored in SEDD’s knowledge base (KB). Finally, the inferenceprocess carried out by SEDD’s inference engine (IE) is described.It uses the rules in the KB along with a fact base (FB) containingraw data related to a disaster case under study to produce anassessment of the disaster’s possible consequences. All thismethodology is presented in a rather general way to emphasizethat it is general enough to serve as a methodological base for awide class of DSS which could address problems other thannatural-disaster risk management. Another methodology forbuilding fuzzy rules from data is described in [8].
3.1. Knowledge representation
To build up rules from data and to carry out a useful inferenceprocess, it is necessary to define first the general framework andmathematical models used to represent the information andknowledge with which SEDD will work. In other words, amathematical model of knowledge representation is needed togive the data an appropriate shape or structure in agreement withthe data structures required as input to the rule-building andinference processes.
Following the approach described in [23], the basic raw dataused by SEDD are considered as a database, which can be viewedas a real-valued matrix D¼ ðdkiÞmxn having m instances and n
variables, X1; . . . ;Xn. Within the semantics of SEDD, each of thesem instances represents a historical disaster scenario and each ofthe n variables a quantity of interest for describing these disasterscenarios.
The range of each variable Xi is then partitioned into a set of ci
classes Ai1; . . . ;Aici, which can be fuzzy or crisp. In this paper, these
classes are intended to be linearly ordered, i.e., AijoAij0 iff jo j0, buta different structure could also be proposed, as explained in [18].
Here capital letters will be used to denote the values of
variables in the database, i.e., Xki ¼ dki for k¼ 1; . . . ;m and
i¼ 1; . . . ;n. Lower-case letters will be used to denote values of
categories, i.e., xkiji¼ mAij
ðXki Þ for ji ¼ 1; . . . ; ci, where mAij
is the
membership function of class Aij. In the crisp case, it is assumed
that the value of Xki lies in exactly one class j0, i.e., mAij0
ðXki Þ ¼ 1 and
mAijðXk
i Þ ¼ 0 if ja j0. In the fuzzy case, mAijðXk
i ÞA ½0;1� and the classes
do not necessarily form a fuzzy partition in the sense of Ruspini,
i.e.,Pci
j ¼ 1 mAijðXk
i Þ does not need to sum exactly to one (see for
example [2]). In fact, missing values of any variable are modeledby assigning the value 0 to every class.
In this way, the first level of knowledge representation in SEDDis constituted by a matrix H¼ ðhkjÞmxl, with l¼
Pni ¼ 1 ci being the
total number of categories or classes, and such that hkj : ¼
xkiji¼ mAiji
ðXki Þ for all k¼ 1; . . . ;m, i¼ 1; . . . ;n, ji ¼ 1; . . . ; ci, and
j¼ 1; . . . ; l. Reference to the ith variable is removed in the hkj’sbecause it is intended that categories in H will be sorted by thevariables to which they correspond.
3.2. Data-based rule building
The matrix H constitutes the first level of knowledge in SEDDand represents historical information of the type in place x there

J. Tinguaro Rodrıguez et al. / Computers & Operations Research 39 (2012) 863–873866
was phenomena y and the damage was z. However, to obtaininference capability, a second level of knowledge, or meta-knowledge, is needed: something like when phenomenon y occurs
in places like x, the damage tends to be z. This second-levelknowledge, to which we shall refer as rules, must be extractedfrom the first-level knowledge (the data), and therefore it is saidthat these rules are data-based.
Conceptually, the proposed SEDD methodology for ruleextraction is based on the idea that a rule is built up throughsuccessive repetition and experience of similar situations. It isusually accepted that whenever a relation is experienced orsuccessively repeated, its rule condition is strengthened.
In fact, when faced with the problem formulated in the lastsection, the expert implicitly tries to relate the current disasterscenario under study with other similar past situations and toapprehend whether the rules or relations extracted from theanalysis of these past situations are fulfilled by the present one.Although the expert may not be able to enunciate working rulesexplicitly, his/her extensive knowledge of historical disaster casessimilar to the current one under study should enable the expert toknow what effects can be expected to occur. An estimatedassessment of the consequences of the present disaster can thenbe generated by the expert.
The approach presented in this paper follows the principlesjust described. Each instance of the database in which the sameclasses of different variables appear together is considered asevidence for the existence of a relationship between thesecategories. In this sense, what is going to be measured andtranslated into rules is the trend of some variables to occur asother variables appear.
Rules still need some variables to play the role of premises orindependent variables, with the rest serving as consequences ordependent variables. Thus, from the set of n variables X1; . . . ;Xn, asubset of p premise variables is extracted, leaving another subsetof q¼ n� p consequence variables. Because in this approach theconclusion for each consequence variable is independent of theconclusion for any other, for the sake of simplicity in presentation,it will be assumed without loss of generality that q¼ 1, i.e., thatthere exists only one consequence or dependent variable for eachset of premise variables. In the rest of this paper, this dependentvariable will be denoted by Y, with fX1; . . . ;Xpg being the set ofpremises or independent variables.
Moreover, if T is a t-norm (see for instance [25]), let TðHÞ
denote the c1 � � � � � cp �m multidimensional matrix such that
TðHÞðj1; . . . ; jpÞ ¼ TðH; j1; . . . ; jpÞ ¼ ðTðx11j1; . . . ; x1
pjpÞ; . . . ; Tðxm
1j1; . . . ; xm
pjpÞÞ
t ;
for ji ¼ 1; . . . ; ci and i¼ 1; . . . ;n. In this way, for each combinationðj1; . . . ; jpÞ of the premise indices, T(H) is a vector containing themembership degrees in the conjunction class A1j1
4 � � �4Apjpof
the values of the premise variables for each of the m instances inthe database. Let yj also denote the vector of length m such that
yj ¼ ðy1j ; . . . ; y
mj Þ
t¼ ðmBj
ðY1Þ; . . . ;mBjðYmÞÞ
t ; j¼ 1; . . . ; d;
where Bj is any of the d¼ cpþ1 classes defined in the last sectionfor the dependent variable Y, and Yk represents the value of thisvariable for the kth instance in the database, k¼ 1; . . . ;m.
In this paper, three types of rules and the algorithms tocompute them are described. Formally, a rule is understood to bean expression of the type
R : if X1 is A1 and X2 is A2 and . . . and Xp is Ap then Y is B;
where each Ai is a class of the ith premise variable and B is theconclusion assigned to the dependent variable Y. Thus, themeaning of the three different groups of rules is that threedifferent types of conclusions B will be assigned to the dependent
variable Y:
�
In the first type of rules, a degree of possibility pj is assigned toeach one of the d classes, Bj ðj¼ 1; . . . ; dÞ. Therefore,B¼ p¼ ðp1; . . . ;pdÞ. As shall be seen in the next section, thisleads to a class Bj or a union of adjacent classes as a predictionof the dependent variable Y. This group of rules is useful to dealwith categorical variables and also with numerical variableswhich have previously been classified, as is the case withlinguistically assessed variables. � The second group of rules assigns to Y a mean value y in therange of the dependent variable. The algorithm that computesthis value makes use of the possibilities p determined by theprevious group of rules to weight the values of Y. Therefore,these rules are dependent on the rules in the first group, and inthis case, B¼ y. This group of rules works with numerical dataand is therefore designed to predict numerical variables.
� Finally, the last group of rules assigns to Y an interval ½b1; b2� ofpossible values of the dependent variable. The lower and upperextremes of this interval are computed by means of fuzzy orcrisp order statistics, respectively, and therefore the algorithmto compute these rules is in fact an algorithm to compute thosestatistics. Thus, for this group of rules, B¼ ½b1; b2�. Intervals andorder statistics work well when dealing with numericalvariables which exhibit large variability, outliers, or both.
Although the two are similar (and in fact identical in the crispcase), it is important not to confuse these rules with the forecaststhat constitute the outcome of the inference process described inthe next subsection. As will be seen shortly, this inference processmakes use of various rules along with information about thedisaster case under study to construct the forecasts, while therule-building process described in this section makes use of dataand first-level knowledge to extract the second-level knowledge(i.e., to build up the rules).
Another important remark before describing the algorithms forrule extraction: it should be noted that, in most of the cases whichpose the problem of building rules from data, the set of rules tocreate is not previously defined. This amounts to saying that theset of combinations of independent variables and/or classes ofthese variables that have to be used as premises of the rules is notgiven. Furthermore, every possible combination of classes couldoccur in practice and could constitute an important premise forexplaining the data. For this reason, regardless of the fact that thiscould lead to exponentially increasing computational require-ments, this research presents algorithms to build every possiblerule, leaving for a discussion at the end of this section and forfuture research the issue of how to develop heuristics to avoidcreating all the rules. In any case, this possibility will notconstitute a problem for a DSS with small data requirements,which, as stated in the previous section, is the case for SEDD.
Case 1. B¼ p. Calculation of dependent class possibilities pGiven the matrix H, a class Bj of the dependent variable Y, and a
combination ðj1; . . . ; jpÞ of classes of the p premise variables,jAf1; . . . ;dg and jiAf1; . . . ; cig for all i¼ 1; . . . ; p, the possibility in H
of the class Bj when A1j14 � � �4Apjp
is true is defined as a weightedaggregation of its membership degrees over all m instances in thedatabase, i.e.,
pHðjjj1; . . . ; jpÞ ¼
Pmk ¼ 1 Tðxk
1j1; . . . ; xk
pjpÞyk
jPmk ¼ 1 Tðxk
1j1; . . . ; xk
pjpÞ;
where ykj ¼ mBj
ðYkÞ is the membership degree in the jth class of thekth instance of variable Y and T is the logical operator (usually a
J. Tinguaro Rodrıguez et al. / Computers & Operations Research 39 (2012) 863–873 867
t-norm) that models the conjunction ‘‘and.’’ In vector notation,
pHðjjj1; . . . ; jpÞ ¼TðH; j1; . . . ; jpÞ
t� yj
TðH; j1; . . . ; jpÞt� 1
;
where 1 represents a vector with m ones, i.e., 1¼ ð1; . . . ;1zfflfflfflffl}|fflfflfflffl{m
Þ, in sucha way that the denominator is equal to the sum of all the elements
in TðH; j1; . . . ; jpÞ.
Proposition 1. If the variable Y does not have missing values and if
the classes Bj, j¼ 1; . . . ; d, form a Ruspini partition, then the
possibilities of the d classes of Y given any combination of premises
ðj1; . . . ; jpÞ sum up to one.
Proof.
Xd
j ¼ 1
pHðjjj1; . . . ; jpÞ ¼
Pmk ¼ 1 Tðxk
1j1; . . . ; xk
pjpÞPd
j ¼ 1 ykjPm
k ¼ 1 Tðxk1j1; . . . ; xk
pjpÞ
¼
Pmk ¼ 1 Tðxk
1j1; . . . ; xk
pjpÞPm
k ¼ 1 Tðxk1j1; . . . ; xk
pjpÞ¼ 1: &
Thus, if a variable Y has missing values and its classes form aRuspini partition, the proposition just stated means that thepossibilities of Y sum to o1. In this way, it is possible to definethe ignorance associated with variable Y given a combination ofpremises ðj1; . . . ; jpÞ as one minus the sum of its possibilities forthat combination of premises, i.e., IY ðj1; . . . ; jpÞ ¼ 1�
Pdj ¼ 1�
pHðjjj1; . . . ; jpÞ. As explained in [18], the ignorance I is a necessaryclass that should be added to the existing set of classes to modelbetter the underlying learning process.
Case 2. B¼ y. Calculation of the dependent-variable mean y.Given H and a combination ðj1; . . . ; jpÞ of classes of the p
premise variables, jiAf1; . . . ; cig for all i¼ 1; . . . ; p, the fuzzy meanof a crisp variable Y when A1j1
4 � � �4Apjpis true can be easily
defined as the fraction
Xmk ¼ 1
Tðxk1j1; . . . ; xk
pjpÞYk
Xm
k ¼ 1
Tðxk1j1; . . . ; xk
pjpÞ:
,
However, because the variable Y can have not only missing values,but also outliers in classes with low possibility, it seemed morerealistic to define this mean value as
yHðj1; . . . ; jpÞ ¼
Pmk ¼ 1 Wkðj1; . . . ; jpÞTðxk
1j1; . . . ; xk
pjpÞYkPm
k ¼ 1 Wkðj1; . . . ; jpÞTðxk1j1; . . . ; xk
pjpÞ:
This expression can be alternatively given in a more compactvector notation, defining the weights W as
Wkðj1; . . . ; jpÞ ¼Xd
j ¼ 1
ykj pHðjjj1; . . . ; jpÞ;
in such a way that
Wðj1; . . . ; jpÞ ¼ ðW1ðj1; . . . ; jpÞ; . . . ;W
mðj1; . . . ; jpÞÞt :
If 3 stands for the element-wise product of matrices andY¼ ðY1; . . . ;YmÞ
t , then
yHðj1; . . . ; jpÞ ¼ðWðj1; . . . ; jpÞ3TðH; j1; . . . ; jpÞÞ
t� Y
Wðj1; . . . ; jpÞt� TðH; j1; . . . ; jpÞ
:
This way, missing values of Y do not affect the computation.Moreover, if outliers of Y lie in classes with low or zero possibility,their values will have little effect on the resulting mean value.Such a mean yHðj1; . . . ; jpÞ will be biased towards the classes Bj
with higher possibility pHðjjj1; . . . ; jpÞ, which is a realistic assump-tion in the authors’ opinion.
Case 3. B¼ ½b1; b2�. Calculation of fuzzy order statistics.Given H and a combination ðj1; . . . ; jpÞ of classes of the p
premise variables, jiAf1; . . . ; cig for all i¼ 1; . . . ; p, if the classes ofthe premise variables are fuzzy, it is not obvious how to calculatethe percentiles aAf1; . . . ;99g of the values of a crisp variable Y forwhich A1j1
4 � � �4Apjpis true. For each instance of Yk in H, the truth
value of the conjunction A1j14 � � �4Apjp
could take on a differentvalue Tðxk
1j1; . . . ; xk
pjpÞ, so it is not possible simply to take as the
a� percentile the value of Y below which a percent of theobservations for which A1j1
4 � � �4Apjpis true may be found.
However, it seems natural to generalize this idea to the fuzzy caseby defining the a� percentile as the value of Y below which isfound a percent of the total amount of membershipwðj1; . . . ; jpÞ ¼
Pmk ¼ 1 Tðxk
1j1; . . . ; xk
pjpÞ in the conjunction class
A1j14 � � �4Apjp. The algorithm used to find this value is the
following:
1.
Sort H by the values of Y, removing the instances for which thevalue of Y is missing.2.
Definekaðj1; . . . ; jpÞ ¼min k=Pks ¼ 1 Tðxs
1j1; . . . ; xs
pjpÞ4 a
100wðj1; . . . ; jpÞ
n o.
k ðj ;...;j Þ
3. Define the a� percentile as PCaðj1; . . . ; jpÞ ¼ Y a 1 p .Thus, to build the interval that constitutes the conclusion of therules in this third group, two values, a1;a2Af1; . . . ;99g, a1oa2,must be chosen, leading to the interval ½PCa1
ðj1; . . . ; jpÞ;
PCa1ðj1; . . . ; jpÞ�.
These three groups of rules are then stored as vectors ormultidimensional matrices in the SEDD knowledge base. Thesematrices constitute the second level of knowledge representationin SEDD.
3.3. Inference process
To make inferences about the unknown variables of a disastercase under study, SEDD’s inference engine must combine theknown information present in the fact base with the rules storedin the knowledge base. This is done by using these known data asthe premises of the rules. Without loss of generality, it can beassumed that the values of variables X1; . . . ;Xp are known and thatit is desired to generate a prediction of the value y of an unknownvariable Y. The values of the known variables in the fact base aredenoted by the vector F ¼ ðF1; . . . ; FpÞ, and fiji
denotes themembership degree of value Fi in the class Aiji
, i.e., fiji¼ mAiji
ðFiÞ,jiAf1; . . . ; cig for all i¼ 1; . . . ;p.
The way that predictions are built from these inputs isbasically the same for each of the three groups of rules. However,because for the first group a prediction class is needed, differentways of aggregating the resulting class possibilities Bj, j¼ 1; . . . ; d,of the dependent variable Y are described.
Because for the crisp case there is only one combinationðj1; . . . ; jpÞ of classes of the independent variables into which thevalues F1; . . . ; Fp are classified, the output of the inference processis simply the conclusion of the rule having the combination ofclasses ðj1; . . . ; jpÞ as its premise. However, in the fuzzy case, thevalues F1; . . . ; Fp are usually classified into several combinationsA1j14 � � �4Apjp
of classes of the independent variables, andtherefore a way of aggregating the conclusions of the correspond-ing rules is needed. This aggregation is carried out by means of aweighted aggregation operator, in which the different truthdegrees Tðfiji
; . . . ; fijpÞ of the values F1; . . . ; Fp lying in each
combination A1j14 � � �4Apjpare used as weights. Thus, because
this case is the more general one, only the construction ofpredictions for the fuzzy case is described.
J. Tinguaro Rodrıguez et al. / Computers & Operations Research 39 (2012) 863–873868
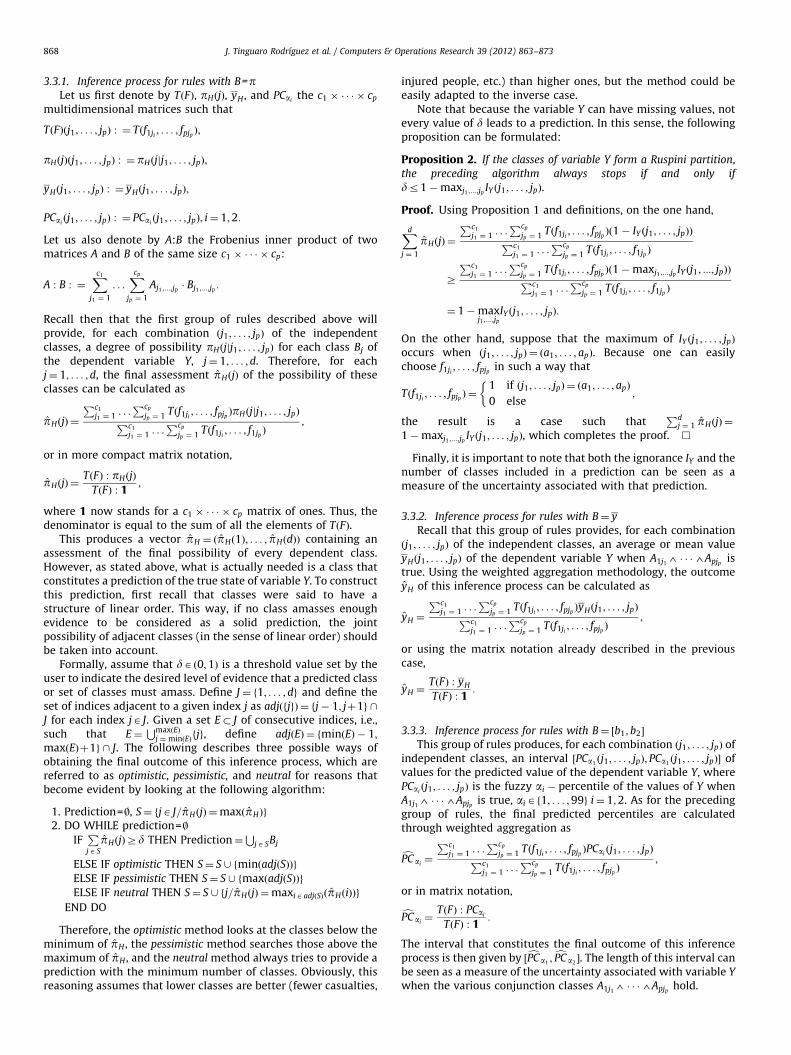
3.3.1. Inference process for rules with B=pLet us first denote by TðFÞ, pHðjÞ, yH , and PCai
the c1 � � � � � cp
multidimensional matrices such that
TðFÞðj1; . . . ; jpÞ : ¼ Tðf1ji; . . . ; fpjp
Þ;
pHðjÞðj1; . . . ; jpÞ : ¼ pHðjjj1; . . . ; jpÞ;
yHðj1; . . . ; jpÞ : ¼ yHðj1; . . . ; jpÞ;
PCaiðj1; . . . ; jpÞ : ¼ PCai
ðj1; . . . ; jpÞ; i¼ 1;2:
Let us also denote by A:B the Frobenius inner product of twomatrices A and B of the same size c1 � � � � � cp:
A : B : ¼Xc1
j1 ¼ 1
. . .Xcp
jp ¼ 1
Aj1 ;...;jp� Bj1 ;...;jp
:
Recall then that the first group of rules described above willprovide, for each combination ðj1; . . . ; jpÞ of the independentclasses, a degree of possibility pHðjjj1; . . . ; jpÞ for each class Bj ofthe dependent variable Y, j¼ 1; . . . ; d. Therefore, for eachj¼ 1; . . . ; d, the final assessment pHðjÞ of the possibility of theseclasses can be calculated as
pHðjÞ ¼
Pc1
j1 ¼ 1 . . .Pcp
jp ¼ 1 Tðf1ji; . . . ; fpjp
ÞpHðjjj1; . . . ; jpÞPc1
j1 ¼ 1 . . .Pcp
jp ¼ 1 Tðf1ji ; . . . ; f1jpÞ
;
or in more compact matrix notation,
pHðjÞ ¼TðFÞ : pHðjÞ
TðFÞ : 1;
where 1 now stands for a c1 � � � � � cp matrix of ones. Thus, thedenominator is equal to the sum of all the elements of TðFÞ.
This produces a vector pH ¼ ðpHð1Þ; . . . ; pHðdÞÞ containing anassessment of the final possibility of every dependent class.However, as stated above, what is actually needed is a class thatconstitutes a prediction of the true state of variable Y. To constructthis prediction, first recall that classes were said to have astructure of linear order. This way, if no class amasses enoughevidence to be considered as a solid prediction, the jointpossibility of adjacent classes (in the sense of linear order) shouldbe taken into account.
Formally, assume that dAð0;1Þ is a threshold value set by theuser to indicate the desired level of evidence that a predicted classor set of classes must amass. Define J¼ f1; . . . ; dg and define theset of indices adjacent to a given index j as adjðfjgÞ ¼ fj� 1; jþ1g \J for each index jA J. Given a set E� J of consecutive indices, i.e.,such that E¼
SmaxðEÞj ¼ minðEÞfjg, define adjðEÞ ¼ fminðEÞ � 1;
maxðEÞþ1g \ J. The following describes three possible ways ofobtaining the final outcome of this inference process, which arereferred to as optimistic, pessimistic, and neutral for reasons thatbecome evident by looking at the following algorithm:
1. Prediction=|, S¼ fjA J=pHðjÞ ¼maxðpHÞg
2. DO WHILE prediction=|IFPjAS
pHðjÞZd THEN Prediction¼S
jASBj
ELSE IF optimistic THEN S¼ S [ fminðadjðSÞÞg
ELSE IF pessimistic THEN S¼ S [ fmaxðadjðSÞÞg
ELSE IF neutral THEN S¼ S [ fj=pHðjÞ ¼maxiAadjðSÞðpHðiÞÞg
END DO
Therefore, the optimistic method looks at the classes below theminimum of pH , the pessimistic method searches those above themaximum of pH , and the neutral method always tries to provide aprediction with the minimum number of classes. Obviously, thisreasoning assumes that lower classes are better (fewer casualties,
injured people, etc.) than higher ones, but the method could beeasily adapted to the inverse case.
Note that because the variable Y can have missing values, notevery value of d leads to a prediction. In this sense, the followingproposition can be formulated:
Proposition 2. If the classes of variable Y form a Ruspini partition,the preceding algorithm always stops if and only if
dr1�maxj1 ;...;jp IY ðj1; . . . ; jpÞ.
Proof. Using Proposition 1 and definitions, on the one hand,
Xd
j ¼ 1
pHðjÞ ¼
Pc1
j1 ¼ 1 . . .Pcp
jp ¼ 1 Tðf1ji; . . . ; fpjp
Þð1� IY ðj1; . . . ; jpÞÞPc1
j1 ¼ 1 . . .Pcp
jp ¼ 1 Tðf1ji ; . . . ; f1jpÞ
Z
Pc1
j1 ¼ 1 . . .Pcp
jp ¼ 1 Tðf1ji ; . . . ; fpjpÞð1�maxj1 ;...;jp
IY ðj1; :::; jpÞÞPc1
j1 ¼ 1 . . .Pcp
jp ¼ 1 Tðf1ji; . . . ; f1jp
Þ
¼ 1�maxj1 ;...;jp
IY ðj1; . . . ; jpÞ:
On the other hand, suppose that the maximum of IY ðj1; . . . ; jpÞ
occurs when ðj1; . . . ; jpÞ ¼ ða1; . . . ; apÞ. Because one can easilychoose f1ji
; . . . ; fpjpin such a way that
Tðf1ji ; . . . ; fpjpÞ ¼
1 if ðj1; . . . ; jpÞ ¼ ða1; . . . ; apÞ
0 else;
�the result is a case such that
Pdj ¼ 1 pHðjÞ ¼
1�maxj1 ;...;jpIY ðj1; . . . ; jpÞ, which completes the proof. &
Finally, it is important to note that both the ignorance IY and thenumber of classes included in a prediction can be seen as ameasure of the uncertainty associated with that prediction.
3.3.2. Inference process for rules with B¼ y
Recall that this group of rules provides, for each combinationðj1; . . . ; jpÞ of the independent classes, an average or mean valueyHðj1; . . . ; jpÞ of the dependent variable Y when A1j1
4 � � �4Apjpis
true. Using the weighted aggregation methodology, the outcomeyH of this inference process can be calculated as
yH ¼
Pc1
j1 ¼ 1 . . .Pcp
jp ¼ 1 Tðf1ji ; . . . ; fpjpÞyHðj1; . . . ; jpÞPc1
j1 ¼ 1 . . .Pcp
jp ¼ 1 Tðf1ji; . . . ; fpjp
Þ;
or using the matrix notation already described in the previouscase,
yH ¼TðFÞ : yH
TðFÞ : 1:
3.3.3. Inference process for rules with B¼ ½b1; b2�
This group of rules produces, for each combination ðj1; . . . ; jpÞ ofindependent classes, an interval ½PCa1
ðj1; . . . ; jpÞ; PCa1ðj1; . . . ; jpÞ� of
values for the predicted value of the dependent variable Y, wherePCaiðj1; . . . ; jpÞ is the fuzzy ai � percentile of the values of Y when
A1j14 � � �4Apjp
is true, aiAf1; . . . ;99g i¼ 1;2. As for the precedinggroup of rules, the final predicted percentiles are calculatedthrough weighted aggregation as
cPCai¼
Pc1
j1 ¼ 1 . . .Pcp
jp ¼ 1 Tðf1ji; . . . ; fpjp
ÞPCaiðj1; . . . ; jpÞPc1
j1 ¼ 1 . . .Pcp
jp ¼ 1 Tðf1ji; . . . ; fpjp
Þ;
or in matrix notation,
cPCai¼
TðFÞ : PCai
TðFÞ : 1:
The interval that constitutes the final outcome of this inferenceprocess is then given by ½cPCa1
;cPCa2�. The length of this interval can
be seen as a measure of the uncertainty associated with variable Y
when the various conjunction classes A1j14 � � �4Apjp
hold.
J. Tinguaro Rodrıguez et al. / Computers & Operations Research 39 (2012) 863–873 869
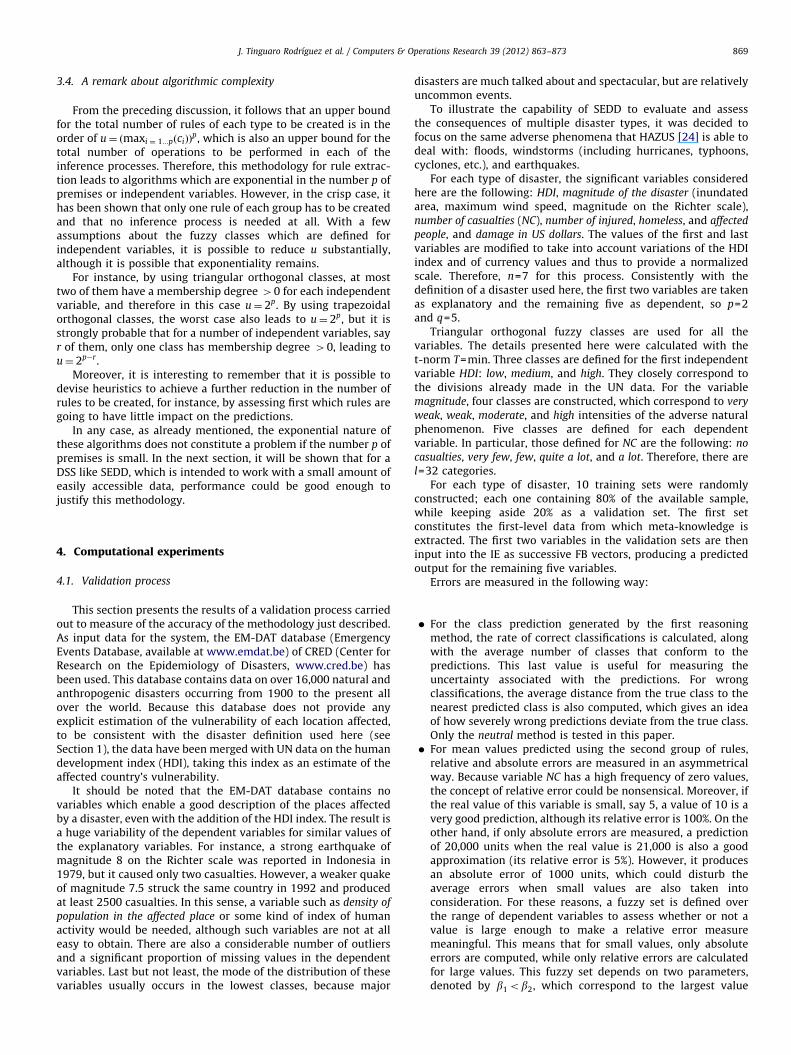
3.4. A remark about algorithmic complexity
From the preceding discussion, it follows that an upper boundfor the total number of rules of each type to be created is in theorder of u¼ ðmaxi ¼ 1...pðciÞÞ
p, which is also an upper bound for thetotal number of operations to be performed in each of theinference processes. Therefore, this methodology for rule extrac-tion leads to algorithms which are exponential in the number p ofpremises or independent variables. However, in the crisp case, ithas been shown that only one rule of each group has to be createdand that no inference process is needed at all. With a fewassumptions about the fuzzy classes which are defined forindependent variables, it is possible to reduce u substantially,although it is possible that exponentiality remains.
For instance, by using triangular orthogonal classes, at mosttwo of them have a membership degree 40 for each independentvariable, and therefore in this case u¼ 2p. By using trapezoidalorthogonal classes, the worst case also leads to u¼ 2p, but it isstrongly probable that for a number of independent variables, sayr of them, only one class has membership degree 40, leading tou¼ 2p�r .
Moreover, it is interesting to remember that it is possible todevise heuristics to achieve a further reduction in the number ofrules to be created, for instance, by assessing first which rules aregoing to have little impact on the predictions.
In any case, as already mentioned, the exponential nature ofthese algorithms does not constitute a problem if the number p ofpremises is small. In the next section, it will be shown that for aDSS like SEDD, which is intended to work with a small amount ofeasily accessible data, performance could be good enough tojustify this methodology.
4. Computational experiments
4.1. Validation process
This section presents the results of a validation process carriedout to measure of the accuracy of the methodology just described.As input data for the system, the EM-DAT database (EmergencyEvents Database, available at www.emdat.be) of CRED (Center forResearch on the Epidemiology of Disasters, www.cred.be) hasbeen used. This database contains data on over 16,000 natural andanthropogenic disasters occurring from 1900 to the present allover the world. Because this database does not provide anyexplicit estimation of the vulnerability of each location affected,to be consistent with the disaster definition used here (seeSection 1), the data have been merged with UN data on the humandevelopment index (HDI), taking this index as an estimate of theaffected country’s vulnerability.
It should be noted that the EM-DAT database contains novariables which enable a good description of the places affectedby a disaster, even with the addition of the HDI index. The result isa huge variability of the dependent variables for similar values ofthe explanatory variables. For instance, a strong earthquake ofmagnitude 8 on the Richter scale was reported in Indonesia in1979, but it caused only two casualties. However, a weaker quakeof magnitude 7.5 struck the same country in 1992 and producedat least 2500 casualties. In this sense, a variable such as density of
population in the affected place or some kind of index of humanactivity would be needed, although such variables are not at alleasy to obtain. There are also a considerable number of outliersand a significant proportion of missing values in the dependentvariables. Last but not least, the mode of the distribution of thesevariables usually occurs in the lowest classes, because major
disasters are much talked about and spectacular, but are relativelyuncommon events.
To illustrate the capability of SEDD to evaluate and assessthe consequences of multiple disaster types, it was decided tofocus on the same adverse phenomena that HAZUS [24] is able todeal with: floods, windstorms (including hurricanes, typhoons,cyclones, etc.), and earthquakes.
For each type of disaster, the significant variables consideredhere are the following: HDI, magnitude of the disaster (inundatedarea, maximum wind speed, magnitude on the Richter scale),number of casualties (NC), number of injured, homeless, and affected
people, and damage in US dollars. The values of the first and lastvariables are modified to take into account variations of the HDIindex and of currency values and thus to provide a normalizedscale. Therefore, n=7 for this process. Consistently with thedefinition of a disaster used here, the first two variables are takenas explanatory and the remaining five as dependent, so p=2and q=5.
Triangular orthogonal fuzzy classes are used for all thevariables. The details presented here were calculated with thet-norm T=min. Three classes are defined for the first independentvariable HDI: low, medium, and high. They closely correspond tothe divisions already made in the UN data. For the variablemagnitude, four classes are constructed, which correspond to very
weak, weak, moderate, and high intensities of the adverse naturalphenomenon. Five classes are defined for each dependentvariable. In particular, those defined for NC are the following: no
casualties, very few, few, quite a lot, and a lot. Therefore, there arel=32 categories.
For each type of disaster, 10 training sets were randomlyconstructed; each one containing 80% of the available sample,while keeping aside 20% as a validation set. The first setconstitutes the first-level data from which meta-knowledge isextracted. The first two variables in the validation sets are theninput into the IE as successive FB vectors, producing a predictedoutput for the remaining five variables.
Errors are measured in the following way:
�
For the class prediction generated by the first reasoningmethod, the rate of correct classifications is calculated, alongwith the average number of classes that conform to thepredictions. This last value is useful for measuring theuncertainty associated with the predictions. For wrongclassifications, the average distance from the true class to thenearest predicted class is also computed, which gives an ideaof how severely wrong predictions deviate from the true class.Only the neutral method is tested in this paper. � For mean values predicted using the second group of rules,relative and absolute errors are measured in an asymmetricalway. Because variable NC has a high frequency of zero values,the concept of relative error could be nonsensical. Moreover, ifthe real value of this variable is small, say 5, a value of 10 is avery good prediction, although its relative error is 100%. On theother hand, if only absolute errors are measured, a predictionof 20,000 units when the real value is 21,000 is also a goodapproximation (its relative error is 5%). However, it producesan absolute error of 1000 units, which could disturb theaverage errors when small values are also taken intoconsideration. For these reasons, a fuzzy set is defined overthe range of dependent variables to assess whether or not avalue is large enough to make a relative error measuremeaningful. This means that for small values, only absoluteerrors are computed, while only relative errors are calculatedfor large values. This fuzzy set depends on two parameters,denoted by b1ob2, which correspond to the largest value
TabA s
HD
N
N
0
TabWe
H
Lo
M
H
TabFuz
H
Lo
M
H
J. Tinguaro Rodrıguez et al. / Computers & Operations Research 39 (2012) 863–873870
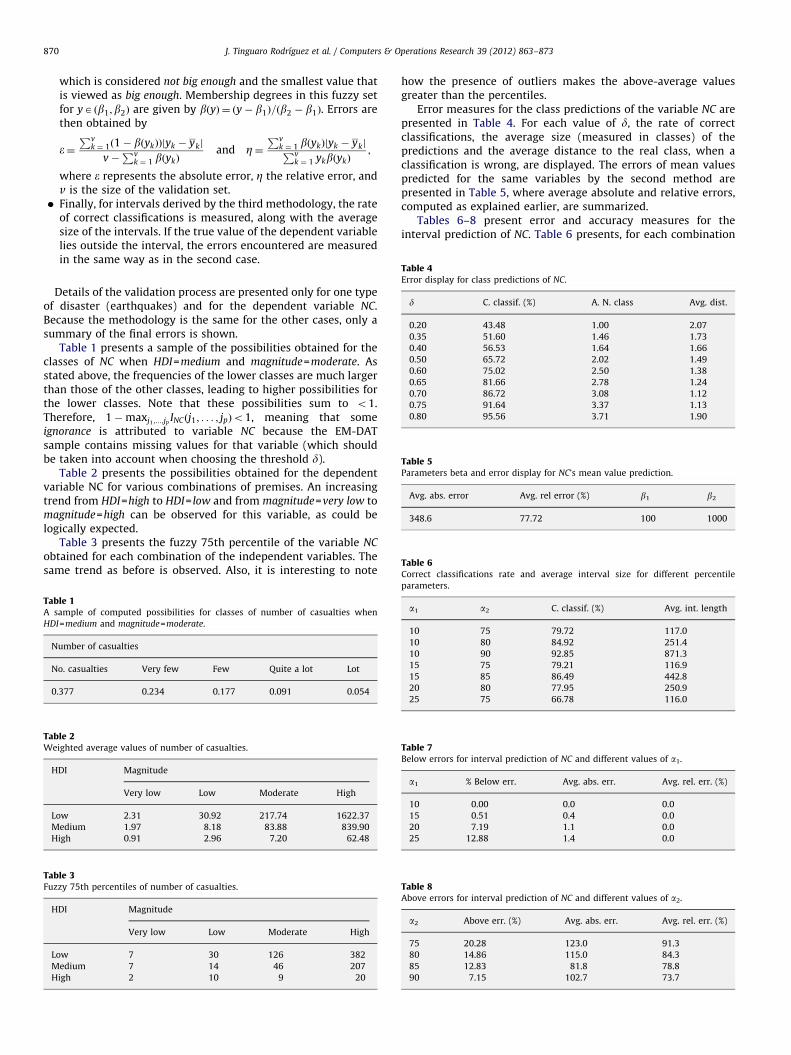
which is considered not big enough and the smallest value thatis viewed as big enough. Membership degrees in this fuzzy setfor yAðb1;b2Þ are given by bðyÞ ¼ ðy� b1Þ=ðb2 � b1Þ. Errors arethen obtained by
e¼Pv
k ¼ 1ð1� bðykÞÞjyk � ykj
v�Pv
k ¼ 1 bðykÞand Z¼
Pvk ¼ 1 bðykÞjyk � ykjPv
k ¼ 1 ykbðykÞ;
where e represents the absolute error, Z the relative error, andv is the size of the validation set.
�Table 4Error display for class predictions of NC.
d C. classif. (%) A. N. class Avg. dist.
0.20 43.48 1.00 2.07
0.35 51.60 1.46 1.73
0.40 56.53 1.64 1.66
0.50 65.72 2.02 1.49
0.60 75.02 2.50 1.38
0.65 81.66 2.78 1.24
0.70 86.72 3.08 1.12
0.75 91.64 3.37 1.13
0.80 95.56 3.71 1.90
Table 5Parameters beta and error display for NC’s mean value prediction.
Avg. abs. error Avg. rel error (%) b1 b2
348.6 77.72 100 1000
Table 6Correct classifications rate and average interval size for different percentile
Finally, for intervals derived by the third methodology, the rateof correct classifications is measured, along with the averagesize of the intervals. If the true value of the dependent variablelies outside the interval, the errors encountered are measuredin the same way as in the second case.
Details of the validation process are presented only for one typeof disaster (earthquakes) and for the dependent variable NC.Because the methodology is the same for the other cases, only asummary of the final errors is shown.
Table 1 presents a sample of the possibilities obtained for theclasses of NC when HDI=medium and magnitude=moderate. Asstated above, the frequencies of the lower classes are much largerthan those of the other classes, leading to higher possibilities forthe lower classes. Note that these possibilities sum to o1.Therefore, 1�maxj1 ;...;jp INCðj1; . . . ; jpÞo1, meaning that someignorance is attributed to variable NC because the EM-DATsample contains missing values for that variable (which shouldbe taken into account when choosing the threshold d).
Table 2 presents the possibilities obtained for the dependentvariable NC for various combinations of premises. An increasingtrend from HDI=high to HDI= low and from magnitude=very low tomagnitude=high can be observed for this variable, as could belogically expected.
Table 3 presents the fuzzy 75th percentile of the variable NC
obtained for each combination of the independent variables. Thesame trend as before is observed. Also, it is interesting to note
le 1ample of computed possibilities for classes of number of casualties when
I=medium and magnitude=moderate.
umber of casualties
o. casualties Very few Few Quite a lot Lot
.377 0.234 0.177 0.091 0.054
le 2ighted average values of number of casualties.
DI Magnitude
Very low Low Moderate High
w 2.31 30.92 217.74 1622.37
edium 1.97 8.18 83.88 839.90
igh 0.91 2.96 7.20 62.48
le 3zy 75th percentiles of number of casualties.
DI Magnitude
Very low Low Moderate High
w 7 30 126 382
edium 7 14 46 207
igh 2 10 9 20
how the presence of outliers makes the above-average valuesgreater than the percentiles.
Error measures for the class predictions of the variable NC arepresented in Table 4. For each value of d, the rate of correctclassifications, the average size (measured in classes) of thepredictions and the average distance to the real class, when aclassification is wrong, are displayed. The errors of mean valuespredicted for the same variables by the second method arepresented in Table 5, where average absolute and relative errors,computed as explained earlier, are summarized.
Tables 6–8 present error and accuracy measures for theinterval prediction of NC. Table 6 presents, for each combination
parameters.
a1 a2 C. classif. (%) Avg. int. length
10 75 79.72 117.0
10 80 84.92 251.4
10 90 92.85 871.3
15 75 79.21 116.9
15 85 86.49 442.8
20 80 77.95 250.9
25 75 66.78 116.0
Table 7Below errors for interval prediction of NC and different values of a1.
a1 % Below err. Avg. abs. err. Avg. rel. err. (%)
10 0.00 0.0 0.0
15 0.51 0.4 0.0
20 7.19 1.1 0.0
25 12.88 1.4 0.0
Table 8Above errors for interval prediction of NC and different values of a2.
a2 Above err. (%) Avg. abs. err. Avg. rel. err. (%)
75 20.28 123.0 91.3
80 14.86 115.0 84.3
85 12.83 81.8 78.8
90 7.15 102.7 73.7
J. Tinguaro Rodrıguez et al. / Computers & Operations Research 39 (2012) 863–873 871
of percentile parameters a1, a2, the proportion of predictedintervals which correctly classify the values of the dependentvariable and the average length of these intervals. Table 7(respectively, Table 8) presents the proportion of intervals forwhich the real value of NC lies below (above) the predicted value,and the absolute and relative errors, in the sense of the secondmethod, associated with the inferior (superior) extreme of theinterval.
In the authors’ opinion, a good choice of class predictionthreshold is d¼ 0:5 because this value achieves a good compro-mise between correct classification (65% accuracy) and size oruncertainty of predictions (size of two classes).
Similarly, according to Table 6, good choices for the percentileparameters seem to be a1 ¼ 15 and a2 ¼ 75, because these valuesachieve an 80% rate of correct classification with an averageinterval length of 117, which is relatively small. However, aspresented in Table 8, a problem with this choice is that for 20% ofthe instances, the real value of NC lies above the interval, whichamounts to underestimating the magnitude of the disaster.Distances from the upper bound of the interval to real values ofNC are in the order of one hundred for relatively small values ofthat variable (NCo500). For larger values of NC, the relative errorscan increase to as much as 90%. In this sense, a better choice ofpercentile parameters might be a1 ¼ 20 and a2 ¼ 80, because thelower-bound errors, although larger, are insignificant and theupper-bound errors are somewhat reduced.
As expected, the validation results for the second group of rulesare rather poor, mainly because of the huge variability contained inthe sample for the dependent variable NC. Obviously, mean valuesperform poorly as a predictor for a variable with huge variance andvery far away from a normal distribution. For these reasons, furtherresults do not include this kind of prediction.
Despite some uncertainty that can be assumed due to theabsence of basic data and explanatory variables, class and intervalpredictions are quite satisfactorily when predicting the variableNC. The only sense in which these predictions could be considereddubious is that they underestimate the consequences of disasters.However, this is only natural when considering that majordisasters are very unusual events and that this fact is alsoreflected in the EM-DAT database. A more complete or balanceddatabase should make it possible to distinguish these majordisasters more effectively.
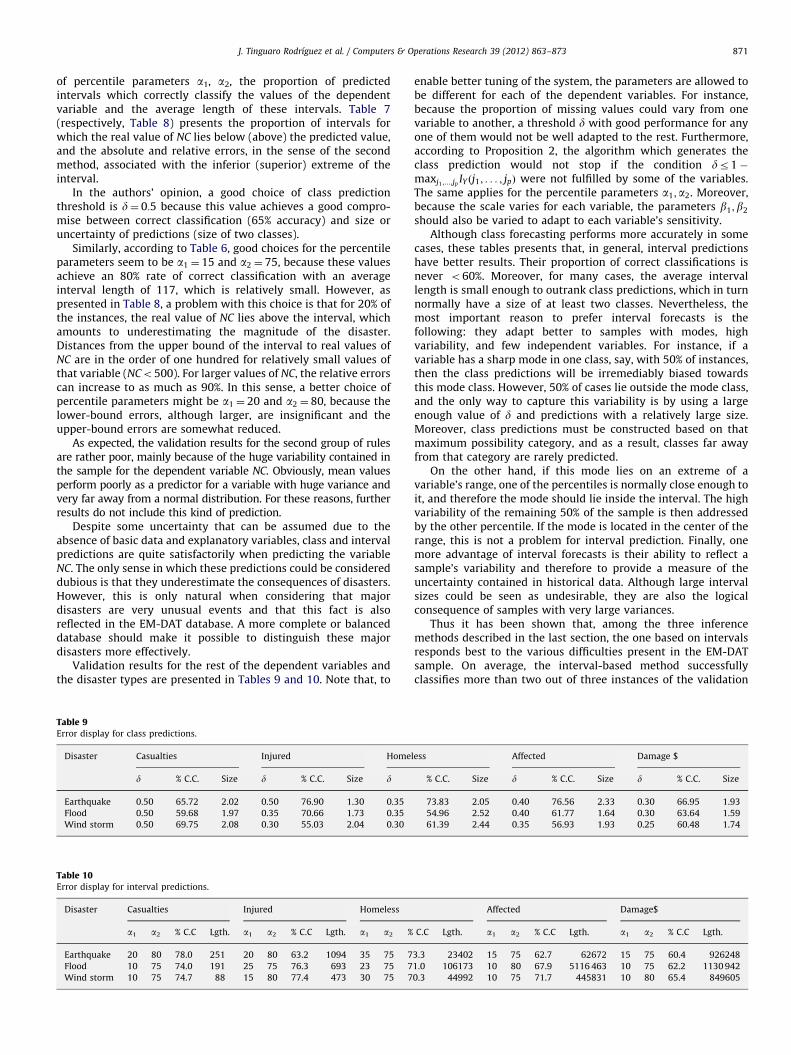
Validation results for the rest of the dependent variables andthe disaster types are presented in Tables 9 and 10. Note that, to
Table 9Error display for class predictions.
Disaster Casualties Injured Home
d % C.C. Size d % C.C. Size d
Earthquake 0.50 65.72 2.02 0.50 76.90 1.30 0.35
Flood 0.50 59.68 1.97 0.35 70.66 1.73 0.35
Wind storm 0.50 69.75 2.08 0.30 55.03 2.04 0.30
Table 10Error display for interval predictions.
Disaster Casualties Injured Homeless
a1 a2 % C.C Lgth. a1 a2 % C.C Lgth. a1 a2 %
Earthquake 20 80 78.0 251 20 80 63.2 1094 35 75 7
Flood 10 75 74.0 191 25 75 76.3 693 23 75 7
Wind storm 10 75 74.7 88 15 80 77.4 473 30 75 7
enable better tuning of the system, the parameters are allowed tobe different for each of the dependent variables. For instance,because the proportion of missing values could vary from onevariable to another, a threshold d with good performance for anyone of them would not be well adapted to the rest. Furthermore,according to Proposition 2, the algorithm which generates theclass prediction would not stop if the condition dr1�maxj1 ;...;jp
IY ðj1; . . . ; jpÞ were not fulfilled by some of the variables.The same applies for the percentile parameters a1;a2. Moreover,because the scale varies for each variable, the parameters b1;b2
should also be varied to adapt to each variable’s sensitivity.Although class forecasting performs more accurately in some
cases, these tables presents that, in general, interval predictionshave better results. Their proportion of correct classifications isnever o60%. Moreover, for many cases, the average intervallength is small enough to outrank class predictions, which in turnnormally have a size of at least two classes. Nevertheless, themost important reason to prefer interval forecasts is thefollowing: they adapt better to samples with modes, highvariability, and few independent variables. For instance, if avariable has a sharp mode in one class, say, with 50% of instances,then the class predictions will be irremediably biased towardsthis mode class. However, 50% of cases lie outside the mode class,and the only way to capture this variability is by using a largeenough value of d and predictions with a relatively large size.Moreover, class predictions must be constructed based on thatmaximum possibility category, and as a result, classes far awayfrom that category are rarely predicted.
On the other hand, if this mode lies on an extreme of avariable’s range, one of the percentiles is normally close enough toit, and therefore the mode should lie inside the interval. The highvariability of the remaining 50% of the sample is then addressedby the other percentile. If the mode is located in the center of therange, this is not a problem for interval prediction. Finally, onemore advantage of interval forecasts is their ability to reflect asample’s variability and therefore to provide a measure of theuncertainty contained in historical data. Although large intervalsizes could be seen as undesirable, they are also the logicalconsequence of samples with very large variances.
Thus it has been shown that, among the three inferencemethods described in the last section, the one based on intervalsresponds best to the various difficulties present in the EM-DATsample. On average, the interval-based method successfullyclassifies more than two out of three instances of the validation
less Affected Damage $
% C.C. Size d % C.C. Size d % C.C. Size
73.83 2.05 0.40 76.56 2.33 0.30 66.95 1.93
54.96 2.52 0.40 61.77 1.64 0.30 63.64 1.59
61.39 2.44 0.35 56.93 1.93 0.25 60.48 1.74
Affected Damage$
C.C Lgth. a1 a2 % C.C Lgth. a1 a2 % C.C Lgth.
3.3 23402 15 75 62.7 62672 15 75 60.4 926248
1.0 106173 10 80 67.9 5116 463 10 75 62.2 1130 942
0.3 44992 10 75 71.7 445831 10 80 65.4 849605

Table 11Real and forecast values for the case of the L’Aquila earthquake.
Variable Real
value
Real
class
Predicted
value
Predicted
class
Predicted
interval
Casualties 294 3 10 1 [0,51]
Injured 1500 4 303 1–2 [8,2060]
Homeless 40000 4 2683 1–2 [0,27 601]
Table 12Real and forecast values for the case of the L’Aquila earthquake with corrected HDI.
Variable Real
value
Real
class
Predicted
value
Predicted
class
Predicted
interval
Casualties 294 3 81 1–2 [0,283]
Injured 1500 4 368 1–2 [33,1880]
Homeless 40000 4 15225 1–3 [0,65 256]
J. Tinguaro Rodrıguez et al. / Computers & Operations Research 39 (2012) 863–873872
set and provides an idea of the level of uncertainty present in thesample. Class predictions, although showing good performance inmany cases, do not perform as well as interval-based methods.Finally, forecasts based on mean values perform poorly.
4.2. A case study
This section presents a case study which provides a betterpicture of SEDD’s operation. The recent tragic earthquake inL’Aquila, Italy, will be taken as an example. L’Aquila is a small city(approximately 75,000 inhabitants), which is the capital of theregion of Abruzzo, in the center of Italy. In the night of April 6,2009, the city was struck by an earthquake of magnitude 6.3,resulting in 294 deaths, 1500 injuries, and 40,000 homeless. Let usalso recall that Italy is a highly developed country to which theUnited Nations Development Program (UNDP) statistics assign anHDI of 0.945 out of 1 (2008 data).
Following the methodology described at the beginning of thissection, HDI and magnitude information is used to forecast thenumber of casualties, injured people, and affected people. Theclasses for these variables are the same as before, but in this case,the entire EM-DAT sample will be used to build the rules. Theparameters also have the same values as presented in Table 10.The forecasts obtained are presented in Table 11.
These results are quite poor: as already happened in thevalidation process, the predicted mean values are very far awayfrom the real ones. Moreover, the class predictions fail for allvariables, and the interval forecasts are correct only for thenumber of injured people, being far away from the real values forthe remaining variables. In summary, the performance obtained ismuch poorer than that observed in the validation process. Howcan this be?
In the authors’ opinion, one main problem is the value of theHDI variable. Recall that this variable provides a measure of thevulnerability of a country, but it is of course true that localconditions and therefore local vulnerability can differ widelyfrom the national average. This is a strong argument for includingmore independent variables in the EM-DAT dataset, particularlythose which would make it possible to assess local vulnerability.In this sense, let us recall that many Italian experts criticized thequality of the buildings which were destroyed by the earthquake(see for instance [34]). It seems that many of these buildingswere built without taking into account the current laws andregulations of the country. This information could be taken tosuggest that the local HDI of the affected zone (L’Aquila in thiscase) is lower than the national average. In any case, it is clear(at least from the facts) that local vulnerability was in factrelatively high.
Taking into account these considerations, it seems appropriateto repeat the case study with a corrected HDI value. It wasdecided to assign this variable a value of 0.8, which constitutesthe limit between what the United Nations calls medium and high
levels of human development. That is, the new value issignificantly lower than the original value, but still high enoughto be considered realistic for a developed country such as Italy.
Results obtained using this corrected values are presented inTable 12.
Now the interval predictions have improved, correctly includ-ing the real value for two of the three variables and being onlyslightly off for the remaining one. Although the predicted classesdo not include the real ones, the distance to them is smaller thanbefore. Moreover, for the injured variable, the possibilitiesobtained were pH ¼ ð22:69;32:98;15:77;8:08;3:80Þ, and thus class4 would have been predicted by using the pessimistic rule (seeSection 3.3) because d¼ 0:5 for this variable. Anyway, as alreadystated, the class predictions are biased towards the mode class,which usually is the lowest one, and this case study is noexception. Further work will be required to develop methods tocorrect unbalanced samples as in the case of EM-DAT.
Interval predictions appear best suited to the challenge ofmodeling the EM-DAT database and using it for learning andinference tasks. Once again, some underestimation is present inthe predictions as a consequence of the sample’s lack of balance.Finally, more independent variables would be useful to distin-guish local features of the place affected by a disaster.
5. Conclusions
Humanitarian NGOs play a key role in current emergencyresponse, especially in many developing countries where avail-able resources or policies make it impossible for local organiza-tions to attend to disasters properly and internationalhumanitarian aid is therefore required. Moreover, disastermitigation and risk management are issues whose importancegoes beyond humanitarian action. Therefore, the problem dis-cussed in this paper is crucial in natural-hazard management,addressing a gap that some NGOs claim exists. Standard existingDSS have been criticized because of their unrealistic complexity.In this paper, on one hand, the authors emphasize the need todevelop decision support tools specifically to address thisproblem, and on the other hand, they show that it is possible todesign such a practical decision support tool so that it can beimplemented in contexts such as developing countries or NGOs.In particular, a DSS-DM data-based rule-building methodologyhas been presented here, which enables damage assessment formultiple disaster scenarios to be generated from availableinformation about the case under study, taking into accounthistorical disaster data and knowledge. Although the system isstill a prototype, validation results suggest the suitability of theapproach developed in this work.
Future research within the SEDD project will involve, amongother things, heuristics for reducing the number of rules whichneed to be built (by means of fuzzy categorical clustering, forexample; see [5]), the introduction of a fuzzy bipolar approach (inthe sense of [21]) to model arguments for and against a certainclassification, and an extended reasoning methodology whichshould take into account relations between dependent variables(see, e.g., [18]). Additional effort should also be devoted to enlargethe knowledge base by adding more premises and dependentvariables, to analyze the robustness of the system with respect to
J. Tinguaro Rodrıguez et al. / Computers & Operations Research 39 (2012) 863–873 873
class definition, and to estimate the required resources. Moreover,in order to provide a better treatment of information uncertainty,it will be necessary to introduce, together with fuzzy uncertaintymeasures, complementary probabilistic measures, and to imple-ment in both frameworks the spatial aggregation operatorsdescribed in [2,3,33].
Acknowledgments
This research has been partially supported by Grants TIN2009-07901, CCGO7-UCM/ESP-2576, and I-Math Consolider C3-0132.
References
[1] Aleskerov F, Say AI, Toker A, Akin H, Altay G. A cluster-based decision supportsystem for estimating earthquake damage and casualties. Disasters2005;29:255–276.
[2] Amo A, Montero J, Biging G, Cutello V. Fuzzy classification systems. EuropeanJournal of Operational Research 2004;156:495–507.
[3] Amo A, Montero J, Molina E. On the representation of recursive rules.European Journal of Operational Research 2001;130:29–53.
[4] Asghar S, Alahakoon D, Churilov L. A dynamic integrated model for disastermanagement decision support systems. International Journal of Simulation2006;6(10–11):95–114.
[5] Benati S. Categorical data fuzzy clustering: an analysis of local searchheuristics. Computers & Operations Research 2008;35(3):766–75.
[6] Cagliardi M, Spera C. Towards a formal theory of model integration. Annals ofOperations Research 1995;58:405–40.
[7] Cova TJ. GIS in emergency management. In: Longley PA, Goodchild MF,Maguire DJ, Rhind DW, editors. Geographical information systems:principles, techniques, applications and management. New York: Wiley;1999. p. 845–58.
[8] Destercke S, Guillaume S, Charnomordic B. Building an interpretable fuzzyrule base from data using orthogonal least squares application to adepollution problem. Fuzzy Sets and Systems 2007;158(18):2078–94.
[9] Dolk D, Kottermann J. Model integration and a theory of models. DecisionSupport Systems 1993;9:51–63.
[10] Drabek TE, Hoetmer GJ, editors. Emergency management: principles andpractice for local government. Washington, DC: International City Manage-ment Association; 1991.
[11] Eguchi RT, Goltz JD, Seligson HA, Flores PJ, Blais NC, Heaton TH, et al. Real-time loss estimation as an emergency response decision support system: theearly post-earthquake damage assessment tool (EPEDAT). EarthquakeSpectra 1997;13(4):815–32.
[12] Eom HB, Lee SM. A survey of decision support system applications(1971–April 1988). Interfaces 1990;20(3):65–79.
[13] Eom SB, Lee SM, Kim EB, Somarajan C. A survey of decision support systemapplications (1988–1994). Journal of the Operational Research Society1998;49:109–20.
[14] Griekspoor A, Collins S. Raising standards in emergency relief: how useful aresphere minimum standards for humanitarian assistance?. British MedicalJournal 2001;323:740–2.
[15] Matisziwa TC, Murraya AT. Modeling s–t path availability to support disastervulnerability assessment of network infrastructure. Computers & OperationsResearch 2009;36(1):16–26.
[16] Mendonc-a D, Beroggi EG, Wallace WA. Decision support for improvisationduring emergency response operations. International Journal of EmergencyManagement 2001;1:30–8.
[17] Milly PC, Wetherald RT, Dunne KA, Delworth TL. Increasing risk of greatfloods in a changing climate. Nature 2002;415:514–7.
[18] Montero J, Gomez D, Bustince H. On the relevance of some families of fuzzysets. Fuzzy Sets and Systems 2007;158:2439–42.
[19] Morrow BH. Identifying and mapping community vulnerability. Disasters1999;23(1):1–18.
[20] Olsen GR, Carstensen N, Hoyen K. Humanitarian crisis: what determines thelevel of emergency assistance? Media coverage, donor interest and the aidbusiness. Disasters 2003;27(2):109–26.
[21] Ozturk M, Tsouki �as A. Modelling uncertain positive and negative reasons indecision aiding. Decision Support Systems 2007;43(4):1512–26.
[22] Repoussis PP, Paraskevopoulos DC, Zobolas G, Tarantilis CD, Ioannou G. Aweb-based decision support system for waste lube oils collection andrecycling. European Journal of Operational Research 2009;195:676–700.
[23] Rodriguez JT, Vitoriano B, Montero J, Omana A. A decision support tool forhumanitarian organizations in natural disaster relief. In: Ruan D, editor.Computational intelligence in decision and control. Singapore: WorldScientific; 2008. p. 600–5.
[24] Schneider PJ, Schauer BA. Hazus—its development and its future. NaturalHazards Review 2006;7(2):40–4.
[25] Schweizer B, Sklar A. Probabilistic metric spaces. New York: North-Holland/Elsevier; 1983.
[26] Stoddard A. Humanitarian NGOs: challenges and trends. In: Macrae J, HarmerA, editors. Humanitarian action and the ‘global war on terror’: a review oftrends and issues, HPG Report 14, London: ODI; 2003. p. 25–36.
[27] Todini E. An operational decision support system for flood risk mapping,forecasting and management. Urban Water 1999;1:131–43.
[28] Tufekci S. An integrated emergency management decision support system forhurricane emergencies. Safety Science 1995;20:39–48.
[29] Turban E, Aronson J. Decision support systems and intelligent systems.Upper Saddle River: Prentice-Hall; 1997.
[30] Van Wassenhove LN. Humanitarian aid logistics: supply chain managementin high gear. Journal of Operations Research Society 2006;57:475–89.
[31] Wallace WA, De Balogh F. Decision support systems for disasters manage-ment. Public Administration Review 1985;45:134–47.
[32] Webb P, Harinarayan A. A measure of uncertainty: the nature of vulnerability,and its relationship to malnutrition. Disasters 1999;23(4):292–305.
[33] Yager R, Kacprzyk J, editors. The ordered weighted averaging operators:theory and applications. Dordrecht: Kluwer Academic Publisher Group; 1997.
[34] /http://news.bbc.co.uk/2/hi/europe/7992936.stmS.