Embed Size (px)
Citation preview
A Canopy Trimming Experimentin Puerto Rico: The Response
of Litter Invertebrate Communitiesto Canopy Loss and Debris
Deposition in a Tropical ForestSubject to Hurricanes
Barbara A. Richardson,1,2* Michael J. Richardson,1,2 Grizelle Gonzalez,3
Aaron B. Shiels,4,5 and Diane S. Srivastava6
1165 Braid Road, Edinburgh EH10 6JE, UK; 2Luquillo LTER, Institute for Tropical Ecosystem Studies, University of Puerto Rico at RıoPiedras, P.O. Box 70377, San Juan, Puerto Rico 00936-8377, USA; 3International Institute of Tropical Forestry, USDA Forest Service,
Jardın Botanico Sur, 1201 Calle Ceiba, San Juan, Puerto Rico 00926-1119, USA; 4Institute for Tropical Ecosystem Studies, Universityof Puerto Rico at Rıo Piedras, P.O. Box 70377, San Juan, Puerto Rico 00936-8377, USA; 5University of Hawai‘i at Manoa, 3190 Maile
Way, Honolulu, Hawaii 96822, USA; 6Department of Zoology and Biodiversity Research Centre, University of British Columbia, 6270
University Blvd., Vancouver, British Columbia V6T 1Z4, Canada
ABSTRACT
Hurricanes cause canopy removal and deposition of
pulses of litter to the forest floor. A Canopy Trim-
ming Experiment (CTE) was designed to decouple
these two factors, and to investigate the separate
abiotic and biotic consequences of hurricane-type
damage and monitor recovery processes. As part of
this experiment, effects on forest floor invertebrate
communities were studied using litterbags. Canopy
opening resulted in increased throughfall, soil
moisture and light levels, but decreased litter
moisture. Of these, only throughfall and soil mois-
ture had returned to control levels 9 months after
trimming. Canopy opening was the major deter-
minant of adverse changes in forest floor inverte-
brate litter communities, by reducing diversity and
biomass, irrespective of debris deposition, which
played a secondary role. Plots subjected to the most
disturbance, with canopy removed and debris ad-
ded, had the lowest diversity and biomass. These
two parameters were higher than control levels
when debris was added to plots with an intact
canopy, demonstrating that increased nutrient po-
tential or habitat complexity can have a beneficial
effect, but only if the abiotic conditions are suitable.
Animal abundance remained similar over all treat-
ments, because individual taxa responded differ-
ently to canopy trimming. Mites, Collembola, and
Psocoptera, all microbiovores feeding mainly on
fungal hyphae and spores, responded positively,
with higher abundance in trimmed plots, whereas
all other taxa, particularly predators and larger de-
tritivores, declined in relative abundance. Litterbag
mesh size and litter type had only minor effects
Received 29 August 2009; accepted 25 January 2010;
published online 13 February 2010
Author Contributions: BAR and MJR identified invertebrates, ana-
lyzed and interpreted data, and wrote the paper. GG designed the litter-
bag experiment, managed the field component and invertebrate
extractions, and helped analyze and interpret data. ABS managed the
planning and organization of the canopy trimming and environmental
measures. DSS analyzed and interpreted data. All authors edited the
paper.
*Corresponding author; e-mail: [email protected]
Ecosystems (2010) 13: 286–301DOI: 10.1007/s10021-010-9317-6
� 2010 Springer Science+Business Media, LLC
286
on communities, and canopy trimming and debris
deposition explained most variation between sites.
Effects of trimming on diversity, biomass, and
abundance of some invertebrate taxa were still seen
when observations finished and canopy closure was
complete at 19 months. This suggests that distur-
bance has a long-lasting effect on litter communities
and may, therefore, delay detrital processing,
depending on the severity of canopy damage and
rate of regrowth.
Key words: canopy gaps; community composi-
tion; forest manipulation; fungi; litterbags; relative
abundance.
INTRODUCTION
Tropical hurricanes, typhoons and cyclones are
major perturbations that can have long-lasting ef-
fects on ecological processes and forest structure
(Sanford and others 1991; Van Bloem and others
2005). In cases of extreme severity and frequency,
such as typhoons in NE Taiwan, loss of nutrients
through litterfall appears to limit tree growth and
canopy height, and leaf regeneration is delayed (Lin
and others 2003). In the Caribbean, where hurri-
canes are less severe and frequent, there is loss of
leaves and wood, damage to branches and stems, and
elevated mortality rates (Foster and Boose 1992;
Lugo and Scatena 1996), but a rapid flush of new
foliage and stem sprouts (Walker 1991). The mag-
nitude of damage is strongly dependent on land-use
history, and the effects of recent hurricanes (Boose
and others 2004). Recovery can be rapid. Relative
tree growth, after Hurricane Gilbert in a Mexican dry
forest was higher than in the three pre-hurricane
years (Wigham and others 1991), and in Puerto Rico,
5 years after Hurricane Hugo, regeneration and
growth of survivors had increased the aboveground
biomass to 86% of the pre-hurricane value (Scatena
and others 1996). Pulses of litterfall from hurricane
inputs rapidly disappear from the forest floor and are
incorporated into forest nutrient cycles, which may
be one reason for the resilience of these forests to
wind disturbance (Ostertag and others 2003). It is
not clear, however, if canopy opening and/or litter
deposition stimulates decomposition.
This study simulates several effects of hurricane
disturbance, based on observations of recent hur-
ricanes in Puerto Rico. Hurricane Hugo (Category
3–4) struck Puerto Rico in September 1989 with
sustained winds of over 166 km h-1, causing se-
vere defoliation of 56% of trees in study plots at El
Verde (Scatena and Larsen 1991). Defoliation
caused a large pulse in fine litter deposition of
green leaves, small wood and miscellaneous debris,
which was 1.2–1.9 times the normal annual litter-
fall throughout the Luquillo Experimental Forest
(LEF) (Lodge and others 1991). In 1998 Hurricane
Georges struck the LEF and caused 0.55–0.93 times
the annual litterfall, and forest floor standing stocks
were then 1.2–2.5 times greater than pre-hurricane
values. Unlike regular litterfall, hurricane litter
contains a high proportion of green leaves from
which nutrients have not been translocated, thus
altering litter quality. The input of phosphorus in
total hurricane litterfall was 1.5–2.4 times normal
annual input (Lodge and others 1991) and such a
high magnitude of P transfer from canopy to forest
floor may affect soil fertility and forest productivity
(Sanford and others 1991). Fresh green leaves have
significantly higher nitrogen concentrations and
lower lignin to N ratios than senescent leaves, and
significantly higher decay rates (Fonte and
Schowalter 2004). Gaps and defoliation have a
dramatic influence on light reaching the forest
floor, resulting in growth of vines, and then of
seedlings of pioneer trees and shrubs. These grow
rapidly, reducing light intensity and the frequency
of bright sun flecks (Fernandez and Fetcher 1991).
The ecological effects of hurricanes have been
particularly well documented in the LEF, a mon-
tane rainforest in eastern Puerto Rico. A long his-
tory of research on soils, climate, biota and
ecosystem function (Odum and Pigeon 1970;
Brown and others 1983; Reagan and Waide 1996)
in this forest has allowed comparison with post-
hurricane effects and subsequent recovery, for
example, on landslide areas, groundwater chemis-
try, aboveground biomass, frog populations, fresh-
water shrimps and canopy arthropods.
In all these opportunistic studies of post-hurri-
cane recovery of the forest ecosystem in Puerto
Rico, it has been impossible to tease apart the
consequences of the two major events: canopy
opening and the pulse of litter to the forest floor.
The experiment described here is part of a larger
controlled experiment (the Canopy Trimming
Experiment, CTE), designed to decouple the abiotic
and biotic effects of hurricane-type disturbance,
and to investigate their separate effects on the
recovery of soils, biota and forest regrowth, in a
multidisciplinary approach.
Hurricane litterfall amounts, litter decay rates
and the chemistry of nutrient cycling have been
Invertebrate Response to Canopy Trimming 287
extensively researched, but the effects of hurri-
canes on the agents of decay and recycling,
microorganisms and litter fauna, have been under
investigated. In this study, using litterbags sampled
over a period of time, we ask what the effects of
canopy opening and debris inputs are on forest
floor litter faunal communities [micro- and meso-
fauna <2 mm (Ruiz and others 2008)], and
whether they are affected by the quality of the litter
and mesh size of the bags. Litterbag experiments,
like all faunal exclusion studies, have limitations
(Tanner 1981). For example, litterbags of different
mesh sizes may provide different microclimates
favoring different groups of organisms or, with very
small mesh, become waterlogged. Litterbags were
used, however, over whole-litter sampling because
they allow treatment effects on colonization of new
litter to be directly linked to effects on decay rates.
Any change in the activity or biomass of the
decomposer community in the bulk litter may
affect faunal community composition, and coloni-
zation rates within the litterbags (Bradford and
others 2002).
In this study, we tested the following hypotheses:
(1) Canopy removal creates a harsher abiotic
environment with adverse effects on litter inver-
tebrate communities. (2) Increased litter deposition
provides additional resources and habitat for
invertebrates, and so increases invertebrate abun-
dance, biomass and diversity. (3) Small mesh size of
litterbags excludes certain invertebrates, and so
changes taxonomic composition. (4) Litterbag
invertebrate communities are similar in composi-
tion to those in bulk litter (compare Richardson
and others 2005), and so provide a useful proxy for
litter fauna. (5) All treatment effects are transient
as the canopy regrows and detritus decomposes.
For all hypotheses we assessed litter invertebrate
communities in terms of abundance, biomass,
diversity, taxonomic composition and trophic
structure.
STUDY SITE
The Luquillo Experimental Forest is part of El
Yunque National Forest, in hurricane-prone NE
Puerto Rico. The CTE plots are in mature lower
montane rain forest, with tabonuco (Dacryodes ex-
celsa Vahl), motillo (Sloanea berteriana Choisy) and
sierra palm (Prestoea montana (Graham) Nicholson)
as the dominants in the canopy, a lower canopy at
20 m, and an open understorey, with sparse forest
floor vegetation. The plots are approximately 1 km
northeast and east of El Verde Field Station
(18.321�N, 65.820�W; Figure 1) at 340–470 m a.s.l.
Annual rainfall is approximately 3.5 m (Garcıa-
Martino and others 1996), with approximately 97
rainless days per year. Rainfall is weakly seasonal,
with a dry season between December and March
(most commonly March) (http://lternet.edu/data/
lterdb14/data/). Litterfall is also seasonal, with a
main peak from March to June, a secondary peak
in September, and minima from December to
February (Zou and others 1995; Lawrence 1996;
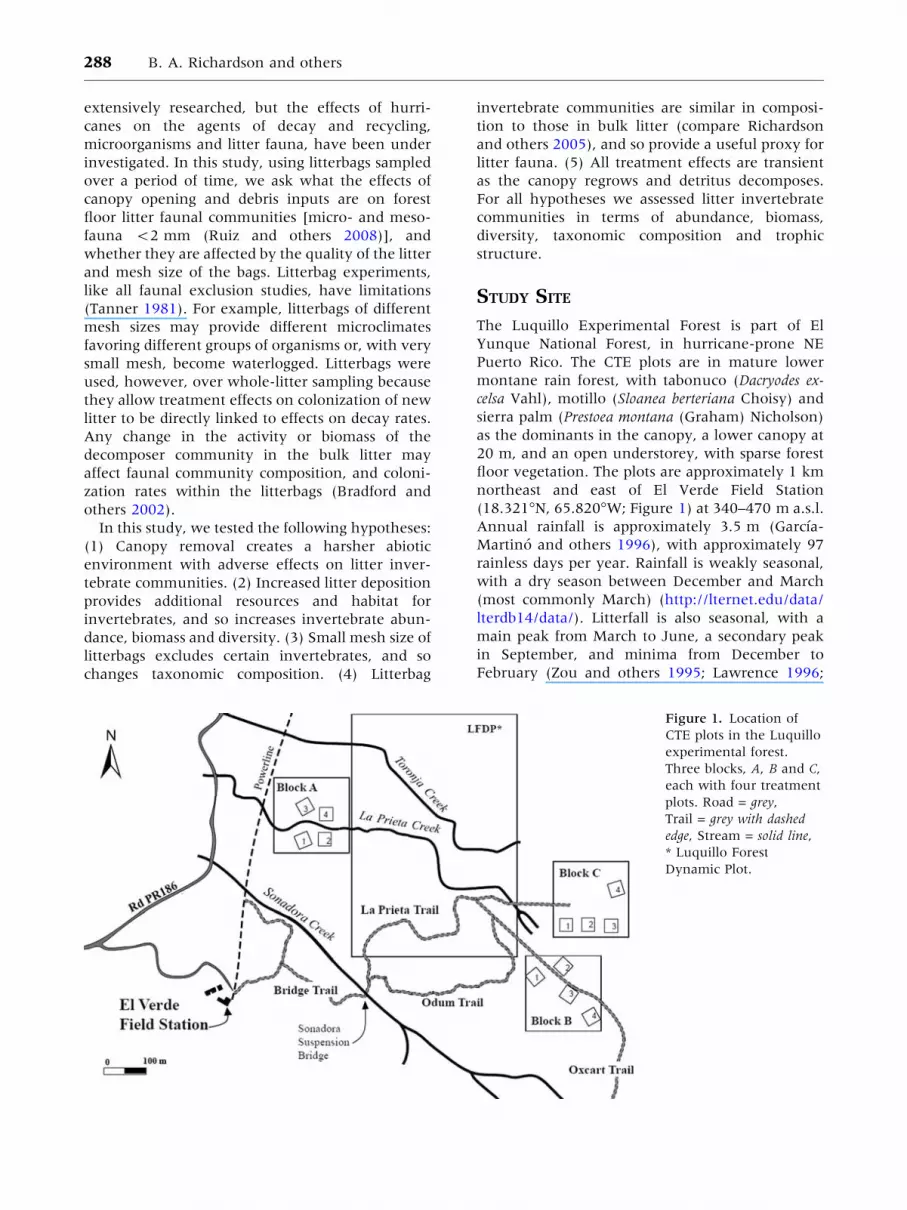
Figure 1. Location of
CTE plots in the Luquillo
experimental forest.
Three blocks, A, B and C,
each with four treatment
plots. Road = grey,
Trail = grey with dashed
edge, Stream = solid line,
* Luquillo Forest
Dynamic Plot.
288 B. A. Richardson and others
Zalamea and Gonzalez 2008). Annual mean
monthly temperatures (1975–2004) range between
20.6 and 25.8�C, with an annual mean of 23.0�C(SD = 1.9�C) (http://lternet.edu/data/lterdb16/data/).
METHODS
Experimental Design
The experimental manipulations involved four
randomized treatment plots in each of three blocks
(Figure 1):
1. Canopy trimmed and trimmed biomass distrib-
uted on forest floor. This simulates the changes
in microclimate and redistribution of biomass
caused by a hurricane.
2. Canopy trimmed and trimmed biomass removed
from the plot. This simulates the changes in
microclimate openness created by the hurricane
without the associated redistribution of biomass.
3. Canopy not trimmed but canopy biomass from a
trimmed plot distributed on forest floor. This
simulates the changes in redistribution of bio-
mass created by the hurricane without the
associated change in microclimate.
4. Canopy not trimmed and no canopy biomass
added to forest floor. This maintains the forest
unmodified by simulated hurricane disturbance.
Replicate blocks were in areas with similar land-use
history, soil-type and vegetation. In all plots exist-
ing litter was left in place. Each plot was
30 9 30 m, with the interior 20 9 20 m of each
plot used for measurements, and divided into 16
subplots. Litterbags (details follow) to be collected
for invertebrate extraction were placed in sub-plots
within each main plot. Two litterbag-level factors
were considered in a factorial design: litterbag mesh
size (large or small) and leaf litter type (dried green
or senescent leaves). At each of 7 sampling dates, a
litterbag for each litter treatment was collected
from each of three sub-plots (1008 litterbags total).
Microclimatic Measurements
Daily rainfall totals were obtained from the National
Atmospheric Deposition Program tower at El Verde,
approximately 0.4–0.7 km from the experimental
area (Figure 1). Funnels collected throughfall into
bottles (3 per plot) and the volumes were recorded
at 2-week intervals. The volume was converted to
throughfall (mm-d), using daily rainfall data from
the NADP tower, by dividing the amount for any
collection period into the same proportions as the
daily rainfall recorded for the same period. This al-
lowed the inclusion of rainless days in the
throughfall record, because it was assumed that
there would be no throughfall in the plots on days
that the tower recorded no rainfall. Soil moisture
and litter moisture content measurements from the
plots were also made available (L Lebron and DJ
Lodge, respectively, unpublished data). Tempera-
ture was recorded using three Campbell 108
(Campbell Scientific) sensors per plot, connected to
a Campbell data logger to give an hourly average. In
the event, these proved unreliable, and there were
many missing data. Canopy closure was monitored
by using a Gap Light Analyzer (GLA, Frazer and
Canham 1999) to analyze a series of hemispherical
photographs taken at 1 m above the ground at each
plot, both before trimming began and at intervals
after trimming.
Canopy Trimming
Professional arborists carried out the canopy trim-
ming. The trimming, weighing and replacement of
Table 1. Dates of Canopy Trimming of the Six Trimmed Plots, and Amounts of Material Removed, to beReturned to the ‘Trimmed With Debris’ Plots (TD) or Relocated from Trimmed Plots (TR) to the ‘UntrimmedWith Debris’ Plots
Block Treatment Date of trim Date of completion
of debris redistribution
Amount of material removed
[t (fw) per 900 m2]
Leafy twigs Wood Palm frond Total
A TR 22 March–17 April 2005 16 June 20051 3.08 4.86 0.99 8.93
A TD 22 March–17 April 2005 16 June 2005 2.88 4.87 0.57 8.32
B TD 26 October–2 December 2004 13 January 2005 5.60 6.89 0.29 12.78
B TR 9 November–18 December 2004 20 January 20051 4.65 5.49 0.52 10.67
C TD 2 February–9 March 2005 17 March 2005 4.10 6.60 0.79 11.50
C TR 24 January–9 March 2005 16 March 20051 4.30 6.18 0.21 10.69
1Debris relocated to untrimmed plots with added debris.
Invertebrate Response to Canopy Trimming 289
debris lasted from 26 October 2004 to 16 June 2005
(Table 1). Two plots in each block were trimmed
and two were left untrimmed. Treatment imple-
mentation was slowed by adverse weather, and the
extremely large amount of material that had to be
collected, weighed and redistributed manually. All
trees larger than 15 cm dbh had limbs and stems
smaller than 10 cm diameter removed. All trees
between 10 and 15 cm dbh were trimmed at 3 m
height, and all limbs smaller than 10 cm removed.
Palms had leaves reaching above 3 m trimmed, and
the apical meristem was preserved. All material
removed from the canopy of each trimmed plot
(debris) was collected, segregated as leafy twigs,
wood and palm, and weighed. Subsamples of each
debris category were dried at 45�C, and reweighed
to establish wet/dry weight ratios. In each block,
after weighing, debris from one trimmed plot was
returned to that plot, and evenly distributed. Debris
from the other trimmed plot was removed and
redistributed to one of the two untrimmed plots.
Where there were large differences in amounts of
material from the two trimmed plots in a block, the
amount of debris returned to the two with-debris
plots was evened out. We compensated for the
unusually low amount of trimmed material in
block A (Table 1) by using material from a nearby
location. Approximately 10 t fresh weight of veg-
etation was removed from each plot (�111 t ha-1),
weighed and redistributed (Table 1, approximately
39% leafy twigs, 55% wood and 6% palm fronds
initially, by fresh weight). Mass losses that occurred
between trimming and redistribution were consis-
tent across blocks for wood (11.6%) and palm
(16.1%). An unexpected consequence of having
piles of leafy litter on the forest floor awaiting
processing (from 1 week to 2 months, Table 1) was
that they were immediately attacked by inverte-
brate herbivores (mainly moth larvae). Green
leaves degraded rapidly, and what was left for
redistribution was mainly woody material, with
minimal foliage (AS, unpublished data). Material
had been stored and moved on tarpaulins, how-
ever, so nutrients in the form of frass were returned
to the plots. The mass loss of leafy twigs varied from
23 to 33% among blocks, so there were differences
in litter quality among blocks, but these differences
are relatively small overall, as the main component
of the debris was woody material. Overall, the
relative proportions of the three components had
changed to approximately 34% leafy twigs, 60%
wood and 6% palm fronds (by fresh weight). The
amount of detritus added to each of the six detritus
addition plots was approximately 5.4 t dry weight,
equivalent to 60 t ha-1.
Litterbags and Invertebrate Collection
Litterbags (14.5 9 14.5 cm) were of large (1.8 mm)
or small mesh (0.475 mm), filled with air-dried
pre-weighed green or senescent leaves (approx.
5.5 g per bag), composed of a mixture of leaf spe-
cies in the same proportion as their representation
in natural litterfall (Zalamea and Gonzalez 2008).
The species were Dacryodes excelsa, Manilkara biden-
tata (A. DC.) Chev., Cyrilla racemiflora L. and Prestoea
montana (R. Graham) Nichols (52%, on a dry mass
basis), 19% of the 7 next most frequent species,
and the remaining 29% a mixture of 19 less fre-
quent species. The LEF is a seasonal wet tropical
forest and in the ‘dry’ season has variable se-
quences of rainless days, which can dry out surface
litter. The litterbags were put out at the same start
period, after all canopy trimming was completed, to
avoid confounding results with seasonal variations
in replicate blocks cut at different times.
Litterbags were placed in all plots on 20–23 June
2005, and recovered after 2, 4, 7, 10, 13, 16 and
19 months in the field. Invertebrates from each bag
were extracted using Tullgren funnels. The inver-
tebrates collected were counted, measured and
identified to morphospecies or species, and relative
abundances were used to monitor changes in
community composition and diversity indices. It
was not practical to identify Acari (mites) or Col-
lembola to morphospecies. Mites were identified as
Oribatida, Mesostigmata or Prostigmata, and Col-
lembola to family level. Morphospecies were as-
signed to broad trophic groups, based on the
known biology of the taxa (for example, Merritt
and Cummins 1984; Stehr 1987, 1991; Borror and
others 1989). Trophic groups were defined for this
study as: detritivores (comminuters of litter), mi-
crobiovores (feeding on fungi, bacteria, protozoa
and small detrital particles), herbivores, parasitoids,
predators and fluid feeders. This latter group was a
mix of organisms known to feed on liquids from
the final stages of decay, ants collecting honeydew
from root-feeding Homoptera and adult flies (Dip-
tera) which oviposit in litter. From information
available for detritivores it was not always known,
for example, whether an organism was feeding on
detritus for its fungal and microbial content or de-
cay products (panphytophagous), or consuming
the detritus directly for its nutrients. Some oribatid
mites are consumers of litter (detritivores), others
are fungivores (microbiovores); similarly, some
Prostigmata are predators, others microbiovores. In
both cases the counts were apportioned 50/50
between the two trophic groups. Although Col-
lembola are ecologically differentiated into many
290 B. A. Richardson and others
feeding guilds, those in tropical forest litters are
characterized as specialist fungivores (hyphae and
fungal spores), with only low densities of litter-
shredding species (Rusek 1998). They were,
therefore, all classified as microbiovores.
Biomass and Diversity
Biomass was estimated using length 9 dry weight
relationships established for different groups of
invertebrates obtained in earlier work with the
fauna of bromeliad phytotelmata and forest floor
litter (Richardson and others 2000, 2005). Addi-
tional weights were obtained during this study for
mites, collembola and ostracods, archived at http://
luq.lternet.edu/data/lterdb134/metadata/lterdb134.
htm.
Diversity was compared among treatments and
over time using Margalef’s index of species richness
and Simpson’s reciprocal index (1/D), which takes
relative species abundance into account. For a dis-
cussion of the advantages of these indices see
Magurran (2004).
Statistical Analysis
Data were analyzed with mixed model ANOVAs.
The ANOVAs examined four treatment effects
(trim, debris, mesh, litter) over time, whilst con-
trolling for random effects of block, plot and sub-
plot. In the experimental design, subplot is nested
within each of 4 plots per block, and plot is nested
within each of three spatially distinct blocks. The
trimmed and debris treatments were applied at the
plot level, and the litter and mesh treatments at the
subplot level. Thus, the four types of manipulation
follow a split-plot design within a randomized
block framework. All possible interactions between
these four manipulated factors were considered.
Date was examined only as a main effect, as tem-
poral variance in the effects of manipulations was
of minor interest. In addition, models that included
interactions between date and manipulated vari-
ables failed to converge. In analyzing community
parameters, the relative abundances of the main
taxonomic groups were considered with reference
to the effect of treatments and the passage of time.
The mixed effects linear model was fitted using
maximum likelihood estimation (Package NLME, R
Version 2.6.2), and significance of fixed effects was
based on F tests (a = 0.05). Residual plots were
assessed for departures from normality and non-
linearity. In many cases, the response variable
needed to be transformed to conform to parametric
assumptions of normality. Data were transformed
back to their original scale for presentation of
results. Response variables included community
metrics (diversity, total abundance and biomass,
and composition) and abundances of the six most
common taxa. Biomass and total abundance were
examined both with and without mites. Insuffi-
cient data existed for reliable univariate analysis of
less abundant taxa. Instead, community composi-
tion was summarized by 3 PCA axes, using the
software PRIMER (version 5.2.9, Plymouth Marine
Labs), to provide information on treatment effects
for all taxa. One outlier sample was identified by
initial analyses and removed. Sample scores on the
three PCA axes were used as response variables in
the mixed model ANOVA, to examine treatment
effects on community composition.
RESULTS
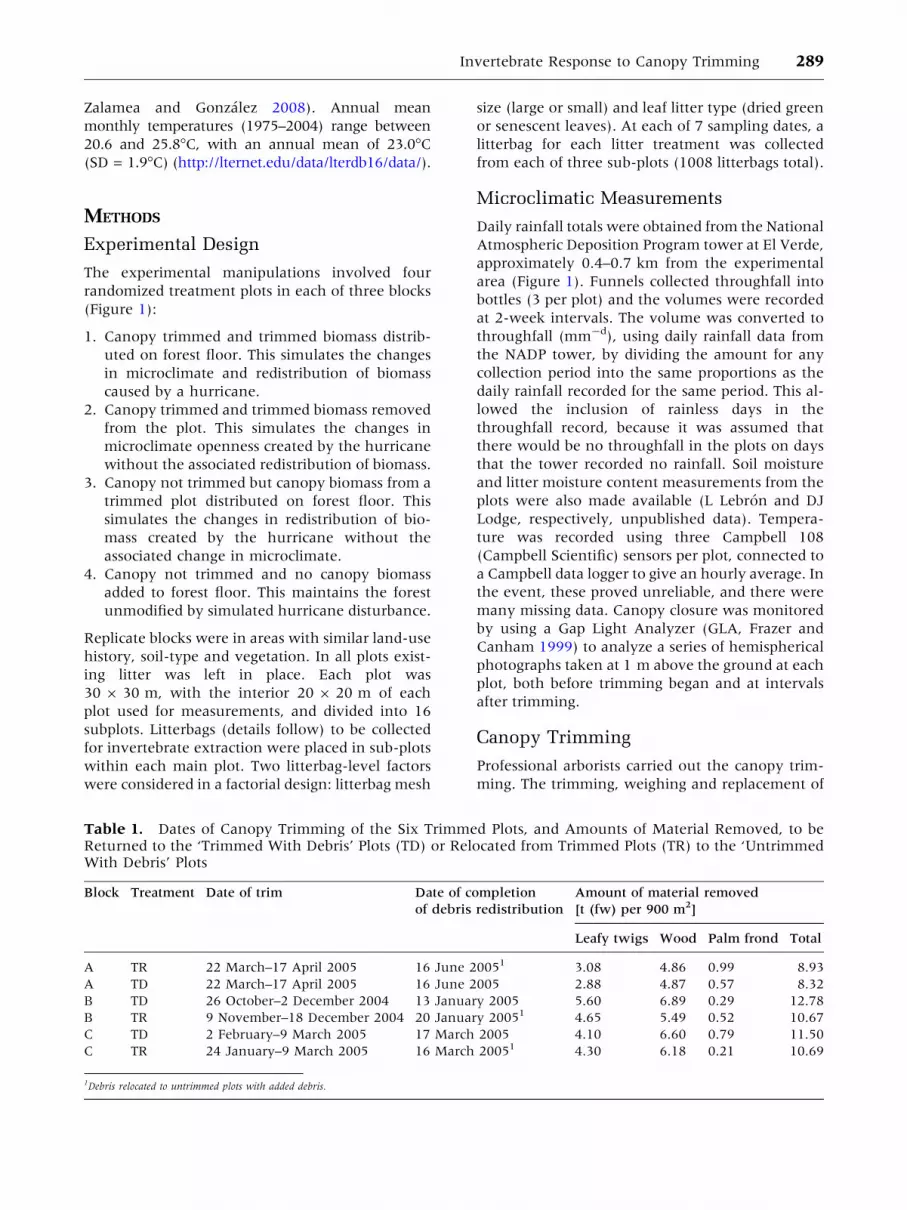
Microclimate Changes
Analysis of the hemispherical photographs, using
GLA, showed that canopy openness in the trimmed
plots had declined from 15 to 20% immediately
after trimming to just above the 5% level, which
was similar to the untrimmed plots, after
18 months (Figure 2A). Canopy opening initially
resulted in major differences in microclimate be-
tween trimmed and untrimmed plots that dimin-
ished as the canopy recovered.
Throughfall data (Figure 2B) show that canopy
trimming increased the amount of precipitation
reaching the forest floor directly, which was similar
to the rainfall values when the canopy was first
removed. Initially, throughfall in the intact canopy
plots was approximately 60% of throughfall in
trimmed plots. The difference in amount of
throughfall in the trimmed and untrimmed treat-
ments gradually decreased, so that by March 2006,
9 months after placing litterbags in the plots, the
throughfall in canopy trimmed plots was similar to
that in untrimmed plots. Similarly, soil moisture
contents were approximately 10% higher in trim-
med plots (L Lebron and DJ Lodge, unpublished
data), with the values again converging among
treatments by March 2006. During the observation
period there were four periods of high rainfall
(>300 mm/month), October 2005, January, April
and July 2006 (4, 7, 10 and 13 months), and one
very dry month (March 2006, with <100 mm).
Soil and litter moisture levels responded differently
to canopy trimming. Soil moisture levels increased
from the beginning to a peak in September 2005
(3 months), were lowest in October in both years
Invertebrate Response to Canopy Trimming 291
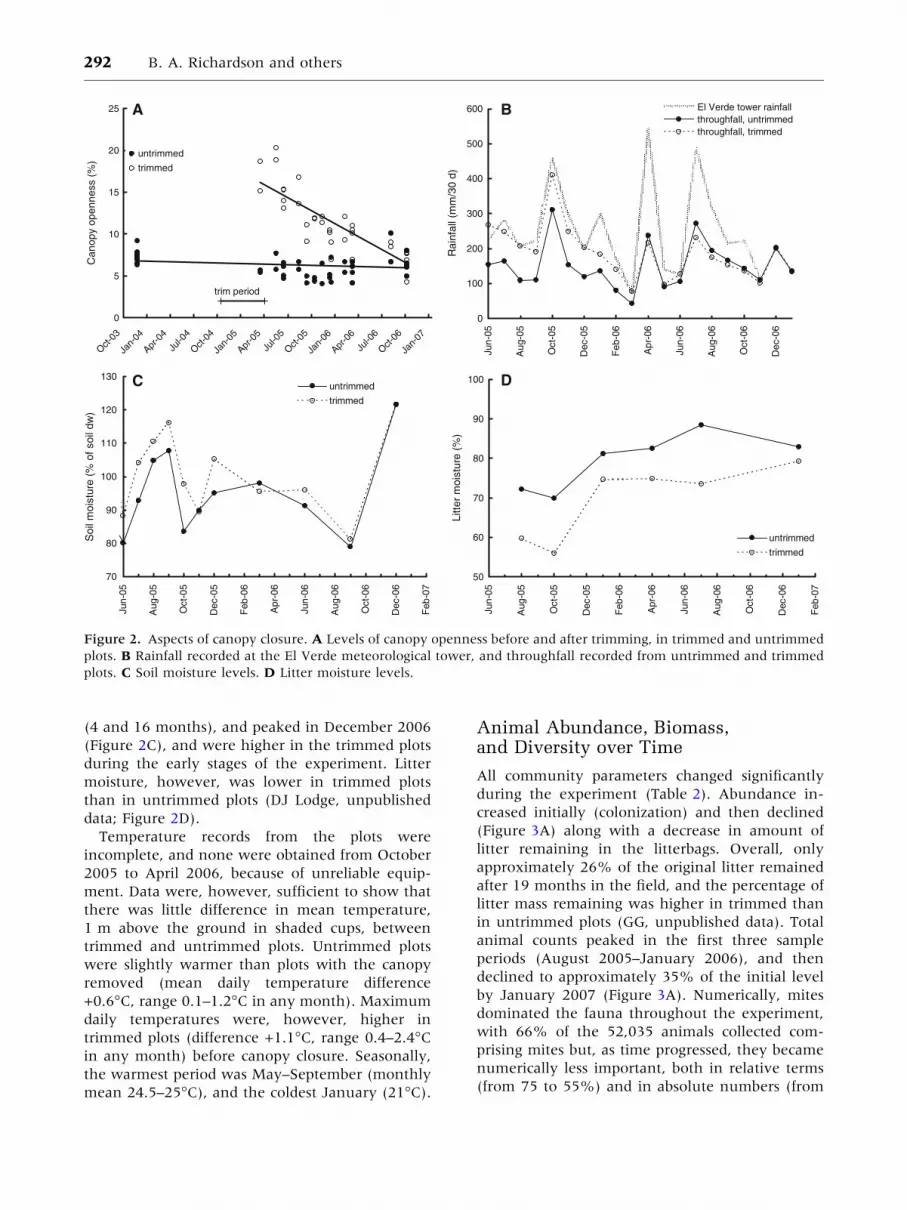
(4 and 16 months), and peaked in December 2006
(Figure 2C), and were higher in the trimmed plots
during the early stages of the experiment. Litter
moisture, however, was lower in trimmed plots
than in untrimmed plots (DJ Lodge, unpublished
data; Figure 2D).
Temperature records from the plots were
incomplete, and none were obtained from October
2005 to April 2006, because of unreliable equip-
ment. Data were, however, sufficient to show that
there was little difference in mean temperature,
1 m above the ground in shaded cups, between
trimmed and untrimmed plots. Untrimmed plots
were slightly warmer than plots with the canopy
removed (mean daily temperature difference
+0.6�C, range 0.1–1.2�C in any month). Maximum
daily temperatures were, however, higher in
trimmed plots (difference +1.1�C, range 0.4–2.4�Cin any month) before canopy closure. Seasonally,
the warmest period was May–September (monthly
mean 24.5–25�C), and the coldest January (21�C).
Animal Abundance, Biomass,and Diversity over Time
All community parameters changed significantly
during the experiment (Table 2). Abundance in-
creased initially (colonization) and then declined
(Figure 3A) along with a decrease in amount of
litter remaining in the litterbags. Overall, only
approximately 26% of the original litter remained
after 19 months in the field, and the percentage of
litter mass remaining was higher in trimmed than
in untrimmed plots (GG, unpublished data). Total
animal counts peaked in the first three sample
periods (August 2005–January 2006), and then
declined to approximately 35% of the initial level
by January 2007 (Figure 3A). Numerically, mites
dominated the fauna throughout the experiment,
with 66% of the 52,035 animals collected com-
prising mites but, as time progressed, they became
numerically less important, both in relative terms
(from 75 to 55%) and in absolute numbers (from
0
5
10
15
20
25
O - t c 3 0
n a J -
4 0
A - r p
4 0 l u J 4 0 -
O - t c 4 0
n a J -
5 0
A - r p
5 0 l u J 5 0 -
O - t c 5 0
n a J -
6 0
A - r p
6 0 l u J 6 0 -
O - t c 6 0
n a J -
7 0
) %
( s s e n n e p o y p o n a
C
untrimmed
trimmed
A
trim period
B
0
100
200
300
400
500
600
5 0 - n u J
5 0 - g u A
5 0 - t c O
5 0 - c e D
6 0 - b e F
6 0 - r p A
6 0 - n u J
6 0 - g u A
6 0 - t c O
6 0 - c e D
) d 0 3 / m
m
( l l a f n i a
R
El Verde tower rainfall throughfall, untrimmed throughfall, trimmed
70
80
90
100
110
120
130
5 0 - n u J
5 0 - g u A
5 0 - t c O
5 0 - c e D
6 0 - b e F
6 0 - r p A
6 0 - n u J
6 0 - g u A
6 0 - t c O
6 0 - c e D
7 0 - b e F
) w
d l i o s f o
%
( e r u t s i o m
l i o
S
untrimmed
trimmed
C D
50
60
70
80
90
100
5 0 - n u J
5 0 - g u A
5 0 - t c O
5 0 - c e D
6 0 - b e F
6 0 - r p A
6 0 - n u J
6 0 - g u A
6 0 - t c O
6 0 - c e D
7 0 - b e F
) %
( e r u t s i o
m
r e t t i L
untrimmed
trimmed
Figure 2. Aspects of canopy closure. A Levels of canopy openness before and after trimming, in trimmed and untrimmed
plots. B Rainfall recorded at the El Verde meteorological tower, and throughfall recorded from untrimmed and trimmed
plots. C Soil moisture levels. D Litter moisture levels.
292 B. A. Richardson and others
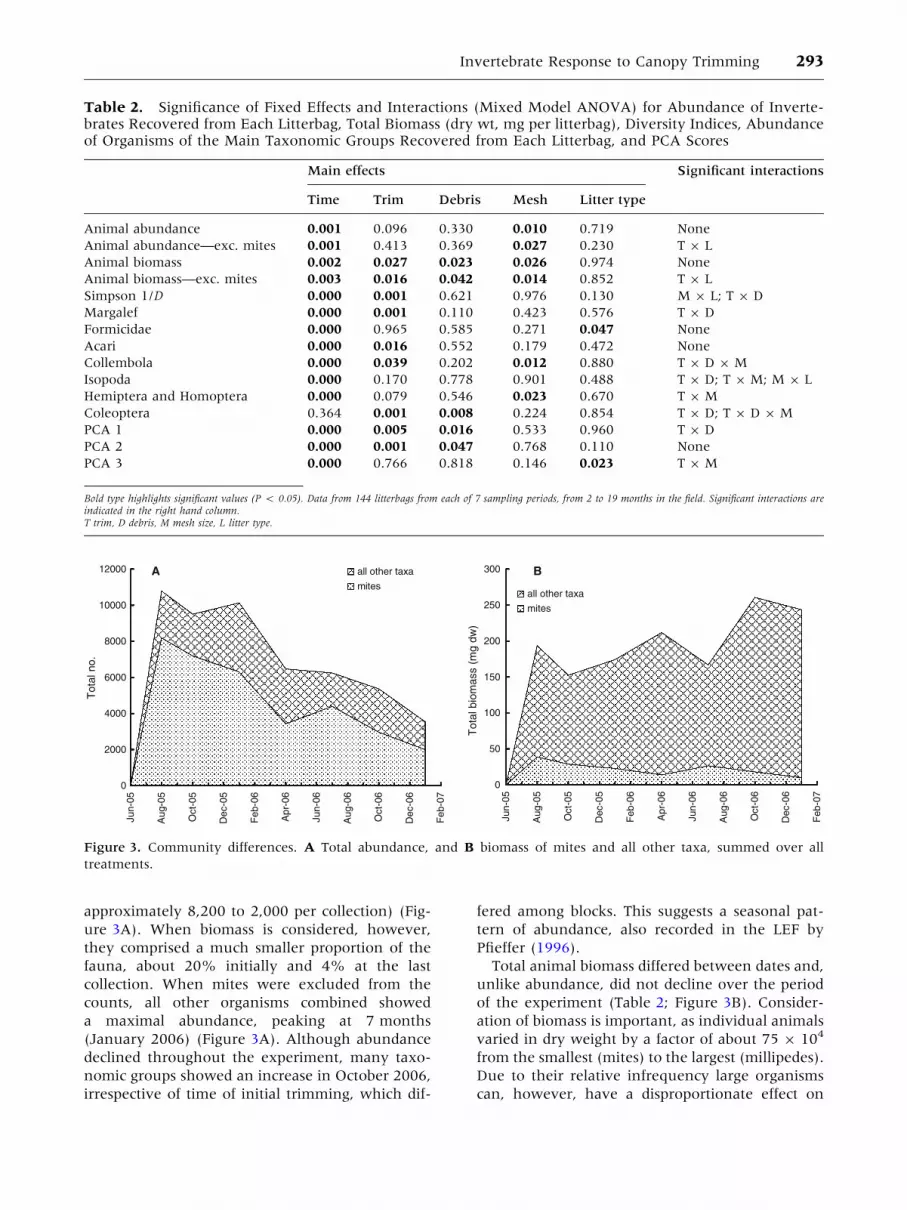
approximately 8,200 to 2,000 per collection) (Fig-
ure 3A). When biomass is considered, however,
they comprised a much smaller proportion of the
fauna, about 20% initially and 4% at the last
collection. When mites were excluded from the
counts, all other organisms combined showed
a maximal abundance, peaking at 7 months
(January 2006) (Figure 3A). Although abundance
declined throughout the experiment, many taxo-
nomic groups showed an increase in October 2006,
irrespective of time of initial trimming, which dif-
fered among blocks. This suggests a seasonal pat-
tern of abundance, also recorded in the LEF by
Pfieffer (1996).
Total animal biomass differed between dates and,
unlike abundance, did not decline over the period
of the experiment (Table 2; Figure 3B). Consider-
ation of biomass is important, as individual animals
varied in dry weight by a factor of about 75 9 104
from the smallest (mites) to the largest (millipedes).
Due to their relative infrequency large organisms
can, however, have a disproportionate effect on
Table 2. Significance of Fixed Effects and Interactions (Mixed Model ANOVA) for Abundance of Inverte-brates Recovered from Each Litterbag, Total Biomass (dry wt, mg per litterbag), Diversity Indices, Abundanceof Organisms of the Main Taxonomic Groups Recovered from Each Litterbag, and PCA Scores
Main effects Significant interactions
Time Trim Debris Mesh Litter type
Animal abundance 0.001 0.096 0.330 0.010 0.719 None
Animal abundance—exc. mites 0.001 0.413 0.369 0.027 0.230 T 9 L
Animal biomass 0.002 0.027 0.023 0.026 0.974 None
Animal biomass—exc. mites 0.003 0.016 0.042 0.014 0.852 T 9 L
Simpson 1/D 0.000 0.001 0.621 0.976 0.130 M 9 L; T 9 D
Margalef 0.000 0.001 0.110 0.423 0.576 T 9 D
Formicidae 0.000 0.965 0.585 0.271 0.047 None
Acari 0.000 0.016 0.552 0.179 0.472 None
Collembola 0.000 0.039 0.202 0.012 0.880 T 9 D 9 M
Isopoda 0.000 0.170 0.778 0.901 0.488 T 9 D; T 9 M; M 9 L
Hemiptera and Homoptera 0.000 0.079 0.546 0.023 0.670 T 9 M
Coleoptera 0.364 0.001 0.008 0.224 0.854 T 9 D; T 9 D 9 M
PCA 1 0.000 0.005 0.016 0.533 0.960 T 9 D
PCA 2 0.000 0.001 0.047 0.768 0.110 None
PCA 3 0.000 0.766 0.818 0.146 0.023 T 9 M
Bold type highlights significant values (P < 0.05). Data from 144 litterbags from each of 7 sampling periods, from 2 to 19 months in the field. Significant interactions areindicated in the right hand column.T trim, D debris, M mesh size, L litter type.
A
0
2000
4000
6000
8000
10000
12000
5 0 - n u J
5 0 - g u A
5 0 - t c O
5 0 - c e D
6 0 - b e F
6 0 - r p A
6 0 - n u J
6 0 - g u A
6 0 - t c O
6 0 - c e D
7 0 - b e F
. o n l a t o T
all other taxa
mites
B
0
50
100
150
200
250
300
5 0 - n u J
5 0 - g u A
5 0 - t c O
5 0 - c e D
6 0 - b e F
6 0 - r p A
6 0 - n u J
6 0 - g u A
6 0 - t c O
6 0 - c e D
7 0 - b e F
) w
d g
m
( s s a m
o i b l a t o
T
all other taxa
mites
Figure 3. Community differences. A Total abundance, and B biomass of mites and all other taxa, summed over all
treatments.
Invertebrate Response to Canopy Trimming 293
some of the data. Relative abundance calculations
are important, to monitor changes in community
composition.
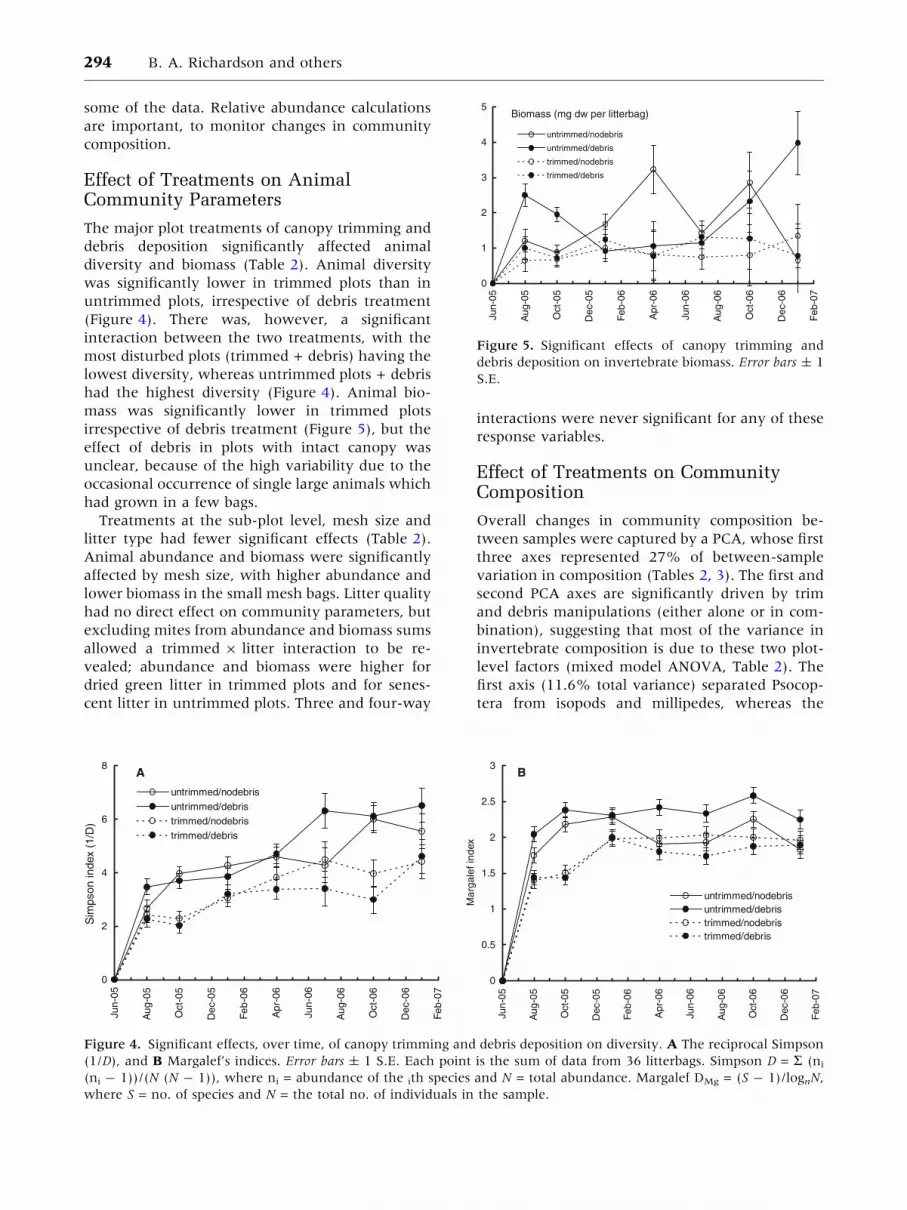
Effect of Treatments on AnimalCommunity Parameters
The major plot treatments of canopy trimming and
debris deposition significantly affected animal
diversity and biomass (Table 2). Animal diversity
was significantly lower in trimmed plots than in
untrimmed plots, irrespective of debris treatment
(Figure 4). There was, however, a significant
interaction between the two treatments, with the
most disturbed plots (trimmed + debris) having the
lowest diversity, whereas untrimmed plots + debris
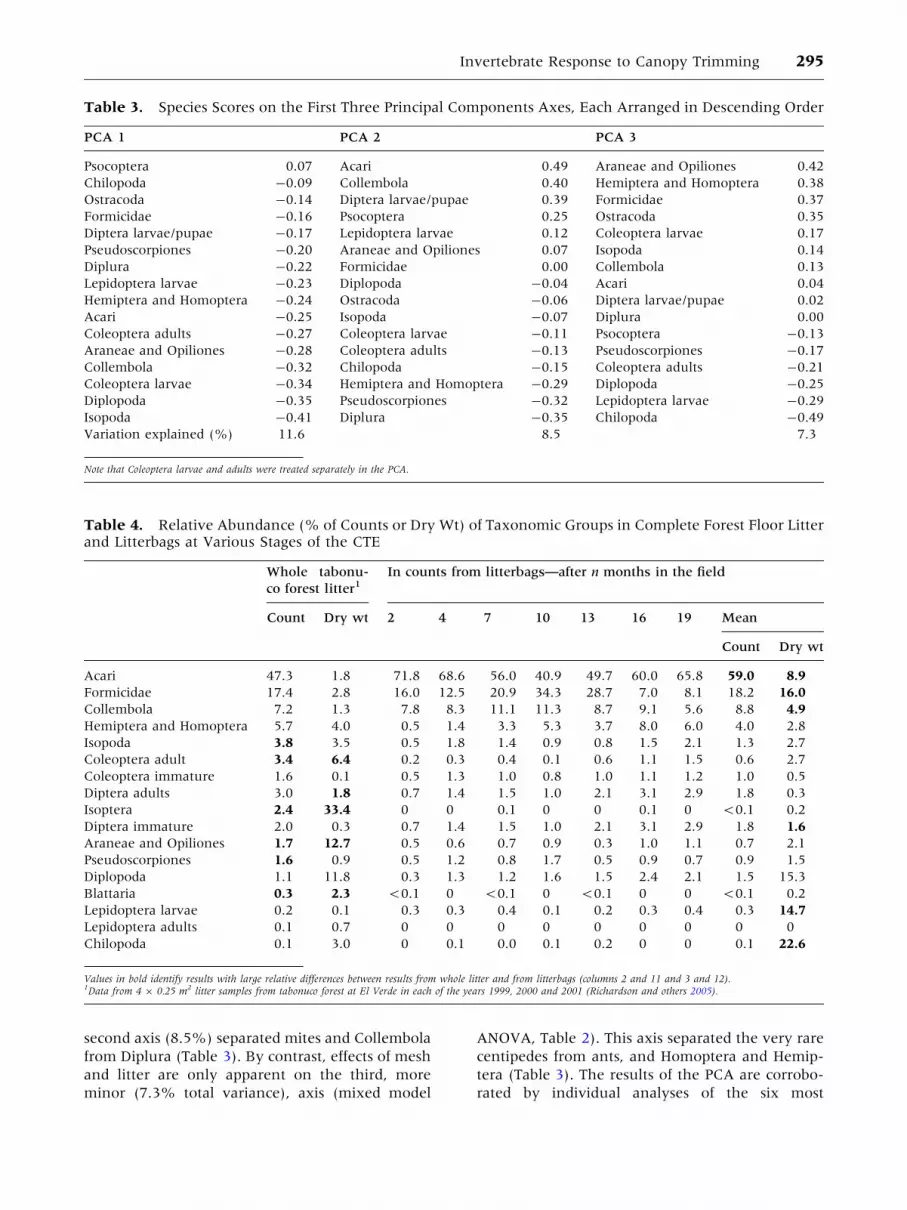
had the highest diversity (Figure 4). Animal bio-
mass was significantly lower in trimmed plots
irrespective of debris treatment (Figure 5), but the
effect of debris in plots with intact canopy was
unclear, because of the high variability due to the
occasional occurrence of single large animals which
had grown in a few bags.
Treatments at the sub-plot level, mesh size and
litter type had fewer significant effects (Table 2).
Animal abundance and biomass were significantly
affected by mesh size, with higher abundance and
lower biomass in the small mesh bags. Litter quality
had no direct effect on community parameters, but
excluding mites from abundance and biomass sums
allowed a trimmed 9 litter interaction to be re-
vealed; abundance and biomass were higher for
dried green litter in trimmed plots and for senes-
cent litter in untrimmed plots. Three and four-way
interactions were never significant for any of these
response variables.
Effect of Treatments on CommunityComposition
Overall changes in community composition be-
tween samples were captured by a PCA, whose first
three axes represented 27% of between-sample
variation in composition (Tables 2, 3). The first and
second PCA axes are significantly driven by trim
and debris manipulations (either alone or in com-
bination), suggesting that most of the variance in
invertebrate composition is due to these two plot-
level factors (mixed model ANOVA, Table 2). The
first axis (11.6% total variance) separated Psocop-
tera from isopods and millipedes, whereas the
0
2
4
6
8
Jun-
05
Aug
-05
Oct
-05
Dec
-05
Feb-
06
Apr
-06
Jun-
06
Aug
-06
Oct
-06
Dec
-06
Feb-
07
Sim
pson
inde
x (1
/D)
untrimmed/nodebrisuntrimmed/debristrimmed/nodebristrimmed/debris
A
0
0.5
1
1.5
2
2.5
3
Jun-
05
Aug
-05
Oct
-05
Dec
-05
Feb
-06
Apr
-06
Jun-
06
Aug
-06
Oct
-06
Dec
-06
Feb
-07
Mar
gale
f ind
ex
untrimmed/nodebrisuntrimmed/debristrimmed/nodebristrimmed/debris
B
Figure 4. Significant effects, over time, of canopy trimming and debris deposition on diversity. A The reciprocal Simpson
(1/D), and B Margalef’s indices. Error bars ± 1 S.E. Each point is the sum of data from 36 litterbags. Simpson D = R (ni
(ni - 1))/(N (N - 1)), where ni = abundance of the ith species and N = total abundance. Margalef DMg = (S - 1)/lognN,
where S = no. of species and N = the total no. of individuals in the sample.
0
1
2
3
4
5
Jun-
05
Aug
-05
Oct
-05
Dec
-05
Feb
-06
Apr
-06
Jun-
06
Aug
-06
Oct
-06
Dec
-06
Feb
-07
untrimmed/nodebris
untrimmed/debris
trimmed/nodebris
trimmed/debris
Biomass (mg dw per litterbag)
Figure 5. Significant effects of canopy trimming and
debris deposition on invertebrate biomass. Error bars ± 1
S.E.
294 B. A. Richardson and others
second axis (8.5%) separated mites and Collembola
from Diplura (Table 3). By contrast, effects of mesh
and litter are only apparent on the third, more
minor (7.3% total variance), axis (mixed model
ANOVA, Table 2). This axis separated the very rare
centipedes from ants, and Homoptera and Hemip-
tera (Table 3). The results of the PCA are corrobo-
rated by individual analyses of the six most
Table 3. Species Scores on the First Three Principal Components Axes, Each Arranged in Descending Order
PCA 1 PCA 2 PCA 3
Psocoptera 0.07 Acari 0.49 Araneae and Opiliones 0.42
Chilopoda -0.09 Collembola 0.40 Hemiptera and Homoptera 0.38
Ostracoda -0.14 Diptera larvae/pupae 0.39 Formicidae 0.37
Formicidae -0.16 Psocoptera 0.25 Ostracoda 0.35
Diptera larvae/pupae -0.17 Lepidoptera larvae 0.12 Coleoptera larvae 0.17
Pseudoscorpiones -0.20 Araneae and Opiliones 0.07 Isopoda 0.14
Diplura -0.22 Formicidae 0.00 Collembola 0.13
Lepidoptera larvae -0.23 Diplopoda -0.04 Acari 0.04
Hemiptera and Homoptera -0.24 Ostracoda -0.06 Diptera larvae/pupae 0.02
Acari -0.25 Isopoda -0.07 Diplura 0.00
Coleoptera adults -0.27 Coleoptera larvae -0.11 Psocoptera -0.13
Araneae and Opiliones -0.28 Coleoptera adults -0.13 Pseudoscorpiones -0.17
Collembola -0.32 Chilopoda -0.15 Coleoptera adults -0.21
Coleoptera larvae -0.34 Hemiptera and Homoptera -0.29 Diplopoda -0.25
Diplopoda -0.35 Pseudoscorpiones -0.32 Lepidoptera larvae -0.29
Isopoda -0.41 Diplura -0.35 Chilopoda -0.49
Variation explained (%) 11.6 8.5 7.3
Note that Coleoptera larvae and adults were treated separately in the PCA.
Table 4. Relative Abundance (% of Counts or Dry Wt) of Taxonomic Groups in Complete Forest Floor Litterand Litterbags at Various Stages of the CTE
Whole tabonu-
co forest litter1In counts from litterbags—after n months in the field
Count Dry wt 2 4 7 10 13 16 19 Mean
Count Dry wt
Acari 47.3 1.8 71.8 68.6 56.0 40.9 49.7 60.0 65.8 59.0 8.9
Formicidae 17.4 2.8 16.0 12.5 20.9 34.3 28.7 7.0 8.1 18.2 16.0
Collembola 7.2 1.3 7.8 8.3 11.1 11.3 8.7 9.1 5.6 8.8 4.9
Hemiptera and Homoptera 5.7 4.0 0.5 1.4 3.3 5.3 3.7 8.0 6.0 4.0 2.8
Isopoda 3.8 3.5 0.5 1.8 1.4 0.9 0.8 1.5 2.1 1.3 2.7
Coleoptera adult 3.4 6.4 0.2 0.3 0.4 0.1 0.6 1.1 1.5 0.6 2.7
Coleoptera immature 1.6 0.1 0.5 1.3 1.0 0.8 1.0 1.1 1.2 1.0 0.5
Diptera adults 3.0 1.8 0.7 1.4 1.5 1.0 2.1 3.1 2.9 1.8 0.3
Isoptera 2.4 33.4 0 0 0.1 0 0 0.1 0 <0.1 0.2
Diptera immature 2.0 0.3 0.7 1.4 1.5 1.0 2.1 3.1 2.9 1.8 1.6
Araneae and Opiliones 1.7 12.7 0.5 0.6 0.7 0.9 0.3 1.0 1.1 0.7 2.1
Pseudoscorpiones 1.6 0.9 0.5 1.2 0.8 1.7 0.5 0.9 0.7 0.9 1.5
Diplopoda 1.1 11.8 0.3 1.3 1.2 1.6 1.5 2.4 2.1 1.5 15.3
Blattaria 0.3 2.3 <0.1 0 <0.1 0 <0.1 0 0 <0.1 0.2
Lepidoptera larvae 0.2 0.1 0.3 0.3 0.4 0.1 0.2 0.3 0.4 0.3 14.7
Lepidoptera adults 0.1 0.7 0 0 0 0 0 0 0 0 0
Chilopoda 0.1 3.0 0 0.1 0.0 0.1 0.2 0 0 0.1 22.6
Values in bold identify results with large relative differences between results from whole litter and from litterbags (columns 2 and 11 and 3 and 12).1Data from 4 9 0.25 m2 litter samples from tabonuco forest at El Verde in each of the years 1999, 2000 and 2001 (Richardson and others 2005).
Invertebrate Response to Canopy Trimming 295
common taxa, which together account for 94% of
all animals recovered during the study. All except
ants showed significant responses to trimming or
debris treatments, either directly or through inter-
actions (Table 2).
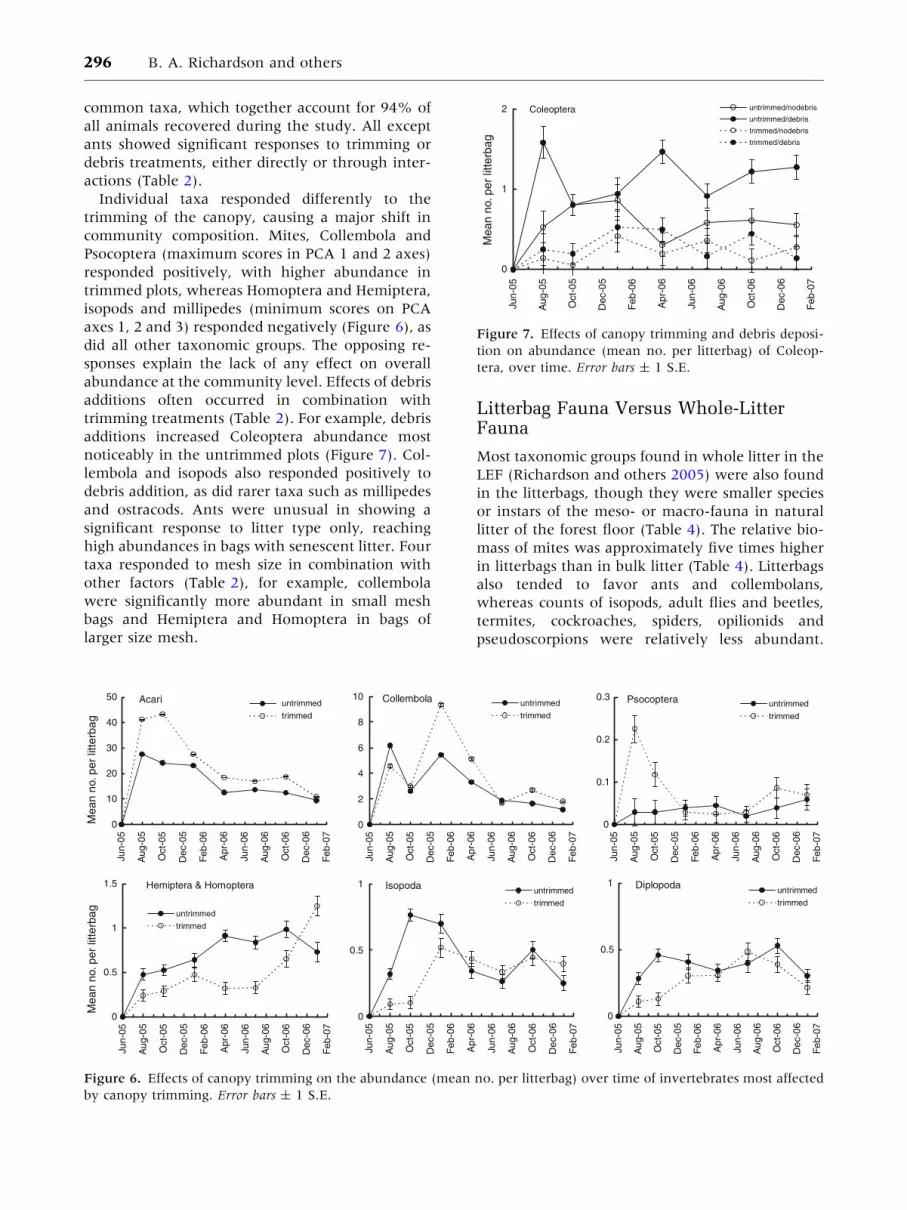
Individual taxa responded differently to the
trimming of the canopy, causing a major shift in
community composition. Mites, Collembola and
Psocoptera (maximum scores in PCA 1 and 2 axes)
responded positively, with higher abundance in
trimmed plots, whereas Homoptera and Hemiptera,
isopods and millipedes (minimum scores on PCA
axes 1, 2 and 3) responded negatively (Figure 6), as
did all other taxonomic groups. The opposing re-
sponses explain the lack of any effect on overall
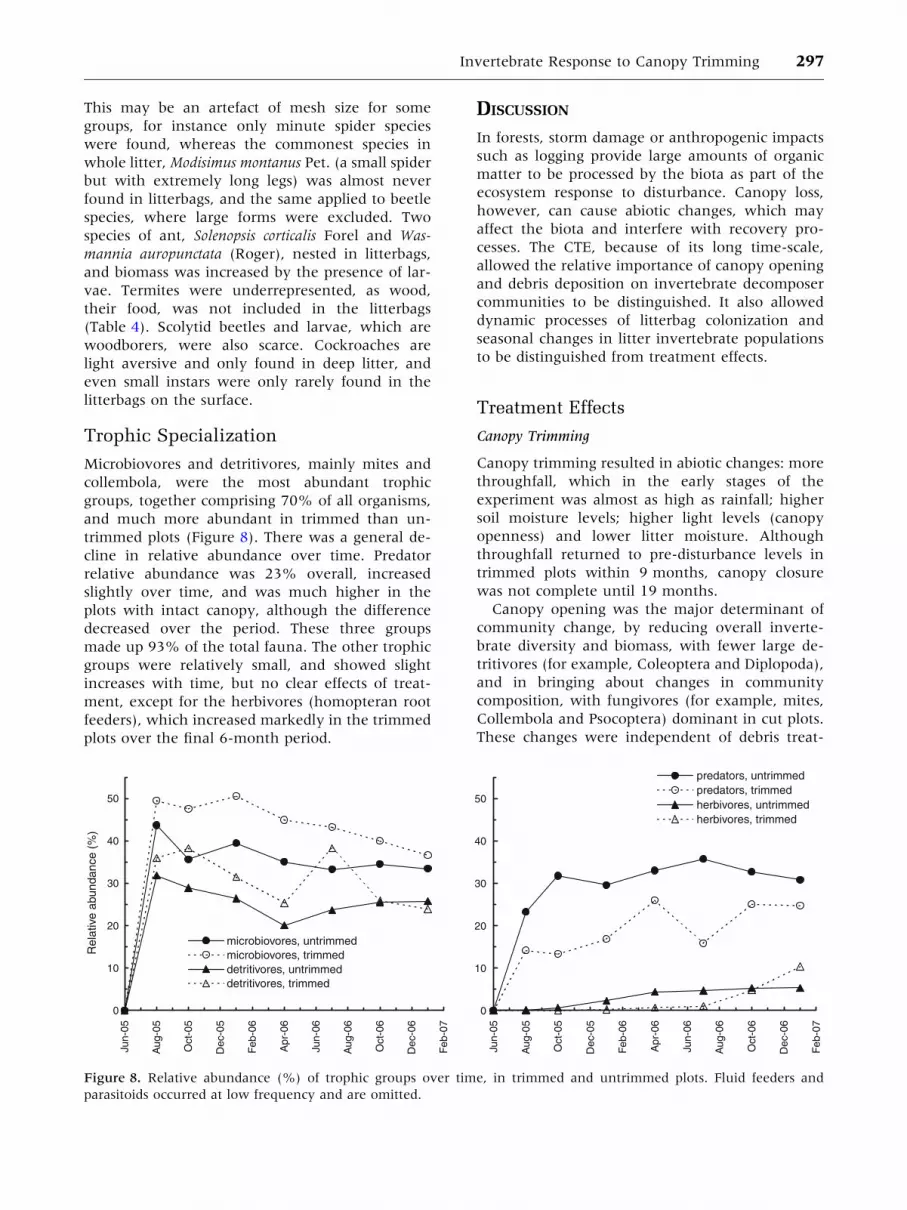
abundance at the community level. Effects of debris
additions often occurred in combination with
trimming treatments (Table 2). For example, debris
additions increased Coleoptera abundance most
noticeably in the untrimmed plots (Figure 7). Col-
lembola and isopods also responded positively to
debris addition, as did rarer taxa such as millipedes
and ostracods. Ants were unusual in showing a
significant response to litter type only, reaching
high abundances in bags with senescent litter. Four
taxa responded to mesh size in combination with
other factors (Table 2), for example, collembola
were significantly more abundant in small mesh
bags and Hemiptera and Homoptera in bags of
larger size mesh.
Litterbag Fauna Versus Whole-LitterFauna
Most taxonomic groups found in whole litter in the
LEF (Richardson and others 2005) were also found
in the litterbags, though they were smaller species
or instars of the meso- or macro-fauna in natural
litter of the forest floor (Table 4). The relative bio-
mass of mites was approximately five times higher
in litterbags than in bulk litter (Table 4). Litterbags
also tended to favor ants and collembolans,
whereas counts of isopods, adult flies and beetles,
termites, cockroaches, spiders, opilionids and
pseudoscorpions were relatively less abundant.
Acari
0
10
20
30
40
50
Jun-
05
Aug
-05
Oct
-05
Dec
-05
Feb
-06
Apr
-06
Jun-
06
Aug
-06
Oct
-06
Dec
-06
Feb
-07
Mea
n no
. per
litte
rbag
untrimmed
trimmed
Collembola
0
2
4
6
8
10
Jun-
05
Aug
-05
Oct
-05
Dec
-05
Feb
-06
Apr
-06
Jun-
06
Aug
-06
Oct
-06
Dec
-06
Feb
-07
untrimmed
trimmed
Psocoptera
0
0.1
0.2
0.3
Jun-
05
Aug
-05
Oct
-05
Dec
-05
Feb
-06
Apr
-06
Jun-
06
Aug
-06
Oct
-06
Dec
-06
Feb
-07
untrimmed
trimmed
Diplopoda
0
0.5
1
Jun-
05
Aug
-05
Oct
-05
Dec
-05
Feb
-06
Apr
-06
Jun-
06
Aug
-06
Oct
-06
Dec
-06
Feb
-07
untrimmed
trimmed
Hemiptera & Homoptera
0
0.5
1
1.5
Jun-
05
Aug
-05
Oct
-05
Dec
-05
Feb
-06
Apr
-06
Jun-
06
Aug
-06
Oct
-06
Dec
-06
Feb
-07
Mea
n no
. per
litte
rbag untrimmed
trimmed
Isopoda
0
0.5
1
Jun-
05
Aug
-05
Oct
-05
Dec
-05
Feb
-06
Apr
-06
Jun-
06
Aug
-06
Oct
-06
Dec
-06
Feb
-07
untrimmed
trimmed
Figure 6. Effects of canopy trimming on the abundance (mean no. per litterbag) over time of invertebrates most affected
by canopy trimming. Error bars ± 1 S.E.
Coleoptera
0
1
2
Jun-
05
Aug
-05
Oct
-05
Dec
-05
Feb
-06
Apr
-06
Jun-
06
Aug
-06
Oct
-06
Dec
-06
Feb
-07
Mea
n no
. per
litte
rbag
untrimmed/nodebris
untrimmed/debris
trimmed/nodebris
trimmed/debris
Figure 7. Effects of canopy trimming and debris deposi-
tion on abundance (mean no. per litterbag) of Coleop-
tera, over time. Error bars ± 1 S.E.
296 B. A. Richardson and others
This may be an artefact of mesh size for some
groups, for instance only minute spider species
were found, whereas the commonest species in
whole litter, Modisimus montanus Pet. (a small spider
but with extremely long legs) was almost never
found in litterbags, and the same applied to beetle
species, where large forms were excluded. Two
species of ant, Solenopsis corticalis Forel and Was-
mannia auropunctata (Roger), nested in litterbags,
and biomass was increased by the presence of lar-
vae. Termites were underrepresented, as wood,
their food, was not included in the litterbags
(Table 4). Scolytid beetles and larvae, which are
woodborers, were also scarce. Cockroaches are
light aversive and only found in deep litter, and
even small instars were only rarely found in the
litterbags on the surface.
Trophic Specialization
Microbiovores and detritivores, mainly mites and
collembola, were the most abundant trophic
groups, together comprising 70% of all organisms,
and much more abundant in trimmed than un-
trimmed plots (Figure 8). There was a general de-
cline in relative abundance over time. Predator
relative abundance was 23% overall, increased
slightly over time, and was much higher in the
plots with intact canopy, although the difference
decreased over the period. These three groups
made up 93% of the total fauna. The other trophic
groups were relatively small, and showed slight
increases with time, but no clear effects of treat-
ment, except for the herbivores (homopteran root
feeders), which increased markedly in the trimmed
plots over the final 6-month period.
DISCUSSION
In forests, storm damage or anthropogenic impacts
such as logging provide large amounts of organic
matter to be processed by the biota as part of the
ecosystem response to disturbance. Canopy loss,
however, can cause abiotic changes, which may
affect the biota and interfere with recovery pro-
cesses. The CTE, because of its long time-scale,
allowed the relative importance of canopy opening
and debris deposition on invertebrate decomposer
communities to be distinguished. It also allowed
dynamic processes of litterbag colonization and
seasonal changes in litter invertebrate populations
to be distinguished from treatment effects.
Treatment Effects
Canopy Trimming
Canopy trimming resulted in abiotic changes: more
throughfall, which in the early stages of the
experiment was almost as high as rainfall; higher
soil moisture levels; higher light levels (canopy
openness) and lower litter moisture. Although
throughfall returned to pre-disturbance levels in
trimmed plots within 9 months, canopy closure
was not complete until 19 months.
Canopy opening was the major determinant of
community change, by reducing overall inverte-
brate diversity and biomass, with fewer large de-
tritivores (for example, Coleoptera and Diplopoda),
and in bringing about changes in community
composition, with fungivores (for example, mites,
Collembola and Psocoptera) dominant in cut plots.
These changes were independent of debris treat-
0
10
20
30
40
50
Jun-
05
Aug
-05
Oct
-05
Dec
-05
Feb
-06
Apr
-06
Jun-
06
Aug
-06
Oct
-06
Dec
-06
Feb
-07
Rel
ativ
e ab
unda
nce
(%)
microbiovores, untrimmedmicrobiovores, trimmeddetritivores, untrimmeddetritivores, trimmed
0
10
20
30
40
50
Jun-
05
Aug
-05
Oct
-05
Dec
-05
Feb
-06
Apr
-06
Jun-
06
Aug
-06
Oct
-06
Dec
-06
Feb
-07
predators, untrimmedpredators, trimmedherbivores, untrimmedherbivores, trimmed
Figure 8. Relative abundance (%) of trophic groups over time, in trimmed and untrimmed plots. Fluid feeders and
parasitoids occurred at low frequency and are omitted.
Invertebrate Response to Canopy Trimming 297
ments, which played a secondary and interactive
role. Litterbags in cut plots had the highest litter-
mass remaining after extraction of the organisms
(GG, unpublished), indicating lower decomposition
rates. The first hypothesis, that canopy trimming
has an adverse effect on litter communities is
confirmed.
Changes in invertebrate communities in trim-
med plots may be explained by three mechanisms:
(a) migration away from adverse conditions, (b)
differential mortality of taxa sensitive to distur-
bance and (c) interactions with fungal groups.
(a) Strong physical gradients, particularly between
soil and litter moisture, may explain the lower
diversity in cut plots. Many litter organisms are
strongly light and drought aversive and move
to deeper layers, for example, small cockroach
nymphs (strongly negatively phototactic) were
almost completely absent from litterbags. It is
likely that light has the strongest effect, as lit-
terbags did not appear to dry out, and Tanner
(1981) found that their litter water content was
higher than that of forest floor litter in a dry
period. As long as there is a gradient, however,
moisture sensitive animals will respond.
(b) Lower diversity in disturbed plots may also be
explained by differential mortality, with many
species sensitive to changes in their natural
habitat, and consequential changes in com-
munity composition. After Hurricane Hugo in
the LEF one species of ant, Wasmannia auro-
punctata (an introduced ‘tramp species’), be-
came the dominant ant species, representing
94% of all ants found 6 months after the hur-
ricane (Perfecto and Camilo, in Garrison and
Willig 1996). Pre-hurricane sampling had
yielded 18 ant species, with two endemics the
most common. Forestry operations have dis-
turbance effects similar to hurricanes (Miller
and Lodge 2007), and total arthropod abun-
dance was lower in intact or salvaged log gaps
and greater in forested controls (Greenberg and
Forrest 2003). Niemela and others (1993)
showed changes in relative abundance with
disturbance, and Turner and Foster (2009)
found reduced biomass and abundance of
mesoarthropods in all compartments of a
Malaysian forest in conversion of primary for-
est to oil palm. Species with a narrow distri-
bution and small local populations are doubly
vulnerable. Collembolan communities had
lower population densities in managed forests
than in semi-natural forests, with a severe de-
crease in species richness of the endemic
component (Cassagne and others 2006). Con-
versely, any species with a high tolerance of
disturbance, such as W. auropunctata, highly
abundant and nesting in litterbags in this
experiment, is at a competitive advantage, and
this ant spreads rapidly after logging operations
(Walsh and others 2004). Disturbance, there-
fore, has major effects in changing food webs.
(c) Many litter organisms are fungivores, usually
specialists feeding on either white rot basidio-
mycetes (Newell 1984) or microfungi that col-
onize litter surfaces (Visser and Whittaker
1977; Schneider and Maraun 2005). Fungal
biomass in litter in the LEF changes rapidly in
response to moisture (Lodge 1996), with long-
er-term declines and large fluctuations thought
to be due to grazing by invertebrates. Different
fungal groups may respond differently to
environmental conditions. We suggest that
changes in some invertebrate populations may
be explained by the changes in fungal com-
munities, found by other researchers in parallel
studies in the same treatments and sub-plots. In
these plots, fungal biomass in litter was similar
between trimmed and untrimmed plots (esti-
mated by fatty acids, Rivera-Figueroa 2008),
but fungal community composition was not.
Trimmed plots with lower litter moisture
had lower basidiomycete white rot activity
(responsible for lignin breakdown), suggesting
a shift to micro-fungi in trimmed plots (Rivera-
Figueroa 2008; DJ Lodge, personal communi-
cation). Trimmed plots had significantly higher
populations of mites, Collembola and Psocop-
tera and these are precisely the taxa known to
have many species that are specialist grazers of
microfungi on litter surfaces. Greater growth of
microfungi, both in litterbags and bulk litter,
could promote increased abundance of these
invertebrate taxa. Holler and Cowley (1970),
also working in the LEF, recorded higher mi-
crofungal populations in plots in which the
canopy had been removed than in control
plots. They suggested that increased exposure
resulted in higher litter temperatures, which in
turn resulted in better growth or sporulation
conditions for these fungi.
Debris Deposition
Addition of debris may have been expected to in-
crease invertebrate density and diversity because of
increased nutrient provision from both green and
woody litter, increased habitat complexity and
physical effects of woody litter (increased humidity
298 B. A. Richardson and others
and shelter). Debris additions interacted signifi-
cantly with canopy trimming. Under a closed can-
opy, diversity, biomass, and abundance of certain
groups, for example, coleoptera, isopods and mil-
lipedes were highest. With trimmed canopy plus
debris (the most disturbed plots) they were at their
lowest. Thus, the second hypothesis is only par-
tially true, and debris stimulates litter communities
only when the abiotic conditions are suitable.
Presumably, in terms of forest recovery after hur-
ricanes, this is when canopy gaps close and there is
deposition of new litterfall. In the CTE there were
unavoidable differences in litter quality among
blocks, because of some herbivory before redistri-
bution, so the experiment did not exactly reflect
hurricane conditions. As wood was the major
component of debris, however, it may be that the
relatively small differences in proportion of leafy
twigs among blocks would not have resulted in
large differences in response. The overwhelming
response of litterbag communities was to canopy
opening, rather than to litter deposition, albeit ra-
ther woody litter. Sayer and others (2006) in Pan-
ama also found that, although litter removal from
the forest floor was associated with lower abun-
dance of mesoarthropods in litterbags, abundance
did not differ significantly between controls and
litter-addition plots. They suggested that this was
due to reduced diffusion of oxygen in the denser
forest floor, increases in the number of predators,
and greater amounts of phytochemicals.
Litterbag Factors
Mesh size and litter type were unimportant in
determining community composition in litterbags,
and differences were significantly driven by plot-
level manipulations, as shown by PCA. Differences
in mesh size only influenced abundance and bio-
mass by excluding larger organisms, and did not
cause changes in taxonomic composition, so
hypothesis 3 is invalid.
Successional stages of colonization showed that
litterbag fauna is at first dominated by mites that,
together with Collembola and Psocoptera, feed on
fungal hyphae, spores and bacteria (Dindal 1990).
Non-fungus feeding mites have cellulases in their
guts derived from symbiotic fungi, and fungivores
have trehalase, enabling them to use trehalose in
fungi (Dindal 1990). Thus mites as a group are
primed for colonization of both the initial air-dried
litter and the early stages of its colonization by
fungi. Their abundance and biomass was consid-
erably higher than previous measurements in bulk
litter in the LEF (Richardson and others 2005) but,
because of their small size, some authors (Franklin
and others 2004; Illig and others 2008) do not
consider them to be directly important in decom-
position processes. Millipedes and isopods occurred
later in the succession and are known to prefer
well-decayed litter (Pfieffer 1996) and, as mites
declined in relative abundance, the diversity of
the larger detritivores and predators increased.
Hemiptera/Homoptera were also abundant towards
the end of observations, but this was mainly due to
ensign coccids (Ortheziidae) feeding on fine roots
permeating the bags, not to organisms feeding on
the litter, particularly in trimmed plots. Although
litterbags were favorable to mites and some species
of ant, which used them as nesting sites, and lacked
wood feeding species, the taxonomic groups
responsible for comminuting leaf litter in the lit-
terbags were similar to those in bulk litter. Litter-
bags can, therefore, provide a useful proxy for
studying litter fauna directly responsible for decay
processes (hypothesis 4), but do not provide the
evidence of litter food-web structure that can be
obtained from bulk sampling.
Litterbag experiments have a limited life span,
because bags deteriorate and nutrient resources
decline. Although there was some convergence of
data, effects of trimming on diversity, biomass and
abundance of some taxa, particularly the coleop-
tera, could still be detected when canopy closure
was complete after 19 months. This suggests that
effects are not merely transient (hypothesis 5) and
there may be long-lasting consequences for food
webs and ecosystem function after canopy damage.
CONCLUSIONS
Litterbags are essential for measuring loss of leaf
litter biomass during the decay process. We dem-
onstrated that they could also be successfully used
to discriminate between animal communities in
different experimental treatments. In this forest,
canopy trimming had major effects in stimulating
populations of specialist micro-fungus feeders,
decreasing the abundance of larger taxa, many of
which are major comminuters of litter, and in
decreasing overall animal diversity and biomass.
Additional disturbance through debris deposition
further decreased diversity and biomass. In the
natural environment, through complex interac-
tions of the invertebrate and fungal biota, hurri-
cane damage may, therefore, delay litter
breakdown and return of nutrients to the ecosys-
tem, at least through the early recovery period. The
expected time of this delay would be dependent on
the severity of canopy damage, which may increase
Invertebrate Response to Canopy Trimming 299
with the predicted rise in frequency and severity of
hurricanes in the Caribbean region.
ACKNOWLEDGEMENTS
This research was supported by Grants DEB-
0218039 and DEB-0620910 from the National
Science Foundation to the Institute for Tropical
Ecosystem Studies (ITES), University of Puerto Rico
(UPR), and the International Institute for Tropical
Forestry USDA Forest Service. These grants support
the Luquillo Long-Term Ecological Research Pro-
gram in Puerto Rico. We thank Elizabeth Reese,
Nicholas Brokaw, Jess Zimmerman and Lıgia Leb-
ron for project management; Marıa M Rivera,
Elizabeth Reese, Samuel Moya, Veronica Cruz,
Carlos Estrada, Carlos Torrens, Elias Iglesias,
Humberto Robles, Christina M Murphy, John Bi-
thorn, Maria Aponte, Samuel Matta, and Lıgia
Lebron for assistance with many aspects of the
fieldwork; Dan L Smith for analysis of canopy
photographs; many student volunteers who helped
with the physically demanding task of canopy col-
lection and redistribution; D Jean Lodge (USDA
Forest Service, NRS) and J Zimmerman (UPR-ITES)
for environmental data, discussion and many
helpful comments on the manuscript; and two
anonymous reviewers for their constructive com-
ments.
REFERENCES
Boose ER, Serrano MI, Foster DR. 2004. Landscape and regional
impacts of hurricanes in Puerto Rico. Ecol Monogr 74:335–52.
Borror DJ, Triplehorn CA, Johnson NF, Eds. 1989. An intro-
duction to the study of insects. 6th edn. Philadelphia, USA:
Saunders College Publishing.
Bradford MA, Tordoff GM, Eggers T, Jones TH, Newington JE.
2002. Microbiota, fauna, and mesh size interactions in litter
decomposition. Oikos 99:317–23.
Brown S, Lugo AE, Silander S, Liegel L. 1983. Research history
and opportunities in the Luquillo experimental forest. New
Orleans: USFS Gen Tech Rep SO-44, Southern Forest Exper-
iment Station.
Cassagne N, Gauquellin T, Bal-Serin C, Gers C. 2006. Endemic
Collembola—privileged bioindicators of forest management.
Pedobiolgia 50:127–34.
Dindal DL, Ed. 1990. Soil biology guide. New York: Wiley.
Fernandez DS, Fetcher N. 1991. Changes in light availability
following Hurricane Hugo in a subtropical montane forest in
Puerto Rico. Biotropica 23:393–9.
Fonte SJ, Schowalter TD. 2004. Decomposition of greenfall vs.
senescent foliage in a tropical forest ecosystem in Puerto Rico.
Biotropica 36:474–82.
Foster DR, Boose ER. 1992. Patterns of forest damage resulting
from catastrophic wind in central New England, USA. J Ecol
80:79–98.
Franklin E, Hayek T, Fagundes EP, Silva LL. 2004. Oribatid mite
(Acari: Oribatida) contribution to decomposition dynamic of
leaf litter in primary forest, second growth, and polyculture in
the Central Amazon. Brazilian J Biol 64:59–72.
Frazer GW, Canham CD. 1999. Gap light analyzer, 2.0. Burnaby,
British Columbia, Canada: Simon Fraser University.
Garcıa-Martino AR, Warner GS, Scatena FN, Civco DL. 1996.
Rainfall, runoff and elevation relationships in the Luquillo
Mountains of Puerto Rico. Caribbean J Sci 32:413–24.
Garrison RW, Willig MR. 1996. Arboreal invertebrates. In:
Reagan DP, Waide RB, Eds. The food web of a tropical rain
forest. Chicago: The University of Chicago Press. p 183–245.
Greenberg CH, Forrest TG. 2003. Seasonal abundance of ground-
occurring macroarthropods in forest and canopy gaps in the
southern Appalachians. Southeast Nat 2:591–608.
Holler JR, Cowley GT. 1970. Response of soil, root, and litter
microfungal populations to radiation. In: Odum HT, Pigeon
RF, Eds. A tropical rain forest. Springfield, Virginia, USA: TID-
24270, Office of Information Services, US Atomic Energy
Commission, NTIS. p F35–9.
Illig J, Schatz H, Scheu S, Maraun M. 2008. Decomposition and
colonization by micro-arthropods of two litter types in a
tropical montane forest in southern Ecuador. J Trop Ecol
24:1–11.
Lawrence WT. 1996. Plants: the food base. In: Reagan DP, Waide
RB, Eds. The food web of a tropical rain forest. Chicago:
University of Chicago Press. p 17–51.
Lin K-C, Hamburg SP, Tang S-L, Hsia Y-J, Lin T-C. 2003.
Typhoon effects on litterfall in a subtropical forest. Can J For
Res 33:2184–92.
Lodge DJ. 1996. Microorganisms. In: Reagan DP, Waide RB, Eds.
The food web of a tropical rain forest. Chicago: University of
Chicago Press. p 53–108.
Lodge DJ, Scatena FN, Asbury CE, Sanchez MJ. 1991. Fine lit-
terfall and related nutrient inputs resulting from Hurricane
Hugo in subtropical wet and lower montane rain forests in
Puerto Rico. Biotropica 23:336–42.
Lugo AE, Scatena FN. 1996. Background and catastrophic tree
mortality in tropical moist, wet, and rainforest. Biotropica
28:585–99.
Magurran AE. 2004. Measuring biological diversity. Oxford, UK:
Blackwell Publishing.
Merritt RW, Cummins KW, Eds. 1984. An introduction to the
aquatic insects of North America. Dubuque, Iowa: Kendall/
Hunt.
Miller RM, Lodge DJ. 2007. Fungal responses to distur-
bance—agriculture and forestry. In: Esser K, Kubicek P,
Druzhinina IS, Eds. The Mycota, Vol. IV: environmental and
microbial relationships. 2nd edn. Berlin: Springer-Verlag. p
44–67.
Newell K. 1984. Interaction between two decomposer basidio-
mycetes and a collembolan under Sitka spruce: grazing and its
potential effects on fungal distribution and litter decomposi-
tion. Soil Biol Biochem 16:235–9.
Niemela J, Langor D, Spence JR. 1993. Effects of clear-trimmed
harvesting on boreal ground beetle assemblages (Coleoptera:
Carabidae) in Western Canada. Conserv Biol 7:551–61.
Odum HT, Pigeon RF, Eds. 1970. A tropical rain forest: a study of
irradiation and ecology at El Verde, Puerto Rico. Springfield,
Virginia, USA: TID-24270, Office of Information Services, US
Atomic Energy Commission, NTIS.
300 B. A. Richardson and others
Ostertag R, Scatena FN, Silver WL. 2003. Forest floor decom-
position following hurricane litter inputs in several Puerto
Rican forests. Ecosystems 6:261–73.
Pfieffer WJ. 1996. Litter invertebrates. In: Reagan DP, Waide RB,
Eds. The food web of a tropical rain forest. Chicago: The
University of Chicago Press. p 137–81.
Reagan DP, Waide RB, Eds. 1996. The food web of a tropical rain
forest. Chicago: The University of Chicago Press.
Richardson BA, Richardson MJ, Scatena FN, McDowell WH.
2000. Effects of nutrient availability and other elevational
changes on bromeliad populations and their invertebrate
communities in a humid tropical forest in Puerto Rico. J Trop
Ecol 16:167–88.
Richardson BA, Richardson MJ, Soto-Adames FN. 2005. Sepa-
rating the effects of forest type and elevation on the diversity
of litter invertebrate communities in a humid tropical forest in
Puerto Rico. J Anim Ecol 74:926–36.
Rivera-Figueroa F. 2008. Efecto De Un Disturbio Natural En El
Perfil De Acidos Grasos De Comunidades Microbianas En El
Bosque Experimental De Luquillo En Puerto Rico. Master’s
Thesis, Universidad Del Turabo, Puerto Rico.
Ruiz N, Lavelle P, Jimenez J. 2008. Soil macrofauna field man-
ual. Rome: FAO.
Rusek J. 1998. Biodiversity of Collembola and their functional
role in the ecosystem. Biodivers Conserv 7:1207–19.
Sanford RL, Parton WJ, Ojima DS, Lodge DJ. 1991. Hurricane
effects on soil organic matter dynamics and forest production
in the Luquillo experimental forest, Puerto Rico: results of
simulation modelling. Biotropica 23:364–72.
Sayer EJ, Tanner EVJ, Lacey AL. 2006. Effects of litter manip-
ulation on early-stage decomposition and meso-arthropod
abundance in a tropical moist forest. Forest Ecol Manag
229:285–93.
Scatena F, Larsen MC. 1991. Physical aspects of Hurricane Hugo
in Puerto Rico. Biotropica 23:317–23.
Scatena F, Moya S, Estrada C, Chinea JD. 1996. The first five
years in the reorganisation of aboveground biomass and
nutrient use following Hurricane Hugo in the Bisley experi-
mental watersheds, Luquillo experimental forest, Puerto Rico.
Biotropica 28:424–40.
Schneider K, Maraun M. 2005. Feeding preferences among dark
pigmented fungal taxa (‘‘Dematiacea’’) indicate limited tro-
phic niche differentiation of oribatid mites (Oribatida, Acari).
Pedobiologia 49:61–7.
Stehr FW, Ed. 1987. Immature insects. Dubuque, Iowa: Kendall/
Hunt.
Stehr FW, Ed. 1991. Immature insects, Vol. 2. Dubuque, Iowa:
Kendall/Hunt.
Tanner EVJ. 1981. The decomposition of leaf litter in Jamaican
montane rain forests. J Ecol 69:263–75.
Turner EC, Foster WA. 2009. The impact of forest conversion to
oil palm on arthropod abundance and biomass in Sabah,
Malaysia. J Trop Ecol 25:23–30.
Van Bloem SJ, Murphy PG, Lugo AE, Ostertag R, Riviera Costa
M, Bernard IR, Molina Colon S, Mora MC. 2005. The influ-
ence of hurricane winds on Caribbean dry forest structure and
nutrient pools. Biotropica 37:571–83.
Visser S, Whittaker JB. 1977. Feeding preferences for certain
litter fungi by Onychiurus subtenuis (Collembola). Oikos
29:320–5.
Walker LR. 1991. Tree damage and recovery from Hurricane
Hugo in Luquillo experimental forest, Puerto Rico. Biotropica
23:379–85.
Walsh PD, Henschel P, Abernethy KA. 2004. Logging speeds
little red fire ant invasion of Africa. Biotropica 36:637–41.
Wigham DF, Olmsted I, Cabrera Cano E, Harmon ME. 1991. The
impact of hurricane Gilbert on trees, litterfall, and woody
debris in a dry tropical forest in the Northeastern Yucatan
Peninsula. Biotropica 23:434–41.
Zalamea M, Gonzalez G. 2008. Leaffall phenology in a sub-
tropical wet forest in Puerto Rico: from species to community
patterns. Biotropica 40:295–304.
Zou X, Zucca CP, Waide RB, McDowell WH. 1995. Long-term
influence of deforestation on tree species composition and
litter dynamics of a tropical rain forest in Puerto Rico. Forest
Ecology and Management 78:147–57.
Invertebrate Response to Canopy Trimming 301


