Embed Size (px)
Citation preview

COMPREHENSIVE ANNUAL FINANCIAL REPORT
County of Burlington
Shamong, New Jersey
SHAMONG TOWNSHIP SCHOOL DISTRICT
FOR THE FISCAL YEAR ENDED JUNE 30, 2017

This page intentionally left blank.

COMPREHENSIVE ANNUAL FINANCIAL REPORT
OF THE
SHAMONG, NEW JERSEY
Finance Department
SHAMONG TOWNSHIP SCHOOL DISTRICT
FOR THE FISCAL YEAR ENDED JUNE 30, 2017
Shamong Township Board of Education
Prepared by


PAGE
Letter of Transmittal 1Organizational Chart 5Roster of Officials 7Consultants and Advisors 9
Independent Auditor's Report 13
REQUIRED SUPPLEMENTARY INFORMATION - PART I
Management's Discussion & Analysis 19
BASIC FINANCIAL STATEMENTS
A. Government-Wide Financial Statements:A-1 Statement of Net Position 31
A-2 Statement of Activities 32
B. Fund Financial Statements:Governmental Funds:
B-1 Balance Sheet 37
B-2 Statement of Revenues, Expenditures & Changes in Fund Balance 38
B-3 Reconciliation of the Statement of Revenues, Expenditures & Changes in Fund 39
Balance of Governmental Funds to the Statement of ActivitiesProprietary Funds:
B-4 Statement of Net Position 43
B-5 Statement of Revenues, Expenditures & Changes in Fund Net Position 44
B-6 Statement of Cash Flows 45Fiduciary Funds:
B-7 Statement of Fiduciary Net Position 49
B-8 Statement of Changes in Fiduciary Net Position 50
Notes to Financial Statements 53
REQUIRED SUPPLEMENTARY INFORMATION - PART II
C. Budgetary Comparison Schedules:
C-1 Budgetary Comparison Schedule - General Fund 91C-1a Combining Schedule of Revenue, Expenditures & Changes in Fund Balance -
Budget & Actual N/A
C-1b Community Development Block Grant N/A
C-2 Budgetary Comparison Schedule - Special Revenue Fund 97
Notes to the Required Supplementary Information:C-3 Budget-to-GAAP Reconciliation 101
(continued)
OUTLINE OF CAFR
INTRODUCTORY SECTION
FINANCIAL SECTION

PAGE
REQUIRED SUPPLEMENTARY INFORMATION - PART III
L. Schedules Related to Accounting and Reporting for Pensions (GASB 68)
L-1 Schedule of the District’s Proportionate Share of the Net Pension Liability – PERS 109
L-2 Schedule of the District Contributions – PERS 110
L-3 State's Proportionate Share of the Net Pension Liability Associated With the District's – TPAF 111
Notes to the Required Supplementary Information - Part III 113
Other Supplementary Information
D. School Based Budget Schedules Fund:
D-1 Combining Balance Sheet N/AD-2 Blended Resource Fund - Schedule of Expenditures Allocated by Resource
Type - Actual N/A
D-3 Blended Resource Fund - Schedule of Blended Expenditures - Budget & Actual N/A
E. Special Revenue Fund:E-1 Combining Schedule of Revenues & Expenditures - Special Revenue Fund -
Budgetary Basis 119
E-2 Preschool Education Aid Schedule(s) of Expenditures - Budgetary Basis N/A
F. Capital Projects Fund:
F-1 Summary Schedule of Project Expenditures 123F-2 Summary Schedule of Revenues, Expenditures and Changes in Fund Balance -
Budgetary Basis 124F-2a Schedule of Revenues, Expenditures, Project Balance & Project Status -
Indian Mills Memorial School & Indian Mills School Renovations, Site Work
& Solar Panel Installation 125F-2b Schedule of Revenues, Expenditures, Project Balance & Project Status -
Indian Mills Memorial School Replacement of Exterior Doors 126F-2c Schedule of Revenues, Expenditures, Project Balance & Project Status -
Indian Mills Memorial School Security Upgrades 127F-2d Schedule of Revenues, Expenditures, Project Balance & Project Status -
Indian Mills School Classroom Air Conditioning 128F-2e Schedule of Revenues, Expenditures, Project Balance & Project Status -
Indian Mills School Security Upgrades 129F-2f Schedule of Revenues, Expenditures, Project Balance & Project Status -
Indian Mills School Window Replacement 130
G. Proprietary Funds:Enterprise Funds:
G-1 Combining Statement of Net Position 135
G-2 Combining Statement of Revenues, Expenses & Changes in Fund Net Position 136
G-3 Combining Statement of Cash Flows 137Internal Service Funds:
G-4 Combining Statement of Net Position N/A
G-5 Combining Statement of Revenues, Expenses & Changes in Fund Net Position N/A
G-6 Combining Statement of Cash Flows N/A
OUTLINE OF CAFR (continued):
(continued)
PAGE
H. Fiduciary Funds:H-1 Combining Statement of Fiduciary Net Position 143
H-2 Combining Statement of Changes in Fiduciary Net Position 144
H-3 Student Activity Agency Fund Schedule of Receipts & Disbursements 145H-4 Payroll Agency Fund Schedule of Receipts & Disbursements 145
I. Long-Term Debt:I-1 Schedule of Serial Bonds 149
I-2 Schedule of Obligations Under Capital Leases 150
I-3 Debt Service Fund Budgetary Comparison Schedule 151
Financial Trends:J-1 Net Position by Component 157
J-2 Changes in Net Position 158J-3 Fund Balances - Governmental Funds 161
J-4 Changes in Fund Balance - Governmental Funds 162Revenue Capacity:
J-5 Other Local Revenue by Source - General Fund 165
J-6 Assessed Value & Estimated Actual Value of Taxable Property 166J-7 Direct & Overlapping Property Tax Rates 167
J-8 Principal Property Taxpayers 168
J-9 Property Tax Levies & Collections 169Debt Capacity:
J-10 Ratios of Outstanding Debt by Type 173
J-11 Ratios of General Bonded Debt Outstanding 174
J-12 Direct & Overlapping Governmental Activities Debt 174
J-13 Legal Debt Margin Information 175Demographic & Economic Information:
J-14 Demographic & Economic Statistics 179
J-15 Principal Employers 179Operating Information:
J-16 Full-Time Equivalent District Employees by Function/Program 183J-17 Operating Statistics 184
J-18 School Building Information 185
J-19 Schedule of Required Maintenance 186
J-20 Insurance Schedule 187
K-1 Independent Auditor's Report on Internal Control Over Financial Reporting and on Complianceand Other Matters Based on an Audit of Financial Statements Performed in Accordancewith Government Auditing Standards 191
K-2 Independent Auditor's Report on Compliance for Each Major Program and on Internal Control
193195196
197199
201
Over Compliance Required by the Uniform Guidance and New Jersey OMB Circular 15-08 K-3 Schedule of Expenditures of Federal Awards, Schedule AK-4 Schedule of Expenditures of State Financial Assistance, Schedule BK-5 Notes to Schedules of Awards and Financial AssistanceK-6 Schedule of Findings & Questioned Costs-Section IK-7 Schedule of Findings & Questioned Costs-Section II & Section IIIK-8 Summary Schedule of Prior Audit Findings 203
SINGLE AUDIT SECTION
OUTLINE OF CAFR (continued):
STATISTICAL SECTION (unaudited)

This page intentionally left blank.
INTRODUCTORY SECTION

This page intentionally left blank.

SHAMONG TOWNSHIP BOARD OF EDUCATION
295 INDIAN MILLS ROAD SHAMONG, NEW JERSEY 08088-9513
Christine Vespe Laura Archer Superintendent School Business Administrator/ Tel. 609-268-0120 Board Secretary Fax. 609-268-1229 Tel. 609-268-0316
Fax. 609-268-1229
November 1, 2017
Honorable President and Members of the Board of Education Shamong Township School District County of Burlington, New Jersey
Dear Board Members/Citizens:
The Comprehensive Annual Financial Report (CAFR) of the Shamong Township School District for the fiscal year ended June 30, 2017, is hereby submitted. Responsibility for both the accuracy of the data and completeness and fairness of the presentation, including all disclosures, rests with the management of the Shamong Township School District. To the best of our knowledge and belief, the data presented in this report is accurate in all material respects and is reported in a manner designed to present fairly, in all material respects, the respective financial position of the governmental activities, the business-type activities, each major fund, and the aggregate remaining fund information of the district as of June 30, 2017, and the respective changes in financial position and cash flows, where applicable, thereof, for the year then ended in conformity with accounting principles generally accepted in the United States of America. All disclosures necessary to enable the reader to gain an understanding of the district’s financial activities have been included.
GAAP requires that management provide a narrative introduction, overview and analysis to accompany the basic financial statements in the form of Management Discussion and Analysis (MD&A). This letter of transmittal is designed to complement the MD&A and should be read in conjunction with it. The MD&A can be found immediately following the report of the independent auditors.
The Comprehensive Annual Financial Report is presented in four sections as follows:
Introductory Section: Section contains a Letter of Transmittal, Roster of Officials, Consultants and Advisors, and an Organizational Chart.
Financial Section: Section contains the Independent Auditors’ Report and includes the Management’s Discussion and Analysis, the Basic Financial Statements, Required Supplementary Information (RSI) and Other Supplementary Information.
1

Statistical Section: Section contains selected financial trends, revenue and debt capacity, demographic, economic and other operating information, generally presented on a multi-year basis.
Single Audit Section: The School District is required to undergo an annual Single Audit in conformity with the provisions of Title 2 U.S. Code of Federal Regulations Part 200, Uniform Administrative Requirements, Cost Principles, and Audit Requirements for Federal Awards (Uniform Guidance) and New Jersey OMB’s Circular 15-08 OMB, “Single Audit Policy for Recipients of Federal Grants, State Grants and State Aid”. Information related to this Single Audit, including the independent auditor’s report on the internal control and compliance with applicable laws, regulations, contracts and grants, along with findings and questioned costs, if any, are included in the Single Audit Section of this report.
REPORTING ENTITY AND ITS SERVICES
The Shamong Township School District is an independent reporting entity within the criteria adopted by the Governmental Accounting Standard Board (GASB) as established by NCGA Statement No. 3. All funds of the School District are included in this report. The School District has no component units.
The School District provides a full range of educational services appropriate to grade levels Pre-K through 8. These include regular education as well as special education for children with special needs. The School District’s enrollment, as of October 15th, for the current and past nine fiscal years are detailed below.
Student PercentFiscal Year Enrollment Change
2016-2017 774 -0.13%2015-2016 775 -3.85%2014-2015 806 -3.36%2013-2014 834 -7.54%2012-2013 902 -0.66%2011-2012 908 -1.20%2010-2011 919 -1.82%2009-2010 936 -0.74%2008-2009 943 0.21%2007-2008 941 0.00%
ECONOMIC CONDITION AND OUTLOOK
Shamong is located within the Pinelands Preservation area and development is highly regulated. The community’s population has declined slightly. The community has not experienced an increase in businesses, therefore, there has been an increase in residential property taxes to support the school system.
Housing development is expected to continue for those areas already designated on the Master Plan. There is a need to attract some business and industry to broaden the tax base and give some relief to the homeowners. Shamong is a stable bedroom community and a desired place to reside. The national economic conditions and state budget cuts have not changed the quality of education in the District.
2

MAJOR INITIATIVES Academic: Major initiatives in the area of instruction included:
1.) The creation and implementation of the middle school Makerspace. We will physically redo the classroom space and set up the room with opportunities for students to practice engineering, coding and various applications of technology.
2.) Adoption and implementation of Journeys Language Arts Program Grades 1-2. Training on the new Thinkcentral platform will continue and students will delve deeper with ELA NJSLS.
3.) Further development in analyzing PARCC, MAPS and STAR data to guide instruction. Instruction will be given to find trends and fill gaps.
4.) NGSS will be fully implemented K-5. Continued professional development will be provided for all science teachers districtwide through in-services and afterschool series.
5.) Google Classroom training will be provided as a teacher tool. Teachers will be given the opportunity to attend afterschool training for district required PD hours.
Community: Each building, elementary and middle, will hold a Parent Academy Night. Through this we will explain the RTI Programs and basic skills role in the classroom and explore the math, sciences and ELA curriculum. Parents will get to see sample “lessons” and gain a better understanding of the school curriculum and state standards. Academic Support Funding: The Shamong Foundation for Educational Excellence was formed early in the 2002-2003 school year. Several mini-grants were awarded to teachers over the past year to support unique educational projects, including but not limited to: Tadpoles & Butterflies, Language Arts Mural, STEM Boxes, Mindfulness and Movement in the Classroom. The Home and School Association continues to fund resources to teachers for items not included in the school budget. Resources were used towards the organization of the Book Fair at each building, funding the After School Homework/Study Club, Incoming 5th Grade Gym Bags, Seneca Scholarship to a Shamong Graduate, etc. Facilities: The district was approved for a total of eight ROD Grants. Construction and close out continued on these projects with all construction completed by July 2017. Increased security for each building in the form of interior door Shelter Shutters were purchased with funds awarded by the district’s insurance carrier. Bottle filling stations were installed at each building in an effort to “Go Green”. INTERNAL ACCOUNTING CONTROLS Management of the School District is responsible for establishing and maintaining an internal control structure designed to ensure that the assets of the district are protected from loss, theft and misuse and to ensure that adequate accounting data are completed to allow for the preparation of financial statement in conformity with general accepted accounting principles (GAAP). The internal control structure is designed to provide reasonable, but not absolute, assurance that these objectives are met. The concept of reasonable assurance recognizes that (1) the cost of a control should not exceed the benefits likely to be delivered; and (2) the valuation of costs and benefits require estimates and judgments by management. As a recipient of federal and state financial assistance, the district also is responsible for ensuring that an adequate internal control structure is in place to ensure compliance with applicable laws and regulations related to those programs. This internal control structure is also subject to periodic evaluations by the district management. As part of the School District’s single audit described earlier, tests are made to determine the adequacy of the internal control structure, including that portion related to federal and state financial assistance programs, as well as to determine that the district has complied with applicable laws and regulations.
3
BUDGETARY CONTROLS
In addition to internal accounting controls, the School District maintains budgetary controls. The objective of these budgetary controls is to ensure compliance with legal provisions embodied in the annual appropriated budget approved by the voters of the municipality. Annual appropriated budgets are adopted for the general fund, the special revenue fund, and the debt service fund. Project-length budgets are approved for the capital improvements accounted for in the capital projects fund. The final budget amount as amended for the fiscal year is reflected in the financial section. An encumbrance accounting system is used to record outstanding purchase commitments on a line item basis. Open encumbrances at year-end are either cancelled or included as re-appropriations of fund balance in the subsequent year.
ACCOUNTING SYSTEM AND REPORTS
The School District's accounting records reflect generally accepted accounting principles, as promulgated by the Governmental Accounting Standards Board (GASB). The School District's accounting system is organized on the basis of funds. The funds are explained in "Notes to Financial Statements", Note 1.
OTHER INFORMATION
INDEPENDENT AUDIT State statutes require an annual audit by independent certified public accountants. The accounting firm of Holman Frenia Allison, P.C., Ce1tified Public Accounts, was appointed by the Board of Education. In addition to meeting the requirements set forth in the State statutes, the audit was also designed to meet the requirements of Title 2 U.S. Code of Federal Regulations (CFR) Pait 200, Uniform Administrative Requirements, Cost Principles, and Audit Requirements for Federal Awards, and New Jersey OMB's Circulm· 15-08, Single Audit Policy for Recipients of Federal Grants, State Grants and State Aid. The auditor's report on the basic financial statements and combining statements and related major fund supp01ting statements and schedules is included in the financial section of this rep01t. The auditor's reports related specifically to the single audit are included in the Single Audit section of this report.
ACKNOWLEDGEMENTS
We would like to express our appreciation to the members of the Board of Education for their concern in providing fiscal accountability to the citizens and taxpayers of the School District and thereby contributing their full support to the development and maintenance of our financial operation. The preparation of this rep01t could not have accomplished without the efficient and dedicated services of our business office staff.
Respectfully submitted,
~sp(~ Superintendent
4

PO
LIC
Y
SH
AM
ON
G T
OW
NS
HIP
BO
AR
D O
F E
DU
CA
TIO
N
A
DM
INIS
TR
AT
ION
1110
/ P
age
1 of
1
O
rgan
izat
iona
l Cha
rt
BO
AR
D O
F E
DU
CA
TIO
N
SU
PE
RIN
TE
ND
EN
T
PR
INC
IPA
LS
DIR
EC
TO
R O
F P
UP
IL S
ER
VIC
ES
B
US
INE
SS
AD
MIN
IST
RA
TO
R /
BO
AR
D S
EC
RE
TA
RY
CH
ILD
ST
UD
Y T
EA
M
SP
EC
IAL
ED
T
EA
CH
ER
S T
EA
CH
ER
SN
UR
SES
CO
UN
SE
LO
RS
OF
FIC
E S
TA
FF
AID
ES
/ A
SSI
ST
AN
TS
PA
YR
OL
L/
BE
NE
FIT
S
PU
RC
HA
SIN
G
AC
CO
UN
TS
PA
YA
BL
E
BU
ILD
ING
S &
GR
OU
ND
S S
UP
ER
VIS
OR
BU
ILD
ING
S &
GR
OU
ND
S A
SSI
ST
AN
T S
UP
ER
VIS
OR
CU
ST
OD
IAN
S
MA
INT
EN
AN
CE
SE
CR
ET
AR
Y T
O
SU
PE
RIN
TE
ND
EN
T
Ado
pted
: 1
1 A
pril
199
5 R
evis
ed:
15
Sep
tem
ber
1998
; 15
May
200
0; 1
6 O
ctob
er 2
001
1
6 S
epte
mbe
r 20
08
5

This page intentionally left blank.
6

MEMBERS OF THE BOARD OF EDUCATION
Melissa Ciliberti, President 2017
Jeffrey Warner, Vice President 2018
Jeffrey Siedlecki, Jr. 2019
Susan Daniels 2017
Michael Tuman 2019
OTHER OFFICIALS
Christine Vespe, Superintendent
Laura Archer, Business Administrator/Board Secretary
Richard Kaz, Treasurer
Frank P. Cavallo, Jr., Solicitor, Parker McCay
JUNE 30, 2017
TERM EXPIRES
SHAMONG TOWNSHIP SCHOOL DISTRICT295 Indian Mills Road
Shamong, New Jersey 08088
ROSTER OF OFFICIALS
7

This page intentionally left blank.
8

ATTORNEY
Holman Frenia Allison, P.C.
Medford, New Jersey 08055
Frank P. Cavallo., Jr.Parker McCay
9000 Midlantic Drive, Suite 300Mt. Laurel, New Jersey 08054
OFFICIAL DEPOSITORY
TD Bank517 Stokes Road
AUDIT FIRM
Kevin P. Frenia, CPA, PSA618 Stokes Road
Medford, New Jersey 08055
SHAMONG TOWNSHIP SCHOOL DISTRICT295 Indian Mills Road
Shamong, New Jersey 08088
CONSULTANTS AND ADVISORS
9

This page intentionally left blank.
10

FINANCIAL SECTION
11

This page intentionally left blank.
12
INDEPENDENT AUDITOR’S REPORT
Honorable President and Members of the Board of Education Shamong Township School District County of Burlington Shamong, New Jersey
Report on the Financial Statements
We have audited the accompanying financial statements of the governmental activities, the business-type activities, each major fund and the aggregate remaining fund information of the Shamong Township School District, County of Burlington, State of New Jersey, as of and for the fiscal year ended June 30, 2017, and the related notes to the financial statements, which collectively comprise the School District’s basic financial statements as listed in the table of contents.
Management’s Responsibility for the Financial Statements
Management is responsible for the preparation and fair presentation of these financial statements in accordance with accounting principles generally accepted in the United States of America; this includes the design, implementation, and maintenance of internal control relevant to the preparation and fair presentation of financial statements that are free from material misstatement, whether due to fraud or error.
Auditor’s Responsibility
Our responsibility is to express opinions on these financial statements based on our audit. We conducted our audit in accordance with auditing standards generally accepted in the United States of America; the standards applicable to financial audits contained in Governmental Auditing Standards, issued by the Comptroller General of the United States; and audit requirements as prescribed by the, Office of School Finance, Department of Education, State of New Jersey. Those standards require that we plan and perform the audit to obtain reasonable assurance about whether the financial statements are free from material misstatement.
An audit involves performing procedures to obtain audit evidence about the amounts and disclosures in the financial statements. The procedures selected depend on the auditor’s judgment, including the assessment of the risks of material misstatement of the financial statements, whether due to fraud or error. In making those risk assessments, the auditor considers internal control relevant to the District’s preparation and fair presentation of the financial statements in order to design audit procedures that are appropriate in the circumstances, but not for the purpose of expressing an opinion on the effectiveness of the District’s internal control. Accordingly, we express no such opinion. An audit also includes evaluating the appropriateness of accounting policies used and the reasonableness of significant accounting estimates made by management, as well as evaluating the overall presentation of the financial statements.
13

We believe that the audit evidence we have obtained is sufficient and appropriate to provide a basis for our audit opinions. Opinions In our opinion, the financial statements referred to above present fairly, in all material respects, the respective financial position of the governmental activities, the business-type activities, each major fund and the aggregate remaining fund information of the Shamong Township School District, County of Burlington, State of New Jersey, as of June 30, 2017, and the respective changes in financial position and, where applicable, cash flows thereof for the year then ended in accordance with accounting principles generally accepted in the United States of America. Other Matters Required Supplementary Information Accounting principles generally accepted in the United States of America require that the management’s discussion and analysis, budgetary comparison information, and the schedules related to accounting and reporting for pensions, as listed in the table of contents be presented to supplement the basic financial statements. Such information, although not a part of the basic financial statements, is required by the Governmental Accounting Standards Board who considers it to be an essential part of financial reporting for placing the basic financial statements in an appropriate operational, economic, or historical context. We have applied certain limited procedures to the required supplementary information in accordance with auditing standards generally accepted in the United States of America, which consisted of inquiries of management about the methods of preparing the information and comparing the information for consistency with management’s responses to our inquiries, the basic financial statements, and other knowledge we obtained during our audit of the basic financial statements. We do not express an opinion or provide any assurance on the information because the limited procedures do not provide us with sufficient evidence to express an opinion or provide any assurance. Other Information Our audit was conducted for the purpose of forming opinions on the financial statements that collectively comprise the Shamong Township School District’s basic financial statements. The introductory section, combining statements and related major fund supporting statements and schedules, statistical section and schedule of expenditures of federal awards are presented for purposes of additional analysis, as required by the Division of Administration and Finance, Department of Education, State of New Jersey, and are not a required part of the basic financial statements. The accompanying schedule of expenditures of state financial assistance, as required by New Jersey OMB’s Circular 15-08, Single Audit Policy for Recipients of Federal Grants, State Grants and State Aid, is also presented for purposes of additional analysis and is not a required part of the basic financial statements. The accompanying combining statements and related major fund supporting statements and schedules, and the schedules of expenditures of federal awards and state financial assistance are the responsibility of management and were derived from and relate directly to the underlying accounting and other records used to prepare the basic financial statements. Such information has been subjected to the auditing procedures applied in the audit of the basic financial statements and certain additional procedures, including comparing and reconciling such information directly to the underlying accounting other records used to prepare the basic financial statements or to the basic financial statements themselves, and other additional procedures in accordance with auditing standards generally accepted in the United States of
14

America. In our opinion, the accompanying combining statements and related major fund supporting statements and schedules and schedules of expenditures of federal awards and state financial assistance are fairly stated, in all material respects, in relation to the basic financial statements as a whole.
The introductory section and statistical section listed in the table of contents have not been subjected to the auditing procedures applied in the audit of the basic financial statements and, accordingly, we do not express an opinion or provide any assurance on them.
Other Reporting Required by Government Auditing Standards
In accordance with Government Auditing Standards, we have also issued our report dated November 1, 2017 on our consideration of the School District’s internal control over financial reporting and on our tests of its compliance with certain provisions of laws, regulations, contracts, and grant agreements and other matters. The purpose of that report is to describe the scope of our testing of internal control over financial reporting and compliance and the results of that testing, and not to provide an opinion on internal control over financial reporting or on compliance. That report is an integral part of an audit performed in accordance with Government Auditing Standards in considering the School District’s internal control over financial reporting and compliance.
Respectfully Submitted,
HOLMAN FRENIA ALLISON, P.C.
Kevin Frenia Certified Public Accountant Public School Accountant, No. 1011
Medford, New Jersey November 1, 2017
15

This page intentionally left blank.
16

REQUIRED SUPPLEMENTARY INFORMATION - PART I
Management's Discussion and Analysis
17

This page intentionally left blank.
18

SHAMONG TOWNSHIIP SCHOOL DISTRICT Management’s Discussion and Analysis
For the Fiscal Year Ended June 30, 2017 (Unaudited)
As management of the Shamong Township School District, New Jersey (School District), we offer readers of the School District’s financial statements this narrative overview and analysis of the School District for the fiscal year ended June 30, 2017. We encourage readers to consider the information presented in conjunction with additional information that we have furnished in our letter of transmittal, which can be found in the introductory section of this report. Overview of the Basic Financial Statements This discussion and analysis is intended to serve as an introduction to the School District’s basic financial statements. Comparison to the prior year’s activity is provided in this document. The basic financial statements are comprised of three components:
1) Government-Wide financial statements, 2) Fund financial statements, and 3) Notes to the basic financial statements. This report also contains other supplementary information in addition to the basic financial statements themselves.
Government-Wide Financial Statements
The government-wide financial statements are designed to provide the reader with a broad overview of the financial activities in a manner similar to a private-sector business. The government-wide financial statements include the statement of net position and the statement of net activities. The statement of net position presents information about all of the School District’s assets and liabilities. The difference between the assets plus deferred outflows or resources and liabilities plus deferred inflows of resources is reported as net position. Over time, changes in net position may serve as a useful indicator of whether the financial position of the School District is improving or deteriorating. The statement of activities presents information showing how the net position of the School District changed during the current fiscal year. Changes in net position are recorded in the statement of activities when the underlying event occurs, regardless of the timing of related cash flows. Thus, revenues and expenditures are reported in this statement even though the resulting cash flows may be recorded in a future period. Both of the government-wide financial statements distinguish functions of the School District that are supported from taxes and intergovernmental revenues (governmental activities) and other functions that are intended to recover most of their costs from user fees and charges (business-type activities). Governmental activities consolidate governmental funds including the General Fund, Special Revenue Fund, Capital Projects Fund, and Debt Service Fund. Business-type activities reflect the Food Service Fund. Fund Financial Statements Fund financial statements are designed to demonstrate compliance with financial-related requirements. A fund is a grouping of related accounts that is used to maintain control over resources that have been segregated for specific objectives. All of the funds of the School District are divided into three categories: governmental funds, proprietary funds and fiduciary funds. Governmental funds account for essentially the same information reported in the governmental activities of the government-wide financial statements. However, unlike the government-wide financial statements,
19

SHAMONG TOWNSHIP SCHOOL DISTRICT Management’s Discussion and Analysis
For the Fiscal Year Ended June 30, 2017 (Unaudited) (Continued)
Overview of the Basic Financial Statements (continued) Fund Financial Statements (continued) the governmental fund financial statements focus on near-term financial resources and fund balances. Such information may be useful in evaluating the financial requirements in the near term. Since the governmental funds and the governmental activities report information using the same functions, it is useful to compare the information presented. Because the focus of each report differs, a reconciliation is provided on the fund financial statements to assist the reader in comparing the near-term requirements with the long-term needs. The School District maintains four individual governmental funds. The major funds are the General Fund, the Special Revenue Fund, the Capital Projects Fund, and the Debt Service Fund. They are presented separately in the fund financial statements. The School District adopts an annual appropriated budget for the General Fund, Special Revenue Fund and the Debt Service Fund. A budgetary comparison statement has been provided for each of these funds to demonstrate compliance with budgetary requirements. Proprietary funds are used to present the same functions as the business-type activities presented in the government-wide financial statements. The School District maintains one type of proprietary fund – the Enterprise Fund. The fund financial statements of the enterprise fund provides the same information as the government-wide financial statements, only in more detail. The School District’s one enterprise fund (Food Service Fund) is listed individually and is considered to be a major fund. Fiduciary funds are used to account for resources held for the benefit of parties outside the government. Fiduciary funds are not reflected in the government-wide financial statements because the resources of those funds are not available to support the School District’s programs. Notes to the Basic Financial Statements The notes to the basic financial statements provide additional information that is essential to a full understanding of the data provided in the basic financial statements.
20

SHAMONG TOWNSHIP SCHOOL DISTRICT Management’s Discussion and Analysis
For the Fiscal Year Ended June 30, 2017 (Unaudited) (Continued)
Financial Analysis of the School District as a Whole Table 1 provides a summary of the School Districts net position for the fiscal years 2017 compared to fiscal year 2016.
June 30, June 30, Increase/ Percentage
2017 2016 (Decrease) Change
Current & Other Assets 3,511,290$ 3,281,541$ 229,749$ 7.0%Capital Assets, Net 11,662,173 12,203,911 (541,738) -4.4% Total Assets 15,173,463 15,485,452 (311,989) -2.0%
Deferred Outflow of Resources 1,763,159 928,472 834,687 89.9%
Current and other Liabilities 34,449 42,626 (8,177) -19.2%Noncurrent Liabilities 8,879,408 8,843,400 36,008 0.4% Total Liabilities 8,913,857 8,886,026 27,831 0.3%
Deferred Inflow of Resources 234,334 75,568 158,766 210.1%
Net Position:Net Investment in Capital Assets 8,842,449 8,350,371 492,078 5.9%Restricted 3,427,961 3,334,897 93,064 2.8%Unrestricted (Deficit) (4,481,979) (4,232,938) (249,041) 5.9%
Total Net Position 7,788,431$ 7,452,330$ 336,101$ 4.5%
Summary of Net PositionTable 1
21

SHAMONG TOWNSHIP SCHOOL DISTRICT Management’s Discussion and Analysis
For the Fiscal Year Ended June 30, 2017 (Unaudited) (Continued)
Financial Analysis of the School District as a Whole (continued) Table 2 shows the changes in net position for fiscal year 2017 compared to fiscal year 2016.
Governmental Activities During the fiscal year 2017, the net position of governmental activities increased by $327,628 or 4.42%. The primary reason for the increase was savings in unallocated benefits due to negotiated change in health benefits from minimum $10 co-pay to $15 co-pay.
June 30, June 30, Increase/ Percentage
2017 2016 (Decrease) Change
Revenues:Program Revenues:
Charges for Services 178,458$ 181,502$ (3,044)$ -1.7%Operating Grants & Contributions 1,919,033 3,567,782 (1,648,749) -46.2%
General Revenues:Property Taxes 9,541,312 9,285,085 256,227 2.8%Federal & State Aid 4,353,408 4,725,906 (372,498) -7.9%Other General Revenues 291,504 405,535 (114,031) -28.1%
Total Revenues 16,283,715 18,165,810 (1,882,095) -10.4%
Function/Program Expenses:Regular Instruction 3,906,222 3,788,879 117,343 3.1%Special Education Instruction 1,615,844 1,610,721 5,123 0.3%Other Instruction 349,272 406,385 (57,113) -14.1%Tuition 96,554 154,465 (57,911) -37.5%Health Services 127,016 118,586 8,430 7.1%Student & Instruction Related Services 972,816 912,981 59,835 6.6%Educational Media Services 238,756 240,487 (1,731) -0.7%General Administrative 371,840 371,097 743 0.2%School Administrative Services 459,899 480,375 (20,476) -4.3%Central Services 315,949 312,124 3,825 1.2%Plant Operations & Maintenance 1,190,428 1,124,396 66,032 5.9%Pupil Transportation 652,106 640,139 11,967 1.9%Unallocated Benefits 2,971,286 4,422,076 (1,450,790) -32.8%On Behalf TPAF Pension and Social
Security Contributions 1,569,569 1,411,685 157,884 11.2%Interest & Other Charges 121,523 133,714 (12,191) -9.1%Unallocated Loss on Disposal of Assets 8,800 56,479 (47,679) -84.4%Unallocated Depreciation 733,734 730,202 3,532 0.5%Food Service 246,000 258,791 (12,791) -4.9%
Total Expenses 15,947,614 17,173,582 (1,225,968) -7.1%
Change In Net Position 336,101 992,228 (656,127) -66.1%Net Position - Beginning 7,452,330 6,460,102 992,228 15.4%Net Position - Ending 7,788,431$ 7,452,330$ 336,101$ 4.5%
Table 2Summary of Changes in Net Position
22

SHAMONG TOWNSHIP SCHOOL DISTRICT Management’s Discussion and Analysis
For the Fiscal Year Ended June 30, 2017 (Unaudited) (Continued)
Governmental Activities (continued) The assets and deferred outflows of the primary government activities exceeded liabilities and deferred inflows by $7,739,186, with an unrestricted deficit balance of $(4,512,058). The deficit in unrestricted net position is primarily due to accounting treatment for compensated absences payable, GASB 68 net pension liability, and the last 2 state aid payments. In addition, state statutes prohibit school districts from maintaining more than 2% of its adopted budget as unassigned fund balance. The School District’s governmental activities unrestricted net positon had GASB 68 pension not been implemented would have been as follows:
Business-type Activities
During the fiscal year 2017, the net position of business-type activities increased by $8,473 or 20.78%. The assets and deferred outflows of the business-type activities exceeded liabilities and deferred inflows by $49,245. General Fund Budgeting Highlights Final budgeted revenues was $13,298,894, which was equal to the original budget. Excluding nonbudgeted revenues, the School District’s actual revenues exceeded budgeted revenues by $223,838. Final budgeted appropriations was $14,165,071, which was an increase of $51.826 from the original budget. The increase is primarily due to prior year reserve for encumbrances, which increase the budget appropriations in the subsequent fiscal year’s budget. Excluding nonbudgeted revenues, the School District’s budget appropriations exceeded actual expenditures by $1,221,193. The School District’s general fund balance – budgetary basis (Exhibit C-1) was $3,554,724 at June 30, 2017, an increase of $458,854 from the prior year. Governmental Funds At the end of the current fiscal year, the School District’s governmental funds reported a combined ending fund balance of $3,466,831, an increase of $220,049 from the prior year.
Unrestricted Net Position (With GASB 68) (4,481,979)$
Add back: PERS Pension Liability 5,775,200 Less: Deferred Outflows related to pensions (1,754,385) Add back: Deferred Inflows related to pensions 234,334
Unrestricted Net Position (Without GASB 68) (226,830)$
Table 3GASB 68 Effect on Unrestricted Net Position
23

SHAMONG TOWNSHIP SCHOOL DISTRICT Management’s Discussion and Analysis
For the Fiscal Year Ended June 30, 2017 (Unaudited) (Continued)
Governmental Funds (continued) General fund - During the current fiscal year, the fund balance of the School District’s general fund increased by $458,112. The primary factor(s) affecting the change in fund balance of the general fund is as follows:
Unexpended balance of unallocated benefits due to negotiated contract Additional revenue from audited 15-16 private school tuition Unexpended balance tuition CSSD Special Education
Special revenue fund – There was no change in the fund balance for the special revenue fund. Capital projects fund - During the current fiscal year, the fund balance of the School District’s capital projects fund decreased by $238,063. The primary factor(s) affecting the change in fund balance of the capital projects fund is as follows:
Continuation and completion of SDA projects Debt service fund – There was no change in the fund balance of the debt service. Proprietary Funds Food service fund - During the current fiscal year, the net position of the School District’s food service fund increased by $8,473. The primary factor(s) affecting the change in net position of the food service fund is as follows:
Increase in sales Decrease in expenditures due to reduction in staff
Capital Assets The School District’s capital assets for its governmental and business-type activities as of June 30, 2017, totaled $11,643,007 (net of accumulated depreciation). This investment in capital assets includes land, land improvements, buildings and improvements and equipment. There was a net increase in the School District’s investment in capital assets for the current fiscal year in the amount of $536,917. This increase is primarily due to the current year acquirement of capital assets. Table 4 shows fiscal 2017 balances compared to 2016.
June 30, June 30, Increase/ Percentage
Capital Assest (Net of Depreciation): 2017 2016 (Decrease) Change
Land 1,068,766$ 1,068,766$ -$ 0.0%Construction in Progress 1,408,757 1,261,985 146,772 11.6%Building and Improvements 8,843,857 9,499,393 (655,536) -6.9%Equipment 321,627 349,780 (28,153) -8.0%
11,643,007$ 12,179,924$ (536,917)$ -4.4%
Table 4Summary of Capital Assets
24

SHAMONG TOWNSHIP SCHOOL DISTRICT Management’s Discussion and Analysis
For the Fiscal Year Ended June 30, 2017 (Unaudited) (Continued)
Capital Assets (continued) Depreciation expense for the year was $733,734. Additional information on the School District’s capital assets can be found in the notes to the basic financial statements (Note 5) of this report. Debt Administration Long-term debt – At the end of the current fiscal year, the School District had total bonded debt outstanding of $2,054,000, which is a decrease of $760,000 from the prior year. Additional information on the School District’s long-term obligations can be found in the notes to the basic financial statements (Note 7) of this report. Factors on the School District’s Future It is the opinion of the Superintendent and School Business Administrator that the Shamong Township Board of Education is presently in good financial condition. The School District is proud of its community support, the support of the Home & School Association and the Shamong Foundation for Educational Excellence. Shamong Township is primarily a rural, residential community with very few commercial ratables; thus it becomes the responsibility of homeowners to contribute the majority of the tax burden. The increase in the School District’s operating budget mostly due to contractual salaries and capital improvements and the lack of adequate state funding and federal revenues will inevitably result in increased property taxes.
In conclusion, the Shamong Township Board of Education has committed itself to financial excellence for many years. The School District’s system for financial planning, budgeting and internal financial controls are well regarded. The School District plans to continue its sound fiscal management to meet the challenges of the future.
Contacting the School Districts Financial Management
This financial report is designed to provide a general overview of the School District’s finances for all those with an interest in the School District. Questions concerning any of the information provided in this report or requests for additional financial information should be addressed to Mrs. Laura Archer, School Business Administrator/Board Secretary, at the Shamong Board of Education, 295 Indian Mills Road, Shamong, New Jersey 08088.
25

This page intentionally left blank.
26

BASIC FINANCIAL STATEMENTS
27

This page intentionally left blank.
28

A. Government-Wide Financial Statements
29

This page intentionally left blank.
30
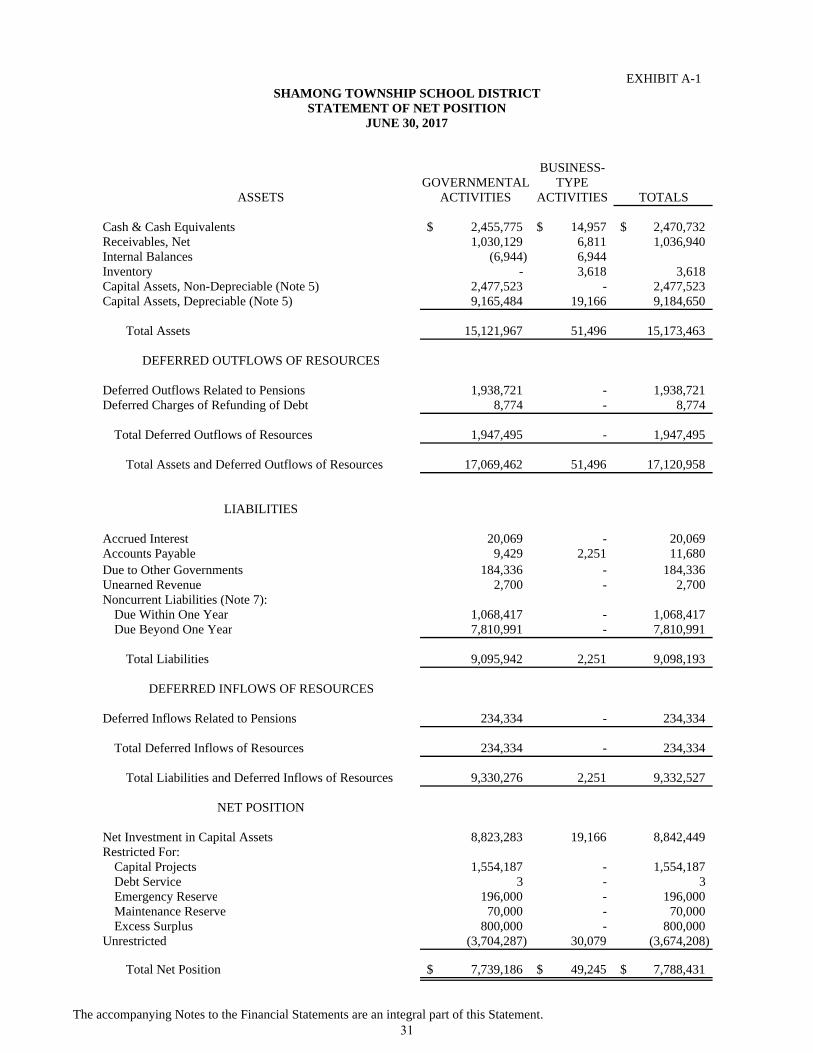
EXHIBIT A-1
BUSINESS-GOVERNMENTAL TYPE
ACTIVITIES ACTIVITIES TOTALS
Cash & Cash Equivalents 2,455,775$ 14,957$ 2,470,732$ Receivables, Net 1,030,129 6,811 1,036,940 Internal Balances (6,944) 6,944 Inventory - 3,618 3,618 Capital Assets, Non-Depreciable (Note 5) 2,477,523 - 2,477,523 Capital Assets, Depreciable (Note 5) 9,165,484 19,166 9,184,650
Total Assets 15,121,967 51,496 15,173,463
Deferred Outflows Related to Pensions 1,938,721 - 1,938,721 Deferred Charges of Refunding of Debt 8,774 - 8,774
Total Deferred Outflows of Resources 1,947,495 - 1,947,495
Total Assets and Deferred Outflows of Resources 17,069,462 51,496 17,120,958
Accrued Interest 20,069 - 20,069 Accounts Payable 9,429 2,251 11,680 Due to Other Governments 184,336 - 184,336 Unearned Revenue 2,700 - 2,700 Noncurrent Liabilities (Note 7):
Due Within One Year 1,068,417 - 1,068,417 Due Beyond One Year 7,810,991 - 7,810,991
Total Liabilities 9,095,942 2,251 9,098,193
Deferred Inflows Related to Pensions 234,334 - 234,334
Total Deferred Inflows of Resources 234,334 - 234,334
Total Liabilities and Deferred Inflows of Resources 9,330,276 2,251 9,332,527
Net Investment in Capital Assets 8,823,283 19,166 8,842,449 Restricted For:
Capital Projects 1,554,187 - 1,554,187 Debt Service 3 - 3 Emergency Reserve 196,000 - 196,000 Maintenance Reserve 70,000 - 70,000 Excess Surplus 800,000 - 800,000
Unrestricted (3,704,287) 30,079 (3,674,208)
Total Net Position 7,739,186$ 49,245$ 7,788,431$
LIABILITIES
SHAMONG TOWNSHIP SCHOOL DISTRICTSTATEMENT OF NET POSITION
JUNE 30, 2017
NET POSITION
ASSETS
DEFERRED OUTFLOWS OF RESOURCES
DEFERRED INFLOWS OF RESOURCES
The accompanying Notes to the Financial Statements are an integral part of this Statement. 31
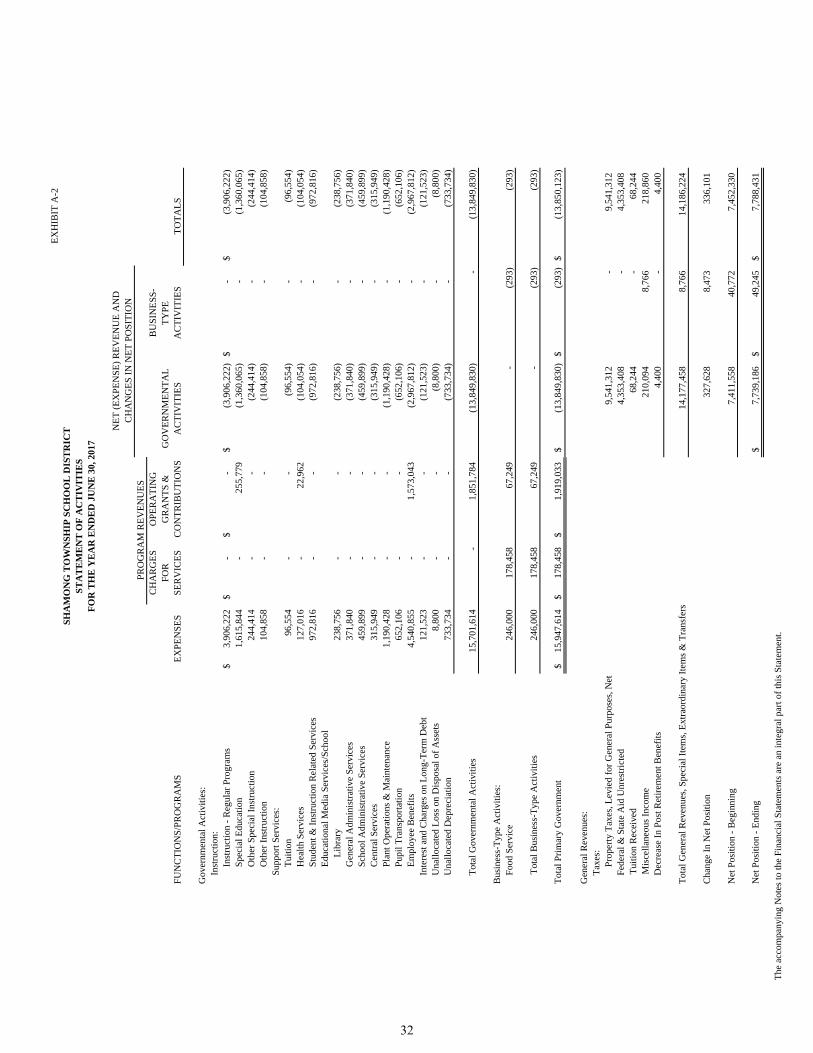
EX
HIB
IT A
-2
CH
AR
GE
SO
PE
RA
TIN
GB
US
INE
SS
-F
OR
GR
AN
TS
&G
OV
ER
NM
EN
TA
LT
YP
EF
UN
CT
ION
S/P
RO
GR
AM
SE
XP
EN
SE
SS
ER
VIC
ES
CO
NT
RIB
UT
ION
SA
CT
IVIT
IES
AC
TIV
ITIE
ST
OT
AL
S
Gov
ernm
enta
l Act
ivit
ies:
Inst
ruct
ion:
Inst
ruct
ion
- R
egul
ar P
rogr
ams
3,90
6,22
2$
-$
-
$
(3
,906
,222
)$
-$
(3,9
06,2
22)
$
S
peci
al E
duca
tion
1,61
5,84
4
-
25
5,77
9
(1,3
60,0
65)
-
(1
,360
,065
)
Oth
er S
peci
al I
nstr
ucti
on24
4,41
4
-
-
(244
,414
)
-
(2
44,4
14)
Oth
er I
nstr
ucti
on10
4,85
8
-
-
(104
,858
)
-
(1
04,8
58)
Sup
port
Ser
vice
s:T
uiti
on96
,554
-
-
(96,
554)
-
(96,
554)
H
ealt
h S
ervi
ces
127,
016
-
22
,962
(1
04,0
54)
-
(104
,054
)
S
tude
nt &
Ins
truc
tion
Rel
ated
Ser
vice
s97
2,81
6
-
-
(972
,816
)
-
(9
72,8
16)
Edu
cati
onal
Med
ia S
ervi
ces/
Sch
ool
L
ibra
ry23
8,75
6
-
-
(238
,756
)
-
(2
38,7
56)
Gen
eral
Adm
inis
trat
ive
Ser
vice
s37
1,84
0
-
-
(371
,840
)
-
(3
71,8
40)
Sch
ool A
dmin
istr
ativ
e S
ervi
ces
459,
899
-
-
(4
59,8
99)
-
(459
,899
)
C
entr
al S
ervi
ces
315,
949
-
-
(3
15,9
49)
-
(315
,949
)
P
lant
Ope
rati
ons
& M
aint
enan
ce1,
190,
428
-
-
(1,1
90,4
28)
-
(1
,190
,428
)
Pup
il T
rans
port
atio
n65
2,10
6
-
-
(652
,106
)
-
(6
52,1
06)
Em
ploy
ee B
enef
its
4,54
0,85
5
-
1,
573,
043
(2,9
67,8
12)
-
(2
,967
,812
)
Inte
rest
and
Cha
rges
on
Lon
g-T
erm
Deb
t12
1,52
3
-
-
(121
,523
)
-
(1
21,5
23)
Una
lloc
ated
Los
s on
Dis
posa
l of
Ass
ets
8,80
0
-
-
(8,8
00)
-
(8
,800
)
Una
lloc
ated
Dep
reci
atio
n73
3,73
4
-
-
(733
,734
)
-
(7
33,7
34)
Tot
al G
over
nmen
tal A
ctiv
itie
s15
,701
,614
-
1,
851,
784
(13,
849,
830)
-
(1
3,84
9,83
0)
Bus
ines
s-T
ype
Act
ivit
ies:
Foo
d S
ervi
ce24
6,00
0
17
8,45
8
67
,249
-
(293
)
(2
93)
T
otal
Bus
ines
s-T
ype
Act
ivit
ies
246,
000
178,
458
67,2
49
-
(2
93)
(293
)
Tot
al P
rim
ary
Gov
ernm
ent
15,9
47,6
14$
17
8,45
8$
1,91
9,03
3$
(13,
849,
830)
$
(293
)$
(1
3,85
0,12
3)$
Gen
eral
Rev
enue
s:T
axes
:P
rope
rty
Tax
es, L
evie
d fo
r G
ener
al P
urpo
ses,
Net
9,54
1,31
2
-
9,
541,
312
F
eder
al &
Sta
te A
id U
nres
tric
ted
4,35
3,40
8
-
4,
353,
408
Tui
tion
Rec
eive
d68
,244
-
68,2
44
M
isce
llan
eous
Inc
ome
210,
094
8,76
6
21
8,86
0
D
ecre
ase
In P
ost R
etir
emen
t Ben
efit
s4,
400
-
4,
400
Tot
al G
ener
al R
even
ues,
Spe
cial
Ite
ms,
Ext
raor
dina
ry I
tem
s &
Tra
nsfe
rs14
,177
,458
8,
766
14,1
86,2
24
Cha
nge
In N
et P
osit
ion
327,
628
8,47
3
33
6,10
1
Net
Pos
itio
n -
Beg
inni
ng7,
411,
558
40
,772
7,
452,
330
Net
Pos
itio
n -
End
ing
7,73
9,18
6$
49,2
45$
7,78
8,43
1$
PR
OG
RA
M R
EV
EN
UE
S
NE
T (
EX
PE
NS
E)
RE
VE
NU
E A
ND
CH
AN
GE
S I
N N
ET
PO
SIT
ION
SH
AM
ON
G T
OW
NS
HIP
SC
HO
OL
DIS
TR
ICT
ST
AT
EM
EN
T O
F A
CT
IVIT
IES
FO
R T
HE
YE
AR
EN
DE
D J
UN
E 3
0, 2
017
The
acc
ompa
nyin
g N
otes
to th
e F
inan
cial
Sta
tem
ents
are
an
inte
gral
par
t of
this
Sta
tem
ent.
32

B. Fund Financial Statements
33

This page intentionally left blank.
34

Governmental Funds
35

This page intentionally left blank.
36

EXHIBIT B-1
SPECIAL CAPITAL DEBTGENERAL REVENUE PROJECTS SERVICE
FUND FUND FUND FUND TOTALS
Cash & Cash Equivalents 816,087$ -$ 202,036$ -$ 1,018,123$ Accounts Receivable:
State 67,143 - 131,326 - 198,469 Other 780,481 2,506 - 46,673 829,660
Interfund 2,001 - - - 2,001Restricted Cash 1,486,826 - - - 1,486,826
Total Assets 3,152,538$ 2,506$ 333,362$ 46,673$ 3,535,079$
Liabilities:Cash Deficit -$ 2,504$ -$ 46,670$ 49,174$ Interfund Payable 6,944 - 1 - 6,945Unearned Revenue 2,700 - - - 2,700Accounts Payable 9,427 2 - - 9,429
Total Liabilities 19,071 2,506 1 46,670 68,248
Fund Balances:Restricted:
Maintenance Reserve 70,000 - - - 70,000 Emergency Reserve 196,000 - - - 196,000 Capital Reserve 1,220,826 - - - 1,220,826 Capital Projects - - 333,361 - 333,361 Debt Service - - - 3 3Excess Surplus - Current Year 800,000 - - - 800,000 Excess Surplus Designated for
Subsequent Year's Expenditures 807,771 - - - 807,771 Assigned:
Other Purposes 38,870 - - - 38,870 Unassigned - - - - -
Total Fund Balances 3,133,467 - 333,361 3 3,466,831
Total Liabilities & Fund Balances 3,152,538$ 2,506$ 333,362$ 46,673$
Amounts reported for governmental activities in the statement of Net Position (A-1) are different because:
Capital assets used in governmental activities are not financial resources andtherefore are not reported in the funds. The cost of the assets is $22,891,600and the accumulated depreciation is $11,248,593. 11,643,007
Deferred outflows and inflows of resources related to pensions and deferred charges or credits on debt refundings are applicable to future reporting periods and, therefore, are not reported in the funds. 1,713,161
Accrued interest payable is not recorded in the fund financial Statementsdue to the fact that the payables are not due in the period. (20,069)
Accrued pension contributions for the June 30, 2017 plan year are not paid with currenteconomic resources and are therefore not reported as a liability in the funds, but are included in accounts payable in the government-wide statement of net position. (184,336)
Long-term liabilities, including net pension liability, bonds payable, bond premium,capital leases, post retirement liability and compensated absences are not due andpayable in the current period and therefore are not reported as liabilities in the funds. (8,879,408)
Net Position of Governmental Activities 7,739,186$
LIABILITIES & FUND BALANCES
ASSETS
SHAMONG TOWNSHIP SCHOOL DISTRICTGOVERNMENTAL FUNDS
BALANCE SHEETJUNE 30, 2017
The accompanying Notes to the Financial Statements are an integral part of this Statement. 37
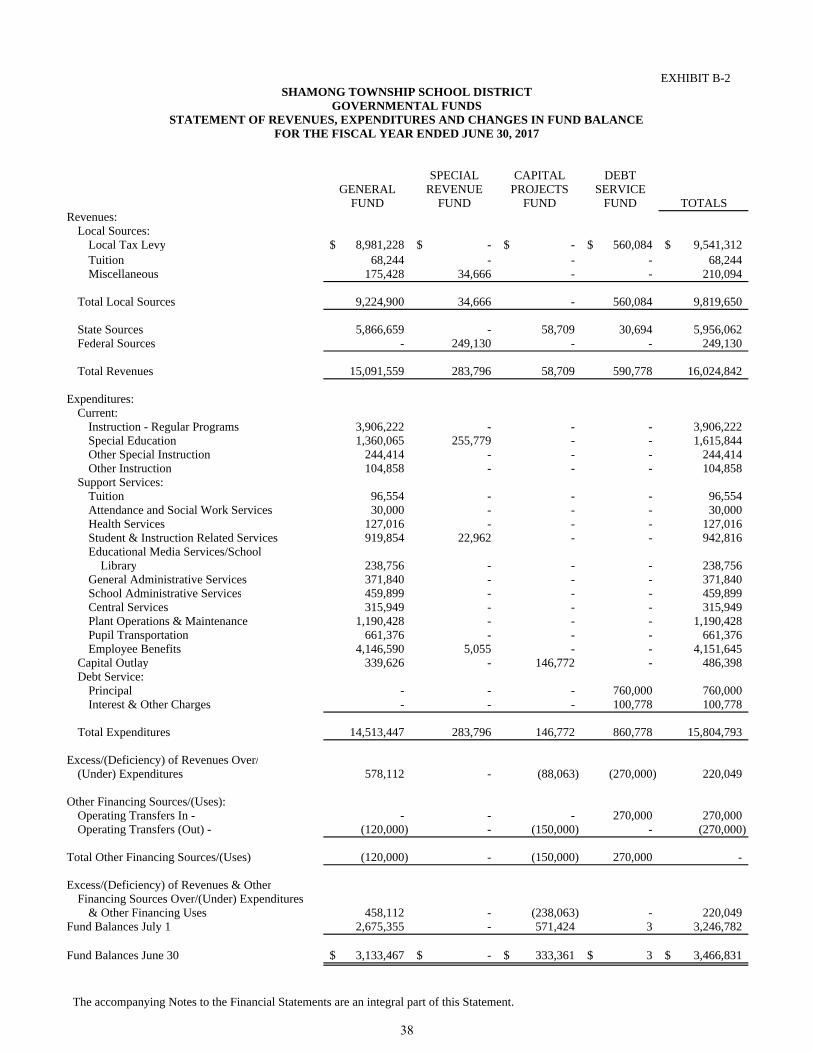
EXHIBIT B-2
SPECIAL CAPITAL DEBTGENERAL REVENUE PROJECTS SERVICE
FUND FUND FUND FUND TOTALSRevenues:
Local Sources:Local Tax Levy 8,981,228$ -$ -$ 560,084$ 9,541,312$ Tuition 68,244 - - - 68,244 Miscellaneous 175,428 34,666 - - 210,094
Total Local Sources 9,224,900 34,666 - 560,084 9,819,650
State Sources 5,866,659 - 58,709 30,694 5,956,062 Federal Sources - 249,130 - - 249,130
Total Revenues 15,091,559 283,796 58,709 590,778 16,024,842
Expenditures:Current:
Instruction - Regular Programs 3,906,222 - - - 3,906,222 Special Education 1,360,065 255,779 - - 1,615,844 Other Special Instruction 244,414 - - - 244,414 Other Instruction 104,858 - - - 104,858
Support Services:Tuition 96,554 - - - 96,554 Attendance and Social Work Services 30,000 - - - 30,000 Health Services 127,016 - - - 127,016 Student & Instruction Related Services 919,854 22,962 - - 942,816 Educational Media Services/School Library 238,756 - - - 238,756 General Administrative Services 371,840 - - - 371,840 School Administrative Services 459,899 - - - 459,899 Central Services 315,949 - - - 315,949 Plant Operations & Maintenance 1,190,428 - - - 1,190,428 Pupil Transportation 661,376 - - - 661,376 Employee Benefits 4,146,590 5,055 - - 4,151,645
Capital Outlay 339,626 - 146,772 - 486,398 Debt Service:
Principal - - - 760,000 760,000 Interest & Other Charges - - - 100,778 100,778
Total Expenditures 14,513,447 283,796 146,772 860,778 15,804,793
Excess/(Deficiency) of Revenues Over/(Under) Expenditures 578,112 - (88,063) (270,000) 220,049
Other Financing Sources/(Uses):Operating Transfers In - - - - 270,000 270,000 Operating Transfers (Out) - (120,000) - (150,000) - (270,000)
Total Other Financing Sources/(Uses) (120,000) - (150,000) 270,000 -
Excess/(Deficiency) of Revenues & OtherFinancing Sources Over/(Under) Expenditures
& Other Financing Uses 458,112 - (238,063) - 220,049 Fund Balances July 1 2,675,355 - 571,424 3 3,246,782
Fund Balances June 30 3,133,467$ -$ 333,361$ 3$ 3,466,831$
SHAMONG TOWNSHIP SCHOOL DISTRICTGOVERNMENTAL FUNDS
STATEMENT OF REVENUES, EXPENDITURES AND CHANGES IN FUND BALANCEFOR THE FISCAL YEAR ENDED JUNE 30, 2017
The accompanying Notes to the Financial Statements are an integral part of this Statement.
38

EXHIBIT B-3
Total Net Change in Fund Balances - Governmental Funds (From B-2) 220,049$
Amounts reported for governmental activities in the statement of activities (A-2)are different because:
Capital outlays are reported in governmental funds as expenditures. However, inthe statement of activities, the cost of those assets is allocated over their estimateduseful lives as depreciation expense. This is the amount by which capital outlaysexceeded depreciation in the period:
Depreciation Expense (733,734) Loss on Disposal of Fixed Assets (8,800) Capital Outlays 205,617 (536,917)
Repayment of bond principal is an expenditure in the governmental funds, but therepayment reduces long-term liabilities in the statement of net assets and is notreported in the statement of activities. 760,000
District pension contributions are reported as expenditures in the governmentalfunds when made. However, they are reported as deferred outflows of resourcesin the Statement of Net Position because the reported net pension liability is measureda year before the District's report date. Pension expense, which is the change in the netpension liability adjusted for changes in deferred outflows and inflows of resources relatedto pensions, is reported in the Statement of Activities.
District PERS Pension Contributions 173,231 Pension Expense (562,441) (389,210)
Interest on long-term debt in the statement of activities is accrued, regardlessof when due. In the governmental funds, interest is reported when due.
Accrued Interest Prior Year 24,652 Accrued Interest Current Year (20,069) 4,583
In the statement of activities, the reduction for Capital Leases should not be anexpenditure. Thus the change in Net Position will differ from the change in fundbalance by the cost of the asset removed (-).
Retirement of Lease 237,720
Deferred charges on Refunding of Debt and premiums from refunded debtissuances are recorded when incurred in the governmental funds but are accruedand expensed over time in the statement of activities.
Amortization of Bond Premium 46,126 Deferred Charge on Refunding (10,029) 36,097
Repayment of Post-Retirement Benefits is an expenditure in the governmental funds,but the repayment reduces long-term liabilities in the statement of net assets and is not reported in the statement of activities.
Current Year (2,400) Prior Year 6,800 4,400
Increase of compensated absences is an expenditure in the governmental funds,but the repayment reduces long-term liabilities in the statement of net assets and is not reported in the statement of activities.
Current Year (273,311) Prior Year 264,217 (9,094)
Change in Net Position of Governmental Activities 327,628$
FOR THE YEAR ENDED JUNE 30, 2017
SHAMONG TOWNSHIP SCHOOL DISTRICTRECONCILIATION OF THE STATEMENT OF REVENUES, EXPENDITURES,
AND CHANGES IN FUND BALANCES OF GOVERNMENTAL FUNDSTO THE STATEMENT OF ACTIVITIES
The accompanying Notes to the Financial Statements are an integral part of this Statement.
39

This page intentionally left blank.
40

Proprietary Funds
41

This page intentionally left blank.
42
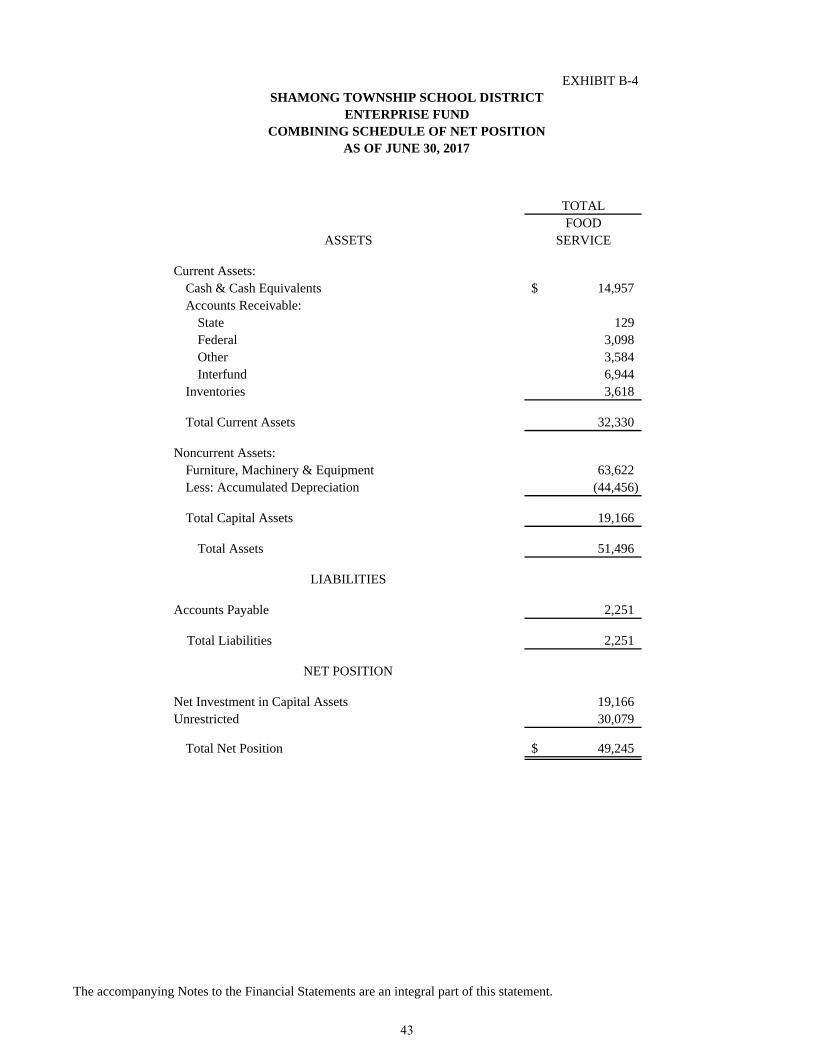
EXHIBIT B-4
TOTALFOOD
SERVICE
Current Assets: Cash & Cash Equivalents 14,957$
Accounts Receivable:State 129 Federal 3,098 Other 3,584 Interfund 6,944
Inventories 3,618
Total Current Assets 32,330
Noncurrent Assets:Furniture, Machinery & Equipment 63,622 Less: Accumulated Depreciation (44,456)
Total Capital Assets 19,166
Total Assets 51,496
Accounts Payable 2,251
Total Liabilities 2,251
Net Investment in Capital Assets 19,166 Unrestricted 30,079
Total Net Position 49,245$
NET POSITION
ASSETS
SHAMONG TOWNSHIP SCHOOL DISTRICTENTERPRISE FUND
COMBINING SCHEDULE OF NET POSITIONAS OF JUNE 30, 2017
LIABILITIES
The accompanying Notes to the Financial Statements are an integral part of this statement.
43

EXHIBIT B-5
TOTALSFOOD
SERVICE FUND
Operating Revenues:Local Sources:
Daily Sales - Reimbursable Programs 100,167$ Daily Sales - Nonreimbursable Programs 78,291 Miscellaneous 8,766
Total Operating Revenue 187,224
Operating Expenses:Cost of Sales 97,501 Salaries & Benefits 103,773 Miscellaneous Expenses 11,103 Management Fee 20,200 Supplies and Materials 8,602 Depreciation 4,821
Total Operating Expenses 246,000
Operating Income/(Loss) (58,776)
Nonoperating Revenues (Expenses):State Sources:
State School Lunch Program 2,090 Federal Sources:
National School Lunch Program 46,246 Healthy Hunger-Free Kids Act 2,879 Cash in Lieu of Commodities 16,034
Total Nonoperating Revenues/(Expenses) 67,249
Change in Net Position 8,473 Total Net Position - Beginning 40,772
Total Net Position - Ending 49,245$
SHAMONG TOWNSHIP SCHOOL DISTRICTENTERPRISE FUNDS
COMBINING STATEMENT OF REVENUESEXPENSES AND CHANGES IN FUND NET POSITION
FOR THE FISCAL YEAR ENDED JUNE 30, 2017
The accompanying Notes to the Financial Statements are an integral part of this Statement.
44
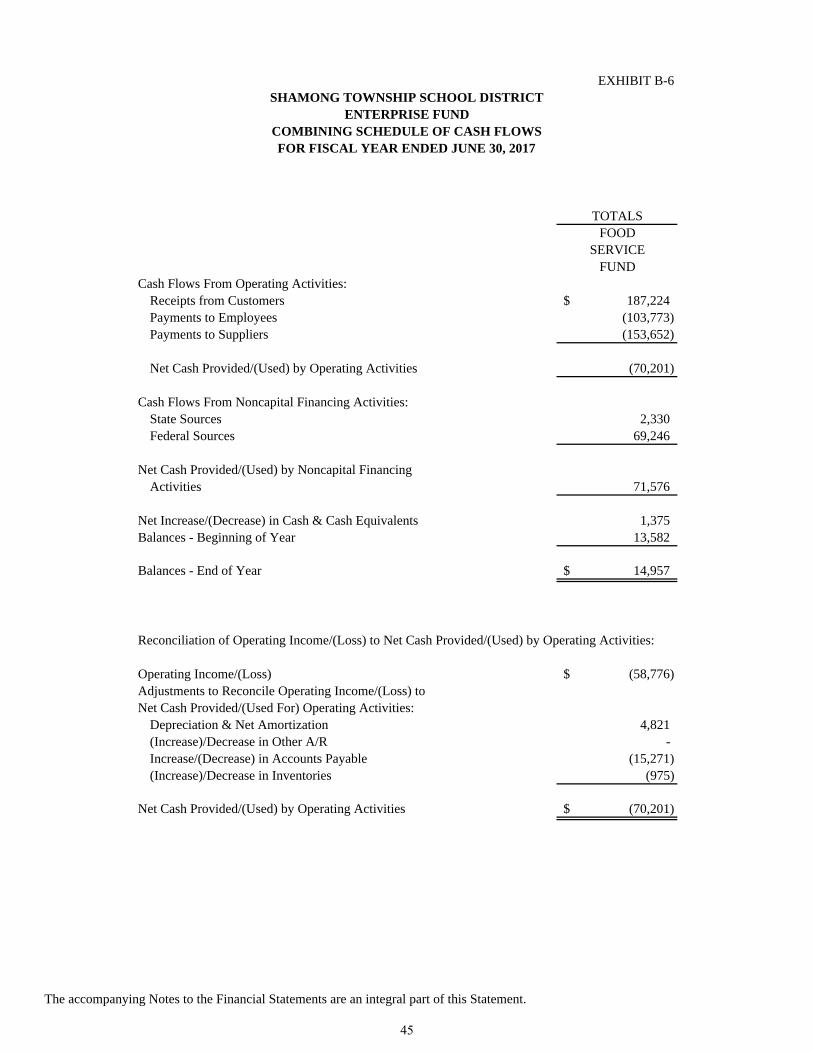
EXHIBIT B-6
TOTALSFOOD
SERVICEFUND
Cash Flows From Operating Activities:Receipts from Customers 187,224$ Payments to Employees (103,773) Payments to Suppliers (153,652)
Net Cash Provided/(Used) by Operating Activities (70,201)
Cash Flows From Noncapital Financing Activities:State Sources 2,330 Federal Sources 69,246
Net Cash Provided/(Used) by Noncapital FinancingActivities 71,576
Net Increase/(Decrease) in Cash & Cash Equivalents 1,375 Balances - Beginning of Year 13,582
Balances - End of Year 14,957$
Reconciliation of Operating Income/(Loss) to Net Cash Provided/(Used) by Operating Activities:
Operating Income/(Loss) (58,776)$ Adjustments to Reconcile Operating Income/(Loss) toNet Cash Provided/(Used For) Operating Activities:
Depreciation & Net Amortization 4,821 (Increase)/Decrease in Other A/R - Increase/(Decrease) in Accounts Payable (15,271) (Increase)/Decrease in Inventories (975)
Net Cash Provided/(Used) by Operating Activities (70,201)$
SHAMONG TOWNSHIP SCHOOL DISTRICTENTERPRISE FUND
COMBINING SCHEDULE OF CASH FLOWSFOR FISCAL YEAR ENDED JUNE 30, 2017
The accompanying Notes to the Financial Statements are an integral part of this Statement.
45

This page intentionally left blank.
46

Fiduciary Fund
47

This page intentionally left blank.
48
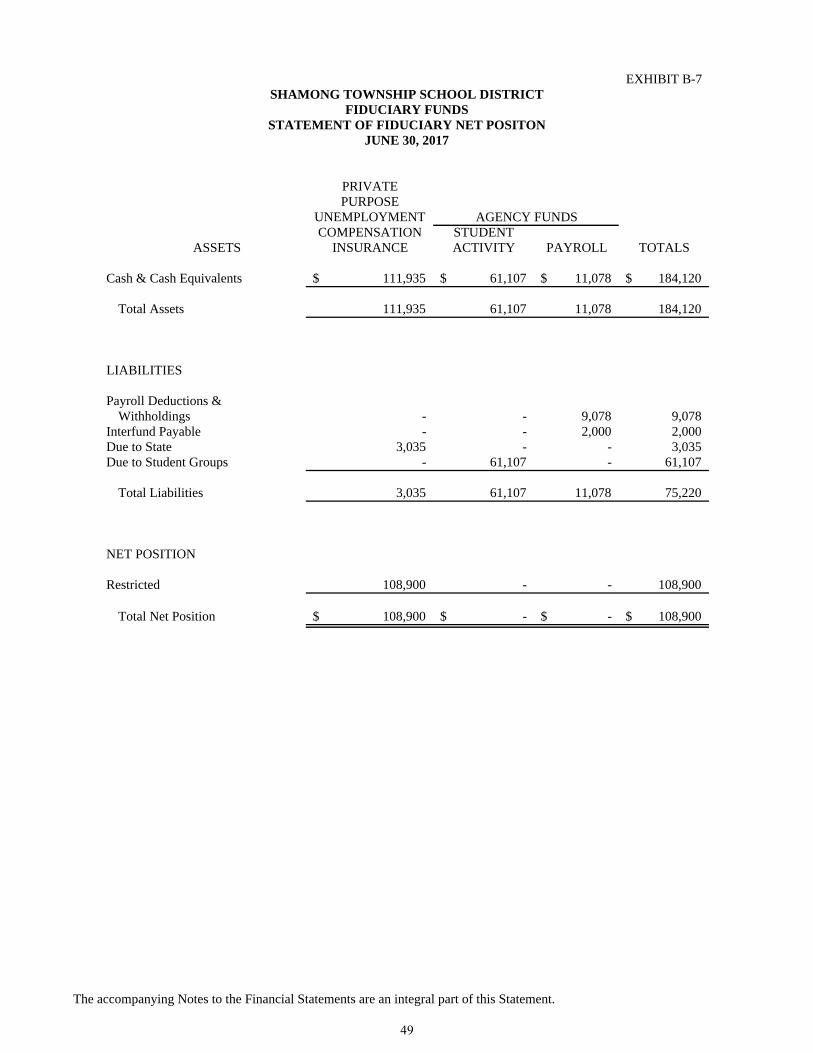
EXHIBIT B-7
PRIVATEPURPOSE
UNEMPLOYMENTCOMPENSATION STUDENT
INSURANCE ACTIVITY PAYROLL TOTALS
Cash & Cash Equivalents 111,935$ 61,107$ 11,078$ 184,120$
Total Assets 111,935 61,107 11,078 184,120
Payroll Deductions &Withholdings - - 9,078 9,078
Interfund Payable - - 2,000 2,000Due to State 3,035 - - 3,035Due to Student Groups - 61,107 - 61,107
Total Liabilities 3,035 61,107 11,078 75,220
Restricted 108,900 - - 108,900
Total Net Position 108,900$ -$ -$ 108,900$
SHAMONG TOWNSHIP SCHOOL DISTRICTFIDUCIARY FUNDS
STATEMENT OF FIDUCIARY NET POSITONJUNE 30, 2017
AGENCY FUNDS
ASSETS
LIABILITIES
NET POSITION
The accompanying Notes to the Financial Statements are an integral part of this Statement.
49
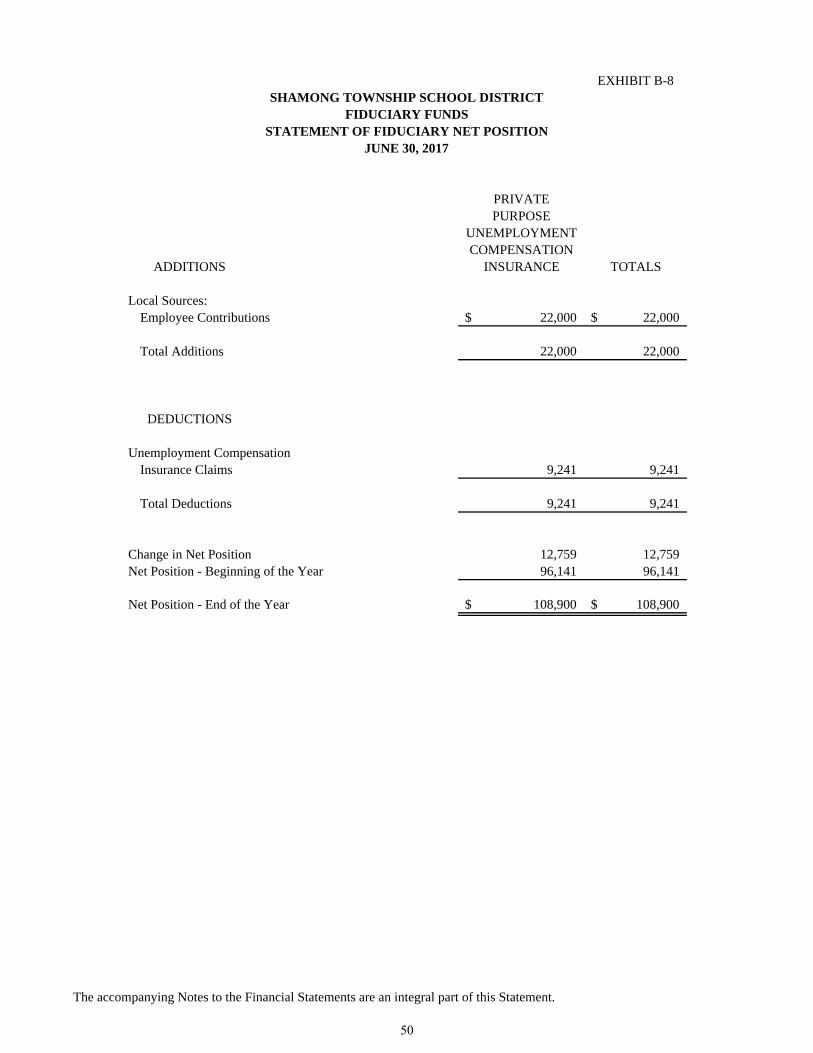
EXHIBIT B-8
PRIVATEPURPOSE
UNEMPLOYMENTCOMPENSATION
INSURANCE TOTALS
Local Sources:Employee Contributions 22,000$ 22,000$
Total Additions 22,000 22,000
Unemployment CompensationInsurance Claims 9,241 9,241
Total Deductions 9,241 9,241
Change in Net Position 12,759 12,759 Net Position - Beginning of the Year 96,141 96,141
Net Position - End of the Year 108,900$ 108,900$
DEDUCTIONS
ADDITIONS
SHAMONG TOWNSHIP SCHOOL DISTRICTFIDUCIARY FUNDS
STATEMENT OF FIDUCIARY NET POSITIONJUNE 30, 2017
The accompanying Notes to the Financial Statements are an integral part of this Statement.
50
SHAMONG TOWNSHIP SCHOOL DISTRICT
NOTES TO THE FINANCIAL STATEMENTS
JUNE 30, 2017
51

This page intentionally left blank.
52

SHAMONG TOWNSHIP SCHOOL DISTRICT
NOTES TO THE FINANCIAL STATEMENTS YEAR ENDED JUNE 30, 2017
Note 1. Summary of Significant Accounting Policies
The financial statements of the Shamong Township School District (the ‘District”) have been prepared in conformity with generally accepted accounting principles (GAAP) as prescribed by the Governmental Accounting Standards Board (GASB). The following is a summary of more significant accounting policies.
Reporting Entity
The Shamong Township School District (hereafter referred to as the “District”) is a Type II district located in the County of Burlington, State of New Jersey. As a Type II district, the School District functions independently through a Board of Education. The Board is comprised of nine members elected to three-year terms. These terms are staggered so that three members’ terms expire each year. The purpose of the District is to educate students in grades kindergarten through eighth at its three schools. The District has an approximate enrollment at June 30, 2017 of 748 students.
The primary criterion for including activities within the District’s reporting entity, as set forth in Section 2100 of the GASB Codification of Governmental Accounting and Financial Reporting Standards, is whether:
the organization is legally separate (can sue or be sued in their own name); the District holds the corporate powers of the organization; the District appoints a voting majority of the organization’s board the District is able to impose its will on the organization; the organization has the potential to impose a financial benefit/burden on the District there is a fiscal dependency by the organization on the District.
There were no additional entities required to be included in the reporting entity under the criteria as described above. Furthermore, the District is not includable in any other reporting entity on the basis of such criteria.
Component Units
GASB Statement No.14. The Financial Reporting Entity, provides guidance that all entities associated with a primary government are potential component units and should be evaluated for inclusion in the financial reporting entity. A primary government is financially accountable not only for the organizations that make up its legal entity but also for legally separate organizations that meet the criteria established by GASB Statement No. 14, as amended by GASB Statement No. 39, Determining Whether Certain Organizations are Component Units and GASB Statement No. 61, The Financial Reporting Entity: Omnis - an amendment of GASB Statements No. 14 and No. 34. The District had no component units as of for the year ended June 30, 2017.
Government-Wide Financial Statements
The District’s Government-Wide Financial Statements include a Statement of Net Position and a Statement of Activities. These statements present summaries of Governmental and Business-Type Activities for the District accompanied by a total column. Fiduciary activities of the District are not included in these statements.
These statements are presented on an “economic resources” measurement focus and the accrual basis of
53

SHAMONG TOWNSHIP SCHOOL DISTRICT
NOTES TO THE FINANCIAL STATEMENTS (continued): YEAR ENDED JUNE 30, 2017
Note 1. Summary of Significant Accounting Policies (continued):
accounting. Accordingly, all of the District’s assets, deferred outflows of resources, liabilities, and deferred inflows of resources, including capital assets and long-term liabilities, are included in the accompanying Statement of Net Position. The Statement of Activities presents changes in net position. Under the accrual basis of accounting, revenues are recognized in the period in which they are earned while expenses are recognized in the period in which the liability is incurred, regardless of the timing of related cash flows. The types of transactions reported as program revenues for the District are reported in three categories: 1) charges for services, 2) operating grants and contributions, and 3) capital grants and contributions.
Certain eliminations have been made to interfund activities, payables, and receivables. All internal balances in the Statement of Net Position have been eliminated except those representing balances between the governmental activities and the business-type activities, which are presented as internal balances and eliminated in the total primary government column. In the Statement of Activities, internal service fund transactions have been eliminated; however, those transactions between governmental and business-type activities have not been eliminated.
Governmental Fund Financial Statements
Governmental fund financial statements include a Balance Sheet and a Statement of Revenues, Expenditures and Changes in Fund Balances for all major governmental funds and non-major funds aggregated. An accompanying schedule (Exhibit B-3) is presented to reconcile and explain the differences in fund balances and changes in fund balances as presented in these statements to the net position and changes in net position presented in the Government-Wide financial statements. The District has presented all major funds that met those qualifications.
All governmental funds are accounted for on a spending or “current financial resources” measurement focus and the modified accrual basis of accounting. Accordingly, only current assets and current liabilities are included on the Balance Sheets. (The District’s deferred outflows of resources and deferred inflows of resources are noncurrent.) The Statement of Revenues, Expenditures and Changes in Fund Balances present increases (revenues and other financing sources) and decreases (expenditures and other financing uses) in net current assets. Under the modified accrual basis of accounting, revenues are recognized in the accounting period in which they become both measurable and available to finance expenditures of the current period. Accordingly, revenues are recorded when received in cash, except that revenues subject to accrual (generally 60 days after year-end) are recognized when due. The primary revenue sources, which have been treated as susceptible to accrual by the District, are property tax and intergovernmental revenues and other taxes. Expenditures are recorded in the accounting period in which the related fund liability is incurred.
Proprietary Fund Financial Statements
Proprietary fund financial statements include a Statement of Net Position, a Statement of Revenues, Expenses and Changes in Fund Net Position, and a Statement of Cash Flows for each major proprietary fund and for the non-major funds aggregated. A column representing internal service funds is also presented in these statements. However, internal service funds balances and activities have been combined with the governmental activities in the Government-Wide financial statements.
Proprietary funds are accounted for using the “economic resources” measurement focus and the accrual basis of accounting. Accordingly, all assets, deferred outflows of resources, liabilities (whether current or noncurrent), and deferred inflows of resources are included on the Statement of Net Position. The Statement of Revenues, Expenses and Changes in Fund Net Position presents increases (revenues) and decreases (expenses) in total net position. Under the accrual basis of accounting, revenues are recognized
54

SHAMONG TOWNSHIP SCHOOL DISTRICT
NOTES TO THE FINANCIAL STATEMENTS (continued): YEAR ENDED JUNE 30, 2017
Note 1. Summary of Significant Accounting Policies (continued):
in the period in which they are earned while expenses are recognized in the period in which the liability is incurred, regardless of the timing of related cash flows.
Operating revenues in the proprietary funds are those revenues that are generated from the primary operations of the fund. All other revenues are reported as non-operating revenues. Operating expenses are those expenses that are essential to the primary operations of the fund. All other expenses are reported as non-operating expenses.
Fiduciary Fund Financial Statements
Fiduciary fund financial statements include a Statement of Net Position. The District’s fiduciary funds are Agency Funds, which are custodial in nature (assets equal liabilities) and do not involve measurement of results of operations. The Agency funds are accounted for on a spending or “economic resources” measurement focus and the accrual basis of accounting as are the proprietary funds explained above. Measurement Focus, Basis of Accounting and Financial Statement Presentation The government-wide financial statements are reported using the economic resources measurement focus and the accrual basis of accounting as are the proprietary fund and fiduciary fund financial statements. Revenues are recorded when earned and expenses are recorded when a liability is incurred, regardless of the timing of related cash flows. Property taxes are recognized as revenues in the year in which they are levied. Grants and similar items are recognized as revenue as soon as all eligibility requirements imposed by the provider have been met.
Amounts reported as program revenues include 1) charges to customers or applicants for goods, services, or privileges provided, 2) operating grants and contributions, and 3) capital grants and contributions. Internally dedicated resources are reported as general revenues rather than as program revenues. Likewise, general revenues include all taxes. While government-wide and fund financial statements are presented separately, they are interrelated. The governmental activities column of the government wide statements incorporates data from governmental funds and internal service funds, while business-type activities incorporate data from the District’s enterprise funds. Separate financial statements are provided for governmental funds, proprietary funds, and fiduciary funds. However, data from the fiduciary funds is not incorporated in the government-wide financial statements Governmental fund financial statements are reported using the current financial resources measurement focus and the modified accrual basis of accounting. Revenues are recognized as soon as they are both measurable and available. Revenues are considered to be available when they are collectible within the current period or soon enough thereafter to pay liabilities of the current period. For this purpose, the District considers revenues to be available if they are collected within 60 days of the end of the current fiscal year-end. Expenditures generally are recorded when a liability is incurred, as under accrual accounting. However, debt service expenditures, as well as expenditures related to compensated absences and claims and judgments, are recorded only when payment is due. General capital assets acquisitions are reported as expenditures in the governmental funds. Issuance of long-term debt and acquisitions under capital leases are reported as other financing sources.
Property taxes, charges for services, licenses, and interest on notes receivable associated with the current fiscal period are all considered to be susceptible to accrual and accordingly have been recognized as
55

SHAMONG TOWNSHIP SCHOOL DISTRICT
NOTES TO THE FINANCIAL STATEMENTS (continued): YEAR ENDED JUNE 30, 2017
Note 1. Summary of Significant Accounting Policies (continued):
revenues of the current fiscal period. Entitlements are recorded as revenues when all eligibility requirements are met, including any time requirements, and the amount is received during the period or within the availability period for this revenue source (within 60 days of year-end). Expenditure-driven grants are recognized as revenue when the qualifying expenditures have been incurred and all eligibility requirements have been met, and the amount is received during the period or within the availability period for this revenue source (within 60 days of year-end). All other revenue items are considered to be measurable and available when cash is received.
Proprietary funds distinguish operating revenues and expenses from nonoperating items. Operating revenues and expenses generally result from providing services and producing and delivering goods in connection with a proprietary fund’s principal ongoing operations. The principal operating revenues of the Food Service Fund program are charges to customers for sales and services. Operating expenses for enterprise funds include the cost of sales and services, employee salaries and benefits, administrative expenses, and depreciation on capital assets. All revenues and expenses not meeting this definition are reported as nonoperating revenues and expenses. When both restricted and unrestricted resources are available for use, it is the District’s policy to use restricted resources first, then unrestricted resources as they are needed. Internal service funds are used to account for those operations which provide benefits to other funds, departments, or agencies of the primary government and its component unit. Although internal service funds are reported as a proprietary fund in the fund financial statements, it is incorporated into governmental activities in the government-wide financial statements. The District does not maintain any internal service funds. The District reports the following major governmental funds:
General Fund - The general fund is the general operating fund of the District and is used to account for all financial resources except those required to be accounted for in another fund. Included are certain expenditures for vehicles and movable instructional or noninstructional equipment which are classified in the Capital Outlay sub-fund. As required by the New Jersey Department of Education the District includes budgeted capital outlay in this fund. Generally accepted accounting principles as they pertain to governmental entities state that General Fund resources may be used to directly finance capital outlays for long-lived improvements as long as the resources in such cases are derived exclusively from unrestricted revenues.
Resources for budgeted capital outlay purposes are normally derived from State of New Jersey Aid, interest earnings and appropriated fund balance. Expenditures are those that result in the acquisition of or additions to capital assets for land, existing buildings, improvements of grounds, construction of buildings, additions to or remodeling of buildings and the purchase of built-in equipment. These resources can be transferred from and to Current Expense by board resolution.
Special Revenue Fund - The Special Revenue Fund is used to account for the proceeds of specific revenue from State and Federal Government, (other than major capital projects, Debt
56
SHAMONG TOWNSHIP SCHOOL DISTRICT
NOTES TO THE FINANCIAL STATEMENTS (continued): YEAR ENDED JUNE 30, 2017
Note 1. Summary of Significant Accounting Policies (continued): Service or the Enterprise Funds) and local appropriations that are legally restricted to expenditures for specified purposes. Capital Projects Fund - The capital projects fund is used to account for all financial resources to be used for the acquisition or construction of major capital facilities (other than those financed by proprietary funds).
Debt Service Fund - The debt service fund is used to account for the accumulation of resources for, and the payment of principal and interest on bonds issued to finance major property acquisition, construction and improvement programs.
The District reports the following major proprietary funds:
Food Service Fund – This fund accounts for the revenues and expenses pertaining to the District’s cafeteria operations.
Additionally, the District reports the following major fiduciary funds:
Private Purpose Trust Funds - Private-purpose trust funds are used to account for the principal and income for trust arrangements that benefit individuals, private organizations, or other governments. The district currently maintains the following private purpose trust funds:
Unemployment Trust Fund – Revenues consist of employee payroll withholdings, interest income, and contributions through the annual budget process of the District. Expenditures consist of unemployment reimbursement claims.
Agency Funds - Agency funds are assets held by a governmental entity (either as trustee or as an agent) for other parties that cannot be used to finance the governmental entity’s own operating programs. The district currently maintains Payroll funds and Student Activity Funds as Agency Funds.
During the course of operations, the District has activity between funds for various purposes. Any residual balances outstanding at year end are reported as due from/to other funds and advances to/from other funds. While these balances are reported in fund financial statements, certain eliminations are made in the preparation of the government-wide financial statements. Balances between the funds included in governmental activities (i.e., the governmental funds and internal service funds) are eliminated so that only the net amount is included as internal balances in the governmental activities column. Similarly, balances between the funds included in business-type activities (i.e., the enterprise funds) are eliminated so that only the net amount is included as internal balances in the business-type activities column.
Further, certain activity occurs during the year involving transfers of resources between funds. In fund financial statements these amounts are reported at gross amounts as transfers in/out. While reported in fund financial statements, certain eliminations are made in the preparation of the government-wide financial statements. Transfers between the funds included in governmental activities are eliminated so that only the net amount is included as transfers in the governmental activities column. Similarly, balances between the funds included in business-type activities are eliminated so that only the net amount is included as internal balances in the business-type activities column.
57

SHAMONG TOWNSHIP SCHOOL DISTRICT
NOTES TO THE FINANCIAL STATEMENTS (continued): YEAR ENDED JUNE 30, 2017
Note 1. Summary of Significant Accounting Policies (continued): Budgets/Budgetary Control Annual appropriated budgets are prepared in the spring of each year for the general, special revenue and debt service funds. The budgets are submitted to the county office. In accordance with P.L.2011 c.202, which became effective January 17, 2012, the District eliminated the April annual voter referendum on budgets which met the statutory tax levy cap limitations and the board of education members are elected at the November general election. Budgets are prepared using the modified accrual basis of accounting. The legal level of budgetary control is established at line item accounts within each fund. Line item accounts are defined as the lowest (most specific) level of detail as established pursuant to the minimum chart of accounts referenced in N.J.A.C. 6A:23-2-2(f)1. Transfers of appropriations may be made by School Board resolution at any time during the fiscal year in accordance with N.J.A.C. 6A:23-2-11. Formal budgetary integration into the accounting system is employed as a management control device during the year. For governmental funds there are no substantial differences between the budgetary basis of accounting and generally accepted accounting principles with the exception of the legally mandated revenue recognition of the last state aid payment for budgetary purposes only and the special revenue fund as noted below. Encumbrance accounting is also employed as an extension of formal budgetary integration in the governmental fund types. Unencumbered appropriations lapse at fiscal year-end. The accounting records of the special revenue fund are maintained on the grant accounting budgetary basis. The grant accounting budgetary basis differs from GAAP in that the grant accounting budgetary basis recognizes encumbrances as expenditures and also recognizes the related revenues, whereas the GAAP basis does not. Sufficient supplemental records are maintained to allow for the presentation of GAAP basis financial reports. The budget, as detailed on Exhibit C-1, Exhibit C-2, and Exhibit I-3, includes all amendments to the adopted budget, if any. Exhibit C-3 presents a reconciliation of the general fund revenues and special revenue fund revenues and expenditures from the budgetary basis of accounts as presented in the General Fund Budgetary Comparison Schedules and the Special Revenue Fund Budgetary Comparison Schedule to the GAAP basis of accounting as presented in the Statement of Revenues, Expenditures and Changes in Fund Balance – Governmental Funds. Note that the District does not report encumbrances outstanding at fiscal year-end as expenditures in the general fund since the general fund budget follows modified accrual basis with the exception of the revenue recognition policy for the last state aid payments. Encumbrances Under encumbrance accounting purchase orders, contracts and other commitments for the expenditure of resources are recorded to reserve a portion of the applicable appropriation. Open encumbrances in governmental funds other than the special revenue fund are reported as assigned fund balances at fiscal year-end as they do not constitute expenditures or liabilities but rather commitments related to unperformed contracts for goods and services. Open encumbrances in the special revenue fund for which the District has received advances are reflected in the balance sheet as a reduction of the accounts receivables or as unearned revenue at fiscal year-end.
58

SHAMONG TOWNSHIP SCHOOL DISTRICT
NOTES TO THE FINANCIAL STATEMENTS (continued): YEAR ENDED JUNE 30, 2017
Note 1. Summary of Significant Accounting Policies (continued): The encumbered appropriation authority carries over into the next fiscal year. An entry will be made at the beginning of the next fiscal year to increase the appropriation reflected in the certified budget by the outstanding encumbrance amount as of the current fiscal year-end. Cash and Cash Equivalents Cash and Cash equivalents include petty cash, change funds, cash in banks and all highly liquid investments with a maturity of three months or less at the time of purchase and are stated at cost plus accrued interest. U.S. Treasury and agency obligations and certificates of deposit with maturities of one year or less when purchased are stated at cost. New Jersey School Districts are limited as to the types of investments and types of financial institutions they may invest in. N.J.S.18A:20-37 provides a list of permissible investments that may be purchased by New Jersey school districts. Additionally, the District has adopted a cash management plan that requires it to deposit public funds in public depositories protected from loss under the provisions of the Governmental Unit Deposit Protection Act (“GUDPA”). GUDPA was enacted in 1970 to protect Governmental Units from loss of funds on deposit with a failed banking institution in New Jersey. N.J.S.A.17:9-41 et. Seq. establishes the requirements for the security of deposits of governmental units. The statute requires that no governmental unit shall deposit public funds in a public depository unless such funds are secured in accordance with the Act. Public depositories include Savings and Loan institutions, banks (both state and national banks) and savings banks the deposits of which are federally insured. All public depositories must pledge collateral, having a market value at least equal to five percent of the average daily balance of collected public funds, to secure the deposits of Governmental Units. If a public depository fails, the collateral it has pledged, plus the collateral of all other public depositories, is available to pay the full amount of their deposits to the Governmental Units. Tuition Payable/Receivable Tuition rates were established by the receiving School District based on estimated costs. The charges are subject to adjustment when the actual costs are determined. Inventories Inventories are valued at cost, using the first-in/first-out (FIFO) method. The costs of inventories are recorded as expenditures when consumed rather when purchased. Short-Term Interfund Receivables/Payables Short-term interfund receivables/payables represent amounts that are owed, other than charges for goods or services rendered to/from a particular fund in the District and that are due within one year. The amounts are eliminated in the governmental and business-type activities, which are presented as Internal Balances. Balances with fiduciary funds are not considered Internal Balances; therefore those balances are reported on the Statement of Net Position.
59

SHAMONG TOWNSHIP SCHOOL DISTRICT
NOTES TO THE FINANCIAL STATEMENTS (continued): YEAR ENDED JUNE 30, 2017
Note 1. Summary of Significant Accounting Policies (continued): Capital Assets
Capital assets are reported in the applicable governmental or business-type activities column in the government-wide financial statements. Purchased or constructed assets are recorded at actual cost or estimated historical cost if actual cost is unavailable. Donated capital assets are recorded at estimated fair value at the date of donation. The District has established a threshold of $2,000 for capitalization of depreciable assets.
Major outlays for capital assets and improvements are capitalized as projects are constructed. The costs of normal maintenance and repairs that do not add to the value of the asset or materially extend asset lives are not capitalized.
Capital assets of the District are depreciated or amortized using the straight-line method over the following estimated lives: Equipment & Vehicles 3 – 20 Years Buildings 30 – 50 Years Improvements 10 – 50 Years Software 5 – 7 Years Compensated Absences Compensated absences are those absences for which employees will be paid, such as vacation, sick leave and sabbatical leave. A liability for compensated absences that are attributable to services already rendered, and that are not contingent on a specific event that is outside the control of the District and its employees, is accrued as the employees earn the rights to the benefits. Compensated absences that relate to future services, or that are contingent on a specific event that is outside the control of the District and its employees, are accounted for in the period in which such services are rendered or in which such events take place. In the Government-Wide financial statements, under governmental activities, compensated absences are reported as an expenditure and noncurrent liabilities. Unearned Revenue Unearned revenue arises when assets are recognized before revenue recognition criteria have been satisfied and is recorded as a liability until the revenue is both measureable and the District is eligible to realize the revenue. Accrued Liabilities and Long-Term Obligations All payables, accrued liabilities, and long-term obligations are reported in the government-wide financial statements, and all payables, accrued liabilities and long-term obligations payable from proprietary funds are reported on the proprietary fund financial statements. In general, government fund payables and accrued liabilities that, once incurred, are paid in a timely manner and in full from current financial resources, are reported as obligations of the funds. However, claims and judgments, compensated absences, special termination benefits and contractually required pension contributions that will be paid
60
SHAMONG TOWNSHIP SCHOOL DISTRICT
NOTES TO THE FINANCIAL STATEMENTS (continued): YEAR ENDED JUNE 30, 2017
Note 1. Summary of Significant Accounting Policies (continued): Accrued Liabilities and Long-Term Obligations (continued) from governmental funds, are reported as a liability in the fund financial statements only to the extent that they are normally expected to be paid with expendable available financial resources. Use of Estimates The preparation of financial statements in conformity with accounting principles generally accepted in the United States of America requires management to make estimates and assumption that affect certain reported amounts and disclosures. Accordingly, actual results could differ from those estimates. Fund Balance In accordance with Government Accounting Standards Board 54, Fund Balance Reporting and Governmental Fund Type Definitions, the District classifies governmental fund balances as follows:
Non-spendable – This classification includes amounts that cannot be spent because they are either not in spendable form or are legally or contractually required to be maintained intact. Non-spendable items are not expected to be converted to cash or are not expected to be converted to cash within the next year.
Restricted – This classification includes amounts for which constraints have been placed on the use of the resources either externally imposed by creditors (such as through a debt covenant), grantors, contributors, or laws or regulations of other governments, or imposed by law through constitutional provisions or enabling legislation.
Committed – This classification includes amounts that can be used only for specific purposes
pursuant to constraints imposed by formal action of the Board of Education. These amounts cannot be used for any other purpose unless the Board of Education removes or changes the specified use by taking the same type of action (resolution) that was employed when the funds were initially committed. This classification also includes contractual obligations to the extent that existing resources have been specifically committed for use in satisfying those contractual requirements. The School Board did not have any committed resources as of June 30, 2017.
Assigned – This classification includes amounts that are constrained by the School District’s
intent to be used for a specific purpose but are neither restricted nor committed. This intent can be expressed by the Board of Education or through the Board of Education delegating this responsibility to the business administrator through the budgetary process. This classification also includes the remaining positive fund balance for all governmental funds except for the General Fund.
Unassigned – This classification includes the residual fund balance for the General Fund. The
Unassigned classification also includes negative residual fund balance of any other governmental fund that cannot be eliminated by offsetting of Assigned fund balance amounts.
61

SHAMONG TOWNSHIP SCHOOL DISTRICT
NOTES TO THE FINANCIAL STATEMENTS (continued): YEAR ENDED JUNE 30, 2017
Note 1. Summary of Significant Accounting Policies (continued): Fund Balance (continued) When an expenditure is incurred for purposes for which both restricted and unrestricted fund balance is available, it is the District’s policy to consider restricted funds to have been spent first. When an expenditure is incurred for which committed, assigned, or unassigned fund balances are available, it is the District’s policy to consider amounts to have been spent first out of committed funds, then assigned funds, and finally unassigned funds, as needed, unless the Board has provided otherwise in its commitment or assignment actions. Net Position Net position, represents the difference between summation of assets and deferred outflows of resources, and the summation of liabilities and deferred inflows of resources. Net position is classified in the following three components:
Net Investment in Capital Assets – This components represents capital assets, net of accumulated depreciation, net of outstanding balances of borrowings used for acquisition, construction, or improvement of those assets.
Restricted – Net position is reported as restricted when there are limitations imposed on their use either through the enabling legislation adopted by the District or through external restrictions imposed by creditors, grantors or laws or regulations of other governments.
Unrestricted – Net position is reported as unrestricted when it does not meet the criteria of the
other two components of net position. Impact of Recently Issued Accounting Principles Adopted Accounting Pronouncements The following GASB Statements became effective for the fiscal year ended June 30, 2017:
Statement No. 74, Financial Reporting for Postemployment Benefit Plans Other Than Pension Plans. The objective of this Statement is to improve the usefulness of information about postemployment benefits other than pensions (other postemployment benefits or OPEB) included in the general purpose external financial reports of state and local governmental OPEB plans for making decisions and assessing accountability. This Statement results from a comprehensive review of the effectiveness of existing standards of accounting and financial reporting for all postemployment benefits (pensions and OPEB) with regard to providing decision-useful information, supporting assessments of accountability and interperiod equity, and creating additional transparency. The adoption of this Statement had no impact on the School District’s financial statements Statement No. 77, Tax Abatement Disclosures. This Statement requires governments that enter into tax abatement agreements to disclose information about those agreements. The adoption of this Statement had no impact on the School District’s financial statements.
62

SHAMONG TOWNSHIP SCHOOL DISTRICT
NOTES TO THE FINANCIAL STATEMENTS (continued): YEAR ENDED JUNE 30, 2017
Note 1. Summary of Significant Accounting Policies (continued): Impact of Recently Issued Accounting Principles (continued) Statement No. 78, Pensions Provided through Certain Multiple-Employer Defined Benefit Pension Plans. The objective of this Statement is to address a practice issue regarding the scope and applicability of Statement No. 68, Accounting and Financial Reporting for Pensions. The adoption of this Statement had no impact on the School District’s financial statements. Statement No. 79, Certain External Investment Pools and Pool Participants. This Statement addresses accounting and financial reporting for certain external investment pools and pool participants. The adoption of this Statement had no impact on the School District’s financial statements. Recently Issued Accounting Pronouncements The GASB has issued the following Statements which will become effective in future fiscal years as shown below: Statement No. 75, Accounting and Financial Reporting for Post-employment Benefits Other than Pensions. This Statement replaces the requirements of Statement No. 45, Accounting and Financial Reporting by Employers for Post- employment Benefits Other Than Pensions, as amended, and No. 57, OPEB Measurements by Agency Employers and Agent Multi-Employer Plans, for OPEB Statement No. 74, Financial Reporting for Post-employment Benefit Plans Other Than Pension Plans, establishes new accounting and financial reporting requirements for OPEB Plans. This Statement will be effective for the year ended June 30, 2018. Management has not yet determined the potential impact on the School District’s financial statements. Statement No. 80, Blending Requirements for Certain Component Units - an amendment of GASB Statement No. 14. The objective of this Statement is to improve financial reporting by clarifying the financial statement presentation requirements for certain component units. This Statement amends the blending requirements established in paragraph 53 of Statement No. 14, The Financial Reporting Entity, as amended. This Statement will be effective for the year ended June 30, 2018. Management does not expect this Statement to have a material impact on the School District’s financial statements. Statement No. 81, Irrevocable Split-Interest Agreements. The objective of this Statement is to improve accounting and financial reporting for irrevocable split-interest agreements by providing recognition and measurement guidance for situations in which a government is a beneficiary of the agreement. This Statement will be effective for the year ended June 30, 2018. Management does not expect this Statement to have a material impact on the School District’s financial statements. Statement No. 82, Pension Issues – an amendment of GASB Statements No. 67, 68 and No. 73. The objective of this Statement is to address certain issues that have been raised with respect to Statements No. 67, Financial Reporting for Pension Plans, No. 68, Accounting and Financial Reporting for Pensions, and No. 73, Accounting and Financial Reporting for Pensions and Related Assets That Are Not within the Scope of GASB Statement 68, and Amendments to Certain Provisions of GASB Statements 67 and 68. This Statement will be effective for the year ended June 30, 2018. Management has not yet determined the potential impact on the School District’s financial statements.
63

SHAMONG TOWNSHIP SCHOOL DISTRICT
NOTES TO THE FINANCIAL STATEMENTS (continued): YEAR ENDED JUNE 30, 2017
Note 1. Summary of Significant Accounting Policies (continued): Impact of Recently Issued Accounting Principles (continued) Statement No. 83, Certain Asset Retirement Obligations. An asset retirement obligation is a legally enforceable liability associated with the retirement of a tangible capital asset. Statement No. 83 establishes guidance for determining the timing and pattern of recognition for liabilities and corresponding deferred outflow of resources related to such obligations. The requirements of this Statement are effective for reporting periods beginning after June 15, 2018. Management does not expect this Statement to have a material impact on the School District’s financial statements. Statement No. 84, Fiduciary Activities. The Statement intends to improve guidance regarding the identification of fiduciary activities for accounting and financial reporting purposes and how those activities should be reported. To that end, Statement No. 84 establishes criteria for identifying fiduciary activities of all state and local governments and clarifies whether and how business-type activities should report their fiduciary activities. Statement No. 84 is effective for reporting periods beginning after December 15, 2018. Management does not expect this Statement to have a material impact on the School District’s financial statements. Statement No. 85, Omnibus 2017. This Statement provides guidance that addresses several different accounting and financial reporting issues identified during the implementation and application of other GASB pronouncements. The guidance in Statement No. 85 is effective for periods beginning after June 15, 2017. Management does not expect this Statement to have a material impact on the School District’s financial statements. Statement No. 86, Accounting for Certain Debt Extinguishment. Statement No. 86 provides guidance for transactions in which cash and other monetary assets acquired with only existing resources, that is, resources other than the proceeds of refunding debt, are placed in an irrevocable trust for the sole purpose of extinguishing debt. Statement No. 86 is effective for reporting periods beginning after June 15, 2017. Management does not expect this Statement to have a material impact on the School District’s financial statements. Statement No. 87, Leases. Statement No. 87 establishes a single approach to accounting for and reporting leases by state and local governments. The GASB based the new standard on the principle that leases are financing of the right to use an underlying asset. Statement No. 87 is effective for reporting periods beginning after December 15, 2019. Management does not expect this Statement to have a material impact on the School District’s financial statements. Bond Premiums, Discounts and Issuance Costs
In the government-wide financial statements and in the proprietary fund financial statements, bond premiums and discounts are deferred and amortized over the life of the bonds using the effective interest method. Bonds payable are reported net of the applicable bond premium or discount. Bond issuance costs are expensed when bonds are issued. In governmental fund financial statements, bond premiums and discounts, as well as debt issuance costs are recognized in the current period. The face amount of the debt is reported as other financing sources. Premiums received on debt issuance are also reported as other financing sources. Issuance costs, whether or not withheld from the actual debt proceeds, are reported as debt service expenditures. Note 1. Summary of Significant Accounting Policies (continued):
64
SHAMONG TOWNSHIP SCHOOL DISTRICT
NOTES TO THE FINANCIAL STATEMENTS (continued): YEAR ENDED JUNE 30, 2017
Deferred Loss on Refunding Debt Deferred loss on refunding debt arising from the issuance of the refunding bonds is recorded as deferred outflows of resources. It is amortized in a systematic and rational manner over the shorter of the duration of the related debt or the new debt issues as a component of interest expense. Deferred Outflows and Deferred Inflows of Resources In addition to assets, the statement of net position will sometimes report a separate section for deferred outflows of resources. This separate financial statement element, deferred outflows of resources represents a consumption of net position that applies to a future period(s) and so will not be recognized as an outflow of resources (expense/expenditure) until then. In addition to liabilities, the statement of net position will sometimes report a separate section for deferred inflows of resources. This separate financial statement element, deferred inflows of resources, represents an acquisition of net position that applies to a future periods and so will not be recognized as an inflow of resources (revenue) until that time. Pensions Section For purposes of measuring the net pension liability, deferred outflows of resources and deferred inflows of resources related to pensions, and pension expense, information about the pension plan’s fiduciary net position and additions to/deductions from the plan’s fiduciary net position have been determined on the same basis as they are reported by the plan. For this purpose, benefit payments (including refunds of employee contributions) are recognized when due and payable in accordance with the benefit terms. Investments are reported at fair value. Note 2. Cash Deposits and Investments Cash Deposits
Custodial Credit Risk – Custodial credit risk is the risk that, in the event of a bank failure, the Board’s deposits may not be recovered. Although the Board does not have a formal policy regarding custodial credit risk, NJSA 17:9-41 et seq. requires that the governmental units shall deposit public funds in public depositories protected from loss under the provisions of GUDPA. Under the Act, the first $250,000.00 of governmental deposits in each insured depository is protected by FDIC. Public fund owned by the Board in excess of FDIC insured amounts are protected by GUDPA. However, GUDPA does not protect intermingled trust funds such as salary withholdings, student activity may pass to the Board relative to the happening of a future condition. Such funds are shown as Uninsured and Uncollateralized in the schedule below. As of June 30, 2017, the District’s bank balance of $2,775,680 was exposed to custodial credit risk as follows:
Insured under FDIC and GUDPA 2,565,000$ Uninsured and Uncollateralized 210,680
2,775,680$
65

SHAMONG TOWNSHIP SCHOOL DISTRICT
NOTES TO THE FINANCIAL STATEMENTS (continued): YEAR ENDED JUNE 30, 2017
Note 2. Cash Deposits and Investments (continued): Investments New Jersey statues permit the Board to purchase the following types of securities:
1. Bonds and other obligations of the United State or obligations guaranteed by the United States. 2. Bonds of any Federal Intermediate Credit Bank, Federal Home Loan Bank, Federal National
Mortgage Agency or of any United States Bank, which have a maturity date not greater than twelve months from the date of purchase.
3. New Jersey Cash Management Fund, New Jersey Asset and Rebate Management Fund and MBIA CLASS.
Custodial credit risk - This is the risk that in the event of the failure of the counterparty (e.g., broker-dealer) to a transaction, a government will not be able to recover the value of its investment or collateral securities that are in the possession of another party. The District does not have custodial credit risk policies for investments. Interest rate risk - This is the risk that changes in market interest rates will adversely affect the fair value of an investment. Generally, the longer the maturity of an investment, the greater the sensitivity of its fair value to changes in market interest rates. The District does not have a formal investment policy that limits investment maturities as a means of managing its exposure to fair value losses arising from increasing interest rates.
Credit risk - Generally, credit risk is the risk that an issuer of a debt type investment will not fulfill its obligation to the holder of the investment. This is measured by assignment of a rating by a nationally recognized rating organization. U.S. Government securities or obligations explicitly guaranteed by the U.S. government are not considered to have credit risk exposure. Concentrations - The District places no limit in the amount the District may invest in any one issuer. The District did not hold any investments at June 30, 2017. Note 3. Reserve Accounts A. Capital Reserve A capital reserve account was established by the Shamong Township School District by inclusion of $100,000 in the original 1995-1996 annual capital outlay budget, which was certified for taxes, for the accumulation of funds for use as capital outlay expenditures in subsequent fiscal years. The capital reserve account is maintained in the general fund and its activity is included in the general fund annual budget. Funds placed in the capital reserve account are restricted to capital projects in the district’s approved Long Range Facilities Plan (LRFP). Upon submission of the LRFP to the department, a district may increase the balance in the capital reserve by appropriating funds in the annual general fund budget certified for taxes or by transfer by board resolution at year-end (June 1 to June 30) of any unanticipated revenue or unexpended line-item appropriation amounts, or both. A district may also appropriate additional amounts when the express approval of the voters has been obtained either by a separate
66

SHAMONG TOWNSHIP SCHOOL DISTRICT
NOTES TO THE FINANCIAL STATEMENTS (continued): YEAR ENDED JUNE 30, 2017
Note 3. Reserve Accounts (continued): A. Capital Reserve (continued) proposal at budget time or by a special question at one of the four special elections authorized pursuant N.J.S.A.19:60-2. Pursuant to N.J.A.C.6:23A-14.1(g), the balance in the account cannot at any time exceed the local support costs of uncompleted capital projects in its approved LRFP. The activity of the capital reserve for the July 01, 2016 to June 30, 2017 fiscal year is as follows:
Beginning Balance, July 1, 2016 900,000$
Increased by:Deposits approved by Board 440,826
1,340,826 Decreased by:
Budget Withdrawls (120,000)
Ending Balance, June 30, 2017 1,220,826$
The June 30, 2017 LRFP balance of local support costs of uncompleted capital projects at June 30, 2017 is $5,145,719. The withdrawals from the capital reserve were for use in a DOE approved facilities project, consistent with the District’s Long Rang Facilities Plan. B. Maintenance Reserve Account The maintenance reserve account is used to accumulate funds for the required maintenance of a facility in accordance with the EFCFA (N.J.A.C.18A:7G-9) as amended by P.L. 2004, c.73(S1701). Districts may only increase the balance in the maintenance reserve account by appropriating funds in the annual general fund budget certified for taxes (N.J.A.C.6A:23A-14.2) or by deposit of any unanticipated revenue or unexpended line-item appropriation by board resolution at year end. The board resolution for deposit at year end into a maintenance reserve account must be made between June 1 and June 20 of the budget year. EFCFA requires that upon District completion of a school facilities project, the District must submit a plan for the maintenance of that facility. Auditors and District staff should refer to the regulations, N.J.A.C.6A:26A, for further guidance. A separate line is provided in the AUDSUM for this reserve account. GASB No. 54 requires the further categorization of the maintenance reserve account balance on the Governmental Funds Balance Sheet (Exhibit B-1) as restricted, committed, and/or assigned. The Department recommends reporting the maintenance reserve under “Restricted” fund balance due to the statutory and regulatory restrictions on withdrawals from maintenance reserve. The same categorization is applicable to the General Fund Budgetary Comparison Schedule (Exhibit C-1). The balance of the maintenance reserve account at June 30, 2017 is $70,000, as there was no activity for the current fiscal year.
67
SHAMONG TOWNSHIP SCHOOL DISTRICT
NOTES TO THE FINANCIAL STATEMENTS (continued): YEAR ENDED JUNE 30, 2017
Note 3. Reserve Accounts (continued): C. Emergency Reserve The emergency reserve account is used to accumulate funds in accordance with N.J.S.A. 18A:7F-41c(1) to finance unanticipated general fund expenditures required for a thorough and efficient education. Unanticipated means reasonably unforeseeable and shall not include additional costs caused by poor planning. The maximum balance permitted at any time in this reserve is the greater of $250,000 or 1 percent of the general fund budget not to exceed $1 million. Deposits may be made to the emergency reserve account by board resolution at year end of any unanticipated revenue or unexpended line item appropriation or both. The department has defined year end for the purpose of depositing surplus into reserve accounts as an amount approved by the district board of education between June 1 and June 30. Withdrawals from the reserve require the approval of the Commissioner unless the withdrawal is necessary to meet an increase in total health care costs in excess of 4 percent. GASBS No. 54 requires the further categorization of the emergency reserve account balance on the Governmental Funds Balance Sheet (Exhibit B-1). The emergency reserve has significant externally imposed restrictions on its withdrawal and should be categorized as “Restricted” fund balance. The same categorization is applicable to the General Fund Budgetary Comparison Schedule (Exhibit C-1) The balance of the emergency reserve account at June 30, 2017 is $196,000, as there was no activity for the current fiscal year. Note 4. Accounts Receivable Accounts receivable at June 30, 2017 consisted of accounts and intergovernmental grants. All state and federal receivables are considered collectible in full due to the stable condition of state programs and the current fiscal year guarantee of federal funds. Accounts receivable as of fiscal year end for the School District’s individual major and fiduciary funds, in the aggregate, are as follows:
ProprietarySpecial Capital Debt Total Total
General Revenue Projects Service Governmental Food Service Business-TypeDescription Fund Fund Fund Fund Activities Fund Activities
Federal Awards -$ -$ -$ -$ -$ 3,098$ 3,098$ State Awards 67,143 131,326 - 198,469 129 129 Other 780,481 2,506 - 46,673 829,660 3,584 3,584
Total 847,624$ 2,506$ 131,326$ 46,673$ 1,028,129$ 6,811$ 6,811$
Governmental FundsFunds
68

SHAMONG TOWNSHIP SCHOOL DISTRICT
NOTES TO THE FINANCIAL STATEMENTS (continued): YEAR ENDED JUNE 30, 2017
Note 5. Capital Assets Capital assets activity for the year ended June 30, 2017 was as follows:
Balance BalanceJuly 1, Retirements June 30, 2016 Additions and Transfers 2017
Governmental Activities:Capital assets not being depreciated:
Land 1,068,766$ -$ -$ 1,068,766$ Construction in Progress 1,261,985 146,772 - 1,408,757
Total Capital Assets not being depreciated 2,330,751 146,772 - 2,477,523
Capital Assets being depreciated:Buildings and Improvements 19,601,570 - - 19,601,570 Equipment 777,862 58,845 (24,200) 812,507
Total Capital Assets being depreciated 20,379,432 58,845 (24,200) 20,414,077
Less: Accumulated Depreciation:Buildings and Improvements (10,102,177) (655,536) - (10,757,713) Equipment (428,082) (78,198) 15,400 (490,880)
Total Accumulated Depreciation (10,530,259) (733,734) 15,400 (11,248,593)
Total Capital Assets being depreciated, net 9,849,173 (674,889) (8,800) 9,165,484
Total Governmental Activities CapitalAssets, net 12,179,924$ (528,117)$ (8,800)$ 11,643,007$
Balance BalanceJuly 1, Retirements June 30, 2016 Additions and Transfers 2017
Business-Type Activities:Equipment 63,622$ -$ -$ 63,622$
63,622 - - 63,622
Less: Accumulated Depreciation:Equipment (39,635) (4,822) - (44,457)
(39,635) (4,822) - (44,457)
Total Business-Type Activities CapitalAssets, net 23,987$ (4,822)$ -$ 19,165$
69
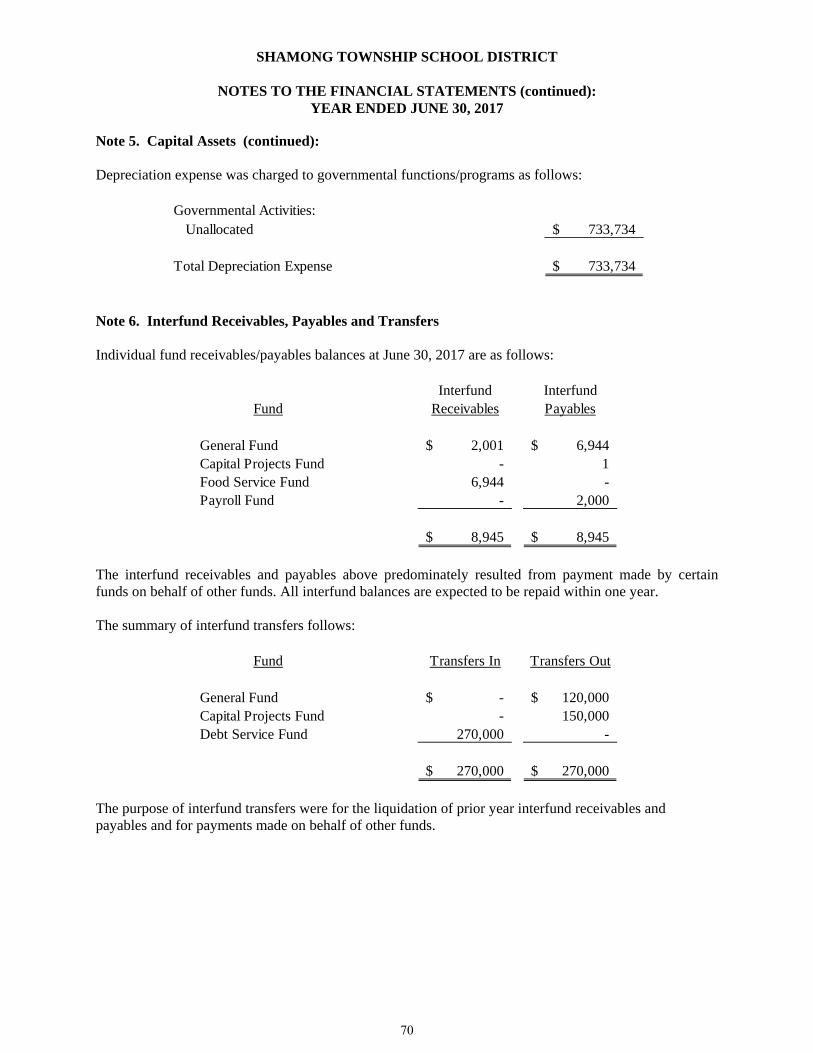
SHAMONG TOWNSHIP SCHOOL DISTRICT
NOTES TO THE FINANCIAL STATEMENTS (continued): YEAR ENDED JUNE 30, 2017
Note 5. Capital Assets (continued): Depreciation expense was charged to governmental functions/programs as follows:
Governmental Activities:Unallocated 733,734$
Total Depreciation Expense 733,734$
Note 6. Interfund Receivables, Payables and Transfers Individual fund receivables/payables balances at June 30, 2017 are as follows:
Interfund Interfund
Fund Receivables Payables
General Fund 2,001$ 6,944$ Capital Projects Fund - 1 Food Service Fund 6,944 - Payroll Fund - 2,000
8,945$ 8,945$
The interfund receivables and payables above predominately resulted from payment made by certain funds on behalf of other funds. All interfund balances are expected to be repaid within one year. The summary of interfund transfers follows:
Fund Transfers In Transfers Out
General Fund -$ 120,000$ Capital Projects Fund - 150,000 Debt Service Fund 270,000 -
270,000$ 270,000$
The purpose of interfund transfers were for the liquidation of prior year interfund receivables and payables and for payments made on behalf of other funds.
70
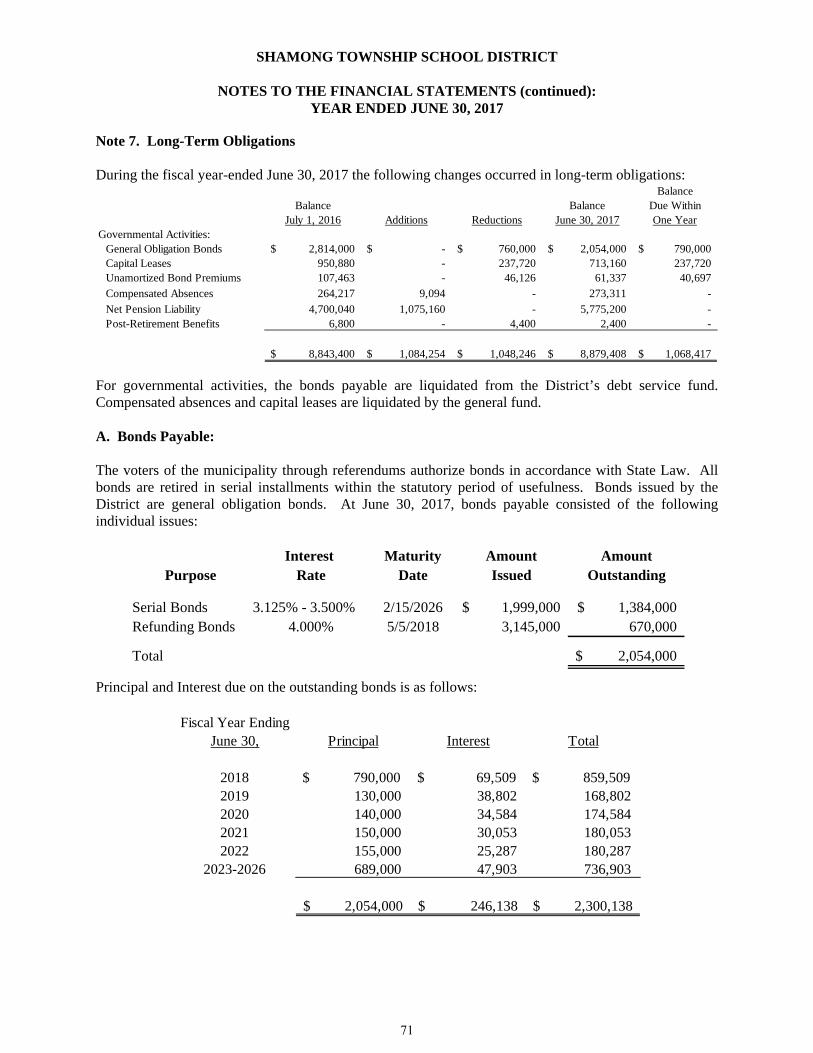
SHAMONG TOWNSHIP SCHOOL DISTRICT
NOTES TO THE FINANCIAL STATEMENTS (continued): YEAR ENDED JUNE 30, 2017
Note 7. Long-Term Obligations During the fiscal year-ended June 30, 2017 the following changes occurred in long-term obligations:
BalanceBalance Balance Due Within
July 1, 2016 Additions Reductions June 30, 2017 One YearGovernmental Activities:
General Obligation Bonds 2,814,000$ -$ 760,000$ 2,054,000$ 790,000$ Capital Leases 950,880 - 237,720 713,160 237,720 Unamortized Bond Premiums 107,463 - 46,126 61,337 40,697 Compensated Absences 264,217 9,094 - 273,311 -
Net Pension Liability 4,700,040 1,075,160 - 5,775,200 - Post-Retirement Benefits 6,800 - 4,400 2,400 -
8,843,400$ 1,084,254$ 1,048,246$ 8,879,408$ 1,068,417$
For governmental activities, the bonds payable are liquidated from the District’s debt service fund. Compensated absences and capital leases are liquidated by the general fund. A. Bonds Payable: The voters of the municipality through referendums authorize bonds in accordance with State Law. All bonds are retired in serial installments within the statutory period of usefulness. Bonds issued by the District are general obligation bonds. At June 30, 2017, bonds payable consisted of the following individual issues:
Interest Maturity Amount AmountPurpose Rate Date Issued Outstanding
Serial Bonds 3.125% - 3.500% 2/15/2026 1,999,000$ 1,384,000$ Refunding Bonds 4.000% 5/5/2018 3,145,000 670,000
Total 2,054,000$
Principal and Interest due on the outstanding bonds is as follows:
Fiscal Year EndingJune 30, Principal Interest Total
2018 $ 790,000 $ 69,509 $ 859,509 2019 130,000 38,802 168,802 2020 140,000 34,584 174,584 2021 150,000 30,053 180,053 2022 155,000 25,287 180,287
2023-2026 689,000 47,903 736,903
2,054,000$ 246,138$ 2,300,138$
71
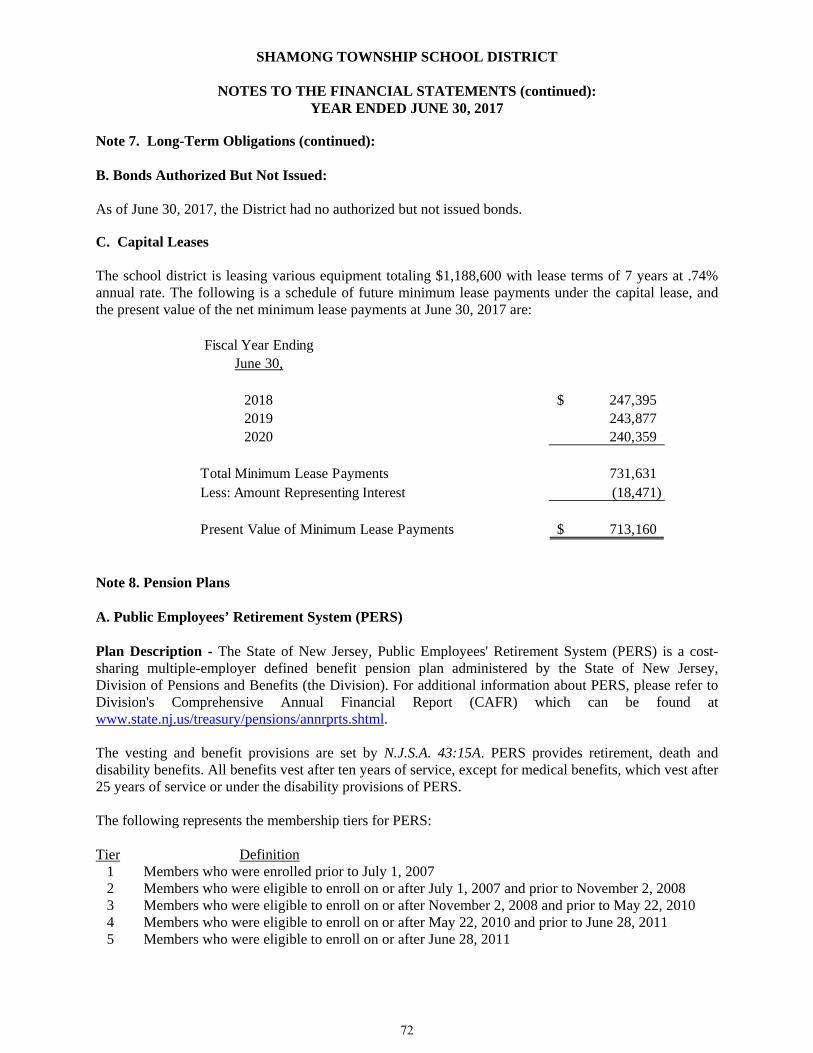
SHAMONG TOWNSHIP SCHOOL DISTRICT
NOTES TO THE FINANCIAL STATEMENTS (continued): YEAR ENDED JUNE 30, 2017
Note 7. Long-Term Obligations (continued): B. Bonds Authorized But Not Issued: As of June 30, 2017, the District had no authorized but not issued bonds. C. Capital Leases The school district is leasing various equipment totaling $1,188,600 with lease terms of 7 years at .74% annual rate. The following is a schedule of future minimum lease payments under the capital lease, and the present value of the net minimum lease payments at June 30, 2017 are:
Fiscal Year EndingJune 30,
2018 247,395$ 2019 243,877 2020 240,359
Total Minimum Lease Payments 731,631 Less: Amount Representing Interest (18,471)
Present Value of Minimum Lease Payments 713,160$
Note 8. Pension Plans A. Public Employees’ Retirement System (PERS) Plan Description - The State of New Jersey, Public Employees' Retirement System (PERS) is a cost-sharing multiple-employer defined benefit pension plan administered by the State of New Jersey, Division of Pensions and Benefits (the Division). For additional information about PERS, please refer to Division's Comprehensive Annual Financial Report (CAFR) which can be found at www.state.nj.us/treasury/pensions/annrprts.shtml. The vesting and benefit provisions are set by N.J.S.A. 43:15A. PERS provides retirement, death and disability benefits. All benefits vest after ten years of service, except for medical benefits, which vest after 25 years of service or under the disability provisions of PERS. The following represents the membership tiers for PERS: Tier Definition 1 Members who were enrolled prior to July 1, 2007 2 Members who were eligible to enroll on or after July 1, 2007 and prior to November 2, 2008 3 Members who were eligible to enroll on or after November 2, 2008 and prior to May 22, 2010 4 Members who were eligible to enroll on or after May 22, 2010 and prior to June 28, 2011 5 Members who were eligible to enroll on or after June 28, 2011
72
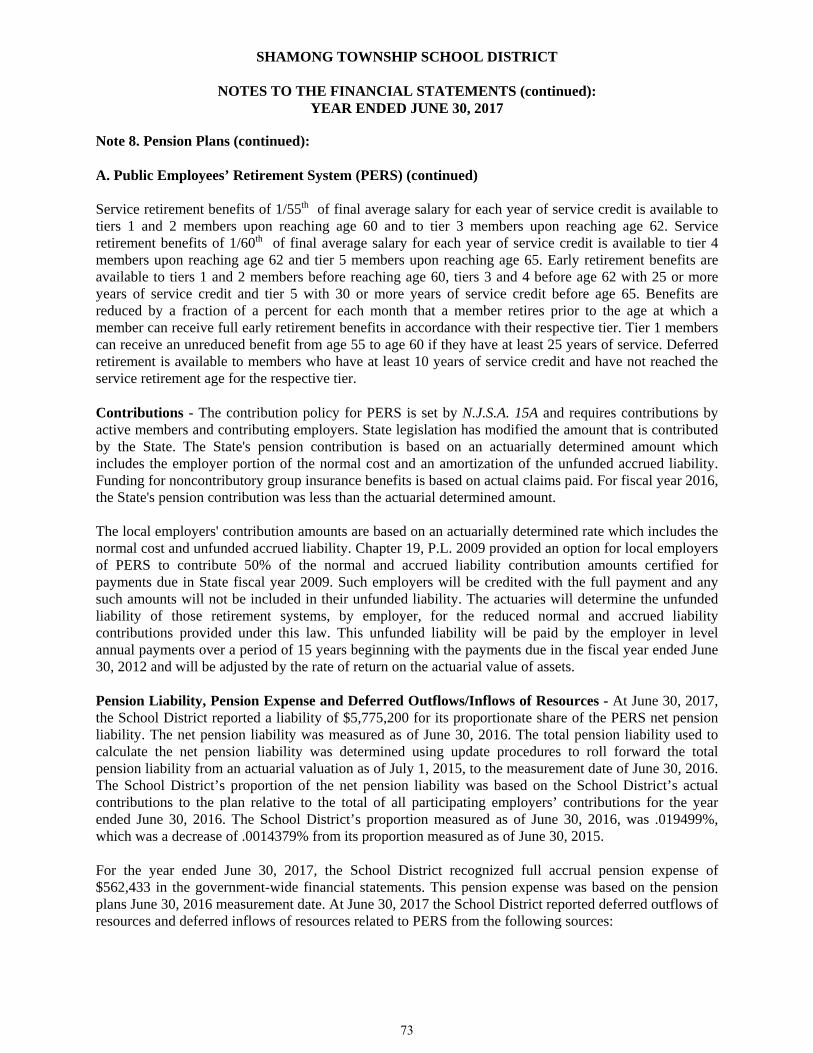
SHAMONG TOWNSHIP SCHOOL DISTRICT
NOTES TO THE FINANCIAL STATEMENTS (continued): YEAR ENDED JUNE 30, 2017
Note 8. Pension Plans (continued): A. Public Employees’ Retirement System (PERS) (continued) Service retirement benefits of 1/55th of final average salary for each year of service credit is available to tiers 1 and 2 members upon reaching age 60 and to tier 3 members upon reaching age 62. Service retirement benefits of 1/60th of final average salary for each year of service credit is available to tier 4 members upon reaching age 62 and tier 5 members upon reaching age 65. Early retirement benefits are available to tiers 1 and 2 members before reaching age 60, tiers 3 and 4 before age 62 with 25 or more years of service credit and tier 5 with 30 or more years of service credit before age 65. Benefits are reduced by a fraction of a percent for each month that a member retires prior to the age at which a member can receive full early retirement benefits in accordance with their respective tier. Tier 1 members can receive an unreduced benefit from age 55 to age 60 if they have at least 25 years of service. Deferred retirement is available to members who have at least 10 years of service credit and have not reached the service retirement age for the respective tier. Contributions - The contribution policy for PERS is set by N.J.S.A. 15A and requires contributions by active members and contributing employers. State legislation has modified the amount that is contributed by the State. The State's pension contribution is based on an actuarially determined amount which includes the employer portion of the normal cost and an amortization of the unfunded accrued liability. Funding for noncontributory group insurance benefits is based on actual claims paid. For fiscal year 2016, the State's pension contribution was less than the actuarial determined amount. The local employers' contribution amounts are based on an actuarially determined rate which includes the normal cost and unfunded accrued liability. Chapter 19, P.L. 2009 provided an option for local employers of PERS to contribute 50% of the normal and accrued liability contribution amounts certified for payments due in State fiscal year 2009. Such employers will be credited with the full payment and any such amounts will not be included in their unfunded liability. The actuaries will determine the unfunded liability of those retirement systems, by employer, for the reduced normal and accrued liability contributions provided under this law. This unfunded liability will be paid by the employer in level annual payments over a period of 15 years beginning with the payments due in the fiscal year ended June 30, 2012 and will be adjusted by the rate of return on the actuarial value of assets.
Pension Liability, Pension Expense and Deferred Outflows/Inflows of Resources - At June 30, 2017, the School District reported a liability of $5,775,200 for its proportionate share of the PERS net pension liability. The net pension liability was measured as of June 30, 2016. The total pension liability used to calculate the net pension liability was determined using update procedures to roll forward the total pension liability from an actuarial valuation as of July 1, 2015, to the measurement date of June 30, 2016. The School District’s proportion of the net pension liability was based on the School District’s actual contributions to the plan relative to the total of all participating employers’ contributions for the year ended June 30, 2016. The School District’s proportion measured as of June 30, 2016, was .019499%, which was a decrease of .0014379% from its proportion measured as of June 30, 2015. For the year ended June 30, 2017, the School District recognized full accrual pension expense of $562,433 in the government-wide financial statements. This pension expense was based on the pension plans June 30, 2016 measurement date. At June 30, 2017 the School District reported deferred outflows of resources and deferred inflows of resources related to PERS from the following sources:
73

SHAMONG TOWNSHIP SCHOOL DISTRICT
NOTES TO THE FINANCIAL STATEMENTS (continued): YEAR ENDED JUNE 30, 2017
Note 8. Pension Plans (continued): A. Public Employees’ Retirement System (PERS) (continued)
Differences between Expected and Actual Experience 107,401$ -$
Changes of Assumptions 1,196,313 -
Net Difference between Projected and Actual Earnings on Pension
Plan Investments 220,214 -
Changes in Proportion and Differences between School District Contributions and Proportionate Share of Contributions 230,457 234,334
School District contributions subsequentto measurement date 184,336
1,938,721$ 234,334$
Deferred Outflows of Resources
Deferred Inflows of Resources
$184,336 reported as deferred outflows of resources resulting from school district contributions subsequent to the measurement date is estimated based on unadjusted 2016-2017 total salaries for PERS employees multiplied by an employer pension contribution rate of 13.37%. The payable is due on April 1, 2018 and will be recognized as a reduction of the net pension liability in the year ended June 30, 2018. The other amounts reported as deferred outflows of resources and deferred inflows of resources related to pensions will be recognized in pension expense as follows:
Year EndingJune 30,
2018 362,183$ 2019 362,184
2020 415,847 2021 329,747
2022 50,090
1,520,051$
74

SHAMONG TOWNSHIP SCHOOL DISTRICT
NOTES TO THE FINANCIAL STATEMENTS (continued): YEAR ENDED JUNE 30, 2017
Note 8. Pension Plans (continued):
A. Public Employees’ Retirement System (PERS) (continued)
The amortization of the above other deferred outflows of resources and deferred inflows of resources related to pensions will be over the following number of years:
Deferred DeferredOutflow of Inflow ofResources Resources
Differences between Expected and Actual Experience
Year of Pension Plan Deferral:June 30, 2014 - -June 30, 2015 5.72 -June 30, 2016 5.57 -
Changes of AssumptionsYear of Pension Plan Deferral:June 30, 2014 6.44 -June 30, 2015 5.72 -June 30, 2016 5.57 -
Net Difference between Projected and Actual Earnings on Pension Plan Investments
Year of Pension Plan Deferral:June 30, 2014 5.00 -June 30, 2015 5.00 -June 30, 2016 5.00 -
The previous amounts do not include employer specific deferred outflows of resources and deferred inflows of resources related to changes in proportion. These amounts should be recognized (amortized) by each employer over the average of the expected remaining service lives of all plan members, which is 5.57, 5.72 and 6.44 years for the 2016, 2015, and 2014 amounts, respectively.
Actuarial Assumptions – The collective total pension liability for the June 30, 2016 measurement date was determined by an actuarial valuation as of July 1, 2015, which was rolled forward to June 30, 2016. This actuarial valuation used the following assumptions:
Inflation Rate 3.08%
Salary Increases: Through 2026 1.65% - 4.15% Based on Age Thereafter 2.65% - 5.15% Based on Age
Investment Rate of Return 7.65%
75
SHAMONG TOWNSHIP SCHOOL DISTRICT
NOTES TO THE FINANCIAL STATEMENTS (continued): YEAR ENDED JUNE 30, 2017
Note 8. Pension Plans (continued):
A. Public Employees’ Retirement System (PERS) (continued) Pre-retirement mortality rates were based on the RP-2000 Employee Preretirement Mortality Table for male and female active participants. For State employees, mortality tables are set back 4 years for males and females. For local employees, mortality tables are set back 2 years for males and 7 years for females. In addition, the tables provide for future improvements in mortality from the base year of 2013 using a generational approach based on the plan actuary’s modified MP-2014 projection scale. Post-retirement mortality rate were based on the RP-2000 Combined Healthy Male and Female Mortality Tables (setback 1 year for males and females) for service retirements and beneficiaries of former members and a one-year static projection based on the mortality improvement Scale AA. In addition, the tables for service retirements and beneficiaries of former members provide for future improvements in mortality from the base year of 2013 using a generational approach based on the plan actuary’s modified MP-2014 projection scales. Disability retirement rates used to value disabled retirees were based on the RP-2000 Disabled Mortality Table (set back 3 years for males and set forward 1 year for females). The actuarial assumptions used in the July 1, 2015 valuation were based on the results of an actuarial experience study for the period July 1, 2011 to June 30, 2014. It is likely that future experience will not exactly conform to these assumptions. To the extent that actual experience deviates from these assumptions, the emerging liabilities may be higher or lower than anticipated. The more the experience deviates, the larger the impact on future financial statements. In accordance with State statute, the long-term expected rate of return on plan investments (7.65% at June 30, 2016) is determined by the State Treasurer, after consultation with the Directors of the Division of Investments and Division of Pensions and Benefits, the board of trustees and the actuaries. The long-term expected rate of return was determined using a building block method in which best-estimate ranges of expected future real rates of return (expected returns, net of pension plan investment expense and inflation) are developed for each major asset class. These ranges are combined to produce the long-term expected rate of return by weighting the expected future real rates of return by the target asset allocation percentage and by adding expected inflation. Best estimates of arithmetic rates of return for each major asset class included in PERS’s target asset allocation as of June 30, 2016 are summarized in the following table:
76

SHAMONG TOWNSHIP SCHOOL DISTRICT
NOTES TO THE FINANCIAL STATEMENTS (continued): YEAR ENDED JUNE 30, 2017
Note 8. Pension Plans (continued):
A. Public Employees’ Retirement System (PERS) (continued)
Long-TermTarget Expected Real
Asset Class Allocation Rate of Return
Cash 5.00% 0.87%U.S. Treasuries 1.50% 1.74%Investment grade credit 8.00% 1.79%Mortgages 2.00% 1.67%High Yield Bonds 2.00% 4.56%Inflation-Indexed Bonds 1.50% 3.44%Broad U.S. Equities 26.00% 8.53%Developed Foreign Equities 13.25% 6.83%Emerging Market Equities 6.50% 9.95%Private Equity 9.00% 12.40%Hedge Funds/Absolute Return 12.50% 4.68%Real Estate (Property) 2.00% 6.91%Commodities 0.50% 5.45%Global debt ex U.S. 5.00% -0.25%REIT 5.25% 5.63%
Discount Rate - The discount rate used to measure the total pension liability was 3.98% as of June 30, 2016. The single blended discount rate was based on long-term expected rate of return on pension plan investments of 7.65%, and a municipal bond rate of 2.85% as of June 30, 2016 based on the Bond Buyer Go 20-Bond Municipal Bond Index, which includes tax-exempt general obligation municipals bonds with an average rating of AA/Aa or higher. The projection of cash flows used to determine the discount rate assumed that contributions from plan members will be made at the current member contribution rates and that contributions from employers will be made based on the contribution rate in the most recent fiscal year. The State employer contributed 30% of the actuarially determined contributions and the local employers contributed 100% of their actuarially determined contributions. Based on those assumptions, the plan’s fiduciary net position was projected to be available to make projected future benefit payments of current plan members through 2034. Therefore, the long-term expected rate of return on plan investments was applied to projected benefit payments through 2034 and the municipal bond rate was applied to projected benefit payments after that date in determining the total pension liability. Sensitivity of the School District’s proportionate share of the Net Pension Liability to Changes in the Discount Rate - The following presents the School District’s proportionate share of the net pension liability as of June 30, 2016, calculated using the discount rate of 3.98% as well as what the School District’s proportionate share of the net pension liability would be if it were calculated using a discount rate that is 1-percentage point lower or 1-percentage point higher than the current rate:
77
SHAMONG TOWNSHIP SCHOOL DISTRICT
NOTES TO THE FINANCIAL STATEMENTS (continued): YEAR ENDED JUNE 30, 2017
Note 8. Pension Plans (continued):
A. Public Employees’ Retirement System (PERS) (continued)
At 1% At Current At 1%Decrease Discount Rate Increase(2.98%) (3.98%) (4.98%)
School District's Proportionate Share of the Net Pension Liability 7,076,834$ 5,775,200$ 4,700,589$
Additional Information - The following is a summary of the collective balances of the local group at June 30, 2017 and 2016:
6/30/2017 6/30/2016
Collective Deferred Outflows of Resources 7,815,204,785$ 2,946,265,815$
Collective Deferred Inflows of Resources -$ 360,920,604$ Collective Net Pension Liability 29,617,131,759$ 22,447,996,119$
0.01950% 0.02094%School District's portion B. Teachers’ Pension and Annuity Fund (TPAF) Plan Description - The State of New Jersey, Teachers' Pension and Annuity Fund (TPAF) is a cost sharing multiple-employer defined benefit pension plan with a special-funding situation, by which the State of New Jersey (the State) is responsible to fund 100% of the employer contributions, excluding any local employer early retirement incentive (ERI) contributions. TPAF is administered by the State of New Jersey, Division of Pensions and Benefits (the Division). For additional information about TPAF, please refer to Division's Comprehensive Annual Financial Report (CAFR) which can be found at www.state.nj.us/treasury/pensions/annrprts.shtml. The vesting and benefit provisions are set by N.J.S.A. 18A:66. TPAF provides retirement, death and disability benefits. All benefits vest after ten years of service, except for medical benefits, which vest after 25 years of service or under the disability provisions of TPAF. Members are always fully vested for their own contributions and, after three years of service credit, become vested for 2% of related interest earned on the contributions. In the case of death before retirement, members' beneficiaries are entitled to full interest credited to the members' accounts. The following represents the membership tiers for TPAF: Tier Definition 1 Members who were enrolled prior to July 1, 2007 2 Members who were eligible to enroll on or after July 1, 2007 and prior to November 2, 2008 3 Members who were eligible to enroll on or after November 2, 2008 and prior to May 22, 2010
78

SHAMONG TOWNSHIP SCHOOL DISTRICT
NOTES TO THE FINANCIAL STATEMENTS (continued): YEAR ENDED JUNE 30, 2017
Note 8. Pension Plans (continued): B. Teachers’ Pension and Annuity Fund (TPAF) (continued) 4 Members who were eligible to enroll on or after May 22, 2010 and prior to June 28, 2011 5 Members who were eligible to enroll on or after June 28, 2011 Service retirement benefits of 1/55th of final average salary for each year of service credit is available to tiers 1 and 2 members upon reaching age 60 and to tier 3 members upon reaching age 62. Service retirement benefits of 1/60th of final average salary for each year of service credit is available to tier 4 members upon reaching age 62 and tier 5 members upon reaching age 65. Early retirement benefits are available to tiers 1 and 2 members before reaching age 60, tiers 3 and 4 before age 62 with 25 or more years of service credit, and tier 5 before age 65 with 30 or more years of service credit. Benefits are reduced by a fraction of a percent for each month that a member retires prior to the retirement age for his/her respective tier. Deferred retirement is available to members who have at least 10 years of service credit and have not reached the service retirement age for the respective tier. Contributions - The contribution policy for TPAF is set by N.J.S.A 18A:66 and requires contributions by active members and contributing employers. Pursuant to the provisions of Chapter 78, P.L. 2011, the active member contribution rate increased from 5.5% of annual compensation to 6.5% plus an additional 1% phased-in over 7 years beginning in July 2012. The member contribution rate was 7.2% in State fiscal year 2017. The State's pension contribution is based on an actuarially determined amount which includes the employer portion of the normal cost and an amortization of the unfunded accrued liability. Funding for noncontributory group insurance benefits is based on actual claims paid. For fiscal year 2016, the State's pension contribution was less than the actuarial determined amount. As mentioned previously, the employer contributions for local participating employers are legally required to be funded by the State in accordance with N.J.S.A 18:66-33. Therefore, the School District is considered to be in a special funding situation as defined by GASB Statement No. 68 and the State is treated as a nonemployer contributing entity. Since the School District does not contribute directly to the plan (except for employer specific financed amounts), there is no net pension liability or deferred outflows or inflows to report in the financial statements of the local participating employers. Pension Liability and Pension Expense - The State’s proportionate share of the TPAF net pension liability, attributable to the School District as of June 30, 2016 was $44,813,287. The School District’s proportionate share was $0. The net pension liability was measured as of June 30, 2016, and the total pension liability used to calculate the net pension liability was determined by an actuarial valuation as of July 1, 2015, which was rolled forward to June 30, 2016. The State’s proportionate share of the net pension liability associated with the District was based on projection of the State’s long-term contributions to the pension plan associated with the District relative to the projected contributions by the State associated with all participating school districts, actuarially determined. At June 30, 2016, the State proportionate share of the TPAF net pension liability attributable to the School District was .056966%, which was a decrease of .000735% from its proportion measured as of June 30, 2015. For the fiscal year ended June 30, 2017, the State of New Jersey recognized a pension expense in the amount of $3,367,095 for the State’s proportionate share of the TPAF pension expense attributable to the School District. This pension expense was based on the pension plans June 30, 2016 measurement date.
79
SHAMONG TOWNSHIP SCHOOL DISTRICT
NOTES TO THE FINANCIAL STATEMENTS (continued): YEAR ENDED JUNE 30, 2017
Note 8. Pension Plans (continued): B. Teachers’ Pension and Annuity Fund (TPAF) (continued) Actuarial Assumptions – The total pension liability for the June 30, 2016 measurement date was determined by an actuarial valuation as of July 1, 2015, which was rolled forward to June 30, 2016. This actuarial valuation used the following actuarial assumptions, applied to all periods in the measurement:
Inflation Rate 2.50%
Salary Increases: 2012-2021 Varies based on experience Thereafter Varies based on experience
Investment Rate of Return 7.65% Pre-retirement, post-retirement and disabled mortality rates were based on the experience of TPAF members reflecting mortality improvement on generational basis based on a 60-year average of Social Security data from 1953 to 2013. The actuarial assumptions used in the July 1, 2015 valuation were based on the results of an actuarial experience study for the period July 1, 2012 to June 30, 2015. Long-Term Expected Rate of Return - In accordance with State statute, the long-term expected rate of return on plan investments (7.65% at June 30, 2016) is determined by the State Treasurer, after consultation with the Directors of the Division of Investments and Division of Pensions and Benefits, the board of trustees and the actuaries. The long-term expected rate of return was determined using a building block method in which best-estimate ranges of expected future real rates of return (expected returns, net of pension plan investment expense and inflation) are developed for each major asset class. These ranges are combined to produce the long-term expected rate of return by weighting the expected future real rates of return by the target asset allocation percentage and by adding expected inflation. Best estimates of arithmetic real rates of return for each major asset class included in TPAF's target asset allocation as of June 30, 2016 are summarized in the following table:
80
SHAMONG TOWNSHIP SCHOOL DISTRICT
NOTES TO THE FINANCIAL STATEMENTS (continued): YEAR ENDED JUNE 30, 2017
Note 8. Pension Plans (continued):
B. Teachers’ Pension and Annuity Fund (TPAF) (continued)
Long-TermTarget Expected Real
Asset Class Allocation Rate of Return
Cash 5.00% 0.39%U.S. Government Bonds 1.50% 1.28%U.S. Credit Bonds 13.00% 2.76%U.S. Mortgages 2.00% 2.38%U.S. Inflation-Indexed Bonds 1.50% 1.41%U.S. High Yield Bonds 2.00% 4.70%U.S. Equity Market 26.00% 5.14%Foreign Developed Equity 13.25% 5.91%Emerging Market Equities 6.50% 8.16%Private Real Estate Property 5.25% 3.64%Timber 1.00% 3.86%Farmland 1.00% 4.39%Private Equity 9.00% 8.97%Commodities 0.50% 2.87%Hedge Funds - MultiStrategy 5.00% 3.70%Hedge Funds - Equity Hedge 3.75% 4.72%Hedge Funds - Distressed 3.75% 3.49%
Discount Rate - The discount rate used to measure the total pension liability was 3.22% as of June 30, 2016. The single blended discount rate was based on long-term expected rate of return on pension plan investments of 7.65%, and a municipal bond rate of 2.85% as of June 30, 2016, based on the Bond Buyer Go 20-Bond Municipal Bond Index which includes tax-exempt general obligation municipals bonds with an average rating of AA/Aa or higher. The projection of cash flows used to determine the discount rate assumed that contributions from plan members will be made at the current member contribution rates and that contributions from employers will be made based on the contribution rate in the most recent fiscal year. The State contributed 30% of the actuarially determined contributions. Based on those assumptions, the plan’s fiduciary net position was projected to be available to make projected future benefit payments of current plan members through 2029. Therefore, the long-term expected rate of return on plan investments was applied to projected benefit payments through 2029, and the municipal bond rate was applied to projected benefit payments after that date in determining the total pension liability.
Sensitivity of the School District’s proportionate share of the Net Pension Liability to Changes in the Discount Rate – As previously mentioned, TPAF has a special funding situation where the State pays 100% of the School District’s annual required contribution. The following represents the State’s proportionate share of the net pension liability, attributable to the School District calculated using the discount rate of 3.22% as well as what the State’s proportionate share of the net pension liability, attributable to the School District’s would be if it were calculated using a discount rate that is 1-percentage point lower or 1-percentage point higher than the current rate:
81

SHAMONG TOWNSHIP SCHOOL DISTRICT
NOTES TO THE FINANCIAL STATEMENTS (continued): YEAR ENDED JUNE 30, 2017
Note 8. Pension Plans (continued):
B. Teachers’ Pension and Annuity Fund (TPAF) (continued)
At 1% At Current At 1%Decrease Discount Rate Increase
(2.22%) (3.22%) (4.22%)
State of New Jersey's Proportionate Share of Net Pension Liability associated with the School District 53,517,079$ 44,813,287$ 37,705,517$
53,517,079$ 44,813,287$ 37,705,517$
Pension Plan Fiduciary Net Position - For purposes of measuring the net pension liability, deferred outflows of resources and deferred inflows of resources related to pensions, and pension expense, information about the fiduciary net position of the Teachers’ Pension and Annuity Fund (TPAF) and additions to/deductions from the TPAF’s fiduciary net position have been determined on the same basis as they are reported by the TPAF. For this purpose, benefit payments (including refunds of employee contributions) are recognized when due and payable in accordance with the benefit terms. Investments are reported at fair value.
C. Defined Contribution Plan (DCRP)
Plan Description - The Defined Contribution Retirement Program (DCRP) was established July 1, 2007, under the provisions of N.J.S.A. 43:15C-1 et seq. The DCRP provides eligible members with a tax-sheltered, defined contribution retirement benefit, along with life insurance and disability coverage
Individuals eligible for membership in the DCRP include:
State or local officials who are elected or appointed on or after July 1, 2007;
Employees enrolled in the Public Employees’ Retirement System (PERS) or Teachers’ Pensionand Annuity Fund (TPAF) on or after July 1, 2007, who earn salary in excess of established“maximum compensation” limits;
Employees enrolled in the Police and Firemen’s Retirement System (PFRS) or State PoliceRetirement System (SPRS) after May 21, 2010, who earn salary in excess of established“maximum compensation” limits;
Employees otherwise eligible to enroll in the PERS or TPAF on or after November 2, 2008, whodo not earn the minimum annual salary for PERS or TPAF Tier 3 enrollment but who earn salaryof at least $5,000 annually. The minimum salary in 2017 is $8,300 and is subject to adjustment infuture years.
82

SHAMONG TOWNSHIP SCHOOL DISTRICT
NOTES TO THE FINANCIAL STATEMENTS (continued): YEAR ENDED JUNE 30, 2017
Note 8. Pension Plans (continued):
C. Defined Contribution Plan (DCRP) (continued)
Employees otherwise eligible to enroll in the PERS or TPAF after May 21, 2010, who do notwork the minimum number of hours per week required for PERS or TPAF Tier 4 or Tier 5enrollment but who earn salary of at least $5,000 annually. The minimum number is 35 hours perweek for State employees, or 32 hours per week for local government or local educationsemployees
Contributions - The contribution policy is set by N.J.S.A. 43:15C-3 and requires active members and contribution employers. When enrolled in the DCRP, members are required to contribute 5.5% of their base salary to a tax-deferred investment account established with Prudential Financial, which jointly administers the DCRP investments with the Division of Pension and Benefits. Member contributions are matched by a 3% contribution from the School District.
For the year ended June 30, 2017, employee contributions totaled $5,915.50, and the School District recognized an expense for payments made to the Defined Contribution Retirement program in the amount of $2,221.30.
Note 9. State Post-Retirement Medical Benefits
P.L. 1987, c. 384 and P.L. 1990, c.6 required Teachers’ Pensions and Annuity Fund (TPAF) and the Public Employees’ Retirement System (PERS), respectively, to fund post-retirement medical benefits for those state employees who retire after accumulating 25 years of credited service or on a disability retirement. P.L. 2007, c.103 amended the law to eliminate the funding of post-retirement medical benefits through the TPAF and PERS. It created separate funds outside of the pension plans for the funding and payment of post-retirement medical benefits for retired State employees and retired educational employees. As of June 30, 2016, there were 110,512 retirees receiving post-retirement medical benefits, and the State contributed $1.37 billion on their behalf. The cost of these benefits is funded through contributions by the State in accordance with P.L. 1994, c.62. Funding of post-retirement medical benefits changed from a pre-funding basis to a pay-as-you-go basis beginning in Fiscal Year 1994.
The State is also responsible for the cost attributable to P.L. 1992, c.126, which provides employer paid health benefits to members of PERS and the Alternate Benefit Program (APB) who retired from a board of education or county college with 25 years of service. The State paid $231.2 million toward Chapter 126 benefits for 20,045 eligible retired members in Fiscal Year 2016.
The School Employees Health Benefits Program (SEHBP) Act is found in New Jersey Statutes Annotated, Title 52, Article 17.25 et seq. Rules governing the operation and administration of the program are found in Title 17, Chapter 9 of the New Jersey Administrative Code. The State of New Jersey Division of Pensions and Benefits issues a publicly available financial report that includes financial statements and required supplementary information for SEHBP. That report may be obtained from the Treasury website at: http://www.nj.gov/treasury/pensions/pdf/financial/2015divisioncombined.pdf
83

SHAMONG TOWNSHIP SCHOOL DISTRICT
NOTES TO THE FINANCIAL STATEMENTS (continued): YEAR ENDED JUNE 30, 2017
Note 10. On-Behalf Payments for Fringe Benefits and Salaries As previously mentioned, the School District receives on-behalf payments from the State of New Jersey for normal costs and post-retirement medical costs related to the Teachers’ Pension and Annuity Fund (TPAF) pension plan. The School District is not legally responsible for these contributions. The on-behalf payments are recorded as revenues and expenditures in the government-wide and general fund financial statements. For the fiscal year ended June 30, 2017, the on-behalf payments for normal costs, post-retirement medical costs, and long-term disability were $621,930, $518,209 and $1,581, respectively. Note 11. Risk Management The District is exposed to various risks of loss related to torts; theft of, damage to, and destruction of assets; errors and omissions; injuries to employees; and natural disasters.
Property and Liability Insurance – The District maintains commercial insurance coverage for property, liability, student accident and surety bonds. A complete schedule of insurance coverage can be found in the Statistical Section of this Comprehensive Annual Financial Report. New Jersey Unemployment Compensation Insurance – The District has elected to fund its New Jersey Unemployment Compensation Insurance under the “Benefit Reimbursement Method”. Under this plan the District is required to reimburse the New Jersey Unemployment Trust Fund for benefits paid to its former employees and charged to its account with the State. The District is billed quarterly for amounts due to the State. The following is a summary of School District contributions, reimbursements to the State for benefits paid and the ending balance of the School District’s trust fund for the current and previous two years:
School District Employee Amount EndingFiscal Year Contributions Contributions Reimbursed Balance
2016-2017 -$ 22,000$ 9,241$ 108,900$ 2015-2016 - 30,000 37,855 96,141 2014-2015 - - 25,014 103,996
Joint Insurance Pool – The Shamong Township School District participates in the Burlington County Insurance Pool Joint Insurance Fund and, public entity risk pool. The Fund provides its members with the following coverages:
Property – Blanket Building & Grounds General & Automobile Liability Boiler & Machinery Workers’ Compensation School Board Legal Liability Crime Coverage
84

SHAMONG TOWNSHIP SCHOOL DISTRICT
NOTES TO THE FINANCIAL STATEMENTS (continued): YEAR ENDED JUNE 30, 2017
Note 12. Contingencies State and Federal Grantor Agencies - The District participates in numerous state and federal grant programs, which are governed by various rules and regulations of the grantor agencies; therefore, to the extent that the District has not complied with the rules and regulations governing the grants, refunds of any money received may be required and the collectability of any related receivable at June 30, 2017 may be impaired. In the opinion of the District, there are no significant contingent liabilities relating to compliance with the rules and regulations governing the respective grants; therefore, no provisions have been recorded in the accompanying combined financial statements for such contingencies. Litigation – The District is a defendant in various lawsuits. Although the outcome of these lawsuits is not presently determinable, it is the opinion of the Districts’ attorney that resolution of these matters will not have a material adverse effect on the financial condition of the District. Economic Dependency - The District receives a substantial amount of its support from federal and state governments. A significant reduction in the level of support, if this were to occur, could have an effect on the District’s programs and activities. Note 13. Deferred Compensation The District offers its employees a choice of the following deferred compensation plans created in accordance with Internal Revenue Code Section 403(b) and 457. The plans, which are administered by the entities listed below, permits participants to defer a portion of their salary until future years Amounts deferred under the plans are not available to employees until termination, retirement, death or unforeseeable emergency. The plan administrators are as follows:
The Vanguard Group AXA Equitable
Lincoln Investment Planning Note 14. Compensated Absences The District accounts for compensated absences (e.g., unused vacation, sick leave) as directed by Governmental Accounting Standards Board Statement No. 16 (GASB 16), “Accounting for Compensated Absences”. A liability for compensated absences attributable to services already rendered and not contingent on a specific event that is outside the control of the employer and employee is accrued as employees earn the rights to the benefits. District employees are granted varying amount of vacation and sick leave in accordance with the District's personnel policies. The District policy permits employees to accumulate unused sick leave and carry forward the full amount to subsequent years. Upon retirement employees shall be paid by the District for the unused sick leave in accordance with Districts’ agreements with the various employee unions. The liability for vested compensated absences of the governmental fund types is recorded in the statement of net position. At June 30, 2017, the liability for compensated absences reported on the government-wide statement of net position was $273,311. As of June 30, 2017 no liability existed for compensated absences in the proprietary fund types.
85

SHAMONG TOWNSHIP SCHOOL DISTRICT
NOTES TO THE FINANCIAL STATEMENTS (continued): YEAR ENDED JUNE 30, 2017
Note 15. Calculation of Excess Surplus The designation for Restricted Fund Balance – Excess Surplus is a required calculation pursuant to N.J.S.A.18A:7F-7. New Jersey school districts are required to reserve General Fund fund balance at the fiscal year-end of June 30 if they did not appropriate a required minimum amount as budgeted fund balance in their subsequent years’ budget. The excess fund balance at June 30, 2017 was $800,000. Note 16. Fund Balance General Fund – Of the $3,133,467 General Fund fund balance at June 30, 2017, $1,220,826 has been reserved in the Capital Reserve Account; $70,000 has been reserved in the Maintenance Reserve Account; $196,000 has been reserved in the Emergency Reserve Account; $807,771 is restricted for excess surplus designated for subsequent years expenditures; $800,000 is restricted for current year excess surplus; $38,870 is assigned to other purposes; and $0 is unassigned. Capital Projects Fund – Of the $333,361 Capital Projects Fund fund balance at June 30, 2017, $333,361 is restricted for current capital projects approved by the District and the Department of Education. Debt Service Fund – Of the $3 Debt Service Fund fund balance at June 30, 2017, $3 is reserved in accordance with N.J.S.A. 7F-41c(2). Note 17. Deficit in Net Position Unrestricted Net Position – The School District governmental activities had a deficit in unrestricted net position in the amount of $3,704,287 at June 30, 2017. The primary causes of this deficit is the School District not recognizing the receivable for the last two state aid payments and the recording of the net pension liability for the Public Employee’s Retirement System (PERS) as of June 30, 2017. The deficit in unrestricted net position for governmental activities does not indicate that the School District is facing financial difficulties.
86

REQUIRED SUPPLEMENTARY INFORMATION - PART II
87

This page intentionally left blank.
88

C. Budgetary Comparison Schedules
89

This page intentionally left blank.
90

EXHIBIT C-1
POSITIVE/(NEGATIVE)
ACCOUNT ORIGINAL BUDGET FINAL FINAL TONUMBERS BUDGET TRANSFERS BUDGET ACTUAL ACTUAL
Revenues:Local Sources:
Local Tax Levy 10-1210 8,981,228$ -$ 8,981,228$ 8,981,228$ -$ Tuition from Other LEAs 10-1310 - - - 32,494 32,494Tuition from Other Sources 10-1340 - - - 35,750 35,750Miscellaneous 10-1990 50,000 - 50,000 175,428 125,428
Total Local Sources 9,031,228 - 9,031,228 9,224,900 193,672
State Sources:Equalization Aid 10-3176 3,430,365 - 3,430,365 3,430,365 - Categorical Transportation Aid 10-3121 224,964 - 224,964 224,964 - Categorical Special Education Aid 10-3132 507,214 - 507,214 507,214 - Categorical Security Aid 10-3177 65,308 - 65,308 65,308 - Extraordinary Aid 10-3131 15,895 - 15,895 42,755 26,860PARCC Readiness Aid 10-3190 8,250 - 8,250 8,250 - Per Pupil Growth Aid 10-3190 8,250 - 8,250 8,250 - Professional Learning Community Aid 10-3190 7,420 - 7,420 7,420 - Nonpublic School Transportation Reimbursement 10-3190 - - - 3,306 3,306Nonbudgeted:
On-Behalf TPAF Post-Retirement Medical Contributions - - - 518,209 518,209On-Behalf TPAF Pension Contributions - - - 621,930 621,930On-Behalf TPAF Long-Term Disability Ins Contributions - - - 1,581 1,581Reimbursed TPAF Social Security Contributions 10-3902 - - - 427,849 427,849
Total State Sources 4,267,666 - 4,267,666 5,867,401 1,599,735
Total Revenues 13,298,894 - 13,298,894 15,092,301 1,793,407
Expenditures:Current Expense:
Instruction - Regular Programs:Salaries of Teachers:
Preschool/Kindergarten 11-110-100-101 219,626 39,811 259,437 258,499 938Preschool/Kindergarten Assistant 11-110-100-106 - 22,399 22,399 22,399 - Grades 1 - 5 11-120-100-101 1,945,881 (54,600) 1,891,281 1,851,467 39,814Grades 6 - 8 11-130-100-101 1,308,674 (101,876) 1,206,798 1,171,381 35,417Home Instruction 11-150-100-101 3,000 - 3,000 1,883 1,117
Regular Programs - Undistributed Instruction:Purchased Professional/Educational Services 11-190-100-320 140,000 42,544 182,544 174,054 8,490Purchased Technical Services 11-190-100-340 97,500 63,312 160,812 156,703 4,109Lease/Rental of Equipment 11-190-100-440 62,434 4,509 66,943 66,943 - Teacher Travel Between Schools 11-190-100-580 1,000 - 1,000 - 1,000General Supplies 11-190-100-610 190,352 (9,187) 181,165 166,969 14,196Textbooks 11-190-100-640 28,000 9,518 37,518 35,598 1,920Other Objects 11-190-100-800 347 - 347 326 21
Total Regular Programs - Instruction 3,996,814 16,430 4,013,244 3,906,222 107,022
Resource Room/ Resource Center:Salaries of Teachers 11-213-100-101 1,062,562 (6,200) 1,056,362 967,574 88,788Other Salaries for Instruction 11-213-100-106 215,316 (6,150) 209,166 175,111 34,055General Supplies 11-213-100-610 8,675 9,300 17,975 17,894 81Textbooks 11-213-100-640 3,160 - 3,160 2,856 304
Total Resource Room 1,289,713 (3,050) 1,286,663 1,163,435 123,228
JUNE 30, 2017
SHAMONG TOWNSHIP SCHOOL DISTRICTGENERAL FUND
BUDGETARY COMPARISON SCHEDULEFOR THE FISCAL YEAR ENDED JUNE 30, 2017
91

EXHIBIT C-1
POSITIVE/(NEGATIVE)
ACCOUNT ORIGINAL BUDGET FINAL FINAL TONUMBERS BUDGET TRANSFERS BUDGET ACTUAL ACTUAL
JUNE 30, 2017
SHAMONG TOWNSHIP SCHOOL DISTRICTGENERAL FUND
BUDGETARY COMPARISON SCHEDULEFOR THE FISCAL YEAR ENDED JUNE 30, 2017
Preschool Disabilities - Part-Time:Salaries of Teachers 11-215-100-101 110,434 - 110,434 106,810 3,624Other Salaries for Instruction 11-215-100-106 65,668 21,184 86,852 83,856 2,996Purchased Educational Services 11-215-100-320 2,000 - 2,000 2,000 - General Supplies 11-215-100-610 5,000 - 5,000 3,964 1,036
Total Preschool Disabilities - Part-Time 183,102 21,184 204,286 196,630 7,656
Total Special Education 1,472,815 18,134 1,490,949 1,360,065 130,884
Basic Skills/Remedial:Salaries of Teachers 11-230-100-101 295,180 (31,577) 263,603 242,355 21,248General Supplies 11-230-100-610 3,500 - 3,500 2,059 1,441
Total Basic Skills/Remedial 298,680 (31,577) 267,103 244,414 22,689
School Sponsored Cocurricular Activities:Salaries 11-401-100-100 52,000 (2,261) 49,739 49,365 374Supplies & Materials 11-401-100-600 3,158 (1,384) 1,774 1,724 50Other Objects 11-401-100-800 1,500 - 1,500 1,464 36
Total School Sponsored Cocurricular Activities 56,658 (3,645) 53,013 52,553 460
School Sponsored Athletics:Salaries 11-402-100-100 40,000 7,785 47,785 47,784 1Purchased Services 11-402-100-500 7,609 (3,238) 4,371 4,371 - Supplies & Materials 11-402-100-600 908 (431) 477 100 377Other Objects 11-402-100-800 550 (470) 80 50 30
Total School Sponsored Athletics 49,067 3,646 52,713 52,305 408
Total Other Instructional Programs 105,725 1 105,726 104,858 868
Total - Instruction 5,874,034 2,988 5,877,022 5,615,559 261,463
Undistributed Expenditures:Instruction:
Tuition to Other LEAs Within theState 11-000-100-561 15,000 - 15,000 - 15,000
Tuition to Other LEAs Outside the State 11-000-100-562 76,000 (21,000) 55,000 7,549 47,451Tuition to CSSD & Regional Day
Schools 11-000-100-565 92,854 - 92,854 - 92,854Tuition to Private School for
The Handicap 11-000-100-567 103,000 8,800 111,800 89,005 22,795
Total Instruction 286,854 (12,200) 274,654 96,554 178,100
Attendance and Social Work ServicesSalaries 11-000-211-100 - 20,000 20,000 20,000 - Purchased Professional & Technical Services 11-000-213-300 - 10,000 10,000 10,000 -
Total Attendance and Social Work Services - 30,000 30,000 30,000 -
Health Services:Salaries 11-000-213-100 118,901 1,569 120,470 120,470 - Purchased Professional & Technical Services 11-000-213-300 4,500 500 5,000 5,000 - Supplies and Materials 11-000-213-600 2,069 (69) 2,000 1,546 454Other Objects 11-000-213-800 140 - 140 - 140
Total Health Services 125,610 2,000 127,610 127,016 594
92

EXHIBIT C-1
POSITIVE/(NEGATIVE)
ACCOUNT ORIGINAL BUDGET FINAL FINAL TONUMBERS BUDGET TRANSFERS BUDGET ACTUAL ACTUAL
JUNE 30, 2017
SHAMONG TOWNSHIP SCHOOL DISTRICTGENERAL FUND
BUDGETARY COMPARISON SCHEDULEFOR THE FISCAL YEAR ENDED JUNE 30, 2017
Related Services:Salaries 11-000-216-101 116,683 10,393 127,076 117,465 9,611Purchased Professional/Educational
Services 11-000-216-320 80,000 36,000 116,000 95,484 20,516Supplies & Materials 11-000-216-610 9,800 46 9,846 7,165 2,681
Total Related Services 206,483 46,439 252,922 220,114 32,808
Extra Services:Salaries 11-000-217-100 49,746 (15,000) 34,746 25,389 9,357Purchased Professional/Educational
Services 11-000-217-320 23,300 - 23,300 10,180 13,120Supplies & Materials 11-000-217-610 4,000 96 4,096 1,173 2,923
Total Extra Services 77,046 (14,904) 62,142 36,742 25,400
Other Support Services - Students - Regular:Salaries of Other Professional
Staff 11-000-218-104 154,668 (1,025) 153,643 152,771 872Purchased Professional/Educational
Services 11-000-218-390 3,000 (2,000) 1,000 - 1,000Supplies & Materials 11-000-218-600 1,250 - 1,250 910 340Other Objects 11-000-218-800 200 - 200 - 200
Total Other Support Services - Students - Regular 159,118 (3,025) 156,093 153,681 2,412
Other Support Services - Students - Special Services:Salaries of Other Professional
Staff 11-000-219-104 352,371 6,224 358,595 348,516 10,079Salaries of Secretarial & Clerical
Assistants 11-000-219-105 46,523 1,624 48,147 48,147 - Rental of Equipment 11-000-219-440 3,000 (3,000) - - - Seminars/Travel 11-000-219-580 9,125 (1,710) 7,415 5,623 1,792Miscellaneous Purchased Services 11-000-219-592 3,700 - 3,700 3,100 600Supplies and Materials 11-000-219-600 11,000 4,500 15,500 12,524 2,976Other Objects 11-000-219-800 1,000 210 1,210 1,210 -
Total Other Support Services - Students - Special 426,719 7,848 434,567 419,120 15,447Services
Improvement of Instruction:Salary of Other Professional Staff 11-000-221-104 79,694 4,887 84,581 84,001 580Travel 11-000-221-580 - 37 37 37 - Purchased Services 11-000-221-590 1,000 (1,000) - - -
Total Improvement of Instruction 80,694 3,924 84,618 84,038 580
Instructional Staff Training:Purchased Professional/Educational
Services 11-000-223-320 5,500 (4,132) 1,368 - 1,368Staff Development - Travel 11-000-223-580 6,100 - 6,100 3,480 2,620Supplies & Materials 11-000-223-600 1,000 - 1,000 359 641Other Objects 11-000-223-800 2,075 245 2,320 2,320 -
Total Instructional Staff Training 14,675 (3,887) 10,788 6,159 4,629
93

EXHIBIT C-1
POSITIVE/(NEGATIVE)
ACCOUNT ORIGINAL BUDGET FINAL FINAL TONUMBERS BUDGET TRANSFERS BUDGET ACTUAL ACTUAL
JUNE 30, 2017
SHAMONG TOWNSHIP SCHOOL DISTRICTGENERAL FUND
BUDGETARY COMPARISON SCHEDULEFOR THE FISCAL YEAR ENDED JUNE 30, 2017
Educational Media Services/School Library:Salaries 11-000-222-100 235,880 (8,875) 227,005 227,004 1Purchased Professional - Educational
Services 11-000-222-300 895 (621) 274 - 274Media Services 11-000-222-400 3,600 (3,597) 3 - 3Travel 11-000-222-580 - 377 377 377 - Supplies and Materials 11-000-222-600 9,237 2,170 11,407 11,375 32
Total Instructional Staff Training Services 249,612 (10,546) 239,066 238,756 310
Support Services General Administration:Salaries 11-000-230-100 213,060 12,925 225,985 225,876 109Legal Services 11-000-230-331 20,000 19,096 39,096 37,290 1,806Audit Services 11-000-230-332 19,000 3,500 22,500 22,500 - Architectural/Engineering Services 11-000-230-334 - 7,900 7,900 7,900 - Other Purchased Professional
Services 11-000-230-339 16,100 (13,801) 2,299 2,299 - Communications/Telephone 11-000-230-530 32,224 (843) 31,381 31,381 - Travel 11-000-230-580 2,000 232 2,232 2,232 - BOE Other Purchased Services 11-000-230-585 2,900 (2,900) - - - Other Purchased Services 11-000-230-590 19,600 (599) 19,001 19,001 - Supplies and Materials 11-000-230-600 3,192 (1,946) 1,246 1,246 - Judgements 11-000-230-820 - 5,745 5,745 3,250 2,495Miscellaneous Expenditures 11-000-230-890 11,208 824 12,032 12,032 - BOE Membership Dues & Fees 11-000-230-895 7,400 (567) 6,833 6,833 -
Total Support Services General Administration 346,684 29,566 376,250 371,840 4,410
Support Services School Administration:Salaries of Principals & Assistant
Principals 11-000-240-103 265,864 6,955 272,819 272,819 - Salaries of Secretarial & Clerical
Assistants 11-000-240-105 186,030 (16,201) 169,829 169,829 - Purchased Professional & Technical
Services 11-000-240-300 15,800 (7,500) 8,300 8,222 78Travel 11-000-251-580 4,400 (2,413) 1,987 1,856 131Supplies & Materials 11-000-240-600 4,850 (1,641) 3,209 3,088 121Other Objects 11-000-240-800 3,750 410 4,160 4,085 75
Total Support Services School Administration 480,694 (20,390) 460,304 459,899 405
Support Services Central Services:Salaries 11-000-251-100 252,759 (11,604) 241,155 241,155 - Purchased Technical Services 11-000-251-340 33,564 8,202 41,766 41,766 - Other Purchased Professional Services 11-000-251-590 2,000 (402) 1,598 1,598 - Travel 11-000-251-580 2,000 275 2,275 2,275 - Supplies and Materials 11-000-251-600 3,500 (770) 2,730 2,730 - Miscellaneous Expenditures 11-000-251-890 1,000 715 1,715 1,674 41
Total Support Services Central Services 294,823 (3,584) 291,239 291,198 41
Administrative Information Technology:Salaries 11-000-252-100 22,803 1,948 24,751 24,751 -
Total Administrative Information Technology 22,803 1,948 24,751 24,751 -
Total Central Services & Admin IT 317,626 (1,636) 315,990 315,949 41
94
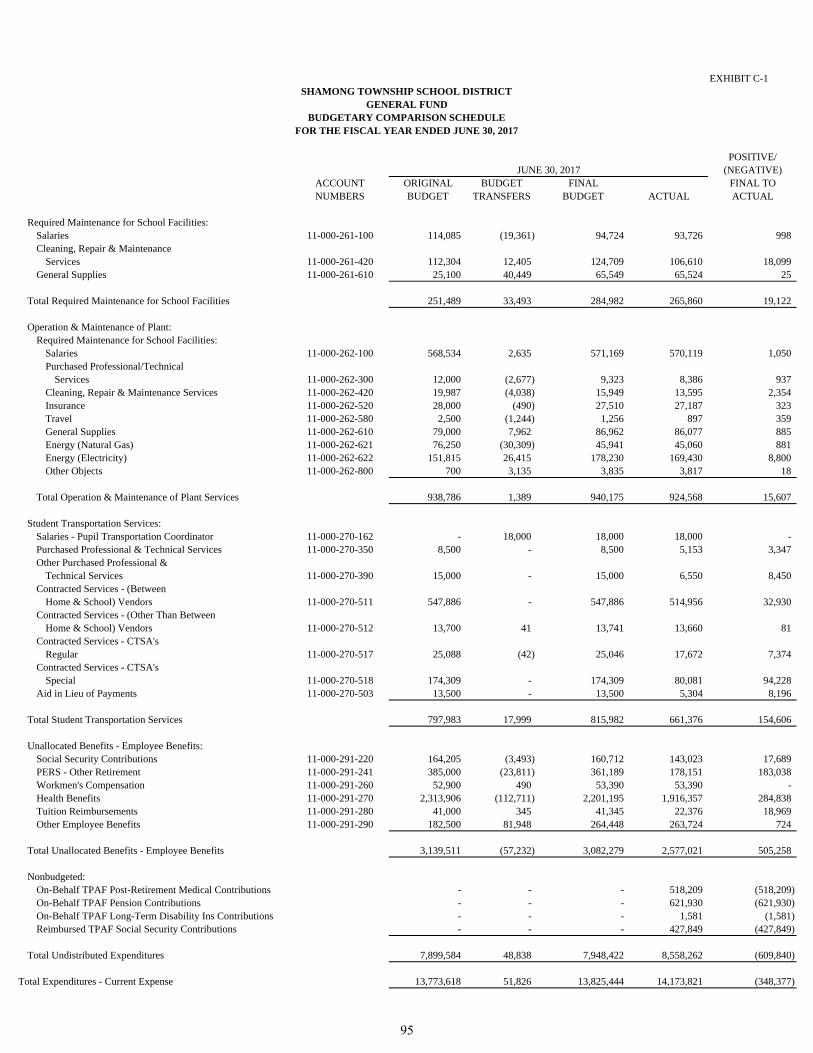
EXHIBIT C-1
POSITIVE/(NEGATIVE)
ACCOUNT ORIGINAL BUDGET FINAL FINAL TONUMBERS BUDGET TRANSFERS BUDGET ACTUAL ACTUAL
JUNE 30, 2017
SHAMONG TOWNSHIP SCHOOL DISTRICTGENERAL FUND
BUDGETARY COMPARISON SCHEDULEFOR THE FISCAL YEAR ENDED JUNE 30, 2017
Required Maintenance for School Facilities:Salaries 11-000-261-100 114,085 (19,361) 94,724 93,726 998Cleaning, Repair & Maintenance
Services 11-000-261-420 112,304 12,405 124,709 106,610 18,099General Supplies 11-000-261-610 25,100 40,449 65,549 65,524 25
Total Required Maintenance for School Facilities 251,489 33,493 284,982 265,860 19,122
Operation & Maintenance of Plant:Required Maintenance for School Facilities:
Salaries 11-000-262-100 568,534 2,635 571,169 570,119 1,050Purchased Professional/Technical
Services 11-000-262-300 12,000 (2,677) 9,323 8,386 937Cleaning, Repair & Maintenance Services 11-000-262-420 19,987 (4,038) 15,949 13,595 2,354Insurance 11-000-262-520 28,000 (490) 27,510 27,187 323Travel 11-000-262-580 2,500 (1,244) 1,256 897 359General Supplies 11-000-262-610 79,000 7,962 86,962 86,077 885Energy (Natural Gas) 11-000-262-621 76,250 (30,309) 45,941 45,060 881Energy (Electricity) 11-000-262-622 151,815 26,415 178,230 169,430 8,800Other Objects 11-000-262-800 700 3,135 3,835 3,817 18
Total Operation & Maintenance of Plant Services 938,786 1,389 940,175 924,568 15,607
Student Transportation Services:Salaries - Pupil Transportation Coordinator 11-000-270-162 - 18,000 18,000 18,000 - Purchased Professional & Technical Services 11-000-270-350 8,500 - 8,500 5,153 3,347Other Purchased Professional &
Technical Services 11-000-270-390 15,000 - 15,000 6,550 8,450Contracted Services - (Between
Home & School) Vendors 11-000-270-511 547,886 - 547,886 514,956 32,930Contracted Services - (Other Than Between
Home & School) Vendors 11-000-270-512 13,700 41 13,741 13,660 81Contracted Services - CTSA's
Regular 11-000-270-517 25,088 (42) 25,046 17,672 7,374Contracted Services - CTSA's
Special 11-000-270-518 174,309 - 174,309 80,081 94,228Aid in Lieu of Payments 11-000-270-503 13,500 - 13,500 5,304 8,196
Total Student Transportation Services 797,983 17,999 815,982 661,376 154,606
Unallocated Benefits - Employee Benefits:Social Security Contributions 11-000-291-220 164,205 (3,493) 160,712 143,023 17,689PERS - Other Retirement 11-000-291-241 385,000 (23,811) 361,189 178,151 183,038Workmen's Compensation 11-000-291-260 52,900 490 53,390 53,390 - Health Benefits 11-000-291-270 2,313,906 (112,711) 2,201,195 1,916,357 284,838Tuition Reimbursements 11-000-291-280 41,000 345 41,345 22,376 18,969Other Employee Benefits 11-000-291-290 182,500 81,948 264,448 263,724 724
Total Unallocated Benefits - Employee Benefits 3,139,511 (57,232) 3,082,279 2,577,021 505,258
Nonbudgeted:On-Behalf TPAF Post-Retirement Medical Contributions - - - 518,209 (518,209) On-Behalf TPAF Pension Contributions - - - 621,930 (621,930) On-Behalf TPAF Long-Term Disability Ins Contributions - - - 1,581 (1,581) Reimbursed TPAF Social Security Contributions - - - 427,849 (427,849)
Total Undistributed Expenditures 7,899,584 48,838 7,948,422 8,558,262 (609,840)
Total Expenditures - Current Expense 13,773,618 51,826 13,825,444 14,173,821 (348,377)
95
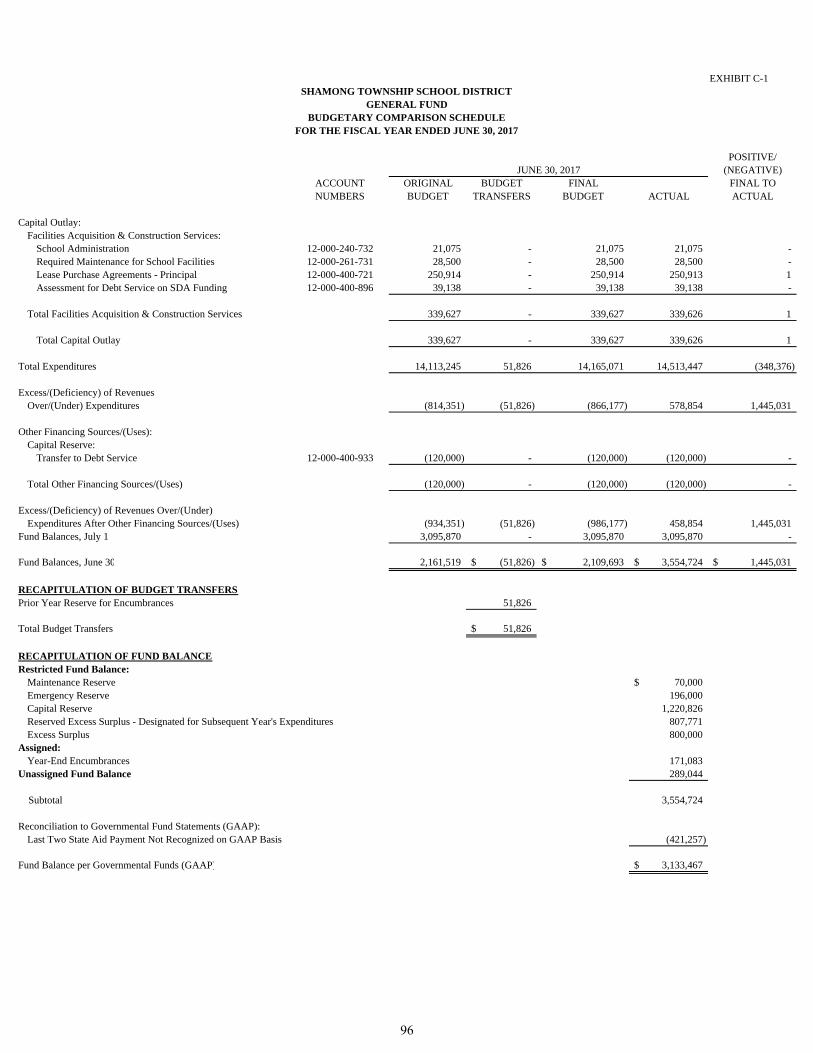
EXHIBIT C-1
POSITIVE/(NEGATIVE)
ACCOUNT ORIGINAL BUDGET FINAL FINAL TONUMBERS BUDGET TRANSFERS BUDGET ACTUAL ACTUAL
JUNE 30, 2017
SHAMONG TOWNSHIP SCHOOL DISTRICTGENERAL FUND
BUDGETARY COMPARISON SCHEDULEFOR THE FISCAL YEAR ENDED JUNE 30, 2017
Capital Outlay:Facilities Acquisition & Construction Services:
School Administration 12-000-240-732 21,075 - 21,075 21,075 - Required Maintenance for School Facilities 12-000-261-731 28,500 - 28,500 28,500 - Lease Purchase Agreements - Principal 12-000-400-721 250,914 - 250,914 250,913 1Assessment for Debt Service on SDA Funding 12-000-400-896 39,138 - 39,138 39,138 -
Total Facilities Acquisition & Construction Services 339,627 - 339,627 339,626 1
Total Capital Outlay 339,627 - 339,627 339,626 1
Total Expenditures 14,113,245 51,826 14,165,071 14,513,447 (348,376)
Excess/(Deficiency) of Revenues Over/(Under) Expenditures (814,351) (51,826) (866,177) 578,854 1,445,031
Other Financing Sources/(Uses):Capital Reserve:
Transfer to Debt Service 12-000-400-933 (120,000) - (120,000) (120,000) -
Total Other Financing Sources/(Uses) (120,000) - (120,000) (120,000) -
Excess/(Deficiency) of Revenues Over/(Under)Expenditures After Other Financing Sources/(Uses) (934,351) (51,826) (986,177) 458,854 1,445,031
Fund Balances, July 1 3,095,870 - 3,095,870 3,095,870 -
Fund Balances, June 30 2,161,519 (51,826)$ 2,109,693$ 3,554,724$ 1,445,031$
Prior Year Reserve for Encumbrances 51,826
Total Budget Transfers 51,826$
Restricted Fund Balance:Maintenance Reserve 70,000$ Emergency Reserve 196,000 Capital Reserve 1,220,826 Reserved Excess Surplus - Designated for Subsequent Year's Expenditures 807,771 Excess Surplus 800,000
Assigned:Year-End Encumbrances 171,083
Unassigned Fund Balance 289,044
Subtotal 3,554,724
Reconciliation to Governmental Fund Statements (GAAP):Last Two State Aid Payment Not Recognized on GAAP Basis (421,257)
Fund Balance per Governmental Funds (GAAP) 3,133,467$
RECAPITULATION OF BUDGET TRANSFERS
RECAPITULATION OF FUND BALANCE
96

EX
HIB
IT C
-2
VA
RIA
NC
EP
OS
ITIV
E/
(NE
GA
TIV
E)
OR
IGIN
AL
BU
DG
ET
FIN
AL
FIN
AL
TO
BU
DG
ET
TR
AN
SF
ER
SB
UD
GE
TA
CT
UA
LA
CT
UA
LR
EV
EN
UE
S
Loc
al S
ourc
es-
$43
,130
$
43
,130
$34
,666
$(8
,464
)$
Fed
eral
Sou
rces
225,
114
24
,016
24
9,13
024
9,13
0-
Tot
al R
even
ues
225,
114
67
,146
29
2,26
028
3,79
6(8
,464
)
EX
PE
ND
ITU
RE
S:
Inst
ruct
ion:
Sal
arie
s of
Tea
cher
s44
,993
(1
2,77
6)
32,2
1732
,217
-P
urch
ased
Pro
fess
iona
l Edu
cati
onal
S
ervi
ces
-3,
512
3,51
23,
512
-T
uiti
on16
0,00
0
6,00
016
6,00
016
6,00
0-
Gen
eral
Sup
plie
s9,
924
52,5
90
62,5
1454
,050
8,46
4
Tot
al I
nstr
ucti
on21
4,91
7
49,3
26
264,
243
255,
779
8,46
4
Sup
port
Ser
vice
s:T
each
er S
alar
ies
10,1
97
(1,7
70)
8,
427
8,42
7-
Per
sona
l Ser
vice
s -
Em
ploy
ee B
enef
its
-5,
055
5,05
55,
055
-P
urch
ased
Pro
fess
iona
l Tec
hnic
alS
ervi
ces
-2,
648
2,64
82,
648
-P
urch
ased
Pro
fess
iona
l Edu
cati
onal
Ser
vice
s-
11,5
26
11,5
2611
,526
-G
ener
al S
uppl
ies
-36
136
136
1-
Tot
al S
uppo
rt S
ervi
ces
10,1
97
17,8
20
28,0
1728
,017
-
Tot
al E
xpen
ditu
res
225,
114
67
,146
29
2,26
028
3,79
68,
464
Tot
al O
utfl
ows
225,
114
67
,146
29
2,26
028
3,79
68,
464
Exc
ess/
(Def
icie
ncy)
of
Rev
enue
s O
ver/
(Und
er)
Exp
endi
ture
s &
Oth
er F
inan
cing
Sou
rces
/(U
ses)
-$
-$
-$
-$
-$
JUN
E 3
0, 2
017
SH
AM
ON
G T
OW
NS
HIP
SC
HO
OL
DIS
TR
ICT
SP
EC
IAL
RE
VE
NU
E F
UN
DB
UD
GE
TA
RY
CO
MP
AR
ISO
N S
CH
ED
UL
E
FO
R T
HE
FIS
CA
L Y
EA
R E
ND
ED
JU
NE
30,
201
7
97

This page intentionally left blank.
98

NOTES TO REQUIRED SUPPLEMENTARY INFORMATION
99

This page intentionally left blank.
100

EXHIBIT C-3
GENERAL SPECIALFUND REVENUE
FUNDSources/Inflows of Resources:
Actual Amounts (Budgetary Basis) "Revenue"From the Budgetary Comparison Schedule (C-Series) 15,092,301$ 283,796$
Difference - Budget to GAAP:State aid payment recognized for GAAP statements inthe current year, previously recognized for budgetarypurposes. 420,515 -
State aid payment recognized for budgetary purposes, notrecognized for GAAP statements until the subsequent year. (421,257) -
Total Revenues as Reported on the Statement of Revenues,Expenditures, and Changes in Fund Balances - GovernmentalFunds. (B-2) 15,091,559$ 283,796$
Uses/Outflows of Resources:Actual amounts (budgetary basis) "total outflows" from thebudgetary comparison schedule 14,513,447$ 283,796$
Total Expenditures as Reported on the Statement of Revenues,Expenditures, and Changes in Fund BalancesGovernmental Funds (B-2) 14,513,447$ 283,796$
SHAMONG TOWNSHIP SCHOOL DISTRICT
Note A - Explanation of Differences between Budgetary Inflows and Outflows and GAAP Revenues and Expenditures
FOR THE FISCAL YEAR ENDED JUNE 30, 2017
REQUIRED SUPPLEMENTARY INFORMATIONBUDGETARY COMPARISON SCHEDULE
NOTE TO RSI
101

This page intentionally left blank.
102

OTHER SUPPLEMENTARY INFORMATION
103

This page intentionally left blank.
104
REQUIRED SUPPLEMENTARY INFORMATION - PART III
105

This page intentionally left blank.
106

L. Schedules Related to Accounting and Reporting for Pensions (GASB 68)
107

This page intentionally left blank
108

EXHIBIT L-1
2017 2016 2015 2014
School District's proportion of the net pension liability 0.01950% 0.02094% 0.01924% 0.01906%
School District's proportionate share of the net pension liability 5,775,200$ 4,700,040$ 3,601,987$ 3,643,602$
School District's covered payroll 1,340,753$ 1,318,264$ 1,330,845$ 1,374,641$
School District's proportionate share of the netpension liability as a percentage of its covered payroll 430.74% 356.53% 270.65% 265.06%
Plan fiduciary net position as a percentage ofthe total pension liability 40.14% 47.93% 52.08% 48.72%
This schedule is presented to illustrate the requirement to show information for 10 years. However, until a full 10-year trend is compiled, governments should present information for those years for which information is available.
SHAMONG TOWNSHIP SCHOOL DISTRICTSCHEDULE OF THE SCHOOL DISTRICT'S PROPORTIONATE SHARE OF THE NET PENSION LIABILITY
PUBLIC EMPLOYEES' RETIREMENT SYSTEM (PERS)LAST FOUR FISCAL YEARS*
*The amounts presented for each fiscal year were determined as of the previous fiscal year end (the measurement date).
109

EXHIBIT L-2
2017 2016 2015 2014 2013
School District's contractually required contribution 184,336$ 173,231$ 180,006$ 158,600$ 143,647$
Contributions in relation to thecontractually required contribution (184,336) (173,231) (180,006) (158,600) (143,647)
Contribution deficiency (excess) -$ -$ -$ -$ -$
School District's covered payroll 1,437,661$ 1,340,753$ 1,318,264$ 1,330,845$ 1,374,641$
Contributions as a percentage of covered payroll 12.82% 12.92% 13.65% 11.92% 10.45%
This schedule is presented to illustrate the requirement to show information for 10 years. However, until a full 10-year trend is compiled, governments should present information for those years for which information is available.
SHAMONG TOWNSHIP SCHOOL DISTRICTSCHEDULE OF SCHOOL DISTRICT CONTRIBUTIONSPUBLIC EMPLOYEES' RETIREMENT SYSTEM (PERS)
LAST FIVE FISCAL YEARS
110

EXHIBIT L-3
2017 2016 2015 2014
School District's proportion of the net pension liability 0.00% 0.00% 0.00% 0.00%
State's proportionate share of the net pension liabilityassociated with the School District 44,813,287$ 36,469,762$ 30,629,904$ 29,378,568$
School District's covered payroll 5,992,483$ 5,758,698$ 5,713,243$ 5,683,551$
School District's proportionate share of the netpension liability as a percentage of its covered payroll 0.00% 0.00% 0.00% 0.00%
Plan fiduciary net position as a percentage ofthe total pension liability 22.33% 28.71% 33.64% 33.76%
*The amounts presented for each fiscal year were determined as of the previous fiscal year end (the measurement date).
This schedule is presented to illustrate the requirement to show information for 10 years. However, until a full 10-year trend is compiled, governmentsshould present information for those years for which information is available.
SHAMONG TOWNSHIP SCHOOL DISTRICTSCHEDULE OF THE DISTRICT'S PROPORTIONATE SHARE OF THE NET PENSION LIABILITY
TEACHERS' PENSION AND ANNUITY FUND (TPAF)LAST FOUR FISCAL YEARS*
111

This page intentionally left blank.
112
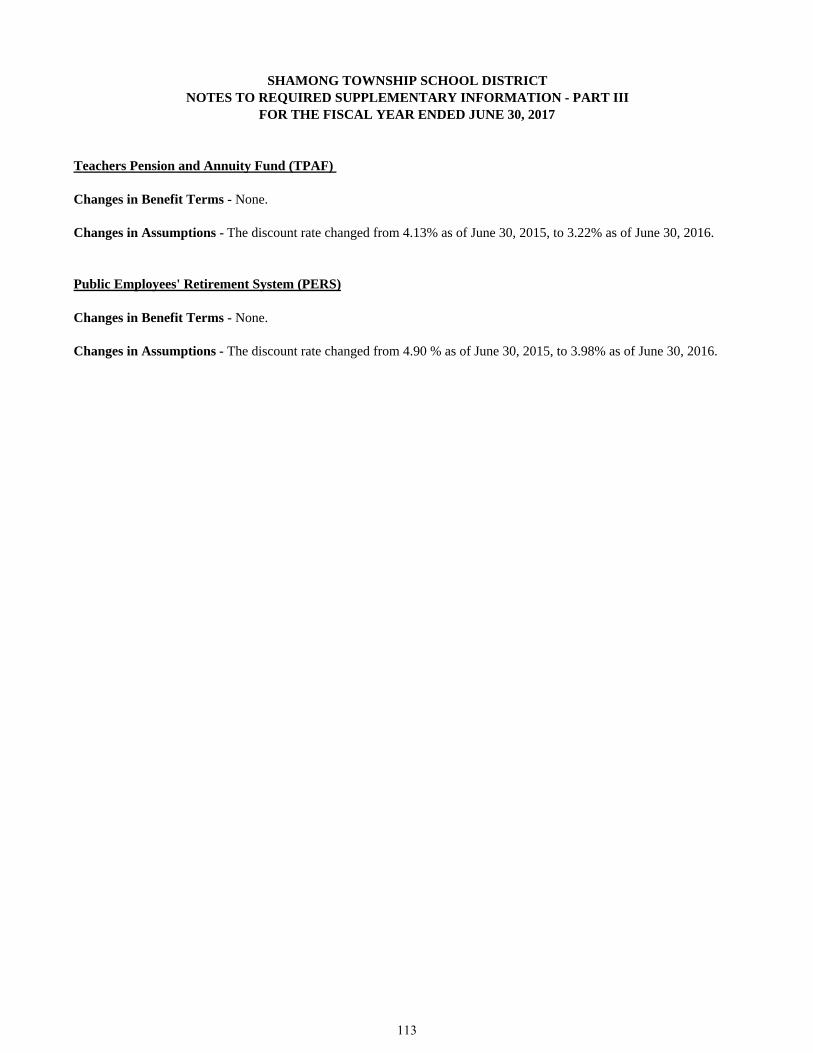
Teachers Pension and Annuity Fund (TPAF)
Changes in Benefit Terms - None.
Public Employees' Retirement System (PERS)
Changes in Benefit Terms - None.
Changes in Assumptions - The discount rate changed from 4.13% as of June 30, 2015, to 3.22% as of June 30, 2016.
Changes in Assumptions - The discount rate changed from 4.90 % as of June 30, 2015, to 3.98% as of June 30, 2016.
SHAMONG TOWNSHIP SCHOOL DISTRICTNOTES TO REQUIRED SUPPLEMENTARY INFORMATION - PART III
FOR THE FISCAL YEAR ENDED JUNE 30, 2017
113

This page intentionally left blank.
114

D. School Based Budget Schedules
Not Applicable
115

This page intentionally left blank.
116

E. Special Revenue Fund
117

This page intentionally left blank.
118
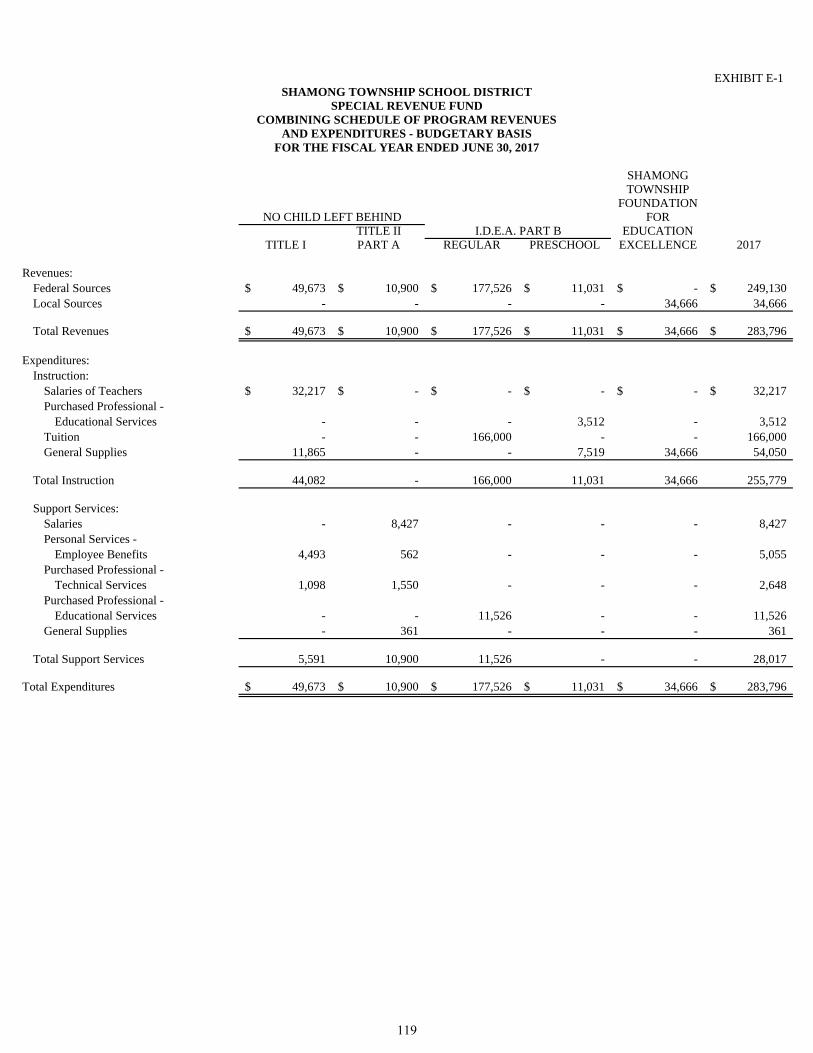
EXHIBIT E-1
SHAMONG TOWNSHIP
FOUNDATIONFOR
TITLE II EDUCATION TITLE I PART A REGULAR PRESCHOOL EXCELLENCE 2017
Revenues:Federal Sources 49,673$ 10,900$ 177,526$ 11,031$ -$ 249,130$ Local Sources - - - - 34,666 34,666
Total Revenues 49,673$ 10,900$ 177,526$ 11,031$ 34,666$ 283,796$
Expenditures:Instruction:
Salaries of Teachers 32,217$ -$ -$ -$ -$ 32,217$ Purchased Professional -
Educational Services - - - 3,512 - 3,512 Tuition - - 166,000 - - 166,000 General Supplies 11,865 - - 7,519 34,666 54,050
Total Instruction 44,082 - 166,000 11,031 34,666 255,779
Support Services:Salaries - 8,427 - - - 8,427 Personal Services -
Employee Benefits 4,493 562 - - - 5,055 Purchased Professional -
Technical Services 1,098 1,550 - - - 2,648 Purchased Professional -
Educational Services - - 11,526 - - 11,526 General Supplies - 361 - - - 361
Total Support Services 5,591 10,900 11,526 - - 28,017
Total Expenditures 49,673$ 10,900$ 177,526$ 11,031$ 34,666$ 283,796$
NO CHILD LEFT BEHINDI.D.E.A. PART B
SHAMONG TOWNSHIP SCHOOL DISTRICTSPECIAL REVENUE FUND
COMBINING SCHEDULE OF PROGRAM REVENUESAND EXPENDITURES - BUDGETARY BASIS
FOR THE FISCAL YEAR ENDED JUNE 30, 2017
119

This page intentionally left blank.
120

F. Capital Projects Fund
121

This page intentionally left blank.
122

EX
HIB
IT F
-1
TR
AN
SF
ER
UN
EX
PE
ND
ED
CA
NC
EL
LA
TIO
NT
O D
EB
TB
AL
AN
CE
OR
IGIN
AL
PR
IOR
CU
RR
EN
TO
F G
RA
NT
SE
RV
ICE
JUN
E 3
0,D
AT
EA
PP
RO
PR
IAT
ION
SY
EA
RS
YE
AR
RE
CE
IVA
BL
EF
UN
D20
17
Rep
lace
men
t of
Ext
erio
r D
oors
at I
ndia
n M
ills
Mem
oria
l Sch
ool
3/31
/201
413
1,00
0$
11
1,32
3$
-$
-$
-$
19
,677
$
S
ecur
ity
Upd
grad
es a
t Ind
ian
Mil
ls M
emor
ial S
choo
l3/
31/2
014
227,
500
198,
308
24
,662
-
-
4,
530
Air
Con
diti
onin
g U
pdgr
ades
at
Indi
an M
ills
Ele
men
tary
Sch
ool
3/31
/201
41,
192,
000
56
4,97
3
90,8
99
-
-
536,
128
Sec
urit
y U
pdgr
ades
at I
ndia
nM
ills
Ele
men
tary
Sch
ool
3/31
/201
426
1,50
0
22
5,73
4
31,2
11
-
-
4,55
5
W
indo
w R
epla
cem
ent a
t Ind
ian
Mil
ls E
lem
enta
ry S
choo
l3/
31/2
014
169,
000
143,
961
-
-
20
,594
4,
445
Ren
ovat
ions
, Sit
e W
ork
& S
olar
Pan
elIn
stal
lati
on a
t Ind
ian
Mil
ls M
emor
ial
Sch
ool &
Ind
ian
Mil
ls S
choo
l9/
29/2
009
2,67
6,41
6
2,33
5,36
2
-
65
,558
275,
496
-
Tot
al4,
657,
416
$
3,
579,
661
$
146,
772
$
65
,558
$
29
6,09
0$
56
9,33
5$
Rec
onci
liat
ion
- U
nexp
ende
d C
apit
al P
roje
ct B
alan
ces
to F
und
Bal
ance
- J
une
30, 2
017
Une
xpen
ded
Pro
ject
Bal
ance
s Ju
ne 3
0, 2
017
569,
335
$
Les
s:S
DA
Gra
nt R
even
ue n
ot R
ecog
nize
d on
GA
AP
Bas
is(2
35,9
74)
Tot
al F
und
Bal
ance
(G
AA
P B
asis
) -
June
30,
201
733
3,36
1$
PR
OJE
CT
TIT
LE
/IS
SU
E
SH
AM
ON
G T
OW
NS
HIP
SC
HO
OL
DIS
TR
ICT
CA
PIT
AL
PR
OJE
CT
S F
UN
DS
UM
MA
RY
SC
HE
DU
LE
OF
PR
OJE
CT
EX
PE
ND
ITU
RE
SY
EA
R E
ND
ED
JU
NE
30,
201
7
EX
PE
ND
ITU
RE
S T
O D
AT
E
123
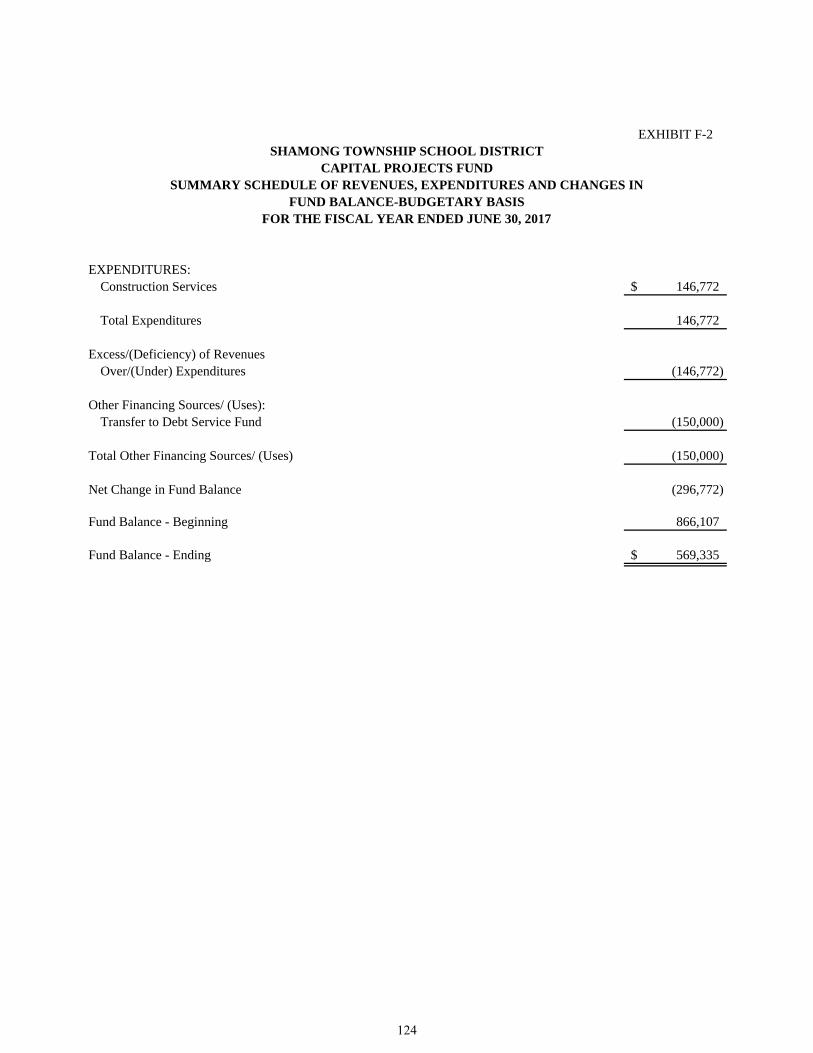
EXHIBIT F-2
EXPENDITURES:Construction Services 146,772$
Total Expenditures 146,772
Excess/(Deficiency) of RevenuesOver/(Under) Expenditures (146,772)
Other Financing Sources/ (Uses):Transfer to Debt Service Fund (150,000)
Total Other Financing Sources/ (Uses) (150,000)
Net Change in Fund Balance (296,772)
Fund Balance - Beginning 866,107
Fund Balance - Ending 569,335$
FOR THE FISCAL YEAR ENDED JUNE 30, 2017
SHAMONG TOWNSHIP SCHOOL DISTRICTCAPITAL PROJECTS FUND
SUMMARY SCHEDULE OF REVENUES, EXPENDITURES AND CHANGES INFUND BALANCE-BUDGETARY BASIS
124

EXHIBIT F-2a
REVISEDPRIOR CURRENT AUTHORIZED
PERIODS YEAR TOTALS COST
Revenues & Other Financing Sources:State Sources - SDA Grant 677,416$ -$ 677,416$ 677,416$ Bond Proceeds & Transfers 1,999,000 - 1,999,000 1,999,000
Total Revenues 2,676,416 - 2,676,416 2,676,416
Expenditures & Other Financing Uses:Purchased Professional & Technical
Services 243,063 - 243,063 243,063 Construction Services 2,053,511 - 2,053,511 2,053,511 Equipment Purchases Supplies 30,423 - 30,423 30,423 Miscellaneous 8,365 - 8,365 8,365
Total Expenditures 2,335,362 - 2,335,362 2,335,362
Other Financing Sources/ (Uses):Cancellation of Grant Receivable (65,558) - (65,558) (65,558) Transfer to Debt Service Fund (146,090) (129,406) (275,496) (275,496)
Total Other Financing Sources/ (Uses) (211,648) (129,406) (341,054) (341,054)
Excess/(Deficiency) of Revenues Over/(Under) Expenditures 129,406$ (129,406)$ -$ -$
Project Number 4740-050-09Grant Date N/ABond Authorization Date 8/26/10Bonds Authorization 8/26/10Bonds Issued 1,999,000Original Authorized Cost 2,676,416$ Additional Authorized Cost -$ Revised Authorized Cost 2,676,416$
Percentage Increase Over Original Authorized Cost 0.00%Percentage Completion Complete
Additional Project Information:
PROJECT STATUS--BUDGETARY BASIS
SHAMONG TOWNSHIP SCHOOL DISTRICTCAPITAL PROJECTS FUND
SCHEDULE OF PROJECT REVENUES, EXPENDITURES, PROJECT BALANCE, AND
FROM INCEPTION AND FOR THE YEAR ENDED JUNE 30, 2017
INDIAN MILLS MEMORIAL SCHOOL & INDIAN MILLS SCHOOLRENOVATIONS, SITE WORK AND SOLAR PANEL INSTALLATION
125

EXHIBIT F-2b
REVISEDPRIOR CURRENT AUTHORIZED
PERIODS YEAR TOTALS COST
Revenues & Other Financing Sources:State Sources - SDA Grant 52,400$ -$ 52,400$ 52,400$ Bond Proceeds & Transfers 78,600 - 78,600 78,600
Total Revenues 131,000 - 131,000 131,000
Expenditures & Other Financing Uses:Purchased Professional & Technical
Services 13,508 - 13,508 15,500 Construction Services 97,815 - 97,815 115,500
Total Expenditures 111,323 - 111,323 131,000
Excess/(Deficiency) of Revenues Over/(Under) Expenditures 19,677$ -$ 19,677$ -$
Project Number 4740-055-14-1013Grant Date N/ABond Authorization Date 2/11/15Bonds AuthorizationBonds Issued N/AOriginal Authorized Cost 131,000$ Additional Authorized Cost -$ Revised Authorized Cost 131,000$
Percentage Increase Over Original Authorized Cost 0.00%Percentage Completion 84.98%Original Target Completion Date 9/2016Revised Target Completion Date Complete
FROM INCEPTION AND FOR THE YEAR ENDED JUNE 30, 2017
Additional Project Information:
SHAMONG TOWNSHIP SCHOOL DISTRICTCAPITAL PROJECTS FUND
SCHEDULE OF PROJECT REVENUES, EXPENDITURES, PROJECT BALANCE, AND PROJECT STATUS--BUDGETARY BASIS
INDIAN MILLS MEMORIAL SCHOOLREPLACEMENT OF EXTERIOR DOORS
126

EXHIBIT F-2c
REVISEDPRIOR CURRENT AUTHORIZED
PERIODS YEAR TOTALS COST
Revenues & Other Financing Sources:State Sources - SDA Grant 91,000$ -$ 91,000$ 91,000$ Bond Proceeds & Transfers 136,500 - 136,500 136,500
Total Revenues 227,500 - 227,500 227,500
Expenditures & Other Financing Uses:Purchased Professional & Technical
Services 19,131 - 19,131 20,150 Construction Services 179,177 24,662 203,839 207,350
Total Expenditures 198,308 24,662 222,970 227,500
Excess/(Deficiency) of Revenues Over/(Under) Expenditures 29,192$ (24,662)$ 4,530$ -$
Project Number 4740-055-14-1012Grant Date N/ABond Authorization Date 2/11/15Bonds AuthorizationBonds Issued N/AOriginal Authorized Cost 227,500$ Additional Authorized Cost -$ Revised Authorized Cost 227,500$
Percentage Increase Over Original Authorized Cost 0.00%Percentage Completion 98.01%Original Target Completion Date 9/2016Revised Target Completion Date Complete
FROM INCEPTION AND FOR THE YEAR ENDED JUNE 30, 2017
Additional Project Information:
SHAMONG TOWNSHIP SCHOOL DISTRICTCAPITAL PROJECTS FUND
SCHEDULE OF PROJECT REVENUES, EXPENDITURES, PROJECT BALANCE, AND PROJECT STATUS--BUDGETARY BASIS
INDIAN MILLS MEMORIAL SCHOOLSECURITY UPGRADES
127

EXHIBIT F-2d
REVISEDPRIOR CURRENT AUTHORIZED
PERIODS YEAR TOTALS COST
Revenues & Other Financing Sources:State Sources - SDA Grant 476,800$ -$ 476,800$ 476,800$ Bond Proceeds & Transfers 715,200 - 715,200 715,200
Total Revenues 1,192,000 - 1,192,000 1,192,000
Expenditures & Other Financing Uses:Purchased Professional & Technical
Services 82,642 - 82,642 103,000 Construction Services 482,331 90,899 573,230 1,089,000
Total Expenditures 564,973 90,899 655,872 1,192,000
Excess/(Deficiency) of Revenues Over/(Under) Expenditures 627,027$ (90,899)$ 536,128$ -$
Project Number 4740-050-14-1005Grant Date N/ABond Authorization Date 2/11/15Bonds AuthorizationBonds Issued N/AOriginal Authorized Cost 1,192,000$ Additional Authorized Cost -$ Revised Authorized Cost 1,192,000$
Percentage Increase Over Original Authorized Cost 0.00%Percentage Completion 55.02%Original Target Completion Date 6/2017Revised Target Completion Date Complete
FROM INCEPTION AND FOR THE YEAR ENDED JUNE 30, 2017
Additional Project Information:
SHAMONG TOWNSHIP SCHOOL DISTRICTCAPITAL PROJECTS FUND
SCHEDULE OF PROJECT REVENUES, EXPENDITURES, PROJECT BALANCE, AND PROJECT STATUS--BUDGETARY BASIS
INDIAN MILLS SCHOOLCLASSROOM AIR CONDITIONING
128
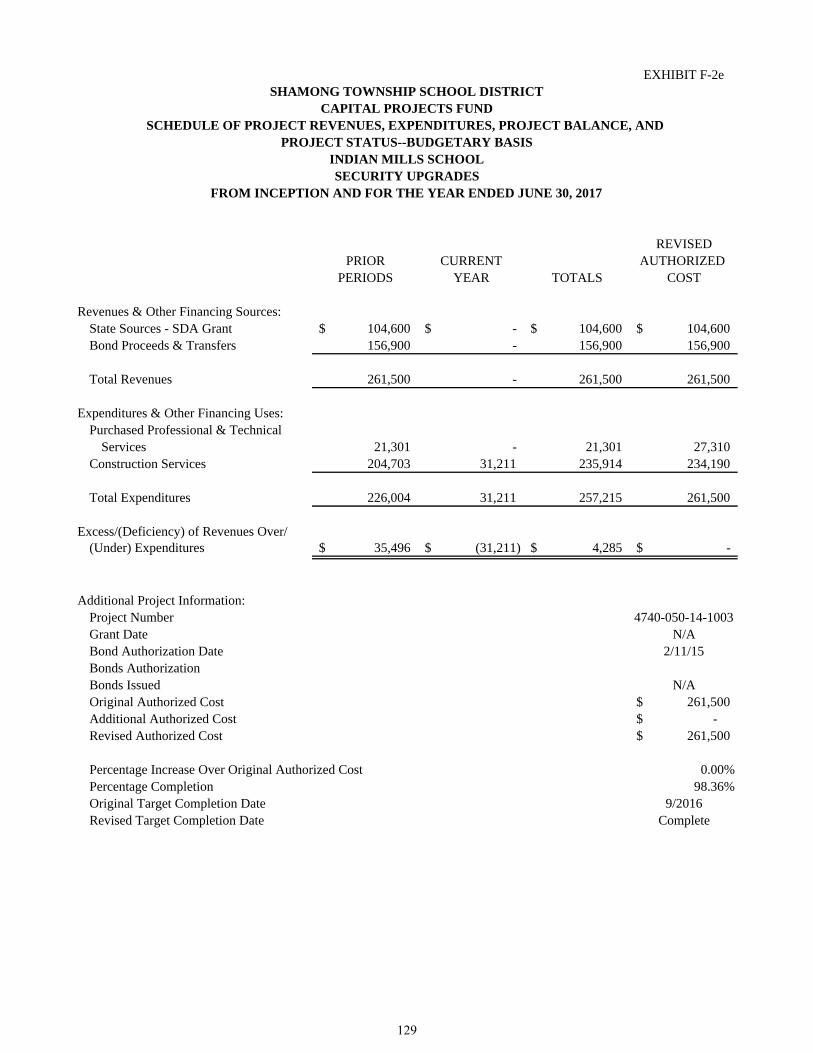
EXHIBIT F-2e
REVISEDPRIOR CURRENT AUTHORIZED
PERIODS YEAR TOTALS COST
Revenues & Other Financing Sources:State Sources - SDA Grant 104,600$ -$ 104,600$ 104,600$ Bond Proceeds & Transfers 156,900 - 156,900 156,900
Total Revenues 261,500 - 261,500 261,500
Expenditures & Other Financing Uses:Purchased Professional & Technical
Services 21,301 - 21,301 27,310 Construction Services 204,703 31,211 235,914 234,190
Total Expenditures 226,004 31,211 257,215 261,500
Excess/(Deficiency) of Revenues Over/(Under) Expenditures 35,496$ (31,211)$ 4,285$ -$
Project Number 4740-050-14-1003Grant Date N/ABond Authorization Date 2/11/15Bonds AuthorizationBonds Issued N/AOriginal Authorized Cost 261,500$ Additional Authorized Cost -$ Revised Authorized Cost 261,500$
Percentage Increase Over Original Authorized Cost 0.00%Percentage Completion 98.36%Original Target Completion Date 9/2016Revised Target Completion Date Complete
FROM INCEPTION AND FOR THE YEAR ENDED JUNE 30, 2017
Additional Project Information:
SHAMONG TOWNSHIP SCHOOL DISTRICTCAPITAL PROJECTS FUND
SCHEDULE OF PROJECT REVENUES, EXPENDITURES, PROJECT BALANCE, AND PROJECT STATUS--BUDGETARY BASIS
INDIAN MILLS SCHOOLSECURITY UPGRADES
129
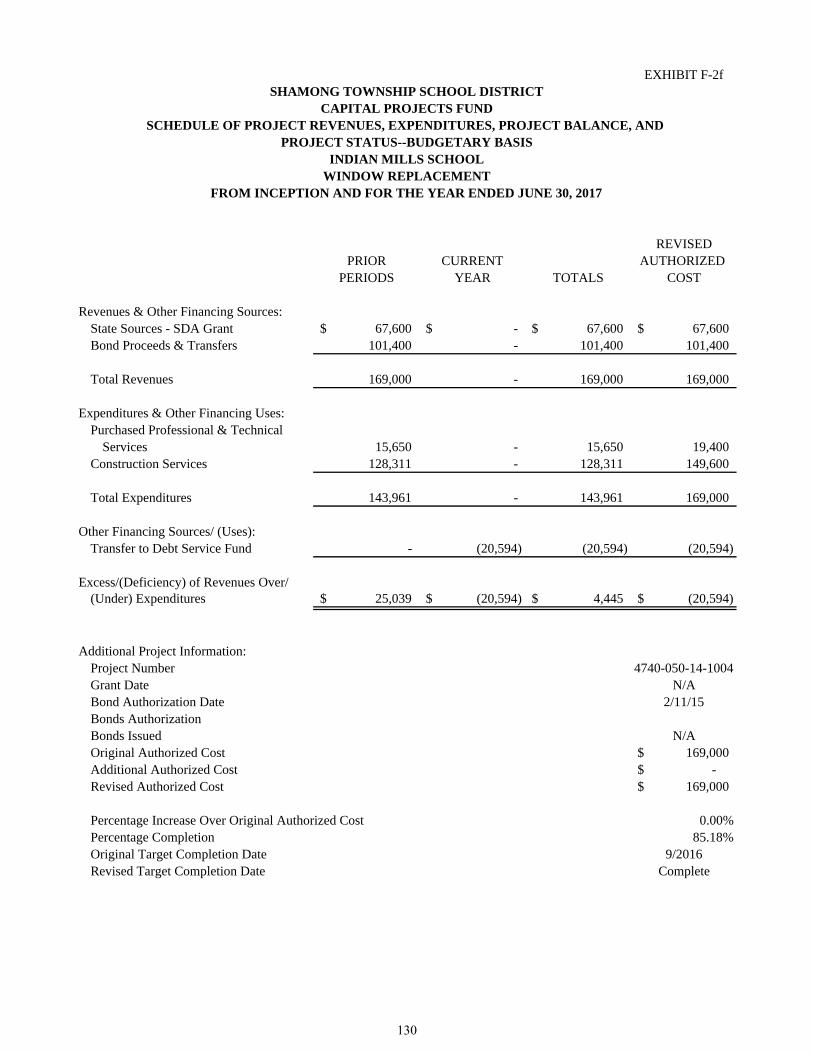
EXHIBIT F-2f
REVISEDPRIOR CURRENT AUTHORIZED
PERIODS YEAR TOTALS COST
Revenues & Other Financing Sources:State Sources - SDA Grant 67,600$ -$ 67,600$ 67,600$ Bond Proceeds & Transfers 101,400 - 101,400 101,400
Total Revenues 169,000 - 169,000 169,000
Expenditures & Other Financing Uses:Purchased Professional & Technical
Services 15,650 - 15,650 19,400 Construction Services 128,311 - 128,311 149,600
Total Expenditures 143,961 - 143,961 169,000
Other Financing Sources/ (Uses):Transfer to Debt Service Fund - (20,594) (20,594) (20,594)
Excess/(Deficiency) of Revenues Over/(Under) Expenditures 25,039$ (20,594)$ 4,445$ (20,594)$
Project Number 4740-050-14-1004Grant Date N/ABond Authorization Date 2/11/15Bonds AuthorizationBonds Issued N/AOriginal Authorized Cost 169,000$ Additional Authorized Cost -$ Revised Authorized Cost 169,000$
Percentage Increase Over Original Authorized Cost 0.00%Percentage Completion 85.18%Original Target Completion Date 9/2016Revised Target Completion Date Complete
FROM INCEPTION AND FOR THE YEAR ENDED JUNE 30, 2017
Additional Project Information:
SHAMONG TOWNSHIP SCHOOL DISTRICTCAPITAL PROJECTS FUND
SCHEDULE OF PROJECT REVENUES, EXPENDITURES, PROJECT BALANCE, AND PROJECT STATUS--BUDGETARY BASIS
INDIAN MILLS SCHOOLWINDOW REPLACEMENT
130

G. Proprietary Funds
131

This page intentionally left blank.
132

Enterprise Funds
133

This page intentionally left blank.
134

EXHIBIT G-1
TOTALSFOOD
SERVICE
Current Assets:Cash & Cash Equivalents 14,957$ Accounts Receivable:
State 129 Federal 3,098 Other 3,584 Interfund 6,944
Inventories 3,618
Total Current Assets 32,330
Noncurrent Assets:Furniture, Machinery & Equipment 63,622 Less: Accumulated Depreciation (44,456)
Total Capital Assets 19,166
Total Assets 51,496
Accounts Payable 2,251
Total Liabilities 2,251
Net Investment in Capital Assets 19,166 Unrestricted 30,079
Total Net Position 49,245$
LIABILITIES
NET ASSETS
ASSETS
SHAMONG TOWNSHIP SCHOOL DISTRICTENTERPRISE FUND
COMBINING SCHEDULE OF NET POSITIONAS OF JUNE 30, 2017
135

EXHIBIT G-2
TOTALSFOOD
SERVICE FUND
Operating Revenues:Local Sources:
Daily Sales - Reimbursable Programs 100,167$ Daily Sales - Nonreimbursable Programs 78,291 Miscellaneous 8,766
Total Operating Revenue 187,224
Operating Expenses:Cost of Sales 97,501 Salaries & Benefits 103,773 Miscellaneous Expenses 11,103 Management Fee 20,200 Supplies and Materials 8,602 Depreciation 4,821
Total Operating Expenses 246,000
Operating Income/(Loss) (58,776)
Nonoperating Revenues (Expenses):State Sources:
State School Lunch Program 2,090 Federal Sources:
National School Lunch Program 46,246 Healthy Hunger-Free Kids Act 2,879 Cash in Lieu of Commodities 16,034
Total Nonoperating Revenues/(Expenses) 67,249
Change in Net Position 8,473 Total Net Position - Beginning 40,772
Total Net Position - Ending 49,245$
SHAMONG TOWNSHIP SCHOOL DISTRICTENTERPRISE FUNDS
COMBINING STATEMENT OF REVENUESEXPENSES AND CHANGES IN FUND NET POSITION
FOR THE FISCAL YEAR ENDED JUNE 30, 2017
136
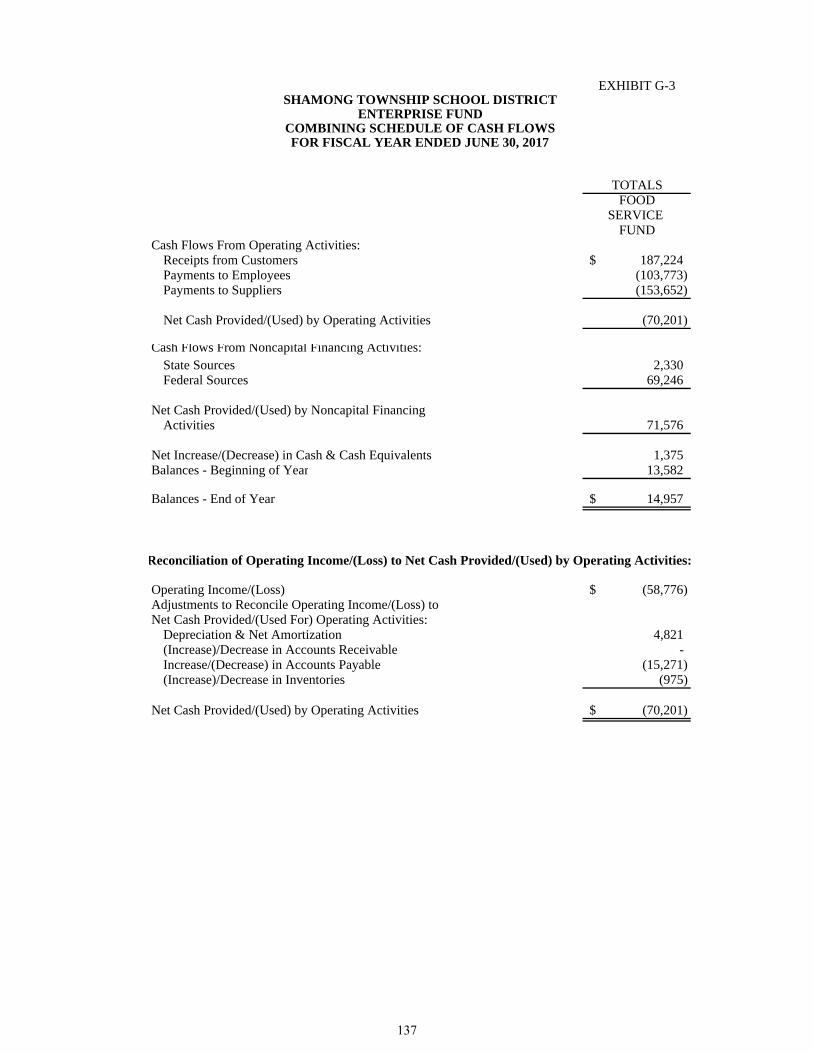
EXHIBIT G-3
TOTALSFOOD
SERVICE FUND
Cash Flows From Operating Activities:Receipts from Customers 187,224$ Payments to Employees (103,773) Payments to Suppliers (153,652)
Net Cash Provided/(Used) by Operating Activities (70,201)
Cash Flows From Noncapital Financing Activities:State Sources 2,330 Federal Sources 69,246
Net Cash Provided/(Used) by Noncapital FinancingActivities 71,576
Net Increase/(Decrease) in Cash & Cash Equivalents 1,375 Balances - Beginning of Year 13,582
Balances - End of Year 14,957$
Operating Income/(Loss) (58,776)$ Adjustments to Reconcile Operating Income/(Loss) toNet Cash Provided/(Used For) Operating Activities:
Depreciation & Net Amortization 4,821 (Increase)/Decrease in Accounts Receivable - Increase/(Decrease) in Accounts Payable (15,271) (Increase)/Decrease in Inventories (975)
Net Cash Provided/(Used) by Operating Activities (70,201)$
Reconciliation of Operating Income/(Loss) to Net Cash Provided/(Used) by Operating Activities:
SHAMONG TOWNSHIP SCHOOL DISTRICTENTERPRISE FUND
COMBINING SCHEDULE OF CASH FLOWSFOR FISCAL YEAR ENDED JUNE 30, 2017
137

This page intentionally left blank.
138

Internal Service Fund
Not Applicable
139

This page intentionally left blank.
140

H. Fiduciary Fund
141

This page intentionally left blank.
142

EXHIBIT H-1
PRIVATEPURPOSE
UNEMPLOYMENTCOMPENSATION STUDENT
INSURANCE ACTIVITY PAYROLL TOTAL
Assets:Cash & Cash Equivalents 111,935$ 61,107$ 11,078$ 184,120$
Total Assets 111,935 61,107 11,078 184,120
Liabilities:Payroll Deductions &
Withholdings - - 9,078 9,078 Interfund Payable - - 2,000 2,000 Due to State 3,035 - - 3,035 Due to Student Groups - 61,107 - 61,107
Total Liabilities 3,035 61,107 11,078 75,220
Restricted 108,900 - - 108,900
Total Net Position 108,900$ -$ -$ 108,900$
ASSETS
LIABILITIES
NET POSITION
AGENCY FUNDS
SHAMONG TOWNSHIP SCHOOL DISTRICTFIDUCIARY FUNDS
COMBINING STATEMENT OF FIDUCIARY NET POSITIONJUNE 30, 2017
143

EXHIBIT H-2
PRIVATEPURPOSE
UNEMPLOYMENTCOMPENSATION
INSURANCE TOTAL
Additions:Local Sources:
Employee Contributions 22,000$ 22,000$
Total Operating Revenues 22,000 22,000
Total Additions 22,000 22,000
Deductions:Unemployment Compensation Insurance Claims 9,241 9,241
Change in Net Position 12,759 12,759 Net Position, July 1 96,141 96,141
Net Position, June 30 108,900$ 108,900$
SHAMONG TOWNSHIP SCHOOL DISTRICTFIDUCIARY FUNDS
COMBINING STATEMENT OF CHANGES IN FIDUCIARY NET POSITIONJUNE 30, 2017
144
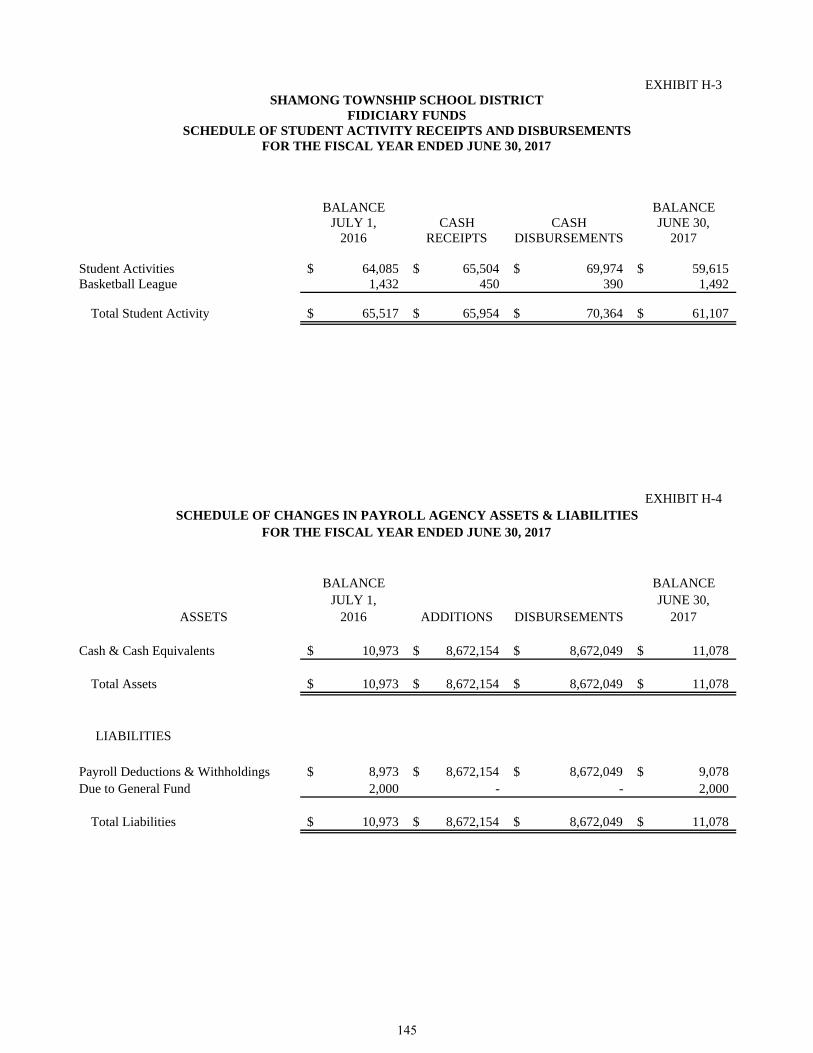
EXHIBIT H-3
BALANCE BALANCEJULY 1, CASH CASH JUNE 30,
2016 RECEIPTS DISBURSEMENTS 2017
Student Activities 64,085$ 65,504$ 69,974$ 59,615$ Basketball League 1,432 450 390 1,492
Total Student Activity 65,517$ 65,954$ 70,364$ 61,107$
EXHIBIT H-4
BALANCE BALANCEJULY 1, JUNE 30,
2016 ADDITIONS DISBURSEMENTS 2017
Cash & Cash Equivalents 10,973$ 8,672,154$ 8,672,049$ 11,078$
Total Assets 10,973$ 8,672,154$ 8,672,049$ 11,078$
Payroll Deductions & Withholdings 8,973$ 8,672,154$ 8,672,049$ 9,078$ Due to General Fund 2,000 - - 2,000
Total Liabilities 10,973$ 8,672,154$ 8,672,049$ 11,078$
ASSETS
LIABILITIES
SCHEDULE OF CHANGES IN PAYROLL AGENCY ASSETS & LIABILITIESFOR THE FISCAL YEAR ENDED JUNE 30, 2017
SHAMONG TOWNSHIP SCHOOL DISTRICTFIDICIARY FUNDS
SCHEDULE OF STUDENT ACTIVITY RECEIPTS AND DISBURSEMENTSFOR THE FISCAL YEAR ENDED JUNE 30, 2017
145

This page intentionally left blank.
146
I. Long-Term Debt
147

This page intentionally left blank.
148
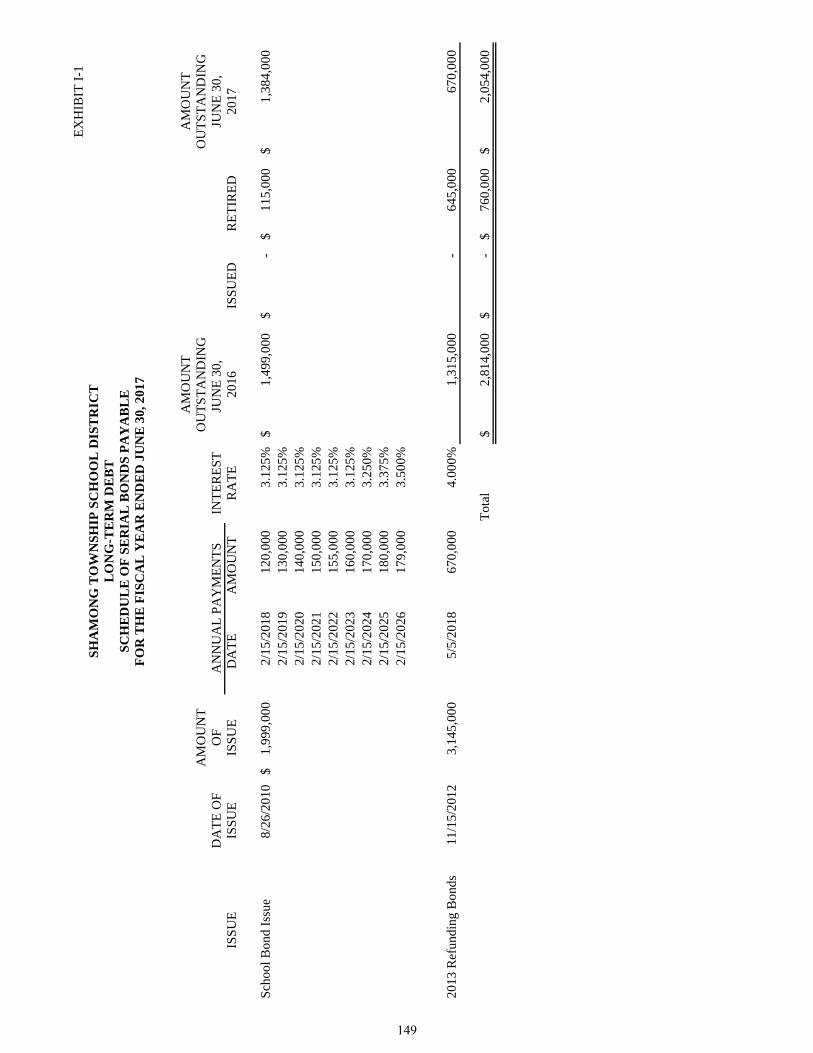
EX
HIB
IT I
-1
AM
OU
NT
AM
OU
NT
AM
OU
NT
OU
TS
TA
ND
ING
OU
TS
TA
ND
ING
DA
TE
OF
OF
INT
ER
ES
TJU
NE
30,
JU
NE
30,
ISS
UE
ISS
UE
DA
TE
AM
OU
NT
RA
TE
2016
ISS
UE
DR
ET
IRE
D20
17
Sch
ool B
ond
Issu
e8/
26/2
010
1,99
9,00
0$
2/15
/201
812
0,00
03.
125%
1,49
9,00
0$
-
$
11
5,00
0$
1,38
4,00
0$
2/
15/2
019
130,
000
3.12
5%2/
15/2
020
140,
000
3.12
5%2/
15/2
021
150,
000
3.12
5%2/
15/2
022
155,
000
3.12
5%2/
15/2
023
160,
000
3.12
5%2/
15/2
024
170,
000
3.25
0%2/
15/2
025
180,
000
3.37
5%2/
15/2
026
179,
000
3.50
0%
2013
Ref
undi
ng B
onds
11/1
5/20
123,
145,
000
5/
5/20
1867
0,00
04.
000%
1,31
5,00
0
-
64
5,00
0
670,
000
Tot
al2,
814,
000
$
-
$
760,
000
$
2,
054,
000
$
ISS
UE
AN
NU
AL
PA
YM
EN
TS
SH
AM
ON
G T
OW
NS
HIP
SC
HO
OL
DIS
TR
ICT
LO
NG
-TE
RM
DE
BT
SC
HE
DU
LE
OF
SE
RIA
L B
ON
DS
PA
YA
BL
EF
OR
TH
E F
ISC
AL
YE
AR
EN
DE
D J
UN
E 3
0, 2
017
149
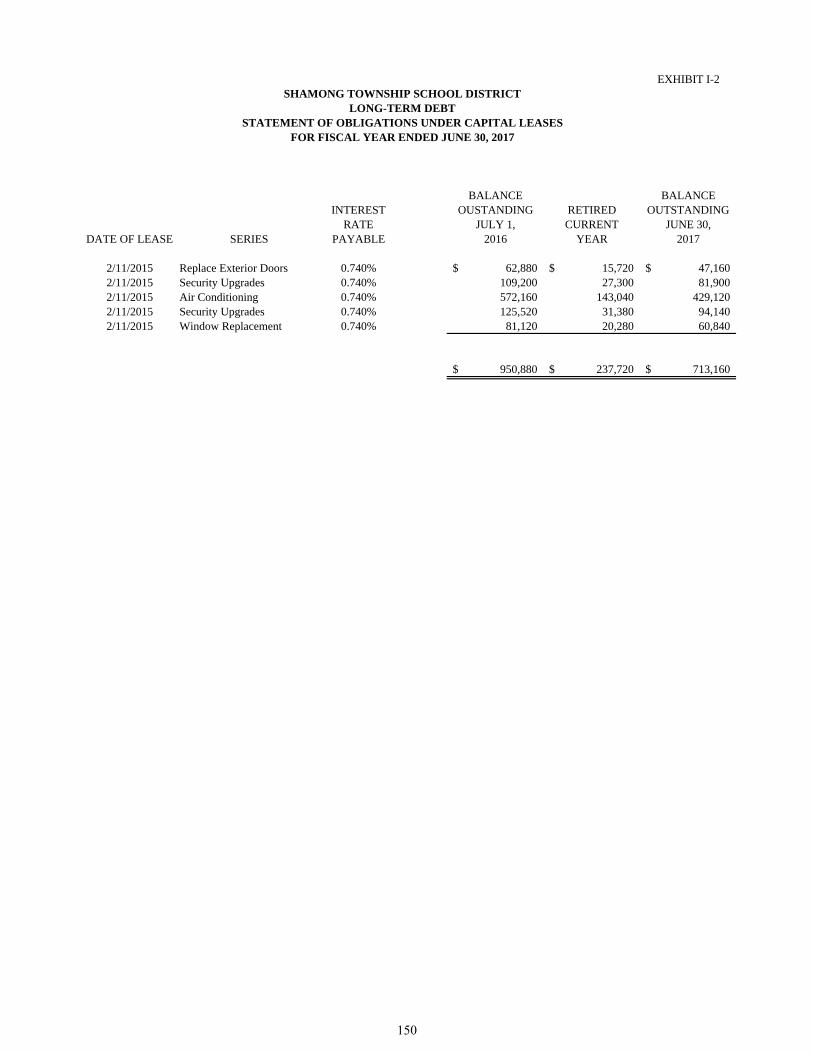
EXHIBIT I-2
BALANCE BALANCEINTEREST OUSTANDING RETIRED OUTSTANDING
RATE JULY 1, CURRENT JUNE 30,DATE OF LEASE SERIES PAYABLE 2016 YEAR 2017
2/11/2015 Replace Exterior Doors 0.740% 62,880$ 15,720$ 47,160$ 2/11/2015 Security Upgrades 0.740% 109,200 27,300 81,900 2/11/2015 Air Conditioning 0.740% 572,160 143,040 429,120 2/11/2015 Security Upgrades 0.740% 125,520 31,380 94,140 2/11/2015 Window Replacement 0.740% 81,120 20,280 60,840
950,880$ 237,720$ 713,160$
SHAMONG TOWNSHIP SCHOOL DISTRICT
STATEMENT OF OBLIGATIONS UNDER CAPITAL LEASESFOR FISCAL YEAR ENDED JUNE 30, 2017
LONG-TERM DEBT
150

EX
HIB
IT I
-3
VA
RIA
NC
EP
OS
ITIV
E/
(NE
GA
TIV
E)
OR
IGIN
AL
BU
DG
ET
FIN
AL
FIN
AL
TO
BU
DG
ET
TR
AN
SF
ER
SB
UD
GE
TA
CT
UA
LA
CT
UA
LR
even
ues:
Loc
al S
ourc
es:
Loc
al T
ax L
evy
560,
084
$
-$
560,
084
$
560,
084
$
-$
Sta
te S
ourc
es:
Deb
t Ser
vice
Aid
Typ
e II
30,6
94
-
30,6
94
30
,694
-
Mis
cell
aneo
us15
0,00
0
-
15
0,00
0
-
(150
,000
)
Tot
al R
even
ues
740,
778
-
740,
778
590,
778
(150
,000
)
Exp
endi
ture
s:R
egul
ar D
ebt S
ervi
ce:
Red
empt
ion
of P
rinc
ipal
760,
000
-
760,
000
760,
000
-
Inte
rest
100,
778
-
100,
778
100,
778
-
Tot
al R
egul
ar D
ebt S
ervi
ce86
0,77
8
-
86
0,77
8
86
0,77
8
-
Exc
ess/
(Def
icie
ncy)
of
Rev
enue
s O
ver
(Und
er)
Exp
endi
ture
s(1
20,0
00)
-
(120
,000
)
(270
,000
)
(150
,000
)
Oth
er F
inan
cing
Sou
rces
/(U
ses)
:O
pera
ting
Tra
nsfe
rs I
n -
Gen
eral
Fun
d12
0,00
0
-
12
0,00
0
12
0,00
0
-
O
pera
ting
Tra
nsfe
rs I
n -
Cap
ital
Pro
ject
s F
und
-
-
-
15
0,00
0
15
0,00
0
Tot
al O
ther
Fin
anci
ng S
ourc
es/(
Use
s)12
0,00
0
-
12
0,00
0
27
0,00
0
15
0,00
0
Fun
d B
alan
ce, J
uly
1,3
-
3
3
-
Fun
d B
alan
ce, J
une
303
$
-$
3$
3$
-$
JUN
E 3
0, 2
017
SH
AM
ON
G T
OW
NS
HIP
SC
HO
OL
DIS
TR
ICT
DE
BT
SE
RV
ICE
FU
ND
BU
DG
ET
AR
Y C
OM
PA
RIS
ON
SC
HE
DU
LE
FO
R F
ISC
AL
YE
AR
EN
DE
D J
UN
E 3
0, 2
017
151

This page intentionally left blank.
152
STATISTICAL SECTION (Unaudited)
153

This page intentionally left blank.
154

Financial Trends Information
Financial trends information is intended to assist the user in understanding and assessing how the School District's financial position has changed over time.Please refer to the following exhibits for a historical view of the School District's
155

This page intentionally left blank.
156
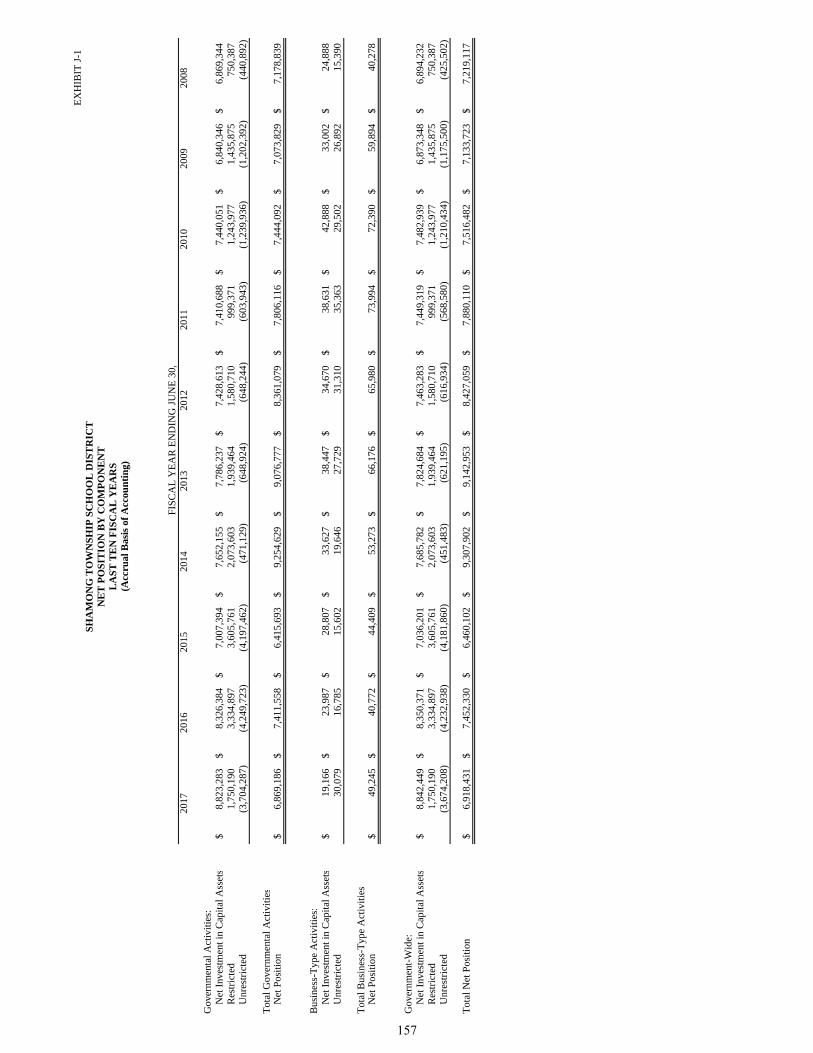
EX
HIB
IT J
-1
2017
2016
2015
2014
2013
2012
2011
2010
2009
2008
Gov
ernm
enta
l Act
ivit
ies:
Net
Inv
estm
ent i
n C
apit
al A
sset
s8,
823,
283
$
8,32
6,38
4$
7,
007,
394
$
7,65
2,15
5$
7,
786,
237
$
7,42
8,61
3$
7,
410,
688
$
7,44
0,05
1$
6,
840,
346
$
6,86
9,34
4$
R
estr
icte
d1,
750,
190
3,33
4,89
7
3,
605,
761
2,07
3,60
3
1,
939,
464
1,58
0,71
0
99
9,37
1
1,24
3,97
7
1,
435,
875
750,
387
U
nres
tric
ted
(3,7
04,2
87)
(4,2
49,7
23)
(4,1
97,4
62)
(4
71,1
29)
(648
,924
)
(6
48,2
44)
(6
03,9
43)
(1,2
39,9
36)
(1
,202
,392
)
(440
,892
)
Tot
al G
over
nmen
tal A
ctiv
itie
sN
et P
osit
ion
6,86
9,18
6$
7,
411,
558
$
6,41
5,69
3$
9,
254,
629
$
9,07
6,77
7$
8,
361,
079
$
7,80
6,11
6$
7,
444,
092
$
7,07
3,82
9$
7,
178,
839
$
Bus
ines
s-T
ype
Act
ivit
ies:
Net
Inv
estm
ent i
n C
apit
al A
sset
s19
,166
$
23,9
87$
28
,807
$
33,6
27$
38
,447
$
34,6
70$
38
,631
$
42,8
88$
33
,002
$
24,8
88$
U
nres
tric
ted
30,0
79
16
,785
15,6
02
19,6
46
27,7
29
31,3
10
35
,363
29
,502
26
,892
15
,390
Tot
al B
usin
ess-
Typ
e A
ctiv
itie
sN
et P
osit
ion
49,2
45$
40
,772
$
44,4
09$
53
,273
$
66,1
76$
65
,980
$
73,9
94$
72
,390
$
59,8
94$
40
,278
$
Gov
ernm
ent-
Wid
e:N
et I
nves
tmen
t in
Cap
ital
Ass
ets
8,84
2,44
9$
8,
350,
371
$
7,03
6,20
1$
7,
685,
782
$
7,82
4,68
4$
7,
463,
283
$
7,44
9,31
9$
7,
482,
939
$
6,87
3,34
8$
6,
894,
232
$
Res
tric
ted
1,75
0,19
0
3,
334,
897
3,60
5,76
1
2,
073,
603
1,93
9,46
4
1,
580,
710
999,
371
1,
243,
977
1,43
5,87
5
75
0,38
7
Unr
estr
icte
d(3
,674
,208
)
(4
,232
,938
)
(4
,181
,860
)
(451
,483
)
(6
21,1
95)
(616
,934
)
(568
,580
)
(1
,210
,434
)
(1,1
75,5
00)
(4
25,5
02)
Tot
al N
et P
osit
ion
6,91
8,43
1$
7,
452,
330
$
6,46
0,10
2$
9,
307,
902
$
9,14
2,95
3$
8,
427,
059
$
7,88
0,11
0$
7,
516,
482
$
7,13
3,72
3$
7,
219,
117
$
SH
AM
ON
G T
OW
NS
HIP
SC
HO
OL
DIS
TR
ICT
NE
T P
OS
ITIO
N B
Y C
OM
PO
NE
NT
LA
ST
TE
N F
ISC
AL
YE
AR
S(A
ccru
al B
asis
of
Acc
oun
tin
g)
FIS
CA
L Y
EA
R E
ND
ING
JU
NE
30 ,
157
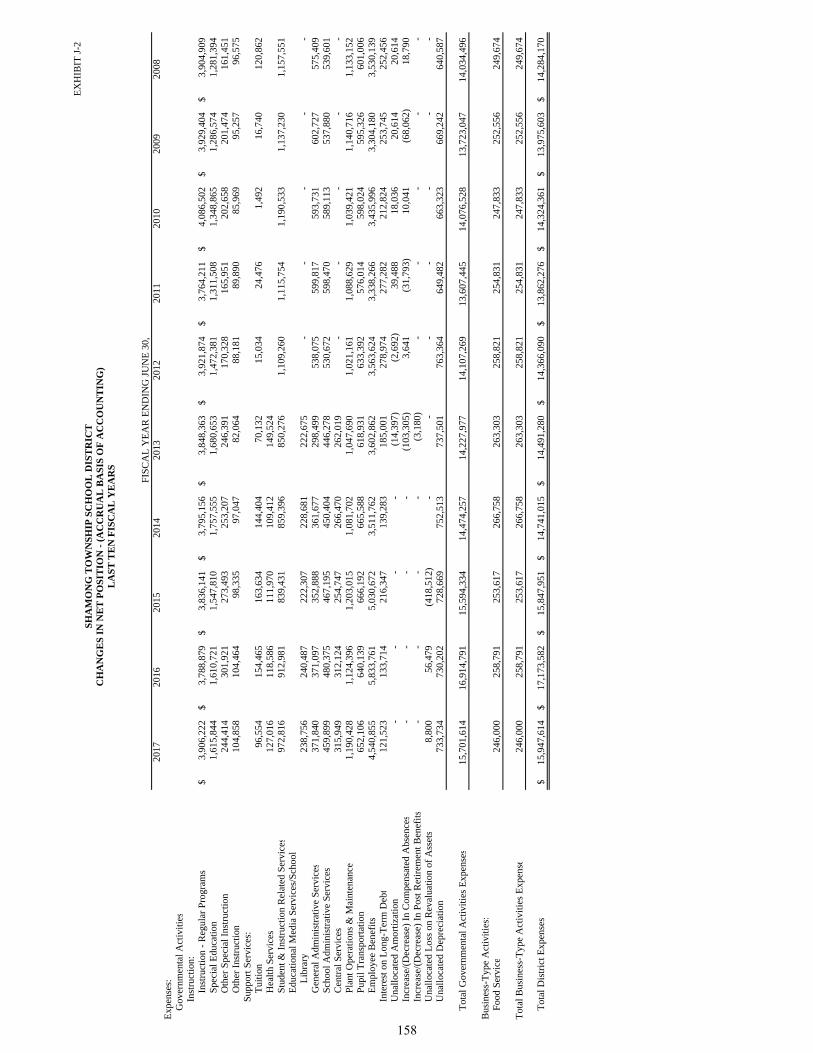
EX
HIB
IT J
-2
2017
2016
2015
2014
2013
2012
2011
2010
2009
2008
Exp
ense
s:G
over
nmen
tal A
ctiv
itie
sIn
stru
ctio
n:In
stru
ctio
n -
Reg
ular
Pro
gram
s3,
906,
222
$
3,78
8,87
9$
3,83
6,14
1$
3,79
5,15
6$
3,84
8,36
3$
3,
921,
874
$
3,76
4,21
1$
4,08
6,50
2$
3,92
9,40
4$
3,90
4,90
9$
Spe
cial
Edu
cati
o n1,
615,
844
1,61
0,72
1
1,54
7,81
0
1,75
7,55
5
1,68
0,65
3
1,
472,
381
1,31
1,50
8
1,34
8,86
5
1,28
6,57
4
1,28
1,39
4
Oth
er S
peci
al I
nstr
ucti
o n24
4,41
4
301,
921
273,
493
253,
207
246,
391
17
0,32
8
165,
951
202,
658
201,
474
161,
451
O
ther
Ins
truc
tio n
104,
858
10
4,46
4
98
,335
97
,047
82
,064
88,1
81
89
,890
85
,969
95
,257
96
,575
S
uppo
rt S
ervi
ces:
Tui
tio n
96,5
54
15
4,46
5
16
3,63
4
14
4,40
4
70
,132
15,0
34
24
,476
1,
492
16
,740
12
0,86
2
Hea
lth
Ser
vice
s12
7,01
6
118,
586
111,
970
109,
412
149,
524
S
tude
nt &
Ins
truc
tion
Rel
ated
Ser
vice
s97
2,81
6
912,
981
839,
431
859,
396
850,
276
1,
109,
260
1,11
5,75
4
1,19
0,53
3
1,13
7,23
0
1,15
7,55
1
Edu
cati
onal
Med
ia S
ervi
ces/
Sch
ool
L
ibra
ry23
8,75
6
240,
487
222,
307
228,
681
222,
675
-
-
-
-
-
Gen
eral
Adm
inis
trat
ive
Ser
vice
s37
1,84
0
371,
097
352,
888
361,
677
298,
499
53
8,07
5
599,
817
593,
731
602,
727
575,
409
S
choo
l Adm
inis
trat
ive
Ser
vice
s45
9,89
9
480,
375
467,
195
450,
404
446,
278
53
0,67
2
598,
470
589,
113
537,
880
539,
601
C
entr
al S
ervi
ces
315,
949
31
2,12
4
25
4,74
7
26
6,47
0
26
2,01
9
-
-
-
-
-
P
lant
Ope
rati
ons
& M
aint
enan
ce1,
190,
428
1,12
4,39
6
1,20
3,01
5
1,08
1,70
2
1,04
7,69
0
1,
021,
161
1,08
8,62
9
1,03
9,42
1
1,14
0,71
6
1,13
3,15
2
Pup
il T
rans
port
atio
n65
2,10
6
640,
139
666,
192
665,
588
618,
931
63
3,39
2
576,
014
598,
024
595,
326
601,
006
E
mpl
oyee
Ben
efit s
4,54
0,85
5
5,
833,
761
5,
030,
672
3,
511,
762
3,
602,
862
3,56
3,62
4
3,
338,
266
3,
435,
996
3,
304,
180
3,
530,
139
In
tere
st o
n L
ong-
Ter
m D
ebt
121,
523
13
3,71
4
21
6,34
7
13
9,28
3
18
5,00
1
278,
974
27
7,28
2
21
2,82
4
25
3,74
5
25
2,45
6
Una
lloc
ated
Am
orti
zati
o n-
-
-
-
(1
4,39
7)
(2,6
92)
39,4
88
18,0
36
20,6
14
20,6
14
Incr
ease
/(D
ecre
ase)
In
Com
pens
ated
Abs
ence
s-
-
-
-
(1
03,3
05)
3,64
1
(3
1,79
3)
10
,041
(6
8,06
2)
18
,790
In
crea
se/(
Dec
reas
e) I
n P
ost R
etir
emen
t Ben
efit
s-
-
-
-
(3
,180
)
-
-
-
-
-
Una
lloc
ated
Los
s on
Rev
alua
tion
of
Ass
ets
8,80
0
56
,479
(4
18,5
12)
-
-
-
-
-
-
-
Una
lloc
ated
Dep
reci
atio
n73
3,73
4
730,
202
728,
669
752,
513
737,
501
76
3,36
4
649,
482
663,
323
669,
242
640,
587
Tot
al G
over
nmen
tal A
ctiv
itie
s E
xpen
ses
15,7
01,6
14
16,9
14,7
91
15
,594
,334
14,4
74,2
57
14
,227
,977
14
,107
,269
13
,607
,445
14,0
76,5
28
13
,723
,047
14,0
34,4
96
Bus
ines
s-T
ype
Act
ivit
ies :
Foo
d S
ervi
ce24
6,00
0
258,
791
253,
617
266,
758
263,
303
25
8,82
1
254,
831
247,
833
252,
556
249,
674
Tot
al B
usin
ess-
Typ
e A
ctiv
itie
s E
xpen
s e24
6,00
0
258,
791
253,
617
266,
758
263,
303
25
8,82
1
254,
831
247,
833
252,
556
249,
674
Tot
a l D
istr
ict E
xpen
ses
15,9
47,6
14$
17,1
73,5
82$
15,8
47,9
51$
14,7
41,0
15$
14,4
91,2
80$
14
,366
,090
$
13
,862
,276
$
14
,324
,361
$
13
,975
,603
$
14
,284
,170
$
SH
AM
ON
G T
OW
NS
HIP
SC
HO
OL
DIS
TR
ICT
CH
AN
GE
S I
N N
ET
PO
SIT
ION
- (
AC
CR
UA
L B
AS
IS O
F A
CC
OU
NT
ING
)L
AS
T T
EN
FIS
CA
L Y
EA
RS
FIS
CA
L Y
EA
R E
ND
ING
JU
NE
30 ,
158

EX
HIB
IT J
-2
2017
2016
2015
2014
2013
2012
2011
2010
2009
2008
Rev
enue
s:O
pera
ting
Gra
nts
& C
ontr
ibut
ion s
1,85
1,78
4$
3,
503,
214
$
2,82
9,25
2$
32
5,89
6$
289,
841
$
28
4,52
7$
307,
826
$
31
4,03
4$
266,
246
$
32
9,14
4$
Tot
al G
over
nmen
tal A
ctiv
itie
sP
rogr
am R
even
ues
1,85
1,78
4
3,
503,
214
2,82
9,25
2
325,
896
289,
841
284,
527
30
7,82
6
31
4,03
4
26
6,24
6
32
9,14
4
Bus
ines
s-T
ype
Act
ivit
ies :
Cha
rges
for
Ser
vice
s:F
ood
Ser
vic e
178,
458
18
1,50
2
176,
447
180,
159
201,
662
178,
804
19
4,31
0
19
5,55
8
20
4,48
3
19
1,80
9
Ope
rati
ng G
rant
s:F
ood
Ser
vic e
67,2
49
64
,568
63
,144
67
,093
57
,554
64
,404
57
,368
49
,356
50
,410
50
,932
Tot
al B
usin
ess
Typ
e A
ctiv
itie
sP
rogr
am R
even
ues
245,
707
24
6,07
0
239,
591
247,
252
259,
216
243,
208
25
1,67
8
24
4,91
4
25
4,89
3
24
2,74
1
Tot
al D
istr
ict P
rogr
am R
even
ues
2,09
7,49
1$
3,
749,
284
$
3,06
8,84
3$
57
3,14
8$
549,
057
$
52
7,73
5$
559,
504
$
55
8,94
8$
521,
139
$
57
1,88
5$
Net
/(E
xpen
se)/
Rev
enue
:G
over
nmen
tal A
ctiv
itie
s(1
3,84
9,83
0)$
(13,
411,
577)
$
(1
2,76
5,08
2)$
(14,
148,
361)
$
(1
3,93
8,13
6)$
(13,
822,
742)
$
(1
3,29
9,61
9)$
(13,
762,
494)
$
(1
3,45
6,80
1)$
(13,
705,
352)
$
B
usin
ess-
Typ
e A
ctiv
itie
s(2
93)
(1
2,72
1)
(14,
026)
(19,
506)
(4,0
87)
(1
5,61
3)
(3,1
53)
(2
,919
)
2,33
7
(6
,933
)
Tot
al D
istr
ict-
Wid
e N
et E
xpen
se(1
3,85
0,12
3)$
(13,
424,
298)
$
(1
2,77
9,10
8)$
(14,
167,
867)
$
(1
3,94
2,22
3)$
(13,
838,
355)
$
(1
3,30
2,77
2)$
(13,
765,
413)
$
(1
3,45
4,46
4)$
(13,
712,
285)
$
FIS
CA
L Y
EA
R E
ND
ING
JU
NE
30 ,
SH
AM
ON
G T
OW
NS
HIP
SC
HO
OL
DIS
TR
ICT
CH
AN
GE
S I
N N
ET
PO
SIT
ION
- (
AC
CR
UA
L B
AS
IS O
F A
CC
OU
NT
ING
)L
AS
T T
EN
FIS
CA
L Y
EA
RS
159

EX
HIB
IT J
-2
2017
2016
2015
2014
2013
2012
2011
2010
2009
2008
Gen
eral
Rev
enue
s &
Oth
er C
hang
es in
Net
Pos
itio
n :G
over
nmen
tal A
ctiv
itie
s:T
axes
:P
rope
rty
Tax
es, L
evie
d fo
r G
ener
a l
Pur
pose
s, N
et9,
541,
312
$
9,
285,
085
$
9,
068,
136
$
8,
902,
667
$
8,
926,
550
$
8,
926,
550
$
8,
765,
917
$
8,
459,
660
$
8,
158,
533
$
7,
868,
988
$
F
eder
al &
Sta
te A
id U
nres
tric
ted
4,35
3,40
8
4,72
5,90
6
4,35
1,47
9
5,
336,
195
5,51
2,21
1
5,
180,
485
4,
711,
979
5,57
3,84
6
5,
089,
474
5,55
7,52
6
T
uiti
on R
ecei
ved
68,2
44
15,1
00
-
-
-
54,0
19
4,
965
13
,844
-
15,9
25
Mis
cell
aneo
us I
ncom
e21
0,09
4
36
4,09
7
82
,416
158,
903
21
5,07
3
216,
651
181,
782
90
,407
108,
784
23
6,21
4
T
rans
fers
-
-
-
-
-
-
(3,0
00)
(5,0
00)
(5,0
00)
(8,0
00)
U
nall
ocat
ed A
mor
tiza
tio n
-
-
36
,097
-
-
-
-
-
-
-
Dec
reas
e In
Com
pens
ated
Abs
ence
s-
16,3
54
27
,220
-
-
-
-
-
-
-
Dec
reas
e In
Pos
t Ret
irem
ent B
enef
its
4,40
0
90
0
4,
400
-
-
-
-
-
-
-
Tot
al G
over
nmen
tal A
ctiv
itie
s14
,177
,458
14
,407
,442
13,5
69,7
48
14
,397
,765
14,6
53,8
34
14
,377
,705
13,6
61,6
43
14
,132
,757
13,3
51,7
91
13
,670
,653
Bus
ines
s-ty
pe A
ctiv
itie
s 8,
766
9,08
4
5,16
2
6,60
3
4,28
3
7,59
9
4,75
7
15,4
15
17
,279
14,5
64
Tot
al D
istr
ict-
Wid
e14
,186
,224
$
14
,416
,526
$
13,5
74,9
10$
14
,404
,368
$
14,6
58,1
17$
14
,385
,304
$
13,6
66,4
00$
14
,148
,172
$
13,3
69,0
70$
13
,685
,217
$
Cha
nge
in N
et P
osit
ion:
Gov
ernm
enta
l Act
ivit
ies
327,
628
995,
865
804,
666
24
9,40
4
715,
698
55
4,96
3
36
2,02
4
370,
263
(1
05,0
10)
(3
4,69
9)
B
usin
ess-
Typ
e A
ctiv
itie
s8,
473
(3,6
37)
(8
,864
)
(1
2,90
3)
19
6
(8
,014
)
1,60
4
12,4
96
19
,616
7,63
1
Tot
al D
istr
ict
336,
101
$
992,
228
$
795,
802
$
236,
501
$
715,
894
$
546,
949
$
363,
628
$
382,
759
$
(85,
394)
$
(27,
068)
$
LA
ST
TE
N F
ISC
AL
YE
AR
S
FIS
CA
L Y
EA
R E
ND
ING
JU
NE
30,
SH
AM
ON
G T
OW
NS
HIP
SC
HO
OL
DIS
TR
ICT
CH
AN
GE
S I
N N
ET
PO
SIT
ION
- (
AC
CR
UA
L B
AS
IS O
F A
CC
OU
NT
ING
)
160

EX
HIB
IT J
-3
2017
2016
2015
2014
2013
2012
2011
2010
2009
2008
Gen
eral
Fun
d:R
estr
icte
d3,
133,
467
$
2,
788,
122
$
2,
735,
227
$
2,
073,
603
$
1,
939,
464
$
1,58
0,71
0$
1,
059,
235
$
693,
519
$
1,
435,
875
$
810,
387
$
U
nass
igne
d-
(112
,767
)
(4
52,6
51)
(119
,941
)
(1
42,1
03)
(8
1,71
2)
(9
3,33
8)
(1
71,2
80)
(6
86,9
61)
79
,201
Tot
al G
ener
al F
und
3,13
3,46
7$
2,67
5,35
5$
2,28
2,57
7$
1,95
3,66
2$
1,79
7,36
1$
1,
498,
998
$
965,
897
$
52
2,23
9$
748,
914
$
88
9,58
8$
All
Oth
er G
over
nmen
tal F
unds
:R
eser
ved
-$
-
$
-$
-
$
-$
-$
-$
-$
-$
138,
921
$
A
ssig
ned,
Rep
orte
d in
:C
apit
al P
roje
ct F
und
333,
361
57
1,42
4
1,24
1,52
8
280,
037
30
7,47
0
321,
603
65
2,74
0
339,
302
82
,041
158,
370
D
ebt S
ervi
ce F
und
3
3
3
2
23,8
84
14
19
6
5
-
Tot
al A
ll O
ther
Gov
ernm
enta
lF
unds
333,
364
$
57
1,42
7$
1,24
1,53
1$
280,
039
$
331,
354
$
32
1,61
7$
652,
759
$
33
9,30
8$
82,0
46$
29
7,29
1$
SH
AM
ON
G T
OW
NS
HIP
SC
HO
OL
DIS
TR
ICT
FU
ND
BA
LA
NC
ES
AN
D G
OV
ER
NM
EN
TA
L F
UN
DS
LA
ST
TE
N F
ISC
AL
YE
AR
S(M
odif
ied
Acc
rual
Bas
is o
f A
ccou
nti
ng)
FIS
CA
L Y
EA
R E
ND
ING
JU
NE
30,
161

EX
HIB
IT J
-4
2017
2016
2015
2014
2013
2012
2011
2010
2009
2008
Rev
enue
s: T
ax L
evy
9,54
1,31
2$
9,
285,
085
$
9,06
8,13
6$
8,90
2,66
7$
8,
926,
550
$
8,
926,
550
$
8,76
5,91
7$
8,
459,
660
$
8,15
8,53
3$
7,
868,
988
$
T
uiti
on68
,244
15,1
00
-
-
-
54
,019
4,
965
13,8
44
-
15,9
25
Mis
cell
aneo
us21
0,09
4
364,
097
17
2,54
8
15
8,90
3
215,
073
216,
651
18
1,78
2
90,4
07
120,
084
22
9,51
3
S
tate
Sou
rces
5,95
6,06
2
6,
193,
568
5,57
3,97
1
5,41
0,65
7
5,
525,
730
5,
081,
622
4,72
9,18
7
4,
903,
914
5,13
6,26
2
5,
666,
989
F
eder
al S
ourc
es24
9,13
0
264,
839
24
5,96
5
25
1,43
4
276,
322
383,
390
29
0,61
8
983,
966
21
9,45
8
219,
681
Tot
al R
even
ue16
,024
,842
16
,122
,689
15
,060
,620
14
,723
,661
14
,943
,675
14
,662
,232
13
,972
,469
14
,451
,791
13
,634
,337
14
,001
,096
Exp
endi
ture
s: I
nstr
ucti
on:
R
egul
ar3,
906,
222
3,78
8,87
9
3,
836,
141
3,
795,
156
3,91
3,15
4
3,92
1,87
4
3,
764,
211
4,08
6,50
2
3,
929,
404
3,93
8,06
6
S
peci
al E
duca
tion
1,61
5,84
4
1,
610,
721
1,54
7,81
0
1,75
7,55
5
1,
680,
653
1,
472,
381
1,31
1,50
8
1,
348,
865
1,28
6,57
4
1,
281,
394
Oth
er S
peci
al I
nstr
ucti
on24
4,41
4
301,
921
27
3,49
3
25
3,20
7
246,
391
170,
328
16
5,95
1
202,
658
20
1,47
4
161,
451
O
ther
Ins
truc
tion
104,
858
10
4,46
4
98,3
35
97,0
47
82,0
64
88,1
81
89,8
90
85
,969
95
,257
96,5
75
Sup
port
Ser
vice
s:
Tui
tion
96,5
54
15
4,46
5
163,
634
144,
404
70
,132
15
,034
24
,476
1,49
2
16
,740
120,
862
A
tten
danc
e an
d S
ocia
l Wor
k S
ervi
ces
30,0
00
-
-
-
-
-
-
-
-
-
H
ealt
h S
ervi
ces
127,
016
11
8,58
6
111,
970
109,
412
14
9,52
4
-
-
-
-
Stu
dent
& I
nstr
ucti
on R
elat
ed S
ervi
ces
942,
816
91
2,98
1
839,
431
859,
396
85
0,27
6
1,
140,
588
1,14
5,96
4
1,
219,
665
1,13
7,23
0
1,
173,
178
Edu
cati
onal
Med
ia S
ervi
ces/
Sch
ool
Lib
rary
238,
756
24
0,48
7
222,
307
228,
681
22
2,67
5
-
-
-
-
-
G
ener
al A
dmin
istr
ativ
e S
ervi
ces
371,
840
37
1,09
7
352,
888
361,
677
29
8,49
9
53
8,07
5
599,
817
59
3,73
1
602,
727
57
5,40
9
Sch
ool A
dmin
istr
ativ
e S
ervi
ces
459,
899
48
0,37
5
467,
195
450,
404
44
6,27
8
53
0,67
2
598,
470
58
9,11
3
537,
880
53
9,60
1
Cen
tral
Ser
vice
s31
5,94
9
312,
124
25
4,74
7
26
6,47
0
262,
019
-
-
-
-
-
Pla
nt O
pera
tion
s &
Mai
nten
ance
1,19
0,42
8
1,
124,
396
1,20
3,01
5
1,08
1,70
2
1,
076,
435
1,
021,
161
1,06
3,63
9
1,
039,
421
1,16
4,04
5
1,
133,
152
Pup
il T
rans
port
atio
n66
1,37
6
682,
225
66
6,19
2
66
5,58
8
618,
931
633,
392
57
6,01
4
598,
024
59
5,32
6
601,
006
E
mpl
oyee
Ben
efit
s4,
151,
645
3,87
2,38
4
3,
662,
778
3,
511,
762
3,60
2,86
2
3,56
3,62
4
3,
338,
266
3,43
7,75
6
3,
282,
740
3,53
0,13
9
C
apit
al O
utla
y48
6,39
8
1,46
8,09
5
20
6,14
8
54
,738
12
8,34
1
35
3,52
3
1,70
5,39
7
39
4,67
1
244,
658
70
2,00
9
Deb
t Ser
vice
:
Pri
ncip
al76
0,00
0
740,
000
84
7,34
6
81
5,00
0
785,
000
745,
000
62
5,00
0
600,
000
60
5,00
0
530,
000
I
nter
est &
Oth
er C
harg
es10
0,77
8
116,
815
13
9,82
5
16
6,47
6
202,
341
266,
440
20
2,75
7
218,
337
27
1,78
0
221,
951
T
otal
Exp
endi
ture
s15
,804
,793
16
,400
,015
14
,893
,255
14
,618
,675
14
,635
,575
14
,460
,273
15
,211
,360
14
,416
,204
13
,970
,835
14
,604
,793
Exc
ess/
(Def
icie
ncy)
of
Rev
enue
s O
ver/
(Und
er)
Exp
endi
ture
s22
0,04
9
(277
,326
)
16
7,36
5
10
4,98
6
308,
100
201,
959
(1
,238
,891
)
35,5
87
(336
,498
)
(603
,697
)
Oth
er F
inan
cing
Sou
rces
/(U
ses)
:
Lea
se-P
urch
ase
Agr
eem
ent P
roce
eds
-
-
1,18
8,60
0
-
-
-
-
-
-
-
C
ance
llat
ion
of G
rant
Rec
eiva
ble
-
-
(65,
558)
-
-
-
-
-
-
-
Ope
rati
ng T
rans
fers
In
-27
0,00
0
131,
671
35
,716
-
-
-
-
-
-
-
Ope
rati
ng T
rans
fers
(O
ut)
-(2
70,0
00)
(131
,671
)
(3
5,71
6)
-
-
-
-
-
-
-
M
isce
llan
eous
/Oth
er-
-
-
-
-
-
1,
996,
000
(5,0
00)
119,
500
(1
,299
)
Tot
al O
ther
Fin
anci
ng S
ourc
es/(
Use
s)-
-
1,
123,
042
-
-
-
1,99
6,00
0
(5
,000
)
11
9,50
0
(1,2
99)
Net
Cha
nge
in F
und
Bal
ance
s22
0,04
9$
(277
,326
)$
1,
290,
407
$
10
4,98
6$
30
8,10
0$
20
1,95
9$
757,
109
$
30
,587
$
(2
16,9
98)
$
(604
,996
)$
Deb
t Ser
vice
as
a P
erce
ntag
e of
Non
capi
tal E
xpen
ditu
res
6.0%
6.1%
7.2%
7.2%
7.3%
7.7%
6.5%
6.2%
6.8%
5.7%
Sou
rce:
Dis
tric
t Rec
ords
SH
AM
ON
G T
OW
NS
HIP
SC
HO
OL
DIS
TR
ICT
CH
AN
GE
S I
N F
UN
D B
AL
AN
CE
S, G
OV
ER
NM
EN
TA
L F
UN
DS
,L
AS
T T
EN
FIS
CA
L Y
EA
RS
(Mod
ifie
d A
ccru
al B
asis
of
Acc
oun
tin
g)
162

Revenue capacity information is intended to assist users in understanding and assessing the factors affecting the School District's ability to generate revenues. Please refer to the following exhibits for ahistorical view of these factors and how they relate to the School District's ability to generate revenues.
Revenue Capacity Information
163

This page intentionally left blank.
164

EX
HIB
IT J
-5
2017
2016
2015
2014
2013
2012
2011
2010
2009
2008
Inte
rest
on
Inve
stm
ents
7,30
7$
5,85
9$
4,
775
$
10,9
63$
16,1
30$
28,5
84$
27,9
70$
23,5
72$
18,1
76$
64,3
14$
S
port
s/C
lub
Fee
s26
,315
27
,403
9,
315
26,9
95
24,2
95
20,3
00
16,5
00
16,7
65
18,6
35
19,2
80
P
rior
Yea
r R
efun
ds36
,550
63
,200
7,
881
12,4
60
-
1,11
3
5,
648
15,5
97
20,5
59
9,26
5
Mis
cell
aneo
us10
5,25
6
19
3,32
9
126,
003
34
,023
14
4,58
5
116,
621
15
5,44
4
83,1
21
73,2
96
117,
461
175,
428
$
289,
791
$
14
7,97
4$
84
,441
$
18
5,01
0$
16
6,61
8$
205,
562
$
139,
055
$
130,
666
$
210,
320
$
Sou
rce:
Dis
tric
t rec
ords
FIS
CA
L Y
EA
R E
ND
ED
JU
NE
30
SH
AM
ON
G T
OW
NS
HIP
SC
HO
OL
DIS
TR
ICT
GE
NE
RA
L F
UN
D -
OT
HE
R L
OC
AL
RE
VE
NU
E B
Y S
OU
RC
EL
AS
T T
EN
FIS
CA
L Y
EA
RS
(Mod
ified
Acc
rual
Bas
is o
f Acc
ount
ing)
165
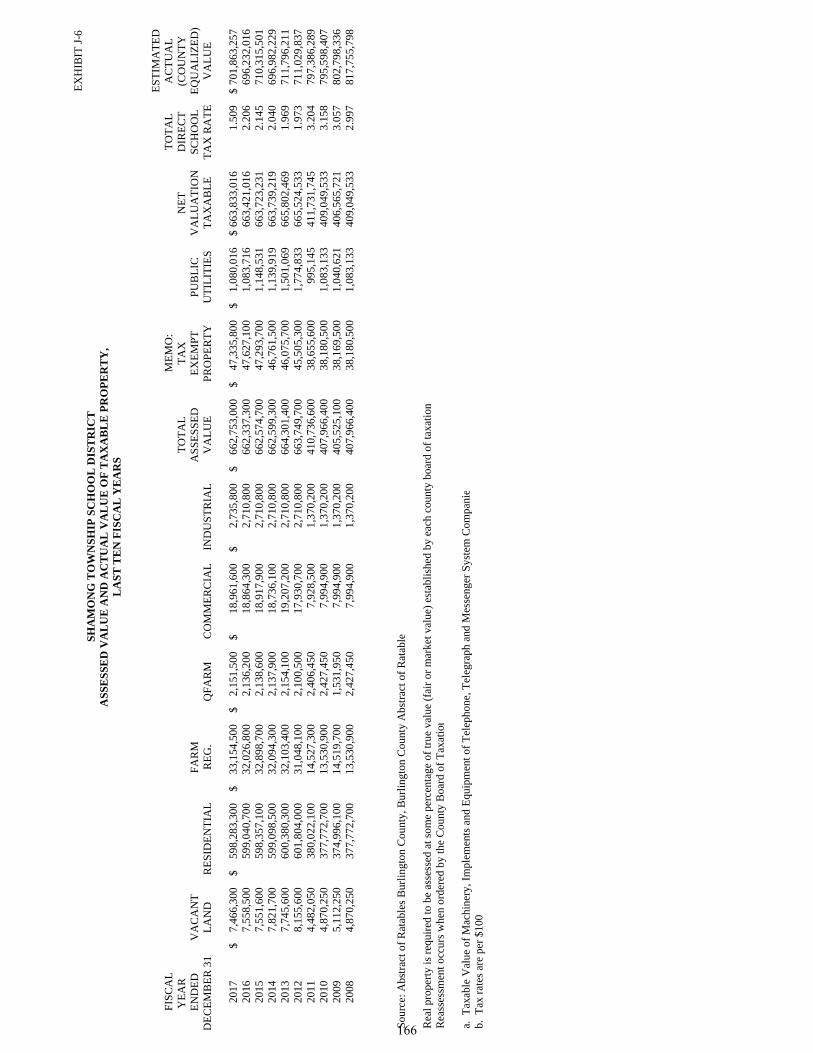
EX
HIB
IT J
-6
ES
TIM
AT
ED
FIS
CA
LM
EM
O:
TO
TA
LA
CT
UA
LY
EA
R
TO
TA
LT
AX
NE
TD
IRE
CT
(CO
UN
TY
EN
DE
DV
AC
AN
TF
AR
MA
SS
ES
SE
DE
XE
MP
TP
UB
LIC
VA
LU
AT
ION
SC
HO
OL
EQ
UA
LIZ
ED
)D
EC
EM
BE
R 3
1,L
AN
DR
ES
IDE
NT
IAL
RE
G.
QF
AR
MC
OM
ME
RC
IAL
IND
US
TR
IAL
VA
LU
EP
RO
PE
RT
YU
TIL
ITIE
ST
AX
AB
LE
TA
X R
AT
EV
AL
UE
2017
7,46
6,30
0$
59
8,28
3,30
0$
33,1
54,5
00$
2,15
1,50
0$
18
,961
,600
$
2,
735,
800
$
66
2,75
3,00
0$
47
,335
,800
$
1,08
0,01
6$
66
3,83
3,01
6$
1.50
970
1,86
3,25
7$
2016
7,55
8,50
0
59
9,04
0,70
0
32,0
26,8
00
2,13
6,20
0
18
,864
,300
2,
710,
800
66
2,33
7,30
0
47
,627
,100
1,08
3,71
6
66
3,42
1,01
6
2.20
669
6,23
2,01
6
2015
7,55
1,60
0
59
8,35
7,10
0
32,8
98,7
00
2,13
8,60
0
18
,917
,900
2,
710,
800
66
2,57
4,70
0
47
,293
,700
1,14
8,53
1
66
3,72
3,23
1
2.14
571
0,31
5,50
1
2014
7,82
1,70
0
59
9,09
8,50
0
32,0
94,3
00
2,13
7,90
0
18
,736
,100
2,
710,
800
66
2,59
9,30
0
46
,761
,500
1,13
9,91
9
66
3,73
9,21
9
2.04
069
6,98
2,22
9
2013
7,74
5,60
0
60
0,38
0,30
0
32,1
03,4
00
2,15
4,10
0
19
,207
,200
2,
710,
800
66
4,30
1,40
0
46
,075
,700
1,50
1,06
9
66
5,80
2,46
9
1.96
971
1,79
6,21
1
2012
8,15
5,60
0
60
1,80
4,00
0
31,0
48,1
00
2,10
0,50
0
17
,930
,700
2,
710,
800
66
3,74
9,70
0
45
,505
,300
1,77
4,83
3
66
5,52
4,53
3
1.97
371
1,02
9,83
7
2011
4,48
2,05
0
38
0,02
2,10
0
14,5
27,3
00
2,40
6,45
0
7,
928,
500
1,37
0,20
0
410,
736,
600
38,6
55,6
00
99
5,14
5
411,
731,
745
3.
204
797,
386,
289
20
104,
870,
250
377,
772,
700
13
,530
,900
2,
427,
450
7,99
4,90
0
1,
370,
200
40
7,96
6,40
0
38
,180
,500
1,08
3,13
3
40
9,04
9,53
3
3.15
879
5,59
8,40
7
2009
5,11
2,25
0
37
4,99
6,10
0
14,5
19,7
00
1,53
1,95
0
7,
994,
900
1,37
0,20
0
405,
525,
100
38,1
69,5
00
1,
040,
621
406,
565,
721
3.
057
802,
798,
336
20
084,
870,
250
377,
772,
700
13
,530
,900
2,
427,
450
7,99
4,90
0
1,
370,
200
40
7,96
6,40
0
38
,180
,500
1,08
3,13
3
40
9,04
9,53
3
2.99
781
7,75
5,79
8
Sou
rce:
Abs
trac
t of
Rat
able
s B
urli
ngto
n C
ount
y, B
urli
ngto
n C
ount
y A
bstr
act o
f R
atab
le
Rea
sses
smen
t occ
urs
whe
n or
dere
d by
the
Cou
nty
Boa
rd o
f T
axat
ion
a. T
axab
le V
alue
of
Mac
hine
ry, I
mpl
emen
ts a
nd E
quip
men
t of
Tel
epho
ne, T
eleg
raph
and
Mes
seng
er S
yste
m C
ompa
nie
b. T
ax r
ates
are
per
$10
0
Rea
l pro
pert
y is
req
uire
d to
be
asse
ssed
at s
ome
perc
enta
ge o
f tr
ue v
alue
(fa
ir o
r m
arke
t val
ue)
esta
blis
hed
by e
ach
coun
ty b
oard
of
taxa
tio n
SH
AM
ON
G T
OW
NS
HIP
SC
HO
OL
DIS
TR
ICT
AS
SE
SS
ED
VA
LU
E A
ND
AC
TU
AL
VA
LU
E O
F T
AX
AB
LE
PR
OP
ER
TY
,L
AS
T T
EN
FIS
CA
L Y
EA
RS
166
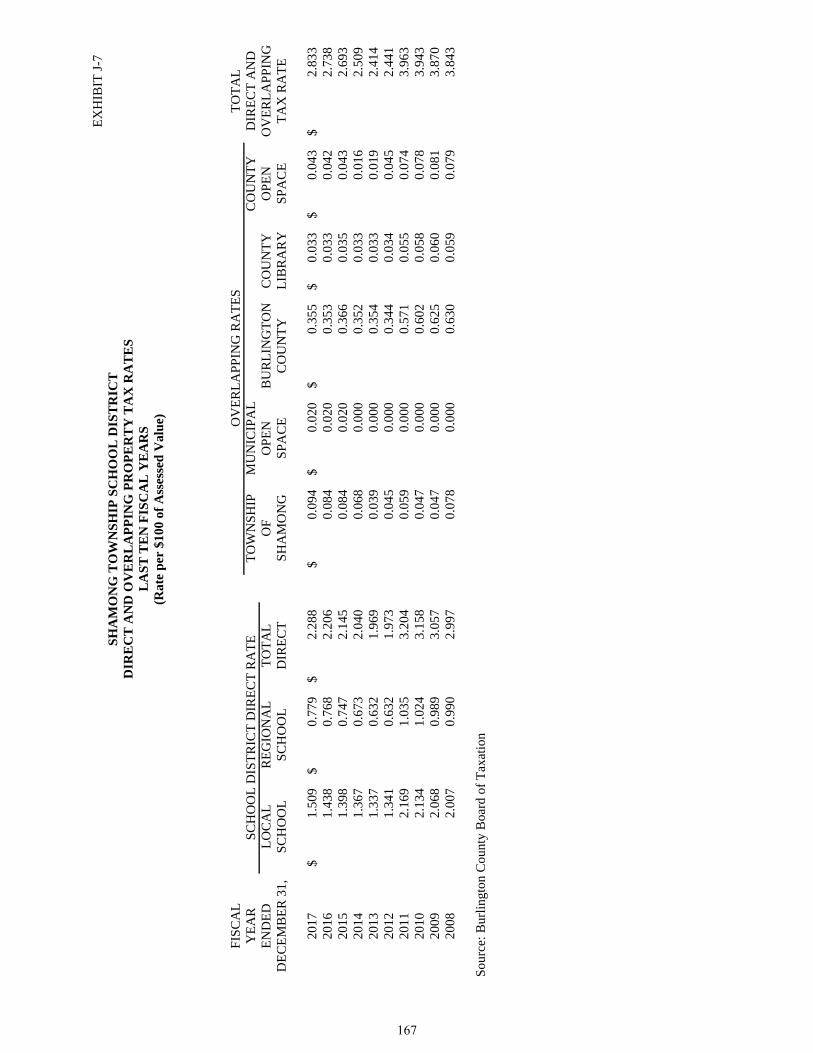
EX
HIB
IT J
-7
FIS
CA
LT
OT
AL
YE
AR
TO
WN
SH
IPM
UN
ICIP
AL
CO
UN
TY
DIR
EC
T A
ND
EN
DE
DL
OC
AL
RE
GIO
NA
LT
OT
AL
OF
OP
EN
BU
RL
ING
TO
NC
OU
NT
YO
PE
NO
VE
RL
AP
PIN
GD
EC
EM
BE
R 3
1,S
CH
OO
LS
CH
OO
LD
IRE
CT
SH
AM
ON
GS
PA
CE
CO
UN
TY
LIB
RA
RY
SP
AC
ET
AX
RA
TE
2017
1.50
9$
0.77
9$
2.28
8$
0.09
4$
0.02
0$
0.35
5$
0.
033
$
0.
043
$
2.83
3$
20
161.
438
0.76
82.
206
0.08
40.
020
0.35
30.
033
0.04
22.
738
2015
1.39
80.
747
2.14
50.
084
0.02
00.
366
0.03
50.
043
2.69
320
141.
367
0.67
32.
040
0.06
80.
000
0.35
20.
033
0.01
62.
509
2013
1.33
70.
632
1.96
90.
039
0.00
00.
354
0.03
30.
019
2.41
420
121.
341
0.63
21.
973
0.04
50.
000
0.34
40.
034
0.04
52.
441
2011
2.16
91.
035
3.20
40.
059
0.00
00.
571
0.05
50.
074
3.96
320
102.
134
1.02
43.
158
0.04
70.
000
0.60
20.
058
0.07
83.
943
2009
2.06
80.
989
3.05
70.
047
0.00
00.
625
0.06
00.
081
3.87
020
082.
007
0.99
02.
997
0.07
80.
000
0.63
00.
059
0.07
93.
843
Sou
rce:
Bur
ling
ton
Cou
nty
Boa
rd o
f T
axat
ion
SC
HO
OL
DIS
TR
ICT
DIR
EC
T R
AT
ESH
AM
ON
G T
OW
NS
HIP
SC
HO
OL
DIS
TR
ICT
DIR
EC
T A
ND
OV
ER
LA
PP
ING
PR
OP
ER
TY
TA
X R
AT
ES
LA
ST
TE
N F
ISC
AL
YE
AR
S(R
ate
per
$10
0 of
Ass
esse
d V
alu
e) OV
ER
LA
PP
ING
RA
TE
S
167
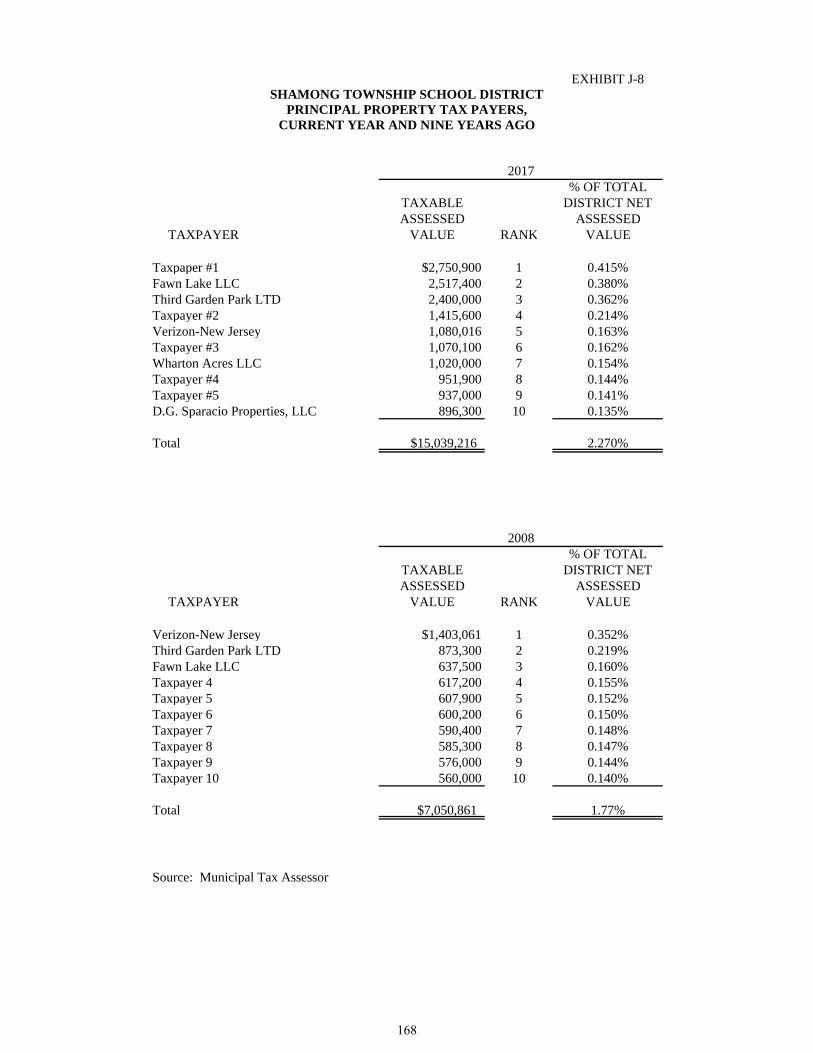
EXHIBIT J-8
% OF TOTALTAXABLE DISTRICT NETASSESSED ASSESSED
TAXPAYER VALUE RANK VALUE
Taxpaper #1 $2,750,900 1 0.415%Fawn Lake LLC 2,517,400 2 0.380%Third Garden Park LTD 2,400,000 3 0.362%Taxpayer #2 1,415,600 4 0.214%Verizon-New Jersey 1,080,016 5 0.163%Taxpayer #3 1,070,100 6 0.162%Wharton Acres LLC 1,020,000 7 0.154%Taxpayer #4 951,900 8 0.144%Taxpayer #5 937,000 9 0.141%D.G. Sparacio Properties, LLC 896,300 10 0.135%
Total $15,039,216 2.270%
% OF TOTALTAXABLE DISTRICT NETASSESSED ASSESSED
TAXPAYER VALUE RANK VALUE
Verizon-New Jersey $1,403,061 1 0.352%Third Garden Park LTD 873,300 2 0.219%Fawn Lake LLC 637,500 3 0.160%Taxpayer 4 617,200 4 0.155%Taxpayer 5 607,900 5 0.152%Taxpayer 6 600,200 6 0.150%Taxpayer 7 590,400 7 0.148%Taxpayer 8 585,300 8 0.147%Taxpayer 9 576,000 9 0.144%Taxpayer 10 560,000 10 0.140%
Total $7,050,861 1.77%
Source: Municipal Tax Assessor
2017
2008
SHAMONG TOWNSHIP SCHOOL DISTRICTPRINCIPAL PROPERTY TAX PAYERS,
CURRENT YEAR AND NINE YEARS AGO
168

EXHIBIT J-9
FISCAL TAXES COLLECTIONSYEAR LEVIED FOR IN
ENDED THE FISCAL PERCENTAGE SUBSEQUENTDECEMBER 31, YEAR AMOUNT OF LEVY YEARS
2016 18,190,594$ 17,933,281$ 98.59% 100%2015 17,766,718 17,538,160 98.71% 100%2014 16,677,587 16,468,708 98.75% 100%2013 16,188,741 16,012,822 98.91% 100%2012 16,298,677 16,025,068 98.32% 100%2011 16,384,072 16,129,746 98.45% 100%2010 16,281,962 16,038,535 98.50% 100%2009 15,895,261 15,729,950 98.96% 100%2008 15,698,799 15,450,230 98.42% 100%2007 15,166,841 14,959,246 98.63% 100%
Source: Municipal Financial Statements
YEAR OF THE LEVY
SHAMONG TOWNSHIP SCHOOL DISTRICTTOTAL PROPERTY TAX LEVIES AND COLLECTIONS
LAST TEN FISCAL YEARS
COLLECTED WITHIN THE FISCAL
169

This page intentionally left blank.
170

Debt Capacity Information
Debt capacity information is intended to assist users in understanding and assessing the School District'sdebt burden and its ability to issue additional debt. Please refer to the following exhibits for a historical
view of the school District's outstanding debt and its debt capacity.
171

This page intentionally left blank.
172

EXHIBIT J-10
FISCAL PERCENTAGEDECEMBER 31, GENERAL OF
ENDED OBLIGATION CAPITAL TOTAL PERSONALJUNE 30, BONDS LEASES DISTRICT INCOME PER CAPITA
2017 2,054,000$ 713,160$ 2,767,160$ N/A N/A 2016 2,814,000 950,880 3,764,880 N/A 583$ 2015 2,706,654 1,188,600 3,895,254 1.10% 607 2014 4,401,346 - 4,401,346 1.27% 684 2013 4,328,346 - 4,328,346 1.30% 672 2012 6,104,346 - 6,104,346 1.83% 942 2011 6,849,346 31,328 6,880,674 2.12% 1,061 2010 7,474,986 61,538 7,536,524 2.42% 1,164 2009 6,075,346 116,033 6,191,379 1.93% 921 2008 6,680,346 49,663 6,730,009 2.09% 999
Note: Details regarding the District's outstanding debt can be found in the notes to the financial statements.a. See Exhibit J-14 for personal income and population data.
GOVERNMENTAL ACTIVITIES
SHAMONG TOWNSHIP SCHOOL DISTRICTRATIOS OF OUTSTANDING DEBT BY TYPE
LAST TEN FISCAL YEARS(Dollars in Thousands, Except per Capita)
173

EXHIBIT J-11
NET PERCENTAGEFISCAL GENERAL OF ACTUALYEAR GENERAL BONDED TAXABLE
ENDED OBLIGATION DEBT VALUE OFJUNE 30, BONDS DEDUCTIONS OUTSTANDING PROPERTY PER CAPITA
2017 2,054,000$ -$ 2,054,000$ 0.31% N/A2016 2,814,000 - 2,814,000 0.42% N/A2015 2,706,654 - 2,706,654 0.41% 422 2014 4,401,346 - 4,401,346 0.66% 684 2013 5,216,346 - 5,216,346 0.79% 810 2012 6,104,346 - 6,104,346 0.92% 942 2011 6,849,346 - 6,849,346 1.03% 1,057 2010 7,474,986 - 7,474,986 1.82% 1,155 2009 6,075,346 - 6,075,346 1.49% 904 2008 6,680,346 - 6,680,346 1.64% 992
EXHIBIT J-12
ESTIMATED SHARE OFDEBT PERCENTAGE OVERLAPPING
OUTSTANDING APPLICABLE DEBT
Debt Repaid With Property Taxes: Shamong Township 175,888$ 100.00% 175,888$ Burlington County General Obligation Debt 314,942,084 1.50% 4,715,204 Lenape Regional High School 55,940,000 3.95% 2,208,530
Subtotal, Overlapping Debt 7,099,622 Shamong Township District Direct Debt 2,054,000
Total Direct & Overlapping Debt 9,153,622$
Sources: Assessed value data used to estimate applicable percentages provided by the Burlington
County Board of Taxation
AS OF JUNE 30, 2017
GOVERNMENTAL UNIT
GENERAL BONDED DEBT OUTSTANDING
SHAMONG TOWNSHIP SCHOOL DISTRICTRATIOS OF NET GENERAL BONDED DEBT OUTSTANDING
LAST TEN FISCAL YEARS
RATIOS OF OVERLAPPING GOVERNMENTAL ACTIVITIES DEBT
174
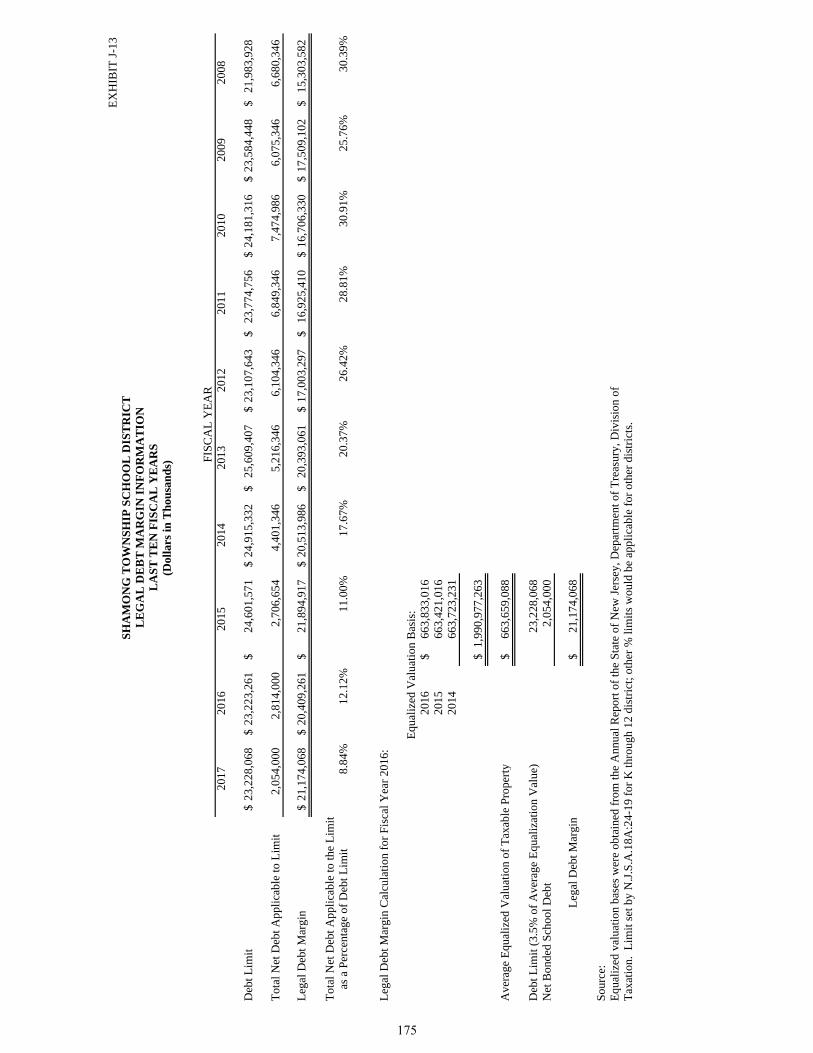
EX
HIB
IT J
-13
2017
2016
2015
2014
2013
2012
2011
2010
2009
2008
Deb
t Lim
it23
,228
,068
$
23,2
23,2
61$
24
,601
,571
$
24
,915
,332
$ 25
,609
,407
$
23,1
07,6
43$
23
,774
,756
$
24,1
81,3
16$
23,5
84,4
48$
21,9
83,9
28$
Tot
al N
et D
ebt A
ppli
cabl
e to
Lim
it2,
054,
000
2,81
4,00
0
2,
706,
654
4,40
1,34
6
5,
216,
346
6,10
4,34
6
6,
849,
346
7,47
4,98
6
6,
075,
346
6,68
0,34
6
Leg
a l D
ebt M
argi
n21
,174
,068
$
20,4
09,2
61$
21
,894
,917
$
20
,513
,986
$ 20
,393
,061
$
17,0
03,2
97$
16
,925
,410
$
16,7
06,3
30$
17,5
09,1
02$
15,3
03,5
82$
Tot
al N
et D
ebt A
ppli
cabl
e to
the
Lim
it
as
a P
erce
ntag
e of
Deb
t Lim
it8.
84%
12.1
2%11
.00%
17.6
7%20
.37%
26.4
2%28
.81%
30.9
1%25
.76%
30.3
9%
Leg
al D
ebt M
argi
n C
alcu
lati
on f
or F
isca
l Yea
r 20
16:
Equ
aliz
ed V
alua
tion
Bas
is:
2016
663,
833,
016
$
20
1566
3,42
1,01
6
20
1466
3,72
3,23
1
1,99
0,97
7,26
3$
Ave
rage
Equ
a liz
ed V
alua
tion
of
Tax
able
Pro
pert
y66
3,65
9,08
8$
Deb
t Lim
it (
3.5%
of
Ave
rage
Equ
aliz
atio
n V
alue
)23
,228
,068
N
et B
onde
d S
choo
l Deb
t2,
054,
000
Leg
al D
ebt M
argi
n21
,174
,068
$
Sou
rce:
Equ
aliz
ed v
alua
tion
bas
es w
ere
obta
ined
fro
m th
e A
nnua
l Rep
ort o
f th
e S
tate
of
New
Jer
sey,
Dep
artm
ent o
f T
reas
ury,
Div
isio
n of
T
axat
ion.
Lim
it s
et b
y N
.J.S
.A.1
8A:2
4-19
for
K th
roug
h 12
dis
tric
t; o
ther
% li
mit
s w
ould
be
appl
icab
le f
or o
ther
dis
tric
ts.
FIS
CA
L Y
EA
R
SH
AM
ON
G T
OW
NS
HIP
SC
HO
OL
DIS
TR
ICT
LE
GA
L D
EB
T M
AR
GIN
IN
FO
RM
AT
ION
LA
ST
TE
N F
ISC
AL
YE
AR
S(D
olla
rs in
Th
ousa
nd
s)
175

This page intentionally left blank.
176

District's operates.
Demographic and Economic Information
Demographic and Economic information is intended to (1) to assist users in understanding the socioeconomicenvironment within which the School District operates and (2) to provide information that facilitates comparisonsof financial information over time and among school districts. Please refer to the following exhibits for a historical
view of the demographic and economic statistics and factors prevalent in the location in which the School
177

This page intentionally left blank.
178
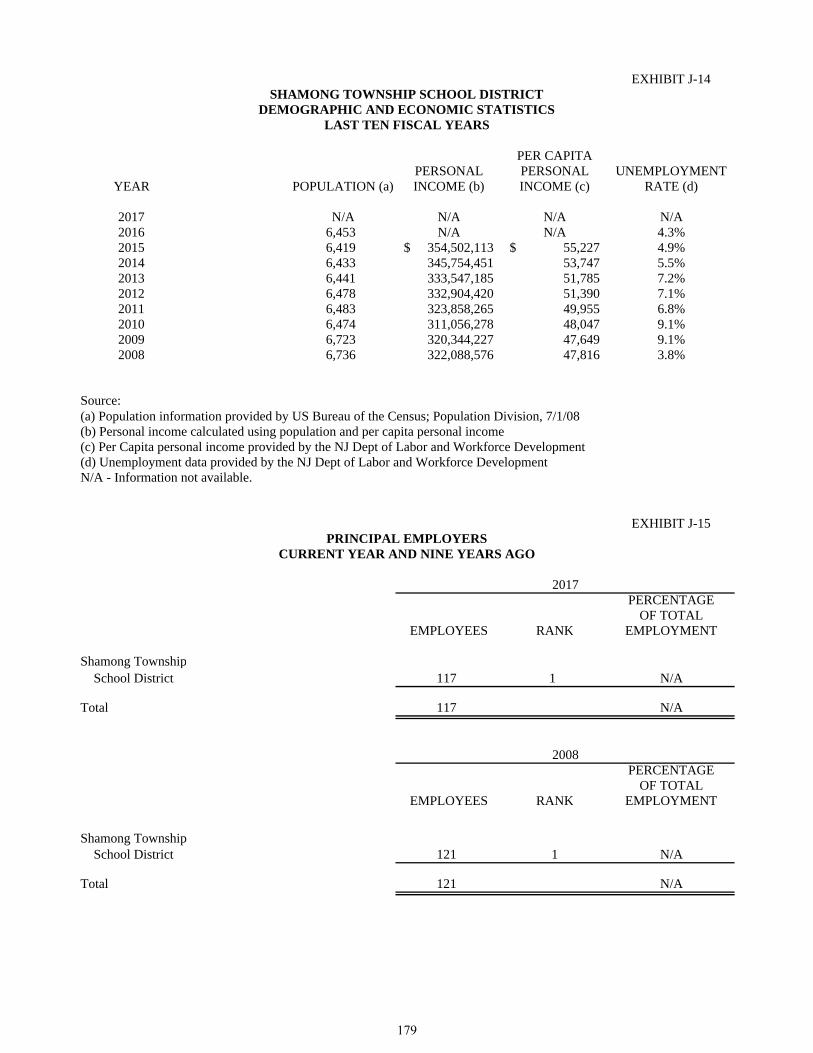
EXHIBIT J-14
PER CAPITAPERSONAL PERSONAL UNEMPLOYMENT
YEAR POPULATION (a) INCOME (b) INCOME (c) RATE (d)
2017 N/A N/A N/A N/A2016 6,453 N/A N/A 4.3%2015 6,419 354,502,113$ 55,227$ 4.9%2014 6,433 345,754,451 53,747 5.5%2013 6,441 333,547,185 51,785 7.2%2012 6,478 332,904,420 51,390 7.1%2011 6,483 323,858,265 49,955 6.8%2010 6,474 311,056,278 48,047 9.1%2009 6,723 320,344,227 47,649 9.1%2008 6,736 322,088,576 47,816 3.8%
Source: (a) Population information provided by US Bureau of the Census; Population Division, 7/1/08(b) Personal income calculated using population and per capita personal income(c) Per Capita personal income provided by the NJ Dept of Labor and Workforce Development(d) Unemployment data provided by the NJ Dept of Labor and Workforce DevelopmentN/A - Information not available.
EXHIBIT J-15
PERCENTAGEOF TOTAL
EMPLOYEES RANK EMPLOYMENT
Shamong Township School District 117 1 N/A
Total 117 N/A
PERCENTAGEOF TOTAL
EMPLOYEES RANK EMPLOYMENT
Shamong Township School District 121 1 N/A
Total 121 N/A
SHAMONG TOWNSHIP SCHOOL DISTRICTDEMOGRAPHIC AND ECONOMIC STATISTICS
LAST TEN FISCAL YEARS
2008
2017
PRINCIPAL EMPLOYERSCURRENT YEAR AND NINE YEARS AGO
179

This page intentionally left blank.
180

pertinent to the School District's operations.
Operation Information
Operating information is intended to provide contextual information about the School District's operationsand resources to assist readers in using financial information to understand and assess the School District'seconomic condition. Please refer to the following exhibits for a historical view of the factors and statistics
181

This page intentionally left blank.
182

EX
HIB
IT J
-16
2017
2016
2015
2014
2013
2012
2011
2010
2009
2008
Tea
cher
s -
Gen
eral
Fun
d68
.053
.069
.069
.073
.570
.571
.070
.071
.068
.0T
each
ers
- S
peci
al R
even
ue0.
020
.0-
--
--
--
-C
lass
room
Aid
es0.
08.
08.
09.
512
.012
.011
.510
.010
.012
.0H
ealt
h S
ervi
ces
2.0
2.0
2.0
2.0
2.0
2.0
2.0
2.0
2.0
2.0
Rel
ated
Ser
vice
s2.
02.
02.
02.
02.
02.
02.
02.
02.
02.
0E
xtra
ordi
nary
Ser
vice
s2.
02.
02.
02.
02.
02.
02.
03.
02.
02.
0G
uida
nce
- P
rofe
ssio
nal
2.0
2.0
2.0
2.0
2.0
2.0
2.0
2.0
2.0
2.0
Chi
ld S
tudy
Tea
m3.
04.
03.
03.
03.
83.
83.
83.
83.
83.
8C
hild
Stu
dy T
eam
Sup
port
1.0
1.0
1.0
1.0
1.0
1.0
1.0
1.0
1.0
1.0
Sup
ervi
sors
& O
ther
Pro
fess
iona
ls1.
00.
80.
40.
40.
20.
20.
20.
20.
20.
2M
edia
Ser
vice
s/T
echn
olog
y4.
04.
03.
85.
03.
03.
03.
03.
02.
02.
0G
ener
al D
istr
ict A
dmin
istr
ator
s1.
01.
01.
01.
01.
01.
01.
01.
01.
01.
0G
ener
al A
dmin
istr
atio
n P
rofe
ssio
nal
0.0
--
--
--
--
-G
ener
al A
dmin
istr
atio
n S
uppo
rt1.
01.
01.
01.
01.
01.
01.
01.
01.
01.
0P
rinc
ipal
s/A
ssis
tant
Pri
ncip
als
2.0
2.0
2.0
2.0
2.0
2.0
2.0
2.0
2.0
2.0
Sch
ool A
dmin
istr
atio
n S
uppo
rt4.
04.
04.
04.
04.
04.
04.
04.
04.
04.
0C
entr
al S
ervi
ces
- A
dmin
istr
ator
s2.
01.
31.
32.
01.
01.
01.
01.
01.
01.
0C
entr
al S
ervi
ces
- S
uppo
rt2.
52.
52.
53.
32.
22.
22.
21.
01.
01.
0O
pera
tion
s &
Mai
nten
ance
13.0
13.0
13.0
13.0
12.5
13.5
13.5
14.0
14.0
14.0
Tot
al11
0.5
123.
611
7.9
122.
212
5.2
123.
212
3.2
121.
012
0.0
119.
0
Sou
rce:
Dis
tric
t Ann
ual B
udge
t Sta
tem
ent S
uppo
rtin
g D
ocum
enta
tion
SH
AM
ON
G T
OW
NS
HIP
SC
HO
OL
DIS
TR
ICT
FU
LL
-TIM
E E
QU
IVA
LE
NT
DIS
TR
ICT
EM
PL
OY
EE
S B
Y F
UN
CT
ION
/PR
OG
RA
ML
AS
T T
EN
FIS
CA
L Y
EA
R
Fun
ctio
n/P
rogr
am
183

EX
HIB
IT J
-17
TE
AC
HE
R/
AV
ER
AG
EA
VE
RA
GE
% C
HA
NG
E I
NO
PE
RA
TIN
GP
UP
ILD
AIL
YD
AIL
YA
VE
RA
GE
S
TU
DE
NT
F
ISC
AL
EX
PE
ND
ITU
RE
SC
OS
T P
ER
PE
RC
EN
TA
GE
TE
AC
HIN
GR
AT
IOE
NR
OL
LM
EN
TA
TT
EN
DA
NC
ED
AIL
Y
AT
TE
ND
AN
CE
YE
AR
EN
RO
LL
ME
NT
(a)
PU
PIL
CH
AN
GE
ST
AF
F (
b)E
LE
ME
NT
AR
Y(A
DE
) (c
)(A
DA
) (c
)E
NR
OL
LM
EN
TP
ER
CE
NT
AG
E
2017
774
14,5
13,4
4718
,751
3.03
%63
1:10
776.
674
0.8
11.6
4%95
.39%
2016
775
14,0
86,2
3418
,176
4.27
%73
1:10
695.
666
3.4
-12.
89%
95.3
7%20
1580
613
,509
,710
16,7
611.
61%
761:
1179
8.5
764.
7-4
.23%
95.7
7%20
1483
413
,295
,703
15,9
420.
31%
811:
1083
3.8
799.
4-6
.90%
95.8
7%20
1390
213
,254
,541
14,6
952.
96%
861:
1089
5.6
854.
9-0
.58%
95.4
6%20
1290
812
,873
,169
14,1
773.
60%
831:
1190
0.8
862.
2-1
.50%
95.7
1%20
1191
912
,425
,325
13,5
20-4
.05%
831:
1191
4.5
872.
7-2
.27%
95.4
3%20
1093
612
,949
,940
13,8
350.
95%
831:
1193
5.7
896.
91.
19%
95.8
5%20
0994
312
,827
,609
13,6
03-0
.97%
821:
1192
4.7
886.
60.
10%
95.8
8%20
0894
112
,952
,715
13,7
656.
03%
821:
1192
3.8
894.
0-2
.77%
96.7
7%
Sou
rces
: D
istr
ict r
ecor
ds
Not
e: E
nrol
lmen
t bas
ed o
n an
nual
Oct
ober
Dis
tric
t cou
nt.
a. O
pera
ting
exp
endi
ture
s eq
ual t
otal
gen
eral
fun
d ex
pend
itur
es.
b. T
each
ing
staf
f in
clud
es o
nly
full
-tim
e eq
uiva
lent
s of
cer
tifi
cate
d st
aff.
c. A
vera
ge d
aily
enr
ollm
ent a
nd a
vera
ge d
aily
att
enda
nce
are
obta
ined
fro
m th
e S
choo
l Reg
iste
r S
umm
ary
(SR
S).
SH
AM
ON
G T
OW
NS
HIP
SC
HO
OL
DIS
TR
ICT
OP
ER
AT
ING
ST
AT
IST
ICS
LA
ST
TE
N F
ISC
AL
YE
AR
S
184
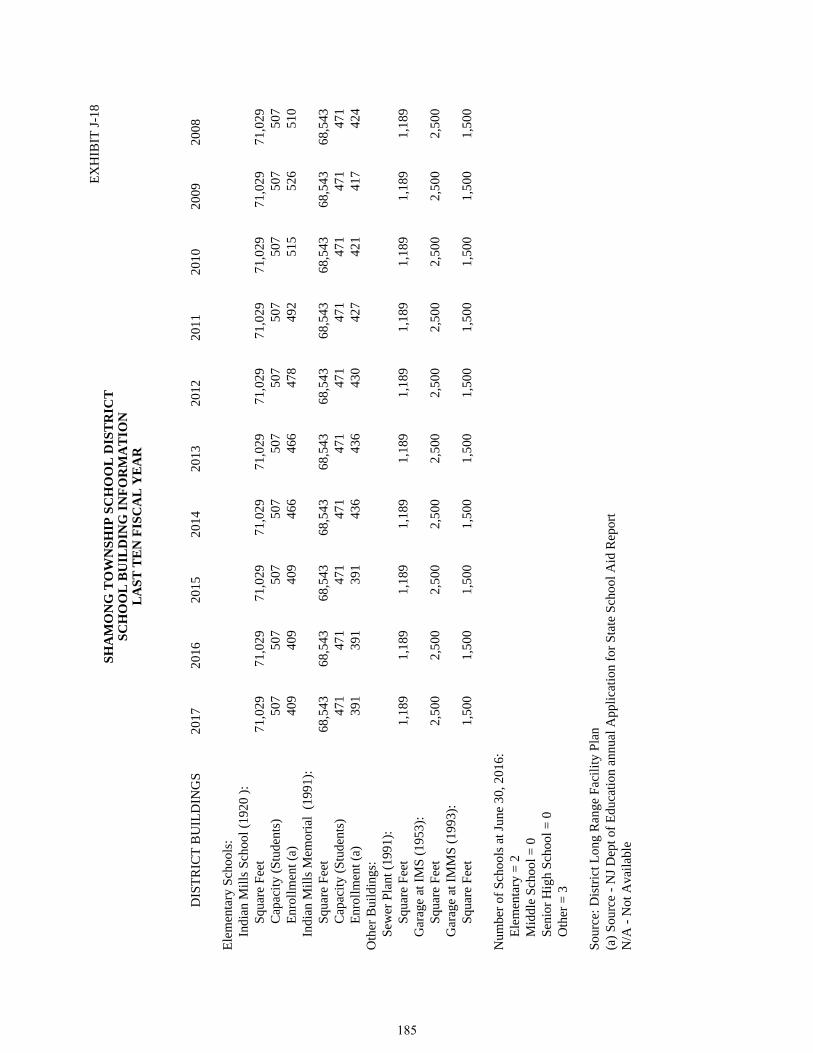
2017
2016
2015
2014
2013
2012
2011
2010
2009
2008
Ele
men
tary
Sch
ools
:
Ind
ian
Mil
ls S
choo
l (19
20 )
:
S
quar
e F
eet
71,0
2971
,029
71,0
2971
,029
71,0
2971
,029
71,0
2971
,029
71,0
2971
,029
Cap
acit
y (S
tude
nts)
507
507
507
507
507
507
507
507
507
507
Enr
ollm
ent (
a)40
940
940
946
646
647
849
251
552
651
0
Ind
ian
Mil
ls M
emor
ial
(199
1):
Squ
are
Fee
t68
,543
68,5
4368
,543
68,5
4368
,543
68,5
4368
,543
68,5
4368
,543
68,5
43
C
apac
ity
(Stu
dent
s)47
147
147
147
147
147
147
147
147
147
1
E
nrol
lmen
t (a)
391
391
391
436
436
430
427
421
417
424
Oth
er B
uild
ings
:
Sew
er P
lant
(19
91):
Squ
are
Fee
t1,
189
1,18
91,
189
1,18
91,
189
1,18
91,
189
1,18
91,
189
1,18
9
Gar
age
at I
MS
(19
53):
Squ
are
Fee
t2,
500
2,50
02,
500
2,50
02,
500
2,50
02,
500
2,50
02,
500
2,50
0
Gar
age
at I
MM
S (
1993
):
S
quar
e F
eet
1,50
01,
500
1,50
01,
500
1,50
01,
500
1,50
01,
500
1,50
01,
500
Num
ber
of S
choo
ls a
t Jun
e 30
, 201
6:
Ele
men
tary
= 2
M
iddl
e S
choo
l = 0
S
enio
r H
igh
Sch
ool =
0
Oth
er =
3
Sou
rce:
Dis
tric
t Lon
g R
ange
Fac
ilit
y P
lan
(a)
Sou
rce
- N
J D
ept o
f E
duca
tion
ann
ual A
ppli
cati
on f
or S
tate
Sch
ool A
id R
epor
tN
/A -
Not
Ava
ilab
le
SH
AM
ON
G T
OW
NS
HIP
SC
HO
OL
DIS
TR
ICT
SC
HO
OL
BU
ILD
ING
IN
FO
RM
AT
ION
LA
ST
TE
N F
ISC
AL
YE
AR
DIS
TR
ICT
BU
ILD
ING
S
EX
HIB
IT J
-18
185
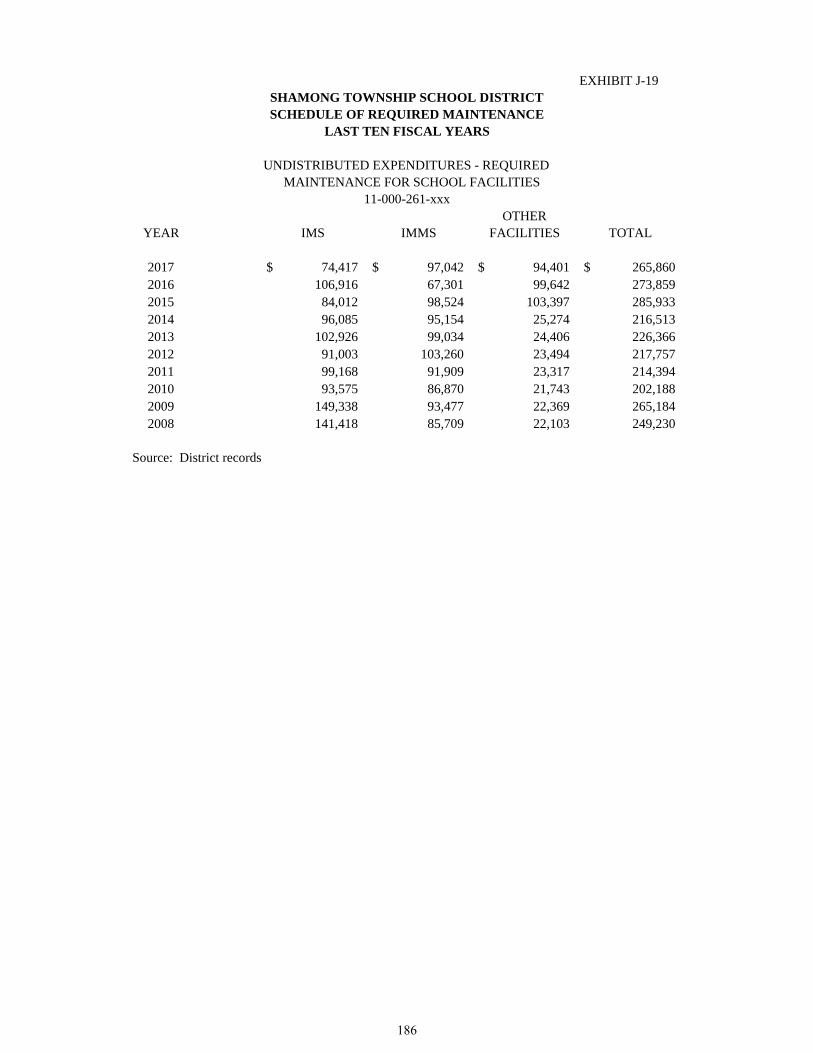
EXHIBIT J-19
OTHERYEAR IMS IMMS FACILITIES TOTAL
2017 74,417$ 97,042$ 94,401$ 265,860$ 2016 106,916 67,301 99,642 273,859 2015 84,012 98,524 103,397 285,933 2014 96,085 95,154 25,274 216,513 2013 102,926 99,034 24,406 226,366 2012 91,003 103,260 23,494 217,757 2011 99,168 91,909 23,317 214,394 2010 93,575 86,870 21,743 202,188 2009 149,338 93,477 22,369 265,184 2008 141,418 85,709 22,103 249,230
Source: District records
11-000-261-xxx
SHAMONG TOWNSHIP SCHOOL DISTRICTSCHEDULE OF REQUIRED MAINTENANCE
LAST TEN FISCAL YEARS
UNDISTRIBUTED EXPENDITURES - REQUIRED MAINTENANCE FOR SCHOOL FACILITIES
186
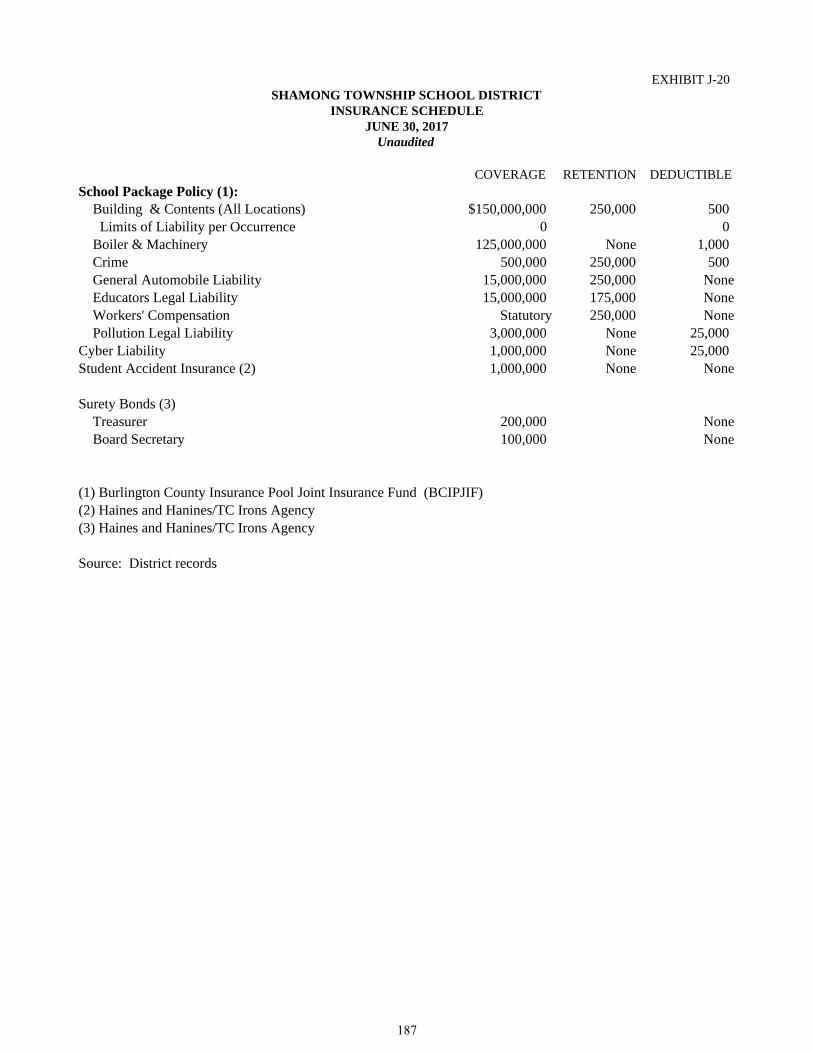
EXHIBIT J-20
COVERAGE RETENTION DEDUCTIBLESchool Package Policy (1): Building & Contents (All Locations) $150,000,000 250,000 500 Limits of Liability per Occurrence 0 0 Boiler & Machinery 125,000,000 None 1,000 Crime 500,000 250,000 500 General Automobile Liability 15,000,000 250,000 None Educators Legal Liability 15,000,000 175,000 None Workers' Compensation Statutory 250,000 None Pollution Legal Liability 3,000,000 None 25,000Cyber Liability 1,000,000 None 25,000Student Accident Insurance (2) 1,000,000 None None
Surety Bonds (3) Treasurer 200,000 None Board Secretary 100,000 None
(1) Burlington County Insurance Pool Joint Insurance Fund (BCIPJIF)(2) Haines and Hanines/TC Irons Agency(3) Haines and Hanines/TC Irons Agency
Source: District records
INSURANCE SCHEDULEJUNE 30, 2017
Unaudited
SHAMONG TOWNSHIP SCHOOL DISTRICT
187

This page intentionally left blank.
188

SINGLE AUDIT SECTION
189

This page intentionally left blank.
190

EXHIBIT K-1
INDEPENDENT AUDITOR’S REPORT ON INTERNAL CONTROL OVER FINANCIAL REPORTING AND ON COMPLIANCE AND OTHER MATTERS BASED ON AN AUDIT OF
FINANCIAL STATEMENTS PERFORMED IN ACCORDANCE WITH GOVERNMENT AUDITING STANDARDS
Honorable President and Members of the Board of Education Shamong Township School District County of Burlington Shamong, New Jersey
We have audited, in accordance with the auditing standards generally accepted in the United States of America and the standards applicable to financial audits contained in Government Auditing Standards issued by the Comptroller General of the United States and audit requirements as prescribed by the Office of School Finance, Department of Education, State of New Jersey, the financial statements of the governmental activities, the business-type activities, each major fund and the aggregate remaining fund information of the Shamong Township School District, as of and for the year ended June 30, 2017, and the related notes to the financial statements, which collectively comprise the Shamong Township School District’s basic financial statements, and have issued our report thereon dated November 1, 2017.
Internal Control Over Financial Reporting
In planning and performing our audit of the financial statements, we considered the Shamong Township School District’s internal control over financial reporting (internal control) to determine the audit procedures that are appropriate in the circumstances for the purpose of expressing our opinions on the financial statements, but not for the purpose of expressing an opinion on the effectiveness of the School District’s internal control. Accordingly, we do not express an opinion on the effectiveness of the Shamong Township School District’s internal control.
A deficiency in internal control exists when the design or operation of a control does not allow management or employees, in the normal course of performing their assigned functions, to prevent, or detect and correct, misstatements on a timely basis. A material weakness is a deficiency, or a combination of deficiencies, in internal control, such that there is a reasonable possibility that a material misstatement of the entity’s financial statements will not be prevented, or detected and corrected on a timely basis. A significant deficiency is a deficiency, or a combination of deficiencies, in internal control that is less severe than a material weakness, yet important enough to merit attention by those charged with governance.
Our consideration of internal control was for the limited purpose described in the first paragraph of this section and was not designed to identify all deficiencies in internal control that might be material weaknesses or significant deficiencies. Given these limitations, during our audit we did not identify any deficiencies in internal control that we consider to be material weaknesses. However, material weaknesses may exist that have not been identified.
191

Compliance and Other Matters As part of obtaining reasonable assurance about whether the Shamong Township School District’s financial statements are free from material misstatement, we performed tests of its compliance with certain provisions of laws, regulations, contracts, and grant agreements, noncompliance with which could have a direct and material effect on the determination of financial statement amounts. However, providing an opinion on compliance with those provisions was not an objective of our audit, and accordingly, we do not express such an opinion. The results of our tests disclosed no instances of noncompliance or other matters that are required to be reported under Government Auditing Standards, and audit requirements as prescribed by the Office of School Finance, Department of Education, State of New Jersey. Purpose of this Report The purpose of this report is solely to describe the scope of our testing of internal control and compliance and the results of that testing, and not to provide an opinion on the effectiveness of the School District’s internal control or on compliance. This report is an integral part of an audit performed in accordance with Government Auditing Standards and audit requirements as prescribed by the Office of School Finance, Department of Education, State of New Jersey, and federal and state awarding agencies and pass-through entities, in considering the School District’s internal control and compliance. Accordingly, this communication is not suitable for any other purpose.
Respectfully Submitted,
HOLMAN FRENIA ALLISON, P.C.
Kevin Frenia Certified Public Accountant Public School Accountant, No. 1011
Medford, New Jersey November 1, 2017
192
EXHIBIT K-2
INDEPENDENT AUDITOR’S REPORT ON COMPLIANCE FOR EACH MAJOR PROGRAM AND ON INTERNAL CONTROL OVER COMPLIANCE REQUIRED BY NEW JERSEY OMB CIRCULAR
15-08
Honorable President and Members of the Board of Education Shamong Township School District County of Burlington Shaomong, New Jersey Report on Compliance for Each Major State Program We have audited the Shamong Township School District’s compliance with the types of compliance requirements described in the New Jersey State Aid/Grant Compliance Supplement that could have a direct and material effect on each of the School District’s major state programs for the fiscal year ended June 30, 2017. The Shamong Township School District’s major state programs are identified in the summary of auditor’s results section of the accompanying schedule of findings and questioned costs. Management’s Responsibility Management is responsible for compliance with state statutes, regulations, and the terms and conditions of its state awards applicable to its state programs. Auditor’s Responsibility Our responsibility is to express an opinion on compliance for each of the Shamong Township School District’s major state programs based on our audit of the types of compliance requirements referred to above. We conducted our audit of compliance in accordance with auditing standards generally accepted in the United States of America; the standards applicable to financial audits contained in Government Auditing Standards, issued by the Comptroller General of the United States; New Jersey OMB’s Circular 15-08, Single Audit Policy for Recipients of Federal Grants, State Grants and State Aid; and the audit requirements prescribed by the Office of School Finance, Department of Education, State of New Jersey. Those standards and New Jersey OMB’s Circular 15-08 require that we plan and perform the audit to obtain reasonable assurance about whether noncompliance with the types of compliance requirements referred to above that could have a direct and material effect on a major state program occurred. An audit includes examining, on a test basis, evidence about the School District’s compliance with those requirements and performing such other procedures as we considered necessary in the circumstances. We believe that our audit provides a reasonable basis for our opinion on compliance for each major state program. However, our audit does not provide a legal determination of the School District’s compliance.
193
Opinion on Each Major State Program
In our opinion, the Shamong Township School District complied, in all material respects, with the types of compliance requirements referred to above that could have a direct and material effect on each of its major state programs for the year ended June 30, 2017.
Report on Internal Control Over Compliance
Management of the Shamong Township School District is responsible for establishing and maintaining effective internal control over compliance with the types of compliance requirements referred to above. In planning and performing our audit of compliance, we considered the School District’s internal control over compliance with the types of requirements that could have a direct and material effect on each major state program to determine the auditing procedures that are appropriate in the circumstances for the purpose of expressing an opinion on compliance for each major state program and to test and report on internal control over compliance in accordance with New Jersey OMB’s Circular 15-08, but not for the purpose of expressing an opinion on the effectiveness of internal control over compliance. Accordingly, we do not express an opinion on the effectiveness of the School District’s internal control over compliance.
A deficiency in internal control over compliance exists when the design or operation of a control over compliance does not allow management or employees, in the normal course of performing their assigned functions, to prevent, or detect and correct, noncompliance with a type of compliance requirement of a state program on a timely basis. A material weakness in internal control over compliance is a deficiency, or combination of deficiencies, in internal control over compliance, such that there is a reasonable possibility that material noncompliance with a type of compliance requirement of a state program will not be prevented, or detected and corrected, on a timely basis. A significant deficiency in internal control over compliance is a deficiency, or a combination of deficiencies, in internal control over compliance with a type of compliance requirement of a state program that is less severe than a material weakness in internal control over compliance, yet important enough to merit attention by those charged with governance.
Our consideration of internal control over compliance was for the limited purpose described in the first paragraph of this section and was not designed to identify all deficiencies in internal control over compliance that might be material weaknesses or significant deficiencies. We did not identify any deficiencies in internal control over compliance that we consider to be material weaknesses. However, material weaknesses may exist that have not been identified.
The purpose of this report on internal control over compliance is solely to describe the scope of our testing of internal control over compliance and the results of that testing based on the requirements of New Jersey OMB’s Circular 15-08. Accordingly, this report is not suitable for any other purpose.
Respectfully Submitted,
HOLMAN FRENIA ALLISON, P.C.
Kevin Frenia Certified Public Accountant Public School Accountant, No. 1011
Medford, New JerseyNovember 1, 2017
194
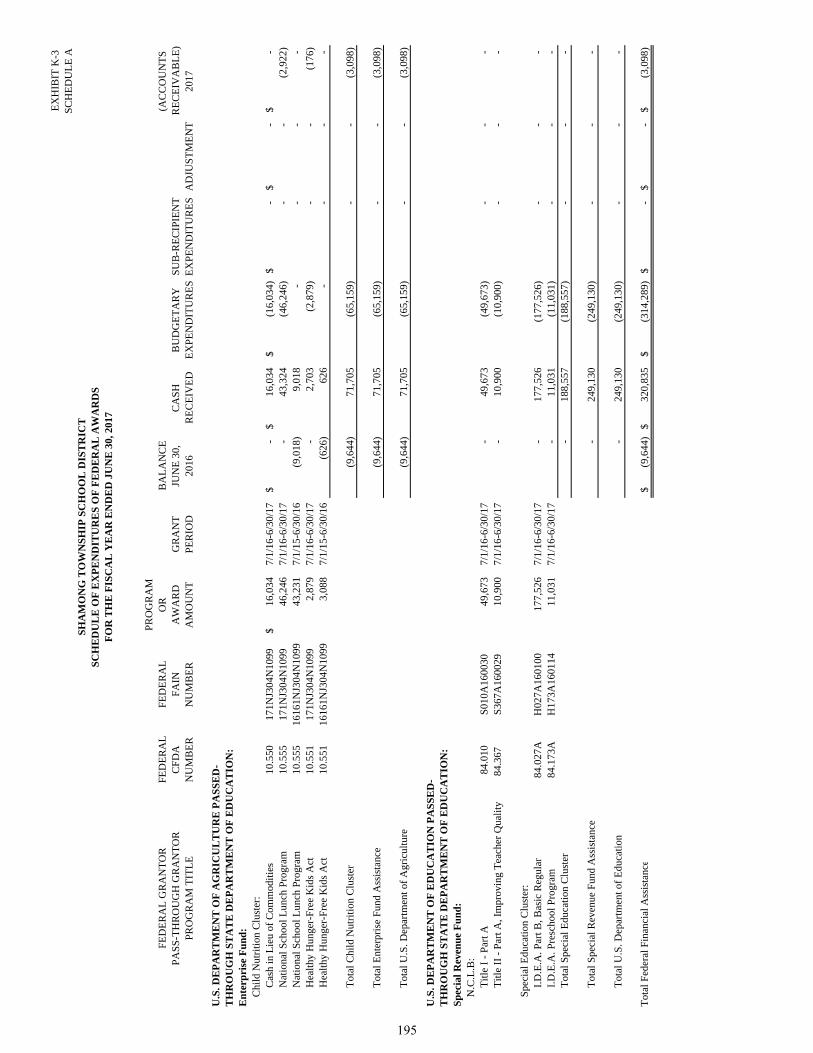
EX
HIB
IT K
-3S
CH
ED
UL
E A
PR
OG
RA
MF
ED
ER
AL
FE
DE
RA
LO
RB
AL
AN
CE
(AC
CO
UN
TS
CF
DA
FA
INA
WA
RD
GR
AN
TJU
NE
30,
CA
SH
BU
DG
ET
AR
YS
UB
-RE
CIP
IEN
TR
EC
EIV
AB
LE
)N
UM
BE
RN
UM
BE
RA
MO
UN
TP
ER
IOD
2016
RE
CE
IVE
DE
XP
EN
DIT
UR
ES
EX
PE
ND
ITU
RE
SA
DJU
ST
ME
NT
2017
U.S
. DE
PA
RT
ME
NT
OF
AG
RIC
UL
TU
RE
PA
SS
ED
-T
HR
OU
GH
ST
AT
E D
EP
AR
TM
EN
T O
F E
DU
CA
TIO
N:
En
terp
rise
Fu
nd
:C
hild
Nut
riti
on C
lust
er:
Cas
h in
Lie
u of
Com
mod
itie
s10
.550
171N
J304
N10
9916
,034
$
7/1/
16-6
/30/
17-
$
16,0
34$
(16,
034)
$
-$
-
$
-$
N
atio
nal S
choo
l Lun
ch P
rogr
am10
.555
171N
J304
N10
9946
,246
7/1/
16-6
/30/
17-
43,3
24
(46,
246)
-
- (2
,922
)
Nat
iona
l Sch
ool L
unch
Pro
gram
10.5
5516
161N
J304
N10
9943
,231
7/1/
15-6
/30/
16(9
,018
)
9,
018
- -
- -
Hea
lthy
Hun
ger-
Fre
e K
ids
Act
10.5
5117
1NJ3
04N
1099
2,87
9
7/1/
16-6
/30/
17-
2,70
3
(2
,879
)
- -
(176
)
Hea
lthy
Hun
ger-
Fre
e K
ids
Act
10.5
5116
161N
J304
N10
993,
088
7/
1/15
-6/3
0/16
(626
)
626
-
- -
-
Tot
al C
hild
Nut
riti
on C
lust
er(9
,644
)
71
,705
(6
5,15
9)
- -
(3,0
98)
Tot
al E
nter
pris
e F
und
Ass
ista
nce
(9,6
44)
71,7
05
(65,
159)
-
- (3
,098
)
Tot
al U
.S. D
epar
tmen
t of
Agr
icul
ture
(9,6
44)
71,7
05
(65,
159)
-
- (3
,098
)
U.S
. DE
PA
RT
ME
NT
OF
ED
UC
AT
ION
PA
SS
ED
-T
HR
OU
GH
ST
AT
E D
EP
AR
TM
EN
T O
F E
DU
CA
TIO
N:
Sp
ecia
l Rev
enu
e F
un
d:
N.C
.L.B
:T
itle
I -
Par
t A84
.010
S01
0A16
0030
49,6
73
7/
1/16
-6/3
0/17
- 49
,673
(4
9,67
3)
- -
- T
itle
II
- P
art A
, Im
prov
ing
Tea
cher
Qua
lity
84.3
67S
367A
1600
2910
,900
7/1/
16-6
/30/
17-
10,9
00
(10,
900)
-
- -
Spe
cial
Edu
cati
on C
lust
er:
I.D
.E.A
. Par
t B, B
asic
Reg
ular
84.0
27A
H02
7A16
0100
177,
526
7/1/
16-6
/30/
17-
177,
526
(177
,526
)
- -
- I.
D.E
.A. P
resc
hool
Pro
gram
84.1
73A
H17
3A16
0114
11,0
31
7/
1/16
-6/3
0/17
- 11
,031
(1
1,03
1)
- -
- T
otal
Spe
cial
Edu
cati
on C
lust
er-
188,
557
(188
,557
)
- -
-
Tot
al S
peci
al R
even
ue F
und
Ass
ista
nce
- 24
9,13
0
(2
49,1
30)
-
- -
Tot
al U
.S. D
epar
tmen
t of
Edu
cati
on-
249,
130
(249
,130
)
- -
-
Tot
al F
eder
al F
inan
cial
Ass
ista
nce
(9,6
44)
$
32
0,83
5$
(3
14,2
89)
$
-$
-$
(3,0
98)
$
PR
OG
RA
M T
ITL
E
SH
AM
ON
G T
OW
NS
HIP
SC
HO
OL
DIS
TR
ICT
SC
HE
DU
LE
OF
EX
PE
ND
ITU
RE
S O
F F
ED
ER
AL
AW
AR
DS
FO
R T
HE
FIS
CA
L Y
EA
R E
ND
ED
JU
NE
30,
201
7
FE
DE
RA
L G
RA
NT
OR
PA
SS
-TH
RO
UG
H G
RA
NT
OR
195

EX
HIB
IT K
-4S
CH
ED
UL
E B
(AC
CO
UN
TS
DE
FE
RR
ED
DU
E T
OG
RA
NT
OR
BA
LA
NC
EC
AR
RY
OV
ER
RE
CE
IVA
BL
E)
RE
VE
NU
EG
RA
NT
OR
CU
MU
LA
TIV
ES
TA
TE
PR
OJE
CT
AW
AR
DG
RA
NT
JUN
E 3
0,(W
AL
KO
VE
R)
CA
SH
BU
DG
ET
AR
YS
UB
-RE
CIP
IEN
TA
T J
UN
E 3
0,A
T J
UN
E 3
0,A
T J
UN
E 3
0,B
UD
GE
TA
RY
TO
TA
LN
UM
BE
RA
MO
UN
TP
ER
IOD
2016
AM
OU
NT
RE
CE
IVE
DE
XP
EN
DIT
UR
ES
EX
PE
ND
ITU
RE
SA
DJU
ST
ME
NT
2017
2017
2017
RE
CE
IVA
BL
EE
XP
EN
DIT
UR
ES
Sta
te D
epar
tmen
t of
Ed
uca
tion
:G
ener
al F
un
d:
Sta
te A
id P
ubli
c:E
qual
izat
ion
Aid
495-
034-
5120
-078
3,43
0,36
5$
7/1/
16-6
/30/
17-
$-
$3,
430,
365
$
(3
,430
,365
)$
-
$-
$-
$-
$-
$(3
39,8
74)
$
3,
430,
365
$
Cat
egor
ical
Spe
cial
Edu
cati
on A
i d49
5-03
4-51
20-0
8950
7,21
4
7/
1/16
-6/3
0/17
--
507,
214
(507
,214
)
--
--
-(5
0,25
4)
50
7,21
4
Cat
egor
ical
Sec
urit
y A
i d49
5-03
4-51
20-0
8465
,308
7/
1/16
-6/3
0/17
--
65,3
08
(6
5,30
8)
--
--
-(6
,471
)
65
,308
PA
RC
C R
eadi
ness
Ai d
495-
034-
5120
-098
8,25
07/
1/16
-6/3
0/17
--
8,25
0
(8,2
50)
--
--
-(8
17)
8,
250
Per
Pup
il G
row
th A
i d49
5-03
4-51
20-0
978,
250
7/1/
16-6
/30/
17-
-8,
250
(8
,250
)-
--
--
(817
)
8,25
0P
rofe
ssio
nal L
earn
ing
Com
mun
ity
Aid
495-
034-
5120
-101
7,42
07/
1/16
-6/3
0/17
--
7,42
0
(7,4
20)
--
--
-(7
35)
7,
420
T
otal
Sta
te A
id P
ubli
c-
-4,
026,
807
(4
,026
,807
)
-
--
--
(398
,968
)
4,02
6,80
7
Cat
egor
ical
Tra
nspo
rtat
ion
Ai d
495-
034-
5120
-014
224,
964
7/1/
16-6
/30/
17-
-22
4,96
4
(2
24,9
64)
-
--
--
(22,
289)
224,
964
E
xtra
ordi
nary
Ai d
495-
034-
5120
-044
42,7
55
7/1/
16-6
/30/
17-
--
(42,
755)
-
-(4
2,75
5)
--
-42
,755
Ext
raor
dina
ry A
id49
5-03
4-51
20-0
4412
,195
7/
1/15
-6/3
0/16
(12,
195)
-
12,1
95
-
--
--
--
Exc
ess
Non
-Pub
lic
Tra
nspo
rtat
ion
Cos
t s49
5-03
4-51
20-0
143,
306
7/1/
16-6
/30/
17-
--
(3,3
06)
--
(3,3
06)
--
-3,
306
Exc
ess
Non
-Pub
lic
Tra
nspo
rtat
ion
Cos
t s49
5-03
4-51
20-0
142,
431
7/1/
15-6
/30/
16(2
,431
)
-
2,43
1
--
--
--
--
On-
Beh
alf
TP
AF
Pos
t-R
etir
emen
M
edic
al (
Non
budg
eted
)49
5-03
4-50
94-0
0151
8,20
9
7/
1/16
-6/3
0/17
--
518,
209
(518
,209
)
--
--
--
518,
209
O
n-B
ehal
f T
PA
F P
ensi
on
C
ontr
ibut
ions
(N
onbu
dget
ed)
495-
034-
5094
-002
621,
930
7/1/
16-6
/30/
17-
-62
1,93
0
(6
21,9
30)
-
--
--
-62
1,93
0
On-
Beh
alf
TP
AF
Lon
g-T
erm
Dis
abil
ity
Insu
ranc
e
Con
trib
utio
ns (
Non
budg
eted
)49
5-03
4-50
94-0
041,
581
7/1/
16-6
/30/
17-
-1,
581
(1
,581
)-
--
--
-1,
581
Rei
mbu
rsed
TP
AF
Soc
ial S
ecur
ity
C
ontr
ibut
ion
(Non
-Bud
gete
d)10
0-03
4-50
95-0
0342
7,84
9
7/
1/16
-6/3
0/17
--
406,
767
(427
,849
)
--
(21,
082)
-
--
427,
849
R
eim
burs
ed T
PA
F S
ocia
l Sec
urit
y
Con
trib
utio
n (N
on-B
udge
ted)
100-
034-
5095
-003
412,
509
7/1/
15-6
/30/
16(2
0,29
6)
-20
,296
--
--
--
--
Tot
al G
ener
al F
und
Ass
ista
nce
(34,
922)
-
5,83
5,18
0
(5,8
67,4
01)
--
(67,
143)
-
-(4
21,2
57)
5,
867,
401
Cap
ital
Pro
ject
s F
un
d:
SD
A G
rant
#G
5-50
1847
40-0
55-1
4-10
1352
,400
7/
1/14
-6/3
0/17
(2,1
22)
-1,
722
-
--
(400
)-
--
-S
DA
Gra
nt #
G5-
5017
4740
-055
-14-
1012
91,0
00
7/1/
14-6
/30/
17(7
9,32
2)
-82
,222
(9,8
65)
--
(6,9
65)
--
-9,
865
SD
A G
rant
#G
5-50
1547
40-0
50-1
4-10
0547
6,80
0
7/
1/14
-6/3
0/17
(29,
369)
-
(36,
360)
-
-(6
5,72
9)
--
-36
,360
SD
A G
rant
#G
5-50
1347
40-0
50-1
4-10
0310
4,60
0
7/
1/14
-6/3
0/17
(90,
293)
-
44,9
45
(1
2,48
4)
--
(57,
832)
-
--
12,4
84S
DA
Gra
nt #
G5-
5014
4740
-050
-14-
1004
67,6
00
7/1/
14-6
/30/
17(3
,088
)
-
2,68
8
--
-(4
00)
--
--
Tot
al C
apit
al P
roje
cts
Fun
d A
ssis
tanc
e(2
04,1
94)
-
131,
577
(58,
709)
-
-(1
31,3
26)
--
-58
,709
Deb
t S
ervi
ce F
un
d:
Deb
t Ser
vice
Typ
e I I
495-
034-
5120
-125
30,6
94
7/1/
16-6
/30/
17-
-30
,694
(30,
694)
-
--
--
-30
,694
Tot
al D
ebt S
ervi
ce F
und
Ass
ista
nce
--
30,6
94
(3
0,69
4)
--
--
--
30,6
94
Tot
al S
tate
Dep
artm
ent o
f E
duca
tio n
(239
,116
)
-5,
997,
451
(5
,956
,804
)
-
-(1
98,4
69)
--
(421
,257
)
5,95
6,80
4
Sta
te D
epar
tmen
t of
Agr
icu
ltu
re:
En
terp
rise
Fu
nd
:N
atio
nal S
choo
l Lun
ch P
rogr
am10
0-01
0-33
60-0
672,
090
7/1/
16-6
/30/
171,
961
(2
,090
)-
(129
)-
--
2,09
0N
atio
nal S
choo
l Lun
ch P
rogr
a m10
0-01
0-33
60-0
672,
283
7/1/
15-6
/30/
16(4
51)
-
451
--
--
--
--
Tot
al E
nter
pris
e F
und
Ass
ista
nce
(451
)
-2,
412
(2
,090
)-
-(1
29)
--
-2,
090
Tot
al S
tate
Dep
artm
ent o
f A
gric
ultu
r e(4
51)
-
2,41
2
(2,0
90)
--
(129
)-
--
2,09
0
Tot
al S
tate
Fin
anci
al A
ssis
tanc
e(2
39,5
67)
$
-
$5,
999,
863
$
(5
,958
,894
)
-
$-
$(1
98,5
98)
$
-$
-$
(421
,257
)$
5,95
8,89
4$
Les
s: G
rant
s N
ot S
ubje
ct to
Maj
or P
rogr
am D
eter
min
atio
nO
n-B
ehal
f T
PA
F P
ost-
Ret
irem
en
Med
ical
(N
onbu
dget
ed)
495-
034-
5094
-001
518,
209
7/1/
16-6
/30/
1751
8,20
9
On-
Beh
alf
TP
AF
Pen
sion
Con
trib
utio
ns (
Non
budg
eted
)49
5-03
4-50
94-0
0262
1,93
0
7/
1/16
-6/3
0/17
621,
930
O
n-B
ehal
f T
PA
F L
ong-
Ter
m D
isab
ilit
y In
sura
nce
C
ontr
ibut
ions
(N
onbu
dget
ed)
495-
034-
5094
-004
1,58
17/
1/16
-6/3
0/17
1,58
1
Tot
al S
tate
Fin
anci
al A
ssis
tanc
e S
ubje
ct to
Maj
or P
rogr
am D
eter
min
atio
(4,8
17,1
74)
$
SH
AM
ON
G T
OW
NS
HIP
SC
HO
OL
DIS
TR
ICT
SC
HE
DU
LE
OF
EX
PE
ND
ITU
RE
S O
F S
TA
TE
FIN
AN
CIA
L A
SS
IST
AN
CE
FO
R T
HE
FIS
CA
L Y
EA
R E
ND
ED
JU
NE
30,
201
7
ST
AT
E G
RA
NT
OR
/PR
OG
RA
M T
ITL
E
ME
MO
196

EXHIBIT K-5 (Page 1 of 2)
SHAMONG TOWNSHIP SCHOOL DISTRICT
NOTES TO SCHEDULES OF EXPENDITURES OF FEDERAL AWARDS AND STATE FINANCIAL ASSISTANCE
FOR THE FISCAL YEAR ENDED JUNE 30, 2017 Note 1. Basis of Presentation The accompanying schedules of expenditures of federal awards and state financial assistance present the activity of all federal awards and state financial assistance programs of the Shamong Township School District. The School District is defined in Note 1 of the basic financial statements. The information in these schedules is presented in accordance with the requirements of Title 2 U.S. Code of Federal Regulations (CFR) Part 200, Uniform Administrative Requirements, Cost Principles, and Audit Requirements for Federal Awards (Uniform Guidance) and New Jersey OMB’s Circular 15-08, Single Audit Policy for Recipients of Federal Grants, State Grants and State Aid. All federal and state awards received directly from federal and state agencies, as well as federal awards and state financial assistance passed through other government agencies is included on the schedule of expenditures of federal awards and state financial assistance. Note 2. Summary of Significant Accounting Policies The accompanying schedules of expenditures of federal awards and state financial assistance are presented using the budgetary basis of accounting with the following exception: programs recorded in the enterprise fund are presented using the accrual basis of accounting and programs recorded in the capital projects fund are presented using the modified accrual basis of accounting. These bases of accounting are described in Note 1 to the School District’s basic financial statements. The information in this schedule is presented in accordance with the requirements of Title 2 U.S. Code of Federal Regulations (CFR) Part 200, Uniform Administrative Requirements, Cost Principles, and Audit Requirements for Federal Awards and New Jersey OMB’s Circular 15-08, Single Audit Policy for Recipients of Federal Grants, State Grants and State Aid. Therefore, some amounts presented in this schedule may differ from amounts presented in, or used in the preparation of, the basic financial statements. The School District did not elect the 10-percent de deminimis indirect cost rate as discussed in 2 CFR 200.414. Revenues and expenditures reported under the Food Distribution Program represent current year value received and current year distributions respectively. The amount reported as TPAF Pension Contributions represents the amount paid by the state on behalf of the School District for the year ended June 30, 2017. TPAF Social Security Contributions represents the amount reimbursed by the state for the employer’s share of social security contributions for TPAF members for the year ended June 30, 2017. Note 3. Relationship to Basic Financial Statements The basic financial statements present the general fund and special revenue fund on a GAAP basis. Budgetary comparison statements or schedules (RSI) are presented for the general fund and special revenue fund to demonstrate finance-related legal compliance in which certain revenue is permitted by law or grant agreement to be recognized in the audit year, whereas for GAAP reporting, revenue is not recognized until the subsequent year or when expenditures have been made.
197
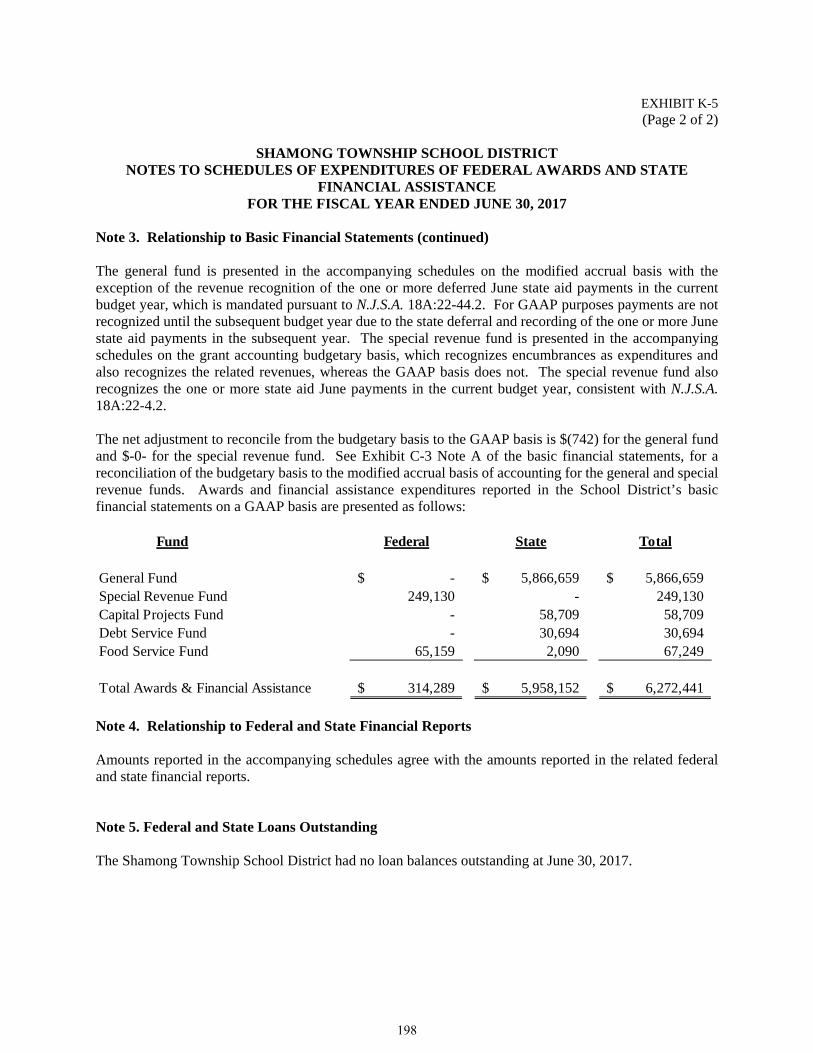
EXHIBIT K-5 (Page 2 of 2)
SHAMONG TOWNSHIP SCHOOL DISTRICT
NOTES TO SCHEDULES OF EXPENDITURES OF FEDERAL AWARDS AND STATE FINANCIAL ASSISTANCE
FOR THE FISCAL YEAR ENDED JUNE 30, 2017 Note 3. Relationship to Basic Financial Statements (continued) The general fund is presented in the accompanying schedules on the modified accrual basis with the exception of the revenue recognition of the one or more deferred June state aid payments in the current budget year, which is mandated pursuant to N.J.S.A. 18A:22-44.2. For GAAP purposes payments are not recognized until the subsequent budget year due to the state deferral and recording of the one or more June state aid payments in the subsequent year. The special revenue fund is presented in the accompanying schedules on the grant accounting budgetary basis, which recognizes encumbrances as expenditures and also recognizes the related revenues, whereas the GAAP basis does not. The special revenue fund also recognizes the one or more state aid June payments in the current budget year, consistent with N.J.S.A. 18A:22-4.2. The net adjustment to reconcile from the budgetary basis to the GAAP basis is $(742) for the general fund and $-0- for the special revenue fund. See Exhibit C-3 Note A of the basic financial statements, for a reconciliation of the budgetary basis to the modified accrual basis of accounting for the general and special revenue funds. Awards and financial assistance expenditures reported in the School District’s basic financial statements on a GAAP basis are presented as follows:
Note 4. Relationship to Federal and State Financial Reports Amounts reported in the accompanying schedules agree with the amounts reported in the related federal and state financial reports. Note 5. Federal and State Loans Outstanding The Shamong Township School District had no loan balances outstanding at June 30, 2017.
Fund Federal State Total
General Fund -$ 5,866,659$ 5,866,659$ Special Revenue Fund 249,130 - 249,130 Capital Projects Fund - 58,709 58,709 Debt Service Fund - 30,694 30,694 Food Service Fund 65,159 2,090 67,249
Total Awards & Financial Assistance 314,289$ 5,958,152$ 6,272,441$
198
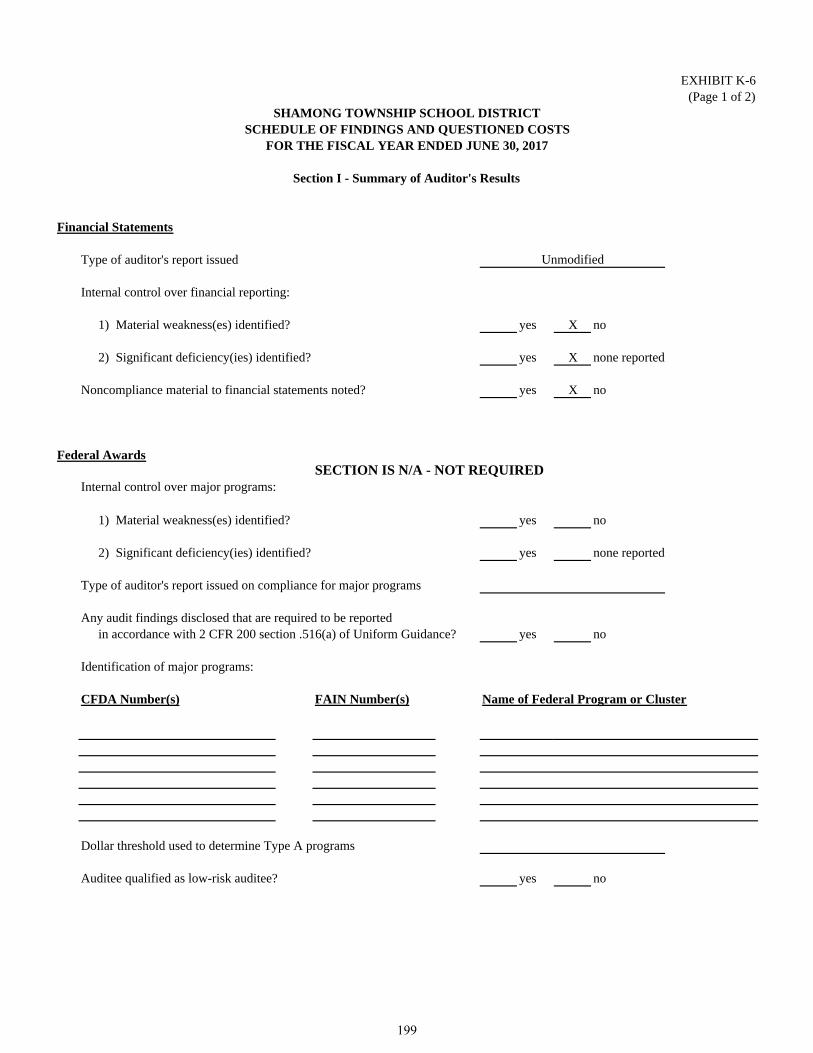
Financial Statements
Type of auditor's report issued
Internal control over financial reporting:
1) Material weakness(es) identified? yes X no
2) Significant deficiency(ies) identified? yes X none reported
Noncompliance material to financial statements noted? yes X no
Federal AwardsSECTION IS N/A - NOT REQUIRED
Internal control over major programs:
1) Material weakness(es) identified? yes no
2) Significant deficiency(ies) identified? yes none reported
Type of auditor's report issued on compliance for major programs
Any audit findings disclosed that are required to be reportedin accordance with 2 CFR 200 section .516(a) of Uniform Guidance? yes no
Identification of major programs:
CFDA Number(s) FAIN Number(s) Name of Federal Program or Cluster
Dollar threshold used to determine Type A programs
Auditee qualified as low-risk auditee? yes no
EXHIBIT K-6(Page 1 of 2)
SHAMONG TOWNSHIP SCHOOL DISTRICTSCHEDULE OF FINDINGS AND QUESTIONED COSTS
FOR THE FISCAL YEAR ENDED JUNE 30, 2017
Section I - Summary of Auditor's Results
Unmodified
199

State Financial Assistance
Dollar threshold used to determine Type A programs
Auditee qualified as low-risk auditee? X yes no
Internal control over major programs:
1) Material weakness(es) identified? yes X no
2) Significant deficiency(ies) identified? yes X no
Type of auditor's report issued on compliance for major programs
Any audit findings disclosed that are required to be reportedin accordance with New Jersey OMB's Circular 15-08? yes X no
Identification of major programs:
State Grant/Project Number(s) Name of State Program
Professional Learning Community Aid495-034-5120-101
495-034-5120-089 Special Education Categorical Aid495-034-5120-097 Per Pupil Growth Aid495-034-5120-098 PARCC Readiness Aid
State Aid - Public:495-034-5120-078 Equalization Aid495-034-5120-084 Security Aid
Unmodified
EXHIBIT K-6(Page 2 of 2)
SHAMONG TOWNSHIP SCHOOL DISTRICTSCHEDULE OF FINDINGS AND QUESTIONED COSTS
FOR THE FISCAL YEAR ENDED JUNE 30, 2017
Section I - Summary of Auditor's Results (continued)
$750,000.00
200

EXHIBIT K-7
SHAMONG TOWNSHIP SCHOOL DISTRICT SCHEDULE OF FINDINGS & QUESTIONED COSTS
FOR THE FISCAL YEAR ENDED JUNE 30, 2017
Section II – Financial Statement Findings This section identifies the significant deficiencies, material weaknesses and instances of noncompliance related to the basic financial statements that are required to be reported in accordance with Government Auditing Standards and with audit requirements prescribed by the Division of Administration and Finance, Department of Education, State of New Jersey. None.
201

EXHIBIT K-7
SHAMONG TOWNSHIP SCHOOL DISTRICT SCHEDULE OF FINDINGS & QUESTIONED COSTS
FOR THE FISCAL YEAR ENDED JUNE 30, 2017
Section III – Federal Awards & State Financial Assistance Findings & Questioned Costs This section identifies the significant deficiencies, material weaknesses and instances of noncompliance, including questioned costs, related to the audit of major federal and state programs, as required by Title 2 U.S. Code of Federal Regulations (CFR) Part 200, Uniform Administrative Requirements, Cost Principals, and Audit Requirements for Federal Awards (Uniform Guidance) and New Jersey OMB’s Circular 15-08. FEDERAL AWARDS
N/A – Federal single audit not required
STATE FINANCIAL ASSISTANCE
None.
202
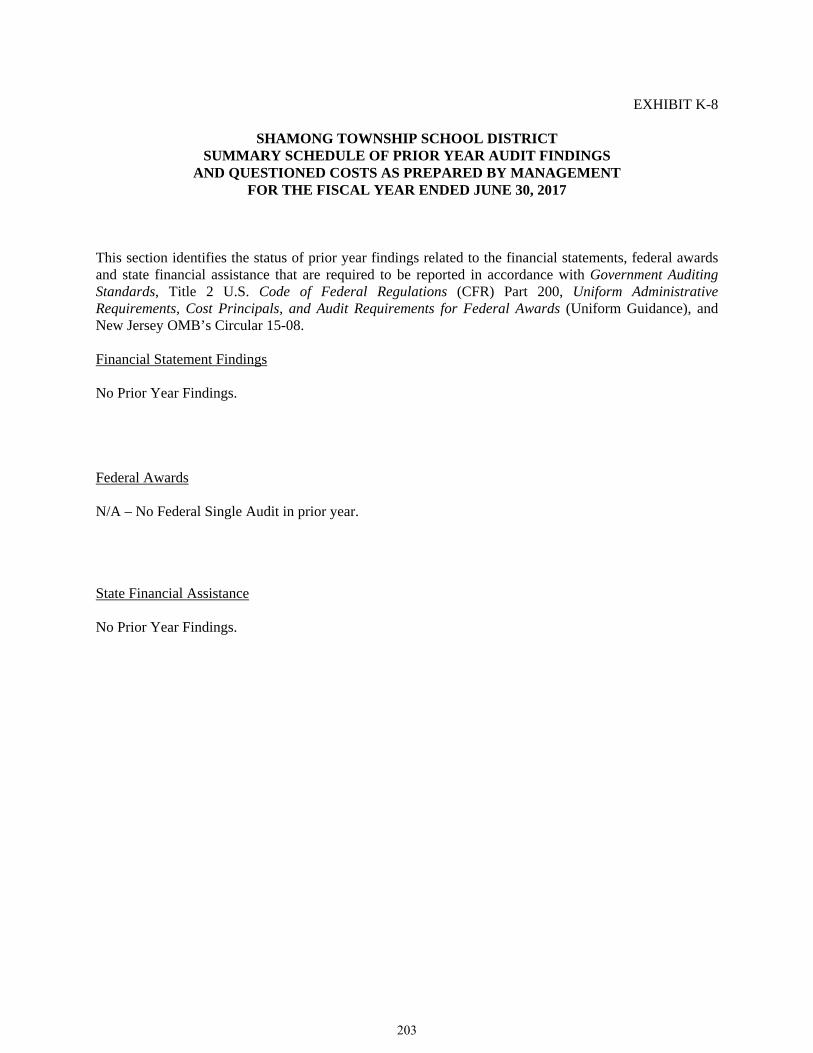
EXHIBIT K-8
SHAMONG TOWNSHIP SCHOOL DISTRICT SUMMARY SCHEDULE OF PRIOR YEAR AUDIT FINDINGS
AND QUESTIONED COSTS AS PREPARED BY MANAGEMENT FOR THE FISCAL YEAR ENDED JUNE 30, 2017
This section identifies the status of prior year findings related to the financial statements, federal awards and state financial assistance that are required to be reported in accordance with Government Auditing Standards, Title 2 U.S. Code of Federal Regulations (CFR) Part 200, Uniform Administrative Requirements, Cost Principals, and Audit Requirements for Federal Awards (Uniform Guidance), and New Jersey OMB’s Circular 15-08.
Financial Statement Findings
No Prior Year Findings.
Federal Awards
N/A – No Federal Single Audit in prior year.
State Financial Assistance
No Prior Year Findings.
203


