Embed Size (px)
Citation preview
New Jersey Department of Human Services
Division of Mental Health and Addiction Services
Substance Abuse Treatment
State Performance Report
September 2014
July 1, 2013 - June 30, 2014
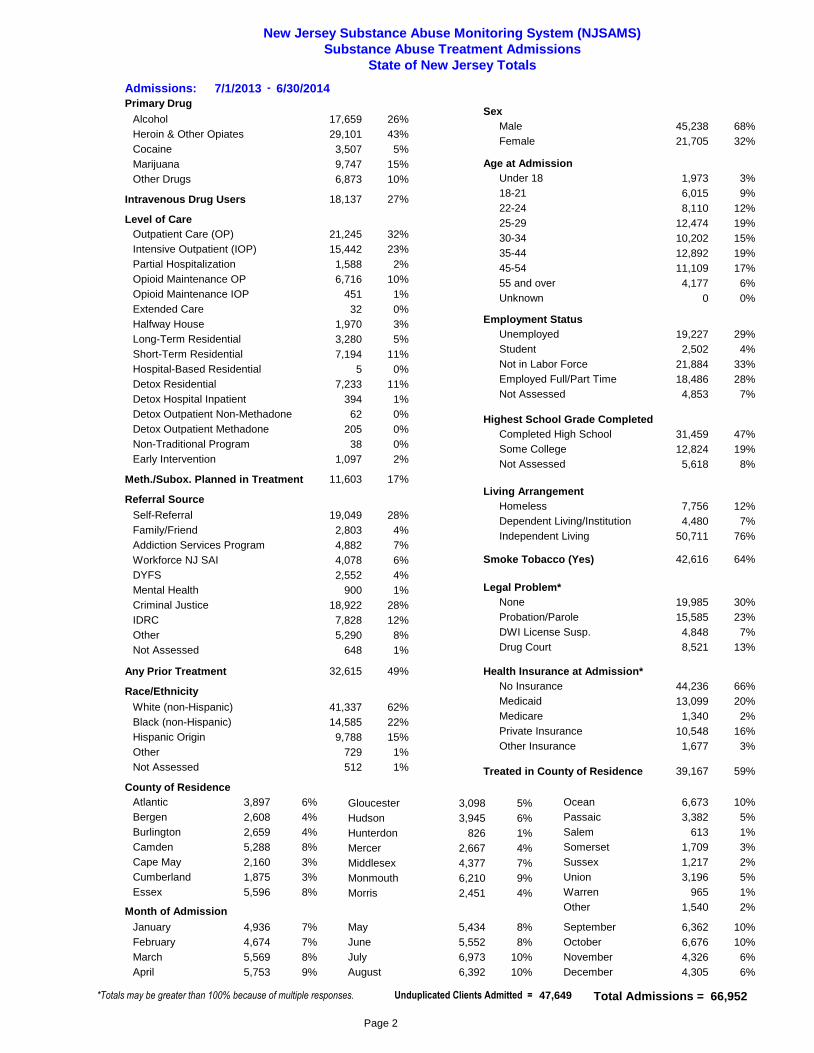
New Jersey Substance Abuse Monitoring System (NJSAMS)
Substance Abuse Treatment Admissions
State of New Jersey Totals
Primary Drug
Alcohol 17,659
Heroin & Other Opiates 29,101
Cocaine 3,507
Marijuana 9,747
Other Drugs 6,873
Level of Care
Outpatient Care (OP) 21,245
Intensive Outpatient (IOP) 15,442
Partial Hospitalization 1,588
Opioid Maintenance OP 6,716
Opioid Maintenance IOP 451
Extended Care 32
Halfway House 1,970
Long-Term Residential 3,280
Short-Term Residential 7,194
Hospital-Based Residential 5
Detox Residential 7,233
Detox Hospital Inpatient 394
Detox Outpatient Non-Methadone 62
Detox Outpatient Methadone 205
Non-Traditional Program 38
Intravenous Drug Users 18,137
Meth./Subox. Planned in Treatment 11,603
26%
43%
5%
15%
10%
32%
23%
2%
10%
1%
0%
3%
5%
11%
0%
11%
1%
0%
0%
0%
Referral Source
Self-Referral 19,049
Family/Friend 2,803
Addiction Services Program 4,882
Workforce NJ SAI 4,078
DYFS 2,552
Mental Health 900
Criminal Justice 18,922
IDRC 7,828
Other 5,290
Not Assessed 648
28%
4%
7%
6%
4%
1%
28%
12%
8%
1%
Any Prior Treatment 32,615
Male 45,238
Sex
Female 21,705
Hispanic Origin 9,788
Race/Ethnicity
White (non-Hispanic) 41,337
Black (non-Hispanic) 14,585
Other 729
Not Assessed 512
Age at Admission
Employment Status
Highest School Grade Completed
Living Arrangement
Health Insurance at Admission*
Treated in County of Residence
County of Residence
Unemployed 19,227
Student 2,502
Not in Labor Force 21,884
Employed Full/Part Time 18,486
Not Assessed 4,853
62%
22%
15%
1%
1%
68%
32%
29%
4%
33%
28%
7%
Completed High School 31,459
Some College 12,824
Not Assessed 5,618
47%
19%
8%
Homeless 7,756
Dependent Living/Institution 4,480
Independent Living 50,711
12%
7%
76%
Medicaid 13,099
Medicare 1,340
Private Insurance 10,548
Other Insurance 1,677
Atlantic 3,897 Gloucester 3,098 Ocean 6,6736% 5% 10%
Bergen 2,608
Burlington 2,659
Camden 5,288
Cape May 2,160
Cumberland 1,875
Essex 5,596
Hudson 3,945
Hunterdon 826
Mercer 2,667
Middlesex 4,377
Monmouth 6,210
Morris 2,451
Passaic 3,382
Salem 613
Somerset 1,709
Sussex 1,217
Union 3,196
Warren 965
Other 1,540
4%
4%
8%
3%
3%
8%
6%
1%
4%
7%
9%
4%
5%
1%
3%
2%
5%
1%
2%Month of Admission
No Insurance 44,236 66%
20%
2%
16%
3%
49%
17%
27%
Under 18 1,973
18-21 6,015
22-24 8,110
25-29 12,474
30-34 10,202
35-44 12,892
45-54 11,109
55 and over 4,177
Unknown 0
3%
9%
12%
19%
15%
19%
17%
6%
0%
January 4,936
February 4,674
March 5,569
April 5,753
May 5,434
June 5,552
July 6,973
August 6,392
September 6,362
October 6,676
November 4,326
December 4,305
7%
7%
8%
9%
8%
8%
10%
10%
10%
10%
6%
6%
Total Admissions = 66,952*Totals may be greater than 100% because of multiple responses.
39,167 59%
Admissions: 7/1/2013 6/30/2014-
Smoke Tobacco (Yes) 42,616 64%
Legal Problem*
None 19,985
Probation/Parole 15,585
DWI License Susp. 4,848
Drug Court 8,521
30%
23%
7%
13%
Early Intervention 1,097 2%
Unduplicated Clients Admitted = 47,649
Page 2
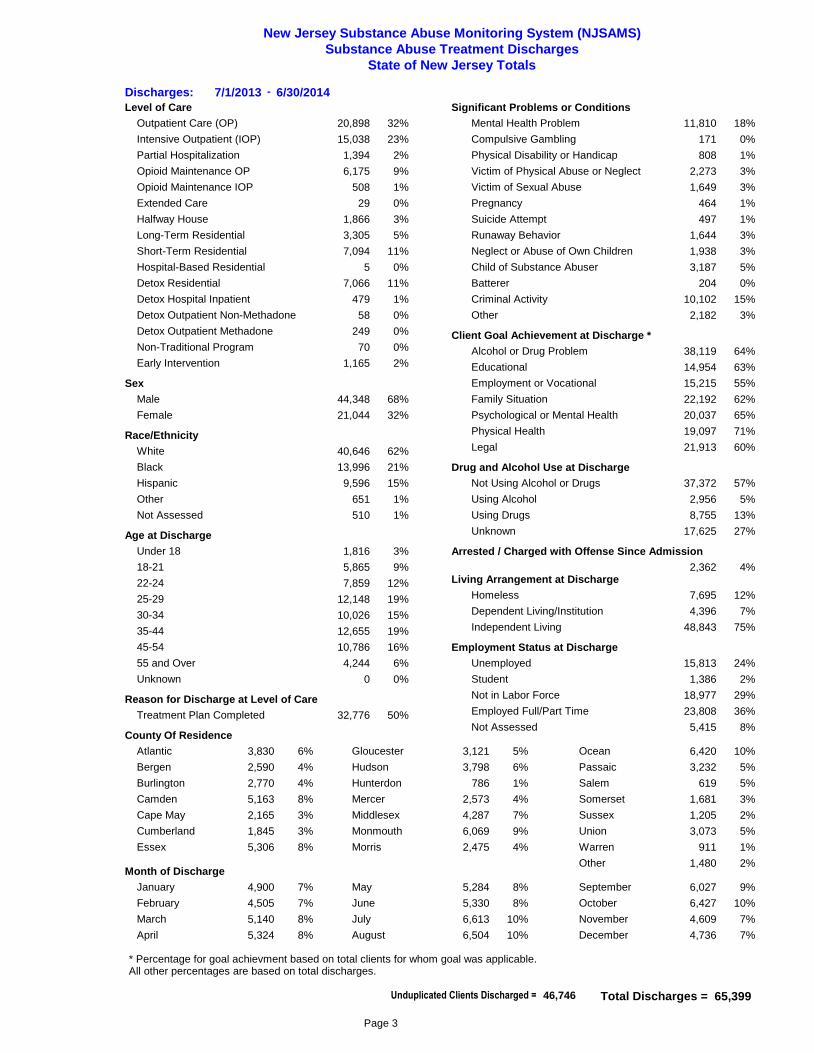
New Jersey Substance Abuse Monitoring System (NJSAMS)
Substance Abuse Treatment Discharges
State of New Jersey Totals
Level of Care Significant Problems or Conditions
Detox Outpatient Non-Methadone 58
Victim of Physical Abuse or Neglect 2,273
0%
3%
Outpatient Care (OP) 20,898 32%
Intensive Outpatient (IOP) 15,038 23%
Partial Hospitalization 1,394 2%
Opioid Maintenance OP 6,175 9%
Opioid Maintenance IOP 508 1%
Extended Care 29 0%
Halfway House 1,866 3%
Long-Term Residential 3,305
Short-Term Residential 7,094
5%
11%
Hospital-Based Residential 5 0%
Detox Residential 7,066 11%
Detox Hospital Inpatient 479 1%
Detox Outpatient Methadone 249 0%
Non-Traditional Program 70 0%
Mental Health Problem 11,810 18%
Compulsive Gambling 171 0%
Physical Disability or Handicap 808 1%
Victim of Sexual Abuse 1,649 3%
Pregnancy 464 1%
Suicide Attempt 497 1%
Runaway Behavior 1,644 3%
Neglect or Abuse of Own Children 1,938 3%
Child of Substance Abuser 3,187 5%
Batterer 204 0%
Criminal Activity 10,102 15%
Other 2,182 3%
Sex
Male 44,348
Female 21,044
68%
32%
Race/Ethnicity
White 40,646
Black 13,996
Hispanic 9,596
Other 651
Not Assessed 510
62%
21%
15%
1%
1%
Treatment Plan Completed 32,776 50%
Reason for Discharge at Level of Care
Age at Discharge
Under 18 1,816 3%
18-21 5,865 9%
22-24 7,859 12%
25-29 12,148 19%
30-34 10,026 15%
35-44 12,655 19%
45-54 10,786 16%
55 and Over 4,244 6%
Unknown 0 0%
Client Goal Achievement at Discharge *
Alcohol or Drug Problem 38,119 64%
Educational 14,954
Employment or Vocational 15,215
63%
55%
Family Situation 22,192 62%
Psychological or Mental Health 20,037 65%
Physical Health 19,097 71%
Legal 21,913 60%
Drug and Alcohol Use at Discharge
Not Using Alcohol or Drugs 37,372
Using Alcohol 2,956
57%
5%
Using Drugs 8,755 13%
Unknown 17,625 27%
Living Arrangement at Discharge
Homeless 7,695
Dependent Living/Institution 4,396
Independent Living 48,843
12%
7%
75%
Employment Status at Discharge
Unemployed 15,813
Student 1,386
Not in Labor Force 18,977
Employed Full/Part Time 23,808
Not Assessed 5,415
24%
2%
29%
36%
8%
Arrested / Charged with Offense Since Admission
2,362 4%
County Of Residence
Atlantic 3,830 6%
Bergen 2,590 4%
Burlington 2,770 4%
Camden 5,163
Cape May 2,165
Cumberland 1,845
Essex 5,306
8%
3%
3%
8%
Gloucester 3,121 5% Ocean 6,420 10%
Hudson 3,798 6%
Hunterdon 786
Mercer 2,573
Middlesex 4,287
Monmouth 6,069
Morris 2,475
1%
4%
7%
9%
4%
Passaic 3,232
Salem 619
Sussex 1,205
Union 3,073
Warren 911
Other 1,480
Somerset 1,681
5%
5%
3%
2%
5%
1%
2%Month of Discharge
January 4,900 7% May 5,284 8% September 6,027 9%
February 4,505 7%
March 5,140 8%
April 5,324 8%
June 5,330 8%
July 6,613 10%
August 6,504 10%
October 6,427
November 4,609
December 4,736
10%
7%
7%
Total Discharges = 65,399
* Percentage for goal achievment based on total clients for whom goal was applicable.All other percentages are based on total discharges.
Discharges: 7/1/2013 6/30/2014-
Early Intervention 1,165 2%
Unduplicated Clients Discharged = 46,746
Page 3
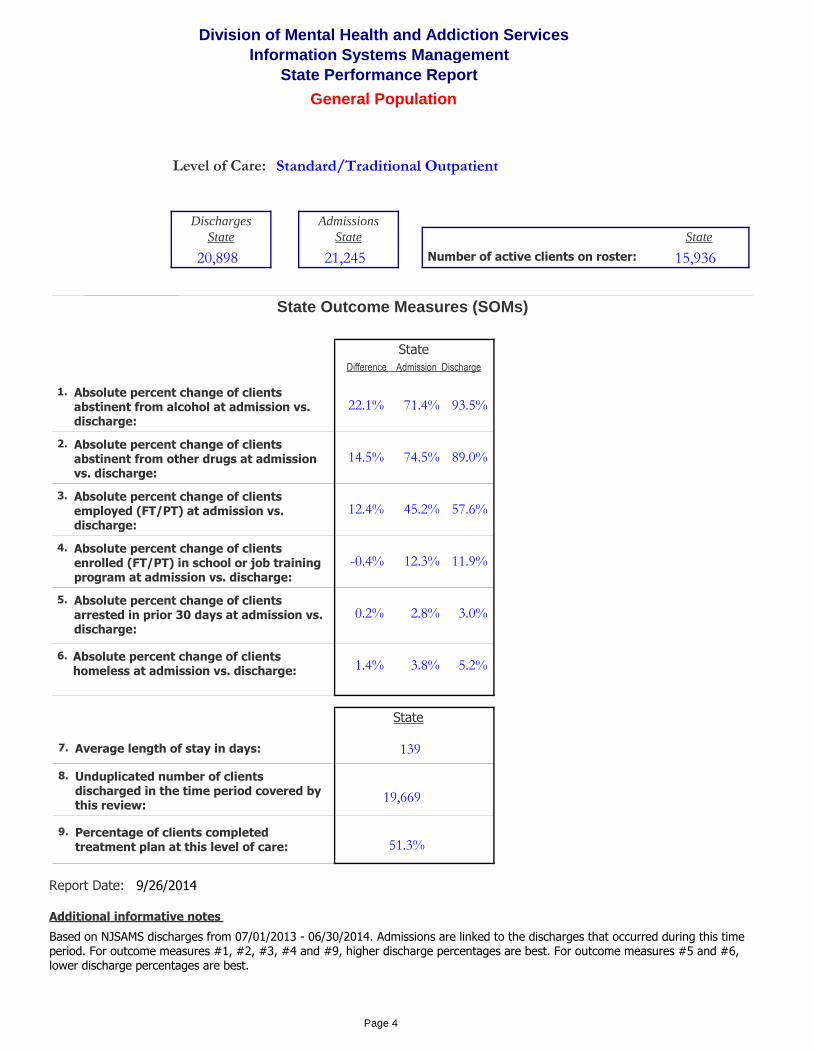
22.1%
12.4%
0.2%
1.4%
139
19,669
51.3%
Additional informative notes
14.5%
9/26/2014Report Date:
93.5%
57.6%
3.0%
5.2%
89.0%
71.4%
45.2%
2.8%
3.8%
74.5%
Level of Care:
State Outcome Measures (SOMs)
Absolute percent change of clients abstinent from alcohol at admission vs. discharge:
Average length of stay in days:
Unduplicated number of clients discharged in the time period covered by this review:
Percentage of clients completed treatment plan at this level of care:
Absolute percent change of clients abstinent from other drugs at admission vs. discharge:
Absolute percent change of clients employed (FT/PT) at admission vs. discharge:
Absolute percent change of clients arrested in prior 30 days at admission vs. discharge:
Absolute percent change of clients homeless at admission vs. discharge:
Standard/Traditional Outpatient
1.
2.
3.
5.
6.
7.
8.
9.
Based on NJSAMS discharges from 07/01/2013 - 06/30/2014. Admissions are linked to the discharges that occurred during this time period. For outcome measures #1, #2, #3, #4 and #9, higher discharge percentages are best. For outcome measures #5 and #6, lower discharge percentages are best.
Division of Mental Health and Addiction Services
General Population
State
Difference Admission Discharge
State
-0.4% 11.9%12.3%Absolute percent change of clients enrolled (FT/PT) in school or job training program at admission vs. discharge:
4.
State
Number of active clients on roster:
Discharges
20,898 15,936
StateState
Admissions
21,245
Information Systems Management
State Performance Report
Page 4

18.1%
11.3%
-0.1%
2.1%
108
13,471
36.0%
Additional informative notes
27.5%
9/26/2014Report Date:
93.4%
35.9%
5.0%
8.9%
82.3%
75.3%
24.6%
5.1%
6.8%
54.8%
Level of Care:
State Outcome Measures (SOMs)
Absolute percent change of clients abstinent from alcohol at admission vs. discharge:
Average length of stay in days:
Unduplicated number of clients discharged in the time period covered by this review:
Percentage of clients completed treatment plan at this level of care:
Absolute percent change of clients abstinent from other drugs at admission vs. discharge:
Absolute percent change of clients employed (FT/PT) at admission vs. discharge:
Absolute percent change of clients arrested in prior 30 days at admission vs. discharge:
Absolute percent change of clients homeless at admission vs. discharge:
Intensive Outpatient
1.
2.
3.
5.
6.
7.
8.
9.
Based on NJSAMS discharges from 07/01/2013 - 06/30/2014. Admissions are linked to the discharges that occurred during this time period. For outcome measures #1, #2, #3, #4 and #9, higher discharge percentages are best. For outcome measures #5 and #6, lower discharge percentages are best.
Division of Mental Health and Addiction Services
General Population
State
Difference Admission Discharge
State
0.9% 7.2%6.3%Absolute percent change of clients enrolled (FT/PT) in school or job training program at admission vs. discharge:
4.
State
Number of active clients on roster:
Discharges
15,038 8,729
StateState
Admissions
15,442
Information Systems Management
State Performance Report
Page 5

24.7%
1.3%
-1.9%
0.5%
114
1,310
38.6%
Additional informative notes
44.2%
9/26/2014Report Date:
92.8%
17.4%
4.3%
11.8%
86.7%
68.1%
16.1%
6.2%
11.3%
42.5%
Level of Care:
State Outcome Measures (SOMs)
Absolute percent change of clients abstinent from alcohol at admission vs. discharge:
Average length of stay in days:
Unduplicated number of clients discharged in the time period covered by this review:
Percentage of clients completed treatment plan at this level of care:
Absolute percent change of clients abstinent from other drugs at admission vs. discharge:
Absolute percent change of clients employed (FT/PT) at admission vs. discharge:
Absolute percent change of clients arrested in prior 30 days at admission vs. discharge:
Absolute percent change of clients homeless at admission vs. discharge:
Partial Hospitalization
1.
2.
3.
5.
6.
7.
8.
9.
Based on NJSAMS discharges from 07/01/2013 - 06/30/2014. Admissions are linked to the discharges that occurred during this time period. For outcome measures #1, #2, #3, #4 and #9, higher discharge percentages are best. For outcome measures #5 and #6, lower discharge percentages are best.
Division of Mental Health and Addiction Services
General Population
State
Difference Admission Discharge
State
0.4% 2.8%2.4%Absolute percent change of clients enrolled (FT/PT) in school or job training program at admission vs. discharge:
4.
State
Number of active clients on roster:
Discharges
1,394 1,322
StateState
Admissions
1,588
Information Systems Management
State Performance Report
Page 6

13.8%
-3.4%
0.0%
10.3%
305
28
31.0%
Additional informative notes
37.9%
9/26/2014Report Date:
89.7%
24.1%
6.9%
13.8%
100.0%
75.9%
27.6%
6.9%
3.4%
62.1%
Level of Care:
State Outcome Measures (SOMs)
Absolute percent change of clients abstinent from alcohol at admission vs. discharge:
Average length of stay in days:
Unduplicated number of clients discharged in the time period covered by this review:
Percentage of clients completed treatment plan at this level of care:
Absolute percent change of clients abstinent from other drugs at admission vs. discharge:
Absolute percent change of clients employed (FT/PT) at admission vs. discharge:
Absolute percent change of clients arrested in prior 30 days at admission vs. discharge:
Absolute percent change of clients homeless at admission vs. discharge:
Transitional/Extended Care
1.
2.
3.
5.
6.
7.
8.
9.
Based on NJSAMS discharges from 07/01/2013 - 06/30/2014. Admissions are linked to the discharges that occurred during this time period. For outcome measures #1, #2, #3, #4 and #9, higher discharge percentages are best. For outcome measures #5 and #6, lower discharge percentages are best.
Division of Mental Health and Addiction Services
General Population
State
Difference Admission Discharge
State
0.0% 24.1%24.1%Absolute percent change of clients enrolled (FT/PT) in school or job training program at admission vs. discharge:
4.
State
Number of active clients on roster:
Discharges
29 70
StateState
Admissions
32
Information Systems Management
State Performance Report
Page 7

9.4%
47.7%
-1.0%
-6.0%
124
1,764
54.1%
Additional informative notes
24.5%
9/26/2014Report Date:
97.5%
50.5%
3.1%
25.6%
91.2%
88.1%
2.8%
4.0%
31.6%
66.7%
Level of Care:
State Outcome Measures (SOMs)
Absolute percent change of clients abstinent from alcohol at admission vs. discharge:
Average length of stay in days:
Unduplicated number of clients discharged in the time period covered by this review:
Percentage of clients completed treatment plan at this level of care:
Absolute percent change of clients abstinent from other drugs at admission vs. discharge:
Absolute percent change of clients employed (FT/PT) at admission vs. discharge:
Absolute percent change of clients arrested in prior 30 days at admission vs. discharge:
Absolute percent change of clients homeless at admission vs. discharge:
Halfway House
1.
2.
3.
5.
6.
7.
8.
9.
Based on NJSAMS discharges from 07/01/2013 - 06/30/2014. Admissions are linked to the discharges that occurred during this time period. For outcome measures #1, #2, #3, #4 and #9, higher discharge percentages are best. For outcome measures #5 and #6, lower discharge percentages are best.
Division of Mental Health and Addiction Services
General Population
State
Difference Admission Discharge
State
5.4% 8.7%3.4%Absolute percent change of clients enrolled (FT/PT) in school or job training program at admission vs. discharge:
4.
State
Number of active clients on roster:
Discharges
1,866 919
StateState
Admissions
1,970
Information Systems Management
State Performance Report
Page 8

13.0%
1.3%
-2.8%
9.7%
117
3,091
53.0%
Additional informative notes
44.8%
9/26/2014Report Date:
99.4%
2.8%
1.9%
37.9%
97.5%
86.4%
1.4%
4.7%
28.2%
52.7%
Level of Care:
State Outcome Measures (SOMs)
Absolute percent change of clients abstinent from alcohol at admission vs. discharge:
Average length of stay in days:
Unduplicated number of clients discharged in the time period covered by this review:
Percentage of clients completed treatment plan at this level of care:
Absolute percent change of clients abstinent from other drugs at admission vs. discharge:
Absolute percent change of clients employed (FT/PT) at admission vs. discharge:
Absolute percent change of clients arrested in prior 30 days at admission vs. discharge:
Absolute percent change of clients homeless at admission vs. discharge:
Long-Term Residential
1.
2.
3.
5.
6.
7.
8.
9.
Based on NJSAMS discharges from 07/01/2013 - 06/30/2014. Admissions are linked to the discharges that occurred during this time period. For outcome measures #1, #2, #3, #4 and #9, higher discharge percentages are best. For outcome measures #5 and #6, lower discharge percentages are best.
Division of Mental Health and Addiction Services
General Population
State
Difference Admission Discharge
State
2.7% 6.1%3.3%Absolute percent change of clients enrolled (FT/PT) in school or job training program at admission vs. discharge:
4.
State
Number of active clients on roster:
Discharges
3,305 1,766
StateState
Admissions
3,280
Information Systems Management
State Performance Report
Page 9

24.5%
1.2%
-6.0%
1.9%
25
6,548
74.5%
Additional informative notes
64.7%
9/26/2014Report Date:
99.7%
12.6%
2.5%
18.0%
99.1%
75.2%
11.5%
8.5%
16.1%
34.4%
Level of Care:
State Outcome Measures (SOMs)
Absolute percent change of clients abstinent from alcohol at admission vs. discharge:
Average length of stay in days:
Unduplicated number of clients discharged in the time period covered by this review:
Percentage of clients completed treatment plan at this level of care:
Absolute percent change of clients abstinent from other drugs at admission vs. discharge:
Absolute percent change of clients employed (FT/PT) at admission vs. discharge:
Absolute percent change of clients arrested in prior 30 days at admission vs. discharge:
Absolute percent change of clients homeless at admission vs. discharge:
Short-Term Residential
1.
2.
3.
5.
6.
7.
8.
9.
Based on NJSAMS discharges from 07/01/2013 - 06/30/2014. Admissions are linked to the discharges that occurred during this time period. For outcome measures #1, #2, #3, #4 and #9, higher discharge percentages are best. For outcome measures #5 and #6, lower discharge percentages are best.
Division of Mental Health and Addiction Services
General Population
State
Difference Admission Discharge
State
-0.5% 2.7%3.2%Absolute percent change of clients enrolled (FT/PT) in school or job training program at admission vs. discharge:
4.
State
Number of active clients on roster:
Discharges
7,094 942
StateState
Admissions
7,194
Information Systems Management
State Performance Report
Page 10
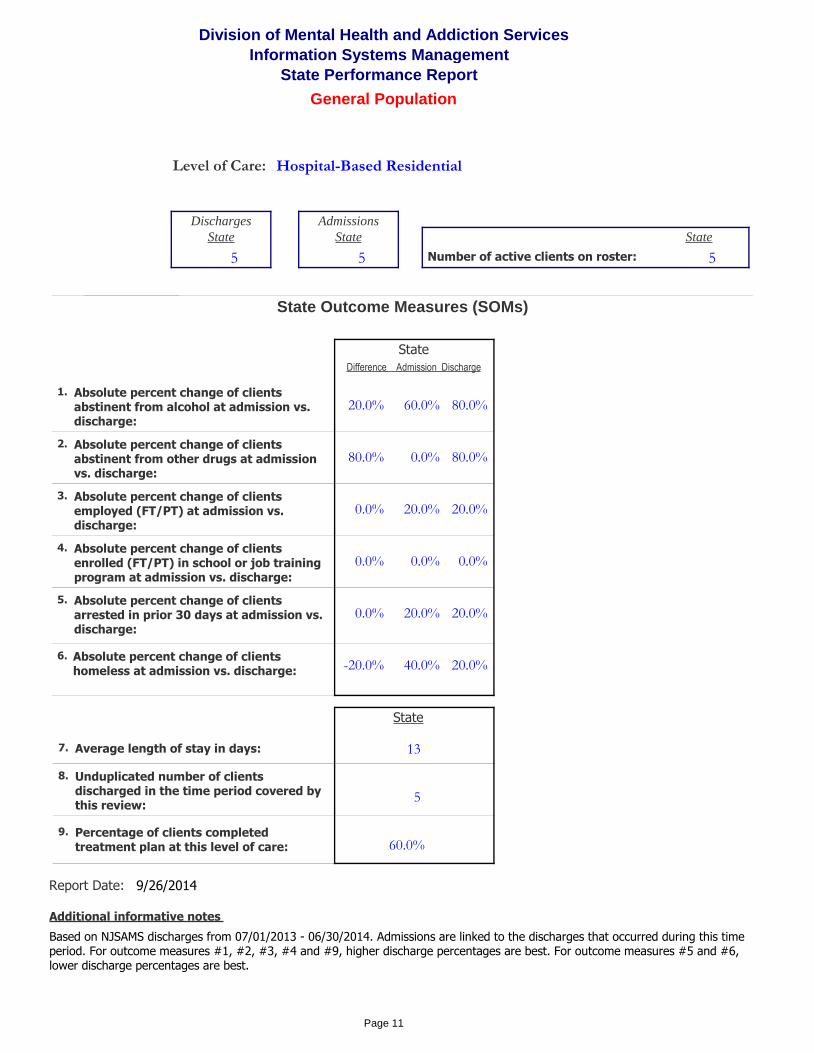
20.0%
0.0%
0.0%
-20.0%
13
5
60.0%
Additional informative notes
80.0%
9/26/2014Report Date:
80.0%
20.0%
20.0%
20.0%
80.0%
60.0%
20.0%
20.0%
40.0%
0.0%
Level of Care:
State Outcome Measures (SOMs)
Absolute percent change of clients abstinent from alcohol at admission vs. discharge:
Average length of stay in days:
Unduplicated number of clients discharged in the time period covered by this review:
Percentage of clients completed treatment plan at this level of care:
Absolute percent change of clients abstinent from other drugs at admission vs. discharge:
Absolute percent change of clients employed (FT/PT) at admission vs. discharge:
Absolute percent change of clients arrested in prior 30 days at admission vs. discharge:
Absolute percent change of clients homeless at admission vs. discharge:
Hospital-Based Residential
1.
2.
3.
5.
6.
7.
8.
9.
Based on NJSAMS discharges from 07/01/2013 - 06/30/2014. Admissions are linked to the discharges that occurred during this time period. For outcome measures #1, #2, #3, #4 and #9, higher discharge percentages are best. For outcome measures #5 and #6, lower discharge percentages are best.
Division of Mental Health and Addiction Services
General Population
State
Difference Admission Discharge
State
0.0% 0.0%0.0%Absolute percent change of clients enrolled (FT/PT) in school or job training program at admission vs. discharge:
4.
State
Number of active clients on roster:
Discharges
5 5
StateState
Admissions
5
Information Systems Management
State Performance Report
Page 11
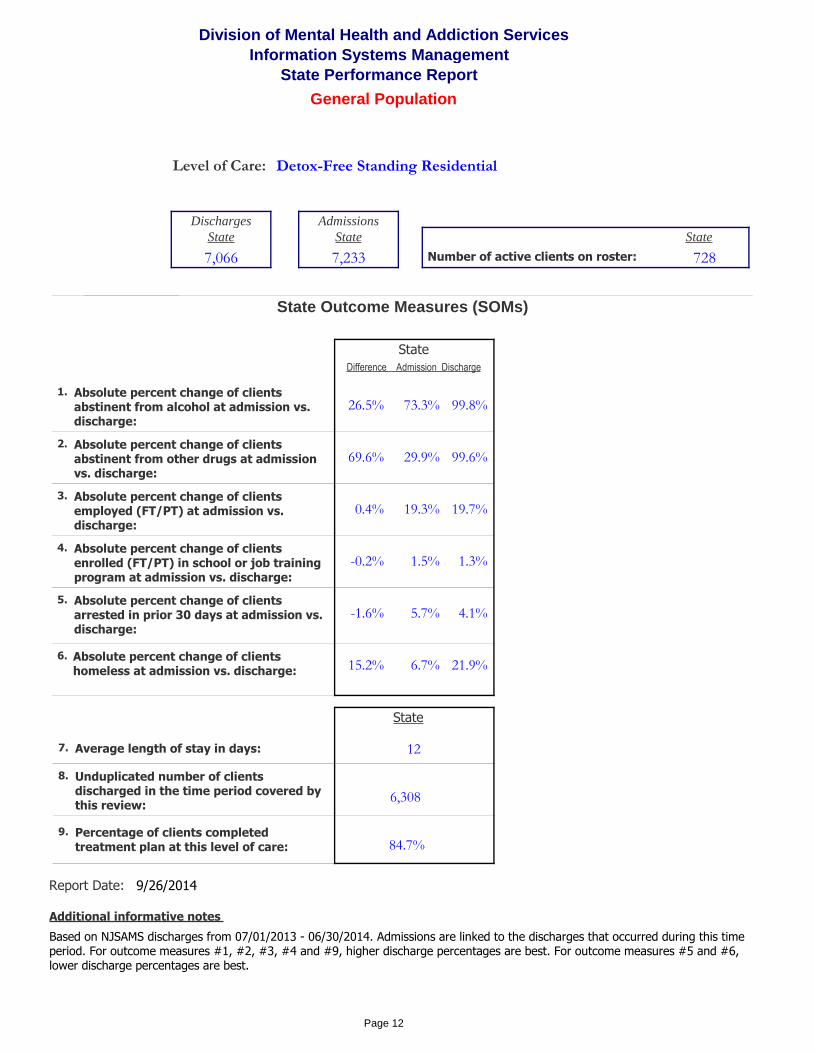
26.5%
0.4%
-1.6%
15.2%
12
6,308
84.7%
Additional informative notes
69.6%
9/26/2014Report Date:
99.8%
19.7%
4.1%
21.9%
99.6%
73.3%
19.3%
5.7%
6.7%
29.9%
Level of Care:
State Outcome Measures (SOMs)
Absolute percent change of clients abstinent from alcohol at admission vs. discharge:
Average length of stay in days:
Unduplicated number of clients discharged in the time period covered by this review:
Percentage of clients completed treatment plan at this level of care:
Absolute percent change of clients abstinent from other drugs at admission vs. discharge:
Absolute percent change of clients employed (FT/PT) at admission vs. discharge:
Absolute percent change of clients arrested in prior 30 days at admission vs. discharge:
Absolute percent change of clients homeless at admission vs. discharge:
Detox-Free Standing Residential
1.
2.
3.
5.
6.
7.
8.
9.
Based on NJSAMS discharges from 07/01/2013 - 06/30/2014. Admissions are linked to the discharges that occurred during this time period. For outcome measures #1, #2, #3, #4 and #9, higher discharge percentages are best. For outcome measures #5 and #6, lower discharge percentages are best.
Division of Mental Health and Addiction Services
General Population
State
Difference Admission Discharge
State
-0.2% 1.3%1.5%Absolute percent change of clients enrolled (FT/PT) in school or job training program at admission vs. discharge:
4.
State
Number of active clients on roster:
Discharges
7,066 728
StateState
Admissions
7,233
Information Systems Management
State Performance Report
Page 12

31.3%
-0.2%
-5.2%
-34.0%
59
472
65.1%
Additional informative notes
84.6%
9/26/2014Report Date:
99.4%
6.7%
0.4%
7.7%
99.0%
68.1%
6.9%
5.6%
41.8%
14.4%
Level of Care:
State Outcome Measures (SOMs)
Absolute percent change of clients abstinent from alcohol at admission vs. discharge:
Average length of stay in days:
Unduplicated number of clients discharged in the time period covered by this review:
Percentage of clients completed treatment plan at this level of care:
Absolute percent change of clients abstinent from other drugs at admission vs. discharge:
Absolute percent change of clients employed (FT/PT) at admission vs. discharge:
Absolute percent change of clients arrested in prior 30 days at admission vs. discharge:
Absolute percent change of clients homeless at admission vs. discharge:
Detox-Hospital Inpatient
1.
2.
3.
5.
6.
7.
8.
9.
Based on NJSAMS discharges from 07/01/2013 - 06/30/2014. Admissions are linked to the discharges that occurred during this time period. For outcome measures #1, #2, #3, #4 and #9, higher discharge percentages are best. For outcome measures #5 and #6, lower discharge percentages are best.
Division of Mental Health and Addiction Services
General Population
State
Difference Admission Discharge
State
-0.2% 0.2%0.4%Absolute percent change of clients enrolled (FT/PT) in school or job training program at admission vs. discharge:
4.
State
Number of active clients on roster:
Discharges
479 518
StateState
Admissions
394
Information Systems Management
State Performance Report
Page 13
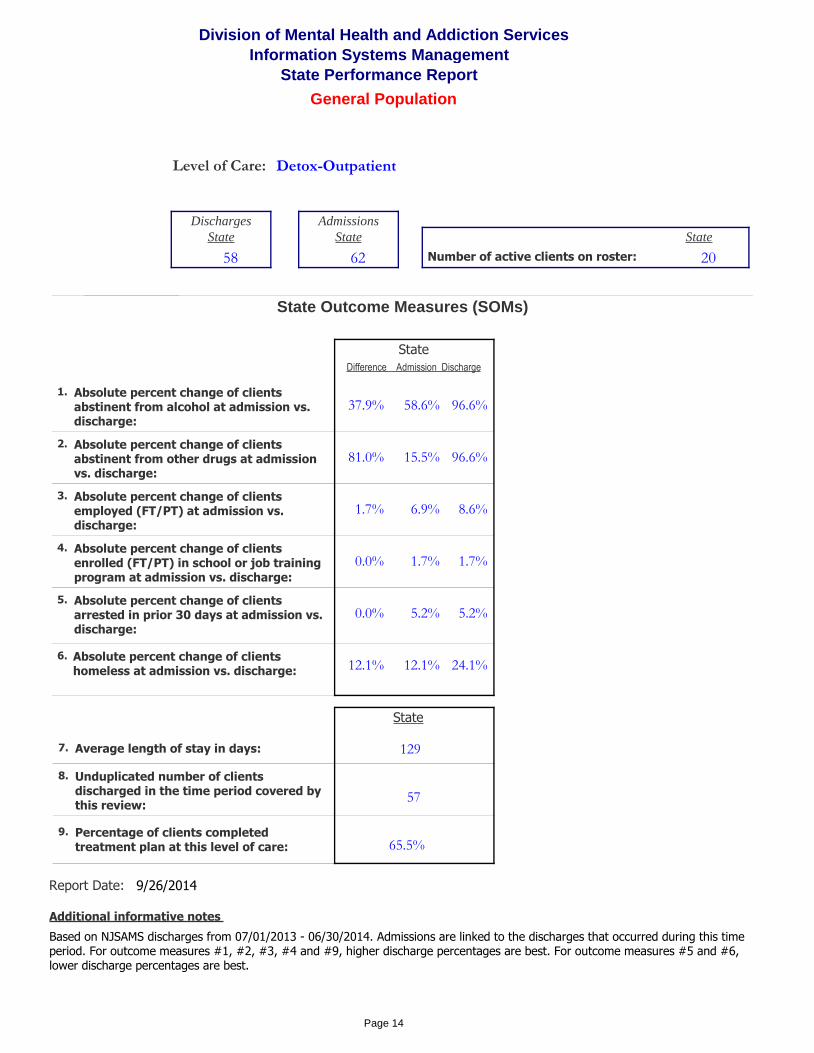
37.9%
1.7%
0.0%
12.1%
129
57
65.5%
Additional informative notes
81.0%
9/26/2014Report Date:
96.6%
8.6%
5.2%
24.1%
96.6%
58.6%
6.9%
5.2%
12.1%
15.5%
Level of Care:
State Outcome Measures (SOMs)
Absolute percent change of clients abstinent from alcohol at admission vs. discharge:
Average length of stay in days:
Unduplicated number of clients discharged in the time period covered by this review:
Percentage of clients completed treatment plan at this level of care:
Absolute percent change of clients abstinent from other drugs at admission vs. discharge:
Absolute percent change of clients employed (FT/PT) at admission vs. discharge:
Absolute percent change of clients arrested in prior 30 days at admission vs. discharge:
Absolute percent change of clients homeless at admission vs. discharge:
Detox-Outpatient
1.
2.
3.
5.
6.
7.
8.
9.
Based on NJSAMS discharges from 07/01/2013 - 06/30/2014. Admissions are linked to the discharges that occurred during this time period. For outcome measures #1, #2, #3, #4 and #9, higher discharge percentages are best. For outcome measures #5 and #6, lower discharge percentages are best.
Division of Mental Health and Addiction Services
General Population
State
Difference Admission Discharge
State
0.0% 1.7%1.7%Absolute percent change of clients enrolled (FT/PT) in school or job training program at admission vs. discharge:
4.
State
Number of active clients on roster:
Discharges
58 20
StateState
Admissions
62
Information Systems Management
State Performance Report
Page 14

0.7%
2.0%
-0.6%
1.5%
539
5,711
11.6%
Additional informative notes
44.2%
9/26/2014Report Date:
95.8%
27.8%
4.9%
6.7%
54.1%
95.1%
25.8%
5.6%
5.2%
9.8%
Level of Care:
State Outcome Measures (SOMs)
Absolute percent change of clients abstinent from alcohol at admission vs. discharge:
Average length of stay in days:
Unduplicated number of clients discharged in the time period covered by this review:
Percentage of clients completed treatment plan at this level of care:
Absolute percent change of clients abstinent from other drugs at admission vs. discharge:
Absolute percent change of clients employed (FT/PT) at admission vs. discharge:
Absolute percent change of clients arrested in prior 30 days at admission vs. discharge:
Absolute percent change of clients homeless at admission vs. discharge:
Opioid-Maintenance Outpatient
1.
2.
3.
5.
6.
7.
8.
9.
Based on NJSAMS discharges from 07/01/2013 - 06/30/2014. Admissions are linked to the discharges that occurred during this time period. For outcome measures #1, #2, #3, #4 and #9, higher discharge percentages are best. For outcome measures #5 and #6, lower discharge percentages are best.
Division of Mental Health and Addiction Services
General Population
State
Difference Admission Discharge
State
0.1% 3.5%3.3%Absolute percent change of clients enrolled (FT/PT) in school or job training program at admission vs. discharge:
4.
State
Number of active clients on roster:
Discharges
6,175 13,922
StateState
Admissions
6,716
Information Systems Management
State Performance Report
Page 15

10.0%
-4.8%
-0.4%
-0.4%
474
235
21.3%
Additional informative notes
46.6%
9/26/2014Report Date:
93.2%
33.3%
1.6%
3.2%
48.2%
83.1%
38.2%
2.0%
3.6%
1.6%
Level of Care:
State Outcome Measures (SOMs)
Absolute percent change of clients abstinent from alcohol at admission vs. discharge:
Average length of stay in days:
Unduplicated number of clients discharged in the time period covered by this review:
Percentage of clients completed treatment plan at this level of care:
Absolute percent change of clients abstinent from other drugs at admission vs. discharge:
Absolute percent change of clients employed (FT/PT) at admission vs. discharge:
Absolute percent change of clients arrested in prior 30 days at admission vs. discharge:
Absolute percent change of clients homeless at admission vs. discharge:
Detox-Methadone Outpatient
1.
2.
3.
5.
6.
7.
8.
9.
Based on NJSAMS discharges from 07/01/2013 - 06/30/2014. Admissions are linked to the discharges that occurred during this time period. For outcome measures #1, #2, #3, #4 and #9, higher discharge percentages are best. For outcome measures #5 and #6, lower discharge percentages are best.
Division of Mental Health and Addiction Services
General Population
State
Difference Admission Discharge
State
-0.8% 1.6%2.4%Absolute percent change of clients enrolled (FT/PT) in school or job training program at admission vs. discharge:
4.
State
Number of active clients on roster:
Discharges
249 375
StateState
Admissions
205
Information Systems Management
State Performance Report
Page 16
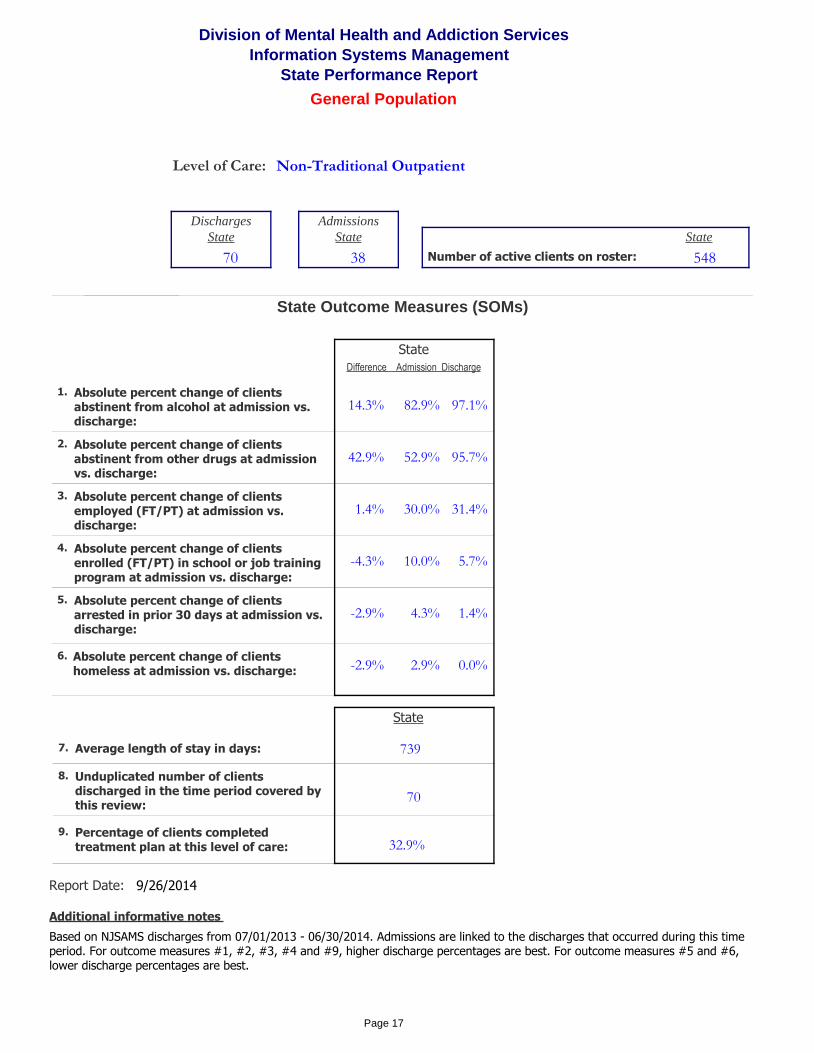
14.3%
1.4%
-2.9%
-2.9%
739
70
32.9%
Additional informative notes
42.9%
9/26/2014Report Date:
97.1%
31.4%
1.4%
0.0%
95.7%
82.9%
30.0%
4.3%
2.9%
52.9%
Level of Care:
State Outcome Measures (SOMs)
Absolute percent change of clients abstinent from alcohol at admission vs. discharge:
Average length of stay in days:
Unduplicated number of clients discharged in the time period covered by this review:
Percentage of clients completed treatment plan at this level of care:
Absolute percent change of clients abstinent from other drugs at admission vs. discharge:
Absolute percent change of clients employed (FT/PT) at admission vs. discharge:
Absolute percent change of clients arrested in prior 30 days at admission vs. discharge:
Absolute percent change of clients homeless at admission vs. discharge:
Non-Traditional Outpatient
1.
2.
3.
5.
6.
7.
8.
9.
Based on NJSAMS discharges from 07/01/2013 - 06/30/2014. Admissions are linked to the discharges that occurred during this time period. For outcome measures #1, #2, #3, #4 and #9, higher discharge percentages are best. For outcome measures #5 and #6, lower discharge percentages are best.
Division of Mental Health and Addiction Services
General Population
State
Difference Admission Discharge
State
-4.3% 5.7%10.0%Absolute percent change of clients enrolled (FT/PT) in school or job training program at admission vs. discharge:
4.
State
Number of active clients on roster:
Discharges
70 548
StateState
Admissions
38
Information Systems Management
State Performance Report
Page 17

5.7%
4.9%
-2.2%
2.0%
408
505
17.9%
Additional informative notes
44.1%
9/26/2014Report Date:
97.2%
22.4%
3.5%
6.7%
55.7%
91.5%
17.5%
5.7%
4.7%
11.6%
Level of Care:
State Outcome Measures (SOMs)
Absolute percent change of clients abstinent from alcohol at admission vs. discharge:
Average length of stay in days:
Unduplicated number of clients discharged in the time period covered by this review:
Percentage of clients completed treatment plan at this level of care:
Absolute percent change of clients abstinent from other drugs at admission vs. discharge:
Absolute percent change of clients employed (FT/PT) at admission vs. discharge:
Absolute percent change of clients arrested in prior 30 days at admission vs. discharge:
Absolute percent change of clients homeless at admission vs. discharge:
Opioid-Maintenance IOP
1.
2.
3.
5.
6.
7.
8.
9.
Based on NJSAMS discharges from 07/01/2013 - 06/30/2014. Admissions are linked to the discharges that occurred during this time period. For outcome measures #1, #2, #3, #4 and #9, higher discharge percentages are best. For outcome measures #5 and #6, lower discharge percentages are best.
Division of Mental Health and Addiction Services
General Population
State
Difference Admission Discharge
State
1.2% 3.5%2.4%Absolute percent change of clients enrolled (FT/PT) in school or job training program at admission vs. discharge:
4.
State
Number of active clients on roster:
Discharges
508 765
StateState
Admissions
451
Information Systems Management
State Performance Report
Page 18
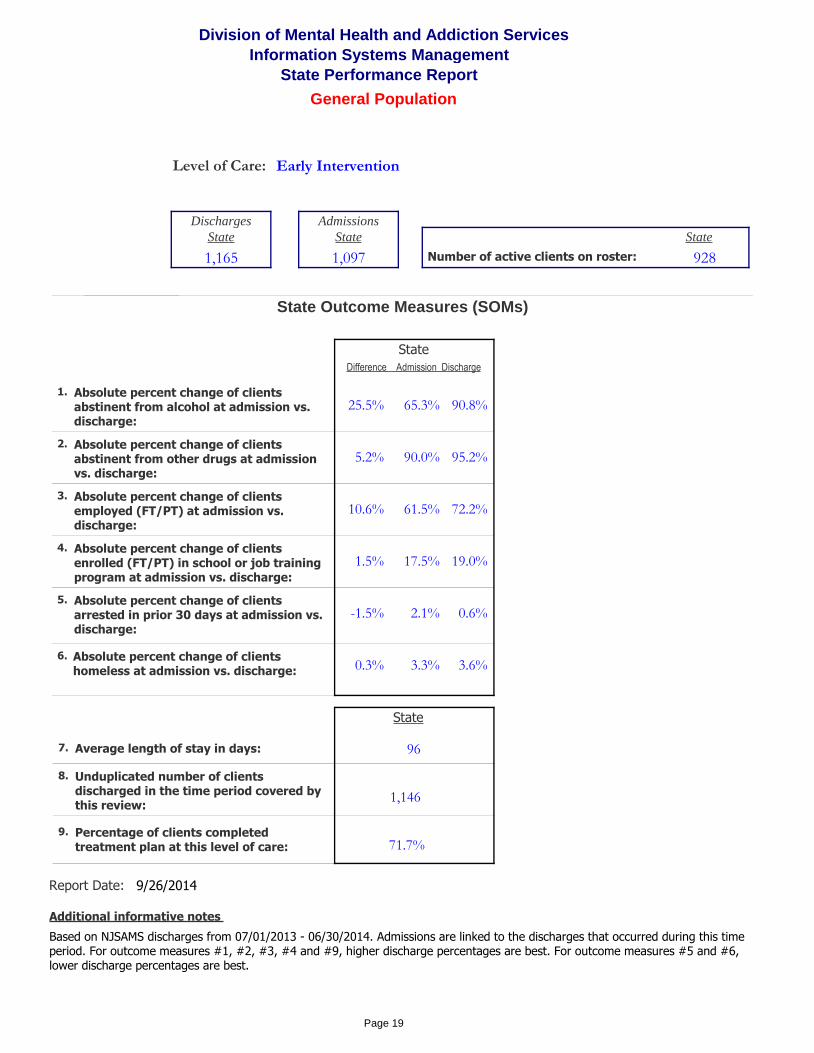
25.5%
10.6%
-1.5%
0.3%
96
1,146
71.7%
Additional informative notes
5.2%
9/26/2014Report Date:
90.8%
72.2%
0.6%
3.6%
95.2%
65.3%
61.5%
2.1%
3.3%
90.0%
Level of Care:
State Outcome Measures (SOMs)
Absolute percent change of clients abstinent from alcohol at admission vs. discharge:
Average length of stay in days:
Unduplicated number of clients discharged in the time period covered by this review:
Percentage of clients completed treatment plan at this level of care:
Absolute percent change of clients abstinent from other drugs at admission vs. discharge:
Absolute percent change of clients employed (FT/PT) at admission vs. discharge:
Absolute percent change of clients arrested in prior 30 days at admission vs. discharge:
Absolute percent change of clients homeless at admission vs. discharge:
Early Intervention
1.
2.
3.
5.
6.
7.
8.
9.
Based on NJSAMS discharges from 07/01/2013 - 06/30/2014. Admissions are linked to the discharges that occurred during this time period. For outcome measures #1, #2, #3, #4 and #9, higher discharge percentages are best. For outcome measures #5 and #6, lower discharge percentages are best.
Division of Mental Health and Addiction Services
General Population
State
Difference Admission Discharge
State
1.5% 19.0%17.5%Absolute percent change of clients enrolled (FT/PT) in school or job training program at admission vs. discharge:
4.
State
Number of active clients on roster:
Discharges
1,165 928
StateState
Admissions
1,097
Information Systems Management
State Performance Report
Page 19


