Embed Size (px)
Citation preview
2020 Western Australia Gas Statement of Opportunities
December 2020

Important notice
PURPOSE
The purpose of this publication is to provide information about the natural gas industry in Western Australia.
AEMO publishes this Western Australia Gas Statement of Opportunities (GSOO) in accordance with rule 103
of the Gas Services Information Rules (GSI Rules). This publication has been prepared by AEMO using data
available at October 2020. Information made available after this date may have been included in this
publication, where practicable.
DISCLAIMER
This document or the information in it may be subsequently updated or amended. This document does not
constitute legal or business advice, and should not be relied on as a substitute for obtaining detailed advice
about the GSI Rules, or any other applicable laws, procedures or policies. AEMO has made every effort to
ensure the quality of the information in this document but cannot guarantee its accuracy or completeness.
Accordingly, to the maximum extent permitted by law, AEMO and its officers, employees and consultants
involved in the preparation of this document:
• make no representation or warranty, express or implied, as to the currency, accuracy, reliability or
completeness of the information in this document; and
• are not liable (whether by reason of negligence or otherwise) for any statements or representations in this
document, or any omissions from it, or for any use or reliance on the information in it.
VERSION CONTROL
Version Release date Changes
1.0 10/12/2020
© 2020 Australian Energy Market Operator Limited. The material in this publication may be used in
accordance with the copyright permissions on AEMO’s website.

© AEMO 2020 | 2020 Western Australia Gas Statement of Opportunities 3
Executive summary
The 2020 Western Australia (WA) Gas Statement of Opportunities (GSOO) presents AEMO’s assessment of
WA’s domestic gas market for the 10-year outlook period from 2021 to 2030. The WA GSOO presents
forecasts of WA’s domestic gas demand and potential gas supply for the low, base and high scenarios1, and
an overview of gas infrastructure and emerging issues affecting the gas industry.
AEMO would like to acknowledge the support of industry and government in providing data and information
for the 2020 WA GSOO.
Key findings
• The WA domestic gas market is expected to be well-supplied until 2026, and finely balanced until
2028. A potential gap is forecast for the final years of the outlook period; however, options are
available to alleviate this.
• Overall, potential gas supply is forecast to decline at an average
annual rate of 2.8% between 2021 and 2030.
– This decline is in line with reserve depletion at existing production
facilities and comes as large liquefied natural gas (LNG) projects,
Browse and Scarborough projects, have been delayed due to
market dynamics, exacerbated by economic conditions resulting
from the COVID-19 pandemic.
– In contrast to the delays in LNG projects, domestic-only projects2,
including backfill for existing production facilities, have progressed
further since the publication of the 2019 WA GSOO.
• Gas demand is forecast to grow at an average annual rate of 0.7%,
largely due to growth in the mining and minerals processing sectors3.
Five committed4 resources projects are expected to add around 40 TJ/day to gas demand from 2023.
– The COVID-19 pandemic has led to an increase in demand for WA’s commodities, particularly gold.
This increase is expected to support domestic gas demand in the short term to 2022. Overall, gas
demand in the mining sector is expected to grow at an average annual rate of 1.6% over the
outlook period.
– On average over the outlook period, gas demand from South West interconnected system (SWIS)
gas-powered generation (GPG) is expected to fall at an average annual rate of 0.4% in the base
scenario, following a decline of 41 terajoules (TJ)/day between 2020 and 2021 due to the entry of
large-scale renewable energy generation capacity in 2020. The commencement of two5 new
1 In this executive summary, all references to forecasts are to the base scenario, unless otherwise specified.
2 These projects are not exposed to the international LNG market and have different development drivers.
3 AEMO has incorporated the impacts of the closure of the BP refinery (https://www.mediastatements.wa.gov.au/Pages/McGowan/2020/10/BP-must-
honour-commitment-to-workers-following-Kwinana-closure.aspx) that is serviced by the Kwinana cogeneration plant in its gas demand forecasts.
4 Committed projects have attained a positive final investment decision or are under construction and are included in all three gas demand scenarios.
5 The Phoenix Kwinana waste-to-energy (36 MW) and East Rockingham waste-to-energy (28 MW) generators are expected to operate as baseload and
therefore displace SWIS GPG.
Potential gas supply is gas
that could be economically
offered to the domestic market
given forecast prices and
production costs, capped by
the availability of processing
capacity and gas reserves. It
does not project how much gas
will be produced, but how
much could be produced if
there was demand at the
forecast price.
© AEMO 2020 | 2020 Western Australia Gas Statement of Opportunities 4
waste-to-energy generators by the end of 2022 and declining electricity consumption forecasts,
partly offset by the retirement of the Muja C power station by 2024, contribute to the forecast
decline in SWIS GPG gas consumption over the outlook period.
• In the high scenario, potential gas supply is forecast to be sufficient to meet gas demand over the
outlook period, except for a small potential gap in 2025 (14 TJ/day) and 2026 (64 TJ/day) with options
such as storage to alleviate this. Prospective demand projects6 could consume up to an additional
145 TJ/day, increasing WA’s gas demand by 11% in 2025 compared to the base scenario.
Potential gas supply and domestic gas demand expected to be finely balanced from 2028
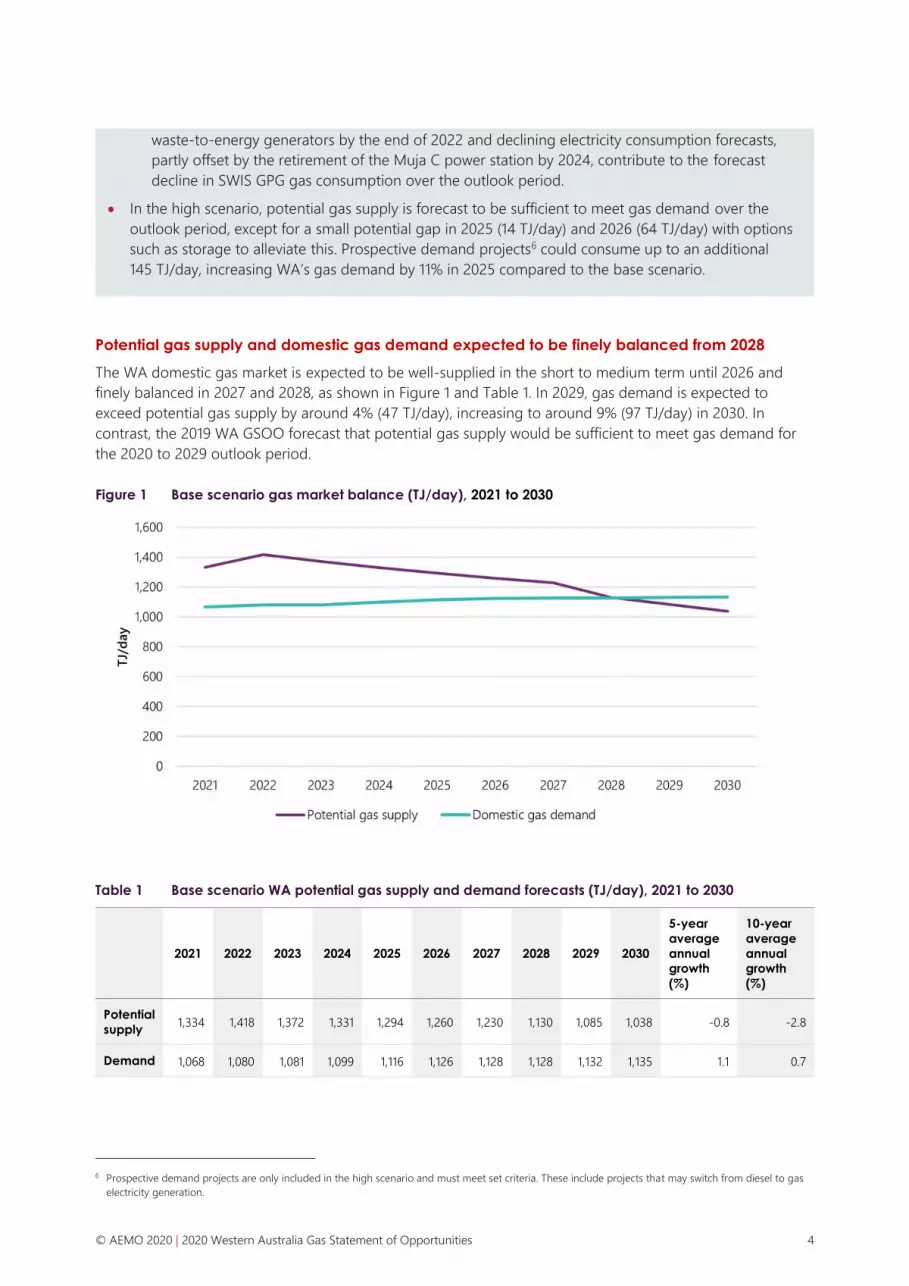
The WA domestic gas market is expected to be well-supplied in the short to medium term until 2026 and
finely balanced in 2027 and 2028, as shown in Figure 1 and Table 1. In 2029, gas demand is expected to
exceed potential gas supply by around 4% (47 TJ/day), increasing to around 9% (97 TJ/day) in 2030. In
contrast, the 2019 WA GSOO forecast that potential gas supply would be sufficient to meet gas demand for
the 2020 to 2029 outlook period.
Figure 1 Base scenario gas market balance (TJ/day), 2021 to 2030
Table 1 Base scenario WA potential gas supply and demand forecasts (TJ/day), 2021 to 2030
2021 2022 2023 2024 2025 2026 2027 2028 2029 2030
5-year
average
annual
growth
(%)
10-year
average
annual
growth
(%)
Potential
supply 1,334 1,418 1,372 1,331 1,294 1,260 1,230 1,130 1,085 1,038 -0.8 -2.8
Demand 1,068 1,080 1,081 1,099 1,116 1,126 1,128 1,128 1,132 1,135 1.1 0.7
6 Prospective demand projects are only included in the high scenario and must meet set criteria. These include projects that may switch from diesel to gas
electricity generation.
© AEMO 2020 | 2020 Western Australia Gas Statement of Opportunities 5
Domestic gas demand is forecast to exceed potential gas supply only from 2029. However, there are options
that could reduce or eliminate any potential gaps in these outer years of the outlook period, including:
• Excess reserves from 2021 to 2026 at existing production facilities could become available to meet
demand after 2028.
• Gas could be withdrawn from storage at a rate of up to 210 TJ/day, eliminating short-term supply gaps7.
• Undeveloped gas fields that may be connected to existing gas production facilities could be developed
over the outlook period and may meet the projected demand.
• Additional supply projects that are not currently included in the potential gas supply forecasts may enter
the market.
Large LNG projects delayed while domestic-only supply sources and backfill gain momentum
In 2020, WA’s domestic gas supply capacity increased by 8.5 TJ/day with the commencement of an expansion
at the Xyris production facility to 20 TJ/day8. From 2021, Gorgon’s second tranche of supply (118 TJ/day) is
expected to become available to the market.
Since the 2019 WA GSOO publication:
• Large LNG projects have been delayed due to weak oil and LNG prices, combined with LNG oversupply,
which has been exacerbated by restrictions introduced because of the COVID-19 pandemic that have
reduced LNG demand9.
• Other projects have either changed development path or increased in volume.
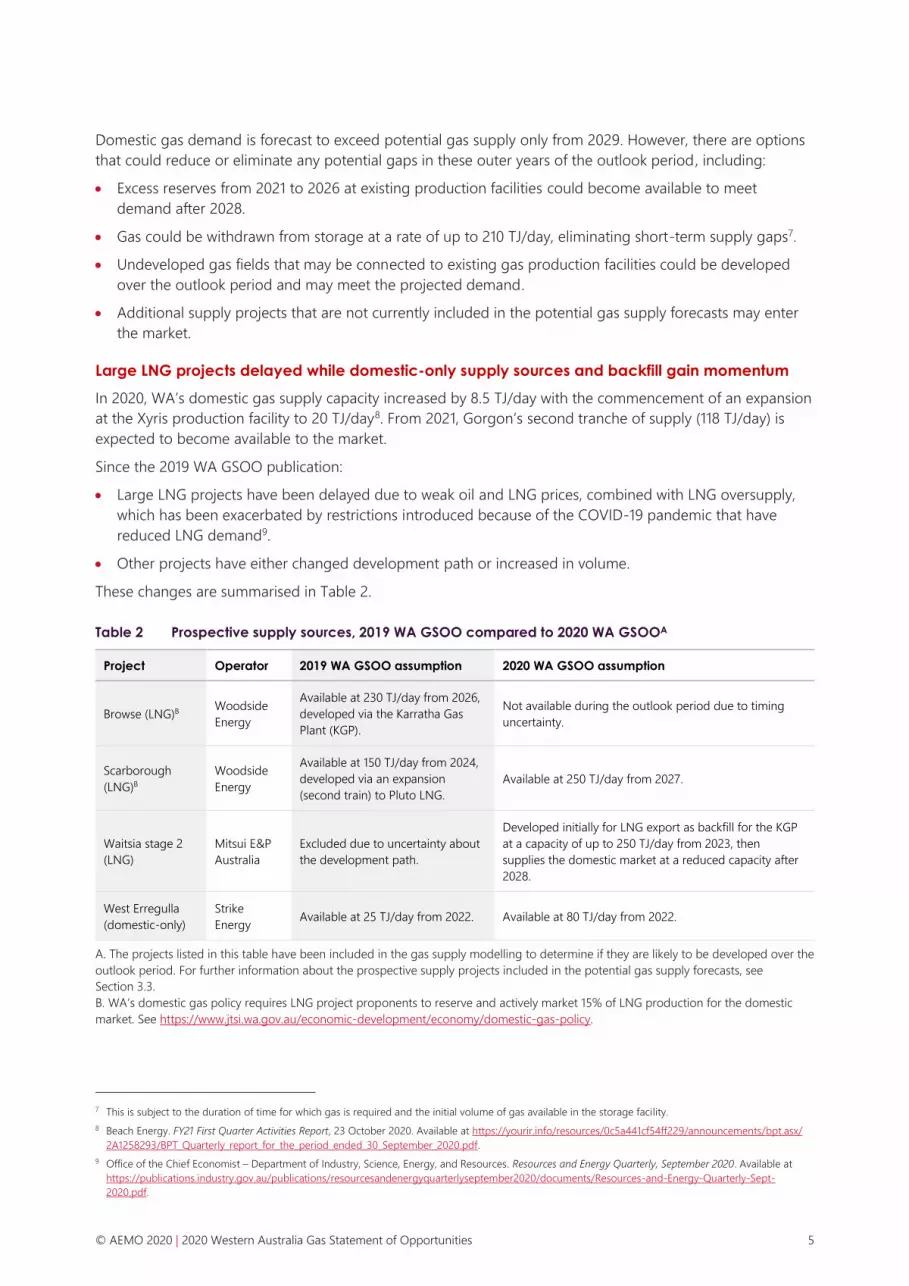
These changes are summarised in Table 2.
Table 2 Prospective supply sources, 2019 WA GSOO compared to 2020 WA GSOOA
Project Operator 2019 WA GSOO assumption 2020 WA GSOO assumption
Browse (LNG)B Woodside
Energy
Available at 230 TJ/day from 2026,
developed via the Karratha Gas
Plant (KGP).
Not available during the outlook period due to timing
uncertainty.
Scarborough
(LNG)B
Woodside
Energy
Available at 150 TJ/day from 2024,
developed via an expansion
(second train) to Pluto LNG.
Available at 250 TJ/day from 2027.
Waitsia stage 2
(LNG)
Mitsui E&P
Australia
Excluded due to uncertainty about
the development path.
Developed initially for LNG export as backfill for the KGP
at a capacity of up to 250 TJ/day from 2023, then
supplies the domestic market at a reduced capacity after
2028.
West Erregulla
(domestic-only)
Strike
Energy Available at 25 TJ/day from 2022. Available at 80 TJ/day from 2022.
A. The projects listed in this table have been included in the gas supply modelling to determine if they are likely to be developed over the
outlook period. For further information about the prospective supply projects included in the potential gas supply forecasts, see
Section 3.3.
B. WA’s domestic gas policy requires LNG project proponents to reserve and actively market 15% of LNG production for the domestic
market. See https://www.jtsi.wa.gov.au/economic-development/economy/domestic-gas-policy.
7 This is subject to the duration of time for which gas is required and the initial volume of gas available in the storage facility.
8 Beach Energy. FY21 First Quarter Activities Report, 23 October 2020. Available at https://yourir.info/resources/0c5a441cf54ff229/announcements/bpt.asx/
2A1258293/BPT_Quarterly_report_for_the_period_ended_30_September_2020.pdf.
9 Office of the Chief Economist – Department of Industry, Science, Energy, and Resources. Resources and Energy Quarterly, September 2020. Available at
https://publications.industry.gov.au/publications/resourcesandenergyquarterlyseptember2020/documents/Resources-and-Energy-Quarterly-Sept-
2020.pdf.

© AEMO 2020 | 2020 Western Australia Gas Statement of Opportunities 6
In addition to the prospective projects in Table 2, two gas fields are currently being progressed as backfill 10
for existing gas production facilities:
1. Beharra Springs Deep – Beach Energy expects to connect this field to the existing Beharra Springs
production facility in the first quarter of 202111.
2. Spartan – Santos intends to connect this field to the Varanus Island production facility and is targeting a
final investment decision for 202112.
While these projects are not expected to increase domestic gas production capacity, they will maintain
potential gas supply from existing production facilities (Beharra Springs and Varanus Island). Assuming they
proceed, the connection of these reserves will result in a slower decline rate of potential supply from existing
gas production facilities over the outlook period, compared to the forecast in the 2019 WA GSOO.
The potential gas supply forecasts are shown in Table 3. In summary:
• Volumes are identical in the base and high scenarios13 between 2021 and 2023, reflecting the same
production facilities being available during this period.
• The low scenario excludes prospective projects and backfill and therefore shows a situation where only
existing and committed production facilities are available throughout the outlook period.
• The high scenario includes an additional backfill source and two additional prospective projects compared
to the base scenario.
Table 3 Potential gas supply forecasts (TJ/day), 2021 to 2030
2021 2022 2023 2024 2025 2026 2027 2028 2029 2030
5-year average
annual growth
(%)
10-year average
annual growth
(%)
Low 1,216 1,169 1,128 1,091 1,058 1,029 1,002 795 777 762 -3.4 -5.1
Base 1,334 1,418 1,372 1,331 1,294 1,260 1,230 1,130 1,085 1,038 -0.8 -2.8
High 1,334 1,418 1,372 1,353 1,316 1,282 1,502 1,613 1,561 1,515 -0.3% 1.4%
AEMO notes that there is a large volume of undeveloped gas that could supply the WA domestic market
during the outlook period, but this volume is currently too speculative to include in the potential supply
forecasts. These sources include Clio-Acme and Equus14. AEMO will continue to monitor these projects for
potential inclusion in future WA GSOOs.
Gas consumption to be supported by strong demand for WA’s commodities
Over the outlook period, gas demand is forecast to increase at an average annual rate of 0.7%, from
1,068 TJ/day in 2021 to 1,135 TJ/day in 2030.
Growth in the first five years of the outlook period is stronger (1.1%) than in the second half of the outlook
period (0.2%), largely as a result of new projects commencing operation.
10 Connecting additional gas fields or reserves to an existing domestic gas production facility, instead of building new processing infrastructure (sometimes
referred to as a tie-back).
11 Beach Energy. FY21 First Quarter Activities Report, 23 October 2020. Available at https://yourir.info/resources/0c5a441cf54ff229/announcements/bpt.asx/
2A1258293/BPT_Quarterly_report_for_the_period_ended_30_September_2020.pdf.
12 Santos. Third Quarter Activities Report for period ending 30 September 2020, 22 October 2020. Available at https://www.santos.com/wp-content/uploads/
2020/10/2020_Third_Quarter_Activities_Report-FINAL.pdf.
13 Assumptions about domestic gas and Asian LNG prices vary between scenarios.
14 Corvus was included in this list in the 2019 WA GSOO, but has been added to the high scenario as backfill for Devil Creek in this report.

© AEMO 2020 | 2020 Western Australia Gas Statement of Opportunities 7
Forecast growth in domestic demand, as shown in Table 4, is underpinned by the following:
• Five15 committed resources projects are expected to add around 40 TJ/day to gas demand from 2023.
• Gas demand in the mining sector is forecast to increase at an average annual rate of 1.6% over the
outlook period, supported by trends in specific commodities, including:
– The COVID-19 pandemic has increased demand for WA’s commodities, particularly gold. As a result,
gas demand in the gold mining sector is forecast to increase by 7.6% between 2020 and 2022. Over
the outlook period, however, gas demand for gold mining is forecast to decline at an average annual
rate of 1.6%, as gold production declines due to an expected reduction in international gold prices
from 2023.
– Gas demand for iron ore mining is forecast to increase at an average annual rate of 1.2% over the next
five years to 2025. Global iron ore supply, particularly from Brazil, has dropped due to mine closures as
a result of the COVID-19 pandemic and other technical issues. Demand for WA iron ore is strong, since
mines have continued to operate and make product available for export.
• On average over the outlook period, gas demand from SWIS GPG16 is expected to fall at an average
annual rate of 0.4% in the base scenario, from 91 TJ/day in 2021 to 87 TJ/day in 2030. This follows a
decline of 41 TJ/day between 2020 and 2021 due to the entry of large-scale renewable energy generation
capacity in 2020. The commencement of two new waste-to-energy generators by the end of 2022 and
declining electricity consumption forecasts, partly offset by the retirement of the Muja C power station by
2024, contribute to the decline in SWIS GPG gas consumption over the outlook period.
• In the high scenario, five prospective demand projects could add up to 145 TJ/day from 2025.
Table 4 Domestic gas demand forecasts (TJ/day), 2021 to 2030
2021 2022 2023 2024 2025 2026 2027 2028 2029 2030
5-year
average
annual
growth
(%)
10-year
average
annual
growth
(%)
Low 1,035 1,048 1,046 1,051 1,061 1,065 1,061 1,054 1,053 1,048 0.6 0.1
Base 1,068 1,080 1,081 1,099 1,116 1,126 1,128 1,128 1,132 1,135 1.1 0.7
High 1,127 1,154 1,159 1,243 1,330 1,346 1,354 1,358 1,367 1,374 4.2 2.2
15 Fortescue Metals Group’s Iron Bridge iron ore project, Rio Tinto’s Gudai-Darri iron ore project, Capricorn Metals’ Karlawinda gold project, Kalium Lakes’
Beyondie sulphate of potash project, and Albemarle Corporation’s Kemerton lithium refinery. For changes in the committed projects list since the 2019 WA
GSOO, see Section 2.2.2.
16 Some GPG that participates in the Wholesale Electricity Market (for example, Alinta’s Pinjarra cogeneration) is classified as minerals processing, mining, or
industrial and is excluded from SWIS GPG gas demand in the WA GSOO. For a full description of how AEMO classifies facilities, see Appendix A5.
© AEMO 2020 | 2020 Western Australia Gas Statement of Opportunities 8
Contents Executive summary 3
1. Year in review 12
1.1 Supply 12
1.2 Infrastructure 13
1.3 Demand 13
1.4 Regulatory 15
2. Gas demand 16
2.1 Historical WA domestic gas demand 16
2.2 Domestic gas demand forecasts 20
2.3 Gas demand forecasts compared to 2019 WA GSOO 25
2.4 Historical peak WA domestic gas demand days 26
2.5 Reconciliation of WA GSOO domestic gas demand forecasts vs actuals 29
2.6 Total gas demand forecasts 29
3. Gas supply 32
3.1 Profile of upstream and gas production 32
3.2 Potential gas supply model assumptions 36
3.3 Prospective supply sources assessment 37
3.4 Potential gas supply forecasts 41
3.5 Comparison of 2019 and 2020 WA GSOO potential gas supply forecasts 42
4. Supply-demand balance 44
4.1 Summary of gas demand and potential gas supply forecasts 44
4.2 Supply-demand balance 45
5. 2020 formal information request data analysis 48
5.1 Gas demand and supply data 49
5.2 Reserves 54
5.3 Gas prices that would influence consumption 55
6. Implications of government and industry initiatives 56
6.1 Government initiatives and regulation 56
6.2 Industry initiatives 57
6.3 Hydrogen 57
A1. References for year in review 59

© AEMO 2020 | 2020 Western Australia Gas Statement of Opportunities 9
A2. Historical domestic gas prices and forward reference prices 64
A2.1 Historical domestic gas prices 64
A2.2 Production costs for the WA domestic gas market 65
A3. Input assumptions and methodologies 67
A3.1 Commodity forecasts 67
A3.2 Gas demand forecast methodology 68
A3.3 Potential gas supply forecast methodology 74
A4. Total gas demand forecasts 76
A5. Sector classifications 78
A6. WA gas infrastructure 79
A6.1 Gas transmission pipelines 79
A6.2 Multi-user gas storage facilities 80
A6.3 Spot and short-term trading 80
A6.4 LNG export production facilities 81
A7. Conversion tables 82
Abbreviations and units of measure 83
Glossary 86
Tables Table 1 Base scenario WA potential gas supply and demand forecasts (TJ/day), 2021 to 2030 4
Table 2 Prospective supply sources, 2019 WA GSOO compared to 2020 WA GSOO 5
Table 3 Potential gas supply forecasts (TJ/day), 2021 to 2030 6
Table 4 Domestic gas demand forecasts (TJ/day), 2021 to 2030 7
Table 5 Residential and non-residential retail customer numbers, 2014-15 to 2019-20 19
Table 6 Domestic gas demand forecasts (TJ/day), 2021 to 2030 22
Table 7 Forecast annual gas demand by sector (TJ/day), base scenario, 2021 to 2030 23
Table 8 Forecast annual gas demand by area (TJ/day), base scenario, 2021 to 2030 24
Table 9 Forecast annual gas demand by region (TJ/day), base scenario, 2021 to 2030 25
Table 10 2019 and 2020 base scenario domestic gas demand forecasts (TJ/day), 2021 to 2029 26
Table 11 20 largest gas usage days per year (total WA), distributed by season, 2013 to 2020 27
Table 12 The 20 largest gas usage days in each GSI Zone, 2017 to 2019, distributed by season 28
Table 13 Reconciliation of previous WA GSOO domestic gas demand forecasts with current
forecasts (% deviance of forecast from actual), 2016 to 2020 29
Table 14 Total gas demand forecasts (PJ/annum), 2021 to 2030 30

© AEMO 2020 | 2020 Western Australia Gas Statement of Opportunities 10
Table 15 WA conventional and unconventional gas resources and reserves (PJ), as at
September 2020 33
Table 16 Domestic gas production facility average production and capacity utilisation, 2019-20 34
Table 17 Criteria for assessing prospective supply sources 38
Table 18 Prospective supply sources, 2019 WA GSOO compared to 2020 WA GSOO 39
Table 19 Potential gas supply forecasts (TJ/day), 2021 to 2030 42
Table 20 Potential gas supply and demand forecasts, base scenario (TJ/day), 2021 to 2030 46
Table 21 Potential gas supply and demand forecasts, low scenario (TJ/day), 2021 to 2030 47
Table 22 Potential gas supply and demand forecasts, high scenario (TJ/day), 2021 to 2030 47
Table 23 2019 and 2020 FIR response rate overview 49
Table 24 Total 2P gas reserves from 2017 through 2020 FIRs (PJ) 54
Table 25 Scenario mapping for GPG modelling 71
Table 26 Total gas demand forecast scenarios 74
Table 27 Potential gas supply model operation 75
Table 28 Domestic gas demand forecasts (PJ/annum), 2021 to 2030 76
Table 29 LNG feedstock forecasts (PJ/annum), 2021 to 2030 76
Table 30 LNG processing forecasts (8% of feedstock) (PJ/annum), 2021 to 2030 77
Table 31 Total gas demand forecasts (PJ/annum), 2021 to 2030 77
Table 32 Classification of gas consumers into sectors (GBB delivery points) 78
Table 33 WA multi-user gas storage facilities, 2020 80
Table 34 Conversion factors 82
Figures Figure 1 Base scenario gas market balance (TJ/day), 2021 to 2030 4
Figure 2 Gas consumption by state (PJ/annum), 2010-11 to 2018-19 17
Figure 3 Major category gas consumption by state (% share of total) (PJ/annum), 2018-19 18
Figure 4 Domestic gas demand forecasts (TJ/day), 2021 to 2030 21
Figure 5 Domestic gas demand forecasts by sector (TJ/day), base scenario, 2021 to 2030 23
Figure 6 Domestic gas demand forecasts by region (TJ/day), base scenario, 2021 to 2030 25
Figure 7 Highest gas demand days (TJ/day) by region, 2013 to 2020 27
Figure 8 Differences between highest and twentieth highest demand days in each GSI Zone 28
Figure 9 Total gas demand forecasts (PJ/annum), base scenario, 2021 to 2030 31
Figure 10 Exploration and development wells drilled, 1990 to 2020 (year to date) 33
Figure 11 Gas production by facility, October 2019 to October 2020 35

© AEMO 2020 | 2020 Western Australia Gas Statement of Opportunities 11
Figure 12 Gas production market share by company, October 2019 to October 2020 36
Figure 13 Potential gas supply and production capacity forecasts (TJ/day), 2021 to 2030 42
Figure 14 2019 and 2020 base scenario potential gas supply forecasts (TJ/day), 2021 to 2030 43
Figure 15 Domestic gas market balance, base scenario, 2021 to 2030 45
Figure 16 Potential gas supply compared to gas demand, high scenario, 2021 to 2030 47
Figure 17 Consumer expected gas demand compared to contracted levels (MCQ), 2021 to
2030 49
Figure 18 Consumer contract duration 50
Figure 19 Consumer expected gas demand compared to supplier contracted levels (MCQ) and
GBB total nameplate capacity, 2021 to 2030 51
Figure 20 Comparison of contracted levels (MCQ) as submitted by consumers and suppliers,
2021 to 2030 51
Figure 21 Comparison of consumer expected demand, 2018 to 2020 FIRs 52
Figure 22 Change in expected demand relative to 2020 53
Figure 23 Comparison of supplier contracted levels (MCQ), 2018 to 2020 FIRs 53
Figure 24 Comparison of prospective demand, 2019 and 2020 FIR 54
Figure 25 Gas price estimates that could result in changes in gas consumption (A$/GJ) 55
Figure 26 Historical domestic gas contract prices (A$/GJ, nominal) and ABS PPI – WA (gas
extraction, index), Q1 2013 to Q2 2020 64
Figure 27 WA spot gas prices from gasTrading (A$/GJ, nominal), January 2015 to September
2020 65
Figure 28 Gas demand forecasting for the non-SWIS GPG sector 72
Figure 29 Total gas demand forecasts 73
Figure 30 Gas transmission pipelines in WA 79
Figure 31 Cumulative stored gas, 2013 to 2020 80
© AEMO 2020 | 2020 Western Australia Gas Statement of Opportunities 12
1. Year in review
This chapter provides a snapshot of events in the Western Australia (WA) gas market since
the 2019 WA Gas Statement of Opportunities (GSOO) publication. References for this
chapter are provided in Appendix A1.
1.1 Supply
• The Beharra Springs Deep well is expected to be connected to the Beharra Springs production facility in
the March 2021 quarter.
• Bennett Resources, a subsidiary of Black Mountain Energy, submitted plans to WA’s Environmental
Protection Authority (EPA) to undertake unconventional exploration drilling and hydraulic fracturing in
the Kimberley’s Canning Basin, with the potential undiscovered resource estimated at 25 trillion cubic
feet (tcf).
• BP began drilling the Ironbark exploration well, which, if successful, may be a candidate for future tie-back
to the North West Shelf (NWS) infrastructure.
• Chevron implemented the following gas sales agreements (GSAs):
– Alcoa for an additional 37 petajoules (PJ) of natural gas (totalling 198 PJ including existing GSAs),
commencing in 2024.
– BHP Nickel West for 22 PJ of natural gas over a 3.5-year period, which commenced in July 2020.
– Newcrest Operations for 16 PJ of equity domestic gas, which commenced in late 2019, for a 3.5-year
period.
• Kalium Lakes secured a GSA with Shell to supply 1 terajoule (TJ)/day for its Beyondie sulphate of potash
(SOP) project. The Beyondie SOP project is expected to commence production in the third quarter of 2021.
• Mitsui E&P Australia (Mitsui) and Beach Energy’s Waitsia gas project advanced further:
– The WA EPA recommended the second stage of the Waitsia gas project (up to 250 TJ/day) for
environmental approval to the Minister. A final investment decision (FID) is expected by the end of
2020.
– The WA Government exempted the second stage of the Waitsia gas project from the updated
Domestic Gas Policy, allowing the project to export gas through the Karratha Gas Plant (KGP).
– Xyris expanded from 11.5 TJ/day to 20 TJ/day in August 2020.
• Santos undertook the following activities:
– Began supplying Alcoa with 120 TJ/day from mid-2020, and Gold Fields with 5.5 PJ of natural gas over
three years from 1 July 2020.
– Executed a GSA with Kleenheat to supply more than 16 PJ of domestic gas over a three-year period
from 2021.
– Commenced front-end engineering design works to connect the Spartan gas field to the Varanus
Island production facility, with FID targeted for 2021.
© AEMO 2020 | 2020 Western Australia Gas Statement of Opportunities 13
• Shell discovered gas in the Bratwurst-1 exploration well, which is a potential tie-back to the Prelude
floating liquefied natural gas (LNG) facility.
• Warrego Energy and Strike Energy signed a binding Heads of Agreement to jointly develop the West
Erregulla gas field, with the capacity revised to 80 TJ/day. Warrego Energy executed a GSA with Alcoa to
supply 255 PJ of natural gas over 10 years, starting in early 2024. FID is expected by the end of the first
quarter of 2021 and first gas by mid-2022.
• Woodside Energy (Woodside) undertook the following activities:
– Made a FID on Greater Western Flank Phase 3 (including Lambert Deep).
– Announced delays to FID for Scarborough and Pluto train two until the second half of 2021, and for
Browse to at least 2023.
– Accepted petroleum production licences for Scarborough from the Commonwealth and Western
Australian Joint Authority.
– Executed a long-term sale and purchase agreement with Uniper Global Commodities to supply LNG
for a term of 13 years commencing from 2021, subject to a positive FID on Scarborough.
1.2 Infrastructure
• APA Group announced it would construct the new 580 km Northern Goldfields Interconnect pipeline to
connect gas fields in the Perth basin (for example, West Erregulla) to Goldfields gas consumers. The
pipeline is expected to be operational by mid-2022.
• Fortescue Metals Group (FMG) proposed the Pilbara Transmission Project, which consists of 275 km of
220 kilovolt (kV) transmission lines connecting FMG’s mine sites, which may allow increased gas
consumption at its mine sites.
• The WA Government called for global expressions of interest for a 1.5 gigawatts (GW) renewable energy
hydrogen hub at the Oakajee Strategic Industrial Area to enable domestic hydrogen production and
possible export.
1.3 Demand
• ATCO Australia is undertaking a study to harvest natural gas from the North Bannister Waste Facility,
south of Perth, and transport it by road to Albany. If successful, this would make Albany the first Australian
city to be completely supplied by renewable natural gas.
• Clean Energy Fuels Australia (CEFA) secured a long-term site lease for a plant near the town of Mount
Magnet, which will form part of the Mid-West LNG Hub. Mount Magnet was chosen due to its good
transport links, its proximity to remote power customers, and existing gas pipeline infrastructure. The hub
will include the first LNG liquefaction train, LNG transport tankers, customer storage, and regasification
facilities, and is expected to reach a maximum demand of around 4.1 TJ/day of gas. CEFA estimates that
over 25 years of operation, the first LNG train at the Mid-West LNG Hub could displace around three
billion litres of imported diesel with domestically-sourced natural gas and reduce customers’ carbon
dioxide emissions by over two million tonnes.
• FMG announced investment into the Pilbara Generation project as part of the Pilbara Energy Connect
program. The project will include 150 megawatts (MW) of gas-powered generation (GPG) and 150 MW of
solar generation, supplemented by large-scale battery storage with the construction and operation of the
gas-fired station approved by the WA EPA. The project also includes the conversion of Solomon Power
Station from diesel to gas generation.
• Hazer Group made a FID on the Hazer Commercial Demonstration Plant, which will convert biogas from
sewage treatment into hydrogen and graphite, with operations to commence mid-2021.
© AEMO 2020 | 2020 Western Australia Gas Statement of Opportunities 14
• Metals X suspended operation of its Nifty Copper Mine in November 2019 and announced a sale process
for the mine in September 2020.
• Perdaman signed a binding Heads of Agreement with a Clough and Saipem joint venture for the
engineering, procurement, and construction work for its urea project in Karratha. The WA Government
announced support for the project, conditional on reaching FID, obtaining all statutory approvals, and
securing an offtake agreement.
• Following the increase in global demand for gold, several gold mining projects are making progress:
– AngloGold Ashanti’s Boston Shaker underground mine at Tropicana achieved commercial production,
reaching an annualised production rate of 0.7 million tonnes per annum (mtpa), with additional power
requirements met by increasing the GPG capacity to 50 MW.
– Blackham Resources’ Wiluna mine is expected to almost double production by late 2021.
– Calidus Resources secured debt financing for development of the Warrawoona gold project, with plant
construction planned for first quarter of 2021.
– Capricorn Minerals made a FID on the Karlawinda project in late 2019, with first gold production
expected in June 2021.
– The Gruyere Gold Mine (joint venture of Gold Road Resources Limited and Gold Fields Limited)
officially opened in December 2019, including 45 MW of GPG.
• Short-term demand for lithium remains weak as the lithium price continued to fall in 2020, resulting in the
following activities:
– Covalent Lithium delayed FID on the Mt Holland lithium project by a year to the first quarter of 2021.
– Galaxy Resources’ Mount Cattlin lithium mine and Pilbara Minerals’ Pilgangoora lithium-tantalum
projects both reduced production by about 50%.
– Altura Mining went into voluntary administration in October 2020, following a reduction in production
to around 80% capacity.
– Mineral Resources Australia’s Wodgina lithium mine was placed under care and maintenance, while
Alita Resources’ Bald Hill lithium mine first suspended operations and subsequently entered voluntary
administration.
– The WA Government announced that it will provide a 50% royalty rebate on spodumene concentrate
for up to a year to Galaxy Resources’ Mount Cattlin and Pilbara Minerals’ Pilgangoora projects.
• Developments in hydrogen gas projects are expected to impact gas demand:
– BP are carrying out the Geraldton Export-Scale Renewable Investment Feasibility Study to explore the
potential for developing a green hydrogen and ammonia production supply chain.
– Horizon Power’s Denham hydrogen demonstration project, which consists of a 500 kilowatt (kW) solar
farm to generate electricity to power an electrolyser for the hydrogen production, is expected to be
commissioned in December 2021.
– Infinite Blue Energy’s Arrowsmith Hydrogen Project secured an agreement to partner with Western
Power to undertake initial planning work for an additional 330 kV transmission network link to its
proposed green hydrogen facility. The hydrogen project is expected to reach FID in 2021 and
commence production in 2022.
– The WA EPA has approved the first stage of NW Interconnected Power Pty Ltd’s Asian Renewable
Energy Hub. This project proposes building up to 15,000 MW of new wind and solar power in the
Pilbara region, with the bulk of the energy to be used for large-scale hydrogen production for
domestic and export markets. The first stage of the project received WA Government environmental
approval in October 2020.

© AEMO 2020 | 2020 Western Australia Gas Statement of Opportunities 15
– The WA Government is funding seven renewable hydrogen feasibility studies as part of the Renewable
Hydrogen Strategy. The studies include examining solar hydrogen for waste collection and light vehicle
fleets in Cockburn, a hydrogen refuelling hub in Mandurah, and the potential for an electrolysis
hydrogen production plant in the Great Southern or Wheatbelt regions.
– Woodside and APA Group’s Badgingarra Renewable Hydrogen Project is expected to use 100%
renewable power to produce hydrogen for use in power generation, transport and industrial
applications.
– The Yara Pilbara Renewable Ammonia Feasibility Study is expected to produce renewable hydrogen to
supply its ammonia production process (currently operated using natural gas) at the Burrup Peninsula
facility. The project is expected to produce 30,000 tonnes of hydrogen per year.
• Gas demand is expected to reduce as renewable energy projects come online as follows:
– BHP executed a 15-year contract extension to its power purchase agreement (PPA) with Southern Cross
Energy for electricity supply to its Nickel West operation, extending the current arrangement to 2038.
The PPA includes an investigation into an 18.5 MW solar photovoltaic (PV) farm at Nickel West’s
Leinster and Mount Keith operations, supported by a battery energy storage system, and a 17 MW
waste heat steam turbine system at the Kalgoorlie smelter.
– Gold Fields Group’s (Gold Fields) 56 MW Agnew Hybrid Renewable Project (stage 1 and 2) – which
consists of an 18 MW wind farm, 4 MW solar farm, 13 MW of battery storage, and a 21 MW gas/diesel
power plant – commenced operation.
– Horizon Power commissioned the Onslow microgrid project, which consists of a solar farm and battery
storage integrated with GPG.
– Horizon Power’s Esperance Power Project – which will deliver a hybrid generation solution including a
4 MW solar farm, 5.5 MW of battery storage, two wind turbines with a combined capacity of 9 MW,
and 22 MW of GPG – commenced construction in September 2020 and is expected to be complete in
November 2021.
– Rio Tinto approved investment in a new 34 MW solar plant with 12 megawatt hours (MWh) of battery
storage at the Gudai-Darri17 mine. Construction is expected to commence at the end of 2020 and due
to be completed in 2021.
– Strandline Resource executed a non-binding proposal with Woodside and Energy Developments
Limited (EDL) to develop a 27 MW hybrid gas and renewable power solution over 15 years to power
the Coburn mineral sands project.
1.4 Regulatory
• DBNGP (WA) Transmission Pty Ltd (DBP) submitted proposed revisions to the access arrangement for the
Dampier to Bunbury Natural Gas Pipeline (DBNGP) for the period 2021 to 2025 to the Economic
Regulation Authority (ERA). The ERA requested a number of changes to the access agreement and the
revised version is under consideration at the time of publication.
• The WA Government clarified the WA Domestic Gas Policy to state that it would not agree to exports of
gas through the WA pipeline network, and that supply of gas to the east coast would be treated as an
export for the purposes of the policy.
17 Spelling change from Koodaideri at the request of the Banjima Native Title Aboriginal Corporation. For further information, see https://cdn-
api.markitdigital.com/apiman-gateway/ASX/asx-research/1.0/file/2924-02294524-3A552729?access_token=83ff96335c2d45a094df02a206a39ff4.

© AEMO 2020 | 2020 Western Australia Gas Statement of Opportunities 16
2. Gas demand
In the base scenario, the Australian Energy Market Operator (AEMO) forecasts domestic
gas demand to grow at an average annual rate of 0.7%, underpinned by growth in the
mining and minerals processing sectors. This includes five committed projects that are
expected to add approximately 40 TJ/day to domestic demand by 2023. The COVID-19
pandemic has increased demand for WA’s commodities, particularly gold, in the short term
to 2022. Over the long term, gas demand for iron ore mining is forecast to continue to
grow, driven by sustained strong global demand for iron ore.
All data in this chapter is presented in calendar years unless otherwise stated.
2.1 Historical WA domestic gas demand
2.1.1 Overview, historical characteristics, and comparisons
WA’s unique combination of geographic isolation and very large gas resources provides a backdrop for
remotely located LNG developments.
WA Government policy promoted the development of gas fields in the NWS area during the 1980s. The State
Energy Commission of WA signed a large gas supply contract with the NWS partners and constructed the
DBNGP.
The WA domestic gas market is characterised by:
• Large gas reserves that are generally located offshore and developed mainly to supply the global LNG
market.
• A limited number of large suppliers/producers and consumers.
• Bilateral, confidential, long-term take-or-pay gas sales contracts.
• Residential, commercial, and small industrial consumers comprising a small proportion of total demand.
• Small volumes of short-term and spot gas sales18.
• A small number of pipelines, interconnectors, and limited surplus pipeline capacity.
• Information about supply that is available to be contracted, potential buyers, and gas contract pricing is
not readily available.
• 78 PJ of storage capacity.
The east coast market, which includes New South Wales, Queensland, South Australia, Victoria, and Tasmania,
is characterised by:
• Active short-term gas hubs which provide greater price discovery and trading flexibility.
• Smaller gas reserves which are predominantly located onshore.
18 Short-term and spot gas sales are expected to increase as more consumers seek shorter-term contracts.

© AEMO 2020 | 2020 Western Australia Gas Statement of Opportunities 17
• Over 200 PJ of gas storage capacity19.
Despite its relatively small population, WA has the highest natural gas consumption of all Australian states.
WA consumed 669 PJ of gas in 2018-19, approximately 42% of Australia’s total gas consumption (as shown in
Figure 2).
Figure 2 Gas consumption by state (PJ/annum), 2010-11 to 2018-19
Source: Department of Industry, Science, Energy, and Resources.
Note: Data is presented in financial years. The figures for New South Wales include the Australian Capital Territory.
Notably, WA has a relatively low proportion of residential and commercial gas consumption (2%) compared
to South Australia (14%), New South Wales (30%), and Victoria (53%).
WA’s consumption of gas in 2018-1920 was from:
• GPG – 43.2%21.
• Mining – 31.1%.
• Industrial and minerals processing sector – 22.2%.
• Residential and commercial – 2.4%.
• Other – 1.1%.
Figure 3 presents a comparison of gas consumption by category across Australian states22 and the Northern
Territory.
19 Based on data from the national Gas Bulletin Board (GBB), available at: https://aemo.com.au/energy-systems/gas/gas-bulletin-board-gbb/data-portal.
20 Direct comparison with WA GBB consumption is not possible due to differences in classifications.
21 Includes generation for mining and minerals processing.
22 The Australian Capital Territory has been included in the figures for New South Wales.

© AEMO 2020 | 2020 Western Australia Gas Statement of Opportunities 18
Figure 3 Major category gas consumption by state (% share of total), 2018-19
Source: Department of Industry, Science, Energy, and Resources.
Note: Data is presented in financial years.
2.1.2 Large customers supplied through the transmission network
The majority of large customers23 are supplied directly through the transmission network (such as the DBNGP
and the Goldfields Gas Pipeline). The remaining large customers are supplied by domestic LNG facilities,
which convert natural gas to LNG which is then transported by road.
Large customers include:
• Mine sites such as iron ore, gold, and nickel mines.
• Mineral processing facilities such as alumina refineries and nickel smelters.
• Electricity generation from GPG, mainly located in the North West Interconnected System (NWIS) and the
South West interconnected system (SWIS).
• Industrial large users such as brickworks, cement manufacturers, and chemicals plants.
• Producers of domestic LNG, compressed natural gas, and liquefied petroleum gas (LPG).
• Petroleum processors.
Based on WA Gas Bulletin Board (GBB)24 data, large customers accounted for 85% of gas consumed in WA in
2019 and 84% in 2020 (year to date to 31 October), in line with historical usage. The majority was consumed
in the minerals processing (32% of large customer use), mining (26%), and electricity generation (27%)
sectors.
2.1.3 Customers supplied through the distribution network
Customers supplied through the retail distribution network account for 6% of WA’s total domestic gas
consumption. Table 525 shows the total number of residential and non-residential customers supplied
through the distribution network, and customer transfers between retailers between the 2014-15 and 2018-19
financial years.
23 Gas consumers using 10 TJ/day or more.
24 This public website (at https://gbbwa.aemo.com.au) publishes forecast and historical data on the domestic production, transmission, storage, and usage of
natural gas in WA.
25 AEMO. Gas Retail Markets Monthly Statistics – June 2020. Available at https://www.aemo.com.au/-
/media/files/gas/retail_markets_and_metering/data/2020/gas-monthly-retail-transfer-statistics-june-2020.pdf?la=en.

© AEMO 2020 | 2020 Western Australia Gas Statement of Opportunities 19
Annual growth in customer numbers has fallen since 2015-16, despite the population continuing to grow26. In
2019-20, particularly slow growth (0.3%) is mainly attributed to the lowest number of new dwellings being
completed since 1984-8527.
Average usage per connection has fallen due to increasingly efficient gas appliances, smaller household sizes,
and increasing competitive substitutes from alternative energy sources such as electricity28.
Customer churn continued to increase in 2019-20; it has risen from 5% in 2014-15 to 14% in 2019-2029. Before
2013-14, Alinta was the only small residential and business retailer. The retail gas market has since expanded
to include a total of nine retail licenses30 including AGL, Amanda, Simply Energy, Origin, Perth Energy and
Kleenheat.
Table 5 Residential and non-residential retail customer numbers, 2014-15 to 2019-20
Financial year
Total number of customers Existing customer transfers
Number Growth Number ChurnA
2014-15 717,439 N/A 37,196 5%
2015-16 738,835 3% 54,103 7%
2016-17 752,454 2% 95,845 13%
2017-18 761,734 1% 112,089 15%
2018-19 771,415 1% 119,884 16%
2019-20 773,778 0.3% 110,564 14%
A. Calculated by dividing the number of customers changing retailer by the total number of customers for a given financial year.
Note: Data is presented in financial years.
The annual gas retail market for large business customers (business customers on ATCO’s distribution
network who consume more than 0.18 TJ of gas per year and are covered by the gas market moratorium)
experienced a shift. Alinta’s customer share declined from 85% in 2013-14 to 46% in 2018-1931. Most of these
customers were captured by Kleenheat, whose market share jumped from 10% in 2013-14 to 32% in 2015-16,
then to 40% in 2018-19. As of 2019, Synergy is the third largest retailer with 6% of the market share, followed
by Perth Energy with 3%, Esperance Gas Distribution Company with 2%, and AGL with 2%.
A similar pattern was noticed in the small residential market (residential customers on ATCO’s distribution
network who consume less than 0.18 TJ of gas per year and are covered by the gas market moratorium).
Alinta’s share steadily declined from monopoly status in 2013-14 to 65% in 2018-19. A total of 28% of the
market has been captured by Kleenheat, and AGL and Origin Energy make up the balance with 6% and 2%
market share respectively32.
26 Australian Bureau of Statistics (ABS). National, state, and territory population, 24 September 2020. Available at:
https://www.abs.gov.au/statistics/people/population/national-state-and-territory-population/mar-2020.
27 ABS. Building Activity, Australia, 14 October 2020. Available at: https://www.abs.gov.au/statistics/industry/building-and-construction/building-activity-
australia/jun-2020#data-download.
28 ATCO. 2020-24 Plan: Access Arrangement Information for ATCO’s Mid-West and South-West Gas Distribution System, 31 August 2018, pp. 57-8. Available at:
https://yourgas.com.au/wp-content/uploads/2018/09/ATCO-2020-2024-Plan-1.pdf?utm_source=plan_downloads&utm_medium=2020-24_Plan_page.
29 A comparison of churn rates between states across the 2018-19 financial year is available at: https://www.aemo.com.au/-/media/files/gas/
retail_markets_and_metering/data/2020/gas-monthly-retail-transfer-statistics-september-2020.pdf?la=en.
30 ERA. Annual Data – Energy Retailers 2018/19, 26 March 2020. Available at: https://www.erawa.com.au/gas/gas-licensing/energy-reports.
31 Data for 2019-20 was not available at the time of publication.
32 ERA. Annual Data – Energy Retailers 2018/19, 26 March 2020. Available at: https://www.erawa.com.au/gas/gas-licensing/energy-reports.

© AEMO 2020 | 2020 Western Australia Gas Statement of Opportunities 20
2.2 Domestic gas demand forecasts
2.2.1 Forecasting scenarios
The annual domestic gas demand forecasts are provided for the 10-year outlook period (2021 to 2030). The
forecasts have been developed for three scenarios – low, base, and high. Broadly, these scenarios reflect
varying views regarding the economic outlook, commodity production, gas prices, and population growth.
The forecasting methodology in the base scenario has been improved with access to more formal
information request (FIR) data.
AEMO has not incorporated the effects of hydrogen in the domestic gas demand forecasts, with the
exception of Hazer Group Limited’s biogas to hydrogen project. AEMO will continue to monitor the progress
of hydrogen for potential inclusion in future WA GSOOs.
All scenarios assume that the following five committed33 mining and mineral processing projects34 will
contribute approximately 40 TJ/day of gas demand over the outlook period:
• Albemarle Corporation’s Kemerton lithium processing plant is scheduled to commence operation in 202135
after initial delays.
• Rio Tinto’s Gudai-Darri iron ore project, with first production planned for early 202236. A 34 MW PV solar
farm set to be installed in 2021 is expected to offset part of this project’s gas demand37.
• The joint venture project between FMG Magnetite and Formosa Steel IB, the Iron Bridge magnetite
processing project (stage 2), is due to commence in mid-202238, with a ramp up to full production within
12 months.
• Capricorn Metal’s Karlawinda Mine is set to become operational in 202139.
• Kalium Lakes Beyondie Sulphate of Potash (SOP) project is on target to begin production in 202140.
Partially offsetting the demand from the above projects, all scenarios assume that the following two projects
will reduce existing gas demand by approximately 2.4 TJ/day over the outlook period:
• Gold Field’s Agnew Gold mine renewable power project, which commenced operation in May 202041.
• Hazer Group Limited’s biogas to hydrogen and graphite project beginning in 202142.
BHP’s South Flank project is set to commence production from mid-202143. It will fully replace production
from the 80 mtpa Yandi mine and have no impact on net gas demand in any scenario.
33 Committed gas demand projects have attained FID or are already under construction as defined in Appendix A3.2.1.
34 Since the 2019 WA GSOO, one project has been removed, one project added, and one project’s gas demand has been reduced due to the addition of
renewable generation.
35 Albemarle Corporation. “Albemarle Reports Third Quarter Results”, 4 November 2020. Available at: https://investors.albemarle.com/node/22451/pdf.
36 Rio Tinto Limited. “Rio Tinto releases third quarter production results”, 16 October 2020. Available at: https://cdn-api.markitdigital.com/apiman-
gateway/ASX/asx-research/1.0/file/2924-02294524-3A552729?access_token=83ff96335c2d45a094df02a206a39ff4.
37 Rio Tinto Limited. “Rio Tinto to build first solar plant in Western Australia to power iron ore mine”, 16 February 2020. Available at:
https://www.riotinto.com/news/releases/2020/Rio-Tinto-to-build-first-solar-plant-in-Western-Australia-to-power-iron-ore-mine.
38 Fortescue Metals Group Limited. “Strong start to FY21 with record first quarter operating performance”, 29 October 2020. Available at:
https://www.fmgl.com.au/docs/default-source/announcements/2134058.pdf.
39 Capricorn Metals Limited. “Debt Financing Completed and Project Update Karlawinda Gold Project”, 18 December 2019. Available at:
http://capmetals.com.au/wp-content/uploads/2019/12/191218-Financing-finalised.pdf.
40 Kalium Lakes Limited. “Beyondie SOP Project – Update”, 27 October 2020. Available at: https://asx.api.markitdigital.com/asx-research/1.0/file/2924-
02299323-6A1003385?access_token=83ff96335c2d45a094df02a206a39ff4.
41 EDL. “Agnew”. Available at https://edlenergy.com/project/agnew/. Viewed 5 November 2020.
42 Hazer Group Limited. “Hazer Commercial Demonstration Project Final Investment Decision Approval”, 31 July 2020. Available at:
https://hazergroup.com.au/wp-content/uploads/2020/09/200731-FID-Approval-FINAL.pdf.
43 BHP. “BHP Operational Review for the Quarter Ended 30 September 2020”, 20 October 2020. Available at https://www.bhp.com/-/media/documents/
media/reports-and-presentations/2020/201020_bhpoperationalreviewforthequarterended30september2020.pdf?la=en.

© AEMO 2020 | 2020 Western Australia Gas Statement of Opportunities 21
The high gas demand scenario also includes five prospective demand projects44, totalling 145 TJ/day of gas
demand by 2025.
Scenario assumptions specific to SWIS GPG gas demand are dependent on the electricity demand forecasts
presented in the 2020 Wholesale Electricity Market (WEM) Electricity Statement of Opportunities (ESOO)45, as
well as the expected generation mix in the SWIS over the outlook period. In all scenarios, non-SWIS GPG
(including towns like Port Hedland, Karratha, Carnarvon, and Exmouth but excluding mining GPG) represents
roughly 30% of total GPG gas usage (4% of total domestic gas demand). However, limited growth has been
identified in this area, since electricity consumption in these towns is expected to remain relatively stable.
Further discussion on the projected outlooks for individual gas use sectors is provided in Section 2.2.3.
Further information relating to the methodology and assumptions underpinning the GPG and gas demand
scenarios is provided in Appendix A3 and in the commodity forecast46 and SWIS GPG forecast modelling
reports47.
2.2.2 Gas demand forecasts by scenario, 2021 to 2030
AEMO forecasts domestic gas demand to grow at a 10-year average annual rate of 0.7% in the base scenario,
primarily driven by general demand growth in the mining and mineral processing sectors and new committed
major resource projects.
The gas demand forecasts under the low, base, and high scenarios are presented in Figure 4 and Table 6.
Figure 4 Domestic gas demand forecasts (TJ/day), 2021 to 2030
44 Prospective gas demand projects may be developed over the outlook period or may switch fuel type from diesel to gas. To be included in the high
scenario, they must meet set criteria, as defined in Appendix A3.2.1.
45 For further information about the electricity forecasts, see https://aemo.com.au/Electricity/Wholesale-Electricity-Market-WEM/Planning-and-forecasting/
WEM-Electricity-Statement-of-Opportunities.
46 NIEIR. Commodity forecasts for Western Australia to 2030, August 2020. Available at: https://aemo.com.au/energy-systems/gas/gas-forecasting-and-
planning/wa-gas-statement-of-opportunities-wa-gsoo.
47 RBP. Gas powered generation forecast modelling – final report. December 2020. Available at: https://aemo.com.au/energy-systems/gas/gas-forecasting-
and-planning/wa-gas-statement-of-opportunities-wa-gsoo.

© AEMO 2020 | 2020 Western Australia Gas Statement of Opportunities 22
Table 6 Domestic gas demand forecasts (TJ/day), 2021 to 2030
Scenario 2021 2022 2023 2024 2025 2026 2027 2028 2029 2030 5-year
average
annual
growth
(%)
10-year
average
annual
growth
(%)
Low 1,035 1,048 1,046 1,051 1,061 1,065 1,061 1,054 1,053 1,048 0.6 0.1
Base 1,068 1,080 1,081 1,099 1,116 1,126 1,128 1,128 1,132 1,135 1.1 0.7
High 1,127 1,154 1,159 1,243 1,330 1,346 1,354 1,358 1,367 1,374 4.2 2.2
The impacts of varying assumptions embedded in the gas demand growth scenarios are:
• In the low scenario, due to different commodity outlooks, minerals processing, mining and industrial gas
consumption are lower compared to the base and high scenarios.
• In the base scenario, growth in overall demand is largely driven by an increase in gas consumption in
mining and minerals processing over the outlook period. SWIS GPG gas demand is forecast to fall at an
average annual rate of 0.4%. The entry of two new waste-to-energy generators 48 and declining electricity
consumption forecasts as published in the 2020 WEM ESOO, partly offset by increased GPG generation
due to the retirement of the Muja C power station by 2024, contribute to the decline in SWIS GPG gas
consumption over the outlook period. GPG demand is forecast to grow in both the base and low
scenarios after 2024 due to increased ramping requirements49 associated with behind-the-meter PV and
large-scale intermittent renewable generation.
• In the high scenario, the commencement of five prospective projects50 is forecast to add approximately
145 TJ/day of demand by 2025. The inclusion of prospective projects is the key factor contributing to
higher gas use in the high scenario compared with the base scenario. Despite fewer prospective projects
in the high scenario compared to the 2019 WA GSOO51, the forecasts are higher this year due to a more
favourable commodity outlook.
2.2.3 Gas demand forecasts by usage category
The gas demand forecasts are disaggregated into the following usage categories52:
• Mineral processing.
• Mining.
• GPG (SWIS and non-SWIS).
• Industry (major users such as ammonia, fertiliser, and LPG production).
• Distribution.
This breakdown is shown in Figure 5 and Table 7.
48 Two waste-to-energy facilities are currently under construction in the SWIS; the Phoenix Kwinana Facility and the East Rockingham Resource Recovery
Facility are due to be completed in 2021 and 2022 respectively. For further information see Appendix 3.
49 The difference between minimum and peak demand in the SWIS is widening with increasing uptake of behind-the-meter solar PV and large-scale solar.
This requires generation (usually GPG) that is capable of rapidly increasing output (“ramping”) over a short period of time to meet evening peak demand.
50 Prospective gas demand projects must meet set criteria and are only included in the high scenario. They may either be developed over the outlook period
or switch from diesel to gas.
51 Prospective demand in the 2019 WA GSOO was forecast to add up to 168 TJ/day by 2025.
52 Usage categories were defined in this way because each category is affected by different external and internal influences. Appendix A5 provided a
complete breakdown of how gas consumers were categorised. The mining and minerals processing sectors include GPG located at remote mine sites or
minerals processing facilities.

© AEMO 2020 | 2020 Western Australia Gas Statement of Opportunities 23
Figure 5 Domestic gas demand forecasts by sector (TJ/day), base scenario, 2021 to 2030
Table 7 Forecast annual gas demand by sector (TJ/day), base scenario, 2021 to 2030
Sector 2021 2022 2023 2024 2025 2026 2027 2028 2029 2030 5-year
average
growth (%)
10-year
average
growth (%)
Mineral
processing 382 391 394 397 399 403 401 403 404 403 1.1 0.6
Mining 273 284 279 295 304 310 311 310 313 316 2.7 1.6
GPG 130 123 125 126 130 130 131 132 129 130 -0.1 0.0
Industrial 186 183 183 183 183 183 183 183 183 183 -0.4 -0.2
Distribution 82 84 84 85 86 86 86 87 87 88 1.2 0.8
Note: Sector breakdown excludes domestic LNG (15 TJ/day).
Drivers of trends in the different sectors are:
• Projected 5-year and 10-year growth rates in minerals processing remain unchanged from rates presented
in the 2019 WA GSOO. This is predominantly growth associated with the commencement of the Kemerton
lithium processing plant in 2022.
• Gas demand from the mining sector is forecast to grow at an average growth rate of 1.6% over the 10-year
outlook period. This is a reduction from the 2019 WA GSOO forecast value, due to lower expected
demand from new projects, lower GPG forecasts, and the introduction of renewable energy offsetting gas
demand in the mining sector over the outlook period. Stronger growth in the initial five years of the
outlook period is driven by strong commodity forecasts, despite a dip in 2023 reflecting reduced WA iron
ore production after Brazil’s iron ore production recovers from the Brumadinho dam disaster53 and
COVID-19 restrictions.
• In GPG demand forecasts, the reductions compared to the 2019 WA GSOO are due to the commencement
of two waste-to-energy generators by the end of 2022, higher forecast domestic gas prices, and declining
electricity consumption forecasts. This reduction is forecast to be partially offset by increased GPG use due
53 A tailings dam at the Córrego do Feijão iron ore mine collapsed on 25 January 2019, causing a fall in iron ore exports from Brazil. Since demand has
remained robust, particularly from China, other low-cost producers such as WA have increased exports to make up for Brazil’s lost production.

© AEMO 2020 | 2020 Western Australia Gas Statement of Opportunities 24
to the retirement of the Muja C power station in October 2024, combined with increasing ramping
requirements due to uptake of large-scale and behind-the-meter solar generation54, leading to a relatively
flat forecast of GPG demand over the outlook period.
• Gas demand in the industrial sector is forecast to remain flat across the outlook period after 2021 with no
new projects on the horizon. Two prospective industrial projects have been included in the high scenario
only.
• Demand from the distribution network is forecast to increase at an average annual rate of 0.8% over the
outlook period. While the number of residential connections in the distribution network is forecast to
grow, this is forecast to be partially offset by falling average use per connection as a result of increased
energy efficiency and fuel switching.
2.2.4 Gas demand forecasts by area
In line with previous WA GSOO reports, gas demand has been disaggregated into two areas, SWIS and
non-SWIS55, as shown in Table 8.
Consistent with the 2019 WA GSOO, the forecast growth in gas demand outside the SWIS exceeds the
expected growth rate within the SWIS. Despite increases in mining growth as a result of strong global
demand for iron ore and gold in the short term, non-SWIS growth is projected to be much weaker than that
forecast in the 2019 WA GSOO, predominantly due to a weaker long-term outlook for commodities.
Forecast demand growth within the SWIS remains similar to the 2019 WA GSOO forecasts, primarily driven by
increased gas demand in the mineral processing sector over the outlook period. The lower forecasts in 2021
and 2022 result from a reduction in gas demand in SWIS GPG associated with the entry of new renewable
generation capacity by 2022. SWIS GPG demand is forecast to recover after 2022 and retain growth in the
second half of the outlook period following the retirement of the Muja C power station in combination with
increased ramping requirements (see Section 2.2.4).
Table 8 Forecast annual gas demand by area (TJ/day), base scenario, 2021 to 2030
Area 2021 2022 2023 2024 2025 2026 2027 2028 2029 2030 5-year
average
growth (%)
10-year
average
growth (%)
Non-
SWIS 425 438 433 448 458 464 466 465 469 471 1.9 1.1
SWIS 643 643 648 650 658 662 662 663 663 664 0.6 0.4
2.2.5 Gas demand forecasts by region
This section provides regional disaggregation of gas demand forecasts. WA domestic gas forecasts have been
split into three regions:
• East (includes the GBB zones of Goldfields and Kalgoorlie).
• North (includes the GBB zones of Karratha, Dampier, Pilbara, and Telfer).
• Metro/South West (includes the GBB zones of Mid-West, Parmelia, Metro, and South West)56.
Figure 6 and Table 9 present the expected domestic gas demand forecasts by region for the base scenario.
54 AEMO notes that increased short-term gas demand for GPG to meet ramping requirements as a result of renewable energy generation (both large-scale
and behind-the-meter) are likely to cause issues with managing pipeline capacity. For further information, see https://www.dbp.net.au/wp-
content/uploads/2019/05/AGIG-DBP-Draft-Plan-2021-2025_Web.pdf.
55 The SWIS includes the electricity transmission and distribution networks in the south west area of WA and extends from Albany to Kalbarri and to
Kalgoorlie in the east. The non-SWIS area includes all towns and mine sites outside of the SWIS (see Appendix A.3 for further information).
56 Note that this zoning classification does not match the SWIS area presented above for SWIS/non-SWIS demand forecasts as provided in Section 2.2.4.

© AEMO 2020 | 2020 Western Australia Gas Statement of Opportunities 25
Figure 6 Domestic gas demand forecasts by region (TJ/day), base scenario, 2021 to 2030
Table 9 Forecast annual gas demand by region (TJ/day), base scenario, 2021 to 2030
Region 2021 2022 2023 2024 2025 2026 2027 2028 2029 2030 5-year
average
growth (%)
10-year
average
growth (%)
Metro/South
West 641 645 650 652 659 663 664 664 664 665 0.7 0.4
East 113 111 108 106 106 107 106 106 106 106 -1.6 -0.8
North 313 324 322 340 350 355 357 357 361 364 2.9 1.7
Of the three regions, the strongest growth is forecast to occur in the North region, particularly during the first
half of the outlook period (2.9% average annual growth). This is predominantly due to new gas-consuming
projects related to iron ore, which are expected to add 36.4 TJ/day to gas consumption from 2023. Growth in
this region is projected to slow after 2025, which reflects low growth in gas consumption in the mining sector.
Growth in new projects is limited in the Metro/South West region, contributing to a relatively flat growth rate
of 0.4% over the outlook period. A marginally higher growth rate (0.7%) in the first half of the outlook period
associated with general demand growth is lessened by the forecast reduction in demand from SWIS GPG
associated with the entry of renewable generation, as discussed in Sections 2.2.2 and 2.2.3.
In the East region, gas demand is forecast to fall at an annual growth rate of -1.6% in the first half of the
outlook period due to the introduction of the Agnew renewables project. Gas demand is then forecast to
stabilise after 2024, resulting in a 10-year growth rate of -0.8%.
2.3 Gas demand forecasts compared to 2019 WA GSOO
The base scenario gas demand forecasts developed for the 201957 and 2020 WA GSOOs are compared in
Table 10.
The gas demand forecasts presented in this 2020 WA GSOO are lower than in the 2019 WA GSOO,
particularly between 2023 and 2024. This is largely due to a decrease in forecasts for gas consumption for
57 The domestic gas demand forecasts in the 2019 WA GSOO covered the period 2020 to 2029.

© AEMO 2020 | 2020 Western Australia Gas Statement of Opportunities 26
SWIS GPG, which reflects the impact of new generation capacity that is currently under construction (see
Section 2.2.3). Slower growth in the mining sector is associated with weaker forecasts for most commodities
over the outlook period, partly offset by strong growth in gold until 2022 and iron ore across the outlook
period (see Section 2.2.3 and Appendix A3.1).
These changes account for the majority of the difference between the base scenario 2019 and 2020 WA
GSOO domestic gas demand forecasts.
Table 10 2019 and 2020 base scenario domestic gas demand forecasts (TJ/day), 2021 to 2029
2021 2022 2023 2024 2025 2026 2027 2028 2029
2019 domestic demand 1,065 1,098 1,124 1,128 1,139 1,138 1,148 1,154 1,165
2020 domestic demand 1,068 1,080 1,081 1,099 1,116 1,126 1,128 1,128 1,132
Difference 3 -18 -43 -29 -23 -12 -20 -26 -33
2.4 Historical peak WA domestic gas demand days
The historical WA gas demand presented below used GBB data for the period from 1 August 2013 to
16 November 202058. The highest gas usage day59 over this period occurred on 28 January 2015, when
consumption reached 1,275 TJ.
The highest gas usage day in 2020 occurred on 26 May, with consumption of 1,200 TJ, making it the
thirteenth-highest gas demand day since GBB start in August 2013.
The major drivers of high demand days include:
• Weather-related factors such as high numbers of cooling degree days60 (CDD) and heating degree
days61 (HDD).
• Type of calendar day (for example, business day or weekend, public holiday and/or school holiday).
• Macro-economic activity.
• Mineral processing and mining projects.
• Outages of non-gas electricity generation facilities that were partially offset by increasing gas
consumption.
The 20 highest gas usage days distributed by season, for each year since the GBB commenced, are shown in
Table 11. In 2020, there was a 49 TJ difference between the highest gas demand day and the
twentieth-highest day for WA.
58 Improvements have been made to the reporting methodology for historical gas demand, including reporting in the calendar year where possible, to be in
line with gas demand forecast reporting. Historical gas demand distributions may not match those reported in the 2019 WA GSOO and previous GSOOs.
59 Excluding gas demand used in gas shipping, compression and injections to storage facilities.
60 Average temperatures higher than 24°C.
61 Average temperature less than 18°C.

© AEMO 2020 | 2020 Western Australia Gas Statement of Opportunities 27
Table 11 20 highest gas demand days per year (total WA), distributed by season, 2013 to 2020
Number of peak
gas usage days in:
2013A 2014 2015 2016 2017 2018 2019 2020B
SummerC 5 2 6 8 - - - -
Autumn - - - 5 2 2 4 9
Winter 1 17 14 4 15 15 15 8
Spring 14 1 - 3 3 3 1 3
A. 1 August to year end.
B. Year start to 16 November 2020.
C. January, February, and December of the same calendar year.
Observations from Table 11 include:
• Since 2017, high-consumption days were more likely to be associated with high HDD days, which occurred
predominantly in the winter and spring periods.
• A large number of high-consumption days were in spring of 2013, because data collection only began in
August.
• An unusually mild winter season in 2016 led to fewer high-consumption days.
• There were high-consumption days in autumn in 202062, attributed to higher-than-normal GPG
generation due to lower coal power availability associated with planned outages.
Gas consumption data are grouped into three geographic zones, as defined in the Gas Services Information
Rules (GSI Rules)63 (see Section 2.2.5 for the regional categorisation). In Figure 7, GBB data has been used to
determine the previous years’ highest gas demand days across the three regions.
Figure 7 Highest gas demand days (TJ/day) by region, 2013 to 2020
The seasonal distribution of the 20 highest gas demand days for the period 1 January 2017 to 31 December
2019 across the three regions is shown in Table 12.
62 The 2020 data currently excludes some of the summer and some of the spring season.
63 ERA. Gas Services Information Rules, 1 March 2019. Available at: https://www.erawa.com.au/rule-change-panel/gas-services-information-rules.

© AEMO 2020 | 2020 Western Australia Gas Statement of Opportunities 28
Table 12 The 20 highest gas demand days in each GSI Zone, 2017 to 2019, distributed by season
2017 2018 2019
Number
of peak
gas
usage
days in:
East Metro/South
West North East
Metro/South
West North East
Metro/South
West North
Summer 7 - 9 7 - - 7 3 6
Autumn 3 1 - - - 20 1 2 12
Winter 4 18 4 2 18 - 8 15 1
Spring 6 1 7 11 2 - 4 - 1
Note: Each region’s 20 highest gas demand days are not necessarily the same as the 20 WA highest gas demand days.
• On average, most high-demand days in the Metro/South-West region occurred in winter, largely driven
by gas heating requirements.
• Additional supporting information and analysis suggests there is a strong day-of-the-week effect in the
Metro/South West region, with business days seeing the strongest positive effect on gas demand.
• Most high-demand days occurred in summer and spring in the East region; however, most high gas
demand days were in the winter period in 2019.
• In the North region, high-demand days occurred mostly in summer and autumn.
Figure 8 shows, for each Zone, the difference between the highest and lowest peak demand days since 2013.
Figure 8 Differences between highest and twentieth highest demand days in each GSI Zone
Note: Full year’s data is not available for 2013 and 2020.
Analysis of high-demand days by Zone shows that:
• The large differences between the highest gas usage day and the twentieth-highest day for the
Metro/South-West Zone are driven predominantly by gas heating requirements.
• Variation between years is apparent in the North zone, with the largest differences between the highest
demand day and the twentieth-highest in 2015, which was a hotter-than-average year.
• In contrast, there is very little variation between the 20 highest-demand days in the East Zone, reflecting
relatively stable gas use from mine sites.
© AEMO 2020 | 2020 Western Australia Gas Statement of Opportunities 29
2.5 Reconciliation of WA GSOO domestic gas demand forecasts
vs actuals
Reconciliation of previous WA GSOO domestic gas demand forecasts against actual average gas use data
sourced from the GBB64 is shown in Table 13. Improvements to forecasting methodology, access to FIR data,
and augmentation of GBB data have contributed to the accuracy of the forecasts over time.
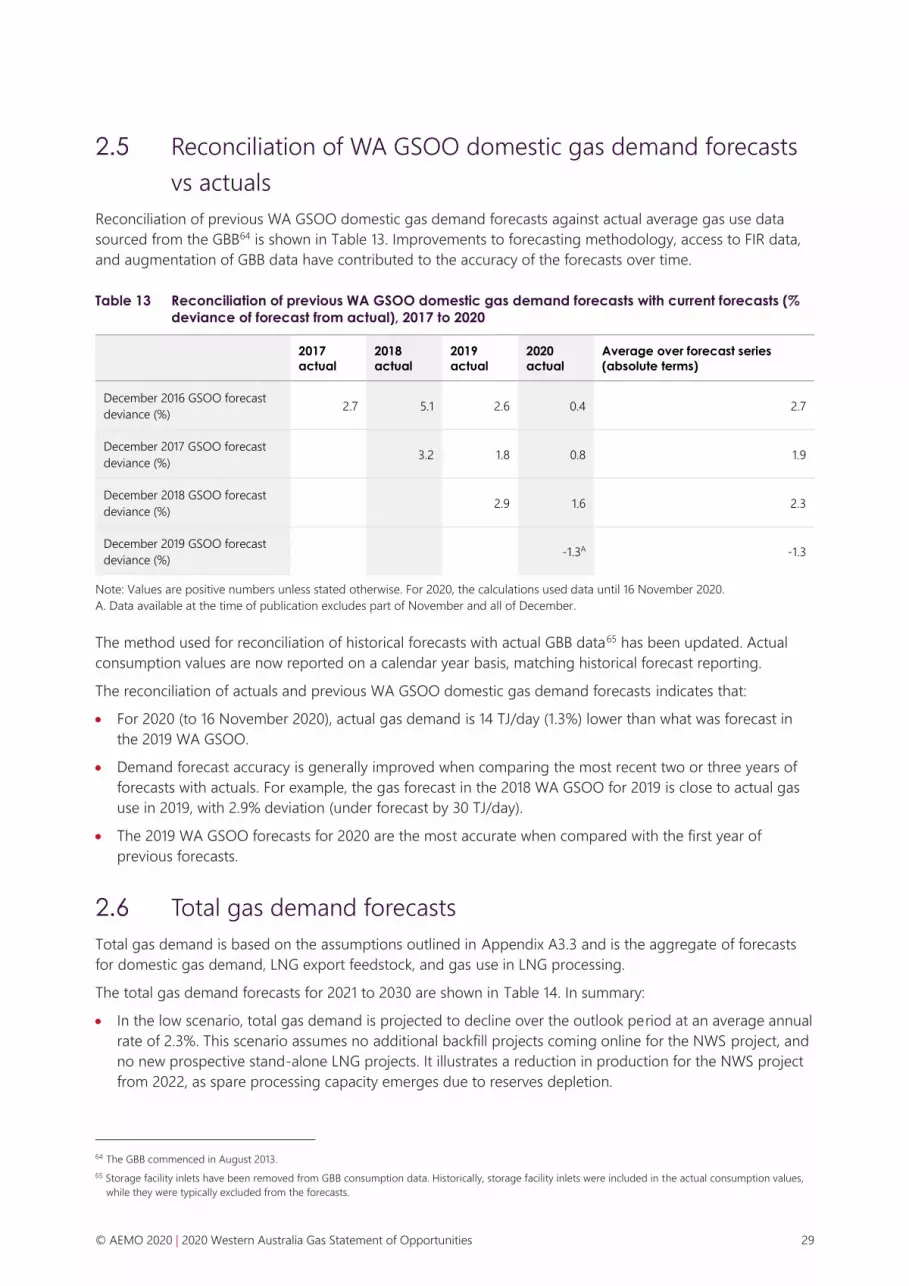
Table 13 Reconciliation of previous WA GSOO domestic gas demand forecasts with current forecasts (%
deviance of forecast from actual), 2017 to 2020
Note: Values are positive numbers unless stated otherwise. For 2020, the calculations used data until 16 November 2020.
A. Data available at the time of publication excludes part of November and all of December.
The method used for reconciliation of historical forecasts with actual GBB data65 has been updated. Actual
consumption values are now reported on a calendar year basis, matching historical forecast reporting.
The reconciliation of actuals and previous WA GSOO domestic gas demand forecasts indicates that:
• For 2020 (to 16 November 2020), actual gas demand is 14 TJ/day (1.3%) lower than what was forecast in
the 2019 WA GSOO.
• Demand forecast accuracy is generally improved when comparing the most recent two or three years of
forecasts with actuals. For example, the gas forecast in the 2018 WA GSOO for 2019 is close to actual gas
use in 2019, with 2.9% deviation (under forecast by 30 TJ/day).
• The 2019 WA GSOO forecasts for 2020 are the most accurate when compared with the first year of
previous forecasts.
2.6 Total gas demand forecasts
Total gas demand is based on the assumptions outlined in Appendix A3.3 and is the aggregate of forecasts
for domestic gas demand, LNG export feedstock, and gas use in LNG processing.
The total gas demand forecasts for 2021 to 2030 are shown in Table 14. In summary:
• In the low scenario, total gas demand is projected to decline over the outlook period at an average annual
rate of 2.3%. This scenario assumes no additional backfill projects coming online for the NWS project, and
no new prospective stand-alone LNG projects. It illustrates a reduction in production for the NWS project
from 2022, as spare processing capacity emerges due to reserves depletion.
64 The GBB commenced in August 2013.
65 Storage facility inlets have been removed from GBB consumption data. Historically, storage facility inlets were included in the actual consumption values,
while they were typically excluded from the forecasts.
2017
actual
2018
actual
2019
actual
2020
actual
Average over forecast series
(absolute terms)
December 2016 GSOO forecast
deviance (%) 2.7 5.1 2.6 0.4 2.7
December 2017 GSOO forecast
deviance (%) 3.2 1.8 0.8 1.9
December 2018 GSOO forecast
deviance (%) 2.9 1.6 2.3
December 2019 GSOO forecast
deviance (%) -1.3A -1.3

© AEMO 2020 | 2020 Western Australia Gas Statement of Opportunities 30
• In the base scenario, projected small increases in total gas demand between 2021 and 2025 are driven by
backfill for the NWS project from Waitsia stage 2 and Pluto. Between 2025 and 2026, total gas demand
increases by 374 PJ as a result of Scarborough commencing66. From 2026 to 2030, and despite the
additional gas from Scarborough, total gas demand falls as a result of further production declines at the
NWS project.
• Compared to the base scenario, the high scenario includes an expansion to Ichthys, which supports total
gas demand growth at an average annual rate of 0.6%.
Table 14 Total gas demand forecasts (PJ/annum), 2021 to 2030
A further breakdown for total gas demand forecasts (into domestic gas demand, LNG feedstock, and LNG
processing) for the low, base, and high scenarios is included in Appendix A4.
Figure 9 shows the base scenario forecast for total gas demand for the outlook period. LNG feedstock is
forecast to account for approximately 83% of the total gas demand, while domestic gas demand is projected
to contribute around 9% to 11% of total gas demand over the outlook period.
The base scenario projects total gas demand to increase marginally (0.1% average annual growth) from 2021
to 2025, at an average annual rate of 0.1%. In 2026, LNG feedstock increases by 343 PJ, reflecting the
commencement of Scarborough through Pluto train two and the NWS. Despite this increase, total gas
demand is forecast to decline by about 287 PJ from 2023 to 2030, reflecting declining NWS production that is
not expected to be fully offset by backfill projects.
66 The LNG component of the Scarborough project is expected to commence in 2026, while the domestic gas production facility is assumed to be available
from 2027.
2021 2022 2023 2024 2025 2026 2027 2028 2029 2030 5-year
average
annual
growth
(%)
10-year
average
annual
growth
(%)
Low 3,965 3,885 3,800 3,719 3,637 3,554 3,468 3,382 3,296 3,210 -2.1 -2.3
Base 3,977 4,068 4,154 4,077 3,998 4,372 4,288 4,035 3,950 3,867 0.1 -0.3
High 3,999 4,095 4,182 4,130 4,076 4,452 4,371 4,372 4,289 4,208 0.5 0.6

© AEMO 2020 | 2020 Western Australia Gas Statement of Opportunities 31
Figure 9 Total gas demand forecasts (PJ/annum), base scenario, 2021 to 2030

© AEMO 2020 | 2020 Western Australia Gas Statement of Opportunities 32
3. Gas supply
Overall, potential gas supply is projected to decline at an average annual rate of 2.8%
between 2021 and 2030. Delays to large LNG projects, including Browse and Scarborough,
have been caused by weak oil and LNG prices, as well as LNG oversupply, which has been
exacerbated by reduced demand due to restrictions introduced during the COVID-19
pandemic. In contrast, domestic-only projects, including backfill67 for existing production
facilities, have progressed further since the publication of the 2019 WA GSOO.
All data in this chapter is presented in calendar years unless otherwise stated.
3.1 Profile of upstream and gas production
3.1.1 Reserves and resources
Gas has been categorised into either reserves or resources, based on the level of commercial and technical
uncertainty associated with extraction68. These terms are broadly defined below:
• Reserves are quantities of gas that are anticipated to be commercially recoverable from known
accumulations. Proved and probable (2P) reserves are considered the best estimate of commercially
recoverable reserves69.
• Contingent (2C) resources are considered less commercially viable than reserves. These can be considered
roughly the equivalent of reserves with one or more commercial or technical uncertainties impacting the
likelihood of development. 2C resources are considered the best estimate of sub-commercial resources70.
Third-party estimates of WA’s total conventional gas resources71 are summarised in Table 1572. Compared to
the 2019 WA GSOO, conventional gas 2P reserves have decreased and 2C resources have increased.
In addition to conventional gas, WA has unconventional gas resources (shale and tight gas), mostly located in
the Canning and Perth basins. Given the amount of conventional gas resources remaining, and the relatively
high cost of developing unconventional gas, despite active interest there has been no commercial production
of unconventional gas in WA. Under current WA legislation, the use of hydraulic fracture stimulation
67 Connecting additional gas fields or reserves to an existing domestic gas production facility, instead of building new processing infrastructure (sometimes
referred to as a tie-back).
68 These uncertainties could include securing finance, obtaining government approvals, negotiating contracts, or overcoming geological challenges. The
terms ‘resources’ and ‘reserves’ are not interchangeable: reserves constitute a subset of resources.
69 The 2P reserves categorisation indicates there is a reasonable probability that 50% or more of the gas is recoverable and economically profitable. Proved
reserves (1P) indicate that this probability is higher than 90%. Gas producers generally sign gas supply sales contracts based on 1P reserves.
70 The resources are estimated to exist in prospective areas but have not been proven by drilling.
71 ‘Conventional’ refers to formations that are relatively straightforward to extract, and ‘unconventional’ refers to formations that are much more difficult to
extract, in some cases requiring specialised techniques. Both conventional and unconventional gas formations may contribute to reserves and resources,
depending on the economic viability of extraction.
72 Department of Jobs, Tourism, Science and Innovation (DJTSI). WA LNG Industry Profile, August 2019, p. 5, at https://www.jtsi.wa.gov.au/docs/default-
source/default-document-library/wa-lng-profile-0919.pdf?sfvrsn=93c7701c_4. WA LNG Industry Profile, September 2020, p. 2, at
https://jtsi.wa.gov.au/docs/default-source/default-document-library/wa-lng-profile---september-2020.docx?sfvrsn=eff761c_4.

© AEMO 2020 | 2020 Western Australia Gas Statement of Opportunities 33
techniques73 in WA is still limited, and the revised WA Domestic Gas Policy74 indicates future unconventional
gas production will be limited. The Australian Government is currently exploring the development of
conventional and unconventional oil and gas resources in the Canning Basin75.
Table 15 WA conventional and unconventional gas resources and reserves (PJ), as at September 2020
Type 2019 A 2020 B
Conventional 2P gas reserves 69,430 64,441
Conventional 2C gas resources 72,080 79,426
A. Sum of resources and reserves converted from trillion cubic feet (tcf) to PJ.
B. Based on WA Department of Mines, Industry Regulation and Safety’s (DMIRS) estimates.
3.1.2 Exploration
Gas supply to the WA domestic market is largely dependent on the sustained development of gas reserves.
The number of exploration and development wells drilled remains subdued, with only 10 wells drilled over the
January 2020 to October 2020 period. As shown in Figure 10, this is only marginally higher than the lowest
record of nine wells drilled in 2017, which was a period of global oversupply in oil and gas markets.
Figure 10 Exploration and development wells drilled, 1990 to 2020 (year to date)
Note: Based on National Offshore Petroleum Information Management System and the Western Australia Petroleum & Geothermal
Information Management System data.
The WA Government has introduced an Exploration Incentive Scheme76 to encourage energy resource
exploration in under-explored areas in WA.
73 WA Government, “Hydraulic fracturing remains banned on 98 per cent of WA”, 6 September 2019. Available at: https://www.mediastatements.wa.gov.au/
Pages/McGowan/2019/09/Hydraulic-fracturing-remains-banned-on-98-per-cent-of-WA.aspx.
74 WA Government, “Revised policy to secure domestic gas supply and create jobs”, 17 August 2020. Available at:
https://www.mediastatements.wa.gov.au/Pages/McGowan/2020/08/Revised-policy-to-secure-domestic-gas-supply-and-create-jobs.aspx.
75 Australian Government, “Unlocking new resource corridors to drive economic recovery”, 11 August 2020. Available at:
https://www.minister.industry.gov.au/ministers/pitt/media-releases/unlocking-new-resource-corridors-drive-economic-recovery.
76 WA Government, ‘$8.2 million in COVID-19 recovery funding for resources exploration, media statement, 4 August 2020. Available at:
https://www.mediastatements.wa.gov.au/Pages/McGowan/2020/08/8-point-2-million-dollars-in-COVID-19-recovery-funding-for-resources-
exploration.aspx.

© AEMO 2020 | 2020 Western Australia Gas Statement of Opportunities 34
3.1.3 Domestic gas production
There are nine gas production facilities that supply the WA domestic market, with a total capacity of about
1,838 TJ/day77, as shown in Table 16. The KGP maintains the largest capacity at 630 TJ/day.
The following trends were observed during the 2019-20 financial year:
• Production from Beharra Springs, the KGP, and Xyris declined, while production from Gorgon, Macedon,
and Pluto increased.
• Production from Devil Creek, Varanus Island and Wheatstone declined between 1 July 2019 and 31 March
2020 and increased from 1 April 2020.
• The Macedon and Gorgon facilities had the highest capacity utilisation (85% and 76% respectively),
followed by the Wheatstone and Varanus Island facilities (67% and 63% respectively). The remaining
facilities (excluding Xyris) have been operating at half capacity.
Table 16 Domestic gas production facility average production and capacity utilisation, 2019-20
Facility Nameplate
capacity
(TJ/day)
Average production (TJ/day) Average capacity utilisation (%)A
1 Jul -
31 Aug
2019
1 Sept -
31 Dec
2019
1 Jan-
31 Mar
2020
1 Apr -
30 Jun
2020
2019-20 1 Jul -
31 Aug
2019
1 Sept -
31 Dec
2019
1 Jan-
31 Mar
2020
1 Apr -
30 Jun
2020
2019‑20
Beharra
Springs 18.5 12 10 10 8 10 62% 53% 56% 43% 54%
Devil Creek 220 170 133 73 110 122 77% 60% 33% 50% 55%
Gorgon 182 123 147 138 144 138 68% 81% 76% 79% 76%
KGP 630 358 353 362 310 346 57% 56% 57% 49% 55%
MacedonB 201 149 173 174 184 170 70% 81% 81% 91% 85%
Pluto 25 8 12 11 18 12 34% 47% 42% 72% 49%
Varanus
Island 345 237 195 196 242 218 69% 57% 57% 70% 63%
Wheatstone 205 121 106 136 190 138 59% 52% 66% 93% 67%
XyrisC 11.5 2 2 0 0 1 20% 16% 0% 0% 9%
Total 1,838 1,180 1,131 1,098 1,206 1,154 64% 62% 60% 66% 63%
A. Utilisation was calculated using nameplate capacity and average production for each three-month period.
B. Macedon’s capacity was revised from 213 TJ/day to 201 TJ/day in March 2020.
C. Xyris did not operate between January and September 2020 while the expansion to 20 TJ/day was under construction. Nameplate
capacity was listed on the GBB as 11.5 TJ/day for the 2019-20 financial year and was updated to 20 TJ/day on 16 November 2020.
Figure 11 shows gas production from each facility between October 2019 to October 2020. While there is
seasonal variation in production from each gas production facility, several key trends can be observed:
• Production from the KGP declined steeply between May 2020 and July 2020, due to the end of at least
one GSA.
• Production from Varanus Island and Devil Creek ramped up in July and August 2020 respectively, likely as
a result of GSAs commencing (for example, the GSA between Santos and Alcoa to supply 120 TJ/day from
77 Dongara has not operated since Q3 2017 and has therefore been excluded.
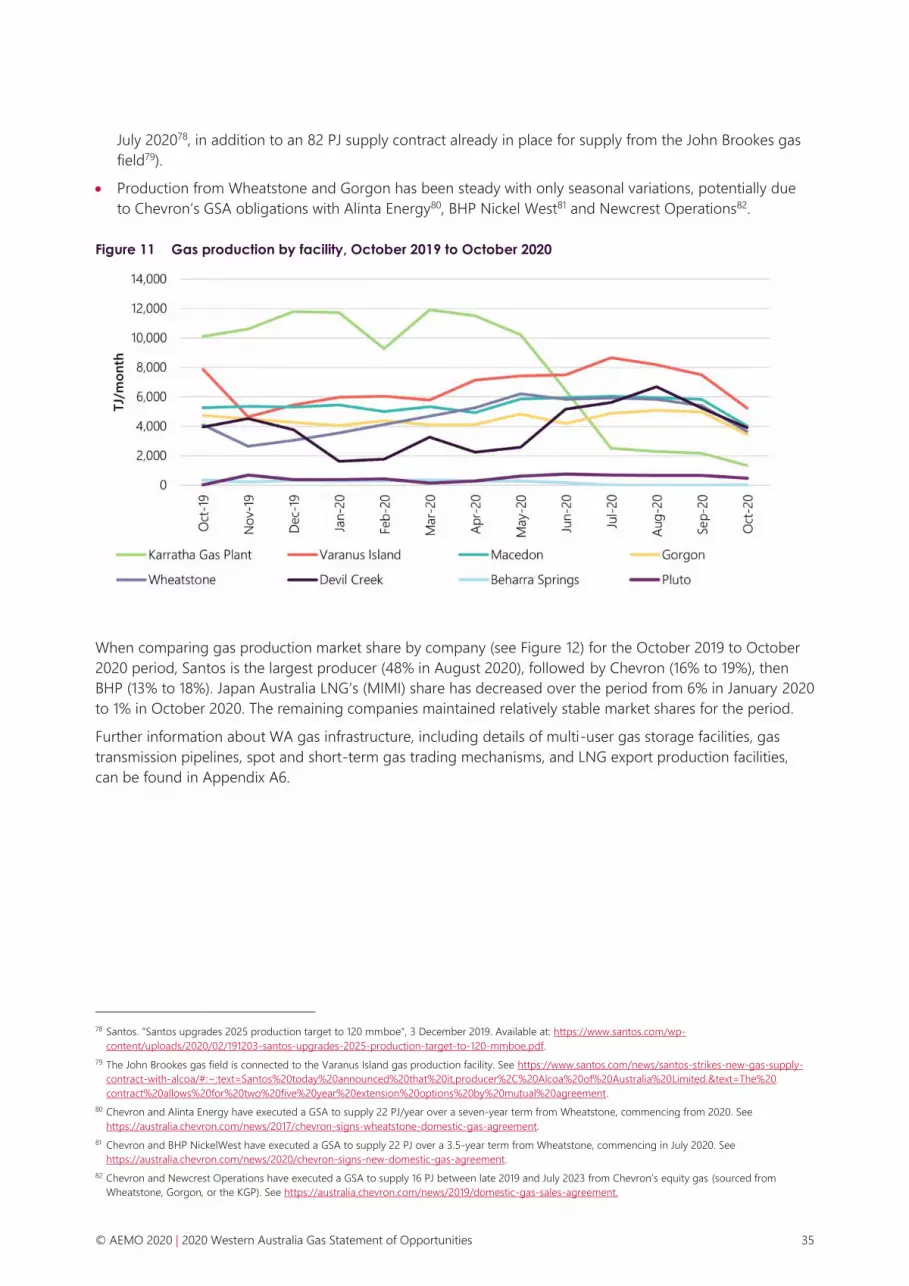
© AEMO 2020 | 2020 Western Australia Gas Statement of Opportunities 35
July 202078, in addition to an 82 PJ supply contract already in place for supply from the John Brookes gas
field79).
• Production from Wheatstone and Gorgon has been steady with only seasonal variations, potentially due
to Chevron’s GSA obligations with Alinta Energy80, BHP Nickel West81 and Newcrest Operations82.
Figure 11 Gas production by facility, October 2019 to October 2020
When comparing gas production market share by company (see Figure 12) for the October 2019 to October
2020 period, Santos is the largest producer (48% in August 2020), followed by Chevron (16% to 19%), then
BHP (13% to 18%). Japan Australia LNG’s (MIMI) share has decreased over the period from 6% in January 2020
to 1% in October 2020. The remaining companies maintained relatively stable market shares for the period.
Further information about WA gas infrastructure, including details of multi-user gas storage facilities, gas
transmission pipelines, spot and short-term gas trading mechanisms, and LNG export production facilities,
can be found in Appendix A6.
78 Santos. “Santos upgrades 2025 production target to 120 mmboe”, 3 December 2019. Available at: https://www.santos.com/wp-
content/uploads/2020/02/191203-santos-upgrades-2025-production-target-to-120-mmboe.pdf.
79 The John Brookes gas field is connected to the Varanus Island gas production facility. See https://www.santos.com/news/santos-strikes-new-gas-supply-
contract-with-alcoa/#:~:text=Santos%20today%20announced%20that%20it,producer%2C%20Alcoa%20of%20Australia%20Limited.&text=The%20
contract%20allows%20for%20two%20five%20year%20extension%20options%20by%20mutual%20agreement.
80 Chevron and Alinta Energy have executed a GSA to supply 22 PJ/year over a seven-year term from Wheatstone, commencing from 2020. See
https://australia.chevron.com/news/2017/chevron-signs-wheatstone-domestic-gas-agreement.
81 Chevron and BHP NickelWest have executed a GSA to supply 22 PJ over a 3.5-year term from Wheatstone, commencing in July 2020. See
https://australia.chevron.com/news/2020/chevron-signs-new-domestic-gas-agreement.
82 Chevron and Newcrest Operations have executed a GSA to supply 16 PJ between late 2019 and July 2023 from Chevron’s equity gas (sourced from
Wheatstone, Gorgon, or the KGP). See https://australia.chevron.com/news/2019/domestic-gas-sales-agreement.
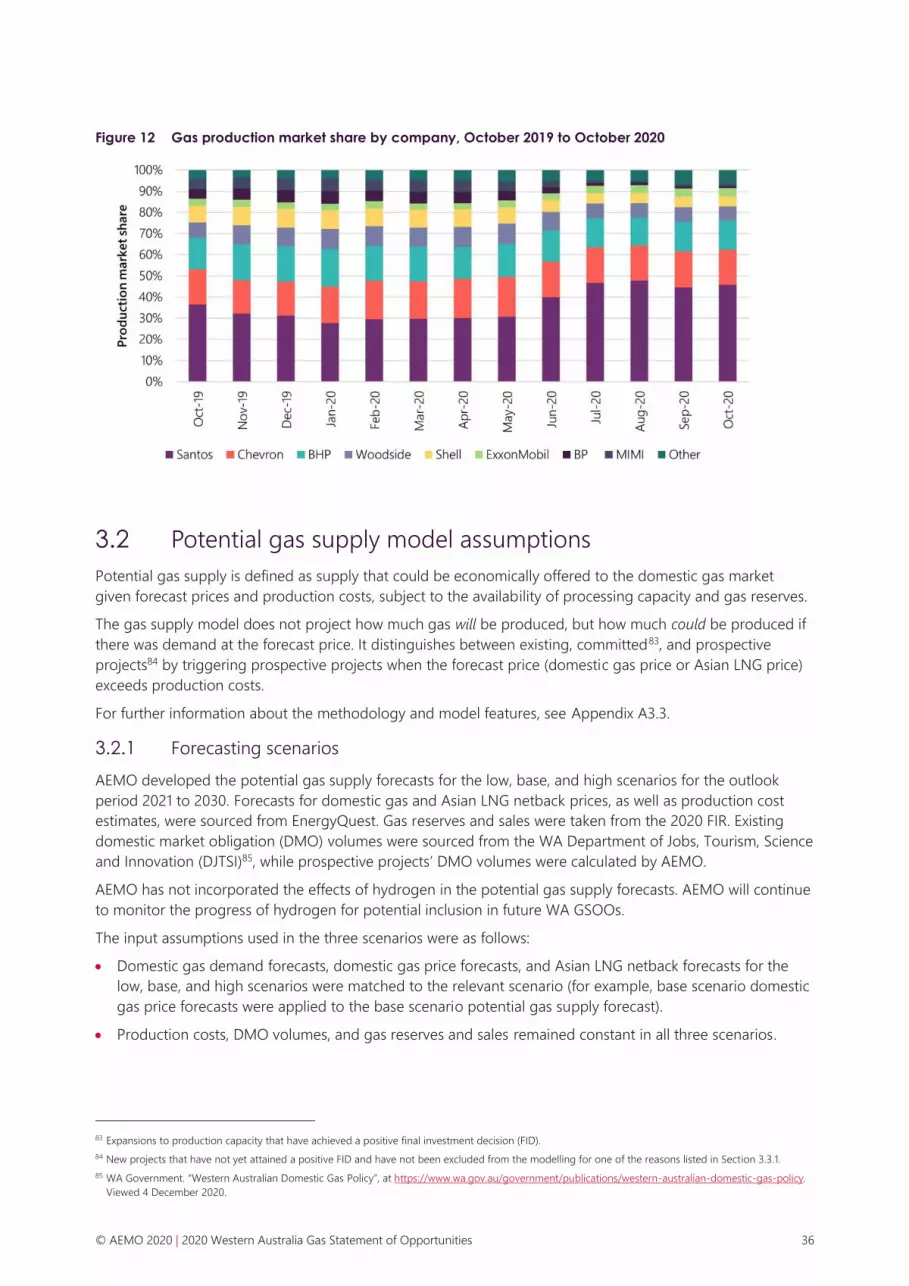
© AEMO 2020 | 2020 Western Australia Gas Statement of Opportunities 36
Figure 12 Gas production market share by company, October 2019 to October 2020
3.2 Potential gas supply model assumptions
Potential gas supply is defined as supply that could be economically offered to the domestic gas market
given forecast prices and production costs, subject to the availability of processing capacity and gas reserves.
The gas supply model does not project how much gas will be produced, but how much could be produced if
there was demand at the forecast price. It distinguishes between existing, committed83, and prospective
projects84 by triggering prospective projects when the forecast price (domestic gas price or Asian LNG price)
exceeds production costs.
For further information about the methodology and model features, see Appendix A3.3.
3.2.1 Forecasting scenarios
AEMO developed the potential gas supply forecasts for the low, base, and high scenarios for the outlook
period 2021 to 2030. Forecasts for domestic gas and Asian LNG netback prices, as well as production cost
estimates, were sourced from EnergyQuest. Gas reserves and sales were taken from the 2020 FIR. Existing
domestic market obligation (DMO) volumes were sourced from the WA Department of Jobs, Tourism, Science
and Innovation (DJTSI)85, while prospective projects’ DMO volumes were calculated by AEMO.
AEMO has not incorporated the effects of hydrogen in the potential gas supply forecasts. AEMO will continue
to monitor the progress of hydrogen for potential inclusion in future WA GSOOs.
The input assumptions used in the three scenarios were as follows:
• Domestic gas demand forecasts, domestic gas price forecasts, and Asian LNG netback forecasts for the
low, base, and high scenarios were matched to the relevant scenario (for example, base scenario domestic
gas price forecasts were applied to the base scenario potential gas supply forecast).
• Production costs, DMO volumes, and gas reserves and sales remained constant in all three scenarios.
83 Expansions to production capacity that have achieved a positive final investment decision (FID).
84 New projects that have not yet attained a positive FID and have not been excluded from the modelling for one of the reasons listed in Section 3.3.1.
85 WA Government. “Western Australian Domestic Gas Policy”, at https://www.wa.gov.au/government/publications/western-australian-domestic-gas-policy.
Viewed 4 December 2020.
© AEMO 2020 | 2020 Western Australia Gas Statement of Opportunities 37
3.2.2 Key modelling assumptions
WA has a Domestic Gas Policy86 that aims to secure the state’s long-term energy needs by ensuring that LNG
export project developers make gas available to the WA domestic market. The policy seeks to reserve the
equivalent of 15% of LNG exports for WA consumers. In August 2020, the WA State Government clarified that
it would not agree to exports of gas through the WA pipeline network, and that supply of gas to the east
coast would be treated as an export for the purposes of the policy87.
The full DMO quantity associated with an LNG-linked supply source is assumed to be available to the
domestic gas market as gas reserves and infrastructure are developed over the outlook period.
In addition, for existing and committed production capacity:
• Beharra Springs (including the Beharra Springs Deep gas field), Devil Creek, Gorgon (tranche one of
182 TJ/day), Macedon, Varanus Island, and Wheatstone were modelled as existing production facilities.
• Modelling assumed maximum potential gas supply from domestic-only gas production facilities is subject
to remaining gas reserves.
• The second tranche from Gorgon (118 TJ/day) was modelled as being available from 2021, taking Gorgon’s
total capacity to 300 TJ/day.
• Pluto was modelled as an existing facility at 40 TJ/day, the sum of the LNG truck-loading facility (15 TJ/day)
and direct pipeline injection capacity (25 TJ/day).
• The KGP is assumed to make supply available at the DMO volume of 90 TJ/day until the end of the
outlook period.
• Xyris was modelled at 20 TJ/day over the entire outlook period, reflecting the expansion that was
commissioned in 2020.
Three prospective supply sources (Scarborough, Waitsia stage 2, and West Erregulla) were identified and
included in the gas supply modelling to determine if they were likely to be developed over the outlook
period. The earliest that each of these prospective sources is expected to be available to supply the market is
based on AEMO’s independent assessment of information from the project proponent and the projected
availability of infrastructure. Section 3.3.2 provides more information about these prospective supply sources.
In addition to the prospective supply projects, three backfill sources for existing gas production facilities were
identified. Section 3.3.3 provides more information about these gas fields.
3.3 Prospective supply sources assessment
3.3.1 Assessment criteria
AEMO’s assessment of prospective supply sources reflects information from external consultants, DJTSI, and
information in the public domain. AEMO used both physical and commercial characteristics when assessing
prospective supply sources, as shown in Table 17.
86 WA Government. “Western Australian Domestic Gas Policy”, at https://www.wa.gov.au/government/publications/western-australian-domestic-gas-policy.
Viewed 4 December 2020.
87 WA Government. “Revised policy to secure domestic gas supply and create jobs”, 17 August 2020. Available at:
https://www.mediastatements.wa.gov.au/Pages/McGowan/2020/08/Revised-policy-to-secure-domestic-gas-supply-and-create-jobs.aspx.

© AEMO 2020 | 2020 Western Australia Gas Statement of Opportunities 38
Table 17 Criteria for assessing prospective supply sources
Physical characteristics Commercial characteristics
• Reserves location
• Water depth
• Reserves volume
• Reservoir characteristics (for example, dry or technically
challenging)
• DMO for sources that are primarily being developed to supply
the global LNG market
• Ownership structure (joint venture or sole owner)
• Proponent or operator experience
• Primary development driver (global LNG market or domestic
gas market)
• Likely development path (for example, tie-back to an existing
facility, or new production facility)
• Estimated development costs based on the likely development
path
• Commercial arrangements (for example, any tolling
requirements)
• Gas sales contracts (for example, offtake option, sale and
purchase agreements)
There are substantial undeveloped gas reserves located in WA that could provide domestic gas in the future,
either through new or existing production facilities.
AEMO assessed 22 candidate new supply sources:
• Of these, 16 were excluded as prospective supply sources or backfill for existing gas production facilities
for at least one of the following reasons:
– Insufficient testing of the field had been completed to evaluate the size and characteristics of the
resource.
– The development timeframe was likely to extend beyond the end of the outlook period.
– Developing the resource was considered to be uneconomic under current and expected near-term
LNG and domestic market conditions.
– The project proponent or operator had not selected a preferred development option.
AEMO will continue to monitor these fields as potential future prospective supply sources.
• The remaining six candidates were identified as either prospective supply sources or backfill for existing
gas production facilities as follows:
– Scarborough, Waitsia stage 2, and West Erregulla as prospective supply sources (see Section 3.3.2 for
more information).
– Beharra Springs Deep, Corvus, and Spartan as backfill (see Section 3.3.3 for more information).
These gas fields were included in the potential gas supply model to determine whether they were likely to be
developed over the outlook period (see Section 3.4 for the potential gas supply forecasts).
3.3.2 Modelled prospective supply sources
Since the 2019 WA GSOO publication:
• Large LNG projects have been delayed due to weak oil prices (and LNG prices), combined with LNG
oversupply, which has been exacerbated by restrictions introduced because of the COVID-19 pandemic
that have dampened LNG demand.
• Other projects have either changed development path or increased in volume.
These changes and the assumptions in the 2020 WA GSOO are summarised in Table 18.
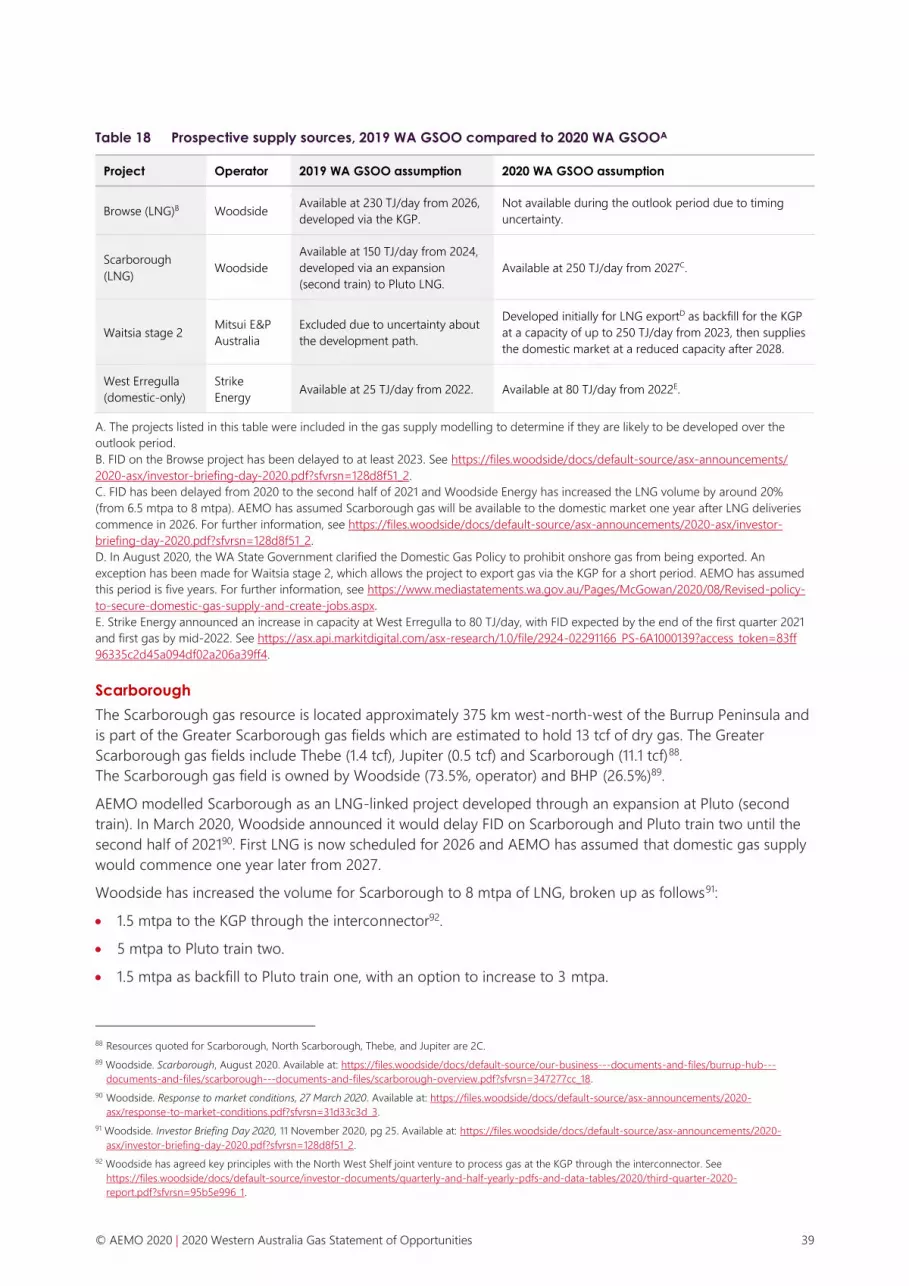
© AEMO 2020 | 2020 Western Australia Gas Statement of Opportunities 39
Table 18 Prospective supply sources, 2019 WA GSOO compared to 2020 WA GSOOA
Project Operator 2019 WA GSOO assumption 2020 WA GSOO assumption
Browse (LNG)B Woodside Available at 230 TJ/day from 2026,
developed via the KGP.
Not available during the outlook period due to timing
uncertainty.
Scarborough
(LNG) Woodside
Available at 150 TJ/day from 2024,
developed via an expansion
(second train) to Pluto LNG.
Available at 250 TJ/day from 2027C.
Waitsia stage 2 Mitsui E&P
Australia
Excluded due to uncertainty about
the development path.
Developed initially for LNG exportD as backfill for the KGP
at a capacity of up to 250 TJ/day from 2023, then supplies
the domestic market at a reduced capacity after 2028.
West Erregulla
(domestic-only)
Strike
Energy Available at 25 TJ/day from 2022. Available at 80 TJ/day from 2022E.
A. The projects listed in this table were included in the gas supply modelling to determine if they are likely to be developed over the
outlook period.
B. FID on the Browse project has been delayed to at least 2023. See https://files.woodside/docs/default-source/asx-announcements/
2020-asx/investor-briefing-day-2020.pdf?sfvrsn=128d8f51_2.
C. FID has been delayed from 2020 to the second half of 2021 and Woodside Energy has increased the LNG volume by around 20%
(from 6.5 mtpa to 8 mtpa). AEMO has assumed Scarborough gas will be available to the domestic market one year after LNG deliveries
commence in 2026. For further information, see https://files.woodside/docs/default-source/asx-announcements/2020-asx/investor-
briefing-day-2020.pdf?sfvrsn=128d8f51_2.
D. In August 2020, the WA State Government clarified the Domestic Gas Policy to prohibit onshore gas from being exported. An
exception has been made for Waitsia stage 2, which allows the project to export gas via the KGP for a short period. AEMO has assumed
this period is five years. For further information, see https://www.mediastatements.wa.gov.au/Pages/McGowan/2020/08/Revised-policy-
to-secure-domestic-gas-supply-and-create-jobs.aspx.
E. Strike Energy announced an increase in capacity at West Erregulla to 80 TJ/day, with FID expected by the end of the first quarter 2021
and first gas by mid-2022. See https://asx.api.markitdigital.com/asx-research/1.0/file/2924-02291166_PS-6A1000139?access_token=83ff
96335c2d45a094df02a206a39ff4.
Scarborough
The Scarborough gas resource is located approximately 375 km west-north-west of the Burrup Peninsula and
is part of the Greater Scarborough gas fields which are estimated to hold 13 tcf of dry gas. The Greater
Scarborough gas fields include Thebe (1.4 tcf), Jupiter (0.5 tcf) and Scarborough (11.1 tcf)88.
The Scarborough gas field is owned by Woodside (73.5%, operator) and BHP (26.5%)89.
AEMO modelled Scarborough as an LNG-linked project developed through an expansion at Pluto (second
train). In March 2020, Woodside announced it would delay FID on Scarborough and Pluto train two until the
second half of 202190. First LNG is now scheduled for 2026 and AEMO has assumed that domestic gas supply
would commence one year later from 2027.
Woodside has increased the volume for Scarborough to 8 mtpa of LNG, broken up as follows91:
• 1.5 mtpa to the KGP through the interconnector92.
• 5 mtpa to Pluto train two.
• 1.5 mtpa as backfill to Pluto train one, with an option to increase to 3 mtpa.
88 Resources quoted for Scarborough, North Scarborough, Thebe, and Jupiter are 2C.
89 Woodside. Scarborough, August 2020. Available at: https://files.woodside/docs/default-source/our-business---documents-and-files/burrup-hub---
documents-and-files/scarborough---documents-and-files/scarborough-overview.pdf?sfvrsn=347277cc_18.
90 Woodside. Response to market conditions, 27 March 2020. Available at: https://files.woodside/docs/default-source/asx-announcements/2020-
asx/response-to-market-conditions.pdf?sfvrsn=31d33c3d_3.
91 Woodside. Investor Briefing Day 2020, 11 November 2020, pg 25. Available at: https://files.woodside/docs/default-source/asx-announcements/2020-
asx/investor-briefing-day-2020.pdf?sfvrsn=128d8f51_2.
92 Woodside has agreed key principles with the North West Shelf joint venture to process gas at the KGP through the interconnector. See
https://files.woodside/docs/default-source/investor-documents/quarterly-and-half-yearly-pdfs-and-data-tables/2020/third-quarter-2020-
report.pdf?sfvrsn=95b5e996_1.
© AEMO 2020 | 2020 Western Australia Gas Statement of Opportunities 40
Woodside intends to construct a 250 TJ/day domestic gas production facility as part of the Scarborough
development93.
Waitsia stage 2
The Waitsia gas field is located onshore in the Perth basin, approximately 360 km north of Perth. The field is
owned by Mitsui E&P Australia (50%, operator) and Beach Energy (50%).
The Waitsia field was discovered in 2014 and first production was achieved via the existing Xyris production
facility in 2016. Xyris was expanded from 11.5 TJ/day to 20 TJ/day in 2020. The second stage of the project
involves an expansion of up to 250 TJ/day with FID expected by the end of 2020.
Waitsia stage 2 is exempt from the WA Government’s updated Domestic Gas Policy prohibiting exports of
onshore gas reserves. The exemption allows the project to export gas through the KGP for a short period,
which AEMO has assumed to be five years. Non-binding gas processing term sheets have been executed with
the North West Shelf Joint Venture for export of 1.5 mtpa (around 250 TJ/day) from late 202394.
AEMO has modelled Waitsia stage 2 as an LNG-linked prospective project available from 2023. From 2028,
AEMO assumes that Waitsia ceases exporting through the KGP and supplies the domestic gas market, but at
a reduced capacity. The existing Xyris production facility continues to make 20 TJ/day available to the
domestic gas market throughout the entire outlook period.
West Erregulla
The West Erregulla field was discovered in 2019 and is located onshore in the Perth basin, approximately
230 km north of Perth. The field is owned by Strike Energy (50%, operator) and Warrego Energy (50%).
In October 2020, Strike Energy and Warrego Energy announced they had reached alignment on a
development path for West Erregulla95. Phase one of the project has been increased to 80 TJ/day (previously
25 TJ/day), reflecting gas sales agreements with Alcoa of Australia96 and Cuming Smith British Petroleum and
Farmers Limited (CSBP)97. FID is targeted for the first half of 2021 with first gas expected during 2022.
AEMO has modelled West Erregulla as a domestic-only prospective gas project available from 2022 at
80 TJ/day.
3.3.3 Backfill for existing gas production facilities
In addition to the prospective projects discussed in Section 3.3.2, AEMO modelled three gas fields as backfill
for existing gas production facilities (Beharra Springs Deep, Corvus, and Spartan). AEMO treated Corvus and
Spartan in the same way as prospective domestic-only gas projects by triggering their development if
domestic gas prices exceed the estimated cost of production. Beharra Springs Deep was treated as a
committed project and is not subject to the same test as prospective projects.
While these projects are not expected to increase domestic gas production capacity, they will maintain
potential gas supply from existing production facilities (Beharra Springs Deep – Beharra Springs, Spartan –
Varanus Island, and Corvus – Devil Creek).
93 Woodside. Investor Briefing Day 2020, 11 November 2020, pg 25. Available at: https://files.woodside/docs/default-source/asx-announcements/2020-
asx/investor-briefing-day-2020.pdf?sfvrsn=128d8f51_2.
94 Beach Energy. FY21 First Quarter Activities Report, 23 October 2020. Available at:
https://yourir.info/resources/0c5a441cf54ff229/announcements/bpt.asx/2A1258293/BPT_Quarterly_report_for_the_period_ended_30_September_2020.pdf.
95 Warrego Energy. “Warrego and Strike align for joint development of the West Erregulla gas field”, 8 October 2020. Available at:
http://asx.warregoenergy.com/site/PDF/bcbba6ee-b25c-4bed-a46a-f341f6ac19d0/WarregoandStrikealignforJointDevelopment
96 Warrego Energy and Alcoa have signed a long-term gas sales agreement for 155 PJ of gas from 2024. See http://asx.warregoenergy.com/site/PDF/
842f238a-4ee7-4ce6-95bc-ddbb6ffdd25a/UpdatedWarregoandAlcoaSignLargeScaleLongTermGSA.
97 Strike Energy and CSBP have signed a long-term gas sales agreement for 100 PJ (25 TJ/day) from 2022. See https://asx.api.markitdigital.com/asx-
research/1.0/file/2924-02274277-6A993558?access_token=83ff96335c2d45a094df02a206a39ff4.

© AEMO 2020 | 2020 Western Australia Gas Statement of Opportunities 41
Beharra Springs Deep
The Beharra Springs Deep gas field was discovered in 2019 and is located onshore in the Perth basin,
approximately 360 km north of Perth. The field is owned by Beach Energy (50%, operator) and Mitsui E&P
Australia (50%).
Beach Energy intends to connect the field to the existing Beharra Springs production facility during the first
quarter of 202198. AEMO has modelled Beharra Springs Deep as a committed domestic-only gas project that
increases reserves at the existing Beharra Springs production facility. In the high scenario, AEMO has included
an expansion to Beharra Springs, supported by the connection of the Beharra Springs Deep field.
Corvus
The Corvus gas field is located offshore in the Carnarvon basin, approximately 90 km north-west of Dampier.
The field is 100% owned and operated by Santos.
Santos has identified Corvus as potential backfill for either Devil Creek or Varanus Island99. AEMO has
modelled Corvus as backfill for Devil Creek commencing from 2028.
Spartan
The Spartan gas field is located offshore in the Carnarvon basin, approximately 40 km west of Varanus Island.
The field is 100% owned and operated by Santos.
Santos intends to connect Spartan to the Varanus Island production facility and targets FID in 2021 100. AEMO
has modelled connection of the field to Varanus Island by 2022.
3.4 Potential gas supply forecasts
Depending on the various input assumptions for the low, base, and high scenarios, prospective supply
sources and backfill for existing production facilities are triggered to commence if:
• Forecast WA domestic gas prices exceed the cost of production, for domestic-only gas projects.
• Forecast Asian LNG netback prices exceed the cost of production, for LNG-linked projects. If the project
commences, AEMO assumes that an associated DMO will be offered to the domestic gas market.
AEMO’s potential gas supply forecasts for the three scenarios are shown in Figure 13 and Table 19. Potential
gas supply forecasts in all three scenarios are lower than the total nameplate production capacity expected to
be available over the outlook period.
In summary:
• Volumes are similar in the base and high scenarios between 2021 and 2027, reflecting a similar mix of
production facilities being available during this period.
• The low scenario excludes prospective projects and backfill and therefore shows a situation where only
existing production facilities are available throughout the outlook period.
• Compared to the base scenario, the high scenario includes an additional backfill source and two
prospective projects.
98 Beach Energy, 2020. FY21 First Quarter Activities Report, 23 October 2020. Available at
https://yourir.info/resources/0c5a441cf54ff229/announcements/bpt.asx/2A1258293/BPT_Quarterly_report_for_the_period_ended_30_September_2020.pdf.
99 Santos. “Successful Corvus-2 appraisal well discovers significant offshore resource”, 16 April 2019. Available at: https://www.santos.com/news/successful-
corvus-2-appraisal-well-discovers-significant-offshore-resource/.
100 Santos. Third Quarter Activities Report for period ending 30 September 2020, 22 October 2020. Available at https://www.santos.com/wp-
content/uploads/2020/10/2020_Third_Quarter_Activities_Report-FINAL.pdf.

© AEMO 2020 | 2020 Western Australia Gas Statement of Opportunities 42
Figure 13 Potential gas supply and production capacity forecasts (TJ/day), 2021 to 2030
Table 19 Potential gas supply forecasts (TJ/day), 2021 to 2030
Scenario 2021 2022 2023 2024 2025 2026 2027 2028 2029 2030 5-year
average
growth
pa (%)
10-year
average
growth
pa (%)
Low 1,216 1,169 1,128 1,091 1,058 1,029 1,002 795 777 762 -3.4 -5.1
Base 1,334 1,418 1,372 1,331 1,294 1,260 1,230 1,130 1,085 1,038 -0.8 -2.8
High 1,334 1,418 1,372 1,353 1,316 1,282 1,502 1,613 1,561 1,515 -0.3 1.4
3.5 Comparison of 2019 and 2020 WA GSOO potential gas
supply forecasts
The base scenario potential gas supply forecasts developed for the 2019101 and 2020 WA GSOOs are
compared in Figure 14.
For the 2020 WA GSOO, AEMO updated the:
• List of prospective supply sources (see Section 3.3 for more information about the changes in prospective
project assumptions) and added backfill for existing production facilities (see Section 3.3.3).
• Forecasts for gas reserves and resources, production costs, domestic gas prices and Asian LNG prices.
• Assumptions about reserve depletion rates, based on responses from the 2020 FIR.
These changes (particularly the list of prospective projects) account for the majority of the difference between
the base scenario potential gas supply forecasts in the 2019 and 2020 WA GSOO.
101 The potential gas supply forecasts in the 2019 WA GSOO covered the period 2020 to 2029.
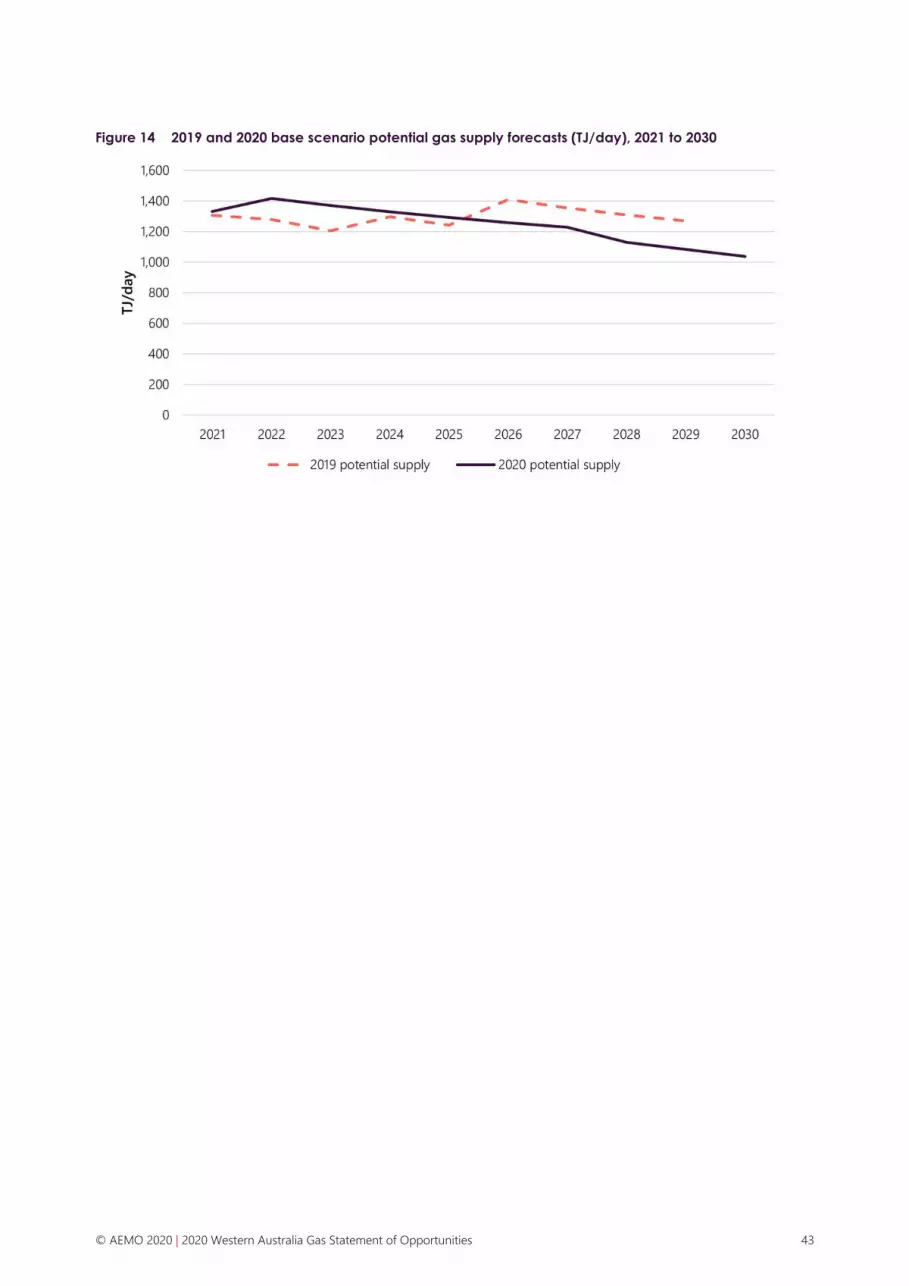
© AEMO 2020 | 2020 Western Australia Gas Statement of Opportunities 43
Figure 14 2019 and 2020 base scenario potential gas supply forecasts (TJ/day), 2021 to 2030
© AEMO 2020 | 2020 Western Australia Gas Statement of Opportunities 44
4. Supply-demand balance
This chapter summarises the gas demand and potential gas supply forecasts discussed in
Chapter 2 and Chapter 3. In the base scenario, the WA domestic gas market is expected to
be well-supplied until 2026, then supply and demand are forecast to be finely balanced
until 2028. A potential supply gap is forecast from 2029 onwards; however, options exist to
address these projected gaps.
4.1 Summary of gas demand and potential gas supply forecasts
4.1.1 Domestic gas demand
Domestic gas demand is forecast to grow at an average annual rate of 0.7% over the outlook period 2021 to
2030, supported by:
• Five committed resources projects that are expected to add approximately 40 TJ/day to gas demand from
2023 in all three scenarios.
• Increased demand for WA’s commodities, particularly gold, partly as a result of investor demand in
response to the COVID-19 pandemic, with the effects expected to continue until 2022.
• The addition of five prospective demand projects in the high scenario totalling 145 TJ/day of gas demand
by 2025.
Gas demand from SWIS GPG is expected to decline at an average rate of 0.4% over the outlook period, after
decreasing by around 41 TJ/day between 2020 and 2021, as a result of more than 500 MW102 of new
large-scale renewable energy that commenced operation in 2020. The combined impact of two new
waste-to-energy generators expected to be operating by 2022103, and declining electricity consumption
forecasts, is projected to continue to reduce SWIS GPG gas demand. These factors are expected to be partly
offset by the staged retirement of the Muja C power station by 2024.
For more information on domestic demand forecasts, see Section 2.2.
4.1.2 Potential gas supply
In the base scenario, potential gas supply is forecast to decline at an average annual rate of 2.8% over the
outlook period.
Large LNG projects, including Woodside’s Browse and Scarborough, have been delayed due to weak oil
prices104, combined with LNG oversupply. Market oversupply has been exacerbated by restrictions introduced
102 Including Yandin wind farm (214 MW), Warradarge wind farm (184 MW), Merredin solar farm (132 MW), and an upgrade to the Greenough River solar
farm (30 MW).
103 The Phoenix Kwinana waste-to-energy (36 MW) and East Rockingham waste-to-energy (28 MW) generators are expected to operate as baseload and
therefore displace SWIS GPG.
104 LNG contract prices are generally linked to oil prices.

© AEMO 2020 | 2020 Western Australia Gas Statement of Opportunities 45
because of the COVID-19 pandemic that have consequently reduced LNG demand105. In contrast to the delays
in LNG projects, domestic-only projects, including backfill for existing production facilities, have progressed
further since the publication of the 2019 WA GSOO.
The potential supply modelling includes the following prospective supply sources and backfill for existing
production facilities:
• Prospective supply – Scarborough, Waitsia stage 2, and West Erregulla.
• Backfill – Beharra Springs Deep, Corvus, and Spartan.
Further information on these prospective supply projects and backfill for existing production facilities can be
found in Section 3.3.
4.2 Supply-demand balance
4.2.1 Base scenario
The WA domestic gas market is expected to be well-supplied in the short to medium term until 2026, with
supply and demand then finely balanced in 2027 and 2028, as shown in Figure 15 and Table 20. A potential
supply gap is forecast in 2029 of around 4% (47 TJ/day), increasing to 9% (97 TJ/day) in 2030.
The 2019 WA GSOO, by comparison, forecast that potential gas supply would be sufficient to meet gas
demand for the 2020 to 2029 outlook period. The factors driving the changed outlook are discussed in
Section 3.5.
Figure 15 Domestic gas market balance, base scenario, 2021 to 2030
105 Office of the Chief Economist – Department of Industry, Science, Energy, and Resources. Resources and Energy Quarterly, September 2020. Available at:
https://publications.industry.gov.au/publications/resourcesandenergyquarterlyseptember2020/documents/Resources-and-Energy-Quarterly-Sept-
2020.pdf.

© AEMO 2020 | 2020 Western Australia Gas Statement of Opportunities 46
Table 20 Potential gas supply and demand forecasts, base scenario (TJ/day), 2021 to 2030
2021 2022 2023 2024 2025 2026 2027 2028 2029 2030 5-year
average
annual
growth
(%)
10-year
average
annual
growth
(%)
Potential
supply 1,334 1,418 1,372 1,331 1,294 1,260 1,230 1,130 1,085 1,038 -0.8 -2.8
Demand 1,068 1,080 1,081 1,099 1,116 1,126 1,128 1,128 1,132 1,135 1.1 0.7
Potential gas demand is forecast to exceed domestic gas supply from 2029. However, options exist to reduce
or eliminate any shortfalls in these outer years of the outlook period, including:
• Excess reserves from 2021 to 2026 at existing production facilities could become available to meet
demand after 2028. Any gas that is not produced between 2021 and 2026 will be available for future
supply.
• Gas could be withdrawn from storage (Mondarra or Tubridgi) at a rate of up to 210 TJ/day, eliminating
short-term supply shortfalls, noting that this will depend on the duration of time for which gas is required
and the initial stored volumes.
• Undeveloped gas fields (for example, Clio-Acme or Equus) may be connected to existing gas production
facilities over the outlook period to meet the projected demand. This would improve supply availability
from existing production facilities that are modelled to decline due to reserve depletion over the outlook
period.
• Additional supply projects that are not currently included in the potential gas supply forecasts may enter
the market. This includes prospective projects that are not triggered in the model because production
costs exceed forecast domestic gas or LNG prices. Improved project economics may result in these
projects being developed over the outlook period.
AEMO notes that there is a large volume of gas reserves that could supply the WA domestic gas market
during the outlook period but are currently too speculative to include as prospective supply in the potential
gas supply forecasts. AEMO will continue to monitor these projects for potential inclusion in future WA
GSOOs.
4.2.2 High and low scenarios
Low scenario
The low scenario includes only existing gas supply sources and therefore represents a conservative forecast.
Potential gas supply is forecast to decline at an average annual rate of 5.1% between 2021 and 2030, in line
with reserve depletion at existing production facilities. As a result, for the low scenario a potential supply gap
would persist from 2025 until the end of the outlook period, as shown in Table 21.

© AEMO 2020 | 2020 Western Australia Gas Statement of Opportunities 47
Table 21 Potential gas supply and demand forecasts, low scenario (TJ/day), 2021 to 2030
2021 2022 2023 2024 2025 2026 2027 2028 2029 2030 5-year
average
annual
growth
(%)
10-year
average
annual
growth
(%)
Potential
supply 1,216 1,169 1,128 1,091 1,058 1,029 1,002 795 777 762 -3.4 -5.1
Demand 1,035 1,048 1,046 1,051 1,061 1,065 1,061 1,054 1,053 1,048 0.6 0.1
High scenario
The high scenario potential gas supply forecasts include additional prospective supply sources and backfill for
existing production facilities compared to the base scenario (see Section 3.4 for further information). The
variance in supply between the base and high scenarios increases over the outlook period, from 22 TJ/day in
2024 to 483 TJ/day in 2028.
Gas demand is forecast to marginally exceed potential gas supply between 2025 and 2026, as shown in
Figure 16 and Table 22. This gap could be alleviated by the options listed in Section 4.2.1. However, if
prospective demand is excluded from the gas demand forecasts, potential gas supply is sufficient to meet
forecast gas demand over the entire outlook period.
Figure 16 Potential gas supply compared to gas demand, high scenario, 2021 to 2030
Table 22 Potential gas supply and demand forecasts, high scenario (TJ/day), 2021 to 2030
2021 2022 2023 2024 2025 2026 2027 2028 2029 2030 5-year
average
annual
growth
(%)
10-year
average
annual
growth
(%)
Potential
supply 1,334 1,418 1,372 1,353 1,316 1,282 1,502 1,613 1,561 1,515 -0.3 1.4
Demand 1,127 1,154 1,159 1,243 1,330 1,346 1,354 1,358 1,367 1,374 4.2 2.2

© AEMO 2020 | 2020 Western Australia Gas Statement of Opportunities 48
5. 2020 formal information request data analysis
This chapter presents aggregate data submitted by Gas Market Participants (GMPs) and
non-GSI participants through the 2020 FIR process, as well as a comparison with data
previously received for the 2018 and 2019 WA GSOOs.
Consumer expected demand captured in the FIR increased again in 2020, while prospective
demand remained largely unchanged. Similarly, contracted volumes reported by suppliers
increased slightly for 2021 and 2022.
In line with the GSI Rules, AEMO has conducted a confidential FIR process annually since 2017 to collect data
and information from GMPs106 for the purposes of the WA GSOO. GMPs are required to respond in line with
the provisions under the GSI Rules107, while some non-GSI participants provide information voluntarily. For
demand, this data covers more than 90%108 of WA’s average daily gas consumption.
AEMO has used the FIR data as an input into developing the gas demand and potential supply forecasts for
this 2020 WA GSOO.
The data presented in this chapter includes:
• Gas demand and supply estimates.
• Contracted volumes.
• Gas reserves.
• Domestic gas prices that may cause gas consumers to reduce or increase gas demand.
Data has been presented in aggregate form. To protect confidentiality of individual respondents, other
information109 submitted in the FIR process has not been presented.
Similar to last year, AEMO received a strong response from GMPs to the FIR in 2020, with a modest
improvement over the prior year bringing the response rate up to 92%, as shown in Table 23.
AEMO has taken all due care to reconcile the information received but accepts no liability for any errors it
may contain. The data reported is from the 2020 FIR process, unless otherwise specified. All data presented is
the latest available as at August 2020 and should be considered indicative only. It is important to note the
data does not represent AEMO forecasts.
106 Under GSI Rule 106, AEMO may require GMPs to provide information for the WA GSOO. This does not cover all participants in the WA domestic gas
market.
107 Under GSI Rule 21, GMPs include Registered Facility Operators and Registered Shippers, although some exemptions are available. For example, some
facilities that consume gas are not responsible for the shipping of this gas and are thus not required to be registered. The GSI Register for GMPs and
facilities is maintained and updated regularly by AEMO. Both are available at: https://www.aemo.com.au/Gas/WA-Gas-Services-Information/GSI-
participant-information/GSI-register.
108 Including GPGs but excluding facilities that are not required to be registered as GMPs (such as small commercial gas users).
109 Other information collected through the 2020 FIR, but not reported, includes future and prospective supply or gas-consuming facility names, their
capacities and development status, and consumption by pipeline and storage facilities.

© AEMO 2020 | 2020 Western Australia Gas Statement of Opportunities 49
Table 23 2019 and 2020 FIR response rate overview
2019 2020
Participants Response rate Number of requests issued Number of responses received Response rate
Gas Market Participants 90% 51 47 92%
Non-Gas Market Participants 67% 9 6 67%
Total 87% 60 53 88%
Source: GMPs and some non-GSI participants.
5.1 Gas demand and supply data
For the 10-year outlook period 2021 to 2030, AEMO asked GMPs110 to provide the following data on a
facility basis:
• For gas consumers – total expected and maximum contracted gas demand estimates.
• For gas production facility operators and their joint venture partners – total firm supply capacity and
maximum contracted gas supply estimates.
The sections below provide comparisons between these measures to give indicative insights on the WA gas
market over the next 10 years.
5.1.1 Total expected and maximum contracted gas demand
Figure 17 presents the expected demand111 and maximum contracted quantities (MCQ) submitted by gas
consumers through the 2020 FIR.
Figure 17 Consumer expected gas demand compared to contracted levels (MCQ), 2021 to 2030
Source: GMPs.
110 All non-GSI submissions were from gas suppliers. The FIR excluded multiple entities which report for the same facility, facilities no longer operating but
not de-registered, and retailers (to avoid double-counting).
111 Expected gas demand includes GPGs and committed projects that have attained FID and are expected to commence within the outlook period.

© AEMO 2020 | 2020 Western Australia Gas Statement of Opportunities 50
Expected consumer demand commentary
Based on consumers’ self-reported expectations, gas demand is projected to peak in 2022 (up 11.8% from
2020) with increased demand largely driven by the mining sector, minerals processing, and GPG. This increase
is offset by an expected softening in demand from GPG. Demand is expected to remain stable from 2024
onwards.
Consumer MCQ commentary
As highlighted in prior WA GSOOs, consumers do not typically contract in full for the following 10 years.
This is illustrated by the MCQ being lower than the expected demand in Figure 17, with a step change
downwards in contracting levels in 2024. The drop in MCQ in 2024 is due to several sizable consumers’
contracts expiring.
Further investigation indicated that it was not uncommon for consumers (38% of the surveyed consumers) to
strike long-term contracts with suppliers exceeding five years, as shown in Figure 18. However, the majority of
these long-term contracts were for diminishing volumes over time, with the final year of the contract ranging
between 60-70% of the 2021 quantities.
Figure 18 Consumer contract duration
5.1.2 Total firm gas supply capacity and maximum contracted gas supply
Domestic gas production facility operators and joint venture partners submitted projections of MCQ for their
facilities and individual corporate entities. GBB nameplate capacity closely matches the total firm gas supply
capacity submitted during the 2020 FIR process. Firm supply represents the supply capacity of gas production
facilities that respondents expect to make available to the domestic gas market each year over the outlook
period.
The GBB nameplate capacity exceeds the expected demand from consumers by more than 700 TJ/day across
the 10-year period, as shown in Figure 19. Most customers are not fully contracted until 2030.
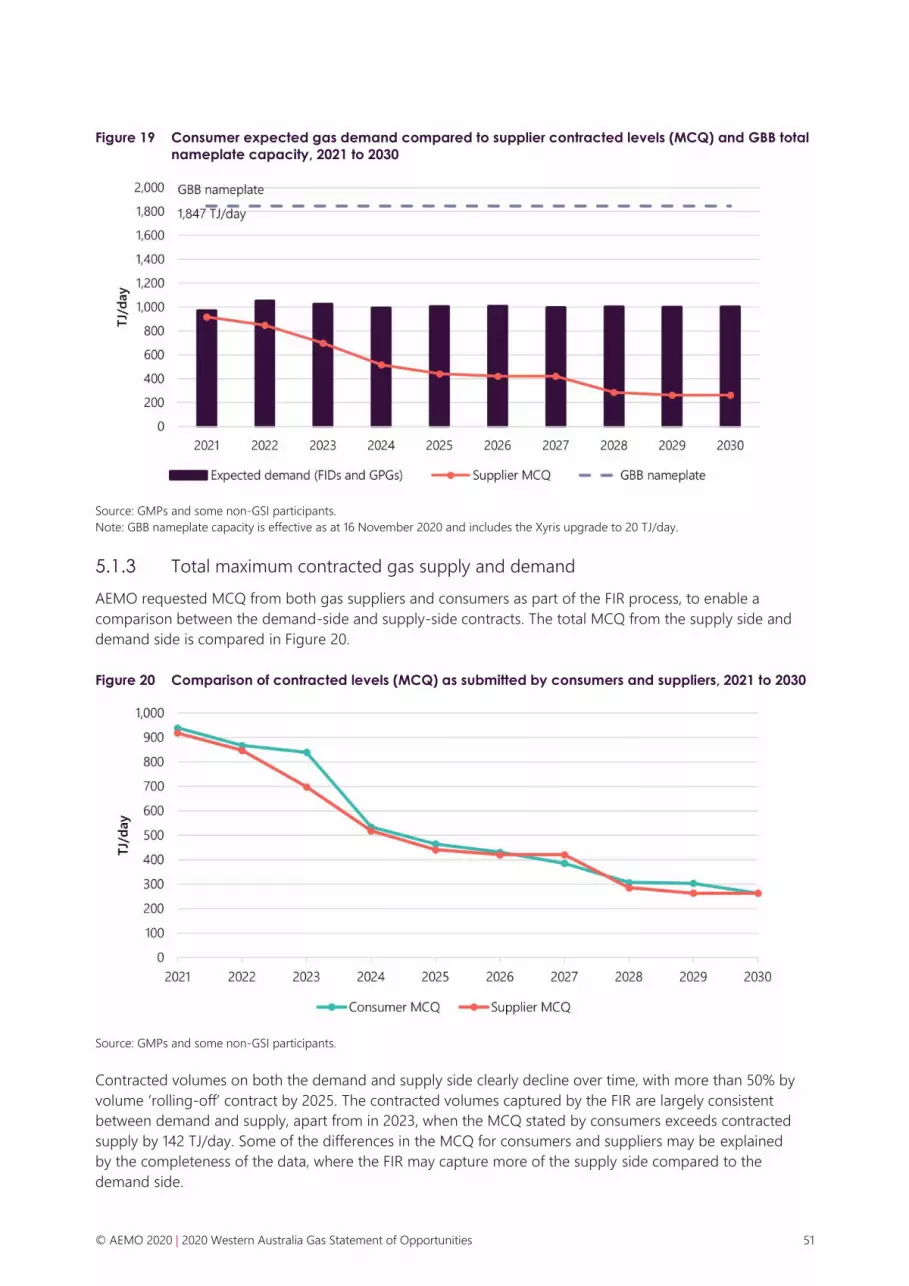
© AEMO 2020 | 2020 Western Australia Gas Statement of Opportunities 51
Figure 19 Consumer expected gas demand compared to supplier contracted levels (MCQ) and GBB total
nameplate capacity, 2021 to 2030
Source: GMPs and some non-GSI participants.
Note: GBB nameplate capacity is effective as at 16 November 2020 and includes the Xyris upgrade to 20 TJ/day.
5.1.3 Total maximum contracted gas supply and demand
AEMO requested MCQ from both gas suppliers and consumers as part of the FIR process, to enable a
comparison between the demand-side and supply-side contracts. The total MCQ from the supply side and
demand side is compared in Figure 20.
Figure 20 Comparison of contracted levels (MCQ) as submitted by consumers and suppliers, 2021 to 2030
Source: GMPs and some non-GSI participants.
Contracted volumes on both the demand and supply side clearly decline over time, with more than 50% by
volume ‘rolling-off’ contract by 2025. The contracted volumes captured by the FIR are largely consistent
between demand and supply, apart from in 2023, when the MCQ stated by consumers exceeds contracted
supply by 142 TJ/day. Some of the differences in the MCQ for consumers and suppliers may be explained
by the completeness of the data, where the FIR may capture more of the supply side compared to the
demand side.
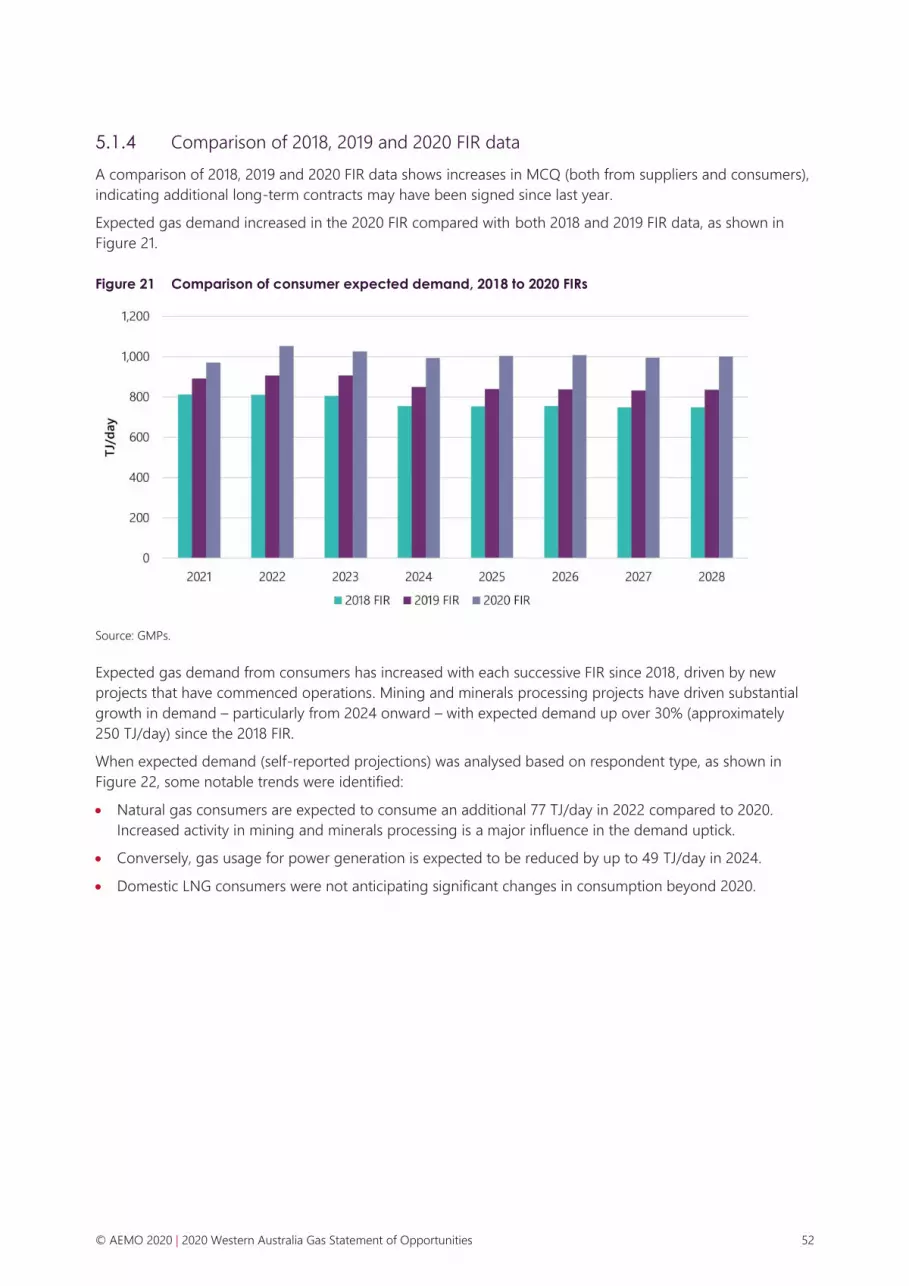
© AEMO 2020 | 2020 Western Australia Gas Statement of Opportunities 52
5.1.4 Comparison of 2018, 2019 and 2020 FIR data
A comparison of 2018, 2019 and 2020 FIR data shows increases in MCQ (both from suppliers and consumers),
indicating additional long-term contracts may have been signed since last year.
Expected gas demand increased in the 2020 FIR compared with both 2018 and 2019 FIR data, as shown in
Figure 21.
Figure 21 Comparison of consumer expected demand, 2018 to 2020 FIRs
Source: GMPs.
Expected gas demand from consumers has increased with each successive FIR since 2018, driven by new
projects that have commenced operations. Mining and minerals processing projects have driven substantial
growth in demand – particularly from 2024 onward – with expected demand up over 30% (approximately
250 TJ/day) since the 2018 FIR.
When expected demand (self-reported projections) was analysed based on respondent type, as shown in
Figure 22, some notable trends were identified:
• Natural gas consumers are expected to consume an additional 77 TJ/day in 2022 compared to 2020.
Increased activity in mining and minerals processing is a major influence in the demand uptick.
• Conversely, gas usage for power generation is expected to be reduced by up to 49 TJ/day in 2024.
• Domestic LNG consumers were not anticipating significant changes in consumption beyond 2020.

© AEMO 2020 | 2020 Western Australia Gas Statement of Opportunities 53
Figure 22 Change in expected demand relative to 2020
Source: GMPs.
From a contracted supply perspective, MCQ has increased in each successive GSOO publication for 2021 and
2022, as shown in Figure 23. This is due to consumers renewing existing contracts and establishing new
contracts to cover their growth in expected demand.
From 2024 onwards, the stated MCQ reduces by between 50 TJ/day and 100 TJ/day. AEMO has been unable
to determine any underlying reason for revised submissions from respondents since the 2019 FIR.
Figure 23 Comparison of supplier contracted levels (MCQ), 2018 to 2020 FIRs
Source: GMPs and some non-GSI participants.
5.1.5 Prospective demand
The 2020 FIR data indicates that the total firm supply capacity is expected to exceed gas demand over the
entire outlook period, even when accounting for prospective demand112.
112 GMPs provided estimates of incremental prospective demand, which included diesel-to-gas fuel switch projects, as well as new or expanded gas-
consuming facilities. Projects were classified according to development stage – FID, environmental approval, internal approval, or speculative.

© AEMO 2020 | 2020 Western Australia Gas Statement of Opportunities 54
Prospective demand from projects likely to be initiated remains relatively constant from 2022 onwards, at
12 TJ/day. There was a small reduction in the estimated consumption from prospective projects (expected to
proceed within the next five years), when compared to the 2019 FIR as shown in Figure 24.
Figure 24 Comparison of prospective demand, 2019 and 2020 FIR
Source: GMPs and some non-GSI participants.
In 2021, the sum of expected and prospective demand is 972 TJ/day, which would utilise approximately 53%
of the GBB nameplate capacity. Utilisation is expected to be maintained at similar levels throughout the
outlook period.
5.2 Reserves
Domestic gas production facility operators and joint venture partners reported the volumes of 2P gas
reserves113 associated with all their WA petroleum production licences, as well as 2P gas reserves that are
physically connected to each existing domestic gas production facility. This data is an input into AEMO’s
potential gas supply model.
The 2P gas reserves connected to domestic gas production facilities are compared with the figures collected
in previous FIRs in Table 24114.
Connected 2P reserves (developed and undeveloped) have increased relative to the 2019 WA GSOO
estimates by 4,206 PJ (9.8%), reflecting an upwards revision of some participants’ estimated reserves.
Table 24 Total 2P gas reserves from 2017 through 2020 FIRs (PJ)
Gas reserves and resources 2017 2018 2019 2020
Total 2P reserves connected to domestic
gas production facilities 35,159 47,886 43,131 47,337
Source: GMPs and some non-GSI participants.
113 Reserves are quantities of gas that are anticipated to be commercially recoverable from known accumulations. Proved and probable reserves (2P) are
considered the best estimate of commercially recoverable reserves. Contingent resources (2C) were not collected for the 2020 FIR, since they are less
commercially viable than reserves.
114 Volumes reported at standard conditions (60°C and 1 atmosphere [101.325 kPa] pressure).
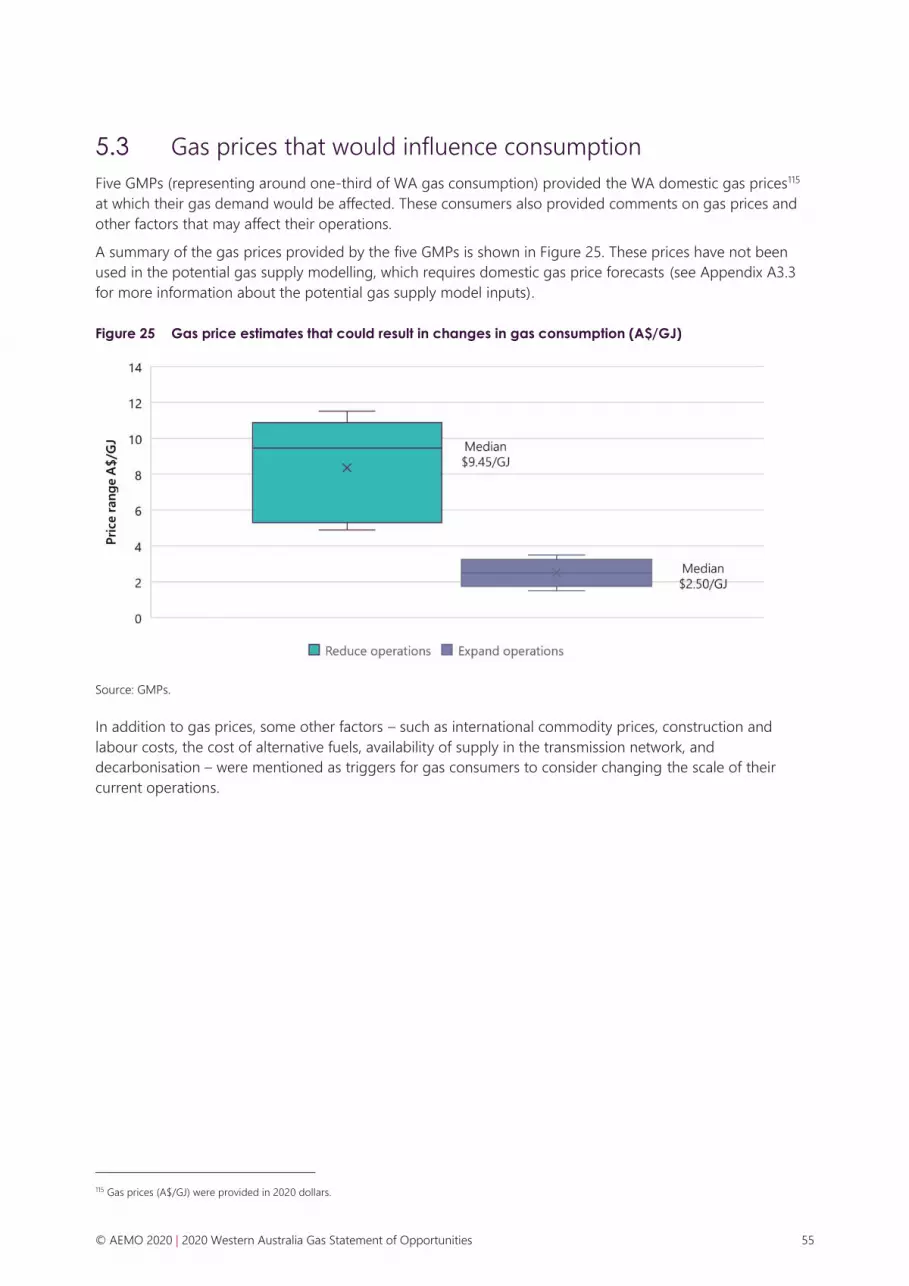
© AEMO 2020 | 2020 Western Australia Gas Statement of Opportunities 55
5.3 Gas prices that would influence consumption
Five GMPs (representing around one-third of WA gas consumption) provided the WA domestic gas prices115
at which their gas demand would be affected. These consumers also provided comments on gas prices and
other factors that may affect their operations.
A summary of the gas prices provided by the five GMPs is shown in Figure 25. These prices have not been
used in the potential gas supply modelling, which requires domestic gas price forecasts (see Appendix A3.3
for more information about the potential gas supply model inputs).
Figure 25 Gas price estimates that could result in changes in gas consumption (A$/GJ)
Source: GMPs.
In addition to gas prices, some other factors – such as international commodity prices, construction and
labour costs, the cost of alternative fuels, availability of supply in the transmission network, and
decarbonisation – were mentioned as triggers for gas consumers to consider changing the scale of their
current operations.
115 Gas prices (A$/GJ) were provided in 2020 dollars.
© AEMO 2020 | 2020 Western Australia Gas Statement of Opportunities 56
6. Implications of government and industry initiatives
This chapter highlights activities and initiatives that may affect gas supply and/or demand
in WA.
6.1 Government initiatives and regulation
WA’s Domestic Gas Policy and national gas reservation
The WA Government has strengthened the state’s domestic gas policy to ensure security of supply for
Western Australians116. The WA Domestic Gas Policy secures the State's long-term energy needs and ongoing
economic development by ensuring that LNG export project developers also make gas equivalent to 15% of
exports available to the domestic market. Under the updated policy, local WA gas cannot be exported to the
eastern states or overseas, and gas used to power ships will not be considered domestic gas.
The Australian Government published a gas reservation issues paper in October 2020117, and is examining
whether Australia should reserve gas solely for domestic use. Reservation would involve diverting gas to the
Australian market that may otherwise be exported.
Access arrangements for the Dampier to Bunbury Natural Gas Pipeline (DBNGP)
On 2 January 2020, DBNGP (WA) Transmission Pty Ltd (DBP) submitted proposed revisions to the access
arrangement (AA5) for DBNGP for the period from 1 January 2021 to 31 December 2025118. The revisions
included demand forecasts, revenue and tariffs. DBP’s proposed net tariff for AA5 increased by 9.9% in real
terms relative to AA4.
The ERA did not approve DBP’s proposal in its draft decision published on 14 August 2020 and requested 53
amendments including reducing reference tariffs to align with the ERA’s calculation of total revenue and
allocation of revenue to reference services.
On 7 October 2020, DBP submitted a revised proposal on revisions to the access arrangement for the
DBNGP. Seven submissions were received in response to the draft decision. Since then, DBP has proposed a
new pipeline ullage service and the ERA will publish the final decision in 2021.
116 WA Government. “Revised policy to secure domestic gas supply and create jobs”, 17 August 2020. Available at:
https://www.mediastatements.wa.gov.au/Pages/McGowan/2020/08/Revised-policy-to-secure-domestic-gas-supply-and-create-jobs.aspx.
117 Australian Government. “Options for a proposed national gas reservation scheme: issues paper.” Available at: https://consult.industry.gov.au/onshore-
minerals/gas-options/. Viewed 30 October 2020.
118 ERA. “Access Arrangement for period 2021-2025”. Available at: https://www.erawa.com.au/gas/gas-access/dampier-to-bunbury-natural-gas-
pipeline/access-arrangements/access-arrangement-for-period-2021-2025. Viewed 30 October 2020.

© AEMO 2020 | 2020 Western Australia Gas Statement of Opportunities 57
6.2 Industry initiatives
Mid-West LNG Hub
CEFA has secured a long-term site lease for a plant near the town of Mount Magnet, which will form part of
the Mid-West LNG Hub119. The hub will supply LNG as a lower-emission fuel to generate electricity for mines
and communities across the region, many of whom still rely on diesel-fired electricity generation to meet their
energy needs.
Mt Holland lithium project
The Covalent Lithium Mount Holland120 project FID has been pushed out to Q1 2021, so further work can be
conducted to optimise project design and ensure product specifications are aligned with continued changes
in battery chemistry. The project is expected to deliver approximately 45,000 tonnes of battery quality lithium
hydroxide per year once completed121.
Perdaman urea project in the Pilbara
The Perdaman Urea project122 has received conditional WA Government support to develop common-user
infrastructure in the Burrup Peninsula to facilitate a major gas manufacturing project in the Pilbara. The
project proposes a new manufacturing plant in the Burrup Strategic Industrial Area that would transform
natural gas into urea. The project is helping to underpin development of the Scarborough gas field, with a
gas supply agreement in place between Woodside and Perdaman.
The project also supports the State's Renewable Hydrogen Strategy by establishing an ammonia-based
industry in the Pilbara and expanding access to water by developing extra capacity on the existing water
infrastructure in the Burrup Peninsula, a critical input for the production of renewable hydrogen.
6.3 Hydrogen
Hydrogen Strategy
The WA State Government has announced that, as part of the WA Recovery Plan123, it will bring forward the
WA Renewable Hydrogen Strategy targets from 2040 to 2030 and invest $22 million to develop hydrogen
supply. The accelerated targets, nine studies, and projects are aimed at meeting growing demand for
hydrogen, creating jobs, boosting the state's renewable hydrogen industry, and positioning WA as a major
producer, user and exporter of renewable hydrogen.
German Hydrogen Agreement
The WA State Government has signed an agreement between the Australian and German governments to
deliver a Hydrogen Supply Chain Feasibility Study with a focus on renewable hydrogen124. The study will
investigate the Australian-German supply chain and opportunities for renewable hydrogen exports, and
complement work underway in WA to drive a hydrogen export industry.
119 CEFA. “Plans for Mid-West LNG Hub at Mount Magnet to boost industry and remote communities,” September 2020. Available at:
https://www.cefa.com.au/mid-west-lng-hub-mount-magnet/.
120 Wesfarmers. “Mt Holland Lithium Project update”, 23 January 2020. Available at: https://www.wesfarmers.com.au/docs/default-source/asx-
announcements/mt-holland-lithium-project-update.pdf?sfvrsn=0.
121 Covalent Lithium. “Our project”. Available at: https://www.covalentlithium.com/our-project. Viewed 30 October 2020.
122 WA Government. “Conditional support for job-creating gas manufacturing project”, 18 August 2020. Available at:
https://www.mediastatements.wa.gov.au/Pages/McGowan/2020/08/Conditional-support-for-job-creating-gas-manufacturing-project.aspx.
123 The WA Recovery Plan is the recovery vision for WA in the wake of the COVID-19 pandemic; see https://www.wa.gov.au/government/publications/wa-
recovery-plan.
124 WA Government. “German hydrogen agreement welcomed”, 11 September 2020. Available at:
https://www.mediastatements.wa.gov.au/Pages/McGowan/2020/09/German-hydrogen-agreement-welcomed.aspx.
© AEMO 2020 | 2020 Western Australia Gas Statement of Opportunities 58
Hydrogen demonstration project for Denham
Horizon Power is supporting the WA Government’s Renewable Hydrogen Strategy by investigating the
possibility of using hydrogen as a future source of energy for the town of Denham125. A solar farm will
generate electricity which will power an electrolyser. The electrolyser splits water into hydrogen and oxygen.
The hydrogen will be stored and used in a fuel cell to generate electricity for Denham customers.
Horizon Power has sought expressions of interest for the design, supply and install of the hydrogen with FID
expected by February 2021.
Murchison Renewable Hydrogen Project
Plans for the Murchison Renewable Hydrogen Project, located close to Kalbarri, include 5 gigawatts (GW) of
solar and wind generation to be used in the production and export of emission free hydrogen. The company
proposing the project, Hydrogen Renewables Australia (HRA), has entered into a Heritage Agreement with
the local Nanda Aboriginal Corporation (NAC), which has given formal support for the Section 91 Licence
needed to allow resource monitoring processes to proceed. HRA and NAC have commenced the
development of an Indigenous Land Use Agreement that is planned to be finalised during 2020126.
Low emission hydrogen and graphite from biogas and LNG
The Hazer Group Ltd and Mineral Resources Limited are commissioning a pilot plant that can produce
low-emission hydrogen and graphite from biogas and LNG127. The pilot plant in the Kwinana industrial area
will convert natural gas and similar feedstock into hydrogen and high-quality graphite, using iron ore as a
catalyst. Practical completion and commencement of operations is expected by mid-2021128.
Project Geraldton Export-Scale Renewable Investment Feasibility Study
BP has commenced a feasibility study for a renewable hydrogen and ammonia production facility near
Geraldton129. The potential pilot plant will look to produce green hydrogen, using onsite and/or grid-sourced
renewable power, which will then be converted into around 20 kilotonnes per annum (ktpa) of green
ammonia. Once developed to commercial scale, this is expected to increase to around 1,000 ktpa of green
ammonia, targeted at domestic and export markets.
Hydrogen vehicle refuelling infrastructure
Fortescue Metals Group and ATCO Australia have signed an agreement to build and operate a combined
hydrogen production and refuelling facility in the Perth metropolitan area, with the possibility of wider
deployment across the state130.
125 Horizon Power. “Denham to demonstrate hydrogen power,” 15 January 2020. Available at: https://www.horizonpower.com.au/our-community/news-
events/news/denham-to-demonstrate-hydrogen-power/.
126 Energy Source and Distribution. “New Murchison Renewable Hydrogen Project announced for WA”, 10 October 2019. Available at:
https://esdnews.com.au/new-murchison-renewable-hydrogen-project-announced-for-wa/.
127 WA Government. “Green light for world-leading renewable hydrogen from wastewater project”, 26 May 2020. Available at:
https://www.mediastatements.wa.gov.au/Pages/McGowan/2020/05/Green-light-for-world-leading-renewable-hydrogen-from-wastewater-project.aspx.
128 Hazer Group. “Commercial demonstration project investor presentation”, 7 August 2020. Available at:
https://www.asx.com.au/asxpdf/20200807/pdf/44l95chhyhw8l6.pdf.
129 ARENA. “Project GERI Feasibility Study”, at https://arena.gov.au/projects/project-geri-feasibility-study/. Viewed 30 October 2020.
130 FMG. “Fortescue and ATCO power on with hydrogen agreement”, 6 April 2020. Available at: https://www.fmgl.com.au/in-the-news/media-
releases/2020/04/06/fortescue-and-atco-power-on-with-hydrogen-agreement.

© AEMO 2020 | 2020 Western Australia Gas Statement of Opportunities 59
A1. References for year in review
Supply
Beach Energy Limited. Annual Report 2020. Available at: https://www.beachenergy.com.au/wp-
content/uploads/2020/08/BPT_2020_Beach_Energy_Ltd_Annual_Report.pdf.
Beach Energy Limited. FY21 First Quarter Activities Report, 23 October 2020. Available at:
https://yourir.info/resources/0c5a441cf54ff229/announcements/bpt.asx/2A1258293/BPT_Quarterly_report_for
_the_period_ended_30_September_2020.pdf.
BP Australia. “Ironbark: acreage WA-359-P”. Available at: https://www.bp.com/en_au/australia/home/who-
we-are/exploring.html. Viewed 18 November 2020.
Chevron Australia. “Chevron signs domestic gas sale agreement”, 13 December 2019. Available at:
https://australia.chevron.com/news/2019/domestic-gas-sales-agreement.
Chevron Australia. “Chevron signs new domestic gas sale agreement”, 23 June 2020. Available at:
https://australia.chevron.com/news/2020/chevron-signs-new-domestic-gas-agreement.
Chevron Australia. “Chevron expands delivery of domestic gas to Alcoa”, 28 September 2020. Available at:
https://australia.chevron.com/news/2020/chevron-expands-delivery-of-domestic-gas-to-alcoa.
EPA. “EP371 Laurel Gas Exploration and Appraisal Program”, 31 August 2020. Available at:
https://www.epa.wa.gov.au/proposals/ep371-laurel-gas-exploration-and-appraisal-program.
EPA. “Waitsia Gas Project Stage 2”, 7 September 2020. Available at:
https://www.epa.wa.gov.au/proposals/waitsia-gas-project-stage-2.
EPA. “Waitsia Gas Project Stage 2 recommended for environmental approval”, 7 September 2020. Available
at: https://epa.wa.gov.au/media-statements/waitsia-gas-project-stage-2-recommended-environmental-
approval.
Santos Limited. “Santos report 2020 half-year results”, 20 August 2020. Available at:
https://www.santos.com/wp-content/uploads/2020/08/2020-Half-Year-Results-Announcement-and-
Presentation-1.pdf.
Santos Limited. “Santos signs new gas deal with gold fields”, 16 June 2020. Available at:
https://www.santos.com/news/santos-signs-new-gas-deal-with-gold-fields/.
Santos Limited. “Santos signs new gas deal with WA-based Kleenheat”, 4 November 2020. Available at:
https://www.santos.com/news/santos-signs-new-gas-deal-with-wa-based-kleenheat/.
Santos Limited. “Third Quarter Activities Report for period ending 30 September 2020”, 22 October 2020.
Available at https://www.santos.com/wp-content/uploads/2020/10/2020_Third_Quarter_Activities_Report-
FINAL.pdf.
Shell Australia. “Bratwurst: a significant discovery for Shell”, 20 December 2019. Available at:
https://www.shell.com.au/media/2019-media-releases/shell-significant-discovery.html.
© AEMO 2020 | 2020 Western Australia Gas Statement of Opportunities 60
WA Government. “Revised policy to secure domestic supply and create jobs”, 17 August 2020. Available at:
https://www.mediastatements.wa.gov.au/Pages/McGowan/2020/08/Revised-policy-to-secure-domestic-gas-
supply-and-create-jobs.aspx.
Warrego Energy. “Updated – Warrego and Alcoa sign large scale, long term gas sales agreement”,
29 September 2020. Available at: http://asx.warregoenergy.com/site/PDF/842f238a-4ee7-4ce6-95bc-
ddbb6ffdd25a/UpdatedWarregoandAlcoaSignLargeScaleLongTermGSA.
Warrego Energy. “Warrego and Strike align for join development of the West Erregulla gas field”, 8 October
2020. Available at: http://asx.warregoenergy.com/site/PDF/bcbba6ee-b25c-4bed-a46a-f341f6ac19d0/
WarregoandStrikealignforJointDevelopment.
Woodside. “First quarter report for period ended 31 March 2020”, 16 April 2020. Available at:
https://files.woodside/docs/default-source/investor-documents/quarterly-and-half-yearly-pdfs-and-data-
tables/2020/first-quarter-2020-report.pdf?sfvrsn=b85c9e9b_3.
Woodside. “Response to market conditions”, 27 March 2020. Available at: https://files.woodside/docs/default-
source/asx-announcements/2020-asx/response-to-market-conditions.pdf?sfvrsn=31d33c3d_3.
Woodside. “Scarborough Joint Venture to accept production licences”, 9 November 2020. Available at:
https://files.woodside/docs/default-source/media-releases/scarborough-joint-venture-to-accept-production-
licences.pdf?sfvrsn=23ce1346_4.
Woodside. “Woodside signs agreement for long-term LNG supply”, 24 December 2019. Available at:
https://files.woodside/docs/default-source/asx-announcements/2019-asx-announcements/woodside-signs-
agreement-for-long-term-lng-supply.pdf?sfvrsn=9db672da_2.
Infrastructure
APA. “WA forms WA gas grid with new Northern Goldfields Interconnect Pipeline”, 25 November 2020.
Available at: https://www.apa.com.au/globalassets/asx-releases/2020/2020-11-25-apa-ngi-asx-release.pdf.
FMG. “Fortescue invests US$450 million in energy infrastructure through Pilbara generation project”,
30 January 2020. Available at: https://www.fmgl.com.au/docs/default-source/announcements/pilbara-
generation-project.pdf.
WA Government. “Global call for EOIs to unlock Oakajee’s renewable hydrogen potential”, 18 September
2020. Available at: https://www.mediastatements.wa.gov.au/Pages/McGowan/2020/09/Global-call-for-EOIs-
to-unlock-Oakajees-renewable-hydrogen-potential.aspx.
Demand
Alita Resources. “Updates on Deed of Company Arrangement”, 15 July 2020. Available at:
https://www.allianceminerals.com.au/wp-content/uploads/2020/07/200715-Alita-Shareholder-update.pdf.
Altura Mining. “Production Update”, 24 December 2019. Available at: https://alturamining.com/wp-
content/uploads/2019/12/2015375.pdf.
AngloGold Ashanti. “Boston Shaker underground mine at Tropicana achieves commercial production”,
17 September 2020. Available at: https://thevault.exchange/?get_group_doc=143/1600319883-BostonShaker
undergroundmineatTropicanaachievescommercialproduction.pdf.
APA. “Mid West Pipeline & Mt Magnet Lateral”. Available at:
https://www.apa.com.au/globalassets/documents/info/schematic/mwp-mmp-diagram.pdf.
ASX. “Altura Mining Limited – suspension of approval ASX Code: AJM (Voluntary Administrator Appointed)”,
last updated: 27 October 2020. Available at:
https://asxonline.com/content/asxonline/public/notices/2020/oct/1351.20.10.html.
ARENA. “BP Australia study looks to scale up renewable hydrogen for export”, 8 May 2020. Available at:
https://arena.gov.au/assets/2020/05/ARENA-Media-Release_BP-Hydrogen_08052020.pdf.

© AEMO 2020 | 2020 Western Australia Gas Statement of Opportunities 61
ARENA. “Seven shortlisted for $70 million hydrogen funding round”, 20 July 2020. Available at:
https://arena.gov.au/news/seven-shortlisted-for-70-million-hydrogen-funding-round/#funding-applicants.
ARENA. “Yara Pilbara Renewable Ammonia Feasibility Study”, 21 February 2020. Available at:
https://arena.gov.au/news/the-pilbara-looks-to-renewable-hydrogen/.
BHP. “BHP extends Southern Cross Energy contract to reduce emissions at its Nickel West operations”,
23 October 2020. Available at: https://www.bhp.com/media-and-insights/news-releases/2020/10/bhp-
extends-southern-cross-energy-contract-to-reduce-emissions-at-its-nickel-west-
operations/#:~:text=Our%20approach-,BHP%20
extends%20Southern%20Cross%20Energy%20contract%20to,at%20its%20Nickel%20West%20operations
&text=BHP%20has%20executed%20a%2015,Nickel%20West%20Goldfields%20based%20operations.
Blackham Resources Limited. “Quarterly Activities Report December 2019”, 16 January 2020. Available at:
https://wcsecure.weblink.com.au/pdf/BLK/02193176.pdf.
Calidus Resources Limited. “Calidus secures $110 million in debt financing for Warrawoona”, 30 November
2020. Available at: https://www.investi.com.au/api/announcements/cai/8e1539b3-e2f.pdf.
Capricorn Metals Limited. “Debt Financing Completed & Project Update Karlawinda Gold Project”,
18 December 2019. Available at: http://capmetals.com.au/wp-content/uploads/2019/12/191218-Financing-
finalised.pdf.
CEFA. “Plans for Mid-West LNG Hub at Mount Magnet to boost industry and remote communities”,
September 2020. Available at: https://www.cefa.com.au/mid-west-lng-hub-mount-magnet/,
EDL, “Agnew Hybrid Renewable Power Station”. Available at: https://edlenergy.com/wp-
content/uploads/2020/05/EDL-Fact-Sheet-Agnew-Hybrid-Renewable-Power-Station.pdf.
EPA. “Environmental approval recommended for large-scale renewable energy hub”, 4 May 2020. Available
at: https://www.epa.wa.gov.au/media-statements/environmental-approval-recommended-large-scale-
renewable-energy-hub.
FuelCellsWorks. “Infinite Blue Energy Joins with Western Power to complete the initial studies for a 330KV
power line to its Arrowsmith Hydrogen Plant”, 18 November 2020. Available at:
https://fuelcellsworks.com/news/infinite-blue-energy-joins-with-western-power-to-complete-the-initial-
studies-for-a-330kv-power-line-to-its-arrowsmith-hydrogen-
plant/#:~:text=Infinite%20Blue%20Energy%20has%20signed%20an%20agreement%20with,part%20of%20its
%20FID%20planned%20for%20January%202021.
Galaxy Resources. “December 2019 Quarterly Activities Report”, 23 January 2020. Available at:
https://wcsecure.weblink.com.au/pdf/GXY/02194852.pdf.
Gold Industry Group. “Gruyere Gold Mine’s grand opening”, 4 December 2019. Available at:
https://www.goldindustrygroup.com.au/news/2019/12/3/gruyere-gold-mines-grand-opening#:~:text=First
%20gold%20was%20poured%20on,and%20Petroleum%20Minister%2C%20the%20Hon.
Hazer Group. “Hazer Commercial Demonstration Project final investment decision approval”, 31 July 2020.
Available at: https://hazergroup.com.au/wp-content/uploads/2020/09/200731-FID-Approval-FINAL.pdf.
Horizon Power. “An Australian first to power Denham”, 27 November 2020. Available at:
https://www.horizonpower.com.au/our-community/news-events/news/an-australian-first-to-power-denham/.
Horizon Power. “New power supply agreement signed for Port of Esperance”, 11 September 2020. Available
at: https://www.horizonpower.com.au/our-community/news-events/news/new-power-supply-agreement-
signed-for-port-of-esperance/.
Horizon Power. “Town of Onslow leading the renewable energy transformation”, 26 November 2019.
Available at: https://www.horizonpower.com.au/our-community/news-events/news/town-of-onslow-leading-
the-renewable-energy-transformation/,

© AEMO 2020 | 2020 Western Australia Gas Statement of Opportunities 62
Kalium Lakes. “Company Year End Update December 2019”, 19 December 2019. Available at:
https://asx.api.markitdigital.com/asx-research/1.0/file/2924-02187188-
6A960326?access_token=83ff96335c2d45a094df02a206a39ff4.
Metals X Limited. “Quarterly Report for Quarter Ending 30 September 2020”, October 2020. Available at:
https://www.metalsx.com.au/wp-content/uploads/2020/10/20200930-Quarterly-Report.pdf.
Mineral Resources. “Quarterly Exploration and Mining Activities Report October to December 2019 (Q2
FY20)”, 24 January 2020. Available at: https://clients3.weblink.com.au/pdf/MIN/02195164.pdf.
Pacific Energy. “Pacific Energy Secures More Contract Expansions”, 6 May 2019. Available at:
http://pacificenergy.com.au/images/files/asx-announcements/2019/Contract-Expansions.pdf.
Perdaman. “$4.5bn Karratha Urea Project agrees EPC terms”. Available at:
https://perdaman.com.au/2020/07/01/4-5bn-karratha-urea-project-agrees-epc-
terms/#:~:text=Perdaman%20Industries%20(Chemical%20%26%20Fertilisers),Australia%20and%20Saipem%2
0of%20Italy. Viewed 3 December 2020.
Pilbara Minerals. “March 2020 Quarterly Activities Report”, 28 April 2020. Available at:
http://www.pilbaraminerals.com.au/site/PDF/989d03fa-40e3-493e-9460-
719c7746cd2d/QuarterlyActivitiesReport.
Renew Economy. “Massive green hydrogen project signs network deal with Western Power”, 20 November
2020. Available at: https://reneweconomy.com.au/massive-green-hydrogen-project-signs-network-deal-with-
western-power-91553/.
Renew Economy. “Massive hydrogen project gets green light after securing $300m investment”, 29 April
2020. Available at: https://reneweconomy.com.au/massive-hydrogen-project-gets-green-light-after-securing-
300m-investment-68959/.
Rio Tinto. “Rio Tinto approves $2.6 billion investment in Koodaideri iron ore mine”, 29 November 2019.
Available at: https://www.riotinto.com/en/news/releases/Koodaideri-investment-
approved#:~:text=Rio%20Tinto%20approves
%20%242.6%20billion%20investment%20in%20Koodaideri%20iron%20ore%20mine,-29%20November
%202018&text=Rio%20Tinto%20is%20to%20develop,ore%20mine%20in%20Western%20Australia.
Strandline Resources Limited. “Strandline selects Woodside and EDL to jointly deliver integrated energy
solution for Coburn project”, 3 December 2019. Available at:
http://www.strandline.com.au/irm/PDF/c98b7025-9354-4584-81f7-e1cc43446e9d/StrandlineStrikes
PowerDealwithWoodsideEDLJVonCoburn.
WA Government. “Conditional support for job-creating gas manufacturing project”, 18 August 2020. Available
at: https://www.mediastatements.wa.gov.au/Pages/McGowan/2020/08/Conditional-support-for-job-creating-
gas-manufacturing-project.aspx.
WA Government. “Funding for studies to kick-start hydrogen industry”, 8 January 2020. Available at:
https://www.mediastatements.wa.gov.au/Pages/McGowan/2020/01/Funding-for-studies-to-kick-start-
hydrogen-industry.aspx.
WA Government. “Recycled gas opportunity for Albany”, 1 December 2020. Available at:
https://www.mediastatements.wa.gov.au/Pages/McGowan/2020/12/Recycled-gas-opportunity-for-
Albany.aspx.
WA Government. “Royalty rebate scheme for lithium miners”, 1 December 2020. Available at:
https://www.mediastatements.wa.gov.au/Pages/McGowan/2020/12/Royalty-rebate-scheme-for-lithium-
miners.aspx.
Wesfarmers. “Mt Holland Lithium Project update”, 23 January 2020. Available at:
https://www.wesfarmers.com.au/docs/default-source/asx-announcements/mt-holland-lithium-project-
update.pdf?sfvrsn=e46202bb_0.

© AEMO 2020 | 2020 Western Australia Gas Statement of Opportunities 63
Regulatory
Economic Regulation Authority. “Dampier to Bunbury Natural Gas Pipeline: Access Arrangement for period
2021-2025”, last updated 6 November 2020. Available at: https://www.erawa.com.au/gas/gas-
access/dampier-to-bunbury-natural-gas-pipeline/access-arrangements/access-arrangement-for-period-
2021-2025.
Government of Western Australia. “Revised policy to secure domestic gas supply and create jobs”, 17 August
2020. Available at: https://www.mediastatements.wa.gov.au/Pages/McGowan/2020/08/Revised-policy-to-
secure-domestic-gas-supply-and-create-jobs.aspx.

© AEMO 2020 | 2020 Western Australia Gas Statement of Opportunities 64
A2. Historical domestic gas prices and forward reference prices
All prices in this appendix refer to Australian dollars unless otherwise specified.
A2.1 Historical domestic gas prices
The quarterly historical domestic gas contract price131 is compared with the ABS’s producer price index (PPI)132
for gas extraction in Figure 26.
Figure 26 Historical domestic gas contract prices (A$/GJ, nominal) and ABS PPI – WA (gas extraction,
index), Q1 2013 to Q2 2020
Source: ABS and DMIRS.
131 DMIRS. Latest Statistics Release – 2019-20 Major Commodities Resources File. Available at: http://www.dmp.wa.gov.au/About-Us-Careers/Latest-Statistics-
Release-4081.aspx.
132 The base for the index is the 2015-16 financial year. ABS. Producer Price Indexes, Australia, Jun 2020, Table 36 – Output of the Mining industries, index
numbers. Available at https://www.abs.gov.au/statistics/economy/price-indexes-and-https://www.abs.gov.au/statistics/economy/price-indexes-and-
inflation/producer-price-indexes-australiainflation/producer-price-indexes-australia/jun-2020.
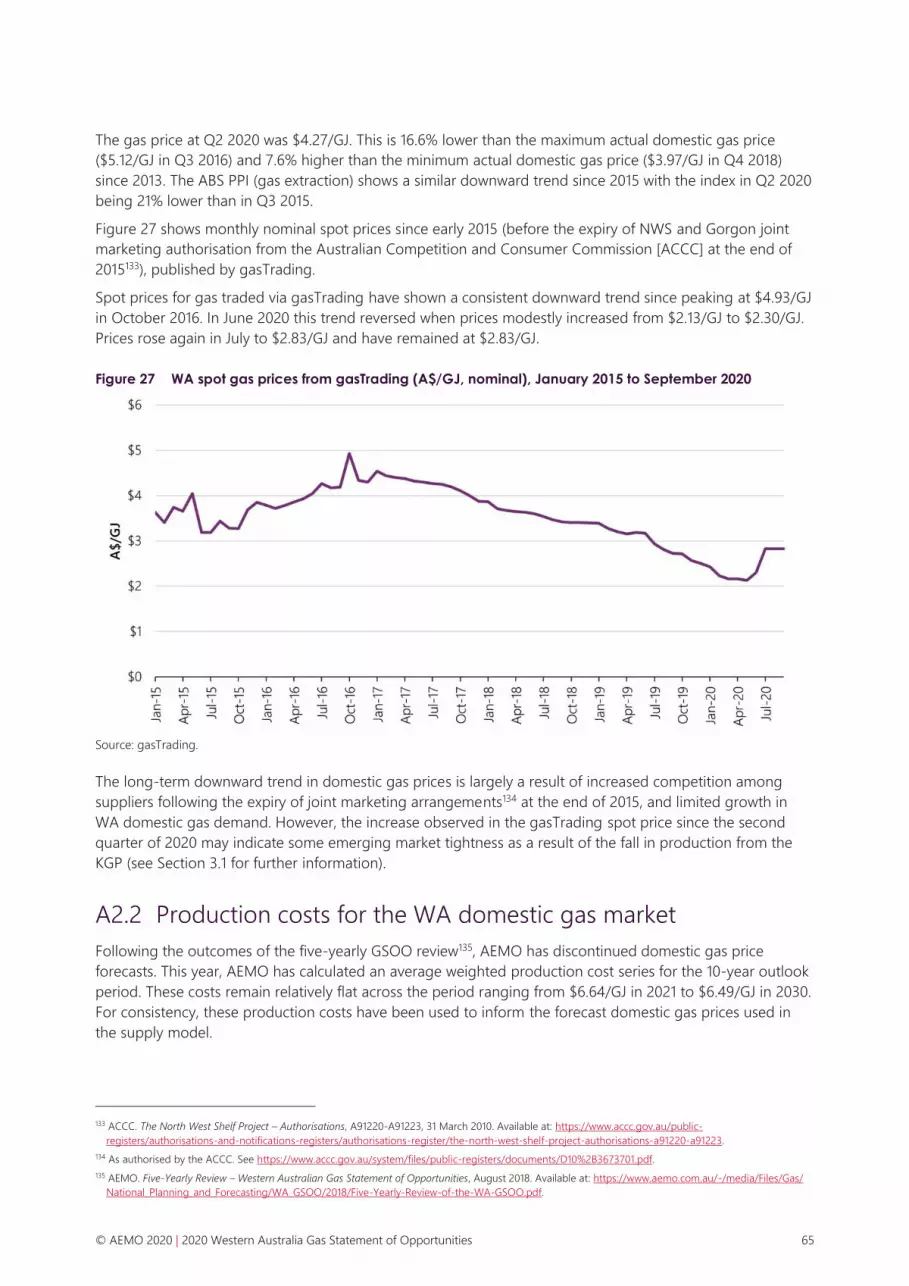
© AEMO 2020 | 2020 Western Australia Gas Statement of Opportunities 65
The gas price at Q2 2020 was $4.27/GJ. This is 16.6% lower than the maximum actual domestic gas price
($5.12/GJ in Q3 2016) and 7.6% higher than the minimum actual domestic gas price ($3.97/GJ in Q4 2018)
since 2013. The ABS PPI (gas extraction) shows a similar downward trend since 2015 with the index in Q2 2020
being 21% lower than in Q3 2015.
Figure 27 shows monthly nominal spot prices since early 2015 (before the expiry of NWS and Gorgon joint
marketing authorisation from the Australian Competition and Consumer Commission [ACCC] at the end of
2015133), published by gasTrading.
Spot prices for gas traded via gasTrading have shown a consistent downward trend since peaking at $4.93/GJ
in October 2016. In June 2020 this trend reversed when prices modestly increased from $2.13/GJ to $2.30/GJ.
Prices rose again in July to $2.83/GJ and have remained at $2.83/GJ.
Figure 27 WA spot gas prices from gasTrading (A$/GJ, nominal), January 2015 to September 2020
Source: gasTrading.
The long-term downward trend in domestic gas prices is largely a result of increased competition among
suppliers following the expiry of joint marketing arrangements134 at the end of 2015, and limited growth in
WA domestic gas demand. However, the increase observed in the gasTrading spot price since the second
quarter of 2020 may indicate some emerging market tightness as a result of the fall in production from the
KGP (see Section 3.1 for further information).
A2.2 Production costs for the WA domestic gas market
Following the outcomes of the five-yearly GSOO review135, AEMO has discontinued domestic gas price
forecasts. This year, AEMO has calculated an average weighted production cost series for the 10-year outlook
period. These costs remain relatively flat across the period ranging from $6.64/GJ in 2021 to $6.49/GJ in 2030.
For consistency, these production costs have been used to inform the forecast domestic gas prices used in
the supply model.
133 ACCC. The North West Shelf Project – Authorisations, A91220-A91223, 31 March 2010. Available at: https://www.accc.gov.au/public-
registers/authorisations-and-notifications-registers/authorisations-register/the-north-west-shelf-project-authorisations-a91220-a91223.
134 As authorised by the ACCC. See https://www.accc.gov.au/system/files/public-registers/documents/D10%2B3673701.pdf.
135 AEMO. Five-Yearly Review – Western Australian Gas Statement of Opportunities, August 2018. Available at: https://www.aemo.com.au/-/media/Files/Gas/
National_Planning_and_Forecasting/WA_GSOO/2018/Five-Yearly-Review-of-the-WA-GSOO.pdf.

© AEMO 2020 | 2020 Western Australia Gas Statement of Opportunities 66
Weighted average production costs have been calculated using the following assumptions:
• Whole of project (including short and long-run costs) have been used for each project.
• New projects were introduced to the market according to the timeframes publicly announced by the
project operator (see Section 3.3 for further information about these dates).
• A 10% internal rate of return was included.
• Costs were weighted by the nameplate capacity of the production facility for both existing facilities and
prospective supply sources136.
136 For existing facilities, AEMO has used the nameplate production capacity. For prospective supply sources, the DMO quantity or the expected production
capacity has been used as applicable. See Chapter 3 – Gas supply for further details of production capacity.

© AEMO 2020 | 2020 Western Australia Gas Statement of Opportunities 67
A3. Input assumptions and methodologies
This appendix provides details of input assumptions and methodologies used for the 2020
WA GSOO to forecast:
• Domestic gas demand.
• Total gas demand.
• Potential gas supply.
A3.1 Commodity forecasts
AEMO engaged the National Institute of Economic and Industry Research (NIEIR) to provide commodity
forecasts137 as inputs to the development of the WA domestic gas demand forecasts. Mining projects in WA
are often located in remote areas, outside of the SWIS. Gas usage at these mines can include power
generation for process use at the mine site and adjoining towns. NIEIR combined information about new
projects, expansions and closures for each commodity type with consensus price forecasts to develop the
commodity production forecasts.
WA’s iron ore production grew by 5.8% between 2019 and 2020, largely as a result of mine shutdowns in
Brazil as a result of the COVID-19 pandemic, combined with other environmental and technical issues.
However, production is expected to grow at a more modest average annual rate of 1.2% over the outlook
period. Most of the investment in iron ore over the next 10 years is expected to replace existing mine capacity
which is reaching end-of-life, rather than substantially increasing production volumes.
Gold production is forecast to grow by 7.5% between 2020 and 2022 as the economic effects of the
COVID-19 pandemic increase investment demand. After 2022, global demand for gold is expected to fall,
resulting in WA’s production falling at an average annual rate of 2.9% between 2022 and 2030.
Over the next 10 years in the base scenario, NIEIR projects strong average annual production growth for the
following commodities:
• Lithium (11.2%).
• Cobalt (7.0%).
• Mineral sands (4.6%).
• Copper (4.3%).
• Nickel (4.2%).
Following a short-term slowdown until 2022, projected growth in lithium, nickel and cobalt is underpinned by
expected strong global demand for batteries (used in consumer electronics and electric vehicles) over the
outlook period. New mines are expected to commence operation in WA to help meet this demand.
137 NIEIR prepared forecasts for the following commodities – iron ore, alumina, gold, nickel, zinc, copper, lithium, lead, cobalt, and mineral sands.

© AEMO 2020 | 2020 Western Australia Gas Statement of Opportunities 68
WA is one of the world’s largest producers of mineral sands, and several large projects are currently being
considered (including Strandline Resources’ Coburn, Sheffield Resources’ Thunderbird and Diatreme
Resources’ Cyclone) which would support higher future production.
Since the 2019 WA GSOO, the commodity production forecasts have been revised as follows:
• The impacts of the COVID-19 pandemic on global commodity demand, prices and production volume
outlooks have been incorporated. This has particularly affected nickel, minerals sands, and gold forecasts.
• The forecasts for lithium and zinc have increased as a result of an improved outlook for demand for
rechargeable batteries for use in electric vehicles (supported by sales targets in China and associated
increased production among manufacturers), portable devices and other equipment.
• The forecast for copper has increased in line with additional projects, including OZ Minerals’ West
Musgrave.
Projections for the remaining commodities (alumina, iron ore, cobalt, and lead) are broadly in line with the
2019 WA GSOO forecasts over the outlook period. Further information about the commodity forecasts can be
found in NIEIR’s report138.
A3.2 Gas demand forecast methodology
AEMO presents WA domestic and total gas demand forecasts, defined as:
• Domestic gas demand forecasts – all major mining and minerals processing, industrial, and commercial
demand, GPG demand in the SWIS and non-SWIS areas, and small-use customers connected to WA’s gas
transmission and distribution networks.
• Total gas demand forecasts – domestic gas demand plus an estimate of the total quantity of gas required
for LNG exports, reflecting an overall assessment of WA gas demand.
The methodology for preparing these forecasts is summarised in Sections A3.2.1 and A3.2.2.
A3.2.1 Domestic gas demand
AEMO forecast domestic gas demand by separately modelling each of the following sectors:
• Tariff V – volumetrically tariffed customers, which includes residential and commercial distribution
network customers. These consumers typically use less than 10 TJ/year. Distribution networks include
Kalgoorlie and Leonora but exclude Albany which distributes liquefied petroleum gas.
• Tariff D – demand tariffed customers that typically use more than 10 TJ/year. This includes industrial
customers that are located within the distribution network, and the following transmission-connected
consumers:
– Minerals processing.
– Mining.
– Industrial.
• GPG (including SWIS and non-SWIS).
The methodology applied in forecasting each sector is summarised below.
Residential and commercial distribution customers (Tariff V)
The distribution network includes the low-pressure pipelines used to supply small-use residential and
non-residential retail customers. These customers account for approximately 3.5% of WA’s domestic gas
demand.
138 NIEIR. Commodity forecasts for Western Australia to 2030, August 2020, at: https://aemo.com.au/energy-systems/gas/gas-forecasting-and-planning/wa-
gas-statement-of-opportunities-wa-gsoo.
© AEMO 2020 | 2020 Western Australia Gas Statement of Opportunities 69
AEMO forecast Tariff V total consumption by applying different assumptions based on the customer type
(residential or non-residential), scenario, and the consumption per connection.
The heating139 and baseload consumption per connection was forecast separately, and then adjusted for:
• Growth in connection numbers.
• Energy efficiency.
• Fuel switching.
• Weather and climate change effects.
• Gas price impacts.
The effect of the COVID-19 pandemic on consumption patterns was investigated, including the effect of a
higher proportion of people working from home. However, it was found that any changes to the relationship
between average gas consumption and temperature as a result of the pandemic were negligible for WA, so
no model recalibration was required.
Further information about the WA Tariff V forecasting methodology can be found in Chapter 5 of the Gas
Demand Forecasting Methodology Information Paper140.
Tariff D consumption
Tariff D consumers account for approximately 80% of WA’s total domestic gas demand, and include:
• Mining consumers such as:
– Iron ore producers – BHP, CITIC Pacific, FMG, and Rio Tinto.
– Gold producers – AngloGold Ashanti, Blackham Resources, and Newcrest.
– Nickel producers – BHP NickelWest.
– Lithium producers – Minerals Resources and Tianqi.
– Base metals producers – Nifty.
• Minerals processing consumers such as Alcoa, BHP, and South32.
• Industrial consumers such as CSBP and Yara Pilbara.
• Construction materials producers such as Midland Brick and Cockburn Cement.
• Domestic LNG producers such as EDL and Wesfarmers.
• Other industrial customers that are in the distribution network.
The mining, minerals processing, industrial, and other industrial forecasts are largely driven by:
• Forecast mining activity.
• Commodity prices.
• Expected mine production and outages.
• Production costs.
• Exchange rate forecasts.
From the list of industrial consumers, it has been assumed that Tariff D gas consumers are associated with
natural gas-intensive processes, such as minerals processing calcination facilities, mining of specific minerals
including the fuelling of equipment, and specific finished products.
139 Heating load is largely dependent on future weather projections, specifically the frequency and severity of cold days. This is referred to as HDDs (heating
degree days).
140 AEMO. Gas Demand Forecasting Methodology Information Paper, April 2020. Available at: https://aemo.com.au/-
/media/files/gas/national_planning_and_forecasting/gsoo/2020/gas-demand-forecasting-methodology.pdf.

© AEMO 2020 | 2020 Western Australia Gas Statement of Opportunities 70
Due to these requirements, the growth or decline in future gas consumption has been linked to the quantity
of minerals processed, mined, or produced. AEMO used NIEIR’s commodity forecasts as an input into the
Tariff D demand forecasts (see Section A3.1.2 for further information).
AEMO has adopted information received from gas consumers as part of the 2020 FIR for developing the gas
demand forecasts for the below sectors. Where FIR information was unavailable, AEMO has applied NIEIR’s
commodity production forecasts.
Minerals processing, mining, and industrial sectors
AEMO approached forecasting the mining, minerals processing, and industrial sectors sequentially as follows:
1. Tier 1 (preferred method) – obtained forecast data from the facility operator, usually through the FIR, with
quality checks performed against historical consumption along with any public announcements about the
facility’s operations.
2. Tier 2 (if no site-specific forecast is available) – used other causal information such as commodity
forecasts. Historical usage data was analysed to calculate either a regression-based energy coefficient
(commodity specific) or an energy intensity factor. Scenario bandwidths were calculated using this method
for the low, base and high commodity forecasts.
3. Tier 3 (where data for the first two approaches is unavailable) – historical pattern matching across multiple
years of consumption determined whether the forecast was based on a trend or a median level of usage,
with scenario bandwidths based on statistical levels of certainty.
Other Tariff D consumption
While gas consumption for the minerals processing, mining and industrial sectors is available on the WA GBB,
only aggregated data on distribution-connected industrial customers is readily available to AEMO.
To estimate the gas demand, the segment was split into two components: the aggregate and large users. An
econometric model was applied to forecast the aggregate component, which considered the impact of
annual gross state product growth, climate-adjusted weather, and weekdays. The large user component was
forecast using information provided by the distribution network service provider.
SWIS GPG
The most variable component of gas demand, electricity generation by GPG141 in the SWIS, accounted for
approximately 12% of domestic gas demand in WA in 2020. In the 2020-21 Capacity Year 2,958 MW of
Capacity Credits were assigned to gas or gas/diesel dual fuel generators. Two-thirds of this capacity is
peaking or mid-merit142. Typically, the SWIS relies on GPG to supply peak load over the summer season and
for the provision of Load Following Ancillary Services (LFAS)143.
Forecasts of SWIS GPG gas demand were prepared by Robinson Bowmaker Paul (RBP) and were added to
AEMO’s forecasts.
The scenarios used by RBP for the GPG modelling are shown in Table 25.
141 Some GPG that participates in the WEM (for example, Alinta’s Pinjarra cogeneration) serves large behind-the-meter loads in the minerals processing,
mining, or industrial sectors and is excluded from SWIS GPG gas demand in the WA GSOO. For a full description of how AEMO classifies facilities, see
Appendix A5.
142 Peaking capacity operates less than 10% of the time, and mid-merit capacity operates between 10% and 70% of the time. For more information, see the
2020 WEM ESOO, at https://www.aemo.com.au/-/media/files/electricity/wem/planning_and_forecasting/esoo/2020/2020-wholesale-electricity-market-
electricity-statement-of-opportunities.pdf.
143 LFAS is the power system security ancillary service whereby assigned generators automatically and constantly change their output to compensate for load
and wind fluctuations and thus regulate the system frequency. Load following units will respond automatically to any over or under frequency events
(including generator trips and load rejection events).
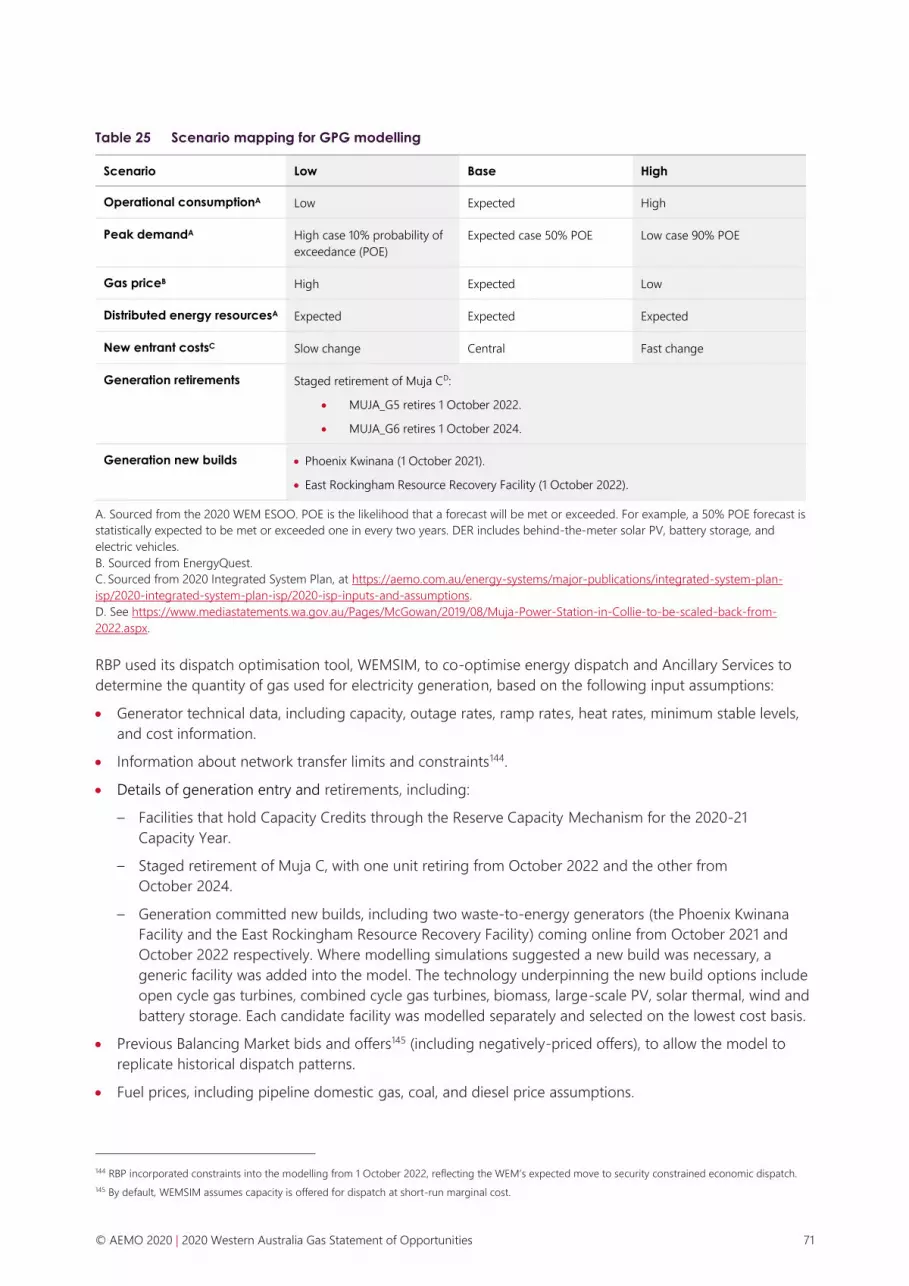
© AEMO 2020 | 2020 Western Australia Gas Statement of Opportunities 71
Table 25 Scenario mapping for GPG modelling
Scenario Low Base High
Operational consumptionA Low Expected High
Peak demandA High case 10% probability of
exceedance (POE)
Expected case 50% POE Low case 90% POE
Gas priceB High Expected Low
Distributed energy resourcesA Expected Expected Expected
New entrant costsC Slow change Central Fast change
Generation retirements Staged retirement of Muja CD:
• MUJA_G5 retires 1 October 2022.
• MUJA_G6 retires 1 October 2024.
Generation new builds • Phoenix Kwinana (1 October 2021).
• East Rockingham Resource Recovery Facility (1 October 2022).
A. Sourced from the 2020 WEM ESOO. POE is the likelihood that a forecast will be met or exceeded. For example, a 50% POE forecast is
statistically expected to be met or exceeded one in every two years. DER includes behind-the-meter solar PV, battery storage, and
electric vehicles.
B. Sourced from EnergyQuest.
C. Sourced from 2020 Integrated System Plan, at https://aemo.com.au/energy-systems/major-publications/integrated-system-plan-
isp/2020-integrated-system-plan-isp/2020-isp-inputs-and-assumptions.
D. See https://www.mediastatements.wa.gov.au/Pages/McGowan/2019/08/Muja-Power-Station-in-Collie-to-be-scaled-back-from-
2022.aspx.
RBP used its dispatch optimisation tool, WEMSIM, to co-optimise energy dispatch and Ancillary Services to
determine the quantity of gas used for electricity generation, based on the following input assumptions:
• Generator technical data, including capacity, outage rates, ramp rates, heat rates, minimum stable levels,
and cost information.
• Information about network transfer limits and constraints144.
• Details of generation entry and retirements, including:
– Facilities that hold Capacity Credits through the Reserve Capacity Mechanism for the 2020-21
Capacity Year.
– Staged retirement of Muja C, with one unit retiring from October 2022 and the other from
October 2024.
– Generation committed new builds, including two waste-to-energy generators (the Phoenix Kwinana
Facility and the East Rockingham Resource Recovery Facility) coming online from October 2021 and
October 2022 respectively. Where modelling simulations suggested a new build was necessary, a
generic facility was added into the model. The technology underpinning the new build options include
open cycle gas turbines, combined cycle gas turbines, biomass, large-scale PV, solar thermal, wind and
battery storage. Each candidate facility was modelled separately and selected on the lowest cost basis.
• Previous Balancing Market bids and offers145 (including negatively-priced offers), to allow the model to
replicate historical dispatch patterns.
• Fuel prices, including pipeline domestic gas, coal, and diesel price assumptions.
144 RBP incorporated constraints into the modelling from 1 October 2022, reflecting the WEM’s expected move to security constrained economic dispatch.
145 By default, WEMSIM assumes capacity is offered for dispatch at short-run marginal cost.

© AEMO 2020 | 2020 Western Australia Gas Statement of Opportunities 72
Non-SWIS GPG
Non-SWIS GPG includes the electricity distribution networks operated by Horizon Power. To forecast
non-SWIS GPG gas consumption, AEMO collected publicly available information from:
• Horizon Power’s annual report.
• The WA GBB.
• Clean Energy Regulator’s Greenhouse and Energy Information on electricity generation.
• NWIS reports.
In addition to the information listed above, AEMO used information collected through the 2020 FIR.
The non-SWIS GPG gas consumption was forecast by applying an econometric model that forecasts
electricity consumption for each gas consuming non-SWIS area. The non-SWIS region has relatively stable
electricity consumption, largely due to the semi-arid desert climate of its surrounds.
The electricity model considered the historical population growth in each non-SWIS area as reported by the
ABS, the historical growth of residential behind-the-meter PV, historical electricity consumption, and the
commencement of new electricity generation in these areas.
Gas consumption was estimated by multiplying forecast electricity demand by the gas consumption per
megawatt hour (MWh) to derive total gas forecasts for non-SWIS GPG, as shown in Figure 28.
Figure 28 Gas demand forecasting for the non-SWIS GPG sector
Committed new project demand
Committed new project demand is defined as gas consuming or reducing projects that have a direct impact
on WA gas consumption and have attained FID and/or are already under construction.
These projects include approved upcoming projects that are utilising natural gas as an input feedstock or as
an input for power generation or have approved renewable energy projects that will offset existing gas
demand. Committed new project demand includes expansions to existing minerals processing, mining, and
industrial operations.
Gas consumption for each project under this category has been estimated individually, based on publicly
available information, consultation with the project proponent, or from gas consumption information
provided to AEMO as part of the 2020 FIR process. These estimates were added to all three scenarios (see
Section 2.2.1 for further details about these projects).
Prospective gas demand in the high scenario
While gas demand forecasts for all three scenarios include committed projects, the high gas demand scenario
includes projects that may be developed and consume gas, projects that could switch from consuming diesel
to gas, and renewable energy projects that offset the consumption of gas over the outlook period
(“prospective demand”).
Electricity
forecasts
(non-SWIS)
Gas
consumption
(TJ per MWh)
Gas forecasts
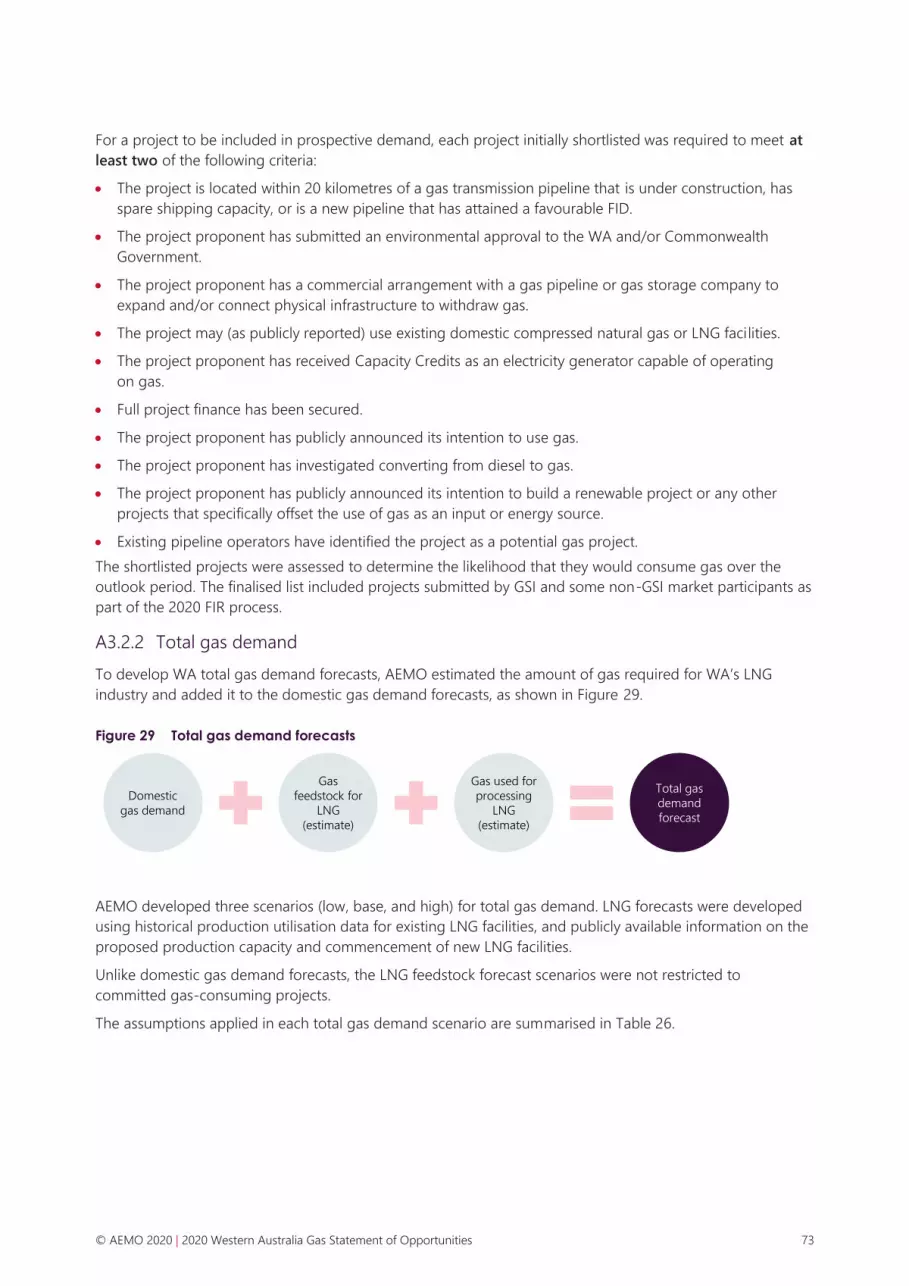
© AEMO 2020 | 2020 Western Australia Gas Statement of Opportunities 73
For a project to be included in prospective demand, each project initially shortlisted was required to meet at
least two of the following criteria:
• The project is located within 20 kilometres of a gas transmission pipeline that is under construction, has
spare shipping capacity, or is a new pipeline that has attained a favourable FID.
• The project proponent has submitted an environmental approval to the WA and/or Commonwealth
Government.
• The project proponent has a commercial arrangement with a gas pipeline or gas storage company to
expand and/or connect physical infrastructure to withdraw gas.
• The project may (as publicly reported) use existing domestic compressed natural gas or LNG facilities.
• The project proponent has received Capacity Credits as an electricity generator capable of operating
on gas.
• Full project finance has been secured.
• The project proponent has publicly announced its intention to use gas.
• The project proponent has investigated converting from diesel to gas.
• The project proponent has publicly announced its intention to build a renewable project or any other
projects that specifically offset the use of gas as an input or energy source.
• Existing pipeline operators have identified the project as a potential gas project.
The shortlisted projects were assessed to determine the likelihood that they would consume gas over the
outlook period. The finalised list included projects submitted by GSI and some non-GSI market participants as
part of the 2020 FIR process.
A3.2.2 Total gas demand
To develop WA total gas demand forecasts, AEMO estimated the amount of gas required for WA’s LNG
industry and added it to the domestic gas demand forecasts, as shown in Figure 29.
Figure 29 Total gas demand forecasts
AEMO developed three scenarios (low, base, and high) for total gas demand. LNG forecasts were developed
using historical production utilisation data for existing LNG facilities, and publicly available information on the
proposed production capacity and commencement of new LNG facilities.
Unlike domestic gas demand forecasts, the LNG feedstock forecast scenarios were not restricted to
committed gas-consuming projects.
The assumptions applied in each total gas demand scenario are summarised in Table 26.
Domestic
gas demand
Gas
feedstock for
LNG
(estimate)
Gas used for
processing
LNG
(estimate)
Total gas
demand
forecast

© AEMO 2020 | 2020 Western Australia Gas Statement of Opportunities 74
Table 26 Total gas demand forecast scenarios
Parameter Low Base High
Domestic gas
demand
forecasts
Low Base High
Gas feedstock
for LNG exports • NWS (16.9 mtpa, supported
by commencement of
Greater Western Flank 2 in
2018).
• Pluto LNG (4.9 mtpa).
• Gorgon LNG (15.6 mtpa).
• Wheatstone LNG (8.9 mtpa).
• Prelude FLNG (3.6 mtpa).
• Ichthys LNG (8.9 mtpa).
Includes facilities outlined in the Low
scenario assumptions, with the following
exceptions:
• NWS production maintained via backfill
through the interconnector from Pluto
(1.5 mtpa from 2022) and Scarborough
(1.5 mtpa from 2026).
• NWS production maintained via backfill
from Waitsia (1.5 mtpa from 2023 to
2027).
• Pluto train 1 supported by backfill from
Scarborough (1.5 mtpa from 2026).
• Pluto train 2 expansion from
Scarborough gas (5 mtpa, commences
2026).
Includes facilities outlined in
Base scenario assumptions,
with the following
exceptions:
• Ichthys expansion
(4.45 mtpa in June
2028).
Gas used for
processing
LNGA
8%
A. Processing estimates were calculated by taking the low range of estimates from Lewis Grey Advisory, Projections of gas and electricity
used in LNG, Public report prepared for AEMO, 18 November 2016, p. vi, https://www.aemo.com.au/-/media/Files/Gas/National_
Planning_and_Forecasting/NGFR/2016/Projections-of-Gas-and-Electricity-Used-in-LNG-Public-Report-November-2016.pdf.
A3.3 Potential gas supply forecast methodology
Instead of forecasting how much gas is expected to be supplied over the outlook period, AEMO’s forecasts of
potential gas supply reflect how much gas could be produced if there was market demand for it at the
forecast price. This approach is useful in assessing supply adequacy and identifying potential supply
shortfalls146.
AEMO’s potential gas supply model was redeveloped by ACIL Allen in 2018 following the recommendations
of the five-yearly WA GSOO review147. For this 2020 WA GSOO, AEMO updated the input assumptions used
in the model and made improvements to better capture FIR data.
The model tracks the gas reserves remaining to each domestic-only production facility on an annual basis by
incorporating assumptions about the following inputs:
• Initial gas reserves and resources.
• Modelled annual gas sales (contracted and uncontracted).
• Fuel gas requirements.
• Incremental reserves addition.
The operation of the potential gas supply model distinguishes between existing, committed, and prospective
supply projects, as shown in Table 27.
146 Transmission pipeline capacity constraints are not considered in the model.
147 For further information, see https://aemo.com.au/-/media/Files/Gas/National_Planning_and_Forecasting/WA_GSOO/2018/Five-Yearly-Review-of-the-WA-
GSOO.pdf.
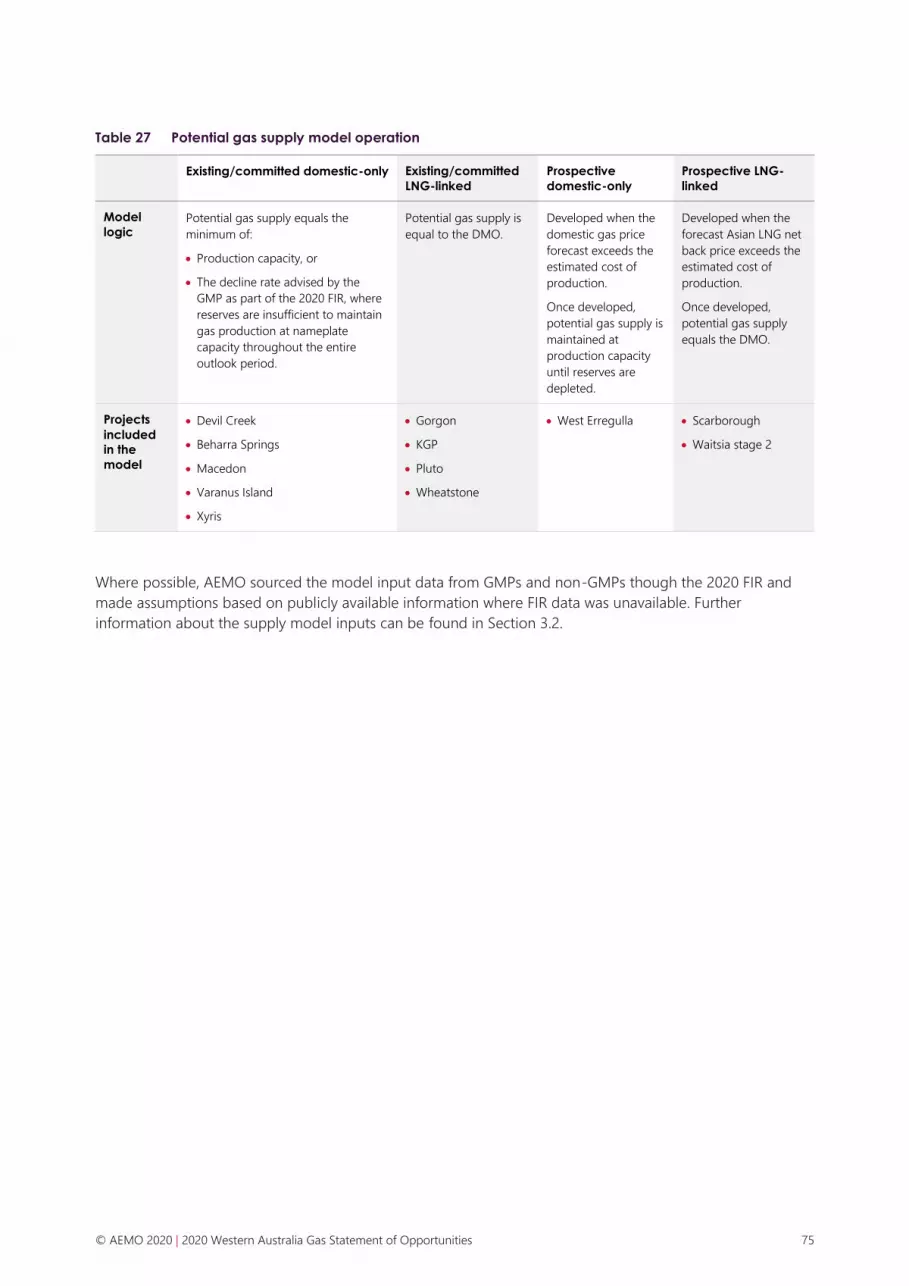
© AEMO 2020 | 2020 Western Australia Gas Statement of Opportunities 75
Table 27 Potential gas supply model operation
Existing/committed domestic-only Existing/committed
LNG-linked
Prospective
domestic-only
Prospective LNG-
linked
Model
logic Potential gas supply equals the
minimum of:
• Production capacity, or
• The decline rate advised by the
GMP as part of the 2020 FIR, where
reserves are insufficient to maintain
gas production at nameplate
capacity throughout the entire
outlook period.
Potential gas supply is
equal to the DMO.
Developed when the
domestic gas price
forecast exceeds the
estimated cost of
production.
Once developed,
potential gas supply is
maintained at
production capacity
until reserves are
depleted.
Developed when the
forecast Asian LNG net
back price exceeds the
estimated cost of
production.
Once developed,
potential gas supply
equals the DMO.
Projects
included
in the
model
• Devil Creek
• Beharra Springs
• Macedon
• Varanus Island
• Xyris
• Gorgon
• KGP
• Pluto
• Wheatstone
• West Erregulla • Scarborough
• Waitsia stage 2
Where possible, AEMO sourced the model input data from GMPs and non-GMPs though the 2020 FIR and
made assumptions based on publicly available information where FIR data was unavailable. Further
information about the supply model inputs can be found in Section 3.2.

© AEMO 2020 | 2020 Western Australia Gas Statement of Opportunities 76
A4. Total gas demand forecasts
Table 28 Domestic gas demand forecasts (PJ/annum), 2021 to 2030
Year Low Base High
2021 377.8 389.8 411.4
2022 382.5 394.3 421.2
2023 381.7 394.6 422.9
2024 383.7 401.1 453.8
2025 387.2 407.4 485.4
2026 388.8 411.0 491.2
2027 387.2 411.7 494.4
2028 384.7 411.7 495.6
2029 384.4 413.0 498.9
2030 382.6 414.3 501.6
Table 29 LNG feedstock forecasts (PJ/annum), 2021 to 2030
Year Low Base High
2021 3,321.4 3,321.4 3,321.4
2022 3,243.2 3,401.2 3,401.2
2023 3,165.0 3,481.0 3,481.0
2024 3,086.9 3,402.8 3,402.8
2025 3,008.7 3,324.7 3,324.7
2026 2,930.6 3,667.8 3,667.8
2027 2,852.4 3,589.6 3,589.6
2028 2,774.2 3,353.5 3,587.8
2029 2,696.1 3,275.3 3,509.6
2030 2,617.9 3,197.1 3,431.5
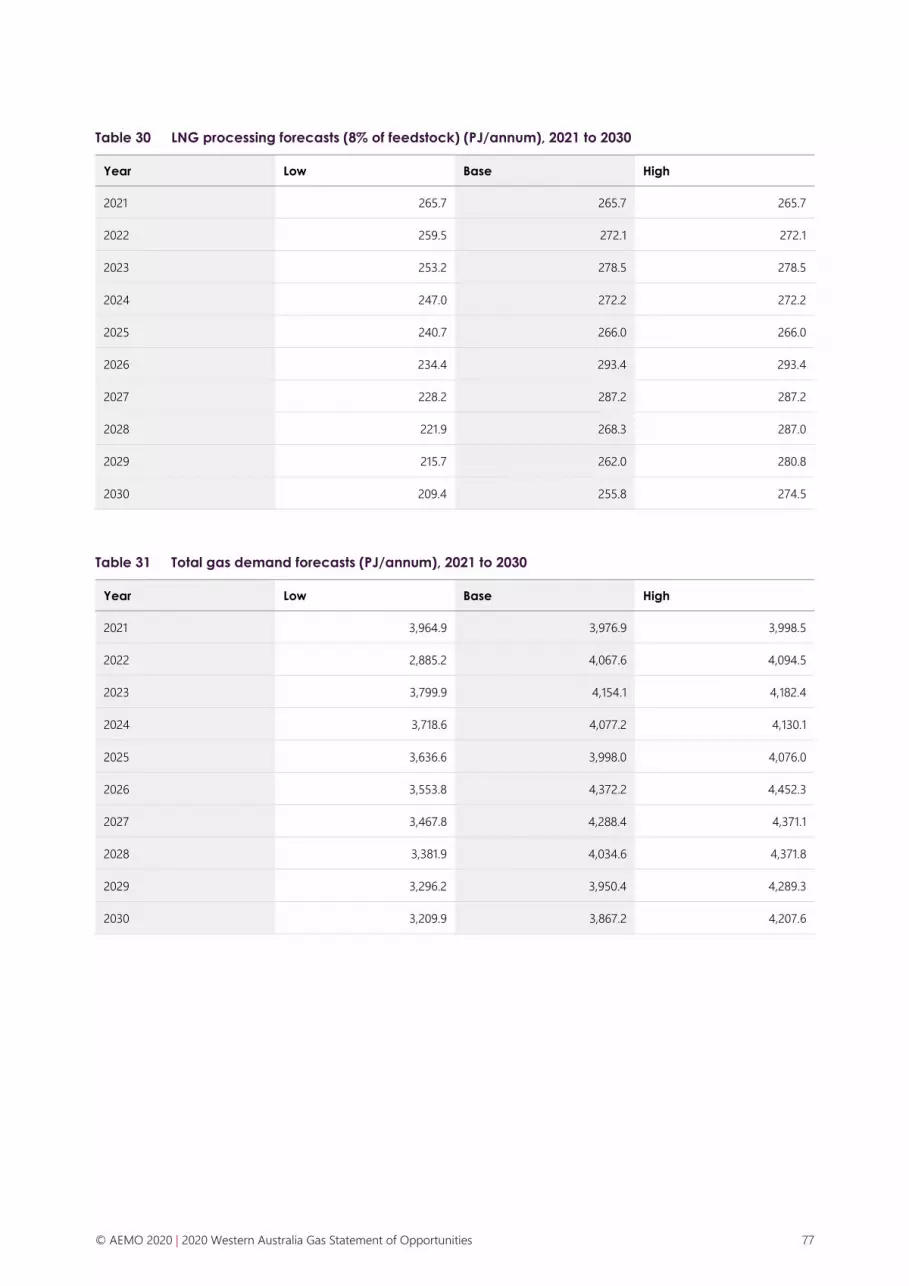
© AEMO 2020 | 2020 Western Australia Gas Statement of Opportunities 77
Table 30 LNG processing forecasts (8% of feedstock) (PJ/annum), 2021 to 2030
Year Low Base High
2021 265.7 265.7 265.7
2022 259.5 272.1 272.1
2023 253.2 278.5 278.5
2024 247.0 272.2 272.2
2025 240.7 266.0 266.0
2026 234.4 293.4 293.4
2027 228.2 287.2 287.2
2028 221.9 268.3 287.0
2029 215.7 262.0 280.8
2030 209.4 255.8 274.5
Table 31 Total gas demand forecasts (PJ/annum), 2021 to 2030
Year Low Base High
2021 3,964.9 3,976.9 3,998.5
2022 2,885.2 4,067.6 4,094.5
2023 3,799.9 4,154.1 4,182.4
2024 3,718.6 4,077.2 4,130.1
2025 3,636.6 3,998.0 4,076.0
2026 3,553.8 4,372.2 4,452.3
2027 3,467.8 4,288.4 4,371.1
2028 3,381.9 4,034.6 4,371.8
2029 3,296.2 3,950.4 4,289.3
2030 3,209.9 3,867.2 4,207.6
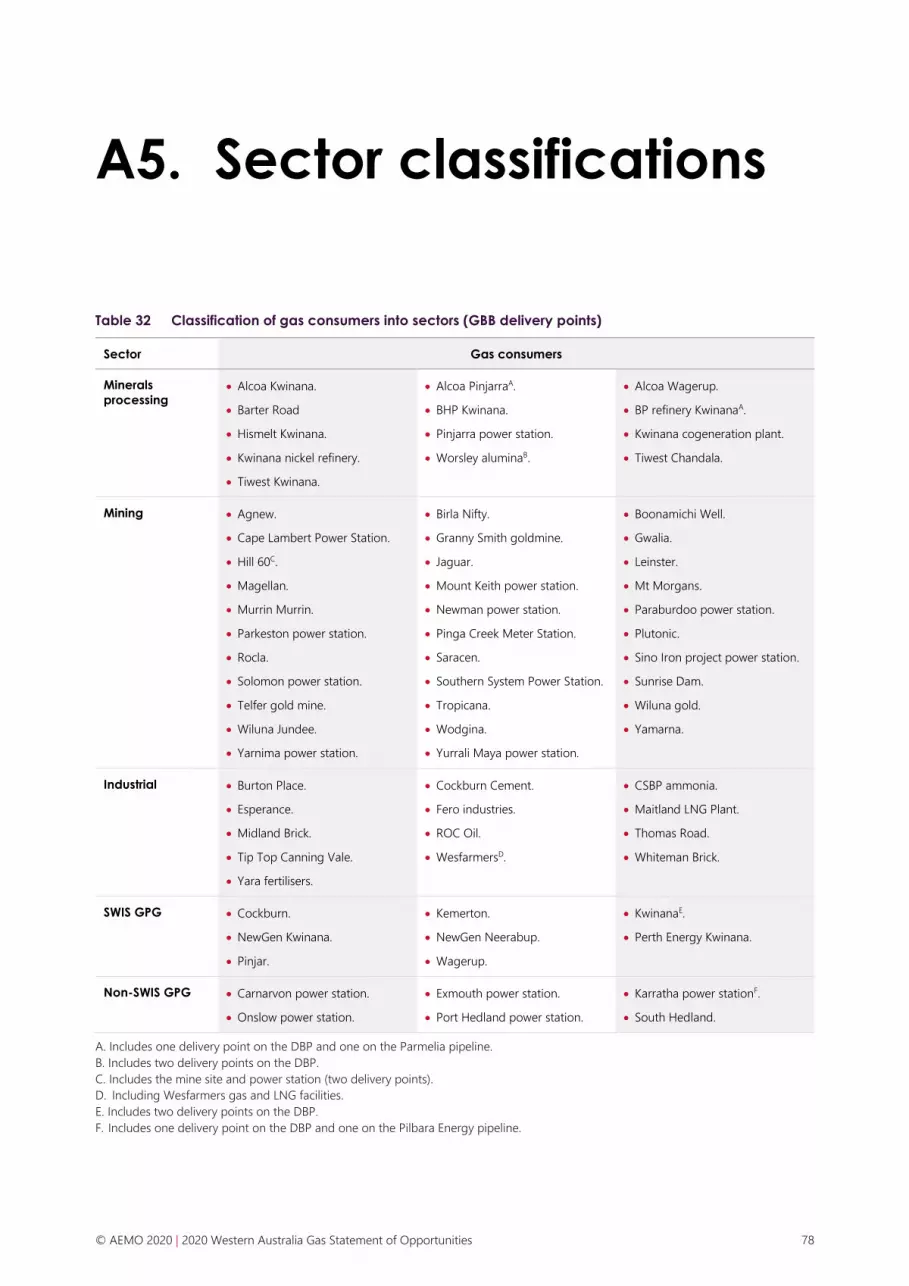
© AEMO 2020 | 2020 Western Australia Gas Statement of Opportunities 78
A5. Sector classifications
Table 32 Classification of gas consumers into sectors (GBB delivery points)
Sector Gas consumers
Minerals
processing • Alcoa Kwinana.
• Barter Road
• Hismelt Kwinana.
• Kwinana nickel refinery.
• Tiwest Kwinana.
• Alcoa PinjarraA.
• BHP Kwinana.
• Pinjarra power station.
• Worsley aluminaB.
• Alcoa Wagerup.
• BP refinery KwinanaA.
• Kwinana cogeneration plant.
• Tiwest Chandala.
Mining • Agnew.
• Cape Lambert Power Station.
• Hill 60C.
• Magellan.
• Murrin Murrin.
• Parkeston power station.
• Rocla.
• Solomon power station.
• Telfer gold mine.
• Wiluna Jundee.
• Yarnima power station.
• Birla Nifty.
• Granny Smith goldmine.
• Jaguar.
• Mount Keith power station.
• Newman power station.
• Pinga Creek Meter Station.
• Saracen.
• Southern System Power Station.
• Tropicana.
• Wodgina.
• Yurrali Maya power station.
• Boonamichi Well.
• Gwalia.
• Leinster.
• Mt Morgans.
• Paraburdoo power station.
• Plutonic.
• Sino Iron project power station.
• Sunrise Dam.
• Wiluna gold.
• Yamarna.
Industrial • Burton Place.
• Esperance.
• Midland Brick.
• Tip Top Canning Vale.
• Yara fertilisers.
• Cockburn Cement.
• Fero industries.
• ROC Oil.
• WesfarmersD.
• CSBP ammonia.
• Maitland LNG Plant.
• Thomas Road.
• Whiteman Brick.
SWIS GPG • Cockburn.
• NewGen Kwinana.
• Pinjar.
• Kemerton.
• NewGen Neerabup.
• Wagerup.
• KwinanaE.
• Perth Energy Kwinana.
Non-SWIS GPG • Carnarvon power station.
• Onslow power station.
• Exmouth power station.
• Port Hedland power station.
• Karratha power stationF.
• South Hedland.
A. Includes one delivery point on the DBP and one on the Parmelia pipeline.
B. Includes two delivery points on the DBP.
C. Includes the mine site and power station (two delivery points).
D. Including Wesfarmers gas and LNG facilities.
E. Includes two delivery points on the DBP.
F. Includes one delivery point on the DBP and one on the Pilbara Energy pipeline.

© AEMO 2020 | 2020 Western Australia Gas Statement of Opportunities 79
A6. WA gas infrastructure
WA gas infrastructure includes multi-user gas storage facilities, domestic gas transmission
pipelines, spot and short-term trading mechanisms, and LNG export production facilities.
Information on domestic gas production facilities is provided in Chapter 3.
A6.1 Gas transmission pipelines
A map of WA’s gas transmission network is shown in Figure 30.
Figure 30 Gas transmission pipelines in WA
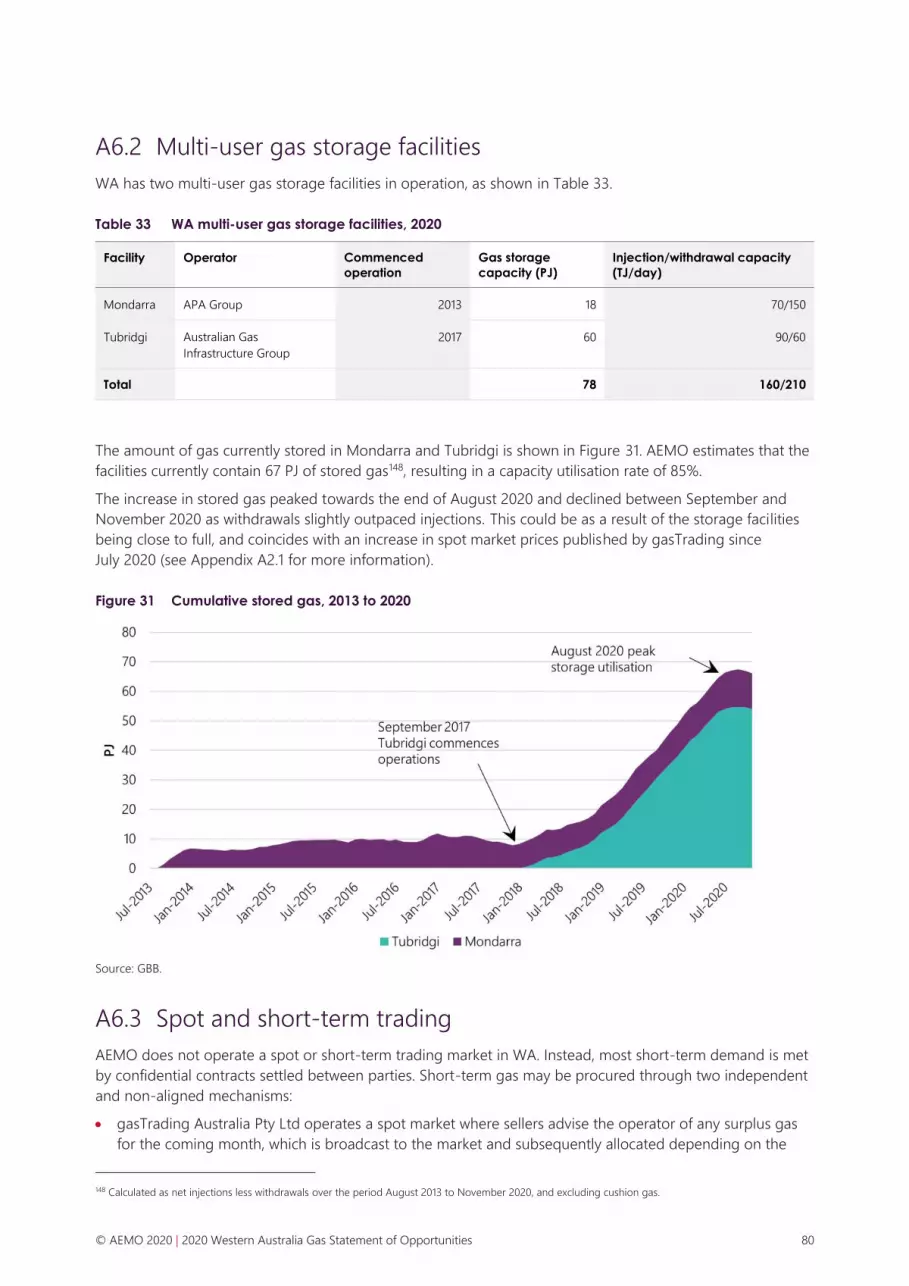
© AEMO 2020 | 2020 Western Australia Gas Statement of Opportunities 80
A6.2 Multi-user gas storage facilities
WA has two multi-user gas storage facilities in operation, as shown in Table 33.
Table 33 WA multi-user gas storage facilities, 2020
Facility Operator Commenced
operation
Gas storage
capacity (PJ)
Injection/withdrawal capacity
(TJ/day)
Mondarra APA Group 2013 18 70/150
Tubridgi Australian Gas
Infrastructure Group
2017 60 90/60
Total 78 160/210
The amount of gas currently stored in Mondarra and Tubridgi is shown in Figure 31. AEMO estimates that the
facilities currently contain 67 PJ of stored gas148, resulting in a capacity utilisation rate of 85%.
The increase in stored gas peaked towards the end of August 2020 and declined between September and
November 2020 as withdrawals slightly outpaced injections. This could be as a result of the storage facilities
being close to full, and coincides with an increase in spot market prices published by gasTrading since
July 2020 (see Appendix A2.1 for more information).
Figure 31 Cumulative stored gas, 2013 to 2020
Source: GBB.
A6.3 Spot and short-term trading
AEMO does not operate a spot or short-term trading market in WA. Instead, most short-term demand is met
by confidential contracts settled between parties. Short-term gas may be procured through two independent
and non-aligned mechanisms:
• gasTrading Australia Pty Ltd operates a spot market where sellers advise the operator of any surplus gas
for the coming month, which is broadcast to the market and subsequently allocated depending on the
148 Calculated as net injections less withdrawals over the period August 2013 to November 2020, and excluding cushion gas.
© AEMO 2020 | 2020 Western Australia Gas Statement of Opportunities 81
ranking of the purchasers’ offers and availability. The exact volumes available are confirmed by the seller
one day ahead. Trade data is published on gasTrading’s website at the end of each month.
• Energy Access Services Pty Ltd operates a real-time energy trading platform where members enter gas
trade agreements with a focus on supply durations of up to 90 days. Trades can encompass firm and
interruptible gas arrangements, as well as imbalances, and trade data is published monthly on the Energy
Access website.
AEMO estimates that approximately 3-5% of total gas consumption in WA is traded on a short-term basis.
Information in the public domain regarding the quantity and associated prices of spot or short-term gas is
provided by gasTrading Australia Pty Ltd and Energy Access Services Pty Ltd.
A6.4 LNG export production facilities
WA’s LNG nameplate production capacity totals 46.3 mtpa and consists of four production facilities: NWS
(KGP) – 16.9 mtpa149, Pluto – 4.9 mtpa150, Gorgon – 15.6 mtpa151, and Wheatstone – 8.9 mtpa152.
Two additional facilities source gas from WA waters, but the liquefaction either occurs offshore or in the
Northern Territory, and therefore they do not contribute to WA’s overall LNG production capacity:
• Prelude – a 3.6 mtpa153 floating LNG facility operated by Royal Dutch Shell plc, which exports directly from
the offshore vessel.
• Ichthys – a 8.9 mtpa154 LNG project operated by Inpex Corporation, which has an onshore liquefaction
plant located in Darwin.
149 Woodside. “North West Shelf”. Available at: https://www.woodside.com.au/our-business/north-west-shelf. Viewed 30 October 2020.
150 Woodside. “Pluto LNG”. Available at: https://www.woodside.com.au/our-business/pluto-lng. Viewed 30 October 2020.
151 Chevron Australia. “Gorgon project”. Available at: https://australia.chevron.com/our-businesses/gorgon-project. Viewed 30 October 2020.
152 Woodside. “Wheatstone project”. Available at: https://www.woodside.com.au/our-business/wheatstone-project. Viewed 30 October 2020.
153 Shell. “Prelude FLNG marine terminal”. Available at: https://www.shell.com.au/about-us/projects-and-locations/prelude-flng-marine-terminal. Viewed 30
October 2020.
154 Inpex. “Ichthys LNG”. Available at: https://www.inpex.com.au/projects/ichthys-lng/. Viewed 30 October 2020.

© AEMO 2020 | 2020 Western Australia Gas Statement of Opportunities 82
A7. Conversion tables
The following conversion factors have been applied in preparing figures for this 2020 WA GSOO.
Table 34 Conversion factors
To
Billion cubic
meters NG
Billion cubic
feet NG
Million tonnes
of oil
equivalent
Million
tonnes LNG
Trillion
British
thermal
units
Million
barrels of
oil
equivalent
Petajoule
From Multiply by
Billion cubic
meters NG 1 35.3 0.9 0.74 35.7 6.6 37.45
Billion cubic
feet NG 0.028 1 0.025 0.0216 1.01 0.19 1.06
Million
tonnes of oil
equivalent
1.11 39.2 1 0.82 39.7 7.33 -
Million
tonnes LNG 1.36 48 1.22 1 48.6 8.97 55.43
Trillion British
thermal
units
0.028 0.99 0.025 0.021 1 0.18 1.06
Million
barrels of oil
equivalent
0.15 5.35 0.14 0.11 5.41 1 5.82
Petajoule 0.027 0.943 - 0.018 0.943 0.172 1

© AEMO 2020 | 2020 Western Australia Gas Statement of Opportunities 83
Abbreviations and units of measure
Units of measure
Abbreviation Unit of measure
A$ Australian dollar
GJ Gigajoule
mtpa Million tonnes per annum
MW Megawatt
MWh Megawatt hour
PJ Petajoule
Q Quarter
tcf Trillion cubic feet
TJ Terajoule
Abbreviations
Abbreviation Expanded name
1P Proved reserves
2C Contingent resources
2P Proved and probable reserves
ABS Australian Bureau of Statistics
ACCC Australian Competition and Consumer Commission
AEMO Australian Energy Market Operator
CDD Cooling degree days
CEFA Clean Energy Fuels Australia
CSBP Cuming Smith British Petroleum and Farmers Limited

© AEMO 2020 | 2020 Western Australia Gas Statement of Opportunities 84
Abbreviation Expanded name
DBP DBNGP (WA) Transmission Pty Ltd
DBNGP Dampier to Bunbury Natural Gas Pipeline
DER Distributed energy resources
DJTSI WA Department of Jobs, Tourism, Science, and Innovation
DMIRS WA Department of Mines, Industry Regulation and Safety
DMO Domestic market obligation
EDL Energy Developments Limited
EPA Environmental Protection Agency
ERA Economic Regulation Authority
ESOO Electricity Statement of Opportunities
FID Final investment decision
FIR Formal information request
FMG Fortescue Metals Group
GBB Gas Bulletin Board
GMP Gas Market Participant
GPG Gas powered generation
GSA Gas Sale Agreement
GSI Rules Gas Services Information Rules
GSOO Gas Statement of Opportunities
HDD Heating degree days
KGP Karratha Gas Plant
LNG Liquefied natural gas
LPG Liquified petroleum gas
MCQ Maximum contracted quantity
NIEIR National Institute of Economic and Industry Research
NWIS North West Interconnected System
NWS North West Shelf
PPA Power Purchase Agreement
PPI Purchasing Power Index
PV Photovoltaics
SOP Sulphate of potash
SWIS South West interconnected system

© AEMO 2020 | 2020 Western Australia Gas Statement of Opportunities 85
Abbreviation Expanded name
WA Western Australia
WEM Wholesale Electricity Market

© AEMO 2020 | 2020 Western Australia Gas Statement of Opportunities 86
Glossary
This document uses terms that have meanings defined in the GSI Rules. The GSI meanings are adopted unless
otherwise specified.
Term Definition
1P A measure of gas reserves that includes proven (developed and undeveloped) reserves.
2C A measure of gas resources that are considered less commercially viable than reserves. 2C resources are
considered the best estimate of sub-commercial reserves.
2P A measure of gas reserves that includes proven (developed and undeveloped) and probable reserves.
Backfill Connecting additional gas fields or reserves to an existing domestic gas production facility, instead of
building new processing infrastructure (sometimes referred to as a tie-back).
Committed projects Gas supply or demand projects that are existing, under construction or have taken a positive FID.
Distribution network The low-pressure networks operated by ATCO and used to supply residential and non-residential
customers in the Perth metropolitan area and regional centres of Albany, Bunbury, Geraldton, and
Kalgoorlie.
Domestic gas
demand Includes all major industrial and commercial loads, electricity generators, and small-use customers
connected to WA’s gas transmission and distribution networks.
Large customers Gas customers using 10 TJ/day or more (GBB Large Users).
LNG feedstock Natural gas that enters an LNG production train for removal of impurities and liquefaction.
Potential gas supply Instead of forecasting how much gas is expected to be supplied over the outlook period, AEMO’s forecasts
of potential gas supply reflect how much gas could be produced if there was market demand for it at the
forecast price. This approach is useful in assessing supply adequacy and identifying potential supply
shortfalls.
Prospective projects Prospective gas supply sources include all gas field developments which have been publicly announced
that would make supply available to the WA domestic gas market, including LNG projects. Selected
prospective supply sources have been included in the potential gas supply model.
Prospective gas demand projects are only included in the high scenario and must meet set criteria
(described in Appendix A3.2.1). These include projects that may switch from diesel to gas electricity
generation.
Ramping
requirements The difference between minimum and peak demand in the SWIS is widening with increasing uptake of
behind the meter PV and large-scale solar. This, combined with increased intermittent wind generation,
requires generation (usually GPG) that is capable of rapidly increasing output (“ramping”) over a short
period of time to meet evening peak demand.
Total gas demand Domestic gas demand plus an estimate of the gas required to produce LNG for export, reflecting an
overall assessment of the demand for natural gas in WA.
Transmission network The high-pressure pipelines used to transport large volumes of gas from the production facilities to
customers. Large customers can connect directly to the transmission network, while smaller customers are
supplied through the distribution network connected to the transmission network.


