Embed Size (px)
Citation preview

Reckitt Annual Report and Accounts 2021
Financial StatementsGovernanceStrategic Report
193
1 Our opinion is unmodifiedWe have audited the Financial Statements of Reckitt Benckiser Group plc (“the Company”) for the year ended 31 December 2021 which comprise the Group Income Statement, Group Statement of Comprehensive Income, Group Balance Sheet, Group Statement of Changes in Equity, Group Cash Flow Statement, and the related Notes, including the accounting policies in Note 1 to the Group Financial Statements, and the Parent Company Balance Sheet, Parent Company Statement of Changes in Equity and the related Notes, including the accounting policies in Note 1 to the Parent Company Financial Statements.
In our opinion:
• the Financial Statements give a true and fair view of the state of the Group’s and of the Parent Company’s affairs as at 31 December 2021 and of the Group’s loss for the year then ended;
• the Group Financial Statements have been properly prepared in accordance with UK-adopted international accounting standards;
• the Parent Company Financial Statements have been properly prepared in accordance with UK accounting standards, including FRS 102 the Financial Reporting Standard applicable in the UK and Republic of Ireland; and
• the financial statements have been prepared in accordance with the requirements of the Companies Act 2006.
Additional opinion in relation to IFRS as issued by the IASB:As explained in Note 1 to the Group Financial Statements, the Group, in addition to complying with its legal obligation to apply UK-adopted international accounting standards, has also applied IFRSs as issued by the International Accounting Standards Board (“IASB”).
In our opinion the Group Financial Statements have been properly prepared in accordance with IFRS as issued by the IASB.
Basis for opinionWe conducted our audit in accordance with International Standards on Auditing (UK) (“ISAs (UK)”) and applicable law. Our responsibilities are described below. We believe that the audit evidence we have obtained is a sufficient and appropriate basis for our opinion. Our audit opinion and matters included in this report are consistent with our report to the Audit Committee.
We were first appointed as auditor by the Shareholders on 3 May 2018. The period of total uninterrupted engagement is for the four financial years ended 31 December 2021. The Group lead engagement partner is required to rotate after five years. This is Richard Broadbelt’s fourth year as lead engagement partner. We have fulfilled our ethical responsibilities under, and we remain independent of the Group in accordance with, UK ethical requirements including the FRC Ethical Standard as applied to listed public interest entities. No non-audit services prohibited by that standard were provided.
Overview
Materiality: Group Financial Statements as a whole
£135 million (2020: £150 million)5.2% (2020: 5.1%) of normalised Group profit/loss before tax as defined in section 3
Coverage 76% (2020: 79%) of Group Net Revenue 83% (2020: 83%) of total profits and losses that made up Group loss/profit before tax 84% (2020: 87%) of Group total assets
Key audit matters vs 2020
Recurring risks Revenue recognition in relation to trade spend arrangements and associated accruals
Recoverability of goodwill and indefinite life intangible assets relating to the IFCN Cash Generating Unit (CGU)
Provisions for uncertain tax positions (UTPs)
Contingent liabilities arising from the amendment to the South Korean Humidifier Sanitiser (HS) law
Recoverability of the Parent Company’s investment in Reckitt Benckiser Limited
Event driven New: Allocation of consideration between the Biofreeze brand intangible and goodwill
INDEPENDENT AUDITOR’S REPORTTO THE MEMBERS OF RECKITT BENCKISER GROUP PLC
194
Independent Auditor’s Report (Continued)
2 Key audit matters: our assessment of risks of material misstatementKey audit matters are those matters that, in our professional judgement, were of most significance in the audit of the Financial Statements and include the most significant assessed risks of material misstatement (whether or not due to fraud) identified by us, including those which had the greatest effect on: the overall audit strategy; the allocation of resources in the audit; and directing the efforts of the engagement team.
We include below the key audit matters, in decreasing order of audit significance, in arriving at our audit opinion above, together with our key audit procedures to address those matters and, as required for public interest entities, our results from those procedures. These matters were addressed, and our results are based on procedures undertaken, in the context of, and solely for the purpose of, our audit of the Financial Statements as a whole, and in forming our opinion thereon, and consequently are incidental to that opinion, and we do not provide a separate opinion on these matters.
Revenue recognition in relation to trade spend arrangements and associated accrualsTrade spend accruals: (£1,137 million; 2020: £1,275 million)
Refer to page 136 (Audit Committee Report), Note 1 on page 216 (accounting policy) and Note 21 on page 240 (financial disclosures).
The risk: subjective estimateThe Group regularly enters into complex arrangements providing pricing, placement and other promotional rebates and allowances to its customers. These trade spend arrangements can vary in complexity by market, product category and customer.
Revenue is measured net of outflows arising from such arrangements which, for agreements or practices spanning a period end, requires an estimate of the extent and value of future activity. These estimates can be subjective and require the use of assumptions that are susceptible to management bias and fraud.
The Group operates a variable compensation scheme with outturns directly linked to financial performance against targets. Strong financial performance could create an incentive to defer revenues into the next financial year by overstating trade spend accruals. Conversely, weaker financial performance may create a bias to understate trade spend accruals. Whilst the risk of a material misstatement in an individual market is remote, there is a risk that unacceptable judgements in multiple markets may, in aggregate, misstate the Group Financial Statements.
The effect of these matters is that, as part of our risk assessment, we determined that trade spend accruals carry a high degree of estimation uncertainty, with a potential range of reasonable outcomes greater than our materiality for the Group Financial Statements as a whole.
Our procedures included:Accounting policies: We critically assessed the appropriateness of the Group’s accounting policies relating to trade spend.
Historical comparisons: We assessed the accuracy of the Group’s accruals by comparing, for a selection of the more judgemental accruals, those recognised in the prior year to the actual trade spend incurred.
With the assistance of KPMG Forensic specialists, we assessed the results of the investigation performed by management to assess evidence supporting the creation, utilisation and release of certain accruals within the Hygiene GBU. Where we identified significant differences between the expected and final quantum of outflow, we considered whether such differences were as a result of a change in estimate or error. We performed an assessment of whether an overstatement of accruals identified through these procedures was material.
Tests of detail: We focused our testing on those trade spend accruals we considered to be more judgemental or potentially subject to management bias and fraud. For a sample of these trade spend accruals, we:
• reperformed the calculation to assess whether it was mathematically accurate;
• identified the key assumptions in the calculation of each accrual selected, such as forecast sales volumes, rebate structure and settlement mechanism;
• agreed those key assumptions to relevant documentation, such as invoices received after the balance sheet date, customer agreements or third-party consumption data; and
• assessed whether the key assumptions were consistent with external data points and the Group’s historic experience of comparable trade spend arrangements.
Incorporating unpredictability into our audit: A requirement of auditing standards is that we undertake procedures which are deliberately unexpected and could not have reasonably been predicted by management. We performed unpredictable procedures over certain trade spend accruals in seven out of scope components in different geographic locations in the current year.
Assessing transparency: We assessed the adequacy of the Group’s disclosures in relation to the degree of estimation involved in arriving at the trade spend accruals and the resulting amount of trade spend deducted in determining Net Revenue.
We performed the detailed tests above rather than seeking to rely on any of the Group’s controls because the detailed testing described is inherently the most effective means of obtaining audit evidence in this area.
Our results:We found the trade spend accruals recognised to be acceptable (2020 result: acceptable).
Reckitt Annual Report and Accounts 2021
Financial StatementsGovernanceStrategic Report
195
Recoverability of goodwill and indefinite life intangible assets relating to the IFCN CGUIFCN goodwill and indefinite life intangible assets (£5,668 million; 2020: £9,849 million)
Impairment charge (£nil million; 2020: £985 million)
Refer to page 136 (Audit Committee Report), Note 1 on page 216 (accounting policy) and Note 9 on pages 222 to 225 (financial disclosures).
The risk: forecast-based valuationThe recoverability of goodwill and indefinite life intangible assets relating to the Infant and Child Nutrition (“IFCN”) cash generating unit (“CGU”) is assessed using forecast financial information within a discounted cash flow model (“the model”).
The disposal of IFCN China in 2021, and the resulting impact on the composition of the CGU has reduced the risk around the recoverability of goodwill and indefinite life intangible assets. Nonetheless, the model remains highly sensitive to changes in key assumptions, both in relation to forecast financial performance, in particular, Net Revenue growth and margin improvements, as well as external factors such as discount rates and terminal growth rates.
The specific assumptions considered most critical are the impact of long term birth rate trends, future category growth, the commercial success of new product launches including adult nutrition, the expansion of specialty nutrition, the ability to pass on inflationary pressures through price rises, and the delivery of margin improvements through productivity initiatives.
While the current year carrying amount of the IFCN CGU is supported by the value of the model, the recoverable amount of the IFCN CGU is subject to a high degree of estimation uncertainty.
When conducting an impairment assessment, there is an inherent risk of fraud that the Group may use assumptions that are overly optimistic and which could result in no impairment charge being recognised.
The effect of these matters is that, as part of our risk assessment, we determined that the value in use of the IFCN CGU has a high degree of estimation uncertainty and there exists a reasonably possible set of changes in key assumptions that would result in a change to the IFCN valuation in excess of our materiality for the Group Financial Statements as a whole and possibly many times that amount. The Group Financial Statements (note 9) disclose the sensitivity estimated by the Group.
2 Key audit matters: our assessment of risks of material misstatement continued

196
Our procedures included:Sensitivity analysis: We considered the sensitivity of the recoverable amount of the IFCN CGU to reasonably possible changes in key assumptions, identified changes to these assumptions since previous forecasts, and focused our attention on those assumptions we considered to be most sensitive, judgemental or otherwise prone to management bias.
Historical comparisons: We compared the actual performance of IFCN since acquisition against previous budgets and forecasts to assess the Group’s ability to forecast accurately and considered the impact on our evaluation of forecast growth. We critically challenged the margin projections by reference to those achieved historically, forecast volume trends, forecast and realised savings from the productivity programme and the Group’s historic ability to pass on cost inflation through price rises.
We challenged the Group on the forecast commercial success of new product launches, particularly in relation to adult nutrition, and its ability to deliver forecast Net Revenue growth by assessing the Group’s past experience in bringing new or improved products to market.
Benchmarking assumptions: We critically evaluated differences between Net Revenue growth assumptions within the model and external market data relating to projected growth for the product category. We critically challenged the Group on its assumptions relating to the expectations of long term birth rates and inflationary effects including through comparison to external market data sources.
We benchmarked margin assumptions against industry competitors, external market volume growth forecasts and our assessment of the Group’s ability to achieve productivity savings. We also benchmarked the terminal growth rate assumptions against long-term estimates of inflation.
Personnel interviews: We compared judgements made centrally to direct discussions with Nutrition GBU leadership, country General Managers and Finance Directors. We considered and challenged the Group’s assumptions with reference to any alternative views provided.
We corroborated the consistency of key assumptions used within the model to papers presented to, and minutes taken at, meetings of the Board.
Our valuation expertise: We independently derived a reasonable range of appropriate discount rates, with the assistance of our own valuation specialists, compared these to those calculated by the Group and challenged differences in assumptions between the calculations. We benchmarked the recoverable amount of the IFCN CGU using implied earnings multiples to comparative companies, historic transactions within the industry, including the Group’s disposal of IFCN China in 2021, and stockbrokers’ reports with the assistance of our own valuation specialists.
Assessing transparency: We considered the adequacy of the disclosures provided by Note 9 of the Group Financial Statements in relation to relevant accounting standards. We paid particular attention to the transparency of the sensitivity disclosures, including that they appropriately reflect uncertainty inherent in the assessment of recoverable amount, as well as the impact of reasonable changes in key assumptions.
We performed the tests above rather than seeking to rely on any of the Group’s controls because the nature of the balance is such that we would expect to obtain audit evidence primarily through the detailed procedures described.
Our results:We found the Group’s conclusion that there is no impairment of goodwill and indefinite life intangible assets relating to the IFCN CGU to be acceptable (2020 result: we found the goodwill and indefinite life intangible assets, and the related impairment charge, to be acceptable).
2 Key audit matters: our assessment of risks of material misstatement continued
Independent Auditor’s Report (Continued)

Reckitt Annual Report and Accounts 2021
Financial StatementsGovernanceStrategic Report
197
Provisions for uncertain tax positions (UTPs)(£770 million; 2020: £950 million)
Refer to page 136 (Audit Committee Report), Note 1 on page 216 (accounting policy) and Note 22 on page 240 (financial disclosures).
The risk: subjective estimateDue to the Group operating across a number of different tax jurisdictions, and the complexities of transfer pricing and other international tax legislation, it is subject to periodic challenge by local tax authorities on a range of tax matters arising in the normal course of business.
These challenges by the local tax authorities include but are not limited to:
• transfer pricing arrangements relating to the Group’s operating model;
• transfer pricing arrangements relating to the ownership of intellectual property rights that are used across the Group;
• deductibility of interest on intra-Group borrowings;
• the European Commission’s ongoing State Aid investigations into transfer pricing ruling practices of certain member states.
Provision for uncertain tax positions requires the Directors to make judgements and estimates in relation to tax issues and exposures where the Group may be challenged by local tax authorities on its interpretation of tax legislation. Auditor judgement is required to assess whether the Directors’ overall estimate, taking into account the Group’s internally derived key assumptions such as the risk rating applied to a certain jurisdiction and the consequential percentage applied to calculate the provision, falls within an acceptable range.
The effect of these matters is that, as part of our risk assessment, we determined that the estimates of uncertain tax positions has a high degree of estimation uncertainty, with a potential range of reasonable outcomes greater than our materiality for the Group Financial Statements as a whole.
Our procedures included:Our tax expertise: We used our own international and local tax specialists to assist us to:
• Inspect and assess the Group’s centrally prepared transfer pricing policies to determine whether they reflect the risks, activities and substance of each of the entities within the supply chain; and
• Assess the Group’s tax positions, its correspondence with the relevant tax authorities, and to analyse and challenge the assumptions used to determine provisions for tax uncertainties based on our knowledge and experiences of the application of tax legislation.
Historical comparisons: We assessed the historical accuracy of the provision level following any recent court judgements and results of relevant tax authority audits and considered the impact on the remaining provision.
Assessing transparency: We assessed the adequacy of the Group’s disclosures in respect of uncertain tax positions.
We performed the tests above rather than seeking to rely on any of the Group’s controls because the nature of the balance is such that we would expect to obtain audit evidence primarily through the detailed procedures described above.
Our results: We found the level of uncertain tax provisioning to be acceptable (2020 result: acceptable).
2 Key audit matters: our assessment of risks of material misstatement continued
198
Contingent liabilities arising from the amendment to the South Korean Humidifier Sanitiser (HS) lawRefer to page 136 (Audit Committee Report), Note 1 on page 216 (accounting policy) and Note 20 on page 239 (financial disclosures).
The risk: dispute outcomeThe Group is involved in an ongoing litigation relating to the HS issue in South Korea. The HS law amendment enacted on 25 September 2020 significantly altered the legal framework under which HS claims were previously made and settled. As a result, judgement is needed to assess whether the recognition criteria for a provision have been met for additional litigation under the HS law amendment.
The Group must assess the likelihood and extent of any future economic outflow arising from the HS law amendment. The amounts involved are potentially significant, and the application of accounting standards to determine the amount, if any, to be provided for, is inherently subjective.
Our procedures included:Enquiry of lawyers: We enquired of the Group’s internal and external counsel to obtain an understanding of this year’s developments, in particular the progress of litigations and the establishment of a mediation panel between HS companies and claimant groups.
We made inquiries of the Group’s external legal counsel to understand developments in the matter. We requested and received formal correspondence directly from the Group’s external counsel that evaluated the current status of legal proceedings, the probability of economic outflow in relation to the law amendment, and the ability to reliably estimate such economic outflow.
We corroborated the consistency of the judgement made by management to inquiries with both internal and external legal counsel.
Assessing transparency: We assessed the adequacy of the Group’s disclosures of contingent liabilities related to the HS law amendment in Note 20 of the Group Financial Statements, particularly the uncertainties relating to the amount and timing of outflow.
We performed the tests above rather than seeking to rely on any of the Group’s controls because the nature of the balance is such that we would expect to obtain audit evidence primarily through the detailed procedures described.
Our results:We found the Group’s treatment of the impact of the HS law amendment as contingent liabilities to be acceptable (2020: acceptable).
Allocation of consideration between the Biofreeze brand intangible and goodwillBiofreeze brand intangible asset £564 million; goodwill £271 million.
Refer to page 136 (Audit Committee Report), Note 1 on page 211 (accounting policy) and Note 29 on pages 250 to 252 (financial disclosures).
The risk: forecast based valuationOn 12 July 2021, the Group purchased the Biofreeze and TheraPearl brands from Performance Health for cash consideration of £766 million. The acquisition was accounted for as a business combination with net identifiable acquired assets of £495 million – substantially comprising of the Biofreeze brand intangible of £564 million – and goodwill of £271 million being recognised.
The Biofreeze brand intangible is recognised at fair value at the date of acquisition. To estimate fair value, the Directors use a discounted forecast cash flow model (‘the model’), which requires the application of complex valuation techniques and is sensitive to changes in key assumptions. Any changes in identifiable asset valuation would impact the value of goodwill recognised.
Key assumptions in the model include forecast financial performance, in particular net revenue and margin growth; as well as external factors such as forecast growth of the topical analgesic category as a whole and discount rates.
As part of our risk assessment, we therefore determined that the allocation of consideration between the Biofreeze brand intangible and goodwill is dependent upon a number of key assumptions. There exists a reasonably possible set of changes in such assumptions that could result in a material change to value of consideration allocated to the Biofreeze brand intangible.
2 Key audit matters: our assessment of risks of material misstatement continued
Independent Auditor’s Report (Continued)

Reckitt Annual Report and Accounts 2021
Financial StatementsGovernanceStrategic Report
199
Our procedures included: Sensitivity analysis: We considered the sensitivity of the Biofreeze brand intangible valuation to reasonably possible changes in assumptions and focused our attention to those assumptions which we considered the most critical to the valuation.
Benchmarking assumptions: We evaluated the Net Revenue growth assumptions in the model with reference to historic Biofreeze performance and external market data relating to projected growth for the product category as a whole.
Personnel interviews: We compared judgements made centrally to direct discussions with the relevant Finance Directors and Sales Managers. We considered and challenged the Group’s assumptions with reference to any alternative views provided in-market.
Valuation expertise: With the assistance of our own valuation specialist we evaluated the basis used by the Group to value the acquired intangible assets. We challenged the appropriateness of the key assumptions underlying the Biofreeze brand intangible valuation, including the discount rate used.
We performed the tests above rather than seeking to rely on any of the Group’s controls because the nature of the balances is such that we would expect to obtain audit evidence primarily through the detailed procedures described.
Our results:We found the Group’s valuation of the Biofreeze brand intangible and the consequential goodwill balance at the acquisition date to be acceptable (2020 result: n/a).
Recoverability of the Parent Company’s investment in the subsidiary, Reckitt Benckiser Limited(£15,001 million, 2020: £14,975 million)
Refer to page 257 (accounting policy) and page 258 (financial disclosures).
The risk: low risk, high valueThe carrying amount of the Parent Company’s investment in its subsidiary, Reckitt Benckiser Limited, represents 99.5% (2020: 99.6%) of the Parent Company’s total assets. Its recoverability is not at a high risk of significant misstatement or subject to significant judgement. However, due to its materiality in the context of the Parent Company Financial Statements, this is considered to be the area that had the greatest effect on our overall Parent Company audit.
Our procedures included:Comparing valuations: We performed a reconciliation of the carrying amount of the investment to the market capitalisation of the Group as Reckitt Benckiser Limited, either directly or indirectly, owns all other subsidiaries of the Group.
We performed the tests above rather than seeking to rely on any of the company’s controls because the nature of the balance is such that we would expect to obtain audit evidence primarily through the detailed procedures described above.
Our results:We found the Company’s conclusion that there is no impairment of its investment in the subsidiary to be acceptable (2020 result: acceptable).
2 Key audit matters: our assessment of risks of material misstatement continued

Group loss before tax normalised to exclude adjusting items £2,593 million (2020: £2,934 million)
Group Materiality£135 million (2020: £150 million)
£135 millionWhole financial statements materiality(2020: £150 million)
£100 millionRange of materiality at 48 components (£8 million to £100 million)(2020: 54 components (£8 million to £100 million))
£6.0 millionMisstatements reported to the Audit Committee(2020: £7 million)
Group loss before tax normalised to exclude adjusting items
Group materiality
Full scope for Group audit purposes 2021
76%(2020: 79%)
24%
76%
79% 82%
1%
17%
Group Net Revenue
Group total assets
Key:
Audit of account balances 2021
21%
16%
13%
84%
86%
1%
83%(2020: 83%)
17%
83%
84%(2020: 87%)
Full scope for Group audit purposes 2020
Specified risk-focused procedures 2020
Residual components 2020Residual components 2021
Group profits and losses that made up Group loss before tax
200
3 Our application of materiality and an overview of the scope of our auditMaterialityMateriality for the Group Financial Statements as a whole was set at £135 million, determined with reference to a benchmark of normalised Group loss before tax, of which it represents 5.2%. In 2020 materiality for the Group Financial Statements as whole was set at £150 million with reference to a benchmark of normalised Group profit before tax (PBT), of which it represented 5.1%.
We normalised PBT (2020: PBT) by adding back adjustments that do not represent the normal, continuing operations of the Group. The items we adjusted for were acquisition advisor costs, inventory fair value adjustments, losses on disposal of brands, reclassified foreign exchange translation on liquidation of subsidiaries and other individually material items of income or expense as defined on pages 85 to 86 totalling £2,854 million (2020: £1,061 million).
Materiality for the Parent Company Financial Statements as a whole was set at £65 million (2020: £75 million) determined with reference to a benchmark of Parent Company total assets of £15,071 million (2020: £15,034 million) of which it represents 0.4% (2020: 0.5%).
In line with our audit methodology, our procedures on individual account balances and disclosures were performed to a lower threshold, performance materiality, so as to reduce to an acceptable level the risk that individually immaterial misstatements in individual account balances add up to a material amount across the Financial Statements as a whole. Performance materiality was set at 75% (2020: 75%) of materiality for the financial statements as a whole, which equates to £100 million (2020: £110 million) for the Group and £49 million (2020: £55 million) for the parent Company. We applied this percentage in our determination of performance materiality because we did not identify any factors indicating an elevated level of risk.
We agreed to report to the Audit Committee any corrected or uncorrected identified misstatements exceeding £6.0 million (2020: £7.0 million) in addition to other identified misstatements that warranted reporting on qualitative grounds.
ScopeThe Group operates in more than 60 countries across six continents with the largest market being the United States of America. The Group is organised into three Global Business Units being Hygiene, Health and Nutrition.
We scoped the audit by obtaining an understanding of the Group and its environment and assessing the risk of material misstatement at the Group and component level. We have considered components on the basis of their contribution to Group Net Revenue, total profits and losses that made up Group loss/profit before tax and Group total assets. Of the Group’s 422 (2020: 429) reporting components, as instructed by us, component teams in 20 countries (2020: 21 countries) subjected 47 (2020: 54) to full scope audits for Group purposes and 1 (2020: 1) to an audit of account balance over inventory, cost of sales, property, plant and equipment, trade payables and cash. The component for which we performed work other than an audit for Group reporting purposes was not individually significant but was included in the scope of our Group reporting work in order to provide further coverage over the Group’s results. The components within the scope of our work accounted for the percentages illustrated opposite.
Independent Auditor’s Report (Continued)

Reckitt Annual Report and Accounts 2021
Financial StatementsGovernanceStrategic Report
201
The Group team performed procedures on the items excluded from normalised Group loss before tax (2020: Group profit before tax).
The remaining 24% (2020: 21%) of Group Net Revenue, 17% (2020: 17%) of total profits and losses that made up Group loss/profit before tax and 16% (2020: 13%) of Group total assets is represented by a number of other reporting components, none of which individually represented more than 1% (2020: 3%) of any of Group Net Revenue, total profits and losses that made up Group profit before tax or Group total assets. For these residual 374 (2020: 375) components, we performed analysis at an aggregated Group level to re-examine our assessment that no significant risks of material misstatement exist in those components.
The scope of the audit work performed was predominately substantive as we placed limited reliance upon the Group’s internal control over financial reporting.
Team StructureThe Group audit team is required to instruct the component teams about their responsibilities in relation to the consolidated Group audit and to understand the approach taken by component auditors to meet these responsibilities. The Group audit team is also required to understand the conclusions reached by component auditors and to review and challenge the work they have performed to reach these conclusions.
Due to the continuation of travel restrictions imposed as a result of COVID-19, the Group audit team was again unable to physically visit any overseas components in 2021 (2020: no components). Instead, the virtual communication and oversight strategy implemented in 2020 remained in place between the Group audit team and component auditors. This included:
• Virtual global planning conferences led by the Group audit team to discuss key audit risks and obtain input from component auditors;
• Instructions issued by the Group audit team to component auditors setting out the significant areas to be covered, including the relevant key audit matters identified above and the information to be reported back to the Group audit team;
• Approval by the Group audit team of the component materiality for all components, which ranged from £8 million to £100 million (2020: £8 million to £100 million), having regard to the mix of size and risk profile of the Group across the components, including considering the benchmark for each component;
• Attendance by senior members of the Group audit team and relevant component auditors at management’s balance sheet reviews for all in-scope component locations and by the Group audit team at 1 out-of-scope component locations, the latter to incorporate an element of unpredictability into our audit and to reconfirm our risk;
• Risk assessment and challenge sessions with each component audit team in the planning and final phases of the audit led by a senior member of the Group audit team;
• Attendance by members of the Group audit team and relevant component auditors at year end clearance meetings where the findings reported to the Group audit team were discussed in more detail and any further work required by the Group audit team was then performed by the component auditors; and
3 Our application of materiality and an overview of the scope of our audit continued
• Review of key working papers within component audit files (using remote technology capabilities) to understand and challenge the audit approach and audit findings of each component audit.
The work on 46 of the 48 components (2020: 52 of the 54 components) was performed by component auditors and the rest, including the audit of the Parent Company, was performed by the Group audit team.
4 The impact of climate change on our auditIn planning our audit, we have considered the potential impact of risks arising from climate change on the Group’s business and its financial statements. This included considering the Group’s exposure to supply chain risks, physical risks, regulatory risks, market risks, and consumer preference risks. We considered that the key estimate or judgement contained within the financial statements for which climate change could have the greatest impact was the recoverability of goodwill and indefinite life intangible assets relating to the IFCN CGU and considered the adequacy of the Group’s sensitivity disclosures in relation to the impact of climate change on the impairment test. We concluded that, given the likely impact of the Group’s current climate plans, climate-related risks were not a key assumption in the value in use calculation.
While the impact of climate change on the Group is inherently uncertain, our risk assessment was therefore that the impact of climate change does not currently have a material impact on the financial statements. Climate change therefore only had a limited impact on the overall audit strategy, the allocation of resources in the audit and directing the efforts of the engagement team.
We have read the Group’s TCFD Summary on pages 66 to 67 of the Strategic Report and considered the consistency of this disclosure with the financial statements and our audit knowledge.
5 Going ConcernThe Directors have prepared the Financial Statements on the going concern basis as they do not intend to liquidate the Group or the Parent Company or to cease their operations, and as they have concluded that the Group’s and the Parent Company’s financial position means that this is realistic. They have also concluded that there are no material uncertainties that could have cast significant doubt over their ability to continue as a going concern for at least a year from the date of approval of the Financial Statements (“the going concern period”).
We used our knowledge of the Group, its industry, and the general economic environment to identify the inherent risks to its business model and analysed how those risks might affect the Group’s and Parent Company’s financial resources or ability to continue operations over the going concern period. The risks that we considered most likely to adversely affect the Group’s and Parent Company’s available financial resources and metrics relevant to debt covenants over this period were:
• In relation to the COVID-19 pandemic, disruption at a number of the Group’s key production facilities, the viability of key suppliers and customers, and the impact of consumer demand for the Group’s brands;
• A significant product safety issue leading to reputational damage with customers, consumers or regulators; and
• The impact of a significant business continuity issue, outside of those risks presented by the COVID-19 pandemic, affecting the Group’s manufacturing facilities or those of its suppliers.
202
which the Group operates. The forensic specialists participated in the initial fraud risk assessment discussions and were consulted throughout the audit when further guidance was deemed necessary.
We communicated identified fraud risks throughout the audit team and remained alert to any indications of fraud throughout the audit. This included communication from the Group to component audit teams of relevant fraud risks identified at the Group level and request to all component audit teams to report to the Group audit team any instances of fraud that could give rise to a material misstatement at Group.
As required by auditing standards, and after considering the impact of the Group’s results against performance targets, we perform procedures to address the risk of management override of controls and the risk of fraudulent revenue recognition. We assessed that there is an inherent risk that Group and component management may be in a position to make inappropriate accounting entries, and risk of bias in accounting estimates and judgements. We determined that these risks would most likely manifest themselves in two key areas being:
• Trade spend accruals may be manipulated to alter the timing of recognition of revenue and profit; and
• Management bias in the recoverability of goodwill and indefinite life intangible assets relating to IFCN arising from external pressure to demonstrate improved business performance since the disposal of IFCN China in 2021.
Further detail in respect of both matters is set out in the key audit matter disclosures in section 2 of this report.
We performed procedures including:
• For all components within scope, identifying journal entries to test based on risk criteria and comparing the identified entries to supporting documentation. These included unusual journal entries associated with trade spend.
We discussed with the audit committee matters related to actual or suspected fraud, which included the results of an investigation commissioned by management to assess evidence supporting the creation, utilisation and release of certain operational expenditure and trade investment accruals within the Hygiene GBU (page 137), and considered any implications for our audit.
Identifying and responding to risks of material misstatement related to compliance with laws and regulationsWe identified areas of laws and regulations that could reasonably be expected to have a material effect on the Financial Statements from our general commercial and sector experience, through inquiries with the Directors and other management (as required by auditing standards), and from inspection of the Group’s regulatory and legal correspondence, relevant discussion with the Group’s external legal counsel and inspection of the policies and procedures regarding compliance with laws and regulations.
We communicated identified laws and regulations throughout our team and remained alert to any indications of non-compliance throughout the audit. This included communication from the Group to all component audit teams of relevant laws and regulations identified at the Group level, and a request for component auditors to report to the Group audit team any instances of non-compliance with laws and regulations that could give rise to a material misstatement at the Group level.
We considered whether these risks could plausibly affect the liquidity or covenant compliance in the going concern period by comparing severe, but plausible downside scenarios that could arise from these risks individually and collectively against the level of available financial resources and covenants indicated by the Group’s financial forecasts.
Our procedures also included an assessment of whether the going concern disclosure in note 1 to the Financial Statements gives a complete and accurate description of the Directors’ assessment of going concern.
Our conclusions based on this work:
• we consider that the Directors’ use of the going concern basis of accounting in the preparation of the Financial Statements is appropriate;
• we have not identified, and concur with the Directors’ assessment that there is not, a material uncertainty related to events or conditions that, individually or collectively, may cast significant doubt on the Group’s or Parent Company’s ability to continue as a going concern for the going concern period;
• we have nothing material to add or draw attention to in relation to the directors’ statement in note 1 to the Financial Statements on the use of the going concern basis of accounting with no material uncertainties that may cast significant doubt over the Group and Parent Company’s use of that basis for the going concern period, and we found the going concern disclosure in note 1 to be acceptable; and
• the related statement under the Listing Rules set out on page 192 is materially consistent with the Financial Statements and our audit knowledge.
However, as we cannot predict all future events or conditions and as subsequent events may result in outcomes that are inconsistent with judgements that were reasonable at the time they were made, the above conclusions are not a guarantee that the Group or the Parent Company will continue in operation.
6 Fraud and breaches of laws and regulations – ability to detectIdentifying and responding to risks of material misstatement due to fraudTo identify risks of material misstatement due to fraud (“fraud risks”) we assessed events or conditions that could indicate an incentive or pressure to commit fraud or provide an opportunity to commit fraud.
Our risk assessment procedures included:
• Enquiry of Directors, operational managers, the General Counsel, the Chief Ethics and Compliance Officer and members of the Internal Audit function as well as inspection of minutes of meetings of the Board, Audit Committee, Executive Committee and CRSEC Committee;
• Inspection of the Group’s policies and procedures to prevent, detect and respond to the risks of fraud, Internal Audit reports issued during the year and reports to the Group’s whistleblowing hotline and the responses to those reports, including those concerning investigations;
• Consideration of the Group’s results against performance targets and the Group’s remuneration policies;
• Consultation with our own forensic specialists to assist us in identifying fraud risks based on their experience of comparable businesses, similar sectors; as well as of the geographies in
5 Going Concern continued
Independent Auditor’s Report (Continued)
Reckitt Annual Report and Accounts 2021
Financial StatementsGovernanceStrategic Report
203
6 Fraud and breaches of laws and regulations – ability to detect continuedThe potential effect of these laws and regulations on the Financial Statements varies considerably.
Firstly, the Group is subject to laws and regulations that directly impact the Financial Statements including financial reporting legislation (including related companies legislation), distributable profits legislation, and taxation legislation (direct and indirect). We assessed the extent of compliance with these laws and regulations as part of our procedures on the related Financial Statement items.
Secondly, the Group is subject to many other laws and regulations where the consequences of non-compliance could have a material effect on amounts or disclosures in the Financial Statements, for instance through the imposition of fines or litigation or the loss of the Group’s permission to operate in countries where the non-adherence to laws could prevent trading in such countries. We identified the following areas as those most likely to have such an effect:
• Employee health and safety, reflecting the nature of the Group’s production and distribution process;
• Anti-bribery and corruption, reflecting that the Group operates in a number of countries where there is an opportunity to engage in bribery given more limited regulation;
• Interaction with healthcare professionals, reflecting the nature of the Group’s products in the Health and Nutrition Global Business Units;
• Global competition laws, reflecting the nature of the Group’s business and certain market share positions;
• Consumer product law such as product safety, quality standards and product claims, reflecting the nature of the Group’s diverse product base;
• Data privacy laws, reflecting the Group’s growing amounts of personal data held; and
• Intellectual property legislation, reflection the potential of the Group to infringe trademarks, copyright and patents.
Auditing standards limit the required audit procedures to identify non-compliance with these laws and regulations to enquiry of the Directors and other management and inspection of regulatory and legal correspondence, if any. Therefore, if a breach of operational regulations is not disclosed to us or evident from relevant correspondence, an audit will not detect that breach.
Further detail in respect of the effect of ongoing litigation relating to the HS issue in South Korea is set out in the key audit matter disclosures in section 2 of this report.
Context of the ability of the audit to detect fraud or breaches of law or regulationOwing to the inherent limitations of an audit, there is an unavoidable risk that we may not have detected some material misstatements in the Financial Statements, even though we have properly planned and performed our audit in accordance with auditing standards. For example, the further removed non-compliance with laws and regulations is from the events and transactions reflected in the Financial Statements, the less likely the inherently limited procedures required by auditing standards would identify it.
In addition, as with any audit, there remained a higher risk of non-detection of fraud, as these may involve collusion, forgery, intentional omissions, misrepresentations, or the override of internal controls. Our audit procedures are designed to detect material misstatement. We are not responsible for preventing non-compliance or fraud and cannot be expected to detect non-compliance with all laws and regulations.
7 We have nothing to report on the other information in the Annual ReportThe Directors are responsible for the other information presented in the Annual Report together with the Financial Statements. Our opinion on the Financial Statements does not cover the other information and, accordingly, we do not express an audit opinion or, except as explicitly stated below, any form of assurance conclusion thereon.
Our responsibility is to read the other information and, in doing so, consider whether, based on our Financial Statements audit work, the information therein is materially misstated or inconsistent with the Financial Statements or our audit knowledge.
Based solely on that work we have not identified material misstatements in the other information.
Strategic report and directors’ reportBased solely on our work on the other information:
• we have not identified material misstatements in the strategic report and the Directors’ report;
• in our opinion the information given in those reports for the financial year is consistent with the Financial Statements; and
• in our opinion those reports have been prepared in accordance with the Companies Act 2006.
Directors’ remuneration reportIn our opinion the part of the Directors’ Remuneration Report to be audited has been properly prepared in accordance with the Companies Act 2006.
Disclosures of emerging and principal risks and longer-term viabilityWe are required to perform procedures to identify whether there is a material inconsistency between the Directors’ disclosures in respect of emerging and principal risks and the viability statement, and the financial statements and our audit knowledge.
Based on those procedures, we have nothing material to add or draw attention to in relation to:
• the Directors’ confirmation within the Viability Statement (page 103) that they have carried out a robust assessment of the emerging and principal risks facing the Group, including those that would threaten its business model, future performance, solvency and liquidity;
• the principal and emerging risk disclosures describing these risks and how emerging risks are identified, and explaining how they are being managed and mitigated; and
• the Directors’ explanation in the Viability Statement of how they have assessed the prospects of the Group, over what period they have done so and why they considered that period to be appropriate, and their statement as to whether they have a reasonable expectation that the Group will be able to continue in operation and meet its liabilities as they fall due over the period of their assessment, including any related disclosures drawing attention to any necessary qualifications or assumptions.
204
9 Respective responsibilitiesDirectors’ responsibilitiesAs explained more fully in their statement set out on page 192, the Directors are responsible for: the preparation of the Financial Statements including being satisfied that they give a true and fair view; such internal control as they determine is necessary to enable the preparation of Financial Statements that are free from material misstatement, whether due to fraud or error; assessing the Group and Parent Company’s ability to continue as a going concern, disclosing, as applicable, matters related to going concern; and using the going concern basis of accounting unless they either intend to liquidate the Group or the Parent Company or to cease operations, or have no realistic alternative but to do so.
Auditor’s responsibilitiesOur objectives are to obtain reasonable assurance about whether the Financial Statements as a whole are free from material misstatement, whether due to fraud or error, and to issue our opinion in an auditor’s report. Reasonable assurance is a high level of assurance, but does not guarantee that an audit conducted in accordance with ISAs (UK) will always detect a material misstatement when it exists. Misstatements can arise from fraud or error and are considered material if, individually or in aggregate, they could reasonably be expected to influence the economic decisions of users taken on the basis of the Financial Statements.
A fuller description of our responsibilities is provided on the FRC’s website at www.frc.org.uk/auditorsresponsibilities.
10 The purpose of our audit work and to whom we owe our responsibilitiesThis report is made solely to the Company’s members, as a body, in accordance with Chapter 3 of Part 16 of the Companies Act 2006 and the terms of our engagement by the Company. Our audit work has been undertaken so that we might state to the Company’s members those matters we are required to state to them in an auditor’s report, and the further matters we are required to state to them in accordance with the terms agreed with the company, and for no other purpose. To the fullest extent permitted by law, we do not accept or assume responsibility to anyone other than the Company and the Company’s members, as a body, for our audit work, for this report, or for the opinions we have formed.
Richard Broadbelt (Senior Statutory Auditor)for and on behalf of KPMG LLP, Statutory Auditor Chartered Accountants 15 Canada Square London E14 5GL
13 April 2022
We are also required to review the Viability Statement, set out on page 103 under the Listing Rules. Based on the above procedures, we have concluded that the above disclosures are materially consistent with the Financial Statements and our audit knowledge.
Our work is limited to assessing these matters in the context of only the knowledge acquired during our Financial Statements audit. As we cannot predict all future events or conditions and as subsequent events may result in outcomes that are inconsistent with judgements that were reasonable at the time they were made, the absence of anything to report on these statements is not a guarantee as to the Group’s and Parent Company’s longer-term viability.
Corporate governance disclosuresWe are required to perform procedures to identify whether there is a material inconsistency between the Directors’ corporate governance disclosures and the Financial Statements and our audit knowledge.
Based on those procedures, we have concluded that each of the following is materially consistent with the Financial Statements and our audit knowledge:
• the Directors’ statement that they consider that the Annual Report and Financial Statements taken as a whole is fair, balanced and understandable, and provides the information necessary for shareholders to assess the Group’s position and performance, business model and strategy;
• the section of the Annual Report describing the work of the Audit Committee, including the significant issues that the Audit Committee considered in relation to the Financial Statements, and how these issues were addressed; and
• the section of the Annual Report that describes the review of the effectiveness of the Group’s risk management and internal control systems.
We are also required to review the part of the Corporate Governance Statement relating to the Group’s compliance with the provisions of the UK Corporate Governance Code specified by the Listing Rules for our review.
We have nothing to report in this respect.
8 We have nothing to report on the other matters on which we are required to report by exceptionUnder the Companies Act 2006, we are required to report to you if, in our opinion:
• adequate accounting records have not been kept by the Parent Company, or returns adequate for our audit have not been received from branches not visited by us; or
• the Parent Company Financial Statements and the part of the Directors’ Remuneration Report to be audited are not in agreement with the accounting records and returns; or
• certain disclosures of Directors’ remuneration specified by law are not made; or
• we have not received all the information and explanations we require for our audit.
We have nothing to report in these respects.
7 We have nothing to report on the other information in the Annual Report continued
Independent Auditor’s Report (Continued)
Reckitt Annual Report and Accounts 2021
Financial StatementsGovernanceStrategic Report
205
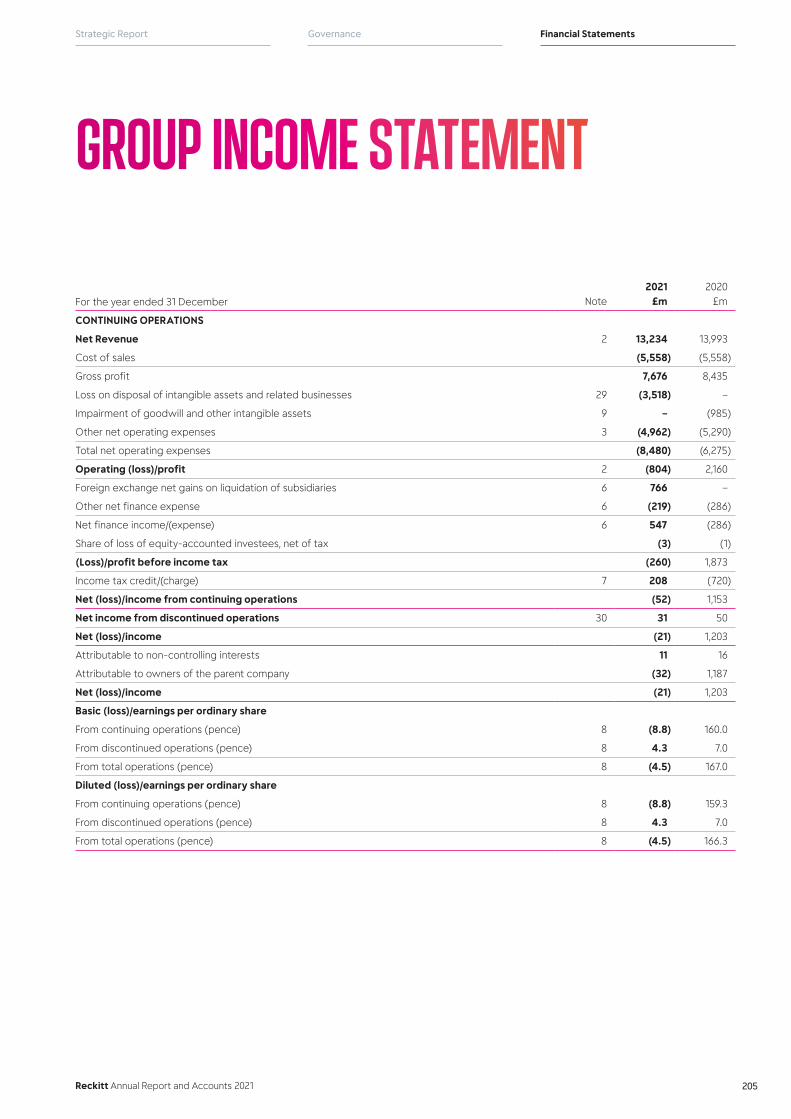
GROUP INCOME STATEMENT
For the year ended 31 December Note2021
£m2020
£m
CONTINUING OPERATIONS
Net Revenue 2 13,234 13,993
Cost of sales (5,558) (5,558)
Gross profit 7,676 8,435
Loss on disposal of intangible assets and related businesses 29 (3,518) –
Impairment of goodwill and other intangible assets 9 – (985)
Other net operating expenses 3 (4,962) (5,290)
Total net operating expenses (8,480) (6,275)
Operating (loss)/profit 2 (804) 2,160
Foreign exchange net gains on liquidation of subsidiaries 6 766 –
Other net finance expense 6 (219) (286)
Net finance income/(expense) 6 547 (286)
Share of loss of equity-accounted investees, net of tax (3) (1)
(Loss)/profit before income tax (260) 1,873
Income tax credit/(charge) 7 208 (720)
Net (loss)/income from continuing operations (52) 1,153
Net income from discontinued operations 30 31 50
Net (loss)/income (21) 1,203
Attributable to non-controlling interests 11 16
Attributable to owners of the parent company (32) 1,187
Net (loss)/income (21) 1,203
Basic (loss)/earnings per ordinary share
From continuing operations (pence) 8 (8.8) 160.0
From discontinued operations (pence) 8 4.3 7.0
From total operations (pence) 8 (4.5) 167.0
Diluted (loss)/earnings per ordinary share
From continuing operations (pence) 8 (8.8) 159.3
From discontinued operations (pence) 8 4.3 7.0
From total operations (pence) 8 (4.5) 166.3

206
GROUP STATEMENT OF COMPREHENSIVE INCOMEFor the year ended 31 December Note
2021 £m
2020 £m
Net (loss)/income (21) 1,203
Other comprehensive expense
Items that have or may be reclassified to the Income Statement in subsequent years
Net exchange losses on foreign currency translation, net of tax 7 (374) (207)
Reclassification of foreign currency translation reserves on disposal or liquidation of foreign operations, net of tax 26 (550) –
Gains/(losses) on net investment hedges, net of tax 7 84 (75)
Gains/(losses) on cash flow hedges, net of tax 7 30 (17)
(810) (299)
Items that will not be reclassified to the Income Statement in subsequent years
Remeasurements of defined benefit pension plans, net of tax 7 133 (60)
Revaluation of equity instruments – FVOCI 7 (1) 19
132 (41)
Other comprehensive expense, net of tax (678) (340)
Total comprehensive (expense)/income (699) 863
Attributable to non-controlling interests 11 16
Attributable to owners of the parent company (710) 847
Total comprehensive (expense)/income (699) 863
Total comprehensive (expense)/income attributable to owners of the parent company arising from:
Continuing operations (741) 797
Discontinued operations 31 50
(710) 847
Reckitt Annual Report and Accounts 2021
Financial StatementsGovernanceStrategic Report
207
As at 31 December Note2021
£m2020
£m
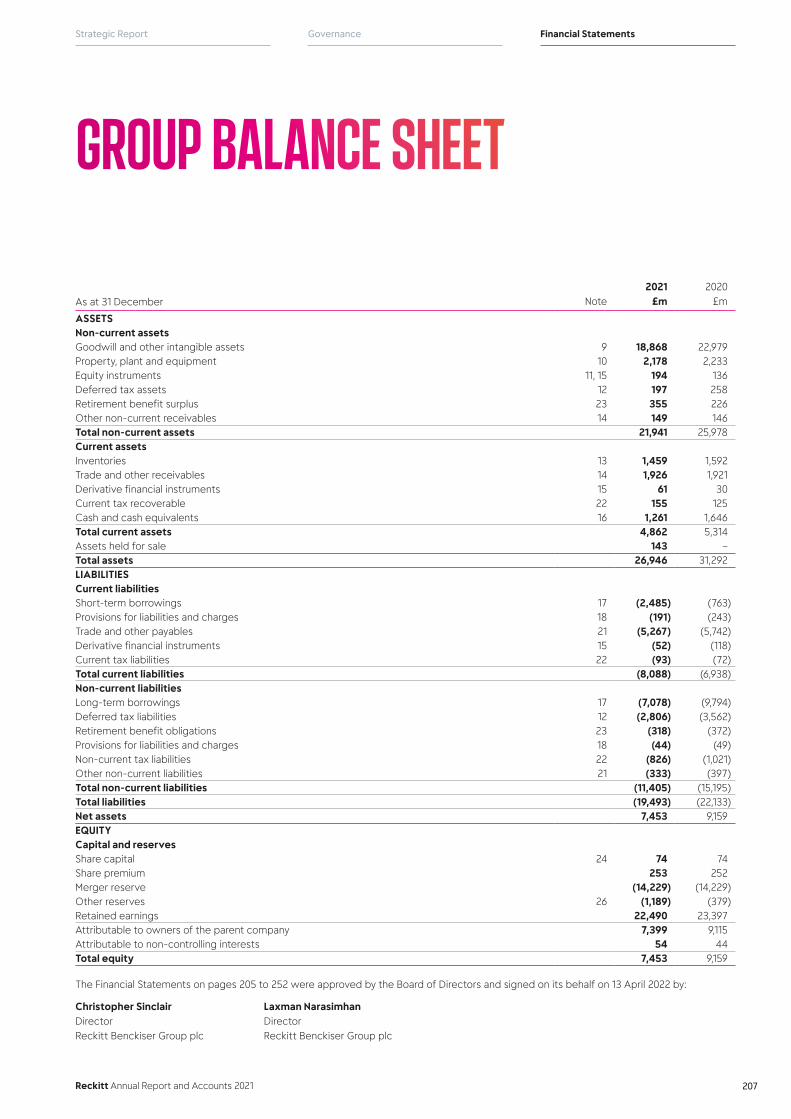
ASSETSNon-current assetsGoodwill and other intangible assets 9 18,868 22,979 Property, plant and equipment 10 2,178 2,233 Equity instruments 11, 15 194 136 Deferred tax assets 12 197 258 Retirement benefit surplus 23 355 226 Other non-current receivables 14 149 146 Total non-current assets 21,941 25,978 Current assetsInventories 13 1,459 1,592 Trade and other receivables 14 1,926 1,921 Derivative financial instruments 15 61 30 Current tax recoverable 22 155 125Cash and cash equivalents 16 1,261 1,646 Total current assets 4,862 5,314Assets held for sale 143 –Total assets 26,946 31,292 LIABILITIESCurrent liabilitiesShort-term borrowings 17 (2,485) (763)Provisions for liabilities and charges 18 (191) (243)Trade and other payables 21 (5,267) (5,742)Derivative financial instruments 15 (52) (118)Current tax liabilities 22 (93) (72)Total current liabilities (8,088) (6,938)Non-current liabilitiesLong-term borrowings 17 (7,078) (9,794)Deferred tax liabilities 12 (2,806) (3,562)Retirement benefit obligations 23 (318) (372)Provisions for liabilities and charges 18 (44) (49)Non-current tax liabilities 22 (826) (1,021)Other non-current liabilities 21 (333) (397)Total non-current liabilities (11,405) (15,195)Total liabilities (19,493) (22,133)Net assets 7,453 9,159 EQUITYCapital and reservesShare capital 24 74 74 Share premium 253 252 Merger reserve (14,229) (14,229)Other reserves 26 (1,189) (379)Retained earnings 22,490 23,397 Attributable to owners of the parent company 7,399 9,115Attributable to non-controlling interests 54 44 Total equity 7,453 9,159
The Financial Statements on pages 205 to 252 were approved by the Board of Directors and signed on its behalf on 13 April 2022 by:
Christopher Sinclair Laxman NarasimhanDirector Director Reckitt Benckiser Group plc Reckitt Benckiser Group plc
GROUP BALANCE SHEET

208
Notes
Share capital
£m
Share premium
£m
Merger reserves1
£m
Other reserves2
£m
Retained earnings
£m
Total attributable
to owners of the parent
company £m
Non-controlling
interests £m
Total equity
£m
Balance at 1 January 2020 74 245 (14,229) (80) 23,353 9,363 44 9,407
Comprehensive income
Net income – – – – 1,187 1,187 16 1,203
Other comprehensive (expense)/income – – – (299) (41) (340) – (340)
Total comprehensive (expense)/income – – – (299) 1,146 847 16 863
Transactions with owners
Treasury shares reissued 24 – 7 – – 124 131 – 131
Share-based payments 25 – – – – 15 15 – 15
Purchase of ordinary shares by employee share ownership trust – – – – (4) (4) – (4)
Tax on share awards 7 – – – – 4 4 – 4
Cash dividends 28 – – – – (1,241) (1,241) (16) (1,257)
Total transactions with owners – 7 – – (1,102) (1,095) (16) (1,111)
Balance at 31 December 2020 74 252 (14,229) (379) 23,397 9,115 44 9,159
Comprehensive income
Net (loss)/income – – – – (32) (32) 11 (21)
Other comprehensive (expense)/income – – – (810) 132 (678) – (678)
Total comprehensive (expense)/income – – – (810) 100 (710) 11 (699)
Transactions with owners
Treasury shares reissued 24 – 1 – – 79 80 – 80
Purchase of ordinary shares by employee share ownership trust – – – – (5) (5) – (5)
Issuance of shares to non-controlling interest – – – – – – 7 7
Share-based payments 25 – – – – 30 30 – 30
Cash dividends 28 – – – – (1,246) (1,246) (17) (1,263)
Transactions with non-controlling interests 27 – – – – 135 135 – 135
Disposal of non-controlling interest in IFCN China 29 – – – – – – 9 9
Total transactions with owners – 1 – – (1,007) (1,006) (1) (1,007)
Balance at 31 December 2021 74 253 (14,229) (1,189) 22,490 7,399 54 7,453
1. The merger reserve relates to the 1999 combination of Reckitt & Colman plc and Benckiser N.V. and a Group reconstruction in 2007 treated as a merger under Part 27 of the
Companies Act 2006
2. Refer to Note 26 for an explanation of other reserves
GROUP STATEMENT OF CHANGES IN EQUITY

Reckitt Annual Report and Accounts 2021
Financial StatementsGovernanceStrategic Report
209
GROUP CASH FLOW STATEMENTFor the year ended 31 December Note
2021 £m
2020 £m
CASH FLOWS FROM OPERATING ACTIVITIES
Operating (loss)/profit from continuing operations (804) 2,160
Losses on sale of property, plant and equipment and intangible assets 3,442 3
Depreciation, amortisation and impairment 481 1,457
Share-based payments 30 15
Increase in inventories (57) (317)
(Increase)/decrease in trade and other receivables (130) 94
(Decrease)/increase in payables and provisions (126) 1,145
Cash generated from continuing operations 2,836 4,557
Interest paid (251) (323)
Interest received 29 56
Tax paid (915) (762)
Net cash flows attributable to discontinued operations 29 (2) (10)
Net cash generated from operating activities 1,697 3,518
CASH FLOWS FROM INVESTING ACTIVITIES
Purchase of property, plant and equipment (373) (394)
Purchase of intangible assets (77) (92)
Proceeds from the sale of property, plant and equipment 9 10
Proceeds from sale of intangible assets and related businesses, net of cash disposed 1,622 –
Acquisition of businesses (915) –
Purchase of equity instruments and convertible notes (27) (36)
Net cash generated from / (used in) investing activities 239 (512)
CASH FLOWS FROM FINANCING ACTIVITIES
Treasury shares reissued 24 80 131
Purchase of ordinary shares by employee share ownership trust (5) (4)
Proceeds from borrowings 17 38 2,903
Repayment of borrowings 17 (1,044) (4,583)
Dividends paid to owners of the parent company 28 (1,246) (1,241)
Dividends paid to non-controlling interests (17) (16)
Other financing activities (92) (47)
Net cash used in financing activities (2,286) (2,857)
Net (decrease) / increase in cash and cash equivalents (350) 149
Cash and cash equivalents at beginning of the year 1,644 1,547
Exchange losses (35) (52)
Cash and cash equivalents at end of the year 1,259 1,644
Cash and cash equivalents comprise:
Cash and cash equivalents 16 1,261 1,646
Overdrafts 17 (2) (2)
1,259 1,644
210
1 Accounting PoliciesThe principal accounting policies adopted in the preparation of these Financial Statements are set out below. Unless otherwise stated, these policies have been consistently applied to all the years presented.
Basis of preparationThese Financial Statements have been prepared in accordance with the recognition, measurement and presentation requirements of UK-adopted International Accounting Standards and in accordance with IFRS as issued by the International Accounting Standards Board (IASB).
These Financial Statements have been prepared under the historical cost convention, as modified by the revaluation of certain financial assets and liabilities (including derivative instruments) at fair value through profit or loss or other comprehensive income. A summary of the Group’s accounting policies is set out below. Historical cost is generally based on the fair value of the consideration given in exchange for goods and services.
The preparation of Financial Statements that conform to IFRS requires management to make estimates and assumptions that affect the reported amounts of assets and liabilities at the Balance Sheet date and revenue and expenses during the reporting period. Although these estimates are based on management’s best knowledge at the time, actual amounts may ultimately differ from those estimates.
New standards, amendments and interpretationsThe following amended standards and interpretations were adopted by the Group during the year ending 31 December 2021. These amended standards and interpretations have not had a significant impact on the Group Financial Statements.
• Interest Rate Benchmark Reform – Phase 2 (Amendments to IFRS 9, IAS 39, IFRS 7, IFRS 4 and IFRS 16)
A number of new standards are effective for annual periods beginning on or after 1 January 2022 and earlier application is permitted; however, the Group has not early adopted the new or amended standards in preparing these consolidated Financial Statements.
• Onerous Contracts – Cost of Fulfilling a Contract (Amendments to IAS 37).
• Property, Plant and Equipment: Proceeds before Intended Use (Amendments to IAS 16).
• Classification of Liabilities as Current or Non-current (Amendments to IAS 1).
• Annual Improvements to IFRS Standards 2018–2020
• Reference to the Conceptual Framework (Amendments to IFRS 3)
• Deferred Tax related to Assets and Liabilities arising from a Single Transaction (Amendments to IAS 12)
• Disclosure of Accounting Policies (Amendments to IAS 1 and IFRS Practice Statement 2)
• Definition of Accounting Estimates (Amendments to IAS 8)
Going concernHaving assessed the principal risks and other matters discussed in connection with the Viability Statement, the Directors considered it appropriate to adopt the going concern basis of accounting in preparing the consolidated Financial Statements. When reaching this conclusion, the Directors took into account the Group’s overall financial position, exposure to principal risks and future business forecasts. At 31 December 2021, the Group had cash and cash equivalents of £1.3 billion. The Group also had access to committed borrowing facilities of £4.5 billion, which were undrawn at year-end and are not subject to renewal until 2024 onwards. Further detail is contained within the Viability Statement on page 103.
Basis of consolidationThe consolidated Financial Statements include the results of Reckitt Benckiser Group plc, a company registered in the UK, and all its subsidiary undertakings made up to the same accounting date. Subsidiary undertakings are those entities controlled by Reckitt Benckiser Group plc. Control exists where the Group is exposed to, or has the rights to variable returns from its involvement with, the investee and has the ability to use its power over the investee to affect its returns.
Intercompany transactions, balances and unrealised gains on transactions between Group companies have been eliminated on consolidation. Unrealised losses have also been eliminated to the extent that they do not represent an impairment of a transferred asset. The accounting policies of subsidiaries have been changed where necessary to ensure consistency with accounting policies adopted by the Group.
Foreign currency translationItems included in the Financial Statements of each of the Group’s entities are measured using the currency of the primary economic environment in which the entity operates (the functional currency). The consolidated Financial Statements are presented in Sterling, which is the Group’s presentational currency.
Foreign currency transactions are translated into the functional currency using exchange rates prevailing at the dates of the transactions. Foreign exchange gains and losses resulting from the settlement of foreign currency transactions and from the translation of foreign currency denominated monetary assets and liabilities are recognised in the Income Statement, except where hedge accounting is applied.
NOTES TO THE FINANCIAL STATEMENTS
Reckitt Annual Report and Accounts 2021
Financial StatementsGovernanceStrategic Report
211
The Financial Statements of subsidiary undertakings with a non-Sterling functional currency are translated into Sterling on the following basis:
• Assets and liabilities, at the rate of exchange ruling at the year-end date.
• Income Statement items, at the average rate of exchange for the year.
Exchange differences arising from the translation of the net investment in subsidiary undertakings with a non-Sterling functional currency, and of borrowings and other currency instruments designated as hedges of such investments, are recorded in equity on consolidation.
Business combinationsThe acquisition method is used to account for the acquisition of subsidiaries and businesses. Identifiable net assets acquired (including intangible assets) in a business combination are measured initially at their fair values at the acquisition date.
Where the measurement of the fair value of identifiable net assets acquired is incomplete at the end of the reporting period in which the combination occurs, the Group will report provisional fair values. Final fair values are determined within a year of the acquisition date and retrospectively applied.
The excess of the consideration transferred and the amount of any non-controlling interest over the fair value of the identifiable assets (including intangibles), liabilities and contingent liabilities acquired is recorded as goodwill.
The consideration transferred is measured at the fair value of the assets given, equity instruments issued (if any), and liabilities assumed or incurred at the date of acquisition.
Acquisition-related costs are expensed as incurred.
The results of the subsidiaries and businesses acquired are included in the consolidated Financial Statements from the acquisition date.
Assets held for sale and disposal groupsNon-current assets, or disposal groups comprising assets and liabilities, are classified as held-for sale and presented separately in the balance sheet when the following criteria are met: the Group is committed to selling the asset or disposal group, it is available for immediate sale in its current condition, an active plan of sale has commenced and approved in line with Group policy, and in the judgement of Group management it is highly probable that the sale will be completed within 12 months.
Immediately before the initial classification of the assets and disposal groups as held for sale, the carrying amounts of the assets (or all the assets and liabilities in the disposal groups) are measured in accordance with the applicable accounting standards. Goodwill (including cost and accumulated impairment) is allocated to the disposal group using a relative value approach, unless a different method better reflects goodwill associated with the disposal.
Assets held for sale and disposal groups are subsequently measured at the lower of their carrying amount and fair value less costs of disposal. Impairment losses on initial classification as held-for-sale, and subsequent gains and losses on remeasurement to fair value less costs of disposal, are recognised in the Income Statement. Once classified as held-for-sale, intangible assets and property, plant and equipment are no longer amortised or depreciated.
Disposals of intangible assets and subsidiariesThe financial performance of subsidiaries and businesses are included in the Group Financial Statements up to the point on which the Group ceases to have control over that subsidiary. Intangible assets not disposed of through the sale of shares in subsidiaries are treated as disposed at the point that the Group ceases to control the asset.
The difference between the fair value of the consideration (net of costs) and the carrying value of the assets and liabilities disposed is recognised as a gain or loss in the Income Statement. Any amounts previously recognised in other comprehensive income in respect of that subsidiary or asset, including exchange gains or losses on foreign currency translation, are accounted for as if the Group had directly disposed of related assets and liabilities. This results in a reclassification of amounts previously recognised in other comprehensive income to the Income Statement and included within the Loss on disposal of intangible assets and related businesses.
Where the assets and liabilities disposed represent a partial disposal of a cash generating unit to which goodwill has been allocated, goodwill is allocated using a relative value approach to the disposal group, unless a different method better reflects goodwill associated with the disposal.
Where the tax base will not be transferred with the disposed assets, the deferred tax balances relating to the intangible assets are not considered part of the assets disposed and are instead credited or charged to the Income Statement within Income tax expense.
Liquidation of subsidiariesThe Group liquidates subsidiaries that are no longer required in order to simplify the group structure. As part of this process, the Group ensures any outstanding matters relating to the subsidiary are resolved. Once this is completed, control is passed to the liquidator and any amounts previously recognised in other comprehensive income in respect of that subsidiary, including exchange gains or losses on foreign currency translation, are reclassified to the Income Statement, and included within net finance income/(expense).
Non-controlling interestsOn an acquisition-by-acquisition basis the non-controlling interest is measured at either fair value or a proportionate share of the acquiree’s net assets.
Purchases of non-controlling interests are accounted for as transactions with the owners and therefore no goodwill is recognised as a result of such transactions.
RevenueRevenue from the sale of products is recognised in the Group Income Statement as and when performance obligations are satisfied by transferring control of the product or service to the customer.
Net revenue is defined as the amount invoiced to external customers during the year and comprises, as required by IFRS 15, gross sales net of trade spend, customer allowances for credit notes, returns and consumer coupons. The methodology and assumptions used to estimate credit notes, returns and consumer coupons are monitored and adjusted regularly in the light of contractual and legal obligations, historical trends, past experience and projected market conditions.
1 Accounting Policies continued
212
Trade spend, which consists primarily of customer pricing allowances, placement/listing fees and promotional allowances, is governed by sales agreements with the Group’s trade customers (retailers and distributors). Trade spend also includes reimbursement arrangements under the Special Supplemental Nutrition Program for Women, Infants and Children (WIC), payable to the respective US State WIC agencies.
Accruals are recognised under the terms of these agreements to reflect the expected activity level and the Group’s historical experience. These accruals are reported within trade and other payables.
Value-added tax and other sales taxes are excluded from net revenue.
Operating segmentsOperating segments are reported in a manner consistent with the internal reporting provided to the Chief Operating Decision Maker (CODM). The CODM, who is responsible for allocating resources and assessing performance of the operating segments, has been identified as the Group Executive Committee.
Research and developmentResearch expenditure is expensed in the year in which it is incurred.
Development expenditure is expensed in the year in which it is incurred, unless it meets the requirements of IAS 38 to be capitalised and then amortised over the useful life of the developed product.
Income taxIncome tax on the profit/(loss) for the year comprises current and deferred tax. Income tax is recognised in the Income Statement except to the extent that it relates to items recognised in other comprehensive income or directly in equity, in which case the tax is also recognised in other comprehensive income or directly in equity, respectively.
Current tax is the expected tax payable on the taxable income for the year, using tax rates enacted or substantively enacted in each jurisdiction at the Balance Sheet date, and any adjustment to tax payable in respect of previous years.
Deferred tax is provided in full, using the liability method, on temporary differences arising between the tax bases of assets and liabilities and their carrying amounts in the consolidated Financial Statements. Deferred tax is not accounted for if it arises from the initial recognition of an asset or liability in a transaction (other than a business combination) that affects neither accounting nor taxable profit or loss at that time. Deferred tax is determined using tax rates (and laws) that have been enacted or substantively enacted at the Balance Sheet date and are expected to apply when the deferred tax asset or liability is settled. Deferred tax assets are recognised to the extent that it is probable that future taxable profit will be available against which the temporary differences can be utilised.
Deferred tax is provided on temporary differences arising on investments in subsidiaries except where the investor is able to control the timing of the reversal of the temporary differences and it is probable that the temporary difference will not reverse in the foreseeable future.
Deferred tax assets and liabilities within the same tax jurisdiction are offset where there is a legally enforceable right to offset current tax assets against current tax liabilities and where there is an intention to settle these balances on a net basis.
Goodwill and other intangible assets(i) GoodwillGoodwill is allocated to the cash generating unit (CGU), or group of CGUs (GCGU), to which it relates and is tested annually for impairment. Goodwill is carried at cost less accumulated impairment losses.
(ii) BrandsSeparately acquired brands are shown at cost less accumulated amortisation and impairment. Brands acquired as part of a business combination, and that are separately identifiable are recognised at fair value and amortised over their useful economic life as determined at the acquisition date (up to 20 years), except when their life is determined as being indefinite.
Applying indefinite lives to certain acquired brands is appropriate due to the stable long-term nature of the business and the enduring nature of the brands. A core element of the Group’s strategy is to invest in building its brands through an ongoing programme of product innovation and continuing marketing investment. Within the Group, a brand typically comprises an assortment of base products and more innovative products. Both contribute to the enduring nature of the brand. The base products establish the long-term positioning of the brand while a succession of innovations attracts ongoing consumer interest and attention. Indefinite life brands are allocated to the CGUs or GCGUs to which they relate and are tested annually for impairment.
The Directors also review the useful economic life of brands annually, to ensure that these lives are still appropriate. If a brand is considered to have a finite life, its carrying value is amortised over its remaining estimated useful economic life.
(iii) SoftwareExpenditure relating to the acquisition of computer software licences and systems are capitalised at cost. The assets are amortised on a straight-line basis over a period of seven years for systems and five years or less for all other software licences.
(iv) Distribution rightsPayments made in respect of product registration, acquired and reacquired distribution rights are capitalised where the rights comply with the above requirements for recognition of acquired brands. If the registration or distribution rights are for a defined time period, the intangible asset is amortised over that period. If no time period is defined, the intangible asset is treated in the same way as acquired brands.
(v) Customer contractsAcquired customer contracts are capitalised at cost. These costs are amortised on a straight-line basis over the period of the contract.
(vi) Customer relationshipsCustomer relationships are shown at cost less accumulated amortisation and impairment. Customer relationships acquired as part of a business combination, and that are separately identifiable are recognised at fair value and amortised over their useful economic life as determined at the acquisition date (up to 10 years).
Notes to the Financial Statements (Continued)
1 Accounting Policies continued
Reckitt Annual Report and Accounts 2021
Financial StatementsGovernanceStrategic Report
213
(vii) Acquired intellectual propertyIntellectual property rights acquired as part of the business and that are separately identifiable are recognised at fair value and amortised over their useful economic life as determined at the acquisition date (up to 20 years).
Amortisation of intangible assets in (ii) to (vii) is charged to cost of goods sold or net operating expenses depending on the use of the asset.
Property, plant and equipmentProperty, plant and equipment is stated at cost less accumulated depreciation and impairment, with the exception of freehold land, which is shown at cost less impairment. Cost includes expenditure that is directly attributable to the acquisition of the asset. Except for freehold land and assets under construction, the cost of property, plant and equipment is depreciated on a straight-line basis over the period of the expected useful life of the asset. For this purpose, expected lives are determined within the following limits:
• Freehold buildings: not more than 50 years;
• Leasehold land and buildings: the lesser of 50 years or the life of the lease; and
• Owned plant and equipment: not more than 15 years (except for environmental assets and spray dryers which are not more than 30 years).
In general, production plant and equipment and office equipment are depreciated over ten years or less; motor vehicles and computer equipment over five years or less.
Assets’ residual values and useful lives are reviewed, and adjusted if necessary, at each Balance Sheet date. Property, plant and equipment is reviewed for impairment if events or changes in circumstances indicate that the carrying amount may not be appropriate. Freehold land is reviewed for impairment on an annual basis.
Gains and losses on the disposal of property, plant and equipment are determined by comparing the asset’s carrying value with any sale proceeds and are included in the Income Statement.
LeasesThe Group has various lease arrangements for buildings (such as offices and warehouses), cars, and IT and other equipment. Lease terms are negotiated on an individual basis locally and subject to domestic rules and regulations. At the inception of a lease contract, the Group assesses whether the contract conveys the right to control the use of an identified asset for a certain period in exchange for consideration, in which case it is identified as a lease. The Group recognises a right of use asset and a corresponding lease liability with respect to all lease arrangements in which it is the lessee, except for short-term leases (defined as leases with a lease term of 12 months or less) and leases of low value assets. Low value leases are those with an underlying asset value of US$5,000 or less. For these leases, the Group recognises the lease payments as an operating expense on a straight-line basis over the term of the lease.
Right of use assetsAt commencement date, right of use assets are measured at cost, which comprises the following:
• The initial measurement of the lease liability;
• Prepayments before commencement date of the lease;
• Initial direct costs; and
• Costs to restore.
Subsequent to initial recognition right of use assets are depreciated on a straight-line basis over the duration of the contract. Right of use assets are assessed for impairment where indicators of impairment are present.
Lease liabilitiesAt commencement date, lease liabilities are measured at the present value of lease payments not yet paid including:
• Fixed payments excluding lease incentive receivables;
• Future contractually agreed fixed increases; and
• Payments related to renewals or early termination, when options to renew or for early termination are reasonably certain to be exercised.
Subsequent to initial recognition lease liabilities are increased by the interest costs on the lease liabilities and decreased by lease payments made. Lease liabilities held are remeasured to account for revised future payments.
Impairment of assetsAssets that have indefinite lives, including goodwill and brands, are tested annually for impairment at the level where cash flows are considered to be largely independent. This testing is performed at either the CGU or GCGU level. All CGUs and GCGUs are tested for impairment if there is an event or circumstance that indicates that their carrying value may not be recoverable. If the carrying value exceeds its recoverable amount an impairment loss is recognised in the Income Statement. The recoverable amount is the higher of the CGU or GCGU’s value in use and its fair value less costs of disposal.
Value in use is calculated with reference to the future and terminal cash flows expected to be generated by each CGU or GCGU (or group of assets where cash flows are not identifiable to specific assets). The discount rates used in the impairment reviews are based on weighted-average cost of capital (WACC) specific to each CGU and GCGU, with the WACC converted to the implied pre-tax rates.
Fair value less costs of disposal is calculated using a discounted cash flow approach prepared on a market participant basis, with a post-tax discount rate applied to projected risk-adjusted post-tax cash flows and terminal value.
InventoriesInventories are stated at the lower of cost and net realisable value. Cost comprises materials, direct labour and an appropriate portion of overhead expenses (based on normal operating capacity) required to get the inventory to its present location and condition. Inventory valuation is determined on a first in, first out (FIFO) basis. Net realisable value represents the estimated selling price less applicable selling expenses.
1 Accounting Policies continued

214
Trade and other receivablesTrade and other receivables are initially recognised at the fair value of consideration less transaction costs and subsequently held at amortised cost, less provision for discounts and doubtful debts. Allowance losses are calculated by reviewing lifetime expected credit losses using historic and forward-looking data on credit risk.
Trade and other payablesTrade and other payables are initially recognised at fair value including transaction costs and subsequently carried at amortised cost.
Cash and cash equivalentsCash and cash equivalents comprise cash balances and other deposits with a maturity of less than three months when deposited.
For the purpose of the cash flow statement, bank overdrafts that form an integral part of the Group’s cash management, and are repayable on demand, are included as a component of cash and cash equivalents. Bank overdrafts are included within short-term borrowings in the Balance Sheet.
BorrowingsInterest-bearing borrowings are recognised initially at fair value less, where permitted by IFRS 9, any directly attributable transaction costs. Subsequent to initial recognition, interest-bearing borrowings are stated at amortised cost with any difference between cost and redemption value being recognised in the Income Statement over the period of the borrowings on an effective interest basis.
Derivative financial instruments and hedging activityThe Group may use derivatives to manage its exposures to fluctuating interest and foreign exchange rates. These instruments are initially recognised at fair value on the date the contract is entered into and are subsequently remeasured at their fair value. The method of recognising the resulting gain or loss depends on whether the derivative is designated as a hedging instrument and, if so, the nature of the item being hedged.
At the inception of designated hedge relationships, the Group documents its risk management objectives and strategy for undertaking various hedging transactions. The Group also documents its assessment, both at hedge inception and on an ongoing basis, of whether the derivatives that are used in hedging transactions are highly effective in offsetting changes in cash flows or fair values of hedged items.
The Group designates certain derivatives as either:
• hedges of a particular risk associated with a recognised asset or liability or a highly probable forecast transaction (cash flow hedges); or
• hedges of the fair value of recognised assets or liabilities or a firm commitment (fair value hedges).
Derivatives designated as cash flow hedges:
• The effective portion of changes in the fair value of derivatives that are designated and qualify as cash flow hedges is recognised in other comprehensive income and accumulated in the hedging reserve. Any gain or loss relating to the ineffective portion is recognised immediately in the Income Statement.
When the hedged forecast transaction subsequently results in the recognition of a non-financial item such as inventory, the amount accumulated in the hedging reserve and the cost of hedging reserve is included directly in the initial cost of the non-financial item when it is recognised. For all other transactions, the amounts accumulated in the hedging reserve are recycled to the Income Statement in the period (or periods) when the hedged item affects the Income Statement.
If the hedge no longer meets the criteria for hedge accounting or the hedging instrument is sold, expires, is terminated, or is exercised, then hedge accounting is discontinued prospectively. The amount that has been accumulated in the hedging reserve remains in equity until it is either included in the cost of a non-financial item or recycled to the Income Statement.
Derivatives designated as fair value hedges: Fair value hedges are used to manage the currency and/or interest rate risks to which the fair value of certain assets and liabilities are exposed. Changes in the fair value are recognised in the Income Statement, together with any changes in the fair value of the hedged asset or liability that are attributable to the hedged risk. If such a hedge relationship no longer meets hedge accounting criteria, fair value movements on the derivative continue to be taken to the Income Statement while any fair value adjustments made to the underlying hedged item to that date are amortised through the Income Statement over its remaining life using the effective interest rate method.
Changes in the fair value of any derivative instruments that do not qualify for hedge accounting are recognised immediately in the Income Statement.
Net investment hedgesGains and losses on those hedging instruments designated as hedges of the net investments in foreign operations are recognised in other comprehensive income to the extent that the hedging relationship is effective. Gains and losses accumulated in the foreign currency translation reserve are recycled to the Income Statement when the foreign operation is disposed of.
Equity instruments (FVOCI)Equity instruments (FVOCI) are investments that are neither held for trading nor classified as investments in subsidiaries, associates or joint arrangements. Subsequent to their initial recognition, equity instruments (FVOCI) are stated at their fair value. Gains and losses arising from subsequent changes in the fair value are recognised in the Income Statement or in other comprehensive income on a case by case basis. Accumulated gains and losses included in other comprehensive income are not recycled to the Income Statement. Dividends from other investments are recognised in the Income Statement.
Investment in associatesInvestments in associates are accounted for using the equity method. An associate is an entity over which the Group has significant influence, being the power to participate in the investee’s financial and operating policy decisions without control or joint control.
Interests in associates are stated in the consolidated balance sheet at cost, adjusted for the movement in the Group’s share of their net assets and liabilities. The Group’s share of the profit or loss after tax of associates is included in the Group’s consolidated profit before taxation. Unrealised intragroup profits or losses from transactions are offset against the carrying amount of the investment on a pro-rata basis during consolidation, if material.
1 Accounting Policies continued
Notes to the Financial Statements (Continued)

Reckitt Annual Report and Accounts 2021
Financial StatementsGovernanceStrategic Report
215
When the Group’s share of losses exceeds its interest in an associate, the Group does not recognise further losses, unless it has incurred obligations or made payments on behalf of the associate.
The Financial Statements of the companies accounted for using the equity method are prepared in accordance with uniform accounting and measurement methods throughout the Group.
Employee share schemesIncentives in the form of shares are provided to employees under share option and restricted share schemes vested in accordance with non-market conditions.
The fair value determined at the grant date of the equity-settled share-based payments is expensed on a straight-line basis over the vesting period, based on the Group’s estimate of equity instruments that will eventually vest. At each Balance Sheet date, the Group revises its estimate of the number of equity instruments expected to vest. The impact of the revision of the original estimates, if any, is recognised in profit or loss such that the cumulative expense reflects the revised estimate, with a corresponding adjustment to equity reserves.
Additional employer costs, including social security taxes, in respect of options and awards are charged to the Income Statement over the same period with a corresponding liability recognised.
Repurchase and reissuance of ordinary sharesWhen shares recognised as equity are repurchased, the amount of the consideration paid, including directly attributable costs, is recognised as a charge to equity. Repurchased shares are classified as Treasury shares and are presented in retained earnings. When Treasury shares are sold or reissued subsequently, the amount received is recognised as an increase in equity and any resulting surplus is presented within share premium or deficit presented within retained earnings.
Pension commitmentsGroup companies operate defined contribution and (funded and unfunded) defined benefit pension plans.
The cost of providing pensions to employees who are members of defined contribution plans is charged to the Income Statement as contributions are made. The Group has no further payment obligations once the contributions have been paid.
The deficit or surplus recognised in the Balance Sheet in respect of defined benefit pension plans is the present value of the defined benefit obligation at the Balance Sheet date, less the fair value of the plan assets. The defined benefit obligation is calculated annually by independent actuaries using the projected unit credit method. The present value of the defined benefit obligation is determined by discounting the estimated future cash flows by the yield on high-quality corporate bonds denominated in the currency in which the benefits will be paid, and that have a maturity approximating to the terms of the pension obligations. The costs of providing these defined benefit plans are accrued over the period of employment. Actuarial gains and losses are recognised immediately in other comprehensive income.
Past-service costs are recognised immediately in profit or loss.
The net interest amount is calculated by applying the discounted rate used to measure the defined benefit obligation at the beginning of the period to the net defined benefit liability/asset.
The net pension plan interest is presented as finance income/expense.
Post-retirement benefits other than pensionsSome Group companies provide post-retirement medical care to their retirees. The costs of providing these benefits are accrued over the period of employment and the liability recognised in the Balance Sheet is calculated using the projected unit credit method and is discounted to its present value and the fair value of any related asset is deducted.
ProvisionsProvisions are recognised when the Group has a present legal or constructive obligation as a result of past events; it is more likely than not that there will be an outflow of resources to settle that obligation; and the amount can be reliably estimated. Provisions are valued at the present value of the Directors’ best estimate of the expenditure required to settle the obligation at the Balance Sheet date. Where it is possible that an outflow of resources may be required to settle the obligation or it is not possible to make a reliable estimate of the estimated financial impact, appropriate disclosure is made but no provision recognised.
Share capital transactionsWhen the Group purchases equity share capital, the amount of the consideration paid, including directly attributable costs, is recognised as a change in equity. Purchased shares are either held in Treasury, in order to satisfy employee options, or cancelled and, in order to maintain capital, an equivalent amount to the nominal value of the shares cancelled would be transferred from retained earnings.
Dividend distributionDividends to owners of the Parent Company are recognised as a liability in the period in which the dividends are approved by the company’s shareholders. Interim dividends are recorded in the period in which they are approved and paid.
Dividend payments are recorded at fair value. Where non-cash dividend payments are made, gains arising as a result of fair value remeasurements are recognised in profit or loss in the same period.
Accounting estimates and judgementsIn preparing these consolidated Financial Statements, management has made judgements and estimates that affect the application of the Group’s accounting policies and the reported amounts of assets, liabilities, income and expenses. Actual amounts and results may differ from these estimates.
The estimates and underlying assumptions are reviewed on an ongoing basis. Revisions to accounting estimates are recognised in the period in which the estimate is revised if the revision affects only that period, or in the period of the revision and future periods if the revision affects both current and future periods.
Critical judgements in applying the Group’s accounting policiesOver the course of the year, management has made a number of critical judgements in the application of the Group’s accounting policies. These include the following:
• Management has identified matters (including the Korea HS issue) that may incur liabilities in the future but does not recognise these liabilities when it is too early to determine the likely outcome or make a reliable estimate (Note 18, Note 20).
• The continuing enduring nature of the Group’s brands supports the indefinite life assumption of these assets (Note 9).
1 Accounting Policies continued
216
• Assumptions are made as to the recoverability of tax assets especially as to whether there will be sufficient future taxable profits in the same jurisdictions to fully utilise losses in future years (Note 12).
Key sources of estimation uncertaintyEach year, management is required to make a number of assumptions regarding the future. The related year-end accounting estimates will, by definition, seldom equal the final actual results. The estimates and assumptions that have a significant risk of causing a material adjustment to the carrying amounts of assets and liabilities within the next financial year are addressed below.
Goodwill and Indefinite life intangible assets:Under IFRS, goodwill and other indefinite life intangible assets must be tested for impairment on at least an annual basis. As disclosed further in Note 9, this testing generally requires management to make multiple estimates, for example around individual market pressures and forces, future price and volume growth, future margins, terminal growth rates and discount rates.
In 2021, the Group recognised impairment losses of £nil (2020: £985 million, all of which related to IFCN goodwill). In addition to the estimates outlined above, the IFCN impairment assessment incorporated estimates relating to future birth rates and future WIC tendering in the US. Refer to Note 9 for further information, including details on the sensitivity of IFCN value-in-use to reasonable changes in key assumptions.
Tax:The actual tax paid on profits is determined based on tax laws and regulations that differ across the numerous jurisdictions in which the Group operates. Assumptions are made in applying these laws to the taxable profits in any given period in order to calculate the tax charge for that period. Where the eventual tax paid or reclaimed is different to the amounts originally estimated, the difference is charged or credited to the Income Statement in the period in which it is determined (Note 7).
The Group operates in an international tax environment and is subject to tax examinations and uncertainties in a number of jurisdictions. The issues involved can be complex and disputes may take a number of years to resolve. Each uncertainty is separately assessed and management applies judgement in the recognition and measurement of the uncertainty based on the relevant circumstances. The exposure recognised is calculated based on the expected value method or the most likely outcome method, depending on whether there are a wide range of possible outcomes or if resolution of the uncertainty is concentrated on one outcome. In particular, the range of possible outcomes relating to transfer pricing exposures can be wide and in these scenarios the expected value method is employed. The accounting estimates and judgements considered include:
• Status of the unresolved matter;
• Clarity of relevant legislation and related guidance;
• Pre-clearances issued by taxing authorities;
• Advice from in-house specialists and opinions of professional firms;
• Resolution process and range of possible outcomes;
• Past experience and precedents set by the particular taxing authority;
• Decisions and agreements reached in other jurisdictions on comparable issues;
• Unutilised tax losses, tax credits and availability of mutual agreement procedures between tax authorities; and
• Statute of limitations.
Management is of the opinion that the carrying values of the provisions made in respect of these matters represent the most accurate measurement once all facts and circumstances have been taken into account. Nevertheless, the final amounts paid to discharge the liabilities arising (either through negotiated settlement or litigation) will in all likelihood be different from the provision recognised. The net liabilities recognised in respect of uncertain tax positions as at 31 December 2021 are £770 million (2020: £950 million) (Note 22).
Trade spend:The Group provides for amounts payable to our trade customers for promotional activity and government reimbursement arrangements. Where an activity spans across the year end, an accrual is reflected in the consolidated Financial Statements based on our estimation of customer and consumer uptake during the relevant period and the extent to which temporary funded activity has occurred. As there is a timing difference between that initial estimation and final settlement of trade spend with our customers, differences can result on final settlement. As at 31 December 2021, the Group recognised total accruals of £1,137 million (2020: £1,275 million) in respect of amounts payable to trade customers and government bodies for trade spend. The Group’s trade spend arrangements vary considerably by market and category, and the Group’s trade spend accruals are made up of many individually small accruals. Therefore, an aggregated disclosure of sensitivity analysis on the key inputs to trade spend accrual estimates would not be practicable nor meaningful. Nevertheless, a 12% (2020: 12%) difference between those initial estimates and final settlement would cause a material adjustment in the next financial year.
Other estimatesSet out below are other estimates where there is a risk of adjustment to the carrying amounts of assets and liabilities within the next financial year, but the risk of a material adjustment is not significant.
Legal provisions:The Group recognises legal provisions in line with the Group’s provisions policy. The level of provisioning in relation to civil and/or criminal investigations is an area where management and legal judgement are important, with individual provisions being based on best estimates of the potential loss, considering all available information, external advice and historical experience. As at 31 December 2021, the Group recognised legal provisions of £180 million (2020: £232 million) in relation to a number of historical regulatory and other matters in various jurisdictions.
Defined benefit pension plan:The value of the Group’s defined benefit pension plan obligations is dependent on a number of key assumptions. These assumptions include the rate of increase in pensionable salaries, the discount rate to be applied, the level of inflation and the life expectancy of the schemes’ members. Details of the key assumptions and the sensitivity of the principal schemes’ carrying value to changes in the assumptions are set out in Note 23.
1 Accounting Policies continued
Notes to the Financial Statements (Continued)
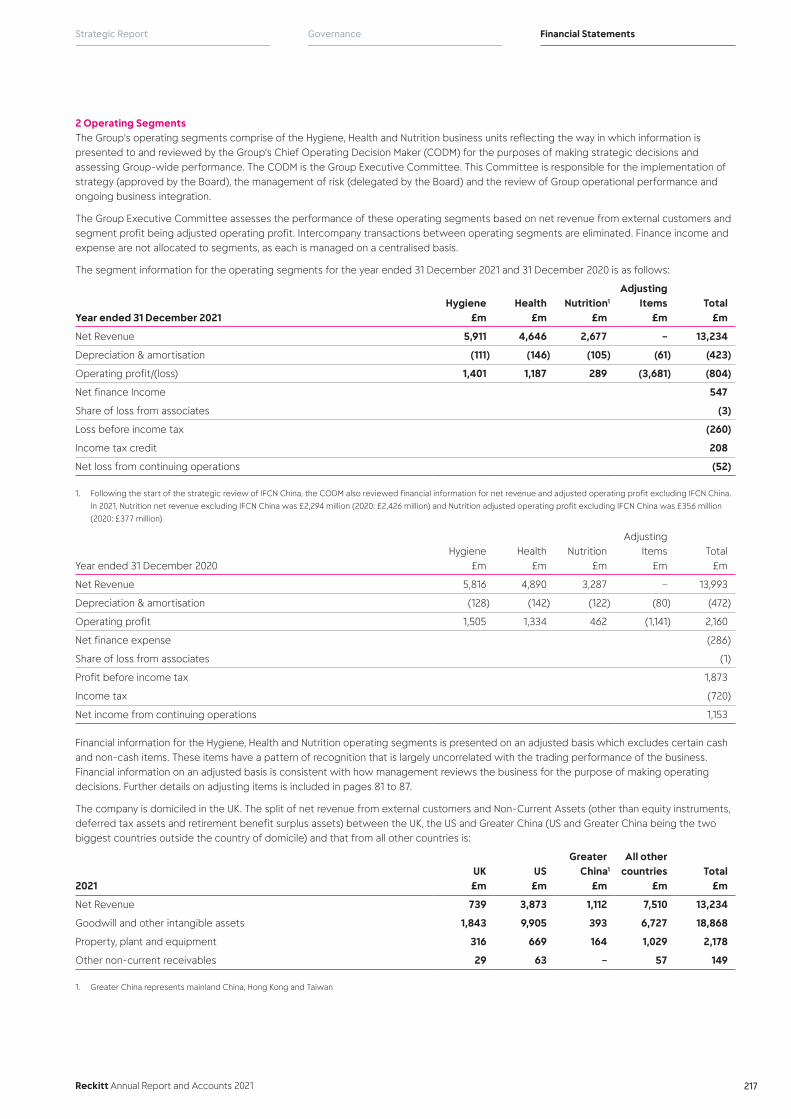
Reckitt Annual Report and Accounts 2021
Financial StatementsGovernanceStrategic Report
217
2 Operating SegmentsThe Group’s operating segments comprise of the Hygiene, Health and Nutrition business units reflecting the way in which information is presented to and reviewed by the Group’s Chief Operating Decision Maker (CODM) for the purposes of making strategic decisions and assessing Group-wide performance. The CODM is the Group Executive Committee. This Committee is responsible for the implementation of strategy (approved by the Board), the management of risk (delegated by the Board) and the review of Group operational performance and ongoing business integration.
The Group Executive Committee assesses the performance of these operating segments based on net revenue from external customers and segment profit being adjusted operating profit. Intercompany transactions between operating segments are eliminated. Finance income and expense are not allocated to segments, as each is managed on a centralised basis.
The segment information for the operating segments for the year ended 31 December 2021 and 31 December 2020 is as follows:
Year ended 31 December 2021Hygiene
£mHealth
£mNutrition1
£m
Adjusting Items
£mTotal
£m
Net Revenue 5,911 4,646 2,677 – 13,234
Depreciation & amortisation (111) (146) (105) (61) (423)
Operating profit/(loss) 1,401 1,187 289 (3,681) (804)
Net finance Income 547
Share of loss from associates (3)
Loss before income tax (260)
Income tax credit 208
Net loss from continuing operations (52)
1. Following the start of the strategic review of IFCN China, the CODM also reviewed financial information for net revenue and adjusted operating profit excluding IFCN China.
In 2021, Nutrition net revenue excluding IFCN China was £2,294 million (2020: £2,426 million) and Nutrition adjusted operating profit excluding IFCN China was £356 million
(2020: £377 million)
Year ended 31 December 2020Hygiene
£mHealth
£mNutrition
£m
Adjusting Items
£mTotal
£m
Net Revenue 5,816 4,890 3,287 – 13,993
Depreciation & amortisation (128) (142) (122) (80) (472)
Operating profit 1,505 1,334 462 (1,141) 2,160
Net finance expense (286)
Share of loss from associates (1)
Profit before income tax 1,873
Income tax (720)
Net income from continuing operations 1,153
Financial information for the Hygiene, Health and Nutrition operating segments is presented on an adjusted basis which excludes certain cash and non-cash items. These items have a pattern of recognition that is largely uncorrelated with the trading performance of the business. Financial information on an adjusted basis is consistent with how management reviews the business for the purpose of making operating decisions. Further details on adjusting items is included in pages 81 to 87.
The company is domiciled in the UK. The split of net revenue from external customers and Non-Current Assets (other than equity instruments, deferred tax assets and retirement benefit surplus assets) between the UK, the US and Greater China (US and Greater China being the two biggest countries outside the country of domicile) and that from all other countries is:
2021UK £m
US £m
Greater China1
£m
All other countries
£mTotal
£m
Net Revenue 739 3,873 1,112 7,510 13,234
Goodwill and other intangible assets 1,843 9,905 393 6,727 18,868
Property, plant and equipment 316 669 164 1,029 2,178
Other non-current receivables 29 63 – 57 149
1. Greater China represents mainland China, Hong Kong and Taiwan
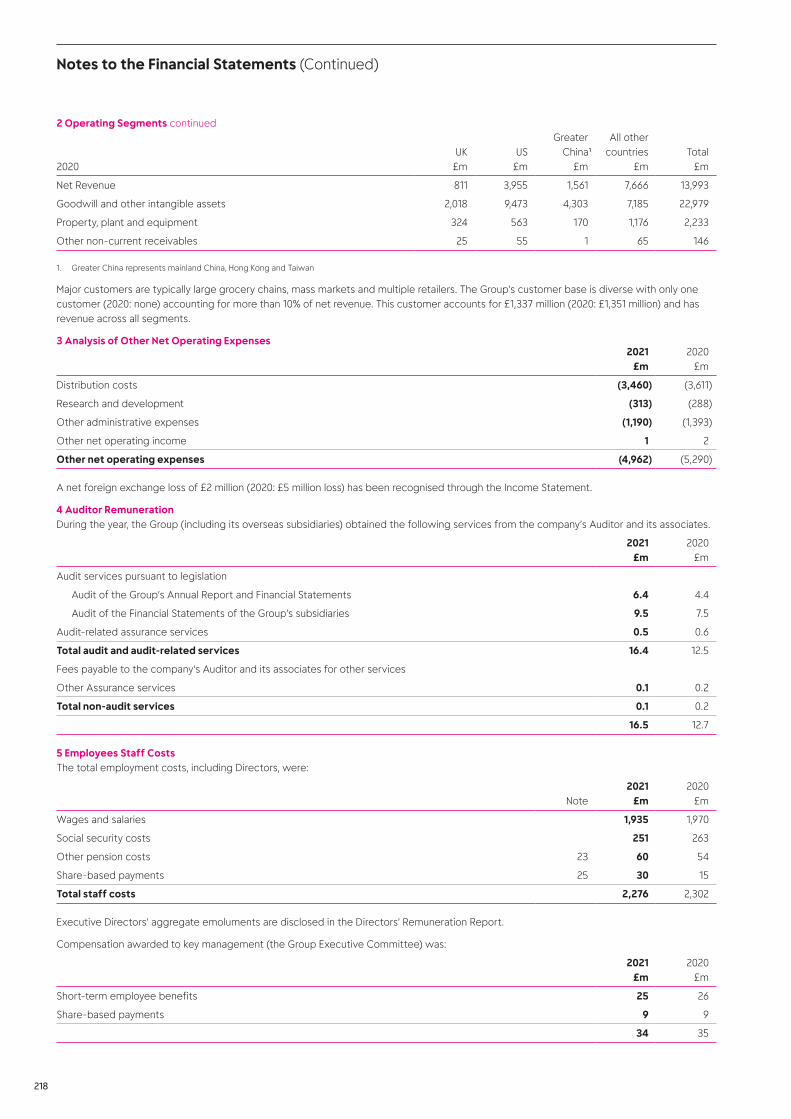
218
2020UK £m
US £m
Greater China1
£m
All other countries
£mTotal
£m
Net Revenue 811 3,955 1,561 7,666 13,993
Goodwill and other intangible assets 2,018 9,473 4,303 7,185 22,979
Property, plant and equipment 324 563 170 1,176 2,233
Other non-current receivables 25 55 1 65 146
1. Greater China represents mainland China, Hong Kong and Taiwan
Major customers are typically large grocery chains, mass markets and multiple retailers. The Group’s customer base is diverse with only one customer (2020: none) accounting for more than 10% of net revenue. This customer accounts for £1,337 million (2020: £1,351 million) and has revenue across all segments.
3 Analysis of Other Net Operating Expenses2021
£m2020
£m
Distribution costs (3,460) (3,611)
Research and development (313) (288)
Other administrative expenses (1,190) (1,393)
Other net operating income 1 2
Other net operating expenses (4,962) (5,290)
A net foreign exchange loss of £2 million (2020: £5 million loss) has been recognised through the Income Statement.
4 Auditor RemunerationDuring the year, the Group (including its overseas subsidiaries) obtained the following services from the company’s Auditor and its associates.
2021 £m
2020 £m
Audit services pursuant to legislation
Audit of the Group’s Annual Report and Financial Statements 6.4 4.4
Audit of the Financial Statements of the Group’s subsidiaries 9.5 7.5
Audit-related assurance services 0.5 0.6
Total audit and audit-related services 16.4 12.5
Fees payable to the company’s Auditor and its associates for other services
Other Assurance services 0.1 0.2
Total non-audit services 0.1 0.2
16.5 12.7
5 Employees Staff CostsThe total employment costs, including Directors, were:
Note2021
£m2020
£m
Wages and salaries 1,935 1,970
Social security costs 251 263
Other pension costs 23 60 54
Share-based payments 25 30 15
Total staff costs 2,276 2,302
Executive Directors’ aggregate emoluments are disclosed in the Directors’ Remuneration Report.
Compensation awarded to key management (the Group Executive Committee) was:
2021 £m
2020 £m
Short-term employee benefits 25 26
Share-based payments 9 9
34 35
2 Operating Segments continued
Notes to the Financial Statements (Continued)

Reckitt Annual Report and Accounts 2021
Financial StatementsGovernanceStrategic Report
219
Staff numbersThe monthly average number of people employed by the Group, including Directors, during the year was:
2021 ’000
2020 ’000
North America 5.0 4.7
Europe/ANZ 14.8 14.1
Rest of world 22.0 25.1
41.8 43.9
6 Net Finance Income/(Expense)2021
£m2020
£m
Foreign exchange net gain on liquidation of subsidiaries
Gains on liquidation 1,048 –
Losses on liquidation (282) –
Total foreign exchange net gain on liquidation of subsidiaries 766 –
Other finance income
Interest income on cash and cash equivalents 29 61
Movement on put option liability 14 –
Finance income on tax balances 1 –
Other finance income 1 16
Total other finance income 45 77
Other finance expense
Interest payable on borrowings (244) (276)
Finance expense on tax balances – (26)
Movement on put option liability – (9)
Other finance expense (20) (52)
Total other finance expense (264) (363)
Other net finance expense (219) (286)
Net finance Income/(expense) 547 (286)
During 2021, as a result of the simplification of the Group’s legal entity structure, a number of entities were liquidated and the cumulative foreign exchange reserves were recycled to the Income Statement, resulting in a net foreign exchange gain of £766 million, principally from the liquidation of intermediate financing and holding companies.
7 Income Tax Expense2021
£m2020
£m
Current tax 711 740
Adjustment in respect of prior periods 53 (45)
Total current tax 764 695
Origination and reversal of temporary differences (1,089) (56)
Impact of changes in tax rates 185 81
Total deferred tax (904) 25
Cumulative foreign exchange on deferred tax balances reclassified to the Income Statement (68) –
Income tax (credit)/charge (208) 720
Current tax includes tax incurred by UK entities of £133 million (2020: £135 million). This is comprised of UK corporation tax of £55 million (2020: £85 million) and overseas tax suffered of £78 million (2020: £50 million). UK current tax is calculated at 19% (2020: 19%) of the estimated assessable profit for the year, net of relief for overseas taxes where available. Taxation in other jurisdictions is calculated at the rates prevailing in the relevant jurisdictions.
Cash tax paid in the year was £915 million (2020: £762 million). The variance from the current tax charge of £711 million is attributable to movements on non-current tax liabilities (shown in Note 22) and timing differences arising between accrual and payment of income tax liabilities.
5 Employees Staff Costs continued
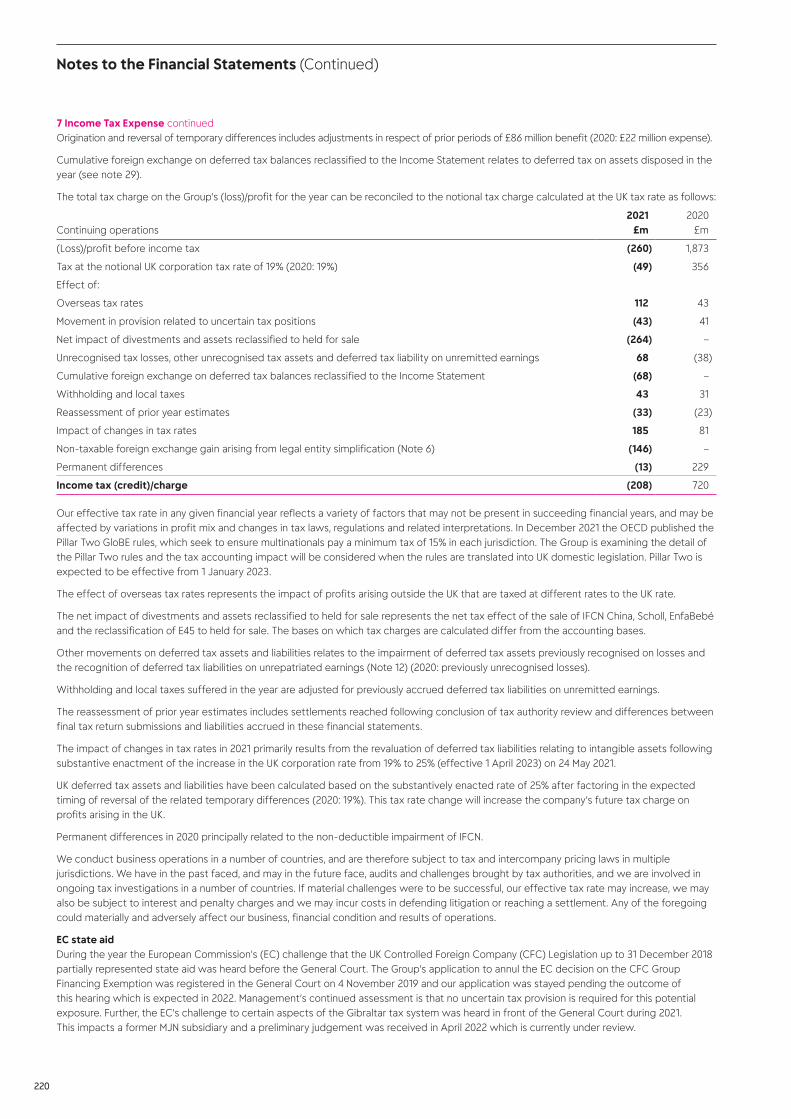
220
Origination and reversal of temporary differences includes adjustments in respect of prior periods of £86 million benefit (2020: £22 million expense).
Cumulative foreign exchange on deferred tax balances reclassified to the Income Statement relates to deferred tax on assets disposed in the year (see note 29).
The total tax charge on the Group’s (loss)/profit for the year can be reconciled to the notional tax charge calculated at the UK tax rate as follows:
Continuing operations2021
£m2020
£m
(Loss)/profit before income tax (260) 1,873
Tax at the notional UK corporation tax rate of 19% (2020: 19%) (49) 356
Effect of:
Overseas tax rates 112 43
Movement in provision related to uncertain tax positions (43) 41
Net impact of divestments and assets reclassified to held for sale (264) –
Unrecognised tax losses, other unrecognised tax assets and deferred tax liability on unremitted earnings 68 (38)
Cumulative foreign exchange on deferred tax balances reclassified to the Income Statement (68) –
Withholding and local taxes 43 31
Reassessment of prior year estimates (33) (23)
Impact of changes in tax rates 185 81
Non-taxable foreign exchange gain arising from legal entity simplification (Note 6) (146) –
Permanent differences (13) 229
Income tax (credit)/charge (208) 720
Our effective tax rate in any given financial year reflects a variety of factors that may not be present in succeeding financial years, and may be affected by variations in profit mix and changes in tax laws, regulations and related interpretations. In December 2021 the OECD published the Pillar Two GloBE rules, which seek to ensure multinationals pay a minimum tax of 15% in each jurisdiction. The Group is examining the detail of the Pillar Two rules and the tax accounting impact will be considered when the rules are translated into UK domestic legislation. Pillar Two is expected to be effective from 1 January 2023.
The effect of overseas tax rates represents the impact of profits arising outside the UK that are taxed at different rates to the UK rate.
The net impact of divestments and assets reclassified to held for sale represents the net tax effect of the sale of IFCN China, Scholl, EnfaBebé and the reclassification of E45 to held for sale. The bases on which tax charges are calculated differ from the accounting bases.
Other movements on deferred tax assets and liabilities relates to the impairment of deferred tax assets previously recognised on losses and the recognition of deferred tax liabilities on unrepatriated earnings (Note 12) (2020: previously unrecognised losses).
Withholding and local taxes suffered in the year are adjusted for previously accrued deferred tax liabilities on unremitted earnings.
The reassessment of prior year estimates includes settlements reached following conclusion of tax authority review and differences between final tax return submissions and liabilities accrued in these financial statements.
The impact of changes in tax rates in 2021 primarily results from the revaluation of deferred tax liabilities relating to intangible assets following substantive enactment of the increase in the UK corporation rate from 19% to 25% (effective 1 April 2023) on 24 May 2021.
UK deferred tax assets and liabilities have been calculated based on the substantively enacted rate of 25% after factoring in the expected timing of reversal of the related temporary differences (2020: 19%). This tax rate change will increase the company’s future tax charge on profits arising in the UK.
Permanent differences in 2020 principally related to the non-deductible impairment of IFCN.
We conduct business operations in a number of countries, and are therefore subject to tax and intercompany pricing laws in multiple jurisdictions. We have in the past faced, and may in the future face, audits and challenges brought by tax authorities, and we are involved in ongoing tax investigations in a number of countries. If material challenges were to be successful, our effective tax rate may increase, we may also be subject to interest and penalty charges and we may incur costs in defending litigation or reaching a settlement. Any of the foregoing could materially and adversely affect our business, financial condition and results of operations.
EC state aidDuring the year the European Commission’s (EC) challenge that the UK Controlled Foreign Company (CFC) Legislation up to 31 December 2018 partially represented state aid was heard before the General Court. The Group’s application to annul the EC decision on the CFC Group Financing Exemption was registered in the General Court on 4 November 2019 and our application was stayed pending the outcome of this hearing which is expected in 2022. Management’s continued assessment is that no uncertain tax provision is required for this potential exposure. Further, the EC’s challenge to certain aspects of the Gibraltar tax system was heard in front of the General Court during 2021. This impacts a former MJN subsidiary and a preliminary judgement was received in April 2022 which is currently under review.
Notes to the Financial Statements (Continued)
7 Income Tax Expense continued

Reckitt Annual Report and Accounts 2021
Financial StatementsGovernanceStrategic Report
221
The tax (charge)/credit relating to components of other comprehensive income is as follows:
2021 2020
Before tax £m
Tax (charge)/
credit £m
After tax £m
Before tax £m
Tax (charge)/
credit £m
After tax £m
Net exchange (losses) on foreign currency translation (374) – (374) (207) – (207)
Reclassification of foreign currency translation reserves on disposal or liquidation of foreign operations (550) – (550) – – –
Gains/(losses) on cash flow and net investment hedges 118 (4) 114 (95) 3 (92)
Remeasurement of defined benefit pension plans (Note 23) 179 (46) 133 (75) 15 (60)
Revaluation of equity instruments – FVOCI (1) – (1) 31 (12) 19
Other comprehensive loss (628) (50) (678) (346) 6 (340)
Current tax – 1
Deferred tax (Note 12) (50) 5
(50) 6
The tax credited/(charged) directly to the Statement of Changes in Equity during the year is as follows:
2021 £m
2020 £m
Current tax 4 6
Deferred tax (Note 12) (4) (2)
– 4
8 Earnings Per Share2021
pence2020
pence
Basic (loss)/earnings per share
From continuing operations (8.8) 160.0
From discontinued operations 4.3 7.0
Total basic (loss)/earnings per share (4.5) 167.0
Diluted (loss)/earnings per share
From continuing operations (8.8) 159.3
From discontinued operations 4.3 7.0
Total diluted (loss)/earnings per share (4.5) 166.3
BasicBasic earnings per share is calculated by dividing the net (loss)/income attributable to owners of the Parent Company from continuing operations (2021: £63 million loss, 2020: £1,137 million income) and discontinued operations (2021: £31 million income; 2020: £50 million income) by the weighted average number of ordinary shares in issue during the year (2021: 713,758,909; 2020: 710,907,200)
DilutedDiluted earnings per share is calculated by adjusting the weighted average number of shares outstanding to assume conversion of all potentially dilutive ordinary shares. The company has the following categories of potentially dilutive ordinary shares: Executive Share Awards (including Executive Share Options and Executive Restricted Share Scheme Awards) and Employee Sharesave Scheme Options. The options only dilute earnings when they result in the issue of shares at a value below the market price of the share and when all performance criteria (if applicable) have been met. As at 31 December 2021 there were 10,683,109 (2020: 1,865,524) Executive Share Awards excluded from the dilution because the exercise price for the options was greater than the average share price for the year or the performance criteria have not been met.
2021 Average number of
shares
2020 Average number of
shares
On a basic basis 713,758,909 710,907,200
Dilution for Executive Share Awards1 – 61,251
Dilution for Employee Sharesave Scheme Options outstanding1 – 2,778,499
On a diluted basis 713,758,909 713,746,950
1. As there was a loss in 2021, the effect of potentially dilutive shares is anti-dilutive
7 Income Tax Expense continued
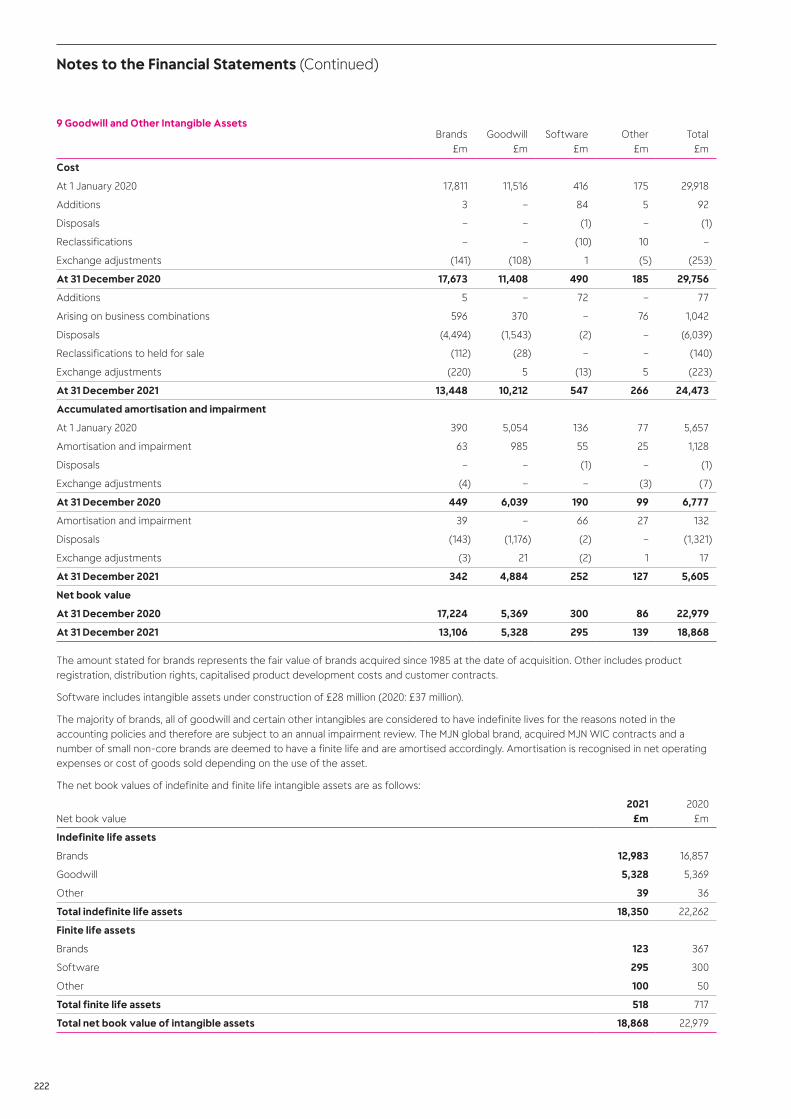
222
9 Goodwill and Other Intangible AssetsBrands
£mGoodwill
£mSoftware
£mOther
£mTotal
£m
Cost
At 1 January 2020 17,811 11,516 416 175 29,918
Additions 3 – 84 5 92
Disposals – – (1) – (1)
Reclassifications – – (10) 10 –
Exchange adjustments (141) (108) 1 (5) (253)
At 31 December 2020 17,673 11,408 490 185 29,756
Additions 5 – 72 – 77
Arising on business combinations 596 370 – 76 1,042
Disposals (4,494) (1,543) (2) – (6,039)
Reclassifications to held for sale (112) (28) – – (140)
Exchange adjustments (220) 5 (13) 5 (223)
At 31 December 2021 13,448 10,212 547 266 24,473
Accumulated amortisation and impairment
At 1 January 2020 390 5,054 136 77 5,657
Amortisation and impairment 63 985 55 25 1,128
Disposals – – (1) – (1)
Exchange adjustments (4) – – (3) (7)
At 31 December 2020 449 6,039 190 99 6,777
Amortisation and impairment 39 – 66 27 132
Disposals (143) (1,176) (2) – (1,321)
Exchange adjustments (3) 21 (2) 1 17
At 31 December 2021 342 4,884 252 127 5,605
Net book value
At 31 December 2020 17,224 5,369 300 86 22,979
At 31 December 2021 13,106 5,328 295 139 18,868
The amount stated for brands represents the fair value of brands acquired since 1985 at the date of acquisition. Other includes product registration, distribution rights, capitalised product development costs and customer contracts.
Software includes intangible assets under construction of £28 million (2020: £37 million).
The majority of brands, all of goodwill and certain other intangibles are considered to have indefinite lives for the reasons noted in the accounting policies and therefore are subject to an annual impairment review. The MJN global brand, acquired MJN WIC contracts and a number of small non-core brands are deemed to have a finite life and are amortised accordingly. Amortisation is recognised in net operating expenses or cost of goods sold depending on the use of the asset.
The net book values of indefinite and finite life intangible assets are as follows:
Net book value2021
£m2020
£m
Indefinite life assets
Brands 12,983 16,857
Goodwill 5,328 5,369
Other 39 36
Total indefinite life assets 18,350 22,262
Finite life assets
Brands 123 367
Software 295 300
Other 100 50
Total finite life assets 518 717
Total net book value of intangible assets 18,868 22,979
Notes to the Financial Statements (Continued)
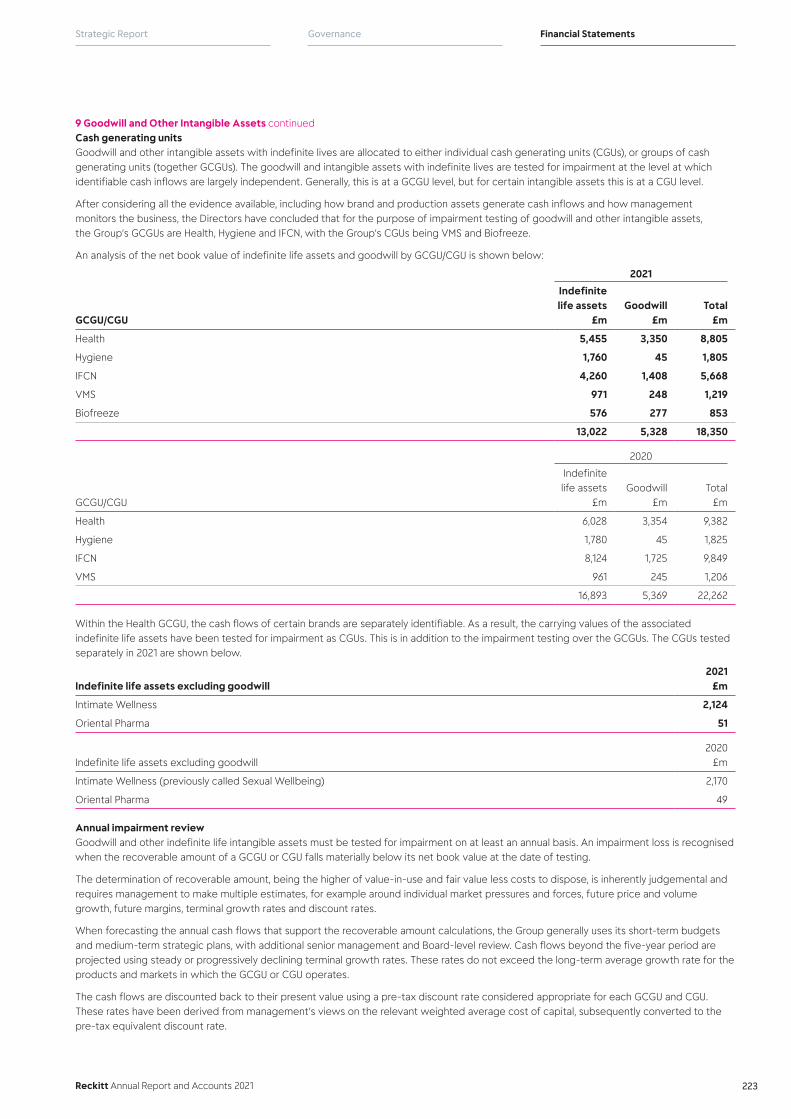
Reckitt Annual Report and Accounts 2021
Financial StatementsGovernanceStrategic Report
223
Cash generating unitsGoodwill and other intangible assets with indefinite lives are allocated to either individual cash generating units (CGUs), or groups of cash generating units (together GCGUs). The goodwill and intangible assets with indefinite lives are tested for impairment at the level at which identifiable cash inflows are largely independent. Generally, this is at a GCGU level, but for certain intangible assets this is at a CGU level.
After considering all the evidence available, including how brand and production assets generate cash inflows and how management monitors the business, the Directors have concluded that for the purpose of impairment testing of goodwill and other intangible assets, the Group’s GCGUs are Health, Hygiene and IFCN, with the Group’s CGUs being VMS and Biofreeze.
An analysis of the net book value of indefinite life assets and goodwill by GCGU/CGU is shown below:
2021
GCGU/CGU
Indefinite life assets
£mGoodwill
£mTotal
£m
Health 5,455 3,350 8,805
Hygiene 1,760 45 1,805
IFCN 4,260 1,408 5,668
VMS 971 248 1,219
Biofreeze 576 277 853
13,022 5,328 18,350
2020
GCGU/CGU
Indefinite life assets
£mGoodwill
£mTotal
£m
Health 6,028 3,354 9,382
Hygiene 1,780 45 1,825
IFCN 8,124 1,725 9,849
VMS 961 245 1,206
16,893 5,369 22,262
Within the Health GCGU, the cash flows of certain brands are separately identifiable. As a result, the carrying values of the associated indefinite life assets have been tested for impairment as CGUs. This is in addition to the impairment testing over the GCGUs. The CGUs tested separately in 2021 are shown below.
Indefinite life assets excluding goodwill2021
£m
Intimate Wellness 2,124
Oriental Pharma 51
Indefinite life assets excluding goodwill2020
£m
Intimate Wellness (previously called Sexual Wellbeing) 2,170
Oriental Pharma 49
Annual impairment reviewGoodwill and other indefinite life intangible assets must be tested for impairment on at least an annual basis. An impairment loss is recognised when the recoverable amount of a GCGU or CGU falls materially below its net book value at the date of testing.
The determination of recoverable amount, being the higher of value-in-use and fair value less costs to dispose, is inherently judgemental and requires management to make multiple estimates, for example around individual market pressures and forces, future price and volume growth, future margins, terminal growth rates and discount rates.
When forecasting the annual cash flows that support the recoverable amount calculations, the Group generally uses its short-term budgets and medium-term strategic plans, with additional senior management and Board-level review. Cash flows beyond the five-year period are projected using steady or progressively declining terminal growth rates. These rates do not exceed the long-term average growth rate for the products and markets in which the GCGU or CGU operates.
The cash flows are discounted back to their present value using a pre-tax discount rate considered appropriate for each GCGU and CGU. These rates have been derived from management’s views on the relevant weighted average cost of capital, subsequently converted to the pre-tax equivalent discount rate.
9 Goodwill and Other Intangible Assets continued
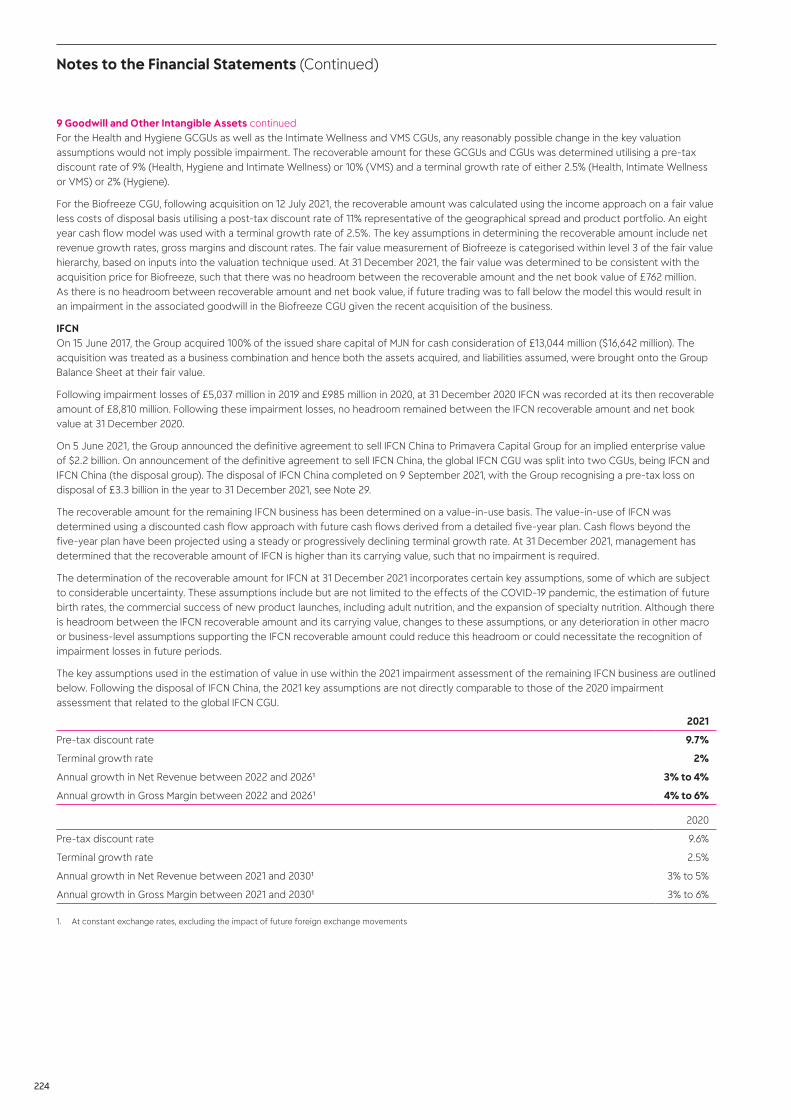
224
For the Health and Hygiene GCGUs as well as the Intimate Wellness and VMS CGUs, any reasonably possible change in the key valuation assumptions would not imply possible impairment. The recoverable amount for these GCGUs and CGUs was determined utilising a pre-tax discount rate of 9% (Health, Hygiene and Intimate Wellness) or 10% (VMS) and a terminal growth rate of either 2.5% (Health, Intimate Wellness or VMS) or 2% (Hygiene).
For the Biofreeze CGU, following acquisition on 12 July 2021, the recoverable amount was calculated using the income approach on a fair value less costs of disposal basis utilising a post-tax discount rate of 11% representative of the geographical spread and product portfolio. An eight year cash flow model was used with a terminal growth rate of 2.5%. The key assumptions in determining the recoverable amount include net revenue growth rates, gross margins and discount rates. The fair value measurement of Biofreeze is categorised within level 3 of the fair value hierarchy, based on inputs into the valuation technique used. At 31 December 2021, the fair value was determined to be consistent with the acquisition price for Biofreeze, such that there was no headroom between the recoverable amount and the net book value of £762 million. As there is no headroom between recoverable amount and net book value, if future trading was to fall below the model this would result in an impairment in the associated goodwill in the Biofreeze CGU given the recent acquisition of the business.
IFCNOn 15 June 2017, the Group acquired 100% of the issued share capital of MJN for cash consideration of £13,044 million ($16,642 million). The acquisition was treated as a business combination and hence both the assets acquired, and liabilities assumed, were brought onto the Group Balance Sheet at their fair value.
Following impairment losses of £5,037 million in 2019 and £985 million in 2020, at 31 December 2020 IFCN was recorded at its then recoverable amount of £8,810 million. Following these impairment losses, no headroom remained between the IFCN recoverable amount and net book value at 31 December 2020.
On 5 June 2021, the Group announced the definitive agreement to sell IFCN China to Primavera Capital Group for an implied enterprise value of $2.2 billion. On announcement of the definitive agreement to sell IFCN China, the global IFCN CGU was split into two CGUs, being IFCN and IFCN China (the disposal group). The disposal of IFCN China completed on 9 September 2021, with the Group recognising a pre-tax loss on disposal of £3.3 billion in the year to 31 December 2021, see Note 29.
The recoverable amount for the remaining IFCN business has been determined on a value-in-use basis. The value-in-use of IFCN was determined using a discounted cash flow approach with future cash flows derived from a detailed five-year plan. Cash flows beyond the five-year plan have been projected using a steady or progressively declining terminal growth rate. At 31 December 2021, management has determined that the recoverable amount of IFCN is higher than its carrying value, such that no impairment is required.
The determination of the recoverable amount for IFCN at 31 December 2021 incorporates certain key assumptions, some of which are subject to considerable uncertainty. These assumptions include but are not limited to the effects of the COVID-19 pandemic, the estimation of future birth rates, the commercial success of new product launches, including adult nutrition, and the expansion of specialty nutrition. Although there is headroom between the IFCN recoverable amount and its carrying value, changes to these assumptions, or any deterioration in other macro or business-level assumptions supporting the IFCN recoverable amount could reduce this headroom or could necessitate the recognition of impairment losses in future periods.
The key assumptions used in the estimation of value in use within the 2021 impairment assessment of the remaining IFCN business are outlined below. Following the disposal of IFCN China, the 2021 key assumptions are not directly comparable to those of the 2020 impairment assessment that related to the global IFCN CGU.
2021
Pre-tax discount rate 9.7%
Terminal growth rate 2%
Annual growth in Net Revenue between 2022 and 20261 3% to 4%
Annual growth in Gross Margin between 2022 and 20261 4% to 6%
2020
Pre-tax discount rate 9.6%
Terminal growth rate 2.5%
Annual growth in Net Revenue between 2021 and 20301 3% to 5%
Annual growth in Gross Margin between 2021 and 20301 3% to 6%
1. At constant exchange rates, excluding the impact of future foreign exchange movements
9 Goodwill and Other Intangible Assets continued
Notes to the Financial Statements (Continued)
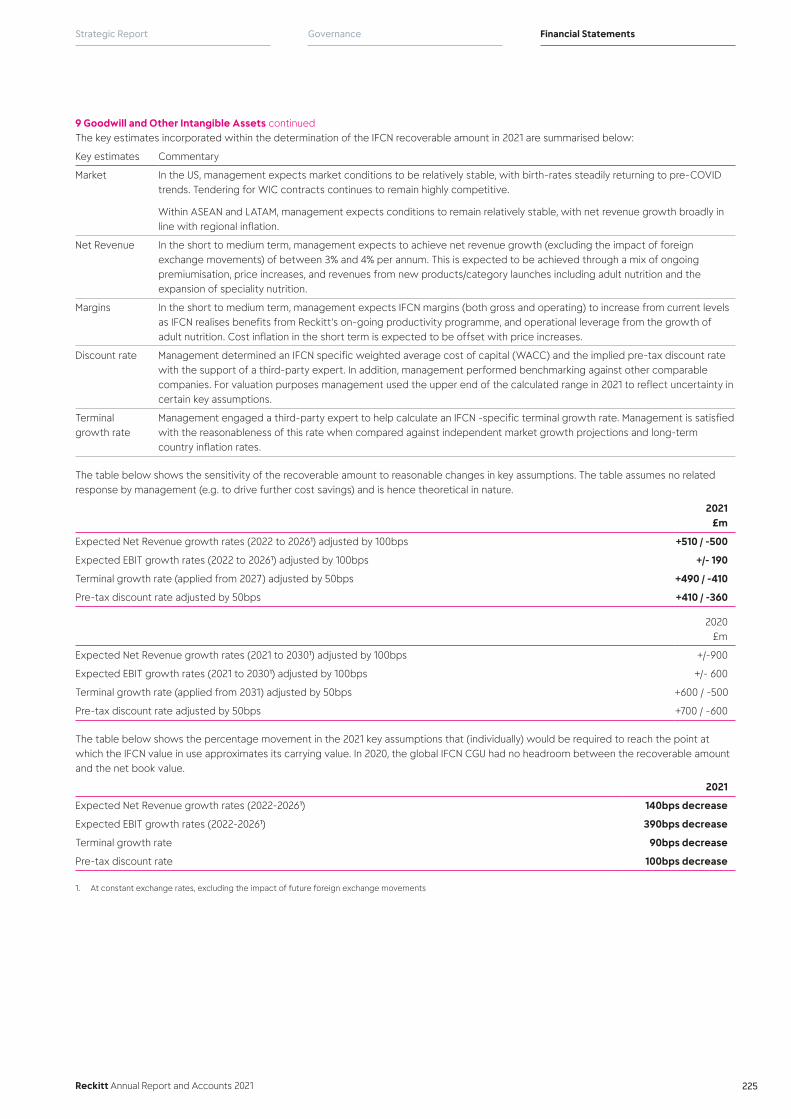
Reckitt Annual Report and Accounts 2021
Financial StatementsGovernanceStrategic Report
225
The key estimates incorporated within the determination of the IFCN recoverable amount in 2021 are summarised below:
Key estimates Commentary
Market In the US, management expects market conditions to be relatively stable, with birth-rates steadily returning to pre-COVID trends. Tendering for WIC contracts continues to remain highly competitive.
Within ASEAN and LATAM, management expects conditions to remain relatively stable, with net revenue growth broadly in line with regional inflation.
Net Revenue In the short to medium term, management expects to achieve net revenue growth (excluding the impact of foreign exchange movements) of between 3% and 4% per annum. This is expected to be achieved through a mix of ongoing premiumisation, price increases, and revenues from new products/category launches including adult nutrition and the expansion of speciality nutrition.
Margins In the short to medium term, management expects IFCN margins (both gross and operating) to increase from current levels as IFCN realises benefits from Reckitt’s on-going productivity programme, and operational leverage from the growth of adult nutrition. Cost inflation in the short term is expected to be offset with price increases.
Discount rate Management determined an IFCN specific weighted average cost of capital (WACC) and the implied pre-tax discount rate with the support of a third-party expert. In addition, management performed benchmarking against other comparable companies. For valuation purposes management used the upper end of the calculated range in 2021 to reflect uncertainty in certain key assumptions.
Terminal growth rate
Management engaged a third-party expert to help calculate an IFCN -specific terminal growth rate. Management is satisfied with the reasonableness of this rate when compared against independent market growth projections and long-term country inflation rates.
The table below shows the sensitivity of the recoverable amount to reasonable changes in key assumptions. The table assumes no related response by management (e.g. to drive further cost savings) and is hence theoretical in nature.
2021 £m
Expected Net Revenue growth rates (2022 to 20261) adjusted by 100bps +510 / -500
Expected EBIT growth rates (2022 to 20261) adjusted by 100bps +/- 190
Terminal growth rate (applied from 2027) adjusted by 50bps +490 / -410
Pre-tax discount rate adjusted by 50bps +410 / -360
2020£m
Expected Net Revenue growth rates (2021 to 20301) adjusted by 100bps +/-900
Expected EBIT growth rates (2021 to 20301) adjusted by 100bps +/- 600
Terminal growth rate (applied from 2031) adjusted by 50bps +600 / -500
Pre-tax discount rate adjusted by 50bps +700 / -600
The table below shows the percentage movement in the 2021 key assumptions that (individually) would be required to reach the point at which the IFCN value in use approximates its carrying value. In 2020, the global IFCN CGU had no headroom between the recoverable amount and the net book value.
2021
Expected Net Revenue growth rates (2022-20261) 140bps decrease
Expected EBIT growth rates (2022-20261) 390bps decrease
Terminal growth rate 90bps decrease
Pre-tax discount rate 100bps decrease
1. At constant exchange rates, excluding the impact of future foreign exchange movements
9 Goodwill and Other Intangible Assets continued
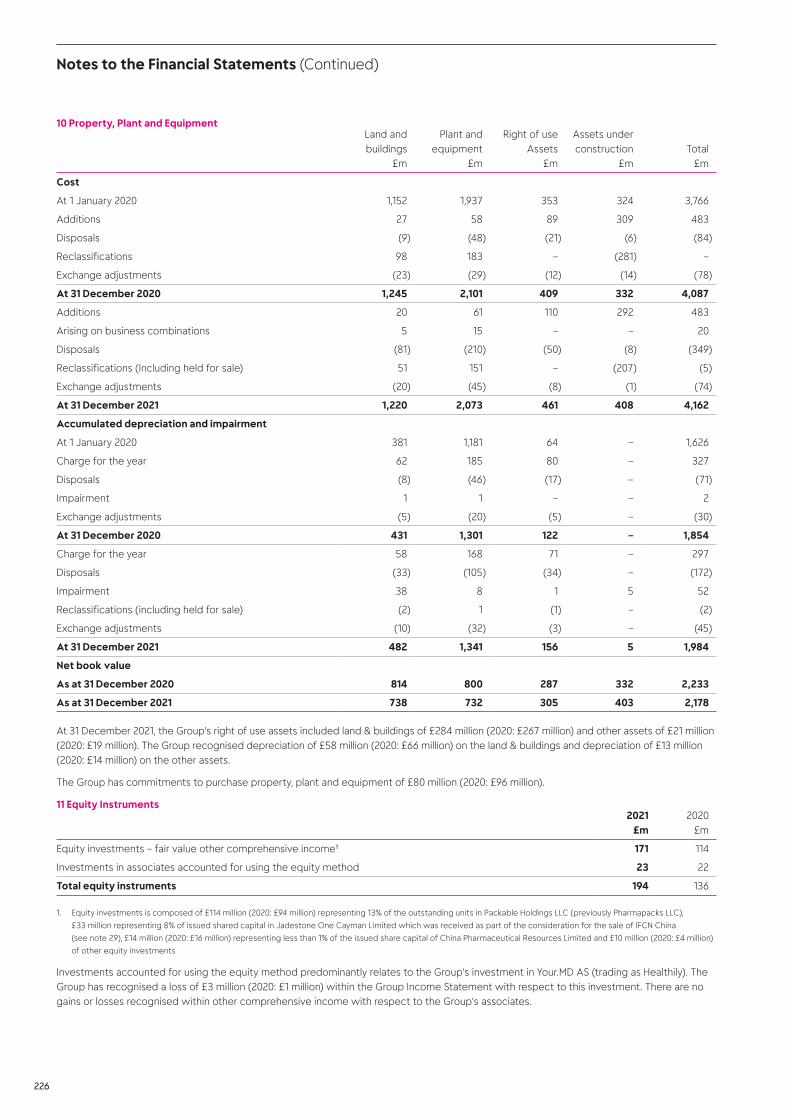
226
10 Property, Plant and EquipmentLand and buildings
£m
Plant and equipment
£m
Right of use Assets
£m
Assets under construction
£mTotal
£m
Cost
At 1 January 2020 1,152 1,937 353 324 3,766
Additions 27 58 89 309 483
Disposals (9) (48) (21) (6) (84)
Reclassifications 98 183 – (281) –
Exchange adjustments (23) (29) (12) (14) (78)
At 31 December 2020 1,245 2,101 409 332 4,087
Additions 20 61 110 292 483
Arising on business combinations 5 15 – – 20
Disposals (81) (210) (50) (8) (349)
Reclassifications (Including held for sale) 51 151 – (207) (5)
Exchange adjustments (20) (45) (8) (1) (74)
At 31 December 2021 1,220 2,073 461 408 4,162
Accumulated depreciation and impairment
At 1 January 2020 381 1,181 64 – 1,626
Charge for the year 62 185 80 – 327
Disposals (8) (46) (17) – (71)
Impairment 1 1 – – 2
Exchange adjustments (5) (20) (5) – (30)
At 31 December 2020 431 1,301 122 – 1,854
Charge for the year 58 168 71 – 297
Disposals (33) (105) (34) – (172)
Impairment 38 8 1 5 52
Reclassifications (including held for sale) (2) 1 (1) – (2)
Exchange adjustments (10) (32) (3) – (45)
At 31 December 2021 482 1,341 156 5 1,984
Net book value
As at 31 December 2020 814 800 287 332 2,233
As at 31 December 2021 738 732 305 403 2,178
At 31 December 2021, the Group’s right of use assets included land & buildings of £284 million (2020: £267 million) and other assets of £21 million (2020: £19 million). The Group recognised depreciation of £58 million (2020: £66 million) on the land & buildings and depreciation of £13 million (2020: £14 million) on the other assets.
The Group has commitments to purchase property, plant and equipment of £80 million (2020: £96 million).
11 Equity Instruments2021
£m2020
£m
Equity investments – fair value other comprehensive income1 171 114
Investments in associates accounted for using the equity method 23 22
Total equity instruments 194 136
1. Equity investments is composed of £114 million (2020: £94 million) representing 13% of the outstanding units in Packable Holdings LLC (previously Pharmapacks LLC),
£33 million representing 8% of issued shared capital in Jadestone One Cayman Limited which was received as part of the consideration for the sale of IFCN China
(see note 29), £14 million (2020: £16 million) representing less than 1% of the issued share capital of China Pharmaceutical Resources Limited and £10 million (2020: £4 million)
of other equity investments
Investments accounted for using the equity method predominantly relates to the Group’s investment in Your.MD AS (trading as Healthily). The Group has recognised a loss of £3 million (2020: £1 million) within the Group Income Statement with respect to this investment. There are no gains or losses recognised within other comprehensive income with respect to the Group’s associates.
Notes to the Financial Statements (Continued)

Reckitt Annual Report and Accounts 2021
Financial StatementsGovernanceStrategic Report
227
12 Deferred Tax
Deferred tax
Accelerated capital
allowances £m
Intangible assets
£m
Short-term temporary
differences £m
Tax losses
£m
Retirement benefit
obligations £m
Total £m
At 1 January 2021 (55) (3,766) 427 52 38 (3,304)
Credited/(charged) to the Income Statement 3 864 59 (24) 2 904
(Charged) to other comprehensive income – – (4) – (46) (50)
(Charged) directly to equity – – (4) – – (4)
Arising on business acquisitions/ disposals 4 (151) (31) – – (178)
Exchange differences (1) 30 (5) (1) – 23
At 31 December 2021 (49) (3,023) 442 27 (6) (2,609)
2021
Accelerated capital
allowances £m
Intangible assets
£m
Short-term temporary
differences £m
Tax losses
£m
Retirement benefit
obligations £m
Total £m
Deferred tax assets (2) (37) 189 24 23 197
Deferred tax liabilities (47) (2,986) 253 3 (29) (2,806)
Deferred tax (49) (3,023) 442 27 (6) (2,609)
Deferred tax
Accelerated capital
allowances £m
Intangible assets
£m
Short-term temporary
differences£m
Tax losses
£m
Retirement benefit
obligations £m
Total £m
At 1 January 2020 (42) (3,710) 381 44 38 (3,289)
(Charged)/credited to the Income Statement (14) (78) 70 10 (13) (25)
Credited/(charged) to other comprehensive income – – (8) – 13 5
Exchange differences 1 22 (16) (2) – 5
At 31 December 2020 (55) (3,766) 427 52 38 (3,304)
2020
Accelerated capital
allowances £m
Intangible assets
£m
Short-term temporary
differences £m
Tax losses
£m
Retirement benefit
obligations £m
Total £m
Deferred tax assets 4 (64) 244 48 26 258
Deferred tax liabilities (59) (3,702) 183 4 12 (3,562)
Deferred tax (55) (3,766) 427 52 38 (3,304)
Deferred tax assets and liabilities have been offset where they relate to income taxes levied by the same taxation authority.
Certain deferred tax assets in respect of corporation tax losses and other temporary differences totalling £2,091 million (2020: £1,534 million) have not been recognised at 31 December 2021 as the likelihood of future economic benefit is not sufficiently assured. These assets will be recognised if utilisation of the losses and other temporary differences becomes sufficiently probable.
13 Inventories2021
£m2020
£m
Raw materials and consumables 383 352
Work in progress 70 87
Finished goods and goods held for resale 1,006 1,153
Total inventories 1,459 1,592
The total cost of inventories recognised as an expense and included in cost of sales amounted to £5,292 million (2020: £5,309 million). This includes inventory write-offs and losses of £191 million (2020: £187 million).
The Group inventory provision at 31 December 2021 was £151 million (2020: £119 million).

228
14 Trade and Other Receivables
Amounts falling due within one year2021
£m2020
£m
Trade receivables 1,587 1,584
Less: Provision for impairment of receivables (36) (27)
Trade receivables – net 1,551 1,557
Other receivables 291 290
Prepayments and accrued income 84 74
Trade and other receivables 1,926 1,921
The carrying amounts of the Group’s trade and other receivables are denominated in the following currencies:
Currency analysis2021
£m2020
£m
US dollar 574 477
Euro 302 281
Sterling 167 155
Brazilian Real 128 117
Other currencies 755 891
Trade and other receivables 1,926 1,921
The maximum exposure to credit risk at the year end is the carrying value of each class of receivable mentioned above.
a. Trade receivablesTrade receivables consist of amounts due from customers. The Group’s customer base is large and diverse and consequently there is limited concentration of credit risk. Credit risk is assessed at a subsidiary and Group level and takes into account the financial positions of customers, past experience, future expectations and other relevant factors. Individual credit limits are established based on those factors.
The following table provides an ageing analysis of trade receivables at year end:
Ageing analysis2021
£m2020
£m
Not overdue 1,318 1,346
Up to 3 months overdue 219 193
Over 3 months overdue 50 45
Trade receivables 1,587 1,584
At 31 December 2021, a provision of £36 million (2020: £27 million) was recorded against certain trade receivables based on a forward-looking assessment of the lifetime expected credit loss as required by IFRS 9. This assessment considered the ageing profiles of specific trade receivable balances along with the risk of future customer defaults.
As at 31 December 2021, trade receivables of £233 million (2020: £211 million) were past due but not impaired. These receivables were not impaired because having considered their nature and historical collection experience, recovery of the unprovided amounts is expected in due course.
b. Other receivablesOther receivables includes recoverable indirect tax of £212 million (2020: £213 million). This contains £2 million (2020: £3 million) of impaired assets all aged over three months from a broad range of countries within the Group.
c. Other non-current receivablesOther non-current receivables at 31 December 2021 of £149 million (2020: £146 million) includes non-current indirect tax, long-term prepayments, and non-current derivatives of £1 million (2020: £19 million)
d. Financial instruments (Note 15)At 31 December 2021 £1,926 million (2020: £1,918 million) of the current and non-current receivables totalling £2,075 million (2020: £2,067 million) are financial assets. These mainly related to amounts owed from customers or government bodies and are typically non-interest bearing. Amounts that are not financial assets are mostly prepayments and employee benefit assets.
Notes to the Financial Statements (Continued)
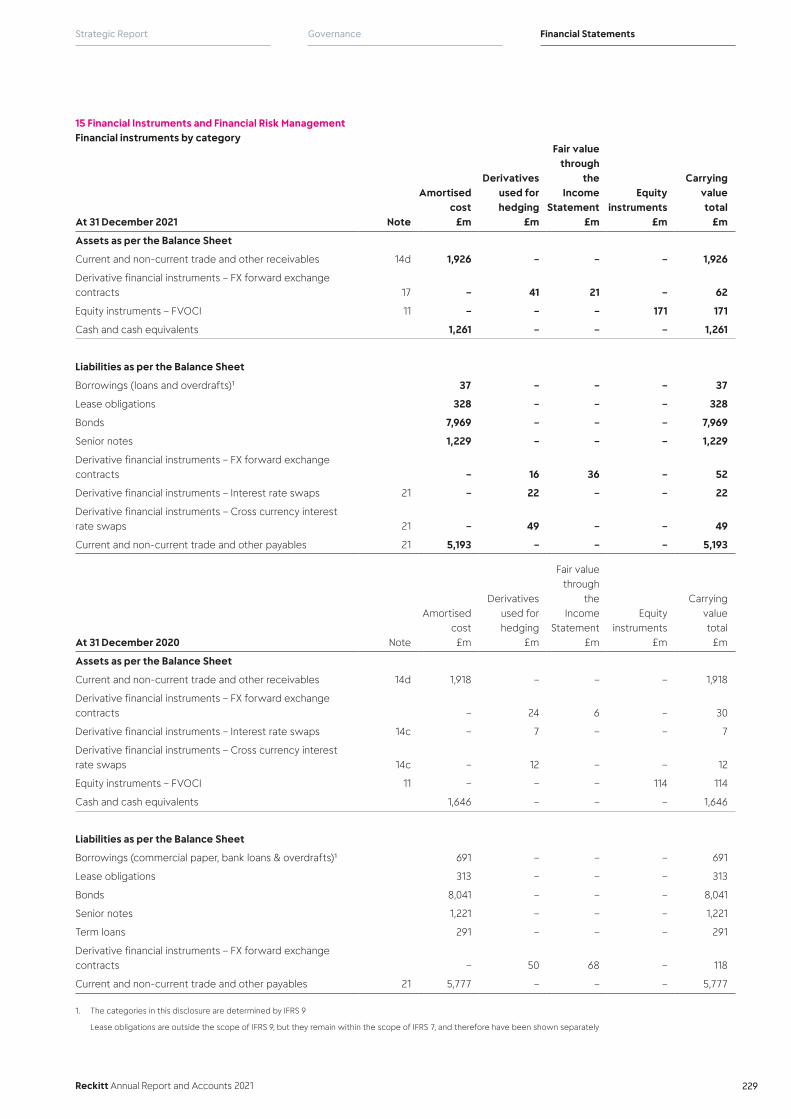
Reckitt Annual Report and Accounts 2021
Financial StatementsGovernanceStrategic Report
229
15 Financial Instruments and Financial Risk ManagementFinancial instruments by category
At 31 December 2021 Note
Amortised cost
£m
Derivatives used for hedging
£m
Fair value through
the Income
Statement £m
Equity instruments
£m
Carrying value total
£m
Assets as per the Balance Sheet
Current and non-current trade and other receivables 14d 1,926 – – – 1,926
Derivative financial instruments – FX forward exchange contracts 17 – 41 21 – 62
Equity instruments – FVOCI 11 – – – 171 171
Cash and cash equivalents 1,261 – – – 1,261
Liabilities as per the Balance Sheet
Borrowings (loans and overdrafts)1 37 – – – 37
Lease obligations 328 – – – 328
Bonds 7,969 – – – 7,969
Senior notes 1,229 – – – 1,229
Derivative financial instruments – FX forward exchange contracts – 16 36 – 52
Derivative financial instruments – Interest rate swaps 21 – 22 – – 22
Derivative financial instruments – Cross currency interest rate swaps 21 – 49 – – 49
Current and non-current trade and other payables 21 5,193 – – – 5,193
At 31 December 2020 Note
Amortised cost £m
Derivatives used for hedging
£m
Fair value through
the Income
Statement £m
Equity instruments
£m
Carrying value total
£m
Assets as per the Balance Sheet
Current and non-current trade and other receivables 14d 1,918 – – – 1,918
Derivative financial instruments – FX forward exchange contracts – 24 6 – 30
Derivative financial instruments – Interest rate swaps 14c – 7 – – 7
Derivative financial instruments – Cross currency interest rate swaps 14c – 12 – – 12
Equity instruments – FVOCI 11 – – – 114 114
Cash and cash equivalents 1,646 – – – 1,646
Liabilities as per the Balance Sheet
Borrowings (commercial paper, bank loans & overdrafts)1 691 – – – 691
Lease obligations 313 – – – 313
Bonds 8,041 – – – 8,041
Senior notes 1,221 – – – 1,221
Term loans 291 – – – 291
Derivative financial instruments – FX forward exchange contracts – 50 68 – 118
Current and non-current trade and other payables 21 5,777 – – – 5,777
1. The categories in this disclosure are determined by IFRS 9
Lease obligations are outside the scope of IFRS 9, but they remain within the scope of IFRS 7, and therefore have been shown separately
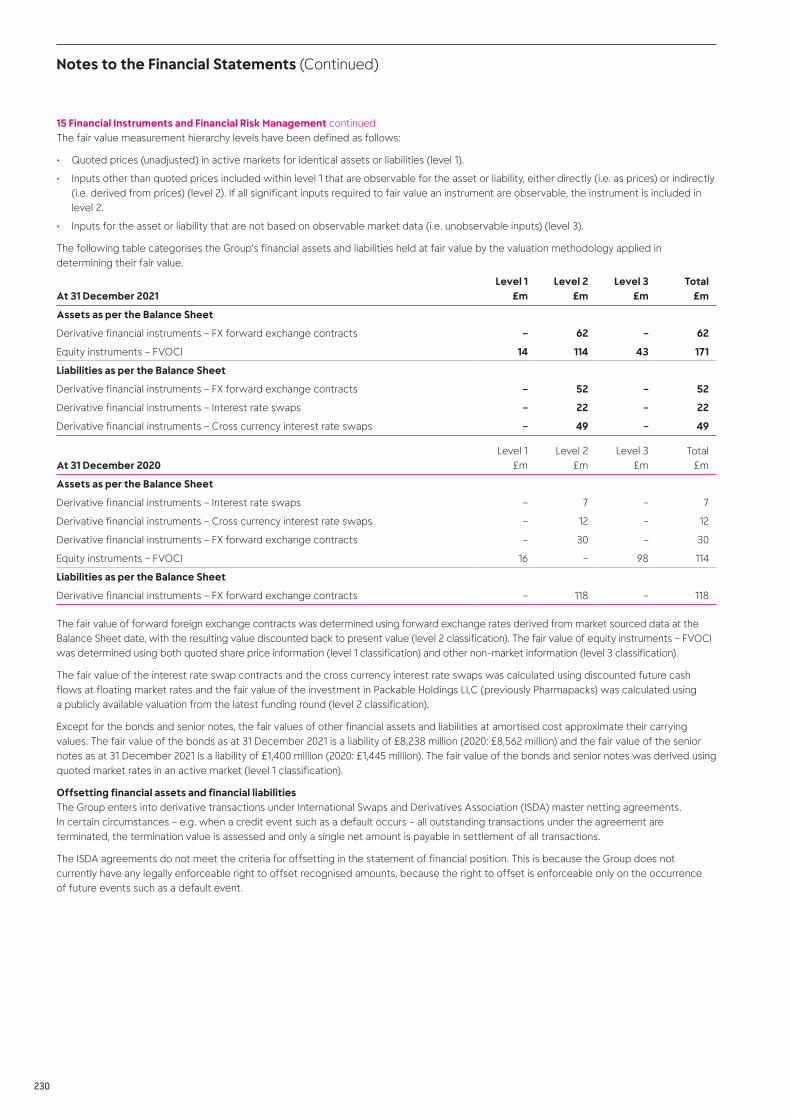
230
The fair value measurement hierarchy levels have been defined as follows:
• Quoted prices (unadjusted) in active markets for identical assets or liabilities (level 1).
• Inputs other than quoted prices included within level 1 that are observable for the asset or liability, either directly (i.e. as prices) or indirectly (i.e. derived from prices) (level 2). If all significant inputs required to fair value an instrument are observable, the instrument is included in level 2.
• Inputs for the asset or liability that are not based on observable market data (i.e. unobservable inputs) (level 3).
The following table categorises the Group’s financial assets and liabilities held at fair value by the valuation methodology applied in determining their fair value.
At 31 December 2021Level 1
£mLevel 2
£mLevel 3
£mTotal
£m
Assets as per the Balance Sheet
Derivative financial instruments – FX forward exchange contracts – 62 – 62
Equity instruments – FVOCI 14 114 43 171
Liabilities as per the Balance Sheet
Derivative financial instruments – FX forward exchange contracts – 52 – 52
Derivative financial instruments – Interest rate swaps – 22 – 22
Derivative financial instruments – Cross currency interest rate swaps – 49 – 49
At 31 December 2020Level 1
£mLevel 2
£mLevel 3
£mTotal
£m
Assets as per the Balance Sheet
Derivative financial instruments – Interest rate swaps – 7 – 7
Derivative financial instruments – Cross currency interest rate swaps – 12 – 12
Derivative financial instruments – FX forward exchange contracts – 30 – 30
Equity instruments – FVOCI 16 – 98 114
Liabilities as per the Balance Sheet
Derivative financial instruments – FX forward exchange contracts – 118 – 118
The fair value of forward foreign exchange contracts was determined using forward exchange rates derived from market sourced data at the Balance Sheet date, with the resulting value discounted back to present value (level 2 classification). The fair value of equity instruments – FVOCI was determined using both quoted share price information (level 1 classification) and other non-market information (level 3 classification).
The fair value of the interest rate swap contracts and the cross currency interest rate swaps was calculated using discounted future cash flows at floating market rates and the fair value of the investment in Packable Holdings LLC (previously Pharmapacks) was calculated using a publicly available valuation from the latest funding round (level 2 classification).
Except for the bonds and senior notes, the fair values of other financial assets and liabilities at amortised cost approximate their carrying values. The fair value of the bonds as at 31 December 2021 is a liability of £8,238 million (2020: £8,562 million) and the fair value of the senior notes as at 31 December 2021 is a liability of £1,400 million (2020: £1,445 million). The fair value of the bonds and senior notes was derived using quoted market rates in an active market (level 1 classification).
Offsetting financial assets and financial liabilitiesThe Group enters into derivative transactions under International Swaps and Derivatives Association (ISDA) master netting agreements. In certain circumstances – e.g. when a credit event such as a default occurs – all outstanding transactions under the agreement are terminated, the termination value is assessed and only a single net amount is payable in settlement of all transactions.
The ISDA agreements do not meet the criteria for offsetting in the statement of financial position. This is because the Group does not currently have any legally enforceable right to offset recognised amounts, because the right to offset is enforceable only on the occurrence of future events such as a default event.
Notes to the Financial Statements (Continued)
15 Financial Instruments and Financial Risk Management continued
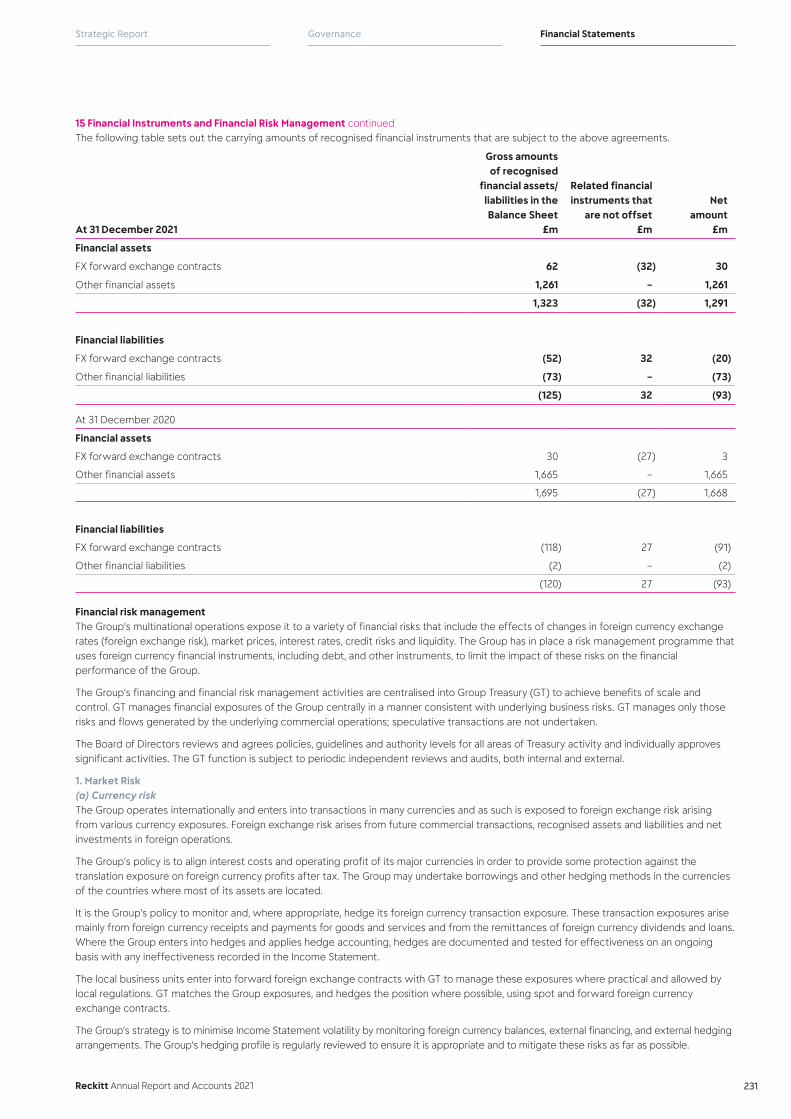
Reckitt Annual Report and Accounts 2021
Financial StatementsGovernanceStrategic Report
231
The following table sets out the carrying amounts of recognised financial instruments that are subject to the above agreements.
At 31 December 2021
Gross amounts of recognised
financial assets/liabilities in the Balance Sheet
£m
Related financial instruments that
are not offset £m
Net amount
£m
Financial assets
FX forward exchange contracts 62 (32) 30
Other financial assets 1,261 – 1,261
1,323 (32) 1,291
Financial liabilities
FX forward exchange contracts (52) 32 (20)
Other financial liabilities (73) – (73)
(125) 32 (93)
At 31 December 2020
Financial assets
FX forward exchange contracts 30 (27) 3
Other financial assets 1,665 – 1,665
1,695 (27) 1,668
Financial liabilities
FX forward exchange contracts (118) 27 (91)
Other financial liabilities (2) – (2)
(120) 27 (93)
Financial risk managementThe Group’s multinational operations expose it to a variety of financial risks that include the effects of changes in foreign currency exchange rates (foreign exchange risk), market prices, interest rates, credit risks and liquidity. The Group has in place a risk management programme that uses foreign currency financial instruments, including debt, and other instruments, to limit the impact of these risks on the financial performance of the Group.
The Group’s financing and financial risk management activities are centralised into Group Treasury (GT) to achieve benefits of scale and control. GT manages financial exposures of the Group centrally in a manner consistent with underlying business risks. GT manages only those risks and flows generated by the underlying commercial operations; speculative transactions are not undertaken.
The Board of Directors reviews and agrees policies, guidelines and authority levels for all areas of Treasury activity and individually approves significant activities. The GT function is subject to periodic independent reviews and audits, both internal and external.
1. Market Risk(a) Currency riskThe Group operates internationally and enters into transactions in many currencies and as such is exposed to foreign exchange risk arising from various currency exposures. Foreign exchange risk arises from future commercial transactions, recognised assets and liabilities and net investments in foreign operations.
The Group’s policy is to align interest costs and operating profit of its major currencies in order to provide some protection against the translation exposure on foreign currency profits after tax. The Group may undertake borrowings and other hedging methods in the currencies of the countries where most of its assets are located.
It is the Group’s policy to monitor and, where appropriate, hedge its foreign currency transaction exposure. These transaction exposures arise mainly from foreign currency receipts and payments for goods and services and from the remittances of foreign currency dividends and loans. Where the Group enters into hedges and applies hedge accounting, hedges are documented and tested for effectiveness on an ongoing basis with any ineffectiveness recorded in the Income Statement.
The local business units enter into forward foreign exchange contracts with GT to manage these exposures where practical and allowed by local regulations. GT matches the Group exposures, and hedges the position where possible, using spot and forward foreign currency exchange contracts.
The Group’s strategy is to minimise Income Statement volatility by monitoring foreign currency balances, external financing, and external hedging arrangements. The Group’s hedging profile is regularly reviewed to ensure it is appropriate and to mitigate these risks as far as possible.
15 Financial Instruments and Financial Risk Management continued

232
The notional principal amount of the outstanding forward foreign exchange contracts at 31 December 2021 was £7,036 million receivable (2020: £6,146 million) and £7,027 million payable (2020: £6,234 million).
The Group held forward foreign exchange contracts designated as cash flow hedges primarily in Euro, Sterling, US dollar, Canadian dollar, Australian dollar, Philippine peso and Mexican peso. The notional value of the payable leg resulting from these financial instruments was as follows:
Cash Flow Hedge Profile2021
£m2020
£m
Euro 327 444
Sterling 310 423
US dollar 273 438
Canadian dollar 113 84
Australian dollar 107 92
Philippine peso 54 46
Mexican peso 51 53
Other 422 708
1,657 2,288
These forward foreign exchange contracts are mainly expected to mature over the period January 2022 to December 2022 (2020: January 2021 to December 2021). Of the total amount, £11 million (2020: nil) is due between January 2023 and January 2024.
Cash flow hedging is applied with the economic relationship and expected effectiveness being assessed at inception, with any ineffectiveness recognised in the Income Statement. The ineffective portion recognised in the Income Statement arising from cash flow hedges is immaterial (2020: immaterial).
Gains and losses recognised in other comprehensive income and the hedging reserve on forward exchange contracts in 2021 of £30 million gain, net of tax (2020: £17 million loss, net of tax) are recognised in the Income Statement in the periods in which the hedged forecast transaction affects the Income Statement.
At 31 December 2021, the Group had forward contracts used for cash flow hedging with total fair value of £15 million asset (2020: £26 million liability). These contracts are denominated in a diverse range of currency pairings, where a fluctuation of 5% in any one of the contract pairings, with all others remaining constant, would have a maximum effect of £6 million (2020: £8 million) on Shareholder Equity, until the point at which the contracts mature and the forecast transaction occurs. The four largest contract pairings in order of nominal value were Euro/Polish zloty, Euro/Sterling, US dollar/Canadian dollar, and Euro/Australian dollar.
Where the Group is exposed to currency risk on its borrowings, the Group seeks to minimise the impact of foreign exchange on the Income Statement through placing debt within a net investment hedge or using financial instruments.
As at 31 December 2021, the Group had designated a 2023 US dollar bond totalling $500 million (2020: $500 million), 2030 Euro bond totalling €850 million (2020: €850 million) and forward currency swap contracts totalling €750 million (2020: nil) as the hedging instruments in a net investment hedge relationship. During the year commercial paper of €750 million (2020: €750 million) was also in a hedge relationship,. As the commercial paper was repaid during the year, this relationship was ended as it was replaced with the forward currency swap contracts. Possible sources of ineffectiveness include any impairments to the Group’s net investments in Euros. The hedges are documented and are assessed for effectiveness on an ongoing basis.
The net gain or loss under these arrangements is recognised in other comprehensive income. The net effect on other comprehensive income for the year ended 31 December 2021 was a £84 million gain (2020: £75 million loss). If Sterling weakens by 5% against the US dollar and Euro, the maximum impact on shareholders’ equity due to the net investment hedging on US dollar bond and Euro bond/ swaps would be £19 million loss and £51 million loss respectively.
In 2020, the Group issued a €850 million bond due in 2026. Concurrent with the issue of the bond, the Group entered into a €850 million cross currency interest rate swap on similar terms to the 2026 bond to mitigate foreign exchange currency risk, for which hedge accounting has been applied. Sources of ineffectiveness on this hedge relationship will come from a difference in credit ratings between the counterparties and modifications to the terms of either hedged item or instrument. At 31 December 2021 no material ineffectiveness (2020: no material ineffectiveness) has been recognized in the Income Statement as the effect is not material. The interest rate element of the swap is discussed in interest rate risk below.
The remaining major monetary financial instruments (liquid assets, receivables, interest and non-interest bearing liabilities) are directly denominated in the functional currency of the Group or are transferred to the functional currency of the local entity through the use of derivatives.
The gains and losses from fair value movements on derivatives held at fair value through the Income Statement, recognised in the Income Statement in 2021, was a £6 million gain (2020: £2 million loss).
Notes to the Financial Statements (Continued)
15 Financial Instruments and Financial Risk Management continued

Reckitt Annual Report and Accounts 2021
Financial StatementsGovernanceStrategic Report
233
(b) Cost inflation riskDue to the nature of its business the Group is exposed to commodity, freight and other inflation risks. Short term volatility in pricing of these products is mitigated through medium-term contracts, inventories of key materials and financial hedging. Over the medium and long term, the Group mitigates the impact of inflation through: implementing pricing and revenue growth management, identifying productivity and efficiencies and improving sales mix.
(c) Interest rate riskThe Group has both interest-bearing and non-interest bearing assets and liabilities. The Group monitors its interest income and expense rate exposure on a regular basis. The Group sets its desired level of fixed and floating rate exposure as part of its interest risk management strategy. The mix of fixed and floating exposure on interest-bearing assets is managed by using a mixture of fixed and floating rate deposits. The fixed/floating mix on liabilities is managed by using a mixture of fixed and floating rate borrowings as well as by using derivatives to swap fixed to floating rate.
In 2020 the Group issued two €850 million bonds due in 2026 and 2030. In order to maintain a level of floating rate debt in line with the Group’s interest management strategy the Group entered into a €850 million cross currency interest rate swap on similar terms to the 2026 bond and interest rate swap on the coupon payments due on the 2030 bond. The accounting for the foreign exchange element of the cross currency swap is described above. The interest rate element swaps the fixed coupon payments on the bond for floating rate (the cross currency interest rate swap with reference to LIBOR, and the interest rate swap with reference to EURIBOR). The interest rate swaps have been placed into a fair value hedge relationship with the related bonds. Sources of ineffectiveness on this hedge relationship will come from a difference in credit ratings between the counterparties and modifications to the terms of either the hedged item or the hedging instrument. At 31 December 2021 no material ineffectiveness (2020: no material ineffectiveness) has been recognised in the Income Statement.
Various scenarios are simulated taking into consideration refinancing, renewal of existing positions, alternative financing and hedging. Based on these scenarios, the Group calculates the impact on the Income Statement of a defined interest rate shift. For each simulation, the same interest rate shift is used for all currencies, calculated on a full-year and pre-tax basis.
The scenarios are only run for liabilities that represent the major interest-bearing positions. Based on the simulations performed, the impact on the Income Statement of a 50 basis-point shift in interest rates would be a maximum increase of £10 million (2020: £14 million) or decrease of £10 million (2020: £14 million), respectively for the liabilities covered. The simulation is done on a periodic basis to verify that the maximum loss simulated is within the limit given by management.
(d) Managing interest rate benchmark reform and associated risksA fundamental reform of major interest rate benchmarks is being undertaken globally, including the replacement of some interbank offered rates (IBORs) with alternative nearly risk-free rates (referred to as ‘IBOR reform’).
The Group’s main exposure to IBOR reform is through cross currency interest rate swaps that reference a floating Sterling LIBOR. The swaps were executed as hedging instruments of the €850 million bond maturing in 2026 in which the Group pays interest on a floating sterling rate based on 3-month GBP LIBOR. As the swap agreements are governed by contracts based on the International Swaps and Derivatives Association (ISDA)’s master agreements, by adhering to the ISDA LIBOR Fallback Protocol during the year ended 31 December 2021, the Group amended contractual terms of financial instruments indexed to the relevant LIBORs, such that these will be replaced by risk-free rates after IBOR cessation, thereby removing IBOR reform-related uncertainty.
During 2021, the Group’s committed bank facilities totalling £4,500 million (2020: £5,500 million) were amended or renewed to include rate switch provisions, thus addressing IBOR reform, predominantly in the form recommended by the Loan Market Association. These committed facilities were undrawn at 31 December (2020: undrawn).
At 31 December, the Group had contracts of cross currency interest swap liabilities with a carrying value of £49 million referenced to GBP LIBOR but with appropriate fallback clauses (2020: Unreformed contracts of cross currency interest swap asset of £12 million)
On 5 March 2021, the FCA confirmed that certain LIBOR benchmark settings – including the 3-month USD benchmark – would continue to be published until 30 June 2023. Consequently, the Group expects that the $750 million floating rate note maturing in June 2022 that references 3-month USD LIBOR will not be affected by IBOR reform. The Group’s EURIBOR interest rate swap is unaffected as EURIBOR is not impacted by IBOR reform.
2. Credit RiskThe Group has no significant concentrations of credit risk. Credit risk arises from cash and cash equivalents, derivative financial instruments, deposits with banks and financial institutions, as well as credit exposures to customers. The assessment of lifetime expected credit losses relating to trade and other receivables is detailed in Note 14. Financial institution counterparties are subject to approval under the Group’s counterparty risk policy and such approval is limited to financial institutions with a BBB rating or above. The Group uses BBB and higher rated counterparties to manage risk and only uses sub BBB rated counterparties by exception. The amount of exposure to any individual counterparty is subject to a limit defined within the counterparty risk policy, which is reassessed annually by the Board of Directors. Derivative financial instruments are only traded with counterparties approved in accordance with the approved policy. Derivative risk is measured using a risk weighting method.
15 Financial Instruments and Financial Risk Management continued

234
The Group has counterparty risk from asset positions held with financial institutions. This is comprised of short-term investments, cash and cash equivalents and derivatives positions. For risk management purposes the Group assesses the exposure to major financial institutions by looking at the deposits, cash and cash equivalents and a percentage of the nominal amount of derivative contracts taking into account the time to maturity and the nature of the product. The following table summarises the Group’s assessment of its exposure. The financial institutions listed in the tables are not comparable year on year.
2021
CounterpartyCredit rating
Limit £m
Exposure £m
Financial institution A A+ 250 210
Financial institution B A+ 250 160
Financial institution C A+ 250 147
Financial institution D A+ 250 127
Financial institution E A+ 250 115
Financial institution F A 200 115
Financial institution G A 200 102
Financial institution H AAA 300 83
Financial institution I A 200 70
Financial institution J A+ 250 54
2020
CounterpartyCredit rating
Limit £m
Exposure £m
Financial institution A AAA 300 201
Financial institution B A+ 150 141
Financial institution C A+ 150 130
Financial institution D AAA 300 125
Financial institution E A 125 121
Financial institution F A+ 143 102
Financial institution G A+ 100 96
Financial institution H A 103 93
Financial institution I A 116 93
Financial institution J AAA 300 85
3. Liquidity RiskLiquidity risk is the risk that the Group cannot repay financial liabilities as and when they fall due. The Group’s liquidity risk is concentrated towards bond and senior note principal repayments due between 2022 and 2044.
The Group has various borrowing facilities available to it. The Group has bilateral credit facilities with high-quality international banks and has a financial covenant, which is not expected to restrict the Group’s future operations.
At the end of 2021, the Group had long-term debt excluding lease liabilities of £6,812 million (2020: £9,553 million), of which £6,445 million (2020: £6,889 million) is repayable in more than two years. In addition, the Group has committed borrowing facilities totalling £4,500 million (2020: £5,500 million), of which £4,500 million (2020: £3,500 million) expires after more than two years. These facilities were undrawn at year end. The committed borrowing facilities, together with central cash and investments, are considered sufficient to meet the Group’s projected cash requirements.
All borrowing facilities are at floating rates of interest.
The facilities have been arranged to cover general corporate purposes, including support for commercial paper issuance. All facilities incur commitment fees at market rates.
The Group’s borrowing limit at 31 December 2021 calculated in accordance with the Articles of Association was £22,197 million (2020: £27,345 million).
The table on the next page analyses the Group’s financial liabilities and the derivatives which will be settled on a net basis into relevant maturity groupings based on the remaining period at the Balance Sheet date to the contractual maturity date. The amounts disclosed in the table are the contractual undiscounted cash flows which have been calculated using spot rates at the relevant Balance Sheet date, including interest to be paid.
Notes to the Financial Statements (Continued)
15 Financial Instruments and Financial Risk Management continued
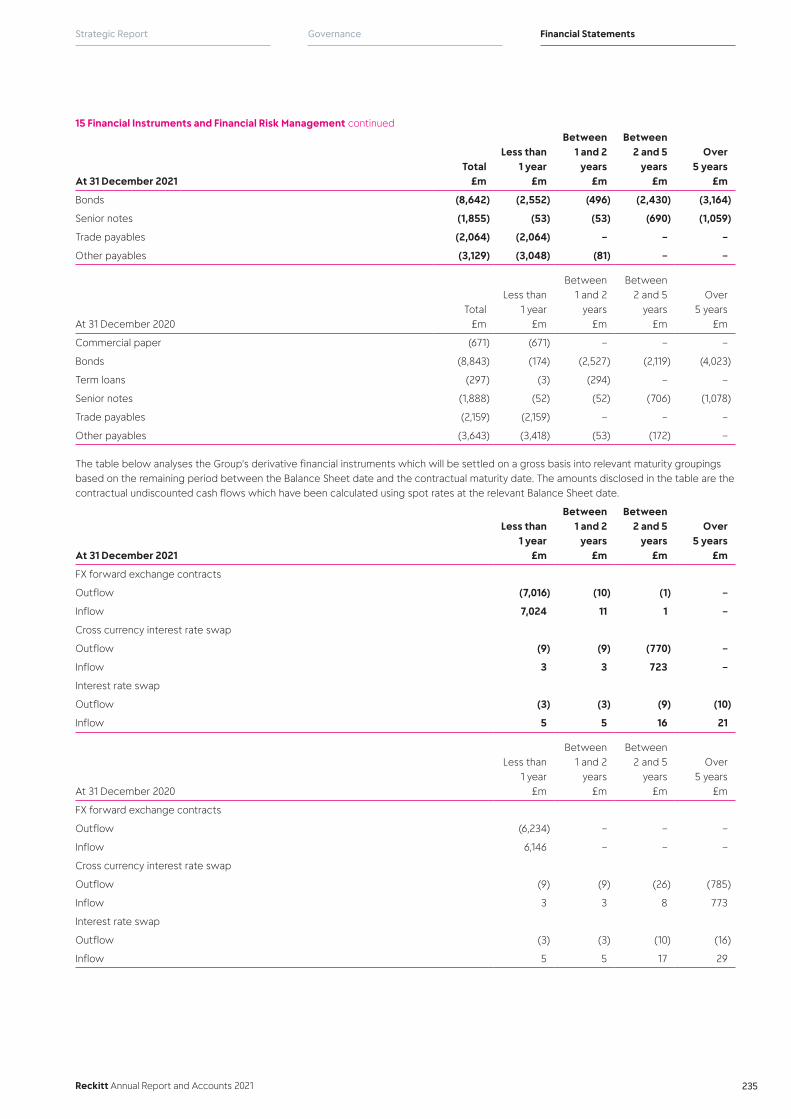
Reckitt Annual Report and Accounts 2021
Financial StatementsGovernanceStrategic Report
235
At 31 December 2021Total
£m
Less than 1 year
£m
Between 1 and 2
years £m
Between 2 and 5
years £m
Over 5 years
£m
Bonds (8,642) (2,552) (496) (2,430) (3,164)
Senior notes (1,855) (53) (53) (690) (1,059)
Trade payables (2,064) (2,064) – – –
Other payables (3,129) (3,048) (81) – –
At 31 December 2020Total
£m
Less than 1 year
£m
Between 1 and 2
years £m
Between 2 and 5
years £m
Over 5 years
£m
Commercial paper (671) (671) – – –
Bonds (8,843) (174) (2,527) (2,119) (4,023)
Term loans (297) (3) (294) – –
Senior notes (1,888) (52) (52) (706) (1,078)
Trade payables (2,159) (2,159) – – –
Other payables (3,643) (3,418) (53) (172) –
The table below analyses the Group’s derivative financial instruments which will be settled on a gross basis into relevant maturity groupings based on the remaining period between the Balance Sheet date and the contractual maturity date. The amounts disclosed in the table are the contractual undiscounted cash flows which have been calculated using spot rates at the relevant Balance Sheet date.
At 31 December 2021
Less than 1 year
£m
Between 1 and 2
years £m
Between 2 and 5
years £m
Over 5 years
£m
FX forward exchange contracts
Outflow (7,016) (10) (1) –
Inflow 7,024 11 1 –
Cross currency interest rate swap
Outflow (9) (9) (770) –
Inflow 3 3 723 –
Interest rate swap
Outflow (3) (3) (9) (10)
Inflow 5 5 16 21
At 31 December 2020
Less than 1 year
£m
Between 1 and 2
years £m
Between 2 and 5
years £m
Over 5 years
£m
FX forward exchange contracts
Outflow (6,234) – – –
Inflow 6,146 – – –
Cross currency interest rate swap
Outflow (9) (9) (26) (785)
Inflow 3 3 8 773
Interest rate swap
Outflow (3) (3) (10) (16)
Inflow 5 5 17 29
15 Financial Instruments and Financial Risk Management continued

236
Cash flow forecasting is performed by the local business units and on an aggregated basis by GT. GT monitors rolling forecasts of the Group’s liquidity requirements to ensure it has sufficient cash to meet operational needs while maintaining sufficient headroom on its undrawn committed borrowing facilities. Funds over and above those required for short-term working capital purposes by the local businesses are generally remitted to GT. The Group uses the remittances to settle obligations, repay borrowings, or, in the event of a surplus, invest in short-term instruments issued by institutions with a BBB rating or above.
4. Capital ManagementThe Group considers capital to be net debt plus total equity. Net debt is calculated as total financing liabilities less cash and cash equivalents and short-term deposits. Total equity includes share capital, reserves and retained earnings as shown in the Group Balance Sheet.
Note2021
£m2020
£m
Cash and cash equivalents including overdrafts 1,259 1,644
Financing liabilities 17 (9,637) (10,598)
Net debt 8,378 8,954
Total equity 7,453 9,159
15,831 18,113
The objectives for managing capital are to safeguard the Group’s ability to continue as a going concern, in order to provide returns for shareholders and benefits for other stakeholders and to maintain an efficient capital structure to optimise the cost of capital.
In 2021, the Group provided returns to shareholders in the form of dividends. Refer to Note 28 for further details.
The Group monitors net debt and at year end the Group had net debt of £8,378 million (2020: £8,954 million). The Group seeks to pay down net debt using cash generated by the business to maintain an appropriate level of financial flexibility.
Supply chain financeThe Group participates in a supply chain finance programme (SCF) under which certain suppliers to the Group are able to access a Supply Chain Financing arrangement that enables them to fund their working capital. The principal purpose of this programme is to facilitate efficient payment processing and enable the willing suppliers to sell their receivables due from the Group to a bank before their due date. The Group does not incur any additional interest towards the bank on the amounts due to the suppliers. As part of this facility the Group has confirmed to certain financial institutions that it will make payments of £372 million (2020: £392 million) to these suppliers as they fall due. These amounts are recorded within Trade Payables on the Balance Sheet and all cash flows associated with the programme are included within operating cash flows as they continue to be part of the normal operating cycle of the Group and their principal nature remains operating, being payments for the purchase of goods and services.
16 Cash and Cash Equivalents2021
£m2020
£m
Cash at bank and in hand 587 499
Short-term bank deposits 674 1,147
Cash and cash equivalents 1,261 1,646
The Group operates in a number of territories where there are either foreign currency exchange restrictions, or where it is difficult for the Group to extract cash readily and easily in the short term. As a result, £66 million (2020: £136 million) of cash included in cash and cash equivalents is restricted for use by the Group, yet available for use in the relevant subsidiary’s day-to-day operations.
Notes to the Financial Statements (Continued)
15 Financial Instruments and Financial Risk Management continued
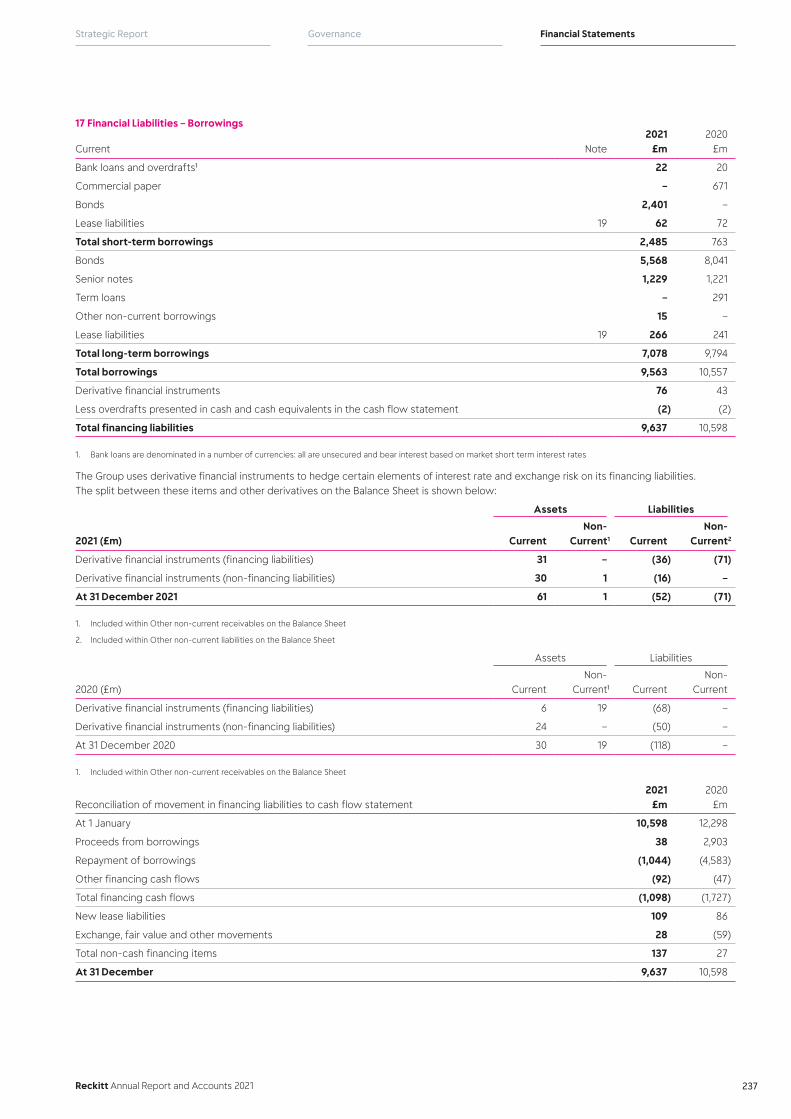
Reckitt Annual Report and Accounts 2021
Financial StatementsGovernanceStrategic Report
237
17 Financial Liabilities – Borrowings
Current Note2021
£m2020
£m
Bank loans and overdrafts1 22 20
Commercial paper – 671
Bonds 2,401 –
Lease liabilities 19 62 72
Total short-term borrowings 2,485 763
Bonds 5,568 8,041
Senior notes 1,229 1,221
Term loans – 291
Other non-current borrowings 15 –
Lease liabilities 19 266 241
Total long-term borrowings 7,078 9,794
Total borrowings 9,563 10,557
Derivative financial instruments 76 43
Less overdrafts presented in cash and cash equivalents in the cash flow statement (2) (2)
Total financing liabilities 9,637 10,598
1. Bank loans are denominated in a number of currencies: all are unsecured and bear interest based on market short term interest rates
The Group uses derivative financial instruments to hedge certain elements of interest rate and exchange risk on its financing liabilities. The split between these items and other derivatives on the Balance Sheet is shown below:
Assets Liabilities
2021 (£m) CurrentNon-
Current1 CurrentNon-
Current2
Derivative financial instruments (financing liabilities) 31 – (36) (71)
Derivative financial instruments (non-financing liabilities) 30 1 (16) –
At 31 December 2021 61 1 (52) (71)
1. Included within Other non-current receivables on the Balance Sheet
2. Included within Other non-current liabilities on the Balance Sheet
Assets Liabilities
2020 (£m) CurrentNon-
Current1 CurrentNon-
Current
Derivative financial instruments (financing liabilities) 6 19 (68) –
Derivative financial instruments (non-financing liabilities) 24 – (50) –
At 31 December 2020 30 19 (118) –
1. Included within Other non-current receivables on the Balance Sheet
Reconciliation of movement in financing liabilities to cash flow statement2021
£m2020
£m
At 1 January 10,598 12,298
Proceeds from borrowings 38 2,903
Repayment of borrowings (1,044) (4,583)
Other financing cash flows (92) (47)
Total financing cash flows (1,098) (1,727)
New lease liabilities 109 86
Exchange, fair value and other movements 28 (59)
Total non-cash financing items 137 27
At 31 December 9,637 10,598
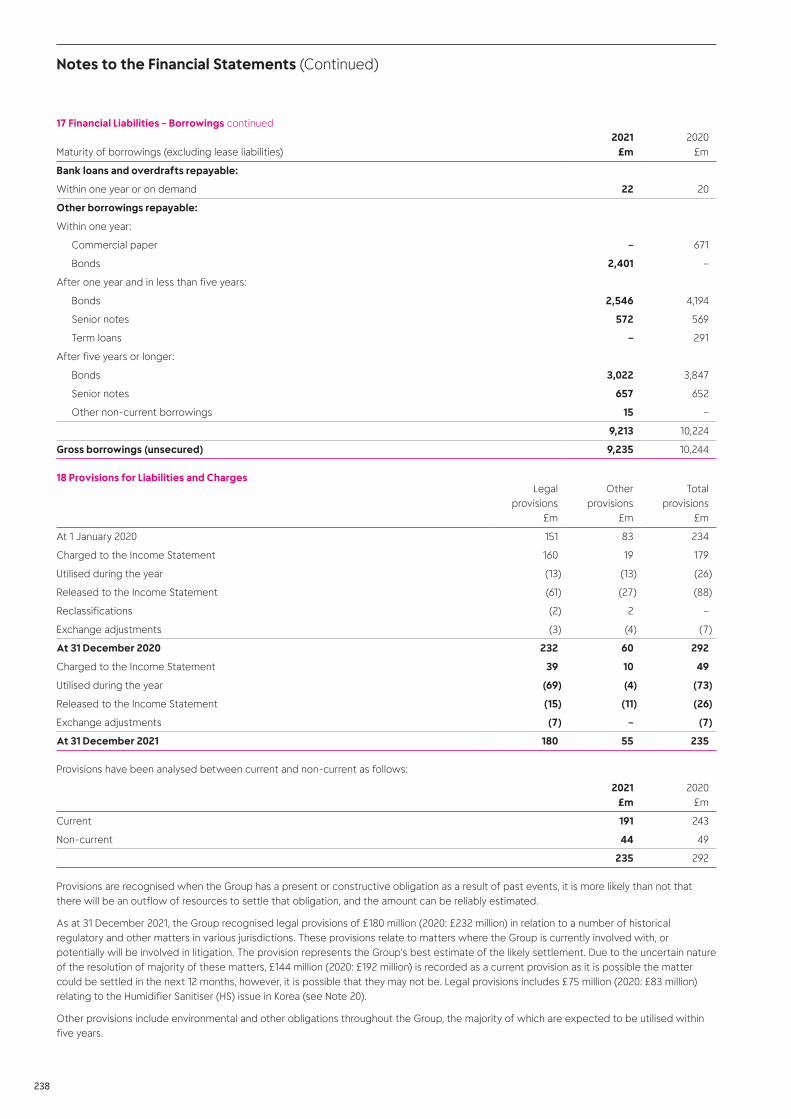
238
Maturity of borrowings (excluding lease liabilities)2021
£m2020
£m
Bank loans and overdrafts repayable:
Within one year or on demand 22 20
Other borrowings repayable:
Within one year:
Commercial paper – 671
Bonds 2,401 –
After one year and in less than five years:
Bonds 2,546 4,194
Senior notes 572 569
Term loans – 291
After five years or longer:
Bonds 3,022 3,847
Senior notes 657 652
Other non-current borrowings 15 –
9,213 10,224
Gross borrowings (unsecured) 9,235 10,244
18 Provisions for Liabilities and ChargesLegal
provisions £m
Other provisions
£m
Total provisions
£m
At 1 January 2020 151 83 234
Charged to the Income Statement 160 19 179
Utilised during the year (13) (13) (26)
Released to the Income Statement (61) (27) (88)
Reclassifications (2) 2 –
Exchange adjustments (3) (4) (7)
At 31 December 2020 232 60 292
Charged to the Income Statement 39 10 49
Utilised during the year (69) (4) (73)
Released to the Income Statement (15) (11) (26)
Exchange adjustments (7) – (7)
At 31 December 2021 180 55 235
Provisions have been analysed between current and non-current as follows:
2021 £m
2020 £m
Current 191 243
Non-current 44 49
235 292
Provisions are recognised when the Group has a present or constructive obligation as a result of past events, it is more likely than not that there will be an outflow of resources to settle that obligation, and the amount can be reliably estimated.
As at 31 December 2021, the Group recognised legal provisions of £180 million (2020: £232 million) in relation to a number of historical regulatory and other matters in various jurisdictions. These provisions relate to matters where the Group is currently involved with, or potentially will be involved in litigation. The provision represents the Group’s best estimate of the likely settlement. Due to the uncertain nature of the resolution of majority of these matters, £144 million (2020: £192 million) is recorded as a current provision as it is possible the matter could be settled in the next 12 months, however, it is possible that they may not be. Legal provisions includes £75 million (2020: £83 million) relating to the Humidifier Sanitiser (HS) issue in Korea (see Note 20).
Other provisions include environmental and other obligations throughout the Group, the majority of which are expected to be utilised within five years.
Notes to the Financial Statements (Continued)
17 Financial Liabilities – Borrowings continued
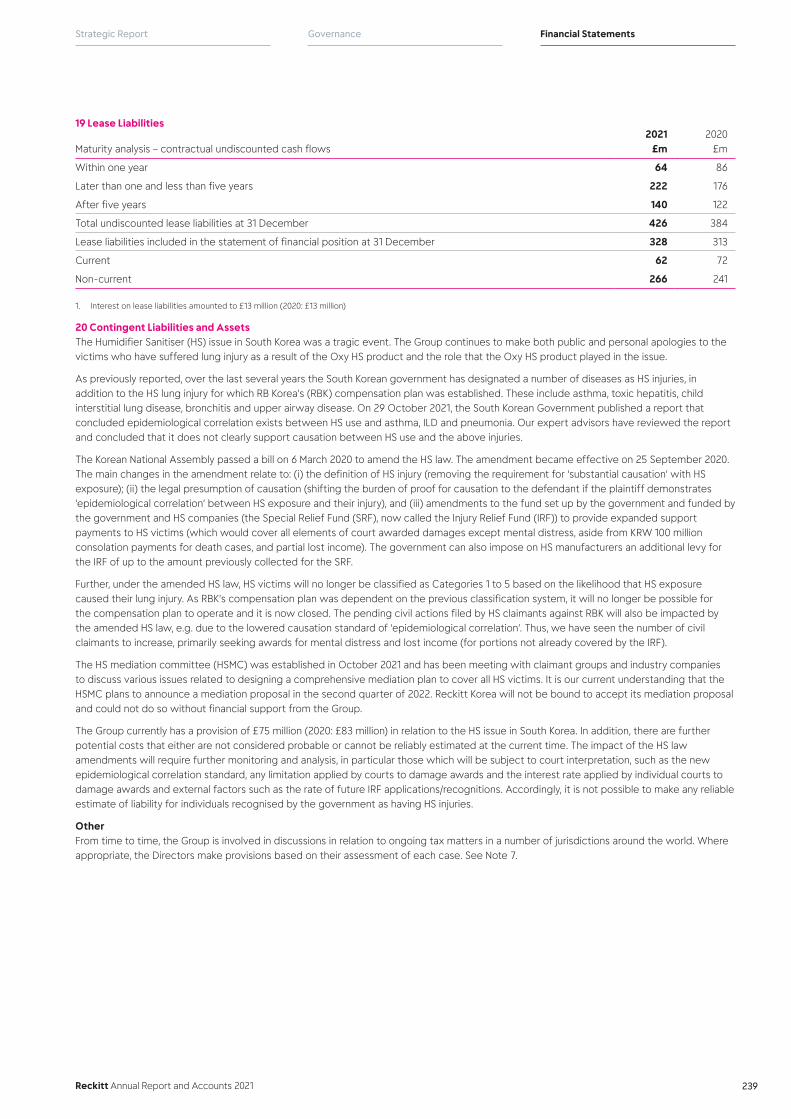
Reckitt Annual Report and Accounts 2021
Financial StatementsGovernanceStrategic Report
239
19 Lease Liabilities
Maturity analysis – contractual undiscounted cash flows2021
£m2020
£m
Within one year 64 86
Later than one and less than five years 222 176
After five years 140 122
Total undiscounted lease liabilities at 31 December 426 384
Lease liabilities included in the statement of financial position at 31 December 328 313
Current 62 72
Non-current 266 241
1. Interest on lease liabilities amounted to £13 million (2020: £13 million)
20 Contingent Liabilities and AssetsThe Humidifier Sanitiser (HS) issue in South Korea was a tragic event. The Group continues to make both public and personal apologies to the victims who have suffered lung injury as a result of the Oxy HS product and the role that the Oxy HS product played in the issue.
As previously reported, over the last several years the South Korean government has designated a number of diseases as HS injuries, in addition to the HS lung injury for which RB Korea’s (RBK) compensation plan was established. These include asthma, toxic hepatitis, child interstitial lung disease, bronchitis and upper airway disease. On 29 October 2021, the South Korean Government published a report that concluded epidemiological correlation exists between HS use and asthma, ILD and pneumonia. Our expert advisors have reviewed the report and concluded that it does not clearly support causation between HS use and the above injuries.
The Korean National Assembly passed a bill on 6 March 2020 to amend the HS law. The amendment became effective on 25 September 2020. The main changes in the amendment relate to: (i) the definition of HS injury (removing the requirement for ‘substantial causation’ with HS exposure); (ii) the legal presumption of causation (shifting the burden of proof for causation to the defendant if the plaintiff demonstrates ‘epidemiological correlation’ between HS exposure and their injury), and (iii) amendments to the fund set up by the government and funded by the government and HS companies (the Special Relief Fund (SRF), now called the Injury Relief Fund (IRF)) to provide expanded support payments to HS victims (which would cover all elements of court awarded damages except mental distress, aside from KRW 100 million consolation payments for death cases, and partial lost income). The government can also impose on HS manufacturers an additional levy for the IRF of up to the amount previously collected for the SRF.
Further, under the amended HS law, HS victims will no longer be classified as Categories 1 to 5 based on the likelihood that HS exposure caused their lung injury. As RBK’s compensation plan was dependent on the previous classification system, it will no longer be possible for the compensation plan to operate and it is now closed. The pending civil actions filed by HS claimants against RBK will also be impacted by the amended HS law, e.g. due to the lowered causation standard of ‘epidemiological correlation’. Thus, we have seen the number of civil claimants to increase, primarily seeking awards for mental distress and lost income (for portions not already covered by the IRF).
The HS mediation committee (HSMC) was established in October 2021 and has been meeting with claimant groups and industry companies to discuss various issues related to designing a comprehensive mediation plan to cover all HS victims. It is our current understanding that the HSMC plans to announce a mediation proposal in the second quarter of 2022. Reckitt Korea will not be bound to accept its mediation proposal and could not do so without financial support from the Group.
The Group currently has a provision of £75 million (2020: £83 million) in relation to the HS issue in South Korea. In addition, there are further potential costs that either are not considered probable or cannot be reliably estimated at the current time. The impact of the HS law amendments will require further monitoring and analysis, in particular those which will be subject to court interpretation, such as the new epidemiological correlation standard, any limitation applied by courts to damage awards and the interest rate applied by individual courts to damage awards and external factors such as the rate of future IRF applications/recognitions. Accordingly, it is not possible to make any reliable estimate of liability for individuals recognised by the government as having HS injuries.
OtherFrom time to time, the Group is involved in discussions in relation to ongoing tax matters in a number of jurisdictions around the world. Where appropriate, the Directors make provisions based on their assessment of each case. See Note 7.
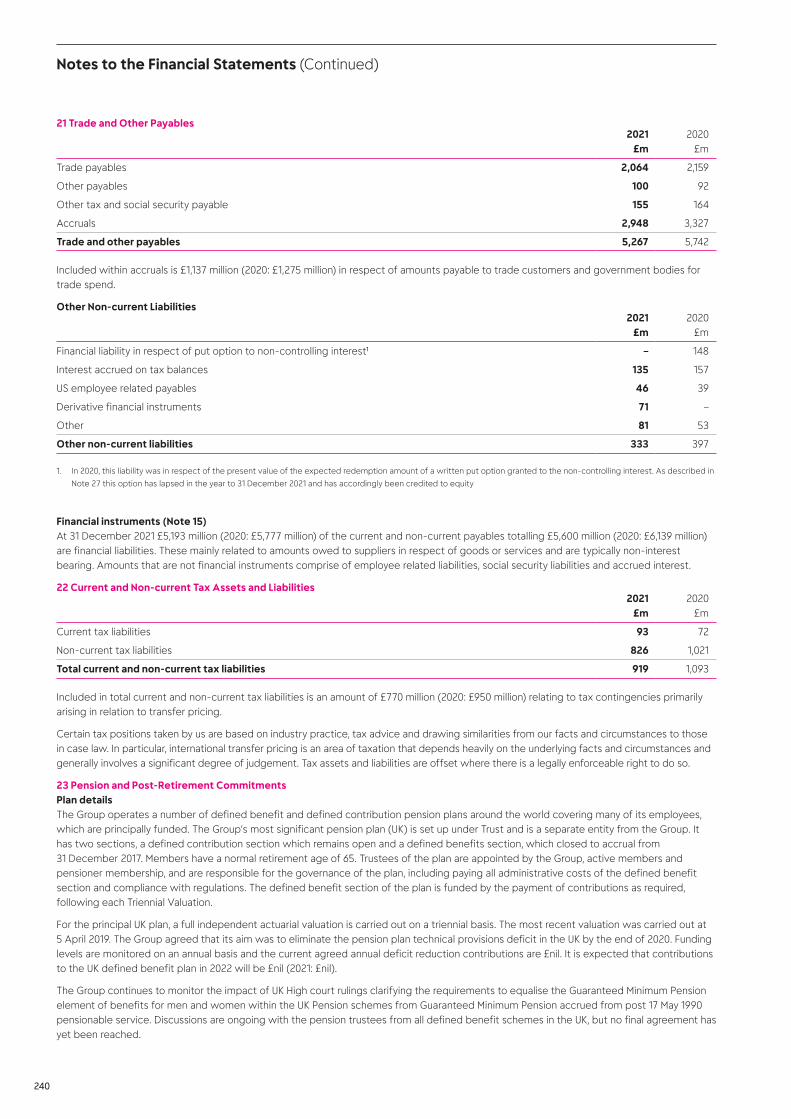
240
21 Trade and Other Payables2021
£m2020
£m
Trade payables 2,064 2,159
Other payables 100 92
Other tax and social security payable 155 164
Accruals 2,948 3,327
Trade and other payables 5,267 5,742
Included within accruals is £1,137 million (2020: £1,275 million) in respect of amounts payable to trade customers and government bodies for trade spend.
Other Non-current Liabilities2021
£m2020
£m
Financial liability in respect of put option to non-controlling interest1 – 148
Interest accrued on tax balances 135 157
US employee related payables 46 39
Derivative financial instruments 71 –
Other 81 53
Other non-current liabilities 333 397
1. In 2020, this liability was in respect of the present value of the expected redemption amount of a written put option granted to the non-controlling interest. As described in
Note 27 this option has lapsed in the year to 31 December 2021 and has accordingly been credited to equity
Financial instruments (Note 15)At 31 December 2021 £5,193 million (2020: £5,777 million) of the current and non-current payables totalling £5,600 million (2020: £6,139 million) are financial liabilities. These mainly related to amounts owed to suppliers in respect of goods or services and are typically non-interest bearing. Amounts that are not financial instruments comprise of employee related liabilities, social security liabilities and accrued interest.
22 Current and Non-current Tax Assets and Liabilities2021
£m2020
£m
Current tax liabilities 93 72
Non-current tax liabilities 826 1,021
Total current and non-current tax liabilities 919 1,093
Included in total current and non-current tax liabilities is an amount of £770 million (2020: £950 million) relating to tax contingencies primarily arising in relation to transfer pricing.
Certain tax positions taken by us are based on industry practice, tax advice and drawing similarities from our facts and circumstances to those in case law. In particular, international transfer pricing is an area of taxation that depends heavily on the underlying facts and circumstances and generally involves a significant degree of judgement. Tax assets and liabilities are offset where there is a legally enforceable right to do so.
23 Pension and Post-Retirement CommitmentsPlan detailsThe Group operates a number of defined benefit and defined contribution pension plans around the world covering many of its employees, which are principally funded. The Group’s most significant pension plan (UK) is set up under Trust and is a separate entity from the Group. It has two sections, a defined contribution section which remains open and a defined benefits section, which closed to accrual from 31 December 2017. Members have a normal retirement age of 65. Trustees of the plan are appointed by the Group, active members and pensioner membership, and are responsible for the governance of the plan, including paying all administrative costs of the defined benefit section and compliance with regulations. The defined benefit section of the plan is funded by the payment of contributions as required, following each Triennial Valuation.
For the principal UK plan, a full independent actuarial valuation is carried out on a triennial basis. The most recent valuation was carried out at 5 April 2019. The Group agreed that its aim was to eliminate the pension plan technical provisions deficit in the UK by the end of 2020. Funding levels are monitored on an annual basis and the current agreed annual deficit reduction contributions are £nil. It is expected that contributions to the UK defined benefit plan in 2022 will be £nil (2021: £nil).
The Group continues to monitor the impact of UK High court rulings clarifying the requirements to equalise the Guaranteed Minimum Pension element of benefits for men and women within the UK Pension schemes from Guaranteed Minimum Pension accrued from post 17 May 1990 pensionable service. Discussions are ongoing with the pension trustees from all defined benefit schemes in the UK, but no final agreement has yet been reached.
Notes to the Financial Statements (Continued)
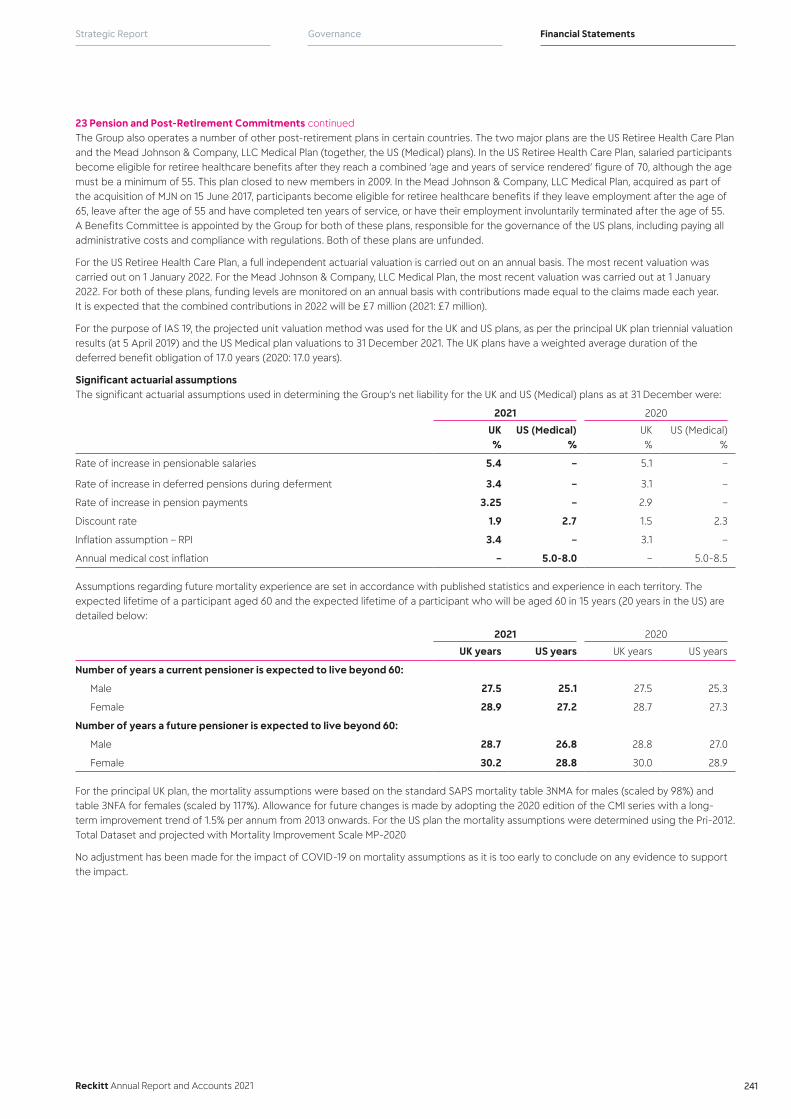
Reckitt Annual Report and Accounts 2021
Financial StatementsGovernanceStrategic Report
241
The Group also operates a number of other post-retirement plans in certain countries. The two major plans are the US Retiree Health Care Plan and the Mead Johnson & Company, LLC Medical Plan (together, the US (Medical) plans). In the US Retiree Health Care Plan, salaried participants become eligible for retiree healthcare benefits after they reach a combined ‘age and years of service rendered’ figure of 70, although the age must be a minimum of 55. This plan closed to new members in 2009. In the Mead Johnson & Company, LLC Medical Plan, acquired as part of the acquisition of MJN on 15 June 2017, participants become eligible for retiree healthcare benefits if they leave employment after the age of 65, leave after the age of 55 and have completed ten years of service, or have their employment involuntarily terminated after the age of 55. A Benefits Committee is appointed by the Group for both of these plans, responsible for the governance of the US plans, including paying all administrative costs and compliance with regulations. Both of these plans are unfunded.
For the US Retiree Health Care Plan, a full independent actuarial valuation is carried out on an annual basis. The most recent valuation was carried out on 1 January 2022. For the Mead Johnson & Company, LLC Medical Plan, the most recent valuation was carried out at 1 January 2022. For both of these plans, funding levels are monitored on an annual basis with contributions made equal to the claims made each year. It is expected that the combined contributions in 2022 will be £7 million (2021: £7 million).
For the purpose of IAS 19, the projected unit valuation method was used for the UK and US plans, as per the principal UK plan triennial valuation results (at 5 April 2019) and the US Medical plan valuations to 31 December 2021. The UK plans have a weighted average duration of the deferred benefit obligation of 17.0 years (2020: 17.0 years).
Significant actuarial assumptionsThe significant actuarial assumptions used in determining the Group’s net liability for the UK and US (Medical) plans as at 31 December were:
2021 2020
UK %
US (Medical) %
UK%
US (Medical) %
Rate of increase in pensionable salaries 5.4 – 5.1 –
Rate of increase in deferred pensions during deferment 3.4 – 3.1 –
Rate of increase in pension payments 3.25 – 2.9 –
Discount rate 1.9 2.7 1.5 2.3
Inflation assumption – RPI 3.4 – 3.1 –
Annual medical cost inflation – 5.0-8.0 – 5.0-8.5
Assumptions regarding future mortality experience are set in accordance with published statistics and experience in each territory. The expected lifetime of a participant aged 60 and the expected lifetime of a participant who will be aged 60 in 15 years (20 years in the US) are detailed below:
2021 2020
UK years US years UK years US years
Number of years a current pensioner is expected to live beyond 60:
Male 27.5 25.1 27.5 25.3
Female 28.9 27.2 28.7 27.3
Number of years a future pensioner is expected to live beyond 60:
Male 28.7 26.8 28.8 27.0
Female 30.2 28.8 30.0 28.9
For the principal UK plan, the mortality assumptions were based on the standard SAPS mortality table 3NMA for males (scaled by 98%) and table 3NFA for females (scaled by 117%). Allowance for future changes is made by adopting the 2020 edition of the CMI series with a long-term improvement trend of 1.5% per annum from 2013 onwards. For the US plan the mortality assumptions were determined using the Pri-2012. Total Dataset and projected with Mortality Improvement Scale MP-2020
No adjustment has been made for the impact of COVID-19 on mortality assumptions as it is too early to conclude on any evidence to support the impact.
23 Pension and Post-Retirement Commitments continued

242
Amounts recognised on the Balance SheetThe amounts recognised on the Balance Sheet are as follows:
2021 £m
2020 £m
Balance Sheet liability for:
US (Medical) (107) (125)
Other (211) (247)
Liability on Balance Sheet (318) (372)
Balance Sheet assets for:
UK 298 188
Other 57 38
Asset on Balance Sheet 355 226
Net pension asset/(liability) 37 (146)
The funded and unfunded amounts recognised on the Balance Sheet are determined as follows:
2021 2020
UK £m
US (Medical)
£mOther
£mTotal
£mUK £m
US (Medical)
£mOther
£mTotal
£m
Present value of funded obligations (1,486) – (481) (1,967) (1,547) – (538) (2,085)
Fair value of plan assets 1,788 – 496 2,284 1,754 – 510 2,264
Surplus/(liability) of funded plans 302 – 15 317 207 – (28) 179
Present value of unfunded obligations – (107) (169) (276) – (125) (181) (306)
Irrecoverable surplus (4) – – (4) (19) – – (19)
Net pension surplus/(liability) 298 (107) (154) 37 188 (125) (209) (146)
The UK surplus of £298 million (2020: £188 million) relates mainly to the Reckitt Benckiser Pension Fund. This surplus has been recognised as the Group has concluded it has an unconditional right to a refund of any surplus once all member benefits have been paid. The Group’s judgement is based on legal advice that the trustees would be unable to unconditionally wind up the plan or enhance members benefits without the Group’s consent.
Group plan assets are comprised as follows:
2021 2020
UK £m
US (Medical)
£mOther
£mTotal
£mUK £m
US (Medical)
£mOther
£mTotal £
m
Equities 178 – 202 380 182 – 217 399
Government bonds 215 – 230 445 682 – 137 819
Corporate bonds 356 – 25 381 395 – 92 487
Real Estate/property – unquoted 113 – 19 132 110 – 51 161
Insurance contracts 388 – – 388 350 – – 350
Other assets – unquoted 538 – 20 558 35 – 13 48
Fair value of plan assets 1,788 – 496 2,284 1,754 – 510 2,264
In 2021, the Trustees of two of the UK pension plans entered into an annuity buy-in agreement which covers, in aggregate, £48 million of pension liabilities (valued under IAS19 at 31 December 2021). The buy-in involved the purchase of a bulk annuity policy under which the insurer will pay the UK pension funds amounts equivalent to the benefits payable to members. This purchase was conducted by the trustees to ensure the pension fund had an asset that would match its obligation to members. The pension liabilities remain with, and the matching annuity policies are held within, the UK pension funds. As this was an investment decision by the trustees the immaterial reduction in the valuation of plan assets (due to the difference between the purchase price of the annuity policy and the accounting value of the buy-in asset) is recorded within Other comprehensive income.
In 2020 the trustees of the principle UK pension plan entered into a similar arrangement, a similar immaterial downward remeasurement of pension assets was recorded within Other comprehensive income. At 31 December 2021 this arrangement covered £340 million (2020: £350 million) of pension liabilities (valued under IAS19).
At 31 December 2021 the Group has not committed to any Buy-out arrangements in respect of any of the UK pension schemes.
Notes to the Financial Statements (Continued)
23 Pension and Post-Retirement Commitments continued

Reckitt Annual Report and Accounts 2021
Financial StatementsGovernanceStrategic Report
243
Included in Other assets are £466 million (2020: nil) relating to liability driven investment funds. This is a bespoke pooled investment vehicle with underlying listed bonds and structured notes. The trustees have purchased these investments during the year to lower risk within the portfolio without reducing potential returns. The remaining other assets are cash.
The present value of obligations for the combined UK plans and the US Medical plans at last valuation date is attributable to participants as follows:
2021 2020
UK £m
US (Medical)
£mUK £m
US (Medical)
£m
Active participants (1) (45) – (50)
Participants with deferred benefits (646) (1) (687) (2)
Participants receiving benefits (839) (62) (860) (73)
Present value of obligation (1,486) (107) (1,547) (125)
The movement in the Group’s net surplus/(deficit) is as follows:
Present value of obligation Fair value of plan assets
UK £m
US (Medical)
£mOther
£mTotal
£mUK £m
US (Medical)
£mOther
£mTotal
£m
At 1 January 2020 1,506 130 704 2,340 (1,741) – (534) (2,275)
Current service cost 4 1 4 9 – – – –
Interest expense/(income) 28 4 14 46 (32) – (15) (47)
32 5 18 55 (32) – (15) (47)
Remeasurements:
Return on plan assets, excluding amounts included in interest income – – – – (54) – (17) (71)
Losses/(gains) from changes in demographic assumptions 9 (1) (2) 6 – – – –
Losses from change in financial assumptions 88 12 55 155 – – – –
Experience (gains)/losses (9) (10) 3 (16) – – – –
88 1 56 145 (54) – (17) (71)
Exchange differences – (4) (15) (19) – – 20 20
Contributions – employers – – – – (6) (7) (8) (21)
Payments from plans:
Benefit payments (79) (7) (44) (130) 79 7 44 130
As at 31 December 2020 1,547 125 719 2,391 (1,754) – (510) (2,264)
Current service cost – 1 9 10 – – – –
Administrative costs 2 – – 2 – – – –
Interest expense/(income) 23 3 9 35 (26) – (5) (31)
25 4 18 47 (26) – (5) (31)
Remeasurements:
Return on plan assets, excluding amounts included in interest income – – – – (76) – (30) (106)
Losses/(gains) from changes in demographic assumptions 1 (6) 4 (1) – – – –
(Gains) from change in financial assumptions (27) (5) (33) (65) – – (1) (1)
Experience (gains)/losses 8 (3) 4 9 – – – –
(18) (14) (25) (57) (76) – (31) (107)
Exchange differences – – (5) (5) – – 4 4
Contributions – employers – – – – – (8) (11) (19)
Payments from plans: – – – – – – – –
Benefit payments (68) (8) (57) (133) 68 8 57 133
As at 31 December 2021 1,486 107 650 2,243 (1,788) – (496) (2,284)
23 Pension and Post-Retirement Commitments continued

244
Amounts recognised in the Income StatementThe charge for the year ended 31 December is shown below:
2021 £m
2020 £m
Defined contribution plans 48 45
Defined benefit plans (net charge excluding interest)
UK 2 4
US (Medical) 1 1
Other 9 4
Total pension costs included in operating profit (Note 5)1 60 54
Income Statement charge included in finance expense – –
Income Statement charge included in profit before income tax 60 54
Remeasurement losses/(gains) for2:
UK 94 34
US (Medical) 14 1
Other 56 39
164 74
1. The Income Statement charge recognised in operating profit includes current service cost, past service cost and administrative costs
2. Remeasurement (gains) excludes £15 million (2020: £1 million) recognised in OCI for irrecoverable surplus
Sensitivity of Significant Actuarial AssumptionsThe sensitivity of the UK defined benefit obligation to changes in the principal assumptions is shown below:
2021 Change in assumptionChange in defined benefit obligation
Discount rate Increase 0.1% Decrease by 1.6%
RPI increase Increase 0.1% Increase by 0.9%
Life expectancy Members live 1 year longer Increase by 4.0%
2020 Change in assumptionChange in defined benefit
obligation
Discount rate Increase 0.1% Decrease by 1.7%
RPI increase Increase 0.1% Increase by 1.0%
Life expectancy Members live 1 year longer Increase by 4.0%
The above sensitivity analyses are based on a change in an assumption while holding all other assumptions constant. In practice, this is unlikely to occur, and changes in some of the assumptions may be correlated.
Impact of medical cost trend rates: A 1% change in the assumed healthcare cost trend rates would have an immaterial impact on the service cost, interest cost and post-retirement benefit obligation.
Risk and risk management: Through its defined benefit pension plans and post-employment medical plans, the Group is exposed to a number of risks, the most significant of which are detailed as follows:
Asset volatility: The plan liabilities are calculated using a discount rate set with reference to corporate bond yields. If plan assets underperform this yield, this will create a deficit. Both the UK and US plans hold a significant proportion of equities, which are expected to outperform corporate bonds in the long term while providing volatility and risk in the short term. However, the Group believes that due to the long-term nature of the plan liabilities and the strength of the supporting group, a level of continuing equity investment is an appropriate element of the Group’s long-term strategy to manage the plans efficiently.
Changes in bond yields: A decrease in government and corporate bond yields will increase plan liabilities, although this will be partially offset by an increase in the value of the plans’ bond holdings
Inflation risk: Some of the Group’s pension obligations are linked to inflation, and higher inflation will lead to higher liabilities (although, in most cases, caps on the level of inflationary increases are in place to protect the plan against extreme inflation). The majority of the plans’ assets are either unaffected by (fixed interest bonds) or loosely correlated with (equities) inflation, meaning that an increase in inflation will also increase the deficit. In the US plans, the pensions in payment are not linked to inflation, so this is a less material risk.
Notes to the Financial Statements (Continued)
23 Pension and Post-Retirement Commitments continued
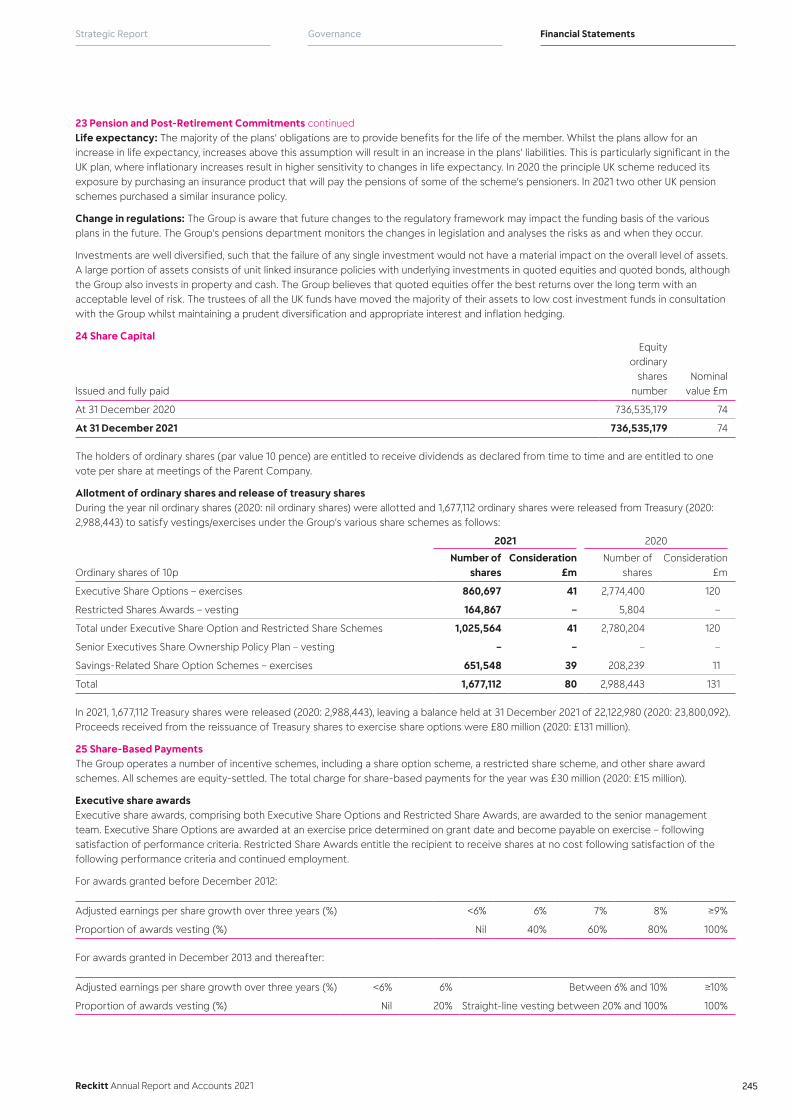
Reckitt Annual Report and Accounts 2021
Financial StatementsGovernanceStrategic Report
245
Life expectancy: The majority of the plans’ obligations are to provide benefits for the life of the member. Whilst the plans allow for an increase in life expectancy, increases above this assumption will result in an increase in the plans’ liabilities. This is particularly significant in the UK plan, where inflationary increases result in higher sensitivity to changes in life expectancy. In 2020 the principle UK scheme reduced its exposure by purchasing an insurance product that will pay the pensions of some of the scheme’s pensioners. In 2021 two other UK pension schemes purchased a similar insurance policy.
Change in regulations: The Group is aware that future changes to the regulatory framework may impact the funding basis of the various plans in the future. The Group’s pensions department monitors the changes in legislation and analyses the risks as and when they occur.
Investments are well diversified, such that the failure of any single investment would not have a material impact on the overall level of assets. A large portion of assets consists of unit linked insurance policies with underlying investments in quoted equities and quoted bonds, although the Group also invests in property and cash. The Group believes that quoted equities offer the best returns over the long term with an acceptable level of risk. The trustees of all the UK funds have moved the majority of their assets to low cost investment funds in consultation with the Group whilst maintaining a prudent diversification and appropriate interest and inflation hedging.
24 Share Capital
Issued and fully paid
Equity ordinary
shares number
Nominal value £m
At 31 December 2020 736,535,179 74
At 31 December 2021 736,535,179 74
The holders of ordinary shares (par value 10 pence) are entitled to receive dividends as declared from time to time and are entitled to one vote per share at meetings of the Parent Company.
Allotment of ordinary shares and release of treasury sharesDuring the year nil ordinary shares (2020: nil ordinary shares) were allotted and 1,677,112 ordinary shares were released from Treasury (2020: 2,988,443) to satisfy vestings/exercises under the Group’s various share schemes as follows:
2021 2020
Ordinary shares of 10pNumber of
sharesConsideration
£mNumber of
sharesConsideration
£m
Executive Share Options – exercises 860,697 41 2,774,400 120
Restricted Shares Awards – vesting 164,867 – 5,804 –
Total under Executive Share Option and Restricted Share Schemes 1,025,564 41 2,780,204 120
Senior Executives Share Ownership Policy Plan – vesting – – – –
Savings-Related Share Option Schemes – exercises 651,548 39 208,239 11
Total 1,677,112 80 2,988,443 131
In 2021, 1,677,112 Treasury shares were released (2020: 2,988,443), leaving a balance held at 31 December 2021 of 22,122,980 (2020: 23,800,092). Proceeds received from the reissuance of Treasury shares to exercise share options were £80 million (2020: £131 million).
25 Share-Based PaymentsThe Group operates a number of incentive schemes, including a share option scheme, a restricted share scheme, and other share award schemes. All schemes are equity-settled. The total charge for share-based payments for the year was £30 million (2020: £15 million).
Executive share awardsExecutive share awards, comprising both Executive Share Options and Restricted Share Awards, are awarded to the senior management team. Executive Share Options are awarded at an exercise price determined on grant date and become payable on exercise – following satisfaction of performance criteria. Restricted Share Awards entitle the recipient to receive shares at no cost following satisfaction of the following performance criteria and continued employment.
For awards granted before December 2012:
Adjusted earnings per share growth over three years (%) <6% 6% 7% 8% ≥9%
Proportion of awards vesting (%) Nil 40% 60% 80% 100%
For awards granted in December 2013 and thereafter:
Adjusted earnings per share growth over three years (%) <6% 6% Between 6% and 10% ≥10%
Proportion of awards vesting (%) Nil 20% Straight-line vesting between 20% and 100% 100%
23 Pension and Post-Retirement Commitments continued

246
For awards granted in May 2019:
Weighting
Threshold (20%
vesting)
Maximum (100%
vesting)
Adjusted EPS growth at actual FX rates (three-year CAGR) 25% 4% 9%
Adjusted EPS growth at constant FX rates (three-year CAGR) 25% 4% 9%
Net Revenue growth (three-year CAGR) 25% 2% 6%
Return on capital employed (in final year) 25% 10.8% 12.8%
For awards granted in May 2020:
Weighting
Threshold (20%
vesting)
Maximum (100%
vesting)
Adjusted EPS at actual FX rates (in final year) 12.5% 302p 337p
Adjusted EPS at constant FX rates (in final year) 12.5% 323p 360p
Net Revenue growth (three-year CAGR) 50.0% 2.0% 5.0%
Return on capital employed (in final year) 25.0% 11.8% 13.1%
For awards granted in May 2021 and thereafter:
Weighting
Threshold (20%
vesting)
Maximum (100%
vesting)
Adjusted EPS at actual FX rates (in final year) 12.5% 308p 379p
Adjusted EPS at constant FX rates (in final year) 12.5% 327p 401p
Net Revenue growth (three-year CAGR) 50% 1% 5%
Return on capital employed (in final year) 25% 12.3% 14.0%
The cost is spread over the three years of the performance period. For Group Executive Committee and members of the Group Leadership Team, vesting conditions must be met over the three-year period and are not retested.
For the remaining members of the senior management team, for awards granted prior to 2021, the targets can be retested after four or five years. If any target has not been met, any remaining shares or options which have not vested will lapse. For awards granted in May 2021 and thereafter, vesting conditions must be met over the three-year period and are not retested.
Other share awardsOther share awards represent SAYE Schemes (offered to all staff within the relevant geographic area) and a number of Senior Executive Share Ownership Policy Plan (SOPP) awards. Other share awards have contractual lives of between three and eight years and are generally not subject to any vesting criteria other than the employee’s continued employment.
Individual tranches of these other share awards are not material for detailed disclosure and therefore have been aggregated in the tables following.
Summary of shares outstandingAll outstanding Executive and Other share awards as at 31 December 2021 and 31 December 2020 are included in the tables following which analyse the charge for 2021 and 2020. The Group has used the Black-Scholes model to calculate the fair value of one award on the date of the grant of the award.
Notes to the Financial Statements (Continued)
25 Share-Based Payments continued
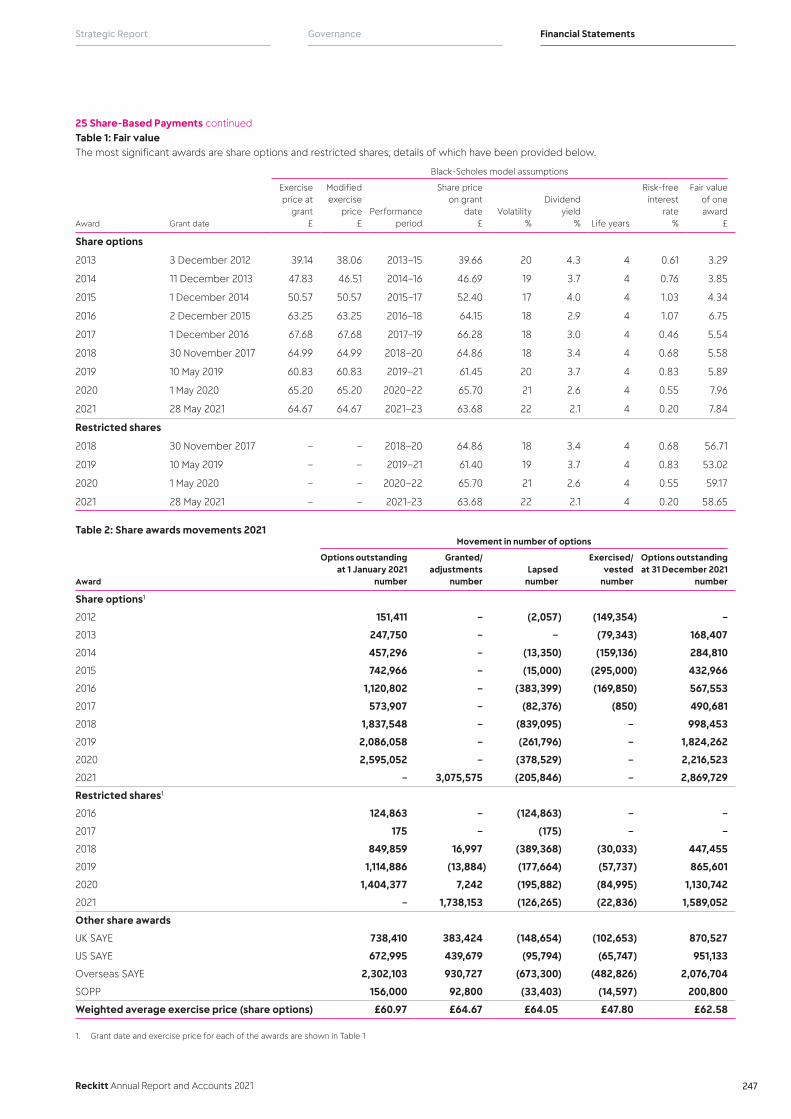
Reckitt Annual Report and Accounts 2021
Financial StatementsGovernanceStrategic Report
247
Table 1: Fair valueThe most significant awards are share options and restricted shares, details of which have been provided below.
Black-Scholes model assumptions
Award Grant date
Exercise price at
grant £
Modified exercise
price £
Performance period
Share price on grant
date £
Volatility %
Dividend yield
% Life years
Risk-free interest
rate %
Fair value of one award
£
Share options
2013 3 December 2012 39.14 38.06 2013–15 39.66 20 4.3 4 0.61 3.29
2014 11 December 2013 47.83 46.51 2014–16 46.69 19 3.7 4 0.76 3.85
2015 1 December 2014 50.57 50.57 2015–17 52.40 17 4.0 4 1.03 4.34
2016 2 December 2015 63.25 63.25 2016–18 64.15 18 2.9 4 1.07 6.75
2017 1 December 2016 67.68 67.68 2017–19 66.28 18 3.0 4 0.46 5.54
2018 30 November 2017 64.99 64.99 2018–20 64.86 18 3.4 4 0.68 5.58
2019 10 May 2019 60.83 60.83 2019–21 61.45 20 3.7 4 0.83 5.89
2020 1 May 2020 65.20 65.20 2020–22 65.70 21 2.6 4 0.55 7.96
2021 28 May 2021 64.67 64.67 2021–23 63.68 22 2.1 4 0.20 7.84
Restricted shares
2018 30 November 2017 – – 2018–20 64.86 18 3.4 4 0.68 56.71
2019 10 May 2019 – – 2019–21 61.40 19 3.7 4 0.83 53.02
2020 1 May 2020 – – 2020–22 65.70 21 2.6 4 0.55 59.17
2021 28 May 2021 – – 2021-23 63.68 22 2.1 4 0.20 58.65
Table 2: Share awards movements 2021Movement in number of options
Award
Options outstanding at 1 January 2021
number
Granted/ adjustments
numberLapsed
number
Exercised/vested
number
Options outstanding at 31 December 2021
number
Share options1
2012 151,411 – (2,057) (149,354) –
2013 247,750 – – (79,343) 168,407
2014 457,296 – (13,350) (159,136) 284,810
2015 742,966 – (15,000) (295,000) 432,966
2016 1,120,802 – (383,399) (169,850) 567,553
2017 573,907 – (82,376) (850) 490,681
2018 1,837,548 – (839,095) – 998,453
2019 2,086,058 – (261,796) – 1,824,262
2020 2,595,052 – (378,529) – 2,216,523
2021 – 3,075,575 (205,846) – 2,869,729
Restricted shares1
2016 124,863 – (124,863) – –
2017 175 – (175) – –
2018 849,859 16,997 (389,368) (30,033) 447,455
2019 1,114,886 (13,884) (177,664) (57,737) 865,601
2020 1,404,377 7,242 (195,882) (84,995) 1,130,742
2021 – 1,738,153 (126,265) (22,836) 1,589,052
Other share awards
UK SAYE 738,410 383,424 (148,654) (102,653) 870,527
US SAYE 672,995 439,679 (95,794) (65,747) 951,133
Overseas SAYE 2,302,103 930,727 (673,300) (482,826) 2,076,704
SOPP 156,000 92,800 (33,403) (14,597) 200,800
Weighted average exercise price (share options) £60.97 £64.67 £64.05 £47.80 £62.58
1. Grant date and exercise price for each of the awards are shown in Table 1
25 Share-Based Payments continued
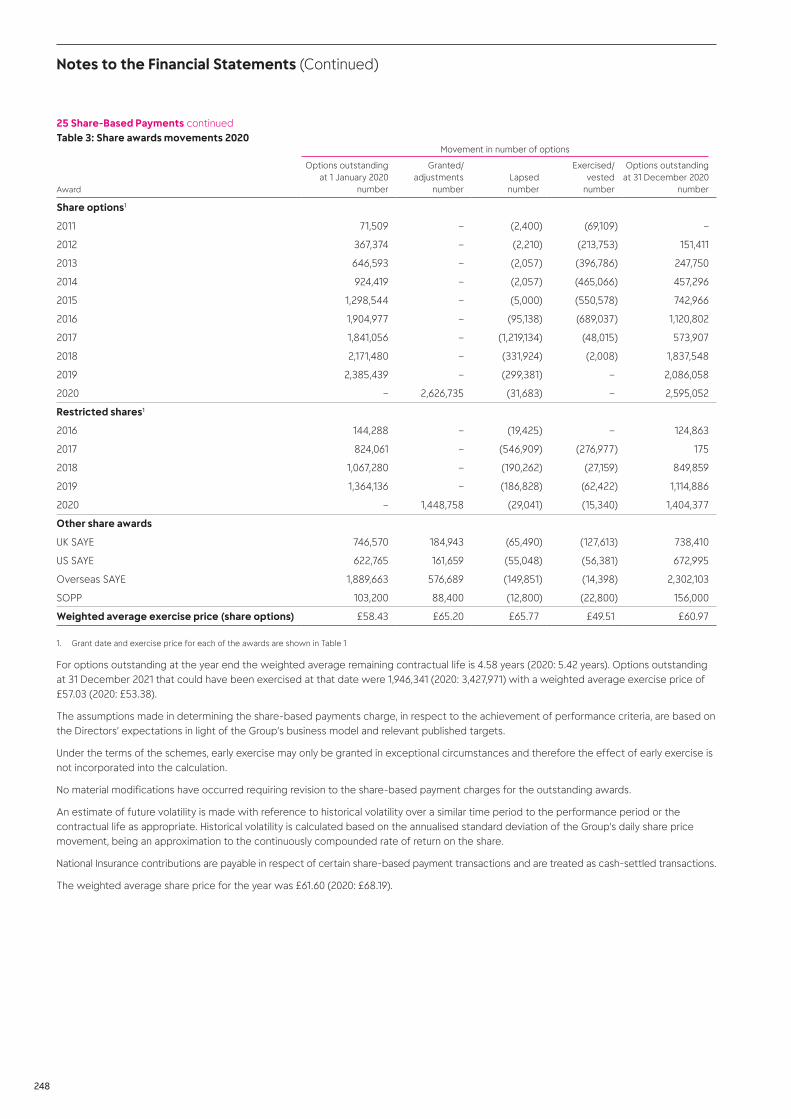
248
Table 3: Share awards movements 2020Movement in number of options
Award
Options outstanding at 1 January 2020
number
Granted/adjustments
numberLapsed number
Exercised/vested
number
Options outstanding at 31 December 2020
number
Share options1
2011 71,509 – (2,400) (69,109) –
2012 367,374 – (2,210) (213,753) 151,411
2013 646,593 – (2,057) (396,786) 247,750
2014 924,419 – (2,057) (465,066) 457,296
2015 1,298,544 – (5,000) (550,578) 742,966
2016 1,904,977 – (95,138) (689,037) 1,120,802
2017 1,841,056 – (1,219,134) (48,015) 573,907
2018 2,171,480 – (331,924) (2,008) 1,837,548
2019 2,385,439 – (299,381) – 2,086,058
2020 – 2,626,735 (31,683) – 2,595,052
Restricted shares1
2016 144,288 – (19,425) – 124,863
2017 824,061 – (546,909) (276,977) 175
2018 1,067,280 – (190,262) (27,159) 849,859
2019 1,364,136 – (186,828) (62,422) 1,114,886
2020 – 1,448,758 (29,041) (15,340) 1,404,377
Other share awards
UK SAYE 746,570 184,943 (65,490) (127,613) 738,410
US SAYE 622,765 161,659 (55,048) (56,381) 672,995
Overseas SAYE 1,889,663 576,689 (149,851) (14,398) 2,302,103
SOPP 103,200 88,400 (12,800) (22,800) 156,000
Weighted average exercise price (share options) £58.43 £65.20 £65.77 £49.51 £60.97
1. Grant date and exercise price for each of the awards are shown in Table 1
For options outstanding at the year end the weighted average remaining contractual life is 4.58 years (2020: 5.42 years). Options outstanding at 31 December 2021 that could have been exercised at that date were 1,946,341 (2020: 3,427,971) with a weighted average exercise price of £57.03 (2020: £53.38).
The assumptions made in determining the share-based payments charge, in respect to the achievement of performance criteria, are based on the Directors’ expectations in light of the Group’s business model and relevant published targets.
Under the terms of the schemes, early exercise may only be granted in exceptional circumstances and therefore the effect of early exercise is not incorporated into the calculation.
No material modifications have occurred requiring revision to the share-based payment charges for the outstanding awards.
An estimate of future volatility is made with reference to historical volatility over a similar time period to the performance period or the contractual life as appropriate. Historical volatility is calculated based on the annualised standard deviation of the Group’s daily share price movement, being an approximation to the continuously compounded rate of return on the share.
National Insurance contributions are payable in respect of certain share-based payment transactions and are treated as cash-settled transactions.
The weighted average share price for the year was £61.60 (2020: £68.19).
Notes to the Financial Statements (Continued)
25 Share-Based Payments continued

Reckitt Annual Report and Accounts 2021
Financial StatementsGovernanceStrategic Report
249
Options and restricted shares granted during the yearOptions and restricted shares granted during the year which may vest or become exercisable at various dates between 2022 and 2027 are as follows:
Price to be paid
£
Number of shares under
option
Executive share option and restricted share schemes
Reckitt Benckiser Long-term Incentive Plan – share options 64.67 3,075,575
Reckitt Benckiser Long-term Incentive Plan – restricted shares – 1,738,153
Reckitt Benckiser Group Senior Executive Share Ownership Policy Plan – 92,800
Total 4,906,528
Savings-related share option schemes
UK Scheme 44.56 383,424
US Scheme 44.56 439,679
Overseas Scheme 44.56 930,727
Total 1,753,830
Options and restricted shares outstanding at 31 December 2021Options and restricted shares which have vested or may vest at various dates between 2022 and 2027 are as follows:
Price to be paid £ Number of shares under option
From To 2021 2020
Executive share option and restricted share schemes
Reckitt Benckiser Long-term Incentive Plan – Annual Grant – options 38.06 78.00 9,853,384 9,812,790
Reckitt Benckiser Long-term Incentive Plan – Annual Grant – restricted shares – – 4,032,850 3,494,160
Reckitt Benckiser Senior Executives Share Ownership Policy Plan – – 200,800 156,000
Total 14,087,034 13,462,950
Savings-related share option schemes
UK Scheme 44.56 62.44 870,527 738,410
US Scheme 44.56 62.44 951,133 672,995
Overseas Scheme 44.56 62.44 2,076,704 2,302,103
Total 3,898,364 3,713,508
26 Other Reserves
Hedging Reserve
£m
Foreign currency
translation reserve
£m
Total other reserves
£m
Balance at 1 January 2020 (2) (78) (80)
Other comprehensive income/(expense)
Losses on cash flow hedges, net of tax (17) – (17)
Net exchange losses on foreign currency translation, net of tax – (207) (207)
Losses on net investment hedges – (75) (75)
Total other comprehensive expense for the year (17) (282) (299)
Balance at 31 December 2020 (19) (360) (379)
Other comprehensive income/(expense)
Gains on cash flow hedges, net of tax 30 – 30
Net exchange losses on foreign currency translation, net of tax – (374) (374)
Gains on net investment hedges, net of tax – 84 84
Reclassification of foreign currency translation reserves on disposal or liquidation of foreign operations, net of tax – (550) (550)
Total other comprehensive income/(expense) for the year 30 (840) (810)
Balance at 31 December 2021 11 (1,200) (1,189)
25 Share-Based Payments continued

250
The hedging reserve comprises the effective portion of the cumulative net change in fair value of cash flow hedging instruments related to hedge transactions that are extant at year end.
The foreign currency translation reserve contains the accumulated foreign exchange differences from the translation of the Financial Statements of the Group’s foreign operations arising when the Group’s entities are consolidated. The reserve also contains the translation of liabilities that hedge the Group’s net exposure in a foreign currency.
During the year ended 31 December 2021 a net gain of £550 million was reclassified to the income statement from foreign currency reserves following the disposal or liquidation of foreign operations, of which a net gain of £766 million related to the liquidation of subsidiaries (see Note 6 for further details) offset by a loss of £216 million, made up of a £284 million arising from the disposal of certain businesses (see Note 29), less related tax credits of £68 million (see Note 7).
27 Related Party TransactionsThe Group has symmetrical put and call options over the non-controlling shareholdings of RB & Manon Business Co. Ltd, RB & Manon Business Limited, RB (China Trading) Limited, RB (Hygiene Home) HK Limited, RB & Manon Hygiene Home (HK) Limited and RB & Manon Hygiene Home (Shanghai) Limited.
During the year ended 31 December 2021, the options were measured at fair value and as a result £14 million was credited to the income statement during the year (see Note 6).
On 31 December 2021, notice to exercise the put and call options was not provided. As a result of the option notice not being received, this option expired. As a result of the expiry of these options, the related liabilities of £135 million were de-recognised with their carrying value credited to equity.
OtherThe Group has related party relationships with its Directors and key management personnel (Note 5). Other related party relationships are acknowledged in Note 11.
28 Dividends2021
£m2020
£m
Cash dividends on equity ordinary shares:
2020 Final paid: 101.6p (2019: Final 101.6p) per share 725 721
2021 Interim paid: 73p (2020: Interim 73p) per share 521 520
Total dividends for the year 1,246 1,241
The Directors are proposing a final dividend in respect of the financial year ended 31 December 2021 of 101.6p per share which will absorb an estimated £726 million of Shareholders’ funds. If approved by Shareholders it will be paid on 9 June 2022 to Shareholders who are on the register on 29 April 2022, with an ex-dividend date of 28 April 2022.
29 Acquisitions, Disposals and Held for SaleDuring the year ended 31 December 2021, the Group completed several acquisitions, accounted for as business combinations, and disposals. In each case, 100% of the businesses were acquired or disposed unless stated otherwise. The Group did not have business disposals or acquisitions during the year ended 31 December 2020.
AcquisitionsAcquisition of BiofreezeOn 12 July 2021, the Group acquired 100% of the equity interests in Lanai Holdings, owner of the Biofreeze and TheraPearl brands, for cash consideration of $1,060 million (£766 million). Biofreeze is a leader in over-the-counter topical pain relief, with a strong footprint in the North America retail and clinical channels and a growing international presence. The acquisition of Biofreeze and TheraPearl has been accounted for as a business combination.
Included within the identifiable assets acquired are brands of £596 million, comprising Biofreeze (£564 million) and TheraPearl (£32 million), customer relationships of £24 million and inventories of £26 million.
Goodwill of £271 million has been recorded on the acquisition, of which £151 million is a consequence of the requirement to record deferred tax liabilities for certain acquired assets. Goodwill represents the future value which the Group believes it will obtain from innovation arising from combining the acquired business with the Group’s existing businesses, which has not been recognised as an intangible asset at the acquisition date. None of the goodwill is deductible for income tax purposes.
The Biofreeze acquisitions contributed £55 million to Group net revenue and £9 million to Group operating profit since acquisition, with transaction costs of £12 million. If the acquisition had taken place at the beginning of the year, Group net revenue would have been increased by circa £50 million and the impact on Group net income would have been immaterial.
Notes to the Financial Statements (Continued)
26 Other Reserves continued

Reckitt Annual Report and Accounts 2021
Financial StatementsGovernanceStrategic Report
251
Other acquisitionsThe Group also completed the following acquisitions during 2021 for cash consideration, all of which have been accounted for as business combinations:
• 1 April 2021, the Maple Island USA dry processing plant, previously a co-packer for Enfagrow stage 3 and Metabolics, as an asset purchase.
• 4 May 2021, through a trade and asset purchase, a business distributing Reckitt products in the United Arab Emirates.
• 31 May 2021, a Chinese PU condom business through an acquisition of an 80% equity interest in Lanzhou Keshi Xixili Healthcare Technologies Co Ltd.
The results of other acquisitions have been included in the Group’s financial statements since the relevant acquisition dates. The effect of these other acquisitions was immaterial to the Group.
The following table summarises the consideration paid and the fair values of assets acquired and liabilities assumed. The amount of consideration transferred in excess of the value of total identifiable net assets is recorded as goodwill.
Biofreeze£m
Others£m
Total£m
Brands and other intangible assets 620 52 672
Property, plant and equipment – 20 20
Inventories 26 – 26
Deferred tax liabilities (151) – (151)
Total identifiable net assets 495 72 567
Goodwill 271 99 370
Total 766 171 937
Cash consideration 766 149 915
Deferred consideration – 22 22
Total consideration 766 171 937
DisposalsThe Group completed three disposals in 2021, for a total consideration, net of disposal costs, of £1,704 million, resulting in a total pre-tax loss on disposal of £3,518 million reported within total net operating expenses. None of the disposals meets the definition of a discontinued operation under IFRS as each disposal does not represent the disposal of either a separate major line of business or a geographical area of operations for Reckitt. As such, the results of the disposed businesses are included in the continuing operations up to their date of disposal.
IFCN ChinaOn 9 September 2021, the Group completed the sale of IFCN China to Primavera Capital Group for total cash consideration, net of disposal costs, of £1,436 million. The consideration was principally represented by cash of £1,513 million and an 8% shareholding in the purchaser’s acquisition entity. The disposal followed a comprehensive strategic review of IFCN China announced by the Group in February 2021. The transaction was structured as a sale of the entirety of IFCN China (China, Hong Kong and Taiwan), including the manufacturing plants in Nijmegen, the Netherlands and Guangzhou, China. The disposal included a royalty-free perpetual and exclusive license of the Mead Johnson and Enfa family of brands in China. Reckitt continues to own the Mead Johnson and Enfa family of brands globally and operates these brands in the rest of the world. On completion of the disposal, the Group recognized a pre-tax loss on disposal of £3,284 million included within total net operating expenses. IFCN China formed part of the Nutrition segment.
29 Acquisitions, Disposals and Held for Sale continued
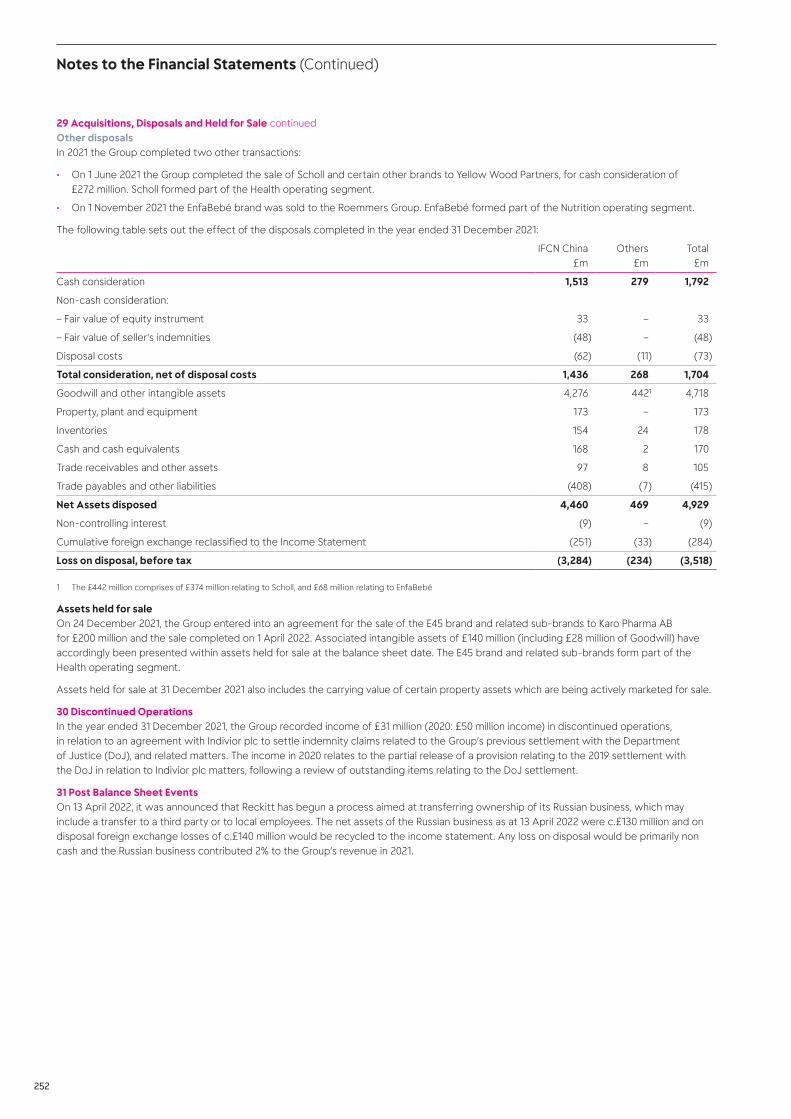
252
Other disposalsIn 2021 the Group completed two other transactions:
• On 1 June 2021 the Group completed the sale of Scholl and certain other brands to Yellow Wood Partners, for cash consideration of £272 million. Scholl formed part of the Health operating segment.
• On 1 November 2021 the EnfaBebé brand was sold to the Roemmers Group. EnfaBebé formed part of the Nutrition operating segment.
The following table sets out the effect of the disposals completed in the year ended 31 December 2021:
IFCN China£m
Others£m
Total£m
Cash consideration 1,513 279 1,792
Non-cash consideration:
– Fair value of equity instrument 33 – 33
– Fair value of seller’s indemnities (48) – (48)
Disposal costs (62) (11) (73)
Total consideration, net of disposal costs 1,436 268 1,704
Goodwill and other intangible assets 4,276 4421 4,718
Property, plant and equipment 173 – 173
Inventories 154 24 178
Cash and cash equivalents 168 2 170
Trade receivables and other assets 97 8 105
Trade payables and other liabilities (408) (7) (415)
Net Assets disposed 4,460 469 4,929
Non-controlling interest (9) – (9)
Cumulative foreign exchange reclassified to the Income Statement (251) (33) (284)
Loss on disposal, before tax (3,284) (234) (3,518)
1 The £442 million comprises of £374 million relating to Scholl, and £68 million relating to EnfaBebé
Assets held for saleOn 24 December 2021, the Group entered into an agreement for the sale of the E45 brand and related sub-brands to Karo Pharma AB for £200 million and the sale completed on 1 April 2022. Associated intangible assets of £140 million (including £28 million of Goodwill) have accordingly been presented within assets held for sale at the balance sheet date. The E45 brand and related sub-brands form part of the Health operating segment.
Assets held for sale at 31 December 2021 also includes the carrying value of certain property assets which are being actively marketed for sale.
30 Discontinued OperationsIn the year ended 31 December 2021, the Group recorded income of £31 million (2020: £50 million income) in discontinued operations, in relation to an agreement with Indivior plc to settle indemnity claims related to the Group’s previous settlement with the Department of Justice (DoJ), and related matters. The income in 2020 relates to the partial release of a provision relating to the 2019 settlement with the DoJ in relation to Indivior plc matters, following a review of outstanding items relating to the DoJ settlement.
31 Post Balance Sheet EventsOn 13 April 2022, it was announced that Reckitt has begun a process aimed at transferring ownership of its Russian business, which may include a transfer to a third party or to local employees. The net assets of the Russian business as at 13 April 2022 were c.£130 million and on disposal foreign exchange losses of c.£140 million would be recycled to the income statement. Any loss on disposal would be primarily non cash and the Russian business contributed 2% to the Group’s revenue in 2021.
29 Acquisitions, Disposals and Held for Sale continued
Notes to the Financial Statements (Continued)
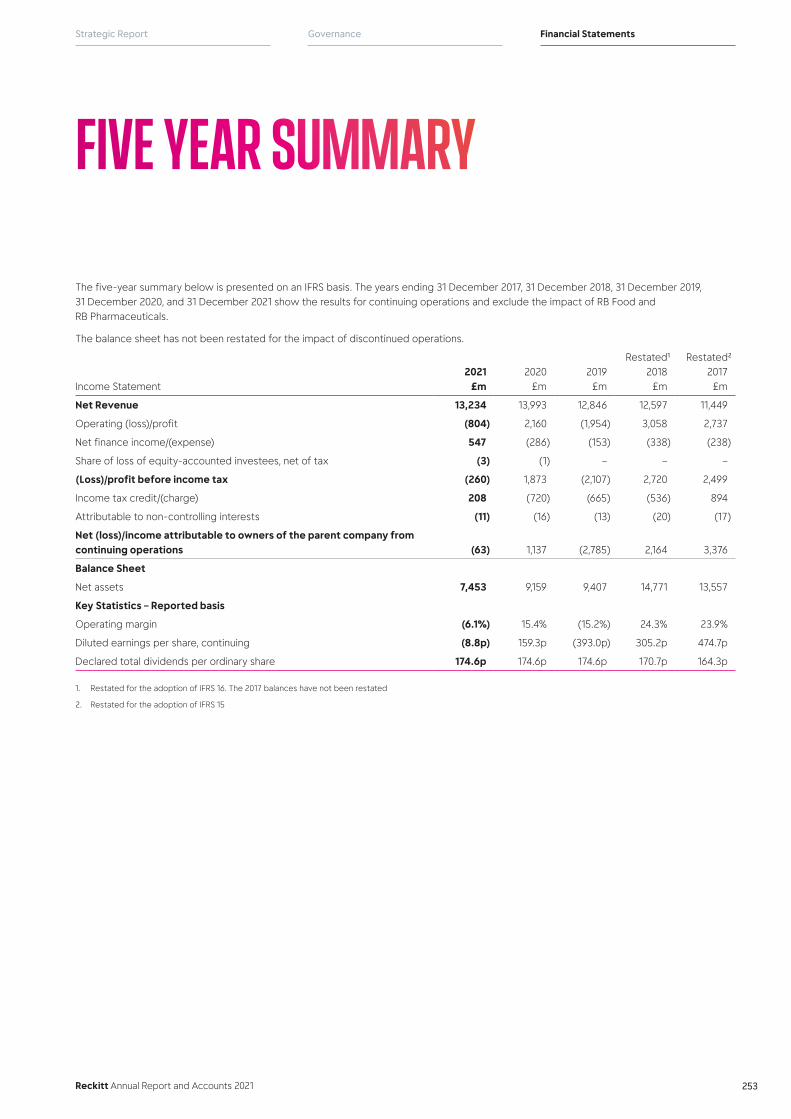
Reckitt Annual Report and Accounts 2021
Financial StatementsGovernanceStrategic Report
253
The five-year summary below is presented on an IFRS basis. The years ending 31 December 2017, 31 December 2018, 31 December 2019, 31 December 2020, and 31 December 2021 show the results for continuing operations and exclude the impact of RB Food and RB Pharmaceuticals.
The balance sheet has not been restated for the impact of discontinued operations.
Income Statement2021
£m2020
£m2019
£m
Restated1 2018
£m
Restated2 2017
£m
Net Revenue 13,234 13,993 12,846 12,597 11,449
Operating (loss)/profit (804) 2,160 (1,954) 3,058 2,737
Net finance income/(expense) 547 (286) (153) (338) (238)
Share of loss of equity-accounted investees, net of tax (3) (1) – – –
(Loss)/profit before income tax (260) 1,873 (2,107) 2,720 2,499
Income tax credit/(charge) 208 (720) (665) (536) 894
Attributable to non-controlling interests (11) (16) (13) (20) (17)
Net (loss)/income attributable to owners of the parent company from continuing operations (63) 1,137 (2,785) 2,164 3,376
Balance Sheet
Net assets 7,453 9,159 9,407 14,771 13,557
Key Statistics – Reported basis
Operating margin (6.1%) 15.4% (15.2%) 24.3% 23.9%
Diluted earnings per share, continuing (8.8p) 159.3p (393.0p) 305.2p 474.7p
Declared total dividends per ordinary share 174.6p 174.6p 174.6p 170.7p 164.3p
1. Restated for the adoption of IFRS 16. The 2017 balances have not been restated
2. Restated for the adoption of IFRS 15
FIVE YEAR SUMMARY

254
As at 31 December Note2021
£m2020
£m
Fixed assets
Investments 2 15,001 14,975
Current assets
Debtors due within one year 3 45 56
Debtors due after more than one year 4 25 3
70 59
Current liabilities
Creditors due within one year 5 (10,898) (9,652)
Net current liabilities (10,828) (9,593)
Total assets less current liabilities 4,173 5,382
Creditors due after more than one year 5 (42) (30)
Provisions for liabilities and charges 6 (41) (43)
Net assets 4,090 5,309
EQUITY
Share capital 7 74 74
Share premium 253 252
Retained earnings 3,763 4,983
Total equity 4,090 5,309
The Financial Statements on pages 254 to 267 were approved by the Board of Directors on 13 April 2022 and signed on its behalf by:
Christopher Sinclair Laxman NarasimhanDirector Director Reckitt Benckiser Group plc Reckitt Benckiser Group plc
Company Number: 06270876
PARENT COMPANY BALANCE SHEET
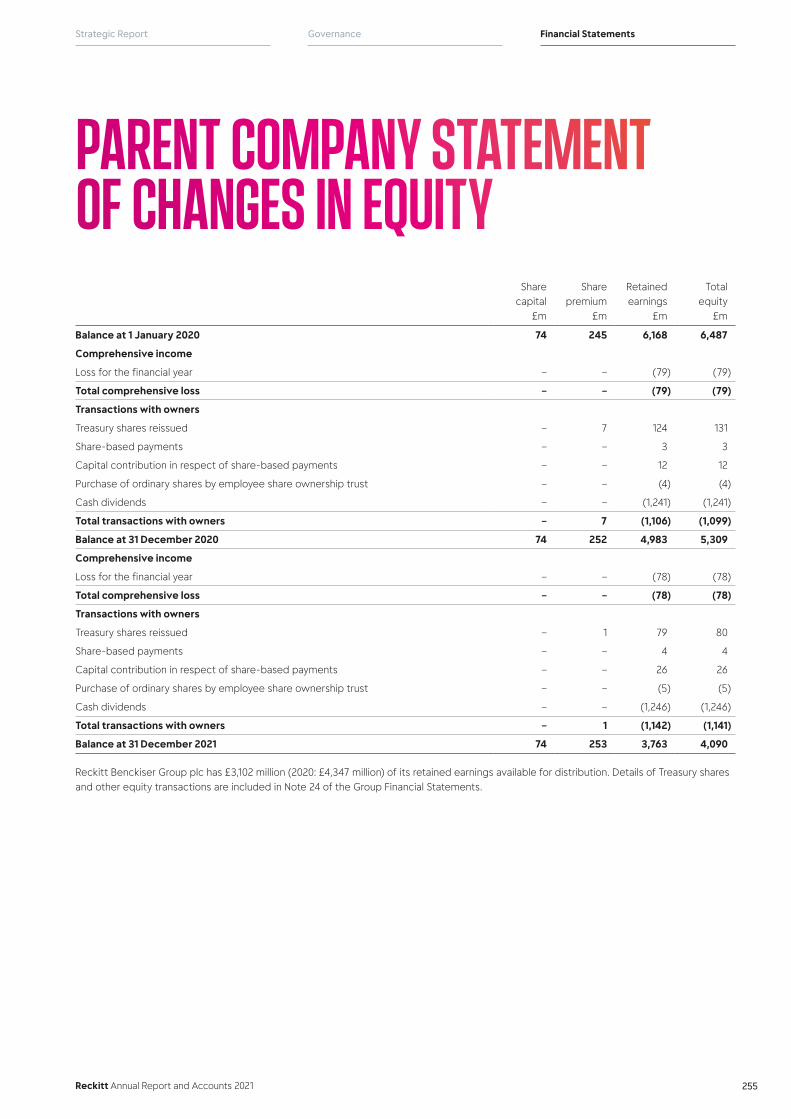
Reckitt Annual Report and Accounts 2021
Financial StatementsGovernanceStrategic Report
255
Share capital
£m
Share premium
£m
Retained earnings
£m
Total equity
£m
Balance at 1 January 2020 74 245 6,168 6,487
Comprehensive income
Loss for the financial year – – (79) (79)
Total comprehensive loss – – (79) (79)
Transactions with owners
Treasury shares reissued – 7 124 131
Share-based payments – – 3 3
Capital contribution in respect of share-based payments – – 12 12
Purchase of ordinary shares by employee share ownership trust – – (4) (4)
Cash dividends – – (1,241) (1,241)
Total transactions with owners – 7 (1,106) (1,099)
Balance at 31 December 2020 74 252 4,983 5,309
Comprehensive income
Loss for the financial year – – (78) (78)
Total comprehensive loss – – (78) (78)
Transactions with owners
Treasury shares reissued – 1 79 80
Share-based payments – – 4 4
Capital contribution in respect of share-based payments – – 26 26
Purchase of ordinary shares by employee share ownership trust – – (5) (5)
Cash dividends – – (1,246) (1,246)
Total transactions with owners – 1 (1,142) (1,141)
Balance at 31 December 2021 74 253 3,763 4,090
Reckitt Benckiser Group plc has £3,102 million (2020: £4,347 million) of its retained earnings available for distribution. Details of Treasury shares and other equity transactions are included in Note 24 of the Group Financial Statements.
PARENT COMPANY STATEMENT OF CHANGES IN EQUITY

256
1 Parent Company Accounting PoliciesThe principal accounting policies are summarised below. They have all been applied consistently throughout the year and the preceding year.
General information and basis of accountingReckitt Benckiser Group plc is a company incorporated in the United Kingdom, registered in England and Wales under the Companies Act 2006, and is a public limited company. The address of the registered office is given on page 269. The nature of the Group’s operations and its principal activities are set out in the Strategic Report on pages 2 to 103.
Statement of complianceThe Financial Statements have been prepared under the historical cost convention and in compliance with United Kingdom Accounting Standards, including Financial Reporting Standard 102, The Financial Reporting Standard applicable in the United Kingdom and the Republic of Ireland (‘FRS 102’) and the Companies Act 2006.
The functional currency of Reckitt Benckiser Group plc is considered to be Pounds Sterling because that is the currency of the primary economic environment in which the Company operates.
As permitted by s408 of the Companies Act 2006, a Statement of Comprehensive Income is not presented for Reckitt Benckiser Group plc.
Going concernThe Directors considered it appropriate to adopt the going concern basis of accounting in preparing the Company Financial Statements.
Having assessed the principal risks and other matters discussed in connection with the Group’s Viability Statement as set out on page 103 of the Group Annual Report, the Directors considered it appropriate to adopt the going concern basis of accounting in preparing the Company Financial Statements. When reaching this conclusion, the Directors took into account the Company’s overall financial position and exposure to principal risks.
Financial Reporting Standard 102 – Reduced disclosure exemptionsFRS 102 allows a qualifying entity certain disclosure exemptions, subject to certain conditions, which have been complied with.
The Company has taken advantage of the following exemptions:
(i) from preparing a Statement of Cash Flows, on the basis that it is a qualifying entity and the Group Cash Flow Statement, included in these Financial Statements, includes the Company’s cash flows;
(ii) from disclosing the Company key management personnel compensation, as required by FRS 102 paragraph 33.7.
The Company’s results are included in the publicly available consolidated Financial Statements of Reckitt Benckiser Group plc and these Financial Statements may be obtained from 103-105 Bath Road, Slough, Berkshire SL1 3UH or at www.reckitt.com.
Foreign currency translationTransactions denominated in foreign currencies are translated using exchange rates prevailing at the dates of the transactions. Foreign exchange gains and losses resulting from the settlement of foreign currency transactions and from the translation at year-end exchange rates of monetary assets and liabilities denominated in foreign currencies are recognised in the Statement of Comprehensive Income.
TaxationThe tax charge/credit is based on the result for the year and takes into account taxation deferred due to timing differences between the treatment of certain items for taxation and accounting purposes. Deferred tax liabilities are provided for in full and deferred tax assets are recognised to the extent that they are considered recoverable.
A net deferred tax asset is considered recoverable if it can be regarded as more likely than not that there will be suitable taxable profits against which to recover carried forward tax losses and from which the future reversal of underlying timing differences can be deducted.
Deferred tax is recognised in respect of all timing differences that have originated but not reversed at the Balance Sheet date, where transactions or events that result in an obligation to pay more tax in the future or a right to pay less tax in the future have occurred at the Balance Sheet date.
Deferred tax is measured at the average tax rates that are expected to apply in the periods in which the timing differences are expected to reverse, based on tax rates and laws that have been enacted or substantively enacted by the Balance Sheet date. Deferred tax is measured on an undiscounted basis.
NOTES TO THE PARENT COMPANY FINANCIAL STATEMENTS
Reckitt Annual Report and Accounts 2021
Financial StatementsGovernanceStrategic Report
257
Fixed asset investmentsFixed asset investments are stated at the lower of cost or their recoverable amount, which is determined as the higher of net realisable value and value in use. A review of the potential impairment of an investment is carried out by the Directors if events or changes in circumstances indicate that the carrying value of the investment may not be recoverable. Such impairment reviews are performed in accordance with FRS 102 Section 27 ‘Impairment of assets’.
Employee share schemesIncentives in the form of shares are provided to employees under share option and restricted share schemes which vest in accordance with non-market conditions.
The fair value determined at the grant date of the equity-settled share-based payments is expensed on a straight-line basis over the vesting period, based on the Group’s estimate of equity instruments that will eventually vest. At each Balance Sheet date, the Group revises its estimate of the number of equity instruments expected to vest. The impact of the revision of the original estimates, if any, is recognised in comprehensive income or expense such that the cumulative expense reflects the revised estimate, with a corresponding adjustment to equity reserves.
Additional employer costs in respect of options and awards are charged, including social security taxes, to the Statement of Comprehensive Income over the same period, with a corresponding liability recognised.
The grant by the Company of options over its equity instruments to the employees of subsidiary undertakings in the Group is treated as a capital contribution. The fair value of employee services received, measured by reference to the grant date fair value, is recognised over the vesting period as an increase to investment in subsidiary undertakings, with a corresponding credit to equity in the Company Financial Statements.
Financial instrumentsThe Company only enters into basic financial instrument transactions that result in the recognition of basic financial assets and liabilities, including trade and other debtors and creditors and loans to and from related parties. These transactions are initially recorded at transaction price, unless the arrangement constitutes a financing transaction where the transaction is measured at the present value of the future receipt discounted at a market rate of interest, and subsequently recognised at amortised cost.
(i) Financial AssetsAt the end of each reporting period financial assets measured at amortised cost are assessed for objective evidence of impairment. If an asset is impaired the impairment loss is the difference between the carrying amount and the present value of the estimated cash flows discounted at the asset’s original effective interest rate. The impairment loss is recognised in comprehensive income or expense.
Financial assets are derecognised when (a) the contractual rights to the cash flows from the asset expire or are settled, or (b) substantially all the risks and rewards of the ownership of the asset are transferred to another party, or (c) control of the asset has been transferred to another party who has the practical ability to unilaterally sell the asset to an unrelated third party without imposing additional restrictions.
(ii) Financial LiabilitiesBasic financial liabilities, including loans from fellow Group companies, are initially recognised at transaction price, unless the arrangement constitutes a financing transaction, where the debt instrument is measured at the present value of future payments. Debt instruments are subsequently carried at amortised cost.
Financial liabilities are derecognised when the liability is extinguished, that is when the contractual obligation is discharged, cancelled or expires.
ProvisionsProvisions are recognised when the Company has a present legal or constructive obligation as a result of past events; it is more likely than not that there will be an outflow of resources to settle that obligation; and the amount can be reliably estimated. Provisions are valued at the present value of the Directors’ best estimate of the expenditure required to settle the obligation at the Balance Sheet date. Where it is possible that a settlement may be reached or it is not possible to make a reliable estimate of the estimated financial impact, appropriate disclosure is made but no provision recognised.
Where a company enters into a financial guarantee contract to guarantee the indebtedness of other companies within its Group, the Company treats the guarantee contract as a contingent liability until such a time as it becomes probable that the Company will be required to make a payment under the guarantee.
Share capital transactionsWhen the Company purchases equity share capital, the amount of the consideration paid, including directly attributable costs, is recognised as a charge to equity. Purchased shares are either held in Treasury in order to satisfy employee options, or cancelled and, in order to maintain capital, an equivalent amount to the nominal value of the shares cancelled is transferred from retained earnings.
Repurchase and reissuance of ordinary sharesWhen shares recognised as equity are repurchased, the amount of the consideration paid, including directly attributable costs, is recognised as a charge to equity. Repurchased shares are classified as Treasury shares and are presented in retained earnings. When Treasury shares are sold or reissued subsequently, the amount received is recognised as an increase in equity and the resulting surplus is presented within share premium.
DividendsDividends payable are recognised when they meet the criteria for a present obligation (i.e. when they have been approved).
Accounting estimates and judgementsIn preparing these Financial Statements, management has made judgements and estimates that affect the application of the Company’s accounting policies and the reported amounts of assets, liabilities, income and expenses. Actual amounts and results may differ from these estimates.
The estimates and underlying assumptions are reviewed on an ongoing basis. Revisions to accounting estimates are recognised in the period in which the estimate is revised if the revision affects only that period, or in the period of the revision and future periods if the revision affects both current and future periods.
1 Parent Company Accounting Policies continued

258
Key sources of estimation uncertaintyEach year, management is required to make a number of assumptions regarding the future. The related year-end accounting estimates will, by definition, seldom equal the final actual results. The Company’s Directors are of the opinion that there are no estimates and assumptions that have a significant risk of causing a material adjustment to the carrying amount of assets and liabilities within the next financial year.
Other estimatesSet out below are other estimates where there is a risk of adjustment to the carrying amounts of assets and liabilities within the next financial year, but the risk of a material adjustment is not significant.
Legal provisions:The Company recognises legal provisions in line with the Company’s provisions policy. The level of provisioning in relation to civil and/or criminal investigations is an area where management and legal judgement is important, with individual provisions being based on best estimates of the probable loss, considering all available information, external advice and historical experience. As at 31 December 2021, the Company recognised legal provisions of £41 million (2020: £43 million) in relation to a number of historical regulatory matters. Refer to Note 6 of the Company Financial Statements for further information.
Tax:Creditors due after more than one year include management judgements and estimates of the amount of tax payable on uncertain tax positions. The exposure recognised is calculated based on the expected value method and the most likely amount method. The accounting estimates and judgements considered include:
• Status of the unresolved matter;
• Clarity of relevant legislation and related guidance;
• Advice from related party specialists and unrelated third parties;
• Range of possible outcomes; and
• Statute of limitations.
The Company’s Directors are of the opinion that there are no other judgements and no further key sources of estimation uncertainty in applying the Company’s accounting policies.
2 InvestmentsShares in
subsidiary undertakings
£m
Cost
At 1 January 2020 14,963
Additions during the year 12
At 31 December 2020 14,975
Additions during the year 26
At 31 December 2021 15,001
Provision for impairment
At 1 January 2020 –
At 31 December 2021 –
Net book amounts
At 31 December 2020 14,975
At 31 December 2021 15,001
The Directors believe that the carrying value of the investments is supported by their underlying net assets.
The subsidiary undertakings as at 31 December 2021, all of which are included in the Group Financial Statements, are shown in Note 11 of the Company Financial Statements.
With the exception of Reckitt Benckiser Limited, none of the subsidiaries are directly held by Reckitt Benckiser Group plc. All subsidiaries have a financial year ending 31 December with the exception of Reckitt Benckiser (India) Private Limited, Reckitt Benckiser Healthcare India Private Limited, Reckitt Benckiser Scholl India Private Limited, Mead Johnson Nutrition (India) Private Limited, RB Hygiene Home India Private Limited, Reckitt Piramal Private Limited, and Reckitt & Colman Management Services (Ireland) Limited (in liquidation) which have a year ending 31 March; Lloyds Pharmaceuticals which has a year ending 24 August; Reigate Square Holdings Sàrl which has a year ending 31 August; Crookes Healthcare Limited which has a year ending 31 January and Reckitt Benckiser Healthcare (Ireland) Limited which has a year ending 30 November.
Additions during the year, and in 2020, relate to the grant by the Company of options over its equity instruments to the employees of subsidiary undertakings in the Group.
3 Debtors Due Within One Year2021
£m2020
£m
Amounts owed by Group undertakings 36 54
Other debtors 9 2
45 56
Amounts owed by Group undertakings are unsecured, interest free and are repayable on demand (2020: same).
4 Debtors Due After More Than One Year2021
£m2020
£m
Deferred tax assets 1 3
Other receivables 24 –
25 3
Deferred tax assets consist of short-term timing differences.
5 CreditorsCreditors due within one year:
2021 £m
2020 £m
Amounts owed to Group undertakings 10,896 9,647
Taxation and social security 1 4
Other creditors 1 1
10,898 9,652
Included in the amounts owed to Group undertakings is an amount of £10,889 million (2020: £9,548 million) which is unsecured, carries interest at the 3M LIBOR equivalent fallback rate and is repayable on demand (2020: 3M LIBOR). All other amounts owed to Group undertakings are unsecured, non-interest bearing and are repayable on demand (2020: same).
1 Parent Company Accounting Policies continued
Notes to the Parent Company Financial Statements (Continued)
Reckitt Annual Report and Accounts 2021
Financial StatementsGovernanceStrategic Report
259
Creditors due after more than one year:2021
£m2020
£m
Non-current tax liabilities 38 30
Other creditors 4 –
42 30
6 Provisions for Liabilities and ChargesLegal
provisions £m
Total provisions
£m
At 1 January 2020 99 99
Charged to the Statement of Comprehensive Income 4 4
Utilised during the year (4) (4)
Released to the Statement of Comprehensive Income (56) (56)
At 31 December 2020 43 43
Charged to the Statement of Comprehensive Income 6 6
Utilised during the year (8) (8)
At 31 December 2021 41 41
Provisions have been analysed between current and non-current as follows:
2021 £m
2020 £m
Current 39 43
Non-current 2 –
41 43
Provisions relate to legal provisions in relation to a number of historical matters. Refer to Note 18 of the Group Financial Statements.
7 Share Capital
Issued and fully paid
Equity ordinary
shares
Nominal value
£m
At 1 January 2021 736,535,179 74
At 31 December 2021 736,535,179 74
The holders of ordinary shares (par value 10 pence) are entitled to receive dividends as declared from time to time and are entitled to one vote per share at meetings of the Parent Company.
The allotment of ordinary shares and release of Treasury shares are disclosed in Note 24 of the Group Financial Statements.
8 Related Party TransactionsThere were no transactions with related parties other than wholly owned companies within the Group.
9 Contingent LiabilitiesThe Company has issued a guarantee to the trustees of the Reckitt Benckiser Pension Fund covering the obligations of certain UK subsidiaries of the Group who are the sponsoring employers of the UK defined benefit pension fund. The guarantee covers any amounts due to the pension fund from these subsidiaries if they fail to meet their pension obligations.
The Company issued a guarantee on behalf of Reckitt Benckiser Treasury Services plc in relation to the issuance of a $8,250 million bond (2020: $8,250 million) (two tranches of $2,500 million, one tranche of $2,000 million, one tranche of $750 million and one tranche of $500 million) and in relation to the issuance of a £500 million bond (2020: £500 million). Details are included in Note 15 of the Group Financial Statements.
The Company issued a guarantee on behalf of Reckitt Benckiser Treasury Services plc in relation to committed borrowing facilities totalling £4,500 million (2020: £5,500 million). Details of the facilities are included in Note 15 of the Group Financial Statements.
The Company issued a guarantee on behalf of Mead Johnson Nutrition Company in relation to outstanding senior notes of $1,550 million (2020: $1,550 million) issued by Mead Johnson Nutrition Company prior to acquisition. The senior notes consist of one tranche of $750 million, one tranche of $500 million and one tranche of $300 million.
The Company has also issued a guarantee on behalf of Reckitt Benckiser Treasury Services (Nederland) BV in relation to the issuance of two €850 million bonds (2020: two €850 million bonds). Details are included in Note 15 of the Group Financial Statements.
Other contingent liabilities are disclosed in Note 20 of the Group Financial Statements.
10 Post Balance Sheet EventsThere are no events subsequent to the balance sheet date that require disclosure.
11 Subsidiary UndertakingsIn accordance with section 409 of the Companies Act 2006 and Schedule 4 of The Large and Medium-sized Companies and Groups (Accounts and Reports) Regulations 2008, a full list of related undertakings as at 31 December 2021, including their registered office address, country of incorporation and the percentage of share ownership, is disclosed below. All undertakings are indirectly owned by Reckitt Benckiser Group plc, unless otherwise stated.
From time to time, management reviews the Group structure and seeks to remove redundant, dormant or non-trading entities. During the year ended 31 December 2021, 14 legal entities and a partnership were placed into liquidation as part of the review (2020: nine legal entities). The removal of legal entities ultimately allows management to focus on the core business, reduces compliance obligations and cost, and improves transparency of the Group to external parties.
All subsidiary undertakings of Reckitt Benckiser Group plc are included in the consolidated Financial Statements of the Group.
5 Creditors continued

260
Name Holding
Registered office and share class
103-105 Bath Road Limited 100.00% 9, 23
2309 Realty Corporation 59.00% 2, 143
Access VC Limited 100.00% 9, 23
Airwick Industrie SAS 100.00% 9, 81
Anhui Guilong Pharmaceutical Trading Company Limited 100.00% 1, 45
Apenas Boa Nutrição Indústria de Alimentos Ltda. 100.00% 9, 29
Beleggingsmaatschappij Lemore B.V. 100.00% 9, 130
Benckiser 100.00% 9, 176
Biofreeze IP Holdings, LLC 100.00% 8, 132
Blisa, LLC 100.00% 8, 73
Brand Acquisition Limited 100.00% 9, 110
Canterbury Square Holdings S.à.r.l. 100.00% 9, 120
Central Square Holding B.V. 100.00% 9, 130
Crookes Healthcare Limited* 100.00% 9, 104
Crookes Healthcare Limited 100.00% 9, 23
Cupal, Limited 100.00% 11, 23
Dakin Brothers Limited 100.00% 9, 23
Dorincourt Holdings (Ireland) Limited 100.00% 9, 104
Durex Limited 100.00% 9, 23
eRB Trading Limited 100.00% 9, 23
ERH Propack Limited* 100.00% 9, 96
Eros NewCo Limited 100.00% 9, 23
Exponential Health LLC 100.00% 9, 73
Fenla Indústria, Comércio e Administração Ltda 100.00% 9, 32
FF Homecare & Hygiene Limited 64.29% 11, 186
Gainbridge Investments (Cyprus) Limited 100.00% 9, 70
Glasgow Square Limited 100.00% 9, 23
Green, Young & Company Limited 100.00% 9, 23
Grosvenor Square Holding B.V. 100.00% 9, 130
Guilong Health Technology (Anhui) Co., Limited 100.00% 1, 45
Guilong Pharmaceutical (Anhui) Co. Ltd – Xiamen branch† 100.00% 1, 47
Guilong Pharmaceutical (Anhui) Company Limited 100.00% 1, 46
Hamol Limited 100.00% 9, 23
Hamol NL B.V. 100.00% 9, 130
Helpcentral Limited 100.00% 9, 23
Howard Lloyd & Company, Limited 100.00% 9, 23
Kukident GmbH 100.00% 4, 83
Lanai Holdings 1.5, Inc. 100.00% 9, 73
Lanzhou Keshi Xixili Healthcare Technologies Co. Ltd 80.00% 13, 199
LI Pensions Trust Limited 100.00% 9, 23
Notes to the Parent Company Financial Statements (Continued)
Name Holding
Registered office and share class
Linden Germany A Limited 100.00% 9, 23
Linden Germany B Limited 100.00% 9, 23
Lloyds Pharmaceuticals 100.00% 9, 23
London International Group Limited 100.00% 9, 23
London International Trading Asia Limited 100.00% 9, 88
LRC North America Inc. 100.00% 5, 73
LRC Products Limited 100.00% 9, 23
LRC Secretarial Services Limited 100.00% 9, 23
Maddison Square Holding B.V. 100.00% 9, 130
Manufactura MJN, S. de R.L. de C.V. 100.00% 9, 125
Mead Johnson & Company LLC 100.00% 8, 73
Mead Johnson do Brasil Comércio e Importação de Produtos de Nutrição Ltda. 100.00% 9, 33
Mead Johnson do Brasil Comércio e Importação de Produtos de Nutrição Ltda. – Itajaí Branch† 100.00% 1, 31
Mead Johnson Nutricionales de México, S. de R.L. de C.V. 100.00% 9, 126
Mead Johnson Nutrition (Asia Pacific) Pte. Ltd. 100.00% 9, 156
Mead Johnson Nutrition (Australia) Pty Ltd 100.00% 9, 20
Mead Johnson Nutrition (Canada) Co. 100.00% 4, 40
Mead Johnson Nutrition (Dominicana), S.A. 100.00% 4, 73
Mead Johnson Nutrition (Dominicana), S.A.† 100.00% 1, 190
Mead Johnson Nutrition (India) Private Limited 100.00% 9, 94
Mead Johnson Nutrition (Malaysia) Sdn Bhd 100.00% 9, 122
Mead Johnson Nutrition (Panama), S. de R.L. 100.00% 9, 140
Mead Johnson Nutrition (Philippines), Inc. 99.99% 9, 143
Mead Johnson Nutrition (Poland) Sp. z o.o 100.00% 14, 145
Mead Johnson Nutrition (Puerto Rico) Inc. 100.00% 9, 73
Mead Johnson Nutrition (Puerto Rico) Inc.† 100.00% 1, 150
Mead Johnson Nutrition (Singapore) Pte. Ltd. 100.00% 9, 156
Mead Johnson Nutrition (Thailand) Ltd. 100.00% 4, 169
Mead Johnson Nutrition (UK) Ltd* 100.00% 9, 177
Mead Johnson Nutrition (Venezuela) LLC 100.00% 8, 73
Mead Johnson Nutrition (Vietnam) Company Limited 100.00% 1, 189
Mead Johnson Nutrition Colombia Ltda 100.00% 9, 65
Mead Johnson Nutrition Company 100.00% 9, 73
Mead Johnson Nutrition Holdings (Singapore) Pte. Ltd. 100.00% 9, 156
Mead Johnson Nutrition Nominees LLC 100.00% 8, 73
Mead Johnson Nutrition Trading Poland Sp. z o.o 100.00% 14, 145
Mead Johnson Nutrition Venezuela, S.C.A. 100.00% 7, 187
Mead Johnson One C.V.^ 100.00% 8, 192
Mead Johnson Two C.V.^ 100.00% 8, 192
11 Subsidiary Undertakings continued
Reckitt Annual Report and Accounts 2021
Financial StatementsGovernanceStrategic Report
261
Name Holding
Registered office and share class
Medcom Marketing And Prodazha Ukraine LLC 100.00% 1, 89
MJ UK Holdings Limited 100.00% 9, 23
MJ USA Holdings LLC 100.00% 8, 73
MJN Asia Pacific Holdings LLC 100.00% 8, 73
MJN Global Holdings B.V. 100.00% 9, 130
MJN Holdings (Netherlands) B.V. 100.00% 9, 130
MJN Innovation Services B.V. 100.00% 9, 130
MJN International Holdings (UK), Ltd. 100.00% 9, 23
MJN U.S. Holdings LLC 100.00% 8, 73
New Bridge Holdings B.V. 100.00% 9, 130
Norwich Square Holding S.L.U. 100.00% 9, 161
Nurofen Limited 100.00% 9, 23
Optrex Limited 100.00% 9, 23
Oriental Medicine Company Limited 100.00% 9, 88
Oxy Reckitt Benckiser LLC 100.00% 1, 160
Performance Health, LLC 100.00% 8, 73
Pharmalab Limited 100.00% 9, 23
Propack Produkte für Haushalt und Körperpflege GmbH 100.00% 9, 84
PT Mead Johnson Indonesia 90.10% 9, 99
PT Reckitt Benckiser Hygiene Home Indonesia 100.00% 9, 100
PT Reckitt Benckiser Hygiene Home Trading Indonesia 100.00% 9, 100
Pt Reckitt Benckiser Indonesia 100.00% 9, 101
PT Reckitt Benckiser Trading Indonesia 100.00% 9, 102
Qingdao London Durex Co., Limited 100.00% 9, 48
Qingdao New Bridge Corporate Management Consulting Company Limited 100.00% 9, 48
R & C Nominees Limited 100.00% 9, 23
R & C Nominees One Limited 100.00% 9, 23
R & C Nominees Two Limited 100.00% 9, 23
RB & Manon Business Co., Limited 75.00% 1, 49
RB & Manon Business Limited 75.00% 9, 90
RB & Manon Hygiene Home (Shanghai) Limited* 100.00% 9, 50
RB & Manon Hygiene Home Limited 80.00% 9, 90
RB (China Trading) Limited 80.00% 2, 9, 23
RB (China) Holding Co. Limited 100.00% 1, 51
RB (Health) Colombia S.A.S 100.00% 9, 66
RB (Health) Malaysia Sdn Bhd 100.00% 9, 123
RB (Hygiene Home) Australia Pty Limited 100.00% 9, 21
RB (Hygiene Home) Czech Republic, spol s.r.o 100.00% 9, 71
RB (Hygiene Home) HK Limited 90.10% 2, 15, 38
RB (Hygiene Home) Hungary Kft 100.00% 9, 92
Name Holding
Registered office and share class
RB (Hygiene Home) New Zealand Limited 100.00% 9, 134
RB (Hygiene Home) Poland Sp. z o.o 100.00% 9, 146
RB (Hygiene Home) Romania S.R.L. 100.00% 14, 151
RB (Hygiene Home) Slovakia spol. s.r.o 100.00% 9, 158
RB (Suzhou) Co. Ltd 100.00% 1, 64
RB Asia Holding Limited 100.00% 9, 23
RB Health (Canada) Inc. 100.00% 4, 41
RB Health (US) LLC 100.00% 8, 185
RB Health Ecuador Cía. Ltda 100.00% 9, 74
RB Health Manufacturing (US) LLC 100.00% 8, 185
RB Health México, S.A de C.V. 100.00% 2, 126
RB Health Nordic A/S 100.00% 9, 72
RB Health Nordic A/S sivuliike Suomessa† 100.00% 1, 79
RB Health Nordic A/S, filial† 100.00% 1, 165
RB Health Nordic, NUF† 100.00% 1, 137
RB Health Peru S.R.L. 100.00% 9, 141
RB Health Services, S.A de C.V. 100.00% 9, 126
RB Holding Europe Du Sud SAS 100.00% 9, 81
RB Holdings (Luxembourg) S.à.r.l. 100.00% 12, 120
RB Holdings (Nottingham) Limited 100.00% 9, 23
RB Holdings Luxembourg (2018) S.à.r.l. 100.00% 9, 120
RB Hygiene Home (Thailand) Limited 100.00% 9, 170
RB Hygiene Home Arabia FZE 100.00% 9, 179
RB Hygiene Home Austria GmbH 100.00% 9, 22
RB Hygiene Home Belgium SA/NV 100.00% 9, 27
RB Hygiene Home Deutschland GmbH 100.00% 1, 85
RB Hygiene Home France SAS 100.00% 9, 81
RB Hygiene Home India Private Limited 100.00% 9, 95
RB Hygiene Home Netherlands B.V. 100.00% 9, 130
RB Hygiene Home Nordic A/S 100.00% 9, 72
RB Hygiene Home Nordic A/S, filial† 100.00% 1, 165
RB Hygiene Home Nordic A/S, sivuliike Suomessa† 100.00% 1, 80
RB Hygiene Home Nordic NUF† 100.00% 1, 137
RB Hygiene Home Pakistan Limited 98.67% 9, 139
RB Hygiene Home Switzerland AG 100.00% 9, 167
RB Investment Co Limited 0.05% 9, 182
RB Ireland Hygiene Home Commercial Limited 100.00% 9, 105
RB LATAM Holding B.V. 100.00% 9, 130
RB Luxembourg (2016) Limited 100.00% 9, 23
RB Luxembourg (TFFC) S.à.rl. 100.00% 9, 120
RB Luxembourg Holdings (TFFC) Limited 100.00% 9, 23
11 Subsidiary Undertakings continued
262
Name Holding
Registered office and share class
RB Luxembourg Holdings (TFFC) Limited† 100.00% 1, 120
RB Manufacturing LLC 100.00% 8, 73
RB Mexico Investments Limited 100.00% 9, 23
RB NL Brands B.V. 100.00% 9, 130
RB Reigate (2019) Ltd 100.00% 9, 23
RB Reigate (Ireland) Unlimited Company* 100.00% 2, 104
RB Reigate (UK) Limited 100.00% 9, 23
RB Salute Mexico S.A de C.V. 100.00% 9, 127
RB Square Holdings Spain S.L. 100.00% 2, 161
RB UK Commercial Limited 100.00% 9, 23
RB UK Hygiene Home Commercial Limited 100.00% 9, 23
RB USA (2019) Ltd 100.00% 9, 23
RB USA Holdings LLC 100.00% 8, 73
RB Winchester (Ireland) Unlimited Company* 100.00% 9, 104
RBHCR Health Reckitt Costa Rica Sociedad Anónima 100.00% 4, 67
Reckitt & Colman (Jersey) Limited 100.00% 9, 111
Reckitt & Colman (Overseas) Health Limited 100.00% 9, 23
Reckitt & Colman (Overseas) Hygiene Home Limited 100.00% 9, 23
Reckitt & Colman (Overseas) Limited 100.00% 9, 23
Reckitt & Colman (UK) Limited 100.00% 11, 23
Reckitt & Colman Capital Finance Limited 100.00% 12, 111
Reckitt & Colman (Guangzhou) Limited 100.00% 9, 52
Reckitt & Colman Holdings Limited 100.00% 9, 23
Reckitt & Colman Management Services (Ireland) Limited* 100.00% 9, 104
Reckitt & Colman Pension Trustee Limited 100.00% 9, 23
Reckitt & Colman Sagrotan Verwaltungsgesellschaft GmbH 100.00% 4, 85
Reckitt & Sons Limited 100.00% 9, 23
Reckitt Benckiser (Australia) Pty Limited 100.00% 11, 21
Reckitt Benckiser (Bangladesh) PLC 82.96% 9, 25
Reckitt Benckiser (Belgium) SA/NV 100.00% 9, 27
Reckitt Benckiser (Brands) Limited 100.00% 9, 23
Reckitt Benckiser (Brasil) Comercial de Produtos de Hygiene, Limpeza e Cosméticos Ltda. 100.00% 9, 34
Reckitt Benckiser (Brasil) Comercial de Produtos de Hygiene, Limpeza e Cosméticos Ltda.† 100.00% 1, 194
Reckitt Benckiser (Brasil) Comercial de Produtos de Hygiene, Limpeza e Cosméticos Ltda.† 100.00% 1, 196
Reckitt Benckiser (Brasil) Comercial de Produtos de Hygiene, Limpeza e Cosméticos Ltda.† 100.00% 1, 197
Reckitt Benckiser (Brasil) Ltda 100.00% 9, 35
Reckitt Benckiser (Brasil) Ltda† 100.00% 1, 199
Reckitt Benckiser (BVI) No. 1 Limited* 100.00% 9, 37
Name Holding
Registered office and share class
Reckitt Benckiser (BVI) No. 2 Limited* 100.00% 9, 37
Reckitt Benckiser (BVI) No. 3 Limited* 100.00% 9, 37
Reckitt Benckiser (Canada) Inc. 100.00% 4, 42
Reckitt Benckiser (Cayman Islands) Limited 100.00% 9, 43
Reckitt Benckiser (Centroamérica) S.A. 100.00% 9, 67
Reckitt Benckiser (Channel Islands) Limited* 100.00% 9, 87
Reckitt Benckiser (Czech Republic), spol. s r.o. 100.00% 14, 71
Reckitt Benckiser (ENA) B.V. 100.00% 9, 133
Reckitt Benckiser (Granollers) SL 100.00% 9, 161
Reckitt Benckiser (Grosvenor) Holdings Limited 100.00% 9, 23
Reckitt Benckiser (Health) Holdings Limited 100.00% 9, 23
Reckitt Benckiser (Hygiene Home) Holdings Limited 100.00% 9, 23
Reckitt Benckiser (India) Private Limited 100.00% 9, 95
Reckitt Benckiser (Lanka) Limited 99.99% 9, 164
Reckitt Benckiser (Latvia) SIA 100.00% 9, 118
Reckitt Benckiser (Latvia) SIA Eesti filial† 100.00% 1, 78
Reckitt Benckiser (Latvia) SIA LT filialas† 100.00% 1, 119
Reckitt Benckiser (Malaysia) Sdn Bhd 100.00% 9, 124
Reckitt Benckiser (Near East) Limited 100.00% 9, 106
Reckitt Benckiser (New Zealand) Limited 100.00% 9, 135
Reckitt Benckiser (Pars) PJSC 100.00% 9, 103
Reckitt Benckiser (Poland) S.A. 100.00% 9, 147
Reckitt Benckiser (Portugal) S.A. 100.00% 9, 148
Reckitt Benckiser (Romania) S.R.L. 100.00% 13, 151
Reckitt Benckiser (RUMEA) Limited 100.00% 9, 23
Reckitt Benckiser (RUMEA) Limited – Dubai Branch† 100.00% 1, 180
Reckitt Benckiser (Singapore) Pte. Limited 100.00% 9, 157
Reckitt Benckiser (Slovak Republic), spol. s r.o. 100.00% 13, 158
Reckitt Benckiser (South America) Holding B.V. 100.00% 9, 130
Reckitt Benckiser (Spain) B.V. 100.00% 9, 130
Reckitt Benckiser (Switzerland) AG 100.00% 9, 167
Reckitt Benckiser (Thailand) Limited 45.00% 9, 171
Reckitt Benckiser (UK) Limited 100.00% 9, 23
Reckitt Benckiser (USA) Limited 100.00% 9, 23
Reckitt Benckiser AG 100.00% 9, 167
Reckitt Benckiser Arabia FZE 100.00% 9, 179
Reckitt Benckiser Arabia FZE† 100.00% 1, 181
Reckitt Benckiser Arabia Trading LLC 48.70% 9, 183
Reckitt Benckiser Argentina S.A. 100.00% 9, 18
Reckitt Benckiser Asia Pacific Limited† 100.00% 1, 23
Reckitt Benckiser Asia Pacific Limited 100.00% 9, 109
Notes to the Parent Company Financial Statements (Continued)
11 Subsidiary Undertakings continued
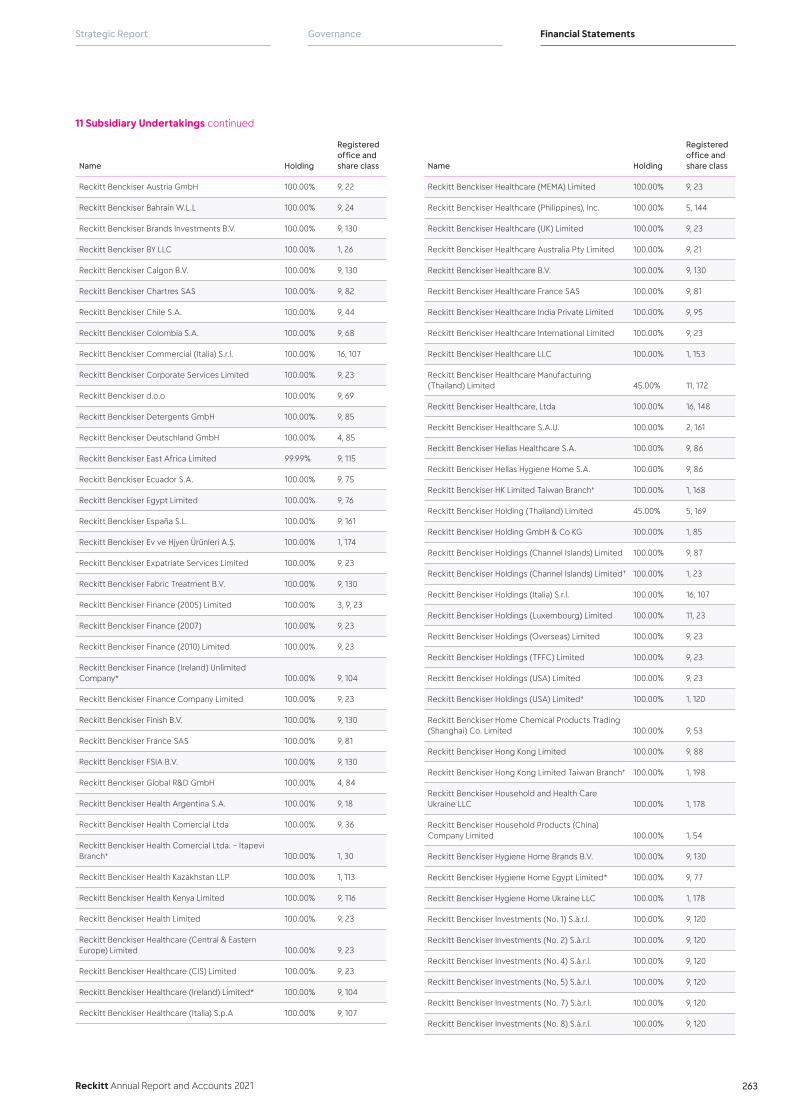
Reckitt Annual Report and Accounts 2021
Financial StatementsGovernanceStrategic Report
263
Name Holding
Registered office and share class
Reckitt Benckiser Austria GmbH 100.00% 9, 22
Reckitt Benckiser Bahrain W.L.L 100.00% 9, 24
Reckitt Benckiser Brands Investments B.V. 100.00% 9, 130
Reckitt Benckiser BY LLC 100.00% 1, 26
Reckitt Benckiser Calgon B.V. 100.00% 9, 130
Reckitt Benckiser Chartres SAS 100.00% 9, 82
Reckitt Benckiser Chile S.A. 100.00% 9, 44
Reckitt Benckiser Colombia S.A. 100.00% 9, 68
Reckitt Benckiser Commercial (Italia) S.r.l. 100.00% 16, 107
Reckitt Benckiser Corporate Services Limited 100.00% 9, 23
Reckitt Benckiser d.o.o 100.00% 9, 69
Reckitt Benckiser Detergents GmbH 100.00% 9, 85
Reckitt Benckiser Deutschland GmbH 100.00% 4, 85
Reckitt Benckiser East Africa Limited 99.99% 9, 115
Reckitt Benckiser Ecuador S.A. 100.00% 9, 75
Reckitt Benckiser Egypt Limited 100.00% 9, 76
Reckitt Benckiser España S.L. 100.00% 9, 161
Reckitt Benckiser Ev ve Hjyen Ürünleri A.Ş. 100.00% 1, 174
Reckitt Benckiser Expatriate Services Limited 100.00% 9, 23
Reckitt Benckiser Fabric Treatment B.V. 100.00% 9, 130
Reckitt Benckiser Finance (2005) Limited 100.00% 3, 9, 23
Reckitt Benckiser Finance (2007) 100.00% 9, 23
Reckitt Benckiser Finance (2010) Limited 100.00% 9, 23
Reckitt Benckiser Finance (Ireland) Unlimited Company* 100.00% 9, 104
Reckitt Benckiser Finance Company Limited 100.00% 9, 23
Reckitt Benckiser Finish B.V. 100.00% 9, 130
Reckitt Benckiser France SAS 100.00% 9, 81
Reckitt Benckiser FSIA B.V. 100.00% 9, 130
Reckitt Benckiser Global R&D GmbH 100.00% 4, 84
Reckitt Benckiser Health Argentina S.A. 100.00% 9, 18
Reckitt Benckiser Health Comercial Ltda 100.00% 9, 36
Reckitt Benckiser Health Comercial Ltda. – Itapevi Branch† 100.00% 1, 30
Reckitt Benckiser Health Kazakhstan LLP 100.00% 1, 113
Reckitt Benckiser Health Kenya Limited 100.00% 9, 116
Reckitt Benckiser Health Limited 100.00% 9, 23
Reckitt Benckiser Healthcare (Central & Eastern Europe) Limited 100.00% 9, 23
Reckitt Benckiser Healthcare (CIS) Limited 100.00% 9, 23
Reckitt Benckiser Healthcare (Ireland) Limited* 100.00% 9, 104
Reckitt Benckiser Healthcare (Italia) S.p.A 100.00% 9, 107
Name Holding
Registered office and share class
Reckitt Benckiser Healthcare (MEMA) Limited 100.00% 9, 23
Reckitt Benckiser Healthcare (Philippines), Inc. 100.00% 5, 144
Reckitt Benckiser Healthcare (UK) Limited 100.00% 9, 23
Reckitt Benckiser Healthcare Australia Pty Limited 100.00% 9, 21
Reckitt Benckiser Healthcare B.V. 100.00% 9, 130
Reckitt Benckiser Healthcare France SAS 100.00% 9, 81
Reckitt Benckiser Healthcare India Private Limited 100.00% 9, 95
Reckitt Benckiser Healthcare International Limited 100.00% 9, 23
Reckitt Benckiser Healthcare LLC 100.00% 1, 153
Reckitt Benckiser Healthcare Manufacturing (Thailand) Limited 45.00% 11, 172
Reckitt Benckiser Healthcare, Ltda 100.00% 16, 148
Reckitt Benckiser Healthcare S.A.U. 100.00% 2, 161
Reckitt Benckiser Hellas Healthcare S.A. 100.00% 9, 86
Reckitt Benckiser Hellas Hygiene Home S.A. 100.00% 9, 86
Reckitt Benckiser HK Limited Taiwan Branch† 100.00% 1, 168
Reckitt Benckiser Holding (Thailand) Limited 45.00% 5, 169
Reckitt Benckiser Holding GmbH & Co KG 100.00% 1, 85
Reckitt Benckiser Holdings (Channel Islands) Limited 100.00% 9, 87
Reckitt Benckiser Holdings (Channel Islands) Limited† 100.00% 1, 23
Reckitt Benckiser Holdings (Italia) S.r.l. 100.00% 16, 107
Reckitt Benckiser Holdings (Luxembourg) Limited 100.00% 11, 23
Reckitt Benckiser Holdings (Overseas) Limited 100.00% 9, 23
Reckitt Benckiser Holdings (TFFC) Limited 100.00% 9, 23
Reckitt Benckiser Holdings (USA) Limited 100.00% 9, 23
Reckitt Benckiser Holdings (USA) Limited† 100.00% 1, 120
Reckitt Benckiser Home Chemical Products Trading (Shanghai) Co. Limited 100.00% 9, 53
Reckitt Benckiser Hong Kong Limited 100.00% 9, 88
Reckitt Benckiser Hong Kong Limited Taiwan Branch† 100.00% 1, 198
Reckitt Benckiser Household and Health Care Ukraine LLC 100.00% 1, 178
Reckitt Benckiser Household Products (China) Company Limited 100.00% 1, 54
Reckitt Benckiser Hygiene Home Brands B.V. 100.00% 9, 130
Reckitt Benckiser Hygiene Home Egypt Limited* 100.00% 9, 77
Reckitt Benckiser Hygiene Home Ukraine LLC 100.00% 1, 178
Reckitt Benckiser Investments (No. 1) S.à.r.l. 100.00% 9, 120
Reckitt Benckiser Investments (No. 2) S.à.r.l. 100.00% 9, 120
Reckitt Benckiser Investments (No. 4) S.à.r.l. 100.00% 9, 120
Reckitt Benckiser Investments (No. 5) S.à.r.l. 100.00% 9, 120
Reckitt Benckiser Investments (No. 7) S.à.r.l. 100.00% 9, 120
Reckitt Benckiser Investments (No. 8) S.à.r.l. 100.00% 9, 120
11 Subsidiary Undertakings continued

264
Name Holding
Registered office and share class
Reckitt Benckiser Investments Limited 100.00% 3, 9, 23
Reckitt Benckiser IP LLC 100.00% 1, 154
Reckitt Benckiser Ireland Limited 100.00% 9, 104
Reckitt Benckiser Italia S.p.A 100.00% 9, 107
Reckitt Benckiser Japan Limited 100.00% 9, 109
Reckitt Benckiser Jersey (No.1) Limited* 100.00% 9, 111
Reckitt Benckiser Jersey (No.1) Limited†* 100.00% 1, 23
Reckitt Benckiser Jersey (No.2) Limited* 100.00% 9, 111
Reckitt Benckiser Jersey (No.2) Limited†* 100.00% 1, 23
Reckitt Benckiser Jersey (No.3) Limited 100.00% 9, 111
Reckitt Benckiser Jersey (No.3) Limited† 100.00% 1, 23
Reckitt Benckiser Jersey (No.5) Limited 100.00% 9, 111
Reckitt Benckiser Jersey (No.5) Limited† 100.00% 1, 23
Reckitt Benckiser Jersey (No.7) Limited 100.00% 12, 111
Reckitt Benckiser Kazakhstan LLP 100.00% 1, 114
Reckitt Benckiser Kereskedelmi Kft 100.00% 14, 92
Reckitt Benckiser Laundry Detergents (No. 1) B.V. 100.00% 9, 130
Reckitt Benckiser Laundry Detergents (No. 2) B.V. 100.00% 9, 130
Reckitt Benckiser Lime-A-Way B.V. 100.00% 9, 130
Reckitt Benckiser Limited˚ 100.00% 9, 23
Reckitt Benckiser LLC 100.00% 8, 155
Reckitt Benckiser LLC 100.00% 8, 73
Reckitt Benckiser LLC in city Klin, Moscow region, Russia† 100.00% 8, 89
Reckitt Benckiser Luxembourg (2010) Limited 100.00% 9, 23
Reckitt Benckiser Luxembourg (No. 1) Limited 100.00% 9, 23
Reckitt Benckiser Luxembourg (No. 2) Limited 100.00% 9, 23
Reckitt Benckiser Luxembourg (No. 3) Limited 100.00% 9, 23
Reckitt Benckiser Luxembourg (No. 4) Limited 100.00% 9, 23
Reckitt Benckiser Management Services Unlimited Company 100.00% 3, 104
Reckitt Benckiser Marc B.V. 100.00% 9, 130
Reckitt Benckiser Mexico, S.A. de C.V. 100.00% 9, 126
Reckitt Benckiser Morocco Sarl AU 100.00% 9, 129
Reckitt Benckiser N.V. 100.00% 9, 130
Reckitt Benckiser N.V.† 100.00% 1, 120
Reckitt Benckiser Nigeria Limited 99.53% 9, 138
Reckitt Benckiser Oven Cleaners B.V. 100.00% 9, 130
Reckitt Benckiser Pakistan Limited 98.68% 9, 139
Reckitt Benckiser Peru S.A. 100.00% 9, 142
Reckitt Benckiser Pharmaceuticals (Proprietary) Limited 100.00% 9, 159
Name Holding
Registered office and share class
Reckitt Benckiser Porto Alto Lda 100.00% 16, 149
Reckitt Benckiser Power Cleaners B.V. 100.00% 9, 130
Reckitt Benckiser Production (Poland) Sp. z.o.o. 100.00% 9, 147
Reckitt Benckiser S.à.r.l. 100.00% 12, 120
Reckitt Benckiser Scholl India Private Limited 100.00% 9, 97
Reckitt Benckiser Service Bureau Limited 100.00% 9, 23
Reckitt Benckiser Services S.A. de C.V. 100.00% 9, 128
Reckitt Benckiser Services (Kenya) Limited 100.00% 9, 117
Reckitt Benckiser South Africa Health Holdings (Pty) Limited 100.00% 9, 159
Reckitt Benckiser South Africa (Proprietary) Limited 100.00% 9, 159
Reckitt Benckiser Tatabanya Kft 100.00% 9, 92
Reckitt Benckiser Temizlik Malzemesi San. ve Tic. A.Ş. 100.00% 1, 175
Reckitt Benckiser Tiret B.V. 100.00% 9, 130
Reckitt Benckiser Treasury (2007) Limited 100.00% 11, 23
Reckitt Benckiser Treasury Services (Nederland) B.V. 100.00% 9, 133
Reckitt Benckiser Treasury Services plc 100.00% 9, 23
Reckitt Benckiser USA (2010) LLC 100.00% 8, 73
Reckitt Benckiser USA (2010) LLC† 100.00% 1, 23
Reckitt Benckiser USA (2012) LLC 100.00% 8, 73
Reckitt Benckiser USA (2013) LLC 100.00% 8, 73
Reckitt Benckiser USA (2013) LLC† 100.00% 1, 23
Reckitt Benckiser USA Finance (No.1) Limited 100.00% 9, 23
Reckitt Benckiser USA Finance (No.2) Limited 100.00% 9, 23
Reckitt Benckiser USA Finance (No.3) Limited 100.00% 9, 23
Reckitt Benckiser Vanish B.V. 100.00% 9, 130
Reckitt Benckiser Venezuela S.A. 100.00% 9, 188
Reckitt Colman Chiswick (OTC) Limited 100.00% 9, 23
Reckitt Piramal Private Limited 100.00% 9, 98
Reckitt Sanabil for Trading Co LLC 51.00% 13, 193
Reckitt Seton Limited 100.00% 11, 23
Reckitt Sonet (UK) Limited 100.00% 9, 23
Reigate Square Holdings S.à.r.l. 100.00% 9, 120
Relcamp Aie* 100.00% 9, 162
Scholl Latin America Limited*^ 100.00% 9, 191
Servicios Nutricionales Mead Johnson, S. de R.L. de C.V. 100.00% 9, 126
Scholl Consumer Produdts Limited 100.00% 9, 23
Sonet Investments Limited 100.00% 9, 23
Sonet Overseas Investments Limited 100.00% 3, 9, 23
Sonet Prebbles Limited 100.00% 9, 23
Sonet Products Limited 100.00% 9, 23
Notes to the Parent Company Financial Statements (Continued)
11 Subsidiary Undertakings continued

Reckitt Annual Report and Accounts 2021
Financial StatementsGovernanceStrategic Report
265
Name Holding
Registered office and share class
Sonet Seton UK Limited 100.00% 9, 23
Sphinx Holdings Company, Inc. 38.00% 5, 143
SSL (MG) Polymers Limited 100.00% 9, 23
SSL (RB) Products Limited 100.00% 9, 23
SSL Australia Pty Ltd 100.00% 6, 21
SSL Capital Ltd 100.00% 9, 112
SSL Healthcare (Shanghai) Ltd 100.00% 9, 55
SSL Healthcare Ireland Limited* 100.00% 9, 104
SSL Healthcare Manufacturing S.A.U.* 100.00% 9, 163
SSL Healthcare Sverige AB 100.00% 9, 166
SSL Holdings (USA) Inc. 100.00% 9, 73
SSL International plc 100.00% 9, 23
SSL Manufacturing (Thailand) Limited 45.00% 12, 173
SSL New Zealand Limited 100.00% 1, 135
SSL Products Limited 100.00% 3, 9, 23
Suffolk Finance Company Limited 100.00% 10, 23
Suffolk Insurance Limited 100.00% 4, 28
Tai He Tai Lai Culture Communication Co Ltd 100.00% 9, 56
TheraPearl LLC 100.00% 8, 184
Tubifoam Limited 100.00% 3, 9, 23
UpSpring LLC 100.00% 8, 93
W.Woodward, Limited 100.00% 9, 23
† Branch
* In liquidation
˚ Interest held directly by Reckitt Benckiser Group plc
^ Country of incorporation different to registered address
Footnotes for Note 11Share Class
1 Capital Contribution/Charter Capital
2 A/B/C/D/E/F/G/H/I/K/J
3 Bonus
4 Common
5 Common/Preference
6 Cumulative Redeemable Preference/Ordinary
7 General Partner
8 Membership
9 Ordinary
10 Ordinary/Deferred
11 Ordinary/Preference
12 Ordinary A/B/C/D/E/F/G/H/I/K/J
13 Partnership
14 Partnership/Membership Interest
15 Preference
16 Quota
Registered Offices
17 Teniente General Richieri 15, Ciudad de Sunchales, Santa Fe, Argentina
18 Bucarelli 2609 PB A, Ciudad Autonoma de Buenos Aires, Argentina
19 Av Hipólito Alferez Bouchard, 4191 3°, Argentina
20 King & Wood Mallesons, ‘Governor Phillip Tower’ Level 61, 1 Farrer Place, Sydney NSW 2000, Australia
21 Level 47, 680 George Street, Sydney NSW 2000, Australia
22 Guglgasse 15, Vienna, 1110, Austria
23 103-105 Bath Road, Slough, SL1 3UH, Berkshire, United Kingdom
24 Building 330, Road 1506, Block 115, Bahrain International Investment Park, Hidd. Kingdom of Bahrain, Bahrain
25 58-59 Nasirabad Industrial Area, Chittagong 4209, Bangladesh
26 Of. 166, 66, K Liebknekhta st., Minsk, 220036, Belarus
27 20 Allée de la Recherche, Anderlecht, 1070 Brussels, Belgium
28 Clarendon House, 2 Church Street, Hamilton HM 11, Bermuda
29 Estrada Fukutaro Yida, n. 930, Bairro Cooperativa, Sao Bernardo Do Campo, Sao Paulo, 09852-060, Brazil
30 Av. Portugal, nº 1.100, Setor Rua 6 Parte A12, Bairro Itaqui, Itapevi, São Paulo, 06696-060, Brazil
31 Rodovia Antonio Heil, SC 486, Km 4, Bairro Itaipava, Armazém 1B, Itajaí, São Paolo, CEP 88316-003, Brazil
32 Rodovia Raposo Tavares, 8015 Km 18, 1º andar, Sala 2, Jardim Arpoador, Sao Paolo, CEP 05577-900, Brazil
33 Avenida Presidente Juscelino Kubitschek, n° 1909, 24° andar, Parte B, Torre Norte, Condomínio São Paulo Corporate Towers, Vila Nova Conceição, Sao Paolo – SP, CEP 04.543-907, Brazil
34 Avenida Presidente Juscelino Kubitschek, 1909 cj 24 e 25, Vila Nova Conceição, São Paolo/SP, Brazil
35 Rodovia Raposo Tavares, 8015 km 18, Jardim Arpoador, Sao Paolo, CEP 05577-900, Brazil
36 Avenida Presidente Juscelino Kubitschek, n° 1909, 24° andar, Parte C, Torre Norte, Condomínio São Paulo Corporate Towers, Vila Nova Conceição, Sao Paolo, CEP 04.543-907, Brazil
37 Palm Grove House, PO Box 438, Road Town, Tortola, British Virgin Islands
38 22/F W Square, 314-324 Hennessy Road, Wanchai, Hong Kong
39 Sofia City – 1407, Lozenets Region, 22, Zlaten rog Str, 3rd Floor, Office 4, Bulgaria
40 Suite 600, 1741 Lower Water Street, Halifax, NS B3J 0J2, Canada
41 Suite 2300, 550 Burard Street, Vancouver, BC V6C 2B5, Canada
42 1680 Tech Avenue, Unit 2, Mississauga, ON L4W 5S9, Canada
43 PO Box 309, Ugland House, Grand Cayman, KY1-1104, Cayman Islands
44 Avenida Presidente Kennedy, Lateral 5454, Oficina 1602, Vitacura, Región Metropolitana, Chile
45 Intersection of Hongqi Road and Mingzhu Road, Dangtu Economic Development Zone, Maanshan City, Anhui Province, China
46 Intersection of Hongqi Road and Mingzhu Road, Dangtu Economic Development Zone, Maanshan City, Anhui Province, China
47 Unit 02, 11/F, Tower A Hedonic Center, 6 Songyue Road, Siming District, Xiamen, China
48 No.1-13 Shangma, Aodong Road, High-tech Industrial Development Zone, Qingdao City, Shandong Province, China
49 Room 1701, No. 1033, Zhao Jia Bang Road, Zuhui District, Shanghai, China
50 16/F, Xu Jia Hui International Plaza, No.1033 Zhao Jia Bang Road, Shanghai, China
51 Unit B01, Room 401, Tower 2, Parkview Green Fang Cao Di, No.9 Dongdaqiao Road, Chaoyang District, Beijing, China
52 No. 3, Canglian 1 Road, ETDZ, Guangzhou, China
53 C6-8 Site 6F, No.333 Futexi Road, Waigaoqiao Free Trade Zone, Shanghai City, China
54 No. 34 East Beijing Road, Jingzhou, Hubei, 434001, China
11 Subsidiary Undertakings continued

266
55 Room 1605, No.660, Shangcheng Road, Shanghai, China
56 Room 2109, Floor 2, No.10 Chaoyangmenwai Street, Chaoyang District, Beijing City, China
57 Unit B02-B04, Room 401, Unit 2, Building 9, Dongdaqiao Road, Chaoyang District, Beijing, China
58 Room 2202, Yanheng Land Plaza, No.1, Section 2, Renmin South Road, Jinjiang District, Chengdu, Sichuan Province, China
59 Room 11-13, 8/F, Global Plaza, 158 Wusi Road, Fuzhou City, Gulou District, China
60 707, Hisense Venture Center, 17 Shandong Road, Shinan District, Qingdao, Shandong Province, China
61 15/F, 755 Huaihai Middle Road, Huangpu District, Shanghai, China
62 Rooms 1408 and 1409, 14/F, Gaoxin No.9 Office Building, Gaoxin 4th Road, Hi Tech Zone, Xi’an City, Shanxi Province, China
63 #2, Xiayuan Road, Dongji Industry Zone of Economic and Technology District, Guangzhou, Guangdong, China
64 No. 99, Changjiang Da Road, Fuqiao Town, Taicang City, China
65 Calle 76, No. 11-17, Edificio Torre, Los Nogales Piso 2, Bogota, CO, Colombia
66 Calle 76 No 11-17, Oficina 301, Bogota, CO, Colombia
67 San Jose-Escazu En Escazu Corporate Center, Setimo Piso, Costado Sur De Multiplaza Escazu, Costa Rica
68 Calle 46, 5-76, Cali, Colombia
69 Ulica Grada Vukovara 269d, 10 000 Zagreb, Hrvatska, Croatia
70 1 Lampousas Street, P.C. 1095, Nicosia, Cyprus
71 Vinohradská 2828/151, 130 00 Praha 3-Žižkov, Czech Republic
72 Vandtårnsvej 83A, DK-2860 Søborg, Denmark
73 251 Little Falls Drive, Wilmington DE 19808, United States
74 Av. Coruña 27-88 y Av. Orellana, Edificio Coruña Plaza, Piso 7, Quito 170150, Ecuador
75 Oficina 4C, Av. 12 de Octubre, #26-48 y Orellana, Edificio Mirage, Piso 4, Quito, 170525, Ecuador
76 Polyium Building 22, Off Road 90, First District, 5th Settlement, New Cairo, Egypt
77 Building A1, Second Floor, Plot #A14b01, Cairo Festival City, First District, Fifth Settlement, New Cairo, Cairo, Egypt
78 Harju maakond, Rae vald, Rae küla, Raeküla tee 5, 75310, Estonia
79 Itsehallintokuja 6, 02600 Espoo, Finland
80 Självstyrelsevägen 6, Esbo, 02600, Finland
81 38 rue Victor Basch, 91300 Massy, France
82 102 rue de Sours, 28000 Chartres, France
83 Heinestrasse 9, 69469, Weinheim, Germany
84 Robert-Koch-Straße 1, 69115 Heidelberg, Germany
85 Darwinstrasse 2-4, 69115, Heidelberg, Germany
86 7 Taki Kavalieratou Street, Kifissia, 145 64, Greece
87 1st & 2nd Floors, Elizabeth House, Les Ruettes Brayes, St Peter Port, GY1 1EW, Guernsey
88 Rooms 2206-11, 22 Floor, Chubb Tower, Windsor House, 311 Gloucester Road, Causeway Bay, Hong Kong
89 Klin City, Tereshkovoy Street, 1, 14160052/1, Moscow Region, Russian Federation
90 Room 2001, 20/F, Greenfield Tower, Concordia Plaza, No.1 Science Museum Road, Tsim Sha Tsui, Kowloon, Hong Kong
91 40-Richchia Zhovtnia avenue, 120, 1 Block, Kyiv, 03127, Ukraine
92 Bocskai út 134-146, H-1113, Budapest, Hungary
93 4209 S. Industrial Drive, Suite 200, Austin TX 78744, United States
94 Unit No. 54, 5th Floor, Kalpataru Square, Andheri-Kurla Road, Maharashtra, Mumbai, 400059, India
95 Plot No. 48, Industrial Area, Sector 32, Gurgaon – 122001, Haryana, India
96 30 Finsbury Square London EC2A 1AG
97 F73 and 74, Sipcot Industrial Park, Irungattukottai, Sriperumbudur TK, Kancheepuram District, Tamilnadu, 602 117, India
98 Unit No. 54, 5th Floor, Kalpataru Square Andheri-Kurla Road, Andheri (East) Mumbai, Maharashtra, 400059, India
99 Treasury Tower, District 8, Lantai 58, SCBD Lot 28, Jl. Jend. Sudirman Kav. 52-53, Kel. Senayan, Kec. Kebayoran Baru, Kota, Adm Jakarta Selatan, Prop, DKI Jakarta, Indonesia
100 Treasury Tower 59th Floor, District 8, SCBD, Jalan Jendral Sudirman Kav 52-53, Jakarta, 12190, Indonesia
101 Gedung Treasury Tower, District 8, Level 58, SCBD Lot 28, Jalan Jend. Sudirman Kav. 52-53, Kel. Senayan, Kec. Kebayoran Baru, Kota, Adm Jakarta Selatan, Prov, DKI Jakarta, Indonesia
102 Jl. Raya Narogong, Chamber A.I, Kel. Pasirangin, Kec Cileungsi, Kab. Bogor. Prop. Jawa Barat, Indonesia
103 1st Floor, Unit 11, No. 88 Baran Building, Sayed Road, Opposite Mellat Park, Vali-e-Asr Avenue, Tehran, Islamic Republic of Iran
104 3rd Floor, Kilmore House, Park Lane, Spencer Dock, Dublin 1, Ireland
105 6th Floor, 2 Grand Canal Square, Dublin 2, Ireland
106 6 Hangar Street, PO Box 6440, I.Z. Neve Nee’man B Hod Hasharon, 4527703, Israel
107 Via Spadolini 7, 20141, Milano, Italy
108 3-20-14 Higashi-Gotanda, Shinagawa-ku, Tokyo, 141-0022, Japan
109 Sumitomo Fudosan Takanawa Park Tower 14F, 3-20-14 Higashi-Gotanda, Shinagawa-ku, Tokyo, 141-0022, Japan
110 22 Grenville Street, St Helier, Jersey
111 IFC 5, St. Helier, JE1 1ST, Jersey
112 44 Esplanade, St Helier, JE4 9WG, Jersey
113 Bld. 15/A, Koktem-1, Almaty, 050040, Kazakhstan
114 Office 302, Building 15a, Koktem-1, Micro District, Almaty City, Kazakhstan
115 Plot 209/2462, Likoni Road, Nairobi, Kenya
116 14 Riverside Drive, Arlington Building, 3rd Floor, Nairobi, 209/19, Kenya
117 LR.NO.1870/1/569, 2nd Floor, Apollo Centre, Ring Road Westlands, Kenya
118 Strēlnieku iela 1A – 2, Rīga, LV-1010, Latvia
119 Vilniaus m. Olimpiečių g. 1A, Lithuania
120 1 rue de la Poudrerie, Leudelange, L-3364, Luxembourg
121 Avenida Son On, No.1040, Centre Indusrial Brilliant 2 Andar, Taipa, Macau
122 Suite 1005, 10th Floor, Wisma Hamzag Kwong Hing, No. 1 Leboh Ampang, 50100 W.P. Kuala Lumpur, Malaysia
123 Unit No. 50-8-1, 8th Floor, Wisma Uoa Damansara, 50 Jalan Dungun, Damansara Heights, 50490, Kuala Lumpur, Malaysia
124 Level 7, Menara Milenium, Jalan Damanlela, Pusat Bandar Damansara, 50490, Damansara Heights, Wilayah Persekutuan, Kuala Lumpur, Malaysia
125 Av de las Granjas 972, Col. Santa Barbara, Azcapotzalco, CDMX, 02230, Mexico
126 Av. Ejército Nacional Mexicano No.769, Corporativo Miyana Torre B, Piso 6, Alcaldía Miguel Hidalgo, Colonia Granada, CP 11520, Mexico
127 Calzada de Tlalpan No. 2996, Col. Ex Hacienda Coapa, Del. Coyoacán, Cd. de México, C.P. 04980, Mexico
128 Circuito Dr Gustavo Baz, 7, No. 7, Fracc Industrial El Pedregal, Atizapan de Zaragoza, Edomex, Mexico
129 59 Boulevard Zerktouni, Residence Les Fleurs 6eme étage, Casablanca, Morocco
130 Siriusdreef 14, 2132 WT, Hoofddorp, The Netherlands
131 225 North Canal Street, Floor 25, Chicago IL 60606, United States
132 112 North Curry Street, Carson City, NV, 89703, United States
133 Schiphol Boulevard 267, 1118 BH, Schiphol, The Netherlands
134 Level 1, 2 Fred Thomas Drive, Takapuna, Auckland, 0622, New Zealand
Notes to the Parent Company Financial Statements (Continued)
11 Subsidiary Undertakings continued

Reckitt Annual Report and Accounts 2021
Financial StatementsGovernanceStrategic Report
267
135 2 Fred Thomas Drive, Takapuna, Auckland, 0622, New Zealand
136 12 Montgomery Road, Yaba, Lagos, Nigeria
137 Henrik Ibsens gate 60A, 0255 Oslo, Norway
138 12, 11th Floor Heritage Place, 21 Lugard Avenue Ikoyi, Nigeria
139 Tenancy 04 & 05, 3rd Floor, Corporate Office Block, Dolmen City, HC, Block 4, Scheme 5, Clifton, Karachi, 75600, Pakistan
140 Apartment 6G, 6th Floor, Edificio Bladex, Calle Avenida La Rotonda. Business Park, Corregimiento de Juan Diaz, Urbanización Costa Del Este, Provincia de Panamá, Distrito de Panama, Panama
141 Calle Dean Valdivia No.148, Torre 1, Ofic. 501, Urb. Jardín, San Isidro, Lima, Peru
142 Av. Republica de Panama #2577, Urb. Santa Catalina, La Victoria, Lima, Peru
143 2309 Don Chino Roces Avenue Extension, Makati City, Philippines
144 3rd Floor Mead Johnson Nutrition Inc, 2309 Don Chino Roces Extension, Makati City, Philippines
145 Ul. Wołoska 22, 02-675, Warsaw, Poland
146 Nowy Dwór Mazowiecki, Ul. Okunin 1, 05-100, Poland
147 ul. Okunin 1, 05-100, Nowy Dwor, Mazowiecki, Poland
148 Rua D. Cristóvão da Gama, n.º 1, 1º, C/D, 1400-116, Lisboa, Portugal
149 Estrada Malhada dos Carrascos, 12, Porto Alto, 2135-061, Samora Correia, Portugal
150 Los Frailes Industrial Park, Ave. Esmeralda, Calle C # 475, Guaynabo, 00969, Puerto Rico
151 89-97 Grigore Alexandrescu street, Building A, 5th floor, Sector 1, Bucharest, Romania
152 Iancu de Hunedoara Boulevard, Nr. 48, 11th Floor, Crystal Tower Building, 1st District, Bucharest, 011745, Romania
153 4, Shluzovaya emb, 3rd Floor, 115114, Moscow, Russian Federation
154 14 Kozhevnicheskaya Str, 115114, Moscow, Russian Federation
155 52/1, Kosmodamianskaya emb, 115054, Moscow, Russian Federation
156 80 Robinson Road, #02-00, 068898, Singapore
157 12 Marina Boulevard, #19-01 Marina Bay Financial Centre, 018982, Singapore
158 Drieňová 3, 821 08 Bratislava, Slovakia
159 8 Jet Park Road, Gauteng, Elandsfontein, 1406, South Africa
160 24th Floor, Two IFC, 10 Gukjegeumyung-ro, Youngdeungpo-gu, Seoul, 07326, Republic of Korea
161 Carrer de Mataró, 28, 08403, Granollers, Barcelona, Spain
162 Fray Carbo, 24, 08400, Granollers, Spain
163 No.151, Avda. Can Fatjó, 08191, Rubí, Barcelona, Spain
164 No.25, Shrubbery Garden, Colombo-04, Sri Lanka
165 Vretenvägen 2, 4th Floor, 171 54 Solna, Sweden
166 Box 190, 101 23 Stockholm, Sweden
167 Richtistrasse 5, 8304, Wallisellen, Switzerland
168 6F., No. 136, Sec. 3, Ren’ai Road, Da’an Dist, Taipei City 1, R.O.C., 10657, Taiwan
169 No.388 Exchange Tower, 14th Floor, Sukhumvit Road, Klongtoey, Bangkok, TH 10110, Thailand
170 No. 388, Room No. 1903, Floor 19th Floor, Exchange Tower, Sukhumvit Road, Sub-District Klongtoey, District Klongtoey, Bangkok, 10110, Thailand
171 No.388 Exchange Tower, 14th Floor, Sukhumvit Road, Klongtoey, Bangkok, 10110, Thailand
172 65 Moo 12 Lardkrabang-Bangplee Road, Bangplee Samutprakarn, 10540, Thailand
173 100 Moo 5, Bangsamak Sub-District, Bangpakong District, Chachoengsao Province 24180, Thailand
174 Orta Mahallesi Demokrasi, Caddesi Benckiser Sitesi No.92, Tuzla, Istanbul, Turkey
175 Esentepe Mahallesi Büyükdere Caddesi Tekfen, Tower No: 209 A Blok D:2 34394 4., Levent, Şişli, İstanbul, Turkey
176 4th Floor, 115 George Street, Edinburgh, EH2 4JN, Scotland, United Kingdom
177 1020 Eskdale Road, Winnersh, Wokingham, RG41 5TS, United Kingdom
178 28A Stepana Bandery, Bld.G, Office 80, 04073, Kyiv, Ukraine
179 Level 27, Tower B, JAFZA One, Jebel Ali Free Zone, Dubai, PO Box 16834, United Arab Emirates
180 Office 1801, 1803, 1804, Emaar Real Estate Burj Khalifa, Dubai, United Arab Emirates
181 309, Floor 3, Dubai Science Park Labrotory Complex, Dubai, United Arab Emirates
182 Unit 05, Level 3, Gate Village Building 04, Dubai Investment Financial Centre, PO Box 677, Dubai, United Arab Emirates
183 Al Seer Corporate Office, Behind Al Tayer Motors, Sheikh Zayed Road, Al Quoz Industrial Area 3, Dubai, 31587, United Arab Emirates
184 4209 S. Industrial Drive, Suite 200, Austin TX 78744, United States
185 Corporation Service Company, 251 Little Falls Drive, Wilmington, New Castle County DE 19808, United States
186 Northcliffe House, Young Street, London, W8 5EH, United Kingdom
187 Urb. Las Mercedes, Av. Orinoco cruce con Mucuchies Torre Nordic, Piso 1, Oficina 1 y 2, Municipio Baruta Caracas, Bolivarian Republic of Venezuela
188 Avenida Mara con Calle San José, Centro Comercial Macaracuay Plaza, Nivel C3, Locales 5 y 12. Urb. Colinas de la California, Caracas, Bolivarian Republic of Venezuela
189 Unit 401, 4th Floor, Metropolitan Building, No.235 Dong Khoi Street, Ben Nghe Ward, District 1, Ho Chi Minh City, Vietnam
190 Av. Winston Churchill No. 1099 Torre Acrópolis, Piso 12, Santo Domingo, Republic of Dominica
191 Incorporated: The Bahamas Registered office: 23
192 Incorporated: The Netherlands Registered office: 131
193 Office number 51, Fifth Floor, Mukmal Plaza Center, Al Hamra District Palestine Street, Jeddah City, Saudi Arabia, United Arab Emirates
194 Est Dona Maria Jose Ferraz Prado, 1481, Cond Dist. Park Embu II Modulo 06, Chacaras Bartira, CEP – 06.845-070, Embu/SP, Brazil
195 Estm Maria Margarida Pinto Dona Belinha, 742, GalpaoO3 Bloco I/A, Extrema/MG, Brazil
196 Rod Governador Mario Covas, 7270, KM 264 Parte RB, Serra/ES, Brazil
197 Rod Dom Gabriel Paulino Bueno Couto, 1606, Itupeva/SP, Brazil
198 6/F, No. 136, Sec. 3, Ren-ai Rd., Da-an Dist, Taipei 106, R.O.C., Taiwan
199 Ketian Aquatic Science and Technology Industrial Park, No. 3949 Kunlunshan Avenue, Lanzhou New Area, Lanzhou City, Gansu Province, China
11 Subsidiary Undertakings continued

268
SHAREHOLDER INFORMATION
Annual General MeetingOur Annual General Meeting (AGM) will be held on Friday 20 May 2022 at 2.00pm at London Heathrow Marriott Hotel, Bath Road, Hayes, Middlesex, UB3 5AN.
The Notice convening the meeting, together with the business to be considered at the meeting is contained in a separate document for shareholders and is available on our website at www.reckitt.com/investors/annual-general-meetings.
2022 Financial calendar and key dates
Announcement of Quarter 1 trading statement 29 April 2022
Annual General Meeting 20 May 2022
Record date for 2021 final dividend 29 April 2022
Payment of 2021 final ordinary dividend 9 June 2022
Announcement of 2022 interim results 27 July 2022
Record date for 2022 interim dividend 5 August 2022
Payment of 2022 interim ordinary dividend 14 September 2022
Announcement of Quarter 3 trading statement 26 October 2022
DividendThe Directors have recommended a final dividend of 101.6 pence per share, for the year ended 31 December 2021. Subject to shareholder approval at the 2021 AGM, payment of the final dividend will be made on 9 June 2022 to all shareholders on the register as at 29 April 2022. The latest date for receipt of new applications to participate in the Dividend Reinvestment Plan (DRIP) in respect of the 2021 final dividend is 17 May 2022. Details on how to join the DRIP can be found in the DRIP section of this report.
Mandatory Direct CreditIn September 2018, we changed the way we pay dividends to shareholders and no longer pay dividends by cheque. This is known as ‘mandatory direct credit’. The reasons and benefits for introducing this change are:
• Shareholders receive dividend funds quicker
• We reduce our environmental impact
• We reduce the risk of cheque fraud
• We reduce the administration costs of issuing or banking cheques
To have your dividends paid directly into your bank account, please log on to the Computershare Investor Centre at www.investorcentre.co.uk, or by telephone on +44 (0)370 703 0118. We will hold your dividends for you until you provide valid bank details and charges may be applied to reissue any dividend payments.
If you are based overseas, you may choose to have your dividends paid to your account in your local currency by using Computershare’s Global Payment Service (GPS). To view the terms and register to the GPS, please join our DRIP. This is also available via Investor Centre.
Dividend Reinvestment Plan (DRIP)Shareholders participating in the DRIP receive additional shares purchased in the market instead of receiving a cash dividend. You can elect to join the DRIP by registering at the Computershare Investor Centre at www.investorcentre.co.uk. Alternatively, you can request a DRIP mandate form and terms and conditions by contacting Computershare on +44 (0)370 703 0118.
Electronic shareholder communicationsWe encourage all shareholders to receive an email notification when shareholder documents become available online, to reduce our impact on the environment. An election to receive shareholder communications in this way will:
• result in annual cost savings to the company since less paper documentation will need to be produced and posted;
• allow for quicker and more effective communications with shareholders; and
• support Reckitt’s corporate responsibility profile.
Shareholders can register for electronic communications by registering at www.investorcentre.co.uk. For each new shareholder that does so, Computershare will donate £1 to the Woodland Trust. For more information on the Woodland Trust and all of their campaigns please visit their website at www.woodlandtrust.org.uk.
Shareholders who have positively elected for electronic communications will receive an email whenever shareholder documents are available to view on the company’s website. Shareholders who have elected by deemed consent in accordance with the Companies Act 2006 will receive a hard copy notice of availability of a document on the company’s website and are entitled to request a hard copy of any such document, at any time, free of charge from Computershare. Shareholders can revoke their consent to receive electronic communications at any time by contacting Computershare.
The company’s 2021 Annual Report and Notice of the 2022 AGM are available to view at www.reckitt.com. The Investor section of the website also contains up-to-date information for shareholders to view throughout the year, including:
• Detailed share price information
• Financial results
• Regulatory announcements
• Dividend payment dates and amounts
• Access to shareholder documents including the Annual Report and Notice of AGM
• Share capital information


![[Financial Statement -2012] - First Security Islami Bank Limited](https://img.dokumen.tips/doc/110x75/6331662eac2998afa709b49a/financial-statement-2012-first-security-islami-bank-limited.jpg)


