Embed Size (px)
Citation preview
FHEAfair housing equity assessment
VERSION 2 DRAFT FOR REVIEW 3/31/2015

This report was funded in part through grant(s) from the U.S. Department of Housing and Urban Development (HUD), the U.S. Environmental Protection Agency (EPA) and the U.S. Department of Transportation (DOT). The views and opinions of the authors expressed herein do not necessarily state or reflect those of HUD, EPA or DOT.
Notice of Nondiscrimination
Metroplan complies with all civil rights provisions of federal statutes and related authorities that prohibit discrimination in programs and activities receiving federal financial assistance. Therefore, Metroplan does not discriminate on the basis of race, sex, color, age, national origin, religion or disability, in admission or access to and treatment in Metroplan’s programs and activities, as well as Metroplan’s hiring or employment practices. Complaints of alleged discrimination and inquiries regarding Metroplan’s nondiscrimination policies may be directed to Susan Dollar, ADA/504/Title VI Coordinator, 501 West Markham Street, Suite B, Little Rock, AR 72201, (501) 372-3300, or the following e-mail address: [email protected]. (Hearing impaired may dial 711.) This notice is available from the ADA/504/Title VI Coordinator in large print, on audiotape and in Braille.
VERSION 2 DRAFT FOR REVIEW 3/31/2015

iiiFAIR HOUSING EQUITY ASSESSMENT |
VERSION 2 DRAFT FOR REVIEW 3/31/2015
Table of ConTenTsExecutive Summary ................................................................................................................................................. 1 The Disabled ...........................................................................................................................................................2 The Elderly ..............................................................................................................................................................2 Racially Concentrated Areas of Poverty (RCAPs) ....................................................................................................3 The Homeless .........................................................................................................................................................6 Access to Opportunity ............................................................................................................................................6
1. Introduction ...................................................................................................................................................... 9 About This Report ...................................................................................................................................................9 Process and Methodology .......................................................................................................................................9 The Sustainable Communities Initiative ..................................................................................................................9 Study Area Boundaries ............................................................................................................................................9 Engaging the Public ..................................................................................................................................................9 Advisory Group ......................................................................................................................................................14
2. The Little Rock-North Little Rock-Conway Metro Area: An Overview ................................................................ 15 Faulkner County .....................................................................................................................................................16 Lonoke County .......................................................................................................................................................16 Pulaski County .......................................................................................................................................................17 Saline County .........................................................................................................................................................17
3. History ........................................................................................................................................................... 19 From Plessy to the Present: Race and Housing in Central Arkansas from the end of the 19th Century
to the beginning of the 21st Century .......................................................................................................................19 1896–1970 ...............................................................................................................................................................18 Post–1970 Expansion ................................................................................................................................................29 A Temporary Shift toward Racial Parity ....................................................................................................................31 The Latest Migration Trends .....................................................................................................................................33 Gentrification and Consequences ............................................................................................................................34 Poverty Moves to the Suburbs .................................................................................................................................35 Exclusionary Zoning in the Region ............................................................................................................................36
4. Segregation and Isolation ................................................................................................................................ 39
5. Persons with Disabilities ................................................................................................................................. 43 Poverty and the Households of the Disabled ........................................................................................................46
6. Affordable Housing and the Elderly ................................................................................................................. 51
7. Central Arkansas’ Racially Concentrated Areas of Poverty ................................................................................ 55 Tract 46 ...............................................................................................................................................................57 Household Demographics ..................................................................................................................................63 Educational Attainment ......................................................................................................................................66 Transportation and Mobility ...............................................................................................................................68 Tract 12 ...............................................................................................................................................................69 Detention Facilities .............................................................................................................................................74 Household Demographics ..................................................................................................................................75 Educational Attainment ......................................................................................................................................77 Transportation and Mobility ...............................................................................................................................78
ivFAIR HOUSING EQUITY ASSESSMENT |
VERSION 2 DRAFT FOR REVIEW 3/31/2015
Tract 28 ...............................................................................................................................................................79 Household Demographics ..................................................................................................................................83 Educational Attainment ......................................................................................................................................84 Transportation and Mobility ...............................................................................................................................86 Tracts 30.1 and 30.2 ...............................................................................................................................................87 Household Demographics ..................................................................................................................................94 Educational Attainment ......................................................................................................................................97 Transportation and Mobility ...............................................................................................................................99 Poverty in the Metropolitan Area outside of RCAPs ............................................................................................101 Health and Safety within the RCAPS ....................................................................................................................104 Food and Nutrition ..............................................................................................................................................109
8. Geographies of Opportunity ..........................................................................................................................115 Race and Ethnicity and Access .............................................................................................................................116 Section 8 Housing ................................................................................................................................................117 Transit Service ......................................................................................................................................................117
9. Housing Discrimination ..................................................................................................................................121 Fair Housing Barriers and Impediments ..............................................................................................................124 Access to Housing Vouchers in Areas of Opportunity..........................................................................................125 Access to Public Transportation in Areas of Opportunity ....................................................................................125 Housing Discrimination in Areas of Opportunity .................................................................................................126 Exclusionary Zoning in Areas of Opportunity ......................................................................................................127 Unfair Landlord-tenant Laws ...............................................................................................................................127
10. Homelessness ................................................................................................................................................129 Overview .............................................................................................................................................................129 Who are the Homeless? ......................................................................................................................................130 Homeless Families ...............................................................................................................................................131 Homeless Veterans .............................................................................................................................................131 Facilities for Homeless Persons ............................................................................................................................131 Reasons for Homelessness ..................................................................................................................................133 Barriers to Ending Homelessness ........................................................................................................................133 Conclusions ..........................................................................................................................................................134
11. Occupation by Race/Ethnicity ........................................................................................................................137
12. Job Access ....................................................................................................................................................145
13. Housing Costs in the Metropolitan Area ..........................................................................................................149 Public and Vouchered Housing in the Little Rock–North Little Rock–Conway Metropolitan Area ......................150 Home Loans in the Metropolitan Area ...............................................................................................................151 Promoting Affordable Housing and Home Ownership .......................................................................................154 Predatory Lending and Banking ..........................................................................................................................155
14. Major Investments to which RCAP Residents Have Access ...............................................................................163 Infrastructure Improvements within the RCAPs .................................................................................................164
15. FHEA Findings .................................................................................................................................................165 Job Access ...........................................................................................................................................................165 Educational Attainment ......................................................................................................................................166 Housing Diversity ................................................................................................................................................166 Health and Safety ................................................................................................................................................166 Regional Organization and Planning ...................................................................................................................167
VERSION 2 DRAFT FOR REVIEW 3/31/2015

vFAIR HOUSING EQUITY ASSESSMENT |
VERSION 2 DRAFT FOR REVIEW 3/31/2015
lisT of figuresFigure 2-1. Population of Faulkner County by Race 1970–2010 .......................................................................................... 16Figure 2-2. Population of Lonoke County by Race 1970–2010 ............................................................................................. 17Figure 2-3. Population of Pulaski County by Race 1970–2010 ............................................................................................. 18Figure 2-4. Population of Saline County by Race 1970–2010............................................................................................... 18Figure 3-1. Slum Clearance and Public Housing .................................................................................................................. 22Figure 3-2. Ethnic Composition of Little Rock Metropolitan Area High Schools ................................................................... 24Figure 3-3. Population by Race with Urban Renewal Projects ............................................................................................. 25Figure 3-4. Median Income by Race 1970–2010 ................................................................................................................. 27Figure 3-5. Suburban Population Growth from 1940–2010 ................................................................................................. 28Figure 3-6. Drug Arrests in the Little Rock-North Little Rock Area and their Proximity to Gang Sets of the 1990s
and 2000s and Racially Concentrated Areas of Poverty ................................................................................ 29Figure 3-7. 1990 African American/White Population Percentage ...................................................................................... 31Figure 3-8. 2000 African American/White Population Percentage ...................................................................................... 32Figure 3-9. 2010 African American/White Population Percentage ...................................................................................... 33Figure 4-1. Dissimilarity Index for the Little Rock Metropolitan Area ................................................................................. 40Figure 4-2. 2010 Neighborhood Racial Exposure in the LR-NLR-Conway Metro Area ..........................................................42Figure 5-1. Disabled Population of Pulaski County by Race ................................................................................................ 44Figure 5-3. Employment of the Disabled in Pulaski County ................................................................................................. 44Figure 5-2. Disabled Population by Race in Faulkner, Lonoke, and Saline Counties .............................................................44Figure 5-5. Transportation to Work for the Disabled in Faulkner, Lonoke, and Saline Counties ...........................................45Figure 5-4. Transportation to Work for Disabled in Pulaski County ..................................................................................... 45Figure 5-6. Travel Time for Disabled in Faulkner, Lonoke, and Saline Counties .................................................................... 46Figure 5-7. Transportation Time to Work for Disabled in Pulaski County ............................................................................ 46Figure 5-8. Percentage of the Disabled Below and Above the Poverty Threshold in Pulaski County ....................................46Figure 5-11. Percentage of the Population without a Disability Below and Above the Poverty Threshold in Faulkner,
Lonoke, and Saline Counties ........................................................................................................................ 47Figure 5-9. Percentage of the Population without a Disability Below and Above the Poverty Threshold in Pulaski County .47Figure 5-10. Percentage Disabled Population Below and Above the Poverty Threshold in Faulkner, Lonoke, and Saline
Counties ...................................................................................................................................................... 47Figure 5-12. Households with a Disabled Member by Building Type in Pulaski County ......................................................48Figure 5-13. Households without Disabled Members by Building Type in Pulaski County ..................................................49Figure 6-1. RCAP Residents 65 and over Living in Poverty by Race ...................................................................................... 52Figure 6-2. RCAP Residents 65 and Over Living in Poverty by Gender ................................................................................ 52Figure 6-3. 65 and Over Living in Poverty Outside of RCAPs by Race .................................................................................. 53Figure 7-2. Racial Demographics for Census Tract 46 by Year .............................................................................................. 57Figure 7-3. Racial Demographics for Tract 46 by Block Group ............................................................................................ 58Figure 7-5. Tract 46 - Age Demographics by Block Group .................................................................................................... 59Figure 7-6. Tract 46 - Gender Distribution by Block Group .................................................................................................. 59Figure 7-7. Total Housing Units in Tract 46 ......................................................................................................................... 60Figure 7-8. Tract 46 - Number of Renter and Owner Occupied Housing Units by Block Group .............................................60Figure 7-9. Tract 46 Median Housing Value 1990 to 2007–2011 ......................................................................................... 61Figure 7-10 Tract 46 Median Rent 1990 to 2007–2011 ....................................................................................................... 62Figure 7-11. Tract 46 Housing by Structure Age .................................................................................................................. 63Figure 7-12. Tract 46 Number of Residents Living in Poverty by Race ................................................................................. 64Figure 7-13. Tract 46 Household Income by Race ............................................................................................................... 65Figure 7-14. Tract 46 — Male Educational Attainment by Race ........................................................................................... 66
VERSION 2 DRAFT FOR REVIEW 3/31/2015

viFAIR HOUSING EQUITY ASSESSMENT |
VERSION 2 DRAFT FOR REVIEW 3/31/2015
Figure 7-15. Tract 46 — Female Educational Attainment by Race ........................................................................................ 67Figure 7-16. Census Tract 46 Transportation to Work Characteristics .................................................................................. 68Figure 7-18. Tract 12 Occupancy Analysis 2010 .................................................................................................................. 70Figure 7-20. The Decline in Housing Stock in Tract 12 1960–2010 ....................................................................................... 70Figure 7-19: Racial Demographics for Census Tract 12 by Year ............................................................................................ 70Figure 7-22. Tract 12 Median Housing Value 1990 to 2007–2011 ........................................................................................ 72Figure 7-21. Tract 12 Median Rent 1990 to 2007–2011 ...................................................................................................... 72Figure 7-23. Tract 12 Housing by Structure Age .................................................................................................................. 73Figure 7-24. Tract 12 Incarcerated vs non-incarcerated ...................................................................................................... 74Figure 7-25. Tract 12 Incarcerated Population by Age and Sex ............................................................................................ 74Figure 7-27. Tract 12 Median Household Income by Race ................................................................................................... 75Figure 7-26. Tract 12 Number of Residents at or below Poverty Level ................................................................................ 75Figure 7-28. Tract 12 - Male Educational Attainment by Race ............................................................................................. 77Figure 7-29. Tract 12 - Female Educational Attainment by Race .......................................................................................... 77Figure 7-30. Census Tract 12 Transportation to Work Characteristics .................................................................................. 78Figure 7-32. Racial Demographics for Census Tract 28 by Year ............................................................................................ 80Figure 7-33. Decline in Housing Stock in Track 28 ............................................................................................................... 81Figure 7-34. Tract 28 Median Rent 1990 to 2007–2011 ....................................................................................................... 81Figure 7-35. Tract 28 2010 Occupancy Analysis .................................................................................................................. 81Figure 7-36. Tract 28 Housing Structure by Age .................................................................................................................. 82Figure 7-37. Tract 28 Median Housing Value 1990 to 2007–2011 ........................................................................................ 82Figure 7-38. Tract 28 Number of Residents Living in Poverty by Race ................................................................................. 83Figure 7-39. Tract 28 Male Educational Attainment by Race ............................................................................................... 84Figure 7-40. Tract 28 Female Educational Attainment by Race ............................................................................................ 85Figure 7-41. Census Tract 28 Transportation Work Characteristics ...................................................................................... 86Figure 7-43. Racial Demographics for Census Tract 30 by Year ............................................................................................ 88Figure 7-45. Decline in the Number of Occupied Housing Units in Tracts 30.1 and 30.2 between 1960 -2010......................89Figure 7-46* Tract 30.1 Occupancy Analysis 2010 ............................................................................................................... 89Figure 7-46.* Tract 30.2 Occupancy Analysis 2010 .............................................................................................................. 89Figure 7-47. Tract 30* Median Rent 1990 to 2007–2011 ..................................................................................................... 90Figure 7-49. Comparison of Median Housing Values in Tracts 30.1 and 30.2 ....................................................................... 90Figure 7-48. Tract 30* Median Value 1990 to 2007–2011.................................................................................................... 90Figure 7-50. Comparison of Median Rental Costs in Tracts 30.1 and 30.2............................................................................ 91Figure 7-51. Racial Comparison between Tracts 30.1 and 30.2 ........................................................................................... 91Figure 7-52. Tract 30.2 -Racial Demographics by Block Group ............................................................................................. 92Figure 7-53. Tract 30.2 - Occupancy by Type and Block Group ............................................................................................ 93Figure 7-54. Tract 30.2 - Age Demographics by Block Group ............................................................................................... 93Figure 7-56. Tract 30.02 Housing by Structure Age .................................................................................................................................... 94
Figure 7-55. Tract 30.01 Housing by Structure Age ............................................................................................................. 94Figure 7-57. Tract 30.1 - Number of Residents living at or below the Poverty Level by Race ...............................................95Figure 7-58 Tract 30.2 - Number of Residents living at or below the Poverty Level by Race ................................................95Figure 7-59. Tract 30.1—Male Educational Attainment by Race .......................................................................................... 97Figure 7-60. Tract 30.1—Female Educational Attainment by Race ...................................................................................... 97Figure 7-61. Tract 30.2—Male Educational Attainment by Race .......................................................................................... 98Figure 7-62. Tract 30.2—Female Educational Attainment by Race ...................................................................................... 98Figure 7-64 Tract 30.2—Transportation to Work Characteristics ....................................................................................... 100Figure 7-63. Tract 30.1—Transportation to Work Characteristics ...................................................................................... 100Figure 7-71. Households Receiving SNAP by Race in Arkansas’ 2nd Congressional District ............................................... 109Figure 7-72. Households Not Receiving SNAP by Race in Arkansas’ 2nd Congressional District ......................................... 110Figure 8-3. Number of Section 8 Housing Units, 2013 ....................................................................................................... 118
VERSION 2 DRAFT FOR REVIEW 3/31/2015

viiFAIR HOUSING EQUITY ASSESSMENT |
VERSION 2 DRAFT FOR REVIEW 3/31/2015
Figure 9-1. 2008–2013 Number of Complaints in Metropolitan Area by County ............................................................... 122Figure 9-2. 2008–2013 Fair Housing Complaints in Metropolitan Area by Basis ................................................................ 122Figure 9-4. 2008–2013 Pulaski County Fair Housing Complaints by Basis .......................................................................... 122Figure 9-3. 2008–2013 Number of Complaints in Metropolitan Area by Basis................................................................... 122Figure 9-6. 2008–2013 Faulkner County Fair Housing Complaints by Basis ....................................................................... 123Figure 9-7. 2008–2013 Lonoke County Fair Housing Complaints by Basis .......................................................................... 123Figure 9-5. 2008–2013 Saline County Fair Housing Complaints by Basis............................................................................ 123Figure 11-1. Median Income by Race/Ethnicity in the Health Care and Social Assistance Sector ....................................... 138Figure 11-2. Employment Sectors with the Highest Share of Regional Employment ......................................................... 139Figure 11-3. Employment Sectors Historically Favored by the African American Middle Class .......................................... 140Figure 11-4 Median Monthly Wages in High Wage Sectors by Race .................................................................................. 142Figure 11-5. Employment Sectors by Race/Ethnicity and Median Monthly Earnings ......................................................... 144Figure 13-2. Percentage of Subsidized Housing Residents by Income 2009–2012 .............................................................. 150Figure 13-2. Number of Home Purchase Loans in the Little Rock-North Little Rock Area .................................................. 151Figure 13-3. Number of Home Purchase Loans by Race in the LR-NLR Area ...................................................................... 152Figure 13-4. Government-Backed Loans as Share of Home Purchase Loans by Race/Ethnicity in LR-NLR Area .................. 152Figure 13-5. Percentage of High Interest Home Loans before 2010 by Race in Little Rock–North Little Rock Area ............. 153Figure 13-6. Percentage of High Interest Home Loans in Little Rock–North Little Rock Area in 2010.................................. 153Figure 13-7. Home Purchase Loan Denial Percentages by Race in the Little Rock–North Little Rock Area .......................... 154Figure 13-8. Payday Lenders in 1999 ................................................................................................................................ 156
Table 3-1. Federal Urban Renewal (Slum Clearance) Projects Costs from 1950–1961 ............................................23
Table 3-3. Educational Attainment in Revitalizing Downtown Neighborhoods ......................................................30
Table 4-2. Comparison of Households of the Disabled and Those Without Disabilities in Faulkner, Lonoke
and Saline Counties .......................................................................................................................................48
Table 5-1. Comparison of Households of the Disabled and Those Without Disabilities in Pulaski County ..............48
Table 8-1. Opportunity Access by Race/Ethnicity and Poverty ............................................................................116
Table 8-2. Opportunity Access by Race/Ethnicity and Poverty ............................................................................117
Table 9-1. 2008–2013 Resolution by Type ..........................................................................................................121
Table 9-2. Number of Complaints in the Metropolitan Area by County...............................................................122
Table 11-1. Percentage of Race & Ethnic Groups by Top Five Employment Sectors .............................................137
Table 11-2. Percentage of Race & Ethnic Groups Employed in High Pay Sectors ..................................................141
Table 12-1. Unemployment Rates in Surrounding Metro Area ............................................................................147
Table 13-1. Cost Burdened Households - Home Owners .....................................................................................149
Table 13-2. Cost Burdened Households - Renters ...............................................................................................149
Table 13-3. Units of Subsidized Housing by Housing Authority and Program ......................................................160
Table 14-1. Major Private Investments in the Metropolitan Area .......................................................................163
Table 14-2. Public Investment in the Metropolitan Area ....................................................................................163
Table 14-3. Road Infrastructure Improvements which impact RCAPs ..................................................................164
lisT of Tables
VERSION 2 DRAFT FOR REVIEW 3/31/2015
viiiFAIR HOUSING EQUITY ASSESSMENT |
VERSION 2 DRAFT FOR REVIEW 3/31/2015
lisT of MaPsFigure 1. Racially Concentrated Areas of Poverty (RCAP) ............................................................................ 4
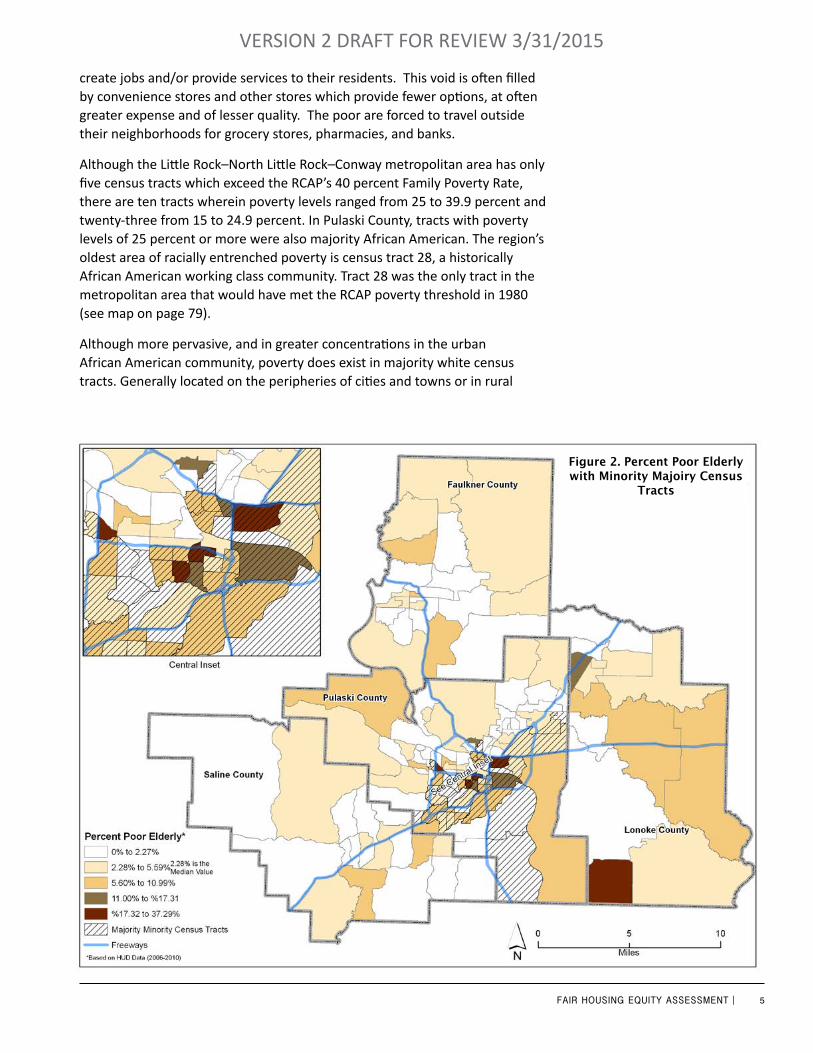
Figure 2. Percent Poor Elderly with Minority Majoiry Census Tracts ........................................................... 5
Figure 1-1. Fair Housing Equity Assessment Study Area............................................................................ 10
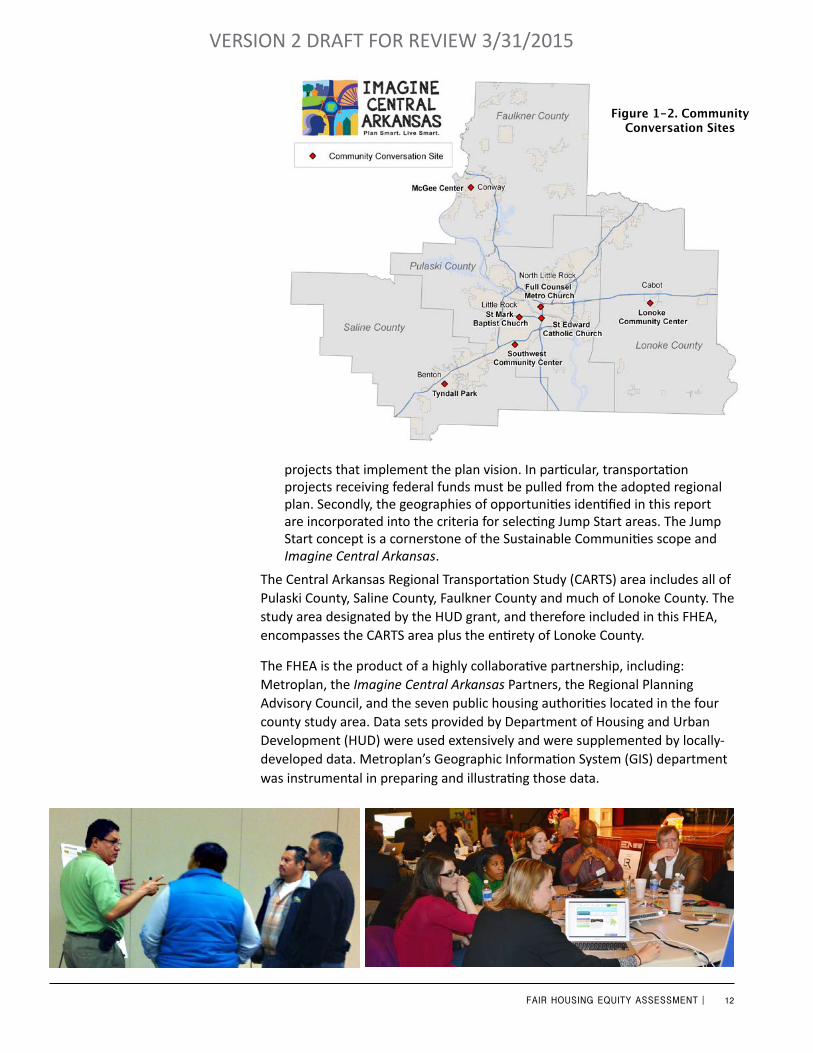
Figure 1-2. Community Conversation Sites ............................................................................................... 12
Figure 3-1. Slum Clearance and Public Housing ........................................................................................ 22
Figure 3-2. Ethnic Composition of Little Rock Metropolitan Area High Schools ......................................... 24
Figure 3-3. Population by Race with RCAPs .............................................................................................. 25
Figure 3-6. Drug Arrests in the Little Rock-North Little Rock Area and their Proximity to
Gang Sets of the 1990s and 2000s and Racially Concentrated Areas of Poverty .................................. 29
Figure 3-7. 1990 African American/White Population Percentage ............................................................ 31
Figure 3-8. 2000 African American/White Population Percentage ............................................................ 32
Figure 3-9. 2010 African American/White Population Percentage ............................................................ 33
Figure 6-4. Percent Poor Elderly with Minority Majority Census Tracts ..................................................... 54
Figure 7-1. Racially Concentrated Areas of Poverty (RCAP) ....................................................................... 55
Figure 7-4. RCAP Census Tract 46 ............................................................................................................. 58
Figure 7-17. RCAP Census Tract 12 ........................................................................................................... 69
Figure 7-31. RCAP Census Tract 28 ........................................................................................................... 79
Figure 7-42. RCAP Census Tract 30.1 ........................................................................................................ 87
Figure 7-44. RCAP Census Tract 30.2 ........................................................................................................ 88
Figure 7-65. Central Arkansas 2000 Family Poverty Rate and Majority Minority Areas ........................... 101
Figure 7-66. Violent Crime in Little Rock and North Little Rock ............................................................... 104
Figure 7-67. Violent Crime and Blight Little Rock and North Little Rock .................................................. 105
Figure 7-68. Environmental Index .......................................................................................................... 106
Figure 7-69. Toxic Release Inventory ...................................................................................................... 107
Figure 7-70. Brownfields ........................................................................................................................ 108
Figure 7-73. Household Food Stamp Percentage .................................................................................... 110
Figure 7-74. Food Deserts ...................................................................................................................... 111
Figure 7-75. Restaurants ........................................................................................................................ 112
Figure 8-1. Areas of Opportunity ........................................................................................................... 115
Figure 8-2. Section 8 Housing ................................................................................................................. 118
Figure 8-3. Transit Service ...................................................................................................................... 119
Figure 9-8. Low Income Housing ............................................................................................................ 124
Figure 9-9. Sidewalks ............................................................................................................................. 126
Figure 10-1. Homeless Shelters .............................................................................................................. 129
Figure 12-1. Resident and Non-Resident Workers .................................................................................. 145
Figure 12-2. Commuters to Pulaski County from County of Origin 2000 and 2010 .................................. 146
Figure 13-9. Banks ................................................................................................................................. 158
Figure 13-10. Pawn Shops and Drug Arrests ........................................................................................... 159
VERSION 2 DRAFT FOR REVIEW 3/31/2015
1FAIR HOUSING EQUITY ASSESSMENT |
VERSION 2 DRAFT FOR REVIEW 3/31/2015
In 2011, Metroplan received a Sustainable Communities Regional Planning Grant from the Department of Housing and Urban Development (HUD) to craft a sustainable development vision and strategies. The Imagine Central Arkansas project culminatee in late 2014 with the adoption of a regional long-range plan that will lay out a blueprint for transportation, development, maintaining healthy lifestyles, environment and energy, and economic vitality.
The Fair Housing Equity Assessment (FHEA) examines the nexus between poverty and opportunity (the availability of affordable housing, high-quality education, recreational resources, and living-wage jobs) in hopes of finding ways of increasing opportunity for those living in areas of entrenched poverty. The disparities, which exist between the most affluent and poorest residents of a region, reveal whether or not prosperity is widely shared or is more concentrated. Historically, race and ethnicity have correlated closely with the placement of community resources and services. The uneven distribution of resources between poor and wealthy neighborhoods reinforces the concentration of poverty and of racial minorities when race and poverty are highly correlated.
As part of this process, the Regional Fair Housing Equity Assessment (FHEA) identifies how land use, zoning, market forces and other factors shape access to housing and other opportunities for the region’s racial and ethnic minorities. The FHEA is an invaluable tool for planning, and creating more diverse and equitable communities. This assessment not only informs the development of Imagine Central Arkansas, but also serves as a stand-alone reference document for housing and government decision makers.
The Little Rock–North Little Rock–Conway metropolitan area is comprised of six counties. The FHEA will focus on its four urban counties: Faulkner, Lonoke, Pulaski, and Saline counties. Pulaski County is the most ethnically diverse of the urban counties, and its largest city, Little Rock, is the seat of both county and state government. Pulaski County is home to 86 percent of the metro area African American population. African Americans are the largest minority group in the region and make-up 35 percent of Pulaski County’s total population. Outside Pulaski County, African Americans are found in substantially smaller numbers, and in only one other county, Faulkner County, do they exceed more that 10 percent of the total population.
The largest concentration of African Americans in the metropolitan area is found in the urban cores of Little Rock and North Little Rock, in southwest Little Rock, and in the census tracts northeast of North Little Rock’s downtown. In these areas, African Americans are the majority. There is no single causal explanation for this living pattern. A number of historical, economic, and social events such as post World War II suburbanization, the construction of the interstate highway system and the preference for private automobile travel, white flight, crime, urban renewal, and middle class abandonment of the central cities have all contributed to the westward expansion of Little Rock and the growth of its
exeCuTive suMMary
2FAIR HOUSING EQUITY ASSESSMENT |
VERSION 2 DRAFT FOR REVIEW 3/31/2015
neighboring suburban communities. Despite these factors, recent housing trends suggest that the downtown area is becoming increasingly diverse.
Although poverty in the region is closely correlated with race, the FHEA does not deal with poverty, housing, or transportation in isolation. Instead, the report deals with these issues from the perspective of a number of minority groups: the homeless, disabled, elderly, and those in Racially Concentrated Areas of Poverty (RCAPs). By taking this approach, a more nuanced portrayal of the concerns and vulnerabilities of each of these groups is possible. Although each of the groups and communities examined in the report share common features, the vulnerabilities, needs, and concerns for each are quite specific.
The Disabled
The metropolitan region has an estimated 208,410 disabled residents. The disabled population is not concentrated in any one city, census tract, or area in the region. The disabled, while well-represented in the workforce, are more likely than those without a disability to live at or below the poverty threshold. They are also less likely to be employed in high paying jobs than non-disabled individuals with similar levels of educational attainment. There is also concern, due to their low wages in comparison to those without disabilities, that there are many opportunities in which the disabled might be excluded. These “missed opportunities” may be in: 1) pursuing post-secondary education, 2) being over-looked for raises and promotions, or 3) discrimination when they are considered for employment. Although a network of programs, agencies, and organizations exists to address these disparities, it is likely that many of the disabled are unaware of, or are not connecting to these resources. A critical concern is with the disabled who are living in poverty, particularly those living in areas of limited access. For this segment of the disabled population, being connected is essential to creating independent, healthy, sustainable lifestyles. Integral components to their social and economic elevation and connectedness are transportation, housing, and access to employment opportunities. The disabled, like those without disabilities, rely overwhelmingly on privately owned vehicles to meet their transportation needs. Their limited transportation options and need for accommodated living and work spaces greatly influence, where they can live, work, and how connected they are to their community.
The Elderly
The number of those 65 years or older is expected to dramatically increase as America’s Baby Boomers age. The expansive growth in the number of elderly, although unprecedented, is linked to expanded life expectancies. The so-called “Graying of America” describes this historic expansion. In planning for this community, a number of considerations must be taken into account.
The elderly are more likely to live on fixed incomes, and few have saved for an extended retirement. Unable to work, many must cut their household expenses to make ends meet in the face of rising living expenses. Others do without necessities such as healthy foods or medications to assure that essential bills
3FAIR HOUSING EQUITY ASSESSMENT |
VERSION 2 DRAFT FOR REVIEW 3/31/2015
are paid. The bulk of the elderly in the RCAP areas spent their working lives in low paying service jobs and rely exclusively on Social Security as their sole source of income more so than the general population. Americans are faced with a new dilemma as the working poor age.
In the past, care for the elderly was largely the responsibility of family networks. The decline of extended and nuclear families had increased numbers of elderly required to fend for themselves.
It should come as no surprise that the recent extended economic recession (called the “Great Recession”) has dramatically changed the lives of the elderly. In some parts of the metropolitan area, as many as one in four elderly are dependent upon social services and charitable organizations for their day to day existence. They also rank among the poorest households in the area. Like the working poor, poor elders rely on low cost housing. Record occupancy levels at public housing exclusively for the elderly attest to this dependence. Dependency is exacerbated by health concerns. These elders are tethered to housing built with universal design standards that incorporate a step-free entry, single-floor living, reachable controls and switches. Seniors in increasing numbers desire public transportation. Transportation that can drop them off and pick them up at medical facilities, act as vital links to goods and services and allows them to remain in contact with their social communities despite their declining mobility.
Increasing life expectancies combined with uncertainty of federal support for programs directed toward elders living in poverty have increased the likelihood that the living conditions for elders living below the poverty threshold will decline. As funds for subsidized elderly housing are reduced, it becomes increasingly less likely that new subsidized housing units will be built in their traditional form. The increasing numbers of elderly poor compete with their youthful counterparts for vouchered housing or are forced to find an alternative living arrangement. The shortage of subsidized housing for poor elders may restore the multigenerational model, because of its utility to both families faced with childcare cost increases and elders faced with increasingly fewer housing choices. Another alternative might be a shared model, wherein several elders live in a single family home in order to share the associated financial burden. This model provides the elder with independence, reduces the cost associated with living alone, and yet maintains a connectedness with the community of peers (roommates). This model was popularized several decades ago in the television show, “The Golden Girls” and, although few elders elected to follow the model when the show was aired, a renewed interest in its utility and cost savings may make it an attractive model for healthy seniors.
Racially Concentrated Areas of Poverty (RCAP)
The Department of Housing and Urban Development (HUD) defines, a Racially Concentrated Area of Poverty as any census tract with a non-White population of 50 percent or more where either the family poverty rate is 40 percent or greater, or the family poverty rate is at least three times that of the average family poverty rate for census tracts in that metropolitan area.
4FAIR HOUSING EQUITY ASSESSMENT |
VERSION 2 DRAFT FOR REVIEW 3/31/2015
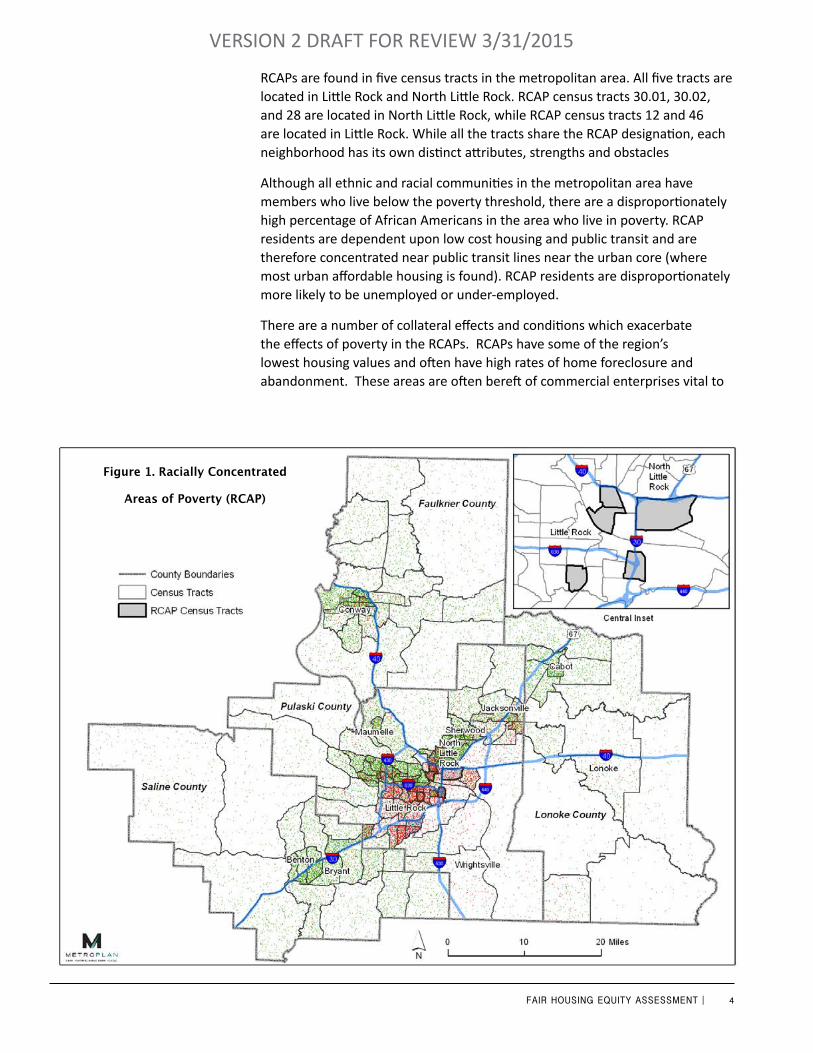
RCAPs are found in five census tracts in the metropolitan area. All five tracts are located in Little Rock and North Little Rock. RCAP census tracts 30.01, 30.02, and 28 are located in North Little Rock, while RCAP census tracts 12 and 46 are located in Little Rock. While all the tracts share the RCAP designation, each neighborhood has its own distinct attributes, strengths and obstacles
Although all ethnic and racial communities in the metropolitan area have members who live below the poverty threshold, there are a disproportionately high percentage of African Americans in the area who live in poverty. RCAP residents are dependent upon low cost housing and public transit and are therefore concentrated near public transit lines near the urban core (where most urban affordable housing is found). RCAP residents are disproportionately more likely to be unemployed or under-employed.
There are a number of collateral effects and conditions which exacerbate the effects of poverty in the RCAPs. RCAPs have some of the region’s lowest housing values and often have high rates of home foreclosure and abandonment. These areas are often bereft of commercial enterprises vital to
Figure 1. Racially Concentrated
Areas of Poverty (RCAP)
5FAIR HOUSING EQUITY ASSESSMENT |
VERSION 2 DRAFT FOR REVIEW 3/31/2015
create jobs and/or provide services to their residents. This void is often filled by convenience stores and other stores which provide fewer options, at often greater expense and of lesser quality. The poor are forced to travel outside their neighborhoods for grocery stores, pharmacies, and banks.
Although the Little Rock–North Little Rock–Conway metropolitan area has only five census tracts which exceed the RCAP’s 40 percent Family Poverty Rate, there are ten tracts wherein poverty levels ranged from 25 to 39.9 percent and twenty-three from 15 to 24.9 percent. In Pulaski County, tracts with poverty levels of 25 percent or more were also majority African American. The region’s oldest area of racially entrenched poverty is census tract 28, a historically African American working class community. Tract 28 was the only tract in the metropolitan area that would have met the RCAP poverty threshold in 1980 (see map on page 79).
Although more pervasive, and in greater concentrations in the urban African American community, poverty does exist in majority white census tracts. Generally located on the peripheries of cities and towns or in rural
Figure 2. Percent Poor Elderly with Minority Majoiry Census
Tracts
6FAIR HOUSING EQUITY ASSESSMENT |
VERSION 2 DRAFT FOR REVIEW 3/31/2015
communities, poverty among Whites is more diffused. For example, of Lonoke County’s sixteen census tracts, only four have populations where less than 7 percent live in poverty. In three tracts (census tracts 202.02, 204, 208), rates of poverty range from 15 to 24.9 percent and a single tract, (census tract 207) has a poverty rate of 25 percent or above. The only other majority white tracts in the metropolitan area which have poverty rate concentrations of 25 percent or above are located in a small section of the city of Conway called “Cow Town”, due to the bovine related names given to its streets. Cow Town spreads into two tracts, tracts 307.02 and 309. The areas of high concentrations of White poverty in Lonoke and Faulkner counties also have in common concentrations of African Americans larger than adjacent census tracts. So even outside Little Rock, concentrations of poverty are correlated with African American communities.
The poor, particularly those in the RCAP and near-RCAP census tracts, live in the metropolitan area’s most dangerous neighborhoods (areas with the highest incidents of violent crime). They are also exposed to more toxins and hazardous materials. The children have fewer healthy food options, are more likely to live in households headed by single females, and on average have lower standardized test scores.
The Homeless
There are an estimated 3,000 homeless in central Arkansas. The homeless are much harder to quantify and categorize than other segments of the poor. This is due in part to the itinerant nature of homelessness, the stigma attached to the condition, and the number of those who are temporarily homeless. The chronically homeless tend to suffer from disabilities such as drug addiction and mental health disorders.1 Others are veterans who have trouble transitioning from their military lives to civil ones, and struggle with unhealed mental wounds from their service. While chronic homelessness in the urban core is very visible, homelessness in rural and suburban communities often goes unnoticed. A host of organizations in the region take on the difficult task of assisting the homeless. Organizations providing assistance note three primary causes of homelessness: poverty due to unemployment and/or underemployment, lack of education and lack of life skills. While men make up the bulk of the homeless, increasing numbers of females (particularly veterans), families, and children on their own are requesting aid.
Access to Opportunity
Many impoverished neighborhoods lack the basic services that contribute to strong communities, these include: access to a grocery store, pharmacy, bank, health care clinic/ hospital, laundromat, a good school, day care, variety store, affordable housing, parks and bus service. Two factors appear to govern housing decisions for the poor: housing cost and access to public transit. The poor in the metropolitan area have extremely narrow price points for housing, which restricts the areas where they can afford to live. Such areas are typically

7FAIR HOUSING EQUITY ASSESSMENT |
VERSION 2 DRAFT FOR REVIEW 3/31/2015
the most dangerous, environmentally unsafe, and have the fewest amenities and job opportunities.
The urban poor are disproportionately dependent upon public transit. Public transit is a lifeline which connects them to jobs and amenities not available in their neighborhoods. Residents who rely on public transit are required to live within its service area and considerations such as travel time and service hours govern how far they can live from their places of employment.
The six primary impediments identified as barriers for poor residents of the metropolitan area include:
1. Availability of low-price point housing throughout the metropolitan area, particularly in areas of opportunity
2. Access to public transportation throughout the metropolitan area
3. Housing discrimination restricting access to affordable housing based on sex, race, disability, age, or national origin
4. Zoning regulations that limit the availability of low-price point housing
5. Landlord-tenant laws which heavily favor landlords over tenants
6. Lack of job opportunities in areas of concentrated poverty
Executive Summary Source1 National Alliance to End Homelessness: www.endhomelessness.org. Chronic homelessness section
(Accessed on March 30, 2015)

8FAIR HOUSING EQUITY ASSESSMENT |
VERSION 2 DRAFT FOR REVIEW 3/31/2015
9FAIR HOUSING EQUITY ASSESSMENT |
VERSION 2 DRAFT FOR REVIEW 3/31/2015
The Sustainable Communities Initiative
In 2010 and 2011, HUD awarded
some $196 million in Sustainable
Communities grants. The Partnership
for Sustainable Communities is an
agreement among HUD, the US
Department of Transportation (DOT)
and the US Environmental Protection
Agency (EPA) to take a more holistic
approach to better respond to unique
regional needs. Central Arkansas is one
of 45 regions in the United States that
received an award.
Sustainability also means creating “geographies of opportunity,”
places that effectively connect people to jobs, quality public
schools, and other amenities. Today, too many HUD-assisted
families are stuck in neighborhoods of concentrated poverty
and segregation, where one’s zip code predicts poor education,
employment, and even health outcomes. These neighborhoods
are not sustainable in the present state.
—HUD Secretary Shaun Donovan, February 23, 2010
About This Report
In 2011, Metroplan received a Sustainable Communities Regional Planning Grant from the US Department of Housing and Urban Development (HUD) to craft a sustainable development vision and strategies. The Imagine Central Arkansas project culminated in late 2014 with the adoption of a regional long-range plan that laid out a blueprint of recommendations for transportation, development, maintaining healthy lifestyles, environment and energy, and economic vitality.
As part of this process, the Regional Fair Housing Equity Assessment (FHEA) identifies how land use, zoning, market forces and other factors shape access to housing and other opportunities for the region’s racial and ethnic minorities. The FHEA will be an invaluable tool for planning, and creating more diverse and equitable communities. This assessment not only informs the development of the Imagine Central Arkansas plan, but also serves as a stand-alone reference document for housing and government decision makers.
Process and Methodology
This document serves as partial fulfillment of the HUD Sustainable Communities grant agreement. There are three key deliverables in completing the FHEA requirement. They are:
• Product. Grantees must produce a Fair Housing Equity Assessment that will serve either as a stand-alone document or one that will be integrated into the regional plan. Information contained in this FHEA will be integrated into the overall long-range planning process, and the full report will be appended to Imagine Central Arkansas. Additionally, the data collected and developed into demographic and housing profiles will be a resource to housing authorities and regional leaders.
• Engagement. Regional stakeholders must consider the findings contained in the FHEA. In central Arkansas, those stakeholders include the consortium, called Imagine Central Arkansas Partners (ICAP), the Regional Planning Advisory Council (RCAP), Metroplan’s Board of Directors, and public housing authorities.
• Integration. Grantees must determine how the FHEA findings will be used to inform decision-making, prioritization and investment. This report will be used to inform decision-making, prioritization and investment in two ways. First, information contained herein will be used to develop the housing element of the regional plan, and will also help inform the other plan elements. Once adopted by the Metroplan Board of Directors, Imagine Central Arkansas will be the resource for encouraging and developing projects that implement the plan vision. In particular, transportation
1. inTroduCTion
10FAIR HOUSING EQUITY ASSESSMENT |
VERSION 2 DRAFT FOR REVIEW 3/31/2015
10
About This Report
In 2011, Metroplan received a Sustainable Communities Regional Planning Grant from the US Department of Housing and Urban Development (HUD) to craft a sustainable development vision and strategies. The Imagine Central Arkansas project culminated in late 2014 with the adoption of a regional long-range plan that will laid out a blueprint of recommendations for transportation, development, maintaining healthy lifestyles, environment and energy, and economic vitality.
As part of this process, the Regional Fair Housing Equity Assessment (FHEA) identifies how land use, zoning, market forces and other factors shape access
to housing and other opportunities for the region’s racial and ethnic minorities. The FHEA is an invaluable tool for planning, and creating more diverse and equitable communities. This assessment not only informs the development of the Imagine Central Arkansas plan, but also serves as a stand-alone reference document for housing and government decision makers.
Process and Methodology
This document serves as partial fulfillment of the HUD Sustainable Communities grant agreement. There are three key deliverables in completing the FHEA requirement. They are:
• Product. Grantees must produce a Fair Housing Equity Assessment that will serve either as a stand-alone document or one
that will be integrated into the regional plan. Information contained in this
The purpose of Jump Start is to
demonstrate how the Livability
Principles can be integrated into
community design and implemented
in existing communities to impact
the larger region. Up to seven
plans for specific neighborhoods/
communities will be created, which
will integrate housing design,
development economics, municipal
codes and regulations, and supportive
infrastructure investments. These
sub-area plans will advance
implementation of Imagine Central
Arkansas.
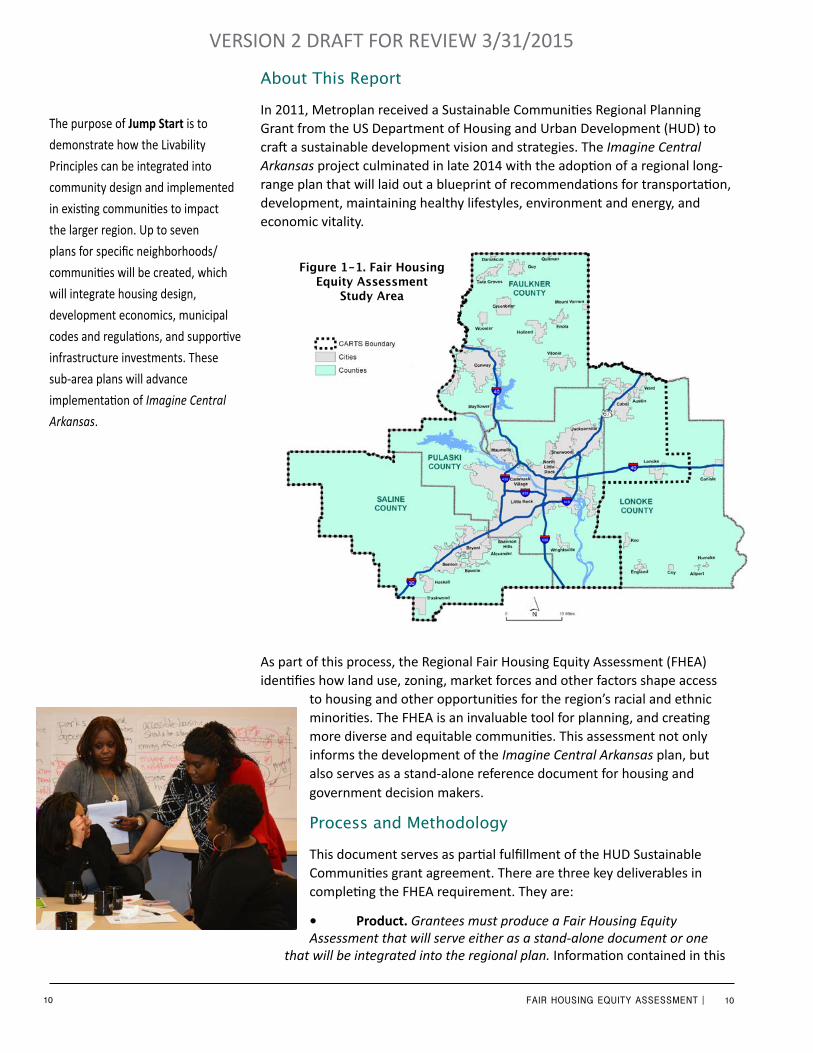
Figure 1-1. Fair Housing Equity Assessment
Study Area

11FAIR HOUSING EQUITY ASSESSMENT |
VERSION 2 DRAFT FOR REVIEW 3/31/2015
ICAP members shared ideas at a meeting in 2013.
An ICAP member drew this spontaneous diagram illustrating the interconnected relationship between medical facilities, educational institutions and employment.
FHEA will be integrated into the overall long-range planning process, and the full report will be appended to Imagine Central Arkansas. Additionally, the data collected and developed into demographic and housing profiles will be a resource to housing authorities and regional leaders.
• Engagement. Regional stakeholders must consider the findings contained in the FHEA. In central Arkansas, those stakeholders include the consortium, called Imagine Central Arkansas Partners (ICAP), the Regional Planning Advisory Council (RCAP), Metroplan’s Board of Directors, and public housing authorities.
• Integration. Grantees must determine how the FHEA findings will be used to inform decision-making, prioritization and investment. This report will be used to inform decision-making, prioritization and investment in two ways. First, information contained herein will be used to develop the housing element of the regional plan, and will also help inform the other plan elements. Once adopted by the Metroplan Board of Directors, Imagine Central Arkansas will be the resource for encouraging and developing
12FAIR HOUSING EQUITY ASSESSMENT |
VERSION 2 DRAFT FOR REVIEW 3/31/2015
projects that implement the plan vision. In particular, transportation projects receiving federal funds must be pulled from the adopted regional plan. Secondly, the geographies of opportunities identified in this report are incorporated into the criteria for selecting Jump Start areas. The Jump Start concept is a cornerstone of the Sustainable Communities scope and Imagine Central Arkansas.
The Central Arkansas Regional Transportation Study (CARTS) area includes all of Pulaski County, Saline County, Faulkner County and much of Lonoke County. The study area designated by the HUD grant, and therefore included in this FHEA, encompasses the CARTS area plus the entirety of Lonoke County.
The FHEA is the product of a highly collaborative partnership, including: Metroplan, the Imagine Central Arkansas Partners, the Regional Planning Advisory Council, and the seven public housing authorities located in the four county study area. Data sets provided by Department of Housing and Urban Development (HUD) were used extensively and were supplemented by locally-developed data. Metroplan’s Geographic Information System (GIS) department was instrumental in preparing and illustrating those data.
Figure 1-2. Community Conversation Sites
13FAIR HOUSING EQUITY ASSESSMENT |
VERSION 2 DRAFT FOR REVIEW 3/31/2015
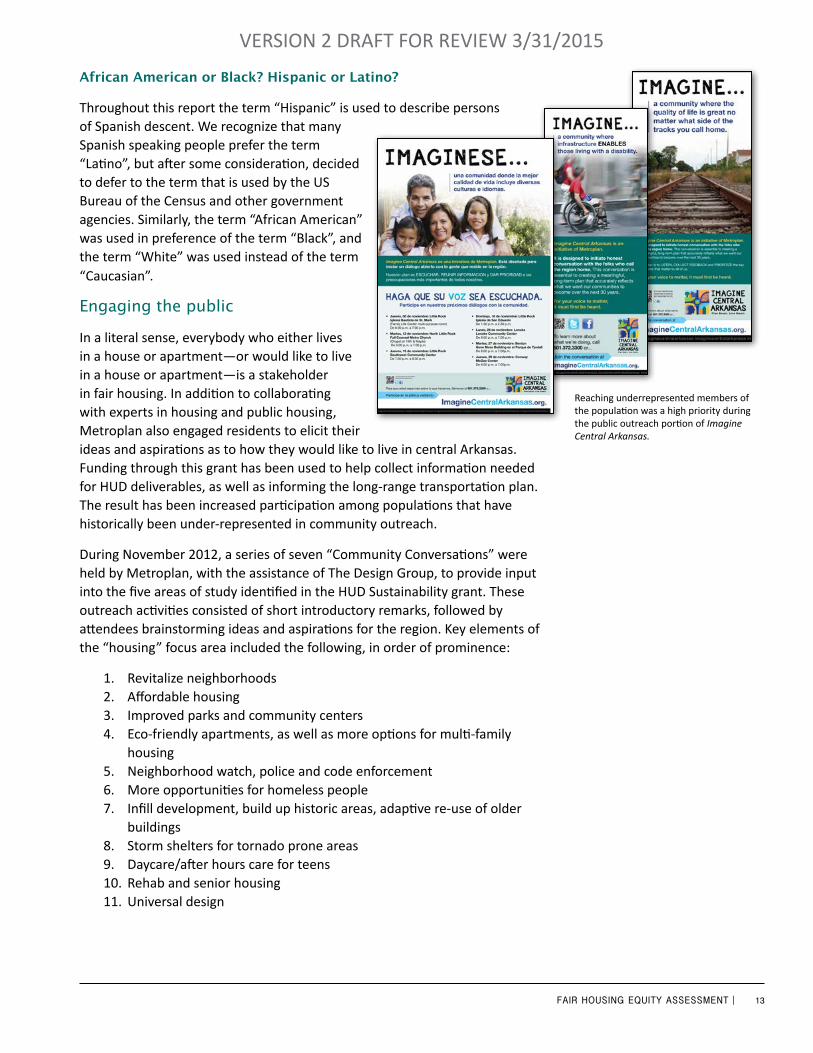
African American or Black? Hispanic or Latino?
Throughout this report the term “Hispanic” is used to describe persons of Spanish descent. We recognize that many Spanish speaking people prefer the term “Latino”, but after some consideration, decided to defer to the term that is used by the US Bureau of the Census and other government agencies. Similarly, the term “African American” was used in preference of the term “Black”, and the term “White” was used instead of the term “Caucasian”.
Engaging the public
In a literal sense, everybody who either lives in a house or apartment—or would like to live in a house or apartment—is a stakeholder in fair housing. In addition to collaborating with experts in housing and public housing, Metroplan also engaged residents to elicit their ideas and aspirations as to how they would like to live in central Arkansas. Funding through this grant has been used to help collect information needed for HUD deliverables, as well as informing the long-range transportation plan. The result has been increased participation among populations that have historically been under-represented in community outreach.
During November 2012, a series of seven “Community Conversations” were held by Metroplan, with the assistance of The Design Group, to provide input into the five areas of study identified in the HUD Sustainability grant. These outreach activities consisted of short introductory remarks, followed by attendees brainstorming ideas and aspirations for the region. Key elements of the “housing” focus area included the following, in order of prominence:
1. Revitalize neighborhoods2. Affordable housing3. Improved parks and community centers4. Eco-friendly apartments, as well as more options for multi-family
housing5. Neighborhood watch, police and code enforcement6. More opportunities for homeless people7. Infill development, build up historic areas, adaptive re-use of older
buildings8. Storm shelters for tornado prone areas9. Daycare/after hours care for teens10. Rehab and senior housing11. Universal design
Reaching underrepresented members of the population was a high priority during the public outreach portion of Imagine Central Arkansas.
14FAIR HOUSING EQUITY ASSESSMENT |
VERSION 2 DRAFT FOR REVIEW 3/31/2015
Advisory Group
A Housing Advisory Group assisted in the development of this report. Members acted as resources and evaluators and provided ongoing feedback and advice. Following are members of the Housing Task Force.
• Becky Adams, Arkansas Department of Health• Debra Banks, ACHANGE• Stephen Copley, Housing Arkansas• Steve Eichhorn, Benton Public Housing Authority• Jennifer Dillaha, Arkansas Department of Health• Jada Johnson, Metropolitan Housing Alliance• Karen Lovelace, Pulaski County• Michael Mason, HUD• Vanessa Nehus, Partners for Inclusive Communities• Laverne Paige, Pulaski County• Doris Smith, Mainstream• Belinda Snow, NLR Housing Authority• Lou Tobian, AARP• LaTonya Wilson, Metropolitan Housing Alliance
The following chapters document and explore
• population and housing• barriers to affordable housing• race• ethnicity and poverty• homelessness• housing discrimination• geographies of opportunity. • The final chapter recommends strategies and actions for increasing
access to decent and affordable housing within the region and identifies areas for continued data collection and analysis.

15FAIR HOUSING EQUITY ASSESSMENT |
VERSION 2 DRAFT FOR REVIEW 3/31/2015
The central Arkansas urban region is the largest metropolitan area in the state of Arkansas. The 2010 census gave the region a population of 699,757, and by 2013 that had reached 721,568. Since 2010, the region has gained population at a 1.1 percent annualized rate, compared with 0.7 percent for the U.S. as a whole, and 0.5 percent for the state of Arkansas. In 2010, the region accounted for 24 percent of the state’s population.
In recent decades, the bulk of the region’s growth has occurred in its suburban and exurban areas. Pulaski County, which contains two of the region’s three largest cities, grew quickly through the late 1970s, averaging approximately 1.7 percent annualized growth in the decade 1970–1980. Growth then slowed to a near-halt, averaging just 0.3 percent annually through the year 2000. Since that time, the population of Pulaski County has increased modestly, to a 0.6 percent annualized pace between 2000–2010, and in-migration and out-migration is showing signs of evening out.
Outlying counties have grown at a fast pace since about the year 1960. Populations in both Faulkner and Saline counties grew from small, predominantly rural areas under 30,000 to being more suburban, with populations over 100,000 each by 2010. Lonoke County, which had more population than either Faulkner or Saline counties as recently as 1950, also grew but not as quickly, reaching nearly 70,000 by 2010.i
The region has an overall racial breakdown similar to much of the American South, with a large White majority and a sizeable African American minority. In recent years the region has also (again, like the nation) seen rapid growth in Hispanic and Asian population groups. For example, Hispanics grew by over 150 percent for two succeeding decades, reaching two percent of regional population by 2010. Asians grew nearly as fast, accounting for a bit over 1 percent of regional population by 2010.
The region’s racial breakdown differs, of course, by community. As with many U.S. urban areas, the central county (Pulaski) has greater racial diversity than the outlying counties. For example, Pulaski County was 55 percent White, 35 percent African American, and about 10 percent “other” in 2010. Saline County had the least racial diversity among the region’s large counties, with 89 percent White, nearly 4.9 percent African American, and about six percent other, in 2010.ii However, Saline County also saw its African American population more than double from the 2.3 percent in 2000.
2. The liTTle roCk-norTh liTTle roCk-Conway MeTro area: an overview
Hendrix Village in Conway, Faulkner County
iNote that Hispanics are counted in this analysis as a separate ethnic group. Thus the figures for White, African American, and other populations represent the “non-Hispanic” portions of those groups.
iiTechnically, the highest percentage of Whites was Grant County, with 94 percent in 2010, and Perry County was close with 93.6 percent, but these counties remain predominantly rural and remain outside the FHEA study area.
16FAIR HOUSING EQUITY ASSESSMENT |
VERSION 2 DRAFT FOR REVIEW 3/31/2015
In most other basic demographic aspects, the region differs little from the nation. Regional median age was 35.7 in 2010, slightly younger than the U.S. average of 37.2. Faulkner County, with a proportionately large college population, has the region’s youngest median age at 31.5, while Saline County was the oldest, at 38.8. Saline County’s greater overall age correlates in part with its large White population, which is generally older than minority groups, and with the sizeable Hot Springs Village unincorporated retirement community located at the county’s western edge. Regional household size, at 2.45 persons per household, is a bit below the national average of 2.58, but varies considerably between different communities. Regional incomes and education levels are also close to, but slightly below, the national average.
Faulkner County
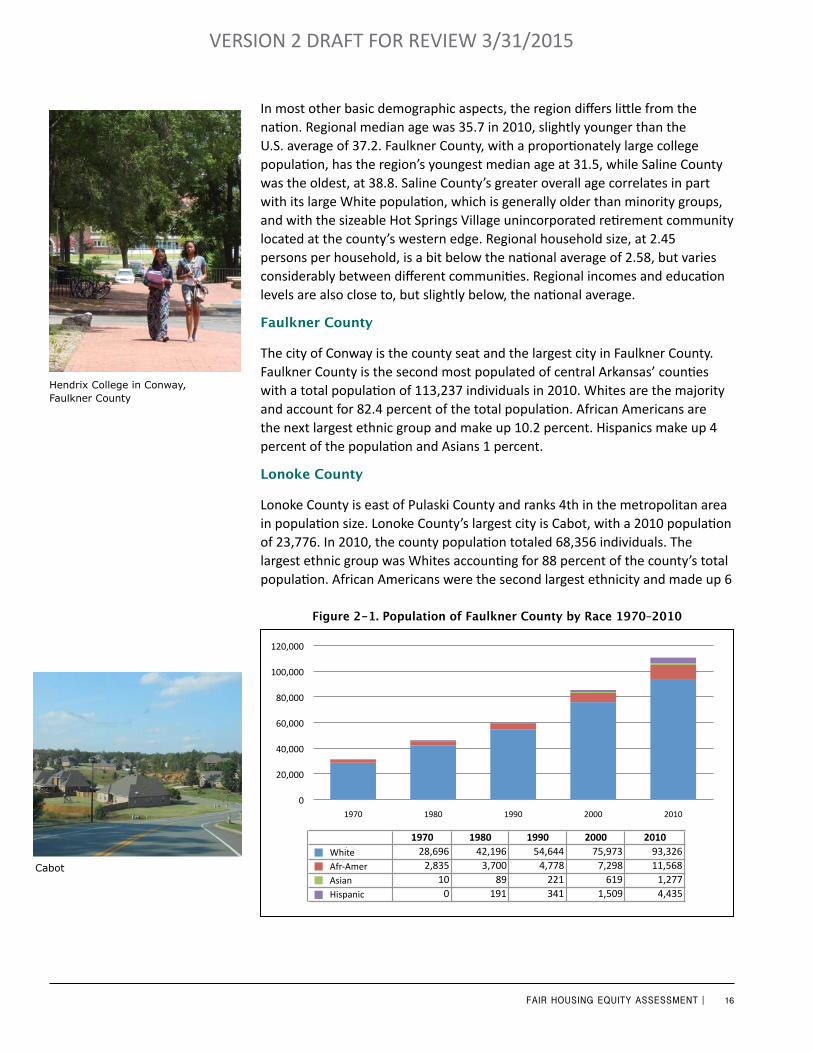
The city of Conway is the county seat and the largest city in Faulkner County. Faulkner County is the second most populated of central Arkansas’ counties with a total population of 113,237 individuals in 2010. Whites are the majority and account for 82.4 percent of the total population. African Americans are the next largest ethnic group and make up 10.2 percent. Hispanics make up 4 percent of the population and Asians 1 percent.
Lonoke County
Lonoke County is east of Pulaski County and ranks 4th in the metropolitan area in population size. Lonoke County’s largest city is Cabot, with a 2010 population of 23,776. In 2010, the county population totaled 68,356 individuals. The largest ethnic group was Whites accounting for 88 percent of the county’s total population. African Americans were the second largest ethnicity and made up 6
0
20,000
40,000
60,000
80,000
100,000
120,000
1970 1980 1990 2000 2010
Popula'on of Faulkner County by Race 1970 -‐2010
White Black Asian Hispanic
Figure 2-1. Population of Faulkner County by Race 1970–2010
1970 1980 1990 2000 2010White 28,696 42,196 54,644 75,973 93,326Black 2,835 3,700 4,778 7,298 11,568Asian 10 89 221 619 1,277Hispanic 0 191 341 1,509 4,435
Hendrix College in Conway, Faulkner County
Cabot
WhiteAfr-AmerAsianHispanic
17FAIR HOUSING EQUITY ASSESSMENT |
VERSION 2 DRAFT FOR REVIEW 3/31/2015
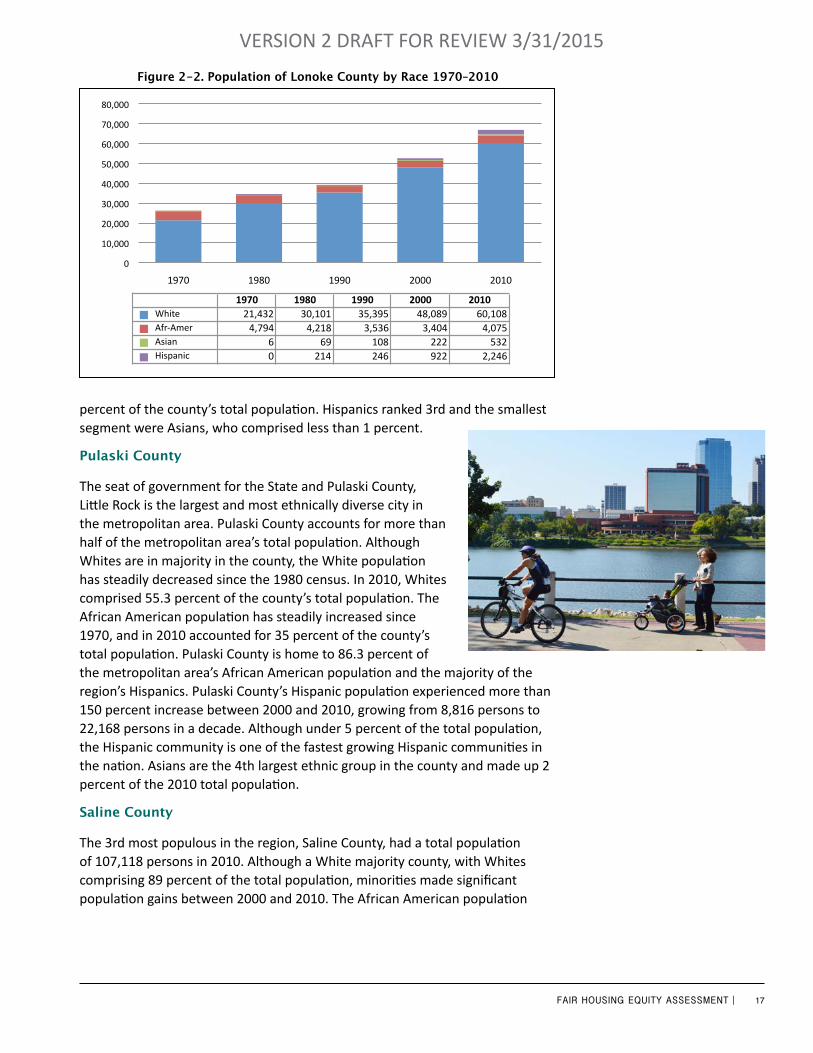
percent of the county’s total population. Hispanics ranked 3rd and the smallest segment were Asians, who comprised less than 1 percent.
Pulaski County
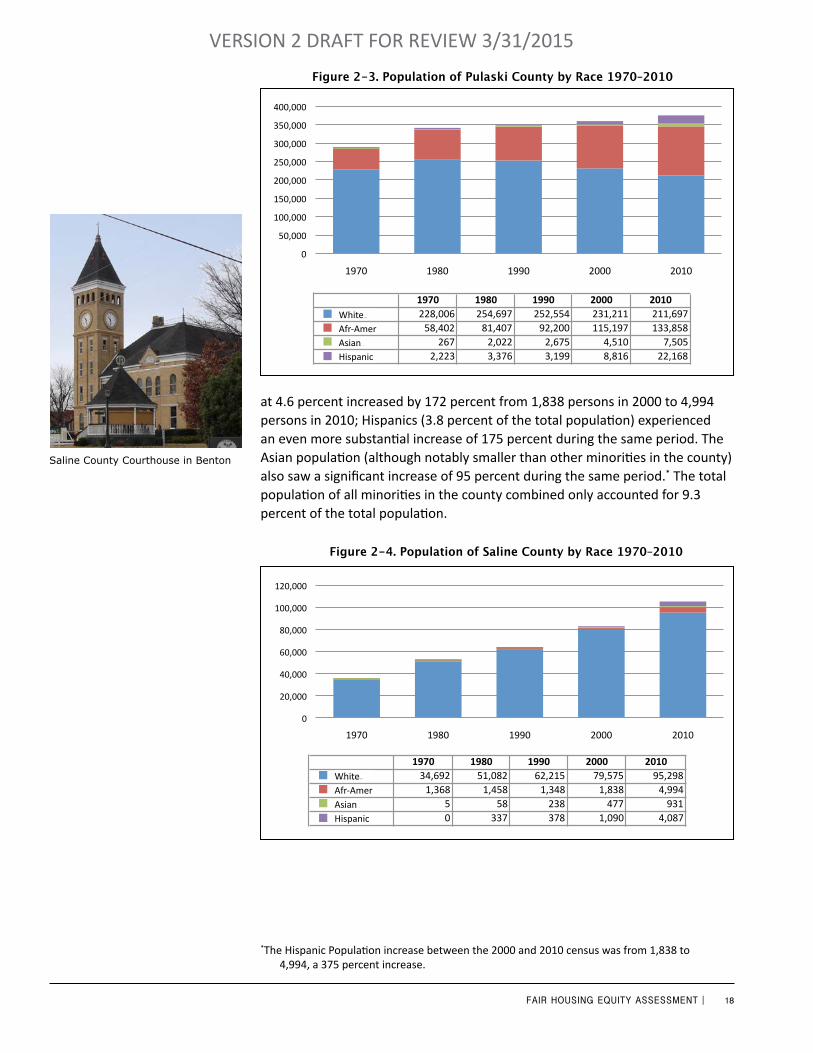
The seat of government for the State and Pulaski County, Little Rock is the largest and most ethnically diverse city in the metropolitan area. Pulaski County accounts for more than half of the metropolitan area’s total population. Although Whites are in majority in the county, the White population has steadily decreased since the 1980 census. In 2010, Whites comprised 55.3 percent of the county’s total population. The African American population has steadily increased since 1970, and in 2010 accounted for 35 percent of the county’s total population. Pulaski County is home to 86.3 percent of the metropolitan area’s African American population and the majority of the region’s Hispanics. Pulaski County’s Hispanic population experienced more than 150 percent increase between 2000 and 2010, growing from 8,816 persons to 22,168 persons in a decade. Although under 5 percent of the total population, the Hispanic community is one of the fastest growing Hispanic communities in the nation. Asians are the 4th largest ethnic group in the county and made up 2 percent of the 2010 total population.
Saline County
The 3rd most populous in the region, Saline County, had a total population of 107,118 persons in 2010. Although a White majority county, with Whites comprising 89 percent of the total population, minorities made significant population gains between 2000 and 2010. The African American population
0
10,000
20,000
30,000
40,000
50,000
60,000
70,000
80,000
1970 1980 1990 2000 2010
Popula'on of Lonoke County by Race 1970 -‐ 2010
White Black Asian Hispanic
Figure 2-2. Population of Lonoke County by Race 1970–2010
1970 1980 1990 2000 2010White 21,432 30,101 35,395 48,089 60,108Black 4,794 4,218 3,536 3,404 4,075Asian 6 69 108 222 532Hispanic 0 214 246 922 2,246
WhiteAfr-AmerAsianHispanic
18FAIR HOUSING EQUITY ASSESSMENT |
VERSION 2 DRAFT FOR REVIEW 3/31/2015
at 4.6 percent increased by 172 percent from 1,838 persons in 2000 to 4,994 persons in 2010; Hispanics (3.8 percent of the total population) experienced an even more substantial increase of 175 percent during the same period. The Asian population (although notably smaller than other minorities in the county) also saw a significant increase of 95 percent during the same period.* The total population of all minorities in the county combined only accounted for 9.3 percent of the total population.
0
50,000
100,000
150,000
200,000
250,000
300,000
350,000
400,000
1970 1980 1990 2000 2010
Popula'on of Pulaski County by Race 1970 -‐2010
White Black Asian Hispanic
Figure 2-3. Population of Pulaski County by Race 1970–2010
1970 1980 1990 2000 2010White 228,006 254,697 252,554 231,211 211,697Black 58,402 81,407 92,200 115,197 133,858Asian 267 2,022 2,675 4,510 7,505Hispanic 2,223 3,376 3,199 8,816 22,168
0
20,000
40,000
60,000
80,000
100,000
120,000
1970 1980 1990 2000 2010
Popula'on of Saline County by Race 1970 -‐ 2010
White Black Asian Hispanic
Figure 2-4. Population of Saline County by Race 1970–2010
1970 1980 1990 2000 2010White 34,692 51,082 62,215 79,575 95,298Black 1,368 1,458 1,348 1,838 4,994Asian 5 58 238 477 931Hispanic 0 337 378 1,090 4,087
Saline County Courthouse in Benton
*The Hispanic Population increase between the 2000 and 2010 census was from 1,838 to 4,994, a 375 percent increase.
WhiteAfr-AmerAsianHispanic
WhiteAfr-AmerAsianHispanic

19FAIR HOUSING EQUITY ASSESSMENT |
VERSION 2 DRAFT FOR REVIEW 3/31/2015
3. hisToryFrom Plessy to the Present: Race and Housing in Central Arkansas from the end of the 19th Century to the Beginning of the 21st Century
1896-1970
While this is a very local history, it is set in a decidedly national context. It is shaped by federal policy and funding no less than by the racial and class prejudices of our citizens. It is embroiled by the vast sprawl of the 20th century’s love affair with and ultimate subjugation to the automobile and its impact on American cities. It is a story that started in the late 19th century as attempts were made to preserve the antebellum social order and later evolved into one of segregation primarily by income, but retaining a strong racial overtone.
In the Arkansas Times, local historians John Kirk and Jess Porter noted that “the city’s [Little Rock] current geographically segregated housing patterns have been consciously created by public policy, with private sector collusion, since the 1950s.”1 Kirk and Porter maintain that the decision to expand the city and create racially segregated neighborhoods were invariably connected to two historical milestones—the 1954 [Brown v. Board of Education] decision to desegregate public schools and the passage of the Civil Rights Act of 1964.
Although not directly linked to housing, these events would be a guiding force in development and planning in central Arkansas for the sixty years that followed the Brown decision. Before 1949, pragmatisms and proximity drove development in Little Rock. “There were no laws to prohibit African Americans and Whites from living in the same area”, so residential development consisted of a network of “pepper and salt” neighborhoods. The exception to this integration was found in the city’s vast social, business, religious, and educational institutions that assured that although African Americans and Whites of the city occupied the same geographic space, they were, in fact, two distinct and separate communities.2
It was in these pockets, corners, crannies, buildings, and churches that the African American community gathered. In the African American business district of the city, located on 9th Street, there were African American insurance companies, doctors, lawyers, pharmacists, churches and dance halls, all a scant few blocks from white businesses and homes. Little Rock’s African American community had shared this geographic space and maintained this duality since the end of Reconstruction and the passage of the Plessy decision’s “Separate but Equal” ruling.
The issue of race and housing came to the national forefront as African Americans living in southern states began migrating en masse to industrial centers in the north. This migration placed additional strain on housing availability and often migrating African Americans found themselves living alongside ethnic minorities that they were competing against for jobs. The
Red's Pool Hall and the Gem Theatre were popular destinations on 9th Street. Courtesy of Tom Dillard Private Collection, Butler Center for Arkansas Studies.
20FAIR HOUSING EQUITY ASSESSMENT |
VERSION 2 DRAFT FOR REVIEW 3/31/2015
situation was exacerbated as Whites living near these growing poor African American neighborhoods realized that their property values were plummeting due to the proximity of their homes to those of African Americans. In hopes of maintaining property values, Whites turned to city leaders, who in response passed ordinances copying the practice of private developers who had pioneered racially exclusive covenants in their developments. These new ordinances created racially exclusive zoning. The issue reached its apex in 1917, when the Supreme Court ruled in Buchanan v. Warley that racially exclusive zoning violated the 14th Amendment’s Equal Protection Clause and was therefore an infringement on the rights of African American citizens.
Although the Buchanan v. Warley decision prohibited racially exclusive ordinances, it did not impede owners of property from writing agreements or contracts which would exclude the sale of property to minorities. Racially restrictive covenants allowed Whites to maintain “All-White” neighborhoods by placing agreements in deeds that required that property be sold only to members of the Caucasian race. The use of these covenants was challenged in 1926 in a Supreme Court case, Corrigan v. Buckley, but the court upheld property owners’ rights and thereby substantiated the practice.
In 1924, Herbert Hoover’s US Department of Commerce promulgated its model enabling act for zoning and urged its adoption nationwide. In 1926 in the famous Euclid v Ambler case, the Supreme Court upheld the use of the police power through zoning to exclude uses from certain areas of a community. The trial judge in the case, Judge Dale Westenhaver, commented that “In the last analysis, the result to be accomplished is to classify the population and to segregate them by income or situation in life.” The High Court stated that “The serious question in the case arises over the provisions of the ordinance excluding from residential districts apartment houses, business houses, retail stores and shops, and other like establishments.” The principle of exclusionary or “Euclidean” zoning became the foundation for the planning and zoning of American cities to this day. Euclidean zoning formed the basis for US Department of Commerce’s model enabling legislation and of the US Department of Housing and Urban Development’s 701 program, which funded the development of community master plans and zoning ordinances across the United States into the 1970s.3
Housing patterns, particularly amongst the poor, began to change nationally in 1933, when the first public housing was built. These housing projects were the first racially exclusive public housing and were the first to attempt to separate the races geographically. The decision to segregate the poor by race after the Depression’s 1929 Housing Programs is the origin of the racially exclusive ghetto in the United States.4
Also of conspicuous note in 1933, the Home Ownership Loan Corporation was formed by President Franklin Roosevelt to help rescue both banks and borrowers in the teeth of the Great Depression. The HOLC was noteworthy for

21FAIR HOUSING EQUITY ASSESSMENT |
VERSION 2 DRAFT FOR REVIEW 3/31/2015
inventing and perfecting the long-term fixed rate mortgage. It refinanced over one million loans and laid the foundation for the suburban boom after WWII. Equally important was its creation of a uniform system of property appraisal that laid the basis for the large-scale inflow of private capital that made it easier to finance homes. The HOLC appraisal methods also did great damage. The agency established four categories of neighborhoods. It favored newly built subdivisions over older ones. Traditional layouts and streetcar suburbs were downgraded. It rated a neighborhood’s ethnic character as well. The lowest rating was reserved for African American districts and districts of mixed race. These areas were delineated in red. For decades afterward, private banks used these maps to guide lending decisions, giving rise to the term red-lining.
In 1934, the Federal Housing Administration took over from the HOLC. FHA had a mission of reviving house construction by insuring mortgage loans made by private banks. Its guidelines and controls maintained the HOLC appraisal system and went far beyond it to shape the design of new housing and new communities. “If a neighborhood is to retain stability,” the FHA’s underwriting manual said, “it is necessary that properties shall continue to be occupied by the same social and racial class.” The agency denied insurance to new housing in towns that lacked zoning or passed ordinances that allowed the density of existing neighborhoods to increase. It recommended and often insisted on restrictive covenants covering race, house design and maintenance. FHA design standards specified minimums for lot sizes, front and side set backs and the width of the house. Grid street patterns were strongly discouraged in favor of superblocks and cul-de-sacs. While FHA guidelines were presented as mere recommendations, financing was all but unobtainable for builders who failed to conform. The sprawl pattern that we take as the market norm today was laid down by the federal government in the 1930s and 40s and enforced upon the nation in the decades since. The housing patterns we have today with all of their effects on segregation by class were only partly market-driven, and can be attributed in part to massive interference in the market by the federal government.5
Segregation suffered a major setback after World War II when the NAACP brought a challenge to racially restrictive covenants before the Supreme Court. In Shelley v. Kraemer the court ruled that although property owners could voluntarily participate in racially restrictive covenants, local and state governments could no longer enforce these agreements because they violated the Equal Protection clause of the 14th Amendment. The Shelley v. Kraemer decision ruled the public enforcement of racially restrictive covenants unconstitutional and thereby closed another method used to maintain racially homogenous neighborhoods.
Segregationists were not deterred and saw in federal Housing Act of 1949 another tool to sustain all white neighborhoods. Originally intended to be a post-Second World War beautification program, cities around the nation,
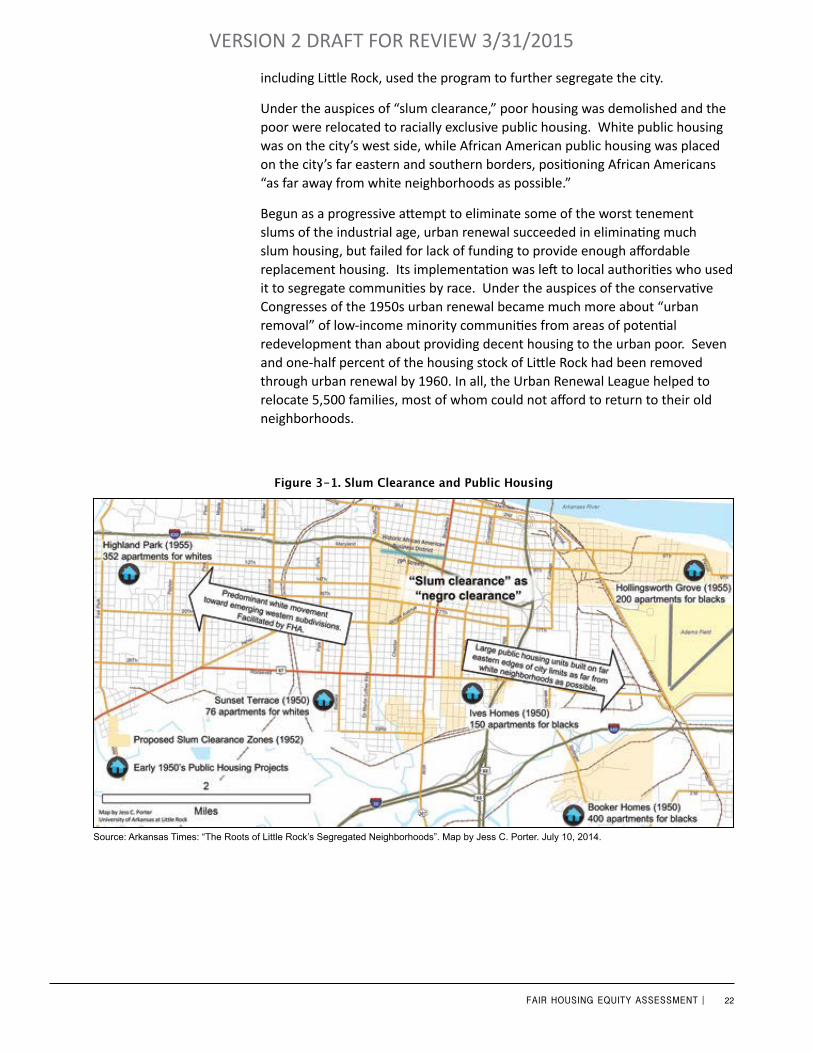
22FAIR HOUSING EQUITY ASSESSMENT |
VERSION 2 DRAFT FOR REVIEW 3/31/2015
including Little Rock, used the program to further segregate the city.
Under the auspices of “slum clearance,” poor housing was demolished and the poor were relocated to racially exclusive public housing. White public housing was on the city’s west side, while African American public housing was placed on the city’s far eastern and southern borders, positioning African Americans “as far away from white neighborhoods as possible.”
Begun as a progressive attempt to eliminate some of the worst tenement slums of the industrial age, urban renewal succeeded in eliminating much slum housing, but failed for lack of funding to provide enough affordable replacement housing. Its implementation was left to local authorities who used it to segregate communities by race. Under the auspices of the conservative Congresses of the 1950s urban renewal became much more about “urban removal” of low-income minority communities from areas of potential redevelopment than about providing decent housing to the urban poor. Seven and one-half percent of the housing stock of Little Rock had been removed through urban renewal by 1960. In all, the Urban Renewal League helped to relocate 5,500 families, most of whom could not afford to return to their old neighborhoods.
Figure 3-1. Slum Clearance and Public Housing
Source: Arkansas Times: “The Roots of Little Rock’s Segregated Neighborhoods”. Map by Jess C. Porter. July 10, 2014.
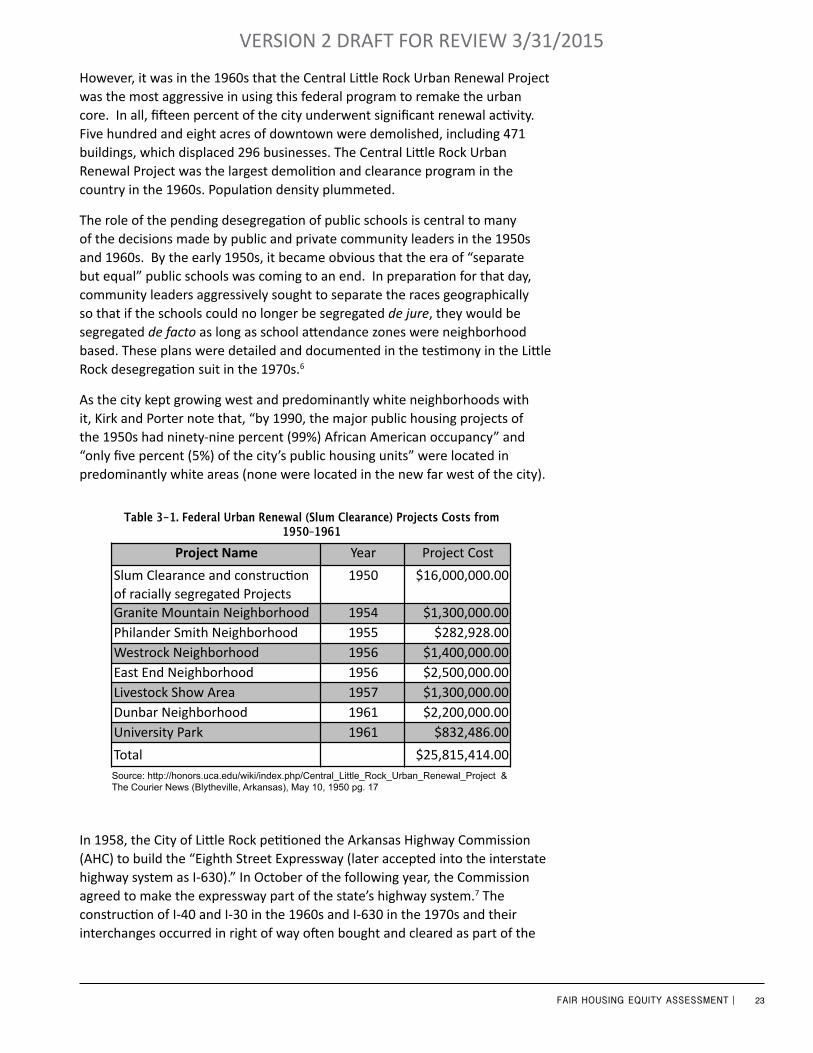
23FAIR HOUSING EQUITY ASSESSMENT |
VERSION 2 DRAFT FOR REVIEW 3/31/2015
However, it was in the 1960s that the Central Little Rock Urban Renewal Project was the most aggressive in using this federal program to remake the urban core. In all, fifteen percent of the city underwent significant renewal activity. Five hundred and eight acres of downtown were demolished, including 471 buildings, which displaced 296 businesses. The Central Little Rock Urban Renewal Project was the largest demolition and clearance program in the country in the 1960s. Population density plummeted.
The role of the pending desegregation of public schools is central to many of the decisions made by public and private community leaders in the 1950s and 1960s. By the early 1950s, it became obvious that the era of “separate but equal” public schools was coming to an end. In preparation for that day, community leaders aggressively sought to separate the races geographically so that if the schools could no longer be segregated de jure, they would be segregated de facto as long as school attendance zones were neighborhood based. These plans were detailed and documented in the testimony in the Little Rock desegregation suit in the 1970s.6
As the city kept growing west and predominantly white neighborhoods with it, Kirk and Porter note that, “by 1990, the major public housing projects of the 1950s had ninety-nine percent (99%) African American occupancy” and “only five percent (5%) of the city’s public housing units” were located in predominantly white areas (none were located in the new far west of the city).
In 1958, the City of Little Rock petitioned the Arkansas Highway Commission (AHC) to build the “Eighth Street Expressway (later accepted into the interstate highway system as I-630).” In October of the following year, the Commission agreed to make the expressway part of the state’s highway system.7 The construction of I-40 and I-30 in the 1960s and I-630 in the 1970s and their interchanges occurred in right of way often bought and cleared as part of the
Project Name Year Project Cost
Slum Clearance and construc3on of racially segregated Projects
1950 $16,000,000.00
Granite Mountain Neighborhood 1954 $1,300,000.00 Philander Smith Neighborhood 1955 $282,928.00 Westrock Neighborhood 1956 $1,400,000.00 East End Neighborhood 1956 $2,500,000.00 Livestock Show Area 1957 $1,300,000.00 Dunbar Neighborhood 1961 $2,200,000.00 University Park 1961 $832,486.00
Total $25,815,414.00
Federal Urban Renewal (Slum Clearance) Projects Costs from 1950 -‐1961
Source: http://honors.uca.edu/wiki/index.php/Central_Little_Rock_Urban_Renewal_Project & The Courier News (Blytheville, Arkansas), May 10, 1950 pg. 17
Table 3-1. Federal Urban Renewal (Slum Clearance) Projects Costs from 1950–1961
Source: http://honors.uca.edu/wiki/index.php/Central_Little_Rock_Urban_Renewal_Project & The Courier News (Blytheville, Arkansas), May 10, 1950 pg. 17
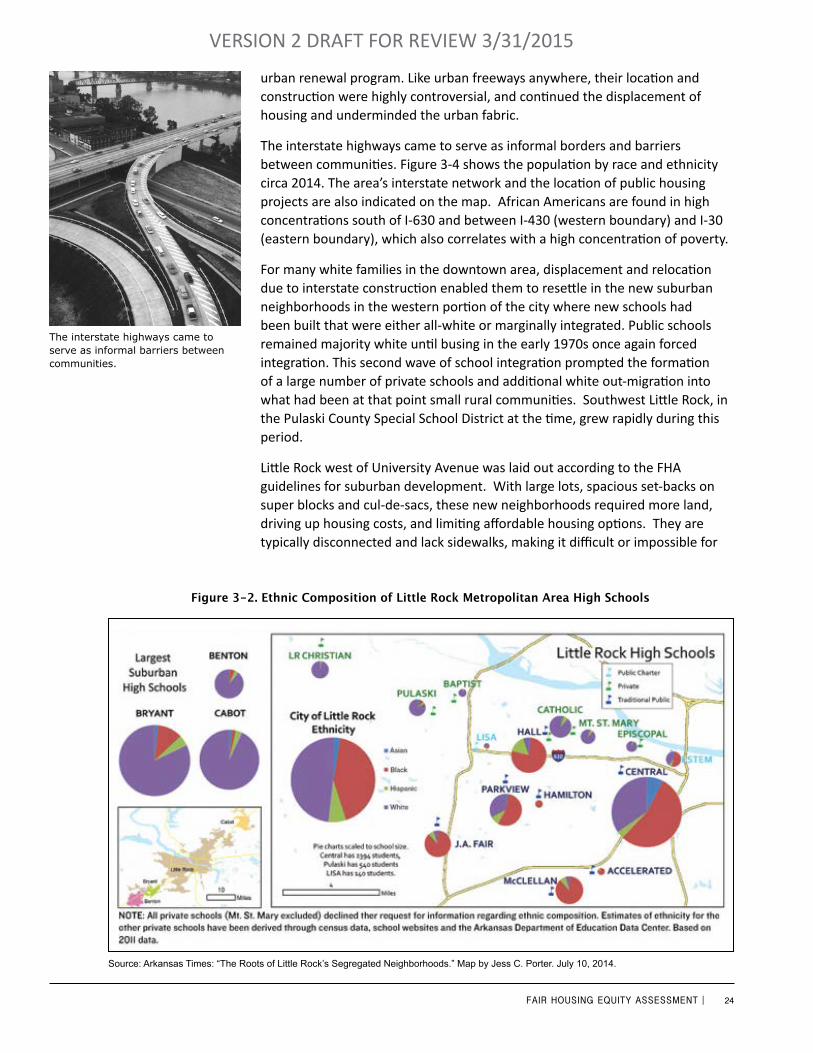
24FAIR HOUSING EQUITY ASSESSMENT |
VERSION 2 DRAFT FOR REVIEW 3/31/2015
urban renewal program. Like urban freeways anywhere, their location and construction were highly controversial, and continued the displacement of housing and underminded the urban fabric.
The interstate highways came to serve as informal borders and barriers between communities. Figure 3-4 shows the population by race and ethnicity circa 2014. The area’s interstate network and the location of public housing projects are also indicated on the map. African Americans are found in high concentrations south of I-630 and between I-430 (western boundary) and I-30 (eastern boundary), which also correlates with a high concentration of poverty.
For many white families in the downtown area, displacement and relocation due to interstate construction enabled them to resettle in the new suburban neighborhoods in the western portion of the city where new schools had been built that were either all-white or marginally integrated. Public schools remained majority white until busing in the early 1970s once again forced integration. This second wave of school integration prompted the formation of a large number of private schools and additional white out-migration into what had been at that point small rural communities. Southwest Little Rock, in the Pulaski County Special School District at the time, grew rapidly during this period.
Little Rock west of University Avenue was laid out according to the FHA guidelines for suburban development. With large lots, spacious set-backs on super blocks and cul-de-sacs, these new neighborhoods required more land, driving up housing costs, and limiting affordable housing options. They are typically disconnected and lack sidewalks, making it difficult or impossible for
Figure 3-2. Ethnic Composition of Little Rock Metropolitan Area High Schools
Source: Arkansas Times: “The Roots of Little Rock’s Segregated Neighborhoods.” Map by Jess C. Porter. July 10, 2014.
The interstate highways came to serve as informal barriers between communities.
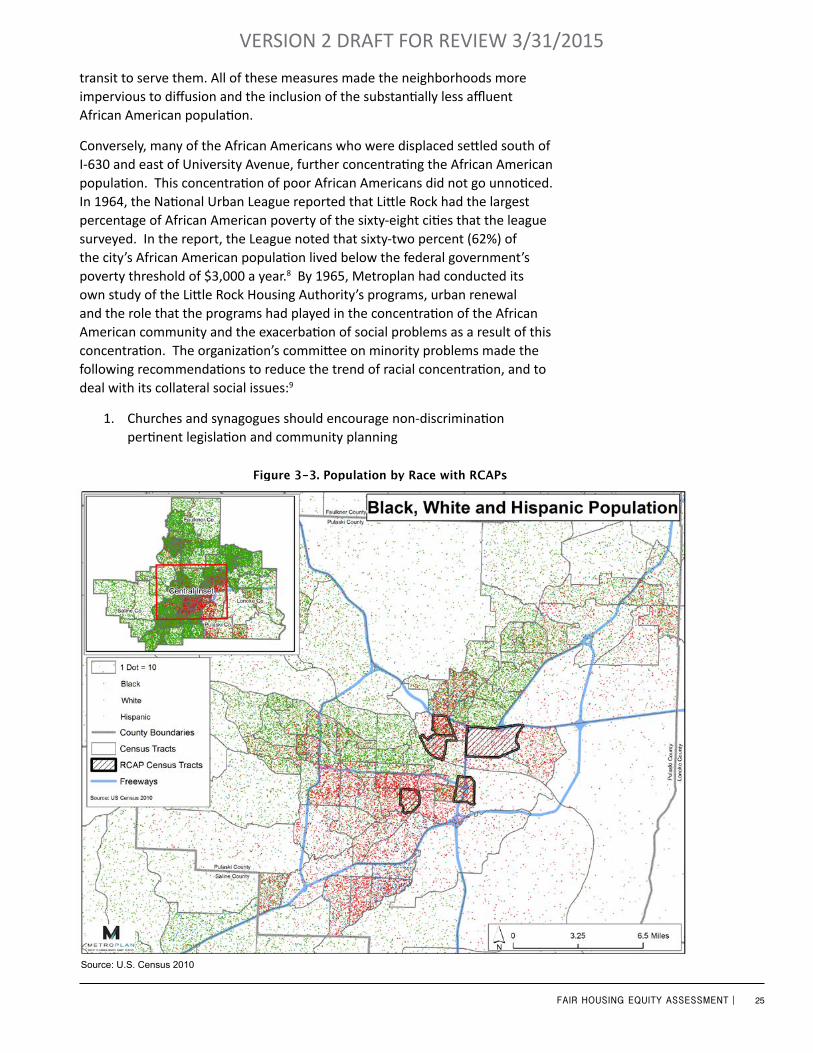
25FAIR HOUSING EQUITY ASSESSMENT |
VERSION 2 DRAFT FOR REVIEW 3/31/2015
transit to serve them. All of these measures made the neighborhoods more impervious to diffusion and the inclusion of the substantially less affluent African American population.
Conversely, many of the African Americans who were displaced settled south of I-630 and east of University Avenue, further concentrating the African American population. This concentration of poor African Americans did not go unnoticed. In 1964, the National Urban League reported that Little Rock had the largest percentage of African American poverty of the sixty-eight cities that the league surveyed. In the report, the League noted that sixty-two percent (62%) of the city’s African American population lived below the federal government’s poverty threshold of $3,000 a year.8 By 1965, Metroplan had conducted its own study of the Little Rock Housing Authority’s programs, urban renewal and the role that the programs had played in the concentration of the African American community and the exacerbation of social problems as a result of this concentration. The organization’s committee on minority problems made the following recommendations to reduce the trend of racial concentration, and to deal with its collateral social issues:9
1. Churches and synagogues should encourage non-discrimination pertinent legislation and community planning
Figure 3-3. Population by Race with RCAPs
Source: U.S. Census 2010
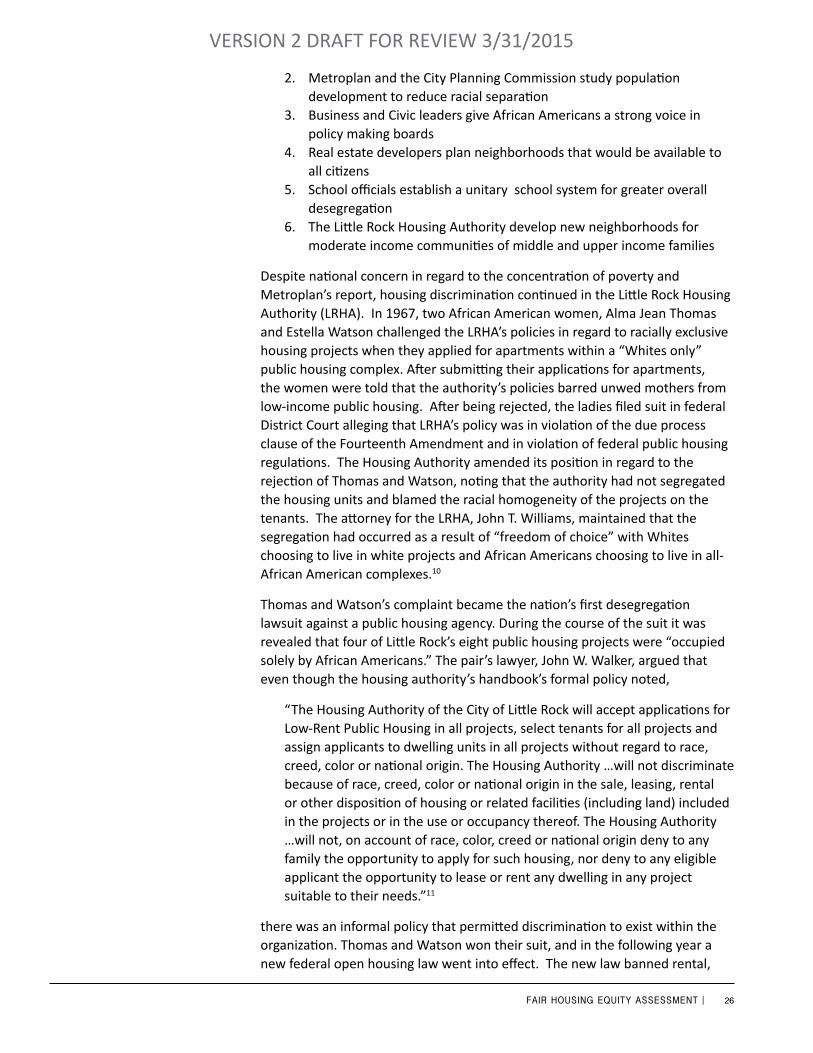
26FAIR HOUSING EQUITY ASSESSMENT |
VERSION 2 DRAFT FOR REVIEW 3/31/2015
2. Metroplan and the City Planning Commission study population development to reduce racial separation
3. Business and Civic leaders give African Americans a strong voice in policy making boards
4. Real estate developers plan neighborhoods that would be available to all citizens
5. School officials establish a unitary school system for greater overall desegregation
6. The Little Rock Housing Authority develop new neighborhoods for moderate income communities of middle and upper income families
Despite national concern in regard to the concentration of poverty and Metroplan’s report, housing discrimination continued in the Little Rock Housing Authority (LRHA). In 1967, two African American women, Alma Jean Thomas and Estella Watson challenged the LRHA’s policies in regard to racially exclusive housing projects when they applied for apartments within a “Whites only” public housing complex. After submitting their applications for apartments, the women were told that the authority’s policies barred unwed mothers from low-income public housing. After being rejected, the ladies filed suit in federal District Court alleging that LRHA’s policy was in violation of the due process clause of the Fourteenth Amendment and in violation of federal public housing regulations. The Housing Authority amended its position in regard to the rejection of Thomas and Watson, noting that the authority had not segregated the housing units and blamed the racial homogeneity of the projects on the tenants. The attorney for the LRHA, John T. Williams, maintained that the segregation had occurred as a result of “freedom of choice” with Whites choosing to live in white projects and African Americans choosing to live in all-African American complexes.10
Thomas and Watson’s complaint became the nation’s first desegregation lawsuit against a public housing agency. During the course of the suit it was revealed that four of Little Rock’s eight public housing projects were “occupied solely by African Americans.” The pair’s lawyer, John W. Walker, argued that even though the housing authority’s handbook’s formal policy noted,
“The Housing Authority of the City of Little Rock will accept applications for Low-Rent Public Housing in all projects, select tenants for all projects and assign applicants to dwelling units in all projects without regard to race, creed, color or national origin. The Housing Authority …will not discriminate because of race, creed, color or national origin in the sale, leasing, rental or other disposition of housing or related facilities (including land) included in the projects or in the use or occupancy thereof. The Housing Authority …will not, on account of race, color, creed or national origin deny to any family the opportunity to apply for such housing, nor deny to any eligible applicant the opportunity to lease or rent any dwelling in any project suitable to their needs.”11
there was an informal policy that permitted discrimination to exist within the organization. Thomas and Watson won their suit, and in the following year a new federal open housing law went into effect. The new law banned rental,
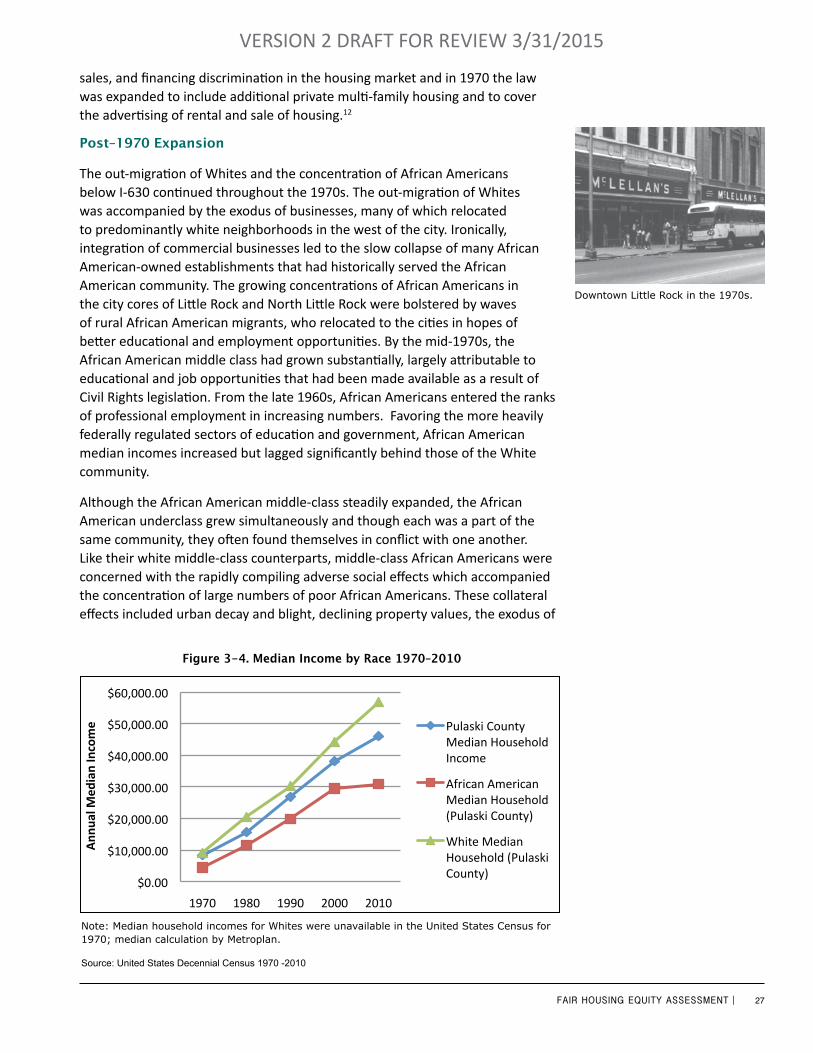
27FAIR HOUSING EQUITY ASSESSMENT |
VERSION 2 DRAFT FOR REVIEW 3/31/2015
sales, and financing discrimination in the housing market and in 1970 the law was expanded to include additional private multi-family housing and to cover the advertising of rental and sale of housing.12
Post–1970 Expansion
The out-migration of Whites and the concentration of African Americans below I-630 continued throughout the 1970s. The out-migration of Whites was accompanied by the exodus of businesses, many of which relocated to predominantly white neighborhoods in the west of the city. Ironically, integration of commercial businesses led to the slow collapse of many African American-owned establishments that had historically served the African American community. The growing concentrations of African Americans in the city cores of Little Rock and North Little Rock were bolstered by waves of rural African American migrants, who relocated to the cities in hopes of better educational and employment opportunities. By the mid-1970s, the African American middle class had grown substantially, largely attributable to educational and job opportunities that had been made available as a result of Civil Rights legislation. From the late 1960s, African Americans entered the ranks of professional employment in increasing numbers. Favoring the more heavily federally regulated sectors of education and government, African American median incomes increased but lagged significantly behind those of the White community.
Although the African American middle-class steadily expanded, the African American underclass grew simultaneously and though each was a part of the same community, they often found themselves in conflict with one another. Like their white middle-class counterparts, middle-class African Americans were concerned with the rapidly compiling adverse social effects which accompanied the concentration of large numbers of poor African Americans. These collateral effects included urban decay and blight, declining property values, the exodus of
Note: Median household incomes for Whites were unavailable in the United States Census for 1970; median calculation by Metroplan.
Source: United States Decennial Census 1970 -2010
Figure 3-4. Median Income by Race 1970–2010
$0.00
$10,000.00
$20,000.00
$30,000.00
$40,000.00
$50,000.00
$60,000.00
1970 1980 1990 2000 2010
Ann
ual M
edian Income
Median Income by Race 1970 -‐ 2010
Pulaski County Median Household Income
African American Median Household (Pulaski County)
White Median Household (Pulaski County)
Downtown Little Rock in the 1970s.
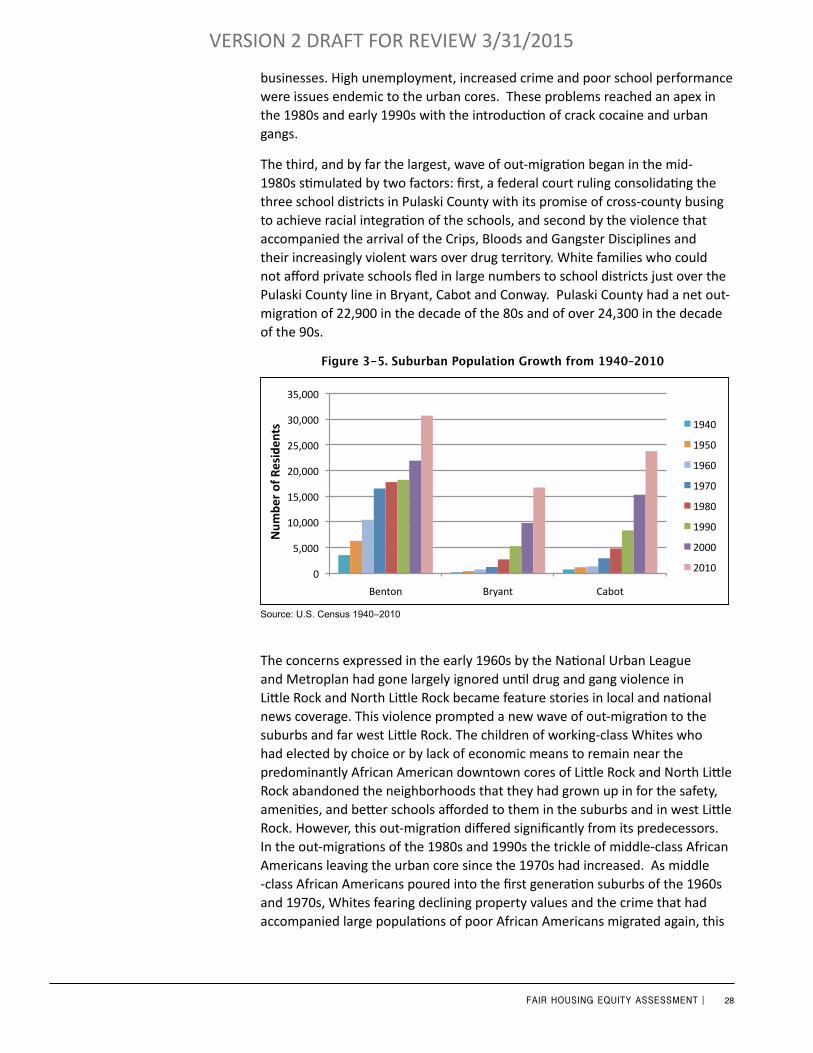
28FAIR HOUSING EQUITY ASSESSMENT |
VERSION 2 DRAFT FOR REVIEW 3/31/2015
businesses. High unemployment, increased crime and poor school performance were issues endemic to the urban cores. These problems reached an apex in the 1980s and early 1990s with the introduction of crack cocaine and urban gangs.
The third, and by far the largest, wave of out-migration began in the mid-1980s stimulated by two factors: first, a federal court ruling consolidating the three school districts in Pulaski County with its promise of cross-county busing to achieve racial integration of the schools, and second by the violence that accompanied the arrival of the Crips, Bloods and Gangster Disciplines and their increasingly violent wars over drug territory. White families who could not afford private schools fled in large numbers to school districts just over the Pulaski County line in Bryant, Cabot and Conway. Pulaski County had a net out-migration of 22,900 in the decade of the 80s and of over 24,300 in the decade of the 90s.
The concerns expressed in the early 1960s by the National Urban League and Metroplan had gone largely ignored until drug and gang violence in Little Rock and North Little Rock became feature stories in local and national news coverage. This violence prompted a new wave of out-migration to the suburbs and far west Little Rock. The children of working-class Whites who had elected by choice or by lack of economic means to remain near the predominantly African American downtown cores of Little Rock and North Little Rock abandoned the neighborhoods that they had grown up in for the safety, amenities, and better schools afforded to them in the suburbs and in west Little Rock. However, this out-migration differed significantly from its predecessors. In the out-migrations of the 1980s and 1990s the trickle of middle-class African Americans leaving the urban core since the 1970s had increased. As middle -class African Americans poured into the first generation suburbs of the 1960s and 1970s, Whites fearing declining property values and the crime that had accompanied large populations of poor African Americans migrated again, this
0
5,000
10,000
15,000
20,000
25,000
30,000
35,000
Benton Bryant Cabot
1940
1950
1960
1970
1980
1990
2000
2010
Figure 3-5. Suburban Population Growth from 1940–2010
Num
ber
of R
esid
ents
Source: U.S. Census 1940–2010
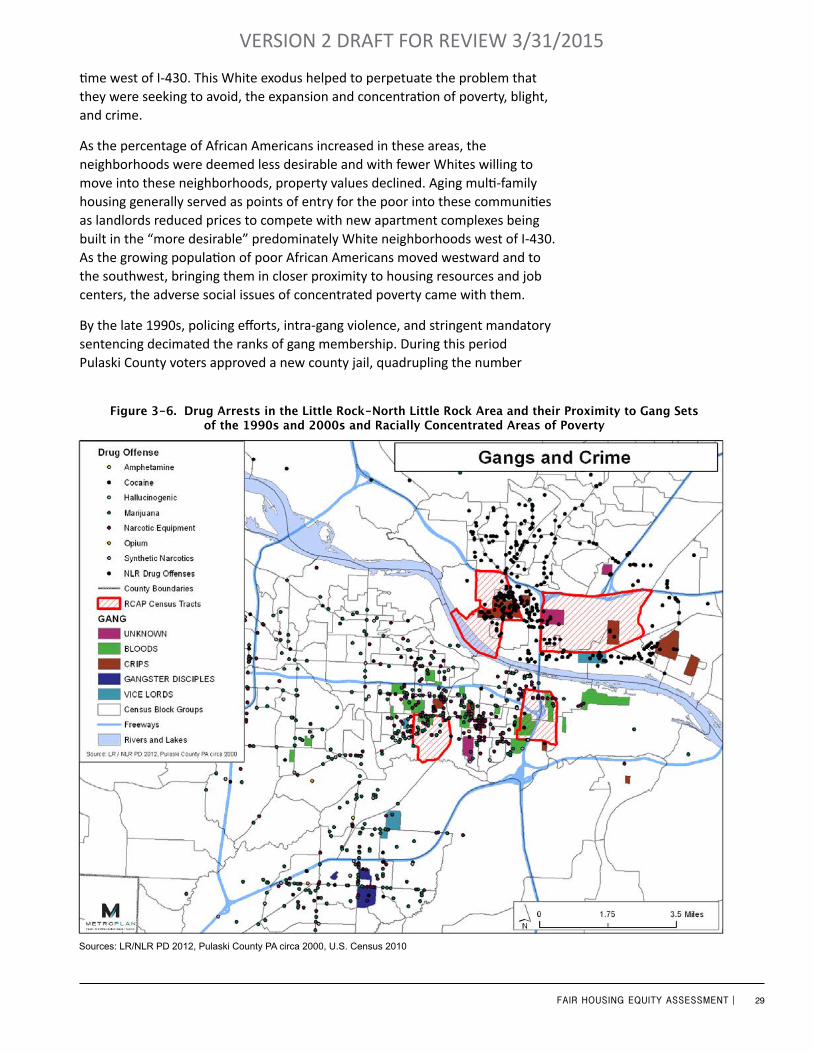
29FAIR HOUSING EQUITY ASSESSMENT |
VERSION 2 DRAFT FOR REVIEW 3/31/2015
time west of I-430. This White exodus helped to perpetuate the problem that they were seeking to avoid, the expansion and concentration of poverty, blight, and crime.
As the percentage of African Americans increased in these areas, the neighborhoods were deemed less desirable and with fewer Whites willing to move into these neighborhoods, property values declined. Aging multi-family housing generally served as points of entry for the poor into these communities as landlords reduced prices to compete with new apartment complexes being built in the “more desirable” predominately White neighborhoods west of I-430. As the growing population of poor African Americans moved westward and to the southwest, bringing them in closer proximity to housing resources and job centers, the adverse social issues of concentrated poverty came with them.
By the late 1990s, policing efforts, intra-gang violence, and stringent mandatory sentencing decimated the ranks of gang membership. During this period Pulaski County voters approved a new county jail, quadrupling the number
Figure 3-6. Drug Arrests in the Little Rock-North Little Rock Area and their Proximity to Gang Sets of the 1990s and 2000s and Racially Concentrated Areas of Poverty
Sources: LR/NLR PD 2012, Pulaski County PA circa 2000, U.S. Census 2010
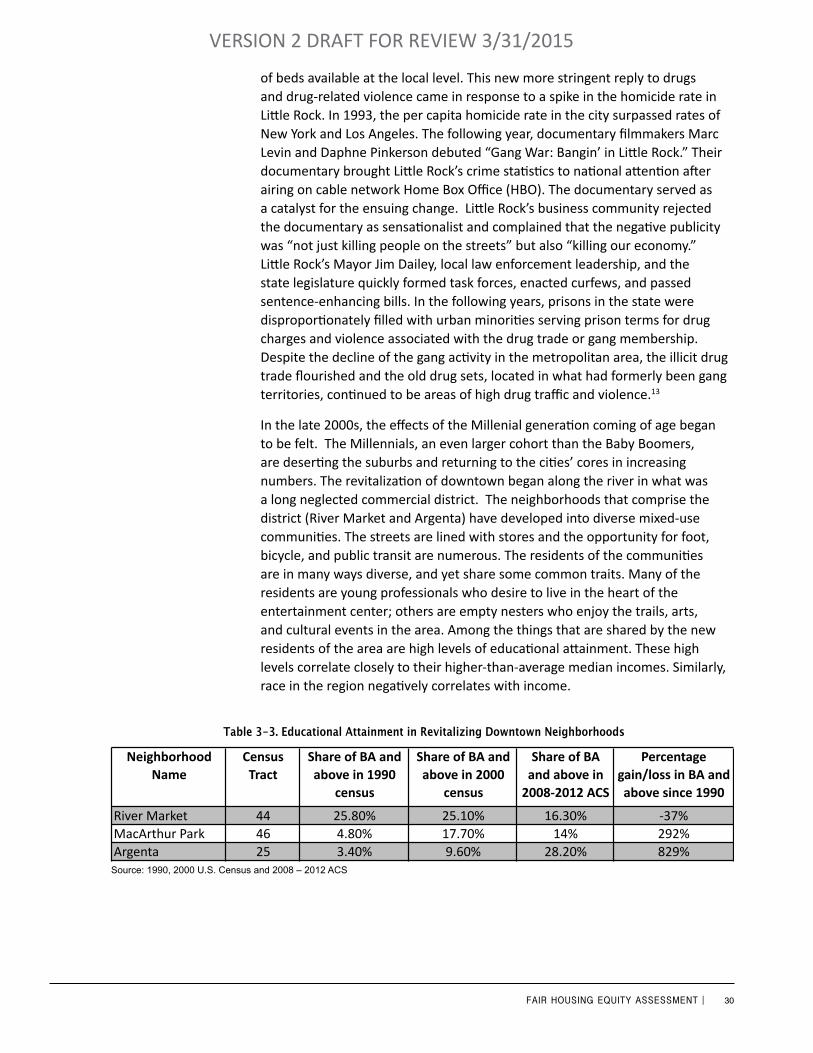
30FAIR HOUSING EQUITY ASSESSMENT |
VERSION 2 DRAFT FOR REVIEW 3/31/2015
of beds available at the local level. This new more stringent reply to drugs and drug-related violence came in response to a spike in the homicide rate in Little Rock. In 1993, the per capita homicide rate in the city surpassed rates of New York and Los Angeles. The following year, documentary filmmakers Marc Levin and Daphne Pinkerson debuted “Gang War: Bangin’ in Little Rock.” Their documentary brought Little Rock’s crime statistics to national attention after airing on cable network Home Box Office (HBO). The documentary served as a catalyst for the ensuing change. Little Rock’s business community rejected the documentary as sensationalist and complained that the negative publicity was “not just killing people on the streets” but also “killing our economy.” Little Rock’s Mayor Jim Dailey, local law enforcement leadership, and the state legislature quickly formed task forces, enacted curfews, and passed sentence-enhancing bills. In the following years, prisons in the state were disproportionately filled with urban minorities serving prison terms for drug charges and violence associated with the drug trade or gang membership. Despite the decline of the gang activity in the metropolitan area, the illicit drug trade flourished and the old drug sets, located in what had formerly been gang territories, continued to be areas of high drug traffic and violence.13
In the late 2000s, the effects of the Millenial generation coming of age began to be felt. The Millennials, an even larger cohort than the Baby Boomers, are deserting the suburbs and returning to the cities’ cores in increasing numbers. The revitalization of downtown began along the river in what was a long neglected commercial district. The neighborhoods that comprise the district (River Market and Argenta) have developed into diverse mixed-use communities. The streets are lined with stores and the opportunity for foot, bicycle, and public transit are numerous. The residents of the communities are in many ways diverse, and yet share some common traits. Many of the residents are young professionals who desire to live in the heart of the entertainment center; others are empty nesters who enjoy the trails, arts, and cultural events in the area. Among the things that are shared by the new residents of the area are high levels of educational attainment. These high levels correlate closely to their higher-than-average median incomes. Similarly, race in the region negatively correlates with income.
Source: 1990, 2000 U.S. Census and 2008 – 2012 ACS
Table 3-3. Educational Attainment in Revitalizing Downtown Neighborhoods
Neighborhood Name
Census Tract
Share of BA and above in 1990
census
Share of BA and above in 2000
census
Share of BA and above in 2008-‐2012 ACS
Percentage gain/loss in BA and above since 1990
River Market 44 25.80% 25.10% 16.30% -‐37%MacArthur Park 46 4.80% 17.70% 14% 292%Argenta 25 3.40% 9.60% 28.20% 829%
Educational Attainment in Revitalizing Downtown Neighborhoods
Source: 1990, 2000 U.S. Census and 2008 – 2012 ACS
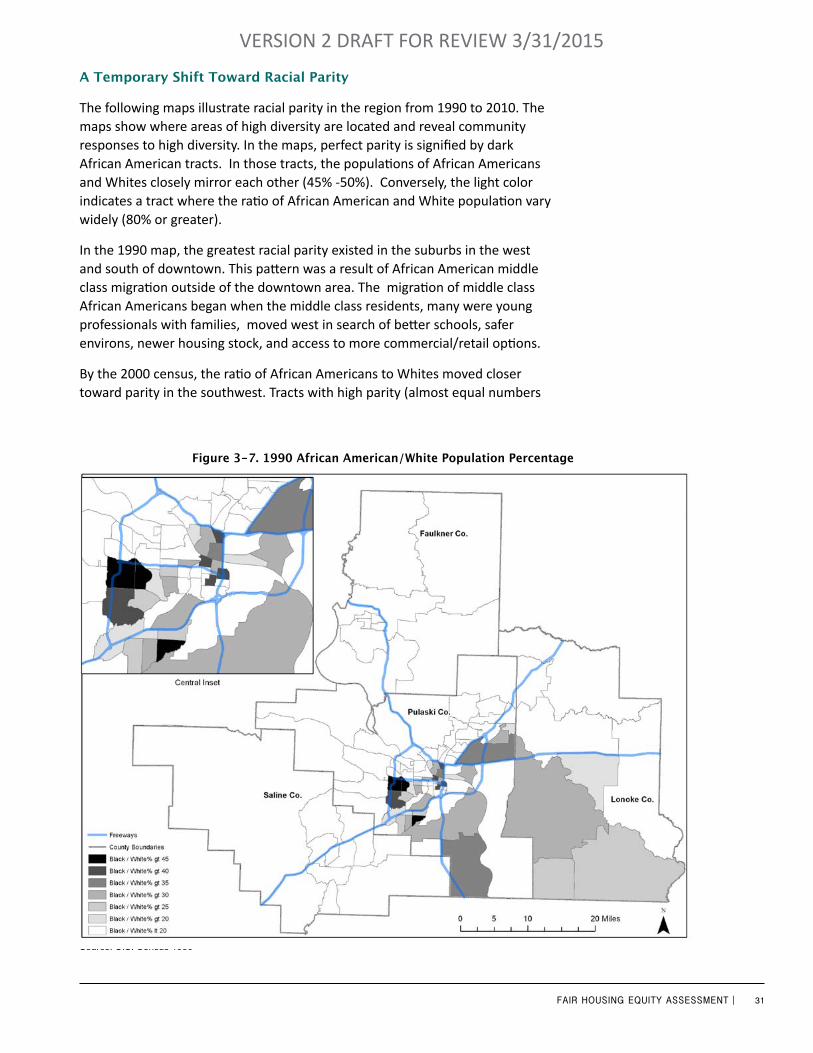
31FAIR HOUSING EQUITY ASSESSMENT |
VERSION 2 DRAFT FOR REVIEW 3/31/2015
A Temporary Shift Toward Racial Parity
The following maps illustrate racial parity in the region from 1990 to 2010. The maps show where areas of high diversity are located and reveal community responses to high diversity. In the maps, perfect parity is signified by dark African American tracts. In those tracts, the populations of African Americans and Whites closely mirror each other (45% -50%). Conversely, the light color indicates a tract where the ratio of African American and White population vary widely (80% or greater).
In the 1990 map, the greatest racial parity existed in the suburbs in the west and south of downtown. This pattern was a result of African American middle class migration outside of the downtown area. The migration of middle class African Americans began when the middle class residents, many were young professionals with families, moved west in search of better schools, safer environs, newer housing stock, and access to more commercial/retail options.
By the 2000 census, the ratio of African Americans to Whites moved closer toward parity in the southwest. Tracts with high parity (almost equal numbers
Source: U.S. Census 1990
Figure 3-7. 1990 African American/White Population Percentage
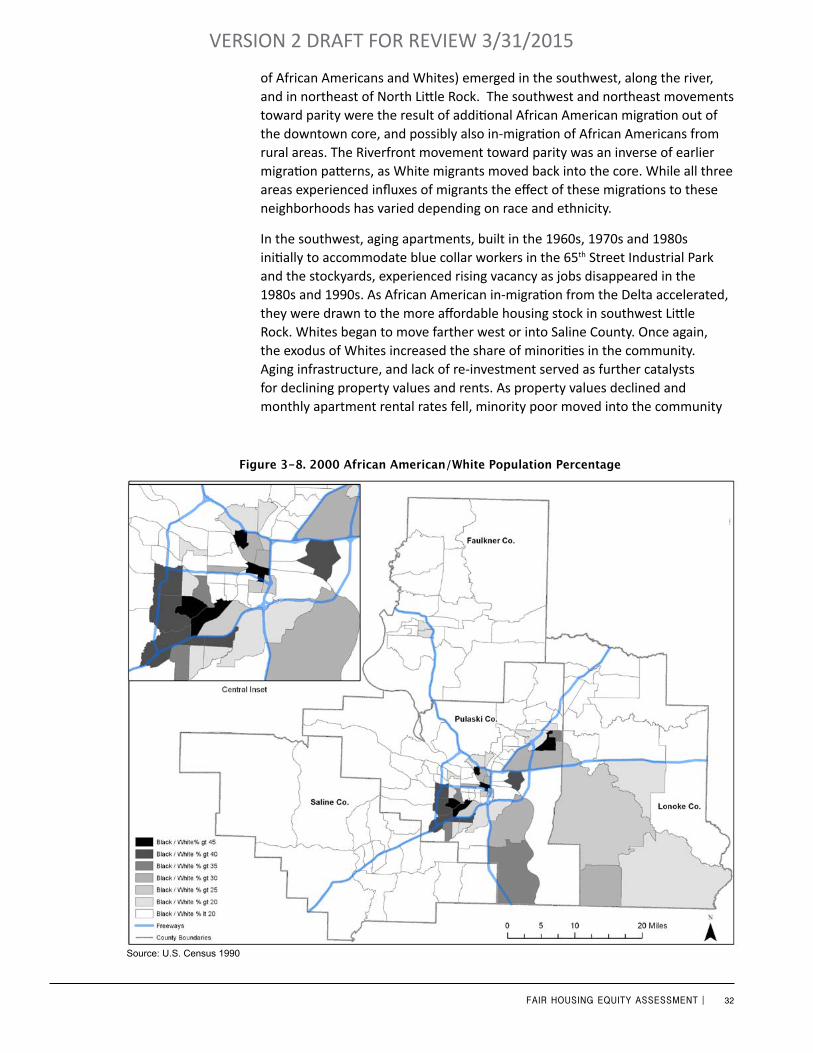
32FAIR HOUSING EQUITY ASSESSMENT |
VERSION 2 DRAFT FOR REVIEW 3/31/2015
of African Americans and Whites) emerged in the southwest, along the river, and in northeast of North Little Rock. The southwest and northeast movements toward parity were the result of additional African American migration out of the downtown core, and possibly also in-migration of African Americans from rural areas. The Riverfront movement toward parity was an inverse of earlier migration patterns, as White migrants moved back into the core. While all three areas experienced influxes of migrants the effect of these migrations to these neighborhoods has varied depending on race and ethnicity.
In the southwest, aging apartments, built in the 1960s, 1970s and 1980s initially to accommodate blue collar workers in the 65th Street Industrial Park and the stockyards, experienced rising vacancy as jobs disappeared in the 1980s and 1990s. As African American in-migration from the Delta accelerated, they were drawn to the more affordable housing stock in southwest Little Rock. Whites began to move farther west or into Saline County. Once again, the exodus of Whites increased the share of minorities in the community. Aging infrastructure, and lack of re-investment served as further catalysts for declining property values and rents. As property values declined and monthly apartment rental rates fell, minority poor moved into the community
Figure 3-8. 2000 African American/White Population Percentage
Source: U.S. Census 1990
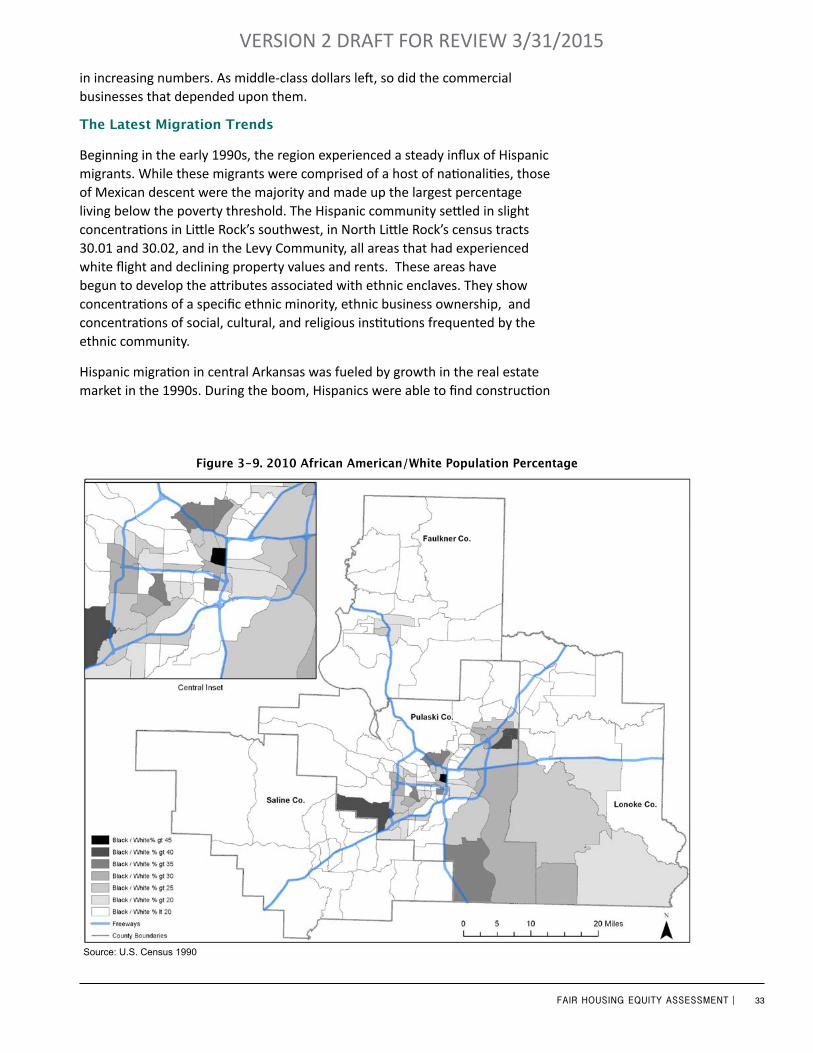
33FAIR HOUSING EQUITY ASSESSMENT |
VERSION 2 DRAFT FOR REVIEW 3/31/2015
in increasing numbers. As middle-class dollars left, so did the commercial businesses that depended upon them.
The Latest Migration Trends
Beginning in the early 1990s, the region experienced a steady influx of Hispanic migrants. While these migrants were comprised of a host of nationalities, those of Mexican descent were the majority and made up the largest percentage living below the poverty threshold. The Hispanic community settled in slight concentrations in Little Rock’s southwest, in North Little Rock’s census tracts 30.01 and 30.02, and in the Levy Community, all areas that had experienced white flight and declining property values and rents. These areas have begun to develop the attributes associated with ethnic enclaves. They show concentrations of a specific ethnic minority, ethnic business ownership, and concentrations of social, cultural, and religious institutions frequented by the ethnic community.
Hispanic migration in central Arkansas was fueled by growth in the real estate market in the 1990s. During the boom, Hispanics were able to find construction
Figure 3-9. 2010 African American/White Population Percentage
Source: U.S. Census 1990
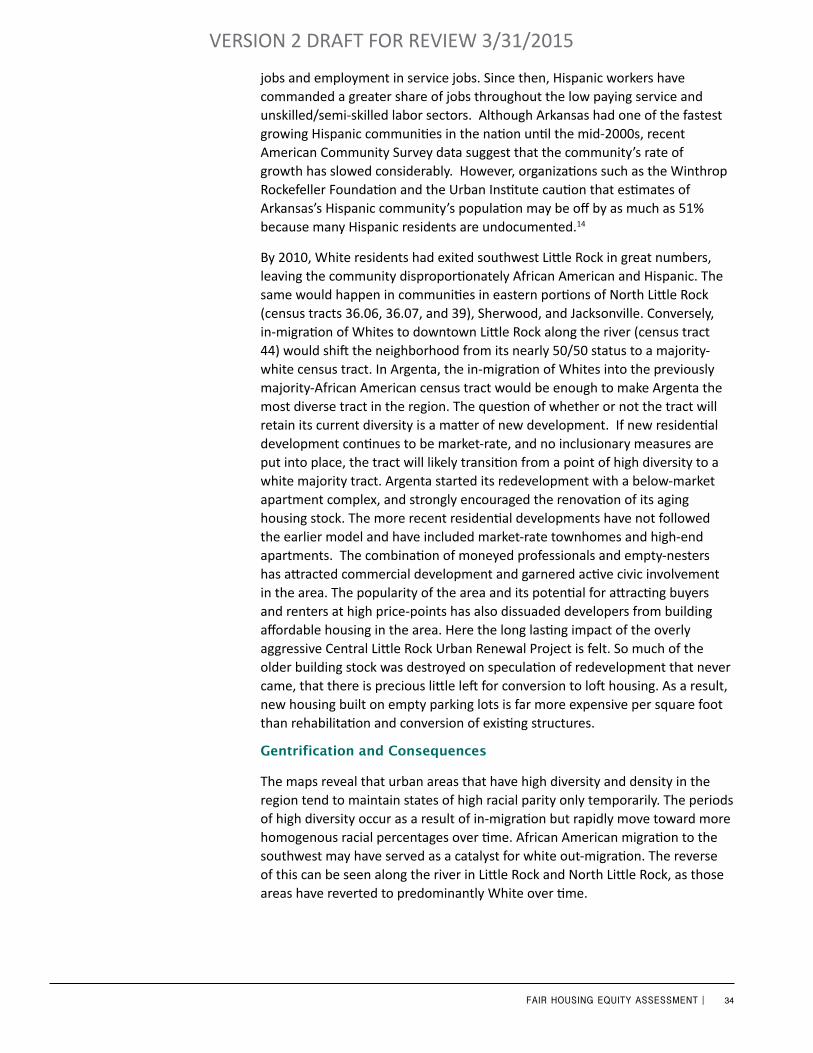
34FAIR HOUSING EQUITY ASSESSMENT |
VERSION 2 DRAFT FOR REVIEW 3/31/2015
jobs and employment in service jobs. Since then, Hispanic workers have commanded a greater share of jobs throughout the low paying service and unskilled/semi-skilled labor sectors. Although Arkansas had one of the fastest growing Hispanic communities in the nation until the mid-2000s, recent American Community Survey data suggest that the community’s rate of growth has slowed considerably. However, organizations such as the Winthrop Rockefeller Foundation and the Urban Institute caution that estimates of Arkansas’s Hispanic community’s population may be off by as much as 51% because many Hispanic residents are undocumented.14
By 2010, White residents had exited southwest Little Rock in great numbers, leaving the community disproportionately African American and Hispanic. The same would happen in communities in eastern portions of North Little Rock (census tracts 36.06, 36.07, and 39), Sherwood, and Jacksonville. Conversely, in-migration of Whites to downtown Little Rock along the river (census tract 44) would shift the neighborhood from its nearly 50/50 status to a majority-white census tract. In Argenta, the in-migration of Whites into the previously majority-African American census tract would be enough to make Argenta the most diverse tract in the region. The question of whether or not the tract will retain its current diversity is a matter of new development. If new residential development continues to be market-rate, and no inclusionary measures are put into place, the tract will likely transition from a point of high diversity to a white majority tract. Argenta started its redevelopment with a below-market apartment complex, and strongly encouraged the renovation of its aging housing stock. The more recent residential developments have not followed the earlier model and have included market-rate townhomes and high-end apartments. The combination of moneyed professionals and empty-nesters has attracted commercial development and garnered active civic involvement in the area. The popularity of the area and its potential for attracting buyers and renters at high price-points has also dissuaded developers from building affordable housing in the area. Here the long lasting impact of the overly aggressive Central Little Rock Urban Renewal Project is felt. So much of the older building stock was destroyed on speculation of redevelopment that never came, that there is precious little left for conversion to loft housing. As a result, new housing built on empty parking lots is far more expensive per square foot than rehabilitation and conversion of existing structures.
Gentrification and Consequences
The maps reveal that urban areas that have high diversity and density in the region tend to maintain states of high racial parity only temporarily. The periods of high diversity occur as a result of in-migration but rapidly move toward more homogenous racial percentages over time. African American migration to the southwest may have served as a catalyst for white out-migration. The reverse of this can be seen along the river in Little Rock and North Little Rock, as those areas have reverted to predominantly White over time.
35FAIR HOUSING EQUITY ASSESSMENT |
VERSION 2 DRAFT FOR REVIEW 3/31/2015
As property values increased and available land along the river was redeveloped, developers began building in the downtown areas surrounding the river. This development was initially widely welcomed because it revitalized what was then underutilized decaying commercial space, generated additional sales tax and property tax revenue, and brought foot traffic to an area that emptied in the evenings. The success of early downtown development and the reestablishment of downtown as a destination, particularly for educated young professionals and cultured empty-nesters, drove the subsequent development of residential property on the periphery of Little Rock’s largely commercial downtown.
Since the 1970s, small numbers of Whites have returned to downtown’s residential neighborhoods. The revival of downtown began in historic districts with the renovation of historically significant homes. Although a number of these large homes were subdivided into smaller more affordable apartments, many of the homes survived intact. The unique architecture and the high cost of restoration made the Quapaw Quarter and Governor’s Mansion areas far more resilient against the forces that caused wholesale flight from other nearby neighborhoods and though some had fallen into disrepair or been divided into apartments the neighborhood remained racially mixed from the 1960s to the present.
While initial efforts to revive downtown’s residential neighborhoods began in these districts, development spread to the surrounding areas. The return of middle-class Whites was a harbinger of the return of businesses. Commercial development outside of the business district has occurred in a fashion and scale similar to that of residential development. Trendy stores, restaurants, coffee shops, yoga studios, and bars sprang up along thoroughfares near the gentrifying neighborhoods. However, major retail facilities like grocery and department stores have yet to exhibit staying power in these areas.
Poverty Moves to the Suburbs
The revival of downtown has meant an increase in property values in gentrifying communities. This benefit was shared by both longtime residents and newcomers. As sales and property values in the area increased, housing within the area was reassessed and property taxes also increased. For many, the increased values were seen positively, a dividend that would be reaped when owners decide to sell the property. However, for residents on fixed incomes, increasing property values and taxes signified an additional burden that they were ill-prepared to shoulder. Renters were even more susceptible to the effects of gentrification as landlords increased rents or sold properties in response to demand and increasing property values.
Landowners unable to pay property taxes and renters unable to meet increased rent demands were displaced to communities that they could afford. This type of displacement, in effect, moves the concentrated poverty from the gentrifying area to other parts of the city and region. The growing concentration of poor
36FAIR HOUSING EQUITY ASSESSMENT |
VERSION 2 DRAFT FOR REVIEW 3/31/2015
minorities in southwest Little Rock is indicative of this type of movement as low income residents seek affordable housing. This movement can be expected to continue to the southwest into the older neighborhoods in Saline County.
From 2000 to 2010, the populations of African American and Hispanic residents in Saline County more than tripled.15 Bryant’s historic downtown, Old Town, with its aging homes, apartments and low rents attracted many of these newcomers. African Americans and Hispanic residents comprised less than nine percent (9%) of the county’s overall population, but made up thirteen percent (13%) of Old Town’s population.16 In central Arkansas, as nationally, poverty is moving to the suburbs.
Although there were only five Racially Concentrated Areas of Poverty (RCAPs) in 2010, there are numerous tracts in the cores of Little Rock and North Little Rock and in southwest Little Rock, which have the potential to slip into that category by the next census. The Great Recession had dramatic consequences for the minorities living in central Arkansas. Disproportionately more likely to be unemployed and having median household incomes that were far below the regional median and being more likely to be targeted by predatory lenders, African Americans and Hispanics were more likely to lose homes to foreclosure, be evicted from apartments or homes, more likely to require federal assistance like SNAP or Section 8 and more likely to live in Cost Burden Households. Fifty years since the dire warnings of the National Urban League and Metroplan, poverty is still concentrating in Pulaski County, and one in four African American households still live below the poverty threshold.17
Exclusionary Zoning in the Region
Zoning is exclusionary by definition, generally prohibiting certain uses in designated areas. Based on federal case law (as mentioned earlier), it is quite legal to use zoning to segregate housing by income. It is also legal to limit and regulate housing types within reason. Ultimately, exclusionary zoning by enough jurisdictions in the region, albeit completely legal, will result in a concentration of poverty and low-income households. Because of the historically low-incomes of the African American population and of immigrant populations, in this area principally Hispanic, low income populations are channeled into those areas with aging single and multi-family housing, which often are far from areas of opportunity.
In the central Arkansas region, only Cammack Village excludes multi-family housing. A town of 768 in 2010, Cammack Village has been completely built out since the 1950s and is completely surrounded by the City of Little Rock. In the 1980s, Arkansas law changed requiring cities to accommodate the placement of manufactured homes within their corporate limits, an affordable housing option for many. Soon thereafter, the Arkansas Supreme Court upheld a court challenge to a zoning ordinance in the City of Sherwood that limited manufactured homes as a ‘use by right’ only in prescribed areas. However, subsequent, federal actions regarding the right of placement of such homes
37FAIR HOUSING EQUITY ASSESSMENT |
VERSION 2 DRAFT FOR REVIEW 3/31/2015
within cities broadened this affordable housing option even further. Metroplan has assisted many of its members in drafting manufactured home friendly regulations into their city codes to comply with the new laws.
Zoning and segregation of housing by income is alive and well in the region as all municipalities with zoning power follow the Euclidean model formulated in the 1920s. Three examples are cited below. In the 1980s, the governing board of Maumelle New Town, an original HUD New Town, reduced its original land use plan from supporting a population of 100,000 to a population of 25,000 largely by eliminating high-rise multi-family from the plan. NIMBYism in the community has since blocked several multi-family projects. Also in the 1980s, the City of Little Rock agreed to annex Chenal Valley, a large upscale development on the western edge of the city, in consideration for allowing the development to come into the city but remain in the Pulaski County Special School District. Chenal Valley promised to include affordable housing in its development. In Chenal’s development plan, the “affordable” neighborhood was to be Duquesne Place, where houses were initially priced at $150,000 to 175,000 and are currently selling for $200,000 to $400,000, far above what a median income family in the region could afford.
Most recently the City of Bryant instituted a temporary moratorium against new multi-family housing construction at the demand of their citizens. Bryant had approved an innovative New Urban mixed -use development called Midtown. The developer went bankrupt, and a new developer received approval for the Courtyard Cottages, a low-income seniors’ apartment complex. As the apartment complex was being developed, neighboring residents argued that the development did not comply with the city’s Traditional Neighborhood Development plan and was not aesthetically pleasing. In 2011, as another developer, Don Spears (Lindsey Group), broke ground for a new apartment complex and despite Spears’ argument that he intended to erect “high end apartments” in the city, he was met with strong opposition from community residents who argued that while early phases of the project were high end, the developer intended to build lower priced units in later phases of development. Homeowners complained that they felt the multi-storied apartments were being built “on top of their single family dwellings,” and argued that their property values would drop as a result of the multi-family complexes. Homeowners additionally maintained that the apartments placed their children in increased danger due to potential increases in traffic and crime and threatened to overburden the community’s infrastructure and school system.18
Ultimately, Bryant adopted an ordinance limiting the total number of multi-family units in the city to 20% of total dwellings and imposed a set of conditions that would ensure only high end apartment complexes could be profitably built in the future with a pledge to protect Bryant’s quality of life. Because Bryant had undergone an apartment construction boom before the moratorium was imposed, it will be quite some time before single family housing can catch up to the apartment surplus (as defined by the ordinance).

38FAIR HOUSING EQUITY ASSESSMENT |
VERSION 2 DRAFT FOR REVIEW 3/31/2015
Bryant has subsequently approved the Jump Start implementation plan and zoning for Old Town, which in fact will allow new multi-family, mixed-use development. The Old Town Jump Start project and the possible revival of the New Urban Midtown development may be the best chances for changing the housing paradigm in suburban communities without traditional downtowns in the metro area.
Chapter 3 Sources1 Kirk, John, and Porter, Jess. “The Roots of Little Rock’s Segregated Neighborhoods.” Arkansas Times,
July 10, 2014.2 Ibid.3 Benjamin Ross. Dead End – Suburban Sprawl and the Rebirth of American Urbanism, (Oxford Univer-
sity Press, 2014) pp. 28 -30. 4 Barnard Bulletin (New York, New York), February 14, 1963; Arnold Hirsh. Making the Second Ghetto:
Race and Housing in Chicago 1940-1960, (University of Chicago Press, 2009) pp.3-55 Ross, pp 41-506http://honors.uca.edu/wiki/index/\.php/Central_Little_Rock_Urban_Renewal_Project (accessed on
March9, 2015)7 http://www.arkansashighways.com/historic_bridge/Early%20Arkansas%20Highway%20Maga-
zines/1980-89%20Volumes%2026-35%20pdfs/Volume%2031%20%E2%80%93%201985/Vol.%2031,%20Winter%201985,%20No.%204.pdf (Accessed on February 26, 2015).
8 Hope Star (Hope, Arkansas), November 19, 1964.9 El Dorado Times (El Dorado, Arkansas), May 21, 1965. 10 Northwest Arkansas Times (Fayetteville, Arkansas), November 15, 1966; Northwest Arkansas Times,
April 27, 1967; Des Moines Register (Des Moines, Iowa), November 22, 1968.11 Thomas v. Housing Authority of City of Little Rock, 282 F. Supp. 575 (E.D. Ark. 1967). http://law.justia.
com/cases/federal/district-courts/FSupp/282/575/1509846/ accessed on February 26, 201512 Hope Star (Hope, Arkansas), January 1, 1969.13 Los Angeles Times, September 01, 2002; Arkansas Times, August 19, 2004.14 Capps, Randy. A Profile of Immigrants in Arkansas. Little Rock, Ark.: Winthrop Rockefeller Foundation,
2007. Pg. 12.15 Decennial Census 2010. U.S. Bureau of the Census.16 2007-2012 ACS 17 2007-2012 ACS18 Nelson, John. “Bryant Council backs citizens; no more apartments to be built.” The Tailgate News
(southarktailgatenews.com). January 11, 2013, pp. 7-8.
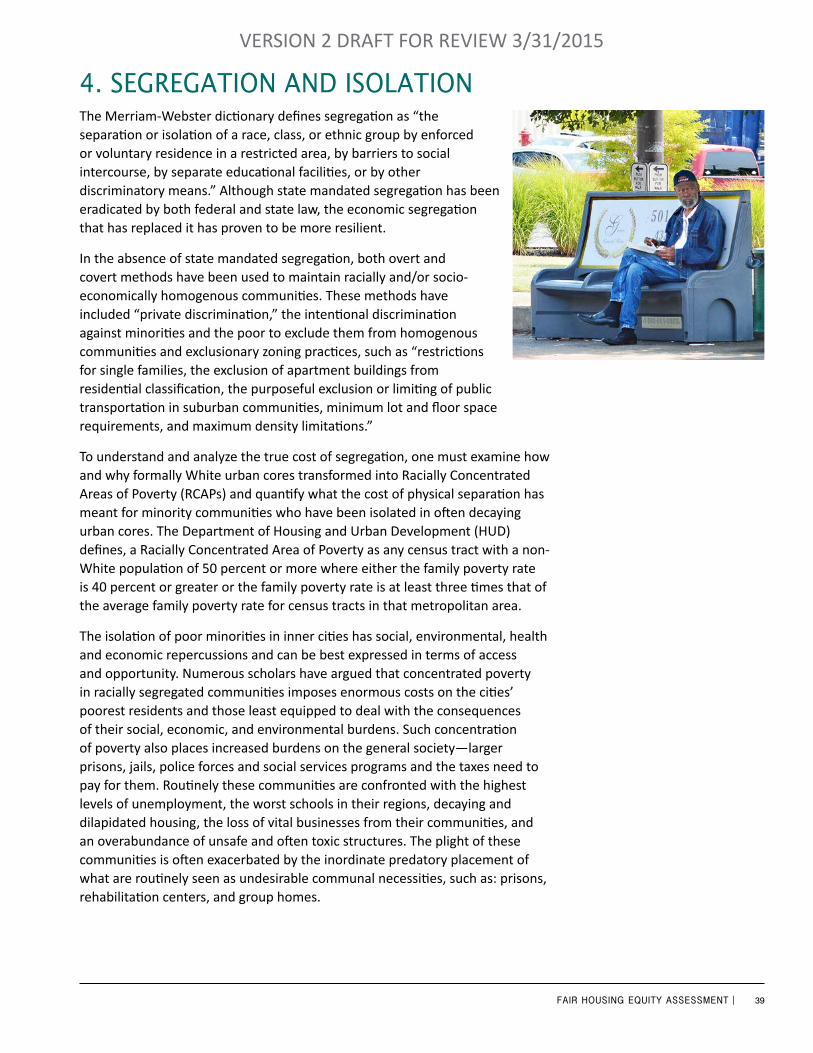
39FAIR HOUSING EQUITY ASSESSMENT |
VERSION 2 DRAFT FOR REVIEW 3/31/2015
The Merriam-Webster dictionary defines segregation as “the separation or isolation of a race, class, or ethnic group by enforced or voluntary residence in a restricted area, by barriers to social intercourse, by separate educational facilities, or by other discriminatory means.” Although state mandated segregation has been eradicated by both federal and state law, the economic segregation that has replaced it has proven to be more resilient.
In the absence of state mandated segregation, both overt and covert methods have been used to maintain racially and/or socio-economically homogenous communities. These methods have included “private discrimination,” the intentional discrimination against minorities and the poor to exclude them from homogenous communities and exclusionary zoning practices, such as “restrictions for single families, the exclusion of apartment buildings from residential classification, the purposeful exclusion or limiting of public transportation in suburban communities, minimum lot and floor space requirements, and maximum density limitations.”
To understand and analyze the true cost of segregation, one must examine how and why formally White urban cores transformed into Racially Concentrated Areas of Poverty (RCAPs) and quantify what the cost of physical separation has meant for minority communities who have been isolated in often decaying urban cores. The Department of Housing and Urban Development (HUD) defines, a Racially Concentrated Area of Poverty as any census tract with a non-White population of 50 percent or more where either the family poverty rate is 40 percent or greater or the family poverty rate is at least three times that of the average family poverty rate for census tracts in that metropolitan area.
The isolation of poor minorities in inner cities has social, environmental, health and economic repercussions and can be best expressed in terms of access and opportunity. Numerous scholars have argued that concentrated poverty in racially segregated communities imposes enormous costs on the cities’ poorest residents and those least equipped to deal with the consequences of their social, economic, and environmental burdens. Such concentration of poverty also places increased burdens on the general society—larger prisons, jails, police forces and social services programs and the taxes need to pay for them. Routinely these communities are confronted with the highest levels of unemployment, the worst schools in their regions, decaying and dilapidated housing, the loss of vital businesses from their communities, and an overabundance of unsafe and often toxic structures. The plight of these communities is often exacerbated by the inordinate predatory placement of what are routinely seen as undesirable communal necessities, such as: prisons, rehabilitation centers, and group homes.
4. segregaTion and isolaTion

40FAIR HOUSING EQUITY ASSESSMENT |
VERSION 2 DRAFT FOR REVIEW 3/31/2015
These communities are also disproportionately burdened by predatory commercial interests. Residents in poor inner city neighborhoods often pay higher prices for their daily needs and routinely have lower quality foodstuffs in their grocery stores, have limited alternative shopping options, and have fewer depository banking resources than their suburban counterparts. Lack of depository banking services forces them to rely on check cashing services, payday lenders, or pawn brokers as their primary banking and lending institutions.
In 1965, sociologists Alma and Karl Taeuber published Negroes in Cities: Residential Segregation and Neighborhood Change. Although one of a number of seminal works written in the 1960s with an emphasis on race and inequity in American inner cities, the Taeubers’ text would be immortalized because of its approach in quantifying segregation. Using United States census data, the Taeubers ranked each city on a “segregation index” that measured dissimilarity in the given city by racial dissimilarities on a census tract level. Every city was ranked on a scale from 1 to 100, with “1” representing a community that was completely residentially integrated and a “100” representing a community that was completely segregated. Therefore, a neighborhood considered integrated would have a similar proportion of African Americans and Whites living in the neighborhood when compared to each group’s relative population in the city as a whole. The number given to each city on the segregation index was equivalent to the number of non-Whites who would have to move from the tract in which they lived in order to produce an integrated population distribution. The Taeubers’ analysis that “a high degree of racial residential segregation is universal in American cities” would later be complemented by the largely qualitative analysis of the Kerner Commission, which made a similar
Figure 4-1. Dissimilarity Index for the Little Rock Metropolitan Area
Source: Brown University, American Communities Project, Spatial Structures in Social Science
Lack of depository banking services forces residents in low-income neighborhoods to rely on check cashing services, payday lenders, or pawn brokers as their primary banking and lending institutions.
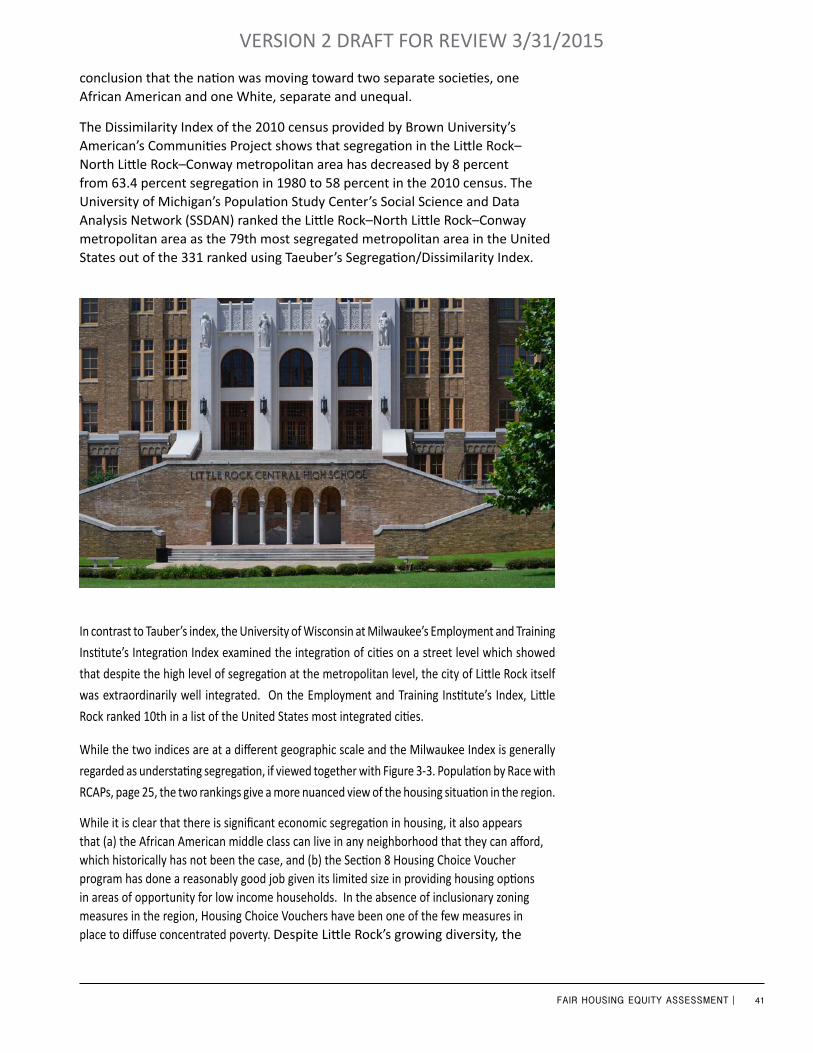
41FAIR HOUSING EQUITY ASSESSMENT |
VERSION 2 DRAFT FOR REVIEW 3/31/2015
conclusion that the nation was moving toward two separate societies, one African American and one White, separate and unequal.
The Dissimilarity Index of the 2010 census provided by Brown University’s American’s Communities Project shows that segregation in the Little Rock–North Little Rock–Conway metropolitan area has decreased by 8 percent from 63.4 percent segregation in 1980 to 58 percent in the 2010 census. The University of Michigan’s Population Study Center’s Social Science and Data Analysis Network (SSDAN) ranked the Little Rock–North Little Rock–Conway metropolitan area as the 79th most segregated metropolitan area in the United States out of the 331 ranked using Taeuber’s Segregation/Dissimilarity Index.
In contrast to Tauber’s index, the University of Wisconsin at Milwaukee’s Employment and Training
Institute’s Integration Index examined the integration of cities on a street level which showed
that despite the high level of segregation at the metropolitan level, the city of Little Rock itself
was extraordinarily well integrated. On the Employment and Training Institute’s Index, Little
Rock ranked 10th in a list of the United States most integrated cities.
While the two indices are at a different geographic scale and the Milwaukee Index is generally
regarded as understating segregation, if viewed together with Figure 3-3. Population by Race with
RCAPs, page 25, the two rankings give a more nuanced view of the housing situation in the region.
While it is clear that there is significant economic segregation in housing, it also appears that (a) the African American middle class can live in any neighborhood that they can afford, which historically has not been the case, and (b) the Section 8 Housing Choice Voucher program has done a reasonably good job given its limited size in providing housing options in areas of opportunity for low income households. In the absence of inclusionary zoning measures in the region, Housing Choice Vouchers have been one of the few measures in place to diffuse concentrated poverty. Despite Little Rock’s growing diversity, the
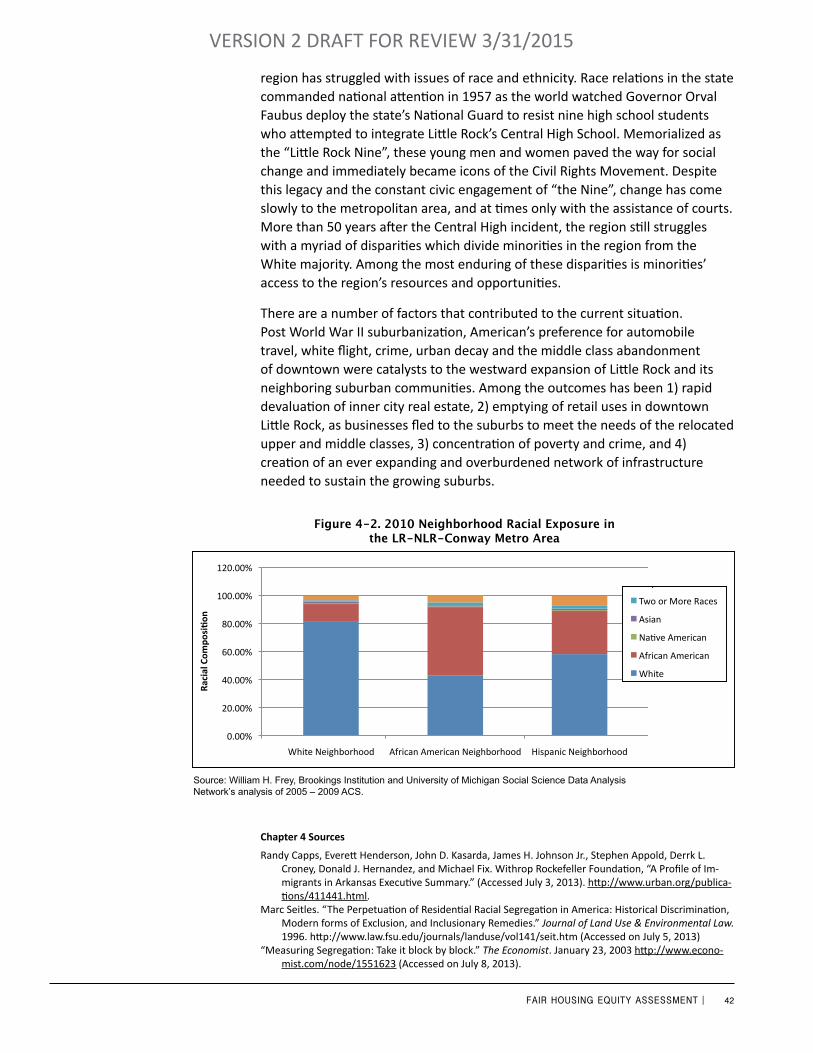
42FAIR HOUSING EQUITY ASSESSMENT |
VERSION 2 DRAFT FOR REVIEW 3/31/2015
region has struggled with issues of race and ethnicity. Race relations in the state commanded national attention in 1957 as the world watched Governor Orval Faubus deploy the state’s National Guard to resist nine high school students who attempted to integrate Little Rock’s Central High School. Memorialized as the “Little Rock Nine”, these young men and women paved the way for social change and immediately became icons of the Civil Rights Movement. Despite this legacy and the constant civic engagement of “the Nine”, change has come slowly to the metropolitan area, and at times only with the assistance of courts. More than 50 years after the Central High incident, the region still struggles with a myriad of disparities which divide minorities in the region from the White majority. Among the most enduring of these disparities is minorities’ access to the region’s resources and opportunities.
There are a number of factors that contributed to the current situation. Post World War II suburbanization, American’s preference for automobile travel, white flight, crime, urban decay and the middle class abandonment of downtown were catalysts to the westward expansion of Little Rock and its neighboring suburban communities. Among the outcomes has been 1) rapid devaluation of inner city real estate, 2) emptying of retail uses in downtown Little Rock, as businesses fled to the suburbs to meet the needs of the relocated upper and middle classes, 3) concentration of poverty and crime, and 4) creation of an ever expanding and overburdened network of infrastructure needed to sustain the growing suburbs.
Chapter 4 Sources
Randy Capps, Everett Henderson, John D. Kasarda, James H. Johnson Jr., Stephen Appold, Derrk L. Croney, Donald J. Hernandez, and Michael Fix. Withrop Rockefeller Foundation, “A Profile of Im-migrants in Arkansas Executive Summary.” (Accessed July 3, 2013). http://www.urban.org/publica-tions/411441.html.
Marc Seitles. “The Perpetuation of Residential Racial Segregation in America: Historical Discrimination, Modern forms of Exclusion, and Inclusionary Remedies.” Journal of Land Use & Environmental Law. 1996. http://www.law.fsu.edu/journals/landuse/vol141/seit.htm (Accessed on July 5, 2013)
“Measuring Segregation: Take it block by block.” The Economist. January 23, 2003 http://www.econo-mist.com/node/1551623 (Accessed on July 8, 2013).
Figure 4-2. 2010 Neighborhood Racial Exposure in the LR-NLR-Conway Metro Area
Source: William H. Frey, Brookings Institution and University of Michigan Social Science Data Analysis Network’s analysis of 2005 – 2009 ACS.
0.00%
20.00%
40.00%
60.00%
80.00%
100.00%
120.00%
White Neighborhood African American Neighborhood Hispanic Neighborhood
Raci
al C
ompo
si,on
2010 Neigborhood Racial Exposure in the LR-‐NLR-‐Conway Metro Area
Hispanic
Two or More Races
Asian
NaBve American
African American
White
0.00%
20.00%
40.00%
60.00%
80.00%
100.00%
120.00%
White Neighborhood African American Neighborhood Hispanic Neighborhood
Raci
al C
ompo
si,on
2010 Neigborhood Racial Exposure in the LR-‐NLR-‐Conway Metro Area
Hispanic
Two or More Races
Asian
NaBve American
African American
White
0.00%
20.00%
40.00%
60.00%
80.00%
100.00%
120.00%
White Neighborhood African American Neighborhood Hispanic Neighborhood
Raci
al C
ompo
si,on
2010 Neigborhood Racial Exposure in the LR-‐NLR-‐Conway Metro Area
Hispanic
Two or More Races
Asian
NaBve American
African American
White 0.00%
20.00%
40.00%
60.00%
80.00%
100.00%
120.00%
White Neighborhood African American Neighborhood Hispanic Neighborhood
Raci
al C
ompo
si,on
2010 Neigborhood Racial Exposure in the LR-‐NLR-‐Conway Metro Area
Hispanic
Two or More Races
Asian
NaBve American
African American
White
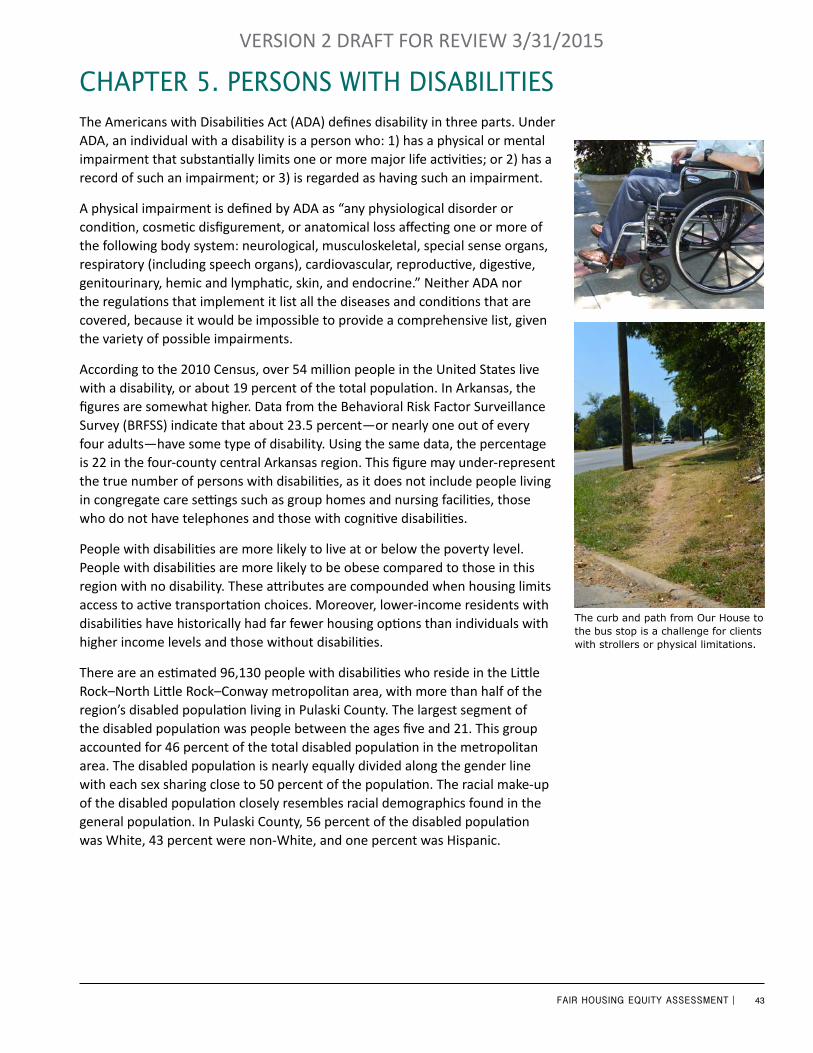
43FAIR HOUSING EQUITY ASSESSMENT |
VERSION 2 DRAFT FOR REVIEW 3/31/2015
The Americans with Disabilities Act (ADA) defines disability in three parts. Under ADA, an individual with a disability is a person who: 1) has a physical or mental impairment that substantially limits one or more major life activities; or 2) has a record of such an impairment; or 3) is regarded as having such an impairment.
A physical impairment is defined by ADA as “any physiological disorder or condition, cosmetic disfigurement, or anatomical loss affecting one or more of the following body system: neurological, musculoskeletal, special sense organs, respiratory (including speech organs), cardiovascular, reproductive, digestive, genitourinary, hemic and lymphatic, skin, and endocrine.” Neither ADA nor the regulations that implement it list all the diseases and conditions that are covered, because it would be impossible to provide a comprehensive list, given the variety of possible impairments.
According to the 2010 Census, over 54 million people in the United States live with a disability, or about 19 percent of the total population. In Arkansas, the figures are somewhat higher. Data from the Behavioral Risk Factor Surveillance Survey (BRFSS) indicate that about 23.5 percent—or nearly one out of every four adults—have some type of disability. Using the same data, the percentage is 22 in the four-county central Arkansas region. This figure may under-represent the true number of persons with disabilities, as it does not include people living in congregate care settings such as group homes and nursing facilities, those who do not have telephones and those with cognitive disabilities.
People with disabilities are more likely to live at or below the poverty level. People with disabilities are more likely to be obese compared to those in this region with no disability. These attributes are compounded when housing limits access to active transportation choices. Moreover, lower-income residents with disabilities have historically had far fewer housing options than individuals with higher income levels and those without disabilities.
There are an estimated 96,130 people with disabilities who reside in the Little Rock–North Little Rock–Conway metropolitan area, with more than half of the region’s disabled population living in Pulaski County. The largest segment of the disabled population was people between the ages five and 21. This group accounted for 46 percent of the total disabled population in the metropolitan area. The disabled population is nearly equally divided along the gender line with each sex sharing close to 50 percent of the population. The racial make-up of the disabled population closely resembles racial demographics found in the general population. In Pulaski County, 56 percent of the disabled population was White, 43 percent were non-White, and one percent was Hispanic.
The curb and path from Our House to the bus stop is a challenge for clients with strollers or physical limitations.
ChaPTer 5. Persons wiTh disabiliTies

44FAIR HOUSING EQUITY ASSESSMENT |
VERSION 2 DRAFT FOR REVIEW 3/31/2015
In the neighboring counties of Faulkner, Lonoke, and Saline, the non-White population is considerably smaller. In those counties, Whites make up 89 percent of the disabled population, non-Whites 10 percent, and Hispanics one percent.
Employment is a critical challenge for the disabled. Those who are able to obtain jobs enjoy far more independence and mobility than their peers who are incapable of entering the labor force or employed. Percentages of employed and unemployed do not differ widely between Pulaski County and its more rural neighbors. In Pulaski County, 90 percent of the disabled in the work force were employed, compared to 88 percent in the surrounding counties.
56%
43%
1%
Disabled Popula.on of Pulaski County by Race
White
Non-‐White
Hispanic
Figure 5-1. Disabled Population of Pulaski County by Race
Source: 2005–2007 ACS PUMS Data
89%
10%
1%
The Disabled by Race in Faulkner, Lonoke, and Saline Coun9es
White
Non-‐White
Hispanic
Figure 5-2. Disabled Population by Race in Faulkner, Lonoke, and Saline Counties
Source: 2005–2007 ACS PUMS Data
90%
10%
Employment of the Disabled in Pulaski County
Employed
In Labor Force, Not Employed
Figure 5-3. Employment of the Disabled in Pulaski County
Source: 2005–2007 ACS PUMS Data

45FAIR HOUSING EQUITY ASSESSMENT |
VERSION 2 DRAFT FOR REVIEW 3/31/2015
Equally important factor for the disabled is transportation. For many of the disabled, access to reliable transportation is a major determinant of where they live, whether or not they are employed, and how connected they are to others. Without reliable transportation, the disabled are unable to live independently. In all of the metropolitan area’s counties, the personal automobile is the most widely used mode of transportation. However, there is an important difference between Pulaski and its neighboring counties. In Pulaski County, five percent of the disabled population use public transit to travel to and from work. This percentage of usage is more than three times as great as those without disabilities. Outside Pulaski County, access for the disabled is extremely limited and without an alternate mode of transportation many disabled, particularly those living in poverty may be forced to forgo employment and rely heavily on government programs.
Analysis of travel times for those disabled living outside of Pulaski County suggests that many commute to Pulaski County for work. Disabled within Pulaski County have considerably shorter travel times and are twice as likely to work at home.
6%
86%
5% 3%
Transporta)on to Work for Disabled in Pulaski County
Work at Home
Car, Truck or Van
Mass Transit
Other
Figure 5-4. Transportation to Work for Disabled in Pulaski County
Source: 2005–2007 ACS PUMS Data
3%
95%
2%
Transporta)on to Work for the Disabled in Faulkner, Lonoke, and Saline Coun)es
Work at Home
Car, Truck or Van
Mass Transit
Other
Figure 5-5. Transportation to Work for the Disabled in Faulkner, Lonoke, and Saline Counties
Source: 2005–2007 ACS PUMS Data
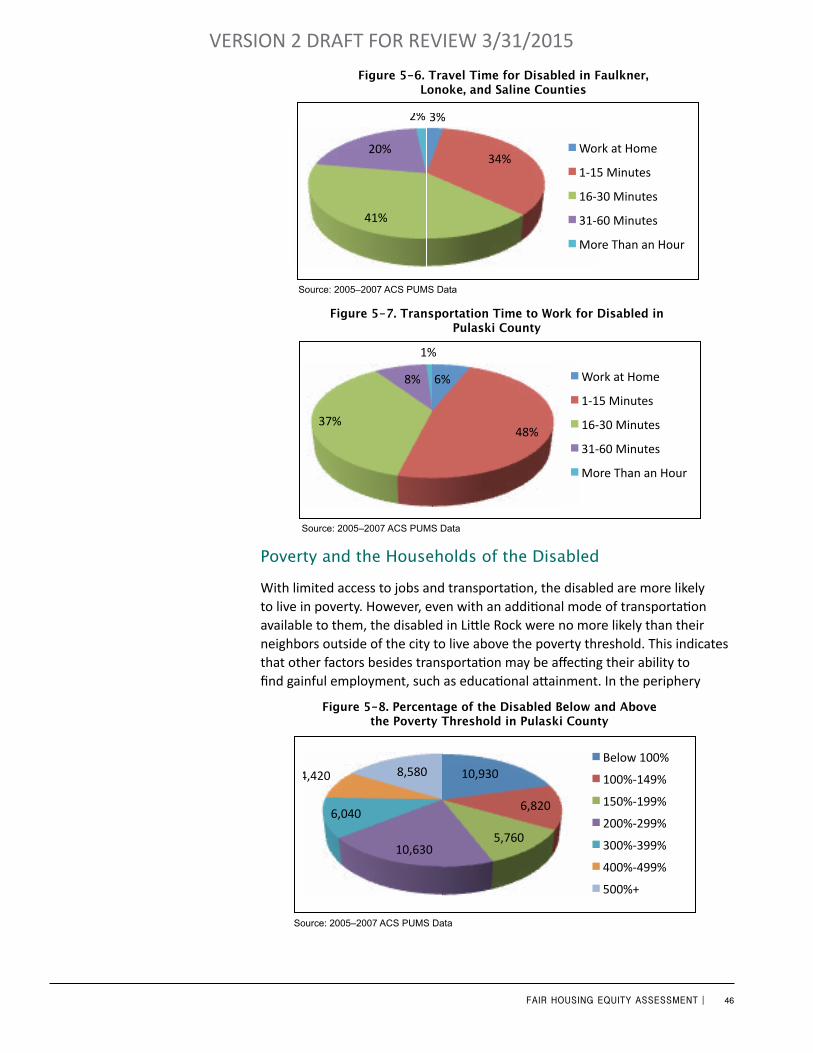
46FAIR HOUSING EQUITY ASSESSMENT |
VERSION 2 DRAFT FOR REVIEW 3/31/2015
Poverty and the Households of the Disabled
With limited access to jobs and transportation, the disabled are more likely to live in poverty. However, even with an additional mode of transportation available to them, the disabled in Little Rock were no more likely than their neighbors outside of the city to live above the poverty threshold. This indicates that other factors besides transportation may be affecting their ability to find gainful employment, such as educational attainment. In the periphery
3%
34%
41%
20%
2%
Travel Time for Disabled in Faulkner, Lonoke, and Saline Coun8es
Work at Home
1-‐15 Minutes
16-‐30 Minutes
31-‐60 Minutes
More Than an Hour
Figure 5-6. Travel Time for Disabled in Faulkner, Lonoke, and Saline Counties
Source: 2005–2007 ACS PUMS Data
6%
48% 37%
8%
1%
Transporta)on Time to Work for Disabled in Pulaski County
Work at Home
1-‐15 Minutes
16-‐30 Minutes
31-‐60 Minutes
More Than an Hour
Figure 5-7. Transportation Time to Work for Disabled in Pulaski County
Source: 2005–2007 ACS PUMS Data
6%
48% 37%
8%
1%
Transporta)on Time to Work for Disabled in Pulaski County
Work at Home
1-‐15 Minutes
16-‐30 Minutes
31-‐60 Minutes
More Than an Hour
10,930
6,820
5,760 10,630
6,040
4,420 8,580
Percentage of the Disabled Below and Above the Poverty Threshold in Pulaski
County
Below 100%
100%-‐149%
150%-‐199%
200%-‐299%
300%-‐399%
400%-‐499%
500%+
Figure 5-8. Percentage of the Disabled Below and Above the Poverty Threshold in Pulaski County
Source: 2005–2007 ACS PUMS Data

47FAIR HOUSING EQUITY ASSESSMENT |
VERSION 2 DRAFT FOR REVIEW 3/31/2015
counties, 20 percent of the disabled live below the threshold. When compared to those without disabilities, the disabled are nearly twice as likely to live in poverty.
The disabled are also far less likely to obtain jobs which exceed the poverty threshold by 500 percent or more than those without a disability.
13% 8%
9%
17% 13%
11%
29%
Percentage of the Popula0on w/o Disability Below and Above the Poverty
Threshold in Pulaski County Below 100%
100%-‐149%
150%-‐199%
200%-‐299%
300%-‐399%
400%-‐499%
500%+
Figure 5-9. Percentage of the Population without a Disability Below and Above the Poverty Threshold in Pulaski County
Source: 2005–2007 ACS PUMS Data
20%
13%
10% 21%
13%
9% 14%
Percentage of Disabled Popula4on Below and Above Poverty Threshold in Faulkner,
Lonoke, and Saline Coun4es
Below 100%
100%-‐149%
150%-‐199%
200%-‐299%
300%-‐399%
400%-‐499%
500%+
Source: 2005–2007 ACS PUMS Data
Figure 5-10. Percentage Disabled Population Below and Above the Poverty Threshold in Faulkner, Lonoke, and Saline Counties
11% 7%
8%
18%
17%
13%
26%
Percentage of Popula/on w/o Disability below and Above Poverty Threshold in Faulkner, Lonoke, and Saline Coun/es
Below 100%
100%-‐149%
150%-‐199%
200%-‐299%
300%-‐399%
400%-‐499%
500%+
Figure 5-11. Percentage of the Population without a Disability Below and Above the Poverty Threshold in Faulkner, Lonoke, and Saline Counties
Source: 2005–2007 ACS PUMS Data
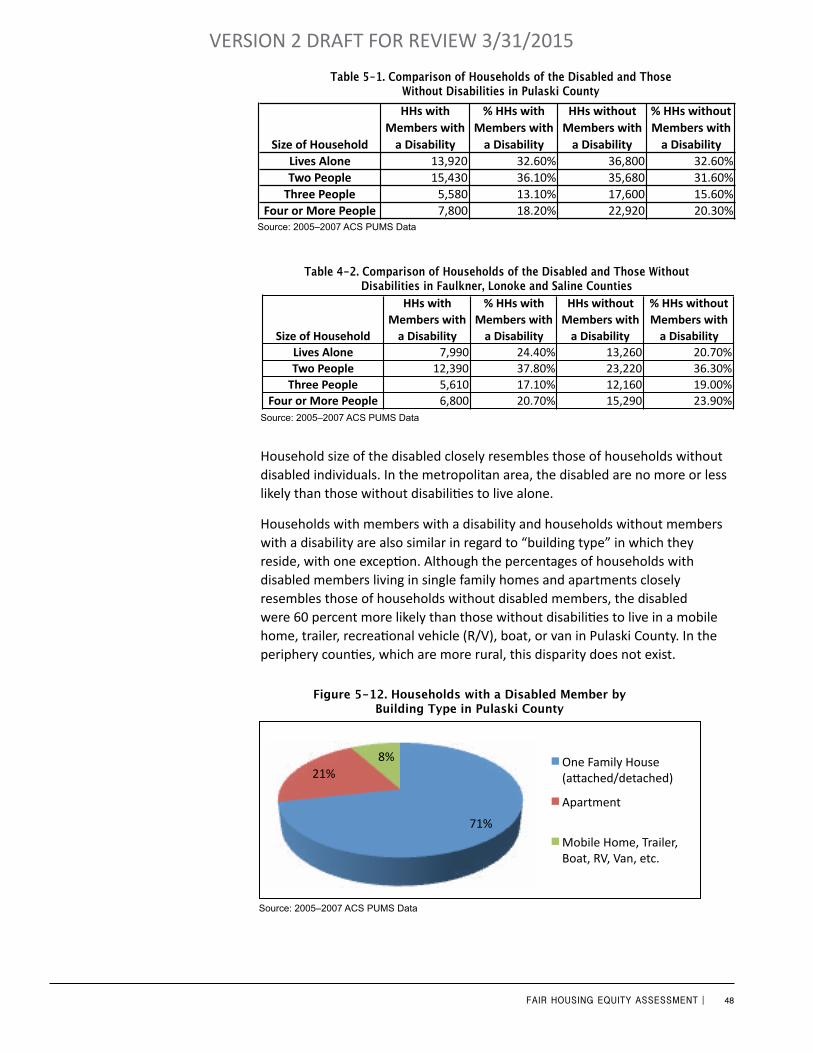
48FAIR HOUSING EQUITY ASSESSMENT |
VERSION 2 DRAFT FOR REVIEW 3/31/2015
Household size of the disabled closely resembles those of households without disabled individuals. In the metropolitan area, the disabled are no more or less likely than those without disabilities to live alone.
Households with members with a disability and households without members with a disability are also similar in regard to “building type” in which they reside, with one exception. Although the percentages of households with disabled members living in single family homes and apartments closely resembles those of households without disabled members, the disabled were 60 percent more likely than those without disabilities to live in a mobile home, trailer, recreational vehicle (R/V), boat, or van in Pulaski County. In the periphery counties, which are more rural, this disparity does not exist.
Size of Household
HHs with Members with
a Disability
% HHs with Members with
a Disability
HHs without Members with
a Disability
% HHs without Members with
a DisabilityLives Alone 13,920 32.60% 36,800 32.60%Two People 15,430 36.10% 35,680 31.60%Three People 5,580 13.10% 17,600 15.60%
Four or More People 7,800 18.20% 22,920 20.30%
Table 1: Comparison of Households of the Disabled and those w/o Disabilities in Pulaski CountyTable 5-1. Comparison of Households of the Disabled and Those
Without Disabilities in Pulaski County
Source: 2005–2007 ACS PUMS Data
Size of Household
HHs with Members with
a Disability
% HHs with Members with
a Disability
HHs without Members with
a Disability
% HHs without Members with
a DisabilityLives Alone 7,990 24.40% 13,260 20.70%Two People 12,390 37.80% 23,220 36.30%Three People 5,610 17.10% 12,160 19.00%
Four or More People 6,800 20.70% 15,290 23.90%
Table 2: Comparison of Households of the Disabled and those w/o Disabilities in Faulkner, Lonoke, and Saline CountiesTable 4-2. Comparison of Households of the Disabled and Those Without
Disabilities in Faulkner, Lonoke and Saline Counties
Source: 2005–2007 ACS PUMS Data
71%
21% 8%
Disabled Households by Building Type in Pulaski County
One Family House (a5ached/detached)
Apartment
Mobile Home, Trailer, Boat, RV, Van, etc.
Figure 5-12. Households with a Disabled Member by Building Type in Pulaski County
Source: 2005–2007 ACS PUMS Data
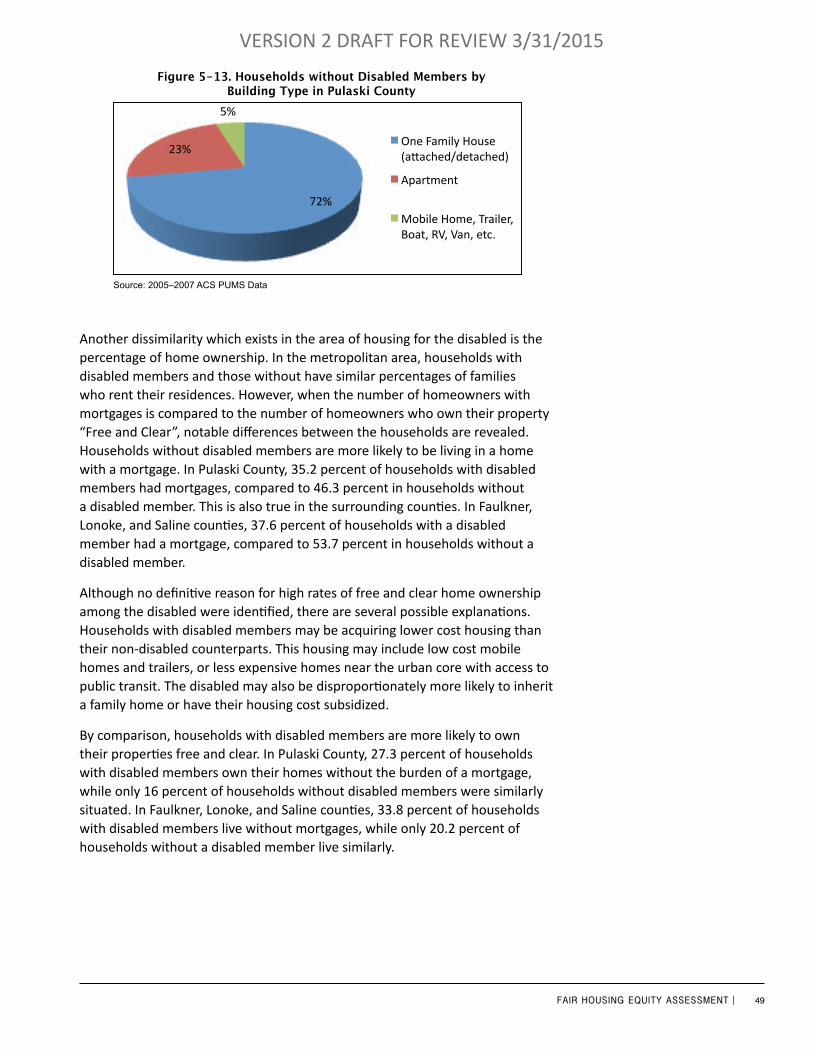
49FAIR HOUSING EQUITY ASSESSMENT |
VERSION 2 DRAFT FOR REVIEW 3/31/2015
Another dissimilarity which exists in the area of housing for the disabled is the percentage of home ownership. In the metropolitan area, households with disabled members and those without have similar percentages of families who rent their residences. However, when the number of homeowners with mortgages is compared to the number of homeowners who own their property “Free and Clear”, notable differences between the households are revealed. Households without disabled members are more likely to be living in a home with a mortgage. In Pulaski County, 35.2 percent of households with disabled members had mortgages, compared to 46.3 percent in households without a disabled member. This is also true in the surrounding counties. In Faulkner, Lonoke, and Saline counties, 37.6 percent of households with a disabled member had a mortgage, compared to 53.7 percent in households without a disabled member.
Although no definitive reason for high rates of free and clear home ownership among the disabled were identified, there are several possible explanations. Households with disabled members may be acquiring lower cost housing than their non-disabled counterparts. This housing may include low cost mobile homes and trailers, or less expensive homes near the urban core with access to public transit. The disabled may also be disproportionately more likely to inherit a family home or have their housing cost subsidized.
By comparison, households with disabled members are more likely to own their properties free and clear. In Pulaski County, 27.3 percent of households with disabled members own their homes without the burden of a mortgage, while only 16 percent of households without disabled members were similarly situated. In Faulkner, Lonoke, and Saline counties, 33.8 percent of households with disabled members live without mortgages, while only 20.2 percent of households without a disabled member live similarly.
72%
23%
5%
Households w/o Disabled members by Building Type in Pulaski County
One Family House (a5ached/detached)
Apartment
Mobile Home, Trailer, Boat, RV, Van, etc.
Figure 5-13. Households without Disabled Members by Building Type in Pulaski County
Source: 2005–2007 ACS PUMS Data
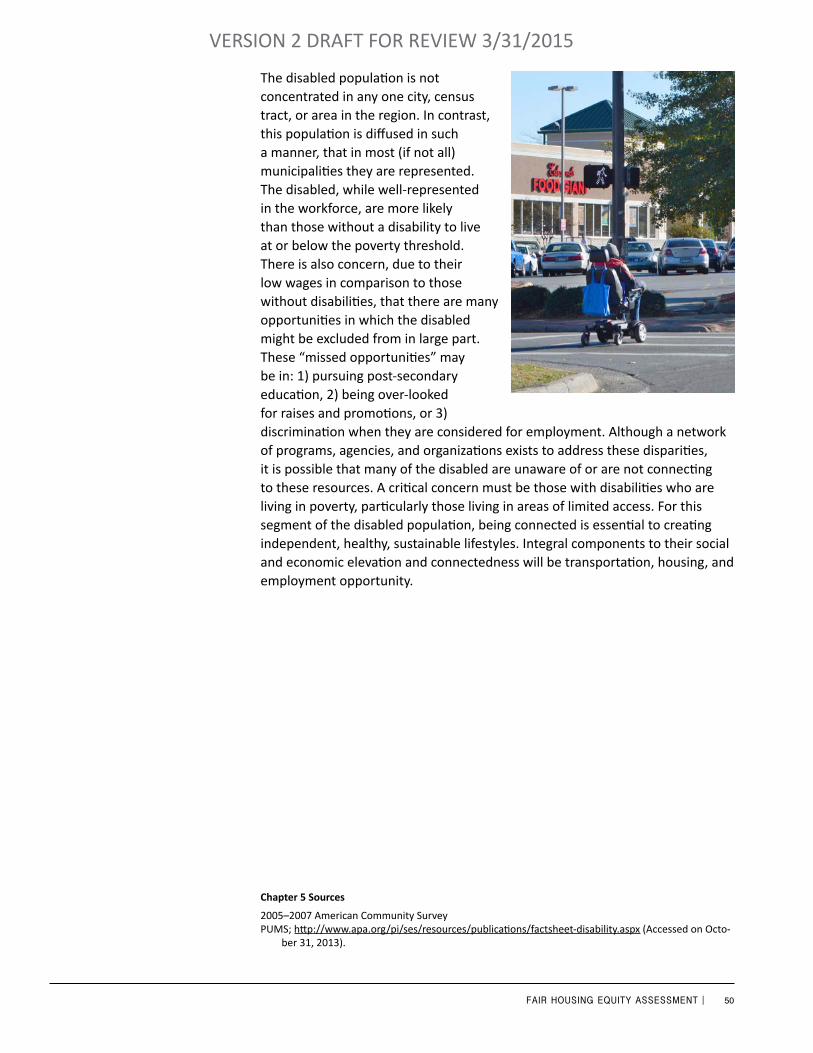
50FAIR HOUSING EQUITY ASSESSMENT |
VERSION 2 DRAFT FOR REVIEW 3/31/2015
The disabled population is not concentrated in any one city, census tract, or area in the region. In contrast, this population is diffused in such a manner, that in most (if not all) municipalities they are represented. The disabled, while well-represented in the workforce, are more likely than those without a disability to live at or below the poverty threshold. There is also concern, due to their low wages in comparison to those without disabilities, that there are many opportunities in which the disabled might be excluded from in large part. These “missed opportunities” may be in: 1) pursuing post-secondary education, 2) being over-looked for raises and promotions, or 3) discrimination when they are considered for employment. Although a network of programs, agencies, and organizations exists to address these disparities, it is possible that many of the disabled are unaware of or are not connecting to these resources. A critical concern must be those with disabilities who are living in poverty, particularly those living in areas of limited access. For this segment of the disabled population, being connected is essential to creating independent, healthy, sustainable lifestyles. Integral components to their social and economic elevation and connectedness will be transportation, housing, and employment opportunity.
Chapter 5 Sources
2005–2007 American Community Survey PUMS; http://www.apa.org/pi/ses/resources/publications/factsheet-disability.aspx (Accessed on Octo-
ber 31, 2013).
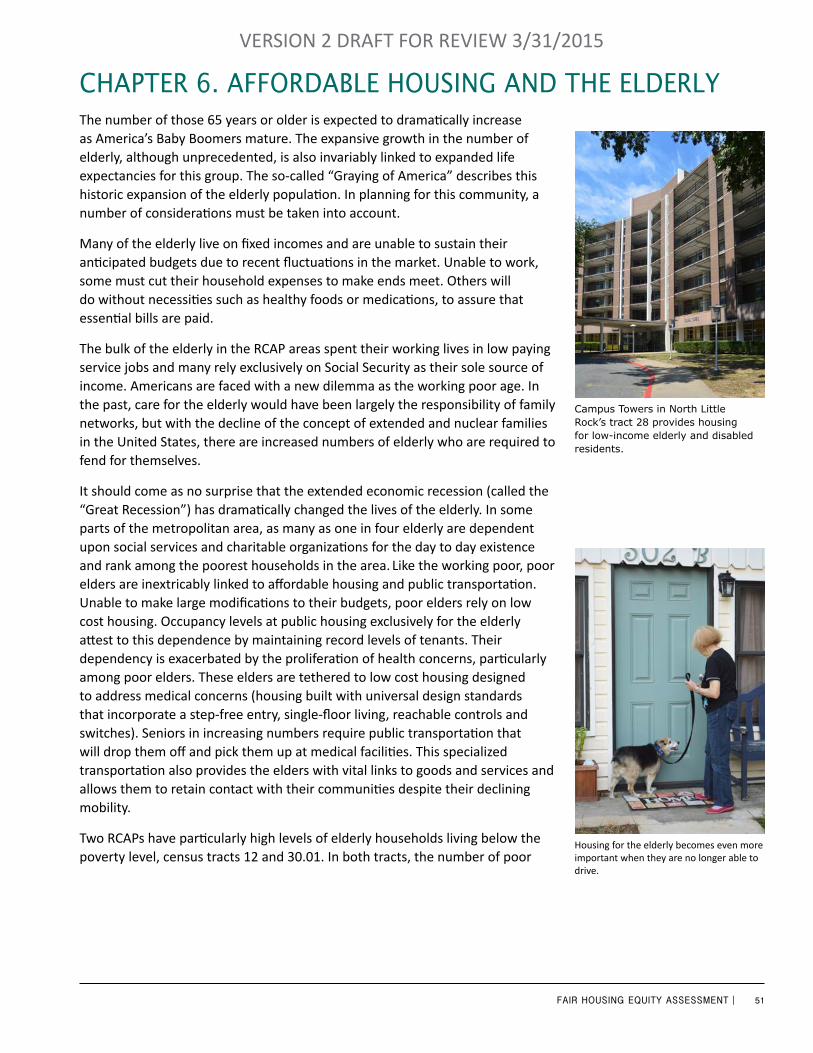
51FAIR HOUSING EQUITY ASSESSMENT |
VERSION 2 DRAFT FOR REVIEW 3/31/2015
Campus Towers in North Little Rock’s tract 28 provides housing for low-income elderly and disabled residents.
ChaPTer 6. affordable housing and The elderly
Housing for the elderly becomes even more important when they are no longer able to drive.
The number of those 65 years or older is expected to dramatically increase as America’s Baby Boomers mature. The expansive growth in the number of elderly, although unprecedented, is also invariably linked to expanded life expectancies for this group. The so-called “Graying of America” describes this historic expansion of the elderly population. In planning for this community, a number of considerations must be taken into account.
Many of the elderly live on fixed incomes and are unable to sustain their anticipated budgets due to recent fluctuations in the market. Unable to work, some must cut their household expenses to make ends meet. Others will do without necessities such as healthy foods or medications, to assure that essential bills are paid.
The bulk of the elderly in the RCAP areas spent their working lives in low paying service jobs and many rely exclusively on Social Security as their sole source of income. Americans are faced with a new dilemma as the working poor age. In the past, care for the elderly would have been largely the responsibility of family networks, but with the decline of the concept of extended and nuclear families in the United States, there are increased numbers of elderly who are required to fend for themselves.
It should come as no surprise that the extended economic recession (called the “Great Recession”) has dramatically changed the lives of the elderly. In some parts of the metropolitan area, as many as one in four elderly are dependent upon social services and charitable organizations for the day to day existence and rank among the poorest households in the area. Like the working poor, poor elders are inextricably linked to affordable housing and public transportation. Unable to make large modifications to their budgets, poor elders rely on low cost housing. Occupancy levels at public housing exclusively for the elderly attest to this dependence by maintaining record levels of tenants. Their dependency is exacerbated by the proliferation of health concerns, particularly among poor elders. These elders are tethered to low cost housing designed to address medical concerns (housing built with universal design standards that incorporate a step-free entry, single-floor living, reachable controls and switches). Seniors in increasing numbers require public transportation that will drop them off and pick them up at medical facilities. This specialized transportation also provides the elders with vital links to goods and services and allows them to retain contact with their communities despite their declining mobility.
Two RCAPs have particularly high levels of elderly households living below the poverty level, census tracts 12 and 30.01. In both tracts, the number of poor
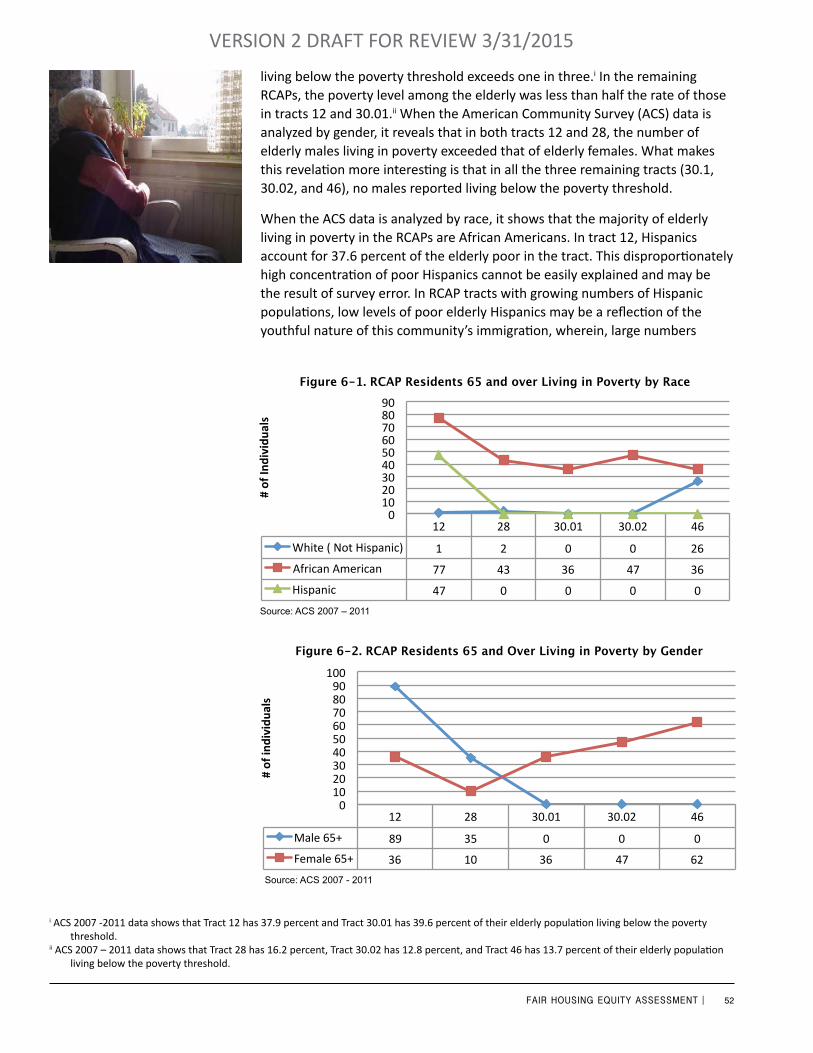
52FAIR HOUSING EQUITY ASSESSMENT |
VERSION 2 DRAFT FOR REVIEW 3/31/2015
living below the poverty threshold exceeds one in three.i In the remaining RCAPs, the poverty level among the elderly was less than half the rate of those in tracts 12 and 30.01.ii When the American Community Survey (ACS) data is analyzed by gender, it reveals that in both tracts 12 and 28, the number of elderly males living in poverty exceeded that of elderly females. What makes this revelation more interesting is that in all the three remaining tracts (30.1, 30.02, and 46), no males reported living below the poverty threshold.
When the ACS data is analyzed by race, it shows that the majority of elderly living in poverty in the RCAPs are African Americans. In tract 12, Hispanics account for 37.6 percent of the elderly poor in the tract. This disproportionately high concentration of poor Hispanics cannot be easily explained and may be the result of survey error. In RCAP tracts with growing numbers of Hispanic populations, low levels of poor elderly Hispanics may be a reflection of the youthful nature of this community’s immigration, wherein, large numbers
12 28 30.01 30.02 46
White ( Not Hispanic) 1 2 0 0 26
African American 77 43 36 47 36
Hispanic 47 0 0 0 0
0 10 20 30 40 50 60 70 80 90
# of In
dividu
als
65+ in Poverty by Race Figure 6-1. RCAP Residents 65 and over Living in Poverty by Race
Source: ACS 2007 – 2011
Source: ACS 2007 - 2011
12 28 30.01 30.02 46
Male 65+ 89 35 0 0 0
Female 65+ 36 10 36 47 62
0 10 20 30 40 50 60 70 80 90
100
# of individu
als
65+ and over in Poverty by Gender Figure 6-2. RCAP Residents 65 and Over Living in Poverty by Gender
i ACS 2007 -2011 data shows that Tract 12 has 37.9 percent and Tract 30.01 has 39.6 percent of their elderly population living below the poverty threshold.
ii ACS 2007 – 2011 data shows that Tract 28 has 16.2 percent, Tract 30.02 has 12.8 percent, and Tract 46 has 13.7 percent of their elderly population living below the poverty threshold.
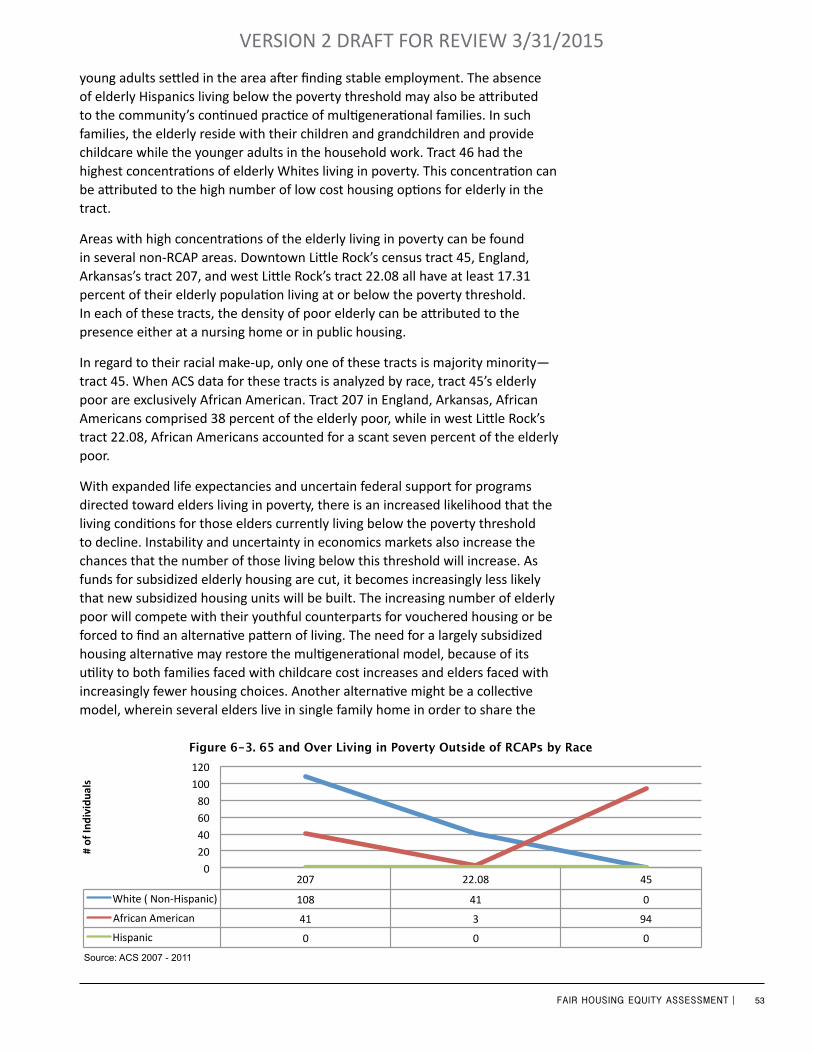
53FAIR HOUSING EQUITY ASSESSMENT |
VERSION 2 DRAFT FOR REVIEW 3/31/2015
207 22.08 45
White ( Non-‐Hispanic) 108 41 0
African American 41 3 94
Hispanic 0 0 0
0
20
40
60
80
100
120
# of In
dividu
als
65 and Over Living in Poverty Outside of RCAPs by Race
207 22.08 45
White ( Non-‐Hispanic) 108 41 0
African American 41 3 94
Hispanic 0 0 0
0
20
40
60
80
100
120
# of In
dividu
als
65 and Over Living in Poverty Outside of RCAPs by Race Figure 6-3. 65 and Over Living in Poverty Outside of RCAPs by Race
Source: ACS 2007 - 2011
young adults settled in the area after finding stable employment. The absence of elderly Hispanics living below the poverty threshold may also be attributed to the community’s continued practice of multigenerational families. In such families, the elderly reside with their children and grandchildren and provide childcare while the younger adults in the household work. Tract 46 had the highest concentrations of elderly Whites living in poverty. This concentration can be attributed to the high number of low cost housing options for elderly in the tract.
Areas with high concentrations of the elderly living in poverty can be found in several non-RCAP areas. Downtown Little Rock’s census tract 45, England, Arkansas’s tract 207, and west Little Rock’s tract 22.08 all have at least 17.31 percent of their elderly population living at or below the poverty threshold. In each of these tracts, the density of poor elderly can be attributed to the presence either at a nursing home or in public housing.
In regard to their racial make-up, only one of these tracts is majority minority— tract 45. When ACS data for these tracts is analyzed by race, tract 45’s elderly poor are exclusively African American. Tract 207 in England, Arkansas, African Americans comprised 38 percent of the elderly poor, while in west Little Rock’s tract 22.08, African Americans accounted for a scant seven percent of the elderly poor.
With expanded life expectancies and uncertain federal support for programs directed toward elders living in poverty, there is an increased likelihood that the living conditions for those elders currently living below the poverty threshold to decline. Instability and uncertainty in economics markets also increase the chances that the number of those living below this threshold will increase. As funds for subsidized elderly housing are cut, it becomes increasingly less likely that new subsidized housing units will be built. The increasing number of elderly poor will compete with their youthful counterparts for vouchered housing or be forced to find an alternative pattern of living. The need for a largely subsidized housing alternative may restore the multigenerational model, because of its utility to both families faced with childcare cost increases and elders faced with increasingly fewer housing choices. Another alternative might be a collective model, wherein several elders live in single family home in order to share the

54FAIR HOUSING EQUITY ASSESSMENT |
VERSION 2 DRAFT FOR REVIEW 3/31/2015
financial burden associated. This model provides the elder with independence, reduces the cost associated with living alone, and provides a connectedness with a community of peers (roommates). This model was popularized several decades before in the television show, “The Golden Girls” and although few elders elected to follow the model, the renewed interests in its utility and cost savings may make it an attractive model for the healthy seniors.
Chapter 6 Sources
United States Department of Housing and Urban Development, Demographic Data—Little Rock–North Little Rock–Conway Metropolitan Area—2006–2010.
American Community Survey (ACS) 2007–2011http://content.usatoday.com/communities/greenhouse/post/2010/12/home-buyers-multi-generation-
al-front-porches/1#.UnEXnsQo6M8 (Accessed on October 30, 2013); http://haysvillelibrary.word-press.com/2010/03/19/resurgence-of-the-multigenerational-household/ (Accessed on October 30, 2013); http://www.asaging.org/blog/multigenerational-living-rising-and-may-be-everyones-benefit (Accessed on October 30, 2013).
http://www.aarp.org/aarp-foundation/our-work/housing/info-2012/affordable-intergenerational-hous-ing-sunrise-park.html (Accessed on October 30, 2013); http://health.usnews.com/health-news/health-wellness/articles/2013/06/20/return-of-the-golden-girls-how-seniors-are-creating-commu-nity (Accessed on October 30, 2013).
http://www.spotlightonpoverty.org/map-detail.aspx?state=Arkansas (Accessed on October 30, 2013); http://www.publicnewsservice.org/2013-09-09/hunger-food-nutrition/getting-hungry-ar-seniors-the-benefits-they-need-and-deserve/a33900-1 (Accessed on October 30, 2013).
http://money.usnews.com/money/blogs/the-best-life/2011/01/14/how-to-make-multigenerationl-living-work (Accessed on October 20, 2013)
Figure 6-4. Percent Poor Elderly with Minority
Majority Census Tracts
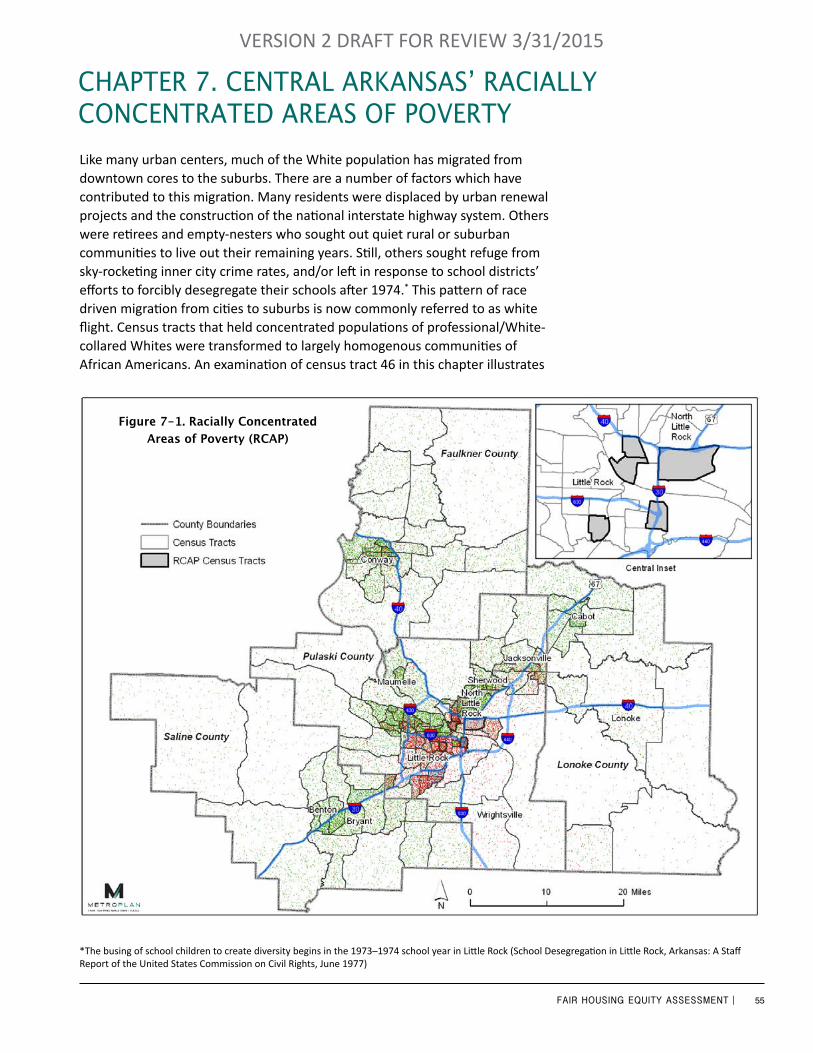
55FAIR HOUSING EQUITY ASSESSMENT |
VERSION 2 DRAFT FOR REVIEW 3/31/2015
ChaPTer 7. CenTral arkansas’ raCially ConCenTraTed areas of PoverTyLike many urban centers, much of the White population has migrated from downtown cores to the suburbs. There are a number of factors which have contributed to this migration. Many residents were displaced by urban renewal projects and the construction of the national interstate highway system. Others were retirees and empty-nesters who sought out quiet rural or suburban communities to live out their remaining years. Still, others sought refuge from sky-rocketing inner city crime rates, and/or left in response to school districts’ efforts to forcibly desegregate their schools after 1974.* This pattern of race driven migration from cities to suburbs is now commonly referred to as white flight. Census tracts that held concentrated populations of professional/White-collared Whites were transformed to largely homogenous communities of African Americans. An examination of census tract 46 in this chapter illustrates
Figure 7-1. Racially Concentrated Areas of Poverty (RCAP)
*The busing of school children to create diversity begins in the 1973–1974 school year in Little Rock (School Desegregation in Little Rock, Arkansas: A Staff Report of the United States Commission on Civil Rights, June 1977)
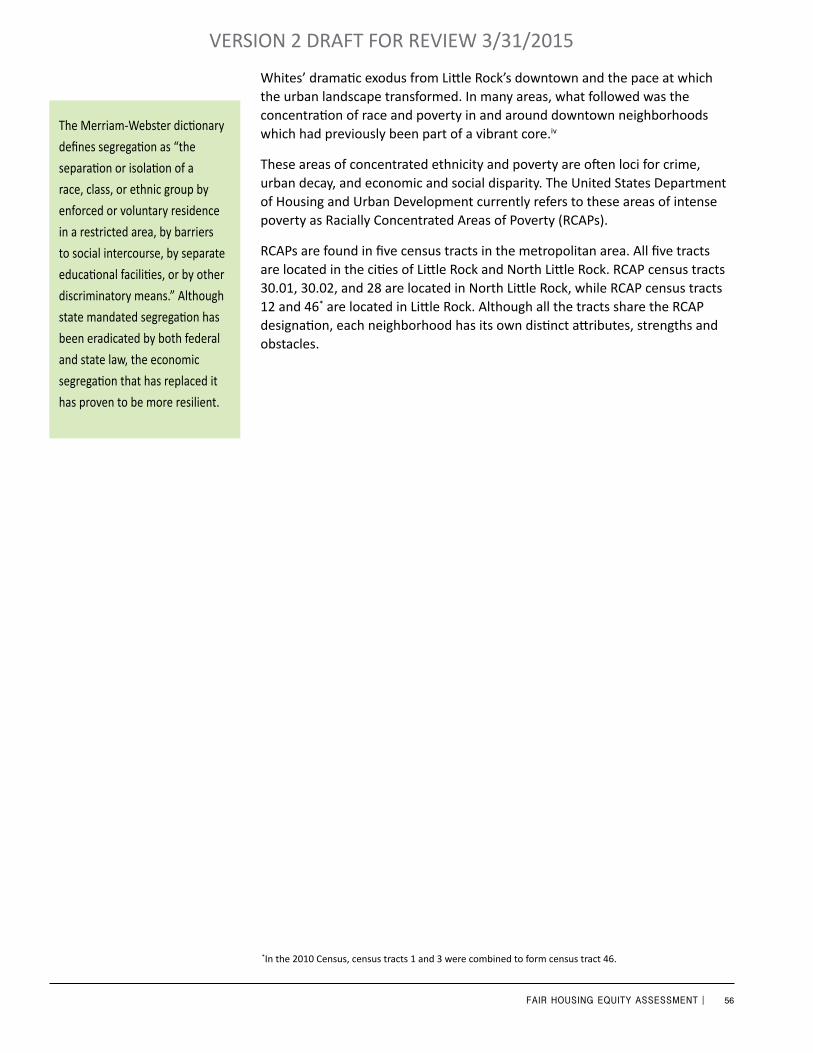
56FAIR HOUSING EQUITY ASSESSMENT |
VERSION 2 DRAFT FOR REVIEW 3/31/2015
Whites’ dramatic exodus from Little Rock’s downtown and the pace at which the urban landscape transformed. In many areas, what followed was the concentration of race and poverty in and around downtown neighborhoods which had previously been part of a vibrant core.iv
These areas of concentrated ethnicity and poverty are often loci for crime, urban decay, and economic and social disparity. The United States Department of Housing and Urban Development currently refers to these areas of intense poverty as Racially Concentrated Areas of Poverty (RCAPs).
RCAPs are found in five census tracts in the metropolitan area. All five tracts are located in the cities of Little Rock and North Little Rock. RCAP census tracts 30.01, 30.02, and 28 are located in North Little Rock, while RCAP census tracts 12 and 46* are located in Little Rock. Although all the tracts share the RCAP designation, each neighborhood has its own distinct attributes, strengths and obstacles.
*In the 2010 Census, census tracts 1 and 3 were combined to form census tract 46.
The Merriam-Webster dictionary
defines segregation as “the
separation or isolation of a
race, class, or ethnic group by
enforced or voluntary residence
in a restricted area, by barriers
to social intercourse, by separate
educational facilities, or by other
discriminatory means.” Although
state mandated segregation has
been eradicated by both federal
and state law, the economic
segregation that has replaced it
has proven to be more resilient.
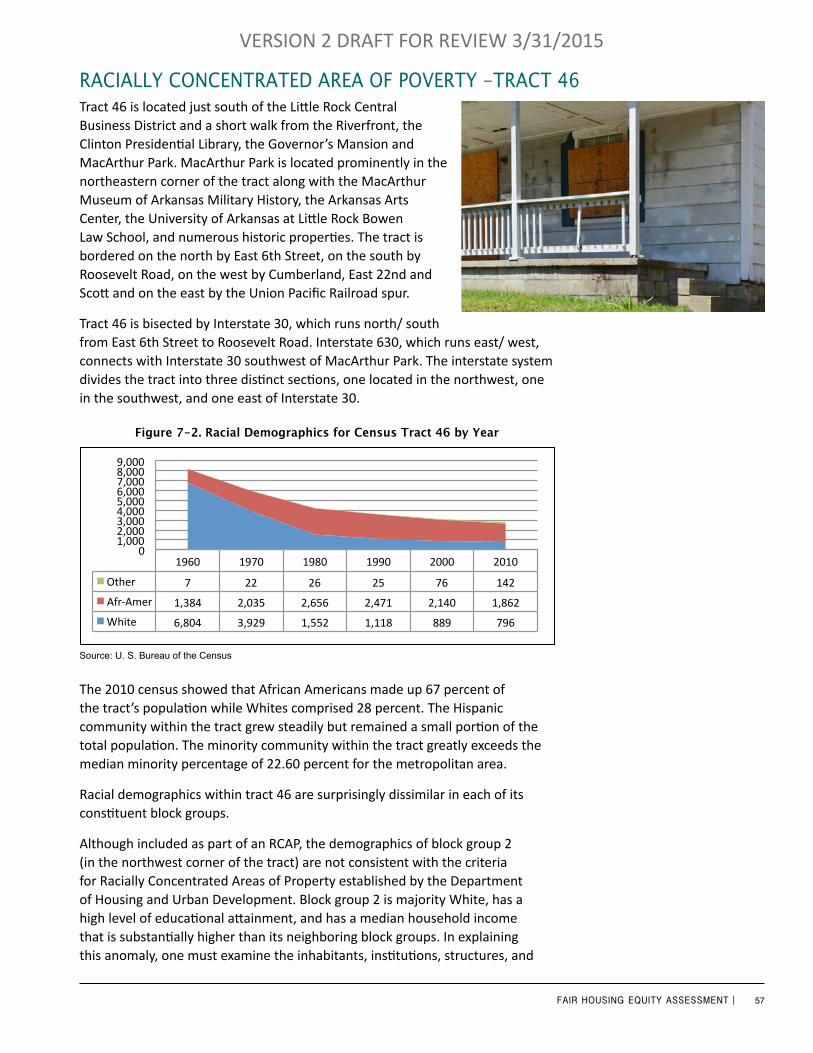
57FAIR HOUSING EQUITY ASSESSMENT |
VERSION 2 DRAFT FOR REVIEW 3/31/2015
Tract 46 is located just south of the Little Rock Central Business District and a short walk from the Riverfront, the Clinton Presidential Library, the Governor’s Mansion and MacArthur Park. MacArthur Park is located prominently in the northeastern corner of the tract along with the MacArthur Museum of Arkansas Military History, the Arkansas Arts Center, the University of Arkansas at Little Rock Bowen Law School, and numerous historic properties. The tract is bordered on the north by East 6th Street, on the south by Roosevelt Road, on the west by Cumberland, East 22nd and Scott and on the east by the Union Pacific Railroad spur.
Tract 46 is bisected by Interstate 30, which runs north/ south from East 6th Street to Roosevelt Road. Interstate 630, which runs east/ west, connects with Interstate 30 southwest of MacArthur Park. The interstate system divides the tract into three distinct sections, one located in the northwest, one in the southwest, and one east of Interstate 30.
The 2010 census showed that African Americans made up 67 percent of the tract’s population while Whites comprised 28 percent. The Hispanic community within the tract grew steadily but remained a small portion of the total population. The minority community within the tract greatly exceeds the median minority percentage of 22.60 percent for the metropolitan area.
Racial demographics within tract 46 are surprisingly dissimilar in each of its constituent block groups.
Although included as part of an RCAP, the demographics of block group 2 (in the northwest corner of the tract) are not consistent with the criteria for Racially Concentrated Areas of Property established by the Department of Housing and Urban Development. Block group 2 is majority White, has a high level of educational attainment, and has a median household income that is substantially higher than its neighboring block groups. In explaining this anomaly, one must examine the inhabitants, institutions, structures, and
Figure 7-2. Racial Demographics for Census Tract 46 by Year
1960 1970 1980 1990 2000 2010
Other 7 22 26 25 76 142
Afr-‐Amer 1,384 2,035 2,656 2,471 2,140 1,862
White 6,804 3,929 1,552 1,118 889 796
0 1,000 2,000 3,000 4,000 5,000 6,000 7,000 8,000 9,000
Racial Demographis in Tract 46 by Census Year
Source: U. S. Bureau of the Census
raCially ConCenTraTed area of PoverTy -TraCT 46

58FAIR HOUSING EQUITY ASSESSMENT |
VERSION 2 DRAFT FOR REVIEW 3/31/2015
amenities found within the block group and its surrounding neighborhoods. The residents of block group 2 are on average older than their tract neighbors.
Figure 7-3. Racial Demographics for Tract 46 by Block Group
Source: U. S. Bureau of the Census
BG 1 BG 2 BG 3
African American 678 589 604
White 100 652 64
Other 8 8 5
0
100
200
300
400
500
600
700
800
Popu
la'on
by Ra
ce
Racial Demographics for Tract 46 by Block Group
Figure 7-4. RCAP Census Tract 46
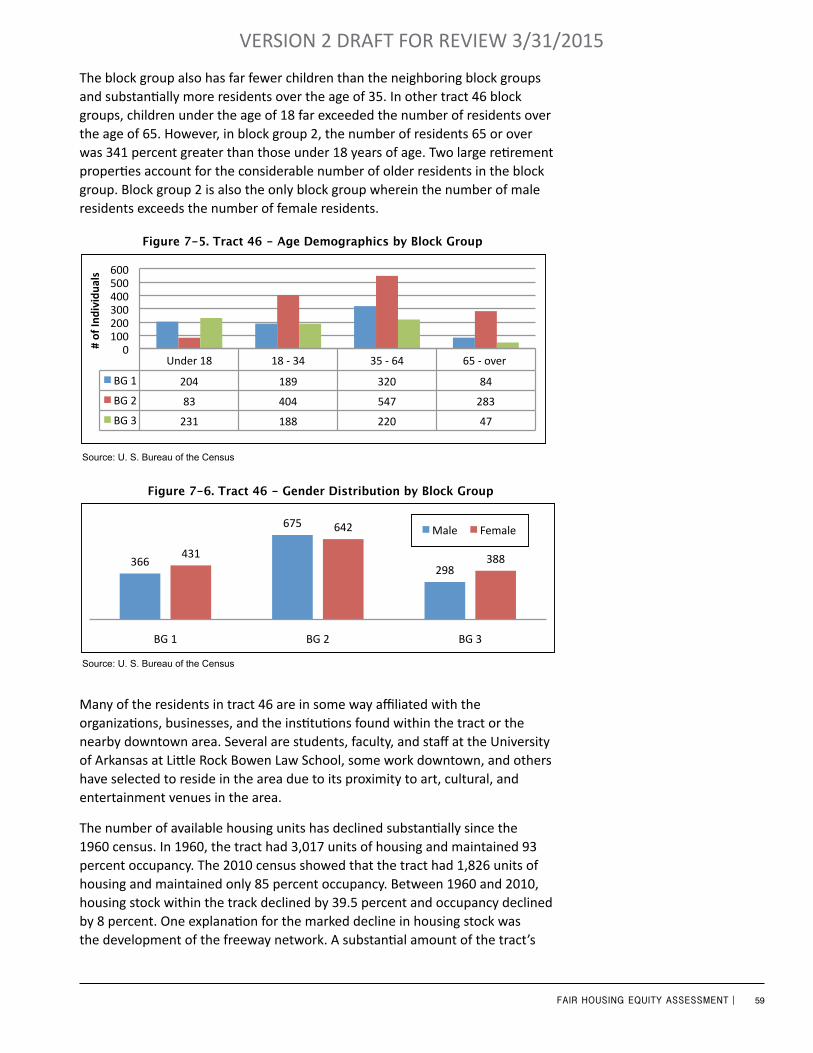
59FAIR HOUSING EQUITY ASSESSMENT |
VERSION 2 DRAFT FOR REVIEW 3/31/2015
The block group also has far fewer children than the neighboring block groups and substantially more residents over the age of 35. In other tract 46 block groups, children under the age of 18 far exceeded the number of residents over the age of 65. However, in block group 2, the number of residents 65 or over was 341 percent greater than those under 18 years of age. Two large retirement properties account for the considerable number of older residents in the block group. Block group 2 is also the only block group wherein the number of male residents exceeds the number of female residents.
Many of the residents in tract 46 are in some way affiliated with the organizations, businesses, and the institutions found within the tract or the nearby downtown area. Several are students, faculty, and staff at the University of Arkansas at Little Rock Bowen Law School, some work downtown, and others have selected to reside in the area due to its proximity to art, cultural, and entertainment venues in the area.
The number of available housing units has declined substantially since the 1960 census. In 1960, the tract had 3,017 units of housing and maintained 93 percent occupancy. The 2010 census showed that the tract had 1,826 units of housing and maintained only 85 percent occupancy. Between 1960 and 2010, housing stock within the track declined by 39.5 percent and occupancy declined by 8 percent. One explanation for the marked decline in housing stock was the development of the freeway network. A substantial amount of the tract’s
Figure 7-5. Tract 46 - Age Demographics by Block Group
Source: U. S. Bureau of the Census
Under 18 18 -‐ 34 35 -‐ 64 65 -‐ over
BG 1 204 189 320 84
BG 2 83 404 547 283
BG 3 231 188 220 47
0 100 200 300 400 500 600
# of In
dividu
als
Tract 46 -‐ Age Demographics by Block Group
366
675
298 431
642
388
BG 1 BG 2 BG 3
Tract 46 -‐ Gender Demographics by Block Group
Male Female Figure 7-6. Tract 46 - Gender Distribution by Block Group
366
675
298 431
642
388
BG 1 BG 2 BG 3
Tract 46 -‐ Gender Demographics by Block Group
Male Female
Source: U. S. Bureau of the Census

60FAIR HOUSING EQUITY ASSESSMENT |
VERSION 2 DRAFT FOR REVIEW 3/31/2015
housing stock was lost during the construction of Interstates 30 and 630 and an estimated 100 housing structures were destroyed or suffered extensive tornado damage in 1999. Currently, forty homes within the tract appear on the city’s vacant, abandoned, unsafe property list and are slated for demolition. Most of the tract’s current blight is confined to the southwest portion of the tract and the area east of Interstate 30.
Tract 46 had 1,554 units of occupied housing in 2010. The majority (75.8 percent or 1,178 units) was occupied by renters, while 376 units or 24.1 percent were owner-occupied. Nearly 15 percent (272 units) of the total housing stock was vacant, of which, 117 units were rental units seeking tenants and 15 units were for sale.
The ratio of renters to owners varies substantially in tract 46 block groups. In block group 1, the ratio of renters to property owners is nearly equal. In block group 2, the number of renters exceeds the number of homeowners. While block group 3 has more rental property than owner-occupied residential housing stock.
Owner Occupied
Renter Occupied
Vacant
0 200 400 600 800 1000 1200 1400
Occupied Housing Units in Tract 46 Figure 7-7. Total Housing Units in Tract 46
Source: U. S. Bureau of the Census
BG 1 BG 2 BG 3
Renters 140 837 201
Home Owners 130 157 89
0 100 200 300 400 500 600 700 800 900
# of Hou
sing Units
Tract 46 -‐ Number of Renter and Owner Occupied Housing units by Block Group
Figure 7-8. Tract 46 - Number of Renter and Owner Occupied Housing Units by Block Group
Source: U. S. Bureau of the Census
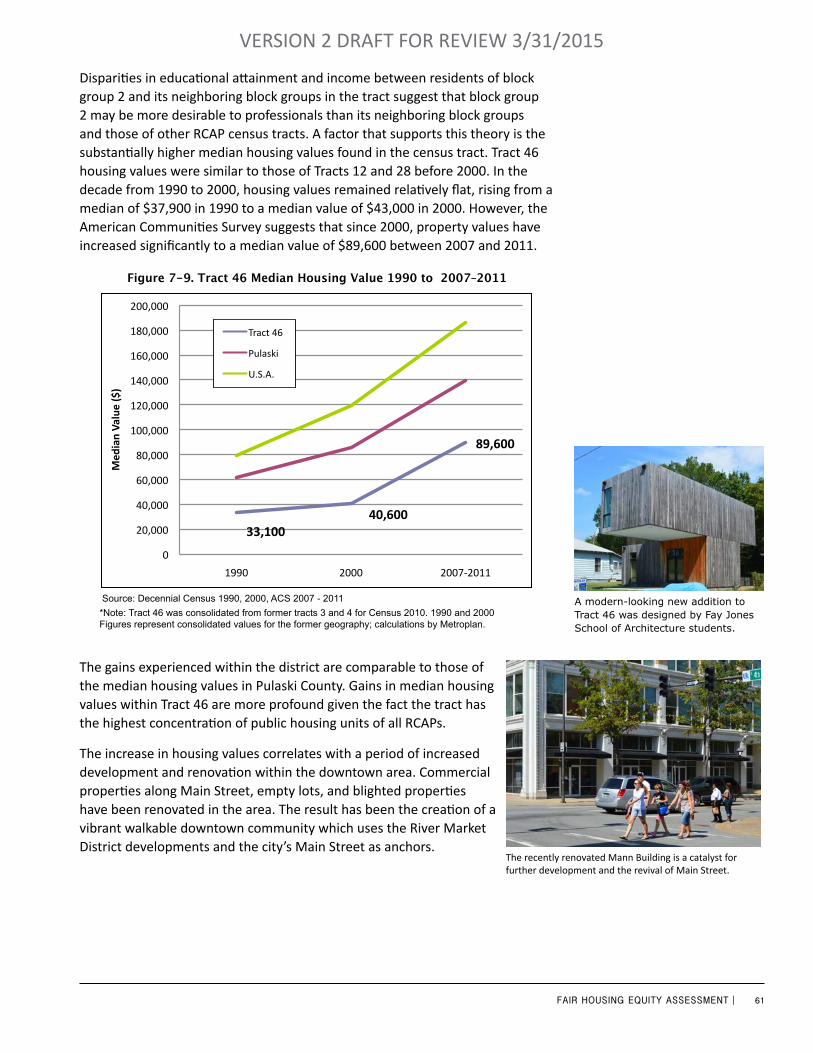
61FAIR HOUSING EQUITY ASSESSMENT |
VERSION 2 DRAFT FOR REVIEW 3/31/2015
Disparities in educational attainment and income between residents of block group 2 and its neighboring block groups in the tract suggest that block group 2 may be more desirable to professionals than its neighboring block groups and those of other RCAP census tracts. A factor that supports this theory is the substantially higher median housing values found in the census tract. Tract 46 housing values were similar to those of Tracts 12 and 28 before 2000. In the decade from 1990 to 2000, housing values remained relatively flat, rising from a median of $37,900 in 1990 to a median value of $43,000 in 2000. However, the American Communities Survey suggests that since 2000, property values have increased significantly to a median value of $89,600 between 2007 and 2011.
The gains experienced within the district are comparable to those of the median housing values in Pulaski County. Gains in median housing values within Tract 46 are more profound given the fact the tract has the highest concentration of public housing units of all RCAPs.
The increase in housing values correlates with a period of increased development and renovation within the downtown area. Commercial properties along Main Street, empty lots, and blighted properties have been renovated in the area. The result has been the creation of a vibrant walkable downtown community which uses the River Market District developments and the city’s Main Street as anchors.
33,100 40,600
89,600
0
20,000
40,000
60,000
80,000
100,000
120,000
140,000
160,000
180,000
200,000
1990 2000 2007-‐2011
Med
ian Va
lue ($)
Tract 46* Median Value 1990 to 2007-‐2011
Tract 46
Pulaski
U.S.A.
Figure 7-9. Tract 46 Median Housing Value 1990 to 2007–2011
Source: Decennial Census 1990, 2000, ACS 2007 - 2011*Note: Tract 46 was consolidated from former tracts 3 and 4 for Census 2010. 1990 and 2000 Figures represent consolidated values for the former geography; calculations by Metroplan.
33,100 40,600
89,600
0
20,000
40,000
60,000
80,000
100,000
120,000
140,000
160,000
180,000
200,000
1990 2000 2007-‐2011
Med
ian Va
lue ($)
Tract 46* Median Value 1990 to 2007-‐2011
Tract 46
Pulaski
U.S.A.
A modern-looking new addition to Tract 46 was designed by Fay Jones School of Architecture students.
The recently renovated Mann Building is a catalyst for further development and the revival of Main Street.
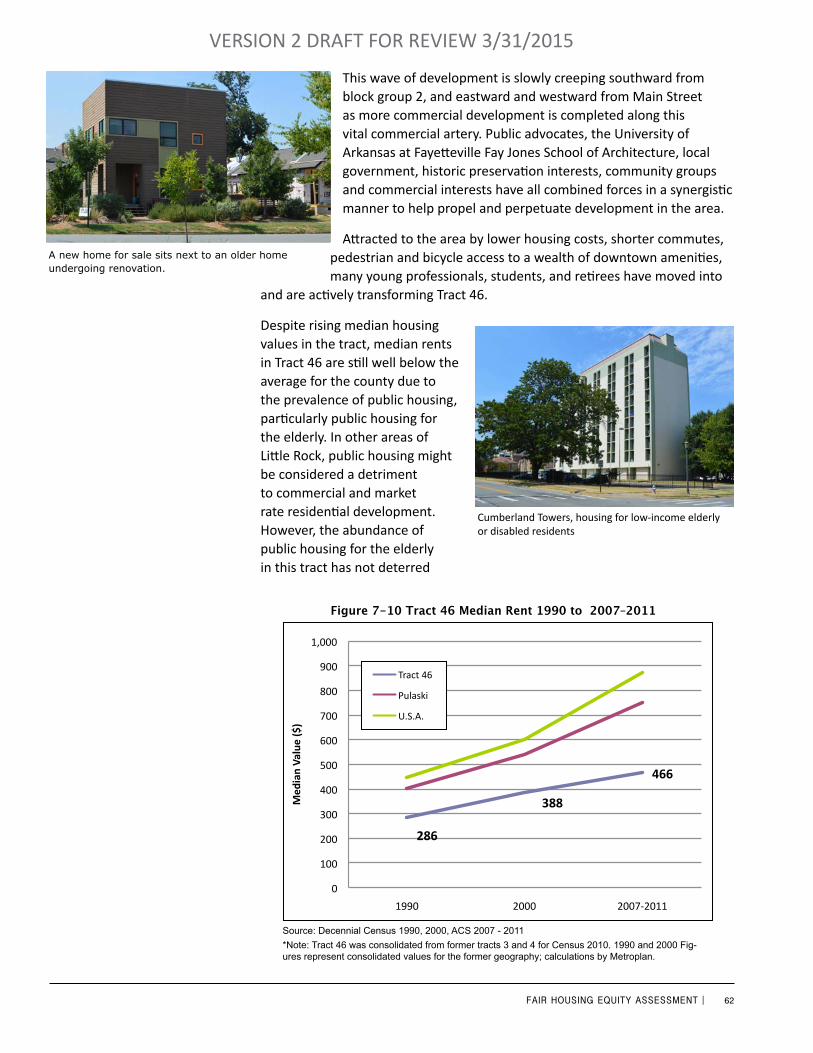
62FAIR HOUSING EQUITY ASSESSMENT |
VERSION 2 DRAFT FOR REVIEW 3/31/2015
This wave of development is slowly creeping southward from block group 2, and eastward and westward from Main Street as more commercial development is completed along this vital commercial artery. Public advocates, the University of Arkansas at Fayetteville Fay Jones School of Architecture, local government, historic preservation interests, community groups and commercial interests have all combined forces in a synergistic manner to help propel and perpetuate development in the area.
Attracted to the area by lower housing costs, shorter commutes, pedestrian and bicycle access to a wealth of downtown amenities, many young professionals, students, and retirees have moved into
and are actively transforming Tract 46.
Despite rising median housing values in the tract, median rents in Tract 46 are still well below the average for the county due to the prevalence of public housing, particularly public housing for the elderly. In other areas of Little Rock, public housing might be considered a detriment to commercial and market rate residential development. However, the abundance of public housing for the elderly in this tract has not deterred
286
388
466
0
100
200
300
400
500
600
700
800
900
1,000
1990 2000 2007-‐2011
Med
ian Va
lue ($)
Tract 46* Median Rent 1990 to 2007-‐2011
Tract 46
Pulaski
U.S.A.
286
388
466
0
100
200
300
400
500
600
700
800
900
1,000
1990 2000 2007-‐2011
Med
ian Va
lue ($)
Tract 46* Median Rent 1990 to 2007-‐2011
Tract 46
Pulaski
U.S.A.
Figure 7-10 Tract 46 Median Rent 1990 to 2007–2011
Source: Decennial Census 1990, 2000, ACS 2007 - 2011*Note: Tract 46 was consolidated from former tracts 3 and 4 for Census 2010. 1990 and 2000 Fig-ures represent consolidated values for the former geography; calculations by Metroplan.
Cumberland Towers, housing for low-income elderly or disabled residents
A new home for sale sits next to an older home undergoing renovation.
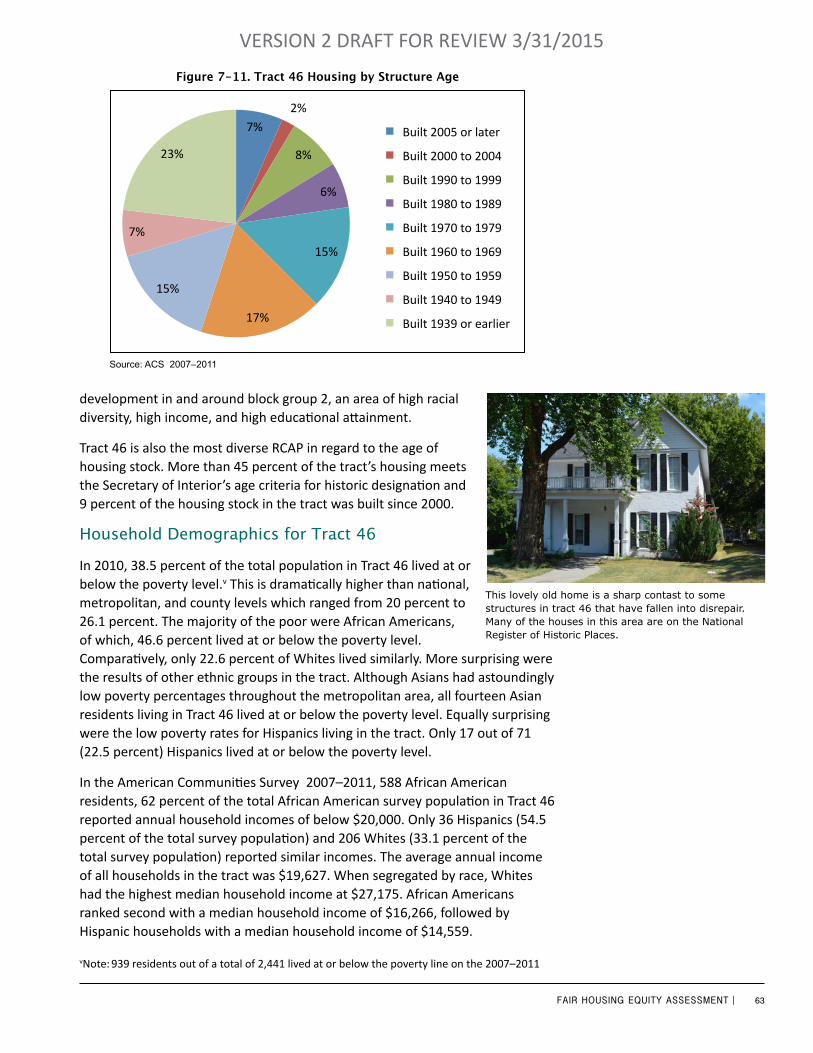
63FAIR HOUSING EQUITY ASSESSMENT |
VERSION 2 DRAFT FOR REVIEW 3/31/2015
7% 2%
8%
6%
15%
17%
15%
7%
23%
Tract 46 Housing by Structure Age
Built 2005 or later
Built 2000 to 2004
Built 1990 to 1999
Built 1980 to 1989
Built 1970 to 1979
Built 1960 to 1969
Built 1950 to 1959
Built 1940 to 1949
Built 1939 or earlier
Figure 7-11. Tract 46 Housing by Structure Age
Source: ACS 2007–2011
development in and around block group 2, an area of high racial diversity, high income, and high educational attainment.
Tract 46 is also the most diverse RCAP in regard to the age of housing stock. More than 45 percent of the tract’s housing meets the Secretary of Interior’s age criteria for historic designation and 9 percent of the housing stock in the tract was built since 2000.
Household Demographics for Tract 46
In 2010, 38.5 percent of the total population in Tract 46 lived at or below the poverty level.v This is dramatically higher than national, metropolitan, and county levels which ranged from 20 percent to 26.1 percent. The majority of the poor were African Americans, of which, 46.6 percent lived at or below the poverty level. Comparatively, only 22.6 percent of Whites lived similarly. More surprising were the results of other ethnic groups in the tract. Although Asians had astoundingly low poverty percentages throughout the metropolitan area, all fourteen Asian residents living in Tract 46 lived at or below the poverty level. Equally surprising were the low poverty rates for Hispanics living in the tract. Only 17 out of 71 (22.5 percent) Hispanics lived at or below the poverty level.
In the American Communities Survey 2007–2011, 588 African American residents, 62 percent of the total African American survey population in Tract 46 reported annual household incomes of below $20,000. Only 36 Hispanics (54.5 percent of the total survey population) and 206 Whites (33.1 percent of the total survey population) reported similar incomes. The average annual income of all households in the tract was $19,627. When segregated by race, Whites had the highest median household income at $27,175. African Americans ranked second with a median household income of $16,266, followed by Hispanic households with a median household income of $14,559.
This lovely old home is a sharp contast to some structures in tract 46 that have fallen into disrepair. Many of the houses in this area are on the National Register of Historic Places.
vNote: 939 residents out of a total of 2,441 lived at or below the poverty line on the 2007–2011
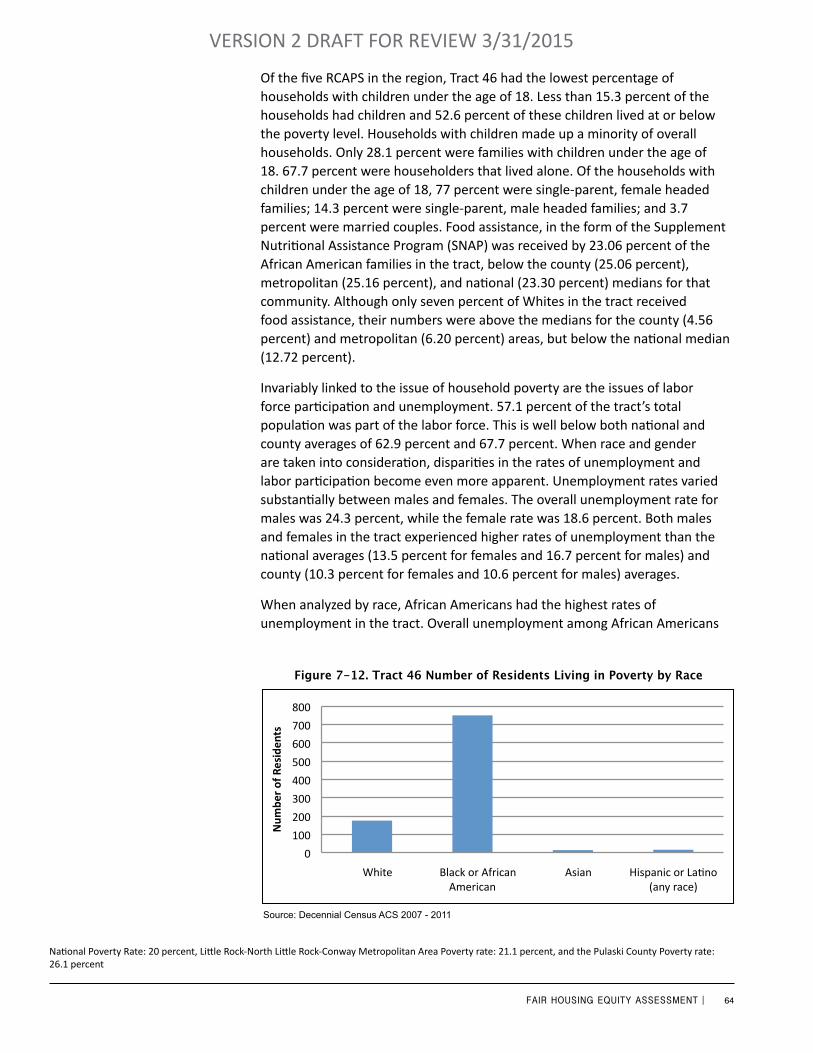
64FAIR HOUSING EQUITY ASSESSMENT |
VERSION 2 DRAFT FOR REVIEW 3/31/2015
Of the five RCAPS in the region, Tract 46 had the lowest percentage of households with children under the age of 18. Less than 15.3 percent of the households had children and 52.6 percent of these children lived at or below the poverty level. Households with children made up a minority of overall households. Only 28.1 percent were families with children under the age of 18. 67.7 percent were householders that lived alone. Of the households with children under the age of 18, 77 percent were single-parent, female headed families; 14.3 percent were single-parent, male headed families; and 3.7 percent were married couples. Food assistance, in the form of the Supplement Nutritional Assistance Program (SNAP) was received by 23.06 percent of the African American families in the tract, below the county (25.06 percent), metropolitan (25.16 percent), and national (23.30 percent) medians for that community. Although only seven percent of Whites in the tract received food assistance, their numbers were above the medians for the county (4.56 percent) and metropolitan (6.20 percent) areas, but below the national median (12.72 percent).
Invariably linked to the issue of household poverty are the issues of labor force participation and unemployment. 57.1 percent of the tract’s total population was part of the labor force. This is well below both national and county averages of 62.9 percent and 67.7 percent. When race and gender are taken into consideration, disparities in the rates of unemployment and labor participation become even more apparent. Unemployment rates varied substantially between males and females. The overall unemployment rate for males was 24.3 percent, while the female rate was 18.6 percent. Both males and females in the tract experienced higher rates of unemployment than the national averages (13.5 percent for females and 16.7 percent for males) and county (10.3 percent for females and 10.6 percent for males) averages.
When analyzed by race, African Americans had the highest rates of unemployment in the tract. Overall unemployment among African Americans
National Poverty Rate: 20 percent, Little Rock-North Little Rock-Conway Metropolitan Area Poverty rate: 21.1 percent, and the Pulaski County Poverty rate: 26.1 percent
0
100
200
300
400
500
600
700
800
White Black or African American
Asian Hispanic or La?no (any race)
Num
ber of Residen
ts
Tract 46 -‐ Poverty by Race Figure 7-12. Tract 46 Number of Residents Living in Poverty by Race
Source: Decennial Census ACS 2007 - 2011
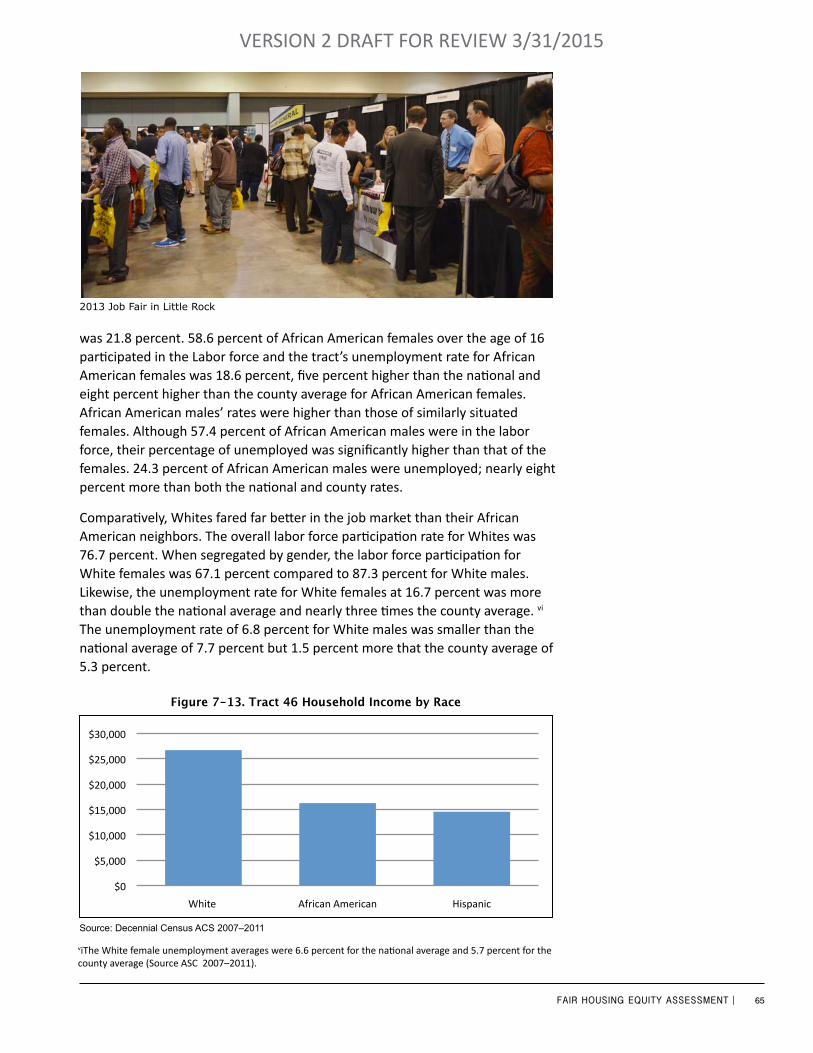
65FAIR HOUSING EQUITY ASSESSMENT |
VERSION 2 DRAFT FOR REVIEW 3/31/2015
was 21.8 percent. 58.6 percent of African American females over the age of 16 participated in the Labor force and the tract’s unemployment rate for African American females was 18.6 percent, five percent higher than the national and eight percent higher than the county average for African American females. African American males’ rates were higher than those of similarly situated females. Although 57.4 percent of African American males were in the labor force, their percentage of unemployed was significantly higher than that of the females. 24.3 percent of African American males were unemployed; nearly eight percent more than both the national and county rates.
Comparatively, Whites fared far better in the job market than their African American neighbors. The overall labor force participation rate for Whites was 76.7 percent. When segregated by gender, the labor force participation for White females was 67.1 percent compared to 87.3 percent for White males. Likewise, the unemployment rate for White females at 16.7 percent was more than double the national average and nearly three times the county average. vi
The unemployment rate of 6.8 percent for White males was smaller than the national average of 7.7 percent but 1.5 percent more that the county average of 5.3 percent.
2013 Job Fair in Little Rock
$0
$5,000
$10,000
$15,000
$20,000
$25,000
$30,000
White African American Hispanic
Tract 46 Household Income by Race Figure 7-13. Tract 46 Household Income by Race
Source: Decennial Census ACS 2007–2011
viThe White female unemployment averages were 6.6 percent for the national average and 5.7 percent for the county average (Source ASC 2007–2011).
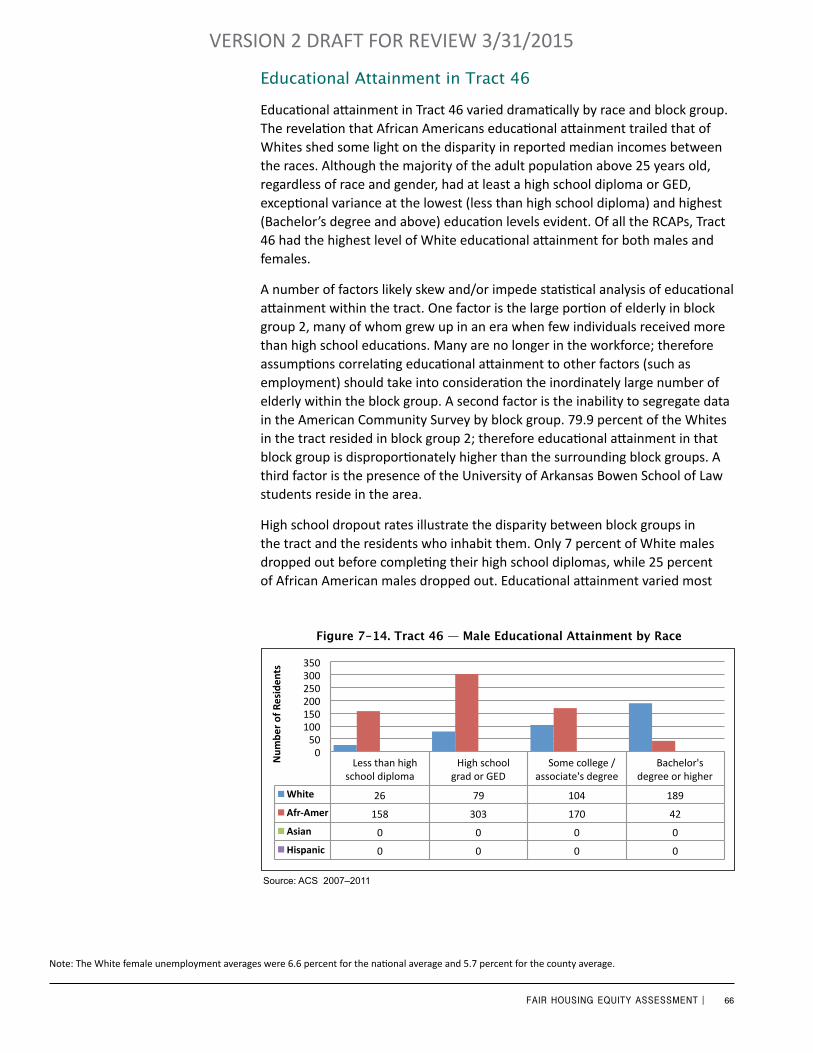
66FAIR HOUSING EQUITY ASSESSMENT |
VERSION 2 DRAFT FOR REVIEW 3/31/2015
Educational Attainment in Tract 46
Educational attainment in Tract 46 varied dramatically by race and block group. The revelation that African Americans educational attainment trailed that of Whites shed some light on the disparity in reported median incomes between the races. Although the majority of the adult population above 25 years old, regardless of race and gender, had at least a high school diploma or GED, exceptional variance at the lowest (less than high school diploma) and highest (Bachelor’s degree and above) education levels evident. Of all the RCAPs, Tract 46 had the highest level of White educational attainment for both males and females.
A number of factors likely skew and/or impede statistical analysis of educational attainment within the tract. One factor is the large portion of elderly in block group 2, many of whom grew up in an era when few individuals received more than high school educations. Many are no longer in the workforce; therefore assumptions correlating educational attainment to other factors (such as employment) should take into consideration the inordinately large number of elderly within the block group. A second factor is the inability to segregate data in the American Community Survey by block group. 79.9 percent of the Whites in the tract resided in block group 2; therefore educational attainment in that block group is disproportionately higher than the surrounding block groups. A third factor is the presence of the University of Arkansas Bowen School of Law students reside in the area.
High school dropout rates illustrate the disparity between block groups in the tract and the residents who inhabit them. Only 7 percent of White males dropped out before completing their high school diplomas, while 25 percent of African American males dropped out. Educational attainment varied most
Note: The White female unemployment averages were 6.6 percent for the national average and 5.7 percent for the county average.
Figure 7-14. Tract 46 — Male Educational Attainment by Race
Less than high school diploma
High school grad or GED
Some college / associate's degree
Bachelor's degree or higher
White 26 79 104 189
Black 158 303 170 42
Hispanic 0 0 0 0
Asian 0 0 0 0
0 50
100 150 200 250 300 350
Num
ber of Residen
ts
Tract 46 -‐ Male Educa9onal A;ainment by Race
Source: ACS 2007–2011
White
Afr-Amer
Asian
Hispanic
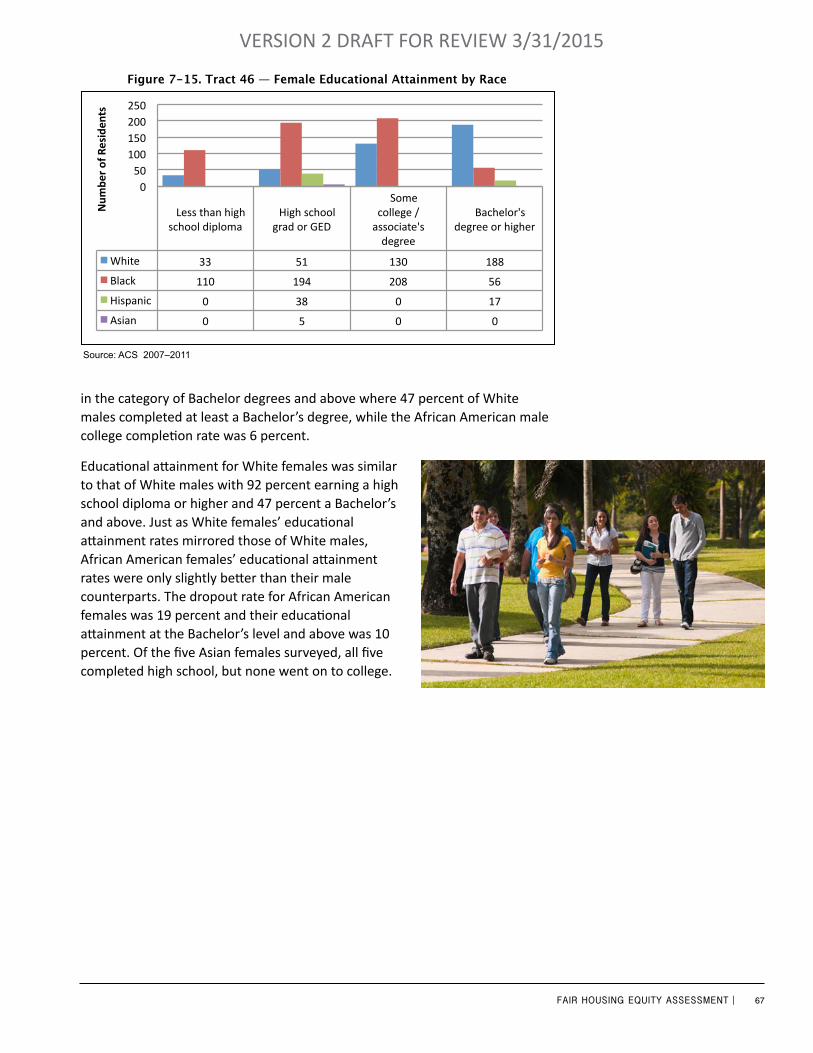
67FAIR HOUSING EQUITY ASSESSMENT |
VERSION 2 DRAFT FOR REVIEW 3/31/2015
Source: ACS 2007–2011
Less than high school diploma
High school grad or GED
Some college / associate's degree
Bachelor's degree or higher
White 33 51 130 188
Black 110 194 208 56
Hispanic 0 38 0 17
Asian 0 5 0 0
0 50
100 150 200 250
Num
ber of Residen
ts
Tract 46 Educa6onal A9ainment -‐Female Figure 7-15. Tract 46 — Female Educational Attainment by Race
in the category of Bachelor degrees and above where 47 percent of White males completed at least a Bachelor’s degree, while the African American male college completion rate was 6 percent.
Educational attainment for White females was similar to that of White males with 92 percent earning a high school diploma or higher and 47 percent a Bachelor’s and above. Just as White females’ educational attainment rates mirrored those of White males, African American females’ educational attainment rates were only slightly better than their male counterparts. The dropout rate for African American females was 19 percent and their educational attainment at the Bachelor’s level and above was 10 percent. Of the five Asian females surveyed, all five completed high school, but none went on to college.
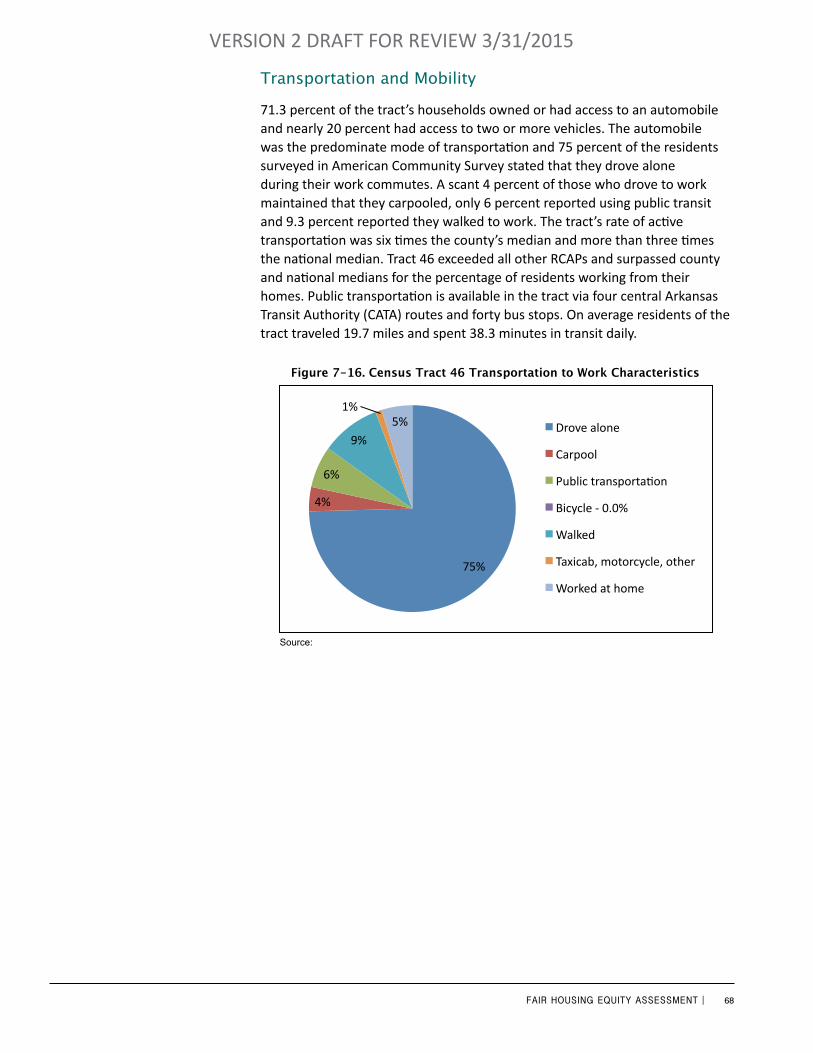
68FAIR HOUSING EQUITY ASSESSMENT |
VERSION 2 DRAFT FOR REVIEW 3/31/2015
Transportation and Mobility
71.3 percent of the tract’s households owned or had access to an automobile and nearly 20 percent had access to two or more vehicles. The automobile was the predominate mode of transportation and 75 percent of the residents surveyed in American Community Survey stated that they drove alone during their work commutes. A scant 4 percent of those who drove to work maintained that they carpooled, only 6 percent reported using public transit and 9.3 percent reported they walked to work. The tract’s rate of active transportation was six times the county’s median and more than three times the national median. Tract 46 exceeded all other RCAPs and surpassed county and national medians for the percentage of residents working from their homes. Public transportation is available in the tract via four central Arkansas Transit Authority (CATA) routes and forty bus stops. On average residents of the tract traveled 19.7 miles and spent 38.3 minutes in transit daily.
75%
4%
6%
9%
1% 5%
Census Tract 46 Transporta0on to Work Characteris0cs
Drove alone
Carpool
Public transporta:on
Bicycle -‐ 0.0%
Walked
Taxicab, motorcycle, other
Worked at home
Figure 7-16. Census Tract 46 Transportation to Work Characteristics
Source:

69FAIR HOUSING EQUITY ASSESSMENT |
VERSION 2 DRAFT FOR REVIEW 3/31/2015
Like census tract 46, census tract 12 was a majority White neighborhood prior to the white flight of the 1960s and 70s. The tract is located southwest of Little Rock’s Central Business District and is bordered on the north by West 20th Street, the Union Pacific Railroad on the eastern border, South Elm Street on the west, and Fourche Creek on the south. The most prominent features in the tract are Calvary and Roselawn cemeteries located on the tract’s northeast corner and the Pulaski County Regional Detention Facility found near the center along West Roosevelt Road.
The majority of the tract’s residential stock is found in the northwestern section south of the northern border of West 20th Street extending east from South Elm Street, to Calvary Cemetery and north of Wright Avenue. A smaller residential community is located south of Wright Avenue to the west of Roselawn cemetery. In the area north of Wright Avenue, there are dense concentrations of abandoned, vacant, and unsafe properties, many of which are indistinguishable from inhabited housing stock that is itself in varying states of disrepair. Once 98.4 percent of the tract’s population, Whites accounted for only 19.1 percent of the population in the 2010 census.
Figure 7-17. RCAP Census Tract 12
raCially ConCenTraTed area of PoverTy -TraCT 12
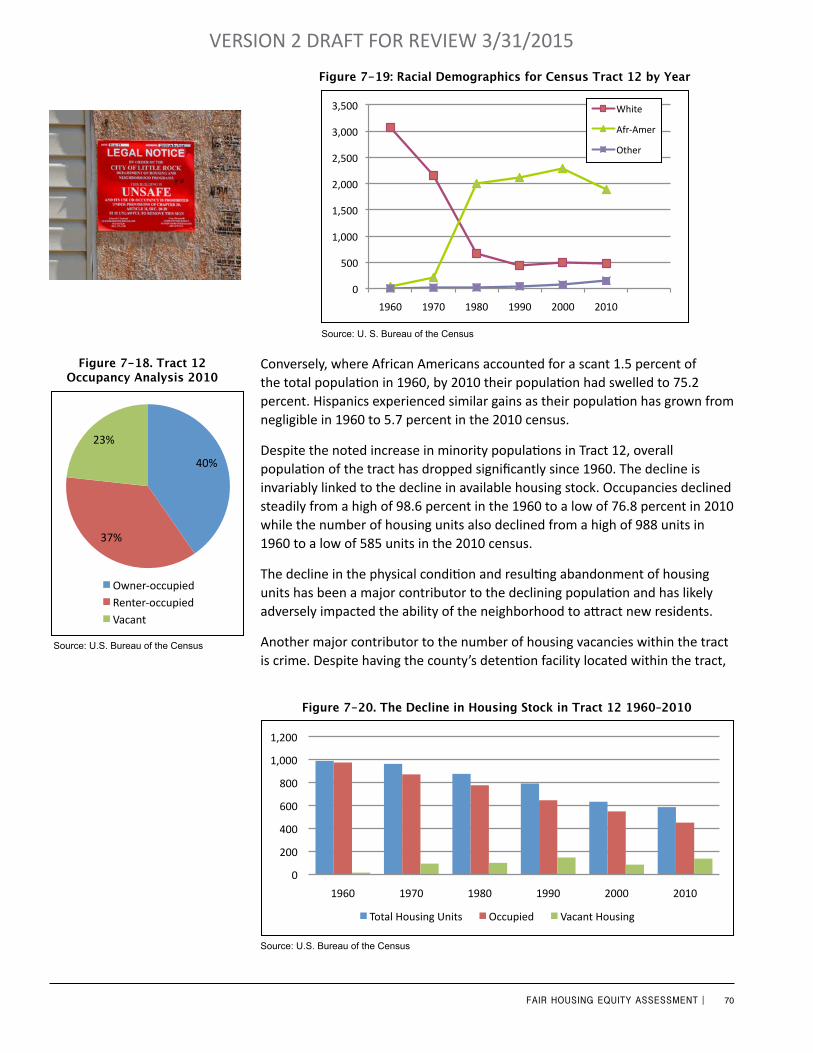
70FAIR HOUSING EQUITY ASSESSMENT |
VERSION 2 DRAFT FOR REVIEW 3/31/2015
Conversely, where African Americans accounted for a scant 1.5 percent of the total population in 1960, by 2010 their population had swelled to 75.2 percent. Hispanics experienced similar gains as their population has grown from negligible in 1960 to 5.7 percent in the 2010 census.
Despite the noted increase in minority populations in Tract 12, overall population of the tract has dropped significantly since 1960. The decline is invariably linked to the decline in available housing stock. Occupancies declined steadily from a high of 98.6 percent in the 1960 to a low of 76.8 percent in 2010 while the number of housing units also declined from a high of 988 units in 1960 to a low of 585 units in the 2010 census.
The decline in the physical condition and resulting abandonment of housing units has been a major contributor to the declining population and has likely adversely impacted the ability of the neighborhood to attract new residents.
Another major contributor to the number of housing vacancies within the tract is crime. Despite having the county’s detention facility located within the tract,
0
500
1,000
1,500
2,000
2,500
3,000
3,500
1960 1970 1980 1990 2000 2010
White
Afr-‐Amer
Other 0
500
1,000
1,500
2,000
2,500
3,000
3,500
1960 1970 1980 1990 2000 2010
White
Afr-‐Amer
Other
Figure 7-19: Racial Demographics for Census Tract 12 by Year
Source: U. S. Bureau of the Census
Figure 7-20. The Decline in Housing Stock in Tract 12 1960–2010
Source: U.S. Bureau of the Census
0
200
400
600
800
1,000
1,200
1960 1970 1980 1990 2000 2010
The Decline in Housing in Tract 12
Total Housing Units Occupied Vacant Housing
Source: U.S. Bureau of the Census
40%
37%
23%
Tract 12 -‐ 2010 Occupancy Analysis
Owner-‐occupied
Renter-‐occupied
Vacant
Figure 7-18. Tract 12 Occupancy Analysis 2010
40%
37%
23%
Tract 12 -‐ 2010 Occupancy Analysis
Owner-‐occupied Renter-‐occupied Vacant
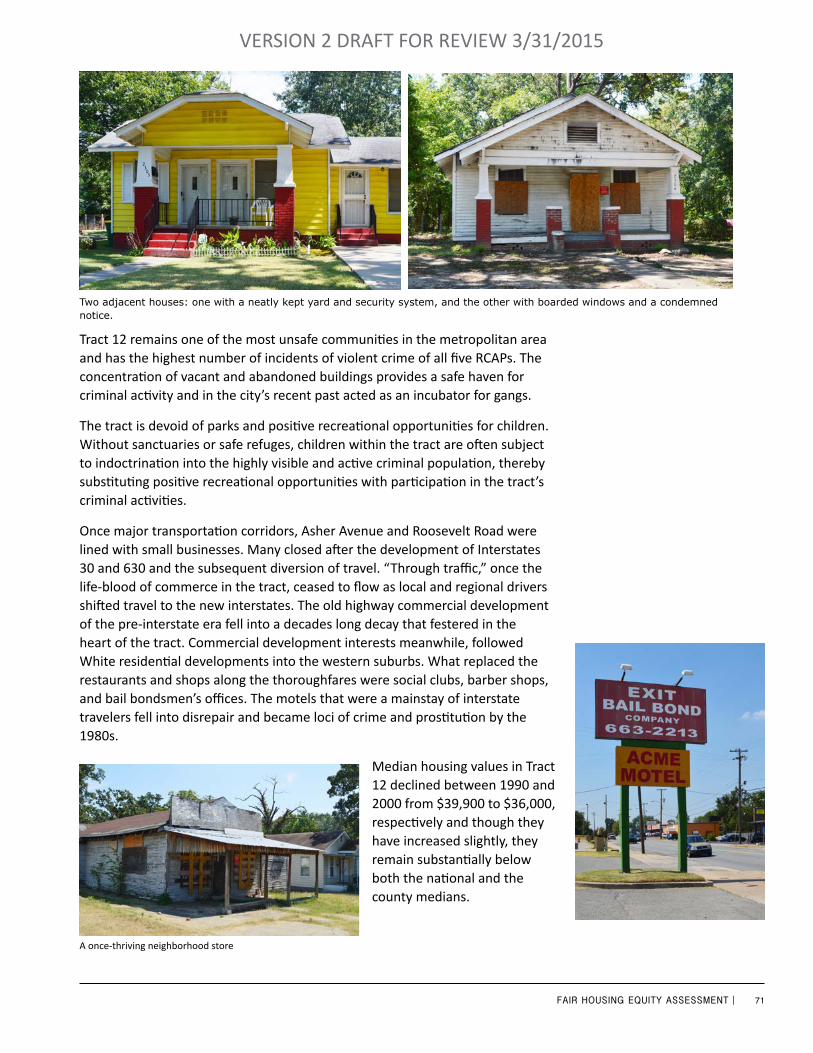
71FAIR HOUSING EQUITY ASSESSMENT |
VERSION 2 DRAFT FOR REVIEW 3/31/2015
Tract 12 remains one of the most unsafe communities in the metropolitan area and has the highest number of incidents of violent crime of all five RCAPs. The concentration of vacant and abandoned buildings provides a safe haven for criminal activity and in the city’s recent past acted as an incubator for gangs.
The tract is devoid of parks and positive recreational opportunities for children. Without sanctuaries or safe refuges, children within the tract are often subject to indoctrination into the highly visible and active criminal population, thereby substituting positive recreational opportunities with participation in the tract’s criminal activities.
Once major transportation corridors, Asher Avenue and Roosevelt Road were lined with small businesses. Many closed after the development of Interstates 30 and 630 and the subsequent diversion of travel. “Through traffic,” once the life-blood of commerce in the tract, ceased to flow as local and regional drivers shifted travel to the new interstates. The old highway commercial development of the pre-interstate era fell into a decades long decay that festered in the heart of the tract. Commercial development interests meanwhile, followed White residential developments into the western suburbs. What replaced the restaurants and shops along the thoroughfares were social clubs, barber shops, and bail bondsmen’s offices. The motels that were a mainstay of interstate travelers fell into disrepair and became loci of crime and prostitution by the 1980s.
Median housing values in Tract 12 declined between 1990 and 2000 from $39,900 to $36,000, respectively and though they have increased slightly, they remain substantially below both the national and the county medians.
Two adjacent houses: one with a neatly kept yard and security system, and the other with boarded windows and a condemned notice.
A once-thriving neighborhood store
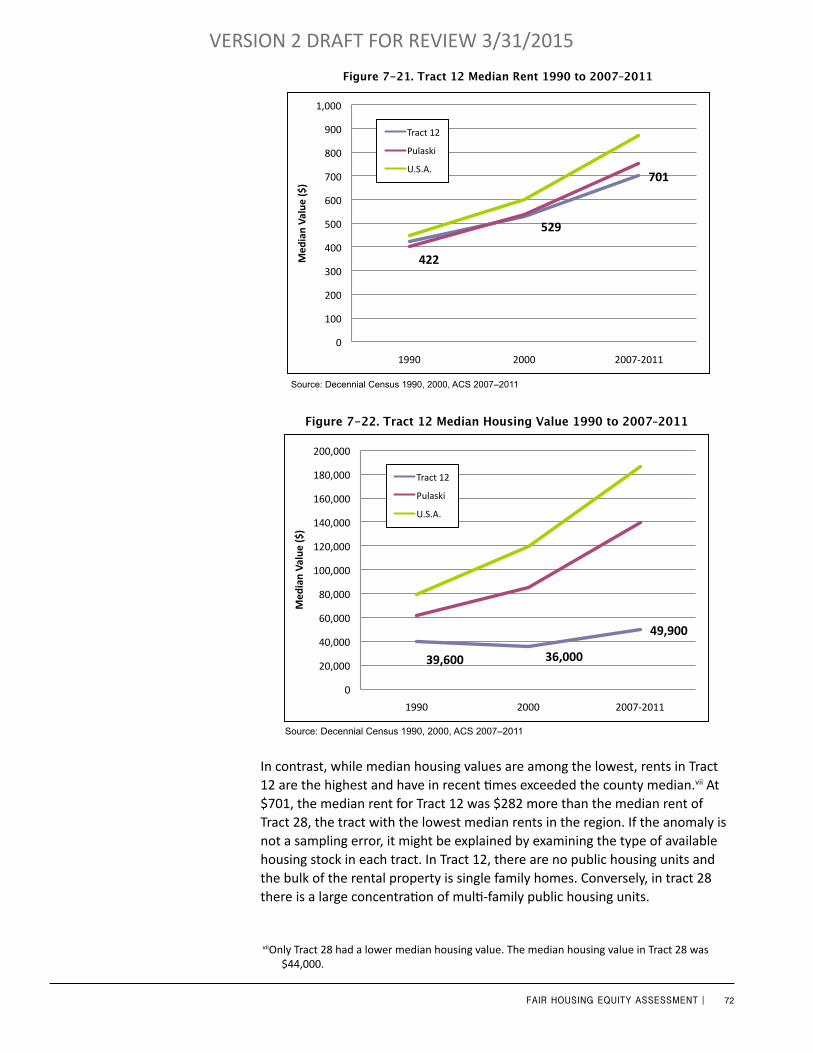
72FAIR HOUSING EQUITY ASSESSMENT |
VERSION 2 DRAFT FOR REVIEW 3/31/2015
In contrast, while median housing values are among the lowest, rents in Tract 12 are the highest and have in recent times exceeded the county median.vii At $701, the median rent for Tract 12 was $282 more than the median rent of Tract 28, the tract with the lowest median rents in the region. If the anomaly is not a sampling error, it might be explained by examining the type of available housing stock in each tract. In Tract 12, there are no public housing units and the bulk of the rental property is single family homes. Conversely, in tract 28 there is a large concentration of multi-family public housing units.
422
529
701
0
100
200
300
400
500
600
700
800
900
1,000
1990 2000 2007-‐2011
Med
ian Va
lue ($)
Tract 12 Median Rent 1990 to 2007-‐2011
Tract 12
Pulaski
U.S.A.
Source: Decennial Census 1990, 2000, ACS 2007–2011
Figure 7-21. Tract 12 Median Rent 1990 to 2007–2011
39,600 36,000
49,900
0
20,000
40,000
60,000
80,000
100,000
120,000
140,000
160,000
180,000
200,000
1990 2000 2007-‐2011
Med
ian Va
lue ($)
Tract 12 Median Value 1990 to 2007-‐2011
Tract 12
Pulaski
U.S.A.
39,600 36,000
49,900
0
20,000
40,000
60,000
80,000
100,000
120,000
140,000
160,000
180,000
200,000
1990 2000 2007-‐2011
Med
ian Va
lue ($)
Tract 12 Median Value 1990 to 2007-‐2011
Tract 12
Pulaski
U.S.A.
39,600 36,000
49,900
0
20,000
40,000
60,000
80,000
100,000
120,000
140,000
160,000
180,000
200,000
1990 2000 2007-‐2011
Med
ian Va
lue ($)
Tract 12 Median Value 1990 to 2007-‐2011
Tract 12
Pulaski
U.S.A.
Figure 7-22. Tract 12 Median Housing Value 1990 to 2007–2011
Source: Decennial Census 1990, 2000, ACS 2007–2011
viiOnly Tract 28 had a lower median housing value. The median housing value in Tract 28 was $44,000.
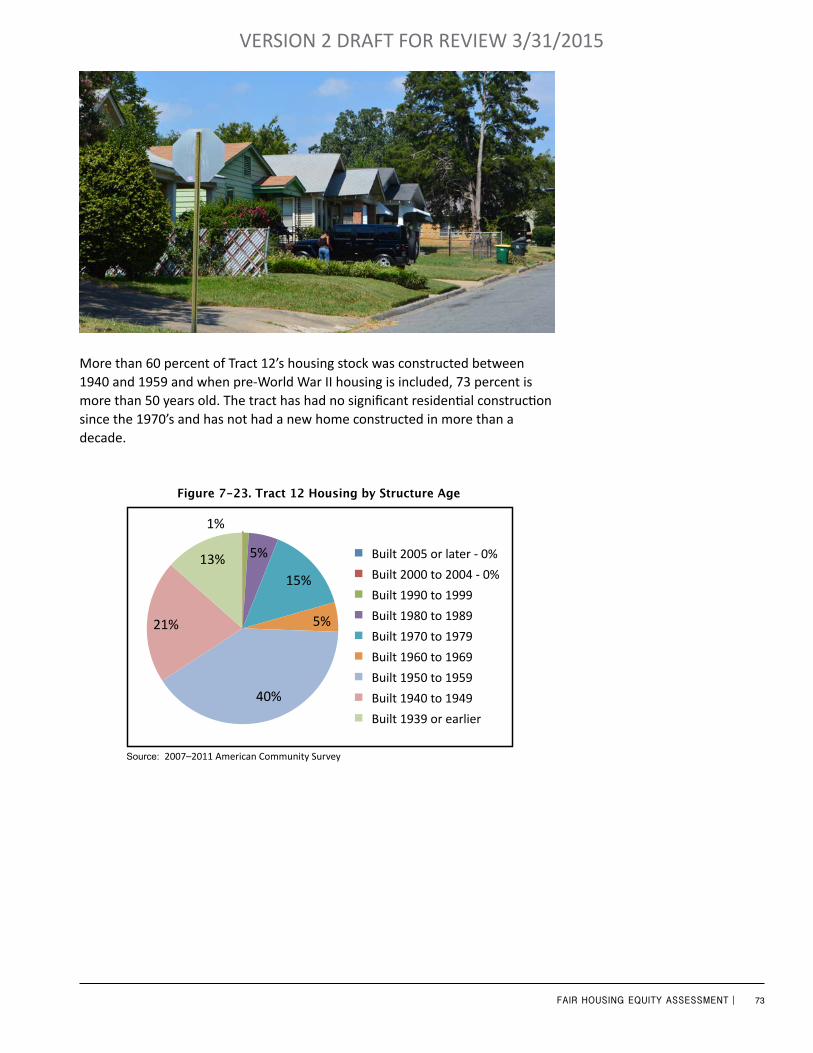
73FAIR HOUSING EQUITY ASSESSMENT |
VERSION 2 DRAFT FOR REVIEW 3/31/2015
1%
5%
15%
5%
40%
21%
13%
Tract 12 -‐ Housing by Structure Age
Built 2005 or later -‐ 0%
Built 2000 to 2004 -‐ 0%
Built 1990 to 1999
Built 1980 to 1989
Built 1970 to 1979
Built 1960 to 1969
Built 1950 to 1959
Built 1940 to 1949
Built 1939 or earlier
1%
5%
15%
5%
40%
21%
13%
Tract 12 -‐ Housing by Structure Age
Built 2005 or later -‐ 0%
Built 2000 to 2004 -‐ 0%
Built 1990 to 1999
Built 1980 to 1989
Built 1970 to 1979
Built 1960 to 1969
Built 1950 to 1959
Built 1940 to 1949
Built 1939 or earlier
Figure 7-23. Tract 12 Housing by Structure Age
More than 60 percent of Tract 12’s housing stock was constructed between 1940 and 1959 and when pre-World War II housing is included, 73 percent is more than 50 years old. The tract has had no significant residential construction since the 1970’s and has not had a new home constructed in more than a decade.
Source: 2007–2011 American Community Survey

74FAIR HOUSING EQUITY ASSESSMENT |
VERSION 2 DRAFT FOR REVIEW 3/31/2015
Detention Facilities Located within Tract 12
Tract 12 houses the Pulaski County Regional Jail facility. In 2010, there were a total of 1089 individuals incarcerated there. The incarcerated population constituted 42 percent of the tract’s total population.
Adult males made up 83 percent of the incarcerated population and 34 percent of the total population. Adult females made up 11 percent of the incarcerated population and Youth under the age of 18 made up the remaining 6 percent. Males under the age of 18, like their adult males counterparts, far outnumbered females of their own age group.
42%
58%
Tract 12 Incarcerated vs Non-‐incarcerated
Incarcerated
Unincarcerated
Figure 7-24. Tract 12 Incarcerated vs non-incarcerated
Source: 2007–2011 American Community Survey
83%
11%
5%
1%
Incarcerated Popula/on by Age and Sex Tract 12
Adult Male
Adult Female
Youth Male
Youth Female
Figure 7-25. Tract 12 Incarcerated Population by Age and Sex
Source: 2007–2011 American Community Survey
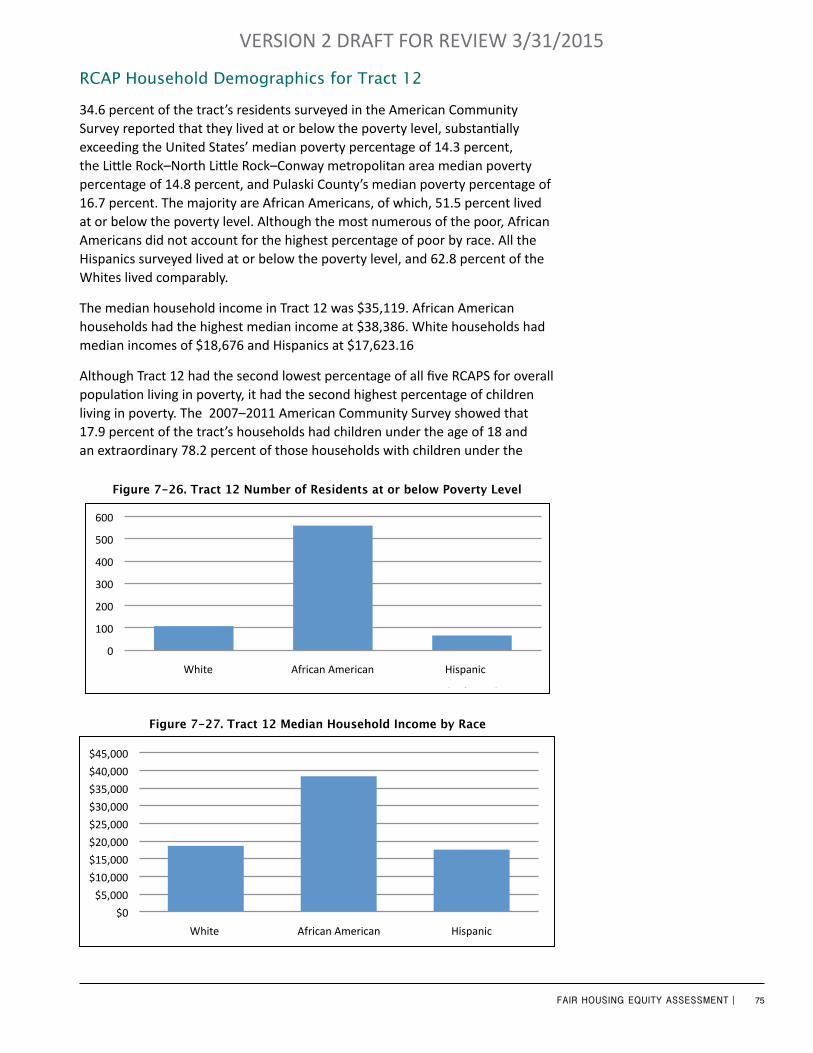
75FAIR HOUSING EQUITY ASSESSMENT |
VERSION 2 DRAFT FOR REVIEW 3/31/2015
$0
$5,000
$10,000
$15,000
$20,000
$25,000
$30,000
$35,000
$40,000
$45,000
White African American Hispanic
Tract 12 Household Income by Race Figure 7-27. Tract 12 Median Household Income by Race
0
100
200
300
400
500
600
White Black or African American Hispanic or La=no (any race)
Tract 12 -‐ number of residents at or below poverty level
African American or African American
White Hispanic or Hispanic(any race)
Figure 7-26. Tract 12 Number of Residents at or below Poverty Level
RCAP Household Demographics for Tract 12
34.6 percent of the tract’s residents surveyed in the American Community Survey reported that they lived at or below the poverty level, substantially exceeding the United States’ median poverty percentage of 14.3 percent, the Little Rock–North Little Rock–Conway metropolitan area median poverty percentage of 14.8 percent, and Pulaski County’s median poverty percentage of 16.7 percent. The majority are African Americans, of which, 51.5 percent lived at or below the poverty level. Although the most numerous of the poor, African Americans did not account for the highest percentage of poor by race. All the Hispanics surveyed lived at or below the poverty level, and 62.8 percent of the Whites lived comparably.
The median household income in Tract 12 was $35,119. African American households had the highest median income at $38,386. White households had median incomes of $18,676 and Hispanics at $17,623.16
Although Tract 12 had the second lowest percentage of all five RCAPS for overall population living in poverty, it had the second highest percentage of children living in poverty. The 2007–2011 American Community Survey showed that 17.9 percent of the tract’s households had children under the age of 18 and an extraordinary 78.2 percent of those households with children under the
$0
$5,000
$10,000
$15,000
$20,000
$25,000
$30,000
$35,000
$40,000
$45,000
White African American Hispanic
Tract 12 Household Income by Race
76FAIR HOUSING EQUITY ASSESSMENT |
VERSION 2 DRAFT FOR REVIEW 3/31/2015
age of 18 lived in poverty. Survey data also revealed that all of the surveyed families were single –parent households headed by females and many of these household’s required assistance from the federal government in the form of the Supplemental Nutritional Assistance Program (SNAP). Fifteen percent of African American families and 75 percent of White families in the tract participated in SNAP.
Unemployment and Labor Force Participation were skewed in the tract due to the large portion of the tract’s population being incarcerated. Only 30 percent of the overall population participated in the labor force. When labor force participation was analyzed by gender, the data showed that females comprised a significantly larger proportion of the labor force than their male counterparts in the tract. 55.5 percent of Tract 12’s females were part of the labor force, while a scant 15.4 percent of tract’s male population participated in the labor force. Males’ labor force participation was more than fifty percentage points below both the national and county averages. Low male labor force participation is most likely connected to the high rate of male incarceration. White, Hispanic, and African American male labor participation and unemployment were all substantially lower than the national and county averages for their race/ethnicity. Of the 791 unincarcerated African American males surveyed in the American Community Survey, only 162 were in the labor force and of the 162 in the labor force, only six (3.7 percent) were unemployed. White males’ data resembled that of African American males, of the 225 White males surveyed in the tract only 17 were part of the labor force and none of the 17 (0.0 percent) were unemployed. Of the 139 Hispanic males surveyed, none were in the labor force, so as a group Hispanics received a deceptively low unemployment rate of 0.0 percent.
African American females’ labor participation rates exceeded the national and county averages. Of the 443 African American females over the age of sixteen, 310 were in the labor force and 304 were employed, leaving only 6 (1.9 percent) unemployed. The survey included 84 White females, of which, 17 were a part of the labor force and all 17 were employed. Only 77 Hispanic females were surveyed, of which, 7 reported that they were in the labor force and each was employed.
SupplementalNutritionAssistanceProgram
Note: 2007–2011 American Community Survey showed that census tract 12 had an overall population poverty rate of 34.6 percent. The Lowest ranking RCAP census tract in overall population poverty rate was census tract 46 with 31.4 percent rate of poverty. The highest ranking census tract in population under 18 living in poverty was census tract 30.01 with a rate of 84.7 percent. Census tract 12 had a rate of 78.2 percent in population under 18 living in poverty.
National Overall Labor Force Participation rate for males was 70.6 percent, while the Pulaski County overall labor force participation rate for males was 70.5 percent.
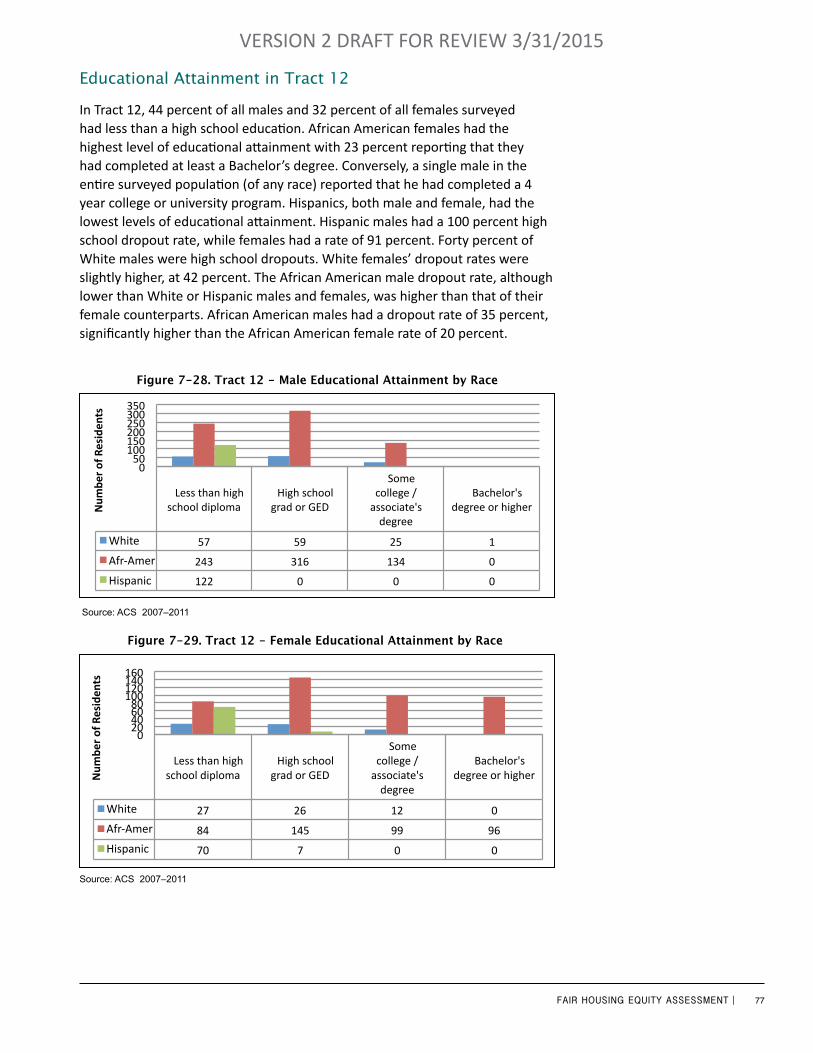
77FAIR HOUSING EQUITY ASSESSMENT |
VERSION 2 DRAFT FOR REVIEW 3/31/2015
Educational Attainment in Tract 12
In Tract 12, 44 percent of all males and 32 percent of all females surveyed had less than a high school education. African American females had the highest level of educational attainment with 23 percent reporting that they had completed at least a Bachelor’s degree. Conversely, a single male in the entire surveyed population (of any race) reported that he had completed a 4 year college or university program. Hispanics, both male and female, had the lowest levels of educational attainment. Hispanic males had a 100 percent high school dropout rate, while females had a rate of 91 percent. Forty percent of White males were high school dropouts. White females’ dropout rates were slightly higher, at 42 percent. The African American male dropout rate, although lower than White or Hispanic males and females, was higher than that of their female counterparts. African American males had a dropout rate of 35 percent, significantly higher than the African American female rate of 20 percent.
Figure 7-28. Tract 12 - Male Educational Attainment by Race
Less than high school diploma
High school grad or GED
Some college / associate's degree
Bachelor's degree or higher
White 57 59 25 1
Black 243 316 134 0
Hispanic 122 0 0 0
0 50
100 150 200 250 300 350
Num
ber of Residen
ts
Educa3onal A6ainment -‐ Males Tract 12
Source: ACS 2007–2011
White
Afr-Amer
Hispanic
Less than high school diploma
High school grad or GED
Some college / associate's degree
Bachelor's degree or higher
White 27 26 12 0
Black 84 145 99 96
Hispanic 70 7 0 0
0 20 40 60 80
100 120 140 160
Num
ber of Residen
ts
Educaiton -‐ Tract 12 Females Figure 7-29. Tract 12 - Female Educational Attainment by Race
Source: ACS 2007–2011
White
Afr-Amer
Hispanic

78FAIR HOUSING EQUITY ASSESSMENT |
VERSION 2 DRAFT FOR REVIEW 3/31/2015
92%
2%
6%
1%
Census Tract 12 Transporta0on to Work Characteris0cs
Drove alone
Carpool
Public transporta8on
Walked -‐ 0%
Bicycle -‐ 0%
Taxicab, motorcycle, other -‐ 0%
Worked at home
Figure 7-30. Census Tract 12 Transportation to Work Characteristics
Transportation and Mobility
Transportation in Tract 12 was overwhelmingly auto-dependent. 83 percent of the tract’s population reported to have access to at least one automobile and 12.7 percent maintained that they had access to three or more cars. 17 percent of the population reported that they had no access to an automobile. Public transportation is accessible via two routes and twenty bus stops. The average resident traveled on average 20.8 miles outside the tract and spent 41.6 minutes in transit daily.
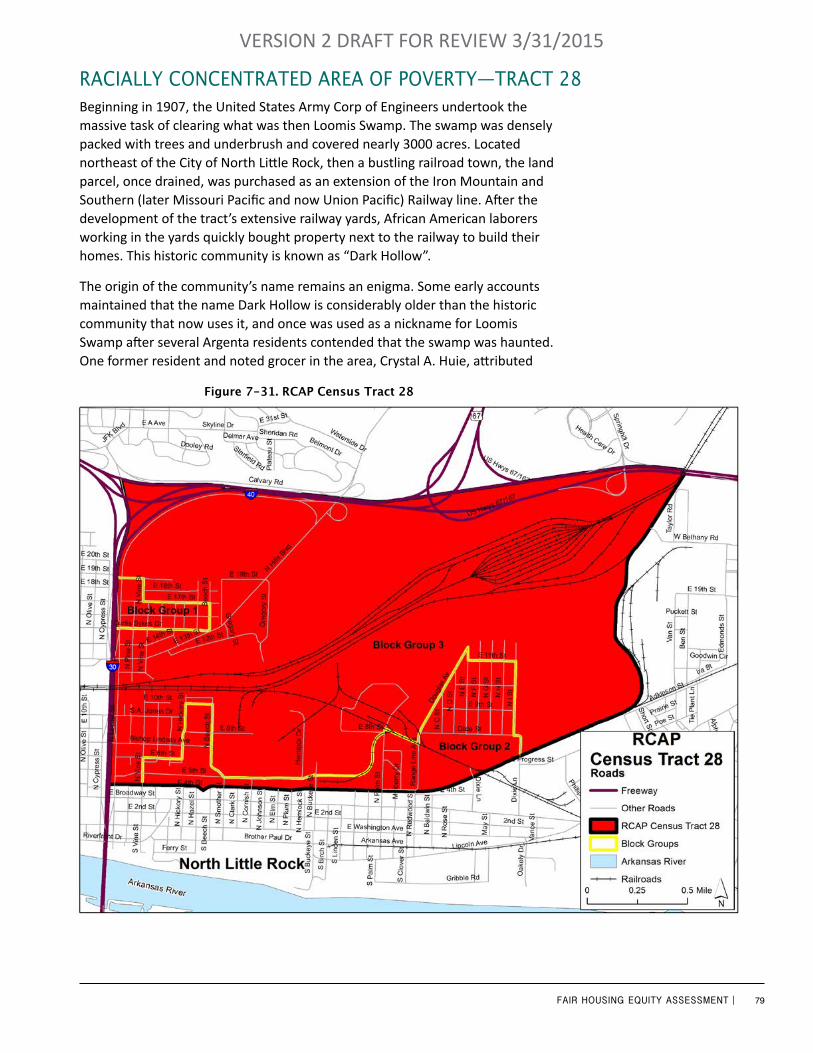
79FAIR HOUSING EQUITY ASSESSMENT |
VERSION 2 DRAFT FOR REVIEW 3/31/2015
Beginning in 1907, the United States Army Corp of Engineers undertook the massive task of clearing what was then Loomis Swamp. The swamp was densely packed with trees and underbrush and covered nearly 3000 acres. Located northeast of the City of North Little Rock, then a bustling railroad town, the land parcel, once drained, was purchased as an extension of the Iron Mountain and Southern (later Missouri Pacific and now Union Pacific) Railway line. After the development of the tract’s extensive railway yards, African American laborers working in the yards quickly bought property next to the railway to build their homes. This historic community is known as “Dark Hollow”.
The origin of the community’s name remains an enigma. Some early accounts maintained that the name Dark Hollow is considerably older than the historic community that now uses it, and once was used as a nickname for Loomis Swamp after several Argenta residents contended that the swamp was haunted. One former resident and noted grocer in the area, Crystal A. Huie, attributed
Figure 7-31. RCAP Census Tract 28
raCially ConCenTraTed area of PoverTy—TraCT 28

80FAIR HOUSING EQUITY ASSESSMENT |
VERSION 2 DRAFT FOR REVIEW 3/31/2015
the name to a later period. Huie maintained that the name was used to describe the area shortly after the neighboring White communities were wired for electricity. Huie noted that the residents of the hollow were “too poor to buy electricity” and the community remained dark in the evening hours.
In comparison to the other RCAPs in the region, Tract 28 is unique. Tract 28 is the only RCAP that was historically an African American neighborhood and did not experience white flight. The tract’s population has remained majority African American since its inception and though its population has steadily declined, the tract has retained the defining feature of an African American majority.
Tract 28 has undergone a slow but steady rate of decline since 1960. This decline can be attributed to the outward migration of middle class African Americans beginning in the 1960s as additional housing choices became available to them. In the 1960 census, there were 6,670 African Americans living in the tract. By 2010, the African American population was a third of that number (2,210). Like most other RCAPs, Tract 28 has suffered a substantial loss of housing stock and decreased levels of occupancy. Dark Hallow maintained an occupancy level of 95.9 percent in 1960, a rate similar to that of Tract 12 when it was a majority White community in the 1960s. However, Tract 28 has not experienced as sharp a decline in occupancy over time as Tract 12. Despite its loss of housing units and middle class residents, Tract 28 maintained an 84.7 percent rate of occupancy in 2010, compared to 76.8 percent in Tract 12.
0
1,000
2,000
3,000
4,000
5,000
6,000
7,000
8,000
1960 1970 1980 1990 2000 2010
Other
Afr-‐Amer
White 0
1,000
2,000
3,000
4,000
5,000
6,000
7,000
8,000
1960 1970 1980 1990 2000 2010
Other
Afr-‐Amer
White
Other
African American
White
Figure 7-32. Racial Demographics for Census Tract 28 by Year
Source: U. S. Bureau of the Census
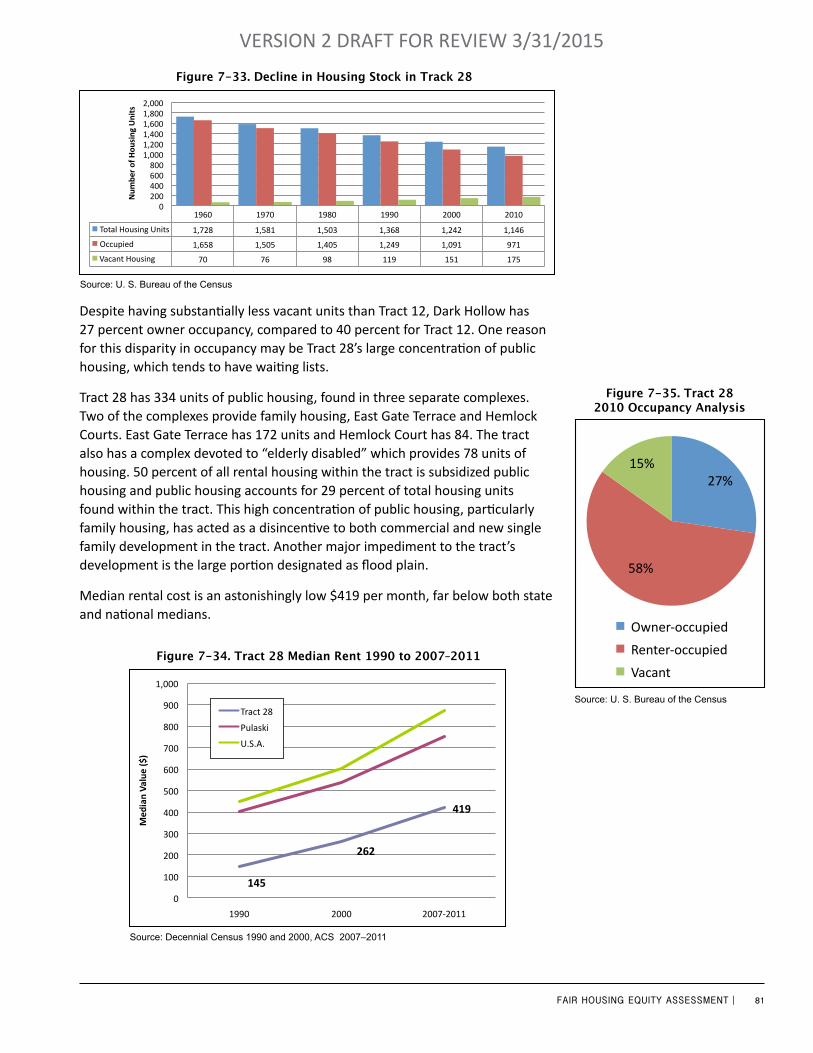
81FAIR HOUSING EQUITY ASSESSMENT |
VERSION 2 DRAFT FOR REVIEW 3/31/2015
Despite having substantially less vacant units than Tract 12, Dark Hollow has 27 percent owner occupancy, compared to 40 percent for Tract 12. One reason for this disparity in occupancy may be Tract 28’s large concentration of public housing, which tends to have waiting lists.
Tract 28 has 334 units of public housing, found in three separate complexes. Two of the complexes provide family housing, East Gate Terrace and Hemlock Courts. East Gate Terrace has 172 units and Hemlock Court has 84. The tract also has a complex devoted to “elderly disabled” which provides 78 units of housing. 50 percent of all rental housing within the tract is subsidized public housing and public housing accounts for 29 percent of total housing units found within the tract. This high concentration of public housing, particularly family housing, has acted as a disincentive to both commercial and new single family development in the tract. Another major impediment to the tract’s development is the large portion designated as flood plain.
Median rental cost is an astonishingly low $419 per month, far below both state and national medians.
1960 1970 1980 1990 2000 2010
Total Housing Units 1,728 1,581 1,503 1,368 1,242 1,146
Occupied 1,658 1,505 1,405 1,249 1,091 971
Vacant Housing 70 76 98 119 151 175
0 200 400 600 800
1,000 1,200 1,400 1,600 1,800 2,000
Num
ber of Hou
sing Units
Decline in Housing Stock in Tract 28 Figure 7-33. Decline in Housing Stock in Track 28
Source: U. S. Bureau of the Census
27%
58%
15%
Tract 28 -‐ 2010 Occupancy Analysis
Owner-‐occupied
Renter-‐occupied
Vacant
Figure 7-35. Tract 282010 Occupancy Analysis
Source: U. S. Bureau of the Census
27%
58%
15%
Tract 28 -‐ 2010 Occupancy Analysis
Owner-‐occupied
Renter-‐occupied
Vacant
145
262
419
0
100
200
300
400
500
600
700
800
900
1,000
1990 2000 2007-‐2011
Med
ian Va
lue ($)
Tract 28 Median Rent 1990 to 2007-‐2011
Tract 28
Pulaski
U.S.A. 145
262
419
0
100
200
300
400
500
600
700
800
900
1,000
1990 2000 2007-‐2011
Med
ian Va
lue ($)
Tract 28 Median Rent 1990 to 2007-‐2011
Tract 28
Pulaski
U.S.A.
Figure 7-34. Tract 28 Median Rent 1990 to 2007–2011
Source: Decennial Census 1990 and 2000, ACS 2007–2011
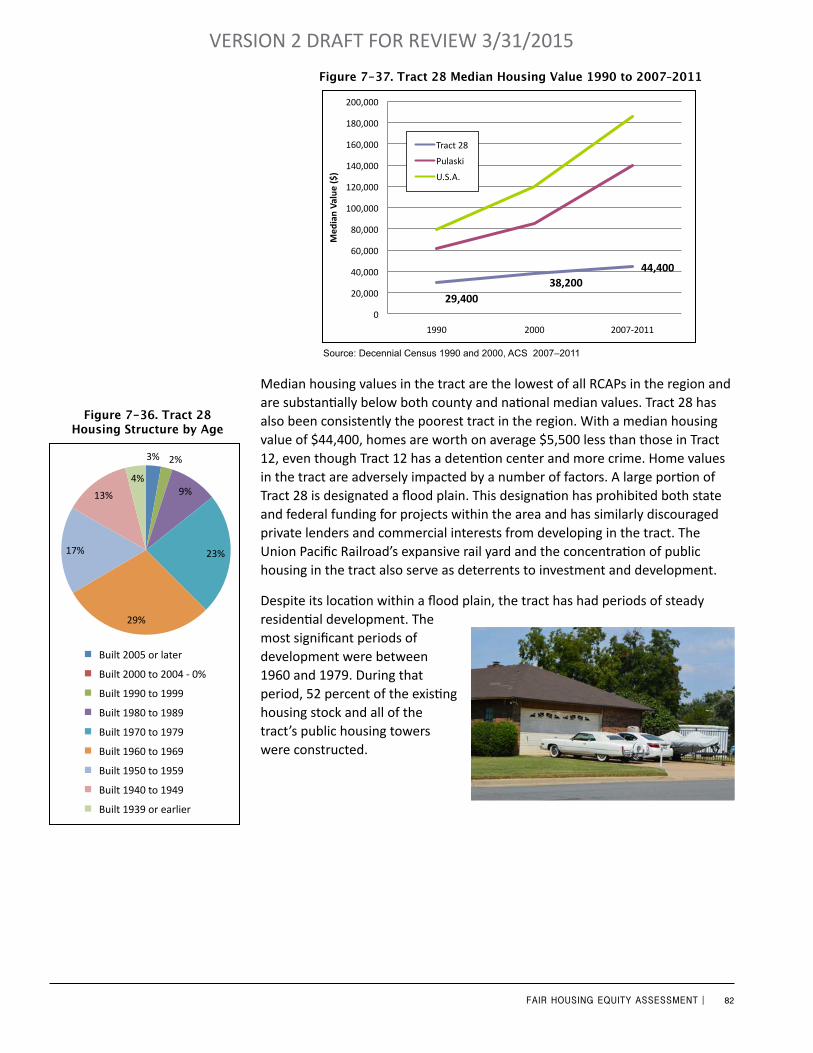
82FAIR HOUSING EQUITY ASSESSMENT |
VERSION 2 DRAFT FOR REVIEW 3/31/2015
Median housing values in the tract are the lowest of all RCAPs in the region and are substantially below both county and national median values. Tract 28 has also been consistently the poorest tract in the region. With a median housing value of $44,400, homes are worth on average $5,500 less than those in Tract 12, even though Tract 12 has a detention center and more crime. Home values in the tract are adversely impacted by a number of factors. A large portion of Tract 28 is designated a flood plain. This designation has prohibited both state and federal funding for projects within the area and has similarly discouraged private lenders and commercial interests from developing in the tract. The Union Pacific Railroad’s expansive rail yard and the concentration of public housing in the tract also serve as deterrents to investment and development.
Despite its location within a flood plain, the tract has had periods of steady residential development. The most significant periods of development were between 1960 and 1979. During that period, 52 percent of the existing housing stock and all of the tract’s public housing towers were constructed.
29,400 38,200
44,400
0
20,000
40,000
60,000
80,000
100,000
120,000
140,000
160,000
180,000
200,000
1990 2000 2007-‐2011 Med
ian Va
lue ($)
Tract 28 Median Value 1990 to 2007-‐2011
Tract 28
Pulaski
U.S.A.
145
262
419
0
100
200
300
400
500
600
700
800
900
1,000
1990 2000 2007-‐2011
Med
ian Va
lue ($)
Tract 28 Median Rent 1990 to 2007-‐2011
Tract 28
Pulaski
U.S.A.
Source: Decennial Census 1990 and 2000, ACS 2007–2011
Figure 7-37. Tract 28 Median Housing Value 1990 to 2007–2011
3% 2%
9%
23%
29%
17%
13%
4%
Tract 28 Housing by Structure Age
Built 2005 or later
Built 2000 to 2004 -‐ 0%
Built 1990 to 1999
Built 1980 to 1989
Built 1970 to 1979
Built 1960 to 1969
Built 1950 to 1959
Built 1940 to 1949
Built 1939 or earlier
Figure 7-36. Tract 28 Housing Structure by Age
3% 2%
9%
23%
29%
17%
13%
4%
Tract 28 Housing by Structure Age
Built 2005 or later
Built 2000 to 2004 -‐ 0%
Built 1990 to 1999
Built 1980 to 1989
Built 1970 to 1979
Built 1960 to 1969
Built 1950 to 1959
Built 1940 to 1949
Built 1939 or earlier
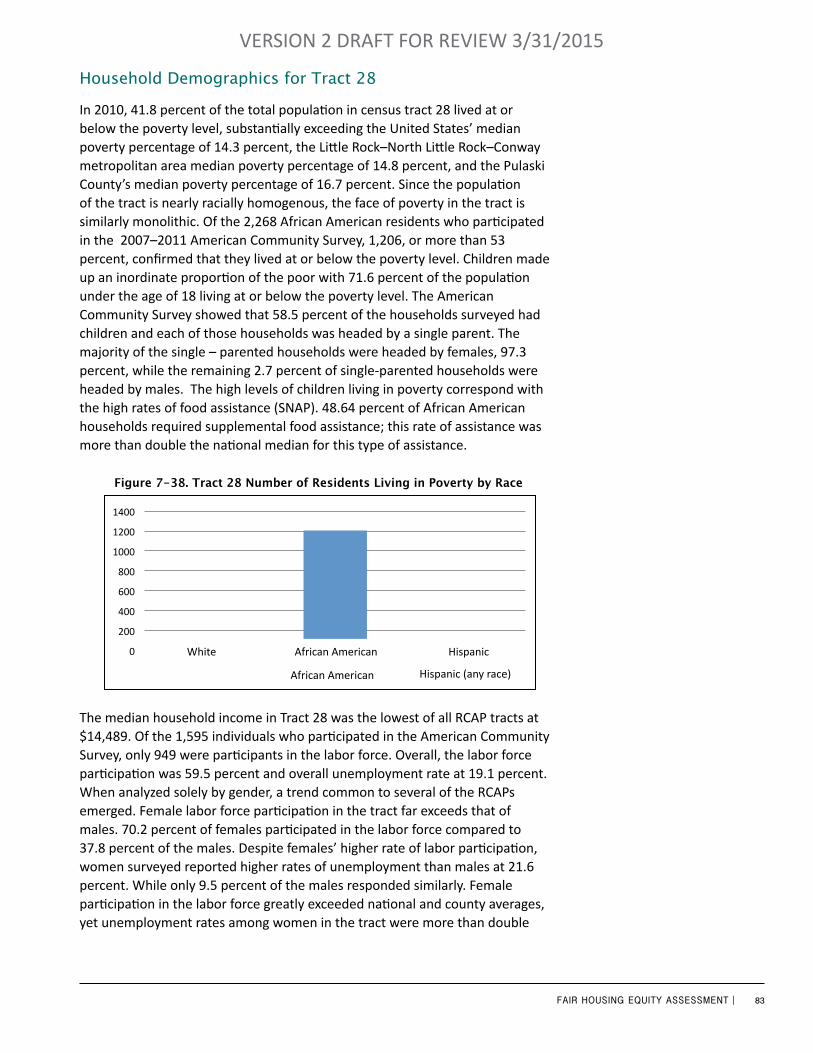
83FAIR HOUSING EQUITY ASSESSMENT |
VERSION 2 DRAFT FOR REVIEW 3/31/2015
Household Demographics for Tract 28
In 2010, 41.8 percent of the total population in census tract 28 lived at or below the poverty level, substantially exceeding the United States’ median poverty percentage of 14.3 percent, the Little Rock–North Little Rock–Conway metropolitan area median poverty percentage of 14.8 percent, and the Pulaski County’s median poverty percentage of 16.7 percent. Since the population of the tract is nearly racially homogenous, the face of poverty in the tract is similarly monolithic. Of the 2,268 African American residents who participated in the 2007–2011 American Community Survey, 1,206, or more than 53 percent, confirmed that they lived at or below the poverty level. Children made up an inordinate proportion of the poor with 71.6 percent of the population under the age of 18 living at or below the poverty level. The American Community Survey showed that 58.5 percent of the households surveyed had children and each of those households was headed by a single parent. The majority of the single – parented households were headed by females, 97.3 percent, while the remaining 2.7 percent of single-parented households were headed by males. The high levels of children living in poverty correspond with the high rates of food assistance (SNAP). 48.64 percent of African American households required supplemental food assistance; this rate of assistance was more than double the national median for this type of assistance.
The median household income in Tract 28 was the lowest of all RCAP tracts at $14,489. Of the 1,595 individuals who participated in the American Community Survey, only 949 were participants in the labor force. Overall, the labor force participation was 59.5 percent and overall unemployment rate at 19.1 percent. When analyzed solely by gender, a trend common to several of the RCAPs emerged. Female labor force participation in the tract far exceeds that of males. 70.2 percent of females participated in the labor force compared to 37.8 percent of the males. Despite females’ higher rate of labor participation, women surveyed reported higher rates of unemployment than males at 21.6 percent. While only 9.5 percent of the males responded similarly. Female participation in the labor force greatly exceeded national and county averages, yet unemployment rates among women in the tract were more than double
0
200
400
600
800
1000
1200
1400
White Black or African American Hispanic or La<no (any race)
Poverty Race 2007-‐2011 Tract 28 Figure 7-38. Tract 28 Number of Residents Living in Poverty by Race
White African American or African American
Hispanic or Hispanic (any race)
$0
$5,000
$10,000
$15,000
$20,000
$25,000
$30,000
$35,000
$40,000
$45,000
White African American Hispanic
Tract 12 Household Income by Race

84FAIR HOUSING EQUITY ASSESSMENT |
VERSION 2 DRAFT FOR REVIEW 3/31/2015
national and county averages. Conversely, males in the tract had a rate of labor force participation which was substantially lower that national and county levels, yet they maintained significantly lower than national and county levels of unemployment.
When analyzed by race, data shows that African American participation in the labor force slightly exceeded the tract’s average. 61.1 percent of African Americans participated in the labor force. At 71.6 percent, African American females participated in the labor force in a larger percentage than their male counterparts. Only 38 percent of African American males reported that they participated. The extremely small population of Whites in the tract was predominately female. At 76.9 percent, White females in the tract reported a higher rate of workforce participation than that of African American females, yet each White female surveyed maintained that she was currently unemployed. All White males surveyed reported that they were not in the labor force. The results and summaries of this data are misleading when the raw data is not examined carefully. While the majority of surveyed White females are listed as eligible participants in the labor force, none of them are actually employed; therefore White females have a 100 percent unemployment rate. Comparatively, all the White males in the tract over the age of 16 in the tract are listed as not in the work force, so none of their numbers appear as unemployed. All the Hispanics who answered the survey were males and of the 11 males that reported that they lived in the tract, all maintained that they were employed.
Educational Attainment in Tract 28
35 percent of the males residing in Tract 28 did not complete their high school education. Dropout rates were highest amongst African Americans with more than one third (36 percent) dropping out before the completion
Less than high school diploma
High school grad or GED
Some college / associate's degree
Bachelor's degree or higher
White 1 1 0 1
Black 132 147 58 33
Hispanic 0 0 11 0
0 20 40 60 80
100 120 140 160
Num
ber of Residen
ts
Tract 28 -‐ Male Educa9onal A;ainment Figure 7-39. Tract 28 Male Educational Attainment by Race
White
Afr-Amer
Hispanic
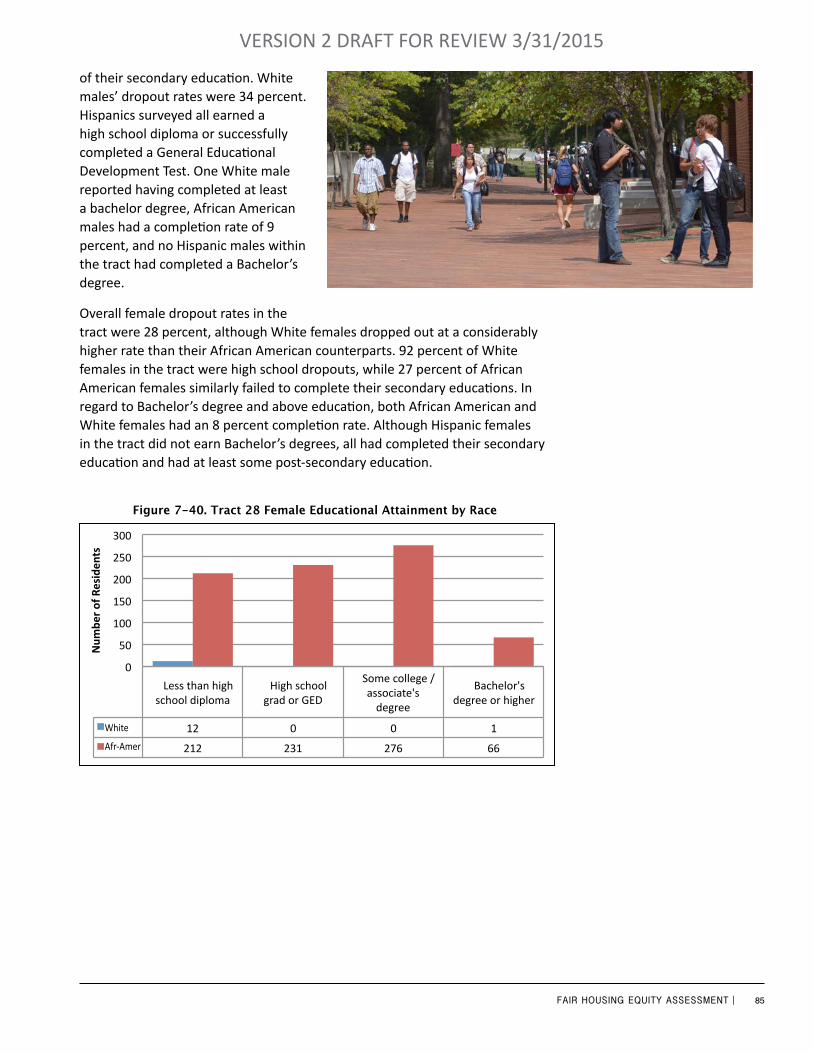
85FAIR HOUSING EQUITY ASSESSMENT |
VERSION 2 DRAFT FOR REVIEW 3/31/2015
of their secondary education. White males’ dropout rates were 34 percent. Hispanics surveyed all earned a high school diploma or successfully completed a General Educational Development Test. One White male reported having completed at least a bachelor degree, African American males had a completion rate of 9 percent, and no Hispanic males within the tract had completed a Bachelor’s degree.
Overall female dropout rates in the tract were 28 percent, although White females dropped out at a considerably higher rate than their African American counterparts. 92 percent of White females in the tract were high school dropouts, while 27 percent of African American females similarly failed to complete their secondary educations. In regard to Bachelor’s degree and above education, both African American and White females had an 8 percent completion rate. Although Hispanic females in the tract did not earn Bachelor’s degrees, all had completed their secondary education and had at least some post-secondary education.
Less than high school diploma
High school grad or GED
Some college / associate's degree
Bachelor's degree or higher
White 12 0 0 1
Black 212 231 276 66
0
50
100
150
200
250
300
Num
ber of Residen
ts
Educa3onal A6ainment -‐ Tract 28 Female Figure 7-40. Tract 28 Female Educational Attainment by Race
White
Afr-Amer
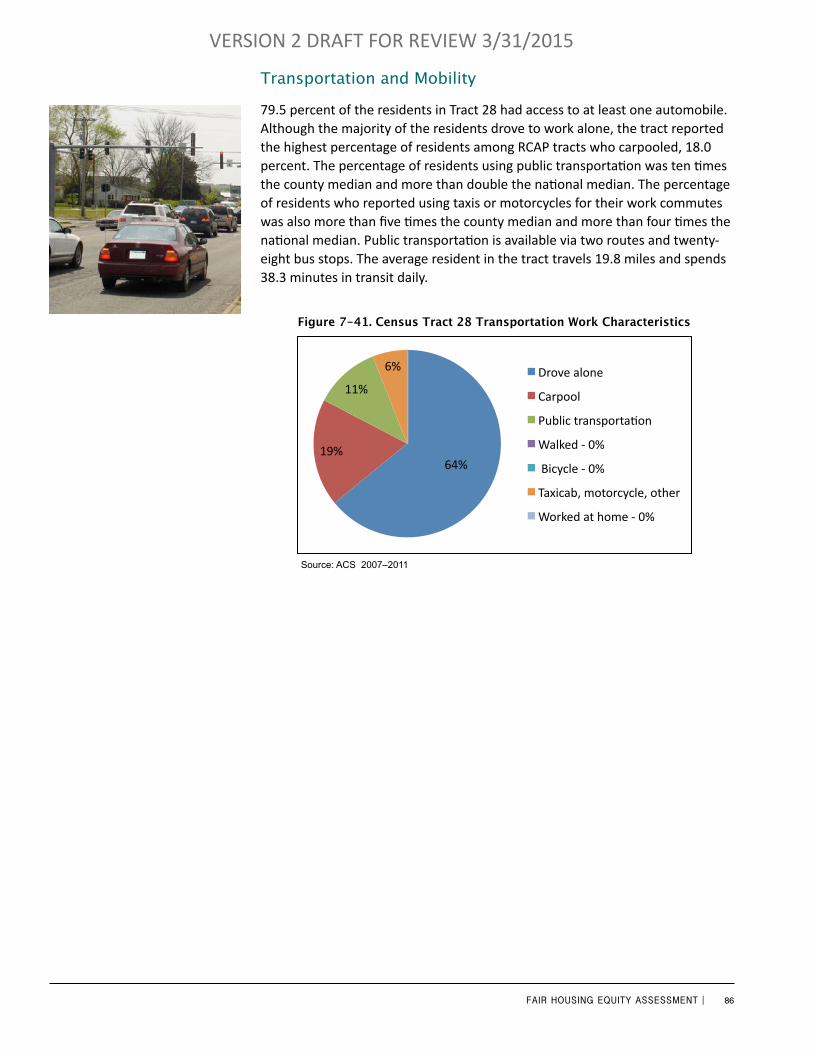
86FAIR HOUSING EQUITY ASSESSMENT |
VERSION 2 DRAFT FOR REVIEW 3/31/2015
Transportation and Mobility
79.5 percent of the residents in Tract 28 had access to at least one automobile. Although the majority of the residents drove to work alone, the tract reported the highest percentage of residents among RCAP tracts who carpooled, 18.0 percent. The percentage of residents using public transportation was ten times the county median and more than double the national median. The percentage of residents who reported using taxis or motorcycles for their work commutes was also more than five times the county median and more than four times the national median. Public transportation is available via two routes and twenty-eight bus stops. The average resident in the tract travels 19.8 miles and spends 38.3 minutes in transit daily.
64% 19%
11%
6%
Census Tract 28 Transporta0on Work Characteris0cs
Drove alone
Carpool
Public transporta8on
Walked -‐ 0%
Bicycle -‐ 0%
Taxicab, motorcycle, other
Worked at home -‐ 0%
Source: ACS 2007–2011
Figure 7-41. Census Tract 28 Transportation Work Characteristics
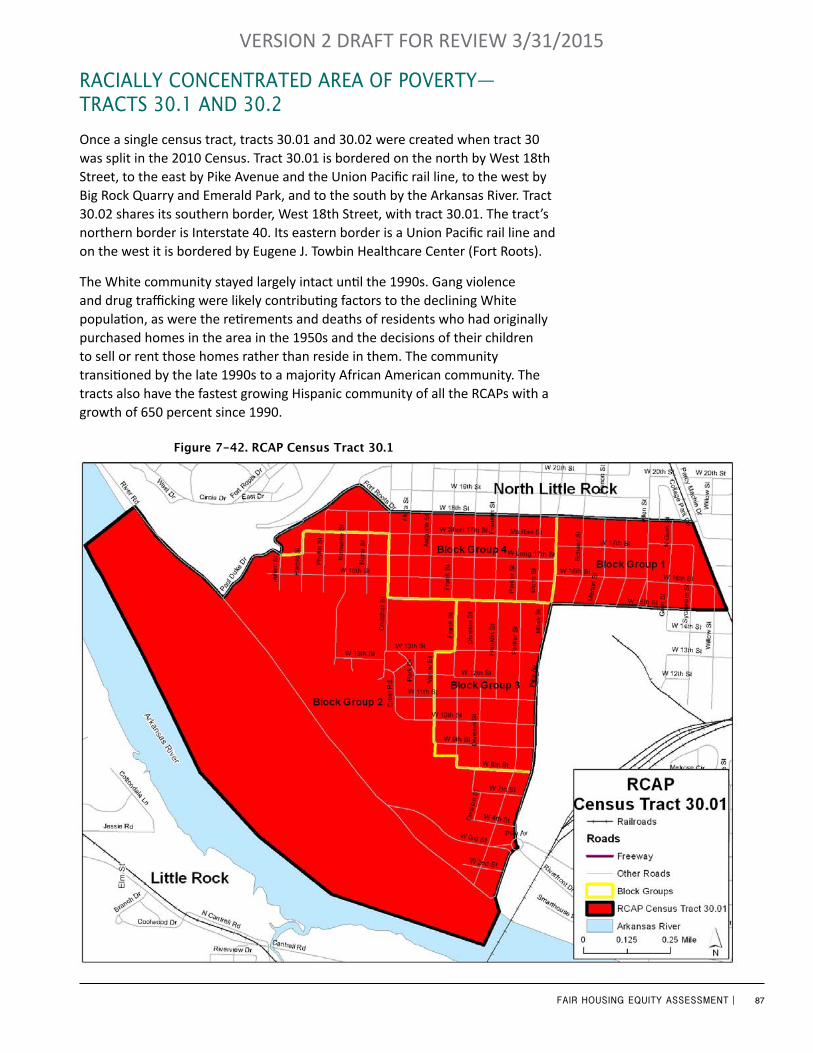
87FAIR HOUSING EQUITY ASSESSMENT |
VERSION 2 DRAFT FOR REVIEW 3/31/2015
raCially ConCenTraTed area of PoverTy— TraCTs 30.1 and 30.2Once a single census tract, tracts 30.01 and 30.02 were created when tract 30 was split in the 2010 Census. Tract 30.01 is bordered on the north by West 18th Street, to the east by Pike Avenue and the Union Pacific rail line, to the west by Big Rock Quarry and Emerald Park, and to the south by the Arkansas River. Tract 30.02 shares its southern border, West 18th Street, with tract 30.01. The tract’s northern border is Interstate 40. Its eastern border is a Union Pacific rail line and on the west it is bordered by Eugene J. Towbin Healthcare Center (Fort Roots).
The White community stayed largely intact until the 1990s. Gang violence and drug trafficking were likely contributing factors to the declining White population, as were the retirements and deaths of residents who had originally purchased homes in the area in the 1950s and the decisions of their children to sell or rent those homes rather than reside in them. The community transitioned by the late 1990s to a majority African American community. The tracts also have the fastest growing Hispanic community of all the RCAPs with a growth of 650 percent since 1990.
Figure 7-42. RCAP Census Tract 30.1
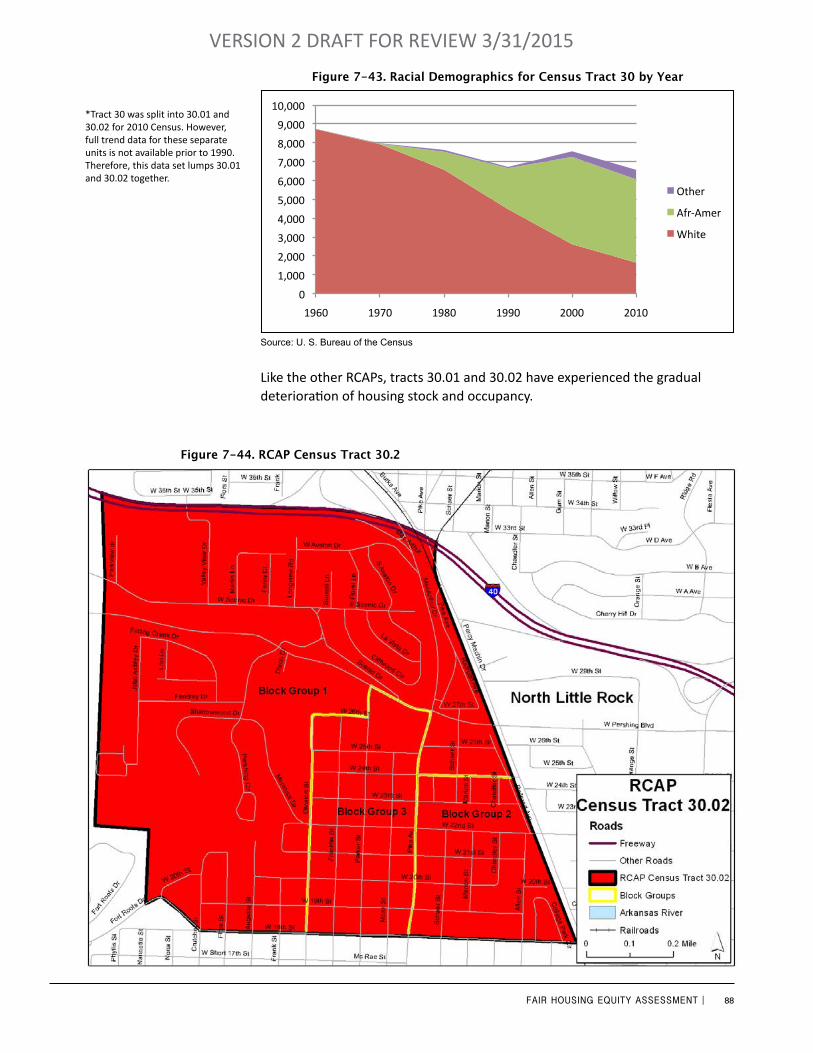
88FAIR HOUSING EQUITY ASSESSMENT |
VERSION 2 DRAFT FOR REVIEW 3/31/2015
Like the other RCAPs, tracts 30.01 and 30.02 have experienced the gradual deterioration of housing stock and occupancy.
*Tract 30 was split into 30.01 and 30.02 for 2010 Census. However, full trend data for these separate units is not available prior to 1990. Therefore, this data set lumps 30.01 and 30.02 together.
0
1,000
2,000
3,000
4,000
5,000
6,000
7,000
8,000
9,000
10,000
1960 1970 1980 1990 2000 2010
Other
Afr-‐Amer
White
Source: U. S. Bureau of the Census
Figure 7-43. Racial Demographics for Census Tract 30 by Year
Figure 7-44. RCAP Census Tract 30.2
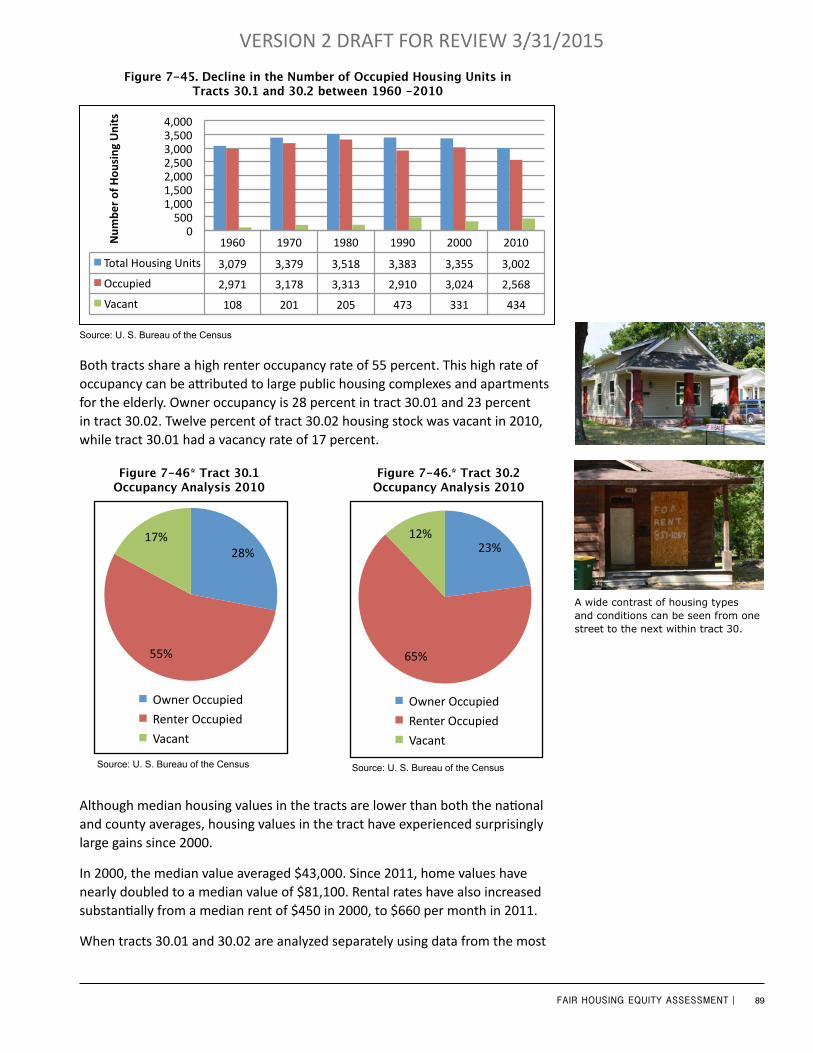
89FAIR HOUSING EQUITY ASSESSMENT |
VERSION 2 DRAFT FOR REVIEW 3/31/2015
Both tracts share a high renter occupancy rate of 55 percent. This high rate of occupancy can be attributed to large public housing complexes and apartments for the elderly. Owner occupancy is 28 percent in tract 30.01 and 23 percent in tract 30.02. Twelve percent of tract 30.02 housing stock was vacant in 2010, while tract 30.01 had a vacancy rate of 17 percent.
Although median housing values in the tracts are lower than both the national and county averages, housing values in the tract have experienced surprisingly large gains since 2000.
In 2000, the median value averaged $43,000. Since 2011, home values have nearly doubled to a median value of $81,100. Rental rates have also increased substantially from a median rent of $450 in 2000, to $660 per month in 2011.
When tracts 30.01 and 30.02 are analyzed separately using data from the most
28%
55%
17%
Tract 30.1 Occupancy Analysis 2010
Owner Occupied
Renter Occupied
Vacant
Figure 7-46* Tract 30.1 Occupancy Analysis 2010
23%
65%
12%
Tract 30.2 Occupancy Analysis 2010
Owner Occupied
Renter Occupied
Vacant
Source: U. S. Bureau of the Census
23%
65%
12%
Tract 30.2 Occupancy Analysis 2010
Owner Occupied
Renter Occupied
Vacant
Figure 7-46.* Tract 30.2 Occupancy Analysis 2010
23%
65%
12%
Tract 30.2 Occupancy Analysis 2010
Owner Occupied
Renter Occupied
Vacant
Source: U. S. Bureau of the Census
1960 1970 1980 1990 2000 2010
Total Housing Units 3,079 3,379 3,518 3,383 3,355 3,002
Occupied 2,971 3,178 3,313 2,910 3,024 2,568
Vacant 108 201 205 473 331 434
0 500
1,000 1,500 2,000 2,500 3,000 3,500 4,000
Num
ber of Hou
sing Units
Decline in the Number of Occupied Housing Units in Tracts 30.1 and 30.2 between 1960 -‐ 2010
Figure 7-45. Decline in the Number of Occupied Housing Units in Tracts 30.1 and 30.2 between 1960 -2010
Source: U. S. Bureau of the Census
A wide contrast of housing types and conditions can be seen from one street to the next within tract 30.
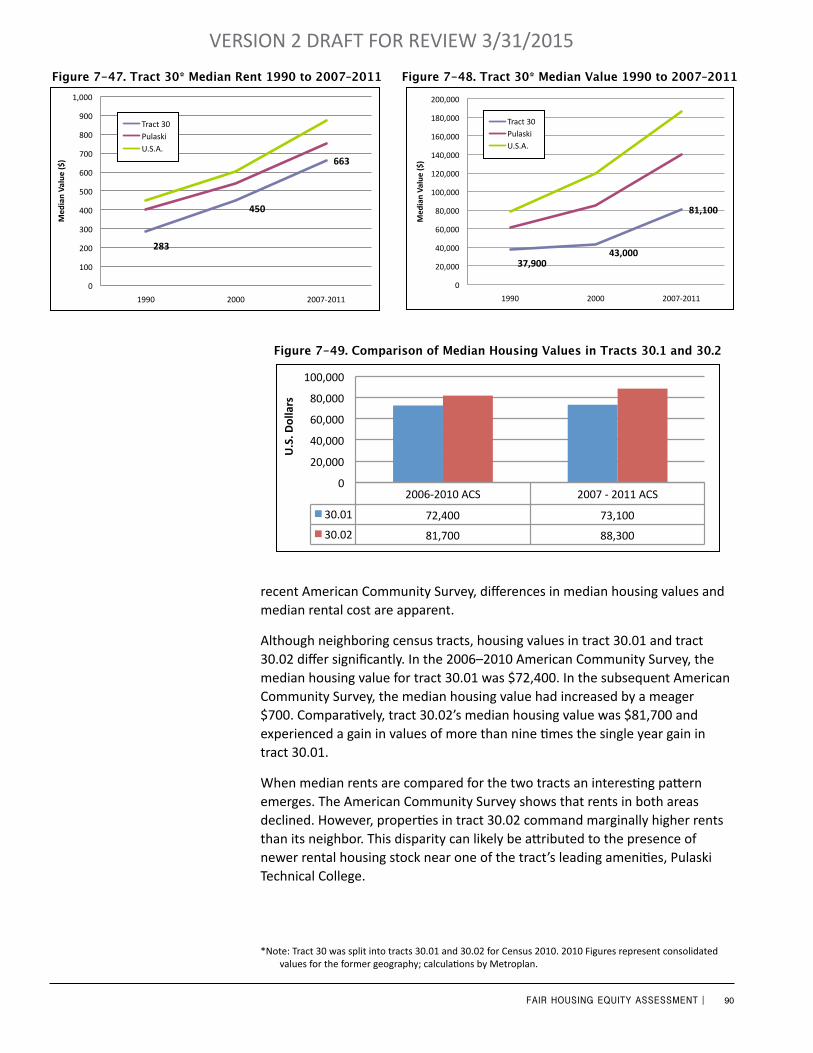
90FAIR HOUSING EQUITY ASSESSMENT |
VERSION 2 DRAFT FOR REVIEW 3/31/2015
recent American Community Survey, differences in median housing values and median rental cost are apparent.
Although neighboring census tracts, housing values in tract 30.01 and tract 30.02 differ significantly. In the 2006–2010 American Community Survey, the median housing value for tract 30.01 was $72,400. In the subsequent American Community Survey, the median housing value had increased by a meager $700. Comparatively, tract 30.02’s median housing value was $81,700 and experienced a gain in values of more than nine times the single year gain in tract 30.01.
When median rents are compared for the two tracts an interesting pattern emerges. The American Community Survey shows that rents in both areas declined. However, properties in tract 30.02 command marginally higher rents than its neighbor. This disparity can likely be attributed to the presence of newer rental housing stock near one of the tract’s leading amenities, Pulaski Technical College.
*Note: Tract 30 was split into tracts 30.01 and 30.02 for Census 2010. 2010 Figures represent consolidated values for the former geography; calculations by Metroplan.
37,900 43,000
81,100
0
20,000
40,000
60,000
80,000
100,000
120,000
140,000
160,000
180,000
200,000
1990 2000 2007-‐2011
Med
ian Va
lue ($)
Tract 30* Median Value 1990 to 2007-‐2011
Tract 30
Pulaski
U.S.A.
283
450
663
0
100
200
300
400
500
600
700
800
900
1,000
1990 2000 2007-‐2011
Med
ian Va
lue ($)
Tract 30* Median Rent 1990 to 2007-‐2011
Tract 30 Pulaski U.S.A.
Figure 7-48. Tract 30* Median Value 1990 to 2007–2011
283
450
663
0
100
200
300
400
500
600
700
800
900
1,000
1990 2000 2007-‐2011
Med
ian Va
lue ($)
Tract 30* Median Rent 1990 to 2007-‐2011
Tract 30 Pulaski U.S.A.
283
450
663
0
100
200
300
400
500
600
700
800
900
1,000
1990 2000 2007-‐2011
Med
ian Va
lue ($)
Tract 30* Median Rent 1990 to 2007-‐2011
Tract 30 Pulaski U.S.A.
Figure 7-47. Tract 30* Median Rent 1990 to 2007–2011
2006-‐2010 ACS 2007 -‐ 2011 ACS
30.01 72,400 73,100
30.02 81,700 88,300
0
20,000
40,000
60,000
80,000
100,000
U.S. D
ollars
Comparison of Median Housing Values in Tracts 30.1 and 30.2 Figure 7-49. Comparison of Median Housing Values in Tracts 30.1 and 30.2
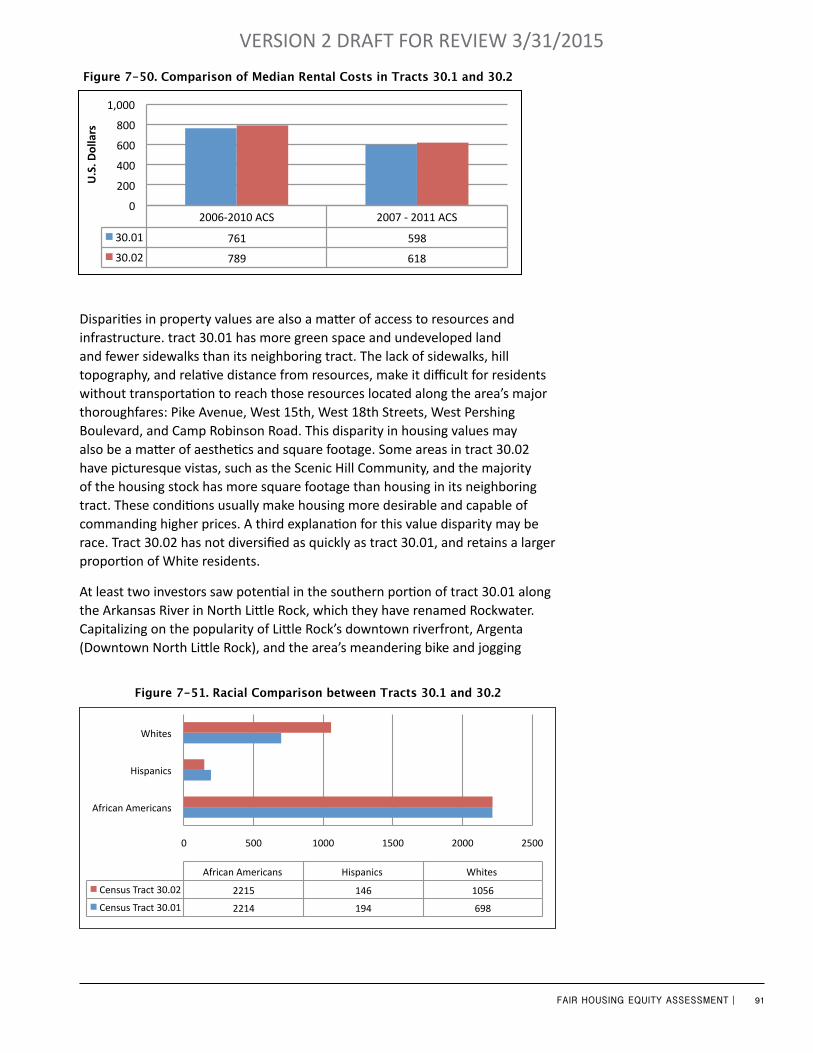
91FAIR HOUSING EQUITY ASSESSMENT |
VERSION 2 DRAFT FOR REVIEW 3/31/2015
Disparities in property values are also a matter of access to resources and infrastructure. tract 30.01 has more green space and undeveloped land and fewer sidewalks than its neighboring tract. The lack of sidewalks, hill topography, and relative distance from resources, make it difficult for residents without transportation to reach those resources located along the area’s major thoroughfares: Pike Avenue, West 15th, West 18th Streets, West Pershing Boulevard, and Camp Robinson Road. This disparity in housing values may also be a matter of aesthetics and square footage. Some areas in tract 30.02 have picturesque vistas, such as the Scenic Hill Community, and the majority of the housing stock has more square footage than housing in its neighboring tract. These conditions usually make housing more desirable and capable of commanding higher prices. A third explanation for this value disparity may be race. Tract 30.02 has not diversified as quickly as tract 30.01, and retains a larger proportion of White residents.
At least two investors saw potential in the southern portion of tract 30.01 along the Arkansas River in North Little Rock, which they have renamed Rockwater. Capitalizing on the popularity of Little Rock’s downtown riverfront, Argenta (Downtown North Little Rock), and the area’s meandering bike and jogging
2006-‐2010 ACS 2007 -‐ 2011 ACS
30.01 761 598
30.02 789 618
0
200
400
600
800
1,000 U.S. D
ollars
Comparison of Median Rental Costs in Tracts 30.1 and 30.2 Figure 7-50. Comparison of Median Rental Costs in Tracts 30.1 and 30.2
0 500 1000 1500 2000 2500
African Americans
Hispanics
Whites
African Americans Hispanics Whites
Census Tract 30.02 2215 146 1056
Census Tract 30.01 2214 194 698
Racial Comparison between Tracts 30.01 and 30.02 Figure 7-51. Racial Comparison between Tracts 30.1 and 30.2
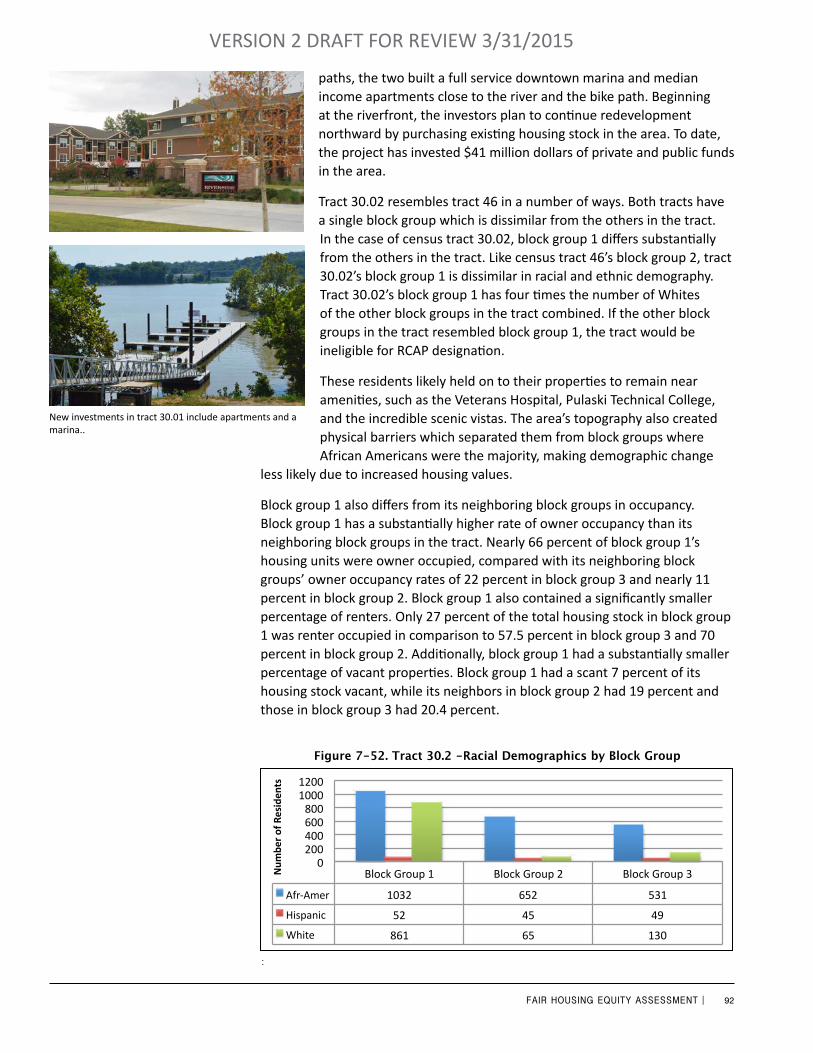
92FAIR HOUSING EQUITY ASSESSMENT |
VERSION 2 DRAFT FOR REVIEW 3/31/2015
paths, the two built a full service downtown marina and median income apartments close to the river and the bike path. Beginning at the riverfront, the investors plan to continue redevelopment northward by purchasing existing housing stock in the area. To date, the project has invested $41 million dollars of private and public funds in the area.
Tract 30.02 resembles tract 46 in a number of ways. Both tracts have a single block group which is dissimilar from the others in the tract. In the case of census tract 30.02, block group 1 differs substantially from the others in the tract. Like census tract 46’s block group 2, tract 30.02’s block group 1 is dissimilar in racial and ethnic demography. Tract 30.02’s block group 1 has four times the number of Whites of the other block groups in the tract combined. If the other block groups in the tract resembled block group 1, the tract would be ineligible for RCAP designation.
These residents likely held on to their properties to remain near amenities, such as the Veterans Hospital, Pulaski Technical College, and the incredible scenic vistas. The area’s topography also created physical barriers which separated them from block groups where African Americans were the majority, making demographic change
less likely due to increased housing values.
Block group 1 also differs from its neighboring block groups in occupancy. Block group 1 has a substantially higher rate of owner occupancy than its neighboring block groups in the tract. Nearly 66 percent of block group 1’s housing units were owner occupied, compared with its neighboring block groups’ owner occupancy rates of 22 percent in block group 3 and nearly 11 percent in block group 2. Block group 1 also contained a significantly smaller percentage of renters. Only 27 percent of the total housing stock in block group 1 was renter occupied in comparison to 57.5 percent in block group 3 and 70 percent in block group 2. Additionally, block group 1 had a substantially smaller percentage of vacant properties. Block group 1 had a scant 7 percent of its housing stock vacant, while its neighbors in block group 2 had 19 percent and those in block group 3 had 20.4 percent.
New investments in tract 30.01 include apartments and a marina..
Block Group 1 Block Group 2 Block Group 3
Black 1032 652 531
Hispanic 52 45 49
White 861 65 130
0 200 400 600 800
1000 1200
Num
ber of Residen
ts
Tract 30.02 -‐ Racial Demographics by Block Group Figure 7-52. Tract 30.2 -Racial Demographics by Block Group
Num
ber
of R
esid
ents
:
Afr-Amer
Hispanic
White

93FAIR HOUSING EQUITY ASSESSMENT |
VERSION 2 DRAFT FOR REVIEW 3/31/2015
Although the largest block group in geographic size and population, the majority of block group 1’s residential population is over 35 years of age, and a significant number is over 65. In both block group 1 and 2, the largest segment of residents are 34 years old and under. Block group 1’s significantly high number of older residents is attributed to two factors: housing units dedicated to older residents (elderly apartments) and residents who aged in place rather than fleeing to the suburbs.
Residential development and housing construction in the two tracts have historically been similar. Both tracts have a small portion of pre-World War II (pre-1939) housing stock. Tract 30.01 saw more development during this era due to its proximity to the city and the early rail yards. Tract 30.01 has more than double (19 percent versus 8 percent) the number of pre-World War II houses as tract 30.02. Aside from this early disparity, the two tracts experienced similar levels of residential development until the 1980s. During the 1980s, residential construction in tract 30.02 dramatically outpaced that of tract 30.01. However, since 1989, all new housing construction has been confined to tract 30.01.
Block Group 1 Block Group 2 Block Group 3
Renters 261 837 180
Home Owners 631 674 69
Vacant 66 64 64
0 200 400 600 800
1000
Num
ber of Hou
sing Units
Tract 30.02 Occupancy by Type and Block Group
Num
ber
of
Hou
sing
Uni
ts
Figure 7-53. Tract 30.2 - Occupancy by Type and Block Group
Under 18 18 -‐34 35 -‐ 64 65 & Above
Block Group 1 401 551 575 450
Block Group 2 334 257 150 26
Block Group 3 220 170 278 36
0 100 200 300 400 500 600 700
Num
ber of Residen
ts
Tract 30.02 -‐ Age Demographics by Block Group
Num
ber
of
Hou
sing
Uni
ts
Figure 7-54. Tract 30.2 - Age Demographics by Block Group
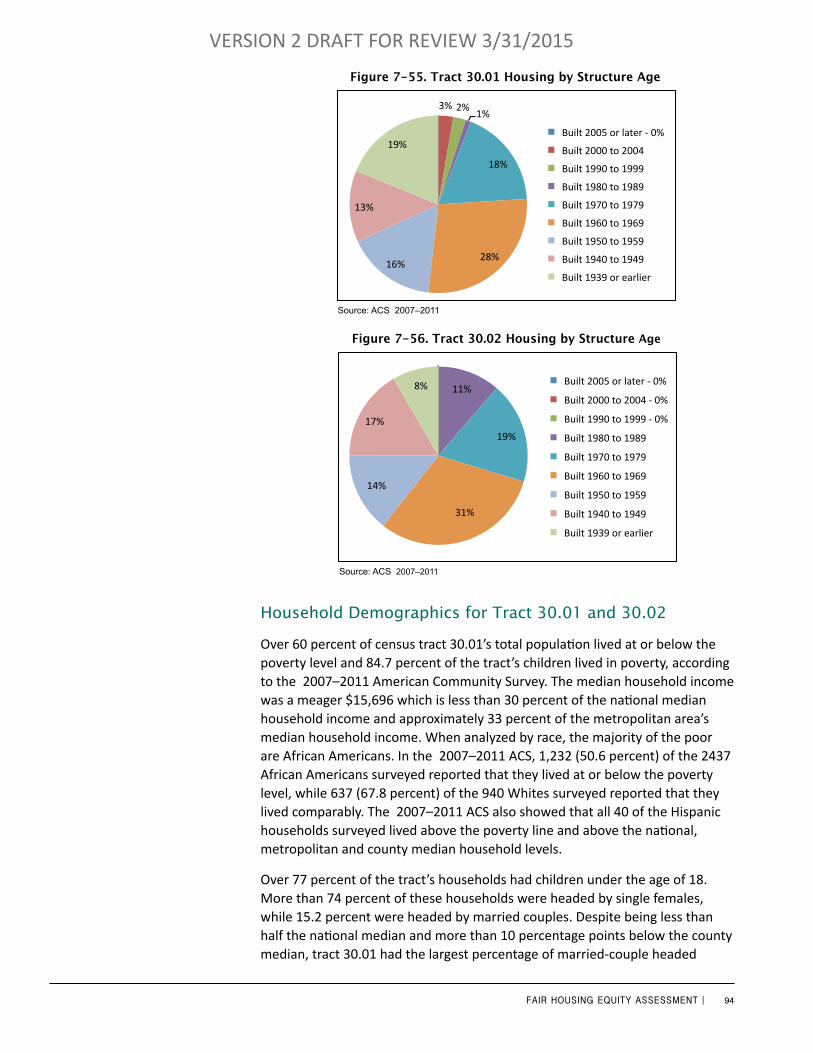
94FAIR HOUSING EQUITY ASSESSMENT |
VERSION 2 DRAFT FOR REVIEW 3/31/2015
3% 2% 1%
18%
28% 16%
13%
19%
Tract 30.01 Housing by Structure Age
Built 2005 or later -‐ 0%
Built 2000 to 2004
Built 1990 to 1999
Built 1980 to 1989
Built 1970 to 1979
Built 1960 to 1969
Built 1950 to 1959
Built 1940 to 1949
Built 1939 or earlier
Figure 7-55. Tract 30.01 Housing by Structure Age
Source: ACS 2007–2011
Source: ACS 2007–2011
Figure 7-56. Tract 30.02 Housing by Structure Age
11%
19%
31%
14%
17%
8%
Tract 30.02 Housing by Structure Age
Built 2005 or later -‐ 0%
Built 2000 to 2004 -‐ 0%
Built 1990 to 1999 -‐ 0%
Built 1980 to 1989
Built 1970 to 1979
Built 1960 to 1969
Built 1950 to 1959
Built 1940 to 1949
Built 1939 or earlier
Household Demographics for Tract 30.01 and 30.02
Over 60 percent of census tract 30.01’s total population lived at or below the poverty level and 84.7 percent of the tract’s children lived in poverty, according to the 2007–2011 American Community Survey. The median household income was a meager $15,696 which is less than 30 percent of the national median household income and approximately 33 percent of the metropolitan area’s median household income. When analyzed by race, the majority of the poor are African Americans. In the 2007–2011 ACS, 1,232 (50.6 percent) of the 2437 African Americans surveyed reported that they lived at or below the poverty level, while 637 (67.8 percent) of the 940 Whites surveyed reported that they lived comparably. The 2007–2011 ACS also showed that all 40 of the Hispanic households surveyed lived above the poverty line and above the national, metropolitan and county median household levels.
Over 77 percent of the tract’s households had children under the age of 18. More than 74 percent of these households were headed by single females, while 15.2 percent were headed by married couples. Despite being less than half the national median and more than 10 percentage points below the county median, tract 30.01 had the largest percentage of married-couple headed

95FAIR HOUSING EQUITY ASSESSMENT |
VERSION 2 DRAFT FOR REVIEW 3/31/2015
households of all RCAPs. Almost 56 percent of African American households and 37.18 percent of White households in the tract received food assistance (SNAP), ranking the tract as the second highest recipient of food assistance among the RCAP tracts.
In tract 30.02, 55.7 percent of the households had children under the age of 18 and 73.7 percent of the tract’s children lived at or below the poverty level. Of the households with children, 89 percent were headed by female single parents and six percent were headed by married couples. The majority of poor in the tract were African Americans. In the 2007–2011 ASC, 1,468 (58 percent) African American residents out of the 2,533 African Americans surveyed reported that they lived in poverty, while only 37 (22.7 percent) of 163 Hispanics surveyed reported that they lived comparably. Only 197 (16.5 percent) of the 1,194 Whites surveyed in the tract contended that they lived at or below the poverty level, well below the national, metropolitan, and county medians.
The percentages of households receiving SNAP assistance affirms the disparity between African Americans and Whites living within the tract. A higher percentage of African Americans households received food assistance in
0
200
400
600
800
1000
1200
1400
1600
White Black or African American
Hispanic or La<no (any race)
Tract 30.1
African American or African American
White Hispanic or Hispanic(any race)
Figure 7-57. Tract 30.1 - Number of Residents living at or below the Poverty Level by Race
Source: 2007–2011 ACS
0
200
400
600
800
1000
1200
1400
1600
White Black or African American
Hispanic or La<no (any race)
Tract 30.2
African American or African American
White Hispanic or Hispanic(any race)
Source: 2007–2011 ACS
Figure 7-58 Tract 30.2 - Number of Residents living at or below the Poverty Level by Race
$0
$5,000
$10,000
$15,000
$20,000
$25,000
$30,000
$35,000
$40,000
$45,000
White African American Hispanic
Tract 12 Household Income by Race
$0
$5,000
$10,000
$15,000
$20,000
$25,000
$30,000
$35,000
$40,000
$45,000
White African American Hispanic
Tract 12 Household Income by Race

96FAIR HOUSING EQUITY ASSESSMENT |
VERSION 2 DRAFT FOR REVIEW 3/31/2015
tract 30.02 than any other RCAP. Over 65 percent of the African Americans households in the tract received food assistance, more than double the African American median rate of assistance in the county (25.06 percent), metropolitan area (25.16 percent), and the nation (23.30 percent). Comparably, White households in the tract receive SNAP assistance at a rate of 9.25 percent, and although the percentage of assistance exceeded the county (4.56 percent) and metropolitan (6.20 percent) medians, it was well below the national median of 12.72 percent.
Labor force participation and unemployment were very similar in many regards in tract 30.01 and 30.02. Both tracts have comparably lower rates of labor force participation when compared to national and county averages. The areas of overall labor force participation and overall male unemployment varied significantly between the two tracts. The percentage of males in the labor force in tract 30.01 exceeded the percentage of males in the labor force in tract 30.02 by more than 10 percent (54.3 percent compared to 43.1 percent). The rate of overall male unemployment in tract 30.01 was also more than 3 times that of tract 30.02 (35.1 percent compared to 10.5 percent). When the survey data is analyzed by race, the disparities between racial and ethnic communities in the tracts becomes more apparent.
Of African American females in tract 30.01, 43.5 percent were in the labor force, compared to 50.6 percent in tract 30.02. The unemployment rate for African American females in tract 30.01 was 30.1 percent, which was slightly higher than the 26.3 percent reported by African American females in tract 30.02. While African American females’ labor force and unemployment rates were similar, the same cannot be said of their male counterparts. 52.6 percent of African American males in tract 30.1 reported that they participated in the labor force, comparatively, only 23.8 percent of those in 30.02 reported similarly. African American male unemployment rates between the two tracts were also dramatically contrasting. In tract 30.01, 50.8 percent of the males in the labor force reported that they were unemployed, while in tract 30.02, all males in the labor force were employed. African American male unemployment in tract 30.01 was more than 3 times the national and county averages of 16.7 percent (national average) and 16.3 percent (county average). White males and females in tract 30.01 participated in the labor force in smaller percentages than in tract 30.02. White female participation in tract 30.01 was at a rate of 37.8 percent, while White females in tract 30.02 participated at a rate of 43.4 percent. However, tract 30.02 had nearly double the rate of White female unemployment when compared to tract 30.01. White males in tract 30.02 participated in the labor force at higher rates than those in tract 30.01 ( 66.0 percent compared to 50.3 percent ), unemployment rates were similar, and in both instances were more than double the national average (7.7 percent) and nearly triple the county average (5.3 percent). Hispanic labor force participation in both tracts was 100 percent; however no females were surveyed in tract 30.01. Similarly, in both tracts there was no Hispanic unemployment.
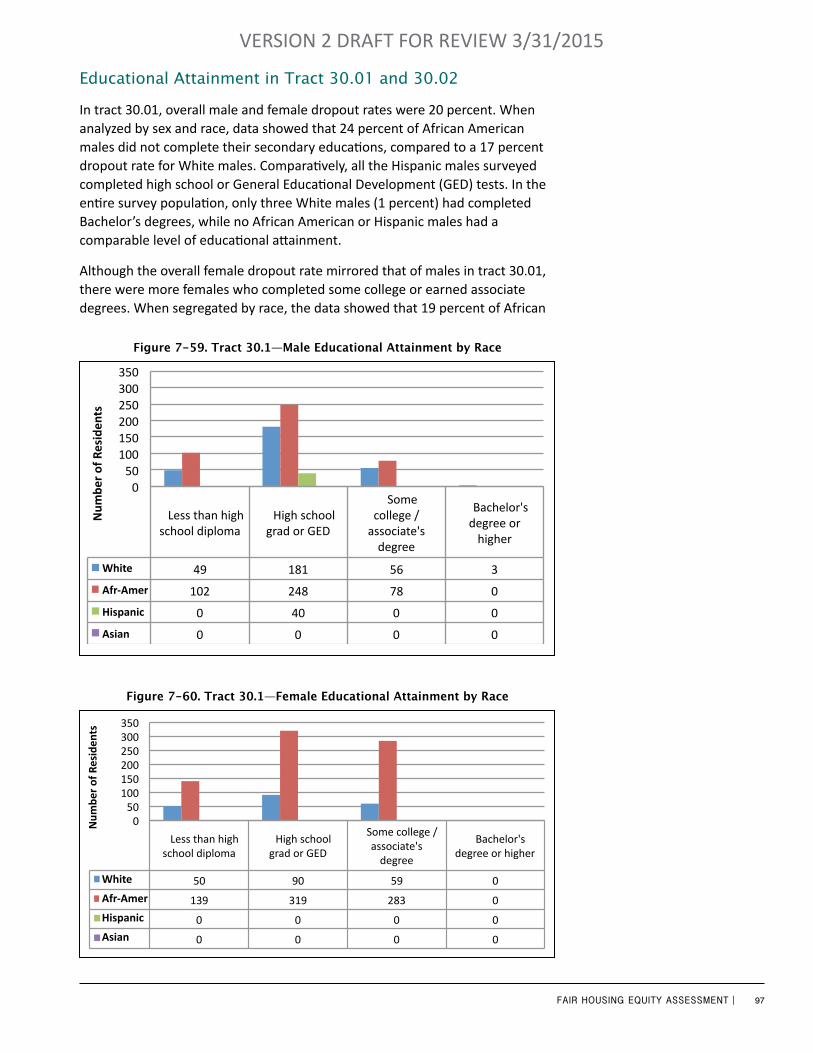
97FAIR HOUSING EQUITY ASSESSMENT |
VERSION 2 DRAFT FOR REVIEW 3/31/2015
Educational Attainment in Tract 30.01 and 30.02
In tract 30.01, overall male and female dropout rates were 20 percent. When analyzed by sex and race, data showed that 24 percent of African American males did not complete their secondary educations, compared to a 17 percent dropout rate for White males. Comparatively, all the Hispanic males surveyed completed high school or General Educational Development (GED) tests. In the entire survey population, only three White males (1 percent) had completed Bachelor’s degrees, while no African American or Hispanic males had a comparable level of educational attainment.
Although the overall female dropout rate mirrored that of males in tract 30.01, there were more females who completed some college or earned associate degrees. When segregated by race, the data showed that 19 percent of African
Figure 7-59. Tract 30.1—Male Educational Attainment by Race
Less than high school diploma
High school grad or GED
Some college / associate's degree
Bachelor's degree or higher
White 49 181 56 3
Black 102 248 78 0
Hispanic 0 40 0 0
Asian 0 0 0 0
0 50
100 150 200 250 300 350
Num
ber of Residen
ts
Tract 30.01 male
White
Afr-Amer
Hispanic
Asian
Less than high school diploma
High school grad or GED
Some college / associate's degree
Bachelor's degree or higher
White 50 90 59 0
Black 139 319 283 0
Hispanic 0 0 0 0
Asian 0 0 0 0
0 50
100 150 200 250 300 350
Num
ber of Residen
ts
Tract 30.01 Figure 7-60. Tract 30.1—Female Educational Attainment by Race
White
Afr-Amer
Hispanic
Asian
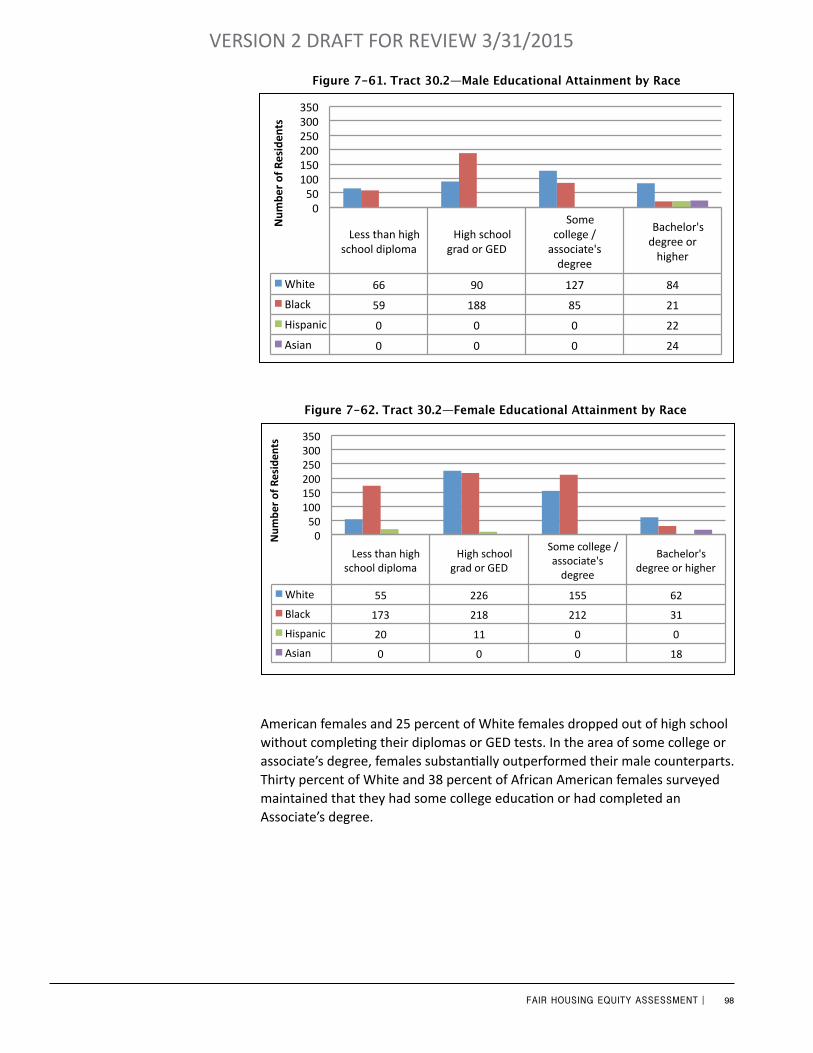
98FAIR HOUSING EQUITY ASSESSMENT |
VERSION 2 DRAFT FOR REVIEW 3/31/2015
Figure 7-61. Tract 30.2—Male Educational Attainment by Race
Less than high school diploma
High school grad or GED
Some college / associate's degree
Bachelor's degree or higher
White 66 90 127 84
Black 59 188 85 21
Hispanic 0 0 0 22
Asian 0 0 0 24
0 50
100 150 200 250 300 350
Num
ber of Residen
ts
Tract 30.02 Male Educa:onal A<ainment by Race
Less than high school diploma
High school grad or GED
Some college / associate's degree
Bachelor's degree or higher
White 55 226 155 62
Black 173 218 212 31
Hispanic 20 11 0 0
Asian 0 0 0 18
0 50
100 150 200 250 300 350
Num
ber of Residen
ts
Tract 30.02 Figure 7-62. Tract 30.2—Female Educational Attainment by Race
American females and 25 percent of White females dropped out of high school without completing their diplomas or GED tests. In the area of some college or associate’s degree, females substantially outperformed their male counterparts. Thirty percent of White and 38 percent of African American females surveyed maintained that they had some college education or had completed an Associate’s degree.

99FAIR HOUSING EQUITY ASSESSMENT |
VERSION 2 DRAFT FOR REVIEW 3/31/2015
In tract 30.02, the overall rate for male dropouts was 16 percent and the overall rate for females was slightly higher at 21 percent. Like tract 46, this disparity may be linked to the prevalence of elderly in the tract, but without block group or more specific individual data, it is difficult to explain the disparity. When analyzed by race, African American female dropout rates were more than double that of White females. Twenty-seven percent of African American females dropped out before completing their secondary educations, while only 11 percent of their White counterparts similarly dropped out. Hispanic females’ dropout rates substantially exceeded those of African American females. Sixty-five percent of Hispanic Females failed to complete high school or obtain a GED. All Asian females surveyed not only completed high school, but also went on to complete at least Bachelor degrees. All other ethnic groups lagged behind Asian females in regard to the highest level of educational attainment. White females’ Bachelor’s degree or higher attainment rate was 13 percent, African American females 5 percent, and no Hispanic females in the tract attended or completed college.
African American and White male dropout rates in the tract were similar, with African American males dropping out at a rate of 17 percent and their White counterparts dropping out at a rate of 18 percent. However, the dropout rates for Asians and Hispanics differed significantly from those African American and White males. Both Asians and Hispanics completed high school and all went on to at least complete Bachelor’s degrees. Comparatively, African American and White males’ educational attainment rates were far lower than those of Asians and Hispanics. Only 6 percent of African American and 23 percent of White males completed Bachelor’s degrees.
Transportation and Mobility
Although similar in many regards, tracts 30.01 and 30.02 contrast one another in the areas of transportation and mobility. Tract 30.01 had the highest rate of residents without an automobile of the all the RCAPs. 30.9 percent of the tract’s residents reported that they had no access to an automobile. Conversely, only 6.2 percent of the residents in tract 30.02 reported to similarly have no access to an automobile. Tract 30.01 led the RCAPs in percentage of residents who you used public transportation to commute for work, residents who walked to work, and those who used taxis or motorcycles for their work commutes. Public transportation in the tract is available from a single route and five bus stops. The average resident in the tract travels 19.6 miles from the tract and spends 39.2 minutes in transit daily.
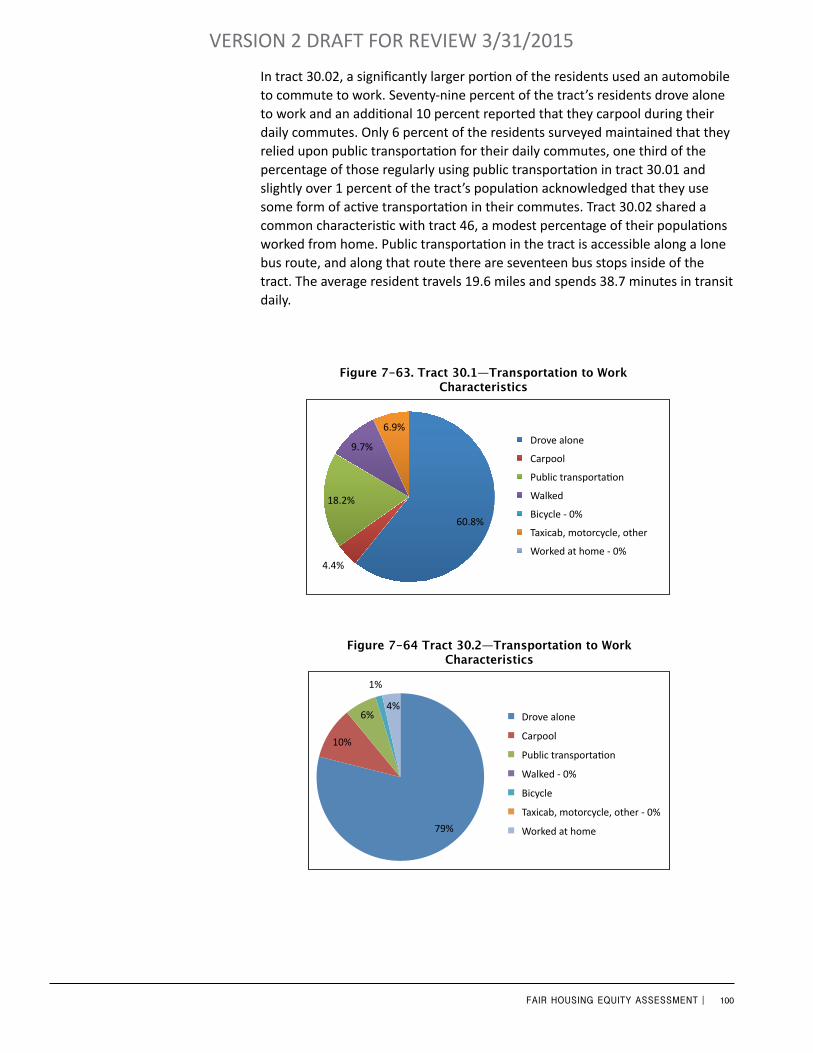
100FAIR HOUSING EQUITY ASSESSMENT |
VERSION 2 DRAFT FOR REVIEW 3/31/2015
60.8%
4.4%
18.2%
9.7%
6.9% Drove alone
Carpool
Public transporta=on
Walked
Bicycle -‐ 0%
Taxicab, motorcycle, other
Worked at home -‐ 0%
Figure 7-63. Tract 30.1—Transportation to Work Characteristics
79%
10%
6%
1%
4%
Census Tract 30.02 Transporta2on to Work Characteris2cs
Drove alone
Carpool
Public transporta:on
Walked -‐ 0%
Bicycle
Taxicab, motorcycle, other -‐ 0%
Worked at home
Figure 7-64 Tract 30.2—Transportation to Work Characteristics
In tract 30.02, a significantly larger portion of the residents used an automobile to commute to work. Seventy-nine percent of the tract’s residents drove alone to work and an additional 10 percent reported that they carpool during their daily commutes. Only 6 percent of the residents surveyed maintained that they relied upon public transportation for their daily commutes, one third of the percentage of those regularly using public transportation in tract 30.01 and slightly over 1 percent of the tract’s population acknowledged that they use some form of active transportation in their commutes. Tract 30.02 shared a common characteristic with tract 46, a modest percentage of their populations worked from home. Public transportation in the tract is accessible along a lone bus route, and along that route there are seventeen bus stops inside of the tract. The average resident travels 19.6 miles and spends 38.7 minutes in transit daily.
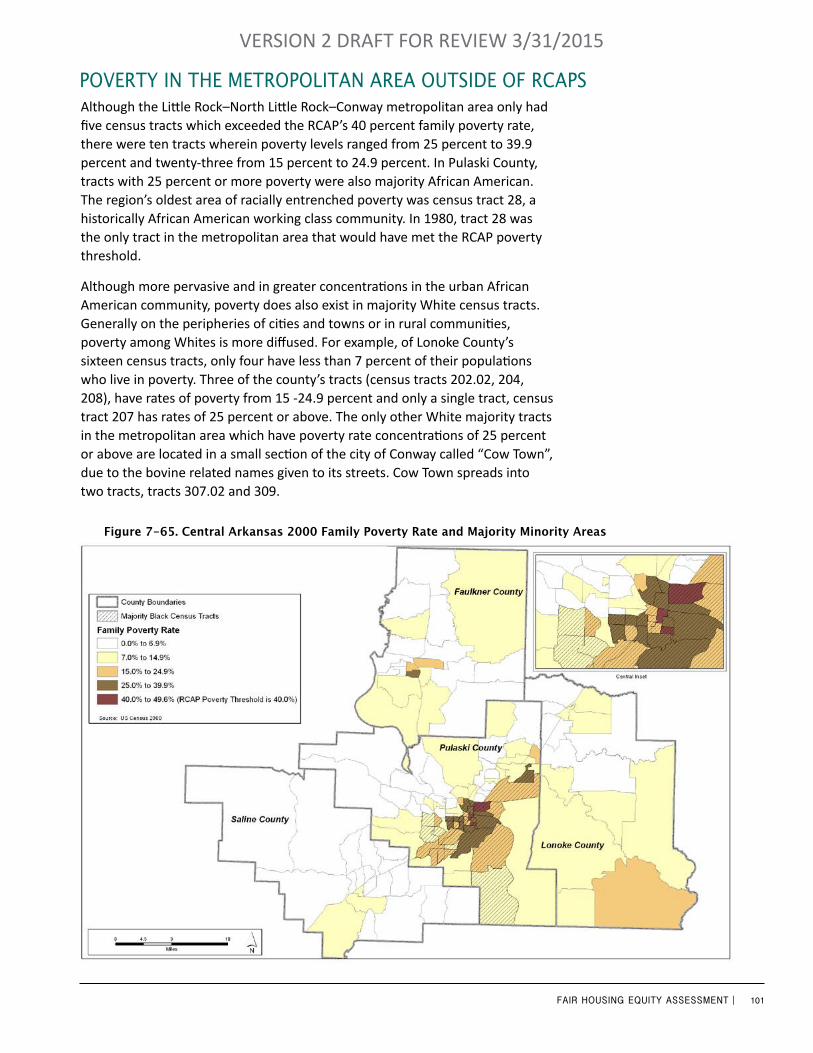
101FAIR HOUSING EQUITY ASSESSMENT |
VERSION 2 DRAFT FOR REVIEW 3/31/2015
Although the Little Rock–North Little Rock–Conway metropolitan area only had five census tracts which exceeded the RCAP’s 40 percent family poverty rate, there were ten tracts wherein poverty levels ranged from 25 percent to 39.9 percent and twenty-three from 15 percent to 24.9 percent. In Pulaski County, tracts with 25 percent or more poverty were also majority African American. The region’s oldest area of racially entrenched poverty was census tract 28, a historically African American working class community. In 1980, tract 28 was the only tract in the metropolitan area that would have met the RCAP poverty threshold.
Although more pervasive and in greater concentrations in the urban African American community, poverty does also exist in majority White census tracts. Generally on the peripheries of cities and towns or in rural communities, poverty among Whites is more diffused. For example, of Lonoke County’s sixteen census tracts, only four have less than 7 percent of their populations who live in poverty. Three of the county’s tracts (census tracts 202.02, 204, 208), have rates of poverty from 15 -24.9 percent and only a single tract, census tract 207 has rates of 25 percent or above. The only other White majority tracts in the metropolitan area which have poverty rate concentrations of 25 percent or above are located in a small section of the city of Conway called “Cow Town”, due to the bovine related names given to its streets. Cow Town spreads into two tracts, tracts 307.02 and 309.
PoverTy in The MeTroPoliTan area ouTside of rCaPs
Figure 7-65. Central Arkansas 2000 Family Poverty Rate and Majority Minority Areas
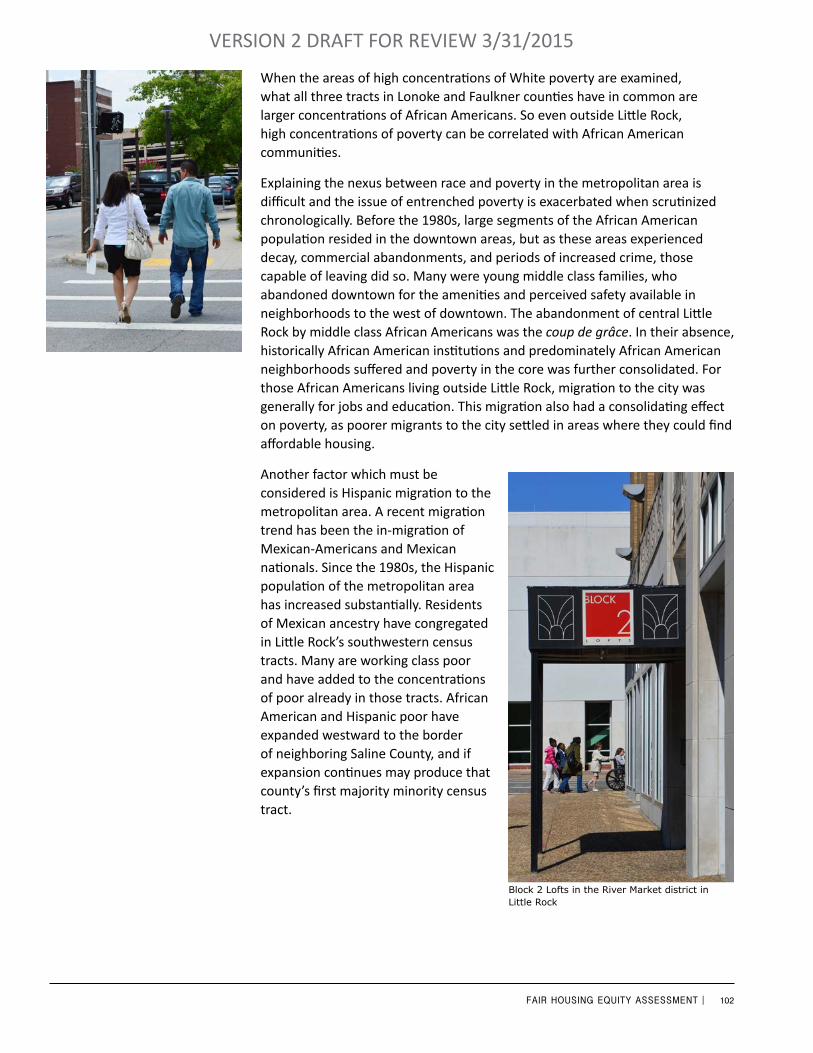
102FAIR HOUSING EQUITY ASSESSMENT |
VERSION 2 DRAFT FOR REVIEW 3/31/2015
When the areas of high concentrations of White poverty are examined, what all three tracts in Lonoke and Faulkner counties have in common are larger concentrations of African Americans. So even outside Little Rock, high concentrations of poverty can be correlated with African American communities.
Explaining the nexus between race and poverty in the metropolitan area is difficult and the issue of entrenched poverty is exacerbated when scrutinized chronologically. Before the 1980s, large segments of the African American population resided in the downtown areas, but as these areas experienced decay, commercial abandonments, and periods of increased crime, those capable of leaving did so. Many were young middle class families, who abandoned downtown for the amenities and perceived safety available in neighborhoods to the west of downtown. The abandonment of central Little Rock by middle class African Americans was the coup de grâce. In their absence, historically African American institutions and predominately African American neighborhoods suffered and poverty in the core was further consolidated. For those African Americans living outside Little Rock, migration to the city was generally for jobs and education. This migration also had a consolidating effect on poverty, as poorer migrants to the city settled in areas where they could find affordable housing.
Another factor which must be considered is Hispanic migration to the metropolitan area. A recent migration trend has been the in-migration of Mexican-Americans and Mexican nationals. Since the 1980s, the Hispanic population of the metropolitan area has increased substantially. Residents of Mexican ancestry have congregated in Little Rock’s southwestern census tracts. Many are working class poor and have added to the concentrations of poor already in those tracts. African American and Hispanic poor have expanded westward to the border of neighboring Saline County, and if expansion continues may produce that county’s first majority minority census tract.
Block 2 Lofts in the River Market district in Little Rock

103FAIR HOUSING EQUITY ASSESSMENT |
VERSION 2 DRAFT FOR REVIEW 3/31/2015
While minority populations have expanded in the southwest, in Little Rock’s downtown River Market area, minority concentrations and poverty levels have declined. Commercial and residential development precipitated this transformation, and numerous construction projects in tracts nearby suggest the continuation of this trend. Widespread commercial and residential development along South Main Street and residential development in Tract 46 are testaments to the southward expansion of the trend, and development along North Little Rock’s riverfront and Main Street serve as indicators of the trend’s northward expansion. Additional indicators of change have been increasing levels of educational attainment, family household incomes, rising property values, and increased populations of Whites. Very little discussion of gentrification has been attributed to the expansion of market value multi-family residential complexes along the river because much of this downtown area was underused or abandoned commercial property before its redevelopment; earlier downtown residential population was nearly eliminated decades earlier by urban renewal. Since few of the proposed projects in the area include subsidized units or low rent units, the displacement of the area’s poor and the discussion of gentrification may become an issue in the future, particularly as development expands from former commercial areas to existing residential neighborhoods. If this trend continues and housing accommodations are not made for the poor, they will be forced into areas of declining property values, where homeowners who were unable to sell or rent their property at market value rates will resort to renting them as below market rate housing units.
The Argenta District in North Little Rock
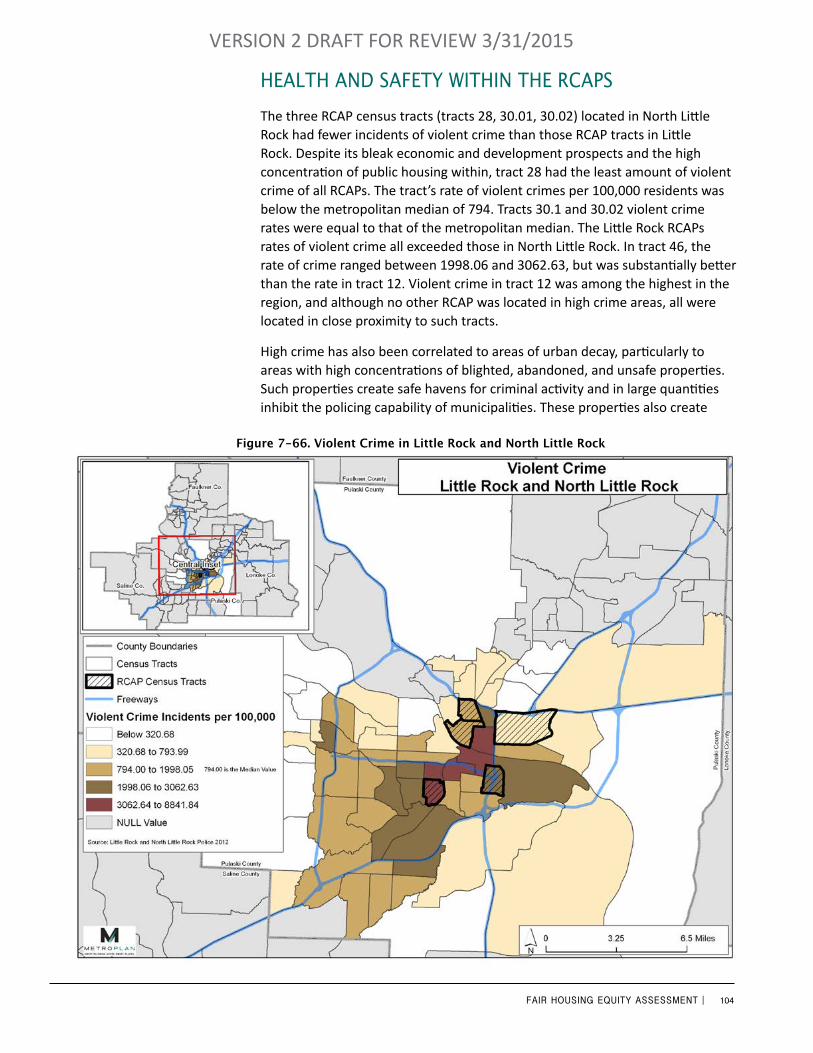
104FAIR HOUSING EQUITY ASSESSMENT |
VERSION 2 DRAFT FOR REVIEW 3/31/2015
The three RCAP census tracts (tracts 28, 30.01, 30.02) located in North Little Rock had fewer incidents of violent crime than those RCAP tracts in Little Rock. Despite its bleak economic and development prospects and the high concentration of public housing within, tract 28 had the least amount of violent crime of all RCAPs. The tract’s rate of violent crimes per 100,000 residents was below the metropolitan median of 794. Tracts 30.1 and 30.02 violent crime rates were equal to that of the metropolitan median. The Little Rock RCAPs rates of violent crime all exceeded those in North Little Rock. In tract 46, the rate of crime ranged between 1998.06 and 3062.63, but was substantially better than the rate in tract 12. Violent crime in tract 12 was among the highest in the region, and although no other RCAP was located in high crime areas, all were located in close proximity to such tracts.
High crime has also been correlated to areas of urban decay, particularly to areas with high concentrations of blighted, abandoned, and unsafe properties. Such properties create safe havens for criminal activity and in large quantities inhibit the policing capability of municipalities. These properties also create
healTh and safeTy wiThin The rCaPs
Figure 7-66. Violent Crime in Little Rock and North Little Rock
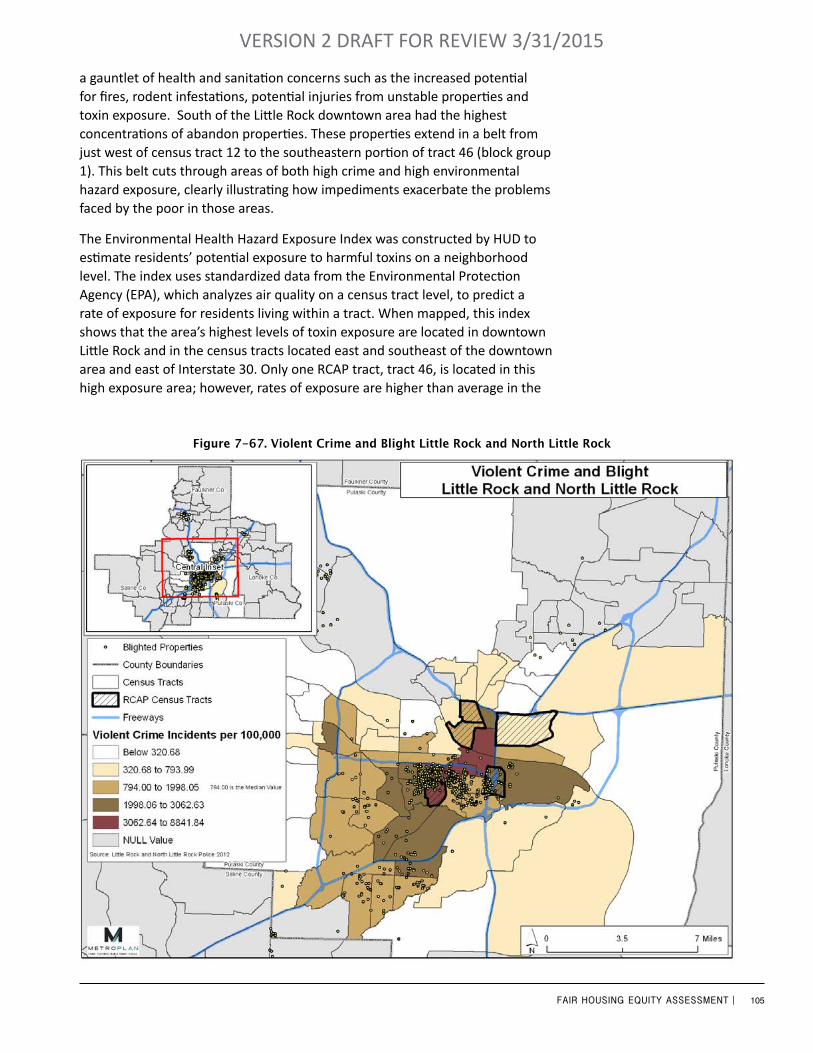
105FAIR HOUSING EQUITY ASSESSMENT |
VERSION 2 DRAFT FOR REVIEW 3/31/2015
a gauntlet of health and sanitation concerns such as the increased potential for fires, rodent infestations, potential injuries from unstable properties and toxin exposure. South of the Little Rock downtown area had the highest concentrations of abandon properties. These properties extend in a belt from just west of census tract 12 to the southeastern portion of tract 46 (block group 1). This belt cuts through areas of both high crime and high environmental hazard exposure, clearly illustrating how impediments exacerbate the problems faced by the poor in those areas.
The Environmental Health Hazard Exposure Index was constructed by HUD to estimate residents’ potential exposure to harmful toxins on a neighborhood level. The index uses standardized data from the Environmental Protection Agency (EPA), which analyzes air quality on a census tract level, to predict a rate of exposure for residents living within a tract. When mapped, this index shows that the area’s highest levels of toxin exposure are located in downtown Little Rock and in the census tracts located east and southeast of the downtown area and east of Interstate 30. Only one RCAP tract, tract 46, is located in this high exposure area; however, rates of exposure are higher than average in the
Figure 7-67. Violent Crime and Blight Little Rock and North Little Rock

106FAIR HOUSING EQUITY ASSESSMENT |
VERSION 2 DRAFT FOR REVIEW 3/31/2015
Figure 7-68. Environmental Index
downtown cores of Little Rock, North Little Rock, and Conway than they are in areas located on the periphery of these cities or in rural areas.
A scrapyard near Tract 46 within a larger industrial area
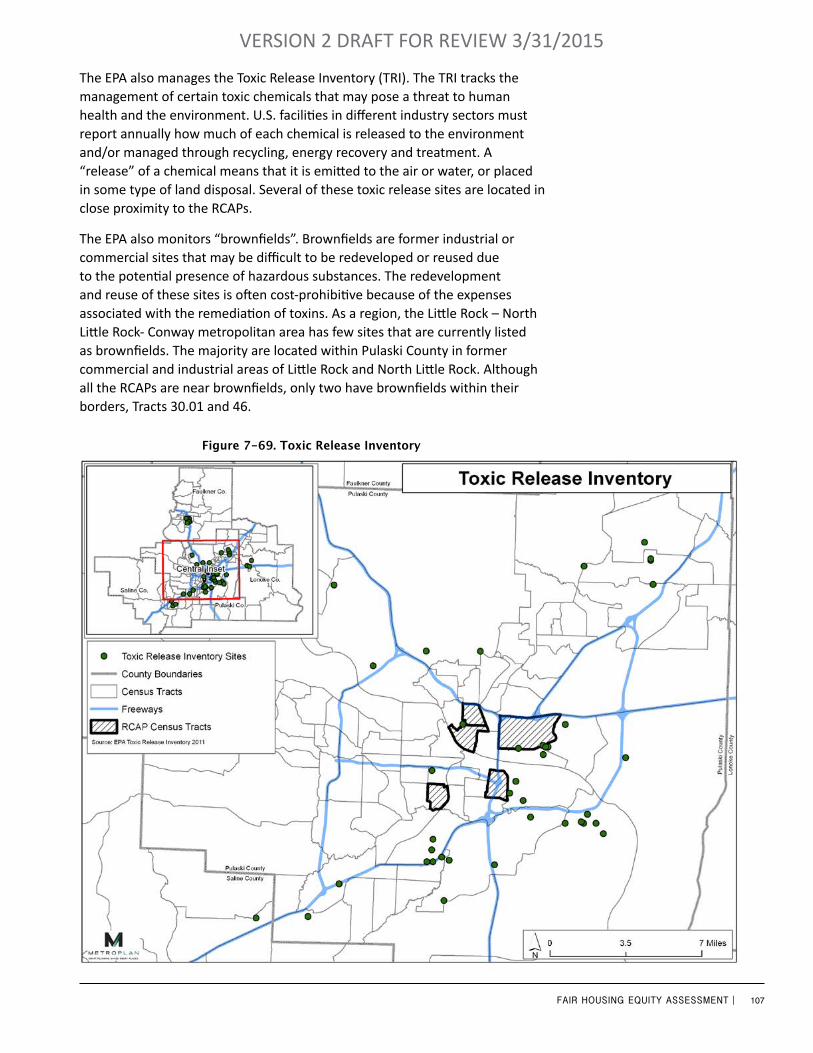
107FAIR HOUSING EQUITY ASSESSMENT |
VERSION 2 DRAFT FOR REVIEW 3/31/2015
The EPA also manages the Toxic Release Inventory (TRI). The TRI tracks the management of certain toxic chemicals that may pose a threat to human health and the environment. U.S. facilities in different industry sectors must report annually how much of each chemical is released to the environment and/or managed through recycling, energy recovery and treatment. A “release” of a chemical means that it is emitted to the air or water, or placed in some type of land disposal. Several of these toxic release sites are located in close proximity to the RCAPs.
The EPA also monitors “brownfields”. Brownfields are former industrial or commercial sites that may be difficult to be redeveloped or reused due to the potential presence of hazardous substances. The redevelopment and reuse of these sites is often cost-prohibitive because of the expenses associated with the remediation of toxins. As a region, the Little Rock – North Little Rock- Conway metropolitan area has few sites that are currently listed as brownfields. The majority are located within Pulaski County in former commercial and industrial areas of Little Rock and North Little Rock. Although all the RCAPs are near brownfields, only two have brownfields within their borders, Tracts 30.01 and 46.
Figure 7-69. Toxic Release Inventory

108FAIR HOUSING EQUITY ASSESSMENT |
VERSION 2 DRAFT FOR REVIEW 3/31/2015
Figure 7-70. Brownfields
Brownfields funding makes refurbishing old buildings cost effective, saving many historic structures in central Arkansas. The former Dillard’s building, circa 1889, on Main Street in Little Rock is being restored.
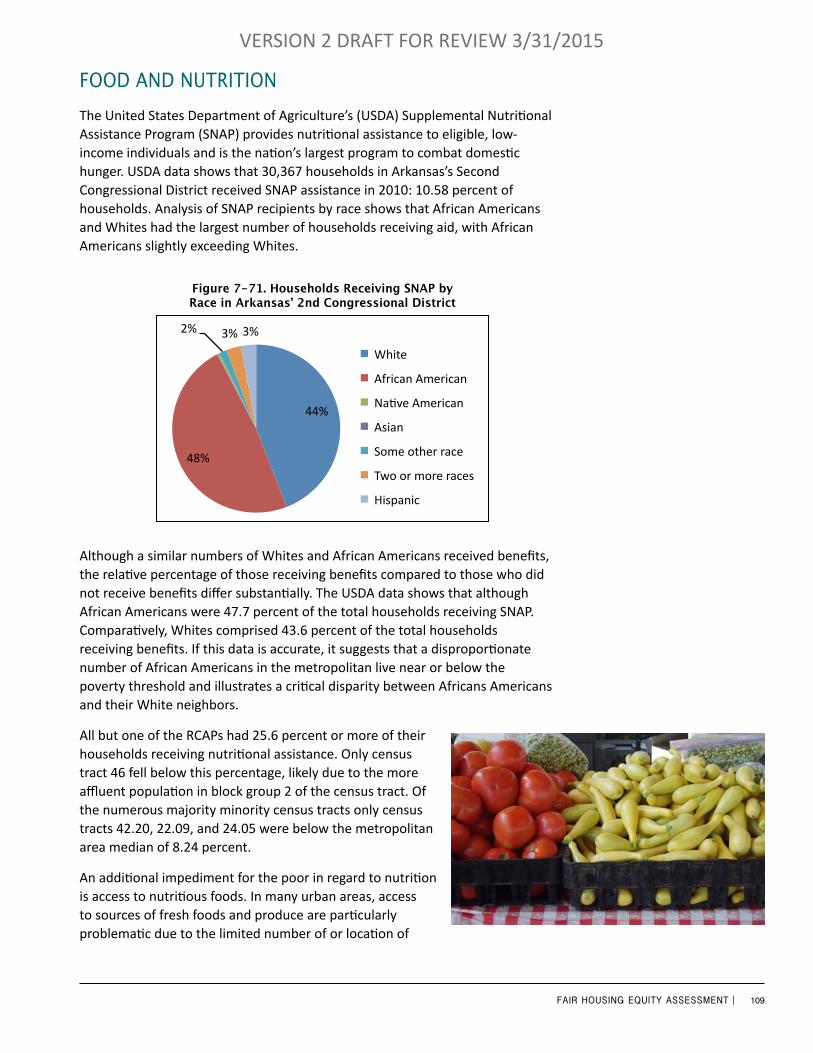
109FAIR HOUSING EQUITY ASSESSMENT |
VERSION 2 DRAFT FOR REVIEW 3/31/2015
food and nuTriTionThe United States Department of Agriculture’s (USDA) Supplemental Nutritional Assistance Program (SNAP) provides nutritional assistance to eligible, low-income individuals and is the nation’s largest program to combat domestic hunger. USDA data shows that 30,367 households in Arkansas’s Second Congressional District received SNAP assistance in 2010: 10.58 percent of households. Analysis of SNAP recipients by race shows that African Americans and Whites had the largest number of households receiving aid, with African Americans slightly exceeding Whites.
Although a similar numbers of Whites and African Americans received benefits, the relative percentage of those receiving benefits compared to those who did not receive benefits differ substantially. The USDA data shows that although African Americans were 47.7 percent of the total households receiving SNAP. Comparatively, Whites comprised 43.6 percent of the total households receiving benefits. If this data is accurate, it suggests that a disproportionate number of African Americans in the metropolitan live near or below the poverty threshold and illustrates a critical disparity between Africans Americans and their White neighbors.
All but one of the RCAPs had 25.6 percent or more of their households receiving nutritional assistance. Only census tract 46 fell below this percentage, likely due to the more affluent population in block group 2 of the census tract. Of the numerous majority minority census tracts only census tracts 42.20, 22.09, and 24.05 were below the metropolitan area median of 8.24 percent.
An additional impediment for the poor in regard to nutrition is access to nutritious foods. In many urban areas, access to sources of fresh foods and produce are particularly problematic due to the limited number of or location of
44%
48%
2% 3% 3%
Households Receiving SNAP by Race in Arkansas's 2nd Congressional District
White
African American
Na4ve American
Asian
Some other race
Two or more races
Hispanic
Figure 7-71. Households Receiving SNAP by Race in Arkansas’ 2nd Congressional District
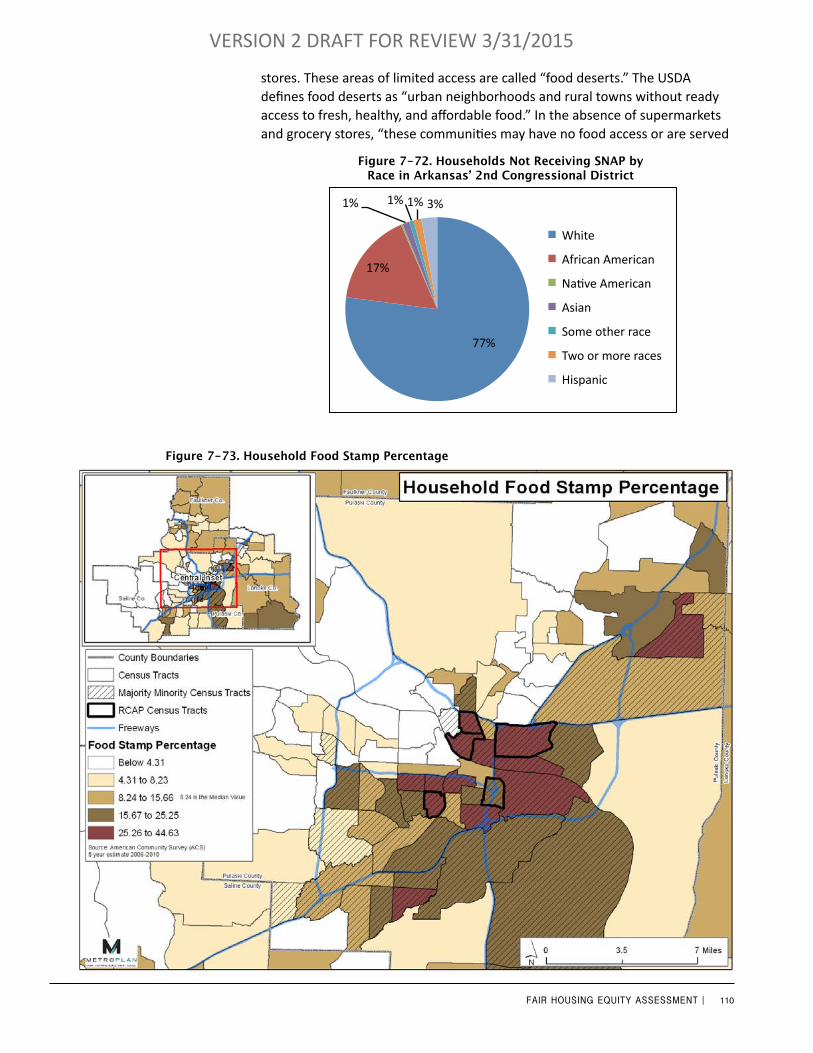
110FAIR HOUSING EQUITY ASSESSMENT |
VERSION 2 DRAFT FOR REVIEW 3/31/2015
77%
17%
1% 1% 1% 3%
Households Not Receiving SNAP by Race in 2nd Congressional District
White
African American
Na3ve American
Asian
Some other race
Two or more races
Hispanic
Figure 7-72. Households Not Receiving SNAP by Race in Arkansas’ 2nd Congressional District
stores. These areas of limited access are called “food deserts.” The USDA defines food deserts as “urban neighborhoods and rural towns without ready access to fresh, healthy, and affordable food.” In the absence of supermarkets and grocery stores, “these communities may have no food access or are served
Figure 7-73. Household Food Stamp Percentage
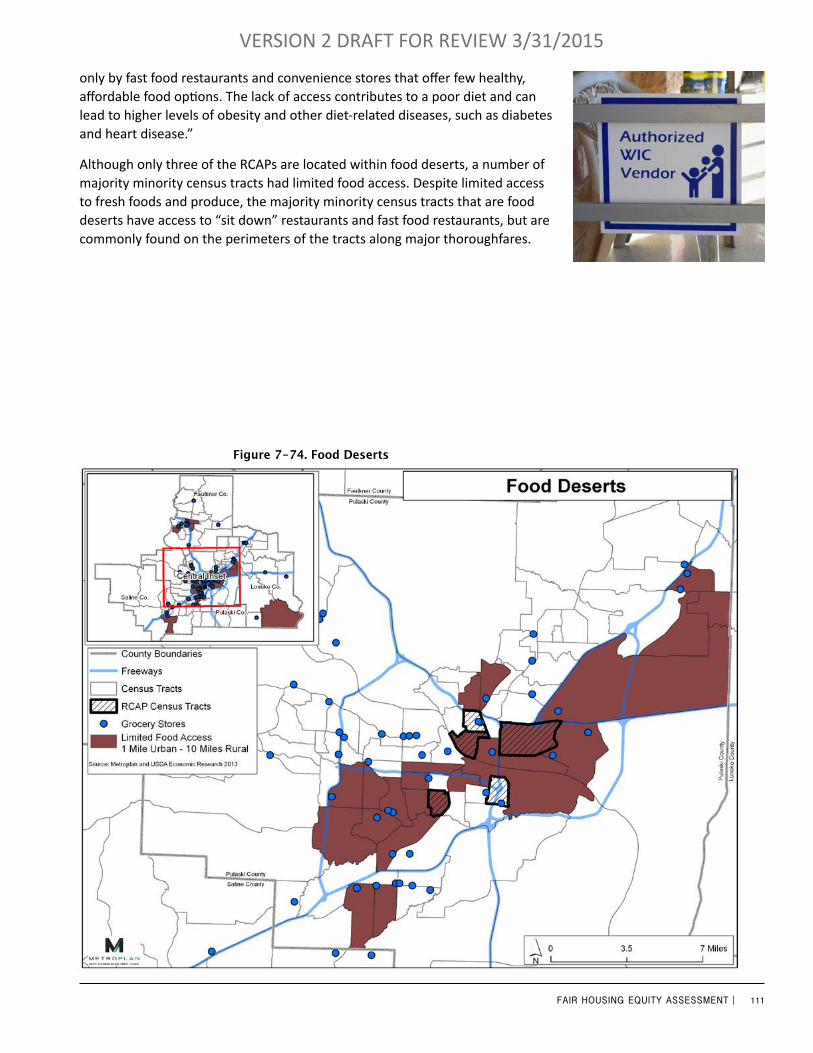
111FAIR HOUSING EQUITY ASSESSMENT |
VERSION 2 DRAFT FOR REVIEW 3/31/2015
only by fast food restaurants and convenience stores that offer few healthy, affordable food options. The lack of access contributes to a poor diet and can lead to higher levels of obesity and other diet-related diseases, such as diabetes and heart disease.”
Although only three of the RCAPs are located within food deserts, a number of majority minority census tracts had limited food access. Despite limited access to fresh foods and produce, the majority minority census tracts that are food deserts have access to “sit down” restaurants and fast food restaurants, but are commonly found on the perimeters of the tracts along major thoroughfares.
Figure 7-74. Food Deserts

112FAIR HOUSING EQUITY ASSESSMENT |
VERSION 2 DRAFT FOR REVIEW 3/31/2015
Figure 7-75. Restaurants
113FAIR HOUSING EQUITY ASSESSMENT |
VERSION 2 DRAFT FOR REVIEW 3/31/2015
Chapter 7 Sources
Randy Capps, Everett Henderson, John D. Kasarda, James H. Johnson Jr., Stephen Appold, Derrk L. Croney, Donald J. Hernandez, and Michael Fix. Withrop Rockefeller Foundation, “A Profile of Im-migrants in Arkansas Executive Summary.” (Accessed July 3, 2013). http://www.urban.org/publica-tions/411441.html.
Marc Seitles. “The Perpetuation of Residential Racial Segregation in America: Historical Discrimination, Modern forms of Exclusion, and Inclusionary Remedies”. Journal of Land Use & Environmental Law. 1996. http://www.law.fsu.edu/journals/landuse/vol141/seit.htm (Accessed on July 5, 2013).
“Measuring Segregation: Take it block by block”. The Economist. January 23, 2003 http://www.econo-mist.com/node/1551623 (Accessed on July 8, 2013).
U.S. Bureau of the Census, American Community Survey 2007–2011.Central Arkansas Regional Travel Study (2010 travel demand model powered by TransCAD)National Overall Labor Force Participation rate for Males was 70.6 percent, while the Pulaski County
Overall Labor Force Participation rate for Males was 70.5 percent, source ACS 2007–2011Arkansas Historic Preservation Program. “George D. D. Huie Grocery Store Building, North Little Rock,
Pulaski County.” http://www.arkansaspreservation.com/historic-properties/_search_nomination_popup.aspx?id=2151 (Accessed June 25, 2013).
Ding , Loni. Public Brocasting Service , “Asian American Timeline.” (Accessed June 25, 2013). http://www.pbs.org/ancestorsintheamericas/chris_1.html.
In an interview, North Little Rock Housing Authority Executive Director Ms. Belinda Snow noted that all of the tract’s public housing towers were built between 1960 and 1980, with most of the towers being erected in the late 1960s (Interviewed on August 21, 2013).
Spencer Watson. “Rockwater Rehabilitation”, Sync, Volume 6, Issue 48 (March 20, 2013), pg. 15.United States Department of Agriculture, Food and Nutrition Service (Office of Research and Analysis),
“Characteristics of SNAP Households: Arkansas Congressional District 2” (September 2011). http://www.fns.usda.gov/ora/SNAPCharacteristics/Arkansas/Arkansas_2.pdf (Accessed on August 22, 2013.)
United States Department of Agriculture, Agricultural Marketing Service, Food Deserts, http://apps.ams.usda.gov/fooddeserts/foodDeserts.aspx (Accessed on August 22, 2013).United States Department of Agriculture, Agricultural Marketing Service, Food Deserts, http://apps.ams.usda.gov/fooddeserts/foodDeserts.aspx (Accessed on August 22, 2013).Non-Legislative Commission on the Study of Landlord-Tenant Laws, Report to the Governor Mike
Beebe, President Pro Tempore of the Senate, and Speaker of the House (December 31, 2012). Ferguson, David. “Arkansas law jails tenants who don’t pay their rent.” Huffington Post, February 09,
2013. http://www.rawstory.com/rs/2013/02/09/arkansas-law-jails-tenants-who-dont-pay-their-rent/ (Accessed August 7, 2013).
Interview with Chad Strike, Executive Director, Second Chance Ranch, Wednesday, July 31, 2013.Interview with Dr. Estella Dunn Morris, Central Arkansas Veterans Healthcare System, Monday, July 15,
2013. National Alliance to End Homelessness and Homelessness Research Institute, “The State of Homelessness in America 2012.” Last modified January 2012. Accessed September 5, 2013. http://msnbcmedia.msn.com/i/MSNBC/Sections/NEWS/z-pdf-archive/homeless.pdf.
2010 Arkansas Disability & Health Chartbook, Partners for Inclusive Communities, Arkansas’ University Center for Developmental Disabilities.
Smith, Korydon H., Webb, Jennifer, and Williams, Brent T. Just Below the Line: Disability, Housing, and Equity in the South, The University of Arkansas Press, Fayetteville, AR, 2010.
Interview with Ms. Belinda Snow, August 21, 2013.Central Arkansas Regional Travel Study (2010 travel demand model powered by TransCAD)

114FAIR HOUSING EQUITY ASSESSMENT |
VERSION 2 DRAFT FOR REVIEW 3/31/2015

115FAIR HOUSING EQUITY ASSESSMENT |
VERSION 2 DRAFT FOR REVIEW 3/31/2015
“Opportunities” are community amenities that contribute to a strong neighborhood. The importance of the types of amenities varies from group to group. Young families may value a good school in the neighborhood, whereas senior citizens may value accessible health care and a close by pharmacy. Some amenities such as grocery stores and parks have high value for all groups.
Many impoverished neighborhoods lack the amenities that contribute to strong communities. Figure 7-1 shows areas in central Arkansas and access to opportunity. These amenities include access to a grocery store, pharmacy, bank, health care clinic/hospital, laundromat, a good school, day care, variety store, public housing, parks and bus service. Other factors included were below average violent crime and below median rental rates.
Three of the census tracts in central Arkansas fall into the low opportunity category. One of the census tracts is Burns Park (32.05) in North Little Rock and has no population. The census tract (32.07) adjacent to Burns Park has access to a daycare, park, bus service and lower than average violent crime. Census tract 12 is an RCAP and only has access to bus service, public housing, day care, and a
ChaPTer 8. geograPhies of oPPorTuniTy
Figure 8-1. Areas of Opportunity
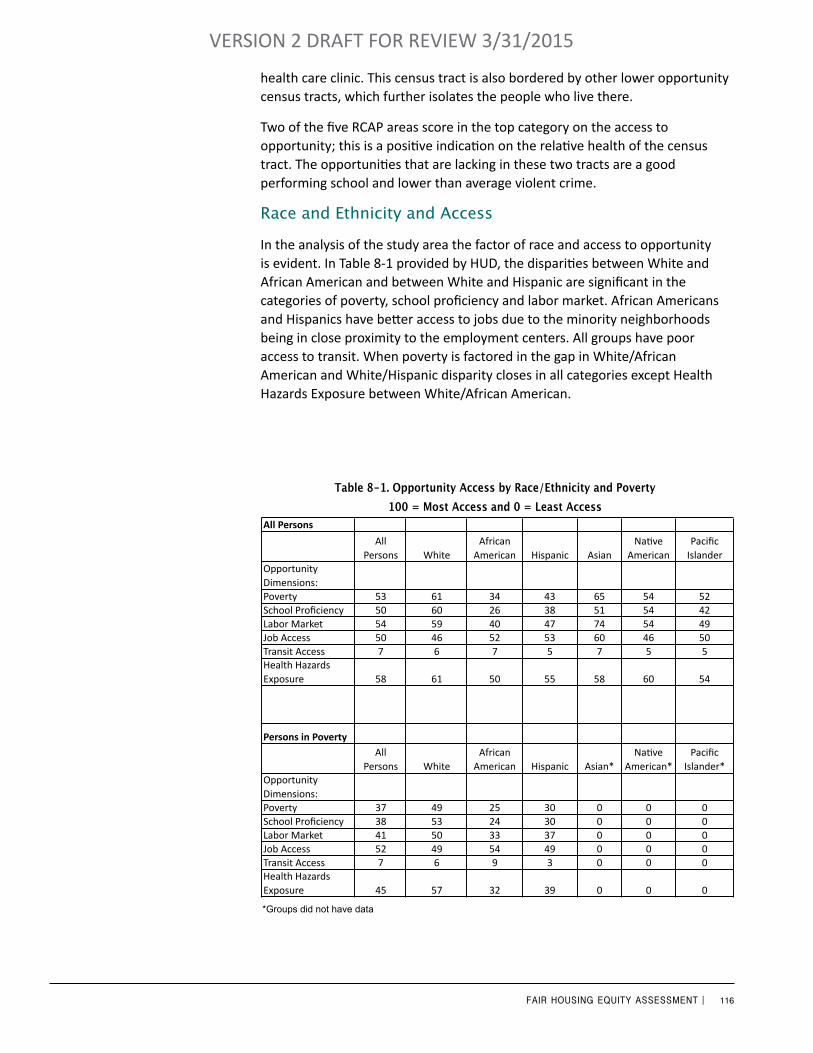
116FAIR HOUSING EQUITY ASSESSMENT |
VERSION 2 DRAFT FOR REVIEW 3/31/2015
health care clinic. This census tract is also bordered by other lower opportunity census tracts, which further isolates the people who live there.
Two of the five RCAP areas score in the top category on the access to opportunity; this is a positive indication on the relative health of the census tract. The opportunities that are lacking in these two tracts are a good performing school and lower than average violent crime.
Race and Ethnicity and Access
In the analysis of the study area the factor of race and access to opportunity is evident. In Table 8-1 provided by HUD, the disparities between White and African American and between White and Hispanic are significant in the categories of poverty, school proficiency and labor market. African Americans and Hispanics have better access to jobs due to the minority neighborhoods being in close proximity to the employment centers. All groups have poor access to transit. When poverty is factored in the gap in White/African American and White/Hispanic disparity closes in all categories except Health Hazards Exposure between White/African American.
*Groups did not have data
Table 8-1. Opportunity Access by Race/Ethnicity and Poverty100 = Most Access and 0 = Least Access
All Persons
All Persons White
African American Hispanic Asian
Na5ve American
Pacific Islander
Opportunity Dimensions:Poverty 53 61 34 43 65 54 52School Proficiency 50 60 26 38 51 54 42Labor Market 54 59 40 47 74 54 49Job Access 50 46 52 53 60 46 50Transit Access 7 6 7 5 7 5 5Health Hazards Exposure 58 61 50 55 58 60 54
Persons in PovertyAll
Persons WhiteAfrican
American Hispanic Asian*Na5ve
American*Pacific
Islander*Opportunity Dimensions:Poverty 37 49 25 30 0 0 0School Proficiency 38 53 24 30 0 0 0Labor Market 41 50 33 37 0 0 0Job Access 52 49 54 49 0 0 0Transit Access 7 6 9 3 0 0 0Health Hazards Exposure 45 57 32 39 0 0 0
*Groups did not have data
Table XXX Opportunity Access by Race/Ethnicity and Poverty100 = Most Access and 0 = Least Access
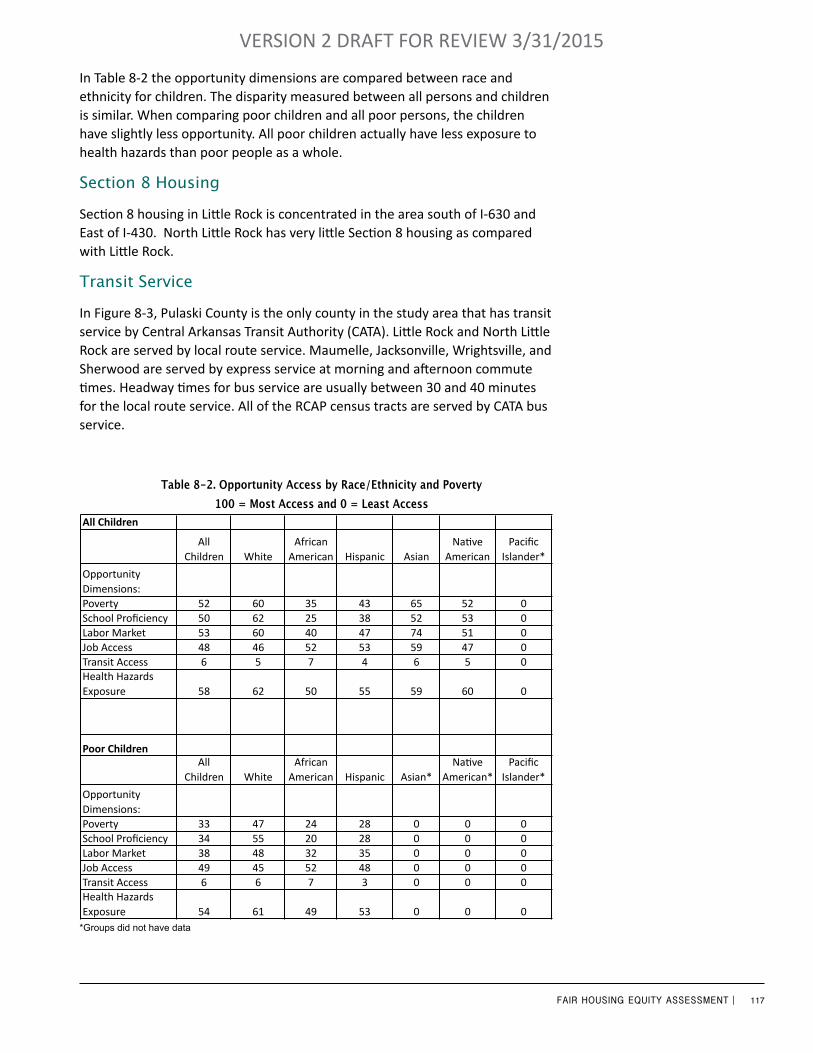
117FAIR HOUSING EQUITY ASSESSMENT |
VERSION 2 DRAFT FOR REVIEW 3/31/2015
In Table 8-2 the opportunity dimensions are compared between race and ethnicity for children. The disparity measured between all persons and children is similar. When comparing poor children and all poor persons, the children have slightly less opportunity. All poor children actually have less exposure to health hazards than poor people as a whole.
Section 8 Housing
Section 8 housing in Little Rock is concentrated in the area south of I-630 and East of I-430. North Little Rock has very little Section 8 housing as compared with Little Rock.
Transit Service
In Figure 8-3, Pulaski County is the only county in the study area that has transit service by Central Arkansas Transit Authority (CATA). Little Rock and North Little Rock are served by local route service. Maumelle, Jacksonville, Wrightsville, and Sherwood are served by express service at morning and afternoon commute times. Headway times for bus service are usually between 30 and 40 minutes for the local route service. All of the RCAP census tracts are served by CATA bus service.
All Children
All Children White
African American Hispanic Asian
Na5ve American
Pacific Islander*
Opportunity Dimensions:Poverty 52 60 35 43 65 52 0School Proficiency 50 62 25 38 52 53 0Labor Market 53 60 40 47 74 51 0Job Access 48 46 52 53 59 47 0Transit Access 6 5 7 4 6 5 0Health Hazards Exposure 58 62 50 55 59 60 0
Poor ChildrenAll
Children WhiteAfrican American Hispanic Asian*
Na5ve American*
Pacific Islander*
Opportunity Dimensions:Poverty 33 47 24 28 0 0 0School Proficiency 34 55 20 28 0 0 0Labor Market 38 48 32 35 0 0 0Job Access 49 45 52 48 0 0 0Transit Access 6 6 7 3 0 0 0Health Hazards Exposure 54 61 49 53 0 0 0
Table XXX Opportunity Access by Race/Ethnicity and Poverty for Children100 = Most Access and 0 = Least Access
*Groups did not have data
Table 8-2. Opportunity Access by Race/Ethnicity and Poverty100 = Most Access and 0 = Least Access
*Groups did not have data
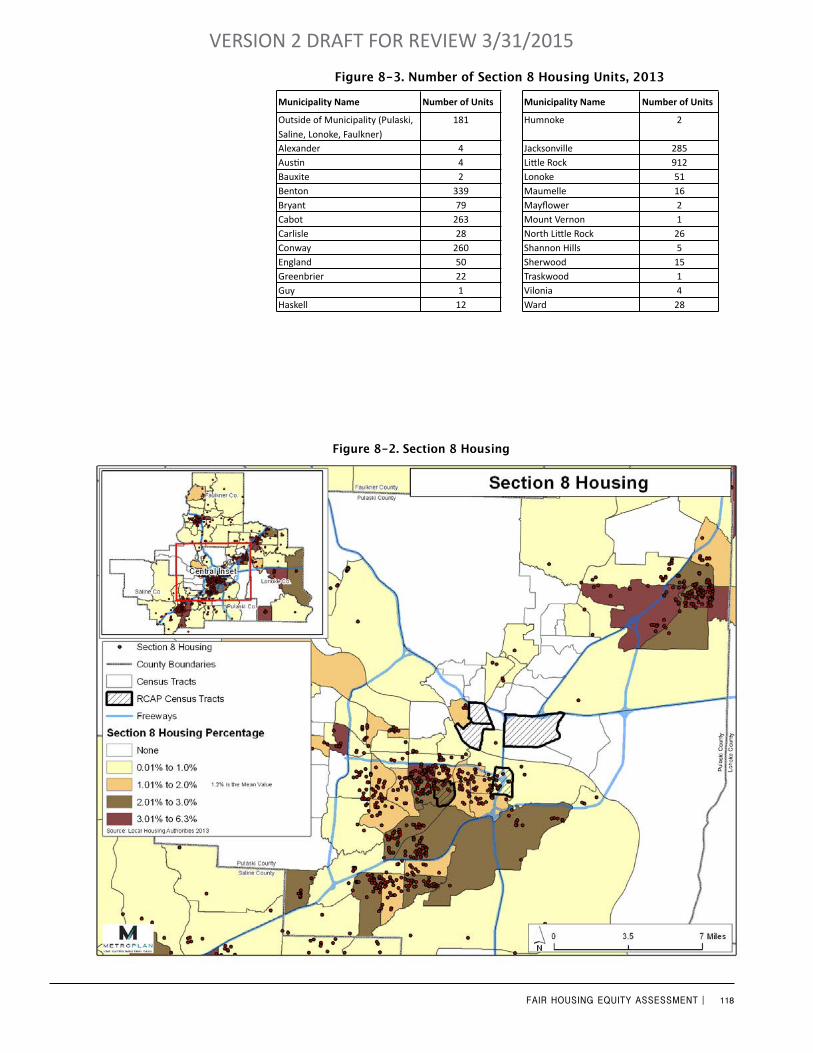
118FAIR HOUSING EQUITY ASSESSMENT |
VERSION 2 DRAFT FOR REVIEW 3/31/2015
Municipality Name Number of Units Municipality Name Number of Units
Outside of Municipality (Pulaski, Saline, Lonoke, Faulkner)
181 Humnoke 2
Alexander 4 Jacksonville 285AusFn 4 LiGle Rock 912Bauxite 2 Lonoke 51Benton 339 Maumelle 16Bryant 79 Mayflower 2Cabot 263 Mount Vernon 1Carlisle 28 North LiGle Rock 26Conway 260 Shannon Hills 5England 50 Sherwood 15Greenbrier 22 Traskwood 1Guy 1 Vilonia 4Haskell 12 Ward 28
Figure 8-3. Number of Section 8 Housing Units, 2013
Figure 8-2. Section 8 Housing
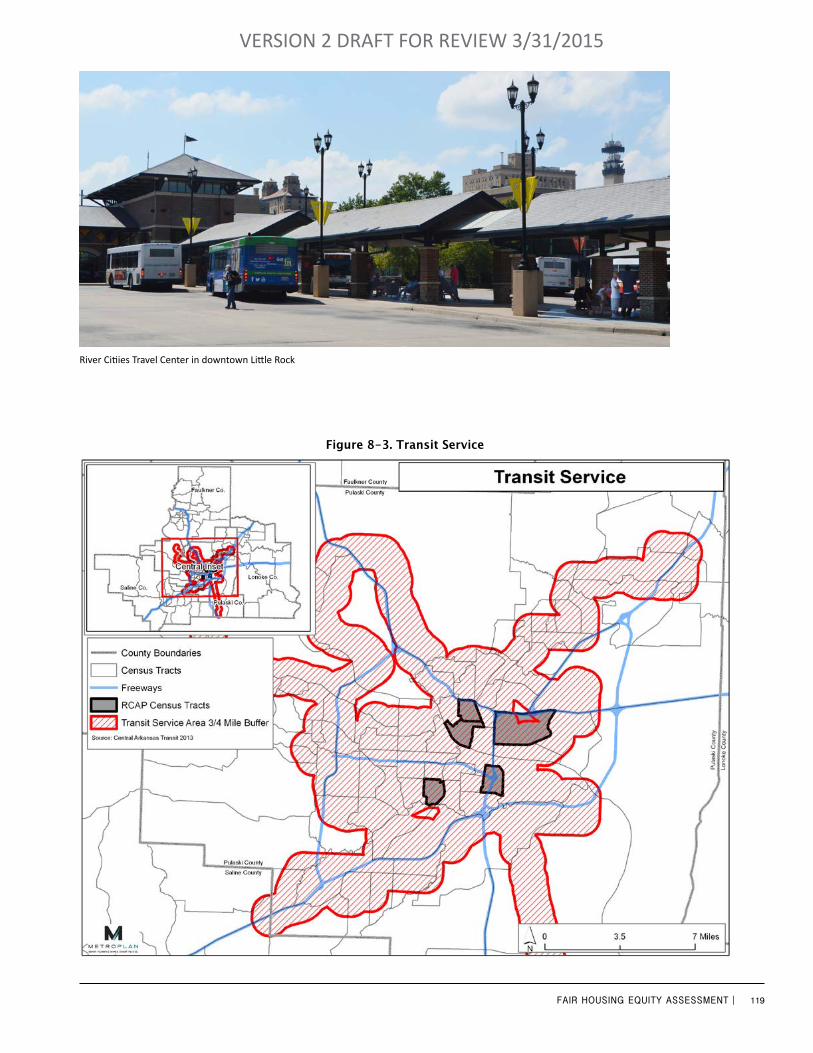
119FAIR HOUSING EQUITY ASSESSMENT |
VERSION 2 DRAFT FOR REVIEW 3/31/2015
River Citiies Travel Center in downtown Little Rock
Figure 8-3. Transit Service

120FAIR HOUSING EQUITY ASSESSMENT |
VERSION 2 DRAFT FOR REVIEW 3/31/2015
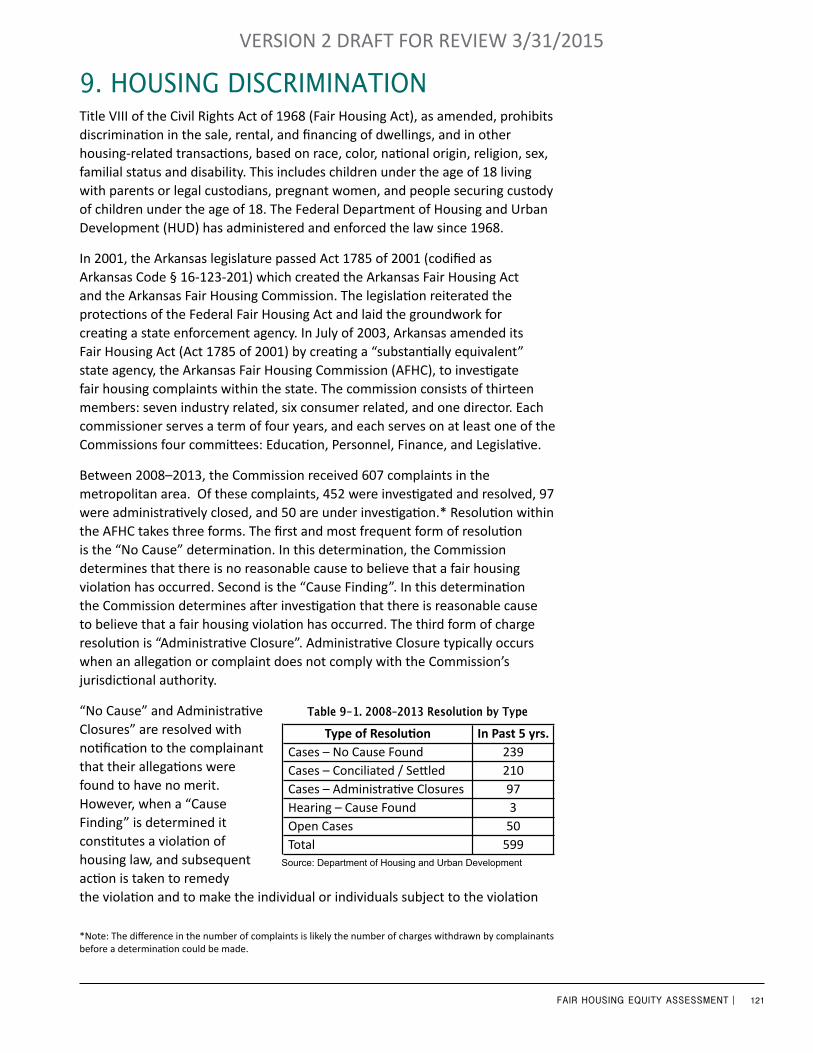
121FAIR HOUSING EQUITY ASSESSMENT |
VERSION 2 DRAFT FOR REVIEW 3/31/2015
Title VIII of the Civil Rights Act of 1968 (Fair Housing Act), as amended, prohibits discrimination in the sale, rental, and financing of dwellings, and in other housing-related transactions, based on race, color, national origin, religion, sex, familial status and disability. This includes children under the age of 18 living with parents or legal custodians, pregnant women, and people securing custody of children under the age of 18. The Federal Department of Housing and Urban Development (HUD) has administered and enforced the law since 1968.
In 2001, the Arkansas legislature passed Act 1785 of 2001 (codified as Arkansas Code § 16-123-201) which created the Arkansas Fair Housing Act and the Arkansas Fair Housing Commission. The legislation reiterated the protections of the Federal Fair Housing Act and laid the groundwork for creating a state enforcement agency. In July of 2003, Arkansas amended its Fair Housing Act (Act 1785 of 2001) by creating a “substantially equivalent” state agency, the Arkansas Fair Housing Commission (AFHC), to investigate fair housing complaints within the state. The commission consists of thirteen members: seven industry related, six consumer related, and one director. Each commissioner serves a term of four years, and each serves on at least one of the Commissions four committees: Education, Personnel, Finance, and Legislative.
Between 2008–2013, the Commission received 607 complaints in the metropolitan area. Of these complaints, 452 were investigated and resolved, 97 were administratively closed, and 50 are under investigation.* Resolution within the AFHC takes three forms. The first and most frequent form of resolution is the “No Cause” determination. In this determination, the Commission determines that there is no reasonable cause to believe that a fair housing violation has occurred. Second is the “Cause Finding”. In this determination the Commission determines after investigation that there is reasonable cause to believe that a fair housing violation has occurred. The third form of charge resolution is “Administrative Closure”. Administrative Closure typically occurs when an allegation or complaint does not comply with the Commission’s jurisdictional authority.
“No Cause” and Administrative Closures” are resolved with notification to the complainant that their allegations were found to have no merit. However, when a “Cause Finding” is determined it constitutes a violation of housing law, and subsequent action is taken to remedy the violation and to make the individual or individuals subject to the violation
9. housing disCriMinaTion
*Note: The difference in the number of complaints is likely the number of charges withdrawn by complainants before a determination could be made.
Table 9-1. 2008–2013 Resolution by Type
Type of Resolu,on In Past 5 yrs. Cases – No Cause Found 239 Cases – Conciliated / Se6led 210 Cases – Administra<ve Closures 97 Hearing – Cause Found 3 Open Cases 50 Total 599
2008 -2013 Resolution by Type
Source: Department of Housing and Urban Development

122FAIR HOUSING EQUITY ASSESSMENT |
VERSION 2 DRAFT FOR REVIEW 3/31/2015
whole. Therefore, “Cause Findings” are resolved by conciliation and settlement agreements and often involved monetary remuneration. In cases where the two parties have no meeting of the minds and cannot mutually come to a resolution, a hearing is held.
Figure 9-2. 2008–2013 Fair Housing Complaints in Metropolitan Area by Basis
Source: Department of Housing and Urban Development
0
50
100
150
200
250
300
350
400
450
Familial Status
Disability Retalia6on/ Harassment
Race Color Religion Sex Na6onal Origin
Num
ber of Com
plaints
2008 -‐ 2013 Fair Housing Complaints in Metropolitan Area by Basis
4%
25%
4% 54%
1% 10%
2%
2008 -‐ 2013 Pulaski County Fair Housing Complaints by Basis
Familial Status
Disability
Retalia6on/ Harassment
Race
Color
Religion
Sex
Na6onal Origin
Figure 9-4. 2008–2013 Pulaski County Fair Housing Complaints by Basis
Table 9-2. Number of Complaints in the Metropolitan
Area by County
Pulaski 545
Lonoke 26
Saline 19
Faulkner 14
Grant 3
Total 607
Number of Complaints in the Metropolitan Area by
County
6%
26%
3% 52%
1% 10%
2%
Complaints in the Metropolitan Area by Basis
Familial Status
Disability
Retalia7on/ Harassment
Race
Color
Religion
Sex
Na7onal Origin
Figure 9-3. 2008–2013 Number of Complaints in Metropolitan Area by Basis
90%
2% 1%
4% 3%
Number of Complaints in Metropolitan Area by by County
Pulaski
Faulkner
Grant
Lonoke
Saline
Figure 9-1. 2008–2013 Number of Complaints in Metropolitan
Area by County
90%
2% 1%
4% 3%
Number of Complaints in Metropolitan Area by by County
Pulaski
Faulkner
Grant
Lonoke
Saline 90%
2% 1%
4% 3%
Number of Complaints in Metropolitan Area by by County
Pulaski
Faulkner
Grant
Lonoke
Saline
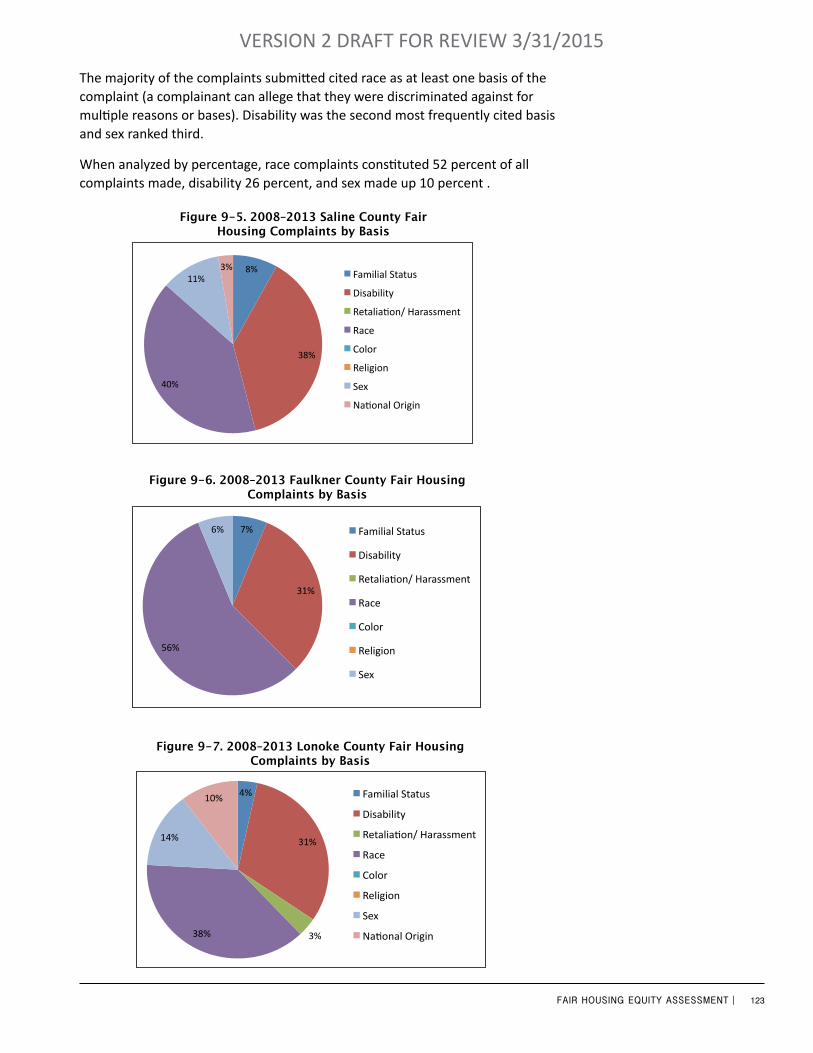
123FAIR HOUSING EQUITY ASSESSMENT |
VERSION 2 DRAFT FOR REVIEW 3/31/2015
The majority of the complaints submitted cited race as at least one basis of the complaint (a complainant can allege that they were discriminated against for multiple reasons or bases). Disability was the second most frequently cited basis and sex ranked third.
When analyzed by percentage, race complaints constituted 52 percent of all complaints made, disability 26 percent, and sex made up 10 percent .
8%
38%
40%
11% 3%
2008 -‐ 2013 Saline County Fair Housing Complaints by Basis
Familial Status
Disability
Retalia6on/ Harassment
Race
Color
Religion
Sex
Na6onal Origin
Figure 9-5. 2008–2013 Saline County Fair Housing Complaints by Basis
7%
31%
56%
6%
2008 -‐2013 Faulkner Couty Fair Housing Complaints by Basis
Familial Status
Disability
Retalia6on/ Harassment
Race
Color
Religion
Sex
Figure 9-6. 2008–2013 Faulkner County Fair Housing Complaints by Basis
4%
31%
3% 38%
14%
10%
2008 -‐ 2013 Lonoke County Fair Housing Complaints by Basis
Familial Status
Disability
Retalia6on/ Harassment
Race
Color
Religion
Sex
Na6onal Origin
Figure 9-7. 2008–2013 Lonoke County Fair Housing Complaints by Basis
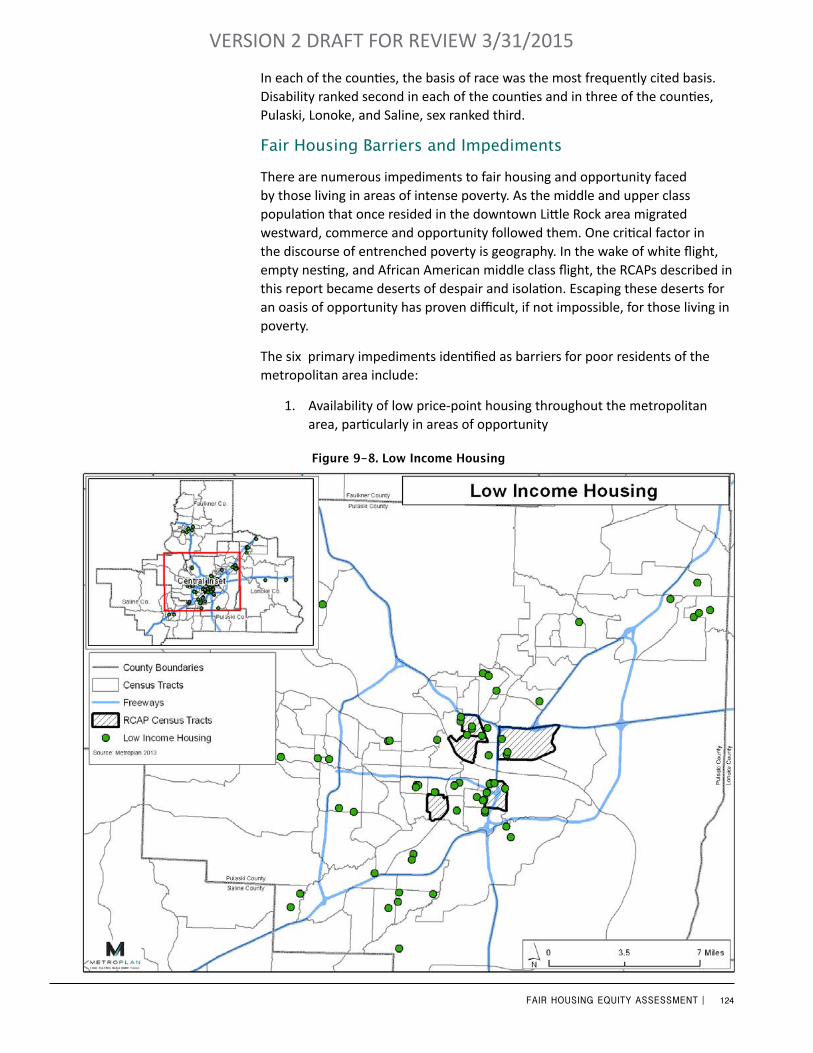
124FAIR HOUSING EQUITY ASSESSMENT |
VERSION 2 DRAFT FOR REVIEW 3/31/2015
In each of the counties, the basis of race was the most frequently cited basis. Disability ranked second in each of the counties and in three of the counties, Pulaski, Lonoke, and Saline, sex ranked third.
Fair Housing Barriers and Impediments
There are numerous impediments to fair housing and opportunity faced by those living in areas of intense poverty. As the middle and upper class population that once resided in the downtown Little Rock area migrated westward, commerce and opportunity followed them. One critical factor in the discourse of entrenched poverty is geography. In the wake of white flight, empty nesting, and African American middle class flight, the RCAPs described in this report became deserts of despair and isolation. Escaping these deserts for an oasis of opportunity has proven difficult, if not impossible, for those living in poverty.
The six primary impediments identified as barriers for poor residents of the metropolitan area include:
1. Availability of low price-point housing throughout the metropolitan area, particularly in areas of opportunity
Figure 9-8. Low Income Housing
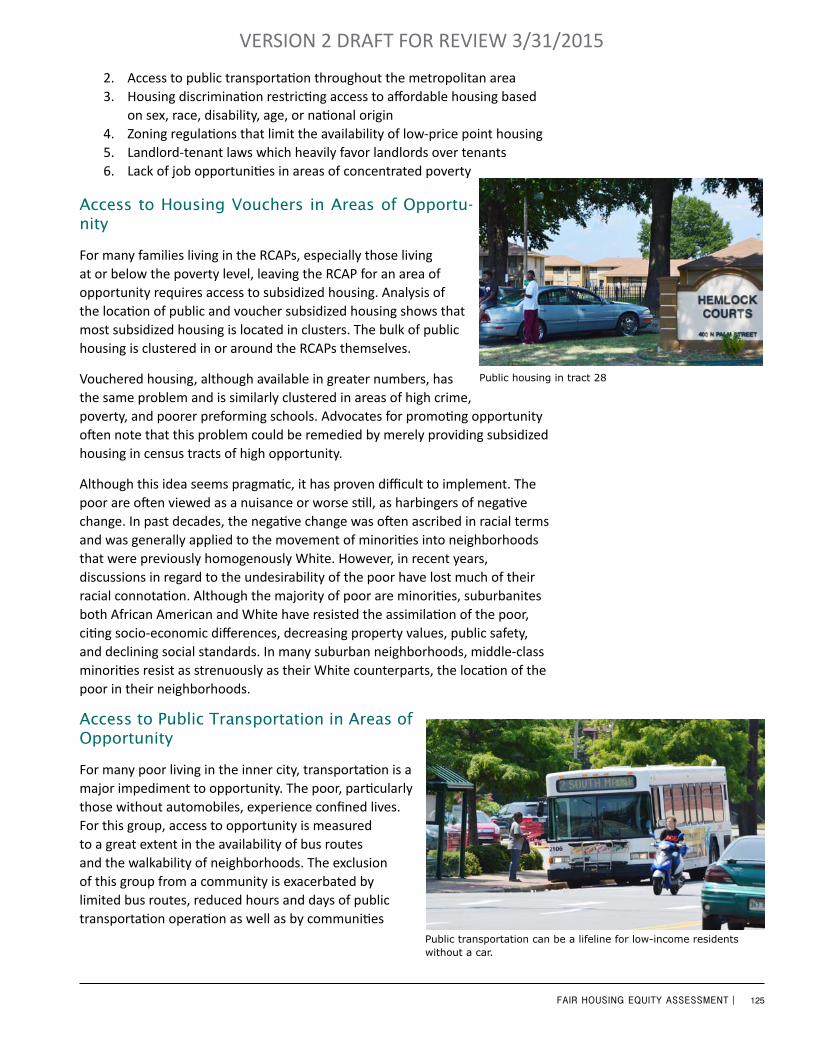
125FAIR HOUSING EQUITY ASSESSMENT |
VERSION 2 DRAFT FOR REVIEW 3/31/2015
2. Access to public transportation throughout the metropolitan area3. Housing discrimination restricting access to affordable housing based
on sex, race, disability, age, or national origin4. Zoning regulations that limit the availability of low-price point housing 5. Landlord-tenant laws which heavily favor landlords over tenants6. Lack of job opportunities in areas of concentrated poverty
Access to Housing Vouchers in Areas of Opportu-nity
For many families living in the RCAPs, especially those living at or below the poverty level, leaving the RCAP for an area of opportunity requires access to subsidized housing. Analysis of the location of public and voucher subsidized housing shows that most subsidized housing is located in clusters. The bulk of public housing is clustered in or around the RCAPs themselves.
Vouchered housing, although available in greater numbers, has the same problem and is similarly clustered in areas of high crime, poverty, and poorer preforming schools. Advocates for promoting opportunity often note that this problem could be remedied by merely providing subsidized housing in census tracts of high opportunity.
Although this idea seems pragmatic, it has proven difficult to implement. The poor are often viewed as a nuisance or worse still, as harbingers of negative change. In past decades, the negative change was often ascribed in racial terms and was generally applied to the movement of minorities into neighborhoods that were previously homogenously White. However, in recent years, discussions in regard to the undesirability of the poor have lost much of their racial connotation. Although the majority of poor are minorities, suburbanites both African American and White have resisted the assimilation of the poor, citing socio-economic differences, decreasing property values, public safety, and declining social standards. In many suburban neighborhoods, middle-class minorities resist as strenuously as their White counterparts, the location of the poor in their neighborhoods.
Access to Public Transportation in Areas of Opportunity
For many poor living in the inner city, transportation is a major impediment to opportunity. The poor, particularly those without automobiles, experience confined lives. For this group, access to opportunity is measured to a great extent in the availability of bus routes and the walkability of neighborhoods. The exclusion of this group from a community is exacerbated by limited bus routes, reduced hours and days of public transportation operation as well as by communities
Public housing in tract 28
Public transportation can be a lifeline for low-income residents without a car.

126FAIR HOUSING EQUITY ASSESSMENT |
VERSION 2 DRAFT FOR REVIEW 3/31/2015
that are not walkable due to the lack of sidewalks. For the carless poor, public transportation is a lifeline. Without it, they lose access to employment, food options, and medical care.
The availability and proximity of bus stops and the accessibility to a variety of low cost transportation alternatives is imperative to sustaining public housing and vouchered housing that is not located in the a city’s core.
Housing Discrimination in Areas of Opportunity
The Arkansas Fair Housing Commission resolved 178 housing complaints in 2010. The Director maintained that she experienced more complaints in 2010 than in 2009, and she anticipates an increase in the number of complaints in subsequent years. Despite continued and vigilant enforcement, the number of complaints has continued to increase. As long as both overt and covert discrimination exists, access to fair housing and areas of opportunity are threatened for minorities and the poor.
Figure 9-9. Sidewalks
127FAIR HOUSING EQUITY ASSESSMENT |
VERSION 2 DRAFT FOR REVIEW 3/31/2015
Exclusionary Zoning in Areas of Opportunity
In the now famous Mount Laurel decision, exclusionary zoning was defined as local zoning regulations used to sustain “enclaves of affluence of social homogeneity.” Exclusionary zoning’s most common incarnations have been single family restrictions, prohibitions on multi-family housing, minimum lot size, minimum square footage, and maximum density regulations, whether through public zoning regulations or private bills of assurance. These zoning tactics have raised housing costs in the segregated communities and have substantially worsened the problem of concentrated poverty in nearby urban cores.
The problem of segregated housing is self-perpetuating. As property values rise in the segregated areas, these areas become much more desirable places to live and the value of the neighboring undeveloped or underdeveloped property increases. To fulfill the demand for new housing in the segregated area, developers build more housing, often destroying existing housing for the poor to meet the demand. As the cycle repeats itself, the poor are left with fewer and fewer housing options and poverty is concentrated.
Nationally, some communities have actively sought to undo the effects of exclusionary zoning by adopting a mirror image approach to its reversal. The purpose of exclusionary zoning was the conscious and intentional exclusion of particular facets of the populace. Inclusionary zoning was designed to purposefully include the poor and to diffuse poverty, rather than concentrate it. Inclusionary zoning is intentionally open and typically calls for the set aside of “moderately priced units” for the disadvantaged community, increased leniency and tolerance of smaller square footage housing and alternative housing styles. Freezing or subsidizing of housing costs are also employed in an attempt to encourage socio-economic and racial diversity.
Unfair Landlord-tenant Laws
In recent years, Arkansas has been criticized for having the most unfair landlord-tenant laws in the nation. Critics of the laws maintain that they are overwhelmingly biased in favor of the landlords and point out that Arkansas is the only state that criminally charges tenants for “failures to vacate”. In 2011, the Arkansas General Assembly created a non-legislative commission on landlord-tenant laws to study, review, and provide a report of their findings and recommendations. The Commission proposed fifteen recommendations calling for the amendment of the unlawful detainer statue:
• The repeal of “civil eviction” and the criminal failure to vacate statutes
• Clarification on the issue of self-help actions, the inclusion of an implied warranty of habitability
• The prohibition of the enforcement of unconscionable leases and leases that would unfairly limit tenants, restrictions on the unreasonable access of landlords

128FAIR HOUSING EQUITY ASSESSMENT |
VERSION 2 DRAFT FOR REVIEW 3/31/2015
Chapter 9 Sources
Kennedy, Maureen, & Leonard , Paul. “Dealing with Neighborhood Change: A Primer on Gentrification and Policy Choices.” www.brookings.edu/urban.
http://www.brookings.edu/~/media/research/files/reports/2001/4/metropolitanpolicy/gentrification.pdf (Accessed November 27, 2013)
Grant, Benjamin. “What is Gentrification.” POV: Documentaries with a Point of View.” http://www.pbs.org/pov/flagwars/special_gentrification.php (Accessed November 27, 2013).
• The amendment of Arkansas’s fair housing statute to include sexual orientation
• A recommendation that a provision be added to allow victims of domestic abuse to terminate a lease early without penalties if a specific set of conditions were met.
The majorities of those living at or below the poverty level are renters and the current landlord-tenant laws make it easy for landlords to evict tenants with very little evidence. Furthermore, those evicted find themselves subject to fines and fees, and possibly even jail.
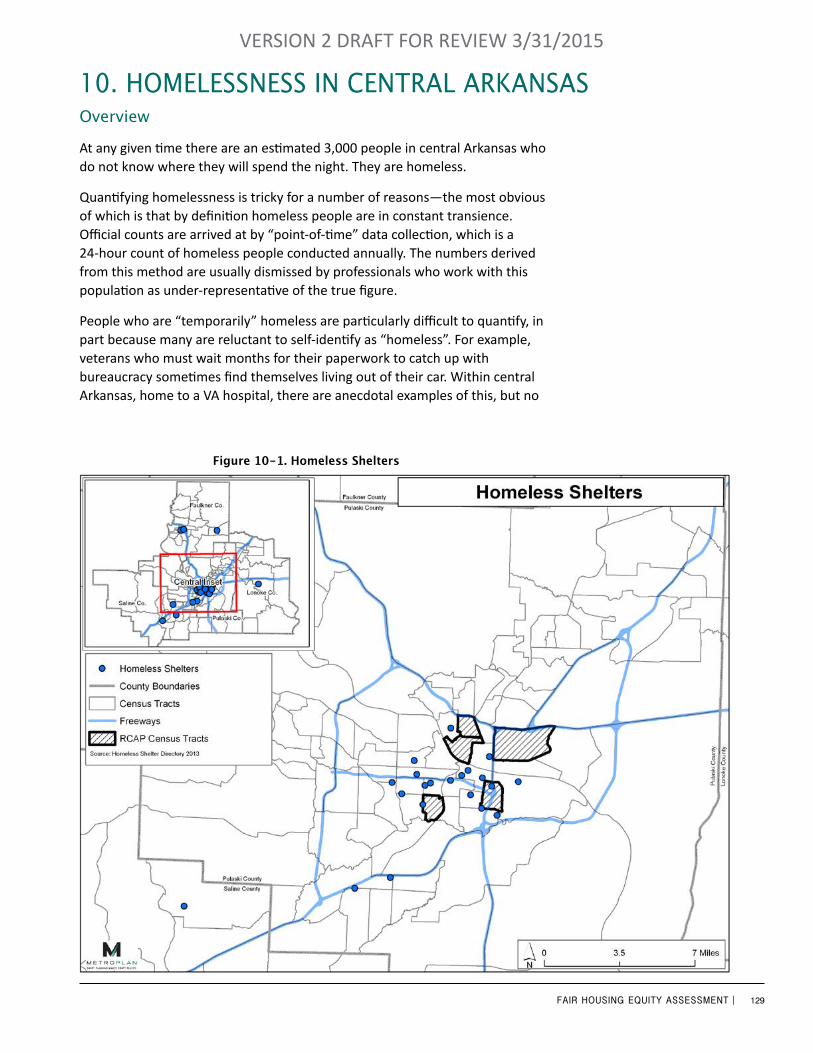
129FAIR HOUSING EQUITY ASSESSMENT |
VERSION 2 DRAFT FOR REVIEW 3/31/2015
Overview
At any given time there are an estimated 3,000 people in central Arkansas who do not know where they will spend the night. They are homeless.
Quantifying homelessness is tricky for a number of reasons—the most obvious of which is that by definition homeless people are in constant transience. Official counts are arrived at by “point-of-time” data collection, which is a 24-hour count of homeless people conducted annually. The numbers derived from this method are usually dismissed by professionals who work with this population as under-representative of the true figure.
People who are “temporarily” homeless are particularly difficult to quantify, in part because many are reluctant to self-identify as “homeless”. For example, veterans who must wait months for their paperwork to catch up with bureaucracy sometimes find themselves living out of their car. Within central Arkansas, home to a VA hospital, there are anecdotal examples of this, but no
10. hoMelessness in CenTral arkansas
Figure 10-1. Homeless Shelters
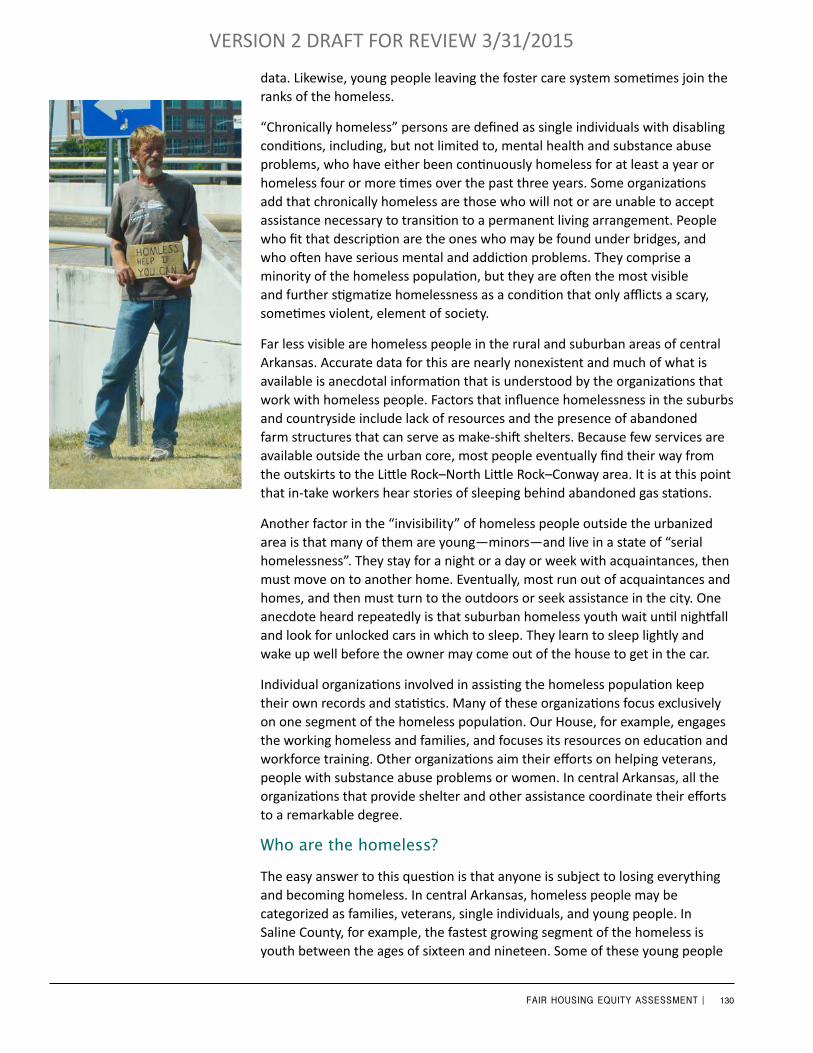
130FAIR HOUSING EQUITY ASSESSMENT |
VERSION 2 DRAFT FOR REVIEW 3/31/2015
data. Likewise, young people leaving the foster care system sometimes join the ranks of the homeless.
“Chronically homeless” persons are defined as single individuals with disabling conditions, including, but not limited to, mental health and substance abuse problems, who have either been continuously homeless for at least a year or homeless four or more times over the past three years. Some organizations add that chronically homeless are those who will not or are unable to accept assistance necessary to transition to a permanent living arrangement. People who fit that description are the ones who may be found under bridges, and who often have serious mental and addiction problems. They comprise a minority of the homeless population, but they are often the most visible and further stigmatize homelessness as a condition that only afflicts a scary, sometimes violent, element of society.
Far less visible are homeless people in the rural and suburban areas of central Arkansas. Accurate data for this are nearly nonexistent and much of what is available is anecdotal information that is understood by the organizations that work with homeless people. Factors that influence homelessness in the suburbs and countryside include lack of resources and the presence of abandoned farm structures that can serve as make-shift shelters. Because few services are available outside the urban core, most people eventually find their way from the outskirts to the Little Rock–North Little Rock–Conway area. It is at this point that in-take workers hear stories of sleeping behind abandoned gas stations.
Another factor in the “invisibility” of homeless people outside the urbanized area is that many of them are young—minors—and live in a state of “serial homelessness”. They stay for a night or a day or week with acquaintances, then must move on to another home. Eventually, most run out of acquaintances and homes, and then must turn to the outdoors or seek assistance in the city. One anecdote heard repeatedly is that suburban homeless youth wait until nightfall and look for unlocked cars in which to sleep. They learn to sleep lightly and wake up well before the owner may come out of the house to get in the car.
Individual organizations involved in assisting the homeless population keep their own records and statistics. Many of these organizations focus exclusively on one segment of the homeless population. Our House, for example, engages the working homeless and families, and focuses its resources on education and workforce training. Other organizations aim their efforts on helping veterans, people with substance abuse problems or women. In central Arkansas, all the organizations that provide shelter and other assistance coordinate their efforts to a remarkable degree.
Who are the homeless?
The easy answer to this question is that anyone is subject to losing everything and becoming homeless. In central Arkansas, homeless people may be categorized as families, veterans, single individuals, and young people. In Saline County, for example, the fastest growing segment of the homeless is youth between the ages of sixteen and nineteen. Some of these young people
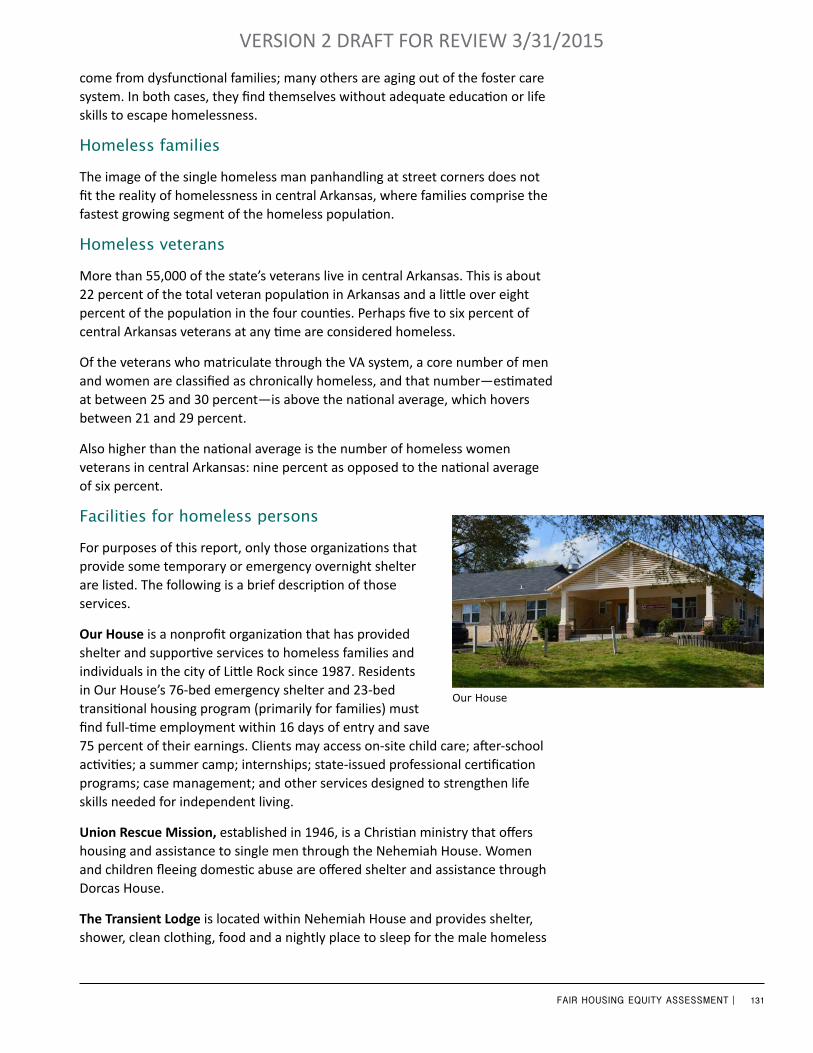
131FAIR HOUSING EQUITY ASSESSMENT |
VERSION 2 DRAFT FOR REVIEW 3/31/2015
come from dysfunctional families; many others are aging out of the foster care system. In both cases, they find themselves without adequate education or life skills to escape homelessness.
Homeless families
The image of the single homeless man panhandling at street corners does not fit the reality of homelessness in central Arkansas, where families comprise the fastest growing segment of the homeless population.
Homeless veterans
More than 55,000 of the state’s veterans live in central Arkansas. This is about 22 percent of the total veteran population in Arkansas and a little over eight percent of the population in the four counties. Perhaps five to six percent of central Arkansas veterans at any time are considered homeless.
Of the veterans who matriculate through the VA system, a core number of men and women are classified as chronically homeless, and that number—estimated at between 25 and 30 percent—is above the national average, which hovers between 21 and 29 percent.
Also higher than the national average is the number of homeless women veterans in central Arkansas: nine percent as opposed to the national average of six percent.
Facilities for homeless persons
For purposes of this report, only those organizations that provide some temporary or emergency overnight shelter are listed. The following is a brief description of those services.
Our House is a nonprofit organization that has provided shelter and supportive services to homeless families and individuals in the city of Little Rock since 1987. Residents in Our House’s 76-bed emergency shelter and 23-bed transitional housing program (primarily for families) must find full-time employment within 16 days of entry and save 75 percent of their earnings. Clients may access on-site child care; after-school activities; a summer camp; internships; state-issued professional certification programs; case management; and other services designed to strengthen life skills needed for independent living.
Union Rescue Mission, established in 1946, is a Christian ministry that offers housing and assistance to single men through the Nehemiah House. Women and children fleeing domestic abuse are offered shelter and assistance through Dorcas House.
The Transient Lodge is located within Nehemiah House and provides shelter, shower, clean clothing, food and a nightly place to sleep for the male homeless
Our House
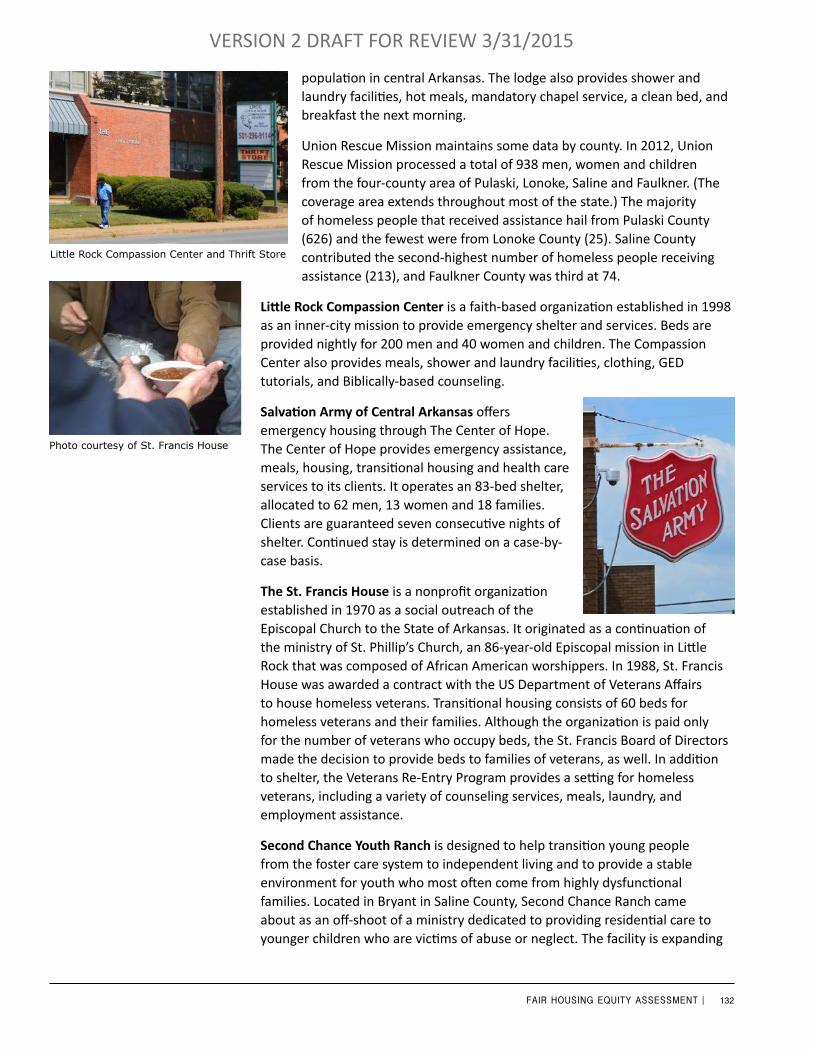
132FAIR HOUSING EQUITY ASSESSMENT |
VERSION 2 DRAFT FOR REVIEW 3/31/2015
population in central Arkansas. The lodge also provides shower and laundry facilities, hot meals, mandatory chapel service, a clean bed, and breakfast the next morning.
Union Rescue Mission maintains some data by county. In 2012, Union Rescue Mission processed a total of 938 men, women and children from the four-county area of Pulaski, Lonoke, Saline and Faulkner. (The coverage area extends throughout most of the state.) The majority of homeless people that received assistance hail from Pulaski County (626) and the fewest were from Lonoke County (25). Saline County contributed the second-highest number of homeless people receiving assistance (213), and Faulkner County was third at 74.
Little Rock Compassion Center is a faith-based organization established in 1998 as an inner-city mission to provide emergency shelter and services. Beds are provided nightly for 200 men and 40 women and children. The Compassion Center also provides meals, shower and laundry facilities, clothing, GED tutorials, and Biblically-based counseling.
Salvation Army of Central Arkansas offers emergency housing through The Center of Hope. The Center of Hope provides emergency assistance, meals, housing, transitional housing and health care services to its clients. It operates an 83-bed shelter, allocated to 62 men, 13 women and 18 families. Clients are guaranteed seven consecutive nights of shelter. Continued stay is determined on a case-by-case basis.
The St. Francis House is a nonprofit organization established in 1970 as a social outreach of the Episcopal Church to the State of Arkansas. It originated as a continuation of the ministry of St. Phillip’s Church, an 86-year-old Episcopal mission in Little Rock that was composed of African American worshippers. In 1988, St. Francis House was awarded a contract with the US Department of Veterans Affairs to house homeless veterans. Transitional housing consists of 60 beds for homeless veterans and their families. Although the organization is paid only for the number of veterans who occupy beds, the St. Francis Board of Directors made the decision to provide beds to families of veterans, as well. In addition to shelter, the Veterans Re-Entry Program provides a setting for homeless veterans, including a variety of counseling services, meals, laundry, and employment assistance.
Second Chance Youth Ranch is designed to help transition young people from the foster care system to independent living and to provide a stable environment for youth who most often come from highly dysfunctional families. Located in Bryant in Saline County, Second Chance Ranch came about as an off-shoot of a ministry dedicated to providing residential care to younger children who are victims of abuse or neglect. The facility is expanding
Photo courtesy of St. Francis House
Little Rock Compassion Center and Thrift Store
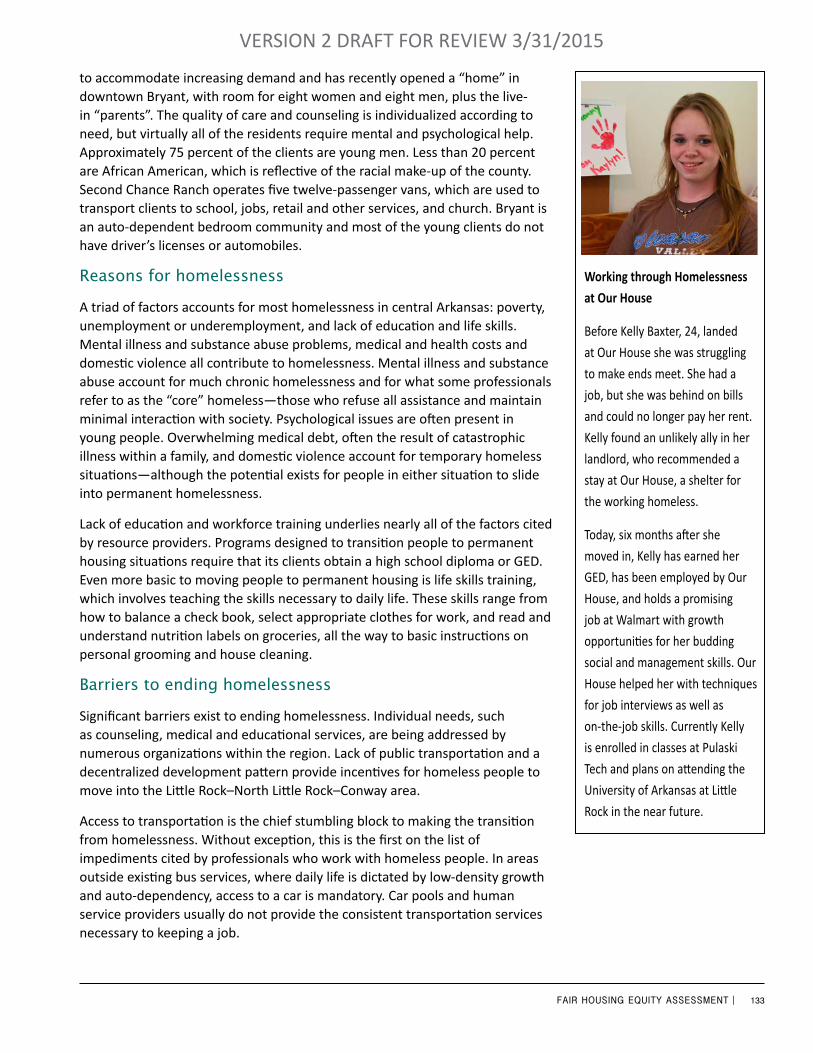
133FAIR HOUSING EQUITY ASSESSMENT |
VERSION 2 DRAFT FOR REVIEW 3/31/2015
to accommodate increasing demand and has recently opened a “home” in downtown Bryant, with room for eight women and eight men, plus the live-in “parents”. The quality of care and counseling is individualized according to need, but virtually all of the residents require mental and psychological help. Approximately 75 percent of the clients are young men. Less than 20 percent are African American, which is reflective of the racial make-up of the county. Second Chance Ranch operates five twelve-passenger vans, which are used to transport clients to school, jobs, retail and other services, and church. Bryant is an auto-dependent bedroom community and most of the young clients do not have driver’s licenses or automobiles.
Reasons for homelessness
A triad of factors accounts for most homelessness in central Arkansas: poverty, unemployment or underemployment, and lack of education and life skills. Mental illness and substance abuse problems, medical and health costs and domestic violence all contribute to homelessness. Mental illness and substance abuse account for much chronic homelessness and for what some professionals refer to as the “core” homeless—those who refuse all assistance and maintain minimal interaction with society. Psychological issues are often present in young people. Overwhelming medical debt, often the result of catastrophic illness within a family, and domestic violence account for temporary homeless situations—although the potential exists for people in either situation to slide into permanent homelessness.
Lack of education and workforce training underlies nearly all of the factors cited by resource providers. Programs designed to transition people to permanent housing situations require that its clients obtain a high school diploma or GED. Even more basic to moving people to permanent housing is life skills training, which involves teaching the skills necessary to daily life. These skills range from how to balance a check book, select appropriate clothes for work, and read and understand nutrition labels on groceries, all the way to basic instructions on personal grooming and house cleaning.
Barriers to ending homelessness
Significant barriers exist to ending homelessness. Individual needs, such as counseling, medical and educational services, are being addressed by numerous organizations within the region. Lack of public transportation and a decentralized development pattern provide incentives for homeless people to move into the Little Rock–North Little Rock–Conway area.
Access to transportation is the chief stumbling block to making the transition from homelessness. Without exception, this is the first on the list of impediments cited by professionals who work with homeless people. In areas outside existing bus services, where daily life is dictated by low-density growth and auto-dependency, access to a car is mandatory. Car pools and human service providers usually do not provide the consistent transportation services necessary to keeping a job.
Working through Homelessness
at Our House
Before Kelly Baxter, 24, landed
at Our House she was struggling
to make ends meet. She had a
job, but she was behind on bills
and could no longer pay her rent.
Kelly found an unlikely ally in her
landlord, who recommended a
stay at Our House, a shelter for
the working homeless.
Today, six months after she
moved in, Kelly has earned her
GED, has been employed by Our
House, and holds a promising
job at Walmart with growth
opportunities for her budding
social and management skills. Our
House helped her with techniques
for job interviews as well as
on-the-job skills. Currently Kelly
is enrolled in classes at Pulaski
Tech and plans on attending the
University of Arkansas at Little
Rock in the near future.
134FAIR HOUSING EQUITY ASSESSMENT |
VERSION 2 DRAFT FOR REVIEW 3/31/2015
The combination of rent and utilities plus car costs can prove overwhelming and insurmountable to people attempting to transition out of sheltered living facilities.
Fixed route bus service provided via Central Arkansas Transit Authority (CATA) and various human service agencies is primarily confined to Pulaski County. Outside Pulaski County, transit services are provided by South Central Arkansas Transit (SCAT), a program of the Central Arkansas Development Council (CADC) and with the exception of Saline County, serves counties outside the CARTS area. Human service agencies provide limited transport to their clients in Saline, Lonoke and Faulkner counties.
The more compact development in the urban areas is advantageous up to a point. Where sidewalks exist, walking and transit becomes an option for those able to walk. Biking is also a possible transportation option. For example, Our House maintains bicycles for use by its residents who are physically fit. Even so, the bus system’s frequency of service, travel times and coverage area do not always connect with employment centers or work hours, or with schools.
Conclusions
The task of providing assistance to homeless people falls largely to the cities. Although people are living without permanent addresses in all parts of central Arkansas, the availability of resources in cities impels most away from suburban and rural places and into the urbanized area. Agencies operating outside of the Little Rock–North Little Rock–Conway area often encourage individuals and families who do not have permanent shelter to relocate to places that offer better resources.
Although the causes and perpetuation of homelessness are myriad and subject to debate among policy-makers, the impediments to achieving permanent living space are not. Lack of access to transportation is responsible for marginalizing homeless people in their efforts to obtaining employment, education and a permanent living arrangement. Car ownership is beyond the means of many homeless people, both because of the expense of upkeep and the inability of many people to obtain a license. Disconnected and inaccessible infrastructure discourages walking and biking as travel options. The fixed route bus system provides much-needed service but is hampered by lack of a dedicated funding source and perennially tight operating budget.
135FAIR HOUSING EQUITY ASSESSMENT |
VERSION 2 DRAFT FOR REVIEW 3/31/2015
Chapter 10 Sources
2010 Arkansas Disability & Health Chartbook, Partners for Inclusive Communities, Arkansas’ University Center for Developmental Disabilities.
Smith, Korydon H., Webb, Jennifer, and Williams, Brent T. Just Below the Line: Disability, Housing, and Equity in the South, The University of Arkansas Press, Fayetteville, AR, 2010.
“Central Arkansas Ten-Year Plan to End Chronic Homelessness”, City of Little Rock (appointed commit-tee), 2006.
www.va.gov and Arkansas Veteran AffairsThe 2013 American Almanac of Family Homelessness. Institute for Children, Poverty & Homelessness in
the USA (ICPHUSA).Interview with Dr. William Tollett, Executive Director, Union Rescue Mission. Tuesday, June 25, 2013.Interview with Dr. Estella Dunn Morris, Central Arkansas Veterans Healthcare System. Monday, July 15,
2013.Interview with Mr. Chad Strike, Executive Director, Second Chance Ranch, Wednesday, July 31, 2013.

136FAIR HOUSING EQUITY ASSESSMENT |
VERSION 2 DRAFT FOR REVIEW 3/31/2015
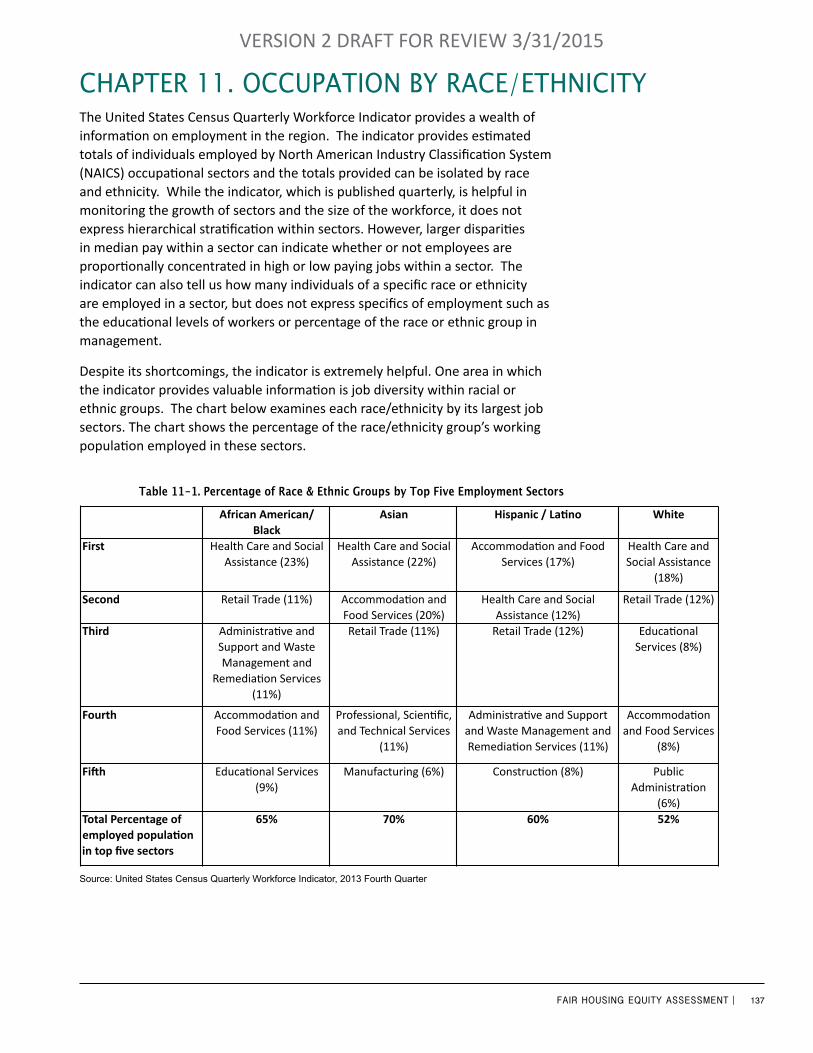
137FAIR HOUSING EQUITY ASSESSMENT |
VERSION 2 DRAFT FOR REVIEW 3/31/2015
ChaPTer 11. oCCuPaTion by raCe/eThniCiTyThe United States Census Quarterly Workforce Indicator provides a wealth of information on employment in the region. The indicator provides estimated totals of individuals employed by North American Industry Classification System (NAICS) occupational sectors and the totals provided can be isolated by race and ethnicity. While the indicator, which is published quarterly, is helpful in monitoring the growth of sectors and the size of the workforce, it does not express hierarchical stratification within sectors. However, larger disparities in median pay within a sector can indicate whether or not employees are proportionally concentrated in high or low paying jobs within a sector. The indicator can also tell us how many individuals of a specific race or ethnicity are employed in a sector, but does not express specifics of employment such as the educational levels of workers or percentage of the race or ethnic group in management.
Despite its shortcomings, the indicator is extremely helpful. One area in which the indicator provides valuable information is job diversity within racial or ethnic groups. The chart below examines each race/ethnicity by its largest job sectors. The chart shows the percentage of the race/ethnicity group’s working population employed in these sectors.
African American/ Black
Asian Hispanic / La3no White
First Health Care and Social Assistance (23%)
Health Care and Social Assistance (22%)
Accommoda8on and Food Services (17%)
Health Care and Social Assistance
(18%)
Second Retail Trade (11%) Accommoda8on and Food Services (20%)
Health Care and Social Assistance (12%)
Retail Trade (12%)
Fourth Accommoda8on and Food Services (11%)
Professional, Scien8fic, and Technical Services
(11%)
Administra8ve and Support and Waste Management and Remedia8on Services (11%)
Accommoda8on and Food Services
(8%)
Fi<h Educa8onal Services (9%)
Manufacturing (6%) Construc8on (8%) Public Administra8on
(6%)
Source: United States Census Quarterly Workforce Indicator, 2013 Fourth Quarter
Third Administra8ve and Support and Waste Management and
Remedia8on Services (11%)
Total Percentage of employed popula3on in top five sectors
65% 70% 60% 52%
Retail Trade (11%) Retail Trade (12%) Educa8onal Services (8%)
Percentage of Race & Ethnic Groups by Top Five Employment Sectors Table 11-1. Percentage of Race & Ethnic Groups by Top Five Employment Sectors
Source: United States Census Quarterly Workforce Indicator, 2013 Fourth Quarter

138FAIR HOUSING EQUITY ASSESSMENT |
VERSION 2 DRAFT FOR REVIEW 3/31/2015
The data shows that nearly a quarter (23%) of African Americans and more than one in five Asians (22%) in the metropolitan area were employed in the Health Care and Social Assistance sector, despite this apparent similarity, there is a sizable disparity in median incomes between the two groups. This disparity may well indicate differences in wages and differing percentages of individuals in management positions within these groups. African Americans in the sector may be disproportionately represented among the sectors lowest paying positions (kitchen and janitorial staff and nurses’ aides); while Asians may be disproportionately represented in the sectors highest paying jobs (physicians, researchers, and high ranking administrators).
Median wage data shows substantial disparity in median pay by race/ethnicity within the sector. African Americans working in the sector earned a median monthly wage of $2,569, nearly half that of White workers ($4,744) and less than a third of the median monthly pay of Asians ($9,203). This disparity affirms that a disproportionately high percentage of African American workers within the sector are likely working in non-management, non-professional, low paying jobs. Although considered a high growth and high pay sector, African American participation in the sector is clearly different from that of Whites and Asians.
In three of the race/ethnic groups (African Americans, Asians, and Whites), the Health Care Sector ranked first in employment participation and in the fourth group (Hispanics/ Latinos) the sector ranked second. The frequency and placement of the sector underscore its importance to the region and clearly delineate it as one of most important employment sectors in the metropolitan area. Like the Health Sector, Accommodation and Food Services and the Retail Trade sectors also are found in each race/ ethnic groups’ top five.
Source: United States Census Quarterly Workforce Indicator, 2013 Fourth Quarter
Figure 11-1. Median Income by Race/Ethnicity in the Health Care and Social Assistance Sector
$0.00 $1,000.00 $2,000.00 $3,000.00 $4,000.00 $5,000.00 $6,000.00 $7,000.00 $8,000.00 $9,000.00
$10,000.00
Health Care and Social Assistance
Median Income by Race/Ethnicity in the Health Care and Social Assistance Sector
White Alone
Black or African American Alone
American Indian or Alaska NaFve Alone
Asian Alone
Hispanic or LaFno Med
ian
Mon
thly
Ear
ning
s

139FAIR HOUSING EQUITY ASSESSMENT |
VERSION 2 DRAFT FOR REVIEW 3/31/2015
Source: United States Census Quarterly Workforce Indicator, 2013 Fourth Quarter
Figure 11-2. Employment Sectors with the Highest Share of Regional Employment
Despite the key importance of these sectors to the region, median wages for African Americans and Hispanics within many of the sectors are precariously close to minimum wage. The lowest paying of the high employment sectors were the Retail Trade and the Accommodation and Food Services sectors. Despite having the lowest wages, these sectors had some of the smallest variances in monthly median earnings by race. This homogeneity in monthly earnings is likely a reflection of the homogenously similar levels of education attainment and experience of those working within the sectors. The percentage of regional workers in these sectors suggests that even a modest elevation in the minimum wage can make a sizable difference in the lives of Central Arkansans. Twenty-two percent (22%) of African Americans, thirty-one percent (31%) of Asians, twenty-nine percent (29%) of Hispanics, and twenty percent (20%) of the region’s Whites are employed in the two sectors.
$0.00
$1,000.00
$2,000.00
$3,000.00
$4,000.00
$5,000.00
$6,000.00
$7,000.00
$8,000.00
$9,000.00
$10,000.00
Retail Trade Administra<ve and Support and Waste Management and Remedia<on Services
Educa<onal Services Health Care and Social Assistance
Accommoda<on and Food Services
Employment Sectors with Highest share of Regional Employment
White Alone
Black or African American Alone
Asian Alone
Hispanic or La<no
Med
ian
Mon
thly
Ear
ning
s
$0.00
$1,000.00
$2,000.00
$3,000.00
$4,000.00
$5,000.00
$6,000.00
$7,000.00
$8,000.00
$9,000.00
$10,000.00
Retail Trade Administra<ve and Support and Waste Management and Remedia<on Services
Educa<onal Services Health Care and Social Assistance
Accommoda<on and Food Services
Employment Sectors with Highest share of Regional Employment
White Alone
Black or African American Alone
Asian Alone
Hispanic or La<no
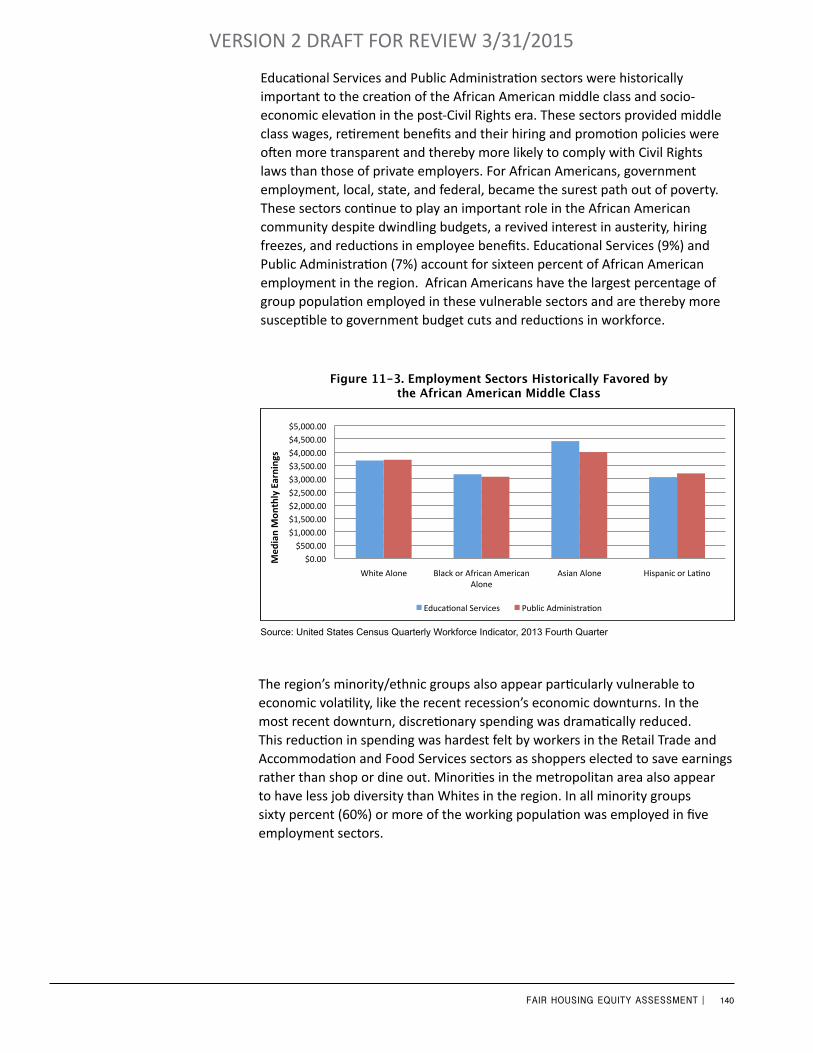
140FAIR HOUSING EQUITY ASSESSMENT |
VERSION 2 DRAFT FOR REVIEW 3/31/2015
Educational Services and Public Administration sectors were historically important to the creation of the African American middle class and socio-economic elevation in the post-Civil Rights era. These sectors provided middle class wages, retirement benefits and their hiring and promotion policies were often more transparent and thereby more likely to comply with Civil Rights laws than those of private employers. For African Americans, government employment, local, state, and federal, became the surest path out of poverty. These sectors continue to play an important role in the African American community despite dwindling budgets, a revived interest in austerity, hiring freezes, and reductions in employee benefits. Educational Services (9%) and Public Administration (7%) account for sixteen percent of African American employment in the region. African Americans have the largest percentage of group population employed in these vulnerable sectors and are thereby more susceptible to government budget cuts and reductions in workforce.
The region’s minority/ethnic groups also appear particularly vulnerable to economic volatility, like the recent recession’s economic downturns. In the most recent downturn, discretionary spending was dramatically reduced. This reduction in spending was hardest felt by workers in the Retail Trade and Accommodation and Food Services sectors as shoppers elected to save earnings rather than shop or dine out. Minorities in the metropolitan area also appear to have less job diversity than Whites in the region. In all minority groups sixty percent (60%) or more of the working population was employed in five employment sectors.
Source: United States Census Quarterly Workforce Indicator, 2013 Fourth Quarter
Figure 11-3. Employment Sectors Historically Favored by the African American Middle Class
$0.00
$500.00
$1,000.00
$1,500.00
$2,000.00
$2,500.00
$3,000.00
$3,500.00
$4,000.00
$4,500.00
$5,000.00
White Alone Black or African American Alone
Asian Alone Hispanic or La?no
Employment Sectors Historically favored by the African American Middle Class
Educa?onal Services Public Administra?on
Med
ian
Mon
thly
Ear
ning
s
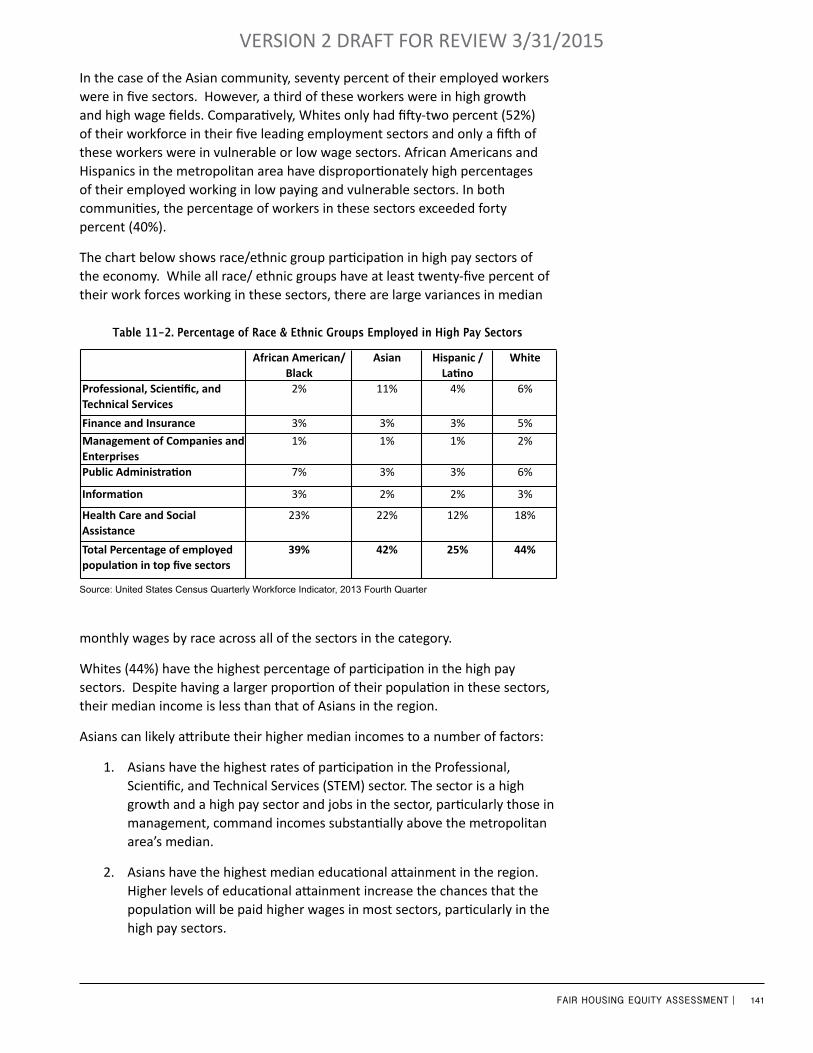
141FAIR HOUSING EQUITY ASSESSMENT |
VERSION 2 DRAFT FOR REVIEW 3/31/2015
Table 11-2. Percentage of Race & Ethnic Groups Employed in High Pay Sectors
Source: United States Census Quarterly Workforce Indicator, 2013 Fourth Quarter
In the case of the Asian community, seventy percent of their employed workers were in five sectors. However, a third of these workers were in high growth and high wage fields. Comparatively, Whites only had fifty-two percent (52%) of their workforce in their five leading employment sectors and only a fifth of these workers were in vulnerable or low wage sectors. African Americans and Hispanics in the metropolitan area have disproportionately high percentages of their employed working in low paying and vulnerable sectors. In both communities, the percentage of workers in these sectors exceeded forty percent (40%).
The chart below shows race/ethnic group participation in high pay sectors of the economy. While all race/ ethnic groups have at least twenty-five percent of their work forces working in these sectors, there are large variances in median
African American/ Black
Asian Hispanic / La3no
White
Professional, Scien3fic, and Technical Services
2% 11% 4% 6%
Finance and Insurance 3% 3% 3% 5%
Management of Companies and Enterprises
1% 1% 1% 2%
Public Administra3on 7% 3% 3% 6%
Informa3on 3% 2% 2% 3%
Health Care and Social Assistance
23% 22% 12% 18%
Percentage of Race & Ethnic Groups Employed in High Pay Sectors
Source: United States Census Quarterly Workforce Indicator, 2013 Fourth Quarter
Total Percentage of employed popula3on in top five sectors
39% 42% 25% 44%
monthly wages by race across all of the sectors in the category.
Whites (44%) have the highest percentage of participation in the high pay sectors. Despite having a larger proportion of their population in these sectors, their median income is less than that of Asians in the region.
Asians can likely attribute their higher median incomes to a number of factors:
1. Asians have the highest rates of participation in the Professional, Scientific, and Technical Services (STEM) sector. The sector is a high growth and a high pay sector and jobs in the sector, particularly those in management, command incomes substantially above the metropolitan area’s median.
2. Asians have the highest median educational attainment in the region. Higher levels of educational attainment increase the chances that the population will be paid higher wages in most sectors, particularly in the high pay sectors.
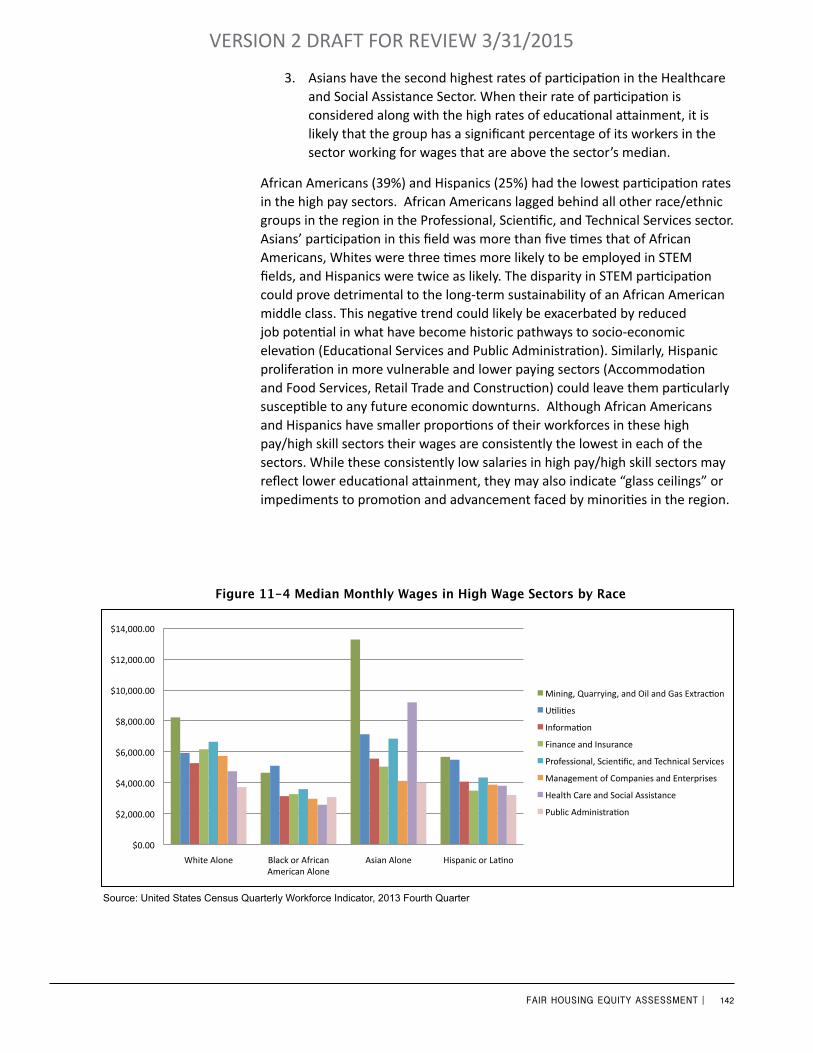
142FAIR HOUSING EQUITY ASSESSMENT |
VERSION 2 DRAFT FOR REVIEW 3/31/2015
3. Asians have the second highest rates of participation in the Healthcare and Social Assistance Sector. When their rate of participation is considered along with the high rates of educational attainment, it is likely that the group has a significant percentage of its workers in the sector working for wages that are above the sector’s median.
African Americans (39%) and Hispanics (25%) had the lowest participation rates in the high pay sectors. African Americans lagged behind all other race/ethnic groups in the region in the Professional, Scientific, and Technical Services sector. Asians’ participation in this field was more than five times that of African Americans, Whites were three times more likely to be employed in STEM fields, and Hispanics were twice as likely. The disparity in STEM participation could prove detrimental to the long-term sustainability of an African American middle class. This negative trend could likely be exacerbated by reduced job potential in what have become historic pathways to socio-economic elevation (Educational Services and Public Administration). Similarly, Hispanic proliferation in more vulnerable and lower paying sectors (Accommodation and Food Services, Retail Trade and Construction) could leave them particularly susceptible to any future economic downturns. Although African Americans and Hispanics have smaller proportions of their workforces in these high pay/high skill sectors their wages are consistently the lowest in each of the sectors. While these consistently low salaries in high pay/high skill sectors may reflect lower educational attainment, they may also indicate “glass ceilings” or impediments to promotion and advancement faced by minorities in the region.
Source: United States Census Quarterly Workforce Indicator, 2013 Fourth Quarter
Figure 11-4 Median Monthly Wages in High Wage Sectors by Race
$0.00
$2,000.00
$4,000.00
$6,000.00
$8,000.00
$10,000.00
$12,000.00
$14,000.00
White Alone Black or African American Alone
Asian Alone Hispanic or La?no
Median Monthly Wages in High Wage Sectors by Race
Mining, Quarrying, and Oil and Gas Extrac?on
U?li?es
Informa?on
Finance and Insurance
Professional, Scien?fic, and Technical Services
Management of Companies and Enterprises
Health Care and Social Assistance
Public Administra?on

143FAIR HOUSING EQUITY ASSESSMENT |
VERSION 2 DRAFT FOR REVIEW 3/31/2015
A long-term strategy to boost African American and Hispanic median wages, increase workforce participation, and provide more economic resiliency during periods of economic hardship should include efforts to increase educational attainment particularly in high growth and high pay sectors and to promote broadening of participation in non-traditional high pay sectors. Although this long-term strategy appears prudent and plausible, its success relies on a number of factors which are beyond the control of the groups employing it. First, there must be sustained growth in the sectors for which the populace is being educated. Second, the education and work-related experience that the populace gains must be on par with or surpass that of comparable job candidates recruited from outside of the region. Third, there must be no economic advantage to hire candidates from outside of the region. Lastly, there should be no bias or discrimination which impedes the African American and Hispanic job candidates from entering the sector with comparable entry-level wages and benefits. The long-term success of the strategy will also require that no similar barriers prohibit or impede the future promotion of these candidates.
The participation and the wages of undocumented workers, in the Hispanic and Asian communities, should not go without consideration. The numbers of workers in Agriculture, Wholesale Trade, Construction and Accommodation and Food Services may be highly skewed when the labor of undocumented workers, much of which garners lower than minimum wage, is considered.
There are a number of activities and programs which could be employed to expedite and enhance African American and Hispanic participation in these fields:
1. Promote and provide early and sustained exposure to STEM education to low income children
2. Promote and provide summer programs which focus on STEM fields3. Early identification of the youth that show interest and promise in STEM
fields4. Mentorship and homework assistance 5. College recruitment and incentivizing students to remain in the region
post-graduation6. Internships in STEM fields7. Recruitment in STEM fields and incentivizing the hiring of central
Arkansans
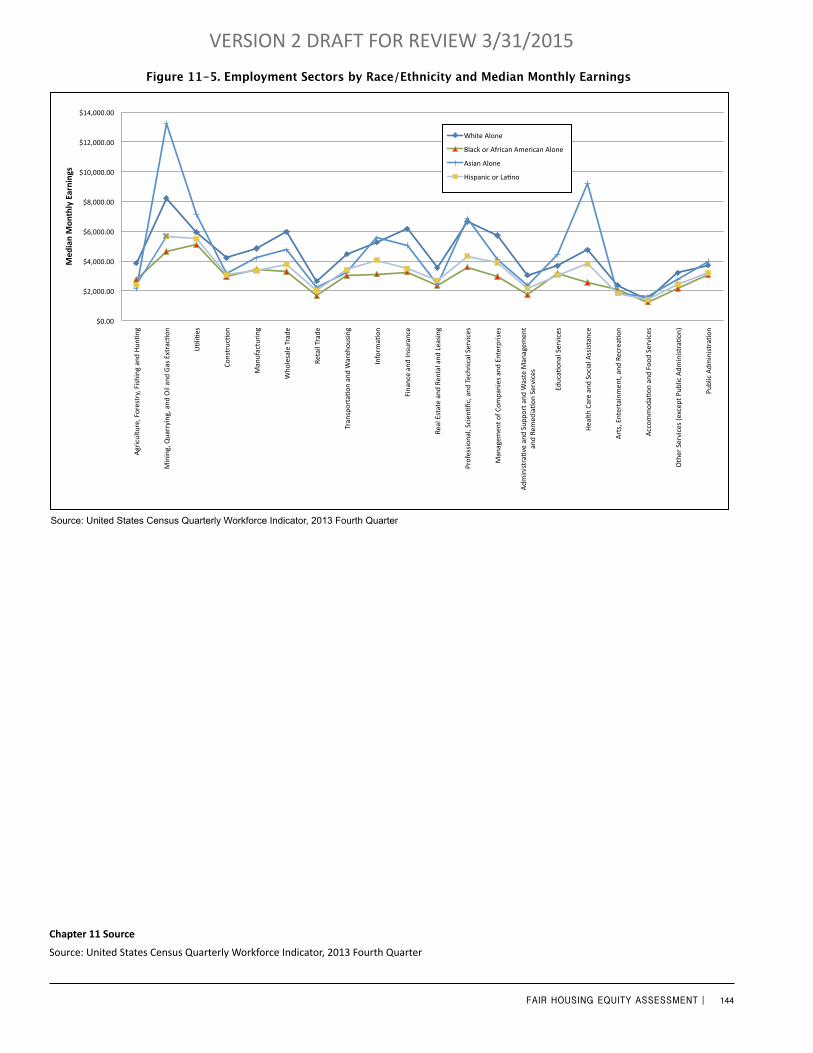
144FAIR HOUSING EQUITY ASSESSMENT |
VERSION 2 DRAFT FOR REVIEW 3/31/2015
Source: United States Census Quarterly Workforce Indicator, 2013 Fourth Quarter
Figure 11-5. Employment Sectors by Race/Ethnicity and Median Monthly Earnings
$0.00
$2,000.00
$4,000.00
$6,000.00
$8,000.00
$10,000.00
$12,000.00
$14,000.00
Agriculture, Forestry, Fishing and Hun=ng
Mining, Quarrying, and Oil and Gas Extrac=on
U=li=es
Construc=on
Manufacturing
Wholesale Trade
Retail Trade
Transporta=on and Warehousing
Informa=on
Finance and Insurance
Real Estate and Rental and Leasing
Professional, Scien=fic, and Technical Services
Management of Companies and Enterprises
Administra=ve and Support and Waste Management
and Remedia=on Services
Educa=onal Services
Health Care and Social Assistance
Arts, Entertainment, and Recrea=on
Accommoda=on and Food Services
Other Services (except Public Administra=on)
Public Administra=on
Med
ian Mon
thly Earnings
Employment Sectors by Race/Ethnicity and Median Monthly Earnings
White Alone
Black or African American Alone
Asian Alone
Hispanic or La=no
Chapter 11 Source
Source: United States Census Quarterly Workforce Indicator, 2013 Fourth Quarter
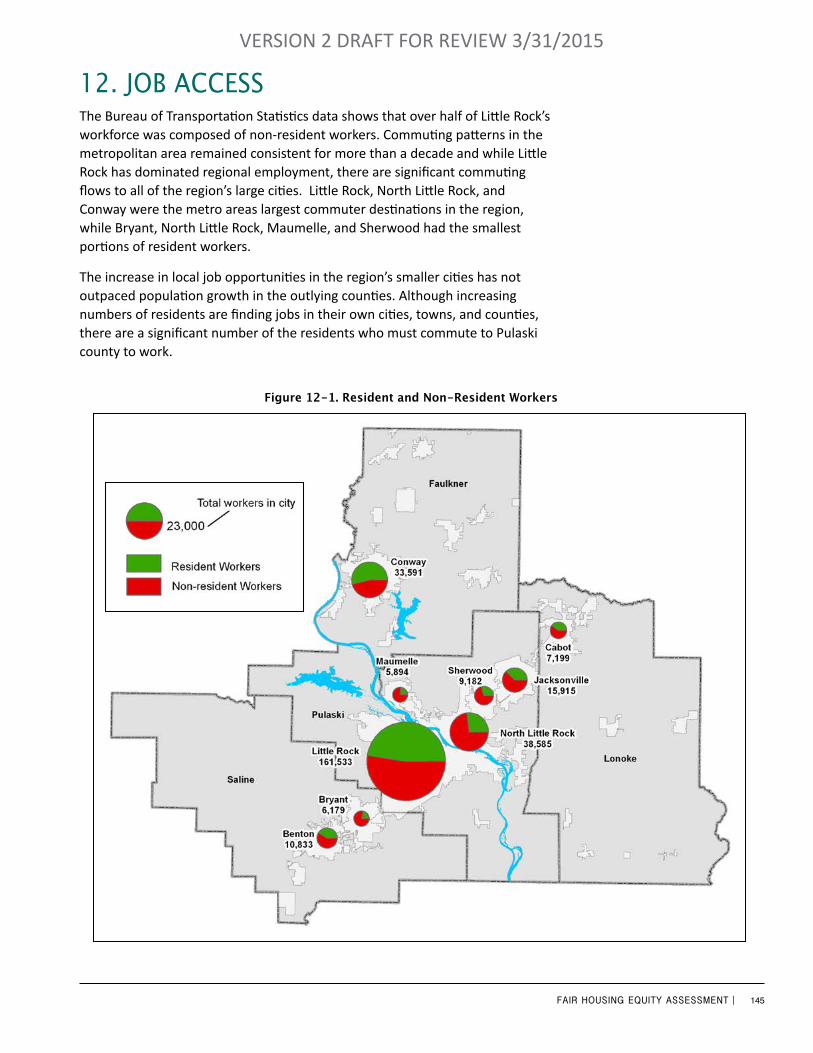
145FAIR HOUSING EQUITY ASSESSMENT |
VERSION 2 DRAFT FOR REVIEW 3/31/2015
The Bureau of Transportation Statistics data shows that over half of Little Rock’s workforce was composed of non-resident workers. Commuting patterns in the metropolitan area remained consistent for more than a decade and while Little Rock has dominated regional employment, there are significant commuting flows to all of the region’s large cities. Little Rock, North Little Rock, and Conway were the metro areas largest commuter destinations in the region, while Bryant, North Little Rock, Maumelle, and Sherwood had the smallest portions of resident workers.
The increase in local job opportunities in the region’s smaller cities has not outpaced population growth in the outlying counties. Although increasing numbers of residents are finding jobs in their own cities, towns, and counties, there are a significant number of the residents who must commute to Pulaski county to work.
12. Job aCCess
Figure 12-1. Resident and Non-Resident Workers
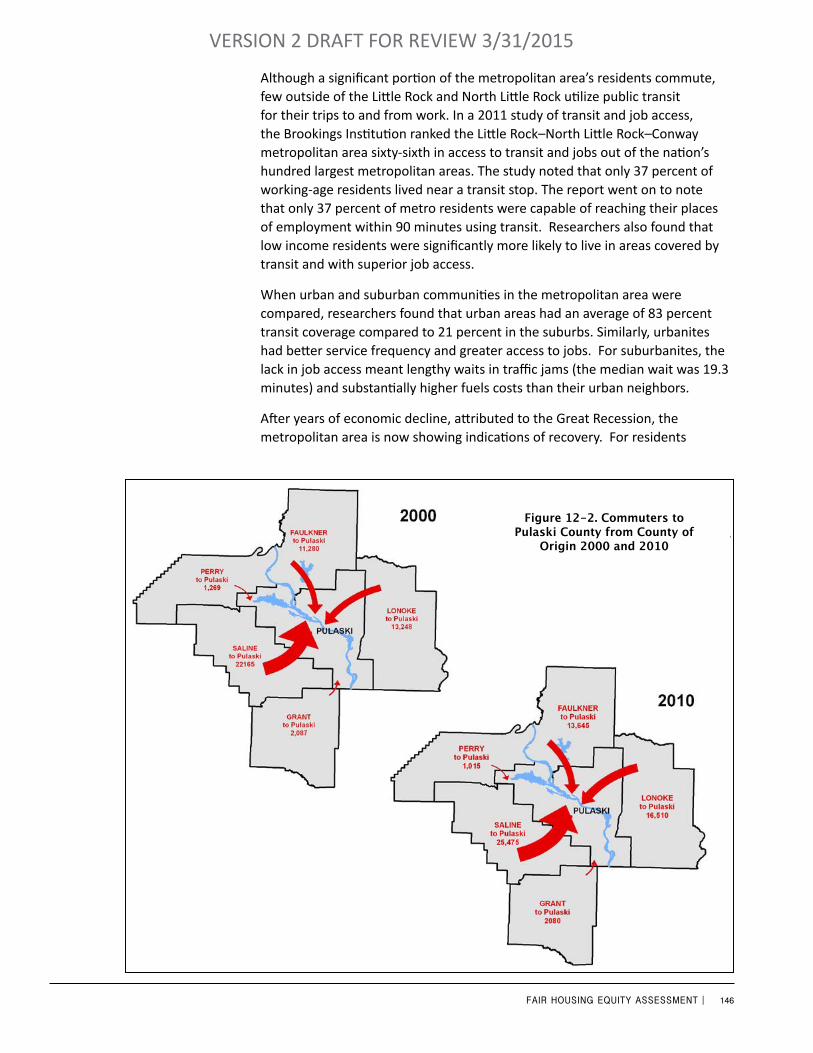
146FAIR HOUSING EQUITY ASSESSMENT |
VERSION 2 DRAFT FOR REVIEW 3/31/2015
Although a significant portion of the metropolitan area’s residents commute, few outside of the Little Rock and North Little Rock utilize public transit for their trips to and from work. In a 2011 study of transit and job access, the Brookings Institution ranked the Little Rock–North Little Rock–Conway metropolitan area sixty-sixth in access to transit and jobs out of the nation’s hundred largest metropolitan areas. The study noted that only 37 percent of working-age residents lived near a transit stop. The report went on to note that only 37 percent of metro residents were capable of reaching their places of employment within 90 minutes using transit. Researchers also found that low income residents were significantly more likely to live in areas covered by transit and with superior job access.
When urban and suburban communities in the metropolitan area were compared, researchers found that urban areas had an average of 83 percent transit coverage compared to 21 percent in the suburbs. Similarly, urbanites had better service frequency and greater access to jobs. For suburbanites, the lack in job access meant lengthy waits in traffic jams (the median wait was 19.3 minutes) and substantially higher fuels costs than their urban neighbors.
After years of economic decline, attributed to the Great Recession, the metropolitan area is now showing indications of recovery. For residents
Figure 12-2. Commuters to Pulaski County from County of
Origin 2000 and 2010
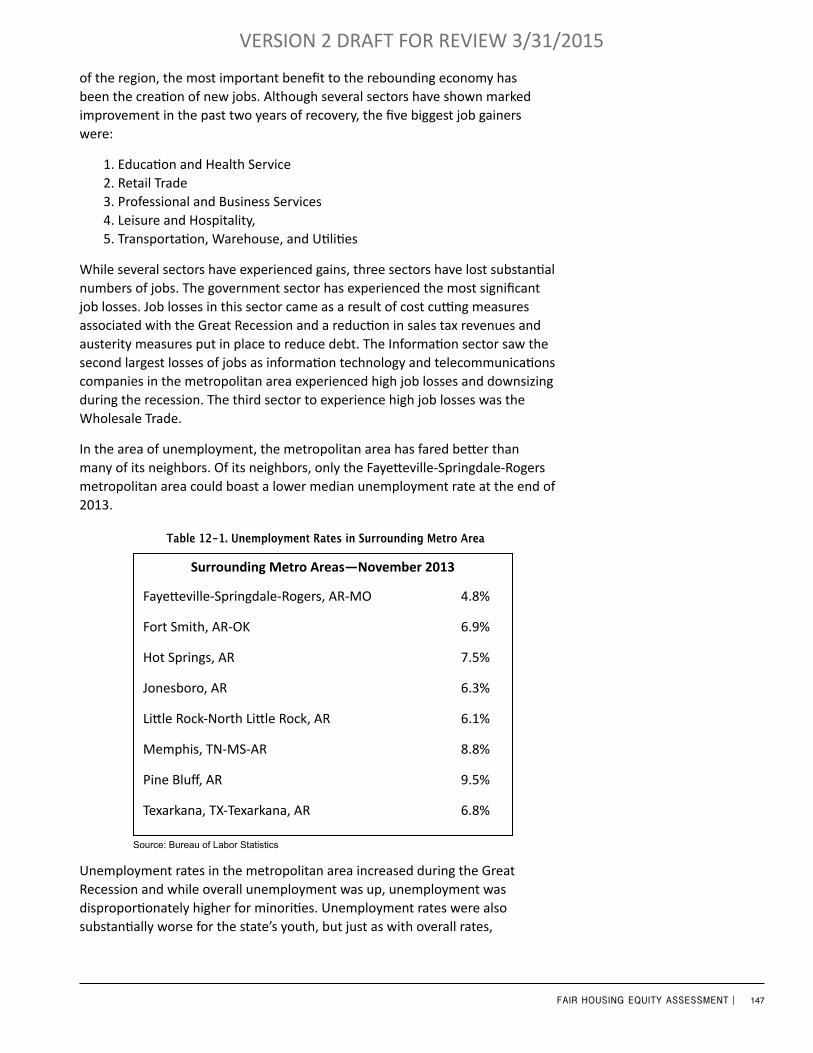
147FAIR HOUSING EQUITY ASSESSMENT |
VERSION 2 DRAFT FOR REVIEW 3/31/2015
of the region, the most important benefit to the rebounding economy has been the creation of new jobs. Although several sectors have shown marked improvement in the past two years of recovery, the five biggest job gainers were:
1. Education and Health Service2. Retail Trade3. Professional and Business Services4. Leisure and Hospitality,5. Transportation, Warehouse, and Utilities
While several sectors have experienced gains, three sectors have lost substantial numbers of jobs. The government sector has experienced the most significant job losses. Job losses in this sector came as a result of cost cutting measures associated with the Great Recession and a reduction in sales tax revenues and austerity measures put in place to reduce debt. The Information sector saw the second largest losses of jobs as information technology and telecommunications companies in the metropolitan area experienced high job losses and downsizing during the recession. The third sector to experience high job losses was the Wholesale Trade.
In the area of unemployment, the metropolitan area has fared better than many of its neighbors. Of its neighbors, only the Fayetteville-Springdale-Rogers metropolitan area could boast a lower median unemployment rate at the end of 2013.
Unemployment rates in the metropolitan area increased during the Great Recession and while overall unemployment was up, unemployment was disproportionately higher for minorities. Unemployment rates were also substantially worse for the state’s youth, but just as with overall rates,
Fayetteville-Springdale-Rogers, AR-MO 4.8%
Fort Smith, AR-OK 6.9%
Hot Springs, AR 7.5%
Jonesboro, AR 6.3%
Little Rock-North Little Rock, AR 6.1%
Memphis, TN-MS-AR 8.8%
Pine Bluff, AR 9.5%
Texarkana, TX-Texarkana, AR 6.8%
Table 12-1. Unemployment Rates in Surrounding Metro Area
Surrounding Metro Areas—November 2013
Source: Bureau of Labor Statistics

148FAIR HOUSING EQUITY ASSESSMENT |
VERSION 2 DRAFT FOR REVIEW 3/31/2015
unemployment among minority youth was higher than that of White youth in the state.
While the role that race plays in unemployment rates throughout the state is debatable, there may be a several pragmatic explanations for the high rate of minority unemployment, particularly among minority youth. Possible factors explaining higher minority unemployment include:
• Lower educational attainment levels among minority populations
• Greater commercial decline in the vicinity of minority residential areas
• Greater competition for jobs in the retail and restaurant sectors by adult workers
• Possible racial preference and Race/National Origin based discrimination
The role that discrimination has played in minority unemployment rates is extremely hard to determine, since few employers admit to participating these prohibited employment practices. One source of data which could possibly shed light on these practices is the number of charges filed with the Equal Employment Opportunity Commission (EEOC) with the basis of Race and National Origin. An analysis of Race and National Origin charges filed with the EEOC suggests that despite increased rates of unemployment among minorities between 2009 and 2012, there were no corresponding increases in the number of Race and National Origin charges filed within the state, suggesting that there was little increase in the frequency of discrimination, notwithstanding high levels of minority unemployment.
In 2009, Race charges accounted for 46.5% of the charges filed in the state, by 2012 the basis of Race could be found on only 31% of charges. Similarly, National Origin charges made up 3.5% of the total charges filed in the state and by 2012 this rate was virtually unchanged.
While the relative stability in the number of the Race and National Origin charges may convey that the frequency of such charges did not change, it is possible that with higher than normal rates of unemployment in the metropolitan area, fewer potentially harmed individuals were willing to file complaints, for fear that filing would impede or stifle their efforts at future employment.
Chapter 12 Sources
*Unemployment rates are calculated based on a 12-month moving average of data from Current Population Survey (CPS). This survey is conducted monthly by the U.S. Census Bureau and covers approximately 800 Arkansas households. Small sample size can trigger a higher level of sampling error, thus there are reliability concerns. For more information regarding the methodology used to produce these estimates, visit: www.bls.gov/gps/notescps.htm
Equal Employment Opportunity Commission, Enforcement and Litigation Statistics - http://eeoc.gov/eeoc/statistics/enforcement/index.cfm
U.S. Bureau of Labor Statistics
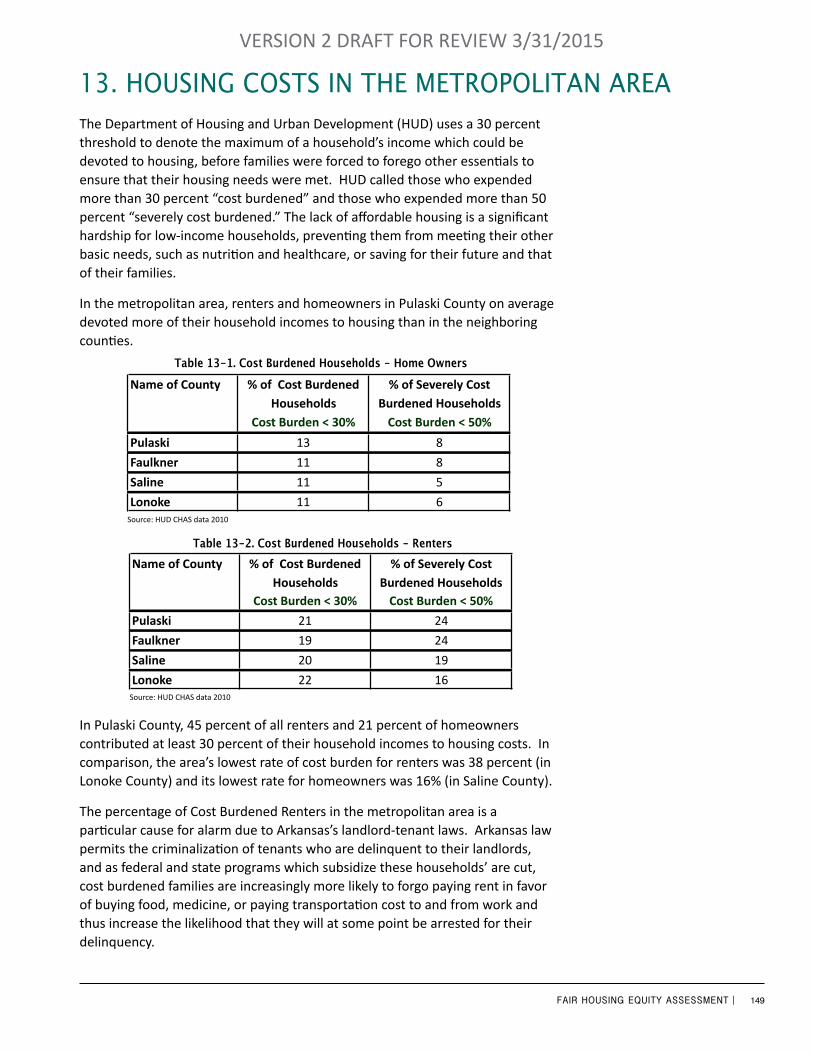
149FAIR HOUSING EQUITY ASSESSMENT |
VERSION 2 DRAFT FOR REVIEW 3/31/2015
13. housing CosTs in The MeTroPoliTan areaThe Department of Housing and Urban Development (HUD) uses a 30 percent threshold to denote the maximum of a household’s income which could be devoted to housing, before families were forced to forego other essentials to ensure that their housing needs were met. HUD called those who expended more than 30 percent “cost burdened” and those who expended more than 50 percent “severely cost burdened.” The lack of affordable housing is a significant hardship for low-income households, preventing them from meeting their other basic needs, such as nutrition and healthcare, or saving for their future and that of their families.
In the metropolitan area, renters and homeowners in Pulaski County on average devoted more of their household incomes to housing than in the neighboring counties.
In Pulaski County, 45 percent of all renters and 21 percent of homeowners contributed at least 30 percent of their household incomes to housing costs. In comparison, the area’s lowest rate of cost burden for renters was 38 percent (in Lonoke County) and its lowest rate for homeowners was 16% (in Saline County).
The percentage of Cost Burdened Renters in the metropolitan area is a particular cause for alarm due to Arkansas’s landlord-tenant laws. Arkansas law permits the criminalization of tenants who are delinquent to their landlords, and as federal and state programs which subsidize these households’ are cut, cost burdened families are increasingly more likely to forgo paying rent in favor of buying food, medicine, or paying transportation cost to and from work and thus increase the likelihood that they will at some point be arrested for their delinquency.
% of Cost Burdened Households
% of Severely Cost Burdened Households
Cost Burden < 30% Cost Burden < 50%
Pulaski 21 24
Faulkner 19 24
Saline 20 19
Lonoke 22 16
Pulaski 13 8
Faulkner 11 8
Saline 11 5
Lonoke 11 6
Source: HUD CHAS data 2010
Name of County
Cost Burdened Households - Renters
Cost Burdened Households – Home Owners
Name of County % of Cost Burdened Households
Cost Burden < 30%
% of Severely Cost Burdened Households Cost Burden < 50%
Source: HUD CHAS data 2010
Table 13-1. Cost Burdened Households - Home Owners
Table 13-2. Cost Burdened Households - Renters% of Cost Burdened
Households% of Severely Cost
Burdened HouseholdsCost Burden < 30% Cost Burden < 50%
Pulaski 21 24
Faulkner 19 24
Saline 20 19
Lonoke 22 16
Pulaski 13 8
Faulkner 11 8
Saline 11 5
Lonoke 11 6
Source: HUD CHAS data 2010
Name of County
Cost Burdened Households - Renters
Cost Burdened Households – Home Owners
Name of County % of Cost Burdened Households
Cost Burden < 30%
% of Severely Cost Burdened Households Cost Burden < 50%
Source: HUD CHAS data 2010
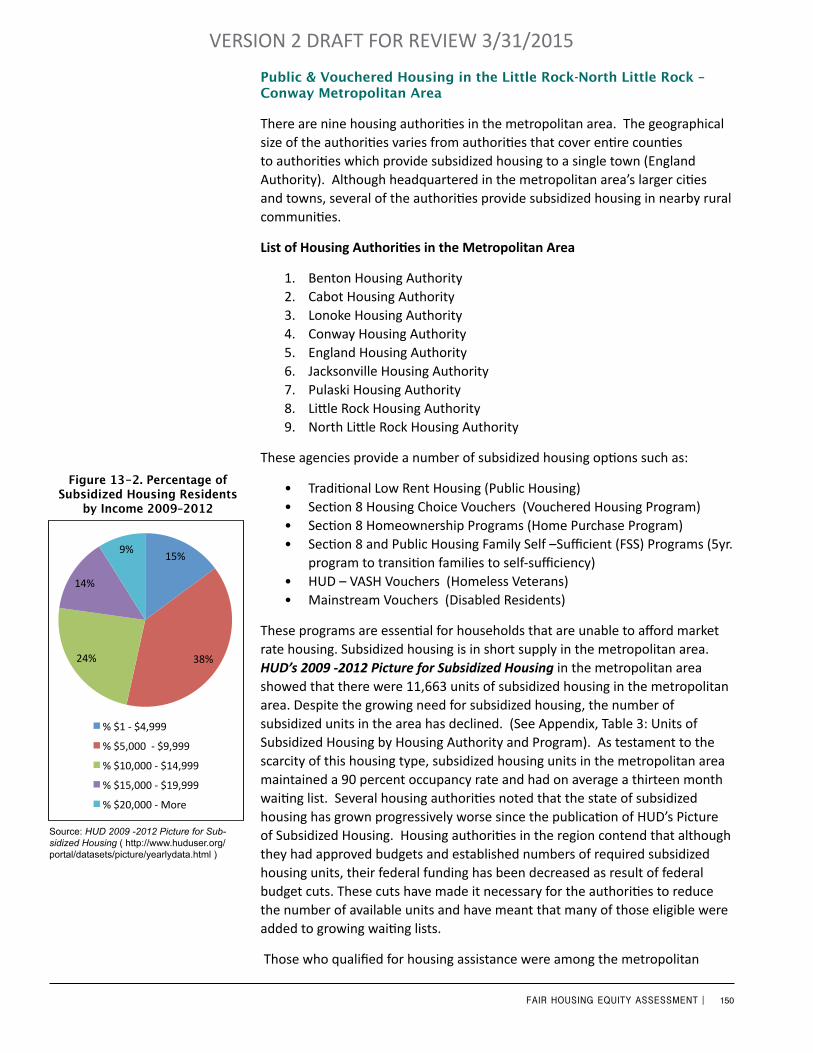
150FAIR HOUSING EQUITY ASSESSMENT |
VERSION 2 DRAFT FOR REVIEW 3/31/2015
Public & Vouchered Housing in the Little Rock-North Little Rock –Conway Metropolitan Area
There are nine housing authorities in the metropolitan area. The geographical size of the authorities varies from authorities that cover entire counties to authorities which provide subsidized housing to a single town (England Authority). Although headquartered in the metropolitan area’s larger cities and towns, several of the authorities provide subsidized housing in nearby rural communities.
List of Housing Authorities in the Metropolitan Area
1. Benton Housing Authority 2. Cabot Housing Authority 3. Lonoke Housing Authority 4. Conway Housing Authority 5. England Housing Authority 6. Jacksonville Housing Authority7. Pulaski Housing Authority8. Little Rock Housing Authority 9. North Little Rock Housing Authority
These agencies provide a number of subsidized housing options such as:
• Traditional Low Rent Housing (Public Housing)• Section 8 Housing Choice Vouchers (Vouchered Housing Program)• Section 8 Homeownership Programs (Home Purchase Program)• Section 8 and Public Housing Family Self –Sufficient (FSS) Programs (5yr.
program to transition families to self-sufficiency)• HUD – VASH Vouchers (Homeless Veterans)• Mainstream Vouchers (Disabled Residents)
These programs are essential for households that are unable to afford market rate housing. Subsidized housing is in short supply in the metropolitan area. HUD’s 2009 -2012 Picture for Subsidized Housing in the metropolitan area showed that there were 11,663 units of subsidized housing in the metropolitan area. Despite the growing need for subsidized housing, the number of subsidized units in the area has declined. (See Appendix, Table 3: Units of Subsidized Housing by Housing Authority and Program). As testament to the scarcity of this housing type, subsidized housing units in the metropolitan area maintained a 90 percent occupancy rate and had on average a thirteen month waiting list. Several housing authorities noted that the state of subsidized housing has grown progressively worse since the publication of HUD’s Picture of Subsidized Housing. Housing authorities in the region contend that although they had approved budgets and established numbers of required subsidized housing units, their federal funding has been decreased as result of federal budget cuts. These cuts have made it necessary for the authorities to reduce the number of available units and have meant that many of those eligible were added to growing waiting lists.
Those who qualified for housing assistance were among the metropolitan
Source: HUD 2009 -2012 Picture for Sub-sidized Housing ( http://www.huduser.org/portal/datasets/picture/yearlydata.html )
15%
38% 24%
14%
9%
Percentage of Subsidized Housing Residents by Income 2009 -‐2012
% $1 -‐ $4,999
% $5,000 -‐ $9,999
% $10,000 -‐ $14,999
% $15,000 -‐ $19,999
% $20,000 -‐ More
15%
38% 24%
14%
9%
Percentage of Subsidized Housing Residents by Income 2009 -‐2012
% $1 -‐ $4,999
% $5,000 -‐ $9,999
% $10,000 -‐ $14,999
% $15,000 -‐ $19,999
% $20,000 -‐ More
Figure 13-2. Percentage of Subsidized Housing Residents
by Income 2009–2012
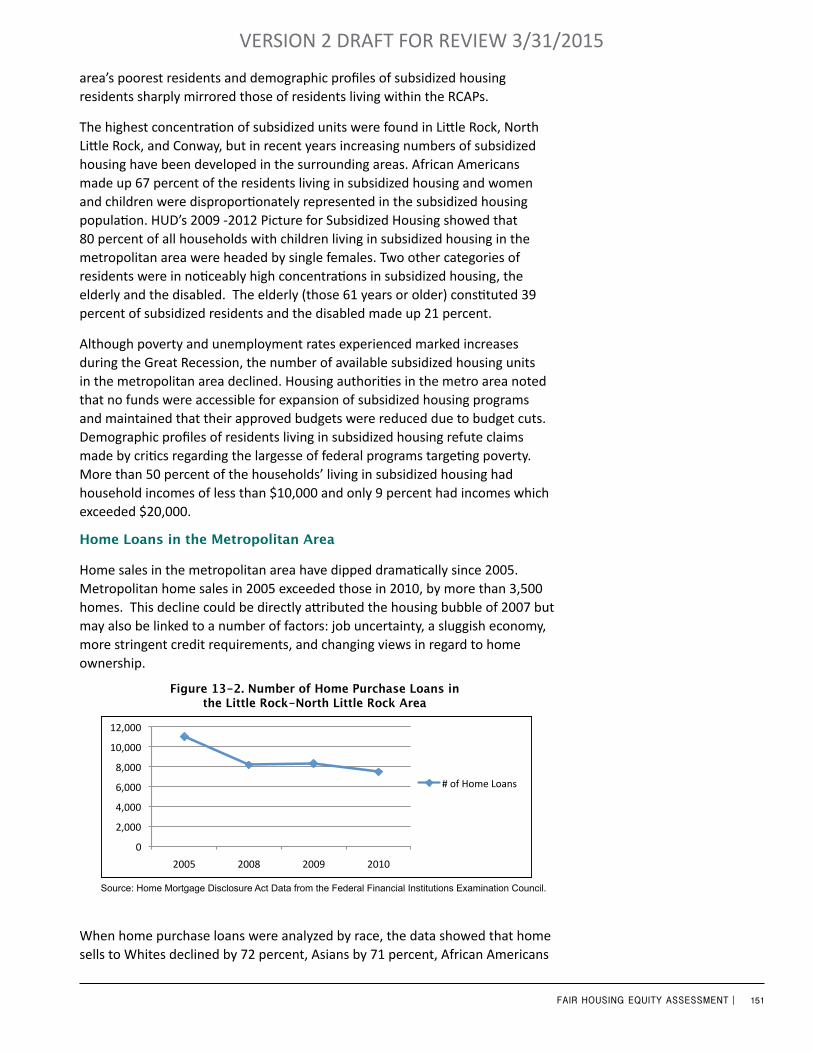
151FAIR HOUSING EQUITY ASSESSMENT |
VERSION 2 DRAFT FOR REVIEW 3/31/2015
area’s poorest residents and demographic profiles of subsidized housing residents sharply mirrored those of residents living within the RCAPs.
The highest concentration of subsidized units were found in Little Rock, North Little Rock, and Conway, but in recent years increasing numbers of subsidized housing have been developed in the surrounding areas. African Americans made up 67 percent of the residents living in subsidized housing and women and children were disproportionately represented in the subsidized housing population. HUD’s 2009 -2012 Picture for Subsidized Housing showed that 80 percent of all households with children living in subsidized housing in the metropolitan area were headed by single females. Two other categories of residents were in noticeably high concentrations in subsidized housing, the elderly and the disabled. The elderly (those 61 years or older) constituted 39 percent of subsidized residents and the disabled made up 21 percent.
Although poverty and unemployment rates experienced marked increases during the Great Recession, the number of available subsidized housing units in the metropolitan area declined. Housing authorities in the metro area noted that no funds were accessible for expansion of subsidized housing programs and maintained that their approved budgets were reduced due to budget cuts. Demographic profiles of residents living in subsidized housing refute claims made by critics regarding the largesse of federal programs targeting poverty. More than 50 percent of the households’ living in subsidized housing had household incomes of less than $10,000 and only 9 percent had incomes which exceeded $20,000.
Home Loans in the Metropolitan Area
Home sales in the metropolitan area have dipped dramatically since 2005. Metropolitan home sales in 2005 exceeded those in 2010, by more than 3,500 homes. This decline could be directly attributed the housing bubble of 2007 but may also be linked to a number of factors: job uncertainty, a sluggish economy, more stringent credit requirements, and changing views in regard to home ownership.
When home purchase loans were analyzed by race, the data showed that home sells to Whites declined by 72 percent, Asians by 71 percent, African Americans
0
2,000
4,000
6,000
8,000
10,000
12,000
2005 2008 2009 2010
Number of Home Purchase Loans in the Li4le Rock-‐North Li4le Rock Area
# of Home Loans
0
2,000
4,000
6,000
8,000
10,000
12,000
2005 2008 2009 2010
Number of Home Purchase Loans in the Li4le Rock-‐North Li4le Rock Area
# of Home Loans
Figure 13-2. Number of Home Purchase Loans in the Little Rock-North Little Rock Area
Source: Home Mortgage Disclosure Act Data from the Federal Financial Institutions Examination Council.

152FAIR HOUSING EQUITY ASSESSMENT |
VERSION 2 DRAFT FOR REVIEW 3/31/2015
by 69 percent, Hispanics by 60 percent and Native Americans by 57 percent. The market share of homes purchased by whites was much larger than that purchased by minorities, this substantial difference is apparent when total home sales in the area are examined collectively or graphed.
While government-backed home loans were available prior to the real estate market collapse, they made up a smaller portion of home financing prior to 2005. Since 2005, government-backed loans have made up an increasingly significant portion of the real estate market. In the African American and Hispanic communities, government-backed loans accounted for more than 80 percent of home purchase loans. Among White home buyers, government-backed loans also saw a marked increase from 25 percent to 65 percent of all home loans between 2005 and 2010.
Source: Home Mortgage Disclosure Act Data from the Federal Financial Institutions Examination Council.
Figure 13-3. Number of Home Purchase Loans by Race in the LR-NLR Area
0
1000
2000
3000
4000
5000
6000
7000
8000
9000
2005 2008 2009 2010
# of hom
es purchased
Number of Home Purchase Loans by Race in the LR-‐NLR Area
Hispanic
Non-‐Hispanic White
Non-‐Hispanic Black
Non-‐Hispanic American Indian
Non-‐Hispanic Asian/Pac. Islander
0
1000
2000
3000
4000
5000
6000
7000
8000
9000
2005 2008 2009 2010
# of hom
es purchased
Number of Home Purchase Loans by Race in the LR-‐NLR Area
Hispanic
Non-‐Hispanic White
Non-‐Hispanic Black
Non-‐Hispanic American Indian
Non-‐Hispanic Asian/Pac. Islander
0.00%
10.00%
20.00%
30.00%
40.00%
50.00%
60.00%
70.00%
80.00%
90.00%
100.00%
Hispanic Non-‐Hispanic White Non-‐Hispanic Black Non-‐Hispanic American Indian
Non-‐Hispanic Asian/Pac. Islander
Perc
enta
ge o
f G
over
nmen
t-‐Ba
cked
Loa
ns
Government-‐Backed Loans as Share of Home Purchase Loans by Race/Ethnicity in LR-‐NLR Area
2005
2008
2009
2010
Figure 13-4. Government-Backed Loans as Share of Home Purchase Loans by Race/Ethnicity in LR-NLR Area
0.00%
10.00%
20.00%
30.00%
40.00%
50.00%
60.00%
70.00%
80.00%
90.00%
100.00%
Hispanic Non-‐Hispanic White Non-‐Hispanic Black Non-‐Hispanic American Indian
Non-‐Hispanic Asian/Pac. Islander
Perc
enta
ge o
f G
over
nmen
t-‐Ba
cked
Loa
ns
Government-‐Backed Loans as Share of Home Purchase Loans by Race/Ethnicity in LR-‐NLR Area
2005
2008
2009
2010
Source: Home Mortgage Disclosure Act Data from the Federal Financial Institutions Examination Council.

153FAIR HOUSING EQUITY ASSESSMENT |
VERSION 2 DRAFT FOR REVIEW 3/31/2015
Government measures to help stabilize the housing sector also included more stringent provisions in regard to high interest home loans, commonly referred to as “bad credit loans.” A high interest home loan is a home loan which exceeds the Prime Lending Rate by three percentage points or more. These mortgages were commonly financed with variable or adjusted rates of interest. Under these flexible rates, when the prime rate of interest changed so did the monthly mortgage costs. Many homeowners, particularly those who were already cost burdened, went into foreclosure. To ensure that this pattern of loan default did not continue, banks required that loan applicants provide more documentation in regard to credit worthiness and income and the federal government established stricter guidelines in regard to high interest home loans.
Prior to 2010, high interest home loans were most frequently acquired by African Americans and Hispanics in the area. In 2005, nearly 38 percent of all African American and 24 percent of all Hispanic home purchase loans were high interest home loans.
The combination of more stringent requirements and greater oversight has yielded substantially fewer high interest home loans. In 2010, less than three percent of African American and just over two percent of Hispanic home loans in the area were high interest home loans.
0.00% 5.00%
10.00% 15.00% 20.00% 25.00% 30.00% 35.00% 40.00%
Hispanic Non-‐Hispanic White
Non-‐Hispanic Black
Non-‐Hispanic Asian/Pac. Islander
Percen
tage of H
ome Loan
s
Percentage of High Interest Home Loans before 2010 by Race in Li9le Rock -‐North Li9le Rock Area
2005
2008
2009
Figure 13-5. Percentage of High Interest Home Loans before 2010 by Race in Little Rock–North Little Rock Area
Source: Home Mortgage Disclosure Act Data from the Federal Financial Institutions Examination Council.
0.00% 5.00% 10.00% 15.00% 20.00% 25.00% 30.00% 35.00% 40.00%
Hispanic Non-‐Hispanic White
Non-‐Hispanic Black
Non-‐Hispanic Asian/Pac. Islander
Percen
tage of H
ome Loan
s
Percentage of High Interest Home Loans before 2010 by Race in Li9le Rock -‐North Li9le Rock Area
2005
2008
2009
0.00% 1.00% 2.00% 3.00% 4.00% 5.00% 6.00%
Hispanic
Non
-‐Hisp
anic
White
Non
-‐Hisp
anic
Black
Non
-‐Hisp
anic
American Indian
Non
-‐Hisp
anic
Asian/Pac.
Island
er
Percentage of High Interest Loans in the LR-‐NLR Area in 2010
Percentage of Home Loans
Figure 13-6. Percentage of High Interest Home Loans in Little Rock–North Little Rock Area in 2010
Source: Home Mortgage Disclosure Act Data from the Federal Financial Institutions Examination Council.
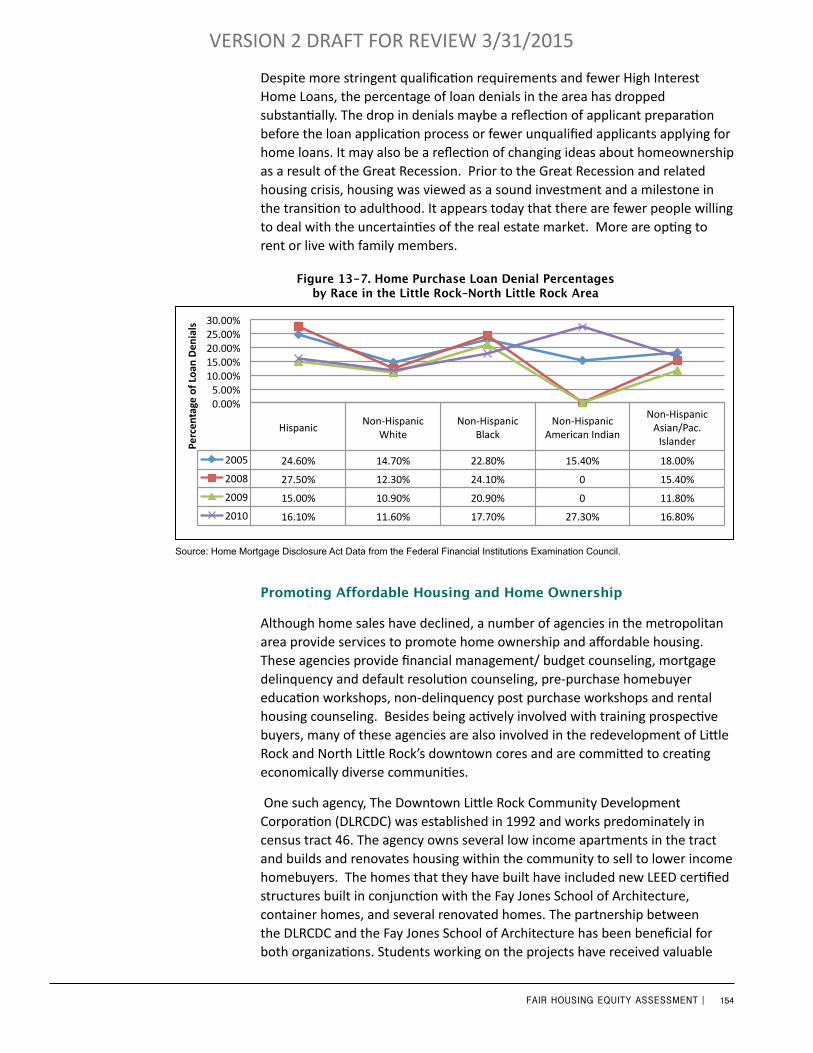
154FAIR HOUSING EQUITY ASSESSMENT |
VERSION 2 DRAFT FOR REVIEW 3/31/2015
Despite more stringent qualification requirements and fewer High Interest Home Loans, the percentage of loan denials in the area has dropped substantially. The drop in denials maybe a reflection of applicant preparation before the loan application process or fewer unqualified applicants applying for home loans. It may also be a reflection of changing ideas about homeownership as a result of the Great Recession. Prior to the Great Recession and related housing crisis, housing was viewed as a sound investment and a milestone in the transition to adulthood. It appears today that there are fewer people willing to deal with the uncertainties of the real estate market. More are opting to rent or live with family members.
Promoting Affordable Housing and Home Ownership
Although home sales have declined, a number of agencies in the metropolitan area provide services to promote home ownership and affordable housing. These agencies provide financial management/ budget counseling, mortgage delinquency and default resolution counseling, pre-purchase homebuyer education workshops, non-delinquency post purchase workshops and rental housing counseling. Besides being actively involved with training prospective buyers, many of these agencies are also involved in the redevelopment of Little Rock and North Little Rock’s downtown cores and are committed to creating economically diverse communities.
One such agency, The Downtown Little Rock Community Development Corporation (DLRCDC) was established in 1992 and works predominately in census tract 46. The agency owns several low income apartments in the tract and builds and renovates housing within the community to sell to lower income homebuyers. The homes that they have built have included new LEED certified structures built in conjunction with the Fay Jones School of Architecture, container homes, and several renovated homes. The partnership between the DLRCDC and the Fay Jones School of Architecture has been beneficial for both organizations. Students working on the projects have received valuable
Hispanic Non-‐Hispanic
White Non-‐Hispanic
Black Non-‐Hispanic
American Indian
Non-‐Hispanic Asian/Pac. Islander
2005 24.60% 14.70% 22.80% 15.40% 18.00%
2008 27.50% 12.30% 24.10% 0 15.40%
2009 15.00% 10.90% 20.90% 0 11.80%
2010 16.10% 11.60% 17.70% 27.30% 16.80%
0.00% 5.00% 10.00% 15.00% 20.00% 25.00% 30.00%
Percen
tage of Loa
n Den
ials
Home Purchase Loan Denial Percentages by Race in the LR-‐NLR Area
Figure 13-7. Home Purchase Loan Denial Percentages by Race in the Little Rock–North Little Rock Area
Source: Home Mortgage Disclosure Act Data from the Federal Financial Institutions Examination Council.
155FAIR HOUSING EQUITY ASSESSMENT |
VERSION 2 DRAFT FOR REVIEW 3/31/2015
hands-on experience in the field and the partnership has enabled the DLRCDC to provide avant-garde and energy efficient structures to its clients. In 2013, students worked collectively with DLRCDC staff and the Pettaway Community to design a sustainable pocket community. The design for this community won the 2012-2013 ACSA/AIA Housing Design Education and Excellence in Housing Education award. Despite its lists of successes, the DLRCDC has suffered dramatically as a result of the downturn in the housing market, and has had to greatly curtail its activities due to declining revenue. The problems of the DLRCDC may have substantial impact in census tract 46, which has seen increased redevelopment that has coincided with nearby downtown development along the river. The DLRCDC’s role of providing affordable housing in the rapidly redeveloping downtown assured an economically diverse population in the census tract, but the demise of the this agency and the potential private acquisition of its land holdings could displace poor living within the community.
Other agencies, such as the Argenta Community Development Corp (Argenta CDC) and Better Community Development Inc. (BCDI) have been better able to endure declining housing sales because they were not as dependent upon revenue created by housing sales to generate operational costs. In both cases, the Argenta Community Development Corporation and the BCDI have done exceptional work and have provided a broad array of services to their communities.
Argenta CDC has been an integral component in North Little Rock’s downtown development and one of the catalysts revitalizing Main Street. The once neglected downtown area is now a vibrant community and cultural and entertainment center, with a mix of small businesses and both market -rate and affordable housing. The popularity of the area since its revival has propelled housing sales and attracted both empty-nesters and young urban professionals.
Located in downtown Little Rock, Better Community Development Inc. (BCDI) has positioned itself as anchor to the community it serves. Its programs reach across age boundaries and address numerous social concerns in the community. Beyond home ownership classes and credit counseling, the agency provides drug treatment and intervention programs, affordable housing to individuals with special needs and ex-offenders, and offers life skills, career training, technology training, and programs for the youth in the community.
Predatory Lending & Banking
For the poor or those slipping from the ranks of the middle class due to joblessness, the difference between homelessness, starvation, or a house without electricity or heat can be a matter of a few hundred dollars. The answer quite often for this particularly vulnerable group’s financial problems has been a short-termed payday loan. Payday loans are generally small unsecured loans which are designed to be short in duration and typically carry extremely high interest rates (often exceeding 300%). Borrowers are required to provide proof of employment and agree to pay the lender in full with their next paycheck. Those who are unable to pay their loans off, incur additional fees
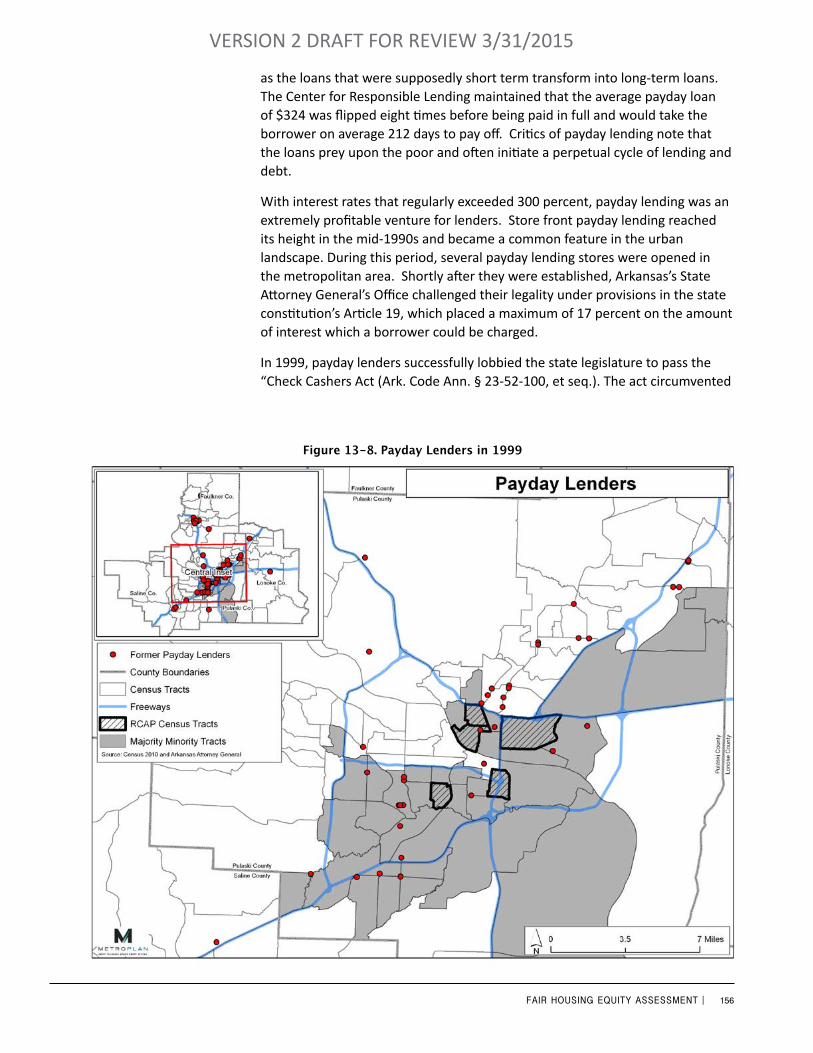
156FAIR HOUSING EQUITY ASSESSMENT |
VERSION 2 DRAFT FOR REVIEW 3/31/2015
as the loans that were supposedly short term transform into long-term loans. The Center for Responsible Lending maintained that the average payday loan of $324 was flipped eight times before being paid in full and would take the borrower on average 212 days to pay off. Critics of payday lending note that the loans prey upon the poor and often initiate a perpetual cycle of lending and debt.
With interest rates that regularly exceeded 300 percent, payday lending was an extremely profitable venture for lenders. Store front payday lending reached its height in the mid-1990s and became a common feature in the urban landscape. During this period, several payday lending stores were opened in the metropolitan area. Shortly after they were established, Arkansas’s State Attorney General’s Office challenged their legality under provisions in the state constitution’s Article 19, which placed a maximum of 17 percent on the amount of interest which a borrower could be charged.
In 1999, payday lenders successfully lobbied the state legislature to pass the “Check Cashers Act (Ark. Code Ann. § 23-52-100, et seq.). The act circumvented
Figure 13-8. Payday Lenders in 1999
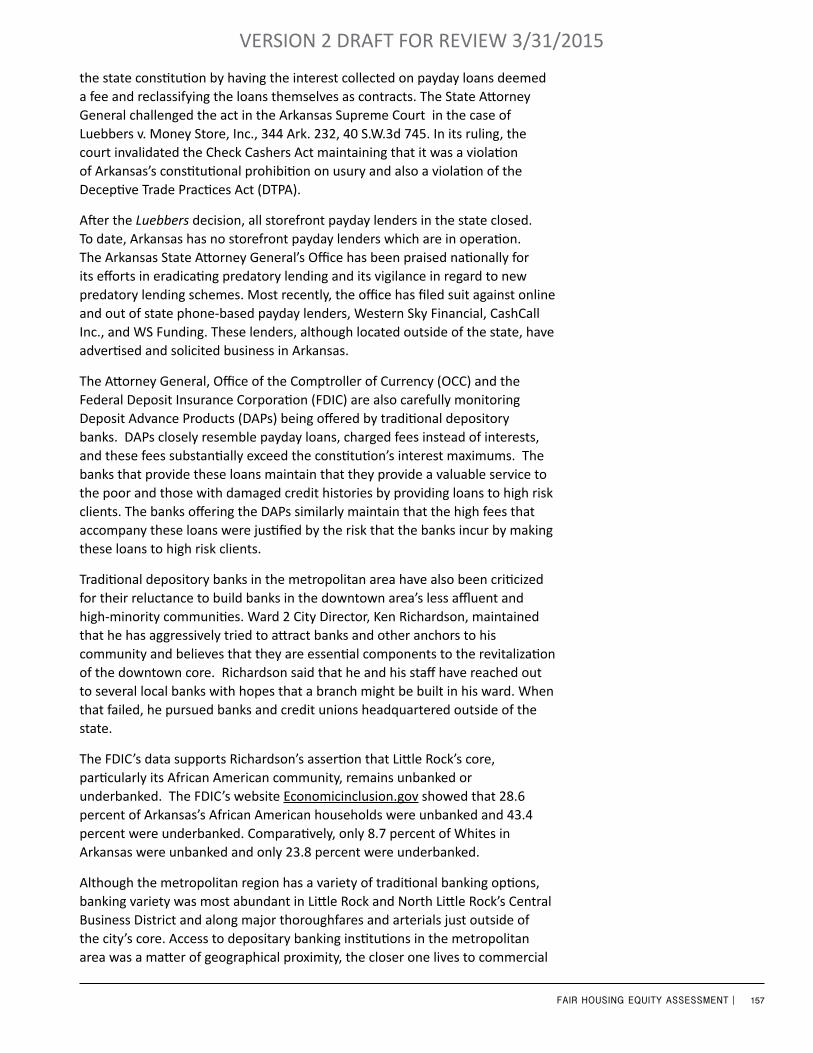
157FAIR HOUSING EQUITY ASSESSMENT |
VERSION 2 DRAFT FOR REVIEW 3/31/2015
the state constitution by having the interest collected on payday loans deemed a fee and reclassifying the loans themselves as contracts. The State Attorney General challenged the act in the Arkansas Supreme Court in the case of Luebbers v. Money Store, Inc., 344 Ark. 232, 40 S.W.3d 745. In its ruling, the court invalidated the Check Cashers Act maintaining that it was a violation of Arkansas’s constitutional prohibition on usury and also a violation of the Deceptive Trade Practices Act (DTPA).
After the Luebbers decision, all storefront payday lenders in the state closed. To date, Arkansas has no storefront payday lenders which are in operation. The Arkansas State Attorney General’s Office has been praised nationally for its efforts in eradicating predatory lending and its vigilance in regard to new predatory lending schemes. Most recently, the office has filed suit against online and out of state phone-based payday lenders, Western Sky Financial, CashCall Inc., and WS Funding. These lenders, although located outside of the state, have advertised and solicited business in Arkansas.
The Attorney General, Office of the Comptroller of Currency (OCC) and the Federal Deposit Insurance Corporation (FDIC) are also carefully monitoring Deposit Advance Products (DAPs) being offered by traditional depository banks. DAPs closely resemble payday loans, charged fees instead of interests, and these fees substantially exceed the constitution’s interest maximums. The banks that provide these loans maintain that they provide a valuable service to the poor and those with damaged credit histories by providing loans to high risk clients. The banks offering the DAPs similarly maintain that the high fees that accompany these loans were justified by the risk that the banks incur by making these loans to high risk clients.
Traditional depository banks in the metropolitan area have also been criticized for their reluctance to build banks in the downtown area’s less affluent and high-minority communities. Ward 2 City Director, Ken Richardson, maintained that he has aggressively tried to attract banks and other anchors to his community and believes that they are essential components to the revitalization of the downtown core. Richardson said that he and his staff have reached out to several local banks with hopes that a branch might be built in his ward. When that failed, he pursued banks and credit unions headquartered outside of the state.
The FDIC’s data supports Richardson’s assertion that Little Rock’s core, particularly its African American community, remains unbanked or underbanked. The FDIC’s website Economicinclusion.gov showed that 28.6 percent of Arkansas’s African American households were unbanked and 43.4 percent were underbanked. Comparatively, only 8.7 percent of Whites in Arkansas were unbanked and only 23.8 percent were underbanked.
Although the metropolitan region has a variety of traditional banking options, banking variety was most abundant in Little Rock and North Little Rock’s Central Business District and along major thoroughfares and arterials just outside of the city’s core. Access to depositary banking institutions in the metropolitan area was a matter of geographical proximity, the closer one lives to commercial
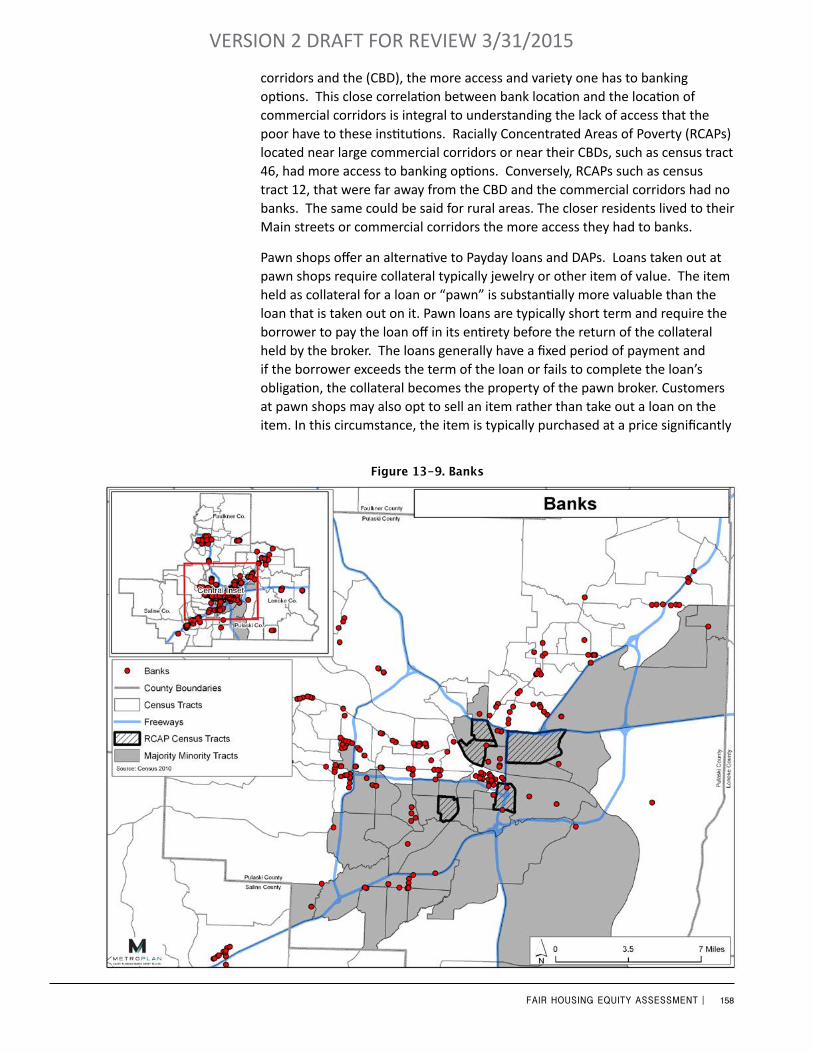
158FAIR HOUSING EQUITY ASSESSMENT |
VERSION 2 DRAFT FOR REVIEW 3/31/2015
corridors and the (CBD), the more access and variety one has to banking options. This close correlation between bank location and the location of commercial corridors is integral to understanding the lack of access that the poor have to these institutions. Racially Concentrated Areas of Poverty (RCAPs) located near large commercial corridors or near their CBDs, such as census tract 46, had more access to banking options. Conversely, RCAPs such as census tract 12, that were far away from the CBD and the commercial corridors had no banks. The same could be said for rural areas. The closer residents lived to their Main streets or commercial corridors the more access they had to banks.
Pawn shops offer an alternative to Payday loans and DAPs. Loans taken out at pawn shops require collateral typically jewelry or other item of value. The item held as collateral for a loan or “pawn” is substantially more valuable than the loan that is taken out on it. Pawn loans are typically short term and require the borrower to pay the loan off in its entirety before the return of the collateral held by the broker. The loans generally have a fixed period of payment and if the borrower exceeds the term of the loan or fails to complete the loan’s obligation, the collateral becomes the property of the pawn broker. Customers at pawn shops may also opt to sell an item rather than take out a loan on the item. In this circumstance, the item is typically purchased at a price significantly
Figure 13-9. Banks
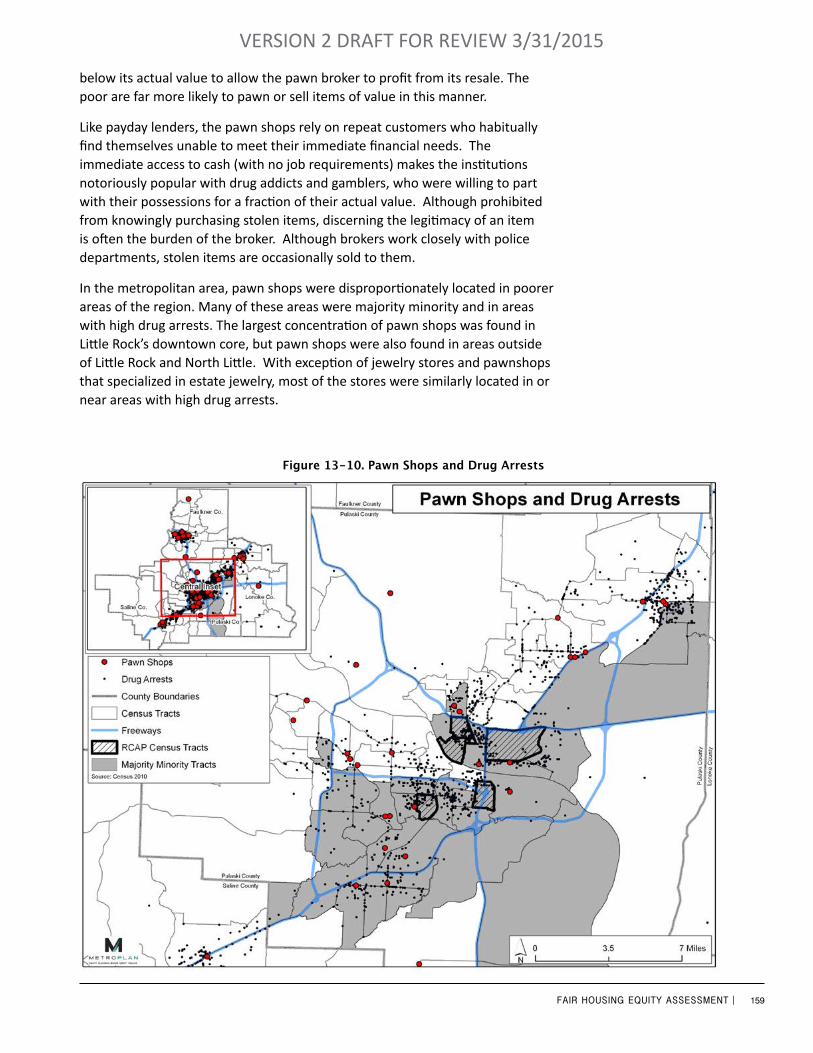
159FAIR HOUSING EQUITY ASSESSMENT |
VERSION 2 DRAFT FOR REVIEW 3/31/2015
below its actual value to allow the pawn broker to profit from its resale. The poor are far more likely to pawn or sell items of value in this manner.
Like payday lenders, the pawn shops rely on repeat customers who habitually find themselves unable to meet their immediate financial needs. The immediate access to cash (with no job requirements) makes the institutions notoriously popular with drug addicts and gamblers, who were willing to part with their possessions for a fraction of their actual value. Although prohibited from knowingly purchasing stolen items, discerning the legitimacy of an item is often the burden of the broker. Although brokers work closely with police departments, stolen items are occasionally sold to them.
In the metropolitan area, pawn shops were disproportionately located in poorer areas of the region. Many of these areas were majority minority and in areas with high drug arrests. The largest concentration of pawn shops was found in Little Rock’s downtown core, but pawn shops were also found in areas outside of Little Rock and North Little. With exception of jewelry stores and pawnshops that specialized in estate jewelry, most of the stores were similarly located in or near areas with high drug arrests.
Figure 13-10. Pawn Shops and Drug Arrests
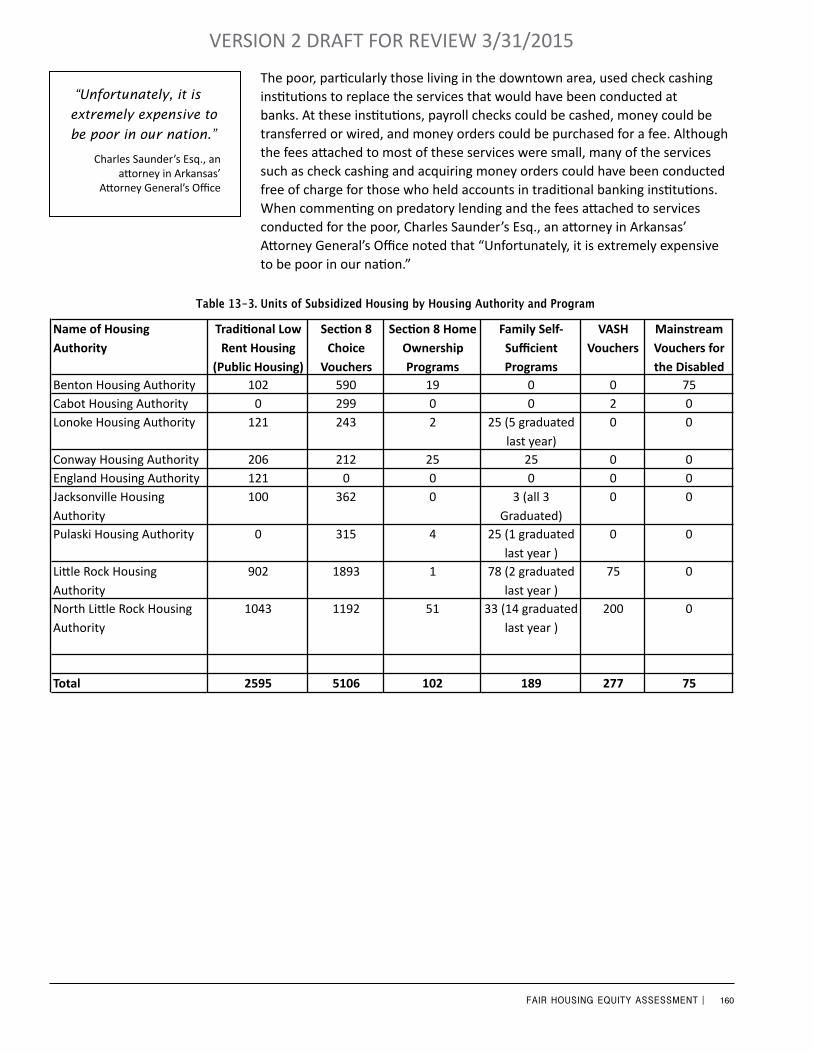
160FAIR HOUSING EQUITY ASSESSMENT |
VERSION 2 DRAFT FOR REVIEW 3/31/2015
The poor, particularly those living in the downtown area, used check cashing institutions to replace the services that would have been conducted at banks. At these institutions, payroll checks could be cashed, money could be transferred or wired, and money orders could be purchased for a fee. Although the fees attached to most of these services were small, many of the services such as check cashing and acquiring money orders could have been conducted free of charge for those who held accounts in traditional banking institutions. When commenting on predatory lending and the fees attached to services conducted for the poor, Charles Saunder’s Esq., an attorney in Arkansas’ Attorney General’s Office noted that “Unfortunately, it is extremely expensive to be poor in our nation.”
Table 13-3. Units of Subsidized Housing by Housing Authority and Program
Name of Housing Authority
Tradi5onal Low Rent Housing
(Public Housing)
Sec5on 8 Choice
Vouchers
Sec5on 8 Home Ownership Programs
Family Self-‐Sufficient Programs
VASH Vouchers
Mainstream Vouchers for the Disabled
Benton Housing Authority 102 590 19 0 0 75Cabot Housing Authority 0 299 0 0 2 0Lonoke Housing Authority 121 243 2 25 (5 graduated
last year)0 0
Conway Housing Authority 206 212 25 25 0 0England Housing Authority 121 0 0 0 0 0Jacksonville Housing Authority
100 362 0 3 (all 3 Graduated)
0 0
Pulaski Housing Authority 0 315 4 25 (1 graduated last year )
0 0
LiIle Rock Housing Authority
902 1893 1 78 (2 graduated last year )
75 0
North LiIle Rock Housing Authority
1043 1192 51 33 (14 graduated last year )
200 0
Total 2595 5106 102 189 277 75
“Unfortunately, it is
extremely expensive to
be poor in our nation.”
Charles Saunder’s Esq., an attorney in Arkansas’
Attorney General’s Office
161FAIR HOUSING EQUITY ASSESSMENT |
VERSION 2 DRAFT FOR REVIEW 3/31/2015
Chapter 13 SourcesHUD’s 2009 -2012 Picture for Subsidized Housing noted that there were 11,663 units of subsidized
housing in the metropolitan area. A census of subsidized housing units was conducted in December 2013-January 2014 of each housing authority’s units was asked to report the number of subsidized housing they supplied. This census showed that there were 8,544 units of subsidized housing in the metropolitan area.
HUD 2009 -2012 Picture for Subsidized Housing; Housing Authority Census & interviews conducted between December 2013 and January 2014.
Pettaway Neighborhood Association Website, http://pettawayneighborhoodassociation.com/2012/12/14/uacdc-receives-2012-2013-acsaaia-housing-design-education-excellence-in-hous-ing-education-for-the-project-pettaway-pocket-neighborhood/ (Accessed on January 6, 2014).
Center for Responsible Lending, http://www.responsiblelending.org/ (Accessed on January 6, 2014 ).Interview with Ward 2 City Director Ken Richardson January 7, 2014.http://economicinclusion.gov/surveys/place-data.html?where=Arkansas&when=2011 (Accessed Janu-
ary 14, 2014). Thomas J. Miles. Markets for Stolen Property: Pawn Shops and Crime. http://www.google.com/url?sa=
t&rct=j&q=&esrc=s&frm=1&source=web&cd=18&cad=rja&ved=0CFUQFjAHOAo&url=http%3A%2F%2Fwww.law.umich.edu%2Fcentersandprograms%2Flawandeconomics%2Fworkshops%2FDocuments%2FWinter2008%2Fmiles.pdf&ei=wKbVUp7rDunJsAS5zICQCg&usg=AFQjCNHNAZnnF3vuGRBTAZtlwHphTfKlBw&bvm=bv.59378465,d.b2I ( Accessed December 17, 2013 )
Interview with Charles Saunders Esq., Arkansas State Attorney General’s Office, December 17, 2013.

162FAIR HOUSING EQUITY ASSESSMENT |
VERSION 2 DRAFT FOR REVIEW 3/31/2015
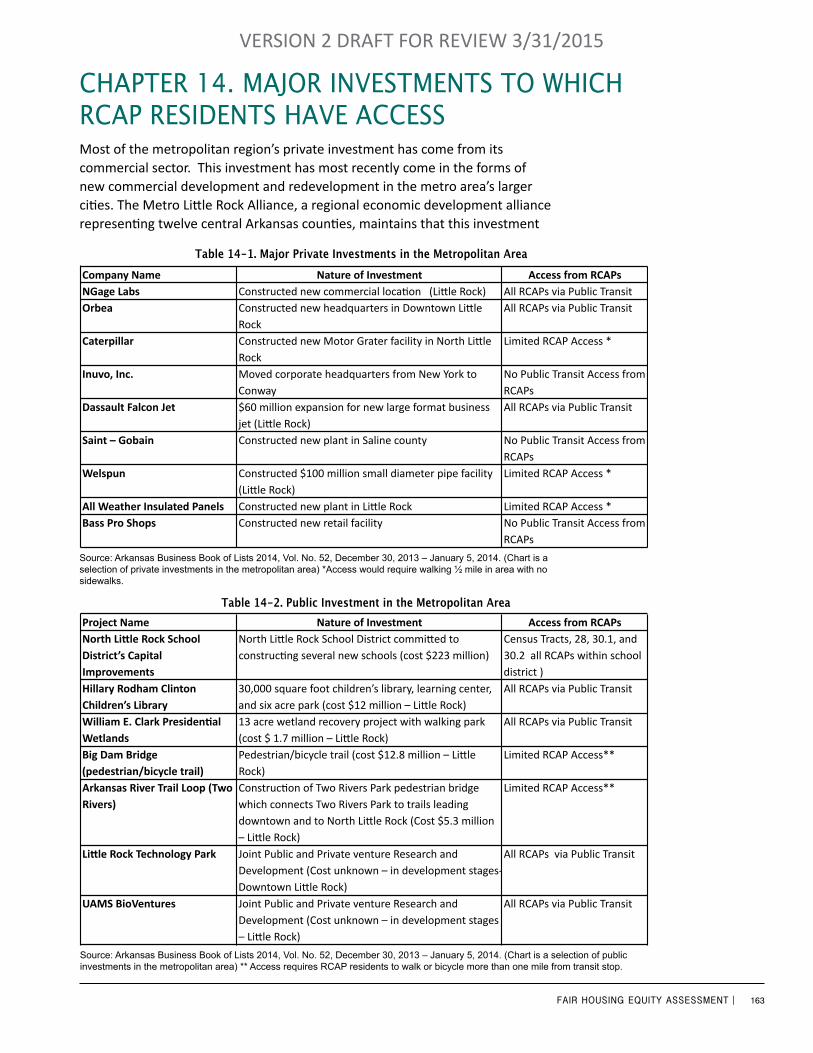
163FAIR HOUSING EQUITY ASSESSMENT |
VERSION 2 DRAFT FOR REVIEW 3/31/2015
Most of the metropolitan region’s private investment has come from its commercial sector. This investment has most recently come in the forms of new commercial development and redevelopment in the metro area’s larger cities. The Metro Little Rock Alliance, a regional economic development alliance representing twelve central Arkansas counties, maintains that this investment
Table 14-1. Major Private Investments in the Metropolitan Area
Source: Arkansas Business Book of Lists 2014, Vol. No. 52, December 30, 2013 – January 5, 2014. (Chart is a selection of private investments in the metropolitan area) *Access would require walking ½ mile in area with no sidewalks.
Company Name Nature of Investment Access from RCAPsNGage Labs Constructed new commercial loca1on (Li4le Rock) All RCAPs via Public TransitOrbea Constructed new headquarters in Downtown Li4le
RockAll RCAPs via Public Transit
Caterpillar Constructed new Motor Grater facility in North Li4le Rock
Limited RCAP Access *
Inuvo, Inc. Moved corporate headquarters from New York to Conway
No Public Transit Access from RCAPs
Dassault Falcon Jet $60 million expansion for new large format business jet (Li4le Rock)
All RCAPs via Public Transit
Saint – Gobain Constructed new plant in Saline county No Public Transit Access from RCAPs
Welspun Constructed $100 million small diameter pipe facility (Li4le Rock)
Limited RCAP Access *
All Weather Insulated Panels Constructed new plant in Li4le Rock Limited RCAP Access *Bass Pro Shops Constructed new retail facility No Public Transit Access from
RCAPs
Project Name Nature of Investment Access from RCAPsNorth LiIle Rock School District’s Capital Improvements
North Li4le Rock School District commi4ed to construc1ng several new schools (cost $223 million)
Census Tracts, 28, 30.1, and 30.2 all RCAPs within school district )
Hillary Rodham Clinton Children’s Library
30,000 square foot children’s library, learning center, and six acre park (cost $12 million – Li4le Rock)
All RCAPs via Public Transit
William E. Clark PresidenNal Wetlands
13 acre wetland recovery project with walking park (cost $ 1.7 million – Li4le Rock)
All RCAPs via Public Transit
Big Dam Bridge (pedestrian/bicycle trail)
Pedestrian/bicycle trail (cost $12.8 million – Li4le Rock)
Limited RCAP Access**
Arkansas River Trail Loop (Two Rivers)
Construc1on of Two Rivers Park pedestrian bridge which connects Two Rivers Park to trails leading downtown and to North Li4le Rock (Cost $5.3 million – Li4le Rock)
Limited RCAP Access**
LiIle Rock Technology Park Joint Public and Private venture Research and Development (Cost unknown – in development stages-‐Downtown Li4le Rock)
All RCAPs via Public Transit
UAMS BioVentures Joint Public and Private venture Research and Development (Cost unknown – in development stages – Li4le Rock)
All RCAPs via Public Transit
Table 14-2. Public Investment in the Metropolitan Area
Source: Arkansas Business Book of Lists 2014, Vol. No. 52, December 30, 2013 – January 5, 2014. (Chart is a selection of public investments in the metropolitan area) ** Access requires RCAP residents to walk or bicycle more than one mile from transit stop.
Company Name Nature of Investment Access from RCAPsNGage Labs Constructed new commercial loca1on (Li4le Rock) All RCAPs via Public TransitOrbea Constructed new headquarters in Downtown Li4le
RockAll RCAPs via Public Transit
Caterpillar Constructed new Motor Grater facility in North Li4le Rock
Limited RCAP Access *
Inuvo, Inc. Moved corporate headquarters from New York to Conway
No Public Transit Access from RCAPs
Dassault Falcon Jet $60 million expansion for new large format business jet (Li4le Rock)
All RCAPs via Public Transit
Saint – Gobain Constructed new plant in Saline county No Public Transit Access from RCAPs
Welspun Constructed $100 million small diameter pipe facility (Li4le Rock)
Limited RCAP Access *
All Weather Insulated Panels Constructed new plant in Li4le Rock Limited RCAP Access *Bass Pro Shops Constructed new retail facility No Public Transit Access from
RCAPs
Project Name Nature of Investment Access from RCAPsNorth LiIle Rock School District’s Capital Improvements
North Li4le Rock School District commi4ed to construc1ng several new schools (cost $223 million)
Census Tracts, 28, 30.1, and 30.2 all RCAPs within school district )
Hillary Rodham Clinton Children’s Library
30,000 square foot children’s library, learning center, and six acre park (cost $12 million – Li4le Rock)
All RCAPs via Public Transit
William E. Clark PresidenNal Wetlands
13 acre wetland recovery project with walking park (cost $ 1.7 million – Li4le Rock)
All RCAPs via Public Transit
Big Dam Bridge (pedestrian/bicycle trail)
Pedestrian/bicycle trail (cost $12.8 million – Li4le Rock)
Limited RCAP Access**
Arkansas River Trail Loop (Two Rivers)
Construc1on of Two Rivers Park pedestrian bridge which connects Two Rivers Park to trails leading downtown and to North Li4le Rock (Cost $5.3 million – Li4le Rock)
Limited RCAP Access**
LiIle Rock Technology Park Joint Public and Private venture Research and Development (Cost unknown – in development stages-‐Downtown Li4le Rock)
All RCAPs via Public Transit
UAMS BioVentures Joint Public and Private venture Research and Development (Cost unknown – in development stages – Li4le Rock)
All RCAPs via Public Transit
ChaPTer 14. MaJor invesTMenTs To whiCh rCaP residenTs have aCCess

164FAIR HOUSING EQUITY ASSESSMENT |
VERSION 2 DRAFT FOR REVIEW 3/31/2015
has created 11,943 jobs, $447 million in new payroll, and has provided $1.649 billion in regional capital investment since 2005.
Private investment in the area generally consisted of the acquisition of land and construction or expansion of commercial facilities. Public Investment projects more often addressed sustainability, quality of life, and transportation issues. At least two projects blended public and private investment: the Little Rock Technology Park and UAMS Bio Ventures. In both instances, leading scholars, scientists, and institutions of higher education in the region will work collaboratively with private industry to promote innovation and potentially foster additional expansion in technology, health/health care, and biotechnology.
In analyzing the impact of private and public investment on RCAPs, access to the opportunities and services offered by these projects had to be considered. Transportation was one impediment. An analysis of transportation and economic development may correlate the placement of manufacturing plants in areas outside of the core, where large tracts of land are more readily available and acquisition might be cheaper. However, analyzing the problem of job access spatially does not account for RCAP residents’ inability to obtain jobs in sectors requiring high levels of educational attainment.
While downtown Little Rock and North Little Rock have created few new opportunities in the areas of manufacturing or large scale retail, they host jobs in technology, biomedical, and professional areas.
Infrastructure Improvements in the RCAPS
Being in and around the downtown cores of Little Rock and North Little Rock, RCAPs possess some of the region’s most outdated infrastructure. For this reason, infrastructure improvement and updates are routinely conducted, generally on an “as-required” basis. In the areas of transportation and access, the interstates and major roads are vital links in the arterial network, not only used by RCAP residents but also by thousands of commuters who drive into the areas daily. The roads, streets, and highways that make up this network are subject to periodic improvements and repairs. The chart below shows road infrastructure improvements which impact RCAP residents.
Project Name RCAP ImpactedRoosevelt Rd. Union Pacific Railroad Bridge Replacement
Census Tract 46 and Census Tract 12
Broadway Bridge over Arkansas River Replacement
Census Tract 30.1 and Census Tract 30.2
Broadway/Pike Avenue Roundabout Census Tract 28I-‐30 Widening Census Tract 46Widening East Broadway in NLR Census Tract 28
Table 14-3. Road Infrastructure Improvements which impact RCAPs
Source: All projects are completed, ongoing, or scheduled.
Chapter 14 Source
Arkansas Business Book of Lists 2014, Vol. No. 52, December 30, 2013– January 5, 2014
165FAIR HOUSING EQUITY ASSESSMENT |
VERSION 2 DRAFT FOR REVIEW 3/31/2015
15. fhea findingsThe Fair Housing Equity Assessment (FHEA) examines housing trends the metropolitan area, identifies and analyzes the metro areas poorest communities, and appraises the access that those communities have to necessary resources. The FHEA report is intended to inform the Imagine Central Arkansas Partners (ICAP), the Regional Planning Advisory Council (RCAP) and the Metroplan Board of Directors as they consider adoption of goals and policies for development of Imagine Central Arkansas: Blueprint for Sustainable Development (the long-range transportation plan for the Little Rock–North Little Rock–Conway metropolitan area).
The report suggests regional leadership should focus efforts to identify necessary policies in the following five primary areas:
1. Job Access2. Educational Attainment 3. Housing Diversity 4. Safety and Health 5. Regional Collaboration
Job Access
The FHEA shows that the region’s poorest residents are dependent upon low cost housing and public transit and are disproportionately more likely to be unemployed or under-employed. Data shows RCAP residents lack the educational attainment to compete in high wage employment sectors. New manufacturing and retail facilities are built with increasing frequency in areas of the region with limited or no public transit.
RCAP residents who find full-time employment often find such employment in the retail and hospitality sectors. However, wages in those sectors are generally low and despite working full-time, many workers are unable to earn above the poverty threshold.
The inability of college educated RCAP residents to find work is more challenging to understand, particularly when their degrees are in high growth and high wage sectors. Disproportionately high numbers of unemployed college educated minorities suggests that race and national origin may still be factors in employment decisions.

166FAIR HOUSING EQUITY ASSESSMENT |
VERSION 2 DRAFT FOR REVIEW 3/31/2015
Educational Attainment
Low educational attainment scores in public schools are a concern for corporations, particularly in the technology, healthcare, and biotechnology sectors. In those sectors, competition for workers is high and recruiting or relocating workers to a region with low testing scores and educational attainment levels is difficult and costly. Efforts to attract new corporations to the region have at times been derailed in their early stages due to these additional costs and the failure to establish high levels of educational attainment across the region will be costly for future development.
Housing Diversity
Poverty and housing options in the region are extremely concentrated due, in part, to the limited distribution of housing at various price points and limited transportation choice. There must be a consolidated effort to increase housing option throughout the region. Housing cost largely governs where individuals live and since poverty is so closely correlated to race in the region; large areas of racially concentrated poverty persists. To effectively increase opportunity, one strategy might be to increase housing at diverse price points in as many census tracts (particularly in the RCAPs and downtown area) as possible. Providing housing stock at varying price points throughout the region benefits all.
Health and Safety
Crime, particularly violent crime and drug trafficking, are major problems within many neighborhoods and must be eliminated/reduced in order to attract critical private investments. In order to broaden housing options regionally, private interests must understand the benefits of investing in diverse housing types at various price points throughout the region. Major obstacles in attracting those investments involve issues related to health and safety. The demolition, renovation, and redevelopment of unsafe and abandoned properties combined with the provision of and/or repair of sidewalks and lighting can help increase neighborhood pedestrian foot-traffic, access to public transit while dissuading criminal activity. The creation, renewed maintenance and staffing of parks and community centers would provide secure areas for children and positive activities for youth to participate in and would provide alternatives to children who may have otherwise considered participation in gangs or criminal activity. Lastly, it is important to have a committed, involved, and community engaged police presence. The reinstitution of beat cops, who patrol the community on foot, bicycle, or horseback, and who are familiar with neighborhood residents is essential to restoring community trust and uprooting entrenched criminal elements.
167FAIR HOUSING EQUITY ASSESSMENT |
VERSION 2 DRAFT FOR REVIEW 3/31/2015
Regional Organization and Planning
Tackling the issues of poverty, access to opportunity and housing equity will require the collaborative efforts of federal, state, and private agencies. While there are numerous organizations working on facets of the problem, there is very little broad collaboration or data collection. The creation of such a collaborative effort allow members to work more effectively on programs, targeting, grant writing, and help increase efficiency by reducing program redundancy. A regional organization or task force assigned to these issues can monitor the increase / decrease, in the effectiveness of programs, promote private development in transitioning neighborhoods areas by creating incentive programs, and pool resources to provide effective support and success.


170FAIR HOUSING EQUITY ASSESSMENT |
VERSION 2 DRAFT FOR REVIEW 3/31/2015