Embed Size (px)
Citation preview
International Journal of Peer to Peer Networks (IJP2P) Vol.8, No.1, February 2017
DOI : 10.5121/ijp2p.2017.8101 1
REAL-TIME INTRUSION DETECTION SYSTEM FOR
BIG DATA
Reghunath K
PG & Research Department of Computer Science, SSM Arts & Science, Periyar
University, Komarapalayam, Tamilnadu, India
ABSTRACT
The objective of the proposed system is to integrate the high volume of data along with the important
considerations like monitoring a wide array of heterogeneous security. When a real time cyber attack
occurred, the Intrusion Detection System automatically store the log in distributed environment and
monitor the log with existing intrusion dictionary. At the same time the system will check and categorize the
severity of the log to high, medium, and low respectively. After the categorization, the system will
automatically take necessary action against the user-unit with respect to the severity of the log. The
advantage of the system is that it utilize anomaly detection, evaluates data and issue alert message or
reports based on abnormal behaviour.
KEYWORDS
Big data, Real time Intrusion System, Lambda Architecture, k-means algorithm, Data Security
1. INTRODUCTION Big data is one of the most talked topic in IT industry. The term Big Data refers to a massive
amount of digital information. Due to the heavy usage of internet, smartphones and the social
networks, the data volume in the world is dramatically increased in a way that the traditional
systems cannot hold these data in terms of storage and processing. Big data analytics provide new
ways for businesses and government to analyze structured, semi-structured and unstructured data.
It is not a single technique or a tool, rather it involves many areas of business and technology.
In recent, the cyber attacks in big data are increasing because of the existing security[4]
technologies are not capable of detecting it. Many intrusion detection systems are available for
various types of network attacks. Most of them are unable to detect recent unknown attacks,
whereas the others do not provide a real-time solution to overcome the challenges. To detect an
intrusion in such ultra-high-speed environment in real time is a challenging task.
1.1 BIG DATA
Big Data[1] is a large collection of structured, semi-structured and unstructured datasets that
cannot be stored and processed using traditional computing techniques[2]. In most enterprise
scenarios the volume of data is too big or it moves too fast or it exceeds current processing
capacity.
1.2 3VS OF BIG DATA
The Big data can be easily defined by using its 3V [5]characteristics like Volume, Velocity and
Variety.

International Journal of Peer to Peer Networks (IJP2P) Vol.8, No.1, February 2017
2
Figure 1. 3V Property of Big Data
1.2.1 VOLUME
We currently see the exponential growth in the data storage as the data is now more than text
data. We can find data in the format of videos, music and large images on our social media
channels. It is very common to have Terabytes and Petabytes of the storage system for
enterprises. The big volume indeed represents Big Data.
1.2.2 VELOCITY
The data growth and social media explosion have changed how we look at the data. There was a
time when we used to believe that data of yesterday is recent. The matter of the fact newspapers is
still following that logic. However, news channels and radios have changed how fast we receive
the news. Today, people refer social media for recent updates. The data movement is now almost
real time. This high velocity data represent Big Data.
1.2.3 VARIETY
Data can be stored in different formats like database, excel, csv, video, SMS, pdf or something we might have not thought about it and that is the challenge we need to overcome with the Big Data.
This variety of the data represents Big Data.
1.3 DISTRIBUTED ENVIRONMENT AND DISTRIBUTED PROCESSING
Nowadays all type data are increasing vastly in terms of their Volume, Velocity and Variety. These kinds of data can’t be stored and processed on a single server machine. For making any
type of decisions on a large amount of data, the comparison of data values should be gone
through the whole datasets and the result preparation will be a time taking process, it will never
reduce in future. The distributed environment will store the data in a large number of commodity
servers and is capable of processing these data in a distributed fashion. In such situation the data
processing task will be spread into the commodity servers and the final output will be aggregate
by using programming paradigms like MapReduce [6].
1.3.1 DISTRIBUTED COMPUTING ENVIRONMENT (DCE)
This is an industry-standard software technology for setting up and managing computing and data
exchange in a system of distributed computers. DCE[7] is typically used in a larger network of
computing systems that include different size servers scattered geographically. DCE uses the
client/server model. Using DCE, application users can use applications and data at remote

International Journal of Peer to Peer Networks (IJP2P) Vol.8, No.1, February 2017
3
servers. Application programmers need not be aware of where their programs will run or where
the data will be located. Much of DCE setup requires the preparation of distributed directories so
that DCE applications and related data can be located when they are being used. DCE includes security support and some implementations provide support for access to popular databases. DCE
was developed by the Open Software Foundation (OSF) using software technologies contributed
by some of its member companies.
Many problems arise in distributed application engineering and systems. Some of these include
communication, authentication, authorization, data integrity, data privacy, sharing of information,
heterogeneous environments, distributed management, consistency of time, reliability,
availability, parallel execution, and graceful degradation.
1.3.2 DISTRIBUTED PROCESSING
Distributed processing[7] is a phrase used to refer to a variety of computer systems that use more
than one computer or processor to run an application. This includes parallel processing in which a
single computer uses more than one CPU to execute programs.
The distributed processing refers to local-area networks designed so that a single program can run
simultaneously at various sites. Most distributed processing systems contain sophisticated software that detects idle CPUs on the network and parcels out programs to utilize them. Another
form of distributed processing involves distributed databases. This is databases in which the data
is stored across two or more computer systems. The database system keeps track of where the
data is so that the distributed nature of the database is not apparent to users.
1.4 HADOOP, MAPREDUCE, AND HDFS
Apache Hadoop is a Java-based programming framework supports the processing of large sets of
data in a distributed computing environment. Hadoop cluster uses a Master/Slave structure. Using
Hadoop, large data sets can be processed across a cluster of servers and applications can be run
on systems with thousands of nodes. Distributed file system in Hadoop helps in rapid data
transfer rates and allows the system to continue its normal operation even in the case of some
node failures. This approach lowers the risk of an entire system failure, even in the case of a
significant number of node failures. Hadoop enables a computing solution that is scalable, cost
effective, flexible and fault tolerant. Hadoop Framework is used by popular companies like
Yahoo, Amazon and IBM etc., to support their applications involving huge amounts of data.
Hadoop[15] has two main sub projects – Mapreduce and Hadoop Distributed File System
(HDFS).
Hadoop Mapreduce[8] is a framework used to write applications that process large amounts of
data in parallel on clusters of commodity hardware resources in a reliable, fault-tolerant manner.
A MapReduce job first divides the data into individual chunks which are processed by Map jobs
in parallel. The outputs of the maps sorted by the framework are then input to the reduce tasks. Generally the input and the output of the job are both stored in a file-system. Scheduling,
Monitoring and re-executing failed tasks are taken care by the framework.

International Journal of Peer to Peer Networks (IJP2P) Vol.8, No.1, February 2017
4
Figure 2. Map Reduce word count process
Hadoop Distributed File System is a file system that spans all the nodes in a Hadoop cluster for
data storage. It links together file systems on local nodes to make it into one large file system.
HDFS improves reliability by replicating data across multiple sources to overcome node failures.
1.5 ADVANTAGES OF BIG DATA
In Big data, the software packages provide a rich set of tools and options where an individual
could map the entire data landscape across the company, thus allowing the individual to analyze
the threats faces internally. This is considered as one of the main advantages as big data keeps the
data safe. With this an individual can be able to detect the potentially sensitive information that is
not protected in an appropriate manner and makes sure it is stored according to the regulatory
requirements.
There are some common characteristics of big data are Addresses, speed and scalability, mobility
and security, flexibility and stability.
In big data the realization time to information is critical to extract value from various data
sources, including mobile devices, radio frequency identification, the web and a growing list
of automated sensory technologies.
1.6 BIG DATA CHALLENGES
Sophisticated hacking[3] attacks[9] are continuously increasing in the cyber space. Hacking in the
past, leaked personal information or were done for just fame, but recent hacking targets
companies, government agencies. This kind of attack is commonly called Advanced Persistent Threat (APT)[10]. APT targets a specific system and analyses vulnerabilities of the system for a
long time. Therefore it is hard to prevent and detect APT than traditional attacks and could result
massive damage. APT attack is usually done in four steps: intrusion, searching, collection and
attack.
Figure 3. General structure of an intrusion

International Journal of Peer to Peer Networks (IJP2P) Vol.8, No.1, February 2017
5
In the intrusion step, the hacker searches for information about the target system and prepares the
attack.
In searching step, the hacker analyses system data such as system log for valuable information
and look for security vulnerabilities that can be exploited for further malicious behaviours.
In the collection step, the hacker installs malwares such as Trojan horse, trap doors and backdoors
to collect system data and maintain system access for the future.
In the final step, the hacker leaks data and destroys target system using the gained information.
1.7 RESEARCH MOTIVATION
There are many technologies used to prevent the intrusion [11] in big data. Following are some of
the techniques to maintain cyber security[17].
• Firewall: A firewall is a network security system, either hardware or software based
on a set of rules, acting as a barrier between a trusted / untrusted networks. The
firewall controls access to the resources of a network through a positive control model.
• Intrusion Detection System: An IDS inspects all inbound and outbound network
activity and identifies suspicious intrusion attempts. Though they both relate to network security, an IDS differs from a firewall in that a firewall looks
out for intrusions in order to stop them from happening. The firewall limits the access between
networks in order to prevent intrusion and does not signal an attack from inside the network. In the existing security[12] system, researchers were developed various security technologies to
protect the system from various types of network threats and attacks. Most of them are unable to
detect recent unknown attacks, whereas the others do not provide a real-time solution to
overcome the challenges.
1.8 REPRESENTATION OF PROPOSED
Figure 4. Representation of Real-Time Intrusion Detection System

International Journal of Peer to Peer Networks (IJP2P) Vol.8, No.1, February 2017
6
2. ARCHITECTURE OF REAL-TIME INTRUSION SYSTEM
2.1 SYSTEM ARCHITECTURE
The Lambda Architecture[13], introduced by Nathan Marz, aims to satisfy the needs for a robust
system that is fault-tolerant, both against hardware failures and human mistakes, being able to
serve a wide range of workloads and use cases, and in which low-latency reads and updates are
required. The resulting system should be linearly scalable, and it should scale out rather than up.
2.2 OVERVIEW OF LAMBDA ARCHITECTURE
Figure 5. Lambda Architecture
All data entering the system is dispatched to both the batch layer and the speed layer for processing. The batch layer has two functions: (i) managing the master dataset (an immutable,
append-only set of raw data), and (ii) to pre-compute the batch views. The serving layer
indexes the batch views so that they can be queried in low-latency, ad-hoc way. The speed
layer compensates for the high latency of updates to the serving layer and deals with recent
data only. Any incoming query can be answered by merging results from batch views and real-
time views.
2.3 REAL-TIME INTRUSION DETECTION SYSTEM ARCHITECTURE
Figure 6. Real-Time Intrusion Detection System Architecture
International Journal of Peer to Peer Networks (IJP2P) Vol.8, No.1, February 2017
7
The real time intrusion system is mainly working and predicting based on the different types logs
available in distributed data processing layer. The intrusion dictionary will be available on an in-
memory database for quick access. Whenever a user interaction happens, the user interaction logs will be processed and compared with the Intrusion dictionary and the output will be stored in the
Real-time output layer. If the output matches with the Intrusion dictionary entries, then the system
will generate alerts and can take actions such as blocking the user from further interactions,
blacklist the user, blacklist the IP address etc.
2.3.1 REAL-TIME DATA/LOG COLLECTION
Logs have long been a powerful tool for providing a view into how large scale systems and
applications are performing. However, as the scale and complexity of these systems have
increased, it's become a challenge to manage multiple logs that are distributed across a fleet of
infrastructure.
The log collection layer will collect different type of logs like System logs, application logs, error
logs and web logs. These log data will parse and move to the distributed system for storage in a predefined format. Key challenges in the existing logging and monitoring approaches are,
2.3.1.1 Log Lag
Due to the inability to quickly collect, analyze and act upon this data, there is a significant cost
overhead introduced by adding an additional monitoring layer. At times this monitoring layer is
brittle and needs significant tuning to avoid noise.
2.3.1.2 Development And Operation Gap
Many organizations still have a disconnect between the development team and the operations
team. The Ops team generally is aware of and uses the log system because the general use cases
tends to be trending analysis, system behavior analysis etc. Whereas the developers tend to prefer
going to straight away to the log on the system or application and not to the centralized logging
system because real-time data is generally not captured and due to their knowledge of the
application they know which log to analyze for fault-diagnosis.
2.3.1.3 Data Anarchy
When one starts to look at the entire operations stack which includes application, systems
software, infrastructure, network etc. On top of that you have other logs generated through
vulnerability scans, anti-virus scans etc. Getting a unified event collection and logging system is
impossible. The lack of such a system drives up the maintenance cost.
The Real-time data analytics works well when it is based on predefined algorithms and queries.
Current tools are able to synthesize multiple streams of rapidly flowing data and perform complex
operations on them.
When it comes to leveraging analytics to ensure continuous service delivery and uptime, log-level
data and real-time processing are two requirements for success. At every layer of your system’s
hardware and application stack, real-time analytics enable centralized log collection and
monitoring, easy identification of key events, and instant alerts to the communication tools.

International Journal of Peer to Peer Networks (IJP2P) Vol.8, No.1, February 2017
8
2.3.2 DISTRIBUTED DATA PROCESSING
The distributed data processing layer will act as a Storage and Data Processing layer where large
amount of data will be processed in a distributed fashion. The process will contain various type of
Statistical algorithms and the final result will be stored in the same layer for future access. The
distributed data processing layer is used for batch processing. The key purpose of the layers.
2.3.2.1 Data Storage This is the key requirements of big data storage are that it can handle very large amounts of data
and keep scaling to keep up with growth, and that it can provide the input/output operations and
necessary to deliver data to analytics tools.
2.3.2.2 Distributed Processing
This is a phrase used to refer to a variety of computer systems that use more than one computer
(or processor) to run an application. This includes parallel processing in which a single computer
uses more than one CPU to execute programs.
2.3.3 Real-Time Data Processing Layer
The real time data processing involves a continual input and output process of data. Data must be
processed in a small time period. Intrusion detection system gathers and analyzes information
from various areas within a computer or a network to identify possible security breaches, which
scans the attacks from outside.
2.3.4 Batch Output Layer
This layer will contain various end user specific outputs in the form of Periodic and Historical
Reports. Periodic Reports is the summary of events that presents essentially the same type of
information updated at regular intervals.
2.3.5 Real-Time Output Layer
This layer will contain various end user specific outputs in the form of Alerts, Charts, and Real
time actions.
2.4. REAL-TIME INTRUSION DETECTION SYSTEM FLOW CHART
Figure 7. Real-Time Intrusion Detection System Flow Chart

International Journal of Peer to Peer Networks (IJP2P) Vol.8, No.1, February 2017
9
3. REAL-TIME INTRUSION SYSTEM INTERNALS
3.1 USER UNIT
User unit is the combination of values which contains the user identifier, IP address and the
country.
3.2 MACHINE LEARNING ACTIVITIES
The Machine Learning activities are happened on the Machine Learning layer with the help of
Machine Learning algorithms. All the collected logs will passed through this intelligent layer and
it will identify the a particular user-unit’s intrusion behaviour. The algorithms that we used in this
system are Naivebayes and K-means.
3.2.1 MACHINE LEARNING
Machine learning is a type of artificial intelligence (AI) that provides computers with the ability
to learn without being explicitly programmed. Machine learning focuses on the development of
computer programs that can teach themselves to grow and change when exposed to new data.
3.2.2 SUPERVISED LEARNING
Supervised learning is the machine learning task of inferring a function from labeled training
data. The training data consist of a set of training examples. In supervised learning, each example
is a pair consisting of an input object (typically a vector) and a desired output value (also called the supervisory signal).
3.2.3 UNSUPERVISED LEARNING
Unsupervised learning is a type of machine learning algorithm used to draw inferences from
datasets consisting of input data without labeled responses. The most common unsupervised
learning method is cluster analysis, which is used for exploratory data analysis to find hidden
patterns or grouping in data.
3.2.4 CLASSIFICATION
In machine learning and statistics, classification is the problem of identifying to which of a set of
categories (sub-populations) a new observation belongs, on the basis of a training set of data
containing observations (or instances) whose category membership is known.
3.2.5 CLUSTERING
Cluster analysis or clustering is the task of grouping a set of objects in such a way that objects in
the same group (called a cluster) are more similar (in some sense or another) to each other than to
those in other groups (clusters). It is a main task of exploratory data mining, and a common
technique for statistical data analysis, used in many fields, including machine learning,pattern
recognition, image analysis, information retrieval, bioinformatics, data compression, and
computer graphics.
International Journal of Peer to Peer Networks (IJP2P) Vol.8, No.1, February 2017
10
3.2.6 ANOMALY DETECTION
Anomaly detection (also outlier detection) is the identification of items, events or observations
which do not conform to an expected pattern or other items in a dataset. Typically the anomalous
items will translate to some kind of problem such as bank fraud, a structural defect, medical
problems or errors in a text. Anomalies are also referred to as outliers, novelties, noise, deviations
and exceptions.
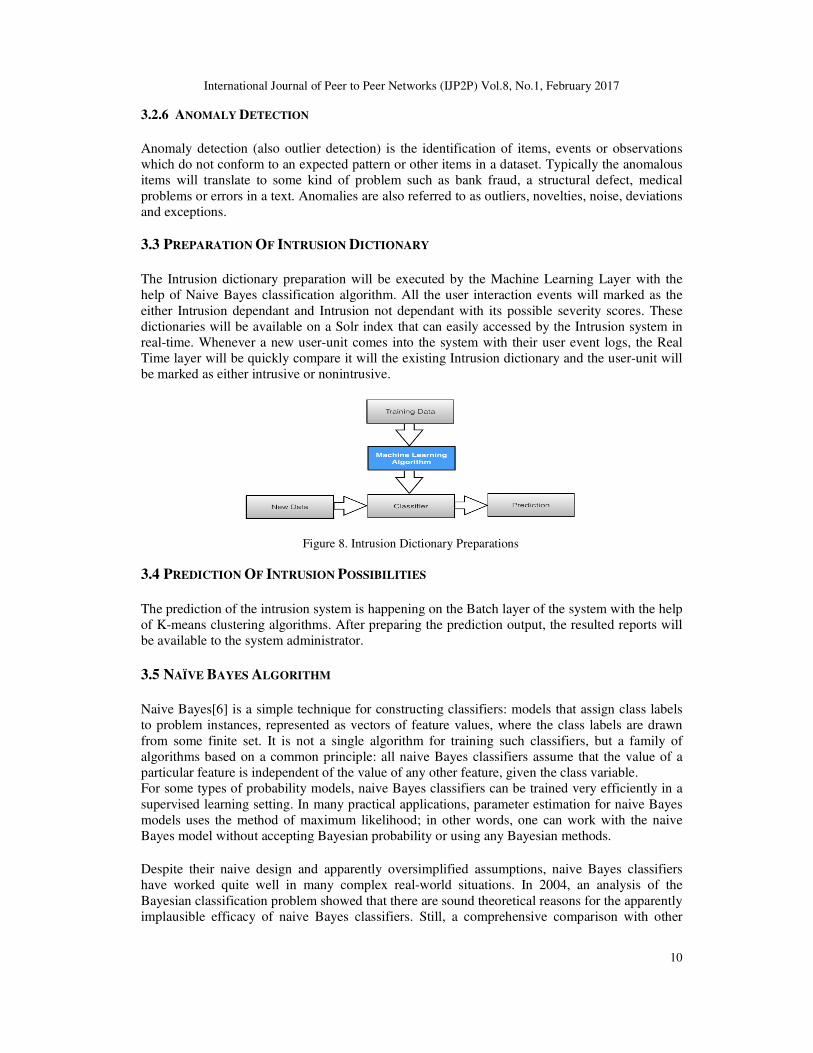
3.3 PREPARATION OF INTRUSION DICTIONARY
The Intrusion dictionary preparation will be executed by the Machine Learning Layer with the
help of Naive Bayes classification algorithm. All the user interaction events will marked as the
either Intrusion dependant and Intrusion not dependant with its possible severity scores. These
dictionaries will be available on a Solr index that can easily accessed by the Intrusion system in
real-time. Whenever a new user-unit comes into the system with their user event logs, the Real
Time layer will be quickly compare it will the existing Intrusion dictionary and the user-unit will
be marked as either intrusive or nonintrusive.
Figure 8. Intrusion Dictionary Preparations
3.4 PREDICTION OF INTRUSION POSSIBILITIES
The prediction of the intrusion system is happening on the Batch layer of the system with the help
of K-means clustering algorithms. After preparing the prediction output, the resulted reports will
be available to the system administrator.
3.5 NAÏVE BAYES ALGORITHM
Naive Bayes[6] is a simple technique for constructing classifiers: models that assign class labels
to problem instances, represented as vectors of feature values, where the class labels are drawn
from some finite set. It is not a single algorithm for training such classifiers, but a family of
algorithms based on a common principle: all naive Bayes classifiers assume that the value of a
particular feature is independent of the value of any other feature, given the class variable.
For some types of probability models, naive Bayes classifiers can be trained very efficiently in a
supervised learning setting. In many practical applications, parameter estimation for naive Bayes
models uses the method of maximum likelihood; in other words, one can work with the naive
Bayes model without accepting Bayesian probability or using any Bayesian methods.
Despite their naive design and apparently oversimplified assumptions, naive Bayes classifiers
have worked quite well in many complex real-world situations. In 2004, an analysis of the
Bayesian classification problem showed that there are sound theoretical reasons for the apparently
implausible efficacy of naive Bayes classifiers. Still, a comprehensive comparison with other

International Journal of Peer to Peer Networks (IJP2P) Vol.8, No.1, February 2017
11
classification algorithms in 2006 showed that Bayes classification is outperformed by other
approaches, such as boosted trees or random forests.
3.5.1 PROBABILISTIC MODEL
The Naive Bayes is a conditional probability model: given a problem instance to be classified,
represented by a vector x = ( x1, …, xn ) representing some n features (independent variables), it
assigns to this instance probabilities
p(Ck | x1, ...., xn)
for each of K possible outcomes or classes CK
The problem with the above formulation is that if the number of features n is large or if a feature
can take on a large number of values, then basing such a model on probability tables is infeasible.
We therefore reformulate the model to make it more tractable. Using Bayes theorem, the
conditional probability can be decomposed as
p(Ck | x = p(Ck) p(x | CK)
------------------- p(x)
In plain English, using Bayesian probability terminology, the above equation can be written as
posterior = prior X likelihood
-------------------------
Evidence
In practice, there is interest only in the numerator of that fraction, because the denominator does
not depend on C and the values of the features F1 are given, so that the denominator is effectively
constant. The numerator is equivalent to the joint probability model.
p(Ck , x1, ......., xn)
Which can be rewritten as follows, using the chain rule for repeated applications of the definition
of conditional probability:
p(Ck , x1, .….., xn) = p(x1, ......., xn, Ck)
= p(x1 | x2, ..., xn, Ck) p(x2, ......, xn, Ck)
= p(x1 | x2, ..., xn, Ck) p(x2 | x3, ..., xn, Ck) p(x3, ...., xn, Ck) = ………………………………………………………....
= p(x1 | x2, ...., xn, Ck) p(x2 | x3, ...., xn, Ck)...(xn-1 | xn, Ck) p(xn | Ck) p(Ck)
Now the "naive" conditional independence assumptions come into play: assume that each feature
Fi is conditionally independent of every other feature Fj for j ≠ i , given the category C. This
means that
p(xi | xi+1, ..., xn, Ck) = p(xi | Ck)
Thus the joint model can be expressed as
p(Ck | x1, ..., xn) p(Ck, x1, ...., xn)

International Journal of Peer to Peer Networks (IJP2P) Vol.8, No.1, February 2017
12
p(Ck) p(x1 | Ck) p(x2 | Ck) p(x3 | Ck).....
p(Ck) p(xi | Ck)
This means that under the above independence assumptions, the conditional distribution over the class variable C is:
p(Ck | x1,..., xn) =
where the evidence Z = p(x) is a scaling factor dependent only on x1, ..…, xn is a constant if the
values of the feature variables are known.
3.5.2 CONSTRUCTING A CLASSIFIER FROM THE PROBABILITY MODEL
The discussion so far has derived the independent feature model, that is, the naive Bayes probability model. The naive Bayes classifier combines this model with a decision rule. One
common rule is to pick the hypothesis that is most probable; this is known as the maximum a
posteriori or MAP decision rule. The corresponding classifier, a Bayes classifier, is the function
that assigns a class label, for some k as follows:
3.6 K-MEANS ALGORITHM
The term K-means[16] was first used by James MacQueen in 1967 though the idea goes back to
Hugo Steinhaus in 1957. The standard algorithm was first proposed by Stuart Lloyd in 1957 as a
technique for pulse-code modulation, though it wasn't published outside of Bell Labs until 1982.
In 1965, E. W. Forgy published essentially the same method, which is why it is sometimes
referred to as Lloyd-Forgy. A more efficient version was later proposed and published in fortran
by Hartigan and Wong.
k-means clustering is a method of vector quantization, originally from signal processing, that is
popular for cluster analysis in data mining. k-means clustering aims to partition n observations
into k clusters in which each observation belongs to the cluster with the nearest mean, serving as
a prototype of the cluster. This results in a partitioning of the data space into Voronoi cells.
The algorithm has a loose relationship to the k-nearest neighbour classifier, a popular machine
learning technique for classification that is often confused with k-means because of the k in the
name. One can apply the 1-nearest neighbour classifier on the cluster centres obtained by k-means
to classify new data into the existing clusters. This is known as nearest centroid classifier or
Rocchio algorithm.
Given an initial set of k means m1,…,mk the algorithm proceeds by alternating between two
steps:

International Journal of Peer to Peer Networks (IJP2P) Vol.8, No.1, February 2017
13
Assignment Step: Assign each observation to the cluster whose mean yields the least within-
cluster sum of squares (WCSS). Since the sum of squares is the squared Euclidean distance, this
is intuitively the "nearest" mean (Mathematically, this means partitioning the observations according to the Voronoi diagram generated by the means).
Si(t) = {xp : || xp - mi(t) ||2 < = || xp - mj(t) ||2 ∀j, i < = j < = k}
where each xp is assigned to exactly one S(t), even if it could be assigned to two or more of them.
Update Step: Calculate the new means to be the centroids of the observations in the new clusters.
mi(t+1) = 1
----- ∑ xj
|Si(t)| xj∊si(t)
Since the arithmetic mean is a least-squares estimator, this also minimizes the within-cluster sum
of squares (WCSS) objective.
The algorithm has converged when the assignments no longer change. Since both steps optimize
the WCSS objective, and there only exists a finite number of such partitionings, the algorithm
must converge to a (local) optimum. There is no guarantee that the global optimum is found using
this algorithm.
The algorithm is often presented as assigning objects to the nearest cluster by distance. The standard algorithm aims at minimizing the WCSS objective, and thus assigns by "least sum of
squares", which is exactly equivalent to assigning by the smallest Euclidean distance. Using a
different distance function other than (squared) Euclidean distance may stop the algorithm from
converging. Various modifications of k-means such as spherical k-means and k-medoids have
been proposed to allow using other distance measures.
3.6.1 INITIALIZATION METHODS
Commonly used initialization methods are Forgy and Random Partition. The Forgy method
randomly chooses k observations from the data set and uses these as the initial means. The
Random Partition method first randomly assigns a cluster to each observation and then proceeds
to the update step, thus computing the initial mean to be the centroid of the cluster's randomly
assigned points. The Forgy method tends to spread the initial means out, while Random Partition
places all of them close to the center of the data set. According to Hamerly et al, the Random
Partition method is generally preferable for algorithms such as the k-harmonic means and fuzzy
k-means. For expectation maximization and standard k-means algorithms, the Forgy method of
initialization is preferable.
3.6.2 DEMONSTRATION OF THE STANDARD ALGORITHM
Step1: In this case k=3, k - initial means are randomly generated within the data domain (shown
in color).
Figure 9. Standard Algorithm - 1

International Journal of Peer to Peer Networks (IJP2P) Vol.8, No.1, February 2017
14
Step2: K - clusters are created by associating every observation with the nearest mean. The
partitions here represent the Voronoi diagram generated by the means.
Figure 10. Standard Algorithm – 2
Step3: The Centroid of each of the k clusters becomes the new mean.
Figure 11. Standard Algorithm – 3
Step4: Step2 and step3 are repeated until convergence has been reached.
Figure 12. Standard Algorithm – 4
As it is a heuristic algorithm, there is no guarantee that it will converge to the global optimum,
and the result may depend on the initial clusters. As the algorithm is usually very fast, it is
common to run it multiple times with different starting conditions. However, in the worst case,
k-means can be very slow to converge: in particular it has been shown that there exist certain
point sets, even in 2 dimensions, on which k-means takes exponential time, that is 2Ω(n), to
converge. These point sets do not seem to arise in practice: this is corroborated by the fact that the smoothed running time of k-means is polynomial. The assignment step is also referred to
as expectation step, the update step as maximization step, making this algorithm a variant of
the generalized expectation-maximization algorithm.
4. REAL-TIME INTRUSION DETECTION SYSTEM ACTIONS
4.1 INTRUSION SEVERITY CLASSES
The Intrusion system has 3 types of severities with corresponding automated decision process on
a particular user-unit as follows:

International Journal of Peer to Peer Networks (IJP2P) Vol.8, No.1, February 2017
15
4.2 HIGH
Whenever the High severity intrusions are discovered the system will automate an action to block
that user-unit permanently.
4.3 MEDIUM
Whenever the Medium severity intrusions are discovered the system will automate an action to
add the user-unit to a watch list for further action monitoring and based on the repeated intrusion
events, the system will move the user-unit to High severity classification and block that user-unit
permanently.
4.3.1 LOW
Whenever the Low severity intrusions are discovered the system will automate an action to add
this user & IP address into a lazy analysis list and the system will predict the upcoming severity
of this user-unit by comparing the event pattern of the current user-unit and the historical user-
unit patterns available in the distributed system. Based on the severity predicted the user-unit may
move to any other Intrusion severity classes.
4.4 SEVERITY CLASSIFICATION FLOW CHART
Figure 13. Overview of the Severity Classification Flow Chart
4.5 INTRUSION ANALYSIS GRAPH
4.5.1 MONTH WISE SEVERITY ANALYSIS
Table 1. Month-wise Severity Analysis

International Journal of Peer to Peer Networks (IJP2P) Vol.8, No.1, February 2017
16
Figure 14. Monthwise Measured Performance of intrusion
4.5.2 IP ADDRESS WISE INTRUSION ANALYSIS
Table 2. IP Address Wise Measured Performance
Figure 15. IP Address Wise Measured Performance of intrusion
4.6 REPORTS FOR ADMINISTRATOR
The various analysis reports available from the system are elaborated below.
Intrusion IP Total Number of Attempt
110.23.45.9 459
75.240.23.5 380
34.200.33.120 250
124.23.11.8 210
45.179.21.42 200
56.34.128.98 195
110.45.98.2 190
80.248.12.55 77
120.34.11.98 54
44.55.126.82 45

International Journal of Peer to Peer Networks (IJP2P) Vol.8, No.1, February 2017
17
4.6.1 COUNTRY WISE INTRUSION ANALYSIS REPORT
Table 3. Country wise intrusion Analysis
Figure 16. Country wise Intrusion Analysis
4.6.2 COUNTRY WISE INTRUSION SEVERITY ANALYSIS REPORT
Figure 17. Country wise Severity Intrusion Analysis
International Journal of Peer to Peer Networks (IJP2P) Vol.8, No.1, February 2017
18
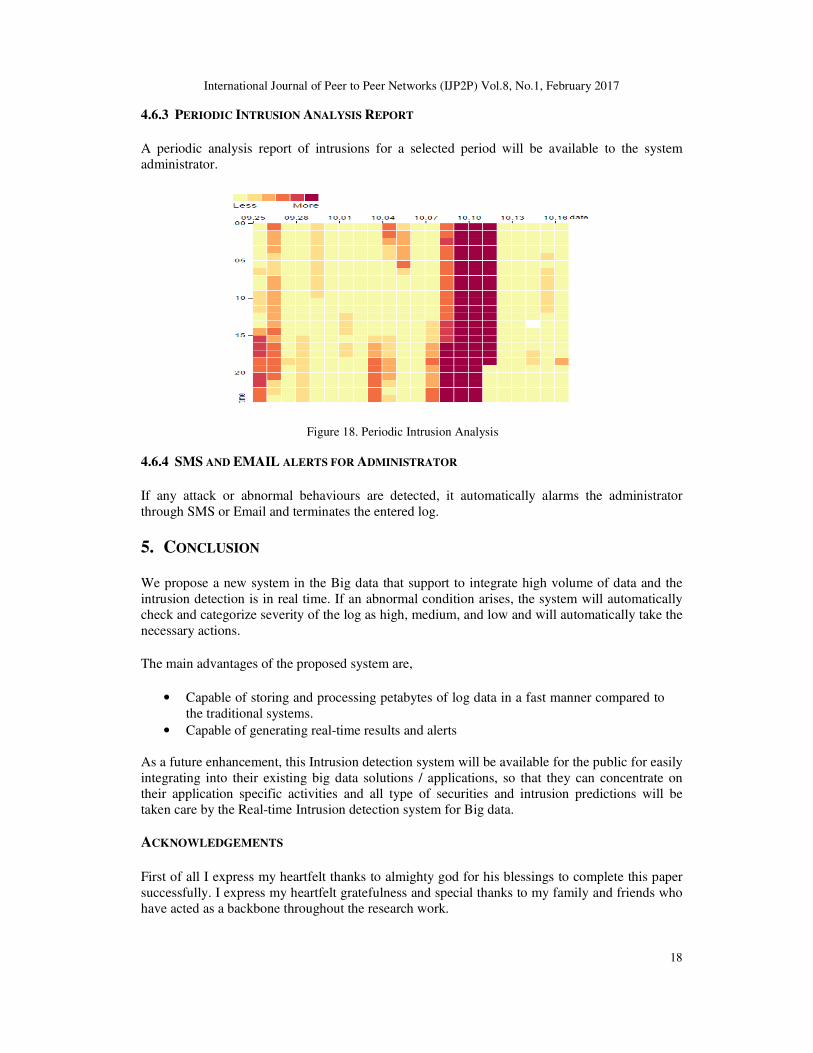
4.6.3 PERIODIC INTRUSION ANALYSIS REPORT
A periodic analysis report of intrusions for a selected period will be available to the system
administrator.
Figure 18. Periodic Intrusion Analysis
4.6.4 SMS AND EMAIL ALERTS FOR ADMINISTRATOR
If any attack or abnormal behaviours are detected, it automatically alarms the administrator
through SMS or Email and terminates the entered log.
5. CONCLUSION
We propose a new system in the Big data that support to integrate high volume of data and the
intrusion detection is in real time. If an abnormal condition arises, the system will automatically
check and categorize severity of the log as high, medium, and low and will automatically take the
necessary actions.
The main advantages of the proposed system are,
• Capable of storing and processing petabytes of log data in a fast manner compared to
the traditional systems.
• Capable of generating real-time results and alerts
As a future enhancement, this Intrusion detection system will be available for the public for easily
integrating into their existing big data solutions / applications, so that they can concentrate on
their application specific activities and all type of securities and intrusion predictions will be
taken care by the Real-time Intrusion detection system for Big data.
ACKNOWLEDGEMENTS
First of all I express my heartfelt thanks to almighty god for his blessings to complete this paper
successfully. I express my heartfelt gratefulness and special thanks to my family and friends who
have acted as a backbone throughout the research work.

International Journal of Peer to Peer Networks (IJP2P) Vol.8, No.1, February 2017
19
REFERENCES [1] “Big Data: A Primer”. Written by “Deepak Chenthati, Hrushikesha Mohanty, Prachet Bhuyan”.
[2] “Santhoshkumar and R.H Gowder” publication on “International Journal of Future Computer and
Communication, Vol. 1, No. 4, December 2012”.
[3] “Big Data Forensics – Learning Hadoop Investigations” written by “Joe Sremack”.
[4] Butun I, Morgera SD, Sankar R (2014) A survey of intrusion detection systems in wireless sensor
networks. IEEE Commun Surv Tutor 16(1):266–282 CrossRef.
[5] Big data classification: problems and challenges in network intrusion prediction with machine
learning - Shan Suthaharan.
[6] A Real-time Intrusion Detection System by Integrating Hadoop and Naive Bayes Classification by
Sanjai Veetil and Qigang Gao.
[7] “Sun Microsystems Unveils Open Cloud Platform,” [Online]. Available:
http://www.sun.com/aboutsun/pr/2009-03/sunflash.20090318.2.xml,2009.
[8] Kilzer, Ann, Emmett Witchel, Indrajit Roy, Vitaly Shmatikov, and Srinath T.V. Setty. "Airavat:
Security and Privacy for MapReduce.".
[9] Stonebraker, M. and J. Hong. 2012. “Researchers Big Data Crisis; Understanding Design and
Functionality”, Communications of the ACM, 55(2):10-11.
[10] Network Security Through Data Analysis, Author Michael Colins.
[11] Ngadi M, Abdullah AH, Mandala S (2008) A survey on MANET intrusion detection. Int J Comput
Sci Secur 2(1):1–11.
[12] http://link.springer.com/article/10.1007/s11227-015-1615-5.
[13] Lambda Architecture by Nathan Marz - http://lambda-architecture.net/.
[14] http://www.ijircce.com/upload/2014/january/4_Study.pdf.
[15] Kaisler, S., W. Money, and S. J. Cohen. 2012. “A Decision Framework for Cloud Computing”, 45th
Hawaii International Conference on System Sciences, Grand Wailea, Maui, HI, Jan 4-7, 2012.
[16] http://airccse.org/journal/nsa/6314nsa04.pdf. by Venkata Narasimha Inukollu, Sailaja Arsi, and
Srinivasa Rao Ravuri.
[17] Denning DE (1987) An intrusion-detection model. IEEE Trans Softw Eng 13(2):222–232.
doi:10.1109/TSE.1987.232894.
[18] http://www.ijritcc.org/download/conferences/ICRTCEE_16/ICRTCEE_Track/1454392173_01-02-
2016.pdf.
[19] http://www.ijareeie.com/upload/may/24_Importance.pdf.
[20] http://airccse.org/journal/ijsptm/papers/4115ijsptm04.pdf.
[21] Zhang Y, Lee W, Huang YA (2003) Intrusion detection techniques for mobile wireless networks. J
Wirel Netw 9(5):545–556 CrossRef.
[22] Patcha A, Park JM (2007) An overview of anomaly detection techniques: existing solutions and latest
technological trends. Elsevier J Comput Netw 51(12):3448–3470 CrossRef.
[23] Puttini R, Hanashiro M, Miziara F, de Sousa R, Garcia-Villalba L, Barenco C(2006) On the anomaly
intrusion-detection in mobile ad hoc network environments.
[24] Engen V.: Machine learning for network based intrusion. Ph.D. dissertation, Bournemouth Univ.,
Poole (2010).
[25] Intrusion Detection System for High Volume and High Velocity Packet Streams: A Clustering
Approach by Dinkar Sitaram, Manish Sharma, Mariyah Zain, Ankita Sastry, and Rishika Todi.
[26] Sagiroglu S, Sinanc D (2013) Big data: a review. In: Collaboration technologies and systems (CTS),
2013 International Conference on. IEEE.
[27] http://www.ijarcce.com/upload/2015/december-15/IJARCCE%2052.pdf.
[28] https://journalofbigdata.springeropen.com/articles/10.1186/s40537-015-0013-4.
[29] A Novel Research on Real-Time Intrusion Detection Technology[2015] - Julan YI.

International Journal of Peer to Peer Networks (IJP2P) Vol.8, No.1, February 2017
20
[30] Denning D (1986) An intrusion-detection model. In: IEEE computer society Symposium on research
security and privacy, pp 118–131.
AUTHOR Reghunath K is currently working as Asst.Professor in a college under Mahatma Gandhi
University, Kottayam, Kerala, India. I have achieved MCA degree from Madurai Kamaraj
University, Tamilnadu. and completed 8 yrs experience as software engineer in an IT firm.
Presently Iam a research scolar in Periyar University, Tamilnadu. My interest area is Cloud
Computing and Big data.