Embed Size (px)
Citation preview

P r o f e s s i o n a l E x p e r t i s e D i s t i l l e d
Make the most advanced predictive analytical processes easy using Watson Analytics with this easy-to-follow practical guide
Learning IBM Watson Analytics
James D
Miller
Learning IBM
Watson A
nalytics
Learning IBM Watson Analytics
Today, only a small portion of businesses actually use a real analytical tool as part of routine decision making. IBM Watson Analytics is changing that, making the most advanced and predictive analytical techniques understandable and usable for any industry.
This book will be the vital tour guide for your trip, starting with what IBM Watson Analytics is. We will start off with an introduction to IBM Watson Analytics and then quickly move on to various use cases in which one can use the different analytics functionalities offered by Watson. During the course of the book, you will learn how to design solutions, and customize and extend Watson Analytics.
We will conclude by taking Watson Analytics to enterprise and integrating it with other solutions (other IBM solutions and analytics). Now is the time for you to learn IBM Watson in order to compete in the world.
Who this book is written forIf you want to perform data discovery and analysis and make sense of the data you have, this book for you. Data scientists can also use this book to explore a new way to perform data analysis tasks on the cloud with ease. This book does not require a programming background.
$ 44.99 US£ 28.99 UK
Prices do not include local sales tax or VAT where applicable
James D Miller
What you will learn from this book
Study the language of Watson while you discover how easy it is to access and confi gure
Review what a Watson use case is, why it's important, and how to identify one
Design Watson Analytics solutions based on your use cases
Understand the basic concepts behind the content analysis cycle and where Watson fi ts in
Explore all the features of Watson, such as Explore, Predict, and Assemble
Customize and extend your Watson solutions
Use Watson at the enterprise level
Integrate Watson with other toolsets
P U B L I S H I N GP U B L I S H I N G
professional expert ise dist i l led
P U B L I S H I N GP U B L I S H I N G
professional expert ise dist i l led
Visit www.PacktPub.com for books, eBooks, code, downloads, and PacktLib.
Free Sample

In this package, you will find: The author biography
A preview chapter from the book, Chapter 5 'Watson Analytics Predict and Assemble'
A synopsis of the book’s content
More information on Learning IBM Watson Analytics

About the Author
James D Miller is an IBM-certifi ed expert, creative innovator, accomplished director, senior project leader, and application/system architect. He has over 35 years of extensive experience in application and system design and development across multiple platforms and technologies. His experience includes introducing customers to new technologies and platforms, integrating with IBM Watson Analytics, Cognos BI, and TM1. He has worked in web architecture design, systems analysis, GUI design and testing, database modeling, systems analysis, design and development of OLAP, web and mainframe applications and systems utilization, IBM Watson Analytics, IBM Cognos BI and TM1 (TM1 rules, TI, TM1Web, and Planning Manager), Cognos Framework Manager, dynaSight - ArcPlan, ASP, DHTML, XML, IIS, MS Visual Basic and VBA, Visual Studio, PERL, SPLUNK, WebSuite, MS SQL Server, ORACLE, SYBASE Server, and so on. James's responsibilities have also included all aspects of Windows and SQL solution development and design, such as analysis; GUI (and website) design; data modeling; table, screen/form, and script development; SQL (and remote stored procedures and triggers) development/testing; test preparation; and management and training of programming staff.
His other experience includes the development of ETL infrastructure, such as data transfer automation between mainframe (DB2, Lawson, Great Plains, and so on) system and client/server SQL Server, web-based applications, and the integration of enterprise applications and data sources. James has been a web application development manager responsible for the design, development, QA, and delivery of multiple websites, including online trading applications and warehouse process control and scheduling systems, as well as administrative and control applications. He was also responsible for the design, development, and administration of a web-based fi nancial reporting system for a 450-million dollar organization, reporting directly to the CFO and his executive team.
Furthermore, he has been responsible for managing and directing multiple resources in various management roles, including as project and team leader, lead developer, and application development director. James has authored Cognos TM1 Developers Certifi cation Guide, Mastering Splunk, and a number of white papers on best practices, including Establishing a Center of Excellence. He continues to post blogs on a number of relevant topics based on personal experiences and industry best practices. James is a perpetual learner, continuing to pursue new experiences and certifi cations. He currently holds the following technical certifi cations: IBM Certifi ed Business Analyst - Cognos TM1 IBM Cognos TM1 Master 385 Certifi cation (perfect score of 100%), IBM Certifi ed Advanced Solution Expert - Cognos TM1, IBM Cognos TM1 10.1 Administrator Certifi cation C2020-703 (perfect score of 100%), IBM OpenPages Developer Fundamentals C2020-001-ENU (98% in exam), IBM Cognos 10 BI Administrator C2020-622 (98% in exam), and IBM Cognos 10 BI Professional C2020-180.
He specializes in the evaluation and introduction of innovative and disruptive technologies, cloud migration, IBM Watson Analytics, Cognos BI and TM1 application design and development, OLAP, Visual Basic, SQL Server, forecasting and planning, international application development, business intelligence, project development and delivery, and process improvement.

PrefaceBased on deep technology experience and media publications, IBM Watson Analytics may be well positioned to replace the data scientist by providing the ability to perform sophisticated data discovery and analysis without all the complexity that usually goes along with it. Additionally, IBM is investing more and more each day into cognitive computing—Watson. Now they are even partnering leading technology universities to launch cognitive computing courses aimed at making this technology mainstream. This is the time to learn IBM Watson to compete in the world.
What this book coversChapter 1, A Quick Start, provides step-by-step instructions for accessing IBM Watson Analytics for the very fi rst time. This chapter explains the different versions of IBM Watson that are currently available and important concepts and terminologies. It also makes recommendations for performing typical confi gurations or adjustments for use.
Chapter 2, Identifying Use Cases, uses realistic examples to explain how identifying use cases will help you better leverage IBM Watson Analytics to gain powerful insights from your data.
Chapter 3, Designing Solutions with Watson Analytics, covers the process of taking a sound approach to leveraging IBM Watson for content analytics, what to think about before you start, how to develop an end-to-end solution design, and how to set expectations for the resulting analysis.
Chapter 4, Understanding Content Analysis, discusses the practice of content analysis and how IBM Watson Analytics can be used as a tool to help analyze big data.
Chapter 5, Watson Analytics Predict and Assemble, leverages use cases to explore IBM Watson Analytics Predict and Assemble.

Preface
Chapter 6, Customizing and Extending, explores the concept of extending the power of Watson Analytics through the use of external tools such as IBM SPSS.
Chapter 7, Taking It to the Enterprise, prepares you to think from an enterprise perspective when using IBM Watson Analytics.
Chapter 8, Adding Value with Integration, discusses the importance of integrating Watson with various data sources, including IBM Cognos Business Intelligence (BI) reporting, and provides the steps required to perform such integrations.

[ 107 ]
Watson Analytics Predict and Assemble
In this chapter, we will discuss the Watson Analytics Predict and Assemble functionalities and evaluate a sample use case using these features.
The chapter is organized as follows:
• Predict• Assemble• A sample use case
Earlier, we used Watson Analytics Explore to ask questions about several data fi les and generate interactive visualizations. We used create, fi lter, and explore to look for patterns and relationships in the data.
In addition to Explore, Watson Analytics also gives us Predict and Assemble. To further analyze a data fi le, you must create a prediction based on that data. The prediction identifi es the data that you are analyzing and includes any insights that are generated from it. Once an insight is identifi ed, you can use the Watson Analytics Assemble capability to express the results of your efforts with Predict and Explore.
PredictMining of insights—those previously unknown—from your data typically requires complex modeling using sophisticated algorithms to process the data. With Watson Analytics, however, you don't have to know which statistical test to run on your data or even how any of the algorithms actually work.

Watson Analytics Predict and Assemble
[ 108 ]
The method that you use with Watson Analytics is so much simpler; identify/refi ne your data, create a prediction, and then view the results—that's it!
We have already covered identifying and refi ning data, so let's now look at predictions and how we can create a prediction.
First, think of predictions as your virtual folders for each predictive analysis effort that you are working on. Here, you identify your data, specify fi eld properties within the data, and select targets and inputs. After you've created the prediction, you can view it to see the output of the analysis. The output consists of visual and text insights.
Creating a Watson Analytics predictionThe steps for creating a Watson Analytics prediction are straightforward:
1. Starting on the Welcome page, you click on Predict (check out the following screenshot):
2. Next, on the Create new prediction dialog, you select a previously uploaded dataset from the list (or upload new data) that you want Watson Analytics to analyze:

Chapter 5
[ 109 ]
3. On the Create a new analysis page (shown in the next screenshot), we set some attributes for our prediction by:
° Giving it a name: We do this by entering it in the Name your workbook field.
° Setting targets: Targets are the fields that you may be most interested in and want to know more about. These are the fields that are perhaps influenced by other fields in the data. When creating a new prediction, Watson Analytics defines default targets and field properties for you, which you can remove (by clicking on the delete icon next to it), and then you can add your own choices (by clicking on Select target). Keep in mind that all predictions must have at least one target (and up to five):

Watson Analytics Predict and Assemble
[ 110 ]
4. Finally, click on Create.
Once you have clicked on Create, Watson Analytics will generate the prediction.
The following screenshot shows a prediction generated based on a Watson Analytics sample dataset:
Viewing the results of a predictionOnce a Watson Analytics prediction has been generated, you can view its results.
Predictor visualization barAcross the top of the prediction page is the top predictors bar (shown in the following screenshot), where you can click to select a particular predictor that is interesting to you:

Chapter 5
[ 111 ]
Main InsightsOn the Main Insight section of the prediction page (shown in the next screenshot for our example), you can examine the top insights that Watson Analytics was able to derive from the data:
DetailsFrom the Main Insights section, you can access (by clicking on the top predictor found—shown circled in the following screenshot) the Details page, which gives you the ability to drill into the details for the individual fi elds and interactions of your prediction:

Watson Analytics Predict and Assemble
[ 112 ]
CustomizationAfter you view the results, you might want to customize the prediction, to refi ne the analysis in order to produce additional insights. IBM Watson Analytics allows you to change the number of targets and see the effect of the change on the prediction results. In addition, Watson Analytics allows you to save your updated prediction or revert at any time to any particular version, as desired.
AssembleThe Watson Analytics Assemble feature is where you can actually organize, or assemble, the most interesting or otherwise important artifacts exposed while using Watson Analytics to Predict or Explore your data fi les (as well as other items collected or otherwise set aside during previous assemble sessions). This, in a way, is where you can do some programming to create powerful methods of conveying information to others.
Watson Analytics breaks assembly into two types: Views and Dashboards. Both of these are made up of visualizations (visualizations are defi ned as a graph, chart, plot, table, map, or any other visual representation of data).
ViewsViews are customizable containers for dashboards (defi ned next) and stories (a set of views over time).
DashboardsDashboards are a specifi c type of view used to help monitor events or activities at a glance.
Using templatesTo make it easier to assemble your views and dashboards, Watson Analytics provides you with templates. They contain predefi ned layouts and grid lines, for easy arrangement and alignment of visualizations in a view.
As we did with predictions (earlier in this chapter), let's take a look at the Assemble process.

Chapter 5
[ 113 ]
From the main or welcome page, click on the plus, or Add New, icon (shown in the following screenshot). Then click on Assemble:
When creating a new assemble, you'll need to choose a data fi le (as shown in the next screenshot) from the list displayed in the Create new view dialog (of course, as usual, you can also upload a new fi le):

Watson Analytics Predict and Assemble
[ 114 ]
Once you select which data fi le you want to use (simply by clicking on the fi lename), Watson Analytics shows you the Create View page, as shown here:
Notice that the Name your view fi eld defaults to the name of the fi le that you selected, and you'll want to change that. Click inside the textbox provided and type an appropriate name for what you are creating, like this:

Chapter 5
[ 115 ]
Once you have entered a name for your view, you'll need to decide whether you'd like to assemble a Dashboard or a Story. Along the left-hand side of the page under Select a template, you can scroll vertically through a list of content types that you can use to organize your visualizations:
We'll get much deeper into the process of assembling in the next section of this chapter, but for now, let's select Dashboard (by clicking on the word Dashboard), and then select the Single Page layout (by double-clicking on the highlighted rectangle labeled Freeform).

Watson Analytics Predict and Assemble
[ 116 ]
Watson Analytics will save your new dashboard and the template will be opened with a blank canvas (shown in this screenshot):
Notice the Data set icon (circled in the next screenshot) at the bottom of the canvas. Under the Data set icon, the Data set list icon, the name of the dataset, and the data columns are displayed. The list of data columns is in what is referred to as the Data Tray. If you click on the data set icon, the information below it is hidden. Click on it again and the information reappears:
Using these features, you can add columns to the canvas by:
• Dragging them from the Data Tray.• Selecting a column (or multiple columns) from the Data set list.• Selecting a column from a different dataset. This is done by clicking on
the Data set list icon and then clicking on the < icon to view and select a different dataset.

Chapter 5
[ 117 ]
Besides adding columns of data, you can add visualizations, by clicking on the Visualization icon (shown in the following screenshot) and selecting a visualization type that you want to use:
Moving to the right (from the Visualizations icon), we have additional icons that provide various other options. These are, Text, Media, Webpage, Image and Shapes. Each allows you to add and enhance your dashboard view.
The far-right icon (shown in the next screenshot) is the Properties icon. This icon allows you to change your dashboard's theme and general style. At the time of writing this book, only a few themes and styles are available, but more are planned:
Another option for enhancing your dashboard, should the aforementioned not be suffi cient, is to access your Watson Analytics collection by clicking on the collection icon on the far right of the main toolbar shown in the following screenshot and dragging selections from the collection list onto the dashboard canvas:

Watson Analytics Predict and Assemble
[ 118 ]
Finally, if nothing else suits your needs, you can have Watson Analytics create a new visualization based on a question you type in the What do you want to assemble? fi eld, as follows:
A simple use caseTo gain a better understanding of how to use the Watson Analytics Predict and Assemble features, let's now take a look at a simple use case.
One of the best ways to learn a new tool is by using it, and to use Watson Analytics, you need data. Up to this point, we've utilized sample data for use cases that I created from various sources, but Watson Analytics has made many sample datasets available for use for your learning. To view the sample data options, simply click on Add from the main or Welcome page and then click on Sample Data, as shown in the following screenshot:

Chapter 5
[ 119 ]
For more information about the available Watson Analytics supplied sample data, you can go to https://community.watsonanalytics.com/resources.
For our use case, we'll go back to an example used earlier in this book—Stadium Sales. For this use case, we've received a similarly formatted fi le, but one that includes historical results of products sold by a particular NFL team at their home stadium over two previous seasons. The fi le, named Historic_Stadium_Sales, can be uploaded to Watson Analytics as explained in earlier chapters:

Watson Analytics Predict and Assemble
[ 120 ]
Once the fi le is uploaded (shown in the previous screenshot), you can click on the upper portion of the fi le's tile and then select Predict:
Remember, that you could've used the Watson Analytics Refi ne or Explore features on this fi le (as we have already covered), but since this fi le is really the same as the original stadium sales fi le, we feel that we are relatively comfortable with its format, so we'll just go ahead and try Watson Analytics' Predict feature.
After clicking on Predict, let's name our workbook (I've decided to call it Historic Sales) and set a target (I picked Product):

Chapter 5
[ 121 ]
Next, click on Create. Watson Analytics, in real time, runs its analytical algorithms on our data and displays the following insights:
Watson Analytics has organized its results into various sections, so we can understand them more easily. Let's start from the center of the page, as shown in the following screenshot:

Watson Analytics Predict and Assemble
[ 122 ]
This section is focused on the predictors of our selected target (Product). In other words, which fi elds in our data have some infl uence on the value of Product? This is interesting, since I may be trying to determine which particular product sells best and when. Watson Analytics has found that three fi elds have some correlation to Product: Winning team, Week, and Season. I can easily set that by sliding my mouse arrow over the three bullets in the target:
For example (as shown in the preceding screenshot), Winning Team is displayed as a predictor bullet of Product (as well as the other fi elds, Week and Season). From the bullet popup, you can see that Predictive Strength of Winning Team is over 27 percent, and you have the option to click on two links: More details… and Associated fi elds….

Chapter 5
[ 123 ]
To the right of our target, the predictors are displayed in another way: What infl uences Product? Check out this screenshot:

Watson Analytics Predict and Assemble
[ 124 ]
Since the top predictor (and the most intriguing one to me) is the Winning team fi eld, let's look a bit closer at it. If you click on the More details… link from the bullet popup, or on the top visualization to the right of the target, Watson Analytics zooms in to the Main Insight:
We can easily see from the visualization provided that when the home team wins, the most popular product seems to be Team Hat - Cap. This is easy for me to understand, but if you are interested in the statistical details of this insight, you can click on Details in the top-right corner of the visualization (shown here):
Since you are so inclined, Watson Analytics provides a brief explanation of how it arrived at the main insight (winning team drives product). Across the top of the details page, you see this statement:
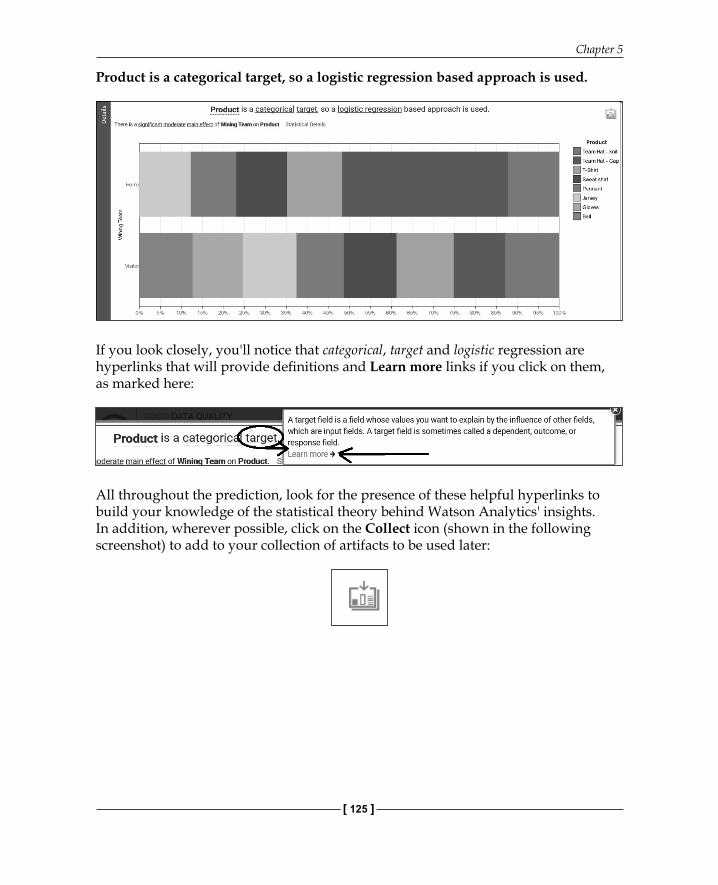
Chapter 5
[ 125 ]
Product is a categorical target, so a logistic regression based approach is used.
If you look closely, you'll notice that categorical, target and logistic regression are hyperlinks that will provide defi nitions and Learn more links if you click on them, as marked here:
All throughout the prediction, look for the presence of these helpful hyperlinks to build your knowledge of the statistical theory behind Watson Analytics' insights. In addition, wherever possible, click on the Collect icon (shown in the following screenshot) to add to your collection of artifacts to be used later:

Watson Analytics Predict and Assemble
[ 126 ]
Back to the Top Predictors section, to the bottom left, we see More Predictive and Easier to Understand:
Watson Analytics starts with the easiest—One Field selected as a start. The One Field is Winning Team. You can experiment by switching to Two Fields (what two fi elds drive the product?) or Combination (is there a combination of fi elds that drive the product?) and see the results of your selection in real time.
Across the top of the prediction is the basic information band, as shown in this screenshot:
Here, Watson Analytics provides basic information, such as the following:
• TARGETS: This shows what the selected targets for this predictive analysis are (ours was Product)
• DATA QUALITY: This gives a rating of the predictive quality of the data, along with any issues or interesting facts
• AN ALYSIS DETAILS: This indicates the number of potentially useful inputs for the analysis
• TOP FIELD ASSOCIATIONS: This shows the associations of certain fields within the data
• TARGET MODEL INPUTS: This is a coming soon feature of Watson Analytics

Chapter 5
[ 127 ]
Across the bottom of the page is Data Tray; it lists all of the fi elds within our data fi le, as shown here:
From the Data Tray, you have the ability to drag fi elds into your prediction. For example, you can select Quantity and drop it onto the target to see that fi elds Top Associations. As shown in the following screenshot, Watson Analytics tells us that the Winning Team fi eld is also associated with the value of Quantity; that is, when the home team wins, we have a higher number of products sold:
Finally, in the top-left corner is the MENU icon, from where you can access important Watson Analytics features, that is, FIELD PROPERTIES and VERSIONS:
Watson Analytics Predict and Assemble
[ 128 ]
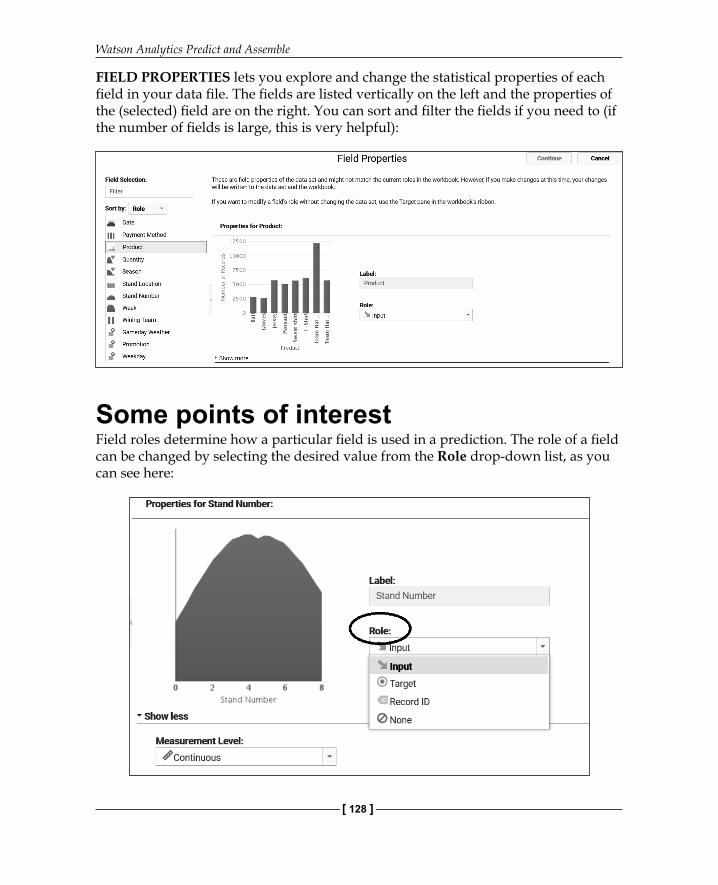
FIELD PROPERTIES lets you explore and change the statistical properties of each fi eld in your data fi le. The fi elds are listed vertically on the left and the properties of the (selected) fi eld are on the right. You can sort and fi lter the fi elds if you need to (if the number of fi elds is large, this is very helpful):
Some points of interestField roles determine how a particular fi eld is used in a prediction. The role of a fi eld can be changed by selecting the desired value from the Role drop-down list, as you can see here:

Chapter 5
[ 129 ]
Measurement Level is used to classify a fi eld for predictive analysis and can affect Watson Analytics' ability to identify insights. The measurement levels for a fi eld can be changed by selecting them from the Measurement Level drop-down list, as shown in this image:

Watson Analytics Predict and Assemble
[ 130 ]
Data issues are also visualized here. In our example, the Gameday Weather fi eld is supposed to hold the weather conditions on the day of the game. In our fi le, Watson Analytics has found that all records contain Sunny, which appears suspicious, so it excludes the fi eld from further analysis:
VersioningWhen you change anything in the fi eld properties, Watson Analytics automatically creates a new version of your prediction for you. Under Menu and then Version, you can view and access/reload any of those saved versions, as follows:
You should now understand Predict—at least enough to start experimenting with your data, so let's move on and take a look at Assemble.
AssembleAs we've mentioned earlier in this book, Assemble gives you the ability to present what you may have discovered using Watson Analytics in various ways, such as dashboards and stories. To illustrate, let's assemble a dashboard using our historical stadium sales prediction example that we just walked through.

Chapter 5
[ 131 ]
From the Watson Analytics Welcome page, we click on Add and then on Assemble, like this:
From the Create new View dialog, we select (double click on) our data, Historic_Stadium_Sales:

Watson Analytics Predict and Assemble
[ 132 ]
Watson Analytics will then display the Create page, like this:
What I want to share with my colleagues is the results of our earlier prediction analysis—the main insight that Watson Analytics identifi ed. That is, when the home team wins, team baseball cap sales go through the roof. To do that, I want to click on Freeform (shown in the preceding screenshot) and then on Create (in the top-right portion). For this example, we will stick to a simple single-panel, free-form dashboard.
Now we have a blank canvas to create our simple dashboard, as shown in this screenshot:

Chapter 5
[ 133 ]
We'll perform three simple steps to assemble our dashboard.
First, let's add the Historic Sales visualization that we saved earlier by accessing the collection of artifacts. We do this by clicking on the collection icon in the top-right corner of the page, as shown in the following screenshot, and dragging the artifact onto our canvas:
Watson Analytics Predict and Assemble
[ 134 ]
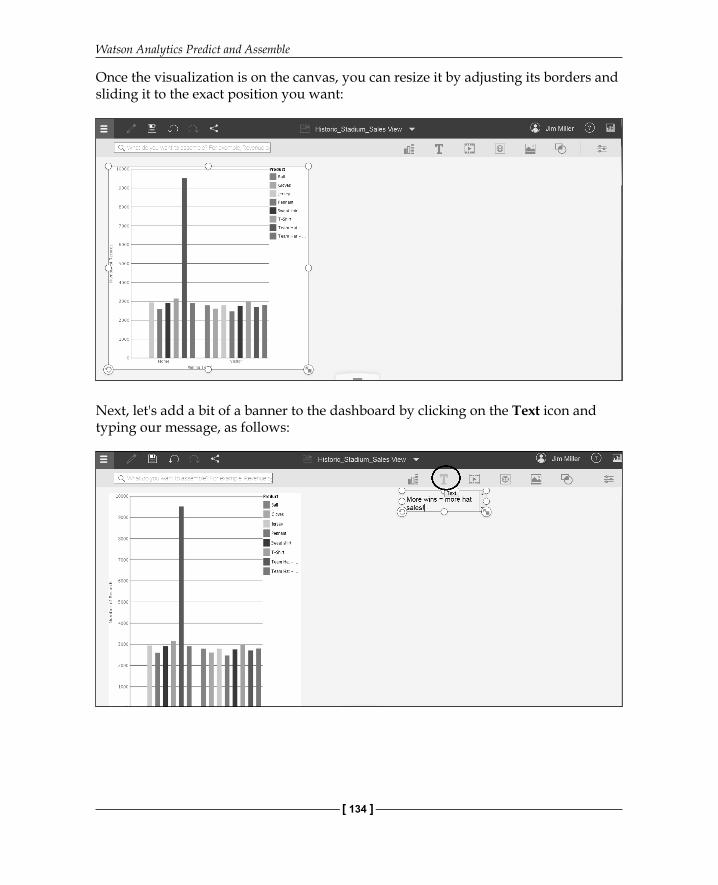
Once the visualization is on the canvas, you can resize it by adjusting its borders and sliding it to the exact position you want:
Next, let's add a bit of a banner to the dashboard by clicking on the Text icon and typing our message, as follows:

Chapter 5
[ 135 ]
Then, let's include a photo of our latest team hat direct from our supplier, by clicking on the image icon and pasting a valid web address, like this:
We can then resize and reposition our three artifacts the way we want them:

Watson Analytics Predict and Assemble
[ 136 ]
Finally, we can click on the Save icon and give our dashboard a name, as shown in this image:
Furthermore, this is too nice not to share with the team, so let's click on the share icon and select the best method for sharing our dashboard, like this:

Chapter 5
[ 137 ]
SummaryIn this chapter, we went over Watson Analytics' Predict and Assemble, demonstrating how they work and how they can add value to insights identifi ed with Watson Analytics Explore and Refi ne.
In the next chapter, we will discuss the idea of customizing and extending solutions created with IBM Watson Analytics.

Where to buy this book You can buy Learning IBM Watson Analytics from the Packt Publishing website.
Alternatively, you can buy the book from Amazon, BN.com, Computer Manuals and most internet
book retailers.
Click here for ordering and shipping details.
www.PacktPub.com
Stay Connected:
Get more information Learning IBM Watson Analytics