Embed Size (px)
Citation preview
Contents
Introduction
Purpose
Task 1 – Churn Analysis
Task 2 – Cross-selling and Up-selling
Task 3 - Customer Segmentation & Customer Lifetime Value
Analytics

Introduction
A telecommunications company is concerned about the number of customers leaving their Services. They need to understand who is leaving and why they leaving. The company's customer database includes customers who churned within the last month. In addition to information on Churn (Yes/No) for each customer, the data contains information on provided services in variables Est_Income , Car_Owner , Usage , Age group , RatePlan , LongDistance ,International Calls ,Local Calls, Dropped Calls. It also contains customer account information in variables Paymethod, LocalBilltype, LongDistanceBilltype. Finally, customer demographic information is contained in variables gender, Status, Dependents.
Purpose
The purpose of this study is, with the help of Watson Analytics examine why
customers are not used the connection of Bits Telecom Company, which
factors are influence the churn. Also see the cross selling and up-selling, also
focus on profitability and investment and find out the way for better results.

Task 1 – CHURN ANALYSIS
1.1– With the help of the Watson Analytics first do Exploration of data.
When Explore the data some starting points are Suggest by Watson.
Purpose-The purpose of this section to find out what factors influence
churn and why

What the breakdown of the number of contract by Churn?
Explore the data of contract by churn,breakdown of…in the search
box and at the window the most relevent options are shows.now
choose one option and click on it.
According to the company’s contracts the churn equally distributes.
-We can add new columns by the option “add new column”
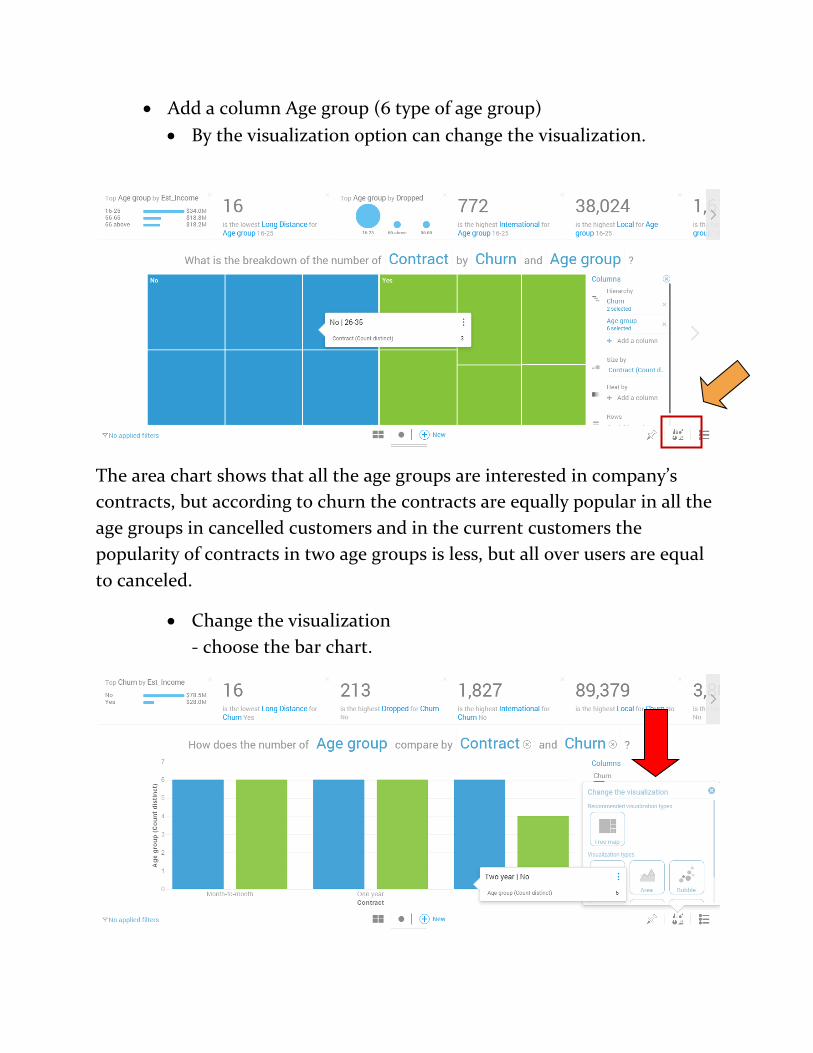
Add a column Age group (6 type of age group)
By the visualization option can change the visualization.
The area chart shows that all the age groups are interested in company’s
contracts, but according to churn the contracts are equally popular in all the
age groups in cancelled customers and in the current customers the
popularity of contracts in two age groups is less, but all over users are equal
to canceled.
Change the visualization
- choose the bar chart.

- This chart shows clearly that the two year contract is used by only 4
age groups and month to month and one month contract are again at
equal level. Focus on Two year contract because the current customers
of this contract are not greater then cancelled customers.
Change the visualization(Line Chart)
-change the visualization option.
-Pin the chart.
- This chart shows the variation of the rate plan popularity between
current and cancelled customers.(red line)current customers, only
month to month contract raise other two are highly decrease but
overall the current customers whom used the rate plans are very less
then to cancelled.
First focus on Two year rate plans.
-Three types of customers. The status are-
Married
Single
Divorced

Which category is interested in two year rate plans -
- Only 13 customers are using the Two year plan others already canceled
it.
The Est_Income by the two year plan.
Filter – two filters apply here, that means once you choose any
field as a filter then furthers all the Exploration proceed
according to that filter. Here I select Contract (Two year)
because we analyze the two year contract popularity and other is
rate plan (all).
- Choose the filter option.
- Add a filter.
- Conditions.

- The Est_income is only 319.7k by the current customers and by the
canceled customers 24.67m. the conclusion is because of churning
the company has vey big loss.
There are 4 type of rate plans in company
- Which rate plan is used broadly in Two year contract?
- In the line chart, the current customers only use RT1, RT3, RT4 and
canceled customers used all 4 plans. The current customers are very
less.

1.2 Prediction – Which fields are drives the churn.
All the factors, which affect the churn
The Top Predictors of Churn spiral chart shows the Combination model and
various Two Field models that are more predictive of customer churn than
One Field models .The predictive strength of one field is 73% shows by the
BAR chart and the driving fields are contract and dependents.
The combination of the fields, the predictive strength is 74% and driving
factors is (contract and age group), (age group and dropped) shows by the
BAR chart…

There are three types of contract in company Month to Month, One year,
Two year
In area chart, according to age group churn position is define. Green and
Blue color area define (yes/no).
As the record the month to month contract has used more then one year and
two year contract. The age group 36-45 used this contract broadly and
greater number of current customer who is used month to month pack.
Churn ratio going down by one year and two year contract and very less
number of current customers interested in two year contract.
Now focus on Two year contract, which rate plan is used mostly in two year
contract? We should modify the two year contract.

If we see the rate plan history then by line chart it is clear that the scope of
success of rate plan 4 and but at the current time only three rate plan is used
in two year contract so the condition is very poor at that time. First talk
about the rate plan 4 applies some discount and offers for the users. You can
add some policy to attract the customers for use that service broadly.
For example check which status categories use the Two year plan and their
dependents.
The divorce status not uses the Two year plan and haven’t dependents and
The Married and single customers used it and they have dependents.
Now for example can offer them like “with one connection another
connection free” etc.
Other hand for divorced can offer like discount policy.
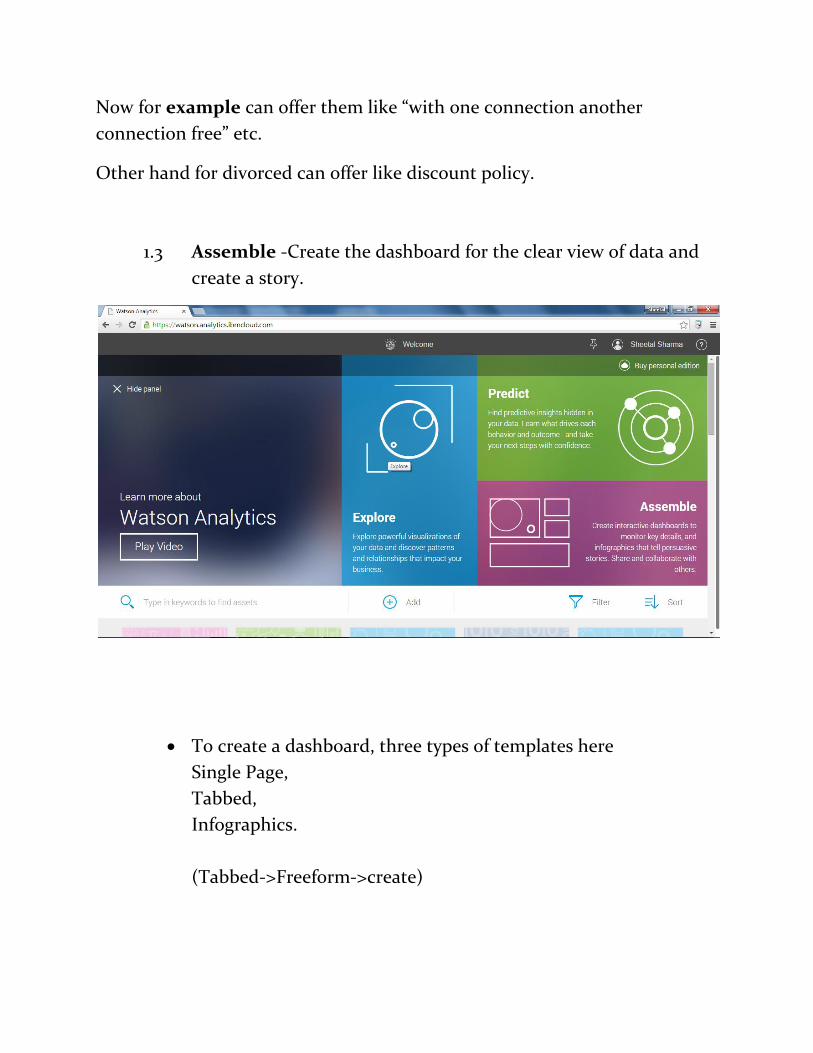
1.3 Assemble -Create the dashboard for the clear view of data and
create a story.
To create a dashboard, three types of templates here
Single Page,
Tabbed,
Infographics.
(Tabbed->Freeform->create)

What do you want to assemble, write in search box then it is
create in dashboard. There are 4 options for a single view box-
Delete,
Duplicate-to create a duplicate tab,
Edit Title,
Visualization.

Select column chart
Dashboard properties-
Themes- apply a theme.
General Style- Change the style.
Pinning Service – Pin (save) the tab.
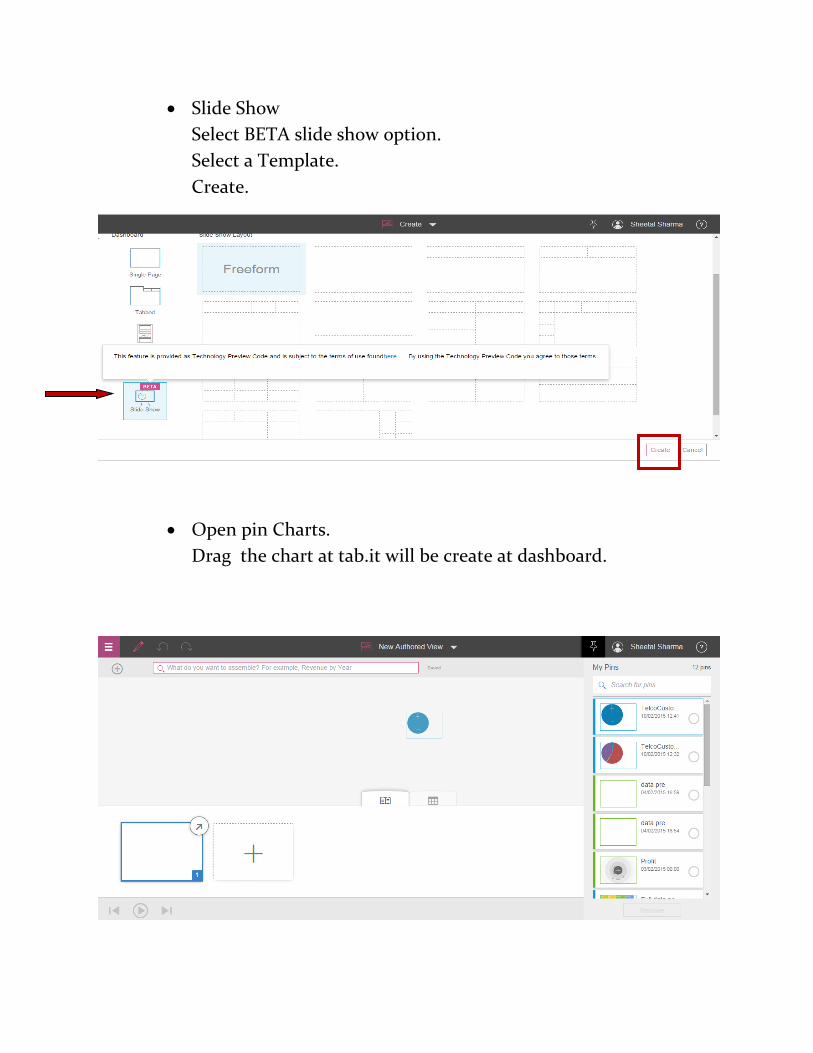
Slide Show
Select BETA slide show option.
Select a Template.
Create.
Open pin Charts.
Drag the chart at tab.it will be create at dashboard.
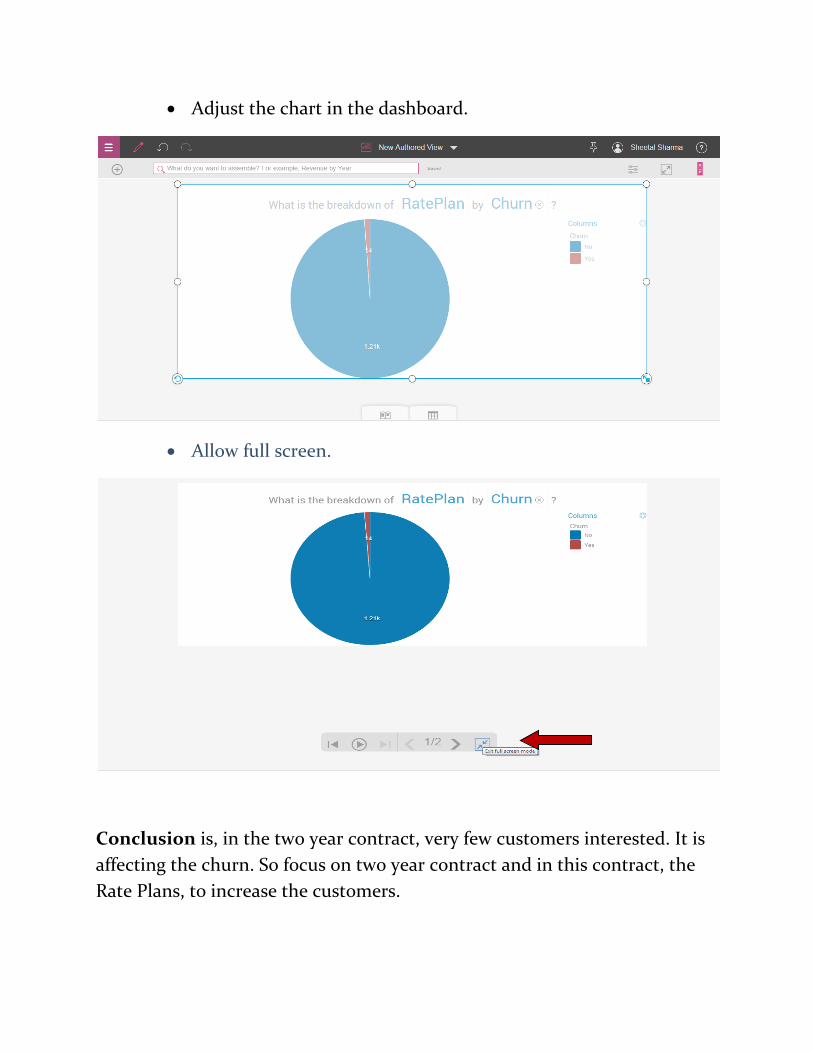
Adjust the chart in the dashboard.
Allow full screen.
Conclusion is, in the two year contract, very few customers interested. It is
affecting the churn. So focus on two year contract and in this contract, the
Rate Plans, to increase the customers.

Task – 2 Cross-Selling and Up-Selling
2.1 EXPLORE the data,
What is the breakdown of Usage by Long distance bill type and local bill
type? (In the long distance bill type 2 categories are Standard and
International discount and in Local bill type 2 categories are Budget
(postpaid) and free local (prepaid)).
According the data the international discount bill type
Customers are use this services not as much of. The other
category used broadly.
The purpose of this section is to create new ideas and How to implement those ideas,
for the better Income and selling. In this section we focus on Bill types and usage of
the customers and analyze that how to get more income in business.
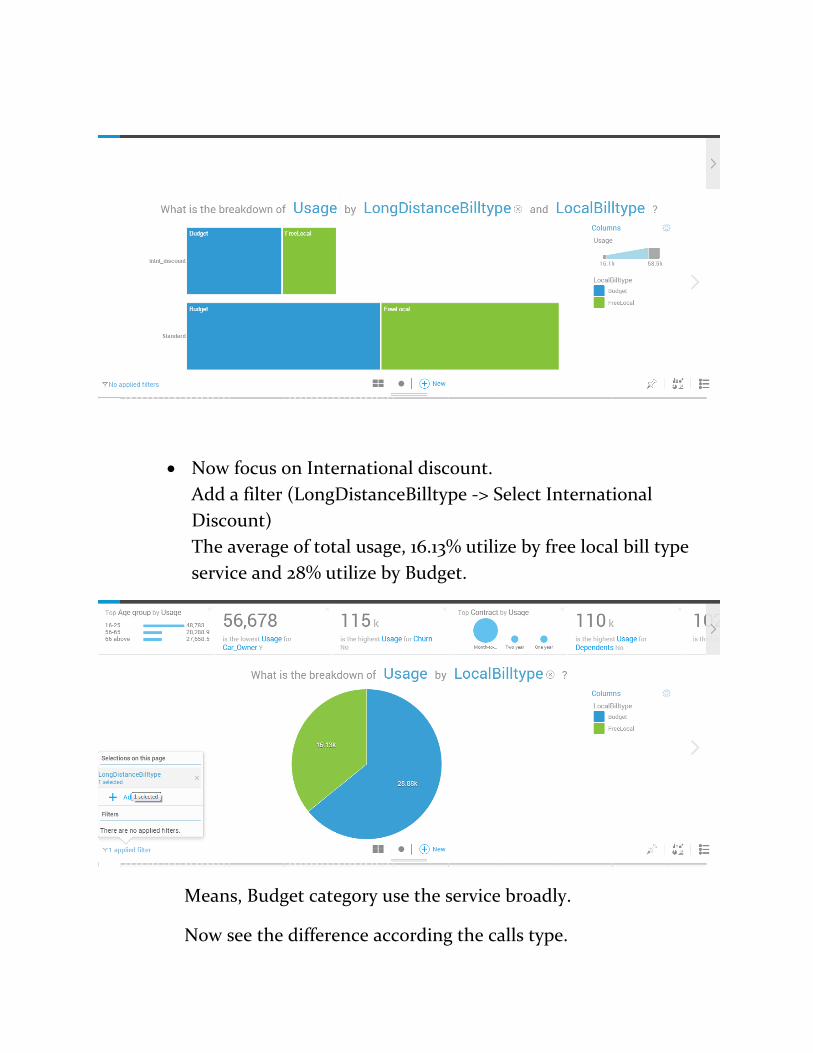
Now focus on International discount.
Add a filter (LongDistanceBilltype -> Select International
Discount)
The average of total usage, 16.13% utilize by free local bill type
service and 28% utilize by Budget.
Means, Budget category use the service broadly.
Now see the difference according the calls type.

Add another filter “Usage”.
Three types of calls system are present in company.
Local Calls
Long distance Calls
International Calls
Here we analyze that which type of calls are more utilize and
which payment method they use.
Three facilities of payment
CC (Credit card)
CH (Check)
Auto (Cash)
Local Calls
Budget (Postpaid) bill type Category utilize Local calls higher then Free
local (Prepaid).

And the pay methods of this category.
Add 3 filter local bill type, select free local (prepaid).
They are use Auto and CC mostly and CH is not much popular.
So, for this category can offer some policy to CC company to increase profit
and CH category like banks here we can offer the banks others beneficial
plans for example if bank offer their customers some plans including our
company policy to promote telecom company and also with CH facilities
then we provide the connections free of cost or with discount.
Long Distance Calls
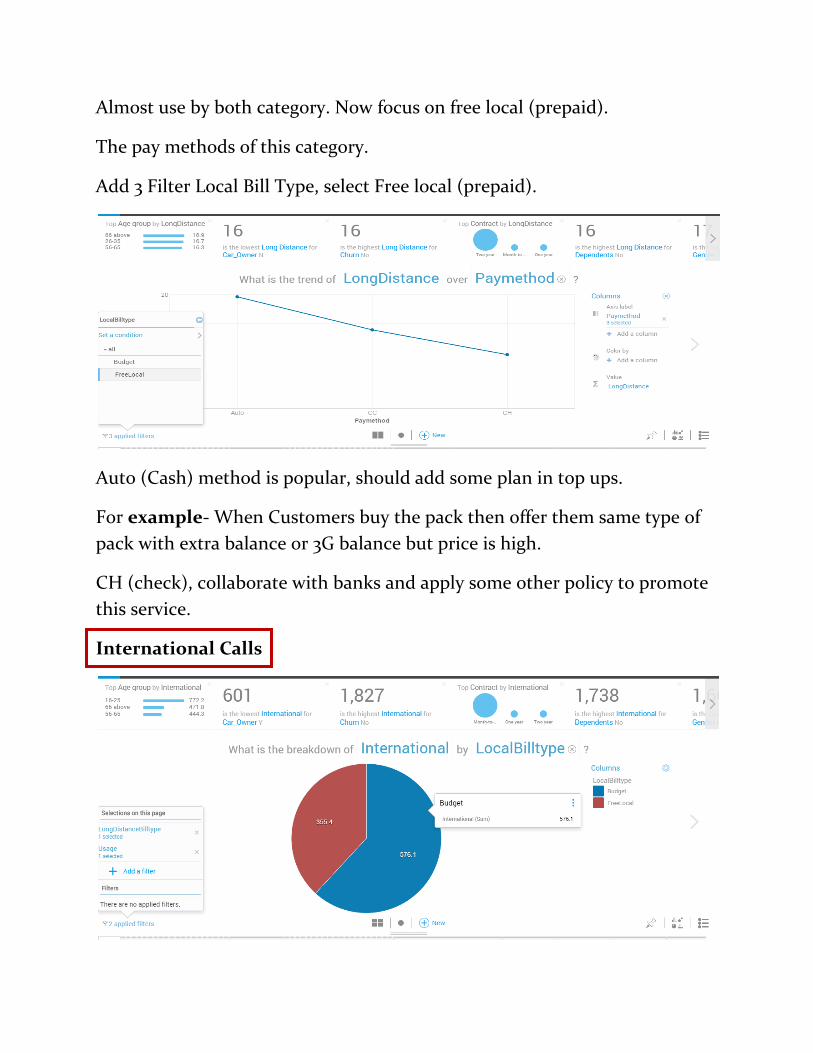
Almost use by both category. Now focus on free local (prepaid).
The pay methods of this category.
Add 3 Filter Local Bill Type, select Free local (prepaid).
Auto (Cash) method is popular, should add some plan in top ups.
For example- When Customers buy the pack then offer them same type of
pack with extra balance or 3G balance but price is high.
CH (check), collaborate with banks and apply some other policy to promote
this service.
International Calls

Postpaid Connection Customers utilize international calls broadly and
prepaid customers are not use to much. Now focus on free local type
(prepaid).
The pay methods of Free local Bill type customers.
Add 3 filter Local Bill Type, select Free local (prepaid).
Only CC customers use broadly the service.
Auto customers very less, offer some discount, if they choose cash payment
option. CH (check), collaborate with banks and apply some other policy to
promote this service.
Conclusion is, Prepaid Connection is not using the services broadly. In the
Payment methods we should focus and then add some policy to promote the
company.

2.2 PREDICTION
The main focus of the business owner at income.
Select the target.
Top Predictors of Estimated income are Local Calls and 8 others. Shows in
decision tree.

Top Decision rules, predicting Estimated income to be high.
The Local calls highly influent the income. Also long distance calls and local
bill type, as seen in exploration part should focus on these factors.
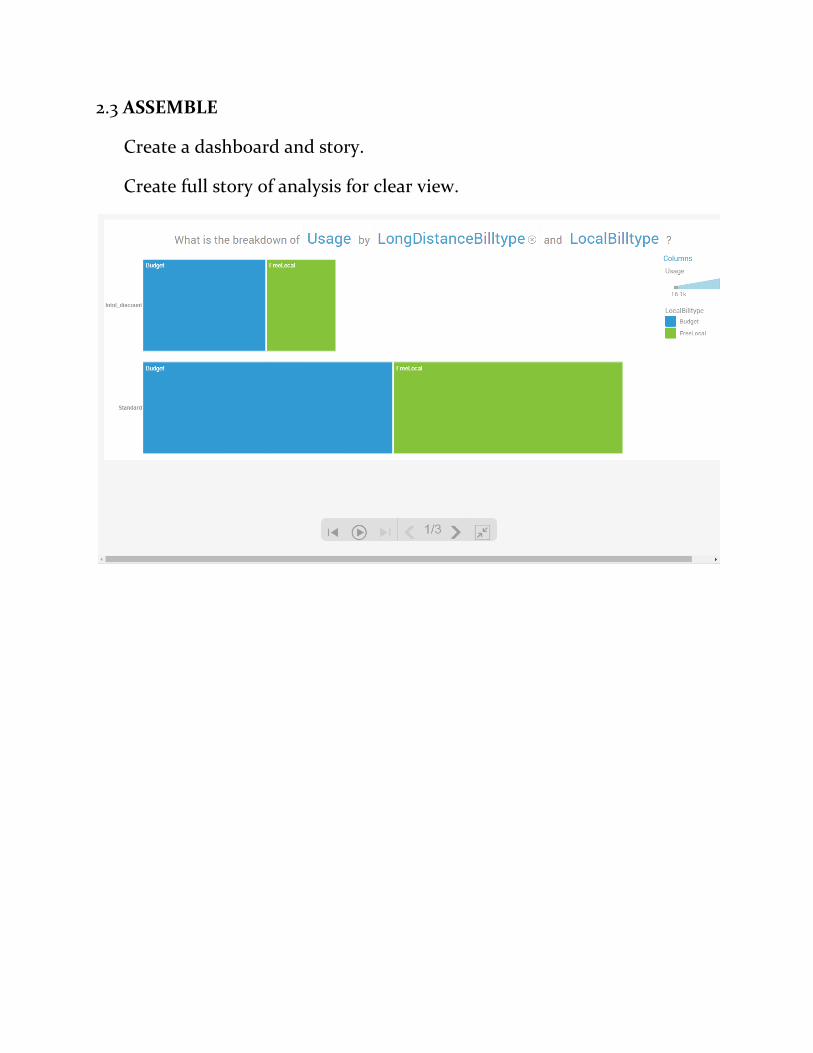
2.3 ASSEMBLE
Create a dashboard and story.
Create full story of analysis for clear view.

Task 3 - Customer Segmentation & Customer
Lifetime Value Analytics
3.1 EXPLORE the data,
If divide the customers age group according to income. The estimation is
that highest income by 16-25 age group customers.
Customers are base of the any business and for the better result the long term
business relationship with customer is important. In this section we focus on
customer’s priority according their involvement in our company also plan some
offers for the users whom used our service from long time according their needs
and status.

Now observe the dependents of the particular age group. As shows in
tree map chart that age group which has no dependents, the income is
high and other which have dependents, the income is less.
So, focus on that group which have dependents here if offer that groups
some kind of plan like “connection free” or some application like, “at one
connection discount for other connection”.
Conclusion is, the customers with dependents, here better scope of selling
company’s plans.
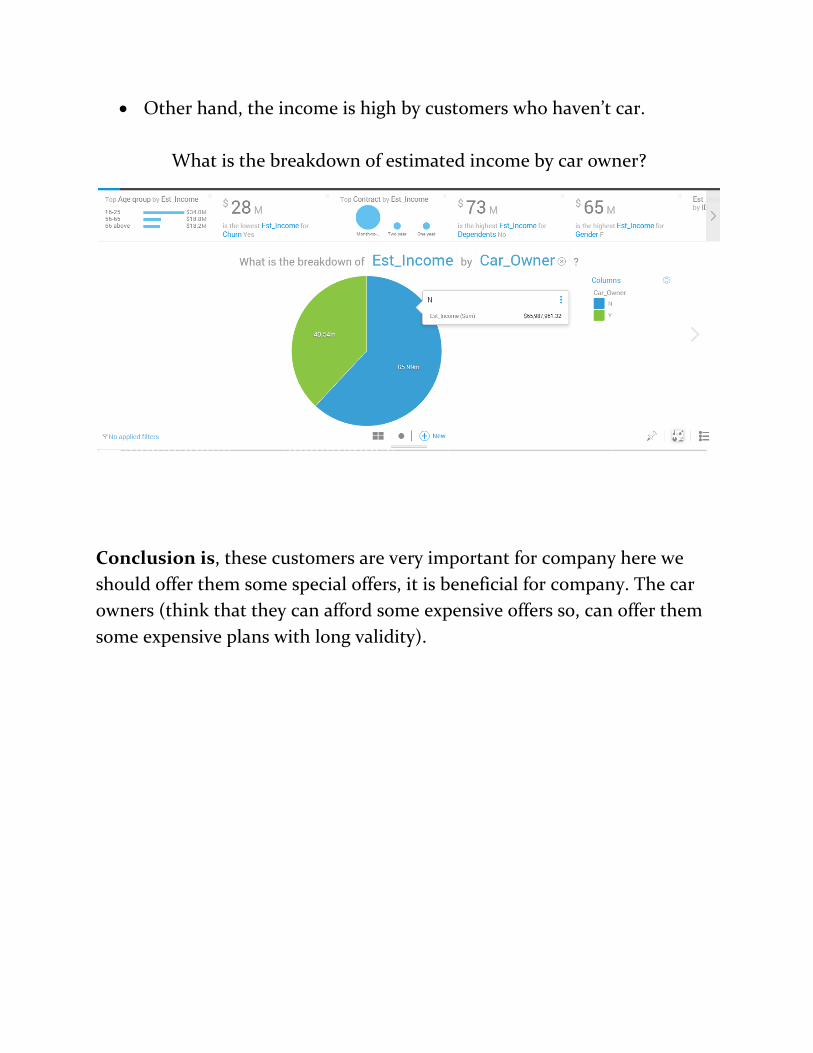
Other hand, the income is high by customers who haven’t car.
What is the breakdown of estimated income by car owner?
Conclusion is, these customers are very important for company here we
should offer them some special offers, it is beneficial for company. The car
owners (think that they can afford some expensive offers so, can offer them
some expensive plans with long validity).

3.2 PREDICTION –
Top predictors of car owner – the top predictor is estimated income and 6
other input.
Decision tree shows all inputs.

Highest decision rules for that that haven’t car with
statistical details.
Highest Decision rules for who have car.

Top predictor is estimated income for car owner as discussed in exploration
part we should focus on both type of customers.
3.3 ASSEMBLE – create Slide Show.
Conclusion is, Income is high by those customers whom haven’t car. They
are important customers for company so we should offer them some good
plans.