Embed Size (px)
Citation preview
If You Can’t Measure It, You Can’t Manage It
NACAS 46TH ANNUAL CONFERENCE MONTREAL, CANADA OCTOBER 5, 2014
Panelists
• Tom Strange , President/CEO – The Solution Design Group, Inc.
• Angela Joyce, Director of Client Services – The Solution Design Group, Inc.
• Mark Ironside, Executive Director of Business Services – Lehigh University
• Mark Reeves, Asst. Vice-President for Business and Auxiliary Services – University of West Georgia
• Alex Posivenko, Financial Manager, Auxiliary Services – University of West Georgia
• Rebecca Brown , Asst. Vice President of Admin Affairs – Florida A&M University
• Malinda Moore, Associate Director of Business & Auxiliary Services – Florida A&M University
Learning Objectives
• Gain a better understanding of benchmarks and how they can be used in auxiliary/business
• Learn about the tools being used to measure and present benchmarks
• Explore methods and techniques for comparing auxiliary efficiencies among peers
35% of College and University CFOs say the quality of analytics and
benchmarking information used to guide decision-making at their
institutions is either “extremely poor” or “below average”.
The Chronicle of Higher Education, June 2014 Survey
Performance Measures
• Why Measure? To learn and improve!
What is working? What isn’t working? What can we change?
• What to Measure? Performance indicators!
How much? How well? At what level? Over what time period?
• What do we want out of it? Improvements!
Can we increase revenue? Can we lower costs to students? Can we improve customer satisfaction?
The Basics
What is a Performance Measure?
“A quantifiable indicator used to assess how well an organization or business is achieving its desired objectives” – www.businessdictionary .com
What is a Benchmark?
“Standard used as point of reference for evaluating performance or quality”
• Internal – within your institution
• External – with other higher-educational institutions
• Functional – with institutions in other industries
Performance/Benchmarking Examples
• Lehigh University
• University of West Georgia
• Florida A&M University

Lehigh University
• Founded: In 1865 by Asa Packer, an industrial pioneer, entrepreneur and philanthropist; located in Bethlehem, Pennsylvania
• One of nation’s premier research universities
• 4 Colleges: Arts and Sciences, Business and Economics, P.C. Rossin College of Engineering, Applied Science and College of Education
• Student Body:4,904 undergraduates , 2,165 graduate students
• Lehigh Endowment : $1 Billion
• Athletics: 25 NCAA Division I intercollegiate sports for men and women, 40 intramural and club sports
Metrics Used:
• Ticket Fees
• Convenience Fees
• Order Fees
• Number of Tickets Sold
• Location
Benchmarking at Lehigh Example 1: Ticketing Revenue and Expenditures
Metrics Used:
• Overall Attendance
• Attendance by Residence
• Attendance by Class
Benchmarking at Lehigh Example 2: Student Participation
Metrics Used:
• Packages
• Delivery Time
• Revenue
• Carrier
Benchmarking at Lehigh Example 3: Mail Services
University of West Georgia
• Founded in 1906, located in Carrolton, Georgia on 645 acres
• Fall 2014 enrollment – 12,150
• 76% full-time students; 24% part-time students
• 65% female; 35% male
• Degrees
• 9 Undergraduate degrees in 43 programs
• 9 Graduate degrees in 23 programs
• 4 Doctoral
Benchmarking at University of West Georgia Self-Op Bookstore Operations
Metrics:
• Margins
• COGS
• Freight Costs
• Labor Costs
• Labor Overtime
• A/R
• A/P
• Order Quantity
• Pricing
• Inventory Levels
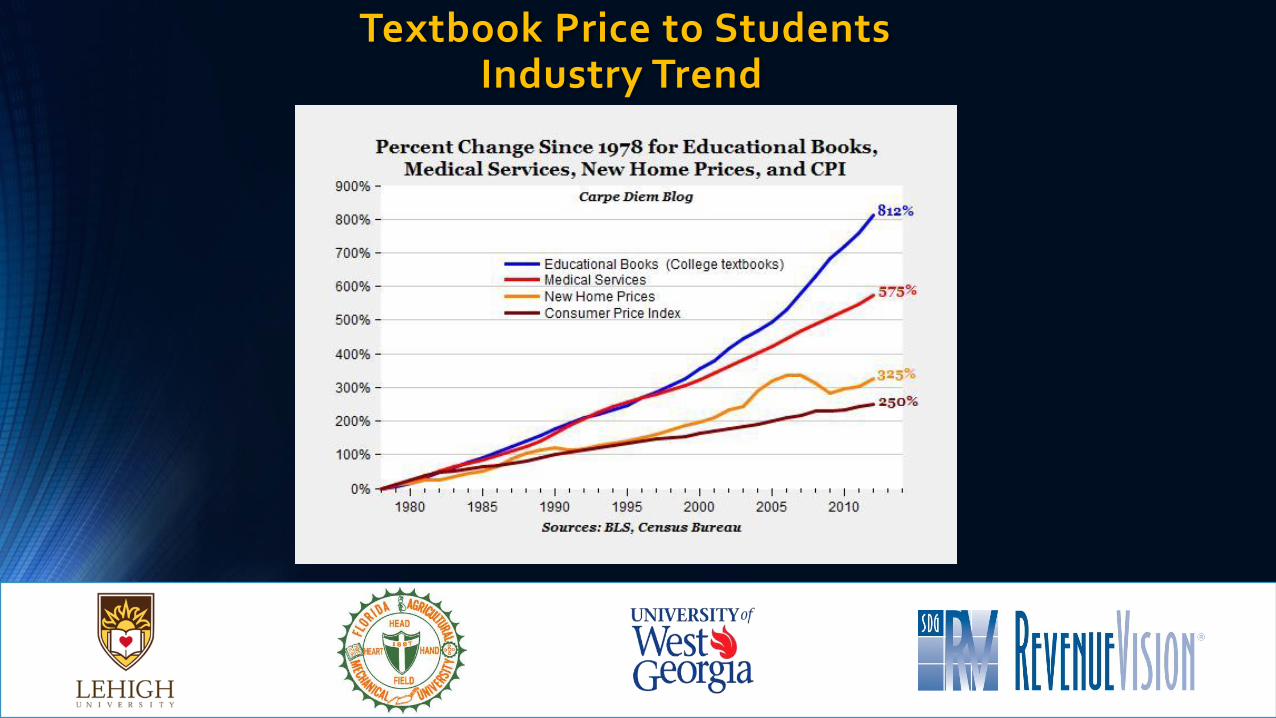
Textbook Price to Students
Industry Trend
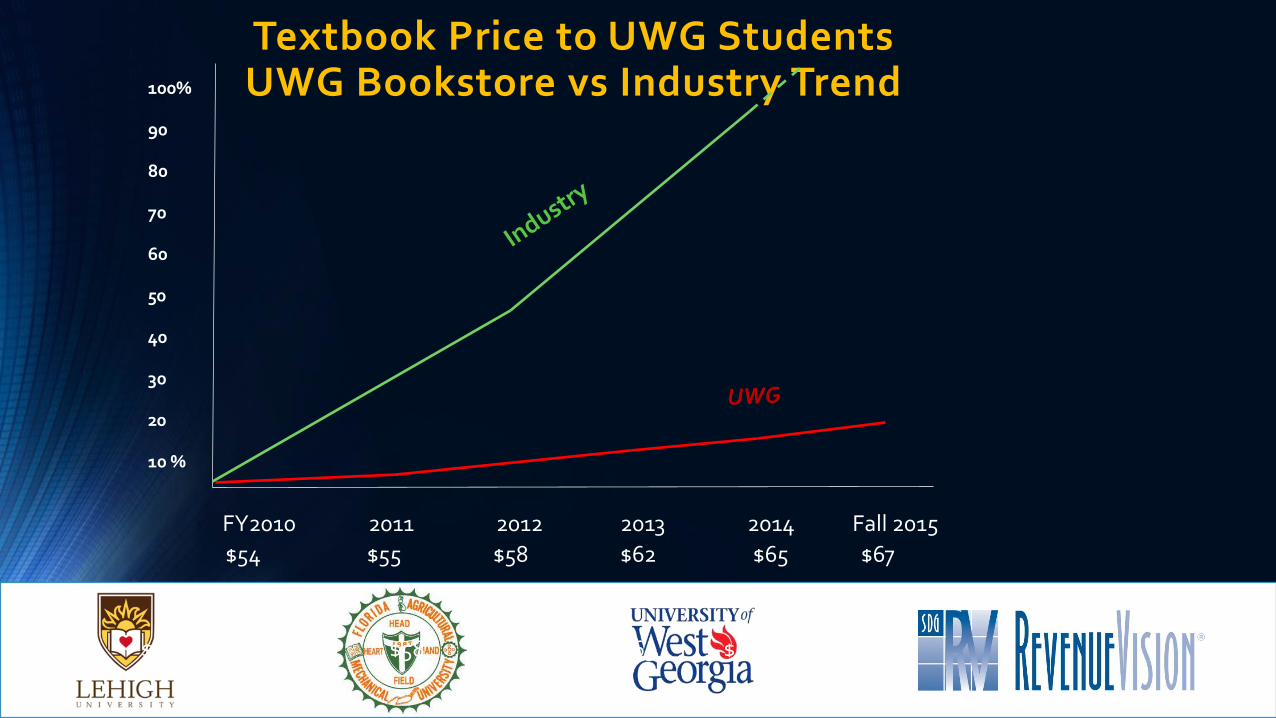
Textbook Price to UWG Students UWG Bookstore vs Industry Trend
FY2010 2011 2012 2013 2014 Fall 2015
100%
90
80
70
60
50
40
30
20
10 %
$54 $55 $58 $62 $65 $67
$54 $55 $58 $62 $65 $67
Florida A&M University • Founded in 1887, located in Tallahassee, Florida
• 10,200 students from more than 30 states, many countries
• Accredited by Southern Association of Colleges and Schools; offers 98 degree programs, including 12 doctoral degrees
• Top 10 Best Historically Black Colleges or Universities in the nation - U.S. News and World Report (2014)
• A “Best in the Southeast” College - The Princeton Review (2014)
• College Database – grads earn average salary $41,000/yr; ranked No. 4 in Florida (2013)
• On Forbes list of top colleges in the U.S. (2013)
Benchmarking at FAMU Background: Housing, Student Meals
• Direct correlation: Housing – Student Meals
• Fall 2014, 5 of 13 housing facilities taken off line (899 beds)
• New facility opened (800 beds)
• Fall 2014 – 2,914 meal plans; 60% mandatory (resident), 40% commuter
• FAMU sells meal plans, collects revenues, then pays provider
• Recent challenges: switching providers, declining enrollment and meal plan participation, closure of facilities
• Purpose: Project revenues for planning, and budgeting
• Description: Analyze meal plan enrollment, rates based on projected participation
• Metrics Used: Student population/enrollment, housing occupancy rate, % of students on meal plans
• Use of Data: Prepare operating Budget, fulfill financial commitments, assess meal plan performance, project growth
• Results : Meal Plan Participation, Revenue increases; more appealing meal plan types; improved customer satisfaction
Benchmarking at FAMU Example 1: Meal Plan Revenues to Student Enrollment
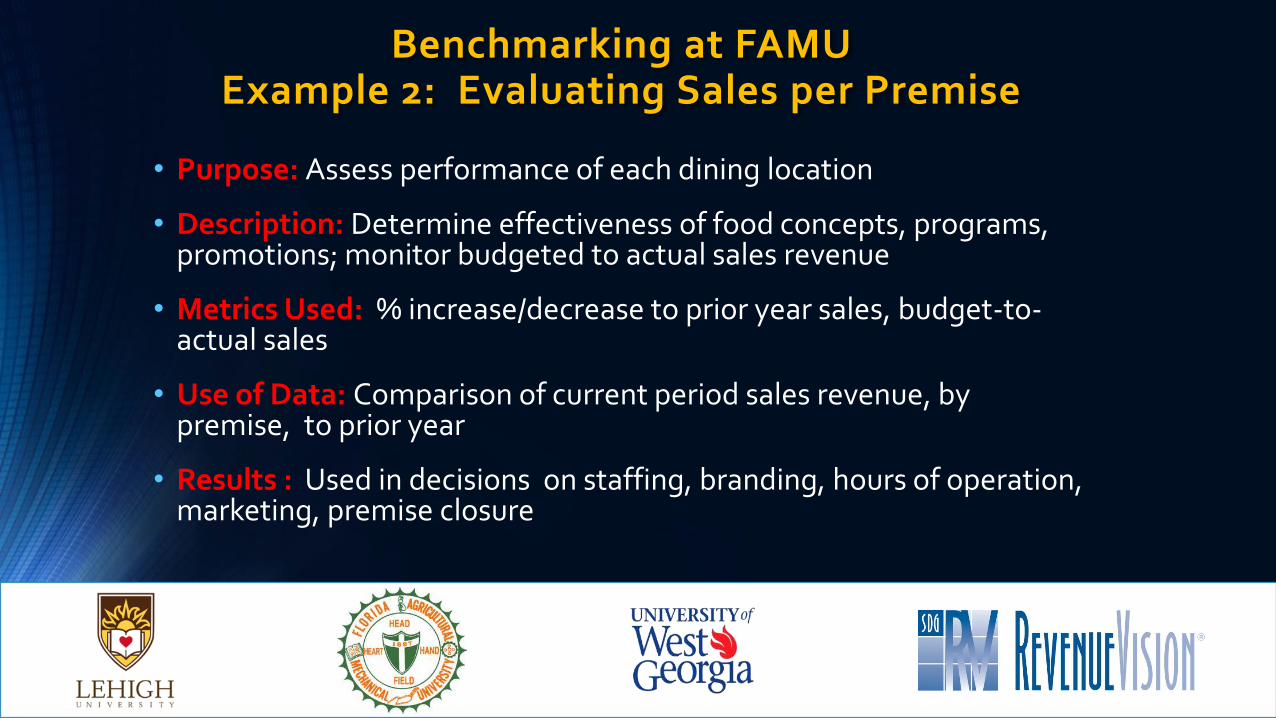
• Purpose: Assess performance of each dining location
• Description: Determine effectiveness of food concepts, programs, promotions; monitor budgeted to actual sales revenue
• Metrics Used: % increase/decrease to prior year sales, budget-to-actual sales
• Use of Data: Comparison of current period sales revenue, by premise, to prior year
• Results : Used in decisions on staffing, branding, hours of operation, marketing, premise closure
Benchmarking at FAMU Example 2: Evaluating Sales per Premise
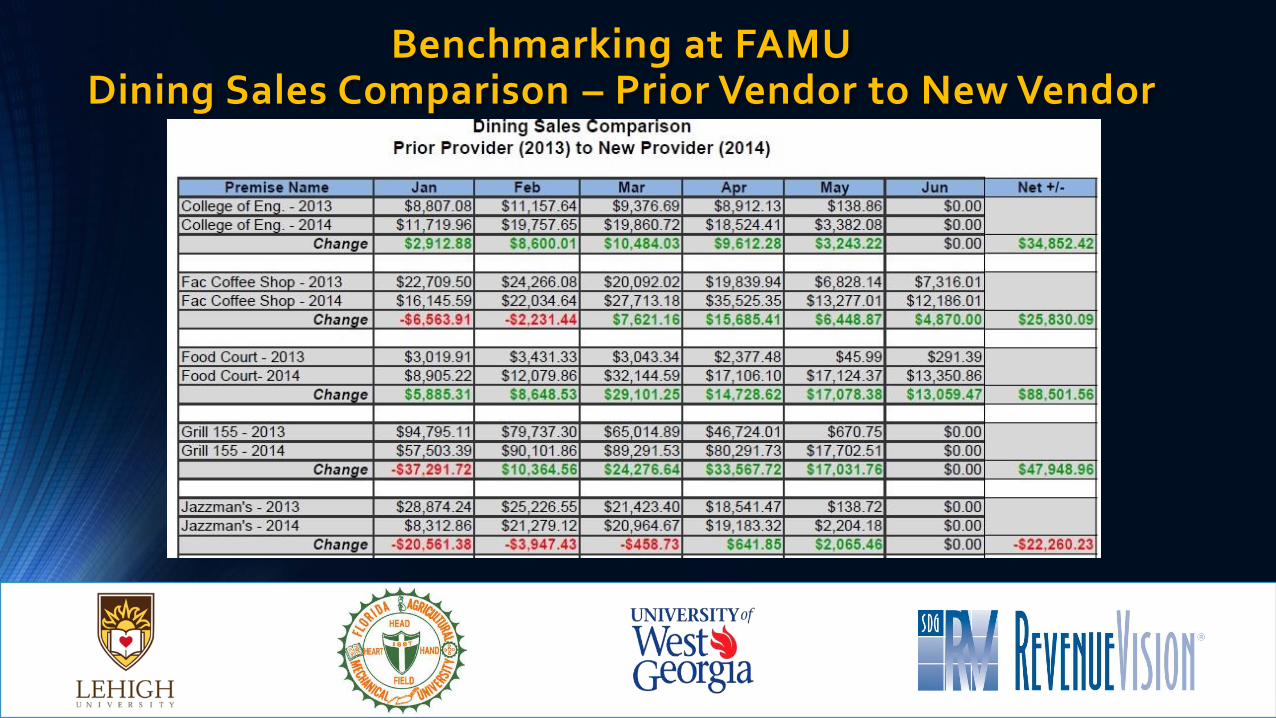
Benchmarking at FAMU Dining Sales Comparison – Prior Vendor to New Vendor
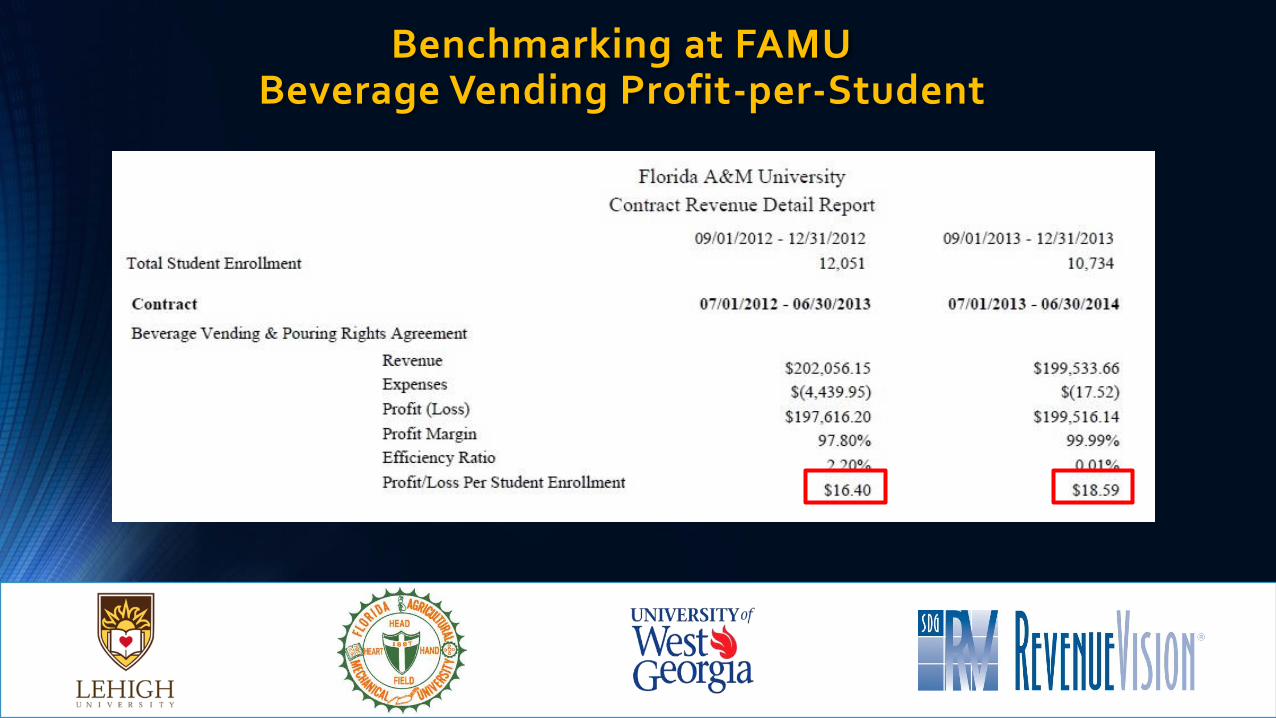
Benchmarking at FAMU Beverage Vending Profit-per-Student
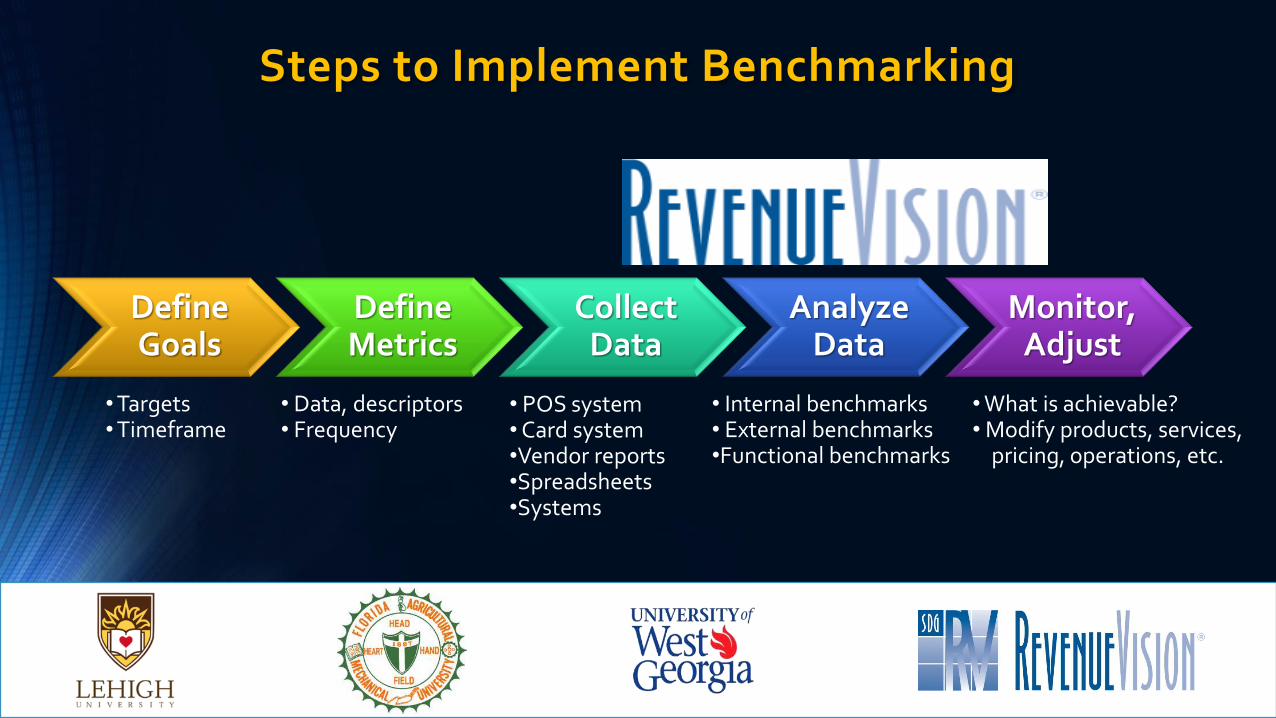
Steps to Implement Benchmarking
Define Goals
Define Metrics
Collect Data
Analyze Data
Monitor, Adjust
• Data, descriptors • Frequency
• POS system • Card system •Vendor reports •Spreadsheets •Systems
• Targets • Timeframe
• Internal benchmarks • External benchmarks •Functional benchmarks
• What is achievable? • Modify products, services, pricing, operations, etc.
• Auxiliary revenue per FTE or FT student
• Auxiliary expense per FTE or FT student
• Profit margin
• Growth/Contraction percentages semester-to-semester
• Efficiency ratio
Benchmarking Overall Auxiliary Performance Benchmarks
• Revenue/expense per student
• Profit/loss per student
• Meal plan revenue per resident student
• Restaurant/franchise revenue per student
• Transactions per hour per location per day of week
Benchmarking Campus Dining Metrics
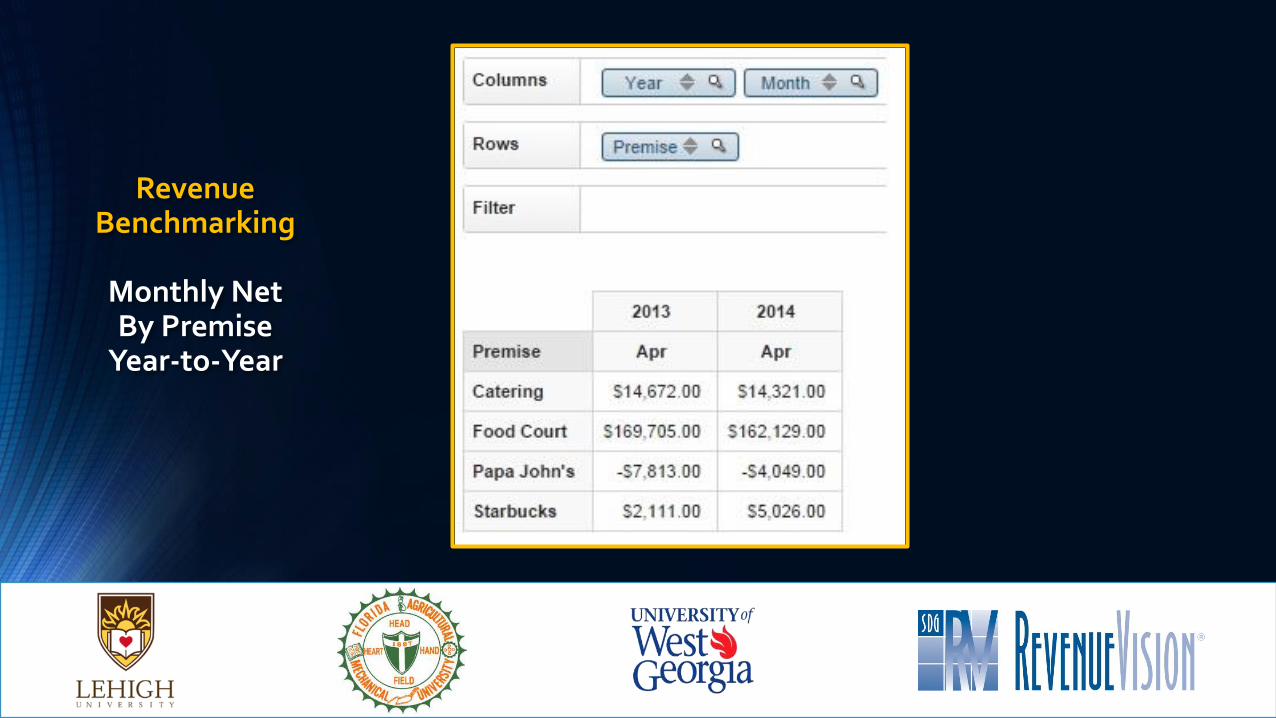
Revenue Benchmarking
Monthly Net By Premise
Year-to-Year
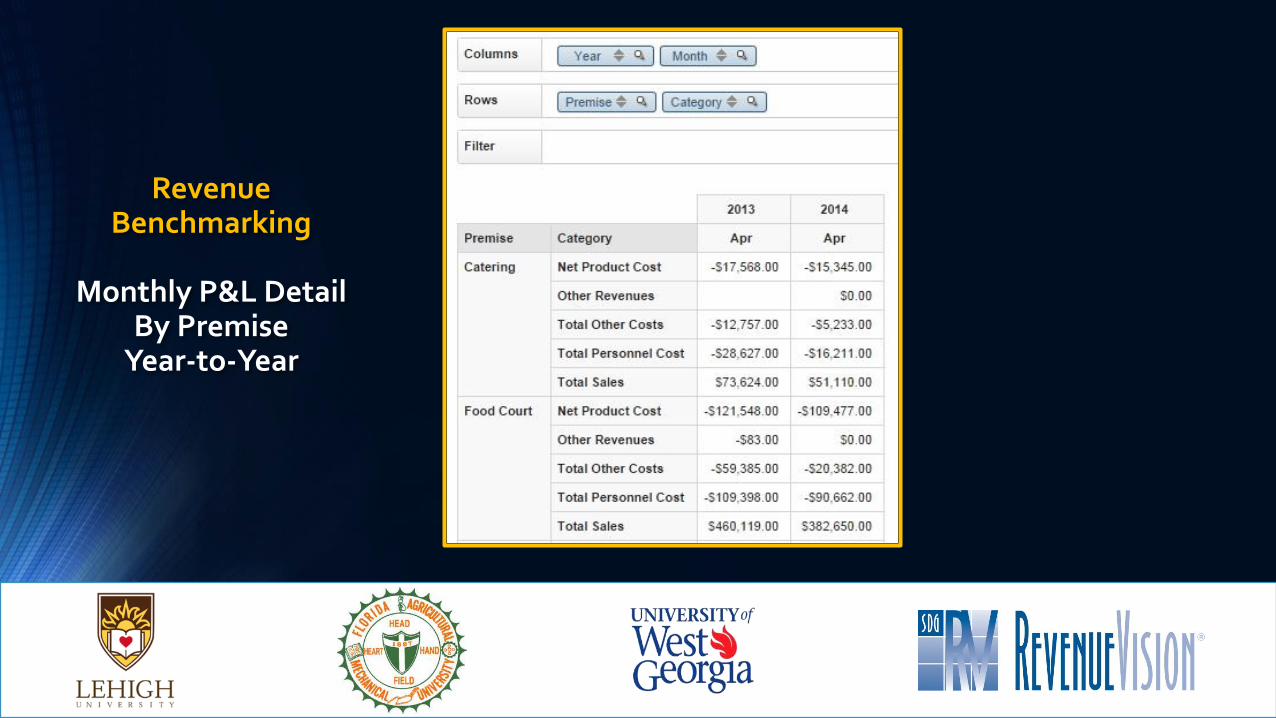
Revenue Benchmarking
Monthly P&L Detail
By Premise Year-to-Year
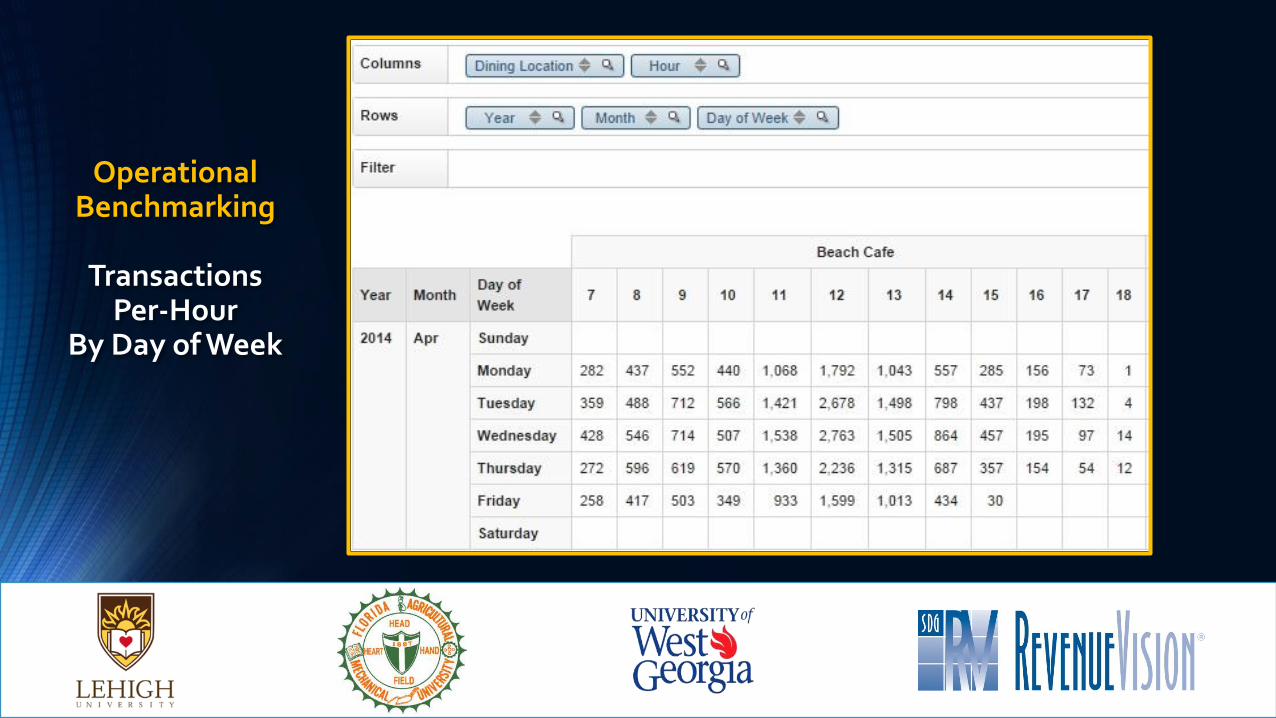
Operational Benchmarking
Transactions
Per-Hour By Day of Week
• Revenue per student
• Revenue by product category per machine
• Revenue by location type (e.g. academic, athletic, residential)
• Analysis of product sales/growth in different times of year
• Cash vs. Campus card sales
Benchmarking Campus Vending Metrics
• Sales and growth by Product Category
• Sales per square foot of retail space
• Sales per student
• Sales by Product Category by Campus (if applicable)
• For self-op, net revenue per student (sales less expenses)
Benchmarking Campus Bookstore Metrics
Audience Questions, Comments
Thank you!
Please complete the online session evaluation.