Embed Size (px)
Citation preview

Houston’s office market impacted by energy industry layoffs
Research & Forecast Report
HOUSTON | OFFICEQ3 2015
Lisa Bridges Director of Market Research | Houston
Known as the Energy Capital of the World, Houston is home to more than 3,700 energy related companies which make up just over half of the local economy. Houston’s Q3 2015 office market indicators reflect the dramatic drop in oil prices that occurred in Q4 2014 and the subsequent reevaluation and adjustments in growth plans implemented by the “upstream” sector of the energy market. The “mid” and “downstream” players remain very strong but tend to occupy less office space than the “upstream” companies.
Houston’s office leasing activity declined 39.7% between quarters, recording only 0.7 million SF in Q3 2015. When compared to the 3.4 million SF recorded 12 months ago in Q3 2014, leasing activity decreased by 77.7%. Tenants are renewing existing leases, but in today’s market, more companies are contracting, not expanding.
Over 1.4M SF of new inventory delivered during Q3 2015 and 41.4% of the space was vacant. Houston’s office construction pipeline totals 10.8M SF and 62.4% is pre-leased. The majority of the new space is located in suburban submarkets and is scheduled to deliver over the next 12 months.
Houston’s office market posted 338,584 SF of positive net absorption, pushing year-to-date positive net absorption to 891,825 SF. Average rental rates increased marginally, however submarkets with higher than average vacancy rates have slightly lower quoted rental rates than a year ago. Recent hikes in property taxes have increased operating expenses, thus increasing gross rental rates.
The Houston metropolitan area created 38,400 jobs between August 2014 and August 2015, an annual increase of 1.3%. Sectors creating most of the jobs contributing to the annual increase include Legal Services and Accommodation & Food Services. Employment sectors that lost the most jobs over the year include Durable Goods Manufacturing and Real Estate & Rental and Leasing.
Summary Statistics Houston Office Market Q3 2014 Q2 2015 Q3 2015
Vacancy Rate 12.2 14.3% 14.5%
Net Absorption (Million Square Feet) 0.7 0.4 0.3
New Construction (Million Square Feet) 1.5 2.1 1.4
Under Construction (Million Square Feet) 17.3 12.3 10.8
Class A Vacancy Rate CBD Suburban
10.110.0
10.214.4
10.414.6
Asking Rents Per Square Foot Per Year
Average (all classes) $27.52 $27.62 $27.83
CBD Class A $43.01 $42.13 $42.72
Suburban Class A $32.66 $32.88 $33.02
Market IndicatorsRelative to prior period
AnnualChange
Quarterly Change
Quarterly Forecast*
VACANCY
NET ABSORPTION
NEW CONSTRUCTION
UNDER CONSTRUCTION
*Projected
2 Houston Research & Forecast Report | Q3 2015 | Office | Colliers International
Job Growth & Unemployment(not seasonly adjusted)
Vacancy & Availability
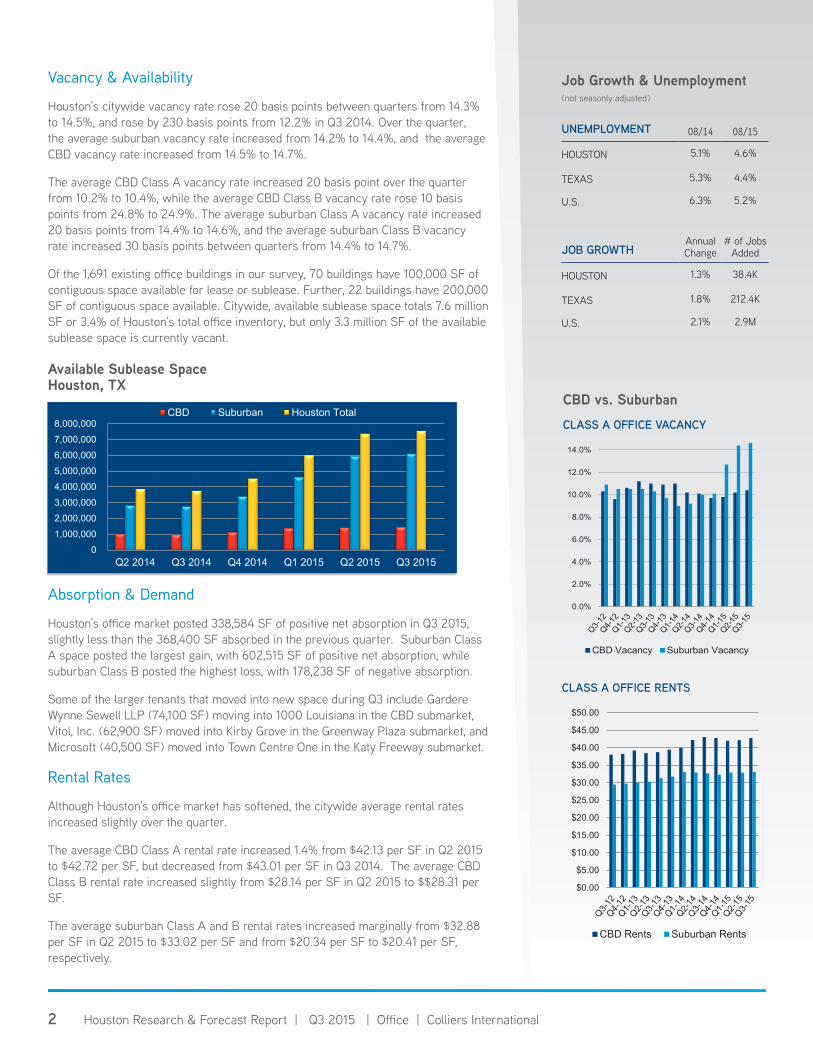
Houston’s citywide vacancy rate rose 20 basis points between quarters from 14.3% to 14.5%, and rose by 230 basis points from 12.2% in Q3 2014. Over the quarter, the average suburban vacancy rate increased from 14.2% to 14.4%, and the average CBD vacancy rate increased from 14.5% to 14.7%.
The average CBD Class A vacancy rate increased 20 basis point over the quarter from 10.2% to 10.4%, while the average CBD Class B vacancy rate rose 10 basis points from 24.8% to 24.9%. The average suburban Class A vacancy rate increased 20 basis points from 14.4% to 14.6%, and the average suburban Class B vacancy rate increased 30 basis points between quarters from 14.4% to 14.7%.
Of the 1,691 existing office buildings in our survey, 70 buildings have 100,000 SF of contiguous space available for lease or sublease. Further, 22 buildings have 200,000 SF of contiguous space available. Citywide, available sublease space totals 7.6 million SF or 3.4% of Houston’s total office inventory, but only 3.3 million SF of the available sublease space is currently vacant. Available Sublease Space Houston, TX
Historical Sublease Statistics
Page 1
0
1,000,000
2,000,000
3,000,000
4,000,000
5,000,000
6,000,000
7,000,000
8,000,000
Q2 2014 Q3 2014 Q4 2014 Q1 2015 Q2 2015 Q3 2015
CBD Suburban Houston Total
Absorption & Demand
Houston’s office market posted 338,584 SF of positive net absorption in Q3 2015, slightly less than the 368,400 SF absorbed in the previous quarter. Suburban Class A space posted the largest gain, with 602,515 SF of positive net absorption, while suburban Class B posted the highest loss, with 178,238 SF of negative absorption.
Some of the larger tenants that moved into new space during Q3 include Gardere Wynne Sewell LLP (74,100 SF) moving into 1000 Louisiana in the CBD submarket, Vitol, Inc. (62,900 SF) moved into Kirby Grove in the Greenway Plaza submarket, and Microsoft (40,500 SF) moved into Town Centre One in the Katy Freeway submarket.
Rental Rates
Although Houston’s office market has softened, the citywide average rental rates increased slightly over the quarter.
The average CBD Class A rental rate increased 1.4% from $42.13 per SF in Q2 2015 to $42.72 per SF, but decreased from $43.01 per SF in Q3 2014. The average CBD Class B rental rate increased slightly from $28.14 per SF in Q2 2015 to $$28.31 per SF.
The average suburban Class A and B rental rates increased marginally from $32.88 per SF in Q2 2015 to $33.02 per SF and from $20.34 per SF to $20.41 per SF, respectively.
UNEMPLOYMENT 08/14 08/15
HOUSTON 5.1% 4.6%
TEXAS 5.3% 4.4%
U.S. 6.3% 5.2%
JOB GROWTHAnnual Change
# of Jobs Added
HOUSTON 1.3% 38.4K
TEXAS 1.8% 212.4K
U.S. 2.1% 2.9M
CBD vs. SuburbanCLASS A OFFICE VACANCY
0.0%
2.0%
4.0%
6.0%
8.0%
10.0%
12.0%
14.0%
16.0%
CBD Vacancy Suburban Vacancy
$0.00
$5.00
$10.00
$15.00
$20.00
$25.00
$30.00
$35.00
$40.00
$45.00
$50.00
CBD Rents Suburban Rents
CLASS A OFFICE RENTS
33 Houston Research & Forecast Report | Q3 2015 | Office | Colliers International
Q3 2015 Top Office Lease TransactionsBUILDING NAME/ADDRESS SUBMARKET SF TENANT LEASE DATE
10001 Richmond Ave Westchase 554,385 WesternGeco1 Sep-15
6330 West Loop South Bellaire 139,244 Texas Children’s Health Plan Aug-15
10100 Katy Fwy Katy Freeway East 80,000 CEMEX USA4 Jul-15
6330 West Loop South Bellaire 55,676 Jones and Carter3,5 Aug-15
1301 McKinney St CBD 50,237 MRC Global3 Aug-15
Deerwood Glen - 4440 SH 225 Gulf Freeway/Pasadena 38,240 Brock Holdings III, Inc5 Jul-15
515 Post Oak Blvd Post Oak Park 32,000 Rockwater Energy Solutions, Inc Aug-15
Two Hughes landing The Woodlands 25,576 The Woodlands Development Company5 Aug-15
Granite Tower @ 290 Northwest Far 20,910 IDS Jul-15
One Riverway Riverway 19,478 EMC Corporation1 Jul-15
Leasing ActivityHouston’s office leasing activity decreased 39.7% between quarters recording only 0.7 million SF of transactions in Q3 2015. When compared to the 3.4 million SF recorded in Q3 2014, leasing activity has decreased drastically, falling by 77.7% in just one year.
1 Renewal 2 Expansion3 Sublease4 Pre-lease/proposed or under construction5Colliers International Transaction
Q3 2015 Significant Sales Transactions – (100,000 SF or greater)BUILDING NAME SUBMARKET RBA (SF) YEAR
BUILT BUYER SELLER SALE PRICE $/SF CLOSED
Energy Center 3 935 N Eldridge Pky
Katy Freeway 548,000 2015 ConocoPhillips Trammell Crow Co $275M $501 Pending
One Commerce Green 515 W Greens Rd
North Belt 340,956 1983 Nabors Property Holdings LLC
Parkway Partners $47.5M $139 Sep-15
Comerica Bank 1 Sugar Creek Center Blvd
E Fort Bend/Sugar Land
193,998 1983 Equus Capital Partners, Ltd Parkway Partners $31.4M $160 Sep-15
2401 Fountain View San Felipe/Voss
174,223 1981/ 1999
Jetall Companies, Inc American Spectrum Realty, Inc
$15.4M $99 Jul-15
Sales ActivityHouston’s office investment sales activity included 30 transactions, with an average price per square foot of $129 and a median cap rate of 7.0%. Listed below are a few significant transactions that are pending or closed in Q3 2015.
Sources: CoStar and Real Capital Analytics
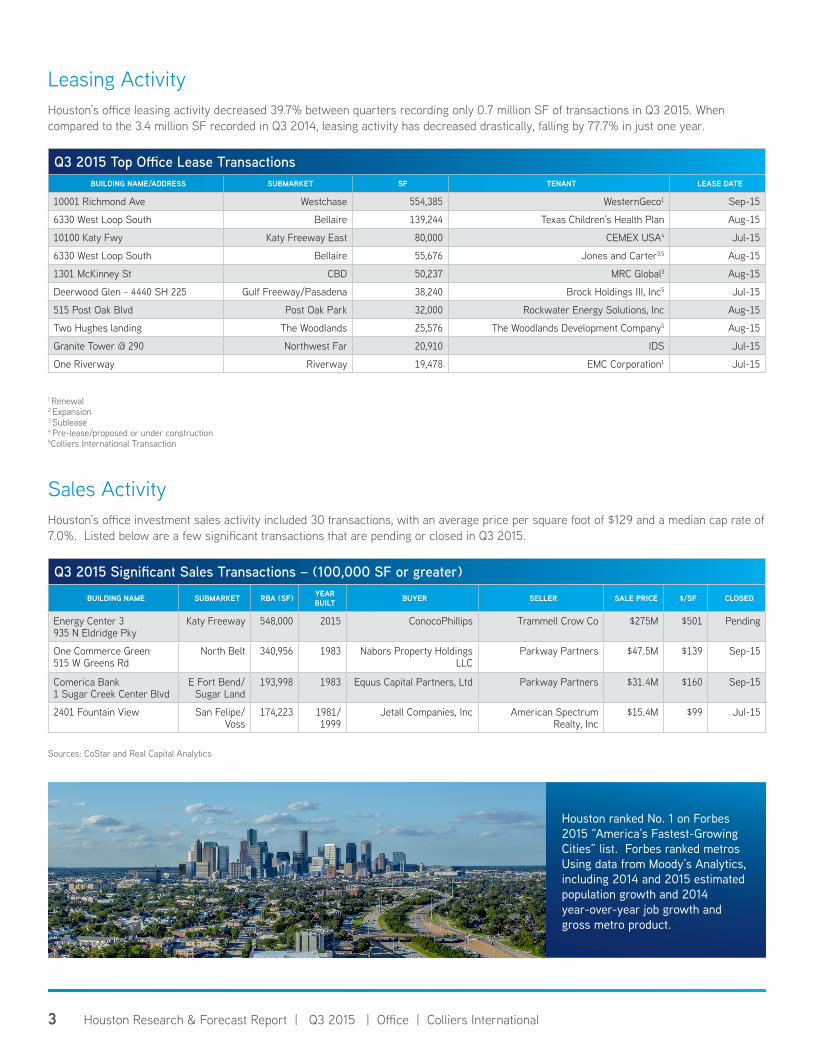
Houston ranked No. 1 on Forbes 2015 “America’s Fastest-Growing Cities” list. Forbes ranked metros Using data from Moody’s Analytics, including 2014 and 2015 estimated population growth and 2014 year-over-year job growth and gross metro product.

4 Houston Research & Forecast Report | Q3 2015 | Office | Colliers International
Houston Office Market Summary (CBD, Suburban, & Overall)
INVENTORY DIRECT VACANCY SUBLEASE VACANCY VACANCY VACANCY RATE (%) NET ABSORPTION
(SF)RENTAL
RATE
CLASS # OF BLDGS. TOTAL (SF) (SF) RATE
(%) (SF) RATE (%)
TOTAL (SF) Q3-2015 Q2-2015 Q3-2015 Q2-2015 AVG
($/SF)
CBD
A 31 30,708,600 2,579,891 8.4% 612,669 2.0% 3,192,560 10.4% 10.2% -68,774 -119,920 $42.72
B 32 10,423,105 2,383,667 22.9% 215,776 2.1% 2,599,443 24.9% 24.8% -12,467 -497,193 $28.31
C 16 1,115,797 412,320 37.0% 0 0.0% 412,320 37.0% 37.0% 0 0 $18.56
Total 79 42,247,502 5,375,878 12.7% 828,445 2.0% 6,204,323 14.7% 14.5% -81,241 -617,113 $37.90
SUBURBAN
A 346 87,510,933 10,869,366 12.4% 1,871,903 2.1% 12,741,269 14.6% 14.4% 602,515 1,073,683 $33.02
B 947 79,359,571 11,062,974 13.9% 585,711 0.7% 11,648,685 14.7% 14.4% -178,238 -109,602 $20.41
C 319 14,057,632 1,707,274 12.1% 13,311 0.8% 1,720,585 12.2% 12.1% -4,452 21,459 $15.40
Total 1612 180,928,136 23,639,614 13.1% 2,470,925 1.4% 26,110,539 14.4% 14.2% 419,825 985,540 $26.31 OVERALL
A 377 118,219,533 13,449,257 11.4% 2,484,572 2.1% 15,933,829 13.5% 13.4% 533,741 953,763 $34.74
B 979 89,782,676 13,446,641 15.0% 801,487 0.9% 14,248,128 15.9% 15.6% -190,705 -606,795 $21.04
C 335 15,173,429 2,119,594 14.0% 13,311 0.1% 2,132,905 14.1% 14.0% -4,452 21,459 $15.74
Total 1691 223,175,638 29,015,492 13.0% 3,299,370 1.5% 32,314,862 14.5% 14.3% 338,584 368,427 $27.83
INVENTORY DIRECT VACANCY SUBLEASE VACANCY VACANCY VACANCY RATE (%) NET ABSORPTION
(SF)RENTAL
RATE
CLASS # OF BLDGS. TOTAL (SF) (SF) RATE
(%) (SF) RATE (%)
TOTAL (SF) Q3-2015 Q2-2015 Q3-2015 Q2-2015 AVG
($/SF)
ALLEN PARKWAY (MIDTOWN)
A 6 2,059,595 556,763 27.0% 6,063 0.3% 562,826 27.3% 23.7% 53,443 58,347 $33.57
B 33 2,688,556 132,182 4.9% 3,135 0.1% 135,317 5.0% 5.0% -173 -3,138 $30.08
C 16 526,292 100,849 19.2% 2,501 0.5% 103,350 19.6% 23.7% 21,363 -1,651 $21.58
Total 55 5,274,443 789,794 15.0% 11,699 0.2% 801,493 15.2% 13.9% 74,633 53,558 $32.12
BAYTOWN
B 3 186,005 6,248 3.4% 0 0.0% 6,248 3.4% 3.4% 0 0 $23.18
C 3 81,481 1,812 2.2% 0 0.0% 1,812 2.2% 2.2% 0 0 $7.95
Total 6 267,486 8,060 3.0% 0 0.0% 8,060 3.0% 3.0% 0 0 $19.76
BELLAIRE
A 6 1,091,536 76,353 7.0% 22,216 2.0% 98,569 9.0% 9.4% 4,341 7,190 $25.71
B 19 2,631,259 118,604 4.5% 2,324 0.1% 120,928 4.6% 4.9% 7,816 -594 $24.15
C 5 327,020 49,923 15.3% 0 0.0% 49,923 15.3% 15.3% 0 2,247 $16.97
Total 30 4,049,815 244,880 6.0% 24,540 0.6% 269,420 6.7% 7.0% 12,157 8,843 $23.72
CONROE AND OUTLYING MONTGOMERY CO
A 2 107,161 47,161 44.0% 0 0.0% 47,161 44.0% 44.0% 0 0 $24.53
B 9 429,851 28,263 6.6% 0 0.0% 28,263 6.6% 6.6% 0 0 $18.09
C 7 289,662 7,255 2.5% 0 0.0% 7,255 2.5% 2.5% -2,781 320 $15.72
Total 18 826,674 82,679 10.0% 0 0.0% 82,679 10.0% 10.0% -2,781 320 $21.25
E. FORT BEND/SUGAR LAND
A 17 3,399,199 212,816 6.3% 17,175 0.5% 229,991 6.8% 7.4% 20,625 2,447 $29.89
B 39 2,397,838 314,685 13.1% 21,337 0.9% 336,022 14.0% 15.3% 143,256 27,057 $22.75
C 3 204,593 0 0.0% 0 0.0% 0 0.0% 0.0% 0 0 $0.00
Total 59 6,001,630 527,501 8.8% 38,512 0.6% 566,013 9.4% 10.2% 163,881 29,504 $25.82
Houston Suburban Office Market Summary

5 Houston Research & Forecast Report | Q3 2015 | Office | Colliers International
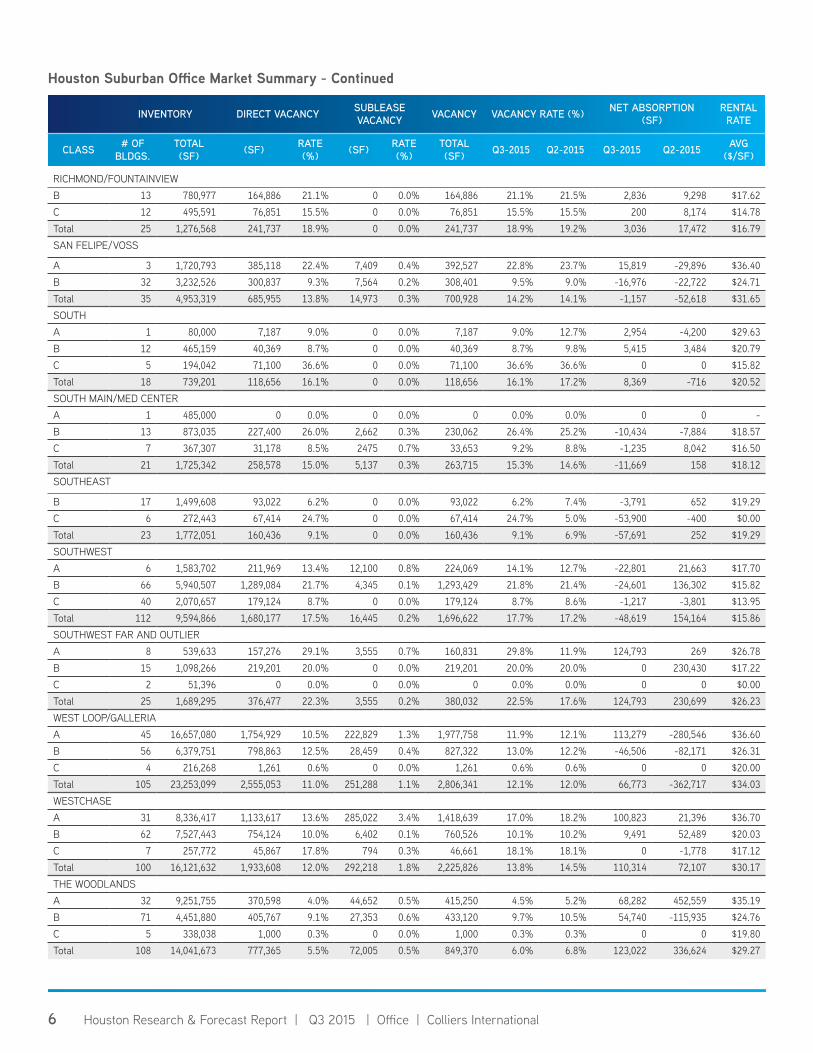
Houston Suburban Office Market Summary - Continued
INVENTORY DIRECT VACANCY SUBLEASE VACANCY VACANCY VACANCY RATE (%) NET ABSORPTION
(SF)RENTAL
RATE
CLASS # OF BLDGS.
TOTAL (SF) (SF) RATE
(%) (SF) RATE (%)
TOTAL (SF) Q3-2015 Q2-2015 Q3-2015 Q2-2015 AVG
($/SF)
FM 1960 A 22 3,353,057 114,714 3.4% 27,680 0.8% 142,394 4.2% 5.1% 28,453 754,097 $28.68B 84 4,714,854 682,835 14.5% 7,601 0.2% 690,436 14.6% 15.1% 22,432 46,892 $16.34C 22 757,200 65,884 8.7% 0 0.0% 65,884 8.7% 9.6% 6,478 -3,855 $16.00Total 128 8,825,111 863,433 9.8% 35,281 0.4% 898,714 10.2% 10.8% 57,363 797,134 $18.76GREENWAY A 16 6,301,350 667,991 10.6% 13,928 0.2% 681,919 10.8% 11.2% 23,007 -48,340 $33.45B 33 3,314,400 216,071 6.5% 10,953 0.3% 227,024 6.8% 5.8% -36,409 10,888 $26.34C 19 777,295 227,169 29.2% - 0.0% 227,169 29.2% 34.1% 37,505 -4,798 $18.27Total 68 10,393,045 1,111,231 10.7% 24,881 0.2% 1,136,112 10.9% 11.2% 24,103 -42,250 $29.66GULF FREEWAY/PASADENA A 1 22,706 0 0.0% 0 0.0% 0 0.0% 2.3% 526 0 $27.59B 37 2,188,548 348,140 15.9% 0 0.0% 348,140 15.9% 16.3% 9,103 4,836 $21.04C 32 1,228,317 106,215 8.6% 0 0.0% 106,215 8.6% 9.3% 7,769 -9,637 $18.21Total 70 3,439,571 454,355 13.2% 0 0.0% 454,355 13.2% 13.7% 17,398 -4,801 $20.08I-10 EAST
B 7 447,680 44,592 10.0% 0 0.0% 44,592 10.0% 11.4% 6,475 5,041 $14.75C 5 267,130 99,243 37.2% 0 0.0% 99,243 37.2% 27.8% -25,000 0 $12.00Total 12 714,810 143,835 20.1% 0 0.0% 143,835 20.1% 17.5% -18,525 5,041 $13.86KATY FREEWAYA 86 20,441,210 1,994,998 9.8% 869,568 4.3% 2,864,566 14.0% 13.8% 264,123 333,095 $37.31B 107 10,444,466 1,482,802 14.2% 254,927 2.4% 1,737,729 16.6% 15.2% -146,299 -404,458 $24.48C 33 1,580,620 57,406 3.6% 7,541 0.5% 64,947 4.1% 4.5% 6,237 7,308 $18.22Total 226 32,466,296 3,535,206 10.9% 1,132,036 3.5% 4,667,242 14.4% 13.8% 124,061 -64,055 $31.28
KINGWOOD/HUMBLEB 15 853,520 75,506 8.8% 0 0.0% 75,506 8.8% 8.0% -6,834 -7,752 $19.36C 4 143,500 16,116 11.2% 0 0.0% 16,116 11.2% 10.2% -1,492 300 $17.84Total 19 997,020 91,622 9.2% 0 0.0% 91,622 9.2% 8.4% -8,326 -7,452 $19.09NASA/CLEAR LAKE A 12 1,770,973 67,070 3.8% 29,537 1.7% 96,607 5.5% 3.6% -32,320 -8,213 $24.44B 49 3,337,795 915,671 27.4% 6,434 0.2% 922,105 27.6% 28.1% 16,247 36,331 $18.67C 20 660,409 108,857 16.5% 0 0.0% 108,857 16.5% 17.9% 9,498 -2,501 $15.44Total 81 5,769,177 1,091,598 18.9% 35,971 0.6% 1,127,569 19.5% 19.4% -6,575 25,617 $19.30NORTH BELT/GREENSPOINT A 24 5,442,036 1,814,489 33.3% 242,288 4.5% 2,056,777 37.8% 33.7% -224,032 -100,629 $28.76B 58 5,999,273 1,261,448 21.0% 145,621 2.4% 1,407,069 23.5% 21.9% -95,556 -60,374 $16.51C 22 1,403,276 284,704 19.6% 0 0.0% 284,704 20.3% 19.6% -10,351 17,942 $11.99Total 104 12,844,585 3,360,641 26.2% 387,909 3.0% 3,748,550 29.2% 26.6% -329,939 -143,061 $22.96NORTHEAST NEAR AND NORTHEAST OUTLIER
B 4 181,618 27,695 15.2% 0 0.0% 27,695 15.2% 15.2% 0 4,838 $20.59C 2 56,562 7,247 12.8% 0 0.0% 7,247 12.8% 13.8% 558 3,946 $14.70Total 6 238,180 34,942 14.7% 0 0.0% 34,942 14.7% 14.9% 558 8,784 $18.49NORTHWEST AND NORTHWEST OUTLIERA 27 4,867,730 1,296,317 26.6% 67,881 1.4% 1,364,198 28.0% 29.3% 61,200 -105,556 $26.76B 93 7,294,756 1,114,679 15.3% 56,594 0.8% 1,171,273 16.1% 15.1% -68,470 26,888 $18.48C 38 1,490,761 100,799 6.8% 0 0.0% 100,799 6.8% 6.9% 1,916 1,601 $13.16Total 158 13,653,247 2,511,795 18.4% 124,475 0.9% 2,636,270 19.3% 19.3% -5,354 -77,067 $21.92
6 Houston Research & Forecast Report | Q3 2015 | Office | Colliers International
Houston Suburban Office Market Summary - Continued
INVENTORY DIRECT VACANCY SUBLEASE VACANCY VACANCY VACANCY RATE (%) NET ABSORPTION
(SF)RENTAL
RATE
CLASS # OF BLDGS.
TOTAL (SF) (SF) RATE
(%) (SF) RATE (%)
TOTAL (SF) Q3-2015 Q2-2015 Q3-2015 Q2-2015 AVG
($/SF)
RICHMOND/FOUNTAINVIEWB 13 780,977 164,886 21.1% 0 0.0% 164,886 21.1% 21.5% 2,836 9,298 $17.62C 12 495,591 76,851 15.5% 0 0.0% 76,851 15.5% 15.5% 200 8,174 $14.78Total 25 1,276,568 241,737 18.9% 0 0.0% 241,737 18.9% 19.2% 3,036 17,472 $16.79SAN FELIPE/VOSS
A 3 1,720,793 385,118 22.4% 7,409 0.4% 392,527 22.8% 23.7% 15,819 -29,896 $36.40B 32 3,232,526 300,837 9.3% 7,564 0.2% 308,401 9.5% 9.0% -16,976 -22,722 $24.71Total 35 4,953,319 685,955 13.8% 14,973 0.3% 700,928 14.2% 14.1% -1,157 -52,618 $31.65SOUTH A 1 80,000 7,187 9.0% 0 0.0% 7,187 9.0% 12.7% 2,954 -4,200 $29.63B 12 465,159 40,369 8.7% 0 0.0% 40,369 8.7% 9.8% 5,415 3,484 $20.79C 5 194,042 71,100 36.6% 0 0.0% 71,100 36.6% 36.6% 0 0 $15.82Total 18 739,201 118,656 16.1% 0 0.0% 118,656 16.1% 17.2% 8,369 -716 $20.52SOUTH MAIN/MED CENTERA 1 485,000 0 0.0% 0 0.0% 0 0.0% 0.0% 0 0 - B 13 873,035 227,400 26.0% 2,662 0.3% 230,062 26.4% 25.2% -10,434 -7,884 $18.57C 7 367,307 31,178 8.5% 2475 0.7% 33,653 9.2% 8.8% -1,235 8,042 $16.50Total 21 1,725,342 258,578 15.0% 5,137 0.3% 263,715 15.3% 14.6% -11,669 158 $18.12SOUTHEAST
B 17 1,499,608 93,022 6.2% 0 0.0% 93,022 6.2% 7.4% -3,791 652 $19.29C 6 272,443 67,414 24.7% 0 0.0% 67,414 24.7% 5.0% -53,900 -400 $0.00Total 23 1,772,051 160,436 9.1% 0 0.0% 160,436 9.1% 6.9% -57,691 252 $19.29SOUTHWESTA 6 1,583,702 211,969 13.4% 12,100 0.8% 224,069 14.1% 12.7% -22,801 21,663 $17.70B 66 5,940,507 1,289,084 21.7% 4,345 0.1% 1,293,429 21.8% 21.4% -24,601 136,302 $15.82C 40 2,070,657 179,124 8.7% 0 0.0% 179,124 8.7% 8.6% -1,217 -3,801 $13.95Total 112 9,594,866 1,680,177 17.5% 16,445 0.2% 1,696,622 17.7% 17.2% -48,619 154,164 $15.86SOUTHWEST FAR AND OUTLIER A 8 539,633 157,276 29.1% 3,555 0.7% 160,831 29.8% 11.9% 124,793 269 $26.78B 15 1,098,266 219,201 20.0% 0 0.0% 219,201 20.0% 20.0% 0 230,430 $17.22C 2 51,396 0 0.0% 0 0.0% 0 0.0% 0.0% 0 0 $0.00Total 25 1,689,295 376,477 22.3% 3,555 0.2% 380,032 22.5% 17.6% 124,793 230,699 $26.23WEST LOOP/GALLERIA A 45 16,657,080 1,754,929 10.5% 222,829 1.3% 1,977,758 11.9% 12.1% 113,279 -280,546 $36.60B 56 6,379,751 798,863 12.5% 28,459 0.4% 827,322 13.0% 12.2% -46,506 -82,171 $26.31C 4 216,268 1,261 0.6% 0 0.0% 1,261 0.6% 0.6% 0 0 $20.00Total 105 23,253,099 2,555,053 11.0% 251,288 1.1% 2,806,341 12.1% 12.0% 66,773 -362,717 $34.03WESTCHASEA 31 8,336,417 1,133,617 13.6% 285,022 3.4% 1,418,639 17.0% 18.2% 100,823 21,396 $36.70B 62 7,527,443 754,124 10.0% 6,402 0.1% 760,526 10.1% 10.2% 9,491 52,489 $20.03C 7 257,772 45,867 17.8% 794 0.3% 46,661 18.1% 18.1% 0 -1,778 $17.12Total 100 16,121,632 1,933,608 12.0% 292,218 1.8% 2,225,826 13.8% 14.5% 110,314 72,107 $30.17THE WOODLANDS A 32 9,251,755 370,598 4.0% 44,652 0.5% 415,250 4.5% 5.2% 68,282 452,559 $35.19B 71 4,451,880 405,767 9.1% 27,353 0.6% 433,120 9.7% 10.5% 54,740 -115,935 $24.76C 5 338,038 1,000 0.3% 0 0.0% 1,000 0.3% 0.3% 0 0 $19.80Total 108 14,041,673 777,365 5.5% 72,005 0.5% 849,370 6.0% 6.8% 123,022 336,624 $29.27

7 Houston Research & Forecast Report | Q3 2015 | Office | Colliers International
Office Development PipelineHouston’s construction pipeline contains 10.8 million SF of office space, and 63.9% of the new space is pre-leased. Build-to-suit projects make up 51.5% of the pipeline, and the remaining 5.2M SF of spec office space under construction is approximately 25.4% pre-leased. Approximately 5.5 million SF, or 50.9% of the build-to-suit projects under construction, are pre-leased to energy industry companies. The table below includes office buildings under construction with a RBA of 50,000 SF or more.
BUILDING NAME ADDRESS SUBMARKET SF PRE-LEASED DEVELOPER EST.
DELIVERY
FMC Technologies Campus Subsea Ln & W Lake Houston Northeast Near 1,700,000 100.0% McCord Development, Inc Jan-16
Phillips 66 2101 Citywest Blvd Westchase 1,100,000 100.0% Gilbane Building Company Jun-16
609 Main at Texas 609 Main St CBD 1,056,658 0.0% Hines Dec-16
BHP Biliton Petroleum 1500 Post Oak Blvd Galleria/Uptown 600,000 100.0% Transwestern Oct-15
Energy Center Four 925 N Eldridge Pky Katy Freeway West 600,000 100.0% Trammell Crow Company Oct-16
Energy Center V 915 N Eldridge Pky Katy Freeway West 524,328 0.0% Trammell Crow Company Apr-16
Air Liquide Center- South 9811 Katy Fwy Katy Freeway East 452,370 59.1% MetroNational Nov-15
Millennium Tower II 10353 Richmond Ave Westchase 445,000 100.0% BMS Management, Inc. Feb-16
Hilcorp Energy Tower 1110 Main Street CBD 406,600 100.0% Hines Jan-16
3737 Buffalo Speedway 3737 Buffalo Speedway Ave Greenway Plaza 400,000 28.8% PM Realty Group Oct-15
West Memorial Place II 15377 Memorial Dr Katy Freeway West 389,709 48.7% Skanska Commercial Development
May-16
Future Amegy Bank HQ 1717 W. Loop South Post Oak Park 380,000 74.2% Hines Feb-17
ExxonMobil - Hughes Landing 1735 Hughes Landing Blvd The Woodlands 318,170 100.0% The Woodlands Development Company
Oct-15
Three Hughes landing 1780 Hughes Landing Blvd The Woodlands 320,815 0.0% The Woodlands Development Company
Nov-15
ExxonMobil - Hughes Landing 1725 Hughes Landing Blvd The Woodlands 331,754 51.1% The Woodlands Development Company
Oct-15
One Grove Street 2925 Richmond Ave Greenway Plaza 248,275 62.8% Midway Companies Oct-15
Havenwood Office Park 25700 Interstate 45 The Woodlands 240,470 0.2% Everson Developments, LLC Nov-15
CityCentre Five 825 Town & Country Katy Freeway East 227,063 64.7% Midway Companies 00/2015
Wildwood Corporate Centre II 480 Wildwood Forest Dr The Woodlands 201,933 0.0% Archway Properties Jul-16
Remington Square - Ph II 10713 W Sam Houston Pky N FM 1960/Hwy 249 200,000 0.0% Stream Realty Partners, L.P. Oct-15
Regions Financial Center 3773 Richmond Ave Greenway Plaza 210,000 44.7% The Redstone Companies Apr-16
1885 Saint James Place 1885 St James Pl West Loop/Galleria 165,000 0.0% Nelson Murphree Legacy Partners
Mar-16
Grandway West II Grand Pky & Franz Rd Katy Freeway West 130,200 16.2% Transwestern Mar-16
Gateway at Spring Valley 9090 Katy Fwy Katy Freeway East 95,459 64.0% Ersa Grae Corporation Oct-15
Lennar Office Building/ Bldg. 6 681 Greens Pky Greenspoint/ N Belt 68,950 100.0% KDC Real Estate Devel. & Invt. Oct-15

8 North American Research & Forecast Report | Q4 2014 | Office Market Outlook | Colliers International
Copyright © 2015 Colliers International.The information contained herein has been obtained from sources deemed reliable. While every reasonable effort has been made to ensure its accuracy, we cannot guarantee it. No responsibility is assumed for any inaccuracies. Readers are encouraged to consult their professional advisors prior to acting on any of the material contained in this report.
Colliers International | Market000 Address, Suite # 000 Address, Suite #+1 000 000 0000colliers.com/<<market>>
8 North American Research & Forecast Report | Q4 2014 | Office Market Outlook | Colliers International
Copyright © 2015 Colliers International.The information contained herein has been obtained from sources deemed reliable. While every reasonable effort has been made to ensure its accuracy, we cannot guarantee it. No responsibility is assumed for any inaccuracies. Readers are encouraged to consult their professional advisors prior to acting on any of the material contained in this report.
Colliers International | Houston1233 West Loop South, Suite 900 Houston, Texas 77027+1 713 222 2111colliers.com/texas/houston
FOR MORE INFORMATIONLisa BridgesDirector of Market Research | Houston+1 713 830 [email protected]
Quoted gross rental rates for existing top performing office buildingsBUILDING NAME ADDRESS SUBMARKET RBA (SF) YEAR
BUILT % LEASED AVAIL. SF RENT ($/SF) OWNER
Wells Fargo Plaza 1000 Louisiana St CBD 1,721,242 1983 91.8% 250,801 $54.10 New York State Common Retirement Fund
Heritage Plaza 1111 Bagby St CBD 1,212,895 1986 99.2% 12,964 $54.04 Brookfield Office Properties
BG Group Place 811 Main CBD 972,474 2011 98.5% 105,652 $56.91 NPS of Korea
CityCentre Two 818 Town & Country Blvd Katy Freeway 149,827 2009 98.7% 5,986 $48.07 LaSalle Investment Management
Williams Tower 2800 Post Oak Blvd West Loop/Galleria
1,476,973 1983 97.6% 67,307 $48.38-$52.38
Invesco Real Estate
3009 Post Oak Blvd 3009 Post Oak Blvd West Loop/Galleria
304,419 2013 88.1% 33,961 $48.73 Post Oak Building LLC
CityWestPlace 4 2103 CityWest Blvd Westchase 518,293 2001 95.0% 208,609 $45.93 Parkway Properties, Inc.
One BriarLake Plaza 2000 W Sam Houston Pky Westchase 502,410 2000 98.1% 69,775 $49.24 TIER REIT, Inc.
Two Hughes Landing 1790 Hughes Landing Blvd The Woodlands 197,719 2014 92.0% 23,635 $43.55 The Woodlands Development Company, L.P.
Note: Avail. SF includes direct and sublet space as well as any future available space listed. Source: CoStar Property
Class A (53%) Class B (40%) Class C (7%)
TOTALOFFICE
INVENTORY
Q3 2015 Highlights
14.5%Current Vacancy
338,584 SFCurrent Net Absorption
118.2M SF89.8M SF
15.2M SF
3.4
1.21.8
2.4
Mill
ion
Squa
re F
eet
Q3 Q2Q1Q42014
0.7
Q32015
77.7% Annual
39.7% Quarterly
LEASING ACTIVITY
10.8M SF
223.2Million SF