Embed Size (px)
Citation preview

Share or view online at colliers.com/texas/houstonindustrial
More than 50% of Houston’s industrial construction activity located in East Southeast Far submarket
Research & Forecast Report
HOUSTON | INDUSTRIALQ3 2016
Lisa Bridges Director of Market Research | Houston
During the third quarter of this year, 6.5M SF of Houston’s industrial inventory was absorbed, substantially more than the 2.2M SF absorbed in the third quarter of the previous year. However, if you remove the 3.9M SF absorbed in one building by Daikin, net absorption would be closer to 2.6M SF. Industrial leasing activity remained steady between quarters dropping slightly from 5.4M SF to 4.9M SF, but was down by 1.0M SF from 5.9M SF in Q3 2015.
The average vacancy rate increased 90 basis points over the year from 4.6% in Q3 2015 to 5.5%, and the rate was unchanged from the previous quarter. Over 82% of the 6.5M SF of new construction delivered in Q3 2016 was pre-leased and 64% of the 7.3M SF currently under construction is pre-leased. More than half of the buildings under construction are located on the east side of Houston where the Houston’s Ship Channel and the Port of Houston are located.
The average citywide quoted industrial rental rate decreased 1.6% on an annual basis from $6.98 per SF NNN in Q3 2015 to $6.87 per SF NNN.
According to the U.S. Bureau of Labor Statistics, the Houston metropolitan area created 14,200 jobs (not seasonally adjusted) between August 2015 and August 2016. Most of the job growth occurred in education and healthcare, trade, transportation and utilities, and professional services.
Summary Statistics Houston Industrial Market Q3 2015 Q2 2016 Q3 2016
Vacancy Rate 4.6% 5.5% 5.5%
Net Absorption (SF)(Million Square Feet) 2.2M 0.6M 6.3M
New Construction (SF)(Million Square Feet) 3.5M 2.6M 6.5M
Under Construction (SF)(Million Square Feet) 13.6M 13.2M 7.4M
Asking Rents Per Square Foot Per Year
Average $6.98 $6.97 $6.87
Warehouse/Distribution $6.53 $6.57 $6.59
Flex/Service $11.48 $11.53 $11.37
Tech/R&D $12.38 $12.26 $11.79
Market IndicatorsRelative to prior period
AnnualChange
Quarterly Change
Quarterly Forecast*
VACANCY
NET ABSORPTION
NEW CONSTRUCTION
UNDER CONSTRUCTION
*Projected

21 New Century LLC purchased an 86,500-SF office/warehouse located at 9600 New Century Dr in Pasadena, TX in the East-Southeast Far submarket. According to Real Capital Analytics, Matlack Leasing sold the property for $5.15M or $60 per SF.
9600 New Century Dr
10855 John Ralston Rd
Sales Transactions
Saron NV purchased a multi-building property on 40 acres from Algeco Scotsman for $3.05M or $53 per SF. The improvements total 57,074 square feet of building area and the majority of the acreage is stabilized. The property is fully fenced and located in the Northeast Hwy 90 submarket.
2 Houston Research & Forecast Report | Q3 2016 | Industrial | Colliers International
Sales ActivitySource: Real Capital Analytics
Q3 2016
NO. OF PROPERTIES: 23
TOTAL SF: 2.5M
AVERAGE $/SF: $67
AVERAGE CAP RATE: N/A
Job Growth & Unemployment(not seasonally adjusted)
UNEMPLOYMENT 08/15 08/16
HOUSTON 4.9% 5.8%
TEXAS 4.6% 5.0%
U.S. 5.0% 5.2%
JOB GROWTHAnnual Change
# of Jobs Added
HOUSTON 0.5% 14.2K
TEXAS 1.6% 186.9K
U.S. 1.7% 2.4M
Vacancy & Availability
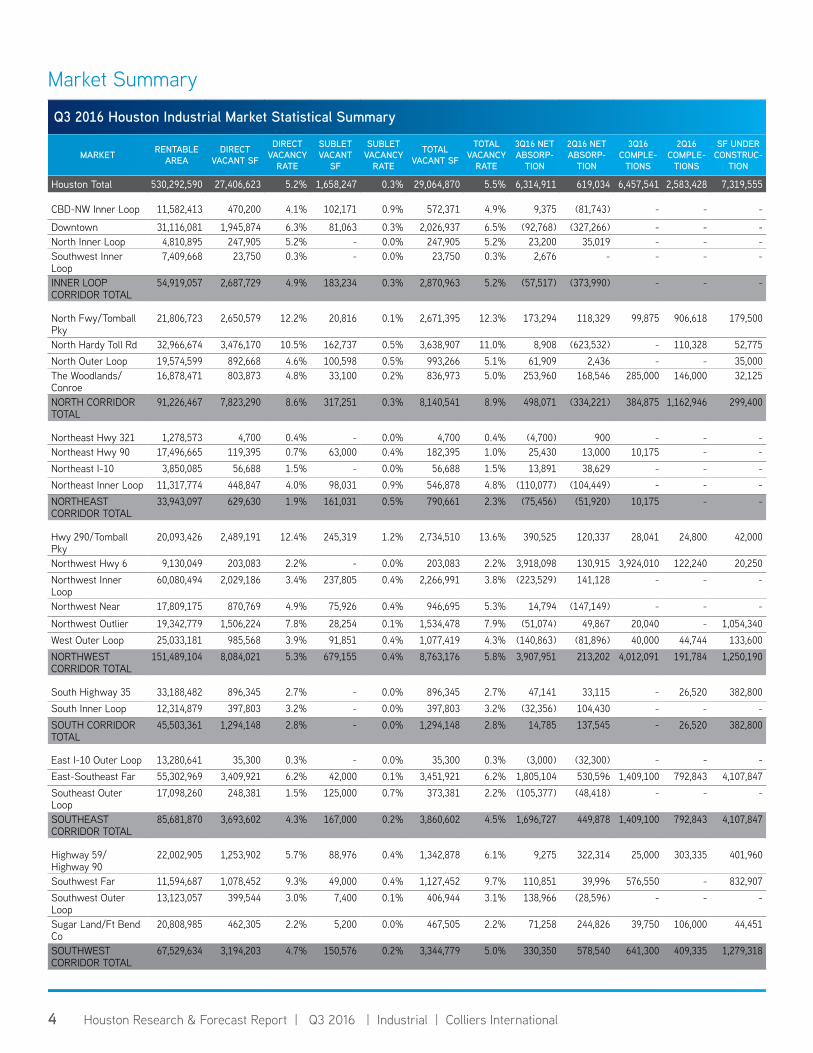
Houston’s average industrial vacancy rate remained at 5.5% over the quarter, increasing 90 basis points from 4.6% in Q3 2015. At the end of the third quarter, Houston had 27.4M SF of vacant industrial space for direct lease and 1.7M SF of vacant sublease space. Among the major industrial corridors, the Northeast Corridor has the lowest vacancy rate at 2.3%, followed by the South at 2.8%, and then the Southeast Corridor at 4.5%. The largest percentage of vacant space is located in the North Corridor which has an 8.9% vacancy rate.
Houston’s industrial construction pipeline had 7.3M SF of projects underway at the end of the third quarter, slightly less than half of which is spec development. The largest project under construction is the 800,000-SF build-to-suit FedEx distribution center located on the newly opened Grand Parkway in northwest Harris County. A partial list of buildings currently under construction can be found on page 3 of this report.
Absorption & Demand
Houston’s industrial market posted 6.3M SF of positive net absorption in the third quarter, with the Northwest Corridor submarket contributing the largest share at 3.9M SF, followed by the Southeast Corridor which posted 1.7M SF of absorption. The North Corridor followed with 498,000 SF of absorption, and the Southwest Corridor contributed 330,350 SF. The South Corridor only posted 14,800 SF of positive net absorption, and two submarkets posted negative net absorption including the Northeast Corridor with 75,456 SF, and the Inner Loop Corridor posting 57,500 SF of negative net absorption.
There were several major tenant move-ins contributing to net absorption gains in the third quarter including Daikin Applied America (3.9M SF) in the Northwest Hwy 6 submarket, Advanced Auto Parts (441,000 SF) in the Hwy 290/Tomball Pky submarket, Valerus Field Solutions (396,880 SF) in the Austin County submarket, and Serta (268,400 SF) in the Hwy 290/Tomball Pky submarket.
Rental Rates
According to CoStar, our data service provider, Houston’s citywide average quoted industrial rental rate for all product types decreased slightly to $6.87 per SF NNN from $6.97 per SF NNN in Q2 2016. According to Colliers’ internal data, actual lease transactions are in the $4.56 – $5.04 per SF NNN range for newer bulk industrial spaces, while flex rates range from $7.20 to $10.80 per SF depending on the existing improvements or the allowance provided for tenant improvements, and the location of the property.
By property type, according to CoStar, the average quoted NNN rental rates are as follows: $6.59 per SF for Warehouse Distribution space; $5.46 per SF for Bulk Logistics space; $11.37 per SF for Flex/Service space; with Tech/R&D space averaging $11.79 per SF.
4.0%
4.5%
5.0%
5.5%
6.0%
6.5%
$4.00
$5.00
$6.00
$7.00
$8.00
Industrial Rental Rate and Vacancy Percentage Houston, TX
Avg. Rent Avg. Vacancy
*Vacancy percentage includes direct and sublease space.
3 Houston Research & Forecast Report | Q3 2016 | Industrial | Colliers International33
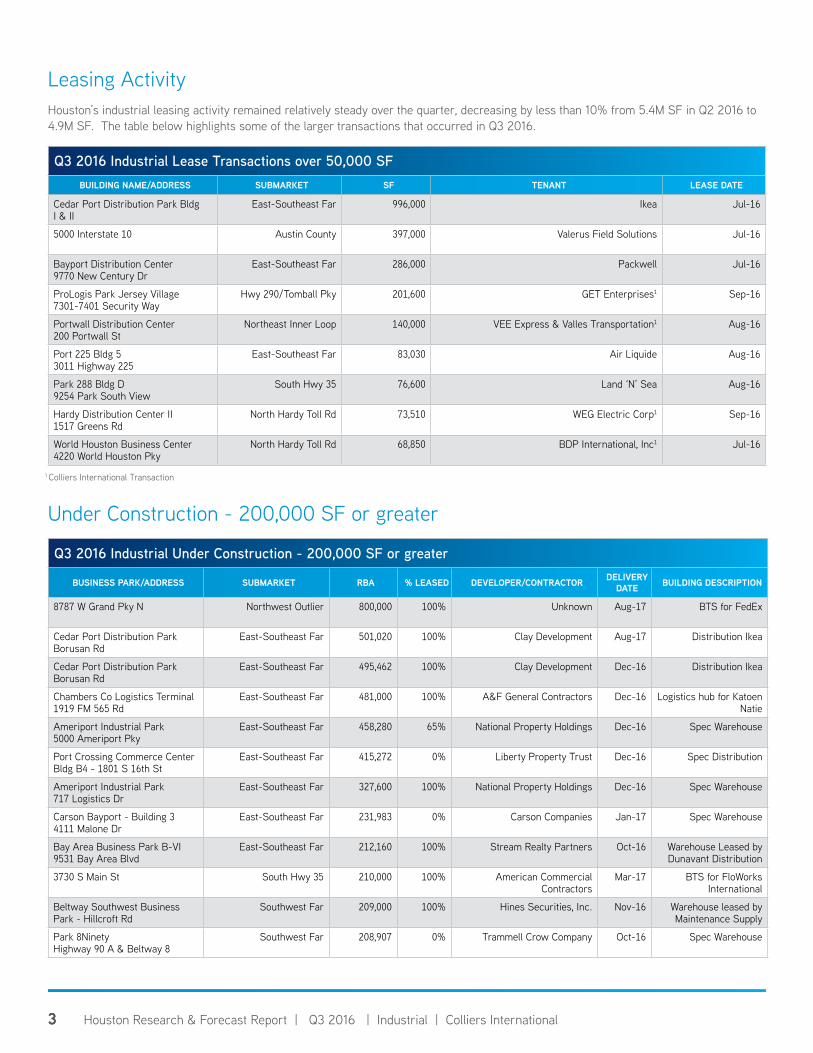
Q3 2016 Industrial Lease Transactions over 50,000 SFBUILDING NAME/ADDRESS SUBMARKET SF TENANT LEASE DATE
Cedar Port Distribution Park Bldg I & II
East-Southeast Far 996,000 Ikea Jul-16
5000 Interstate 10 Austin County 397,000 Valerus Field Solutions Jul-16
Bayport Distribution Center9770 New Century Dr
East-Southeast Far 286,000 Packwell Jul-16
ProLogis Park Jersey Village7301-7401 Security Way
Hwy 290/Tomball Pky 201,600 GET Enterprises1 Sep-16
Portwall Distribution Center200 Portwall St
Northeast Inner Loop 140,000 VEE Express & Valles Transportation1 Aug-16
Port 225 Bldg 53011 Highway 225
East-Southeast Far 83,030 Air Liquide Aug-16
Park 288 Bldg D9254 Park South View
South Hwy 35 76,600 Land ‘N’ Sea Aug-16
Hardy Distribution Center II1517 Greens Rd
North Hardy Toll Rd 73,510 WEG Electric Corp1 Sep-16
World Houston Business Center4220 World Houston Pky
North Hardy Toll Rd 68,850 BDP International, Inc1 Jul-16
Leasing ActivityHouston’s industrial leasing activity remained relatively steady over the quarter, decreasing by less than 10% from 5.4M SF in Q2 2016 to 4.9M SF. The table below highlights some of the larger transactions that occurred in Q3 2016.
1 Colliers International Transaction
Under Construction - 200,000 SF or greater
Q3 2016 Industrial Under Construction - 200,000 SF or greater
BUSINESS PARK/ADDRESS SUBMARKET RBA % LEASED DEVELOPER/CONTRACTOR DELIVERY DATE BUILDING DESCRIPTION
8787 W Grand Pky N Northwest Outlier 800,000 100% Unknown Aug-17 BTS for FedEx
Cedar Port Distribution ParkBorusan Rd
East-Southeast Far 501,020 100% Clay Development Aug-17 Distribution Ikea
Cedar Port Distribution ParkBorusan Rd
East-Southeast Far 495,462 100% Clay Development Dec-16 Distribution Ikea
Chambers Co Logistics Terminal1919 FM 565 Rd
East-Southeast Far 481,000 100% A&F General Contractors Dec-16 Logistics hub for Katoen Natie
Ameriport Industrial Park5000 Ameriport Pky
East-Southeast Far 458,280 65% National Property Holdings Dec-16 Spec Warehouse
Port Crossing Commerce Center Bldg B4 - 1801 S 16th St
East-Southeast Far 415,272 0% Liberty Property Trust Dec-16 Spec Distribution
Ameriport Industrial Park717 Logistics Dr
East-Southeast Far 327,600 100% National Property Holdings Dec-16 Spec Warehouse
Carson Bayport - Building 34111 Malone Dr
East-Southeast Far 231,983 0% Carson Companies Jan-17 Spec Warehouse
Bay Area Business Park B-VI9531 Bay Area Blvd
East-Southeast Far 212,160 100% Stream Realty Partners Oct-16 Warehouse Leased by Dunavant Distribution
3730 S Main St South Hwy 35 210,000 100% American Commercial Contractors
Mar-17 BTS for FloWorks International
Beltway Southwest Business Park - Hillcroft Rd
Southwest Far 209,000 100% Hines Securities, Inc. Nov-16 Warehouse leased by Maintenance Supply
Park 8NinetyHighway 90 A & Beltway 8
Southwest Far 208,907 0% Trammell Crow Company Oct-16 Spec Warehouse
4 Houston Research & Forecast Report | Q3 2016 | Industrial | Colliers International
Q3 2016 Houston Industrial Market Statistical Summary
MARKET RENTABLE AREA
DIRECT VACANT SF
DIRECT VACANCY
RATE
SUBLET VACANT
SF
SUBLET VACANCY
RATE
TOTAL VACANT SF
TOTAL VACANCY
RATE
3Q16 NET ABSORP-
TION
2Q16 NET ABSORP-
TION
3Q16 COMPLE-
TIONS
2Q16 COMPLE-
TIONS
SF UNDER CONSTRUC-
TION
Houston Total 530,292,590 27,406,623 5.2% 1,658,247 0.3% 29,064,870 5.5% 6,314,911 619,034 6,457,541 2,583,428 7,319,555
CBD-NW Inner Loop 11,582,413 470,200 4.1% 102,171 0.9% 572,371 4.9% 9,375 (81,743) - - -
Downtown 31,116,081 1,945,874 6.3% 81,063 0.3% 2,026,937 6.5% (92,768) (327,266) - - - North Inner Loop 4,810,895 247,905 5.2% - 0.0% 247,905 5.2% 23,200 35,019 - - - Southwest Inner Loop
7,409,668 23,750 0.3% - 0.0% 23,750 0.3% 2,676 - - - -
INNER LOOP CORRIDOR TOTAL
54,919,057 2,687,729 4.9% 183,234 0.3% 2,870,963 5.2% (57,517) (373,990) - - -
North Fwy/Tomball Pky
21,806,723 2,650,579 12.2% 20,816 0.1% 2,671,395 12.3% 173,294 118,329 99,875 906,618 179,500
North Hardy Toll Rd 32,966,674 3,476,170 10.5% 162,737 0.5% 3,638,907 11.0% 8,908 (623,532) - 110,328 52,775 North Outer Loop 19,574,599 892,668 4.6% 100,598 0.5% 993,266 5.1% 61,909 2,436 - - 35,000 The Woodlands/Conroe
16,878,471 803,873 4.8% 33,100 0.2% 836,973 5.0% 253,960 168,546 285,000 146,000 32,125
NORTH CORRIDOR TOTAL
91,226,467 7,823,290 8.6% 317,251 0.3% 8,140,541 8.9% 498,071 (334,221) 384,875 1,162,946 299,400
Northeast Hwy 321 1,278,573 4,700 0.4% - 0.0% 4,700 0.4% (4,700) 900 - - - Northeast Hwy 90 17,496,665 119,395 0.7% 63,000 0.4% 182,395 1.0% 25,430 13,000 10,175 - - Northeast I-10 3,850,085 56,688 1.5% - 0.0% 56,688 1.5% 13,891 38,629 - - - Northeast Inner Loop 11,317,774 448,847 4.0% 98,031 0.9% 546,878 4.8% (110,077) (104,449) - - - NORTHEAST CORRIDOR TOTAL
33,943,097 629,630 1.9% 161,031 0.5% 790,661 2.3% (75,456) (51,920) 10,175 - -
Hwy 290/Tomball Pky
20,093,426 2,489,191 12.4% 245,319 1.2% 2,734,510 13.6% 390,525 120,337 28,041 24,800 42,000
Northwest Hwy 6 9,130,049 203,083 2.2% - 0.0% 203,083 2.2% 3,918,098 130,915 3,924,010 122,240 20,250 Northwest Inner Loop
60,080,494 2,029,186 3.4% 237,805 0.4% 2,266,991 3.8% (223,529) 141,128 - - -
Northwest Near 17,809,175 870,769 4.9% 75,926 0.4% 946,695 5.3% 14,794 (147,149) - - -
Northwest Outlier 19,342,779 1,506,224 7.8% 28,254 0.1% 1,534,478 7.9% (51,074) 49,867 20,040 - 1,054,340 West Outer Loop 25,033,181 985,568 3.9% 91,851 0.4% 1,077,419 4.3% (140,863) (81,896) 40,000 44,744 133,600 NORTHWEST CORRIDOR TOTAL
151,489,104 8,084,021 5.3% 679,155 0.4% 8,763,176 5.8% 3,907,951 213,202 4,012,091 191,784 1,250,190
South Highway 35 33,188,482 896,345 2.7% - 0.0% 896,345 2.7% 47,141 33,115 - 26,520 382,800 South Inner Loop 12,314,879 397,803 3.2% - 0.0% 397,803 3.2% (32,356) 104,430 - - - SOUTH CORRIDOR TOTAL
45,503,361 1,294,148 2.8% - 0.0% 1,294,148 2.8% 14,785 137,545 - 26,520 382,800
East I-10 Outer Loop 13,280,641 35,300 0.3% - 0.0% 35,300 0.3% (3,000) (32,300) - - - East-Southeast Far 55,302,969 3,409,921 6.2% 42,000 0.1% 3,451,921 6.2% 1,805,104 530,596 1,409,100 792,843 4,107,847 Southeast Outer Loop
17,098,260 248,381 1.5% 125,000 0.7% 373,381 2.2% (105,377) (48,418) - - -
SOUTHEAST CORRIDOR TOTAL
85,681,870 3,693,602 4.3% 167,000 0.2% 3,860,602 4.5% 1,696,727 449,878 1,409,100 792,843 4,107,847
Highway 59/Highway 90
22,002,905 1,253,902 5.7% 88,976 0.4% 1,342,878 6.1% 9,275 322,314 25,000 303,335 401,960
Southwest Far 11,594,687 1,078,452 9.3% 49,000 0.4% 1,127,452 9.7% 110,851 39,996 576,550 - 832,907 Southwest Outer Loop
13,123,057 399,544 3.0% 7,400 0.1% 406,944 3.1% 138,966 (28,596) - - -
Sugar Land/Ft Bend Co
20,808,985 462,305 2.2% 5,200 0.0% 467,505 2.2% 71,258 244,826 39,750 106,000 44,451
SOUTHWEST CORRIDOR TOTAL
67,529,634 3,194,203 4.7% 150,576 0.2% 3,344,779 5.0% 330,350 578,540 641,300 409,335 1,279,318
Market Summary
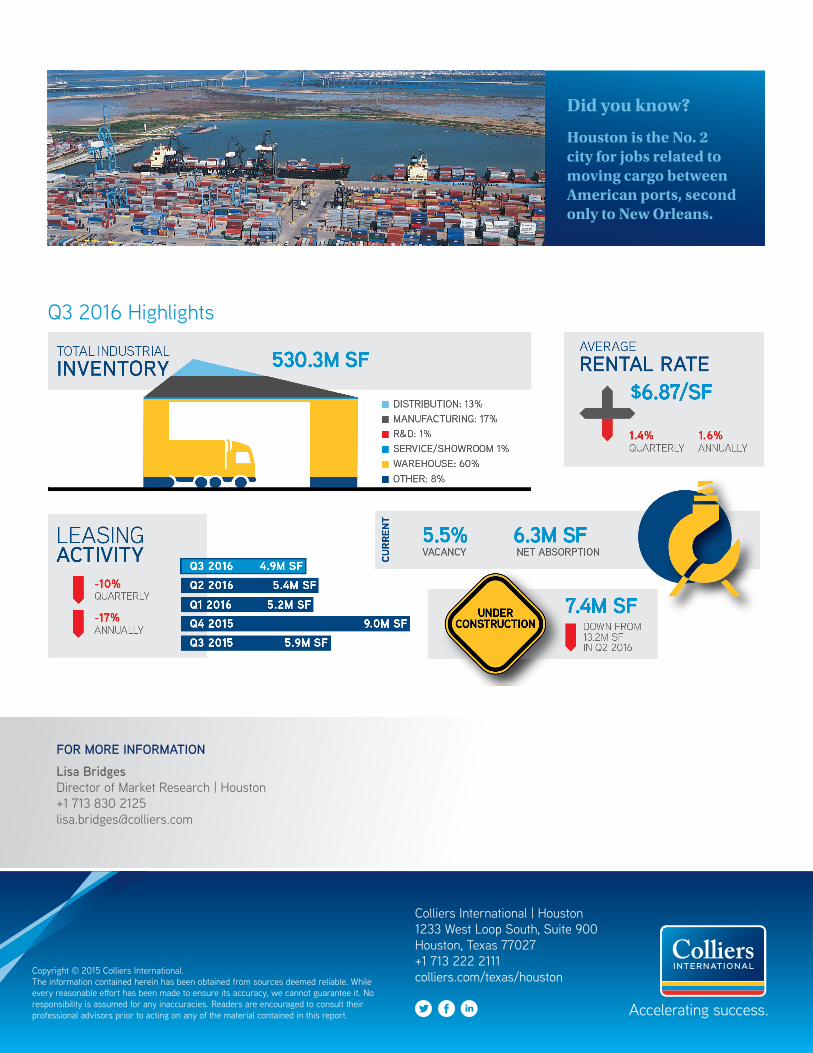
Did you know?
Houston is the No. 2 city for jobs related to moving cargo between American ports, second only to New Orleans.
5 North American Research & Forecast Report | Q4 2014 | Office Market Outlook | Colliers International
Copyright © 2015 Colliers International.The information contained herein has been obtained from sources deemed reliable. While every reasonable effort has been made to ensure its accuracy, we cannot guarantee it. No responsibility is assumed for any inaccuracies. Readers are encouraged to consult their professional advisors prior to acting on any of the material contained in this report.
Colliers International | Market000 Address, Suite # 000 Address, Suite #+1 000 000 0000colliers.com/<<market>>
5 North American Research & Forecast Report | Q4 2014 | Office Market Outlook | Colliers International
Copyright © 2015 Colliers International.The information contained herein has been obtained from sources deemed reliable. While every reasonable effort has been made to ensure its accuracy, we cannot guarantee it. No responsibility is assumed for any inaccuracies. Readers are encouraged to consult their professional advisors prior to acting on any of the material contained in this report.
Colliers International | Houston1233 West Loop South, Suite 900 Houston, Texas 77027+1 713 222 2111colliers.com/texas/houston
FOR MORE INFORMATIONLisa BridgesDirector of Market Research | Houston+1 713 830 [email protected]
Q3 2016 Highlights


![Houston Q2 2011 Industrial Outlook (FINAL)[1]](https://img.dokumen.tips/doc/110x75/577d26f61a28ab4e1ea2abcb/houston-q2-2011-industrial-outlook-final1.jpg)

