Embed Size (px)
Citation preview

3Q’15 MARKET SUMMARYHOUSTON, TX METRO AREA
Cresa Houston5599 San Felipe, Suite 500Houston, Texas 77056713.402.5800
cresa.com/houston
Connect with us and get up-to-date information:
Cresa : The Tenant’s Advantage
Facebook.com/cresa
Follow us!@cresahouston

TABLE OF CONTENTS01
02
04
05
06
MARKET AT-A-GLANCE
RENTAL RATES
LEASING ACTIVITY
SUBLEASE SPACE
CONSTRUCTION & DELIVERIES
Information contained herein is provided, in part, from third party sources including: CoStar
Group, Greater Houston Partnership, Bureau of Economic Analysis, Bauer College of
Business, University of Houston - Institute for Regional Forecasting, U.S. Census Bureau,
Perryman Group, Institute for Supply Management – Houston, Houston Association of
Realtors, National Association of Realtors, C2ER Cost of Living Index 3Q’2015, Baker
Hughes U.S. Rig Count Reports.
Even though obtained from sources deemed reliable, no warranty or representation,
expressed or implied, is made as to the accuracy of the information herein.
09
07
08
SUBMARKET SNAPSHOTS
NET ABSORPTION
SALES ACTIVITY
03 VACANCY RATES
11
10
MARKET OUTLOOK
HOUSTON ECONOMY

1.7%
0.3%
1.3%
$45.12 CBD: Class A 8.4%
$28.02 CBD: Class B 15.6%
$41.73 CBD: Class A + B 10.8%
0.1%
0.1%
0.1%
$35.37 Houston: Class A 10.2%
$21.73 Houston: Class B 12.6%
$29.06 Houston: Class A + B 11.4%
0.1%
0.2%
0.1%
$32.90 Suburban: Class A 10.8%
$21.73 Suburban: Class B 12.6%
$27.08 Suburban: Class A + B 11.6%
WesternGeco 554,385 Westchase Renewal
Texas Children's Health Plan 139,244 Bellaire Lease
EMAS 93,600 Westchase Sublease
WD Vonn Gonten 73,000 Katy Fwy Lease
Pannell Kerr Forster of Texas 65,416 San Felipe/Voss Lease
Jones and Carter 55,676 Bellaire Sublease
MRC Global 50,237 CBD Sublease
Quantlab Financial 46,098 Greenway Plaza Lease
Brock Holdings III 38,240 Gulf Fwy/Pasadena Lease
PMC Sierra 33,370 FM 1960/Hwy 249 Lease
HOUSTON MARKETAT-A-GLANCE
With West Texas crude prices slipping below $45/bbl in 3Q’15, the
downturn that has characterized Houston’s economic landscape
this year, is expected to last longer than originally anticipated – at
least through 2016.
There is good news for tenants, however, as the Houston office
market remains tenant favorable, especially in terms of increased
tenant concessions such as longer periods of free rent, free parking,
and larger tenant improvement allowances. Sublease space and
large blocks saw some high figures in the third quarter, even though
rental rates continue to climb slowly.
Given the cyclical nature of the economy, over the long term, the
Houston office market will return to a balanced supply and demand,
but in the interim, prolonged job cuts continue to have an impact.
TENANT’S PERSPECTIVE
MARKET TRENDS
Even though asking rates are increasing, rates at which deals were done decreased, coupled with attractive concession packages.
Houston today is a tenant-favorable market. Many, however, are delaying making large commitments on space or opting for shorter-term leases.
Landlord concessions remain in the tenant’s favor, in order to stay competitive and retain tenants, especially in the suburban submarkets.
More layoffs, bankruptcies, and M&A activity are expected in the oil industry as budgets are slashed, rig counts and drilling permits decline, and exports reduced (due to an appreciating dollar)..
Total non-farm employment increased 1.3% year-over-year in August 2015 – sectors that experienced decreases in employment include manufacturing, construction, and mining and logging.
Regardless of rates increasing slightly, other fundamentals have weakened – including higher vacancy rates, less absorption, construction, and leasing activity, and increased sublease space.
RECENT TRANSACTIONS RENTAL & VACANCY RATES
Tenant Size (SF) Submarket Type Avg. Rate Vacancy Rate Margin from Q2
01

01 HOUSTON MARKET AT-A-GLANCE
MAJOR SUBMARKET STATS | CLASS A + B OFFICE
SUBMARKET MAP | CLASS A + B OFFICE
GALLERIA
$34.839.6%
G
REENWAY
$32.398.1%
M
ED CENTER
$27.2210.2%
CBD
$41.6510.8%
KATY FWY
$32.2310.0%
W
ESTCHASE
$30.269.0%
E. F
ORT BEND CO
$25.239.0%
N
ORTH BELT
$23.6325.0%
N
ORTHWEST
$20.0816.4%
FM 1960
$19.3012.4%
MIDTOWN
$32.0011.0%
TH
E
WOODLAND
S
$30.475.5%
$
%
Rental Rate
Vacancy Rate
AREA OVERVIEW
WEST BELT
$27.9411.3%
Gross Rental Rate Vacant Available Total Net Absorption Leasing ActivitySF
DeliveredUnder
ConstructionSubmarket Inventory (SF) Direct Sub. Direct Sub. Total Quarter YTD 2015 Deals SF
CBD 47,458,584 $41.65 $27.36 10.8% 1.7% 12.4% (98,306) (1,744,510) 22 145,963 0 1,578,258
Suburban 215,815,534 $27.08 $24.95 11.6% 1.0% 12.6% 833,114 3,981,704 449 2,770,088 1,188,757 10,532,914
E. Fort Bend Co. 8,860,889 $25.23 $21.26 9.0% 0.6% 9.6% 183,926 372,743 30 158,384 137,800 5,824
FM 1960 11,495,518 $19.30 $18.97 12.4% 0.3% 12.7% 76,634 605,208 33 98,708 0 0
Galleria/W. Loop 22,997,133 $34.38 $27.74 9.6% 1.1% 10.6% 66,773 (326,830) 50 243,462 92,021 1,145,000
Greenway Plaza 10,638,618 $32.39 $24.03 8.1% 0.2% 8.3% (12,652) (236,710) 26 166,063 0 858,275
Katy Freeway 34,295,789 $32.23 $23.72 10.0% 2.4% 12.4% 244,731 360,150 68 314,537 305,807 2,365,694
Midtown 6,754,545 $32.00 $25.80 11.0% 0.1% 11.1% 47,737 163,267 22 67,224 167,562 0
North Belt 12,190,983 $23.63 $17.25 25.0% 3.3% 28.2% (300,493) (1,190,631) 9 16,713 0 68,950
Northwest 9,167,626 $20.08 $17.08 16.4% 0.7% 17.0% (17,727) (180,321) 19 81,418 0 15,000
Medical Center 9,413,199 $27.22 $16.93 10.2% 0.0% 10.2% 10,719 (159,931) 14 76,537 0 0
West Belt 6,211,786 $27.94 $21.80 11.3% 1.3% 12.6% 12,252 1,039,999 12 75,056 0 200,000
Westchase 16,159,401 $30.26 $32.50 9.0% 1.7% 10.7% 106,891 (118,349) 34 691,981 0 1,545,000
Woodlands 17,148,948 $30.47 $33.19 5.5% 0.4% 5.9% 146,988 2,192,085 29 120,320 38,350 1,589,652
Other Suburban 50,481,099 $22.37 $25.55 13.7% 0.2% 13.9% 271,206 1,468,674 102 658,795 447,217 2,739,519
TOTAL 263,274,118 $29.07 $25.35 11.4% 1.1% 12.6% 734,808 2,237,194 471 2,916,051 1,188,757 12,111,172

02
RENTAL RATES
Overall, rental rates for Class A and B citywide are holding
steady but starting to see small decreases in some key
submarkets. Even though asking rates are still increasing,
rates at which deals were actually done decreased, coupled
with attractive concession packages.
RENTAL RATES
• Rental rates are the highest they have been in Houston’s history.
• Over the past year, rental rates have seen a 3.2% increase
(nearly $1), from $28.15 PSF gross in 3Q’14 to $29.06 in 3Q’15.
• Year-over-year Class B rates showed the largest increase of
3.3% to $21.73 PSF gross; Class A rates increased by 2.3% to
$35.37 PSF gross.
• In 3Q’15, the highest rates were found in the central submarkets
(the CBD, Greenway Plaza, Galleria/West Loop) and out west
(Katy Freeway).
• The Northwest, North Belt, Westchase, and Greenway Plaza
submarkets saw a decline in rental rates.
SUBMARKET RENTAL RATES 3Q’15
Westchase
The Woodlands
Midtown
Katy Freeway
Greenway Plaza
Galleria/W. Loop
CBD
Houston
West Belt
$0
Rental Rate Houston Avg Rate
Medical Center
Sugar Land
North Belt
Northwest
$10 $20 $30 $40 $50
HISTORICAL DIRECT AVERAGE RATES
3Q ‘08 3Q ‘09 3Q ‘10 3Q ‘11 3Q ‘12 3Q ‘13 3Q ‘14
$40.00
$35.00
$30.00
$25.00
$20.00
$15.00
$10.00
$5.00
$0.00
Class A Class B Houston Average Rate
3Q ‘15
FM 1960

03
HISTORICAL TOTAL VACANT AVAILABLE SUBMARKET VACANCY RATES 3Q’15
CBD
Midtown
West Belt
Houston
FM 1960
Northwest
North Belt
Medical Center
Katy Freeway
0%
Vacancy Rate Houston Avg Rate
Galleria/W. Loop
Westchase
Sugar Land
Greenway Plaza
5% 10% 15% 20%
Class A Class B Houston Average Rate
14%
13%
12%
11%
10%
9%
8%
7%
3Q ‘08 3Q ‘09 3Q ‘10 3Q ‘11 3Q ‘12 3Q ‘13 3Q ‘14 3Q ‘15
NOTES
• Citywide, in Class A and B buildings, vacancy rates increased
by 0.1% (10 basis points) quarter-over-quarter to 11.4%; year-
over-year vacancy rates increased by 1.7% (170 basis points).
• Larger increases have been felt in Class A properties - vacancy
has jumped from 7.6% to 10.2% in just a year.
• In 3Q’15, the lowest vacancy rates (below 10.0%) were in
Woodlands (5.5%), Greenway Plaza (8.1%), Sugar Land (9.0%),
Westchase (9.0%), and Galleria/West Loop (9.6%).
• The highest vacancy rates were in FM 1960 (12.4%), Northwest
(16.4%), and North Belt (25.0%).
Demand for space has slowed considerably and citywide
vacancy increased by 1.7% (170 basis points) year-over-
year to 11.4%. Coupled with the delivery of nearly 1.2 million
square feet of office space and 12.9 million square feet
due to be delivered in the coming years, vacancy is sure to
continue it’s upward trend.
VACANCY RATES
The Woodlands

04
LEASING ACTIVITY
Lease transaction volume continued to decline in 3Q’15
to approximately 2.9 MSF, nearly half of the activity when
compared year-over-year. The slowdown in leasing activity is
mainly due to the uncertainty of oil prices, coupled with the
delivery of product that is not yet leased.
NOTES
• Leasing activity in the first three quarters of 2015 (9.2 MSF) was
about half when compared to the first three quarters of 2014
(16.7 MSF).
• The total number of deals in 3Q’15 was also down to 469 –
lower than the previous 39 quarters and much lower than a year
earlier (1,036 deals in 3Q’14).
• Lease transaction volume fell below the 15-year quarterly
average of 4.3 MSF.
• 3Q’15 was the slowest quarter in terms of leasing activity since
the great recession.
• The submarkets with the most activity include Galleria/West
Loop, Westchase, and Katy Freeway.
• Medical Center, Midtown, and FM 1960 were among the lowest.
TOP 10 TRANSACTIONS HISTORICAL LEASING ACTIVITY
‘01 ‘02 ‘03 ‘04 ‘05 ‘06 ‘07 ‘08 ‘09 ‘10 ‘11 ‘12 ‘13 ‘14
25
20
15
10
5
5,000
4,000
3,000
2,000
1,000
Milli
ons
Total SF Leased Total Deals
WesternGeco 554,385 10001 Richmond Westchase
Texas Children's Health Plan
139,244 6330 W. Loop South Bellaire
EMAS 93,600 10500 Richmond Westchase
WD Vonn Gonten 73,000 10496 Old Katy Rd. Katy Fwy
Pannell Kerr Forster of Texas
65,416 5847 San Felipe San Felipe/Voss
Jones and Carter 55,676 6330 W. Loop South Bellaire
MRC Global 50,237 1301 McKinney CBD
Quantlab Financial 46,098 3 Greenway Plaza Greenway Plaza
Brock Holdings III 38,240 4440 SH 225 Gulf Fwy/Pasadena
PMC Sierra 33,370 11450 Compaq Ctr. W. FM 1960/Hwy 249
Tenant SF Building Submarket
YTD‘15
0 0
Q2’15 Q3’15
1 20
West Belt
CBD
Greenway Plaza
Galleria/W. Loop
Westchase
Katy Freeway
Sugar Land
North Belt
Northwest
The Woodlands
FM 1960
Midtown
SUBMARKET COMPARISON
Leasing activity dwindled starting in 4Q’14. Katy Freeway, The Galleria, and Westchase submarkets saw the most activity during the second quarter of 2015.
Medical Center
Q4’14 Q1’15

05
SUBLEASE SPACE
There is currently 7.8 MSF of space on the sublease market.
Sublease space is continuing to hit the market as the amount
of space available has more than doubled year-over-year.
NOTES
• This space has an average gross rental rate of $25.30. Sublease
rental rates have decreased over the past several quarters.
• This space has an average time on the market of 14.4 months.
• The submarkets with the most sublease space are Katy Freeway
(2.3 MSF), CBD (1.5 MSF), and Westchase (924 KSF).
LARGE BLOCKS OF SUBLEASE SPACE
• There are 87 buildings in the Houston market that have large
blocks of sublease space (20,000 SF+)
• Available space of this size has more than tripled year-over-year.
• This equates to 6.2 MSF (~79%) of total sublease space and has
an average gross rental rate of $25.87.
• Average time on the market for this dataset is 11.0 months
HISTORICAL SUBLEASE SPACE
$33
$29
$25
$21
$17
10%
8%
6%
4%
2%
Gross Rent Total Available
$13 0%
SUBLEASE SPACE BY SUBMARKET
‘07 ‘08 ‘09 ‘10 ‘11 ‘12 ‘13 ‘14 ‘15
Other
The Woodlands
Galleria
Greenspoint
Westchase
CBD
Katy Freeway
FM 1960
0
SF Available
1 MSF 2 MSF0.5 MSF 1.5 MSF 2.5 MSF
Greenway
Northwest
Sugar Land
06
CONSTRUCTION &DELIVERIES
Nearly 1.2 MSF was delivered across Houston during 3Q’15.
This was preceded by a year of record deliveries equating
to nearly 13 MSF. There was an additional 12.9 MSF under
construction across the Houston area at the end of the third
quarter.
DELIVERIES (BLDGS. OVER 100.000 SF)
• There were five building completions totaling 853,000 square feet
in the third quarter (buildings with more than 100,000 SF).
• Of the 853,000 SF delivered in 3Q’15, roughly 36% was leased at
the time of completion.
• The tenancy profile of two of the buildings delivered in 3Q’15 was
single tenant, corporate users, taking 27% of the space delivered
and equating to 233,000 SF.
• 1Q’15 saw the most SF delivered in a single quarter over the past
15 years.
• Completions were dispersed across Houston with one building
each in the E. Fort Bend Co./Sugar Land, Southwest Far, Katy
Freeway, Midtown, and Katy/Grand Parkway submarkets.
PROPOSED DEVELOPMENT
• There is an additional 29.5 MSF proposed in 240
properties, most of which, given current economic
conditions, will not come out of the ground until at least
the end of 2016.
• The submarkets that have the most proposed
development include: CBD (5.6 MSF), Katy Freeway (5.1
MSF), and The Woodlands (4.9 MSF).

Sugar Land 1 133,000 100.0%
Southwest 1 100,000 100.0%
Katy Freeway 1 300,907 0.0%
Midtown 1 167,562 28.7%
Katy/Grand Parkway 1 151,187 16.4%
Total 5 852,656 35.9%
Submarket Bldgs SF % Leased
FM 1960 2 770,000 100.0%
Katy Freeway 9 2,543,657 73.3%
Southwest 5 1,381,977 70.8%
West Belt 1 206,754 15.0%
Woodlands 2 2,000,000 100.0%
Total 19 6,902,388 81.8%
Submarket Bldgs SF % Leased
7705 Highway 90AE. Fort Bend Co./Sugar Land
133,000 SF100% Leased
Nalco Champion
270 Abner Jackson ParkwaySouthwest Far
100,000 SF100% Leased
Dow
1414 EnclaveKaty Freeway West
300,907 SF0.0% LeasedMulti-Tenant
2299 San FelipeMidtown
167,562 SF28.7% LeasedMulti-Tenant
24275 Katy FreewayKaty/Grand Parkway
151,187 SF16.4% LeasedMulti-Tenant
DELIVERIES BY SUBMARKET 1H’15 DELIVERIES BY SUBMARKET 3Q’15
3Q’15 MAJOR DELIVERIES
06 CONSTRUCTION & DELIVERIES

06
2015 1 600,000 11.6% 100.0%
2016 6 4,583,440 88.4% 100.0%
2017 0 NA NA NA
Single Tenant Bldgs. SF % of Devs. % Leased
ST Total 7 5,183,440 47.4% 100.0%
2015 6 1,848,523 32.1% 37.8%
2016 10 3,344,287 58.1% 17.4%
2017 2 566,813 9.8% 49.7%
Multi-Tenant Bldgs. SF % of Devs. % Leased
MT Total 18 5,759,623 52.6% 27.1%
TOTAL 28 10,943,063 100.0% 61.7%
Greenway Plaza
Galleria/W. Loop
The Woodlands
Westchase
CBD
Northeast
West Belt
0
SF Leased SF Unleased
1 MSF 2 MSF
Delivered Projected
0
2 MSF
4 MSF
6 MSF
8 MSF
10 MSF
‘00 ‘01 ‘02 ‘03 ‘04 ‘05 ‘06 ‘07 ‘08 ‘09 ‘10 ‘11 ‘12 ‘13 ‘14 ‘16 ‘17‘15‘990.5 MSF 1.5 MSF 2.5 MSF
10.9 MSF
4Q’15 02/2017
CONSTRUCTION AT-A-GLANCE
SLATED OFFICE DELIVERY
PRE-LEASEDPERCENTAGE
Combined both multi-tenant and single tenant (for just multi-tenant projects, the pre-leased percentage is 27.1%)
62%
SINGLE TENANTCONSTRUCTION
There is 5.2 MSF of single-tenant space under construction compared to 5.8 MSF of multi-tenant space
47%
• At the end of the 3Q’15, Houston had approximate 12.9 MSF of
office space under construction in 60 buildings. Of these, 25 are
at least 100,000 SF and encompass over 10.9 MSF.
• The tenancy profile of 47.4% of the buildings (100,000 SF+)
currently under construction is single tenant, corporate users
totaling over 5.1 MSF in seven buildings.
• Multi-tenant buildings over 100,000 SF, which account for 52.6%
of inventory under construction (5.8 MSF), are 27.1% pre-leased
with a weighted average rent of $44.66 PSF gross with average
operating expenses between $13.00 and $14.00/SF.
UNDER CONSTRUCTION
12 MSF
14 MSF
Katy Freeway
CONSTRUCTION BY SUBMARKET HISTORICAL CONSTRUCTION
CONSTRUCTION & DELIVERIES

06 CONSTRUCTION & DELIVERIES
3Q’15 UNDER CONSTRUCTION
915 Eldridge PkwyKaty Fwy West
526,637 SF0.0% LeasedMulti-Tenant
Delivers 4/2016
925 Eldridge PkwyKaty Fwy West
600,000 SF100% LeasedConocoPhillips
Delivers 10/2015
1500 Post Oak BlvdGalleria
600,000 SF100% LeasedBHP Billiton
Delivers 10/2016
10353 RichmondWestchase445,000 SF
100% LeasedMulti-Tenant
Delivers 2/2016
9811 Katy FwyKaty Fwy East
526,637 SF58.5%
Multi-TenantDelivers 11/2015
Subsea Ln @ W Lake HoustonNortheast Near1,700,000 SF100% Leased
FMC TechnologiesDelivers 1/2016
3773 RichmondGreenway Plaza
210,000 SF37.4% LeasedMulti-Tenant
Delivers 4/2016
2101 Citywest BlvdWestchase
1,100,000 SF100% Leased
Phillips 66Delivers 6/2016
609 Main StCBD
1,057,668 SF0.0% LeasedMulti-Tenant
Delivers 12/2016
825 Town & CountryKaty Fwy East
227,063 SF62.3% LeasedMulti-Tenant
Delivers 11/2015
3737 Buffalo SpeedwayGreenway Plaza
400,000 SF22.9% LeasedMulti-Tenant
Delivers 10/2015
1110 Main StCBD
406,600 SF100% LeasedHilcorp EnergyDelivers 1/2016

07
HISTORICAL NET ABSORPTION SUBMARKET COMPARISON
NET ABSORPTION
The second quarter saw total net absorption of 735 KSF,
which was not balanced with deliveries (excess of 1.2 MSF).
Suburban submarkets such as The Woodlands, Sugar Land
and Katy Freeway experienced the most positive absorption
in the third quarter.
• Absorption in 2014 at 9.3 MSF was historically the highest it’s
been in the past 15 years.
• The Woodlands far outweighs all submarkets in terms of net
absorption over the past year with over 3.9 MSF. The closest
submarket was Katy Freeway with 1.2 MSF..
• The submarkets with the most negative net absorption in 3Q’15
and over the past year were CBD and North Belt.
NOTES
0 MSF
(2) MSF
2 MSF
4 MSF
6 MSF
8 MSF
10 MSF
‘99 ‘00 ‘01 ‘02 ‘03 ‘04 ‘05 ‘06 ‘07 ‘08 ‘09 ‘10 ‘11 ‘12 ‘13 ‘14 ‘15
Class A Class B Houston Total Absorption
5 MSF
Q3’15
Westchase
Midtown
Sugar Land
FM 1960
Katy Freeway
The Woodlands
West Belt
Northwest
Medical Center
Greenway Plaza
Galleria/W. Loop
North Belt
CBD
Q4’14 Q1’15 Q2’15
3 MSF1 MSF(1) MSF(3) MSF

08
TRANSACTION SUMMARY
Sales of significant office properties (75,000 SF+) were strong
in the third quarter with over 2.1 million square feet in 12
buildings trading hands. A majority of the properties coming
to market are single-tenant or deals with major tenancy with
a great deal of term remaining.
Below is a summary of significant transactions (75,000 SF+)
that have closed year-to-date by quarter.
SALES ACTIVITY
1Q’15 6 2,552,269 96% $871,338,775 $341
2Q’15 7 1,171,338 76% $174,400,000 $149
3Q’15 12 2,149,464 75% $294,550,000 $137
Quarter No. SF Occ. Price $/SF
YTD 25 5,873,071 84% $1,340,288,775 $228
LARGEST 3Q’15 TRANSACTIONS
Building Galleria Place I & II One Commerce Green 400 N Sam Houston Pky E Academy HQ
Address 5251 & 5333 Westheimer 515 W Greens Rd 400 North Belt 1540 North Mason Road
Date August 15 September 15 July 15 August 15
Submarket Galleria/Uptown Greenspoint Greenspoint Energy Corridor
Class A B B A
Year Built 1976 1983 1981 2015
SqFt 401,271 340,956 234,147 217,782
Occ. 52% 100% 64% 100%
$/SF $226 $139 $43 $266
Buyer Lincoln Prop. JV Illinois (State) Nabors Industries Hartman Moody National Companies
Seller Songy JV Carlyle Parkway Properties Parkway Properties Academy Sports + Outdoors

CBDSUBMARKET UPDATE
The CBD Submarket is the city’s largest submarket with
nearly 36.5 million square feet of Class A and B space. The
long-term viability of the CBD as the city’s premier submarket
has been ensured as a result of the massive $5 billion public/
private investment in downtown since early 2000.
MARKET TRENDS
MARKET DRIVERS
TENANT’S PERSPECTIVE
• The average rental rate rate experienced an increase between
2Q and 3Q’2015. This rate is at historically its highest level in
this submarket at $41.73 gross PSF.
• At 3Q’15 the vacancy rate of 10.8% was the highest it has
been since 2006.
• Sublease space is at an all-time high at nearly 1.5 million SF.
• Unstable price of oil expected to continue to have an impact
on office rents and vacancy for the remainder of 2015.
• Face rates will remain high, as landlords don’t correct down
as quickly as they correct up.
• Developers are bringing some space to the market to help
meet the increases in demand – one large multi-tenant build-
ing will deliver in January 2016 adding inventory to the CBD.
• Increases in concessions will continue given the instability of
oil prices.
• Due to low vacancies in Class A space, tenants will still
compete for well-located premier office space, however, there
are now more deals to be made.
• Tenants will need to continue to monitor the price of oil due to
its correlation with demand for CBD space.
$ 28.16$0.14 vs
2Q’15
0.2% vs 2Q’15
477K SF vs 2Q’15
Class A Class B
SF00K SF vs
2Q’15
OFFICE SNAPSHOT
Avg. Gross Rental Rate Avg. Gross Rental Rate
Vacancy Vacancy
Net Absorption Net Absorption
Construction Construction
$ 45.29$0.35 vs
2Q’15
%8.40.1% vs
2Q’15
48K SF vs 2Q’15
SF2.3M800K SF vs
2Q’15
SF-19KSF-79K
%15.6
09

4
3
4
1
2
2
3
1
1
3
4
5
1
4
3
5
4
2
1
3
5
1
2
3 4
5
09 CBD SUBMARKET UPDATE
22

UNDER CONSTRUCTION PROPOSED DEVELOPMENT
Hilcorp Energy Tower406,600 SF | 100% Leased
609 Main Street1.1 MSF | 0.0% Leased
700 Avenida De Las Americas115,000 SF | 100% Leased
1600 Louisiana Street1.7 MSF
5 Allen Center1.0 MSF
6 Houston Center633,482 SF
One Market Square750,000 SF
LARGEST EMPLOYERS RECENT LEASES SIGNED
Chevron8,600 Employees
Shell7,000 Employees
JP MorganChase4,892 Employees
CenterPoint Energy3,826 Employees
KBR2,958 Employees
Gardere75,000 SF
MRC Global50,237 SF
VirTis26,198 SF
Plains Marketing24,260 SF
Hughes Watters Askanase24,253 SF
LARGEST SUBLEASE SPACES LARGEST BLOCKS OF SPACE
1415 Louisiana126,262 SF
500 Jefferson97,953 SF
Three Allen Center90,467 SF
BG Group Place81,786 SF
500 Jefferson77,629 SF
800 Bell1,314,350 SF
2 Houston Center234,333 SF
Two Shell Plaza188,695 SF
Two Shell Plaza159,665 SF
Total Plaza145,352 SF
1
2
3
1
2
3
4
5
1
2
3
4
5
1
2
3
4
5
1
2
3
4
5
1
2
3
4
CBD SUBMARKET MAP
09CBD SUBMARKET UPDATE
Capitol Tower750,000 SF | .00% Leased4

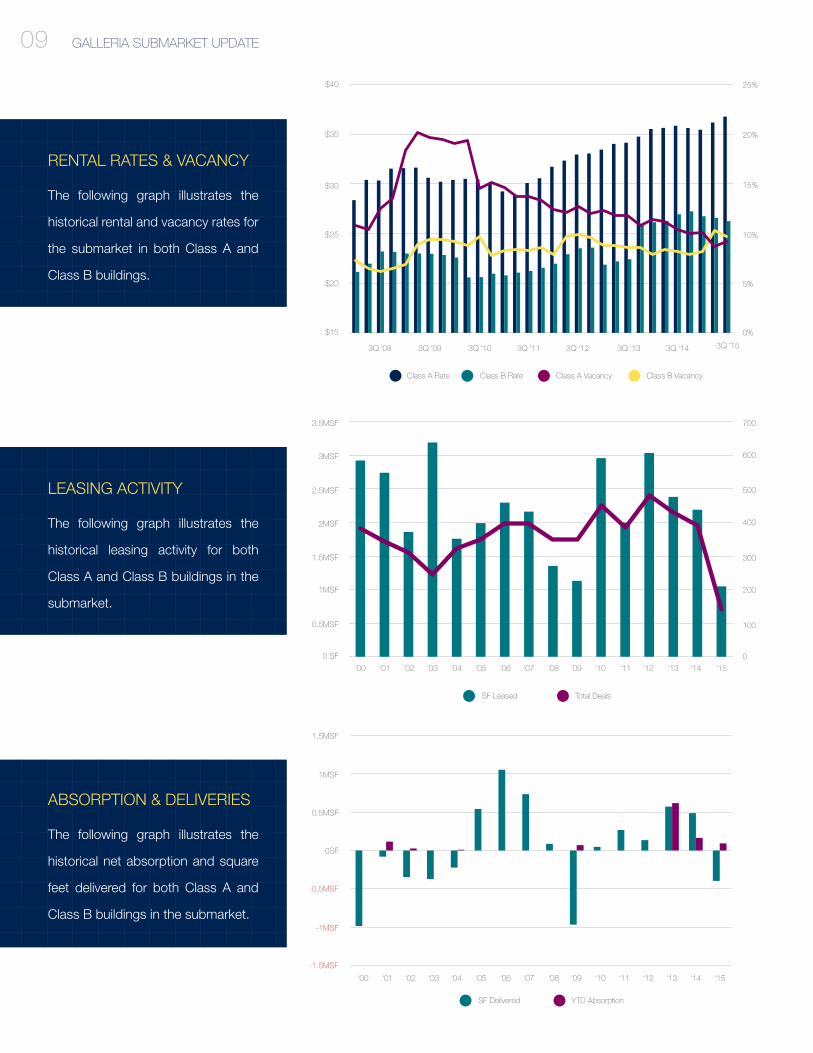
The following graph illustrates the
historical rental and vacancy rates for
the submarket in both Class A and
Class B buildings.
RENTAL RATES & VACANCY
09 CBD SUBMARKET UPDATE
Class A Rate Class B Rate Class A Vacancy
3Q ‘08 3Q ‘09 3Q ‘10 3Q ‘11 3Q ‘12 3Q ‘13 3Q ‘14 3Q ‘15
Class B Vacancy
The following graph illustrates the
historical leasing activity for both
Class A and Class B buildings in the
submarket.
LEASING ACTIVITY
The following graph illustrates the
historical net absorption and square
feet delivered for both Class A and
Class B buildings in the submarket.
ABSORPTION & DELIVERIES
SF Leased Total Deals
1MSF
2MSF
3MSF
4MSF
5MSF
0 SF‘00 ‘01 ‘02 ‘03 ‘04 ‘05 ‘06 ‘07 ‘08 ‘09 ‘10 ‘11 ‘12 ‘13 ‘14 ‘15
‘00 ‘01 ‘02 ‘03 ‘04 ‘05 ‘06 ‘07 ‘08 ‘09 ‘10 ‘11 ‘12 ‘13 ‘14 ‘15
SF Delivered YTD Absorption
-2MSF
-1MSF
4%
6%
8%
10%
12%
14%
16%
18%
$15
$20
$25
$30
$35
$40
$45
$50
6MSF
70
140
210
280
350
0
420
6%
8%
10%
12%
14%
4%
16%
18%
$20
$25
$30
$35
$40
$15
$45
$50
2MSF
0 SF
1MSF
0.5MSF
1.5MSF
2.5MSF
-1.5MSF
-.5MSF

GALLERIASUBMARKET UPDATE
The Galleria area has historically been one of Houston’s
most popular submarkets, providing tenants great access
and amenities. With the metro area’s nation-leading job
growth over the past few years, this submarket has grown
increasingly tight, particularly in Class A buildings.
$ 26.24$0.32 vs
2Q’15
0.5% vs 2Q’15
27K SF vs 2Q’15
Class A Class B
SF0K0K SF vs
2Q’15
OFFICE SNAPSHOT MARKET TRENDS
MARKET DRIVERS
TENANT’S PERSPECTIVE
• In general, the average rental rate (Class A&B) has gradually
continued to increase. This rate is at historically its highest level
in this submarket at $33.60 gross PSF.
• Over the past five years, vacancy rates (Class A&B) have
fluctuated between the 9% - 12% range, and is currently at
10.6%.
• The number of subleases and large blocks being put on the
market has slowed, as has leasing activity - which closed the
quarter with 221,000 SF leased - the smallest amount in the
history of the submarket.
• Unstable price of oil has not had a large impact on office asking
rents, however landlord concessions have greatly increased.
• Face rates will remain high, as landlords don’t correct down as
quickly as they correct up.
• There are a couple of multi-tenant buildings under construction,
which will likely add vacant inventory to the submarket when
they deliver.
• Increases in concessions will continue.
• Tenants will still compete for well-located premier office space,
however, there are now more deals to be made.
• Tenants will need to continue to monitor the price of oil due to
its correlation with demand for space.
Avg. Gross Rental Rate Avg. Gross Rental Rate
Vacancy Vacancy
Net Absorption Net Absorption
Construction Construction
$36.75$0.59 vs
2Q’15
%9.70.6% vs
2Q’15
113K390K SF vs
2Q’15
SF1.1M92K SF vs
2Q’15
%9.2
SF SF-47K
09

1
3
1
1
2
3
5
4
1
2
3
5
2
1
4
3
5
1
2
3
4
5
GALLERIA SUBMARKET UPDATE09
2
2

UNDER CONSTRUCTION PROPOSED DEVELOPMENT
1500 Post Oak Blvd.600,000 SF | 100% Leased
1717 West Loop South380,000 SF | 74.2% Leased
1600 West Loop South120,000 SF | 100% Leased
LARGEST EMPLOYERS RECENT LEASES SIGNED
BHP Billiton2,000 Employees
S&B Infrastructure2,000 Employees
Spectra Energy2,000 Employees
Telecheck2,000 Employees
Bechtel1,700 Employees
Stage Stores168,901 SF
PKF65,416 SF
Capital One Bank58,000 SF
Undisclosed40,703 SF
Alliant39,000 SF
LARGEST SUBLEASE SPACES LARGEST BLOCKS OF SPACE
Galleria Tower II63,829
1800 West Loop South39,626 SF
1775 Saint James Place33,322 SF
5400 Westheimer Court30,481 SF
5555 San Felipe26,407 SF
5251 Westheimer158,084 SF
Five Post Oak Park142,665 SF
2700 Post Oak140,618 SF
1333 West Loop South111,250 SF
1233 West Loop South111,250 SF
1
2
1
2
3
4
5
1
2
3
4
5
1
2
3
4
5
1
2
3
4
5
1
GALLERIA SUBMARKET MAP
09GALLERIA SUBMARKET UPDATE
1885 Saint James Place165,000 SF | 0.0% Leased3
River Oaks District Phase II455,000 SF | 0.0% Leased2
2
The following graph illustrates the
historical rental and vacancy rates for
the submarket in both Class A and
Class B buildings.
RENTAL RATES & VACANCY
Class A Rate Class B Rate Class B Vacancy
3Q ‘08 3Q ‘09 3Q ‘10 3Q ‘11 3Q ‘12 3Q ‘13 3Q ‘14 3Q ‘15
Class A Vacancy
$40
$35
$30
$25
$20
$15
20%
15%
10%
5%
0%
The following graph illustrates the
historical leasing activity for both
Class A and Class B buildings in the
submarket.
LEASING ACTIVITY
The following graph illustrates the
historical net absorption and square
feet delivered for both Class A and
Class B buildings in the submarket.
ABSORPTION & DELIVERIES
SF Leased Total Deals
2MSF
3MSF
300
400
500
600
700
00 SF
‘00 ‘01 ‘02 ‘03 ‘04 ‘05 ‘06 ‘07 ‘08 ‘09 ‘10 ‘11 ‘12 ‘13 ‘14 ‘15
‘00 ‘01 ‘02 ‘03 ‘04 ‘05 ‘06 ‘07 ‘08 ‘09 ‘10 ‘11 ‘12 ‘13 ‘14 ‘15
SF Delivered YTD Absorption
-1MSF
-0.5MSF
0SF
0.5MSF
1MSF
1.5MSF
25%
GALLERIA SUBMARKET UPDATE09
-1.5MSF
0%
5%
10%
15%
20%
25%
$15
$20
$25
$30
$35
$40
1MSF
100
200
0.5MSF
1.5MSF
2.5MSF
3.5MSF

09
$19.93$0.15 vs
2Q’15
0.2% vs 2Q’15
45K SF vs 2Q’15
Class A Class B
SF00 SF vs
2Q’15
OFFICE SNAPSHOT
Avg. Gross Rental Rate Avg. Gross Rental Rate
Vacancy Vacancy
Net Absorption Net Absorption
Construction Construction
$36.70$2.00 vs
2Q’15
%8.80.2% vs
2Q’15
80K SF vs 2Q’15
SF1.5M0K SF vs
2Q’15
SF6KSF101K
%9.2
The Westchase District’s roots trace back to the early 1960s,
evolving from farmland into a 2,460-acre master-planned
community bustling with commercial activity. More than
500,000 people reside within five miles of this submarket,
giving area employers a large, well-educated employee pool.
MARKET TRENDS
MARKET DRIVERS
TENANT’S PERSPECTIVE
• The average rental (Class A&B) rate saw a dip between 3Q’15
and 2Q’15, however, it is still at a near historically high level at
$30.26/SF.
• Overall, the vacancy rate increased by 0.2 percentage points to
9% this quarter.
• Class A sublease space decreased by over 75,000 SF.
• Absorption increased for the second consecutive quarter -
3Q’15 absorption totaled nearly 107 KSF, following a quarter
with 74 KSF.
• Leasing activity continued to slow - the third quarter saw
113,476 SF leased, lower than any quarter in recorded history.
• Price of oil will continue to have an impact on office rents and
vacancy for the remainder of 2015, particularly in submarkets
in west Houston.
• The 1.5 million SF under construction is 100% leased, adding
no vacant space to inventory.
• Due to the low price of oil, tenants are benefitting increases in
concessions.
• The market is currently tenant favorable.
WESTCHASESUBMARKET UPDATE

21
1
2
3
4
5
2
5
1
2
43
5
1
2
3
4
5
09 WESTCHASE SUBMARKET UPDATE
2
4
13
1

UNDER CONSTRUCTION PROPOSED DEVELOPMENT
2101 CityWest1.1 MSF | 0.0% Leased
10353 Richmond445,000 SF | 100% Leased
CityWest 6387,200 SF
CityWest 5306,900 SF
6004 Rogerdale158,607 SF
LARGEST EMPLOYERS RECENT LEASES SIGNED
Jacobs2,344 Employees
Halliburton1,700 Employees
BMC Software1,277 Employees
Phillips 661,100 Employees
CB&I930 Employees
National Oilwell Varco445,000 SF
BMC Software225,000 SF
CB&I100,000 SF
Zachry48,500 SF
USPh40,000 SF
LARGEST SUBLEASE SPACES LARGEST BLOCKS OF SPACE
2103 CityWest Blvd176,193 SF
3010 Briarpark Dr160,356 SF
2107 CityWest Blvd103,018
2050 West Sam Houston Pky89,239 SF
3250 Briarpark Dr41,233 SF
2101 CityWest Blvd314,316 SF
3600 West Sam Houston Pky150,000 SF
2500 CityWest Blvd116,836 SF
2050 West Sam Houston Pky107,088 SF
11490 Westheimer47,363 SF
1
2
1
2
3
4
5
1
2
3
4
5
1
2
3
4
5
1
2
3
4
5
1
2
3
WESTCHASE SUBMARKET MAP
09WESTCHASE SUBMARKET UPDATE

The following graph illustrates the
historical rental and vacancy rates for
the submarket in both Class A and
Class B buildings.
RENTAL RATES & VACANCY
Class A Rate Class B Rate Class A Vacancy
3Q ‘08 3Q ‘09 3Q ‘10 3Q ‘11 3Q ‘12 3Q ‘13 3Q ‘14 3Q ‘15
Class B Vacancy
$40
$35
$30
$25
$20
$15
20%
17%
14%
11%
8%
5%
The following graph illustrates the
historical leasing activity for both
Class A and Class B buildings in the
submarket.
LEASING ACTIVITY
The following graph illustrates the
historical net absorption and square
feet delivered for both Class A and
Class B buildings in the submarket.
ABSORPTION & DELIVERIES
SF Leased Total Deals
1.5MSF
2MSF
2.5MSF
3MSF
3.5MSF
150
200
250
300
350
00 SF
‘00 ‘01 ‘02 ‘03 ‘04 ‘05 ‘06 ‘07 ‘08 ‘09 ‘10 ‘11 ‘12 ‘13 ‘14 ‘15
‘00 ‘01 ‘02 ‘03 ‘04 ‘05 ‘06 ‘07 ‘08 ‘09 ‘10 ‘11 ‘12 ‘13 ‘14 ‘15
SF Delivered YTD Absorption
09 WESTCHASE SUBMARKET UPDATE
1MSF
0.5MSF
100
50
-1MSF
-0.5MSF
0SF
0.5MSF
1MSF
1.5MSF

• The direct average rate (Class A&B) increased slightly between
2Q’15 and 3Q’15 by $0.16 to $31.75 PSF gross.
• Since the previous quarter, the vacancy rate increased by nearly
1.0 percentage points to 10.3%.
• Sublease space continued to increase – up over an additional
408,000 SF in the third quarter alone. Over the past year, each
quarter has seen an increase of at least 250,000 SF.
• Leasing activity remains slow - the third quarter saw 363,268 SF
leased, lower than any quarter since 1Q’2009.
• Vacancy has increased significantly due to several factors,
including over 3.3 million SF delivered in 2015.
• Approximately 2.8 million SF under construction will drive
vacancy up further as space is delivered (half of multi-tenant
new construction is pre-leased); this space was originally
being developed to help meet the rising demand, which has
tapered off this year.
09
The Energy Corridor has long been one of Houston’s most
desirable submarkets and is dominated by large tenants in
the E&P and engineering sectors. This market is driven by
the price of oil and natural gas. Large users like BP, Conoco,
and Shell drive market demand.
MARKET TRENDS
MARKET DRIVERS
TENANT’S PERSPECTIVE
• There are deals to be made in this submarket as space for
lease and sublease continues to climb.
• The majority of space being vacated is obsolete and will need
to be repositioned.
Class A Class B
OFFICE SNAPSHOT
Avg. Gross Rental Rate
Vacancy
Net Absorption
Construction
$ 36.38$0.17 vs
2Q’15
%9.41.4% vs
2Q’15
233K SF vs 2Q’15
SF2.5M200K SF vs
2Q’15
SF262K
KATY FREEWAYSUBMARKET UPDATE
Avg. Gross Rental Rate
Vacancy
Net Absorption
Construction
$ 24.50$0.35 vs
2Q’15
%11.70.1% vs
2Q’15
206K SF vs 2Q’15
SF264K5K SF vs
2Q’15
SF-170K

5
09 KATY FREEWAY SUBMARKET UPDATE
43
1
2
2
1
1
2
45
3
4 5
2
1
4
1
3
12
35
4
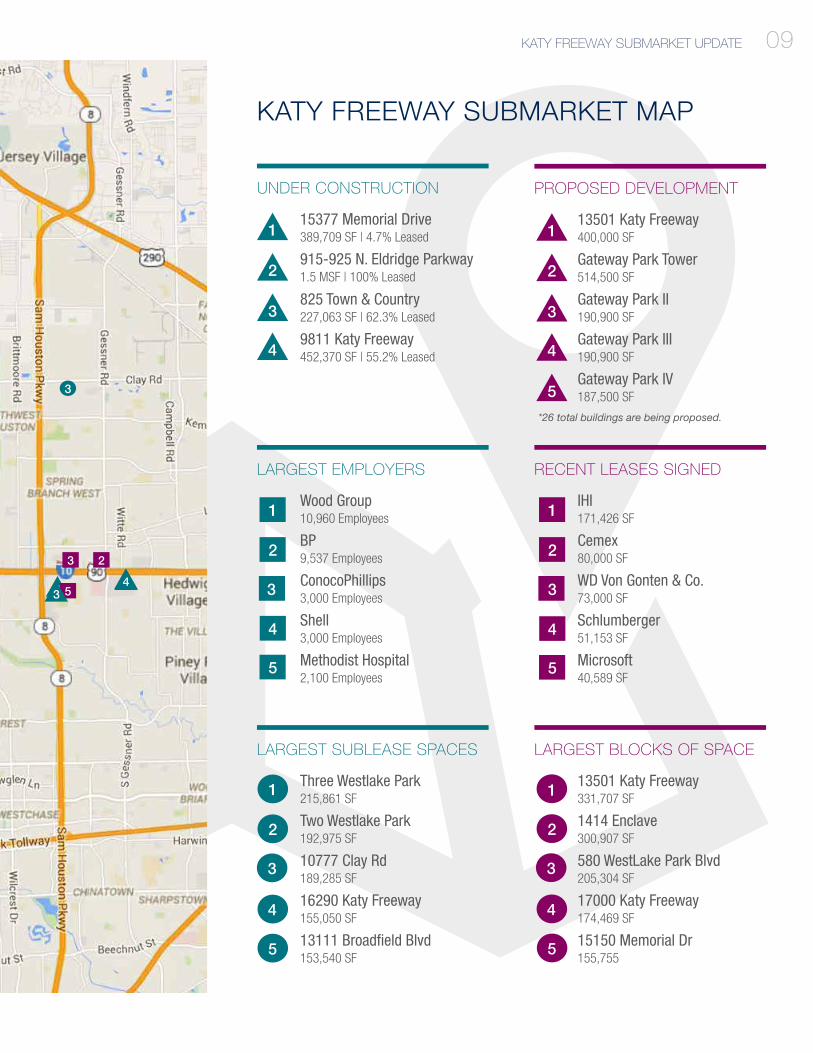
UNDER CONSTRUCTION PROPOSED DEVELOPMENT
15377 Memorial Drive389,709 SF | 4.7% Leased
915-925 N. Eldridge Parkway1.5 MSF | 100% Leased
13501 Katy Freeway400,000 SF
Gateway Park Tower514,500 SF
Gateway Park II190,900 SF
Gateway Park III190,900 SF
Gateway Park IV187,500 SF
LARGEST EMPLOYERS RECENT LEASES SIGNED
Wood Group10,960 Employees
BP9,537 Employees
ConocoPhillips3,000 Employees
Shell3,000 Employees
Methodist Hospital2,100 Employees
IHI171,426 SF
Cemex80,000 SF
WD Von Gonten & Co.73,000 SF
Schlumberger51,153 SF
Microsoft40,589 SF
LARGEST SUBLEASE SPACES LARGEST BLOCKS OF SPACE
Three Westlake Park215,861 SF
Two Westlake Park192,975 SF
10777 Clay Rd189,285 SF
16290 Katy Freeway155,050 SF
13111 Broadfield Blvd153,540 SF
13501 Katy Freeway331,707 SF
1414 Enclave300,907 SF
580 WestLake Park Blvd205,304 SF
17000 Katy Freeway174,469 SF
15150 Memorial Dr155,755
1
2
3
1
2
3
4
5
1
2
3
4
5
1
2
3
4
5
1
2
3
4
5
1
2
3
4
5
KATY FREEWAY SUBMARKET MAP
09KATY FREEWAY SUBMARKET UPDATE
2
825 Town & Country227,063 SF | 62.3% Leased
9811 Katy Freeway452,370 SF | 55.2% Leased4
4 5
*26 total buildings are being proposed.
5
3
3
34

The following graph illustrates the
historical rental and vacancy rates for
the submarket in both Class A and
Class B buildings.
RENTAL RATES & VACANCY
Class A Rate Class B Rate Class A Vacancy
3Q ‘08 3Q ‘09 3Q ‘10 3Q ‘11 3Q ‘12 3Q ‘13 3Q ‘14 3Q ‘15
Class B Vacancy
$30
$25
$20
$15
$10
$0
The following graph illustrates the
historical leasing activity for both
Class A and Class B buildings in the
submarket.
LEASING ACTIVITY
The following graph illustrates the
historical net absorption and square
feet delivered for both Class A and
Class B buildings in the submarket.
ABSORPTION & DELIVERIES
SF Leased Total Deals
1MSF
2MSF
3MSF
4MSF
5MSF
100
200
300
400
500
00 SF
‘00 ‘01 ‘02 ‘03 ‘04 ‘05 ‘06 ‘07 ‘08 ‘09 ‘10 ‘11 ‘12 ‘13 ‘14 ‘15
‘00 ‘01 ‘02 ‘03 ‘04 ‘05 ‘06 ‘07 ‘08 ‘09 ‘10 ‘11 ‘12 ‘13 ‘14 ‘15
SF Delivered YTD Absorption
-1MSF
0 SF
1MSF
2MSF
3MSF
4MSF
09 KATY FREEWAY SUBMARKET UPDATE
$5
$40
$35
12%
10%
8%
6%
4%
0%
2%
16%
14%
6MSF 600

$ 26.34$0.44 vs
2Q’15
0.7% vs 2Q’15
155K SF vs 2Q’15
Class A Class B
SF27K23K SF vs
2Q’15
OFFICE SNAPSHOT
Avg. Gross Rental Rate Avg. Gross Rental Rate
Vacancy Vacancy
Net Absorption Net Absorption
Construction Construction
$ 35.34$1.42 vs
2Q’15
%3.70.5% vs
2Q’15
68K382K SF vs
2Q’15
SF1.6M 0 SF vs
2Q’15
%7.7
SF SF79K
THE WOODLANDSSUBMARKET UPDATE
With several construction cranes dotting the horizon and
expanded/new corporate headquarters including Exxon,
Southwest Energy, and Anadarko, small and medium-sized
tenants in The Woodlands are finding themselves squeezed
for space and shocked by increases in rental rates.
MARKET TRENDS
MARKET DRIVERS
TENANT’S PERSPECTIVE
• In general, the average rental rate (Class A&B) has fluctuated,
but has remained in the $28.00 - $30.00 range in the past two
years; currently at $30.47 PSF gross.
• Vacancy has also fluctuated, between the 5% - 6% range over
the past year and half, and is currently at 5.5%.
• Development has slowed significantly.
• Absorption has kept pace with deliveries, and leasing activity
has slowed.
• Demand has come from corporate relocations and expansions
in the energy, medical and chemical sectors.
• Rates for Class B space have held steady due to companies
looking for value space that is near the new corporate
headquarters.
• Recent headquarter moves and expansions have improved
access and drive times, spurring additional development of
other office, retail, hotel, and residential projects.
• Increases in concessions will continue, especially in Class B
product.
• With higher vacancies, more space options are now available.
09

54
31 2
2
3
1
1
2
4
5
32
1
3
4
5
2
1
3
54
4
3
THE WOODLANDS SUBMARKET UPDATE09

UNDER CONSTRUCTION PROPOSED DEVELOPMENT
1725, 1735, 1780 Hughes Land.969,707 SF | 66% Leased
Havenwood Office Park240,470 SF | 0.0% Leased
Wildwood Corporate Centre II1.5 MSF | 100% Leased
10 Waterway Avenue500,000 SF
Superblock East654,119 SF
Superblock West400,000 SF
CityPlace I & II385,900 SF
Energy Crossing North288,000 SF
LARGEST EMPLOYERS RECENT LEASES SIGNED
Anadarko3,481 Employees
Aon Hewitt1,800 Empoloyees
Memorial Hermann1,400 Employees
St. Luke’s Hospital1,348 Employees
Lone Star College System1,178 Employees
HGA26,189 SF
Howard Hughes25,576 SF
Newfield24,910 SF
Undisclosed16,717 SF
Huckabee12,806 SF
LARGEST SUBLEASE SPACES LARGEST BLOCKS OF SPACE
2445 Technology Forest149,988 SF
10101 Woodloch Forest Dr25,879 SF
1450 Lake Robbins Dr24,331 SF
4055 Technology Forest Blvd23,894 SF
9303 New Trails Dr22,196 SF
8800 Technology Forest153,810 SF
1575 Sawdust Rd153,810 SF
2001 Timberloch Place90,539 SF
2445 Technology Forest36,314 SF
2829 Technology Forest36,314 SF
1
2
3
1
2
3
4
5
1
2
3
4
5
1
2
3
4
5
1
2
3
4
5
1
2
3
4
5
THE WOODLANDS SUBMARKET MAP
Springwoods Village150,000 SF | 33.3% Leased4
*13 total buildings are being proposed.
09THE WOODLANDS SUBMARKET UPDATE

The following graph illustrates the
historical rental and vacancy rates for
the submarket in both Class A and
Class B buildings.
RENTAL RATES & VACANCY
Class A Rate Class B Rate Class A Vacancy
3Q ‘08 3Q ‘09 3Q ‘10 3Q ‘11 3Q ‘12 3Q ‘13 3Q ‘14 3Q ‘15
Class B Vacancy
$40
$35
$30
$15
The following graph illustrates the
historical leasing activity for both
Class A and Class B buildings in the
submarket.
LEASING ACTIVITY
The following graph illustrates the
historical net absorption and square
feet delivered for both Class A and
Class B buildings in the submarket.
ABSORPTION & DELIVERIES
SF Leased Total Deals
0.3MSF
0.6MSF
0.9MSF
1.2MSF
1.5MSF
100
150
200
250
300
500 SF
‘00 ‘01 ‘02 ‘03 ‘04 ‘05 ‘06 ‘07 ‘08 ‘09 ‘10 ‘11 ‘12 ‘13 ‘14 ‘15
‘00 ‘01 ‘02 ‘03 ‘04 ‘05 ‘06 ‘07 ‘08 ‘09 ‘10 ‘11 ‘12 ‘13 ‘14 ‘15
SF Delivered YTD Absorption
0 SF
1MSF
2MSF
3MSF
4MSF
THE WOODLANDS SUBMARKET UPDATE09
$25
$20
12%
9%
6%
0%
3%
15%

HOUSTON ECONOMYFACTS & FIGURES
As anticipated, the third quarter continued to see low oil
prices, job losses and layoffs in the energy sector, M&A
activity, and falling rig counts and drilling permits.
Growth has slowed in foreign markets causing the demand
for Houston’s exports to decrease.
On the bright side, however, the U.S. economy is strong,
and local economists agree that the Houston economy in
resilient and will bounce back.
On the jobs front, although lower than normal, the year
should end with positive employment figures.
The following pages detail the state of the Houston economy
at the end of the third quarter of 2015.
10FORTUNE 500 COMPANIES
Houston ranks third among US metropolitanareas in Fortune 500 headquarters, with 26 companies based in the Houston MSA. More than 88% of these companies are in some way related to the energy industry.
Below is a list of all Fortune 500 companies headquartered in the Houston MSA as of June 2015:
Phillips 66#7
ConocoPhillips #51
Enterprise Products #59
Sysco#61
Plains GP Holdings #67
Halliburton #96
Occidental Petroleum#115
Baker Hughes #119
NOV#127
Anadarko Petroleum #162
EOG Resources #167
Kinder Morgan #193
Waste Management #217
Apache#218
Marathon Oil #227
Cameron Int. #275
Group 1 Automotive#291
CenterPoint Energy #313
Targa Resources #329
Calpine#353
FMC Technologies #357
Quanta Services #361
Buckeye Partners#406
KBR #424
MRC Global #448
Spectra Energy #449

Job growth in the Washington MSA has been
challenged by the contraction of the federal government.
Any improvement in the job growth rate will have to be
fueled by the private sector.
Job growth in the Washington MSA has been
challenged by the contraction of the federal government.
Any improvement in the job growth rate will have to be
fueled by the private sector.
Houston benefited from four years of exceptional
growth and due to this rapid economic expansion, the
city now ranks fourth in the nation in GDP producing
more than $525 billion annually.
If Houston were a country, its economy would be larger
than those of Argentina and Norway, according to the
World Bank, and would rank as the world’s 26th largest
economy. The city of Houston also has a GDP greater
than 42 states.
10 HOUSTON ECONOMY FACTS & FIGURES
New York CIty$1.6 Trillion
Los Angeles$867 Billion
Chicago$611 Billion
Houston$525 Billion
Venezuela$438 Billion
Norway$512 Billion
US GDP RANKING
WORLD GDP RANKING
Job growth in the Washington MSA has been
challenged by the contraction of the federal government.
Any improvement in the job growth rate will have to be
fueled by the private sector.
Houston’s economy grew 1.8% (net of inflation) in 214,
a slowdown from the previous four years. Houston’s
economic growth is projected to double between 2015
and 2040. Houston’s GDP also is projected to top $1.1
trillion by the end of 2027. The adjacent graph shows
the city’s economic makeup.
ECONOMIC GROWTH
Mining
Construction
Manufacturing
Trade
Transportation, Utilities, Warehousing
Information
Finance, Insurance, Real Estate
Services
Government
Agriculture
20.9%
19.3%
18.3%
4.6%
10.5%
1.5%
0.1%
11.9%
5.7%7.2%
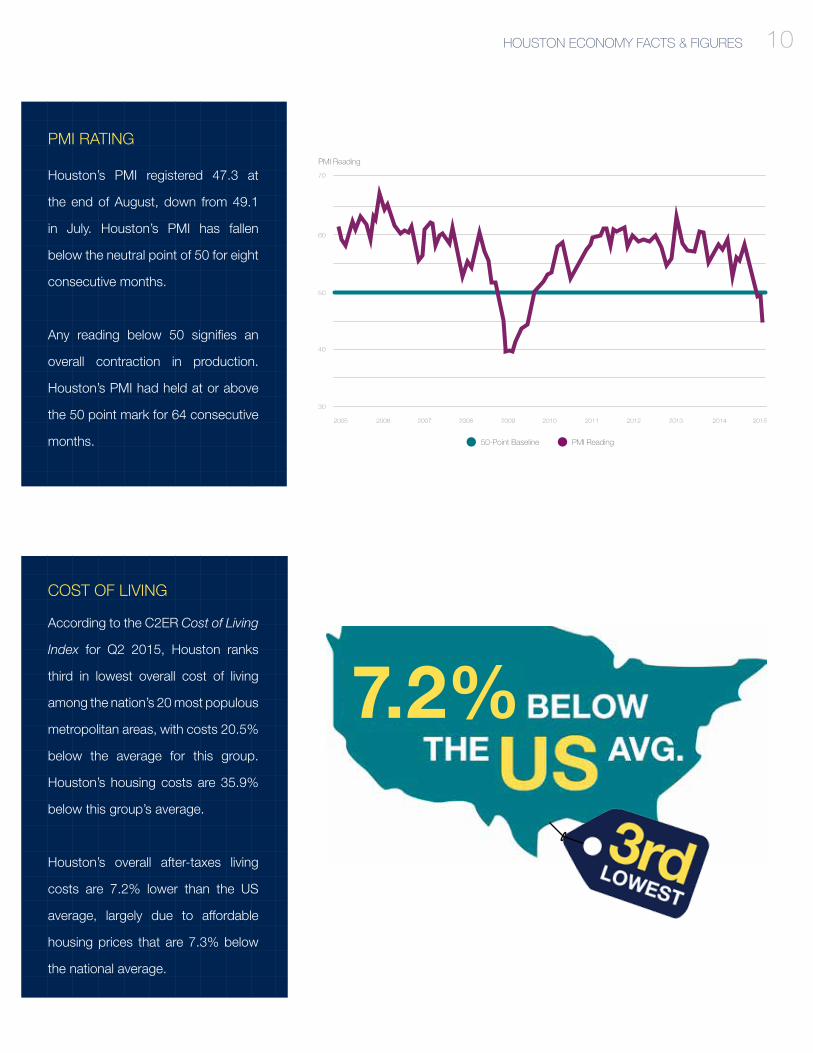
Houston’s PMI registered 47.3 at
the end of August, down from 49.1
in July. Houston’s PMI has fallen
below the neutral point of 50 for eight
consecutive months.
Any reading below 50 signifies an
overall contraction in production.
Houston’s PMI had held at or above
the 50 point mark for 64 consecutive
months.
PMI RATING
According to the C2ER Cost of Living
Index for Q2 2015, Houston ranks
third in lowest overall cost of living
among the nation’s 20 most populous
metropolitan areas, with costs 20.5%
below the average for this group.
Houston’s housing costs are 35.9%
below this group’s average.
Houston’s overall after-taxes living
costs are 7.2% lower than the US
average, largely due to affordable
housing prices that are 7.3% below
the national average.
COST OF LIVING
10HOUSTON ECONOMY FACTS & FIGURES
2005 2007 2008 2009 2010 2011 2012 2013
30
40
50
60
70
2014 20152006
50-Point Baseline PMI Reading
PMI Reading
7.2%

10 HOUSTON ECONOMY FACTS & FIGURES
Houston is the “Energy Capital of the World” with almost half
of its economic activity driven by the energy industry. The
city is home to the largest concentration of human capital
and infrastructure for energy research, development, and
production in the nation.
Forty of the nation’s 134 publicly traded oil and gas
exploration and production firms, based in the US are
located in Houston, including 10 of the top 24.
In December 2014, the MSA held one third of the nation’s
jobs in oil and gas extraction and over 16% of jobs in support
activities for mining.
WTI reached a high of $108 in June 2014 before dropping
significantly in the fall. The price continued to drop into the
third quarter, registering in the low-$40s. The quarter ended
at $45.06.
Supply remains high and U.S. production is still going strong.
EIA forecasts have been revised downward stating that WTI
prices will range from $32/bbl to $67/bbl in January 2016
- volatility in oil prices is expected, as economist agree that
there are too many uncertainties.
OIL PRICES
ENERGY & OIL
WHAT EXACTLY CAUSED THE DROP IN OIL PRICES?
The drop in oil prices is due to many factors
but generally because supply is much higher
than demand.
Since 2010, prices hovered in the $100 per
barrel range with production not being able
to keep up with the increased demand.
These high oil prices led to an increase in
drilling, but then demand began to taper off
across Europe, Asia, and the U.S. Unused oil
was just being stockpiled away, causing the
dramatic decrease in prices, and with OPEC
states not agreeing to cut production, the
price of oil continues to fall.
FALLOUT FROM THE SLUMP
• 150,300 - Number of oil and gas extraction, oil
field services and oil field manufacturing jobs in
Houston
• 176,162 - Number of energy jobs cut worldwide
in the past year
• 13% - U.S. oil and gas employment managers
who say they’ve frozen recruitment
• $200,000 - Average wage, including benefits
and other perks, for an energy worker in
Houston
• 50% - Oil and gas contract workers worldwide
who say their pay has been cut in the past year
*Sources: Swift Worldwide Resources, Rigzone.com, Greater Houston Partnership – August 22, 2015

There is a correlation between the
success of the energy industry and
office rental rates, as well as leased
space, in Houston in the submarkets
that have a strong energy tenancy.
As the price of oil increases or de-
creases, Class A rents usually follow
suit, typically with a six-month lag.
With the decrease in the price of oil,
landlord concessions have increased
significantly.
RENT VS THE PRICE OF OIL
The average U.S. rig count for
September 2015 was 848, down
35 from the 883 counted in August
2015, and down 1,082 from the
1,930 counted in September 2014.
The monthly drop in rigs in 2015
reversed for the first time in July.
September’s rig fall takes the rig
count once again into a downtrend,
set earlier in the year.
OIL RIG COUNT
WTI Spot Price CBD
Oil Price Rental Rates
2013 2014
Rig Count
10HOUSTON ECONOMY FACTS & FIGURES
$160
$140
$120
$100
$80
$0
$40
$60
$20
$50
$45
$40
$35
$30
$10
$20
$25
$14
2015
2,100
1,900
1,700
1,500
1,300
500
900
1,100
700
Jan. Feb. March April May June July Aug. Sep. Oct. Nov. Dec.
Katy Fwy. The Woodlands
‘99 ‘00 ‘01 ‘02 ‘03 ‘04 ‘05 ‘06 ‘07 ‘08 ‘09 ‘10 ‘11 ‘12 ‘13 ‘14 ‘15

10 HOUSTON ECONOMY FACTS & FIGURES
POPULATION
Houston is the fourth largest city (2.2 million residents) and
fifth largest MSA in the nation, with approximately 6.5 million
residents. The MSA led the nation in population growth in
2014, adding 156,371 residents.
Houston is anticipated to lead the nation in population
and employment growth between 2015 and 2040, adding
125,000 new residents in 2015. The population is projected
to swell by nearly four million residents by the end of 2040.
POPULATION GROWTH
NEW ARRIVALS
2015 2040
The city of Houston is one of the fastest growing cities in
the U.S. 35,202 residents moved to Houston in 2014. That
is one new resident every 15 minutes. In the MSA, there is
approximately one new resident every 5 minutes.
X
6.5 Million 9.9 Million

10HOUSTON ECONOMY FACTS & FIGURES
Substantial diversification in Houston’s economy in the last
30 years has reduced its vulnerability to downturns in the
upstream energy sector. This is evident in today’s economy.
Drivers powering the rising economic diversification include:
DIVERSIFYING SECTORS
The Texas Medical Center is the
world’s largest medical complex,
with 56 member institutions and 7.2
million annual patient visits (16,000
international). Quality healthcare also
extends citywide, with nearly as many
jobs as the oil and gas field.
Houston is one of the world’s largest
petrochemical producing centers and
the $15 billion petrochemical complex
at the Houston Ship Channel is the
largest in the US and second largest
worldwide.
The region’s geographic location
makes it an easily-accessed portal to
the global marketplace. The Port of
Houston ranks first in the US in total
tonnage (for 22 years straight) and
waterborne cargo value.
Home to the Johnson Space Center,
and a diverse network of 50 research
and education organizations with ties
to aerospace technology, Houston is
a worldwide leader in the aerospace
industry.
Research and development is critical
to NASA’s Johnson Space Center,
the Texas Medical Center, the world’s
largest concentration of energy and
petrochemical companies, and major
universities across the region.
ECONOMIC DIVERSIFICATION
Up from 13% in the mid-1980s, diversifying sectors now contribute to approximately 50% of Houston’s economy.
Oil
Other
Oil
Other
1986
2015
HEALTHCARE PETROCHEMICALS TRADE
AIR & SPACE TECHNOLOGY

10 HOUSTON ECONOMY FACTS & FIGURES
According to the Greater Houston Partnership, Houston
area employment peaked at over 2.9 million in December
2014 and has trended downward ever since. Houston
employment remains 22,200 jobs below its 2014 peak.
EMPLOYMENT
NON-FARM EMPLOYMENT
• Total non-farm employment in the Houston MSA rose slightly
from the previous month to 2.98 million employed.
• From September 2014 to September 2015, local non-farm
employment rose 1.2%, or an increase of 36,200 jobs.
• Accommodation and Food Services, as well as Health Care
and Social Assistance registered the largest job gains since
December 2014, among Houston’s supersectors, adding
12,500 and 11,400 jobs respectively.
• The largest losses came from Trade, Transportation, and
Utilities (-15,000 jobs), and Manufacturing (-14,200 jobs).
• Houston’s September unemployment rate was 4.6%,
unchanged from August and down from 4.9% a year earlier.
JOB RECOVERY
JOB GROWTH
+Houston will account for 25% of all job growth in Texas between 2012 and 2040.
JOBS JOBS JOBS JOBS
Houston Rest of Texas
WORLDWIDE LAYOFFS (OVER 1,000)
EMPLOYMENT VS RENTAL RATE
3,100
2,900
2,700
2,500
2,300
2,100
$40
$35
$30
$25
$20
$5
Houston Rate Class A RateEmployment
‘12 ‘13 ‘14‘09 ‘10 ‘11‘06 ‘07 ‘08‘05
1,900
1,700
$15
$10
Class B Rate
‘15
Houston led the nation in job recovery, adding three new jobs for each lost in the “Great Recession”.
1,500 $0
Oilfield Services
Halliburton 18,000 Employees
Weatherford 14,000 Employees
Baker Hughes 13,000 Employees
Schlumberger 11,000 Employees
Petroleos Mexicanos 10,000 Employees
Schlumberger 9,000 Employees
Nabors Industries 3,480 Employees
Helmerich & Payne 2,130 Employees
FMC Technologies 2,079 Employees
Key Energy Service 2,000 Employees
Archer Ltd. 1,000 Employees
Civeo 1,000 Employees
Husky Oil Sands 1,000 Employees
Precision Drilling 1,000 Employees
E&P
Shell 7,000 Employees
Total 2,000 Employees
Sasol 1,500 Employees
Suncor Energy 1,000 Employees
Manufacturing
US Steel 3,827 Employees
Vallourec 1,400 Employees

“
HOUSING
After a relatively mild August, the Houston housing market
kept pace with 2014’s record sales volumes and prices.
Single-family home sales saw a moderate increase of 3.5%,
and it took 49 days on average to sell the average home.
Houston’s average sales price for a single-family home is
$270,901, a 0.5% increase over the previous year. The
median price for a single-family home also increased to
$208,000, a year-over-year increase of 4.5%.
Houston’s median house price is third lowest among the ten
largest U.S. metropolitan areas, however, the city ranked
fourth in median sales price gain since 2012.
10HOUSTON ECONOMY FACTS & FIGURES
“September showed a bit more vitality than August, and
considering that we are comparing to a record 2014
sales year and remain in a climate of energy-related
layoffs, I’d say that the Houston real estate market is
truly holding its own... Sales inventory has been stable
for the past three months and we expect it to grow in
the last quarter of 2015.”
- HAR Chair, Nancy Furst

FOREIGN TRADE
In 2014, more than $253.3 billion in foreign trade passed through
the Houston-Galveston Customs District, up 0.6% from the
$251.8 billion handled in 2013. Exports accounted for a majority
of the growth.
According to the Greater Houston Partnership, through August
of this year, more than $138.3 billion in foreign trade passed
through the Houston-Galveston Customs District, down 20.2%
from the $173.3 billion in trade handled in the first eight months
of 2014. The decrease in trade value is expected given the drop
in oil prices. Total trade is up when measuring year-to-date
vessel weight, increasing 2.5% to 169.2 billion kilograms.
$40 $47$58
$72$90
$75$95
$119 $127 $129 $132$65
$89
$92$104$113
$151
$117
$149$147
$123 $122
10 HOUSTON ECONOMY FACTS & FIGURESB
illion
s $300
$250
$200
$150
$100
$50
$0
2004 2005 2006 2007 2008 2009 2010 2011 2012 2013 2014
Exports Imports

11
MARKET OUTLOOK
The outlook for Houston’s economy in the last quarter of
2015 has turned negative. What was a cautiously optimistic
attitude at the beginning of the year has changed midway
through the year, with a recovery not anticipated until at least
the end of 2016.
2015 OUTLOOK
• Worldwide job cuts, reduced capital budgets, reduced
exploration expenditures, and M&A activity continue, adding
to the already large number of subleases and empty blocks of
space.
• Even though rig counts are down, crude oil inventories remain
high and domestic production remains at elevated levels –
showing only small signs of improvement.
• The jobs forecast was revised downward from 62,000
anticipated new jobs in 2015, to 20,000 – 30,000.
• Office development has slowed (if it’s not under construction
already, it likely won’t break ground in 2015). A glut of office
space has been delivered this year. With more product coming
online this year and next, vacancy rates are anticipated to
increase.
• Leasing activity has weakened significantly.
• Due to these market conditions landlord concessions have
increased and rental rates are flattening.
• A return to “normal” is anticipated in 12 - 18 months.

CONTACT US
Cresa © 2015. All rights reserved.
Permission is hereby granted for internal distribution by Cresa business partners. Other
reproduction by any means in whole or part without written permission is prohibited. For
additional information, please contact Elia Quiles, Director of Marketing & Research, at
713.402.5811 or [email protected].
Cresa Houston
5599 San Felipe, Suite 500
Houston, Texas 77056
713.402.5800