Embed Size (px)
Citation preview

Trade Impacts of Trade Agreement on Malawi Exports. What lessons for Malawi? HORACE PHIRI, LUANAR

Outline
• Introduction• Methodology• Findings• Lessons

Introduction
• Sugar is one of Malawi’s major exports accounting for export
earnings in 2014
• Expanding sugar trade is therefore seen as one way of
improving the country’s trade balance (ASWAp , MGDS II)
• Traditionally, EU has been the largest importer of Malawi’s sugar
but trade also happens with SADC, COMESA and other countries

Malawi’s sugar exports – 2001-2014
20012002
20032004
20052006
20072008
20092010
20112012
20132014
0
5000000
10000000
15000000
20000000
25000000
EU COMESA other

Research Motivation
• Malawi access to EU up to 2007 was through
– The sugar protocol -quota - 20824.4 tonnes
– EBA transitional quota – 46461 tonnes
– Special preferential arrangements – 10, 000 tonnes
• Following EU Sugar Policy reforms in 2006
– Sugar protocol denounced in October 2007 setting in place DFQF
access after a transitional period
– Gradual phasing out of price guarantees

Research Motivation
• Absence of quotas would cost ACP/LDC €850 million in lost revenue up to 2020” and would “lead to the death of the sugar sector” in certain ACP countries (CTA, 2013)
• In addition, Malawi joined the SADC FTA in 2008
• Malawi has to adapt if it is to avoid or reduce the negative impacts.
• This study seeks to add to literature on the subject

Research Methodology
• Model specification:– The gravity model of bilateral trade is used
• Where– Wijh, Dummy variables representing trade agreements colony and
common border– Tij, value of exports from country i to country j – Yi, GDP per capita exporting country – Yj, GDP per capita importing country – D distance between importing country and exporting country

Research Methodology
• Data sources– International Trade Centre – World Bank– ‘Centre d’Etudes Prospectives et d’Information
Internationales’ (CEPII).

Estimation
• Hausman-Taylor panel technique was used – to allow for controlling the variations across countries, – incorporating time invariant variables that are correlated with
bilateral specific effects in the estimation.– correction of the endogeneity bias from the trade agreement
dummy (Baier and Bergstrand, 2007)
• Although the FEVD technique also provides solutions HT
chosen FEVD based on weakness raised by Green(2011)
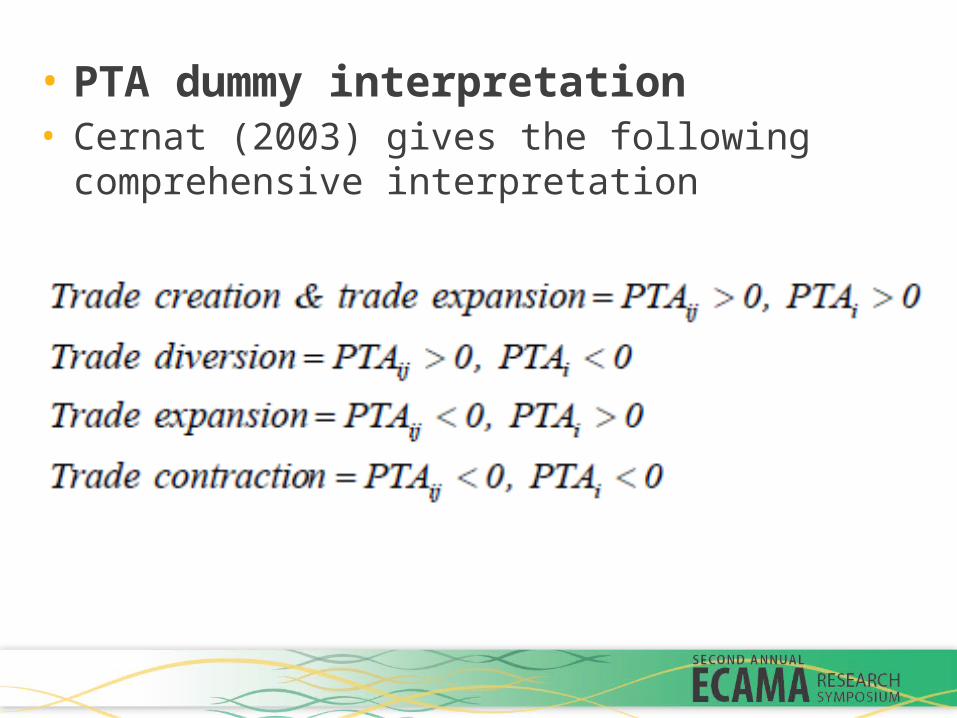
• PTA dummy interpretation• Cernat (2003) gives the following comprehensive
interpretation

EFFECTS OF AGREEMENTS
_cons 42.31361 13.05808 3.24 0.001 16.72025 67.90697
colony 6.579985 2.381825 2.76 0.006 1.911694 11.24828
contig .1494847 1.70027 0.09 0.930 -3.182982 3.481952
comlang_off .1596986 .7340897 0.22 0.828 -1.279091 1.598488
comesa -.4814181 1.426688 -0.34 0.736 -3.277676 2.31484
log_dist -1.121695 1.003273 -1.12 0.264 -3.088074 .8446835
TIexogenous
log_expogdp -6.240867 1.773359 -3.52 0.000 -9.716587 -2.765148
log_impgdp .173097 .580373 0.30 0.766 -.9644132 1.310607
TVendogenous
sadcyes 1.130276 .6823354 1.66 0.098 -.2070769 2.467629
EUEPAyes 1.400353 .434581 3.22 0.001 .5485894 2.252116
logREER .4171778 .6502192 0.64 0.521 -.8572285 1.691584
TVexogenous
log_expo Coef. Std. Err. z P>|z| [95% Conf. Interval]

Annual Effects of EU-ESA EPA
_cons -25.65051 116.9563 -0.22 0.826 -254.8806 203.5796
colony 8.444328 5.871126 1.44 0.150 -3.062868 19.95152
comlang_off -1.466159 4.549704 -0.32 0.747 -10.38342 7.451098
log_dist 17.18442 13.73118 1.25 0.211 -9.728203 44.09704
TIexogenous
log_expogdp -12.26085 5.716554 -2.14 0.032 -23.46509 -1.056607
log_impgdp -4.665851 2.249364 -2.07 0.038 -9.074524 -.2571784
TVendogenous
D2013 1.63749 1.222506 1.34 0.180 -.7585774 4.033557
D2012 -.5563793 1.12815 -0.49 0.622 -2.767513 1.654755
D2011 3.609104 1.212622 2.98 0.003 1.232408 5.985799
D2010 2.583721 1.170389 2.21 0.027 .2898012 4.87764
D2009 2.819967 1.048227 2.69 0.007 .7654796 4.874455
logREER -2.407846 1.426456 -1.69 0.091 -5.203647 .3879557
TVexogenous
log_expo Coef. Std. Err. z P>|z| [95% Conf. Interval]

Trade flow effects: creation and diversion
_cons 95.45507 21.36595 4.47 0.000 53.57859 137.3316
colony 6.602183 2.775183 2.38 0.017 1.162924 12.04144
contig .4639528 1.79269 0.26 0.796 -3.049655 3.977561
comlang_off .1564387 .8487749 0.18 0.854 -1.507129 1.820007
log_dist -.8950458 1.254062 -0.71 0.475 -3.352962 1.562871
TIexogenous
log_expogdp -16.0788 3.486153 -4.61 0.000 -22.91153 -9.246066
log_impgdp .1526306 .602241 0.25 0.800 -1.02774 1.333001
TVendogenous
sadcno 1.916424 .5860514 3.27 0.001 .767784 3.065063
sadcyes 2.797288 .8448382 3.31 0.001 1.141435 4.45314
EUEPAno .3511872 1.351186 0.26 0.795 -2.297089 2.999464
EUEPAyes 1.694745 1.386489 1.22 0.222 -1.022723 4.412213
logREER -.1547077 .6657054 -0.23 0.816 -1.459466 1.150051
TVexogenous
log_expo Coef. Std. Err. z P>|z| [95% Conf. Interval]

Impact of EU-ESA EPA transitional period• In general, the results show that the post sugar protocol reforms
had a positive effect on the volume of sugar exports from Malawi– the increased competition on the EU market for preferential
sugar– continued tariff protection against non-preferred suppliers
• Market determined prices in 2013 had a negative effect on exports but insignificant– High price volatility some exporters got high prices others low
• In terms of trade flows, trade creation and expansion effect is observed but was insignificant– Period coincided with sell of Illovo to ABF which has opted to diversify to 12
EU countries and beyond
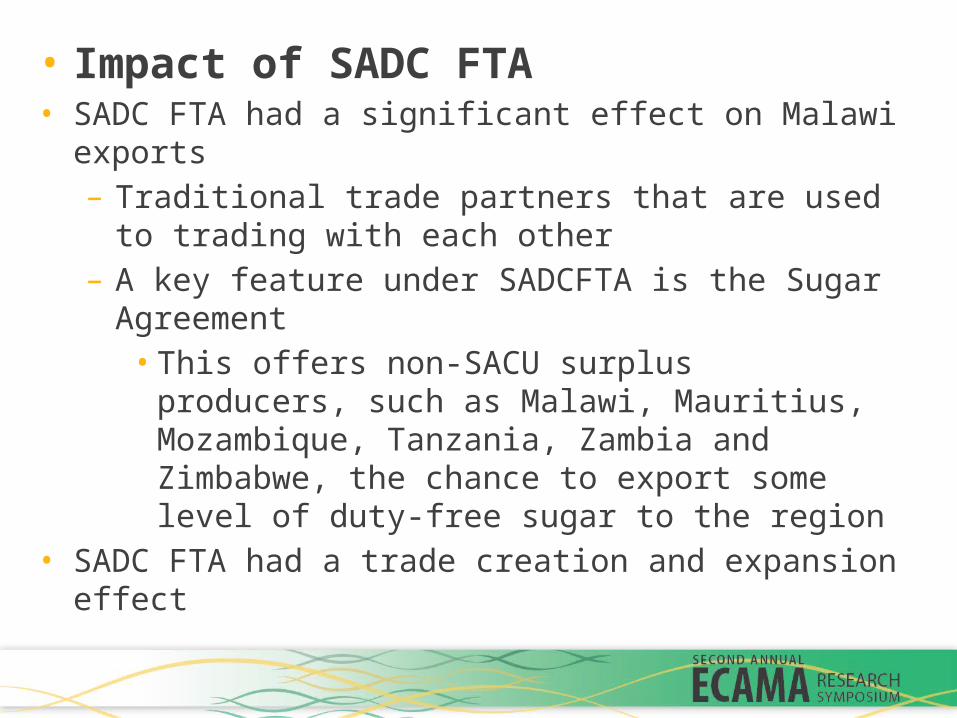
• Impact of SADC FTA• SADC FTA had a significant effect on Malawi exports
– Traditional trade partners that are used to trading with each other
– A key feature under SADCFTA is the Sugar Agreement• This offers non-SACU surplus producers, such as Malawi,
Mauritius, Mozambique, Tanzania, Zambia and Zimbabwe, the chance to export some level of duty-free sugar to the region
• SADC FTA had a trade creation and expansion effect

• Impact of COMESA– COMESA FTA has no effect on sugar exports
• No specific protocol on sugar as sugar impact minimal as trade
• COMESA safeguards e.g. Kenya 350,000• Presence of NTBs limit trade

Key lessons
• DFQF access can also be beneficial– Malawi has benefited from more access as observed by
increasing exports
– Malawi which had a sugar protocol quota of only 20,000 tonnes and in 2011/12 exported five times this volume now delivers sugar to 12 EU member states (CTA, 2014)
– If we focus on improving our competitiveness we can benefit
Key lessons
• Regional exports remain a challenge• Exports to the region have been touted as a potential solution
to envisaged decline in exports to the EU
– Unless regional trade agreements become effective and countries adhere
– Removal of NTBs especially in COMESA would boost intra regional trade

Key lessons
• Commodity specific agreements are important – SADC which has a Sugar Agreement which is part of
SADC trade protocol has shown that it can promote trade

Trade Impacts of Trade Agreement on Malawi Exports. What lessons for Malawi?
HORACE PHIRI, LUANAR