Embed Size (px)
Citation preview

Report
Foreign Trade Statistics in GCC States 2015
Volume 1, July 2016

Prepared by Tigran Terlemezian, contributors: Salah Qasim Bu Ali and Saad Al Ghamdi Page 1 of 11
GCC Foreign Trade
Gulf Cooperation Council (GCC)
The GCC general or total exports in 2015 declined by 305.8 billion of US dollars (USD) or by 35.6
percent almost entirely due to decline in oil exports by 295.0 billion USD or 45.2 percent comprising
96.5 percent and 98.5 percent of decline in general exports and exports domestic goods respectively.
The decline in oil exports was driven by drop in world oil prices:
Table 1: World Prices on Crude Oil and Natural
Subject Descriptor Units 2014 2015 Percent
change
Commodity Fuel (energy) Index includes Crude oil
(petroleum), Natural Gas, and Coal 2005=100 176.9 97.5 -44.9%
Crude Oil APSP: simple average of Brent, WTI, and the
Dubai *)
US$ per barrel 96.2 50.8 -47.2%
2005=100 180.4 95.2 -47.2%
Oil; Dubai, medium, Fateh US$ per barrel 96.7 51.2 -47.0%
Commodity Natural Gas Price Index includes European,
Japanese, and American Natural Gas Price Indices 2005=100 159.9 106.5 -33.4%
*) The APSP denotes an equally weighted average of three crude oil spot prices: West Texas Intermediate
(WTI), Dated Brent (Brent), and Dubai Fateh (Dubai).
Source: World Economic Outlook (WEO) April 2016, IMF:
http://www.imf.org/external/pubs/ft/weo/2016/01/weodata/download.aspx
The decline in non-oil exports and re-exports of goods was relatively modest -by 5.2 percent each.
Imports in the same period declined only by 8.2 billion USD or by 1.7 percent. As a result the positive
trade balance declined from 387.1 billion USD in 2014 to 89.4 billion USD in 2015, with even
sharper decline if we exclude re-exports and take only exports of domestic goods: from 89.4 billion
USD in 2014 to only 6.1 billion USD in 2015.
Table 2: GCC Foreign Trade in 2014 and 2015, Million USD, and Growth Rates *)
Foreign Trade 2014 2015 Growth/Decline
USD Million In percent
Exports 859,532 553,702 -305,830 -35.6%
Exports of domestic goods 771,630 470,378 -301,252 -39.0%
Non-oil 118,727 112,498 -6,230 -5.2%
Oil 652,903 357,880 -295,022 -45.2%
Re-Exports 87,902 83,324 -4,578 -5.2%
Imports 472,439 464,274 -8,165 -1.7%
UAE: excluding Free Zones Trade (Special Trade System) – both imports and exports; (2) re-exports of non-
monetary gold. Imports data are adjusted by the GCC-STAT to include imports of natural gas. The data on
exports oil and gas, and imports of gas are derived from the UAE balance of payments as published by the
Central Bank of the UAE.

Prepared by Tigran Terlemezian, contributors: Salah Qasim Bu Ali and Saad Al Ghamdi Page 2 of 11
By country breakdown
All GCC countries recorded decline in total trade exchange with the highest drop in Kuwait - by 34.0
percent. The oil exports have declined across all GCC countries approximately at the similar negative
growth rates from minus 41.5 - the lowest recorded in Oman, and minus 48.2 percent the sharpest -
recorded in Kuwait. The highest drop in non-oil exports and re-exports of foreign goods was recorded
in Oman – by 27.2 percent and 12.7 percent respectively.
The most modest negative growth in the total trade exchange was recorded in the UAE – minus 13.0
percent due to decline in exports of oil by 42.9 percent largely compensated by positive growth in
exports non-oil domestic goods by 21.9 percent. Bahrain has recorded very sharp increase in re-
exports of foreign goods by 75.6 percent.
Table 3: GCC Foreign Trade in 2014 and 2015 by Countries, Growth Rates
Growth rate in percent GCC UAE BHR SAU OMN QAT KWT
Total trade exchange *) -23.6 -13.0 -17.7 -27.9 -22.4 -30.1 -34.0
Exports -35.6 -21.5 -28.1 -40.9 -34.3 -39.0 -45.3
Exports of domestic goods -39.0 -27.1 -38.1 -42.0 -38.1 -40.2 -46.3
Non-oil -5.2 21.9 -18.5 -17.3 -27.2 -10.1 -6.5
Oil -45.2 -42.9 -46.6 -46.3 -41.5 -43.2 -48.2
Re-Exports -5.2 -9.2 75.6 0.8 -12.7 38.0 7.3
Imports *) -1.7 -3.7 1.9 -2.2 -1.0 7.1 2.8
Relative Shares
The table below presents the relative shares of the GCC countries in the aggregate GCC Foreign Trade. The
UAE, Bahrain and Oman has recorded increase in their relative share to the total GCC trade exchange. The
UAE also recorded a noticeable increase of its relative share in the GCC exports of domestic non-oil goods -
from 32.0 percent in 2014 to 39.0 in 2015, while other five GCC countries recorded decline. Bahrain, Qatar
and Kuwait have increased their relative share in imports of goods, and respectively the other three GCC
countries recorded decline.
Table 4: GCC Foreign Trade in 2014 and 2015, Relative Share of Countries
Relative share of countries in
percent to the GCC total GCC UAE Bahrain KSA Oman Qatar Kuwait
2015
Total trade exchange *) 100 35.0 2.9 36.6 6.2 10.8 8.6
Exports 100 30.3 3.0 36.5 6.2 14.0 10.0
Exports of domestic goods 100 22.9 2.8 41.3 5.9 15.9 11.3
Non-oil 100 39.0 4.6 36.6 6.9 9.1 3.8
Oil 100 17.8 2.2 42.7 5.6 18.0 13.7
Re-Exports 100 72.4 4.3 9.8 8.0 3.1 2.4
Imports *) 100 40.6 2.7 36.6 6.2 7.0 6.9
2014
Total trade exchange 100 30.7 2.7 38.8 6.1 11.8 9.9
Exports 100 38.6 4.2 61.8 9.5 22.9 18.2
Exports of domestic goods 100 31.4 4.5 71.1 9.5 26.5 21.1
Non-oil 100 32.0 5.7 44.2 9.5 10.1 4.0
Oil 100 31.2 4.1 79.5 9.5 31.7 26.4
Re-Exports 100 79.6 2.5 9.7 9.2 2.3 2.2 Imports *) 100 42.1 2.6 37.4 6.3 6.6 6.7
*) General or total exports plus imports

Prepared by Tigran Terlemezian, contributors: Salah Qasim Bu Ali and Saad Al Ghamdi Page 3 of 11
GCC Trade by Product
Exports of Domestic Goods
Due to the drop in the world prices on oil and natural gas in 2015 by 44.9 percent and subsequent substantial
decrease in oil and gas exports by 45.1 percent accompanied by the comparatively modest reduction in non-oil
exports– by 5.2 percent, the relative ratio of oil and gas exports in the total exports of domestic goods dropped
in the GCC from 84.6 percent to 76.1 percent or by 8.5 percentage points, with subsequently increase on the
share non-oil exports by 8.5 percentage points or by 55%. The sharpest structural change, and only two digit
change, in the composition of oil and non-oil exports was recorded in the UAE: 16.4 percentage points drop in
oil / increase in non-oil / exports (or by 67%), followed by Bahrain: 9.6 percentage points (32%), and the KSA
6.3 percentage points (43%). In other there GCC countries the change in percentage points was more modest:
4.6 percentage points in Qatar, and 3.7 and 3.4 percentage points in Oman and Kuwait respectively. However
the change in percent - 2015 share on non-oil exports to 2014 share, was quite significant in Qatar and Kuwait:
50% and 74% in Kuwait (the highest among GCC countries). The most modest change in increase on the non-
oil exports was recorded in Oman from 24% in 2014 to 27.7 percent in 2015 or by 2.7 percentage points of by
16% only (lowest across the GCC countries). However the share if of the non-oil exports is comparably high in
Oman: 27.7 percent in 2015, which is the third highest in the GCC after the UAE – 40.8 percent and the
Bahrain – 39.7 percent. The only GCC country with still a single digit share of the non-oil exports in Kuwait:
7.9 percent. In Qatar the share of the non-oil exports increased from 9.1% in 2014 to 13.6 percent in 2015
bypassing the 10 percent threshold.
Table 5: Exports of Domestic Goods, Relative Share of Oil/Gas and Non-Oil Exports
GCC UAE Bahrain KSA Oman Qatar Kuwait
2015
Oil exports 76.1 59.2 60.3 78.8 72.3 86.4 92.1
Non-oil exports 23.9 40.8 39.7 21.2 27.7 13.6 7.9
Exports of domestics goods 100 100 100 100 100 100 100
2014
Oil exports 84.6 75.6 69.9 85.1 76.0 90.9 95.4
Non-oil exports 15.4 24.4 30.1 14.9 24.0 9.1 4.6
Exports of domestics goods 100 100 100 100 100 100 100
Change in the relative share of the on-oil exports
Percentage points increase 8.5 16.4 9.6 6.3 3.7 4.6 3.4
2015/2014 in percent 155% 167% 132% 143% 116% 150% 174%
Exports of Non-oil Goods
Listed below are the top 5 group of products at HS sections level that dominate the non-oil exports in
the GCC countries comprising an average 83 percent of the total non-oil exports in the GCC, and
occupying first three rows in all GCC countries’ respective rankings, as follows:
Table 6: GCC Exports of Non-Oli Goods, – Common Top 5 HS Sections
HS Sections GCC UAE Bahrain KSA Oman Qatar Kuwait
2015 – Common Top 5
V. Mineral Products
3
3
VI. Chemical Products 1
2 2 1 1 1
VII. Plastics & Rubber 2 3
1
2 2
XIV. Pearls, Precious or Semi-Precious Stones, Metals 3 1

Prepared by Tigran Terlemezian, contributors: Salah Qasim Bu Ali and Saad Al Ghamdi Page 4 of 11
HS Sections GCC UAE Bahrain KSA Oman Qatar Kuwait
XV. Base Metals & Articles Thereof
2 1 3 2 3 3
Total relative share in non-oil exports - in percent 82.9 81.3 82.8 83.3 73.4 98.3 76.4
2014 – Common Top 5
V. Mineral Products
2
1
VI. Chemical Products 1
3 1 2 2 1
VII. Plastics & Rubber 2 3
2
1 2
XIV. Pearls, Precious or Semi-Precious Stones, Metals
1
XV. Base Metals & Articles Thereof 3 2 1 3 3 3 31
Total relative share in non-oil exports - in percent 83.0 74.9 81.9 86.0 80.7 98.5 83.4
Imports of Non-oil Goods
Machinery and Mechanical Appliances and Transportation Equipment (HS Sections XVI and XVII
respectively) top the list of imported goods occupying first two row in respective rankings of imports
in five GCC countries, and the 2nd
and 3rd
rows in the UAE, where the Pearls, Precious Or Semi-
Precious Stones, Metals (Section XIV) top the list. Listed below are the top 6 imported group of
products at HS sections comprising together and average 72 percent of the total non-oil exports in the
GCC and occupying first three rows in all GCC countries’, respective rankings, as follows:
Table 7: GCC Exports of Non-Oli Goods, – Common Top 5 HS Sections
GCC UAE Bahrain KSA Oman Qatar Kuwait
2015
XVI. Machinery & Mechanical Appliances 1 2 2 2 1 1 1
HVII. Transportation Equipment 2 3 1 1 2 2 2
XIV. Pearls, Precious Or Semi-Precious Stones, Metals 3 1
XV. Base Metals & Articles Thereof
3
3
V. Chemical Products
3
VI. Mineral Products
3
3
Total relative share in non-oil exports - in percent 71.8 76.9 68.1 68.0 68.4 73.9 70.8
2014
XVI. Machinery & Mechanical Appliances 1 2 2 1 1 2 1
HVII. Transportation Equipment 2 3 1 2 2 1 2
XIV. Pearls, Precious Or Semi-Precious Stones, Metals 3 1
XV. Base Metals & Articles Thereof
3 3
3
V. Chemical Products
VI. Mineral Products
3
3
Total relative share in non-oil exports - in percent 72.0 76.9 68.1 68.7 68.7 69.7 71.7
1 In Kuwait in 2015 the third place is occupied by HS Section 20 – Miscellaneous products with 187.8 million USD
requiring farther validation. However the exports of the Base Metals & Articles Thereof was very much about the same
level: 187.3 million USD.

Prepared by Tigran Terlemezian, contributors: Salah Qasim Bu Ali and Saad Al Ghamdi Page 5 of 11
Table 9. GCC Trade in 2014-2015
GCC UAE Bahrain KSA Oman Qatar Kuwait
US dollars, Million
General or Total Exports (exports of domestics goods, both oil and non-oil, and re-exports)
2014 860,166 213,937 23,213 342,432 53,221 126,703 100,660
2015 554,141 167,906 16,693 202,237 34,889 77,293 55,123
Domestics Goods - Non-oil Exports
2014 118,724 36,003 6,375 49,767 10,729 11,337 4,513
2015 112,495 43,899 5,197 41,177 7,813 10,188 4,222
Domestics Goods - Oil and Natural Gas
2014 653,540 111,568 14,785 284,558 34,835 113,473 94,323
2015 358,324 63,717 7,892 152,891 20,389 64,491 48,945
Re - Export
2014 87,903 66,367 2,054 8,107 7,657 1,893 1,824
2015 83,322 60,291 3,605 8,169 6,688 2,613 1,956
Imports, including Oil and Natural Gas
2014 475,593 189,633 19,705 173,834 30,944 30,442 31,036
2015 464,082 184,173 16,427 169,968 29,007 32,611 31,895
Total Trade Exchange
2014 1,335,760 403,570 42,918 516,266 84,165 157,145 131,696
2015 1,018,223 352,079 33,120 372,205 63,897 109,904 87,018
Trade Balance
2014 384,573 24,305 3,509 168,599 22,277 96,261 69,624
2015 90,059 -16,266 265 32,269 5,882 44,682 23,227
Growth rates in percent
General or Total Exports (exports of domestics goods, both oil and non-oil, and re-exports)
2015/2014 growth rate -35.6 -21.5 -28.1 -40.9 -34.4 -39.0 -45.2
Domestics Goods - Non-oil Exports
2015/2014 growth rate -5.2 21.9 -18.5 -17.3 -27.2 -10.1 -6.5
Domestics Goods - Oil and Natural Gas
2015/2014 growth rate -45.2 -42.9 -46.6 -46.3 -41.5 -43.2 -48.1
Re - Export
2015/2014 growth rate -5.2 -9.2 75.5 0.8 -12.7 38.0 7.2
Imports, including Oil and Natural Gas
2015/2014 growth rate -2.4 -2.9 -16.6 -2.2 -6.3 7.1 2.8
Total Trade Exchange
2015/2014 growth rate -23.8 -12.8 -22.8 -27.9 -24.1 -30.1 -33.9
By country composition - relative shares in %
General or Total Exports (exports of domestics goods, both oil and non-oil, and re-exports)
2014 100 24.9 2.7 39.8 6.2 14.7 11.7
2015 100 30.3 3.0 36.5 6.3 13.9 9.9
Domestics Goods - Non-oil Exports
2014 100 30.3 5.4 41.9 9.0 9.5 3.8
2015 100 39.0 4.6 36.6 6.9 9.1 3.8
Domestics Goods - Oil and Natural Gas
2014 100 17.1 2.3 43.5 5.3 17.4 14.4
2015 100 17.8 2.2 42.7 5.7 18.0 13.7
Re - Export
2014 100 75.5 2.3 9.2 8.7 2.2 2.1
2015 100 72.4 4.3 9.8 8.0 3.1 2.3
Imports, including Oil and Natural Gas
2014 100 39.9 4.1 36.6 6.5 6.4 6.5
2015 100 39.7 3.5 36.6 6.3 7.0 6.9
Total Trade Exchange
2014 100 30.2 3.2 38.6 6.3 11.8 9.9
2015 100 34.6 3.3 36.6 6.3 10.8 8.5
Trade Balance
2014 100 6.3 0.9 43.8 5.8 25.0 18.1
2015 100 -18.1 0.3 35.8 6.5 49.6 25.8

Prepared by Tigran Terlemezian, contributors: Salah Qasim Bu Ali and Saad Al Ghamdi Page 6 of 11
Table 9. GCC Trade by Product, HS Sections by Country: Exports of Domestics Goods, Excluding Crude Oil and Natural Gas
HS Section GCC UAE Bahrain KSA Oman Qatar Kuwait
No Description 2014 2015 2014 2015 2014 2015 2014 2015 2014 2015 2014 2015 2014 2015
01 Animals & Animal Products 2.4 2.6 1.1 1.3 3.5 1.2 3.0 3.6 5.1 7.0 0.3 0.3 3.7 4.3
02 Vegetable Products 0.6 0.7 0.7 0.6 0.1 0.1 0.5 0.6 1.4 1.9 0.1 0.1 0.9 1.4
03 Animal or Vegetable Fats 0.7 0.6 0.9 0.6 0.0 0.0 0.5 0.6 2.0 2.7 0.0 0.0 0.1 0.1
04 Prepared Foodstuffs 3.7 3.9 5.6 4.7 4.4 4.3 3.2 3.8 2.8 4.0 0.1 0.1 4.6 4.3
05 Mineral Products 5.8 4.4 6.0 4.9 13.0 9.8 0.5 0.7 30.5 19.1 2.9 3.3 0.6 4.1
06 Chemical Products 24.9 22.0 3.3 3.2 12.2 10.9 39.2 35.8 22.9 23.3 32.6 42.6 42.7 45.2
07 Plastics & Rubber 23.9 20.7 8.8 6.9 3.5 5.0 37.8 36.8 8.6 9.2 34.9 32.1 27.9 19.7
08 Hides & Skins 0.1 0.1 0.0 0.0 0.0 0.0 0.2 0.2 0.0 0.0 0.1 0.0 0.1 0.1
09 Wood & Wood Products 0.1 0.1 0.1 0.1 0.3 0.5 0.1 0.1 0.1 0.1 0.0 0.0 0.1 0.1
10 Wood Pulp Products 1.8 1.8 2.9 2.5 1.8 1.2 1.7 1.8 0.4 0.6 0.1 0.1 2.0 2.2
11 Textiles & Textile Articles 1.0 1.1 1.5 1.2 2.7 3.5 0.9 1.1 0.2 0.3 0.0 0.1 1.1 0.7
12 Footwear, Headgear 0.0 0.0 0.0 0.0 0.0 0.0 0.0 0.0 0.0 0.0 0.0 0.0 0.0 0.0
13 Articles of Stone, Plaster, Cement, Asbestos 1.6 1.5 2.4 1.8 1.1 1.3 1.0 1.1 2.6 3.7 0.1 0.1 3.2 2.5
14 Pearls, Precious or Semi-Precious Stones, Metals 11.1 18.9 34.1 46.5 4.3 4.5 1.0 1.1 0.1 0.1 0.0 0.0 3.9 2.9
15 Base Metals & Articles Thereof 17.3 16.9 22.7 19.8 49.0 52.7 7.5 8.8 18.6 21.7 28.1 20.3 8.3 4.4
16 Machinery & Mechanical Appliances 3.1 2.9 6.1 3.6 2.5 3.5 1.6 2.3 3.8 4.8 0.7 0.9 0.1 1.1
17 Transportation Equipment 1.0 0.8 2.7 1.6 0.5 0.5 0.3 0.3 0.4 0.7 0.0 0.0 - 0.8
18 Instruments - Measuring, Musical 0.1 0.0 0.1 0.1 0.2 0.1 0.0 0.0 0.0 0.0 0.0 0.0 - 0.0
19 Arms & Ammunition 0.0 0.0 0.0 0.0 0.0 0.0 - - - - 0.0 - - 0.0
20 Miscellaneous 0.6 0.6 0.7 0.5 1.0 0.9 0.7 0.7 0.6 0.6 0.0 0.0 0.8 1.6
21 Works of Art 0.3 0.4 0.3 0.2 0.1 0.1 0.4 0.5 0.0 0.0 0.0 0.0 - 4.4
Grand Total 100 100 100 100 100 100 100 100 100 100 100 100 100 100

Prepared by Tigran Terlemezian, contributors: Salah Qasim Bu Ali and Saad Al Ghamdi Page 7 of 11
Table 10. GCC Trade by Product – Top 5 HS Sections by Country: Exports of Domestics Goods, Excluding Crude Oil and Natural Gas
GCC UAE Bahrain KSA Oman Qatar Kuwait
HS Section % HS Section % HS Section % HS Section % HS Section % HS Section % HS Section %
2015
Main Product Chemical
Products 22.0
Pearls, Precious
or Semi-Precious
Stones, Metals
46.5 Base Metals &
Articles Thereof 52.7
Plastics &
Rubber 36.8
Chemical
Products 23.3
Chemical
Products 42.6
Chemical
Products 45.2
2nd main product Plastics &
Rubber 20.7
Base Metals &
Articles Thereof 19.8
Chemical
Products 10.9
Chemical
Products 35.8
Base Metals &
Articles Thereof 21.7
Plastics &
Rubber 32.1
Plastics &
Rubber 19.7
3rd main product
Pearls, Precious
or Semi-Precious
Stones, Metals
18.9 Plastics &
Rubber 6.9 Mineral Products 9.8
Base Metals &
Articles Thereof 8.8 Mineral Products 19.1
Base Metals &
Articles Thereof 20.3 Works Of Art 4.4
Sub-total 61.6 73.2 73.3 81.5 64.0 95.0 69.3
4th main product Base Metals &
Articles Thereof 16.9 Mineral Products 4.9
Plastics &
Rubber 5.0
Prepared
Foodstuffs 3.8
Plastics &
Rubber 9.2 Mineral Products 3.3
Base Metals &
Articles Thereof 4.4
5th main product Mineral Products 4.4 Prepared
Foodstuffs 4.7
Pearls, Precious
Or Semi-Precious
Stones, Metals
4.5 Animals &
Animal Products 3.6
Animals &
Animal Products 7.0
Machinery &
Mechanical
Appliances
0.9 Prepared
Foodstuffs 4.3
TOTAL 82.9 82.8 82.8 88.9 80.3 99.2 78.1
2014
Main Product Chemical
Products 24.9
Pearls, Precious
or Semi-Precious
Stones, Metals
34.1 Base Metals &
Articles Thereof 49.0
Chemical
Products 39.2 Mineral Products 30.5
Plastics &
Rubber 34.9
Chemical
Products 42.7
2nd main product Plastics &
Rubber 23.9
Base Metals &
Articles Thereof 22.7 Mineral Products 13.0
Plastics &
Rubber 37.8
Chemical
Products 22.9
Chemical
Products 32.6
Plastics &
Rubber 27.9
3rd main product Base Metals &
Articles Thereof 17.3
Plastics &
Rubber 8.8
Chemical
Products 12.2
Base Metals &
Articles Thereof 7.5
Base Metals &
Articles Thereof 18.6
Base Metals &
Articles Thereof 28.1
Base Metals &
Articles Thereof 8.3
Sub-total 66.1 65.5 74.1 84.5 71.9 95.6 78.9
4th main product
Pearls, Precious
or Semi-Precious
Stones, Metals
11.1
Machinery &
Mechanical
Appliances
6.1 Prepared
Foodstuffs 4.4
Prepared
Foodstuffs 3.2
Plastics &
Rubber 8.6 Mineral Products 2.9
Prepared
Foodstuffs 4.6
5th main product Mineral Products 5.8 Mineral Products 6.0
Pearls, Precious
or Semi-Precious
Stones, Metals
4.3 Animals &
Animal Products 3.0
Animals &
Animal Products 5.1
Machinery &
Mechanical
Appliances
0.7
Pearls, Precious
or Semi-Precious
Stones, Metals
3.9
TOTAL 83.0 77.6 82.8 90.6 85.7 99.2 87.3
Prepared by Tigran Terlemezian, contributors: Salah Qasim Bu Ali and Saad Al Ghamdi Page 8 of 11
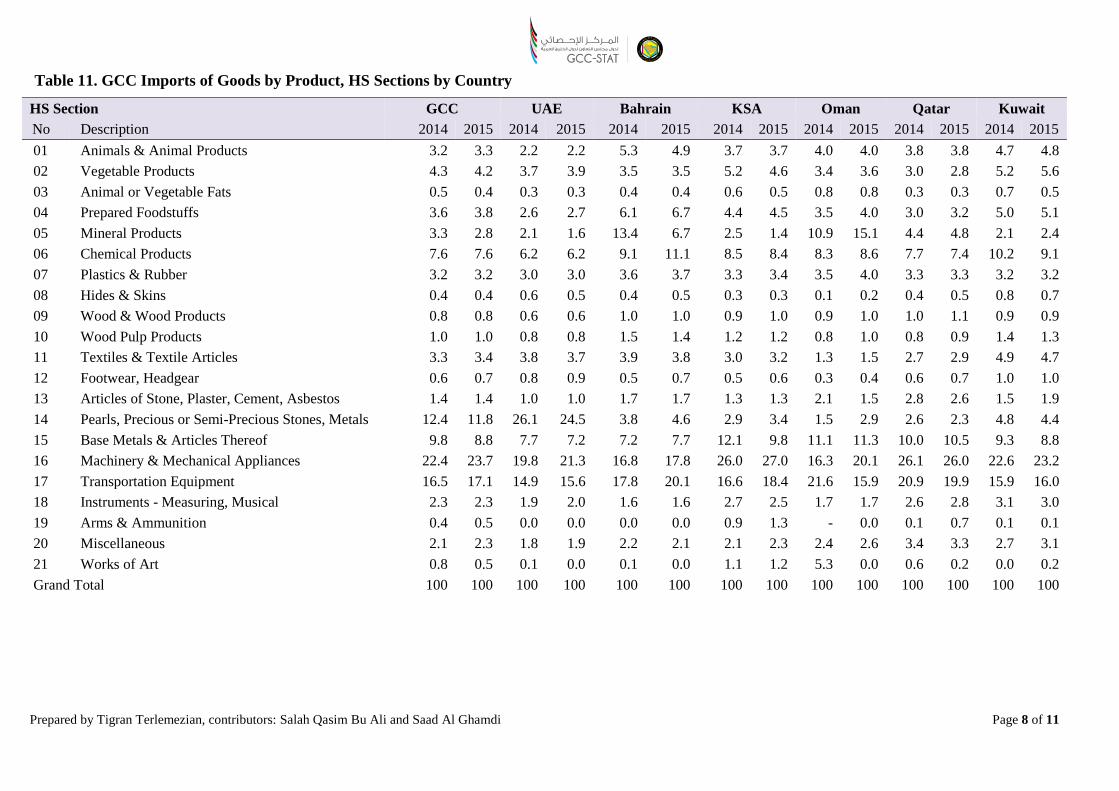
Table 11. GCC Imports of Goods by Product, HS Sections by Country
HS Section GCC UAE Bahrain KSA Oman Qatar Kuwait
No Description 2014 2015 2014 2015 2014 2015 2014 2015 2014 2015 2014 2015 2014 2015
01 Animals & Animal Products 3.2 3.3 2.2 2.2 5.3 4.9 3.7 3.7 4.0 4.0 3.8 3.8 4.7 4.8
02 Vegetable Products 4.3 4.2 3.7 3.9 3.5 3.5 5.2 4.6 3.4 3.6 3.0 2.8 5.2 5.6
03 Animal or Vegetable Fats 0.5 0.4 0.3 0.3 0.4 0.4 0.6 0.5 0.8 0.8 0.3 0.3 0.7 0.5
04 Prepared Foodstuffs 3.6 3.8 2.6 2.7 6.1 6.7 4.4 4.5 3.5 4.0 3.0 3.2 5.0 5.1
05 Mineral Products 3.3 2.8 2.1 1.6 13.4 6.7 2.5 1.4 10.9 15.1 4.4 4.8 2.1 2.4
06 Chemical Products 7.6 7.6 6.2 6.2 9.1 11.1 8.5 8.4 8.3 8.6 7.7 7.4 10.2 9.1
07 Plastics & Rubber 3.2 3.2 3.0 3.0 3.6 3.7 3.3 3.4 3.5 4.0 3.3 3.3 3.2 3.2
08 Hides & Skins 0.4 0.4 0.6 0.5 0.4 0.5 0.3 0.3 0.1 0.2 0.4 0.5 0.8 0.7
09 Wood & Wood Products 0.8 0.8 0.6 0.6 1.0 1.0 0.9 1.0 0.9 1.0 1.0 1.1 0.9 0.9
10 Wood Pulp Products 1.0 1.0 0.8 0.8 1.5 1.4 1.2 1.2 0.8 1.0 0.8 0.9 1.4 1.3
11 Textiles & Textile Articles 3.3 3.4 3.8 3.7 3.9 3.8 3.0 3.2 1.3 1.5 2.7 2.9 4.9 4.7
12 Footwear, Headgear 0.6 0.7 0.8 0.9 0.5 0.7 0.5 0.6 0.3 0.4 0.6 0.7 1.0 1.0
13 Articles of Stone, Plaster, Cement, Asbestos 1.4 1.4 1.0 1.0 1.7 1.7 1.3 1.3 2.1 1.5 2.8 2.6 1.5 1.9
14 Pearls, Precious or Semi-Precious Stones, Metals 12.4 11.8 26.1 24.5 3.8 4.6 2.9 3.4 1.5 2.9 2.6 2.3 4.8 4.4
15 Base Metals & Articles Thereof 9.8 8.8 7.7 7.2 7.2 7.7 12.1 9.8 11.1 11.3 10.0 10.5 9.3 8.8
16 Machinery & Mechanical Appliances 22.4 23.7 19.8 21.3 16.8 17.8 26.0 27.0 16.3 20.1 26.1 26.0 22.6 23.2
17 Transportation Equipment 16.5 17.1 14.9 15.6 17.8 20.1 16.6 18.4 21.6 15.9 20.9 19.9 15.9 16.0
18 Instruments - Measuring, Musical 2.3 2.3 1.9 2.0 1.6 1.6 2.7 2.5 1.7 1.7 2.6 2.8 3.1 3.0
19 Arms & Ammunition 0.4 0.5 0.0 0.0 0.0 0.0 0.9 1.3 - 0.0 0.1 0.7 0.1 0.1
20 Miscellaneous 2.1 2.3 1.8 1.9 2.2 2.1 2.1 2.3 2.4 2.6 3.4 3.3 2.7 3.1
21 Works of Art 0.8 0.5 0.1 0.0 0.1 0.0 1.1 1.2 5.3 0.0 0.6 0.2 0.0 0.2
Grand Total 100 100 100 100 100 100 100 100 100 100 100 100 100 100

Prepared by Tigran Terlemezian, contributors: Salah Qasim Bu Ali and Saad Al Ghamdi Page 9 of 11
Table 12. GCC Imports by Product – Top 5 HS Sections by Country
GCC UAE Bahrain KSA Oman Qatar Kuwait
HS Section % HS Section % HS Section % HS Section % HS Section % HS Section % HS Section %
2015
Main Product
Machinery &
Mechanical
Appliances
23.7 Pearls, Precious
or Semi-Precious
Stones, Metals
24.5 Transportation
Equipment
20.1 Machinery &
Mechanical
Appliances
27.0 Machinery &
Mechanical
Appliances
20.1 Machinery &
Mechanical
Appliances
26.0 Machinery &
Mechanical
Appliances
23.2
2nd main product
Transportation
Equipment
17.1 Machinery &
Mechanical
Appliances
21.3 Machinery &
Mechanical
Appliances
17.8 Transportation
Equipment
18.4 Transportation
Equipment
15.9 Transportation
Equipment
19.9 Transportation
Equipment
16.0
3rd main product
Pearls, Precious
or Semi-Precious
Stones, Metals
11.8 Transportation
Equipment
15.6 Chemical
Products
11.1 Base Metals &
Articles Thereof
9.8 Mineral Products 15.1 Base Metals &
Articles Thereof
10.5 Chemical
Products
9.1
Sub-total 52.7 61.5 49.1 55.2 51.1 56.4 48.3
4th main product Base Metals &
Articles Thereof
8.8 Base Metals &
Articles Thereof
7.2 Base Metals &
Articles Thereof
7.7 Chemical
Products
8.4 Base Metals &
Articles Thereof
11.3 Chemical
Products
7.4 Base Metals &
Articles Thereof
8.8
5th main product Chemical
Products
7.6 Chemical
Products
6.2 Mineral Products 6.7 Vegetable
Products
4.6 Chemical
Products
8.6 Mineral Products 4.8 Vegetable
Products
5.6
TOTAL 69.0 74.9 63.5 68.2 70.9 68.5 62.7
2014
Main Product
Machinery &
Mechanical
Appliances
22.4 Pearls, Precious
or Semi-Precious
Stones, Metals
26.1 Transportation
Equipment
17.8 Machinery &
Mechanical
Appliances
26.0 Transportation
Equipment
21.6 Machinery &
Mechanical
Appliances
26.1 Machinery &
Mechanical
Appliances
22.6
2nd main product
Transportation
Equipment
16.5 Machinery &
Mechanical
Appliances
19.8 Machinery &
Mechanical
Appliances
16.8 Transportation
Equipment
16.6 Machinery &
Mechanical
Appliances
16.3 Transportation
Equipment
20.9 Transportation
Equipment
15.9
3rd main product
Pearls, Precious
or Semi-Precious
Stones, Metals
12.4 Transportation
Equipment
14.9 Mineral Products 13.4 Base Metals &
Articles Thereof
12.1 Base Metals &
Articles Thereof
11.1 Base Metals &
Articles Thereof
10.0 Chemical
Products
10.2
Sub-total 51.3 60.9 47.9 54.7 49.0 57.0 48.7
4th main product Base Metals &
Articles Thereof
9.8 Base Metals &
Articles Thereof
7.7 Chemical
Products
9.1 Chemical
Products
8.5 Base Metals &
Articles Thereof
11.1 Chemical
Products
7.7 Base Metals &
Articles Thereof
9.3
5th main product Chemical
Products
7.6 Chemical
Products
6.2 Base Metals &
Articles Thereof
7.2 Vegetable
Products
5.2 Chemical
Products
8.3 Mineral Products 4.4 Vegetable
Products
5.2
TOTAL 68.7 74.8 64.2 68.5 68.5 69.0 63.2

Prepared by Tigran Terlemezian, contributors: Salah Qasim Bu Ali and Saad Al Ghamdi Page 10 of 11
The United Arab Emirates
To add some analysis (optional)
Foreign Trade, US Dollars, Million Percent change
2014 2015 2015/2014
Exports 213,929 167,906 -21.5
Exports of domestic goods 147,561 107,615 -27.1
Non-oil 36,003 43,899 21.9
Oil 111,559 63,717 -42.9
Re-Exports 66,367 60,291 -9.2
Imports *) 195,569 188,284 -3.7
The Kingdom of Bahrain
To add some analysis (optional)
Percent change
Foreign Trade, US Dollars, Million 2014 2015 2015/2014
Exports 23,212 16,693 -28.1
Exports of domestic goods 21,159 13,088 -38.1
Non-oil 6,375 5,197 -18.5
Oil 14,785 7,891 -46.6
Re-Exports 2,053 3,604 75.6
Imports *) 12,265 12,494 1.9
Kingdom of Saudi Arabia
To add some analysis (optional)
Foreign Trade, US Dollars, Million Percent change
2014 2015 2015/2014
Exports 342,432 202,237 -40.9
Exports of domestic goods 334,325 194,068 -42.0
Non-oil 49,767 41,177 -17.3
Oil 284,558 152,891 -46.3
Re-Exports 8,107 8,169 0.8
Imports *) 173,834 169,968 -2.2

Prepared by Tigran Terlemezian, contributors: Salah Qasim Bu Ali and Saad Al Ghamdi Page 11 of 11
The Sultanate of Oman
To add some analysis (optional)
Foreign Trade, US Dollars, Million Percent change
2014 2015 2015/2014
Exports 52,416 34,411 -34.3
Exports of domestic goods 44,759 27,723 -38.1
Non-oil 10,729 7,812 -27.2
Oil 34,029 19,911 -41.5
Re-Exports 7,657 6,688 -12.7
Imports *) 29,305 29,007 -1.0
Qatar
To add some analysis (optional)
Foreign Trade, US Dollars, Million Percent change
2014 2015 2015/2014
Exports 126,703 77,293 -39.0
Exports of domestic goods 124,809 74,679 -40.2
Non-oil 11,337 10,188 -10.1
Oil 113,473 64,491 -43.2
Re-Exports 1,893 2,613 38.0
Imports *) 30,442 32,611 7.1
Kuwait
To add some analysis (optional)
Foreign Trade, US Dollars, Million Percent change
2014 2015 2015/2014
Exports 100,840 55,162 -45.3
Exports of domestic goods 99,016 53,204 -46.3
Non-oil 4,517 4,225 -6.5
Oil 94,499 48,979 -48.2
Re-Exports 1,824 1,958 7.3
Imports *) 31,025 31,909 2.8
Oil and gas and their impact on the economies of the GCC countries
(an optional chapter can be added latter on)