Embed Size (px)
Citation preview

18
Chapter-2
Trends in India's Foreign Trade
India’s Trade Performance
Exports
India’s merchandise exports reached a level of
US$ 178.7 billion during 2009-10 registering a
negative growth of 3.5 percent as compared to a
growth of 13.6 percent during the previous year.
Notwithstanding the deceleration of the growth
in 2009-2010, India’s export sector has exhibited
remarkable resilience and dynamism in recent
years. Our merchandise exports recorded a
compound annual growth rate (CAGR) of 22.0 per
cent during the five year period from 2004-05 to
2008-09 as compared to the preceding five years
when exports increased by a lower CAGR of 14.0
per cent. According to latest WTO data (2009),
India’s share in the world merchandise exports
increased from 0.8 per cent in 2004 to 1.3 per cent
in 2008. India also improved its ranking among the
leading exporters in world merchandise trade from
30th in 2004 to 21st in 2009.
India’s exports have not been affected to the same extent as that of other economies of the world during the phase of global slowdown. After declining consistently for the first seven months of the year 2009-10, India’s exports reversed the trend in October, 2009 by registering a positive growth of 3.4%. The upward trend has been maintained since then wherein exports grew at the rate of 30.0 % in November 2009; 20.3% in December, 2009, 18.7% in January, 2010, 34.8% in February, 2010; 54.1 % in March 2010, 38.5 % in April 2010, 30.1 % in May 2010, 43.8% in June 2010, 11.7 % in July 2010, 22.5%
in August 2010, 23.2 % in September 2010, 21.3% in October, 2010, 26.5% in November 2010 and 36.4% in December 2010. (Table 2.1) The extent of sustained recovery of exports would ultimately depend on the
strength of the recovery of global demand.
Table: 2.1Month-wise exports from November, 2009 to
December, 2010Month Percentage growthNovember, 2009 30.0December, 2009 20.3January, 2010 18.7February, 2010 34.8March, 2010 54.1 April,2010 42.1 May, 2010 34.1 June, 2010 46.5July, 2010 13.8August, 2010 23.3 September, 2010 23.8October, 2010 21.3 November, 2010 26.5December, 2010 36.4
Source : DGCI&S
The Government had set an export target of US$
175 billion for 2009-10. With merchandise exports
reaching US$ 178.7 billion in 2009-10, the actual
exports exceeded the target by 2.1 per cent which
is a remarkable achievement during a period of
recession in India’s major export destinations.
During 2010-11 (Apr-Dec) exports reached a level
of US$ 164.7 billion registering a growth of 29.5
per cent with almost all the major commodity
groups making positive growth. Only seven (7)

19
CHAPTER-2 Trends in India’s Foreign Trade
commodities showed negative growth viz. Tea
(1.95), Cashew (7.73), Fruits & Vegetables (28.03),
Iron Ore (93.14), Computer Software (92.73),
Petroleum Products (13.50) and Handicrafts (excl.
Handmade carpets) (56.90).
Imports
Imports during 2009-10 were US$ 288.4 billion as against US$ 303.7 billion during 2008-09 registering a negative growth of 5.1 per cent in Dollar terms. Oil imports were valued at US$ 87.1 billion which was 6.5 per cent lower than those valued at US$ 93.2 billion in the previous year. Non-oil imports were US$ 201.2 billion which was 3.4 per cent higher than non-oil imports of US$194.6 billion in the previous year.
Trade Balance
During 2009-10 trade deficit declined marginally as there was a mild recovery in exports and a marginal decline in imports.
The trade deficit in 2009-10 was US$ 109.6 billion which was lower than the deficit of US$ 118.4 billion during 2008-09.
Performance of Exports, Imports and Balance of Trade in Rupees during 2004-05 to 2010-11 (April-Dec) is given in the Table 2.2.
Table: 2.2Performance of Exports, Imports and Balance of Trade
Value in Rs. Crores
S.No Year Exports %Growth Imports %Growth Trade Balance 1. 2004-2005 375,340 27.94 501,065 39.53 -125,725 2. 2005-2006 456,418 21.60 660,409 31.80 -203,9913. 2006-2007 571,779 25.28 840,506 27.27 -268,727 4. 2007-2008 655,864 14.71 1,012,312 20.44 -356,4485. 2008-2009 840,755 28.19 1,374,436 35.77 -533,6806. 2009-2010 845,534 0.57 1,363,736 -0.78 -518,202 7. 2009-10 (Apr-Dec) 608,882 991,605 -382,7238. 2010-11 (Apr-Dec) 751,633 23.44 1,126,513 13.61 -374,880

20
Annual Report 2010-11
Table: 2.3Performance of Exports, Imports and Balance of Trade
Values in US$ Millions
S.No Year Exports %Growth Imports %Growth Trade Balance 1. 2004-2005 83,536 30.85 111,517 42.70 -27,9812. 2005-2006 103,091 23.41 149,166 33.76 -46,0753. 2006-2007 126,414 22.62 185,735 24.52 -59,3214. 2007-2008 163,132 29.05 251,654 35.49 -88,5225. 2008-2009 185,295 13.59 303,696 20.68 -118,4016. 2009-2010 178,751 -3.53 288,373 -5.05 -109,6217. 2009-10 (Apr-Dec) 127,182 207,315 -80,1338. 2010-11 (Apr-Dec) 164,707 29.5 246,724 19.01 -82,017
Data Source: DGCI&S
India’s exports has not been affected to the same extent as other economies of the world during the phase of global slowdown, yet exports which had suffered a decline since October, 2008 continued of first seven consecutive
months in 2009-10 as well. However, the declining trend became less steep from 2005 onwards and turned the positive phase from the month of November, 2009 reversing the earlier trend.
Foreign Trade Policy, 2009-14
The Foreign Trade Policy (FTP) 2009-14 was
announced on 27th August, 2009 in the backdrop of
a fall in India’s exports due to global slowdown. The
short term objective of FTP (2009-14) was to arrest
and reverse the declining trend of exports as well
as to provide additional support especially to those
sectors which were hit badly by recession in the
developed world. The Policy envisaged an annual
export growth of 15 per cent with an annual export
target of US$ 200 billion by March 2011 and to come
back on the high export growth path of around 25
per cent per annum in the remaining three years
of this Foreign Trade Policy i.e. up to 2014. The
long term policy objective for the Government is
to double India’s share in global trade by 2020.
Subsequently, an Annual Supplement 2010-11 to

21
CHAPTER-2 Trends in India’s Foreign Trade
the FTP (2009-14) was announced on 23rd August,
2010. In this Supplement further measures to
enhance exports have been elaborated. Further
measures were announced on 11th February 2011.
(Details are available in Chapter 3).
Exports by Principal Commodities
Disaggregated data on exports by Principal
Commodities, in dollar terms, for the period
2010-11 (April–September) as compared with the
corresponding period of the previous year are given
in Appendix 2.1 & 2.2. Exports during the period
Apr-Dec. 2010-11 registered a growth of 29.5% in
US$ terms.
The share of top five principal commodity groups in India’s total exports during 2010-11 (April-
September) is given at Chart 2.3.
The export performance (in terms of growth)
of top five commodities during 2010-11 (April-
September) vis-a-vis the corresponding period of
the previous year is shown at Chart 2.4.
22
Annual Report 2010-11
Plantation Crops
Export of plantation crops during 2010-11 (April–Sep), increased by 28.1 per cent in US$ terms compared with the corresponding period of the previous year. Export of Coffee registered a growth of 43.2 per cent, the value increasing from US$ 193.4 million to US$ 277 million. Export of Tea also increased by 17.0 per cent.
Agriculture and Allied Products
Agriculture and Allied Products as a group include cereals, pulses, tobacco, spices, nuts and seeds, oil meals, guargum meals, castor oil, shellac, sugar & molasses, processed food, meat & meat products, etc. During 2010-11 (April–September), exports of commodities under this group registered a growth of 15.6 per cent with the value of exports going up from US$5,846 million in the previous year to US$ 6,756 million during the current year.
Ores and Minerals
Exports of ores and minerals were estimated at US$ 4,410 million during 2010-11 (April-September) registering a growth of 34.5 per cent over the same period of the previous year. Sub groups viz. Processed Minerals recorded a growth of 50.6 per cent and Coal has a negative growth of 43 per cent respectively. Export of Mica has registered growth of 78 per cent.
Leather and Leather Manufactures
Export of leather and leather manufactures recorded a growth of 14 per cent during 2010-11 (April-September). The value of exports increased to US$ 1,833.4 million from US$ 1,611.2 million during the same period of the previous year. Exports of leather and manufactures have registered a growth of 15.6 per cent and Leather Footwear also registered a growth of 11.7 per cent.
Gems and Jewellery
The export of gems and jewellery during 2010-11 (April-September) increased to US$ 15,664 million from US$ 13,757 million during the corresponding
period of last year showing a growth of 13.9 per cent.
Chemicals and Related Products
During the period 2010-11 (April-September), the value of exports of chemicals and allied products increased to US$ 13,994 million from US$ 10,962.2 million during the same period of the previous year registering a growth of 27.7 per cent. Rubber, glass and other products residual chemicals and allied products and basic chemicals, pharmaceuticals and cosmetics and plastic & linoleum have also registered a positive growth.
Engineering Goods
Items under this group consist of machinery, iron & steel and other engineering items. Export from this sector during the period 2010-11(April-September) stood at US$ 23,009.2 million compared with US$15,763 million during the same period of the previous year, registering a growth of 46 per cent. Export of machine tools have registered a negative growth of 1.2 per cent and transport equipments have registered growth of 61.8 per cent. Machinery & instruments (10.5%), iron & steel (63.9%) and other engineering items (59.8%) have registered a positive growth.
Electronic Goods
During the period 2010-11 (April-September), exports of electronic goods as a group were estimated at US$3,470 million compared with US$ 3,167 million during the corresponding period of last year, registering a positive growth of 9.6 per cent.
Textiles
During the period 2010-11 (April-September), the value of textiles exports was estimated at US$ 10,221 million compared with US$ 9,296 million in the corresponding period of the previous year,
recording a growth of 10 per cent. The export of
natural silk textiles registered a negative growth of
0.6 per cent and manmade textiles & made ups has
shown a positive growth of 5.5 per cent.

23
CHAPTER-2 Trends in India’s Foreign Trade
Handicrafts and Carpets
Exports of handicrafts declined to US$ 85 million
during 2010-11 (April-September), from US$ 102.6
million during the corresponding period of the
previous year registering a negative growth of 17.4
per cent. Export of carpets increased to US$ 428.8
million from US$ 319.4 million during the same
period last year registering a positive growth of
34.3 per cent.
Project Goods
During 2010-11 (April-September), the export
of project goods were estimated at US$ 29.5
million compared with US$ 67.4 million during
the corresponding period of last year registering a
negative growth of 56.2 per cent.
Petroleum Products
Export of petroleum products increased to US$
17,857 million during 2010-11 (April-September),
as compared with US$ 10,759.4 million during the
same period of last year recording a growth of 66
per cent.
Cotton Raw including Waste
There was a growth in the exports of cotton raw
including waste by 35.6 per cent from US$ 280.7
million in 2009-10 (April-September) to US$ 381
million during 2010-11 (April-September).
Imports by Principal Commodities
Disaggregated data on imports by principal
commodities, in US$ terms, available for the
period 2010-11 (April–September), as compared
to the corresponding period of the previous year
are given in Appendix 2.5 & 2.6. Imports during the
period of Apr.-Dec 2010-11 registered a growth of
19.0 percent in US$ terms.
The share of top five Principal Commodities
in India’s total imports during 2010-11 (April-
September) is given at Chart 2.5 below:
The import performance by top five principal
commodities during 2010-11 (April–September)
vis-a-vis the corresponding period of the previous
year is shown at Chart 2.6.

24
Annual Report 2010-11
Fertilizers
During 2010-11 (April-September), import of
fertilizers (manufactured) increased marginally to
US$ 3,492.1 million from US$ 3,064 million in April-
September 2009-10 recording a growth of 14 per
cent.
Petroleum Crude & Products
The import of petroleum crude & products stood
at US$ 48,619.2 million during April - September
2010-11 against US$ 37,475.4 million during the
same period of the previous year registering a
growth of 29.7 per cent.
Pearls, Precious and Semi-Precious Stones
Import of pearls and precious and semi-precious
stones during 2010-11 (April-September) increased
to US$ 12,495.3 million from US$ 5,458 million
during the corresponding period of the previous
year registering a growth of 129 per cent. The main
reason for the high growth in the import of pearls,
precious and semi-precious stones is the base
effect. These are principal commodities of export
having a high import content.
Capital Goods
Import of capital goods, largely comprises
machinery other than electrical, including transport
equipment, electrical machinery, machine tools,
non-electrical machinery, electrical machinery and
transport equipment registering a growth of 19.6
per cent, 15.4 per cent, 7.3 per cent, and (-) 37.1
per cent respectively.
Organic and Inorganic Chemicals
During 2010-11 (April-September), import of
organic and inorganic chemicals increased to US$
7,170 million from US$ 5,659.3 million during the
same period of last year, registering a growth of 26.7
per cent. Import of medicinal and pharmaceutical
products increased to US$ 1,199 million from US$
991.9 million during the corresponding period of
last year registering a growth of 20.9 per cent.
Coal, Coke & Briquettes
During 2010-11 (April-September), import of coal
coke and briquettes increased to US$ 5,081.45
million from US$ 4,201.72 million during the same
period of last year, registering a growth of 20.94
per cent.
25
CHAPTER-2 Trends in India’s Foreign Trade
Artificial Resins
Import of artificial resins increased during 2010-11
(April-September) to US$ 3,485.12 million from US$
2,400.41 million during the corresponding period of
last year registering a growth of 45.19 per cent.
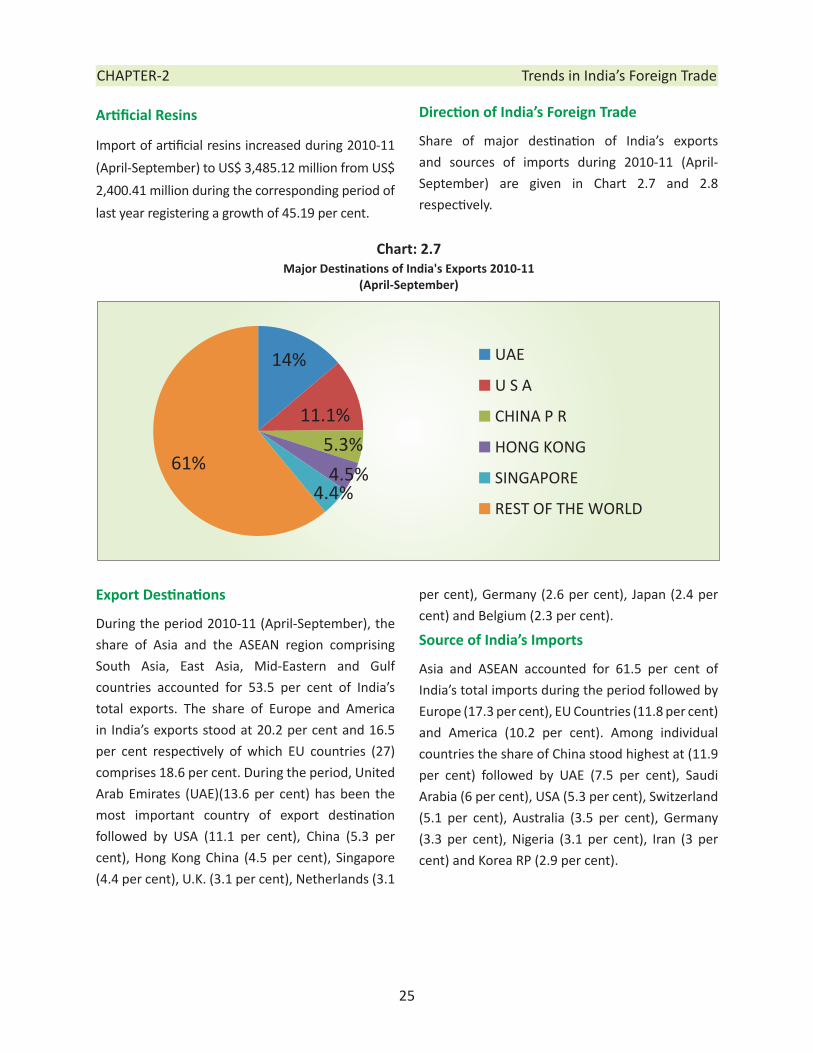
Direction of India’s Foreign Trade
Share of major destination of India’s exports
and sources of imports during 2010-11 (April-
September) are given in Chart 2.7 and 2.8
respectively.
Export Destinations
During the period 2010-11 (April-September), the
share of Asia and the ASEAN region comprising
South Asia, East Asia, Mid-Eastern and Gulf
countries accounted for 53.5 per cent of India’s
total exports. The share of Europe and America
in India’s exports stood at 20.2 per cent and 16.5
per cent respectively of which EU countries (27)
comprises 18.6 per cent. During the period, United
Arab Emirates (UAE)(13.6 per cent) has been the
most important country of export destination
followed by USA (11.1 per cent), China (5.3 per
cent), Hong Kong China (4.5 per cent), Singapore
(4.4 per cent), U.K. (3.1 per cent), Netherlands (3.1
per cent), Germany (2.6 per cent), Japan (2.4 per
cent) and Belgium (2.3 per cent).
Source of India’s Imports
Asia and ASEAN accounted for 61.5 per cent of
India’s total imports during the period followed by
Europe (17.3 per cent), EU Countries (11.8 per cent)
and America (10.2 per cent). Among individual
countries the share of China stood highest at (11.9
per cent) followed by UAE (7.5 per cent), Saudi
Arabia (6 per cent), USA (5.3 per cent), Switzerland
(5.1 per cent), Australia (3.5 per cent), Germany
(3.3 per cent), Nigeria (3.1 per cent), Iran (3 per
cent) and Korea RP (2.9 per cent).

26
Annual Report 2010-11
To sum up, India’s merchandise exports have
shown tremendous resilience inspite of challenging
situations in the world demand for our exports.
India’s foreign trade, however, has to be seen in
the context of current global uncertainties. Our
ability to go ahead in spite of the global volatility
will depend upon the adaptive efficiency of our
exports.
The value of India’s exports by principal commodities
and destinations are given in Appendix. 2.1, 2.2,
2.3, and 2.4.
The value of India’s imports by principal commodities
and destinations are given in Appendix. 2.5, 2.6,
2.7 and 2.8.