Embed Size (px)
Citation preview

Aarhus School of Business and Social Sciences, Aarhus University
Department of Business Administration
December 2013
Consumer response to food labels in Denmark
A study investigating consumers’ awareness, understanding and perception of food labels
Master Thesis
Master of Science in Marketing
Student: Kristoffer Jost Sandberg
Advisor: Polymeros Chrysochou

i
“Sometimes, you just get a label and it sticks.”
Jamie Redknapp

ii
Abstract
Purpose: Food labels can be very valuable for consumers in order to make healthy and ethical food
choices. Research on consumers’ response on food labels is extensive, but mostly has a narrow
focus on nutrition and organic labels. The present study investigates consumer response to all the
most prominent food labels in Denmark thus having a wider focus of attention, with the aim of
filling this shortage in literature. Specifically, it examines consumer awareness of these labels and
measures the influence of awareness on consumers’ response in terms of understanding, usefulness
and trustworthiness.
Method: An online questionnaire was completed by 427 participants living in Denmark.
Findings: The results indicated that in most cases awareness had positively influence on
consumers’ perception of food labels. Most food labels were well understood. Also, it was found
that the most promoted food labels in Denmark were the ones that participants’ declared to have
seen before, to better understand, trust more and find more useful. On the other hand, three food
labels that are related to EU’s scheme of geographical indications and traditional specialties were
recognised by few respondents and also scored low in usefulness, trustworthiness and perceived
understanding. In general it was found that the actual understanding of most labels was high. In
between those two extremes the labels that were moderately recognized are found. Those labels are
not perceived very useful, trustworthy or easy to understand. The EU-leaf scored lower than the
other organic labels, which signifies the importance of aiding text on labels.
Keywords: food labels, Denmark, awareness, understanding, usefulness, trustworthiness

iii
Acknowledgements
I would like to thank Polymeros Chrysoschou, my advisor, for good guidance and advices
throughout the process. Also, I would like to thank my wife, son, friends and family for their
support and encouragement throughout the journey.
December 2nd
, 2013
Kristoffer Jost Sandberg

iv
Table of Contents
1. INTRODUCTION .................................................................... 1
2. LITERATURE REVIEW ............................................................ 4
2.1 Food labelling as means to promote healthy eating ........................................................................... 4
2.1.1. Information retrieval from food labels ..........................................................................................5
2.1.2 Who is the food label user? ............................................................................................................6
2.1.2.1. Socio-demographics ...................................................................................................... 6
2.1.2.2. Personal factors ............................................................................................................. 7
2.2 Problem statement .............................................................................................................................. 8
3. METHODOLOGY ....................................................................10
3.1 Data collection .................................................................................................................................. 10
3.2 Questionnaire design ........................................................................................................................ 10
3.2.1 Food labels .................................................................................................................................. 10
3.2.1.1 Food labeling subjective measures ............................................................................... 12
3.2.1.2 Food labeling objective understanding ........................................................................ 12
3.2.1.3 Socio-Demographics .................................................................................................... 12
3.3 Statistical analysis ............................................................................................................................ 13
4. DATA ANALYSIS AND RESULTS .............................................14
4.1 Sample description ........................................................................................................................... 14
4.2. Response to labels ........................................................................................................................... 16
4.2.1 Label awareness .......................................................................................................................... 16
4.2.2 Label objective understanding ..................................................................................................... 17
4.2.3 Label perceived understanding .................................................................................................... 18
4.2.4 Label perceived usefulness .......................................................................................................... 20

v
4.2.5 Label perceived trustworthiness .................................................................................................. 22
5. KEY FINDINGS AND IMPLICATIONS .......................................25
5.1 Danes’ awareness, understanding and perception of food labels ..................................................... 25
5.2 Managerial and policy Implications ................................................................................................. 27
5.3 Limitations and suggestions for further research ............................................................................. 29
REFERENCES ............................................................................30
List of figures
Figure 1: Information retrieval from food labels ...........................................................................................5
Figure 2: The food labels used in the study ................................................................................................ 11
Figure 3: Participants’ reported awareness on food labels ......................................................................... 16
Figure 4: Participants’ objective understanding of food labels. ................................................................. 17
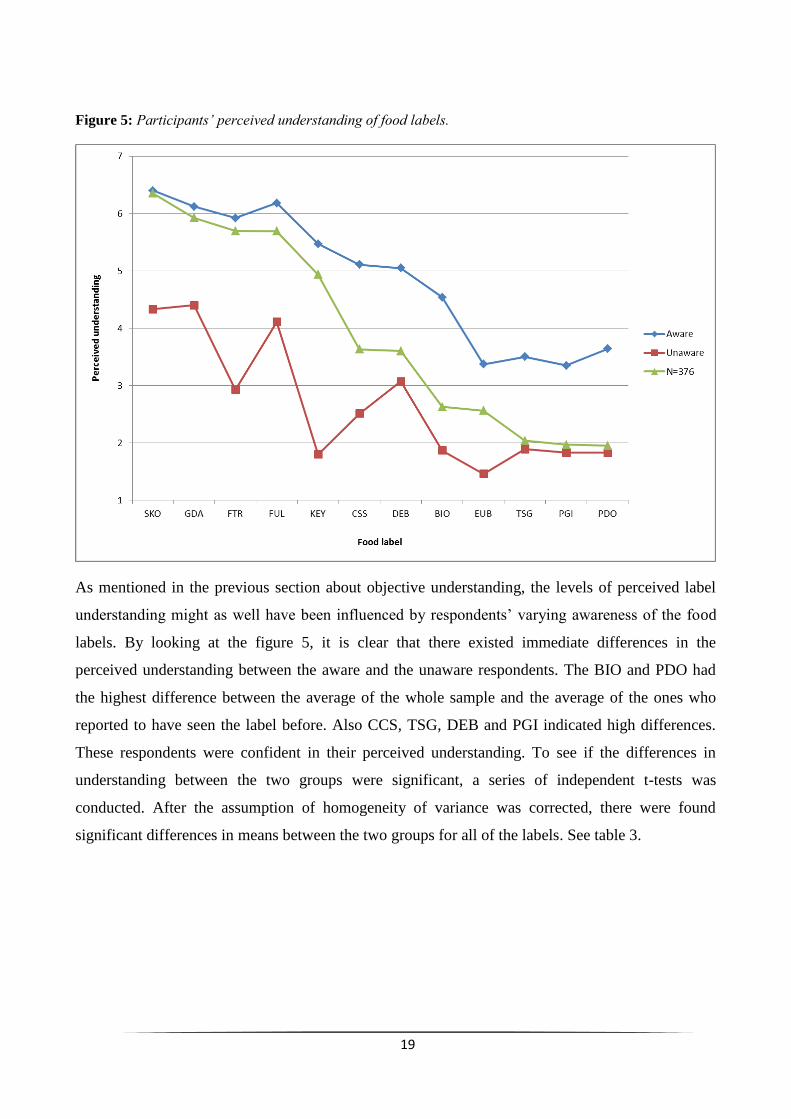
Figure 5: Participants’ perceived understanding of food labels. ................................................................ 19
Figure 6: Participants’ perceived usefulness of food labels. ...................................................................... 21
Figure 7: Participants’ perceived trustworthiness of food labels ................................................................ 23
List of tables
Table 1: Socio-demographic characteristics of the sample ........................................................................ 15
Table 2: Differences in food labels objective understanding depending on respondents’ awareness ........ 18
Table 3: Differences in food labels perceived understanding depending on respondents’ awareness ....... 20
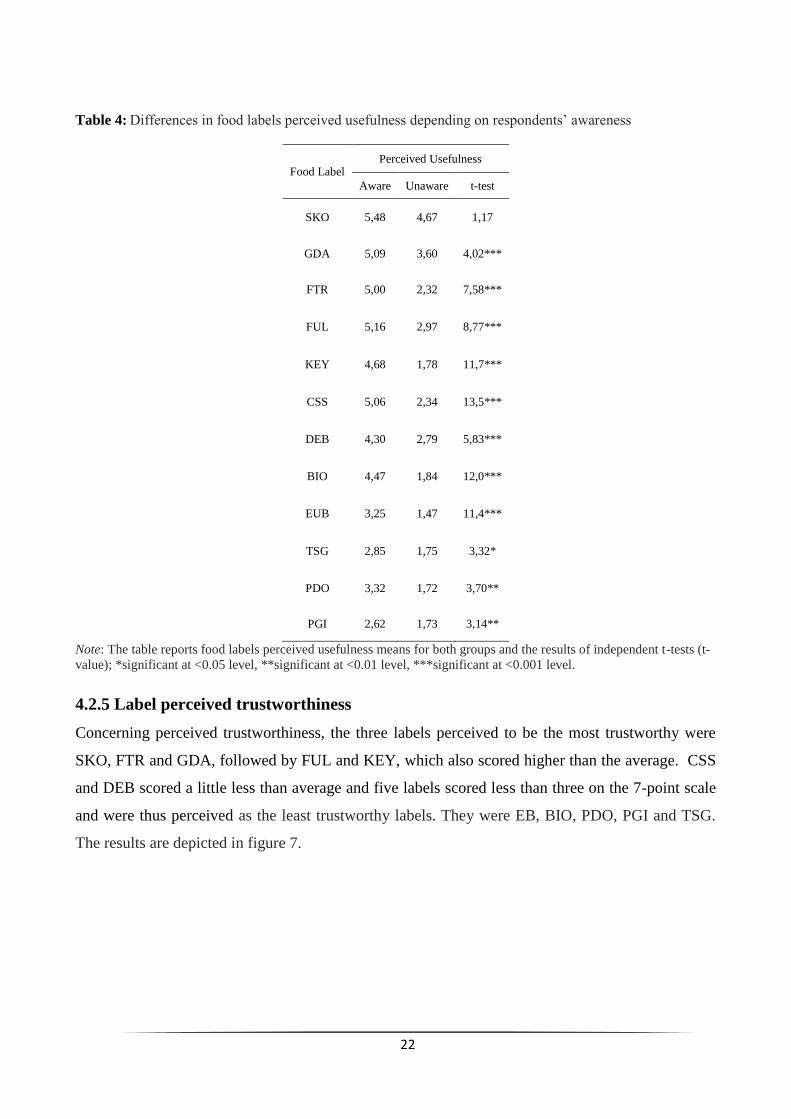
Table 4: Differences in food labels perceived usefulness depending on respondents’ awareness ............. 22
Table 5: Differences in food labels perceived trustworthiness depending on respondents’ awareness ..... 24

1. Introduction
The information presented on a package of a product is considered to be very influential to the
consumers’ buying process. Especially, when it comes to low involvement products the package
information can play the most important role because usually at their point of sale the consumer has
to judge them in a limited time (Silayoi, 2004, Prendergast and Pitt, 1996, Rettie and Brewer,
2000). This assertion is very obvious when the consumer has to decide the purchase of a food
product once facing it on the shelf in a supermarket. Food labels are one of the many visual
elements on a package with the purpose to provide the consumer a wide range of information on
matters such as nutrition value, product qualities or social responsibility of the manufacturer.
Primarily, food labels can be important to the consumers in making more deliberate food choices,
because they give information about the healthiness of the product (Mackison et al., 2010, Grunert
and Wilis, 2007, Grunert, 2013). By paying attention to the food label information, consumers can
ensure that they and their families eat the correct amounts of nutrients. They can also avoid
overeating and keep allergens away from themselves and their families. Labels also assist
consumers in choosing products, which are manufactured in a way that complies with their moral
standards in terms of matters such as environmental sustainability and fair trade. Also, labels can
provide certification to the consumer of authenticity which may be of value to some.
Obviously, the importance of labels for consumers’ buying decision is directly transferred to the
food manufacturers and the authorities, each with own purposes. For food manufacturers, labels are
a versatile tool for communicating information regarding nutrition, qualities of the product, process-
related characteristics and other relevant information, that marketers find relevant in order to
promote and position their product. Some companies may aim their marketing mix to specific
segments of consumers especially concerned with organics, the environment or health. Other
companies need to ensure that consumers are aware of the fact that their products are traditionally
manufactured.
At the same time, authorities are interested in a healthy population, since an unhealthy way of life
can cause high obesity rates and lifestyle-related diseases, which is a major cost to society. As the

2
saying goes ‘you are what you eat’, and therefore society has an interest in highlighting healthy and
nutritious food. Health is often debated in the media and continually investments are made in
campaigns related to health and nutrition advice. Especially in developed countries, protection of
the environment is also of great concern to authorities, and in cooperation with organizations and
companies labels can help promote tendencies that are healthy for the environment.
The above-mentioned importance of labels and the proliferation of many food related qualities have
led to the creation of a great number of food labels, designed with the objective to provide
consistent, understandable, trustworthy and usable information for the consumer. As a result, the
perception of the specific food labels by the consumer is of increasing interest to academic research.
Most prior research in this area explore the response of consumers to labels in relation to nutrition,
ingredient list and safety information (e.g. Malcolm et al., 2008, Ali and Kapoor, 2009, Gorton et
al., 2009, Mackey and Metz, 2009, van Herpen et al., 2012, Hall and Osses, 2013). Other recent
topics of interest include response to various organic labels and other schemes meant to provide
information on processing, quality, sustainability and traditional nature of foods (e.g Botnaki et al.,
2006, Hoogland et al., 2007, Aprile et al., 2012, Janssen and Ham, 2012b, Sirieix et al., 2013).
So far, research findings about use food labels are contradictory. Even though consumers have a
high reported use of nutrition labels, few actually read the information before buying a product
(Grunert et al., 2010). Attention to food labels is generally found to be low. For example, Botnaki et
al. (2006) is reporting low levels of awareness and knowledge in terms of organic and quality-
related labels. In contrast, nutrition labels such as Guideline Daily Amount (GDA) shows to have
higher levels of awareness and understanding among consumers as a result of extensive
communication in the respective countries (Malcolm et al., 2008). A recent study from Spain by
Aprile et al. (2012) shows that consumers have a poor understanding of the Protected Designation
of Origin (PDO) label and the Protected Geographical Indication (PGI) label, while the
understanding of the organic labels is higher. Similar results have also been found in Holland,
where consumers are very familiar with the organic label (Hoogland et al., 2007) although the
understanding is not very high. The same authors conclude that additional information on the label,
such as text, leads to a better understanding and thereby improve consumer perception of organic
products. In United Kingdom Sirieix et al. (2013) observe a general lack of recognition for most
food labels and a tendency to be skeptical of the labels consumers are not familiar with, while
perception of organic and fair trade labels generally tend to be positive. This is consistent with a

3
study of Janssen and Hamm (2012b), that shows that the presence of an organic label made organic
products more trustworthy.
The aim of the present thesis is to identify Danish consumers’ awareness and response to different
food labels, with purpose to clarify to what extent consumers understand the selected food labels
and how they perceive these labels in terms of trustworthiness and usefulness. Furthermore, the
study explores whether consumer response to food labels depends on prior awareness. Twelve
different labels are tested at the same time. The labels cover a wide spectrum of areas; organics,
sustainability, fair trade, geographical indications, traditional specialties, protected designation of
origin, health and nutrition.
The rest of the thesis will consist of the following four chapters. Chapter two will contain a review
of existing literature in the field and end up with the concluding problem statement. The third
chapter of the study will present the methodology used by giving a description of the sample
selection, the questionnaire design and the statistical techniques applied. The fourth chapter will
consist of the statistical analysis and will graphically present the respective results of it. Finally, the
fifth chapter will start with the discussion of the main findings and their implications for the
authorities and the companies, and it will end up with a presentation of the limitations of the study
and proposals for future research.

4
2. Literature Review
2.1 Food labelling as means to promote healthy eating
The term food label is very broad covering a range of signposts and panels found on packages of
food products. Food labels can contain a variety of information and are meant to inform and guide
the consumers. Most commonly the term is used in conjunction with nutritional information, while
in the present paper the term is used in a broader context and is not only referring to nutrition labels,
but also a wider range of labels, which can be found on food products such as organic labels,
quality, fair trade, sustainability and labels relating to geographical indications and traditional
specialties.
Prior research in this area is easily accessible, but most studies have been focusing on the topic of
nutritional information concentrating on which information and labels assists consumers in making
better food choices with special regard to healthiness. Several studies are systematic reviews of
empirical papers (Campos, Doxey, & Hammond, 2011; Cowburn & Stockley, 2007; Grunert &
Willis, 2007; Hieke & Taylor, 2012). Studies on food labels in a broader sense such as quality-
related labels also exist (e.g. Abrams, Meyers, & Irani, 2009; de Pelsmacker, Jannsens, & Mielants,
2005; Larceneux, Benoit-Moreau, & Ranaudin, 2011; Mahé, 2010), however the topic has not been
investigated nearly as intensely as with the case of nutritional labels.
Food labels are believed to have the ability to have an effect on food choices and dietary behavior
(Mackison, Wrieden, & Anderson, 2010) and are commonly acknowledged to have a central role in
communicating product-related information to consumers. Food labelling has become an important
policy tool to enable consumers to get thorough information on the contents and the composition of
food products. Certain mandatory regulations are being developed in the European Union (Campos
et al., 2011), but so far food labelling on pre-packaged foods is a voluntary scheme, except in the
case of certain health and quality claims. However, consumers need to be able to find, read and
correctly interpret and understand the information presented to them on the food labels in order to
be able to make informed and healthy food choices. In the next section, theoretical foundations on
information retrieval and use of food labels will be discussed.

5
2.1.1. Information retrieval from food labels
This section is intended to provide insight into the theoretical considerations underlying the design
of this study. At first, the theoretical model is introduced and then the model’s elements are
described. The model is inspired by theories of consumers’ attitude formation and decision making
when grocery shopping and describes elements of the consumer decision-making process. The
stages of the process are depicted in figure 1.
Figure 1: Information retrieval from food labels (Grunert and Wills, 2007)
Grunert and Wills (2007) have developed a framework that reflects consumers’ decision-making
process relating to their understanding and use of food labels. The framework has been developed
based on two streams of research; ‘consumer-decision making’ and ‘attitude formation and change’.
Logically, only labels to which consumers are exposed to have any further influence. It is only by
exposure that consumer can become aware of specific food labels and according to Grunert and
Wills (2007) the likelihood of exposure increases if consumers actually search for the label
information, even though active search it is not a precondition for exposure, as it can also be
completely random. Exposure leads to effects on subsequent behavior only when the information is
either consciously or subconsciously perceived. Merely exposure is not enough. Conscious
perception is believed to have the strongest effect on future behavior. Finally, perception leads to
understanding and liking. Understanding is the meaning the consumer attaches to what is perceived
and is defined as a cognitive dimension, whereas liking is an affective dimension, reflecting the
values people attach to things and thus their beliefs and attitudes towards them.
Concerning understanding, there is an important distinction between subjective and objective
understanding. Subjective understanding is the meaning the consumer attaches to the perceived
label information; how they believe to have understood the information. Objective understanding is
whether the meaning the consumer has attached to the label information is coherent with the
Search Exposure Perception
Understanding
Liking
Use

6
meaning that the sender of the label information actually intended to communicate. These two can
be different.
The affective dimension, liking, can refer to a wide range of values that people attach to labels, such
as if they find it easy to understand, useful or trustworthy. As figure 1 shows, understanding is not
necessarily a prerequisite to be able to form a positive or negative attitude of the label. Though
consumers can be affected by a label without understanding the meaning of it - consumers may
even like a label simply for the colours and symbols used - it can have an impact on the use of the
label, since a liked label can lead to a more positive evaluation of the product even when it is not
understood. Finally, the authors claim that the information of the label may be used in making food
choices.
Sequentially, the above described processes may be moderated or even impeded by specific
characteristics of the consumers. Literature related to this issue will be disused in the following
section.
2.1.2 Who is the food label user?
To be effective labelling policies must be targeted to different groups of consumers. There exist two
main aspects that literature focuses on in this regard; the analysis of socio-demographic factors and
the other personal factors related with the use and comprehension of food labels. Female users,
higher educated consumers, persons with high income and certain age-groups have generally been
found to use food labels more frequently and understand them better. Also, personal factors such as
concern with health issues, individual’s health condition and nutrition knowledge plays a role
(Hieke & Taylor, 2012). The two aspects will be discussed in the following sections.
2.1.2.1. Socio-demographics
Socio-demographics factors have been examined to a great extent. The most frequently ones
mentioned as determinants of the food label use are considered to be gender, age, size of household,
education, occupation and income.
When it comes to gender, studies bring ambiguous results. On the one hand, some studies report
that women use food labels more than men, trust them more than men and are more likely to
proclaim that food label information influenced their food choice (e.g. Campos et al., 2011,
Drichoutis et al., 2008; Satia, Galanko, & Neuhouser, 2005). On the other hand, there exist a

7
number of studies reporting no statistically significant differences between genders (Aygen, 2012;
Jacobs, de Beer, & Larney, 2010; Nayga, 2000).
Regarding age, evidence is contradictory as well. Some studies do not indicate any significant
relation (Hieke & Taylor, 2012). However, most studies (Drichoutis, Lazaridis, Nayga,
Kapsokefalou, & Chryssochoidis, 2008; Mannel et al., 2006; Petrovich & Ritson, 2006) show that it
is more likely that young or middle-aged consumers have a better understanding and use food labels
more frequently in comparison with older consumers.
Education and income have been closely examined as possible determinants of food label use
(Hieke & Taylor, 2012). On the one hand, it appears that users of food labels are likely to have a
higher degree of education than non-users (Jacobs et al., 2010; Petrovici & Ritson, 2006; Satia et
al., 2005). An explanation can be that consumers with a higher education might also have a higher
ability to apprehend this kind of information. On the other hand, some studies did not find similar
significant results (Aygen 2012, Nayga, 2000). Parallel effects have been reported in the case of
income, where most studies reveal that consumers with a high income are more likely to use food
labels (Petrovici & Ritson, 2006; Sung-Young, Nayga, & Capps, 2001), while other studies found
either the opposite effect or no effect (Campos et al., 2011).
With respect to the other mentioned determinants, married consumers, larger households and
households with children have been found more likely to use food labels. In regard to employment
status and urban or rural communities, reported results have been mixed (Campos et al., 2011;
Hieke & Taylor, 2012).
Reported findings regarding socio-demographics are very ambiguous as well. There seems to be
some indications that women are more likely than men to use food label information, even though
research has brought mixed results. Age seems to be negatively related to comprehension of food
labels, while it does not seem to have any strong relation to the use of food labels. There seems to
be a positive relation between use of food labels and a higher level of education and income, as well
as household size, while the impact of occupation and habituation has been inconclusive. In general,
findings relating to socio-demographics are very conflicting.
2.1.2.2. Personal factors
In addition to the standard socio-demographic characteristics, certain factors regarding health and
nutrition have been discovered to correlate with use of food labels. Studies show that the healthier

8
eating habits consumers have, the higher use of food labels (Gorton, Ni Mhurchu, Chen, & Dixon,
2009; Mannel et al., 2006; Satia et al., 2005). This might be caused by personal preferences or
specific obligations from a diet (Campos et al., 2011). People who are more concerned with dietary
guidelines and nutrition quality have been found to use food labels to a higher extent. Other factors
like knowledge of nutrition and knowledge labels, knowledge of health eating and weight control
are also found to be correlated with use of labels (Campos et al., 2011). Moreover, it appears that
time allocated for shopping has a positive influence on food label use by consumers as well as the
ones that do not put much attention on the price of food products tend to have a higher usage of
food labels. The results also imply other possible factors which might have an impact on consumers
in their food label use, suggesting that consumers might only pay attention to information if it
corresponds with their own beliefs, goals and motivations.
2.2 Problem statement
The search in literature has shown that most research in food labelling relates to nutritional
information. However, in recent years an increasing number of other labels appeared in the
supermarkets and research in consumers’ awareness, knowledge, use and opinions of these labels is
vaguer. Most research has already been performed in developed countries, but studies present
inconclusive results and show that differences exist between different countries and studies. This is
likely caused by cultural differences with regards to shopping behavior, eating practices and public
debate. Little research has been done in the case of Denmark. Therefore the aim of this study is to
provide a deeper insight into this area by considering a wide spectrum of the most prominent food
labelling schemes found in Denmark and thus contribute to a more detailed picture about the use of
food labels from Danes.
The discussion of prior research above has given rise to the main research questions of this thesis
which are:
RQ1: To what extent are the Danish consumers aware of and understand different food labels and
how do they perceive these labels in terms of usefulness and trustworthiness?
RQ2: How does prior awareness of the food labels influence the consumers’ response to the food
labels?

9
The study will measure consumers’ response to certain labels simultaneously and thus shed light to
what extent Danish consumers are aware of and understand different food labels and how they
perceive them in terms of trustworthiness and usefulness. For this purpose, the study includes food
labels that relate to nutrition, organics fair trade, sustainability, quality assurance and authenticity.
Furthermore, the study aims to explore if consumer response to food labels depends on consumers’
prior awareness.
The findings of this study will be valuable to both companies and authorities. Companies will gain a
better insight into the way Danish consumers perceive the food labels and will be able to adapt their
strategy accordingly so they can target specific consumers segments in the Danish market, such as
segments concerned with healthy eating, weight control, environmental issues or ethical matters.
Also, organizations and authorities will learn if their labels are recognized, clearly understood and
found helpful by the Danish consumers and thus are successful in their campaigns and politics.

10
3. Methodology
3.1 Data collection
The data for the study were collected by means of an online survey conducted on Qualtrics
(www.qualtrics.com). The link to the survey was distributed to Danish consumers through different
Internet sources such as Facebook, email and forums. The respondents answered on their own will
since no incentives were provided. The survey ran for two weeks between Sunday 14th
of July and
Monday the 29th
of July. In total 427 respondents completed the survey.
3.2 Questionnaire design
The survey was created both in Danish and in English. The purpose of the English version was
respectively for supervision and for this paper, while respondents were linked to the Danish version,
since the survey would only include Danes. The questionnaire naturally started with a small
introduction to inform respondents about the topic, health and food labels, and the purpose of the
survey. This was followed by three blocks of questions. The first block of questions was related to
subjective understanding, the second to objective understanding and the third was about socio-
demographics. These blocks will be further explained in the subsequent sections. The questionnaire
can be found in appendix 1.
3.2.1 Food labels
Twelve labels were selected to be investigated in the survey. They were chosen after research online
as well as research in supermarkets. The primary criteria were to have some of the most common
food labels found in Denmark and represent areas such as organic production, sustainability,
nutrition, tradition, quality and fair trade. More specifically, the research included four organic
labels (the Danish, the European, a German and a Norwegian), one label indicating sustainable
seafood, three European labels relating to food traditions and indication of specific geographical
areas (PDO, PGI and TSG) and three nutritional labels (GDA, the Keyhole and Whole Grain) and
finally the Fair Trade label. The same twelve labels were used in every section of questions. The
labels are depicted in figure 21.
1 A list with the food labels and the corresponding abbreviations used in this paper can be found in Appendix 2

11
Figure 2: The food labels used in the study
Label Food Label Name Abbreviation
Protected Geographical Indication PGI
The red Ø-logo SKO
Certified Sustainable Seafood CSS
Protected Designation of Origin PDO
European Union organic farming
label EUB
Fair Trade FTR
Traditional Specialty Guaranteed TSG
The Keyhole Symbol KEY
Guideline Daily Amount GDA
The Whole-Grain logo FUL
German national organic farming
label BIO
Norwegian national organic
farming label DEB

12
3.2.1.1 Food labeling subjective measures
The first block of question dealt with subjective measures. The following four subjective measures
were included in the questionnaire; awareness, perceived understanding, perceived usefulness and
perceived trustworthiness. They were measured using single-item questions and the labels were
randomized within each question to control for order effect.
At first, the awareness of the twelve labels was measured by asking the respondents “which of the
following food labels have you seen before?” There were two possible answers for each label; “I
haven’t seen” and “I have seen”. Secondly, the perceived understanding was measured by asking
the question “to what degree do you understand what the following food labels mean?” The
question was measured using a Likert scale that was anchored by “1=Don’t understand at all” and
“7=Completely understand”. The third section was measuring perceived usefulness also by using a
7-point Likert scale. The question was “This food label assists me in making better food choices.”
The scale was anchored by “1=Totally disagree” and “7=Totally agree”. Finally, the fourth question
regarding the subjective measures assessed the perceived trustworthiness of the labels by the
statement “I trust this food label”. Like the previous it was done on a 7-point scale ranging from
“1=Totally disagree” to “7=Totally agree”.
3.2.1.2 Food labeling objective understanding
The second block of questions dealt with objective understanding of the twelve food labels. It was
measured by addressing the question “What does the food label below mean?” For each label, there
were three possible answers with only one correct answer. The correct answer was based on the
official definition.
3.2.1.3 Socio-Demographics
The third block of questions in the questionnaire contained questions about socio-demographics.
Respondents were asked about age, gender, marital status, household size, level of education,
monthly income, place of residence, weight and height.
In addition to these classic socio-demographic questions, a few questions relating to nutrition and
labels were included. These additional questions asked respondents if they usually were in charge of
grocery shopping, how they would describe their overall diet on a 7-point scale from “1=Poor” and
“7=excellent” (Feunekes, Gortemaker, Willems, Lion, & van den Kommer, 2008), what they
thought of their overall knowledge about healthy food and healthy eating on a 7-point scale from

13
“1=Not very knowledgeable” and “7=Very knowledgeable” (Traill, Chambers, & Butler, 2012),
how often they rely on information from food labels to make food purchase decisions on a 7-point
scale ranging from “1=Never” to “7=Always” and last how often they read nutrition information on
food labels while shopping with possible answers 1=always, 2=most of the time, 3=rarely and
4=never.
3.3 Statistical analysis
All data analysis was performed in SPSS, version 21. The descriptive statistics were carried out by
calculating frequencies and average scores of the reported responses, with the aim to examine how
the labels in question scored on respectively awareness, objective understanding, perceived
understanding, usefulness and trustworthiness. For the purpose of comparing the differences
between the aware and the unaware respondents, independent samples t-tests and chi-square tests
were performed where applicable. The t-tests were conducted using awareness of the labels and
independent variable and respectively perceived understanding, usefulness and trustworthiness as
dependent variables. The chi-square tests were used to investigate whether awareness of the labels
influenced the objective understanding of the labels.

14
4. Data analysis and results
4.1 Sample description
Overall 427 participants responded to the survey. Among them 17 Danes that currently live abroad.
They are obviously exposed to a different mix of labels than Danes living in Denmark and since this
group was too small, they were excluded from the survey. Also minors and respondents that
answered the survey in less than six minutes were excluded from the sample. Thus, there were
N=376 participants who successfully completed the questionnaire. Broken down by gender, there
are 274 (~73 %) female and 102 (~27 %) male respondents with an average age of 33.5. Concerning
their lifestyle 244 (~65 %) were non-married and 132 (~35 %) were married. 95 (25.3%) were
living in a one-person household, 133 (35.4%) were living in a two-person household and 148
(39.4%) were living in a more than two-person household. With regard to education 147 (39.1%)
had completed high school or lower level of education while 229 (69.9%) were educated further
than high school. In terms of income 142 (37.8 %) stated that they believed they earn less than
average, 152 (40.4 %) believed they earn close to average and 82 (21.8 %) answered they earn more
than the average. Concerning the place of residence a relatively big part of the sample, 44.1%, were
living in a large town with more than 100.000 inhabitants, while 25.3 % were living in a medium
sized town with between 20.000 and 100.000 inhabitants, 16,2% were living in a small town of
under 20.000 inhabitants and 14.4% were living in a village.
On the basis of weight and height the body mass index (BMI) for each respondent was deducted.
According to their BMI, respondents were categorized into the four groups used by World Health
Organization. More specifically a BMI below 18.5 kg/m2 is categorized as underweight, normal
weight is 18.5 to 24.9 kg/m2, overweight is between 25.0 and 29.9 kg/m2 while above 30 kg/m2 is
categorized as being obese. The sample contained 4.5% underweight, 54.5% normal weight, 28.7%
overweight and 9.3% obese people. 11 respondents (2.9%) did not type in valid data for their
weight and/or height and therefore their BMI could not be computed. The characteristics of the
sample are shown in table 1.

15
Table 1: Socio-demographic characteristics of the sample
N=376 %
Gender
Male
Female
102
274
27,1
72,9
Average age 33,5
Marital status
Non-married
Married
244
132
64,9
35,1
Household size
One-person household
Two-person household
More than two-person household
95
133
148
25,3
35,4
39,4
Education
High school and below
University degree and above
147
229
39,1
60,9
Monthly income
Below average
Close to the average
Above average
142
152
82
37,8
40,4
21,8
Place of residence
Village
Small town (under 20 000 inhabitants)
54
61
14,4
16,2
Medium-sized town (between 20 000 and
100 000 inhabitants) 95 25,3
Large town (over 100 000 inhabitants) 166 44,1
BMI
Underweight ( BMI < 18,5 )
Normal weight ( BMI 18,5 – 25 )
Overweight ( BMI 25 – 30 )
Obese ( BMI > 30 )
Unknown
17
205
108
35
11
4,5
54,5
28,7
9,3
2,9
Responsibility for grocery shopping
Yes
No
306
70
81,4
18,6
Label reading frequency
Always
Most of the time
Rarely
Never
35
210
116
15
9,3
55,9
30,9
4,0
Average quality of diet 5,28
(1 = poor and 7 = excellent diet)
Average knowledge about healthy eating 5,56
(1 = not very knowledgably and 7 = very knowledgably)
Average use of label information 4,67
(1 = never and 7 = always)
Regarding behavior in relation to use of labels 81.4 % of the participants said they were responsible
for the primary grocery shopping in their household while 18.6 % said they were not. The biggest
part of the sample declared often to read labels while grocery shopping. 9.3 % always read labels
and 55.9 % do so most of the time, while 30.9 % rarely read labels and only 4 % stated that they
never pay attention to labels. On a 7-point scale respondents reported to have an average perceived
quality of diet of 5.28 (ranging from 1=poor and 7=excellent), an average perceived knowledge

16
about healthy eating of 5.56 (ranging from 1=not very knowledgeable and 7= very knowledgeable)
and to use information from food labels on an average of 4.67 (1=never and 7= always). The
average score for all three questions was a little higher than the median point of the scale.
4.2. Response to labels
4.2.1 Label awareness
A frequency test of label awareness showed, that the Danish organic label the red Ø-logo (SKO),
the Fair Trade (FTR) label and the Guideline Daily Amount (GDA) were the most well-known
among the Danish participants. The SKO topped the list with close to 98%, nearly 93% declared to
have seen FTR before, while 89% were aware of the GDA. Rather well-known were also the two
labels The Keyhole Symbol (KEY) 85% and the Whole-Grain logo (FUL) 73%. Known to a lesser
extent were the three organic labels that were included in the survey respectively from the European
Union; the European Union farming label (EUB) 58%, the German; Bio-Siegel (BIO) 29%, the
Norwegian Debio (DEB) 27% and the Certified Sustainable Seafood label (CSS) 43%. Least known
among the Danish respondents were the three European labels Protected Geographical Indication
(PGI) 9%, Traditional Specialty Guaranteed (TSG) 9% and the Protected Designation of Origin
(PDO) 7%. These results are depicted in Figure 3.
Figure 3: Participants’ reported awareness on food labels

17
4.2.2 Label objective understanding
With regards to the objective understanding of the labels, the Danish participants in general showed
a fairly high understanding of them. Half of the 12 labels were measured to have an objective
understanding of at least 90%. Close to 99% identified the correct answer for FUL, DEB and SKO,
96% for FTR, 95% for TSG and 90% for BIO. For another three labels more than 80% of the
participants identified the correct answer; namely 89% for KEY, 83% for PDO and 82% for CSS.
66% of the participants correctly answered the question related to GDA. The lowest accuracy rates
were for PGI with 48% and EB with 39%. The results are depicted in figure 4.
Figure 4: Participants’ objective understanding of food labels.
The levels of objective label understanding might be influenced by respondents’ varying awareness
of the labels. By looking at the figure it is clear that for some of the labels apparent differences in
the objective understanding existed between the aware and the unaware respondents. To see if the
differences in understanding between the two groups were significant, a Chi-square test was
performed. Significant differences were found between the two groups for SKO, FTR, BIO, KEY,
CSS and EB. On the other hand, for the cases of FUL, DEB, TSG, PDO, GDA and PGI there were
found no significant differences. Results of the analysis are resumed in table 2.

18
Table 2: Differences in food labels objective understanding depending on respondents’ awareness
Food Label Objective Understanding
Aware Unaware X2
FUL 99,3 97,8 1,55
DEB 98,5 100 1,49
SKO 99,5 77,8 39,2***
FTR 97,4 82,1 16,9***
TSG 97,1 94,4 0,42
BIO 86,6 98,1 11,2**
KEY 90,3 80,0 5,06
PDO 96,0 82,3 3,12
CSS 87,0 77,6 5,52*
GDA 65,9 64,3 0,04
PGI 44,1 48,8 0,28
EUB 46,5 29,6 11,1**
Note: The table reports the results of Chi-square tests (χ2); *significant at <0.05 level, **significant at <0.01 level,
***significant at <0.001 level.
4.2.3 Label perceived understanding
Regarding the perceived understanding of the labels, a frequency test was performed. The results
can be observed in figure 5. As it can be seen SKO, GDA, FTR and FUL scored the highest ratings
in perceived understanding having scores between 5,69 and 6,35. KEY scored a little above average
with 4,93, while CCS and DEB scored a little lower than average, respectively 3,63 and 3,60.
Perceived understanding of the rest of the labels, BIO, EB, TSG, PGI, PDO were rather low.
19
Figure 5: Participants’ perceived understanding of food labels.
As mentioned in the previous section about objective understanding, the levels of perceived label
understanding might as well have been influenced by respondents’ varying awareness of the food
labels. By looking at the figure 5, it is clear that there existed immediate differences in the
perceived understanding between the aware and the unaware respondents. The BIO and PDO had
the highest difference between the average of the whole sample and the average of the ones who
reported to have seen the label before. Also CCS, TSG, DEB and PGI indicated high differences.
These respondents were confident in their perceived understanding. To see if the differences in
understanding between the two groups were significant, a series of independent t-tests was
conducted. After the assumption of homogeneity of variance was corrected, there were found
significant differences in means between the two groups for all of the labels. See table 3.

20
Table 3: Differences in food labels perceived understanding depending on respondents’ awareness
Food Label Perceived Understanding
Aware Unaware t-test
SKO 6,40 4,33 2,59*
GDA 6,12 4,40 5,00***
FTR 5,92 2,93 7,54***
FUL 6,18 4,11 8,69***
KEY 5,47 1,80 16,0***
CSS 5,11 2,51 14,5***
DEB 5,05 3,07 9,62***
BIO 4,54 1,87 13,5***
EUB 3,37 1,46 12,1***
TSG 3,50 1,89 4,51***
PGI 3,35 1,83 4,14***
PDO 3,64 1,83 4,13***
Note: The table reports food labels perceived understanding means for both groups and the results of independent t-tests
(t-value); *significant at <0.05 level, **significant at <0.01 level, ***significant at <0.001 level.
4.2.4 Label perceived usefulness
Reported usefulness of the food labels revealed that the label perceived most useful to the
participants were SKO with a score of 5.46, but also GDA, FTR, FUL and KEY were to some
degree found to assist participants in making better food choices. BIO, EB had scores between 3
and 2 while TSG, PDO and PGI were found to be the least useful with scores lower than 2.
The results are depicted in figure 6.

21
Figure 6: Participants’ perceived usefulness of food labels.
Again, it is obvious the levels of label usefulness might have been influenced by respondents’
varying awareness of the food labels. By looking at the figure 6, it is clear that there existed
immediate differences in the usefulness between the aware and the unaware respondents. To further
examine the differences in perceived usefulness between the aware group and the unaware group a
series of independent t-tests were performed. These results can be observed in table 4. The only
difference between the two groups found not to be statistically significant was SKO.
22
Table 4: Differences in food labels perceived usefulness depending on respondents’ awareness
Food Label Perceived Usefulness
Aware Unaware t-test
SKO 5,48 4,67 1,17
GDA 5,09 3,60 4,02***
FTR 5,00 2,32 7,58***
FUL 5,16 2,97 8,77***
KEY 4,68 1,78 11,7***
CSS 5,06 2,34 13,5***
DEB 4,30 2,79 5,83***
BIO 4,47 1,84 12,0***
EUB 3,25 1,47 11,4***
TSG 2,85 1,75 3,32*
PDO 3,32 1,72 3,70**
PGI 2,62 1,73 3,14**
Note: The table reports food labels perceived usefulness means for both groups and the results of independent t-tests (t-
value); *significant at <0.05 level, **significant at <0.01 level, ***significant at <0.001 level.
4.2.5 Label perceived trustworthiness
Concerning perceived trustworthiness, the three labels perceived to be the most trustworthy were
SKO, FTR and GDA, followed by FUL and KEY, which also scored higher than the average. CSS
and DEB scored a little less than average and five labels scored less than three on the 7-point scale
and were thus perceived as the least trustworthy labels. They were EB, BIO, PDO, PGI and TSG.
The results are depicted in figure 7.

23
Figure 7: Participants’ perceived trustworthiness of food labels
By looking at figure 7, immediate differences can be identified between the aware and the unaware.
The most striking example is the BIO, which seems rather highly trusted by the aware group but it
has a rather low overall score. A series of independent t-tests were applied to see whether the
differences in trustworthiness between the two groups were significant. The results showed that for
all of the labels except SKO the differences between the aware and the unaware were significant.
These results can be observed in table 5.

24
Table 5: Differences in food labels perceived trustworthiness depending on respondents’ awareness
Food Label Perceived Trustworthiness
Aware Unaware t-test
SKO 6,20 5,11 1,43
FTR 5,45 2,93 7,16***
GDA 5,43 3,83 4,47***
FUL 5,37 3,22 9,48***
KEY 5,15 1,98 12,6***
CSS 5,26 2,62 14,7***
DEB 4,50 2,73 8,01***
EUB 3,71 1,92 10,6***
BIO 4,72 2,21 12,1***
PDO 3,72 2,12 4,31***
PGI 3,18 2,13 3,14**
TSG 3,35 2,11 4,01***
Note: The table reports food labels perceived trustworthiness means for both groups and the results of independent t-
tests (t-value); *significant at <0.05 level, **significant at <0.01 level, ***significant at <0.001 level.
25
5. Key findings and Implications
Food labels are a valuable tool in guiding modern consumers to healthy and ethical food choices.
However literature has not investigated to what extent the exposure to different food labels used in
Denmark can influence consumers’ response towards them. The responses to those labels and the
understanding of them have not been measured yet. The purpose of the present study was to fill this
gap by doing the respective measurements. In the previous section the results were presented and in
this section the key findings of the analysis will be discussed and finally the implications for
authorities and companies will be proposed. In the end we will discuss the limitations of this
research and we will suggest further research.
5.1 Danes’ awareness, understanding and perception of food labels
In terms of awareness the labels can be divided into three groups. Certain labels are known to most
Danish consumers, other labels are moderately known, and some are known to a very low degree.
The group of labels with the highest levels of awareness contains SKO, FTR, GDA, KEY and FUL.
These labels all have rather high level of awareness of more than 75%. The reason for this is likely
to be that a huge number of products in supermarkets carry these labels and basically it is almost
impossible to avoid them when shopping for groceries. SKO, KEY and FUL are national Danish (or
Scandinavian) labels and have all been widely promoted in campaigns in recent years. GDA is the
only one of the labels in question, that does not require a special certificate or is needed to live up to
specific requirements, and it is found on most conventional products, which likely explains the high
awareness level. The fair trade label is mostly found on products like coffee, tea, coco and
chocolates. Consumption in Denmark is on these products are very high (reference needed). The
high awareness of FTR could indicate that Danes are concerned with ethical trend.
The group of labels with moderate awareness levels consists of EUB, CSS, BIO and DEB.
Common for EUB, BIO, DEB is that they are non-local organic labels. Even though the levels of
awareness are not nearly as high as for SKO the levels are far from low. The More than half of the
participants states to have seen the EUB before. It is found on many products in Denmark, but has
not been promoted to the same extent as SKO in Denmark. BIO from Germany and DEB from
Norway have much lower measured levels of awareness than the European Union label EUB. It

26
makes good sense, since the two labels would only be on products from respectively Germany and
Norway, and these products would also qualify for carrying the European Union label, which
naturally are found on many more products in general, since all companies, that live up to the
requirements, in the European Union are allowed to use them.
The labels with lowest awareness (less than 10%) are all related to origin and authenticity of the
products and are labels administered by the European Union as well. The overall low scores can be
explained of the lack of interest a consumer has about the protection of the producer and the region.
Probably consumers understand it as a typical law and it is not a signal of quality. The lack of
promotion stands as another explanation.
It can be observed the Danish consumers were measured to have a very high objective
understanding of the labels in general. Only two labels, PGI and EUB, scored less than 50%, while
GDA scored moderately and the majority of the labels scored above 80%. The above finding is
partially consistent with Aprile et al (2012) findings from Spain, since only understanding of PGI
was found low, while PDO was found high. Also the results indicate that for most food labels levels
of understanding do not depend on whether they have previously been seen by the consumers.
Another finding that indicates there is not necessarily correlation between awareness and
understanding is that for the BIO label the unaware respondents scored higher than the aware.
These findings may very well be a consequence of the way the objective understanding was
measured, given the level of difficulty in the questions related to each label probably varied.
Another explanation can be that the labels are easy to interpret, because of design or aiding texts,
regardless of previous exposure. However in the case of KEY where no text exist and no apparent
connection between the keyhole symbol and healthiness the explanation falls short, since it still
performed high in understanding.
Overall SKO, GDA, FTR, FUL and KEY scored above average in perceived understanding. Below
average are CSS, DEB, BIO, EUB, TSG, PGI and PDO following the overall level of awareness.
Also, it is observed that for all labels previous exposure influences positively on the respondents’
confidence in understanding the respective food label. A possible explanation for the above finding
could be that it generates confidence when a consumer notices a label and becomes familiar with it.
Literature reports that the actual understanding and consumers’ assessment of their own
understanding are not necessarily consistent, reflecting the fact that consumers are either under or

27
over confident in their assessment (Alba and Hutchinson, 2000). In the present study respondents
seem to mostly underestimate their understanding of the labels. Only in the case of GDA there
might exist a slight overconfidence.
In terms of usefulness five labels (SKO, GDA, FTR, FUL, KEY) were measured above average.
These are the same five labels with the highest level of awareness. These are followed by the
moderately known labels (CSS, DEB, BIO, EUB) which are the sustainability label and the foreign
organic labels. The EUB was perceived as the least useful of this group, which complies with the
observation that it was the least understood of all labels, despite it had a higher level of awareness
and also is found on more products than the other two foreign organic labels. The labels with the
lowest degree of perceived usefulness were the three European labels that relate to origin and
authenticity, which seems to be valued less by the consumers than labels related to health,
environment and ethics. All labels except SKO were for the unaware respondents measured to have
perceived usefulness below average. For all labels previous exposure has positive influence on
perceived usefulness.
Perceived trustworthiness gave results similar to perceived usefulness. The same five labels are
reported above average as well as the labels perceived least trustworthy are the same as in the case
of usefulness and the levels are also nearly the same. It is observed that prior awareness is
associated with higher levels of credibility. Overall Danish consumers have high trust on label they
have seen before. SKO also has high credibility for the unaware. This may reflect Danes’ high trust
in the local authorities, since the aiding text states the label is state controlled. However KEY scores
low for the unaware and is likewise administered by the authorities, but it is not indicated on the
label which could explain the contrast. This may well also apply for usefulness, where the same
patterns can be observed. For the unaware FUL, which is also partly public administered, scores
closer to average than KEY – the main difference is the aiding text applied on the label.
5.2 Managerial and policy Implications
The purpose of the present study was to measure consumer response on food labels in Denmark. In
general awareness levels were found reasonably high with the exception of particular the three
traditional European labels that relates to origin and authenticity, but also the German and
Norwegian organic labels were only known to one third of the sample. Consumers’ response to food
labels seemed to be driven by exposure, which suggests that if authorities or companies wish to

28
maintain or improve response to food labels, approaches such as awareness campaigns and visible
labels are feasible strategies in order to improve awareness, which could further impact consumers
perceptions (Carpenter and Larceneux, 2008). Good examples for authorities that wish to promote
labels can be the campaigns orchestrated for SKO, KEY and FUL, which all have achieved high
levels of awareness.
There exist great potential for future development concerning PDO, PGI and TSG. Specifically the
EU authorities should put effort on improving awareness of these. Even though many traditional
agricultural products are imported to Denmark from other European countries and the labels are
provided with aiding texts, Danes are not aware of these labels. The low awareness can be
explained by the lack of motivation for the consumers to assure that they buy a traditional product.
EU should focus on explaining the importance of authenticity, so protection of local and traditional
agricultural products can be a value to the consumer similarly to fair trade and sustainability.
Consequently the consumers would pay more attention on such labels while shopping for groceries.
On the other hand companies could focus on making the labels more visible on the package of their
products, and benefit from the fact the labels are easy to interpret. However this is only likely if it is
possible to capitalize on doing this.
Even though Danes are known for their environmental consciousness, the CSS label was only
measured to have awareness level less than 50%, which is remarkably lower than the related FTR.
The label is present on many fish products and is often explained in detail in supermarkets’ printed
ads. Therefore the low level of awareness is surprising. This might reflect the low consumption of
fish products in Denmark (Z. Pieniak et al., 2010) consumption of fish products as a whole.
Finally the design of the label – colors, symbol and the text used - plays a central role in
communicating the purposed messages. According to literature aiding text can increase
understanding of food labels (Hoogland et al., 2007). As an example in the present study, by
comparing the objective understanding of the organic labels, it is observed that EUB scored
remarkably lower than the others and it was also the only one without explanatory text. Therefore it
is proposed to the EU authorities to add accompanying text to the label with the message that it is
organic. It is also important that the symbol is related to the values associated with the label in the
mind of the consumer. However the results indicate the importance of a symbol is relatively lower
than the importance of text. This is exemplified in the case of FTR that scored high in objective
understanding, even though the symbol has no obviously related meaning.

29
5.3 Limitations and suggestions for further research
The present study has some limitations. The number of unaware respondents for certain labels
proved to be insufficient for robust statistical analysis. This was the case for unaware of SKO, FTR
and the aware of PDO. The results depend on the characteristics of the sample. For this study data
was collected by mean of an online questionnaire that was distributed based on convenience
through online media. This circumstance resulted in the sample being biased towards younger,
higher educated respondents with an overweight of urban population. In order to avoid these
problems the data used in future research should be more extensive. Also the labels were presented
to respondents out of the context in which they normally exist. Actually food labels compete in
visual clutter on the packaging with much other information (Grunert, 2013). Whether they actually
gain attention and any impact on purchase behavior is uncertain. Future studies could address the
issue of attention by observing the actual purchase behavior a consumer has while shopping product
with food labels. Also an experimental design could be used in order to compare the actual
importance the consumer places between the different information found on the packaging.
Another factor that might bias the results of the measured response to food labels is that respondents
may tend to over-report their actual use in order to project a favorable image to others and not feel
embarrassed (Fisher, 1993).
Future research could also involve measuring the differences between responses in different
countries within the European Union. Not only in terms of awareness, but also regarding cultural
differences. For instance a research shows that trustworthiness of Romanians towards food labels is
remarkably low. This is explained by the high levels of skepticism Romanians have towards
authorities (Festilla et al, 2013), while the Danish culture is characterized with high levels of trust in
authorities.
Finally more factors such as gender, age, responsibility for shopping, household size, education,
income, health, dietary quality etc. could be added to the research in future studies.

30
References
Abrams, K. M., Meyers, C. A., & Irani, T. A. (2009). Naturally confused. Consumers’ perceptions
of all-natural and organic pork products. Agriculture and Human Values, 27(3), 365-374.
Alba, J. W. , & Hutchinson, J. W. (2000). Knowledge calibration. What consumers know and what
they think they know. Journal of Consumer Research, 27(2), 123-156.
Ali, J. & Kapoor, S. (2009) Understanding consumers' perspectives on food labelling in India.
International Journal of Consumer Studies, 33, 724-734.
Aprile, M. C., Caputo, V. & Nayga Jr, R. M. (2012) Consumers' valuation of food quality labels.
The case of the European geographic indication and organic farming labels. International
Journal of Consumer Studies, 36, 158-165.
Aygen, F. G. (2012). Turkish consumers' understanding and use of nutrition labels on packaged
food products. International Journal of Business and Social Science, 3(6), 171-183.
Botonaki, A., Polymeros, K., Tsakiridou, E. & Mattas, K. (2006) The role of food quality
certification on consumers' food choices. British Food Journal, 108, 77-90.
Campos, S., Doxey, J., & Hammond, D. (2011). Nutrition labels on pre-packaged foods. A
systematic review. Public Health Nutrition, 14(8), 1496-1506.
Carpenter, M. & Larceneux, F. (2008) Label equity and the effectiveness of values-based labels. An
experiment with two French Protected Geographic Indication labels. International Journal
of Consumer Studies, 32, 499-507.
Cowburn, G., & Stockley, L. (2007). Consumer understanding and use of nutrition labelling. A
systematic review. Public Health Nutrition, 8(1), 21-28.
de Pelsmacker, P., Janssens, W., & Mielants, C. (2005). Consumer values and fair-trade beliefs,
attitudes and buying behaviour. International Review on Public and Non Profit Marketing,
2(2), 50-69.
Drichoutis, A. C., Lazaridis, P., Nayga, R. M., Jr., Kapsokefalou, M., & Chryssochoidis, G. (2008).
A theoretical and empirical investigation of nutritional label use. European Journal of
Health Economics, 9(3), 293-304.
Festila, A., Chrysochou P., & Krystallis, A. (2013) Consumer response to food labels in an
emerging market: The case of Romania. Working paper- MAPP Centre for Research on
Customer Relations in the Food Sector, Department of Business.
Feunekes, G. I., Gortemaker, I. A., Willems, A. A., Lion, R., & van den Kommer, M. (2008). Front-
of-pack nutrition labelling. Testing effectiveness of different nutrition labelling formats
front-of-pack in four European countries. Appetite, 50(1), 57-70.
Gorton, D., Ni Mhurchu, C., Chen, M. H., & Dixon, R. (2009). Nutrition labels. A survey of use,
understanding and preferences among ethnically diverse shoppers in New Zealand. Public
Health Nutrition, 12(9), 1359-1365.

31
Grunert, K. G., Wills, J. M. & Fernández-Celemín, L. (2010) Nutrition knowledge, and use and
understanding of nutrition information on food labels among consumers in the UK. Appetite,
55, 177-189.
Grunert, K. G. (2013). Nutrition labeling. In C. B. (Ed.), Encyclopedia of Human Nutrition (3rd ed.,
Vol. 3, pp. 315-319). Waltham, MA: Academic Press.
Grunert, K. G., & Wills, J. M. (2007). A review of European research on consumer response to
nutrition information on food labels. Journal of Public Health, 15(5), 385-399.
Hall, C. & Osses, F. (2013) A review to inform understanding of the use of food safety messages on
food labels. International Journal of Consumer Studies, 37, 422-432.
Hieke, S., & Taylor, C. R. (2012). A critical review of the literature on nutritional labeling. Journal
of Consumer Affairs, 46(1), 120-156.
Hoogland, C. T., de Boer, J. & Boersema, J. J. (2007) Food and sustainability. Do consumers
recognize, understand and value on-package information on production standards? Appetite,
49, 47-57.
Jacobs, S. A., de Beer, H., & Larney, M. (2010). Adult consumers' understanding and use of
information on food labels. A study among consumers living in the Potchefstroom and
Klerksdorp regions, South Africa. Public Health Nutrition, 14(3), 510-522.
Larceneux, F., Benoit-Moreau, F., & Renaudin, V. (2011). Why might organic labels fail to
influence consumer choices? Marginal labelling and brand equity effects. Journal of
Consumer Policy, 35(1), 85-104.
Mackey, M. A. & Metz, M. (2009) Ease of reading of mandatory information on Canadian food
product labels. International Journal of Consumer Studies, 33, 369-381.
Mackison, D., Wrieden, W. L., & Anderson, A. S. (2010). Validity and reliability testing of a short
questionnaire developed to assess consumers' use, understanding and perception of food
labels. European Journal of Clinical Nutrition, 64(2), 210-217.
Mahé, T. (2010). Are stated preferences confirmed by purchasing behaviours? The case of fair
trade-certified bananas in Switzerland. Journal of Business Ethics, 92(S2), 301-315.
Malcolm, K., Murray, D. & Mackay, L. (2008) How has awareness, comprehension and usage of
GDA labelling evolved? Millward Brown.
Mannell, A., Brevard, P., Nayga, R. Jr., Combris, P., Lee, R., & Gloeckner, J. (2006). French
consumers' use of nutrition labels. Nutrition and Food Science, 36(3), 159-168.
Nayga, R. M. Jr. (2000). Nutritional knowledge, gender, and food label use. Journal of Consumer
Affairs, 34(1), 97-112.
Petrovici, D. A., & Ritson, C. (2006). Factors influencing consumer dietary health preventative
behaviours. BMC Public Health, 6, 222.
Pieniak, Z., Verbeke, W., Olsen, S. O., Hansen, K. B., & Brunsø, K. (2010). Health-related attitudes
as a basis for segmenting European fish consumers. Food Policy, 35(5), 448-455.
Prendergast, G., & Pitt,L. (1996) Packaging, marketing, logistics and the environment: are there
trade-offs?. International Journal of Physical Distribution & Logistics Management, 26(6),
60 – 72.

32
Rettie, R., & Brewer, C.(2000) The verbal and visual components of package design. Journal of
Product & Brand Management, 9(1), 56 – 70.
Satia, J. A., Galanko, J. A., & Neuhouser, M. L. (2005). Food nutrition label use is associated with
demographic, behavioral, and psychosocial factors and dietary intake among African
Americans in North Carolina. Journal of the American Dietetic Association, 105(3), 392-
402.
Silayoi, P., & Speece, M. (2007) The importance of packaging attributes: a conjoint analysis
approach. European Journal of Marketing, 41(11/12), 1495 – 1517.
Sirieix, L., Delanchy, M., Remaud, H., Zepeda, L. & Gurviez, P. (2013) Consumers' perceptions of
individual and combined sustainable food labels. A UK pilot investigation. International
Journal of Consumer Studies, 37, 143-151.
Sung-Yong, K., Nayga, R. M. Jr, & Capps, O. Jr. (2001). Food label use, self-selectivity, and diet
quality. Journal of Consumer Affairs, 35(2), 346-363.
Traill, W. B., Chambers, S. A., & Butler, L. (2012). Attitudinal and demographic determinants of
diet quality and implications for policy targeting. Journal of Human Nutrition and Dietetics,
25(1), 87-94.
van Herpen, E., Seiss, E. & van Trijp, H. C. M. (2012) The role of familiarity in front-of-pack label
evaluation and use. A comparison between the United Kingdom and The Netherlands. Food
Quality and Preference, 26, 22-34.