Embed Size (px)
Citation preview

1
TSX: GCMNovember 15, 2016
Lombardo Paredes Arenas, CEOMike Davies, CFO
The leading high‐grade gold producer in Colombia
Third Quarter 2016 Results

2
TSX: GCMNovember 15, 2016
Forward‐Looking Statements DISCLAIMER
This presentation contains "forward‐looking information", which may include, but is not limited to, statements withrespect to the future financial or operating performance of the Company and its projects, and, specifically, statementsconcerning anticipated growth in annual gold production, reduction of cash costs and AISC, future G&A and capex,interest payments on the senior debt and future purchases and/or redemptions of the senior debt. Often, but notalways, forward‐looking statements can be identified by the use of words such as "plans", "expects", "is expected","budget", "scheduled", "estimates", "forecasts", "intends", "anticipates", or "believes" or variations (includingnegative variations) of such words and phrases, or state that certain actions, events or results "may", "could","would", "might" or "will" be taken, occur or be achieved. Forward‐looking statements involve known and unknownrisks, uncertainties and other factors which may cause the actual results, performance or achievements of GranColombia to be materially different from any future results, performance or achievements expressed or implied by theforward‐looking statements. Factors that could cause actual results to differ materially from those anticipated inthese forward‐looking statements are described under the caption "Risk Factors" in the Company's AnnualInformation Form dated as of March 30, 2016 which is available for view on SEDAR at www.sedar.com. Forward‐looking statements contained herein are made as of the date of this press release and Gran Colombia disclaims, otherthan as required by law, any obligation to update any forward‐looking statements whether as a result of newinformation, results, future events, circumstances, or if management's estimates or opinions should change, orotherwise. There can be no assurance that forward‐looking statements will prove to be accurate, as actual resultsand future events could differ materially from those anticipated in such statements. Accordingly, the reader iscautioned not to place undue reliance on forward‐looking statements.

3
TSX: GCMNovember 15, 2016
RESULTS Highlights
Mine development at Sandra K – July 17, 2014
3nd Quarter Nine Months
2016 2015 2016 2015
39,111 34,339 Gold production (ozs) 108,829 86,807
39,017 35,501 Gold sales (ozs) 107,605 87,356
$1,296 $1,090 Realized gold price ($/oz) $1,225 $1,142
$728 $644 Cash cost ($/oz) $699 $737
$884 $789 AISC ($/oz) $832 $867
$51.2M $39.3M Revenue $133.7M $101.2M
$19.7M $13.3M Adjusted EBITDA (1) $49.6M $28.4M
$8.1M $6.7M Net income $19.0M $6.4M
$0.03 $0.28 Per share $0.12 $0.27
$8.1M $2.0M Adjusted net income (1) $12.2M $1.8M
$0.03 $0.08 Per share $0.08 $0.08
(1) Refer to Company’s MD&A for computation

4
TSX: GCMNovember 15, 2016
RESULTS
Segovia YTD 2016 up 32% over YTD 2015….increased daily tonnes processed in 2016 by 40% to an average of 764 tpd with
head grades averaging 13.7 g/t…2016 production aided by improved recovery of Company‐operated gold frommill circuit…produced 11,173 ozs in October 2016 bringing 10 months total to 102,608 ozs.
Marmato YTD 2016 down 2% vs YTD 2015… increased daily tonnes processed in 2016 by ~13% to an average of 924 tpd;
head grades and mill recovery each tracking ~8% and 5%, respectively, below YTD 2015 levels…produced 1,915ozs in October 2016 bringing 10 months total to 19,309 ozs.
Production
3rd Quarter Nine Months
2016 2015 2016 2015
Gold (ozs)
Segovia
7,146 4,920 Company-operated 20,197 10,351
26,406 23,028 Contract miners 71,238 58,675
33,552 27,948 91,435 69,026
5,559 6,391 Marmato 17,394 17,781
39,111 34,339 Total Company 108,829 86,807
36,942 43,019 Silver (ozs) 118,976 101,313

5
TSX: GCMNovember 15, 2016
Over the last 8 quarters, GCM has realized growth in its Trailing 4 Quarters total gold production driven by growth from the Segovia Operations. Marmato has been steady.
Increasing 2016 annual gold production guidance to 144,000‐150,000 ounces.
Total Gold ProductionRESULTSAISC (‐23%
)
000’s ozs
‐
20
40
60
80
100
120
140
Q1'14 Q2'14 Q3'14 Q4'14 Q1'15 Q2'15 Q3'15 Q4'15 Q1'16 Q2'16 Q3'16
Qtr ‐ Marmato
Qtr ‐ Segovia
Trailing 4 Qtr ‐ Segovia
Trailing 4 Qtr ‐ Total GCM

6
TSX: GCMNovember 15, 2016
Q3‐2016 total cash cost for the Company of $728/oz brings the Nine Months 2016 average to $699/oz, down 5% fromsame period in 2015, benefitting from:
Principal source of Gran Colombia’s gold production is the high‐grade resources at Segovia where the Company hascut costs and optimized its operating cost structure in the last couple of years; fixed costs on a per ounce havedecreased as a result of increased production in first nine months of 2016.
Devaluation of the Colombian peso in H2‐2015 positively impacted US$ equivalent costs this year vs last year.
Marmato cash cost/oz for Q2‐Q3 2016 adversely impacted by lower grades and mill recovery. Spending is under control.
Total Cash Cost Per OunceRESULTS
117
89 $500
$700
$900
$1,100
$1,300
Q1 Q2 Q3 Q4 Q1 Q2 Q3 Q4 Q1 Q2 Q3
Segovia
Q1 Q2 Q3 Q4 Q1 Q2 Q3 Q4 Q1 Q2 Q3
Marmato
$1,094
15% of YTD 2016 gold sales
2014 20142015 2015
US$/oz sold
$672
2016 2016
85% of YTD 2016 gold sales

7
TSX: GCMNovember 15, 2016
Reductions in total cash costs and G&A have been the key to success in reducing AISC to the current level.
Anticipate 2016 full year average AISC/oz of $825 to $850 based on YTD AISC average of $832/oz.
All‐In Sustaining Costs
*All‐In Sustaining cash cost per ounce includes total cash costs per ounce and adds the sum of G&A, sustaining capital and certain E&E costs and provision
for environmental discharge fees
RESULTSAISC (‐23%
)
US$/oz sold
$500
$700
$900
$1,100
$1,300
$1,500
Q1'14 Q2'14 Q3'14 Q4'14 Q1'15 Q2'15 Q3'15 Q4'15 Q1'16 Q2'16 Q3'16
G&A,SustainingCapex and Other
Total Cash Cost
$884

8
TSX: GCMNovember 15, 2016
Gran Colombia’s AISC is well positioned amongst industry peers.
All‐In Sustaining Costs (1)
(1) Nine months 2016 reported results per Q3‐2016 filings; AISC is a common performance measure but does not have any standardized meaning within the industry and therefore its computations may vary between companies.
RESULTSAISC (‐23%
)
US$/oz sold
$0 $200 $400 $600 $800 $1,000 $1,200
IamGold
Alamos Gold
(TAHOE) Lakeshore Gold
Kin Ross Gold
Argonaut Gold
Kirkland Lake Gold
Yamana Gold
Goldcorp
Gran Colombia Gold
Centerra Gold
Timmins Gold
Guyana Goldfields
Barrick Gold
New Gold
Cash Cost AISC

9
TSX: GCMNovember 15, 2016
Improved production together with reductions in total cash costs and G&A have been the key to our success in increasing quarterly EBITDA since Q4‐2014.
Adjusted EBITDA (1)RESULTSAISC (‐23%
)
US$M
$‐
$10
$20
$30
$40
$50
$60
Q1'14 Q2'14 Q3'14 Q4'14 Q1'15 Q2'15 Q3'15 Q4'15 Q1'16 Q2'16 Q3'16
Adjusted Quarterly EBITDA
Trailing 4 Quarters Total
(1) Refer to Company’s MD&A for computation

10
TSX: GCMNovember 15, 2016
Excess Cash FlowRESULTS
* As defined in Indentures (available on the Company’s web site) for the 2018 and 2020 Debentures
In US$000’s Q32016
Nine Months2016
Adjusted EBITDA as reported $19,712 $49,597
Repayment of local long‐term debt and increase in cash in trust for debt service (411) (1,241)
Interest paid, net of finance income (3,354) (7,908)
Debt restructuring costs paid ‐ (1,714)
Capital, development and exploration expenditures (4,277) (10,147)
Payments for Marmato titles and compensation agreements (389) (1,030)
Equity, wealth and income tax payments, net of income tax refund (4,349) (8,972)
Frontino health plan payments (580) (994)
Segovia environmental discharge fees paid (500) (1,192)
Changes in non‐cash working capital and CIIGSA sale proceeds (5,740) (13,988)
Excess Cash Flow * $112 $2,411
2018 Debentures sinking fund deposits (25%) $28 $603
2020 Debentures sinking fund deposits (75%) $84 $1,808
11
TSX: GCMNovember 15, 2016
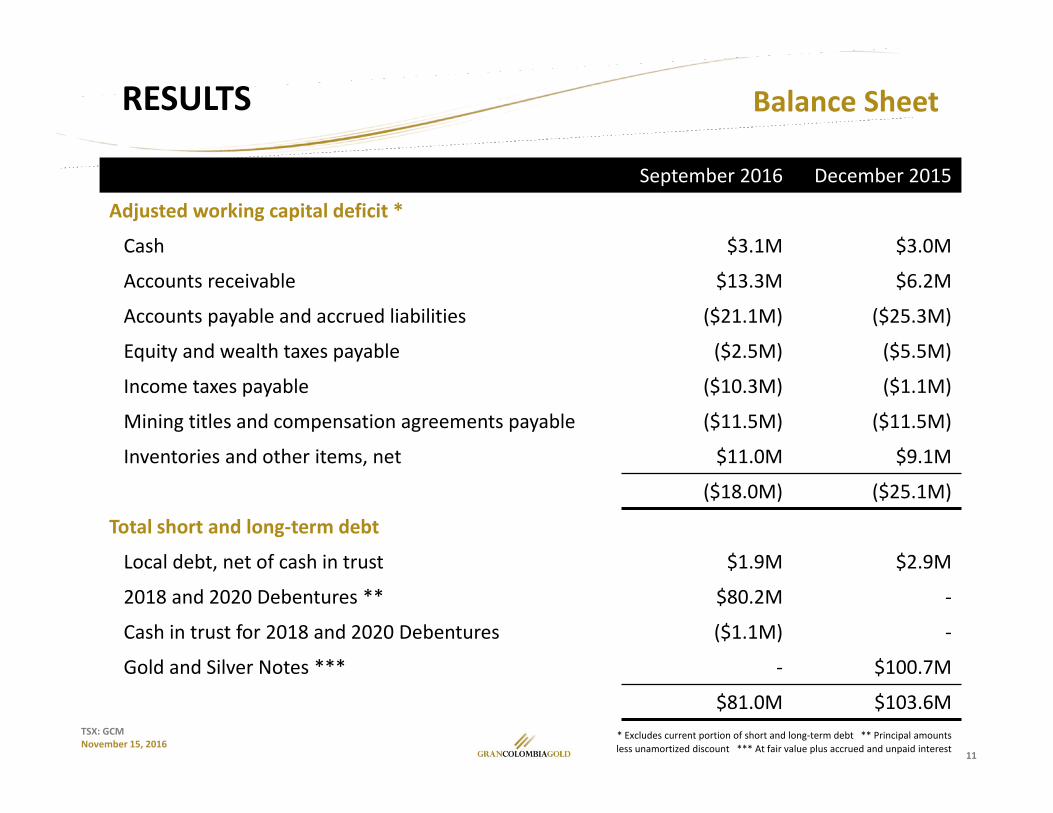
Balance SheetRESULTS
* Excludes current portion of short and long‐term debt ** Principal amounts less unamortized discount *** At fair value plus accrued and unpaid interest
September 2016 December 2015
Adjusted working capital deficit *
Cash $3.1M $3.0M
Accounts receivable $13.3M $6.2M
Accounts payable and accrued liabilities ($21.1M) ($25.3M)
Equity and wealth taxes payable ($2.5M) ($5.5M)
Income taxes payable ($10.3M) ($1.1M)
Mining titles and compensation agreements payable ($11.5M) ($11.5M)
Inventories and other items, net $11.0M $9.1M
($18.0M) ($25.1M)
Total short and long‐term debt
Local debt, net of cash in trust $1.9M $2.9M
2018 and 2020 Debentures ** $80.2M ‐
Cash in trust for 2018 and 2020 Debentures ($1.1M) ‐
Gold and Silver Notes *** ‐ $100.7M
$81.0M $103.6M

12
TSX: GCMNovember 15, 2016
RESULTS
TSX Symbol Exercise Price
12‐31‐2015 01‐20‐2016Exchange
Date
09‐30‐2016 FullyDilutedShares
Common shares GCM 23.7M 113.6M 277.7M 277.7M
2018 Debentures * GCM.DB.U US$0.13 N/A ** $71.2M $49.7M 382.6M
2020 Debentures * GCM.DB.V US$0.13 N/A *** $104.0M $102.5M 788.1M
1,448.4M
Warrants GCM.WT.AUnlisted
CA$3.25CA$18.75
4.2M1.0M
4.2M1.0M
4.2M1.0M
Options CA$0.17 to CA$18.25 0.9M 0.9M 12.6M
* Amounts shown above for the Senior Convertible Debentures are at Face Value.** Replaced the US$78.6M Silver Notes due 2018.*** Replaced the US$100M Gold Notes due 2017.
Capital Structure
Gran Colombia launched Normal Course Issuer Bids on July 21, 2016 to repurchase the 2018 and 2020 Debentures on the open market for cancellation.
To date, Gran Colombia has repurchased and cancelled a total of $1.6M principal amount of debentures, reducing its fully diluted shares by 12.5M.

13
TSX: GCMNovember 15, 2016
2016 OUTLOOK
Priorities1. Monthly interest payments on 2018 and 2020 Debentures.2. Continue implementation of optimized mine plan at Segovia:
– Primary focus on development and mechanization at Providencia;– Secondary focus on development and mechanization at El Silencio; and,– 10,000m drilling program at Segovia to be completed by end of year.
3. Improve balance sheet by reducing the working capital deficit.4. Excess free cash flow sinking funds for 2018/2020 Debentures NCIBs.
2016 Annual Targets
Current Guidance Nine Months 2016 Actual
Trailing 12 Monthsas of Q3‐2016
Gold production (ozs) 144,000 – 150,000 108,829 (1) 138,879
Cash cost/oz sold $700 ‐ $720 $699 $700
AISC/oz sold $825 ‐ $850 $832 $836
(1) Actual = 121,917 ozs at end of October 2016
Improving Guidance

14
TSX: GCMNovember 15, 2016
For Further Information, Contact: Mike Davies
Chief Financial Officer(416) 360‐4653
Town of Segovia