Embed Size (px)
Citation preview

Third-quarter results 2021

Disclaimer
This presentation contains forward-looking statements that reflect management’s current views with
respect to certain future events and potential financial performance. Although Nordea believes that the
expectations reflected in such forward-looking statements are reasonable, no assurance can be given
that such expectations will prove to have been correct. Accordingly, results could differ materially from
those set out in the forward-looking statements as a result of various factors.
Important factors that may cause such a difference for Nordea include, but are not limited to: (i) the
macroeconomic development, (ii) change in the competitive climate, (iii) change in the regulatory
environment and other government actions and (iv) change in interest rate and foreign exchange rate
levels.
This presentation does not imply that Nordea has undertaken to revise these forward-looking statements,
beyond what is required by applicable law or applicable stock exchange regulations if and when
circumstances arise that will lead to changes compared to the date when these statements were
provided.
2

Executive summary
• Continued strong growth in customer business volumes across Nordics
➢ Mortgage volumes up 6% y/y, SME lending up 9% y/y and assets under management up 21% y/y to all-time high of EUR 393bn
• Strong result, supported by quality income growth and good cost management
➢ Net interest income up 7%, net fee and commission income up 19% and net fair value result down 13%
➢ Operating profit up 17%, despite more challenging financial markets
• Improved cost-to-income ratio* of 49%, with income growth delivered under continued cost discipline
➢ Full-year 2021 cost outlook unchanged at around EUR 4.6bn
• Continued strong credit quality – management buffer unchanged
➢ Net loan losses and similar net result amounting to reversal of EUR 22m or 3bp during quarter
• Return on equity* at 10.8% and earnings per share EUR 0.25
• Unpaid dividends of EUR 0.72 per share distributed to shareholders and share buy-back of up to EUR 2bn initiated
➢ CET1 ratio down to 16.9% due to capital deduction associated with buy-back – 6.7pp above regulatory requirement
3 * With amortised resolution fees

Group quarterly results Q3 2021
* Includes fair value adjustments to loans held at fair value in Nordea Kredit
** With amortised resolution fees
4
Income statement and key ratios
EURmQ321 Q320 Q3/Q3 Q221 Q3/Q2
Net interest income 1,226 1,146 7 % 1,232 0 %
Net fee and commission income 870 729 19 % 878 -1 %
Net fair value result 224 257 -13 % 278 -19 %
Other income 24 23 4 % 30 -20 %
Total operating income 2,344 2,155 9 % 2,418 -3 %
Total operating expenses excl. res. fee -1,098 -1,089 1 % -1,131 -3 %
Total operating expenses -1,098 -1,089 1 % -1,131 -3 %
Profit before loan losses 1,246 1,066 17 % 1,287 -3 %
Net loan losses and similar net result* 22 19 51
Operating profit 1,268 1,085 17 % 1,338 -5 %
Cost-to-income ratio**, % 49 53 49
Return on equity**, % 10.8 10.1 11.4
Diluted earnings per share, EUR 0.25 0.21 0.25

5
Net interest income – continued strong growth in customer business volumes
Quarter-over-quarter bridge, EURm
Year-over-year bridge, EURm
• Net interest income up 7% (up 5% excl. Nordea
Finance Equipment)
• Continued strong growth in business volumes
across Nordics
• Mortgage volumes up 6% and lending to SMEs up 9%
(up 5% excl. Nordea Finance Equipment)
• Margins supported by lower funding costs compared
with Q3 2020
• Mortgage margin pressure in Norway and Sweden
compared with Q2 2021, partly offset by higher
deposit margins in Denmark
Comments
40
4827 19
Q321VolumesQ320 Margins Other FX
0
Day count
1,146
1,226
+7%
9 9
7
11 12
VolumesQ221 FXMargins Other Day count Q321
1,232
1,226
0%

6
Net fee and commission income – further significant growth in savings fee income
Year-over-year bridge, EURm
Quarter-over-quarter bridge, EURm
• Net fee and commission income up 19%
• Strong savings fee income: up 25%, driven by strong
net inflows within all channels
• Continued recovery in cards income
Comments
Savings and investment net commission income, EURm
106
Q320
8
Lending Other
10 7
FX Q321Pay. &
cards
Brok. &
advisory
Asset mgmt.
19
729
8709
+19%
40 37
1517878
Asset mgmt.Q221 Brok. &
advisory
Lending
870
Pay. &
cards
5
Other FX
4
Q321
-1%
Q321
493
563
617
552
Q221Q320 Q420 Q121
613+24%

Net fair value result – continued high levels of activity in customer areas
Net fair value result, EURm
• Continued high activity in customer areas, supported
by FX and equity trading
• Lower trading result driven by weaker markets
• Treasury supported by strong investment valuations
Comments
7
139176
216 213185
71
46
134
33
21
47
20
32224
Q121 Q321Q320
-5
18
Q420 Q221
370
257
217
278
-13%
Customer areas*
Market-making operations
Treasury & other**
* Excludes fair value adjustments to loans held at fair value in Nordea Kredit
** Includes valuation adjustments and FX

8
Costs – continued cost discipline
Year-over-year bridge, EURm
Quarter-over-quarter bridge, EURm
Comments
Outlook
• Full-year 2021 costs expected to be around EUR
4.6bn, as previously guided
• Prime focus is, and will remain, on costs relative to
income
• Underlying costs down, in line with plan
• Staff costs unchanged, adjusted for inclusion of
Nordea Finance Equipment and exchange rate
effects
• Lower VAT refund than in Q3 2020
12 11
10
Underlying costs FXQ320 NFE Q321
1,089
1,098
+1%
28
Q221
5
Underlying costs FX Q321
1,098
1,131
-3%

Q320 Q420 Q121 Q221
9
Comments
• Net loan losses and similar net result amounting to net
reversal of EUR 22m (3bp)
• Reversals of modelled collective provisions due to
improved credit quality
• Management judgement buffer kept at EUR 610m
• Stage 3 loans down to 1.36% from 1.41% in Q2
Stage 3 loans and PD of total loans, %
Net loan losses and similar net result – continued strong credit quality
Net loan losses and similar net result Q321, EURm
22
4
-22
-26
Individual
provisions
and write-offs
-18
Net loan lossesModelled
collective
provisions
Nordea Kredit
fair value adj.
Total
0.50
0.55
0.60
0.65
0.70
0.0
0.5
1.0
1.5
2.0
Q121 Q221 Q321
Stage 3 loans Avg. probability of default (PD) of performing loans
Stage 3 loans, % Avg. PD
Outlook
• Net loan losses in 2021 expected to be significantly
below 2020 level

Q321
excl.
buy-back
• CET1 capital ratio 16.9%, 6.7 percentage points
above regulatory requirement*
• CET1 capital down EUR 1.7bn following buy-back
approval; decrease partly offset by profit generation net
of dividend accrual
• Risk exposure amount at EUR 153bn – credit quality
solid
• Capacity to support customers and distribute capital
• Capital distributions following lifting of restrictions
• Remaining 2019-20 dividends of EUR 0.72 per share
distributed in October 2021
• Share buy-back approval received from European
Central Bank (ECB); buy-back of up to EUR 2bn
announced
• Follow-up buy-back programme planned for 2022,
subject to separate ECB approval
REA development, EURbn
Comments
10
Capital – capital position strong and share buy-back programme initiated
*As of Q3 2021, 0.1 percentage point of the CET1 buffer has been used to fulfil the AT1/Tier 2 capital requirement
CET1 capital ratio development, %
0.7 0.1 0.1
<2.016.918.0
Q221 Profit
10.2
RequirementBuy-back
deduction
Volumes,
incl.
deriv.
Dividend
accrual
Credit
quality
-0.1
Other
18.2
-0.5
-1.3
Q321
Capital policy CET1 requirement
152
Q320 Q321Q420 Q121 Q221
151
153
155
154

11
Personal Banking – income lifted by strong savings and mortgage performance
Total income, EURm
Lending*, EURbn
• Total income up 10%
• Continued strong mortgage activity across countries:
volumes up 6%
• Mortgage margin pressure partly offset by improved deposit
margins
• Strong savings and investment activity; over half of net sales
in Sustainable Choice products
• Improvement in cost-to-income ratio, now 50%
* Excluding FX effects
** With amortised resolution fees
Comments
Cost-to-income ratio**, %
170
Q320 Q420 Q121 Q221 Q321
161163
165
167+5%
278 291 298 317 332
543 535 561569 573
919
1416
Q320
22
Q420
848
19
Q121
43
Q221 Q321
837878
929
+10%
Net interest income Net fee and commission income Net fair value result and other
Q321
50
Q320 Q420 Q121 Q221
54 54
52
49
-4pp

12
Business Banking – strong lending volume development
Total income, EURm
Lending*, EURbn
• Strong quarter with continued high business activity
• Lending volumes up 9% (5% excl. Nordea Finance Equipment) –
strong growth in Norway and Sweden
• Broad-based growth in net fee and commission income, with
increases across product lines
• ESG offering enhanced through introduction of green
corporate loans in Finland and Sweden in cooperation with
European Investment Fund
• Improvement in cost-to-income ratio, now 47%
Comments
Cost-to-income ratio**, %
57 75 81 83 76
134158 164 157 164
352384 395 407 397
Q320
543
Q221Q420 Q321Q121
617 640 647 637
+17%
Net fair value result and otherNet interest income Net fee and commission income
Q320
51
Q420 Q121 Q221 Q321
4547
48
44
-4pp
44 4
493
Q320
9089
Q121***Q420***
91
Q221***
93
Q321***
88
94 9597
+9%
* Excluding FX effects
** With amortised resolution fees
*** Acquisition of SG Finans (now Nordea Finance Equipment) contributed EUR 4bn

13
Large Corporates & Institutions – stable performance amid lower activity and volatility
Total income, EURm
Lending*, EURbn
• Total income down 8%
• Largely stable NII and NCI with high customer activity
• Lower NFV due to lower activity and volatility
• #1 position for Nordic sustainable bonds
• Strict capital discipline and efficient business selection
• Economic capital down 13%
• Cost-to-income ratio 48% and return on capital at risk 12%
Comments
Return on capital at risk**, %
* Excluding repurchase agreements
** With amortised resolution fees
1311
19
16
12
Q321Q420Q320 Q121 Q221
44
Q420Q320 Q121 Q221
46
Q321
4645
43
-7%
133 101
245
112 97
117116
137
163112
225226
238
230
226
Q121Q320 Q420 Q221 Q321
475443
620
505
435
-8%
Net fee and commission incomeNet interest income Net fair value result and other

326
Asset & Wealth Management – record volumes and significant net inflows via all channels
Total income, EURm
Assets under management, EURbn, and net flows, % Cost-to-income ratio*, %
• Total income up 28%
• AuM up 21% to all-time high of EUR 393bn
• Net inflow of EUR 4.1bn (annualised growth 4%), with all channels
contributing positively
• Continued high demand for ESG products: annualised growth at 9%
• Improvement in cost-to-income ratio, now 47% (impacted by
higher provisions for variable pay driven by year-to-date
performance)
* With amortised resolution fees
Comments
14
47
Q320
51
Q420 Q121 Q321Q221
52
42 41
-4pp
28 38 30 29
205 229236 245 270
Q320
19
1617
19
Q121Q420
294
19
Q221
293 19
Q321
249265
318
+28%
Net fair value result and otherNet interest income Net fee and commission income
325351
369 384 393
Q221Q320
6%
10%
Q420
2%
Q121
3% 4%
Q321
AuM Annualised net flow as % of AuM
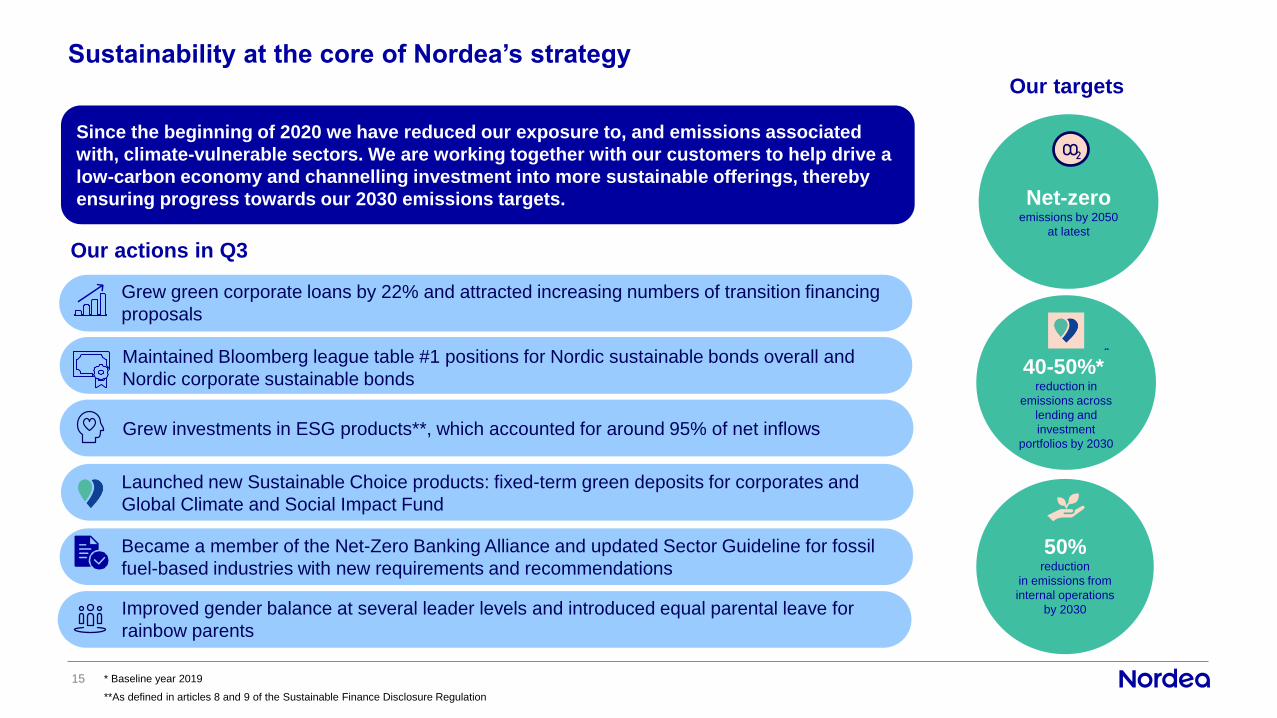
Sustainability at the core of Nordea’s strategy
15 * Baseline year 2019
Grew investments in ESG products**, which accounted for around 95% of net inflows
Our actions in Q3
Our targets
Grew green corporate loans by 22% and attracted increasing numbers of transition financing
proposals
Maintained Bloomberg league table #1 positions for Nordic sustainable bonds overall and
Nordic corporate sustainable bonds
Net-zeroemissions by 2050
at latest
CO2
40-50%**
reduction in
emissions across
lending and
investment
portfolios by 2030
50%reduction
in emissions from
internal operations
by 2030
Became a member of the Net-Zero Banking Alliance and updated Sector Guideline for fossil
fuel-based industries with new requirements and recommendations
Since the beginning of 2020 we have reduced our exposure to, and emissions associated
with, climate-vulnerable sectors. We are working together with our customers to help drive a
low-carbon economy and channelling investment into more sustainable offerings, thereby
ensuring progress towards our 2030 emissions targets.
Launched new Sustainable Choice products: fixed-term green deposits for corporates and
Global Climate and Social Impact Fund
**As defined in articles 8 and 9 of the Sustainable Finance Disclosure Regulation
Improved gender balance at several leader levels and introduced equal parental leave for
rainbow parents

We are committed to delivering on our 2022 financial targets
Capital policy
150-200bp
management buffer
above regulatory CET1 requirement
16
Dividend policy
60-70% payout of distributable
profits to shareholders
Excess capital intended to be distributed
to shareholders through buy-backs
Cost-to-income ratio
50%
Return on equity
>10%


Appendix

20% 25% 23% 31% 1%
Nordic societies have well-structured social safety nets, strong fiscal positions and effective legal systems
42%
8%
50%Total portfolio
EUR 319bn*
Loan book – well diversified with strong credit quality
Portfolio well diversified
across countries and
segments
Updated analysis of COVID-19
impact by segment**
Five segments with 1% of
total exposures still
significantly affected
Corporates Consumer Mortgages
* Excluding reverse repos and securities borrowing
** In Q3 2021 Maritime was split into Shipping, Ship building and Maritime services. In addition, Retail Trade and Shipping are now assessed as “partially affected” rather than “significantly affected”.
Construction is now assessed to be “partially affected” rather than “not significantly affected” and Consumer lending is now assessed as “not significantly affected” rather than “partially affected”.
EUR 256bn
80%
EUR 59bn
19%
EUR 4bn, 1% Significantly affected
Partially affected
Not significantly
affected
Maritime services
0.8%
Agriculture
Other corporates
Ship building
0.4%
Consumer durables
Mining & supporting activities
8.1%
Air transportation
2.7%
Oil, gas & offshore
Media & entertainment
Accomodation & leisure
0.9%
0.1%
Capital goods
0.3%
Retail trade
5.7%
Wholesale trade
Mortgages
Shipping
Construction
Residential real estate
50.0%
Consumer lending
Commercial real estate
0.1%
0.1%
0.1%
Land transportation
0.5%
0.5%
1.1%
1.6%
0.5%
2.5%
8.6%
13.7%
Materials
1.9%
19
Lending by country

Comments
20
Stage 2 and 3 loans at amortised cost, EURm
Further decrease in impaired lending
Coverage ratio, %
39
43 4342 42
4445
3.63.7
3.43.5
3.4 3.43.2
2.5
3.0
3.5
4.0
4.5
5.0
30
35
40
45
Q420Q120 Q220 Q320 Q121 Q321Q221
Stage 3 Stage 2
Stage 2Stage 3
• Low levels of impaired (stage 3) loans further
reduced due to economic upturn and active credit
risk management
• Coverage ratio for impaired loans up to 45%
• Stage 2 loans at low levels (5% of total lending), with
small increase due to technical reasons (e.g. annual
calibration of PDs)
4,219 3,979 4,023 3,750 3,628
13,576 13,840 14,38312,843 13,154
Q320 Q420 Q321Q121 Q221
Stage 2 Stage 3

77
61
89
96
60
47
66
44
51
38
51
41
62
40
64
41
4745
15
44
77
52
89
97
61
4750
42
46
19
63
52
64
39
56
52
46 46
15
45
Maritime
services
Acc.
&
leisure
Air
transp.
Ship
building
Oil,
gas &
offshore
Consumer
durables
Media &
entert.
Capital
goods
Land
transp.
Mining Wholesale
trade
Comm.
real
estate
Retail
trade
Shipping
Construction
Residential
real
estate
Other
corporates
Consumer
lending Mortgages
Nordea
Group
Coverage ratios – well provisioned for potential losses
21
Coverage ratios
Non-significantly
affected segments
Avg. 37%
Partially affected
segments
Avg. 47%
Significantly
affected segments
Avg. 62%
Average Q3 2021 coverage ratio Q2 2021 Q3 2021

Nordic economic development – resilient economies back on track
Housing prices Nordics – among best performing countries during COVID-19
GDP forecasts, %, y/y (Nordea Markets)
22
• Danish GDP up 2.8% q/q in Q2. Unemployment down to 3.6% in
August. House prices up 13.4% y/y and apartment prices up
13.8% y/y in August.
• Finnish GDP up 2.1% q/q in Q2. Unemployment down to 7.6% in
August and housing prices up 4.4% y/y in August.
• Norwegian mainland GDP up 1.4% q/q in Q2. Unemployment
down to 2.6% in September and housing prices up 8.0% y/y in
September.
• Swedish GDP up 0.9% q/q in Q2. Unemployment down to
7.5% in September and housing prices up 13.4% y/y in August.
Unemployment rate
Country 2020 2021E 2022E
Denmark -2.1 3.3 2.7
Finland -2.9 3.5 3.0
Norway -2.5 3.9 3.9
Sweden -3.0 4.5 3.5