Embed Size (px)
Citation preview

2017 First Quarter & Project Update
TSX, NYSE MKT: NG | novagold.com | April 4, 2017

CONFERENCE CALL ATTENDEES
2
o Introduction
Mélanie Hennessy (Vice President Corporate Communications)
o Corporate Update
Greg Lang (President & Chief Executive Officer)
o First Quarter Financials & 2017 Budget
David Ottewell (Vice President & Chief Financial Officer)
o Closing Remarks
Greg Lang (President & Chief Executive Officer)
o Question & Answer Session
Greg Lang & David Ottewell

CAUTIONARY STATEMENTS
3 All dollar amounts quoted in this report are in U.S. currency unless otherwise noted.
REGARDING FORWARD-LOOKING STATEMENTS
This presentation includes certain “forward-looking statements” within the meaning of applicable securities laws, including the United States Private Securities Litigation Reform Act of 1995. All statements, other than statements of historical fact, included herein including, without limitation, the timing of permitting and potential development of Donlin Gold, statements as to the potential exploration upside at Donlin Gold, statements relating to NOVAGOLD’s future operating or financial performance, outlook, the anticipated preparation and timing of an updated feasibility study on Donlin Gold, and the potential sale of all or part of NOVAGOLD’s interest in Galore Creek are forward-looking statements. Forward-looking statements are frequently, but not always, identified by words such as “plans”, “expects”, “anticipates”, “believes”, “intends”, “estimates”, “potential”, “possible” and similar expressions, or statements that events, conditions or results “will”, “may”, “could”, or “should” occur or be achieved. These forward-looking statements set forth in the slides may also include statements regarding perceived merit of properties; exploration results and budgets; mineral reserves and resource estimates; work programs; capital expenditures; timelines; strategic plans; completion of transactions; market price of precious or base metals; or other statements that are not statements of fact. Forward-looking statements involve various risks and uncertainties. There can be no assurance that such statements will prove to be accurate, and actual results and future events could differ materially from those anticipated in such statements. Important factors that could cause actual results to differ materially from our expectations include the uncertainties involving the need for additional financing to explore and develop properties and availability of financing in the debt and capital markets; uncertainties involved in the interpretation of drilling results and geological tests and the estimation of reserves and resources; the need for continued cooperation between NOVAGOLD and Barrick Gold in the exploration and development of the Donlin Gold property; the need for continued cooperation between NOVAGOLD and Teck Resources Ltd. in the exploration and development of the Galore Creek property; the need for cooperation of government agencies and native groups in the development and operation of properties; the need to obtain permits and governmental approvals; risks of construction and mining projects such as accidents, equipment breakdowns, bad weather, non-compliance with environmental and permit requirements, unanticipated variation in geological structures, ore grades or recovery rates; unexpected cost increases; fluctuations in metal prices and currency exchange rates; and other risks and uncertainties disclosed in reports and documents filed by NOVAGOLD with applicable securities regulatory authorities from time to time. The forward-looking statements made herein reflect our beliefs, opinions and projections on the date the statements are made. Except as required by law, we assume no obligation to update the forward-looking statements of beliefs, opinions, projections, or other factors, should they change.
REGARDING SCIENTIFIC AND TECHNICAL INFORMATION
Unless otherwise indicated, all resource and reserve estimates included in this presentation have been prepared in accordance with Canadian National Instrument 43-101 Standards of Disclosure for Mineral Projects (“NI 43-101”) and the Canadian Institute of Mining, Metallurgy and Petroleum (CIM)—CIM Definition Standards on Mineral Resources and Mineral Reserves, adopted by the CIM Council, as amended (“CIM Definition Standards”). NI 43-101 is a rule developed by the Canadian Securities Administrators which establishes standards for all public disclosure an issuer makes of scientific and technical information concerning mineral projects. Canadian standards, including NI 43-101, differ significantly from the requirements of the United States Securities and Exchange Commission ("SEC”), and resource and reserve information contained herein may not be comparable to similar information disclosed by U.S. companies. In particular, and without limiting the generality of the foregoing, the term "resource” does not equate to the term "reserves”. Under U.S. standards, mineralization may not be classified as a "reserve” unless the determination has been made that the mineralization could be economically and legally produced or extracted at the time the reserve determination is made. The SEC's disclosure standards normally do not permit the inclusion of information concerning "measured mineral resources”, "indicated mineral resources” or "inferred mineral resources” or other descriptions of the amount of mineralization in mineral deposits that do not constitute "reserves” by U.S. standards in documents filed with the SEC. Investors are cautioned not to assume that all or any part of “measured” or “indicated resources” will ever be converted into “reserves”. Investors should also understand that "inferred mineral resources” have a great amount of uncertainty as to their existence and great uncertainty as to their economic and legal feasibility. It cannot be assumed that all or any part of the “inferred resources” will ever be upgraded to “indicated resource”, “measured resource”, or “mineral reserve” status. Under Canadian rules, estimated "inferred mineral resources” may not form the basis of feasibility or pre-feasibility studies except in rare cases. Investors are cautioned not to assume that all or any part of an "inferred mineral resource” exists or is economically or legally mineable. Disclosure of "contained ounces” in a resource is permitted disclosure under Canadian regulations; however, the SEC normally only permits issuers to report mineralization that does not constitute "reserves” by SEC standards as in-place tonnage and grade without reference to unit measures. The requirements of NI 43-101 for identification of "reserves” are also not the same as those of the SEC, and reserves reported by NOVAGOLD in compliance with NI 43-101 may not qualify as "reserves” under SEC standards. Accordingly, information concerning mineral deposits set forth herein may not be comparable with information made public by companies that report in accordance with U.S. standards.

A DEVELOPMENT-STAGE COMPANY WITH TWO PROJECTS OF EXCEPTIONAL SCALE, QUALITY, AND JURISDICTIONAL SAFETY
WHAT MAKES NOVAGOLD UNIQUE?
DONLIN GOLD
50/50 with Barrick
Poised to be one of the largest gold producers in the world
Location: Southwest Alaska
GALORE CREEK
50/50 with Teck
Potential to be one of the largest and lowest cost copper mines in Canada
Location: Northern British Columbia
4
FOCUSED ON OUR LONG-TERM STRATEGY OF DELIVERING SHAREHOLDER VALUE
FIRST QUARTER ACTIVITY HIGHLIGHTS
5
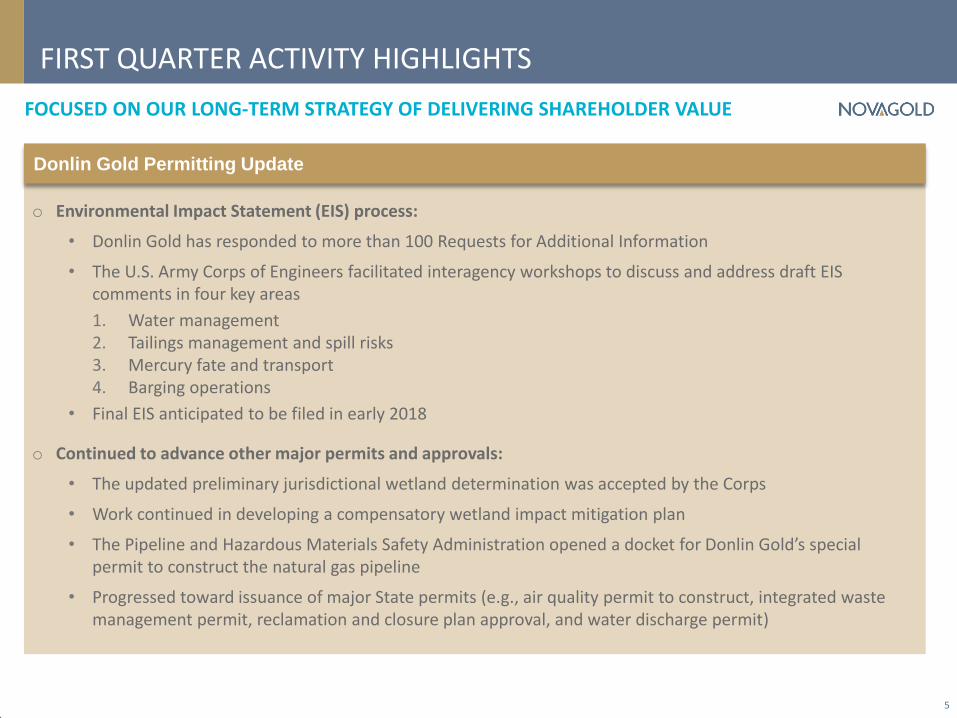
o Environmental Impact Statement (EIS) process:
• Donlin Gold has responded to more than 100 Requests for Additional Information
• The U.S. Army Corps of Engineers facilitated interagency workshops to discuss and address draft EIS comments in four key areas
1. Water management 2. Tailings management and spill risks 3. Mercury fate and transport 4. Barging operations
• Final EIS anticipated to be filed in early 2018
o Continued to advance other major permits and approvals:
• The updated preliminary jurisdictional wetland determination was accepted by the Corps
• Work continued in developing a compensatory wetland impact mitigation plan
• The Pipeline and Hazardous Materials Safety Administration opened a docket for Donlin Gold’s special permit to construct the natural gas pipeline
• Progressed toward issuance of major State permits (e.g., air quality permit to construct, integrated waste management permit, reclamation and closure plan approval, and water discharge permit)
Donlin Gold Permitting Update

FOCUSED ON OUR LONG-TERM STRATEGY OF DELIVERING SHAREHOLDER VALUE
FIRST QUARTER ACTIVITY HIGHLIGHTS CONT’D
6
Community Engagement
o Continued extensive outreach efforts with local stakeholders
• Hosted Donlin Gold village meetings and tribal gathering updates in the Yukon-Kuskokwim (Y-K) region
• Sponsored various key sporting events and a Safety Expo in the Y-K region
• Met with the Lower Kuskokwim School District counsellors and participated in the Career & Internship Fair in Bethel
• Assisted with funding of equipment for the “Arrive Alive” program
• Met with Alaska’s legislative leadership to give a Donlin Gold project update and introduce Andy Cole, the new General Manager
• Sponsored a number of Tahltan community initiatives related to activities at the Galore Creek project in Northern British Columbia

Q1-2017 PROJECT ACTIVITY
7
o Donlin Gold Project funding (NG 50% share)
• Q1-2017: $2.4 million
• FY-2017: $10.0 million
o Galore Creek Project funding (NG 50% share)
• Q1-2017: $0.2 million
• FY-2016: $2.0 million

Q1-2017 OPERATING PERFORMANCE ANALYSIS
8
(US$ millions)
First Quarter 2017
First Quarter 2016
General and administrative(1) $6.7 $7.3
Donlin Gold 2.1 2.0
Galore Creek 0.2 0.2
Operating loss 9.0 9.5
Other expenses, net 1.1 0.5
Net loss $10.1 $10.0
(1) Includes share-based compensation expense of $3.9 million and $4.7 million in the first quarters of 2017 and 2016, respectively.

Q1-2017 CASH FLOW HIGHLIGHTS
9
(US$ millions)
First Quarter 2017
Full Year Budget
General and administrative(1) $(2.8) $(11.0)
Working capital, interest and other (1.2) —
Cash used in operating activities (4.4) (11.0)
Donlin Gold (2.4) (10.0)
Galore Creek (0.2) (2.0)
Decrease in cash and term deposits (9.8) (23.0)
Cash and term deposits:
Beginning 105.3 105.3
Ending $98.2 $82.3
(1) Excludes non-cash share-based compensation expense.

49.8
39.0
18.8
11.5 10.0 9.5
8.0 6.7 6.5 6.3
5.5 5.3 5.2 5.2 4.5 4.1 4.0 2.9
0
10
20
30
40
50
60
KSM Donlin Gold Metates Livengood Brucejack Blackwater CourageousLake
Meliadine Hardrock Rainy River Stibnite Back River CerroMaricunga
VoltaGrande
Buritica Magino DublinGulch
Coffee
MINES THE SIZE OF DONLIN GOLD ARE SCARCE
MORE THAN FOUR TIMES THE RESOURCES OF THE PEER GROUP AVERAGE
10
Donlin Gold’s size and projected production profile clearly distinguish it from its peers
Donlin Gold data as per the second updated feasibility study effective November 18, 2011, as amended January 20, 2012. Represents 100% of measured and indicated resources of which NOVAGOLD’s share represents 50%. Measured and indicated resources inclusive of proven and probable reserves. Projected annual gold production during full life of mine. Peer group data based on company documents, public filings, and websites . Comparison group of 17 projects based on large (2Moz P&P cut off), North/South American gold-focused development projects.
M&
I Go
ld R
eso
urc
e (m
illio
ns
of
ou
nce
s)
USA USA CANADA CANADA COLOMBIA CANADA CANADA CANADA CHILE CANADA CANADA BRAZIL CANADA CANADA
9.6 Moz
39.0 Moz
CANADA MEXICO USA CANADA
0.53
g/t
2.24
g/t
0.52
g/t
0.68
g/t 14.60
g/t 0.74
g/t 2.31
g/t 5.92
g/t 1.21
g/t 1.09
g/t 1.63
g/t
5.87
g/t
0.38
g/t
1.01
g/t 10.8
g/t
0.88
g/t
0.65
g/t 1.38
g/t

QUALITY OF DONLIN GOLD FAR SURPASSES THAT OF NEXT LARGEST DEPOSITS
11
2.24
0.53 0.52
0.00
0.50
1.00
1.50
2.00
2.50
Donlin Gold KSM Metates
M&
I G
old
Res
ou
rce
Gra
de
(g/t
)
DONLIN GOLD: A LARGE HIGH-GRADE GOLD PROJECT
Donlin Gold data as per the second updated feasibility study effective November 18, 2011, as amended January 20, 2012. Represents 100% of measured and indicated resources of which NOVAGOLD’s share represents 50%. Measured and indicated resources inclusive of proven and probable reserves. Peer group data based on company documents, public filings, and websites .

See “Cautionary Note Concerning Reserve & Resource Estimates” and “Reserve & Resource Base” with footnotes in the appendix. 1) 2016 average grade of open-pit and underground deposits with gold as primary commodity and over 1 Moz in measured and indicated resources, sourced from SNL Metals & Mining. 2) Donlin Gold data as per the second updated feasibility study effective November 18, 2011, as amended January 20, 2012. Represents 100% of measured and indicated resources of which NOVAGOLD’s share is 50%. Measured and
indicated resources are inclusive of proven and probable reserves.
World Average Grade1
1.13g/t
Donlin Gold Average Grade2
2.24g/t
DONLIN GOLD: DOUBLE THE GRADE OF THE AVERAGE GOLD DEPOSIT IN THE WORLD
AMONG THE WORLD’S MOST SIGNIFICANT AND HIGHEST-GRADE GOLD DEPOSITS
12
Industry average grades are declining and sources for emerging production are increasingly scarce

1.102
0.54
0.45 0.41 0.40 0.39
0.37 0.34
0.30 0.29 0.28 0.25 0.23 0.24 0.21 0.20 0.20 0.19
1.501
0.00
0.20
0.40
0.60
0.80
1.00
1.20
1.40
1.60
Donlin Gold KSM Metates Blackwater Brucejack CourageousLake
Meliadine Stibnite Magino Livengood Hardrock Buritica CerroMaricunga
Rainy River VoltaGrande
Back River Coffee DublinGulch
DONLIN GOLD: EXPECTED TO BE ONE OF INDUSTRY’S TOP PRODUCING ASSETS
A REMARKABLE RESOURCE AMONG NEW GOLD DEPOSITS IN THE AMERICAS
13
Pro
ject
ed
An
nu
al G
old
Pro
du
ctio
n (
mill
ion
s o
f o
un
ces)
1) Projected annual gold production during first five full years of mine life 2) Projected annual gold production during full life of mine. 3) Donlin Gold data as per the second updated feasibility study effective November 18, 2011, as amended January 20, 2012. Represents 100% of measured and indicated resources of which NOVAGOLD’s share represents 50%.
Measured and indicated resources inclusive of proven and probable reserves. Projected annual gold production during full life of mine. 4) Peer group data as per latest company documents, public filings, and websites. Comparison group of 17 projects based on large (2Moz P&P cut off), North/South American gold-focused development projects.
USA MEXICO CANADA CANADA CANADA USA CANADA CHILE COLUMBIA CANADA BRAZIL CANADA CANADA CANADA
1.1Moz3
.31Moz4
CANADA USA CANADA CANADA

MULTIPLE DRILL PROSPECTS AND TARGETS EXIST ALONG THE 8 KM GOLD MINERALIZED TREND
DONLIN GOLD: EXCELLENT EXPLORATION POTENTIAL
14
The next big gold discovery?
o Potential to expand current open-pit resource along strike and at depth
o Good prospects to discover meaningful deposits outside current mine footprint
• Reserves and resources are contained within just 3 km of an 8 km-long mineralized trend
o Inferred mineral resource: 6 million ounces of gold mainly inside the reserve pit
o Favorable hosts identified along trend of the main deposit, some tested with positive results

$6.2
$8.2
$11.6
$14.6
$19.2
$27.0
0.0
5.0
10.0
15.0
20.0
25.0
30.0
$1,200 $1,300 $1,500 $1,700 $2,000 $2,500
NPV at 5% NPV at 0%
NPV INCREASES ~20X WITH ~2X INCREASE IN GOLD PRICE
DONLIN GOLD: SIGNIFICANT VALUE UPSIDE WITH HIGHER GOLD PRICES
o Project has a positive return that increases substantially with higher gold prices
o Good payback at a broad range of gold prices
o Significant exploration upside on the mineralized trend
o Long mine life offers high likelihood of enjoying one or more cyclical bull markets over the period of the mine’s operation
15
Donlin Gold estimates as per the second updated feasibility study effective November 18, 2011, as amended January 20, 2012 . All dollar figures are in USD and reflect after-tax net present value (at a 0% and 5% discount rates) of the Donlin Gold project using the feasibility study reference date of 1/1/2014 (start of Year -05) as the first year of discounting. Estimated project development costs of approximately $172M to be spent prior to the reference date are treated as sunk costs. At a 5% discount rate, the net present value is: $547 m @ $1,200 gold; $1,465m @ $1,300 gold; $3,147m @ $1,500 gold; $4,581 m @ $1,700 gold; $6,722 m @ $2,000 gold; and $10,243 m @ $2,500 gold.
27 year mine life
NPV after-tax (US$ in billions)

“The reason for Andy Cole’s, the newly Barrick-appointed general manager, and our enthusiasm about Donlin Gold is because we all realize just what a special project it is... All of those attributes located in a place that respects the rule of law, make Donlin Gold not only “special” but “unique,” particularly in light of our bullish view on gold.” – Thomas S. Kaplan, Chairman of NOVAGOLD2
BARRICK AND NOVAGOLD ARE WORKING TOGETHER TO OPTIMIZE AND ENHANCE THE PROJECT
DONLIN GOLD: PARTNERS SHARED MINDSET TO ENHANCE VALUE AND BUILD OPTIONALITY
16
o Advance Donlin Gold through permitting toward a future construction decision
o Optimization studies to further enhance project value and minimize initial capital costs:
• Assessing alternative project development scenarios • Assessing an increase in use of selective mining methods • Evaluating innovative technologies in logistics & automation • Investigating potential third-party participation in infrastructure development
o Drilling to confirm further potential
1) NOVAGOLD 2015 Annual Report. 2) NOVAGOLD 2016 Annual Report.
“The Donlin Gold project has the potential to become a world class asset for Barrick and for our partner NOVAGOLD. We would like nothing more than to see this potential realized... The goal is to ensure the project can meet our investment criteria at prevailing gold prices when permitting at Donlin Gold is complete.” – Kelvin Dushnisky, President of Barrick Gold1

DONLIN GOLD: PROJECT PERMITTING IS ON TRACK THE CORPS EXPECTS TO PUBLISH THE FINAL ENVIRONMENTAL IMPACT STATEMENT IN EARLY 2018
17 1) Donlin Gold data as per the second updated feasibility study. Projected average annual production represents 100% of which NOVAGOLD’s share is 50%.
Public Scoping
Ended 03/13
Draft EIS
Published 11/15
Final EIS Record of Decision
Preliminary Draft EIS
Completed 06/15
Public Comment
Period
Ended 05/16
Notice of Intent
Submitted 12/12
August 2012 2018
Permit Applications
Submitted 08/12
EIS TIMELINE:
16 years 4 27+ years
EXP
LOR
ATI
ON
&
ENV
IRO
NM
ENTA
L ST
UD
IES
PER
MIT
TIN
G
CO
NST
RU
CTI
ON
OP
ERA
TIO
N
1.5 Moz/year first five full years1
1.1 Moz/year life of mine1
5
DEVELOPMENT TIMELINE:

GALORE CREEK: A SIGNIFICANT COPPER-GOLD-SILVER ASSET
POTENTIAL TO BE ONE OF THE LARGEST, HIGHEST-QUALITY, LOWEST-COST COPPER PRODUCERS IN CANADA
18 1) Galore Creek project estimates as per the pre-feasibility study effective September 12, 2011. Represents 100% of proven and probable reserves of which NOVAGOLD’s share is 50%. See “Cautionary Note Concerning Reserve
& Resource Estimates” and “Reserve & Resource Base” with footnotes in the appendix.
Gold
5Moz Grade: 0.32g/t
Silver
102Moz Grade: 6.02g/t
Copper
7Blbs Grade: 0.59%
P&P RESERVES1

TOP INSTITUTIONAL SHAREHOLDERS
54% OF SHARES ISSUED & OUTSTANDING HELD BY LARGEST SHAREHOLDERS2
19
1) Market Capitalization based on 321.5 million shares issued and outstanding and NG share price of $5.21 as of March 27, 2017. 2) Shareholder positions are based on the latest 13-F filings. 3) NOVAGOLD 2015 Annual Report.
Electrum Strategic Resources LP 26.3%
Van Eck Associates Corporation 8.0%
Fidelity Management & Research Company 7.1%
Paulson & Co. Inc. 7.0%
The Baupost Group, L.L.C. 3.0%
Tocqueville Asset Management, LP 2.9%
Other 45.7%
$1.7B Market Cap1
“With so many macro- and micro-economic factors pointing to a more robust price environment than we see today, investors in NOVAGOLD should be well-positioned to derive a lot of value from the successful and timely development of Donlin Gold.” – John Bridges, J.P. Morgan Analyst3

THE NOVAGOLD OPPORTUNITY
20
Safe Geo-Political Environment: Alaska and British Columbia,
top-rated mining jurisdictions
Accomplished Leadership Team:
Over 200 years cumulative experience
Prolific Production Profile: Donlin Gold expected to be one
of industry’s top producing assets; strong leverage to gold
Supportive Stakeholders: Long standing shareholders and engaged partners
Strong Balance Sheet: $98M cash + term deposits as of February 28, 2017
Top Tier Assets: Donlin Gold – Large, high-grade deposit well advanced in permitting; exploration potential
focused on execution and delivery of our
business plan

APPENDIX
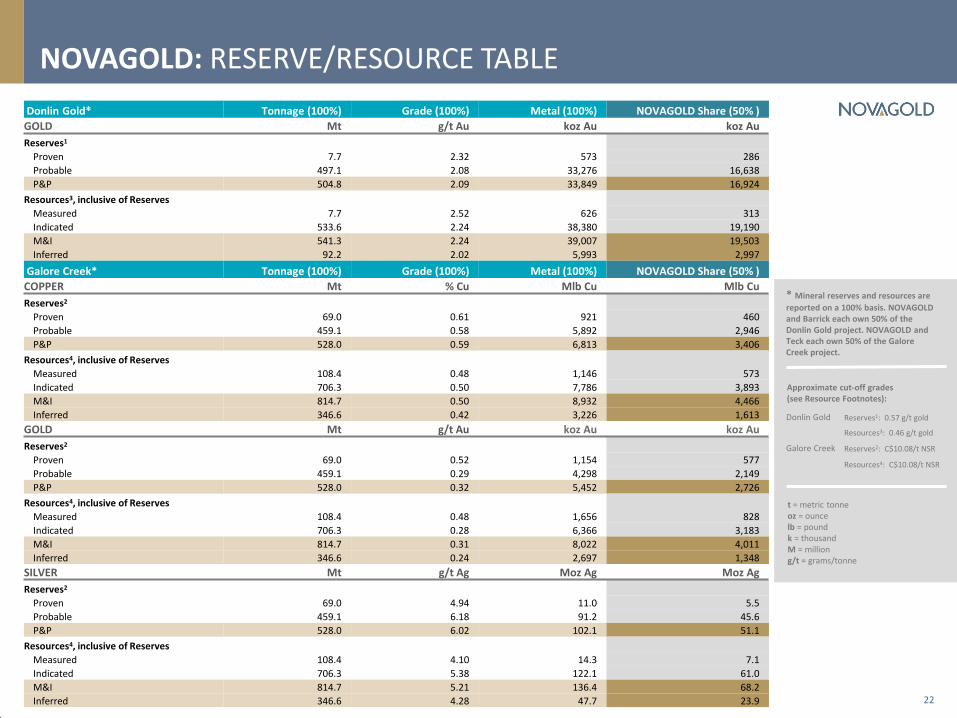
NOVAGOLD: RESERVE/RESOURCE TABLE
22
* Mineral reserves and resources are
reported on a 100% basis. NOVAGOLD and Barrick each own 50% of the Donlin Gold project. NOVAGOLD and Teck each own 50% of the Galore Creek project.
t = metric tonne oz = ounce lb = pound k = thousand M = million g/t = grams/tonne
Approximate cut-off grades (see Resource Footnotes):
Donlin Gold Reserves1: 0.57 g/t gold
Resources3: 0.46 g/t gold
Galore Creek Reserves2: C$10.08/t NSR
Resources4: C$10.08/t NSR
Donlin Gold* Tonnage (100%) Grade (100%) Metal (100%) NOVAGOLD Share (50% )
GOLD Mt g/t Au koz Au koz Au
Reserves1
Proven 7.7 2.32 573 286
Probable 497.1 2.08 33,276 16,638
P&P 504.8 2.09 33,849 16,924
Resources3, inclusive of Reserves
Measured 7.7 2.52 626 313
Indicated 533.6 2.24 38,380 19,190
M&I 541.3 2.24 39,007 19,503
Inferred 92.2 2.02 5,993 2,997
Galore Creek* Tonnage (100%) Grade (100%) Metal (100%) NOVAGOLD Share (50% )
COPPER Mt % Cu Mlb Cu Mlb Cu
Reserves2
Proven 69.0 0.61 921 460
Probable 459.1 0.58 5,892 2,946
P&P 528.0 0.59 6,813 3,406
Resources4, inclusive of Reserves
Measured 108.4 0.48 1,146 573
Indicated 706.3 0.50 7,786 3,893
M&I 814.7 0.50 8,932 4,466
Inferred 346.6 0.42 3,226 1,613
GOLD Mt g/t Au koz Au koz Au
Reserves2
Proven 69.0 0.52 1,154 577
Probable 459.1 0.29 4,298 2,149
P&P 528.0 0.32 5,452 2,726
Resources4, inclusive of Reserves
Measured 108.4 0.48 1,656 828
Indicated 706.3 0.28 6,366 3,183
M&I 814.7 0.31 8,022 4,011
Inferred 346.6 0.24 2,697 1,348
SILVER Mt g/t Ag Moz Ag Moz Ag
Reserves2
Proven 69.0 4.94 11.0 5.5
Probable 459.1 6.18 91.2 45.6
P&P 528.0 6.02 102.1 51.1
Resources4, inclusive of Reserves
Measured 108.4 4.10 14.3 7.1
Indicated 706.3 5.38 122.1 61.0
M&I 814.7 5.21 136.4 68.2
Inferred 346.6 4.28 47.7 23.9

Notes: a. These reserve and resource estimates have been prepared in accordance with NI 43-101 and the CIM Definition Standard, unless otherwise noted. b. See numbered footnotes below on resource information. c. Rounding and significant figures may result in apparent summation differences between tonnes, grade and contained metal d. Tonnage and grade measurements are in metric units. Contained gold and silver ounces are reported as troy ounces, contained copper pounds as imperial pounds Reserves and Resources Footnotes:
1) Mineral reserves are contained within measured and indicated pit designs, and supported by a mine plan, featuring variable throughput rates, stockpiling and cut-off optimization. The pit designs and mine plan were optimized on diluted grades using the following economic and technical parameters: Metal price for gold of US$975/oz; reference mining cost of US$1.67/t incremented US$0.0031/t/m with depth from the 220 m elevation (equates to an average mining cost of US$2.14/t), variable processing cost based on the formula 2.1874 x (S%) + 10.65 for each US$/t processed; general and administrative cost of US$2.27/t processed; stockpile rehandle costs of US$0.19/t processed assuming that 45% of mill feed is rehandled; variable recoveries by rock type, ranging from 86.66% in shale to 94.17% in intrusive rocks in the Akivik domain; refining and freight charges of US$1.78/oz gold; royalty considerations of 4.5%; and variable pit slope angles, ranging from 23º to 43º. Mineral reserves are reported using an optimized net sales return value based on the following equation: Net Sales Return = Au grade * Recovery * (US$975/oz – (1.78 + (US$975/oz – 1.78) * 0.045)) - (10.65 + 2.1874 * (S%) + 2.27 + 0.19) and reported in US$/tonne. Assuming an average recovery of 89.54% and an average S% grade of 1.07%, the marginal gold cutoff grade would be approximately 0.57 g/t, or the gold grade that would equate to a $0.001 net sales return cutoff at these same values. The life of mine strip ratio is 5.48. The assumed life-of-mine throughput rate is 53.5 kt/d.
2) Mineral reserves are contained within measured and indicated pit designs using metal prices for copper, gold and silver of US$2.50/lb, US$1,050/oz, and US$16.85/oz, respectively. Appropriate mining costs, processing costs, metal recoveries and inter ramp pit slope angles varying from 42º to 55º were used to generate the pit phase designs. Mineral reserves have been calculated using a 'cashflow grade' ($NSR/SAG mill hr) cut-off which was varied from year to year to optimize NPV. The net smelter return (NSR) was calculated as follows: NSR = Recoverable Revenue – TCRC (on a per tonne basis), where: NSR = Net Smelter Return; TCRC = Transportation and Refining Costs; Recoverable Revenue = Revenue in Canadian dollars for recoverable copper, recoverable gold, and recoverable silver using metal prices of US$2.50/lb, US$1,050/oz, and US$16.85/oz for copper, gold, and silver, respectively, at an exchange rate of CDN$1.1 to US$1.0; Cu Recovery = Recovery for copper based on mineral zone and total copper grade; for mineral reserves this NSR calculation includes mining dilution. SAG throughputs were modeled by correlation with alteration types. Cash flow grades were calculated as the product of NSR value in $/t and throughput in t/hr. The life of mine strip ratio is 2.16.
3) Mineral resources are contained within a conceptual measured, indicated and inferred optimized pit shell using the following assumptions: gold price of US$1,200/oz; variable process cost based on 2.1874 * (sulphur grade) + 10.6485; administration cost of US$2.29/t; refining, freight & marketing (selling costs) of US$1.85/oz recovered; stockpile rehandle costs of US$0.20/t processed assuming that 45% of mill feed is rehandled; variable royalty rate, based on royalty of 4.5% * (Au price – selling cost). Mineral resources have been estimated using a constant Net Sales Return cut-off of US$0.001/t milled. The Net Sales Return was calculated using the formula: Net Sales Return = Au grade * Recovery * (US$1200/oz – (1.85 + ((US$1200/oz – 1.85) * 0.045)) - (10.65 + 2.1874 * (S%) + 2.29 + 0.20)) and reported in US$/tonne. Assuming an average recovery of 89.54% and an average S% grade of 1.07%, the marginal gold cutoff grade would be approximately 0.46 q/t, or the gold grade that would equate to a $0.001 net sales return cutoff at these same values. Mineral resources are inclusive of mineral reserves. Mineral resources that are not mineral reserves do not have demonstrated economic viability. Inferred resources are in addition to measured and indicated resources. Inferred resources have a great amount of uncertainty as to their existence and whether they can be mined legally or economically. It cannot be assumed that all or any part of the inferred resources will ever be upgraded to a higher category. See "Cautionary Note Concerning Reserve & Resource Estimates".
4) Mineral resources are contained within a conceptual measured, indicated and inferred optimized pit shell using the same economic and technical parameters as used for mineral reserves. Tonnages are assigned based on proportion of the block below topography. The overburden/bedrock boundary has been assigned on a whole block basis. Commodity prices used to constrain the mineral resources are US$2.50/lb copper, US$1,050/oz gold, and US$16.85/oz silver. Mineral resources have been estimated using a constant NSR cut-off of C$10.08/t milled. The Net Smelter Return (NSR) was calculated as follows: NSR = Recoverable Revenue – TCRC (on a per tonne basis), where: NSR = Diluted Net Smelter Return; TCRC = Transportation and Refining Costs; Recoverable Revenue = Revenue in Canadian dollars for recoverable copper, recoverable gold, and recoverable silver using silver using the economic and technical parameters mentioned above. Mineral resources are inclusive of mineral reserves. Mineral resources that are not mineral reserves do not have demonstrated economic viability. Inferred resources are in addition to measured and indicated resources. Inferred resources have a great amount of uncertainty as to their existence and whether they can be mined legally or economically. It cannot be assumed that all or any part of the inferred resources will ever be upgraded to a higher category. See "Cautionary Note Concerning Reserve & Resource Estimates".
Cautionary Note Concerning Reserve & Resource Estimates This summary table uses the term “resources”, “measured resources”, “indicated resources” and “inferred resources”. United States investors are advised that, while such terms are recognized and required by Canadian securities laws, the United States Securities and Exchange Commission (the “SEC”) does not recognize them. Under United States standards, mineralization may not be classified as a “reserve” unless the determination has been made that the mineralization could be economically and legally produced or extracted at the time the reserve determination is made. Mineral resources that are not mineral reserves do not have demonstrated economic viability. Investors are cautioned not to assume that all or any part of measured or indicated resources will ever be converted into reserves. Further, inferred resources have a great amount of uncertainty as to their existence and as to whether they can be mined legally or economically. It cannot be assumed that all or any part of the inferred resources will ever be upgraded to “indicated resource”, “measured resource”, or “mineral reserve” status. Therefore, investors are also cautioned not to assume that all or any part of the inferred resources exist, or that they can be mined legally or economically. Disclosure of “contained ounces” is permitted disclosure under Canadian regulations, however, the SEC normally only permits issuers to report “resources” as in place tonnage and grade without reference to unit measures. Accordingly, information concerning descriptions of mineralization and resources contained in this release may not be comparable to information made public by United States companies subject to the reporting and disclosure requirements of the SEC. NI 43-101 is a rule developed by the Canadian Securities Administrators, which established standards for all public disclosure an issuer makes of scientific and technical information concerning mineral projects. Unless otherwise indicated, all resource estimates contained in this circular have been prepared in accordance with Canadian National Instrument 43-101—Standards of Disclosure for Mineral Projects (“NI 43-101”) and the Canadian Institute of Mining, Metallurgy and Petroleum (CIM)—CIM Definition Standards on Mineral Resources and Mineral Reserves, adopted by the CIM Council, as amended (“CIM Definition Standards”). Technical Reports and Qualified Persons The documents referenced below provide supporting technical information for each of NOVAGOLD's projects. Project Qualified Person(s) Most Recent Disclosure & Filing Date Donlin Gold Gordon Seibel R.M. SME “Donlin Creek Gold Project Alaska, USA, NI 43-101 Technical Report on Second Updated Feasibility Study” prepared by AMEC, effective November 18, 2011, amended January 20, 2012. Kirk Hanson P.E. Galore Creek Jay Melnyk, P.Eng. “Galore Creek Copper-Gold Project NI 43-101 Technical Report on Pre-Feasibility Study, British Columbia – Canada” prepared by AMEC, effective July 27, 2011. Greg Kulla, P.Geo.
Clifford Krall, P.E., who is the Mine Engineering Manager for NOVAGOLD and a “qualified person” under NI 43-101, has approved the scientific and technical information related to the Donlin Gold and Galore Creek projects contained in this presentation.
NOVAGOLD: RESERVE/RESOURCE TABLE (CON’T)
23
NOVAGOLD RESOURCES INC. Suite 720 – 789 West Pender Street Vancouver, BC Canada V6C 1H2 T 604 669 6227 TF 1 866 669 6227 F 604 669 6272 www.novagold.com [email protected]
Mélanie Hennessey VP, Corporate Communications [email protected]
Erin O’Toole Senior Stakeholder Relations Specialist [email protected]
CONTACT US
24