Embed Size (px)
Citation preview
novagold.com
THE GOLD DEVELOPMENT COMPANY for the 21st Century NYSE-MKT, TSX: NG | November 2015
CAUTIONARY STATEMENTS
2
All dollar amounts quoted in this report are in U.S. currency unless otherwise noted.
REGARDING FORWARD-LOOKING STATEMENTS
This presentation includes certain “forward-looking statements” within the meaning of applicable securities laws, including the United States Private Securities Litigation Reform Act of 1995. All statements, other than statements of historical fact, included herein including, without limitation, statements relating to Donlin Gold’s future operating or financial performance, are forward-looking statements. Forward-looking statements are frequently, but not always, identified by words such as “plans”, “expects”, “anticipates”, “believes”, “intends”, “estimates”, “potential”, “possible” and similar expressions, or statements that events, conditions or results “will”, “may”, “could”, or “should” occur or be achieved. These forward-looking statements are set forth in the slides pertaining to the implementation of the Donlin Gold second updated Feasibility Study and pertaining to the implementation of the Galore Creek Pre-Feasibility Study, the factors that may influence future gold price performance, and the potential future value of gold, and may include statements regarding perceived merit of properties; exploration results and budgets; mineral reserves and resource estimates; work programs; capital expenditures; timelines; strategic plans; completion of transactions; market price of precious or base metals; or other statements that are not statements of fact. Forward-looking statements involve various risks and uncertainties. There can be no assurance that such statements will prove to be accurate, and actual results and future events could differ materially from those anticipated in such statements. Important factors that could cause actual results to differ materially from our expectations include the uncertainties involving the need for additional financing to explore and develop properties and availability of financing in the debt and capital markets; uncertainties involved in the interpretation of drilling results and geological tests and the estimation of reserves and resources; the need for continued cooperation between NOVAGOLD and Barrick Gold in the exploration and development of the Donlin Gold property; the need for continued cooperation between NOVAGOLD and Teck Resources Ltd. in the exploration and development of the Galore Creek property; the need for cooperation of government agencies and native groups in the development and operation of properties; the need to obtain permits and governmental approvals; risks of construction and mining projects such as accidents, equipment breakdowns, bad weather, non-compliance with environmental and permit requirements, unanticipated variation in geological structures, ore grades or recovery rates; unexpected cost increases; fluctuations in metal prices and currency exchange rates; and other risks and uncertainties disclosed in reports and documents filed by NOVAGOLD with applicable securities regulatory authorities from time to time. The forward-looking statements made herein reflect our beliefs, opinions and projections on the date the statements are made. Except as required by law, we assume no obligation to update the forward-looking statements of beliefs, opinions, projections, or other factors, should they change.
REGARDING SCIENTIFIC AND TECHNICAL INFORMATION
Unless otherwise indicated, all reserve and resource estimates included in this presentation have been prepared in accordance with Canadian National Instrument 43-101 Standards of Disclosure for Mineral Projects (“NI 43-101”) and the Canadian Institute of Mining, Metallurgy and Petroleum Definition Standards for Mineral Resources and Mineral Reserves (2010)(“CIM Definition Standards 2010”). Canadian standards, including NI 43-101, differ significantly from the requirements of the United States Securities and Exchange Commission (“SEC”), and reserve and resource information in this presentation may not be comparable to similar information disclosed by U.S. companies. In particular, and without limiting the generality of the foregoing, the term “resource” does not equate to the term “‘reserves”. Under U.S. standards, mineralization may not be classified as a “reserve” unless the determination has been made that the mineralization could be economically and legally produced or extracted at the time the reserve determination is made. “Mineral resources” that are not “mineral reserves” do not have demonstrated economic viability. Investors are cautioned not to assume that all or any part of “measured” or “indicated resources” will ever be converted into “reserves”. At this time, both of Donlin Gold and Galore Creek projects are without known reserves, as defined under SEC Industry Guide 7. The SEC’s disclosure standards normally do not permit the inclusion of information concerning “measured mineral resources”, “indicated mineral resources” or “inferred mineral resources” or other descriptions of the amount of mineralization in mineral deposits that do not constitute “reserves” by U.S. standards in documents filed with the SEC. Investors should also understand that “inferred mineral resources” have a great amount of uncertainty as to their existence and great uncertainty as to their economic and legal feasibility. It cannot be assumed that all or any part of the “inferred resources” will ever be upgraded to “indicated resource”, “measured resource”, or “mineral reserve” status. Under Canadian rules, estimated “inferred mineral resources” may not form the basis of feasibility or pre-feasibility studies except in rare cases. Investors are cautioned not to assume that all or any part of an “inferred mineral resource” exists or is economically or legally mineable. Disclosure of “contained ounces” in a resource is permitted disclosure under Canadian regulations; however, the SEC normally only permits issuers to report mineralization that does not constitute “reserves” by SEC standards as in-place tonnage and grade without reference to unit measures. The requirements of NI 43-101 for identification of “reserves” are also not the same as those of the SEC, and reserves reported in compliance with NI 43-101 may not qualify as “reserves” under SEC standards. Accordingly, information concerning mineral deposits set forth herein may not be comparable to information made public by companies that report in accordance with United States standards.
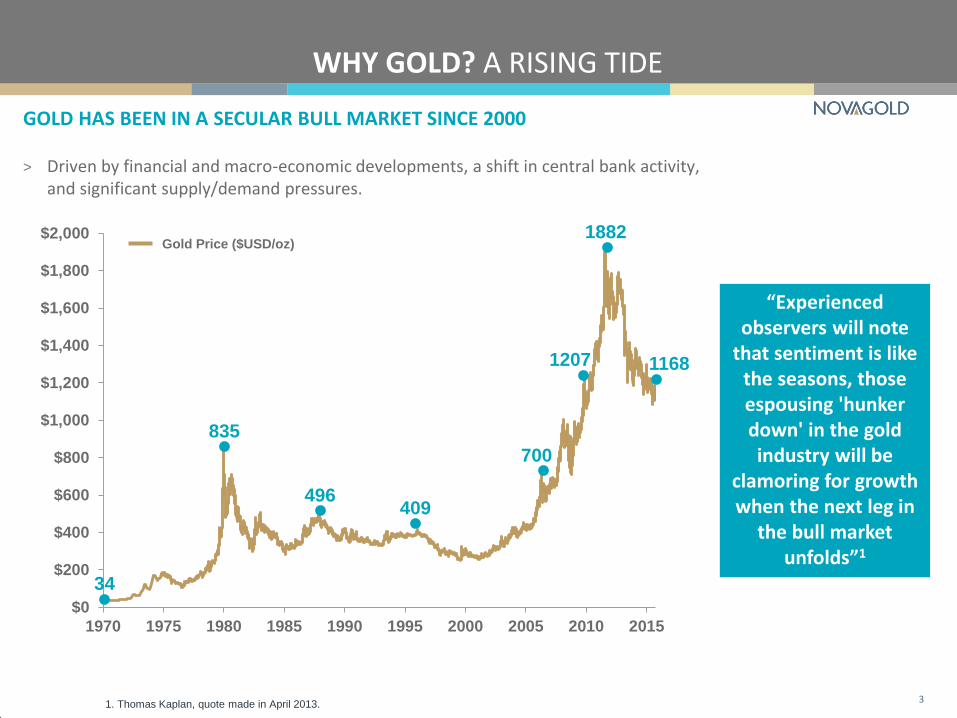
WHY GOLD? A RISING TIDE
“Experienced observers will note
that sentiment is like the seasons, those espousing 'hunker down' in the gold industry will be
clamoring for growth when the next leg in
the bull market unfolds”1
3
GOLD HAS BEEN IN A SECULAR BULL MARKET SINCE 2000
> Driven by financial and macro-economic developments, a shift in central bank activity, and significant supply/demand pressures.
3
$0
$200
$400
$600
$800
$1,000
$1,200
$1,400
$1,600
$1,800
$2,000
1970 1975 1980 1985 1990 1995 2000 2005 2010 2015
34
835
496 409
700
1207
1882
1168
Gold Price ($USD/oz)
1. Thomas Kaplan, quote made in April 2013.
$40
$45
$50
$55
$60
$65
$70
$75
$80
$85
$1,000
$1,050
$1,100
$1,150
$1,200
$1,250
$1,300
$1,350
Gold Oil
$20
$40
$60
$80
$100
$120
$140
$160
$300
$500
$700
$900
$1,100
$1,300
$1,500
$1,700
$1,900
$2,100
Jan-07 Jan-08 Jan-09 Jan-10 Jan-11 Jan-12 Jan-13 Jan-14 Jan-15
Gold Oil
WHY GOLD? GOLD IS MORE THAN A COMMODITY
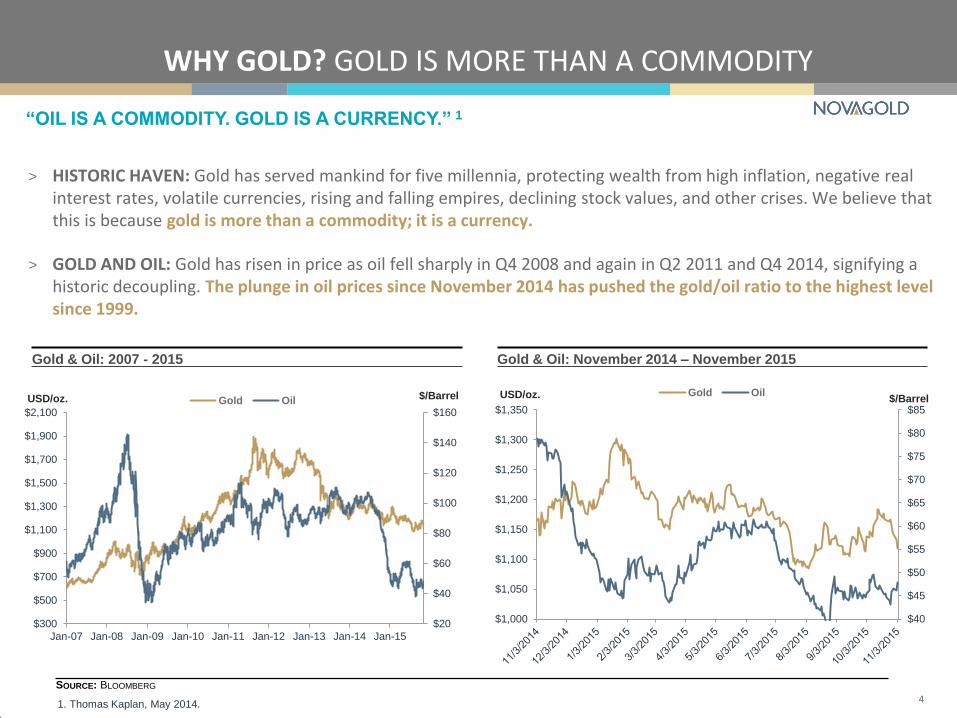
“OIL IS A COMMODITY. GOLD IS A CURRENCY.” 1
1. Thomas Kaplan, May 2014.
Gold & Oil: November 2014 – November 2015
USD/oz. USD/oz. $/Barrel $/Barrel
SOURCE: BLOOMBERG 4
> HISTORIC HAVEN: Gold has served mankind for five millennia, protecting wealth from high inflation, negative real interest rates, volatile currencies, rising and falling empires, declining stock values, and other crises. We believe that this is because gold is more than a commodity; it is a currency.
> GOLD AND OIL: Gold has risen in price as oil fell sharply in Q4 2008 and again in Q2 2011 and Q4 2014, signifying a historic decoupling. The plunge in oil prices since November 2014 has pushed the gold/oil ratio to the highest level since 1999.
4
Gold & Oil: 2007 - 2015
NOT SURPRISINGLY…GOLD IS THE WORLD’S BEST PERFORMING CURRENCY
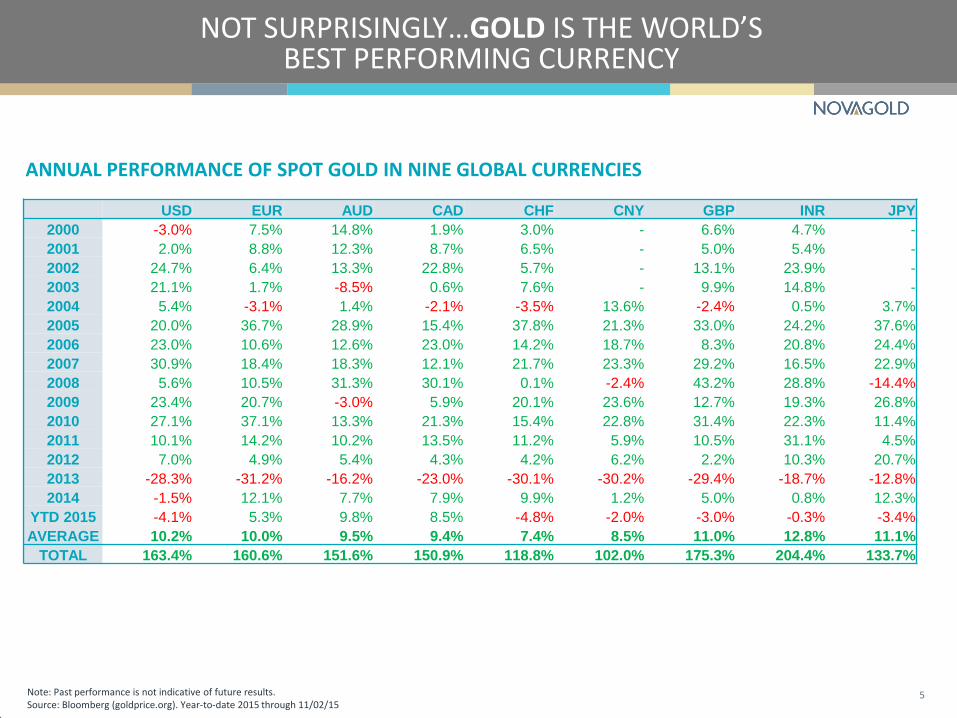
5 Note: Past performance is not indicative of future results. Source: Bloomberg (goldprice.org). Year-to-date 2015 through 11/02/15
USD EUR AUD CAD CHF CNY GBP INR JPY
2000 -3.0% 7.5% 14.8% 1.9% 3.0% - 6.6% 4.7% -
2001 2.0% 8.8% 12.3% 8.7% 6.5% - 5.0% 5.4% -
2002 24.7% 6.4% 13.3% 22.8% 5.7% - 13.1% 23.9% -
2003 21.1% 1.7% -8.5% 0.6% 7.6% - 9.9% 14.8% -
2004 5.4% -3.1% 1.4% -2.1% -3.5% 13.6% -2.4% 0.5% 3.7%
2005 20.0% 36.7% 28.9% 15.4% 37.8% 21.3% 33.0% 24.2% 37.6%
2006 23.0% 10.6% 12.6% 23.0% 14.2% 18.7% 8.3% 20.8% 24.4%
2007 30.9% 18.4% 18.3% 12.1% 21.7% 23.3% 29.2% 16.5% 22.9%
2008 5.6% 10.5% 31.3% 30.1% 0.1% -2.4% 43.2% 28.8% -14.4%
2009 23.4% 20.7% -3.0% 5.9% 20.1% 23.6% 12.7% 19.3% 26.8%
2010 27.1% 37.1% 13.3% 21.3% 15.4% 22.8% 31.4% 22.3% 11.4%
2011 10.1% 14.2% 10.2% 13.5% 11.2% 5.9% 10.5% 31.1% 4.5%
2012 7.0% 4.9% 5.4% 4.3% 4.2% 6.2% 2.2% 10.3% 20.7%
2013 -28.3% -31.2% -16.2% -23.0% -30.1% -30.2% -29.4% -18.7% -12.8%
2014 -1.5% 12.1% 7.7% 7.9% 9.9% 1.2% 5.0% 0.8% 12.3%
YTD 2015 -4.1% 5.3% 9.8% 8.5% -4.8% -2.0% -3.0% -0.3% -3.4%
AVERAGE 10.2% 10.0% 9.5% 9.4% 7.4% 8.5% 11.0% 12.8% 11.1%
TOTAL 163.4% 160.6% 151.6% 150.9% 118.8% 102.0% 175.3% 204.4% 133.7%
ANNUAL PERFORMANCE OF SPOT GOLD IN NINE GLOBAL CURRENCIES
(2.0%)
(1.5%)
(1.0%)
(0.5%)
0.0%
0.5%
1.0%
$0
$200
$400
$600
$800
$1,000
Sep-08 Oct-08 Nov-08 Dec-08 Jan-09 Feb-09 Mar-09
MoM CPI
GOLD THRIVES IN INFLATION AND DEFLATION
6 Note: Past performance is not indicative of future results.
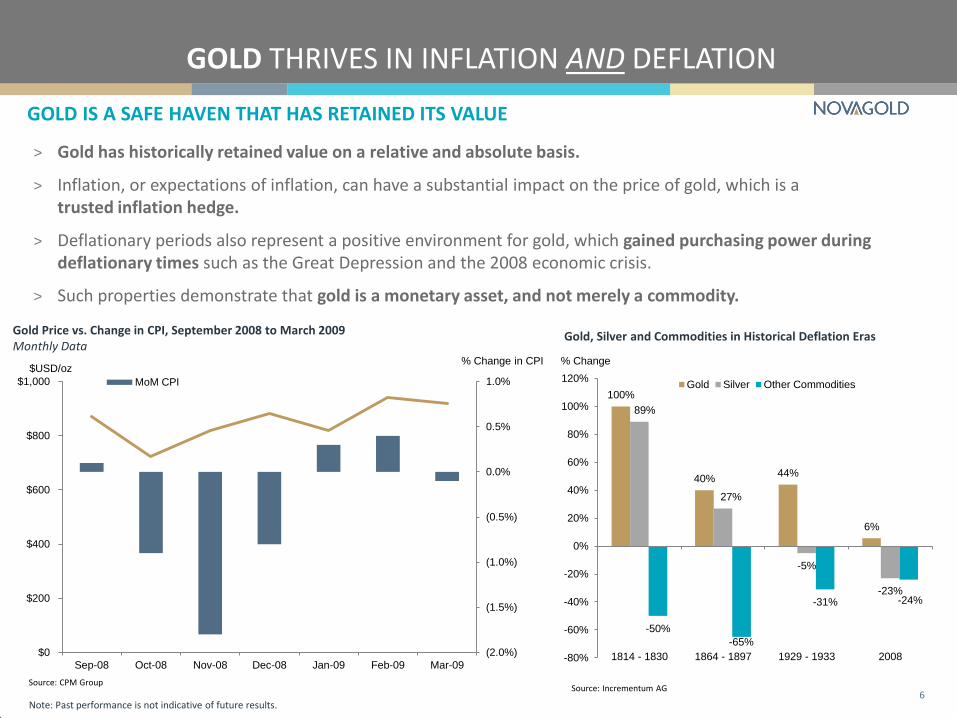
> Gold has historically retained value on a relative and absolute basis.
> Inflation, or expectations of inflation, can have a substantial impact on the price of gold, which is a trusted inflation hedge.
> Deflationary periods also represent a positive environment for gold, which gained purchasing power during deflationary times such as the Great Depression and the 2008 economic crisis.
> Such properties demonstrate that gold is a monetary asset, and not merely a commodity.
100%
40% 44%
6%
89%
27%
-5%
-23%
-50%
-31% -24%
-80%
-60%
-40%
-20%
0%
20%
40%
60%
80%
100%
120%
1814 - 1830 1864 - 1897 1929 - 1933 2008
Gold Silver Other Commodities
-65%
Gold, Silver and Commodities in Historical Deflation Eras
Source: Incrementum AG Source: CPM Group
Gold Price vs. Change in CPI, September 2008 to March 2009 Monthly Data
% Change % Change in CPI $USD/oz
GOLD IS A SAFE HAVEN THAT HAS RETAINED ITS VALUE
GOLD IS A VALUABLE PORTFOLIO DIVERSIFIER
7 Note: Past performance is not indicative of future results.
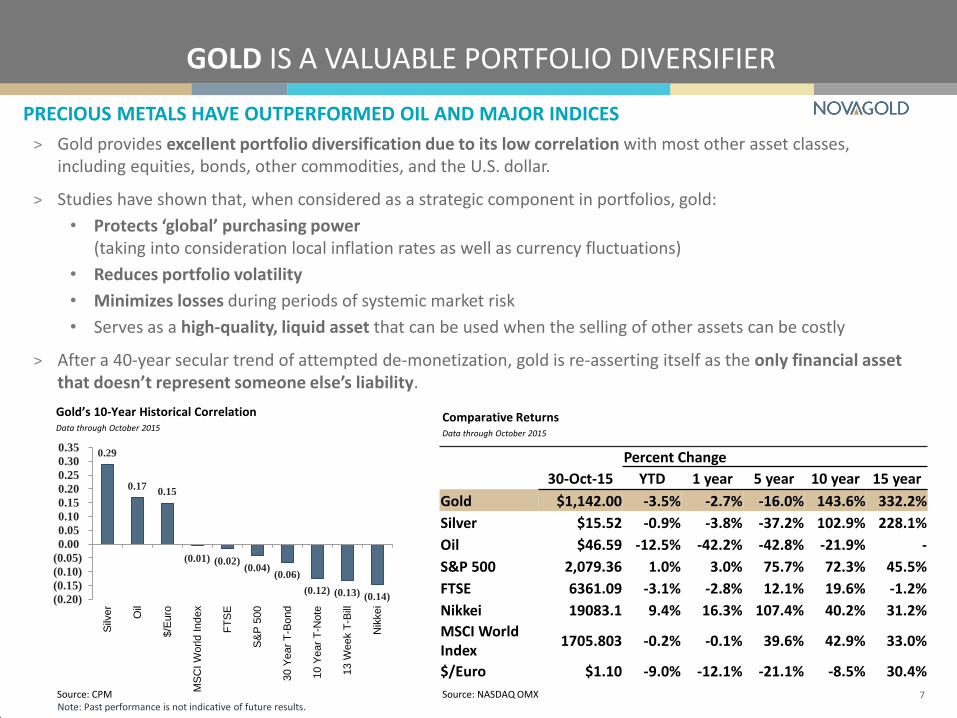
> Gold provides excellent portfolio diversification due to its low correlation with most other asset classes, including equities, bonds, other commodities, and the U.S. dollar.
> Studies have shown that, when considered as a strategic component in portfolios, gold:
• Protects ‘global’ purchasing power (taking into consideration local inflation rates as well as currency fluctuations)
• Reduces portfolio volatility
• Minimizes losses during periods of systemic market risk
• Serves as a high-quality, liquid asset that can be used when the selling of other assets can be costly
> After a 40-year secular trend of attempted de-monetization, gold is re-asserting itself as the only financial asset that doesn’t represent someone else’s liability.
PRECIOUS METALS HAVE OUTPERFORMED OIL AND MAJOR INDICES
Percent Change
30-Oct-15 YTD 1 year 5 year 10 year 15 year
Gold $1,142.00 -3.5% -2.7% -16.0% 143.6% 332.2%
Silver $15.52 -0.9% -3.8% -37.2% 102.9% 228.1%
Oil $46.59 -12.5% -42.2% -42.8% -21.9% -
S&P 500 2,079.36 1.0% 3.0% 75.7% 72.3% 45.5%
FTSE 6361.09 -3.1% -2.8% 12.1% 19.6% -1.2%
Nikkei 19083.1 9.4% 16.3% 107.4% 40.2% 31.2%
MSCI World Index
1705.803 -0.2% -0.1% 39.6% 42.9% 33.0%
$/Euro $1.10 -9.0% -12.1% -21.1% -8.5% 30.4%
Source: NASDAQ OMX
Comparative Returns Data through October 2015
0.29
0.17 0.15
(0.01) (0.02) (0.04)
(0.06)
(0.12) (0.13) (0.14) (0.20)
(0.15)
(0.10)
(0.05)
0.00
0.05
0.10
0.15
0.20
0.25
0.30
0.35
Silv
er
Oil
$/E
uro
MS
CI W
orld
Ind
ex
FT
SE
S&
P 5
00
30 Y
ear
T-B
ond
10 Y
ear
T-N
ote
13 W
eek T
-Bill
Nik
kei
Gold’s 10-Year Historical Correlation Data through October 2015
Source: CPM
$0
$300
$600
$900
$1,200
$1,500
$1,800
1.4
1.6
1.8
2.0
2.2
2004 2005 2006 2007 2008 2009 2010 2011 2012 2013
Weighted-average Head Grade
Gold Price
$0
$300
$600
$900
$1,200
$1,500
$1,800
2004 2005 2006 2007 2008 2009 2010 2011 2012 2013
Cash Operating Costs
Corporate & Admin Costs
Capital Costs
Acquistion & Exploration Costs
Gold Price
WHY GOLD? IT’S SCARCE
8
Note: Past performance is not indicative of future results.
Rising Costs New Discoveries Rare
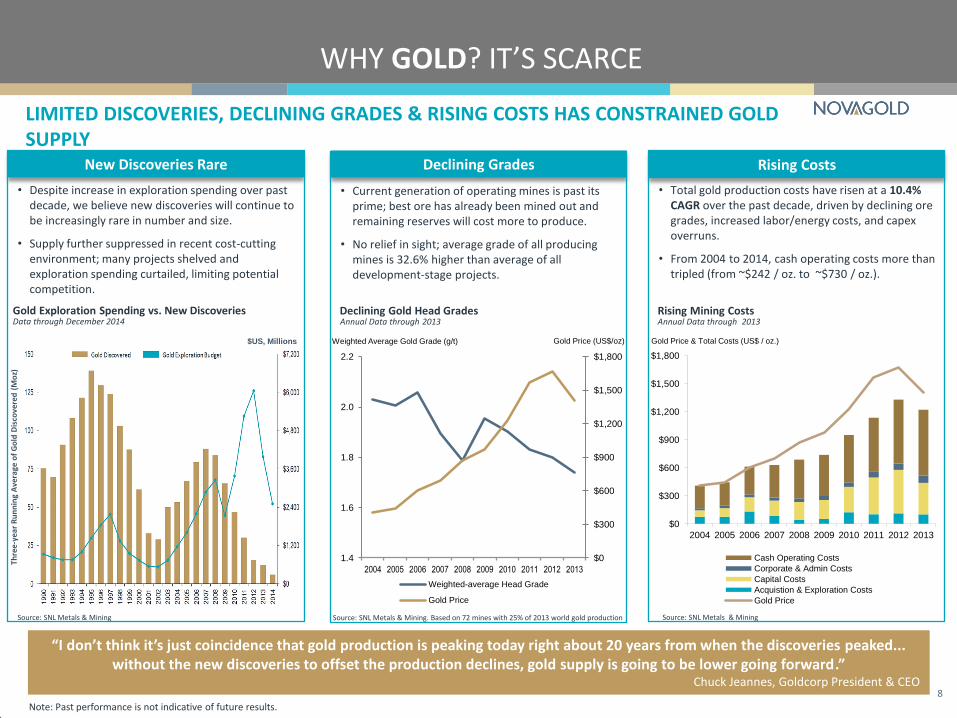
• Despite increase in exploration spending over past decade, we believe new discoveries will continue to be increasingly rare in number and size.
• Supply further suppressed in recent cost-cutting environment; many projects shelved and exploration spending curtailed, limiting potential competition.
Gold Exploration Spending vs. New Discoveries Data through December 2014
Source: SNL Metals & Mining
• Total gold production costs have risen at a 10.4% CAGR over the past decade, driven by declining ore grades, increased labor/energy costs, and capex overruns.
• From 2004 to 2014, cash operating costs more than tripled (from ~$242 / oz. to ~$730 / oz.).
Rising Mining Costs Annual Data through 2013
Declining Grades
• Current generation of operating mines is past its prime; best ore has already been mined out and remaining reserves will cost more to produce.
• No relief in sight; average grade of all producing mines is 32.6% higher than average of all development-stage projects.
Declining Gold Head Grades Annual Data through 2013
Source: SNL Metals & Mining. Based on 72 mines with 25% of 2013 world gold production Source: SNL Metals & Mining
“I don’t think it’s just coincidence that gold production is peaking today right about 20 years from when the discoveries peaked... without the new discoveries to offset the production declines, gold supply is going to be lower going forward.”
Chuck Jeannes, Goldcorp President & CEO
Thre
e-y
ear
Ru
nn
ing
Ave
rage
of
Go
ld D
isco
vere
d (
Mo
z)
$US, Millions Gold Price (US$/oz) Weighted Average Gold Grade (g/t) Gold Price & Total Costs (US$ / oz.)
LIMITED DISCOVERIES, DECLINING GRADES & RISING COSTS HAS CONSTRAINED GOLD SUPPLY
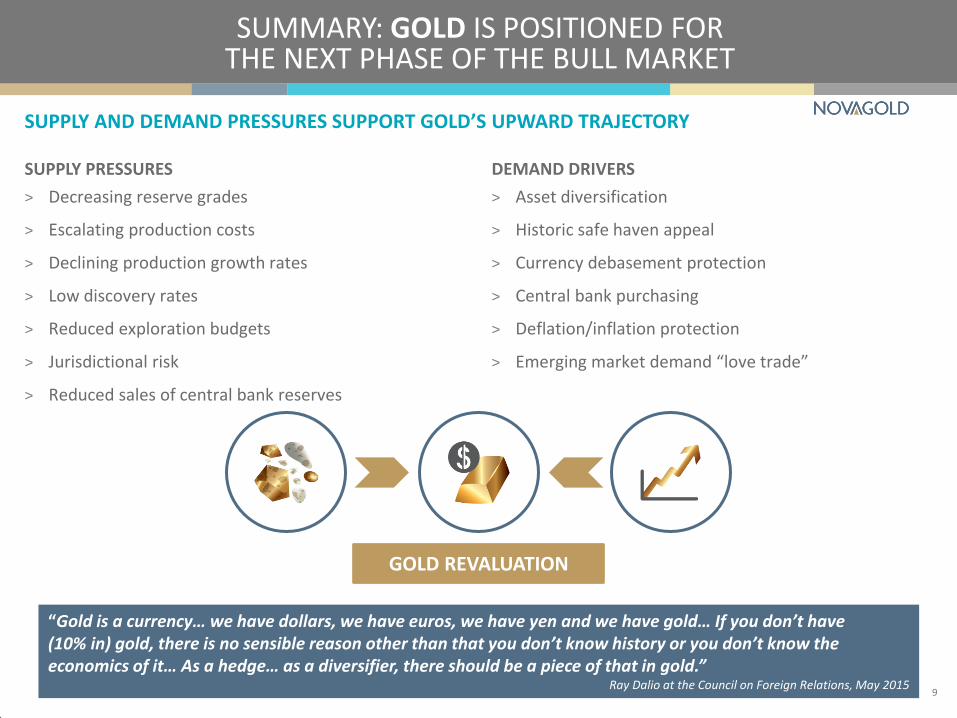
SUPPLY PRESSURES
> Decreasing reserve grades
> Escalating production costs
> Declining production growth rates
> Low discovery rates
> Reduced exploration budgets
> Jurisdictional risk
> Reduced sales of central bank reserves
SUMMARY: GOLD IS POSITIONED FOR THE NEXT PHASE OF THE BULL MARKET
DEMAND DRIVERS
> Asset diversification
> Historic safe haven appeal
> Currency debasement protection
> Central bank purchasing
> Deflation/inflation protection
> Emerging market demand “love trade”
SUPPLY AND DEMAND PRESSURES SUPPORT GOLD’S UPWARD TRAJECTORY
9
GOLD REVALUATION
“Gold is a currency… we have dollars, we have euros, we have yen and we have gold… If you don’t have (10% in) gold, there is no sensible reason other than that you don’t know history or you don’t know the economics of it… As a hedge… as a diversifier, there should be a piece of that in gold.”
Ray Dalio at the Council on Foreign Relations, May 2015
WHY GOLD EQUITIES: EXTRAORDINARY VALUE PROPOSITION
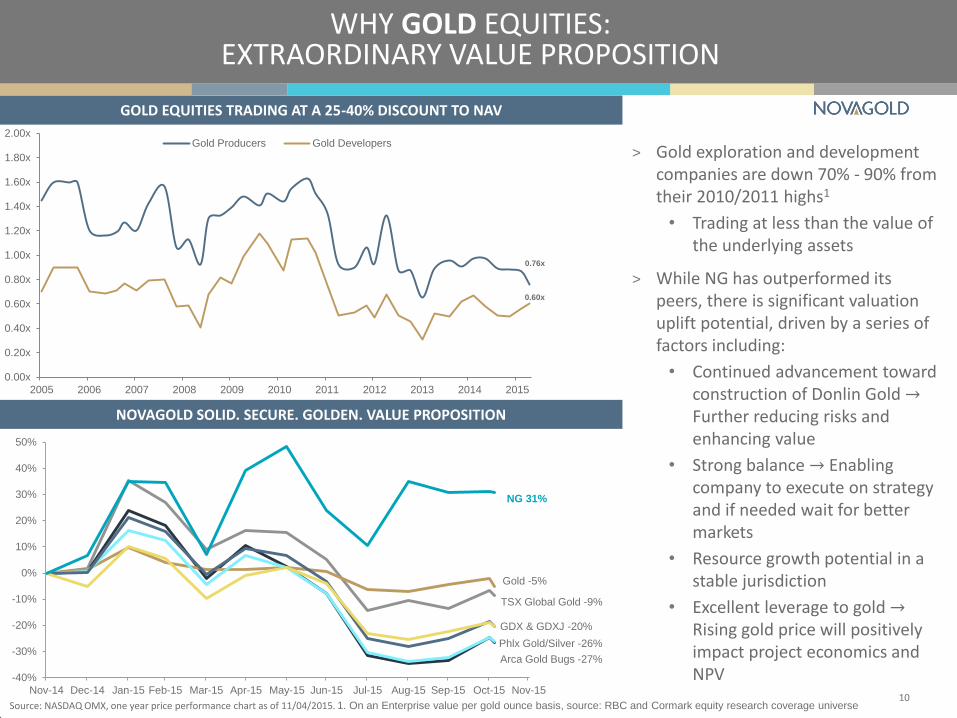
TSX Global Gold -9%
Arca Gold Bugs -27%
Gold -5%
Phlx Gold/Silver -26%
GDX & GDXJ -20%
NG 31%
-40%
-30%
-20%
-10%
0%
10%
20%
30%
40%
50%
Nov-14 Dec-14 Jan-15 Feb-15 Mar-15 Apr-15 May-15 Jun-15 Jul-15 Aug-15 Sep-15 Oct-15 Nov-15
> Gold exploration and development companies are down 70% - 90% from their 2010/2011 highs1
• Trading at less than the value of the underlying assets
> While NG has outperformed its peers, there is significant valuation uplift potential, driven by a series of factors including:
• Continued advancement toward construction of Donlin Gold → Further reducing risks and enhancing value
• Strong balance → Enabling company to execute on strategy and if needed wait for better markets
• Resource growth potential in a stable jurisdiction
• Excellent leverage to gold → Rising gold price will positively impact project economics and NPV
10 Source: NASDAQ OMX, one year price performance chart as of 11/04/2015. 1. On an Enterprise value per gold ounce basis, source: RBC and Cormark equity research coverage universe
0.76x
0.60x
0.00x
0.20x
0.40x
0.60x
0.80x
1.00x
1.20x
1.40x
1.60x
1.80x
2.00x
2005 2006 2007 2008 2009 2010 2011 2012 2013 2014 2015
Gold Producers Gold Developers
GOLD EQUITIES TRADING AT A 25-40% DISCOUNT TO NAV
NOVAGOLD SOLID. SECURE. GOLDEN. VALUE PROPOSITION
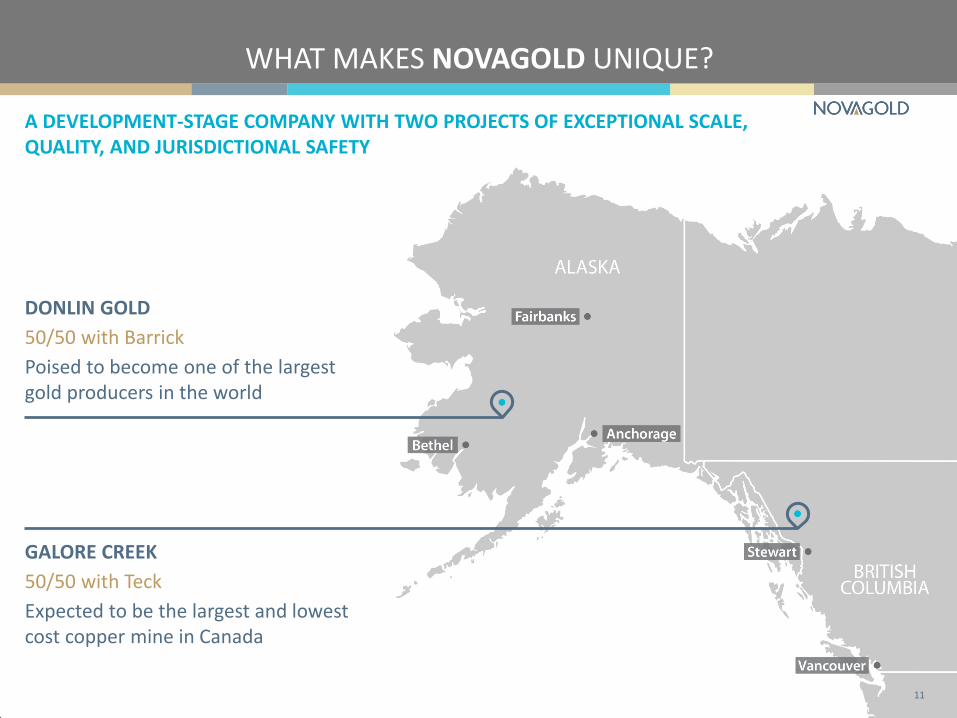
WHAT MAKES NOVAGOLD UNIQUE?
A DEVELOPMENT-STAGE COMPANY WITH TWO PROJECTS OF EXCEPTIONAL SCALE, QUALITY, AND JURISDICTIONAL SAFETY
11
DONLIN GOLD
50/50 with Barrick
Poised to become one of the largest gold producers in the world
GALORE CREEK
50/50 with Teck
Expected to be the largest and lowest cost copper mine in Canada
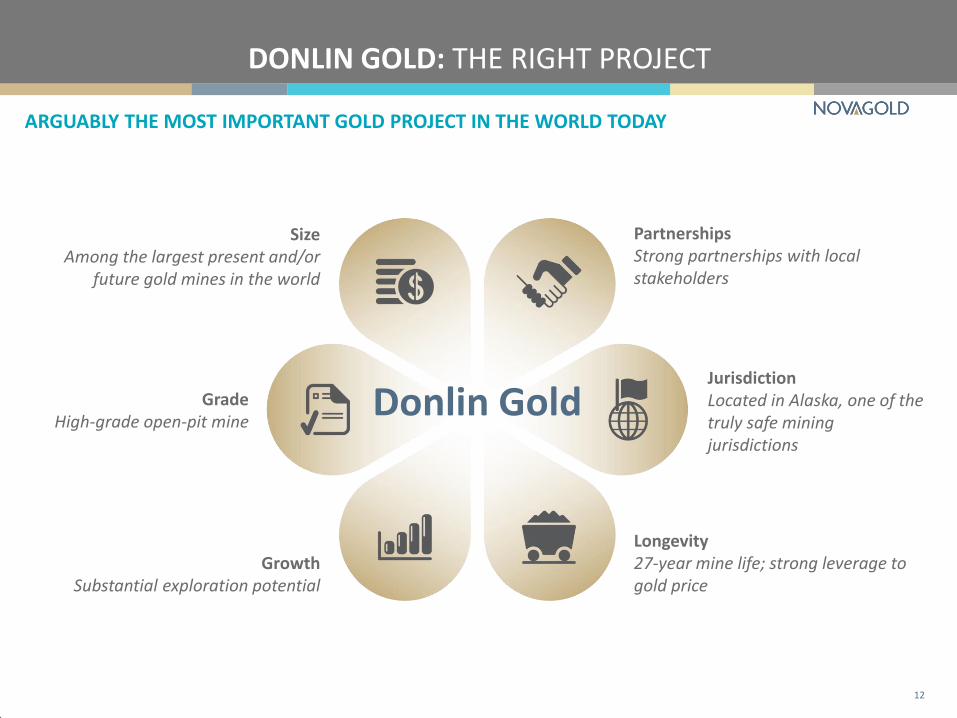
DONLIN GOLD: THE RIGHT PROJECT
ARGUABLY THE MOST IMPORTANT GOLD PROJECT IN THE WORLD TODAY
12
Size Among the largest present and/or
future gold mines in the world
Partnerships Strong partnerships with local stakeholders
Longevity 27-year mine life; strong leverage to gold price
Growth Substantial exploration potential
Grade High-grade open-pit mine
Jurisdiction Located in Alaska, one of the truly safe mining jurisdictions
Donlin Gold
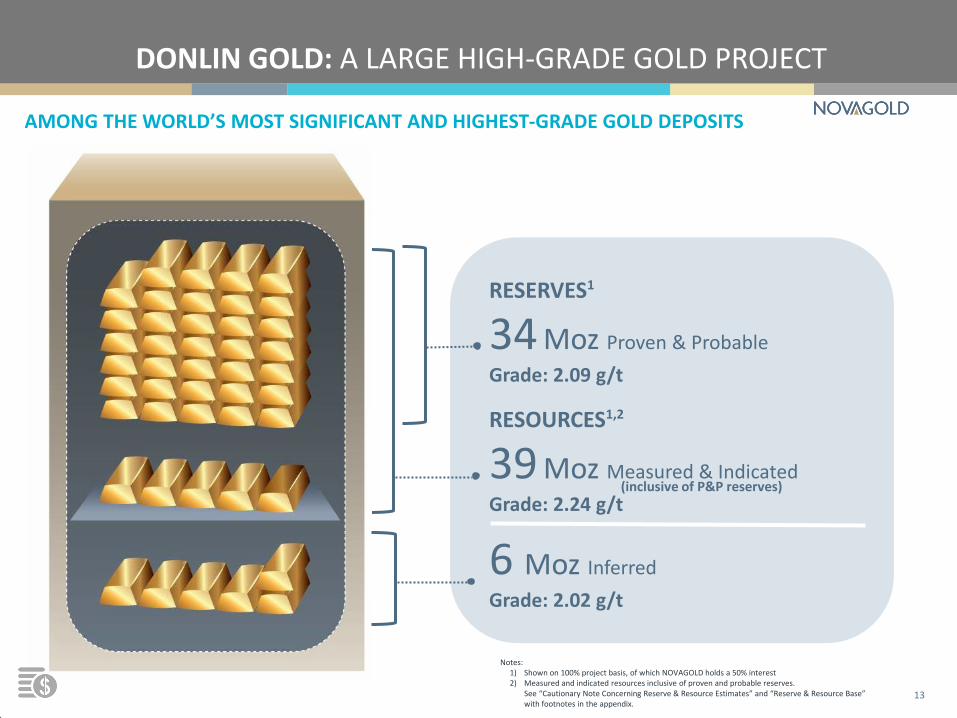
Notes: 1) Shown on 100% project basis, of which NOVAGOLD holds a 50% interest 2) Measured and indicated resources inclusive of proven and probable reserves.
See “Cautionary Note Concerning Reserve & Resource Estimates” and “Reserve & Resource Base” with footnotes in the appendix.
RESERVES1
34 Moz Proven & Probable
Grade: 2.09 g/t
RESOURCES1,2
39 Moz Measured & Indicated
Grade: 2.24 g/t
6 Moz Inferred
Grade: 2.02 g/t
(inclusive of P&P reserves)
AMONG THE WORLD’S MOST SIGNIFICANT AND HIGHEST-GRADE GOLD DEPOSITS
13
DONLIN GOLD: A LARGE HIGH-GRADE GOLD PROJECT
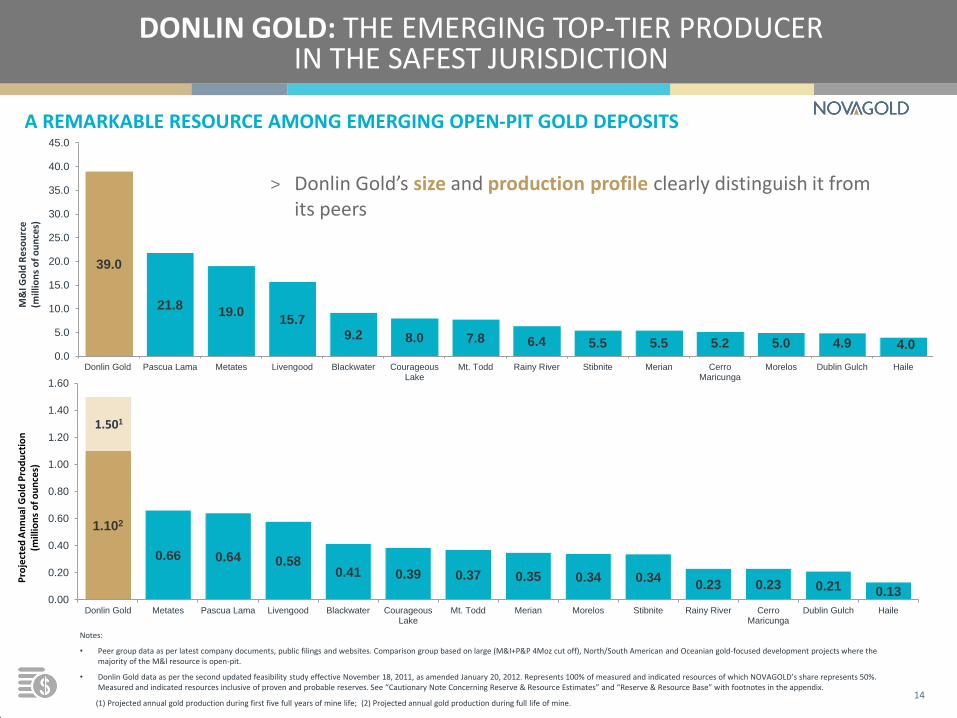
A REMARKABLE RESOURCE AMONG EMERGING OPEN-PIT GOLD DEPOSITS
DONLIN GOLD: THE EMERGING TOP-TIER PRODUCER IN THE SAFEST JURISDICTION
1.102
0.66 0.64 0.58 0.41 0.39 0.37 0.35 0.34 0.34
0.23 0.23 0.21 0.13
1.501
0.00
0.20
0.40
0.60
0.80
1.00
1.20
1.40
1.60
Donlin Gold Metates Pascua Lama Livengood Blackwater CourageousLake
Mt. Todd Merian Morelos Stibnite Rainy River CerroMaricunga
Dublin Gulch Haile
Pro
ject
ed
An
nu
al G
old
Pro
du
ctio
n
(mill
ion
s o
f o
un
ces)
Notes:
• Peer group data as per latest company documents, public filings and websites. Comparison group based on large (M&I+P&P 4Moz cut off), North/South American and Oceanian gold-focused development projects where the majority of the M&I resource is open-pit.
• Donlin Gold data as per the second updated feasibility study effective November 18, 2011, as amended January 20, 2012. Represents 100% of measured and indicated resources of which NOVAGOLD’s share represents 50%. Measured and indicated resources inclusive of proven and probable reserves. See “Cautionary Note Concerning Reserve & Resource Estimates” and “Reserve & Resource Base” with footnotes in the appendix.
(1) Projected annual gold production during first five full years of mine life; (2) Projected annual gold production during full life of mine.
39.0
21.8 19.0
15.7 9.2 8.0 7.8 6.4 5.5 5.5 5.2 5.0 4.9 4.0
0.0
5.0
10.0
15.0
20.0
25.0
30.0
35.0
40.0
45.0
Donlin Gold Pascua Lama Metates Livengood Blackwater CourageousLake
Mt. Todd Rainy River Stibnite Merian CerroMaricunga
Morelos Dublin Gulch Haile
M&
I Go
ld R
eso
urc
e
(mill
ion
s o
f o
un
ces)
14
> Donlin Gold’s size and production profile clearly distinguish it from its peers
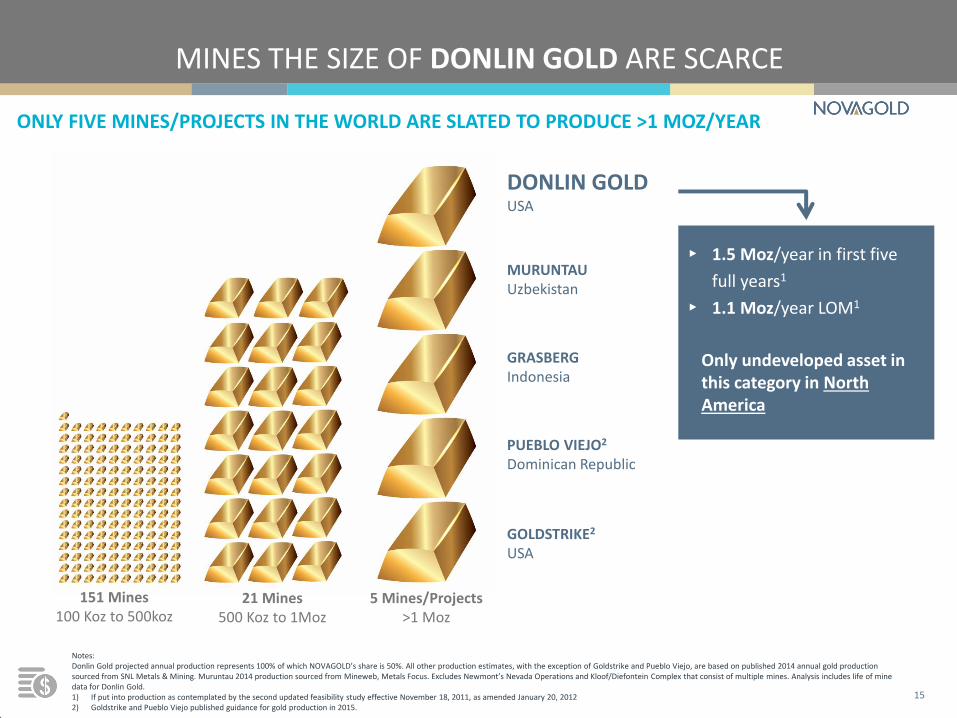
Notes: Donlin Gold projected annual production represents 100% of which NOVAGOLD’s share is 50%. All other production estimates, with the exception of Goldstrike and Pueblo Viejo, are based on published 2014 annual gold production sourced from SNL Metals & Mining. Muruntau 2014 production sourced from Mineweb, Metals Focus. Excludes Newmont’s Nevada Operations and Kloof/Diefontein Complex that consist of multiple mines. Analysis includes life of mine data for Donlin Gold. 1) If put into production as contemplated by the second updated feasibility study effective November 18, 2011, as amended January 20, 2012 2) Goldstrike and Pueblo Viejo published guidance for gold production in 2015.
151 Mines 100 Koz to 500koz
21 Mines 500 Koz to 1Moz
5 Mines/Projects >1 Moz
GOLDSTRIKE2
USA
GRASBERG Indonesia
DONLIN GOLD USA
MINES THE SIZE OF DONLIN GOLD ARE SCARCE
15
PUEBLO VIEJO2 Dominican Republic
MURUNTAU Uzbekistan
ONLY FIVE MINES/PROJECTS IN THE WORLD ARE SLATED TO PRODUCE >1 MOZ/YEAR
▸ 1.5 Moz/year in first five
full years1
▸ 1.1 Moz/year LOM1
Only undeveloped asset in this category in North America
Notes: See “Cautionary Note Concerning Reserve & Resource Estimates” and “Reserve & Resource Base” with footnotes in the appendix. 1) 2014 average grade of open-pit and underground deposits with gold as primary commodity and over 1 Moz in measured and indicated resources, sourced from SNL Metals & Mining. 2) Donlin Gold data as per the second updated feasibility study effective November 18, 2011, as amended January 20, 2012. Represents 100% of measured and indicated resources of which NOVAGOLD’s share is 50%. Measured and
indicated resources are inclusive of proven and probable reserves. 3) 2013 data sourced from SNL Metals & Mining. Includes feasibility-level projects, low grade cut off is 1.0 g/t.
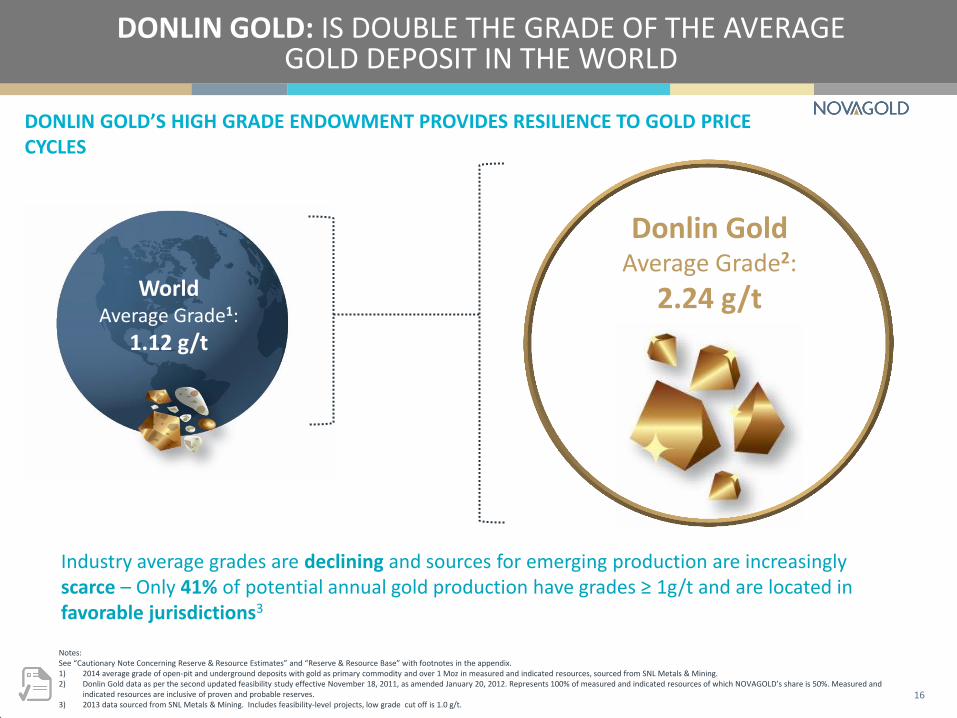
World Average Grade1:
1.12 g/t
Donlin Gold Average Grade2:
2.24 g/t
DONLIN GOLD’S HIGH GRADE ENDOWMENT PROVIDES RESILIENCE TO GOLD PRICE CYCLES
DONLIN GOLD: IS DOUBLE THE GRADE OF THE AVERAGE GOLD DEPOSIT IN THE WORLD
16
Industry average grades are declining and sources for emerging production are increasingly scarce – Only 41% of potential annual gold production have grades ≥ 1g/t and are located in favorable jurisdictions3
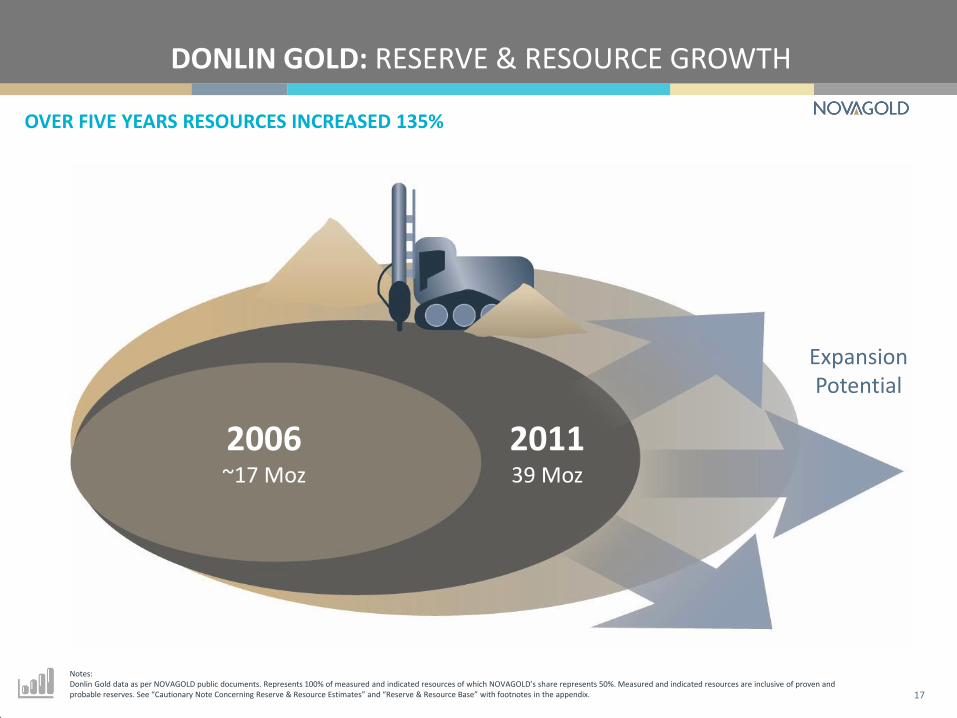
DONLIN GOLD: RESERVE & RESOURCE GROWTH
Notes: Donlin Gold data as per NOVAGOLD public documents. Represents 100% of measured and indicated resources of which NOVAGOLD’s share represents 50%. Measured and indicated resources are inclusive of proven and probable reserves. See “Cautionary Note Concerning Reserve & Resource Estimates” and “Reserve & Resource Base” with footnotes in the appendix.
2006 ~17 Moz
2011 39 Moz
Expansion Potential
OVER FIVE YEARS RESOURCES INCREASED 135%
17

MULTIPLE DRILL PROSPECTS AND TARGETS EXIST ALONG 8KM TREND
DONLIN GOLD: EXCELLENT EXPLORATION POTENTIAL
18
The next big gold discovery?
> Potential to expand current open-pit resources along strike and at depth
> Good prospects to discover meaningful deposits outside current mine footprint
• Reserves and resources are contained within just 3 km of an 8 km long trend
> Inferred mineral resource: 6 Moz of gold mainly inside the reserve pit
• Upside potential to project economics
> In-pit area covers 1,600 acres (~2%) of the 80,000 acres comprising the entire land package
6.2B
8.2B
11.6B
14.6B
19.2B
27.0B
0
5,000
10,000
15,000
20,000
25,000
30,000
1,200 1,300 1,500 1,700 2,000 2,500
Gold Price (US$)
NPV (US$ in millions)
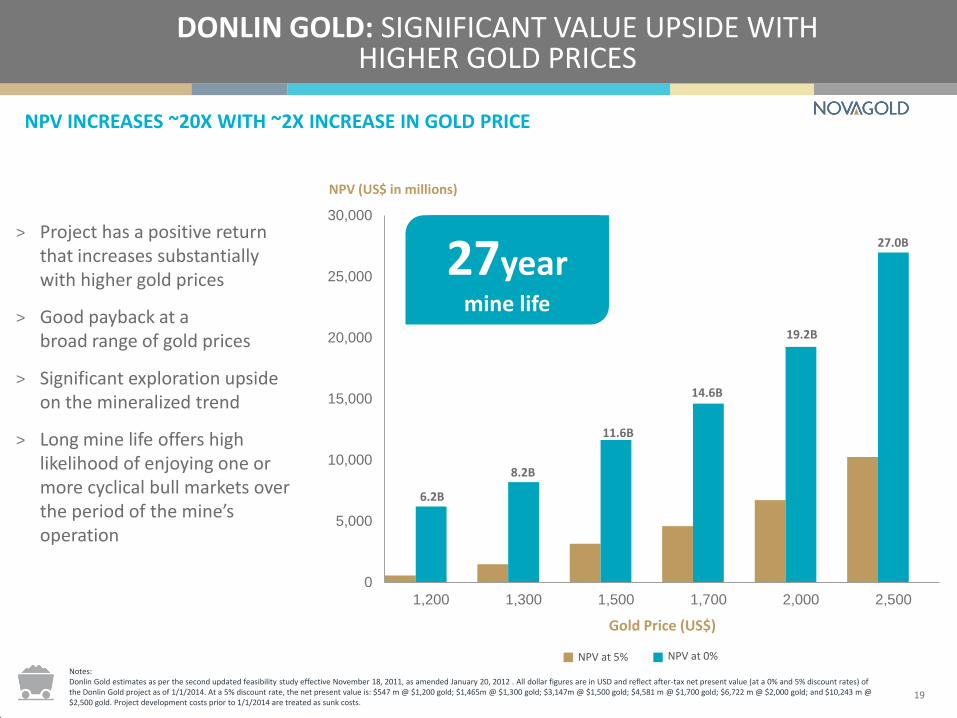
NPV INCREASES ~20X WITH ~2X INCREASE IN GOLD PRICE
DONLIN GOLD: SIGNIFICANT VALUE UPSIDE WITH HIGHER GOLD PRICES
19
Notes: Donlin Gold estimates as per the second updated feasibility study effective November 18, 2011, as amended January 20, 2012 . All dollar figures are in USD and reflect after-tax net present value (at a 0% and 5% discount rates) of the Donlin Gold project as of 1/1/2014. At a 5% discount rate, the net present value is: $547 m @ $1,200 gold; $1,465m @ $1,300 gold; $3,147m @ $1,500 gold; $4,581 m @ $1,700 gold; $6,722 m @ $2,000 gold; and $10,243 m @ $2,500 gold. Project development costs prior to 1/1/2014 are treated as sunk costs.
27year mine life
NPV at 0% NPV at 5%
> Project has a positive return that increases substantially with higher gold prices
> Good payback at a broad range of gold prices
> Significant exploration upside on the mineralized trend
> Long mine life offers high likelihood of enjoying one or more cyclical bull markets over the period of the mine’s operation
COLLABORATING WITH OUR PARTNER TO COMPLETE THE EIS PROCESS
DONLIN GOLD: COMMITTED PARTNERS ADVANCING THE PROJECT
> Project activities continue to progress as planned
> Focused on advancing Donlin Gold through permitting to a construction decision
> Neither partner has a build at any gold price mentality
“Both companies are happy to take a sober and constructive view. We don't want to subsidize the world's consumption of gold by squandering the treasures that Mother Nature has given us and we're happy to wait for the higher gold prices that will make the project's economics sing.” – Thomas S. Kaplan, Chairman of NOVAGOLD
Barrick and NOVAGOLD are jointly committed to working together to create shareholder value from Donlin Gold’s unique optionality
20
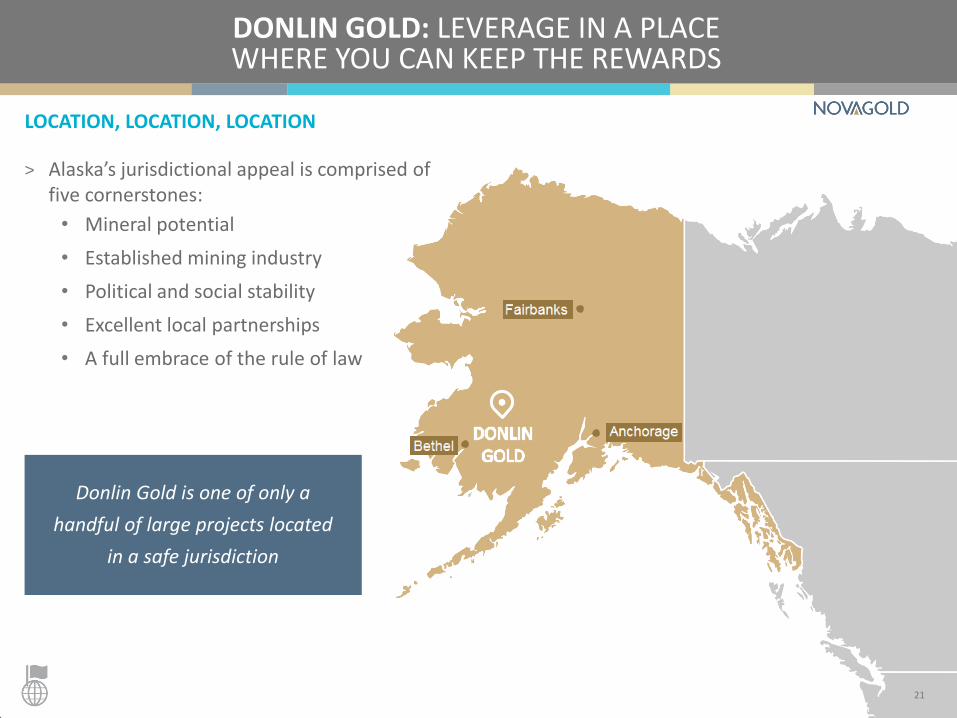
LOCATION, LOCATION, LOCATION
DONLIN GOLD: LEVERAGE IN A PLACE WHERE YOU CAN KEEP THE REWARDS
> Alaska’s jurisdictional appeal is comprised of five cornerstones:
• Mineral potential
• Established mining industry
• Political and social stability
• Excellent local partnerships
• A full embrace of the rule of law
21
Donlin Gold is one of only a
handful of large projects located
in a safe jurisdiction

ALASKA NATIVE CORPORATIONS: LEADERS OF REGIONAL ECONOMIC DEVELOPMENT
DONLIN GOLD: STRONG PARTNERSHIPS WITH LOCAL STAKEHOLDERS
22
> ANCSA established 40 years ago; resolved Alaska Native land claims
> Lands valuable for resource potential selected by Regional Corporations under ANCSA
> Native corporations have an owner’s interest in the development of the selected lands to support the economic prosperity of their shareholders
> Donlin Gold is located on private land specifically selected for its resource development potential
> Enhancing awareness among our broader stakeholder base through active outreach and engagement with communities as well as various organizations in Alaska
• Workforce development • Education (mine tours, village visits, Yup’ik language materials,
documentary videos and newsletters) • Safety • Environmental initiatives
> A unique partnership with the National Fish and Wildlife Foundation that supports regional solutions driven by locals in Alaska to enhance and protect wildlife habitat
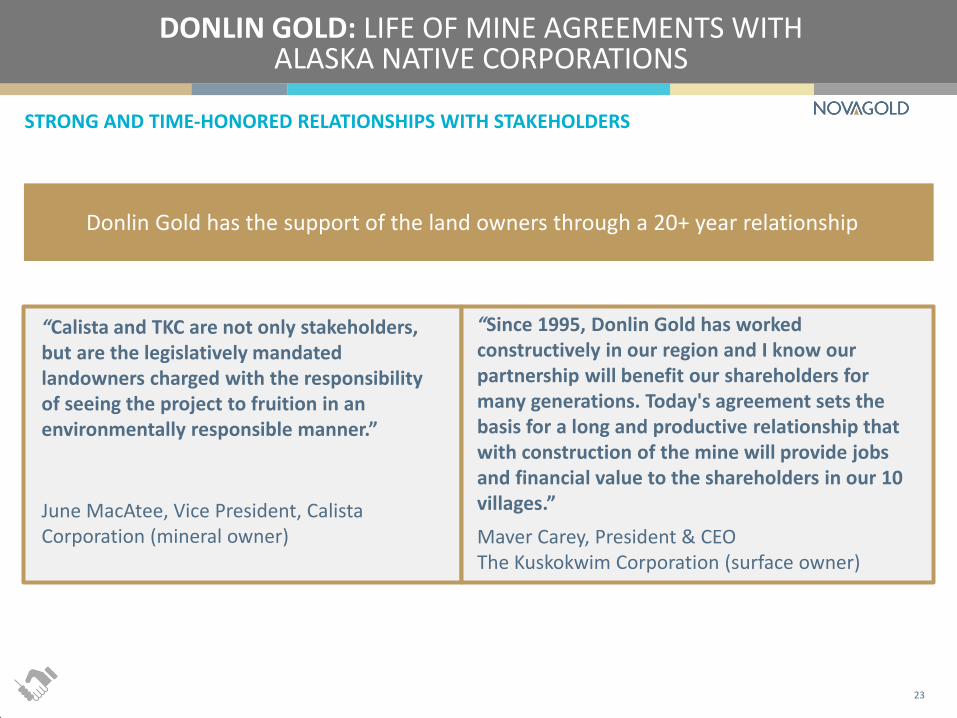
STRONG AND TIME-HONORED RELATIONSHIPS WITH STAKEHOLDERS
DONLIN GOLD: LIFE OF MINE AGREEMENTS WITH ALASKA NATIVE CORPORATIONS
23
Donlin Gold has the support of the land owners through a 20+ year relationship
“Calista and TKC are not only stakeholders, but are the legislatively mandated landowners charged with the responsibility of seeing the project to fruition in an environmentally responsible manner.”
June MacAtee, Vice President, Calista Corporation (mineral owner)
“Since 1995, Donlin Gold has worked constructively in our region and I know our partnership will benefit our shareholders for many generations. Today's agreement sets the basis for a long and productive relationship that with construction of the mine will provide jobs and financial value to the shareholders in our 10 villages.”
Maver Carey, President & CEO The Kuskokwim Corporation (surface owner)
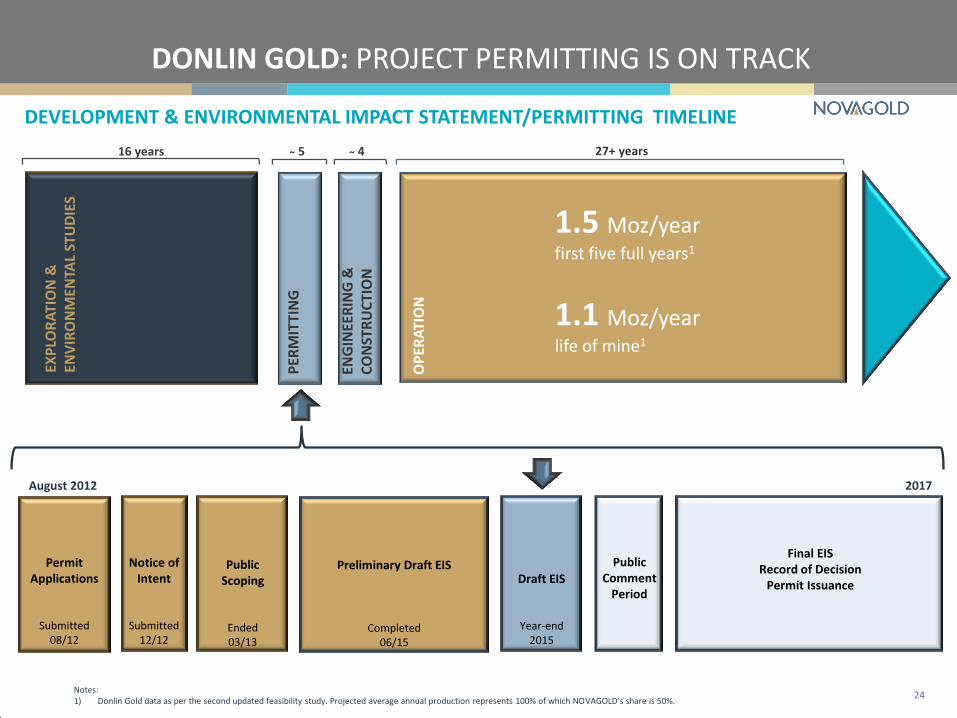
DEVELOPMENT & ENVIRONMENTAL IMPACT STATEMENT/PERMITTING TIMELINE
DONLIN GOLD: PROJECT PERMITTING IS ON TRACK
16 years 4 27+ years
EXP
LOR
ATI
ON
&
ENV
IRO
NM
ENTA
L ST
UD
IES
PER
MIT
TIN
G
ENG
INEE
RIN
G &
C
ON
STR
UC
TIO
N
OP
ERA
TIO
N
1.5 Moz/year first five full years1
1.1 Moz/year life of mine1
5
Notes: 1) Donlin Gold data as per the second updated feasibility study. Projected average annual production represents 100% of which NOVAGOLD’s share is 50%.
24
Public Scoping
Ended 03/13
Draft EIS
Year-end 2015
Final EIS Record of Decision
Permit Issuance
Preliminary Draft EIS
Completed 06/15
Public Comment
Period
Notice of Intent
Submitted 12/12
August 2012 2017
Permit Applications
Submitted 08/12
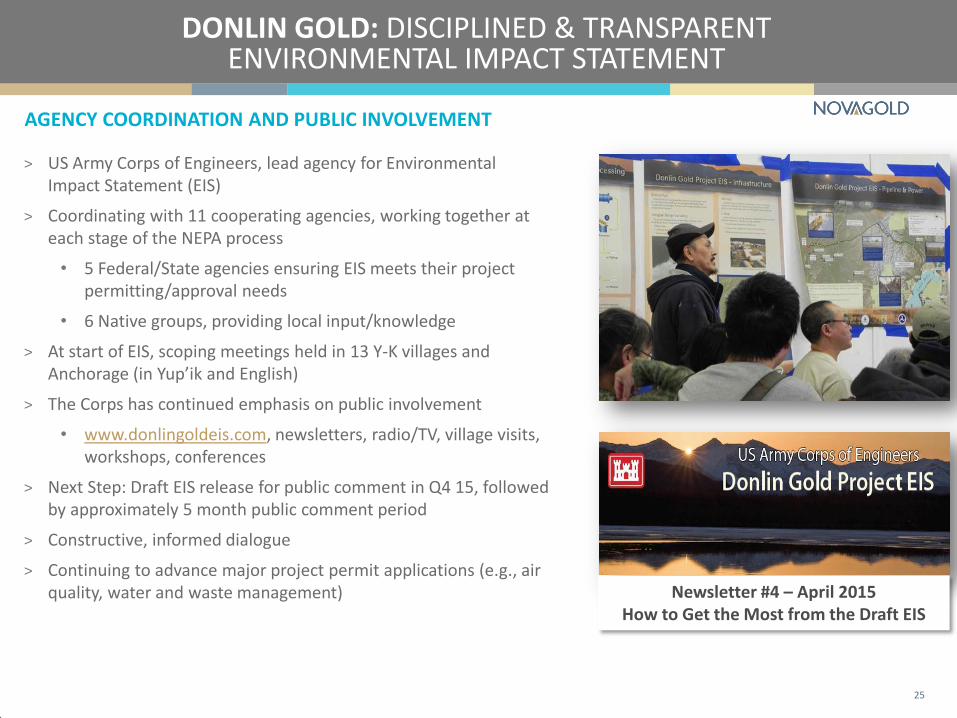
AGENCY COORDINATION AND PUBLIC INVOLVEMENT
DONLIN GOLD: DISCIPLINED & TRANSPARENT ENVIRONMENTAL IMPACT STATEMENT
> US Army Corps of Engineers, lead agency for Environmental Impact Statement (EIS)
> Coordinating with 11 cooperating agencies, working together at each stage of the NEPA process
• 5 Federal/State agencies ensuring EIS meets their project permitting/approval needs
• 6 Native groups, providing local input/knowledge
> At start of EIS, scoping meetings held in 13 Y-K villages and Anchorage (in Yup’ik and English)
> The Corps has continued emphasis on public involvement
• www.donlingoldeis.com, newsletters, radio/TV, village visits, workshops, conferences
> Next Step: Draft EIS release for public comment in Q4 15, followed by approximately 5 month public comment period
> Constructive, informed dialogue
> Continuing to advance major project permit applications (e.g., air quality, water and waste management)
Newsletter #4 – April 2015 How to Get the Most from the Draft EIS
25
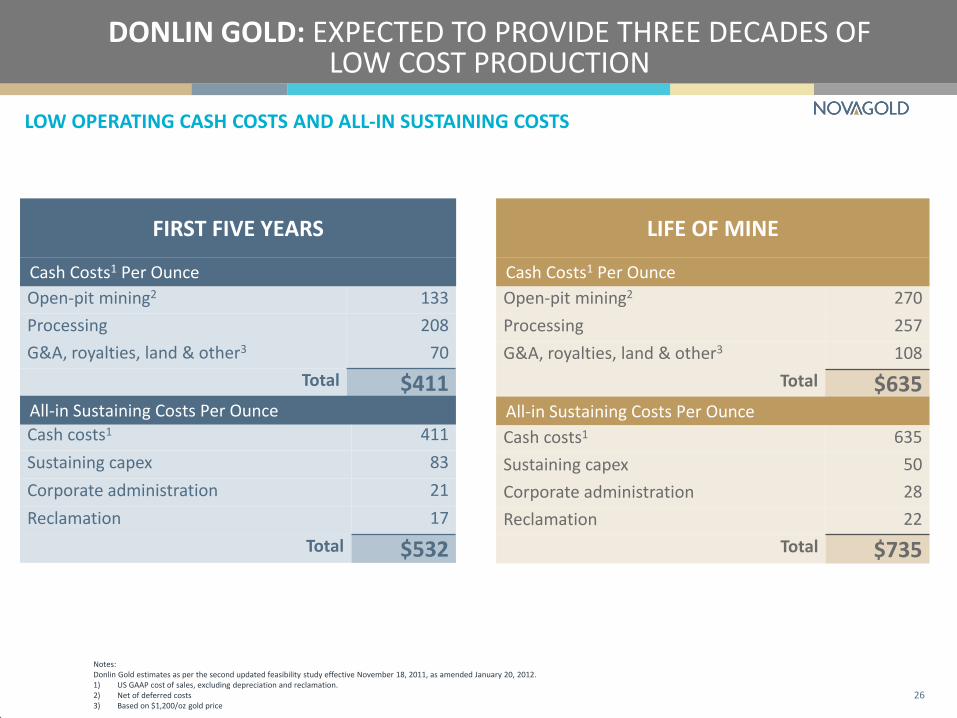
DONLIN GOLD: EXPECTED TO PROVIDE THREE DECADES OF LOW COST PRODUCTION
LOW OPERATING CASH COSTS AND ALL-IN SUSTAINING COSTS
Open-pit mining2 270
Processing 257
G&A, royalties, land & other3 108
Total $635
Open-pit mining2 133
Processing 208
G&A, royalties, land & other3 70
Total $411
Cash Costs1 Per Ounce
FIRST FIVE YEARS
Notes: Donlin Gold estimates as per the second updated feasibility study effective November 18, 2011, as amended January 20, 2012. 1) US GAAP cost of sales, excluding depreciation and reclamation. 2) Net of deferred costs 3) Based on $1,200/oz gold price
All-in Sustaining Costs Per Ounce
Cash costs1 635
Sustaining capex 50
Corporate administration 28
Reclamation 22
Total $735
Cash costs1 411
Sustaining capex 83
Corporate administration 21
Reclamation 17
Total $532
LIFE OF MINE
Cash Costs1 Per Ounce
All-in Sustaining Costs Per Ounce
26
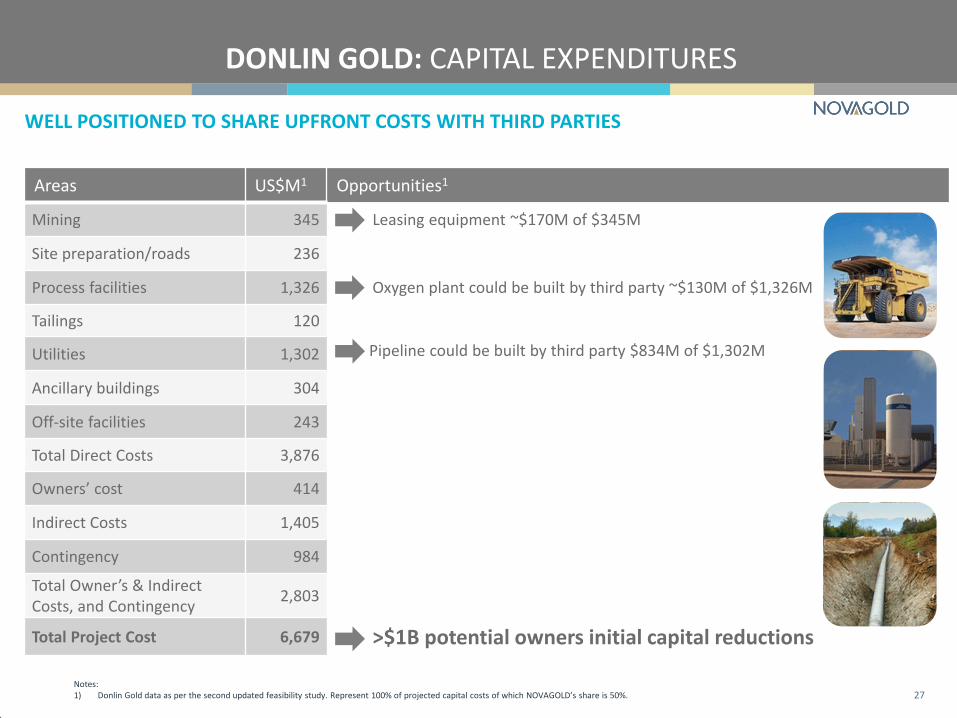
WELL POSITIONED TO SHARE UPFRONT COSTS WITH THIRD PARTIES
DONLIN GOLD: CAPITAL EXPENDITURES
Areas US$M1 Opportunities1
Mining 345 Leasing equipment ~$170M of $345M
Site preparation/roads 236
Process facilities 1,326 Oxygen plant could be built by third party ~$130M of $1,326M
Tailings 120
Utilities 1,302
Ancillary buildings 304
Off-site facilities 243
Total Direct Costs 3,876
Owners’ cost 414
Indirect Costs 1,405
Contingency 984
Total Owner’s & Indirect Costs, and Contingency
2,803
Total Project Cost 6,679 >$1B potential owners initial capital reductions
Pipeline could be built by third party $834M of $1,302M
27 Notes: 1) Donlin Gold data as per the second updated feasibility study. Represent 100% of projected capital costs of which NOVAGOLD’s share is 50%.
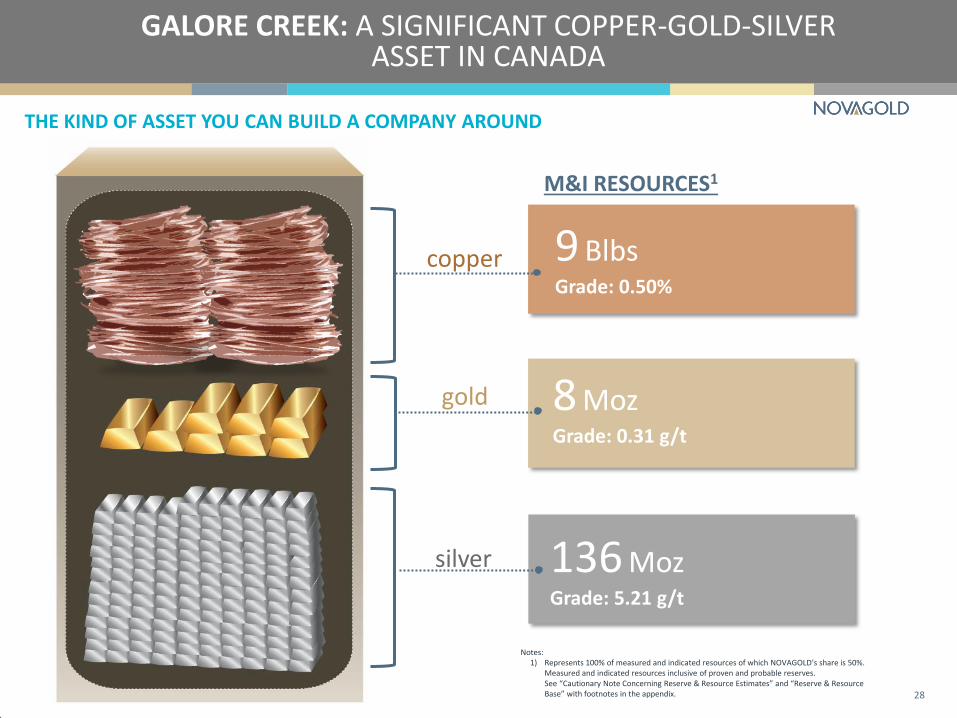
THE KIND OF ASSET YOU CAN BUILD A COMPANY AROUND
GALORE CREEK: A SIGNIFICANT COPPER-GOLD-SILVER ASSET IN CANADA
Notes: 1) Represents 100% of measured and indicated resources of which NOVAGOLD’s share is 50%.
Measured and indicated resources inclusive of proven and probable reserves. See “Cautionary Note Concerning Reserve & Resource Estimates” and “Reserve & Resource Base” with footnotes in the appendix.
9 Blbs Grade: 0.50%
8 Moz Grade: 0.31 g/t
136 Moz Grade: 5.21 g/t
copper
gold
silver
M&I RESOURCES1
28
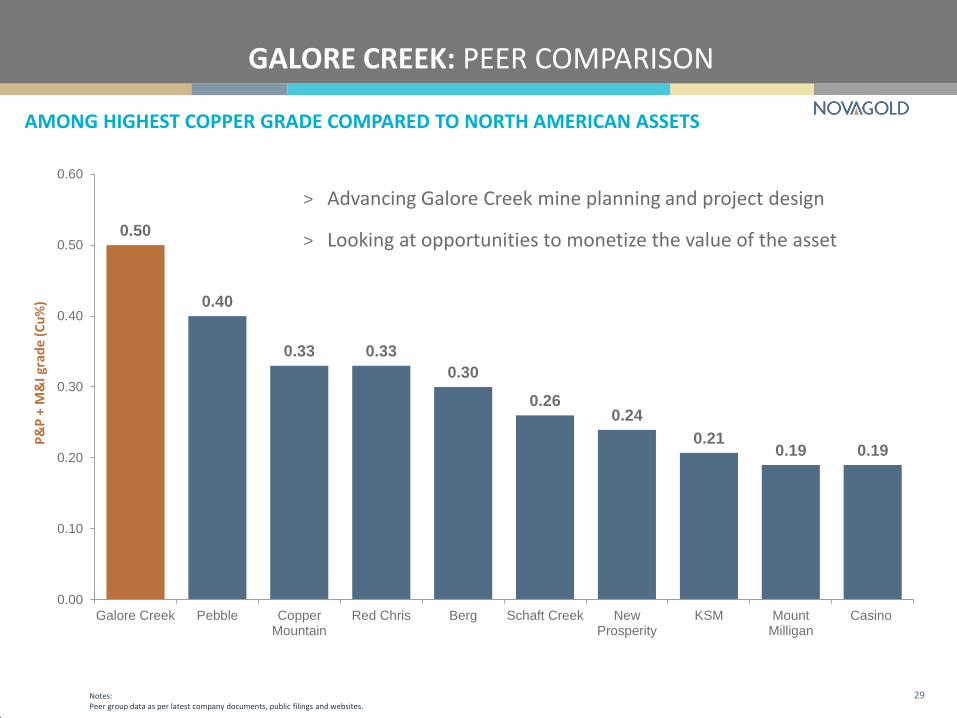
0.50
0.40
0.33 0.33
0.30
0.26 0.24
0.21 0.19 0.19
0.00
0.10
0.20
0.30
0.40
0.50
0.60
Galore Creek Pebble CopperMountain
Red Chris Berg Schaft Creek NewProsperity
KSM MountMilligan
Casino
AMONG HIGHEST COPPER GRADE COMPARED TO NORTH AMERICAN ASSETS
GALORE CREEK: PEER COMPARISON P
&P
+ M
&I g
rad
e (
Cu
%)
Notes: Peer group data as per latest company documents, public filings and websites.
29
> Advancing Galore Creek mine planning and project design
> Looking at opportunities to monetize the value of the asset
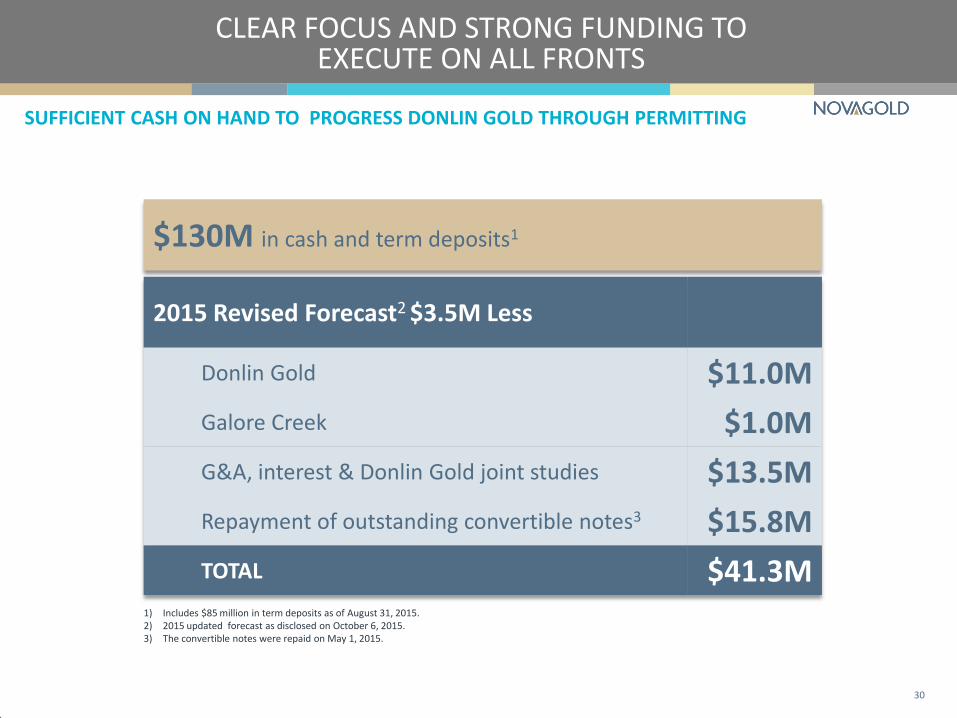
2015 Revised Forecast2 $3.5M Less
Donlin Gold $11.0M
Galore Creek $1.0M
G&A, interest & Donlin Gold joint studies $13.5M
Repayment of outstanding convertible notes3 $15.8M
TOTAL $41.3M 1) Includes $85 million in term deposits as of August 31, 2015. 2) 2015 updated forecast as disclosed on October 6, 2015. 3) The convertible notes were repaid on May 1, 2015.
SUFFICIENT CASH ON HAND TO PROGRESS DONLIN GOLD THROUGH PERMITTING
CLEAR FOCUS AND STRONG FUNDING TO EXECUTE ON ALL FRONTS
30
$130M in cash and term deposits1
CONTINUE TO EXECUTE AND DELIVER ON OUR BUSINESS PLAN
2015 FOCUS
COMMITTED TO GOLD AND WELL-POSITIONED TO EXCEL THROUGH MARKET CYCLES
31
> Advance Donlin Gold permitting to a construction decision
> Maintain strong relationships with all stakeholders
> Advance Galore Creek mine planning and project design
> Monetize the value of Galore Creek
> Safeguard our cash position
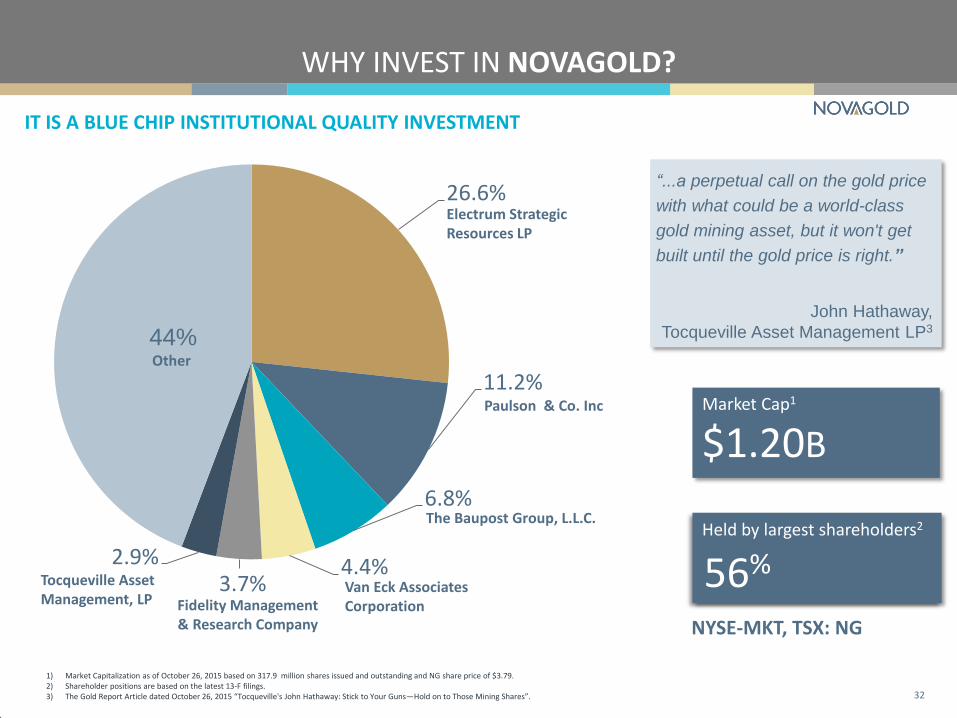
IT IS A BLUE CHIP INSTITUTIONAL QUALITY INVESTMENT
WHY INVEST IN NOVAGOLD?
Market Cap1
$1.20B
1) Market Capitalization as of October 26, 2015 based on 317.9 million shares issued and outstanding and NG share price of $3.79. 2) Shareholder positions are based on the latest 13-F filings. 3) The Gold Report Article dated October 26, 2015 “Tocqueville's John Hathaway: Stick to Your Guns—Hold on to Those Mining Shares”.
NYSE-MKT, TSX: NG
32
“...a perpetual call on the gold price
with what could be a world-class
gold mining asset, but it won't get
built until the gold price is right.”
John Hathaway,
Tocqueville Asset Management LP3
Held by largest shareholders2
56%
26.6%
11.2%
6.8%
4.4% 3.7%
2.9%
44%
Electrum Strategic Resources LP
Paulson & Co. Inc
The Baupost Group, L.L.C.
Van Eck Associates Corporation Fidelity Management
& Research Company
Other
Tocqueville Asset Management, LP
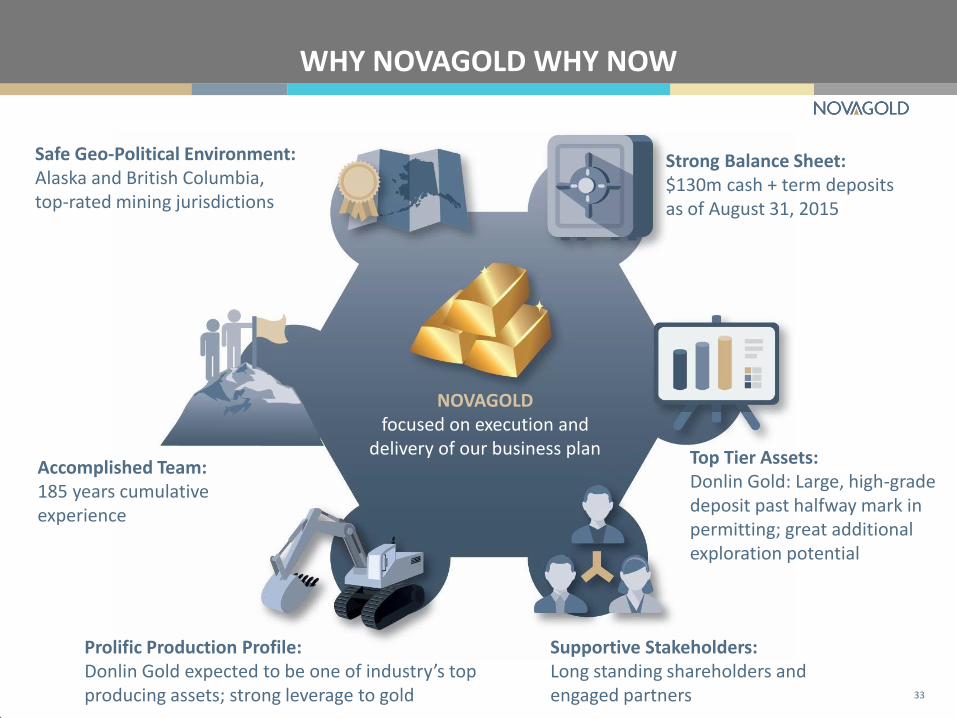
NOVAGOLD focused on execution and
delivery of our business plan
WHY NOVAGOLD WHY NOW
Safe Geo-Political Environment: Alaska and British Columbia, top-rated mining jurisdictions
Accomplished Team: 185 years cumulative experience
Prolific Production Profile: Donlin Gold expected to be one of industry’s top producing assets; strong leverage to gold
Supportive Stakeholders: Long standing shareholders and engaged partners
Strong Balance Sheet: $130m cash + term deposits as of August 31, 2015
Top Tier Assets: Donlin Gold: Large, high-grade deposit past halfway mark in permitting; great additional exploration potential
33
novagold.com
APPENDIX
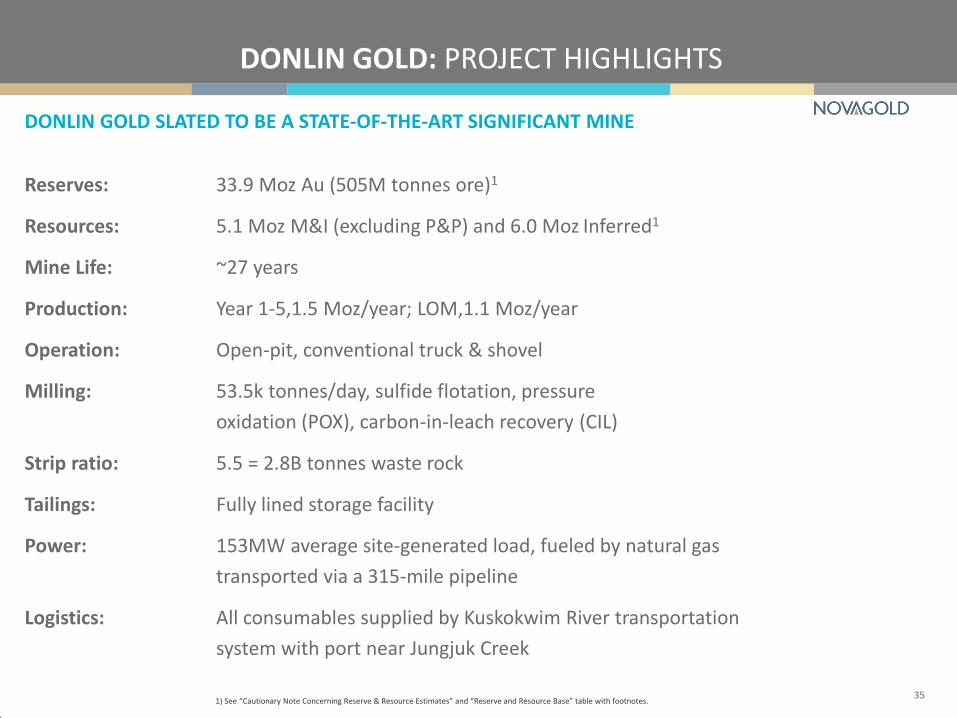
DONLIN GOLD SLATED TO BE A STATE-OF-THE-ART SIGNIFICANT MINE
DONLIN GOLD: PROJECT HIGHLIGHTS
Reserves: 33.9 Moz Au (505M tonnes ore)1
Resources: 5.1 Moz M&I (excluding P&P) and 6.0 Moz Inferred1
Mine Life: ~27 years
Production: Year 1-5,1.5 Moz/year; LOM,1.1 Moz/year
Operation: Open-pit, conventional truck & shovel
Milling: 53.5k tonnes/day, sulfide flotation, pressure
oxidation (POX), carbon-in-leach recovery (CIL)
Strip ratio: 5.5 = 2.8B tonnes waste rock
Tailings: Fully lined storage facility
Power: 153MW average site-generated load, fueled by natural gas
transported via a 315-mile pipeline
Logistics: All consumables supplied by Kuskokwim River transportation
system with port near Jungjuk Creek
1) See “Cautionary Note Concerning Reserve & Resource Estimates” and “Reserve and Resource Base” table with footnotes. 35
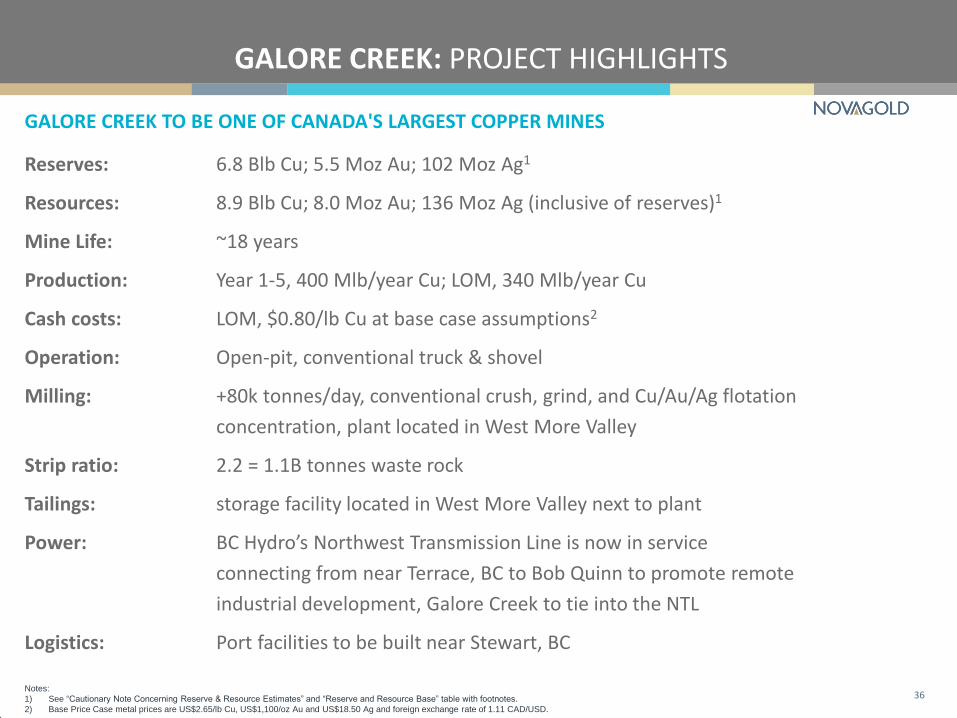
GALORE CREEK TO BE ONE OF CANADA'S LARGEST COPPER MINES
GALORE CREEK: PROJECT HIGHLIGHTS
Reserves: 6.8 Blb Cu; 5.5 Moz Au; 102 Moz Ag1
Resources: 8.9 Blb Cu; 8.0 Moz Au; 136 Moz Ag (inclusive of reserves)1
Mine Life: ~18 years
Production: Year 1-5, 400 Mlb/year Cu; LOM, 340 Mlb/year Cu
Cash costs: LOM, $0.80/lb Cu at base case assumptions2
Operation: Open-pit, conventional truck & shovel
Milling: +80k tonnes/day, conventional crush, grind, and Cu/Au/Ag flotation
concentration, plant located in West More Valley
Strip ratio: 2.2 = 1.1B tonnes waste rock
Tailings: storage facility located in West More Valley next to plant
Power: BC Hydro’s Northwest Transmission Line is now in service
connecting from near Terrace, BC to Bob Quinn to promote remote
industrial development, Galore Creek to tie into the NTL
Logistics: Port facilities to be built near Stewart, BC
Notes:
1) See “Cautionary Note Concerning Reserve & Resource Estimates” and “Reserve and Resource Base” table with footnotes.
2) Base Price Case metal prices are US$2.65/lb Cu, US$1,100/oz Au and US$18.50 Ag and foreign exchange rate of 1.11 CAD/USD.
36
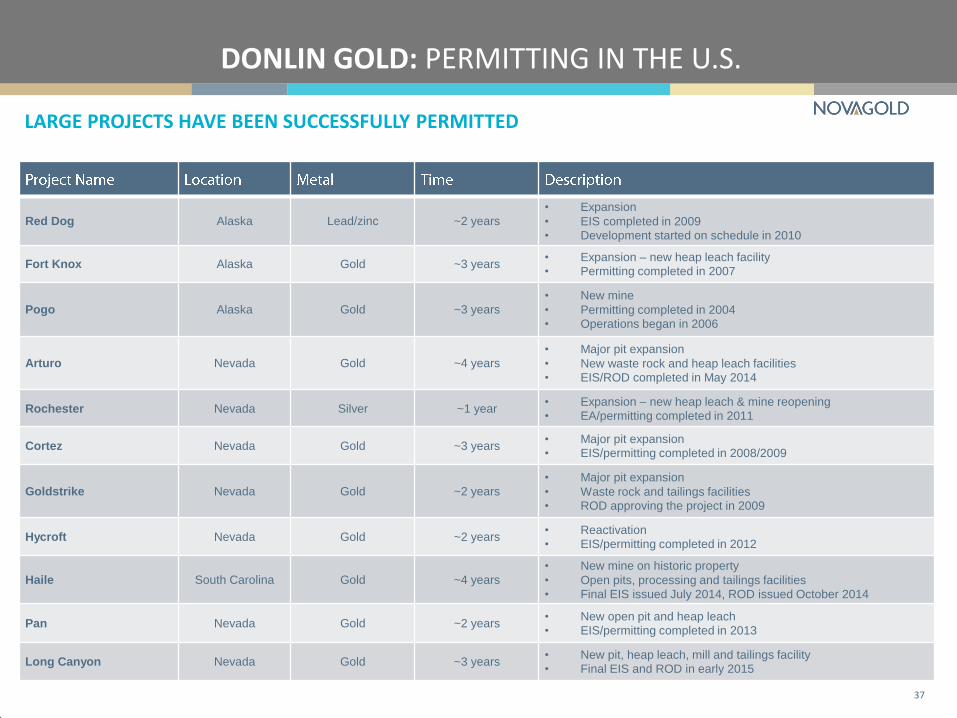
LARGE PROJECTS HAVE BEEN SUCCESSFULLY PERMITTED
DONLIN GOLD: PERMITTING IN THE U.S.
Red Dog Alaska Lead/zinc ~2 years • Expansion
• EIS completed in 2009 • Development started on schedule in 2010
Fort Knox Alaska Gold ~3 years • Expansion – new heap leach facility
• Permitting completed in 2007
Pogo Alaska Gold ~3 years • New mine
• Permitting completed in 2004
• Operations began in 2006
Arturo Nevada Gold ~4 years • Major pit expansion
• New waste rock and heap leach facilities
• EIS/ROD completed in May 2014
Rochester Nevada Silver ~1 year • Expansion – new heap leach & mine reopening
• EA/permitting completed in 2011
Cortez Nevada Gold ~3 years • Major pit expansion
• EIS/permitting completed in 2008/2009
Goldstrike Nevada Gold ~2 years • Major pit expansion
• Waste rock and tailings facilities
• ROD approving the project in 2009
Hycroft Nevada Gold ~2 years • Reactivation
• EIS/permitting completed in 2012
Haile South Carolina Gold ~4 years • New mine on historic property
• Open pits, processing and tailings facilities
• Final EIS issued July 2014, ROD issued October 2014
Pan Nevada Gold ~2 years • New open pit and heap leach
• EIS/permitting completed in 2013
Long Canyon Nevada Gold ~3 years • New pit, heap leach, mill and tailings facility
• Final EIS and ROD in early 2015
37
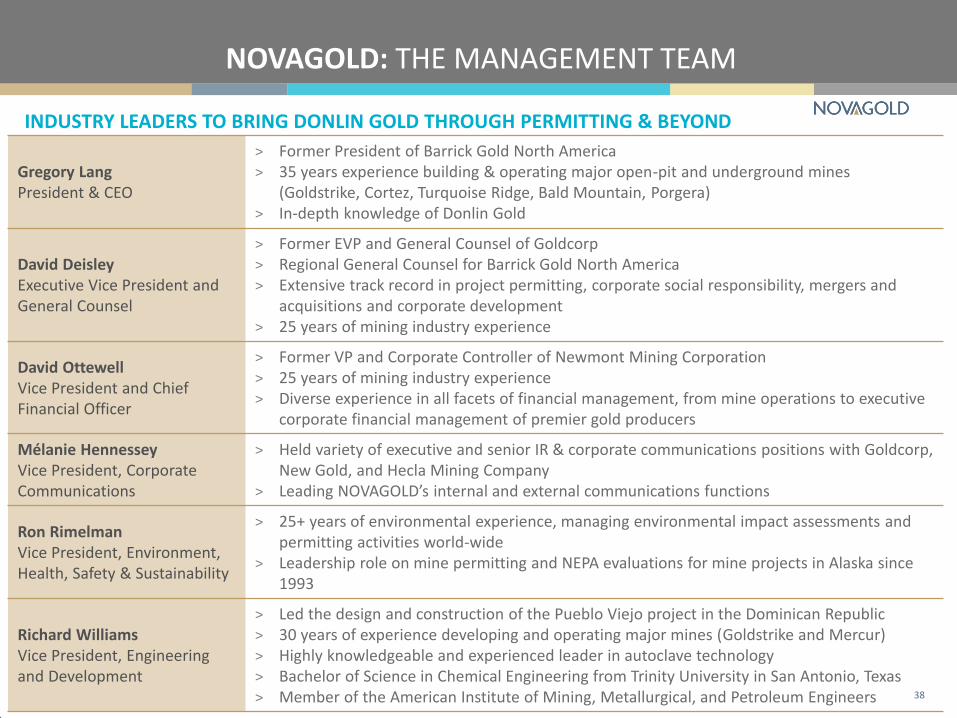
INDUSTRY LEADERS TO BRING DONLIN GOLD THROUGH PERMITTING & BEYOND
NOVAGOLD: THE MANAGEMENT TEAM
Gregory Lang President & CEO
> Former President of Barrick Gold North America > 35 years experience building & operating major open-pit and underground mines
(Goldstrike, Cortez, Turquoise Ridge, Bald Mountain, Porgera) > In-depth knowledge of Donlin Gold
David Deisley Executive Vice President and General Counsel
> Former EVP and General Counsel of Goldcorp > Regional General Counsel for Barrick Gold North America > Extensive track record in project permitting, corporate social responsibility, mergers and
acquisitions and corporate development > 25 years of mining industry experience
David Ottewell Vice President and Chief Financial Officer
> Former VP and Corporate Controller of Newmont Mining Corporation > 25 years of mining industry experience > Diverse experience in all facets of financial management, from mine operations to executive
corporate financial management of premier gold producers
Mélanie Hennessey Vice President, Corporate Communications
> Held variety of executive and senior IR & corporate communications positions with Goldcorp, New Gold, and Hecla Mining Company
> Leading NOVAGOLD’s internal and external communications functions
Ron Rimelman Vice President, Environment, Health, Safety & Sustainability
> 25+ years of environmental experience, managing environmental impact assessments and permitting activities world-wide
> Leadership role on mine permitting and NEPA evaluations for mine projects in Alaska since 1993
Richard Williams Vice President, Engineering and Development
> Led the design and construction of the Pueblo Viejo project in the Dominican Republic > 30 years of experience developing and operating major mines (Goldstrike and Mercur) > Highly knowledgeable and experienced leader in autoclave technology > Bachelor of Science in Chemical Engineering from Trinity University in San Antonio, Texas > Member of the American Institute of Mining, Metallurgical, and Petroleum Engineers 38
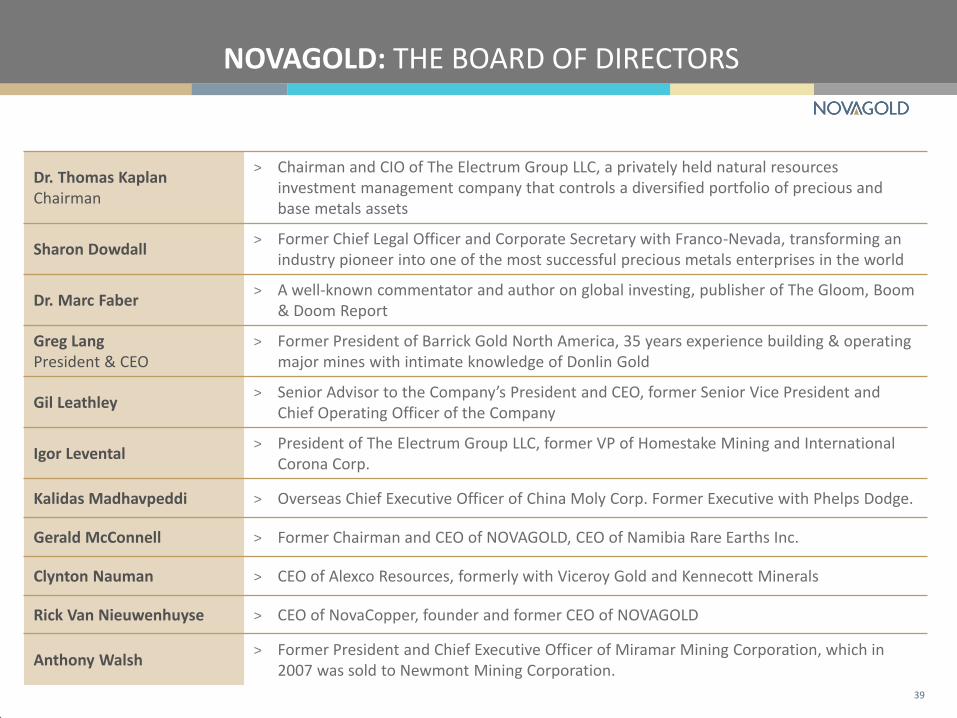
NOVAGOLD: THE BOARD OF DIRECTORS
Dr. Thomas Kaplan Chairman
> Chairman and CIO of The Electrum Group LLC, a privately held natural resources investment management company that controls a diversified portfolio of precious and base metals assets
Sharon Dowdall > Former Chief Legal Officer and Corporate Secretary with Franco-Nevada, transforming an
industry pioneer into one of the most successful precious metals enterprises in the world
Dr. Marc Faber > A well-known commentator and author on global investing, publisher of The Gloom, Boom
& Doom Report
Greg Lang President & CEO
> Former President of Barrick Gold North America, 35 years experience building & operating major mines with intimate knowledge of Donlin Gold
Gil Leathley > Senior Advisor to the Company’s President and CEO, former Senior Vice President and
Chief Operating Officer of the Company
Igor Levental > President of The Electrum Group LLC, former VP of Homestake Mining and International
Corona Corp.
Kalidas Madhavpeddi > Overseas Chief Executive Officer of China Moly Corp. Former Executive with Phelps Dodge.
Gerald McConnell > Former Chairman and CEO of NOVAGOLD, CEO of Namibia Rare Earths Inc.
Clynton Nauman > CEO of Alexco Resources, formerly with Viceroy Gold and Kennecott Minerals
Rick Van Nieuwenhuyse > CEO of NovaCopper, founder and former CEO of NOVAGOLD
Anthony Walsh > Former President and Chief Executive Officer of Miramar Mining Corporation, which in
2007 was sold to Newmont Mining Corporation.
39
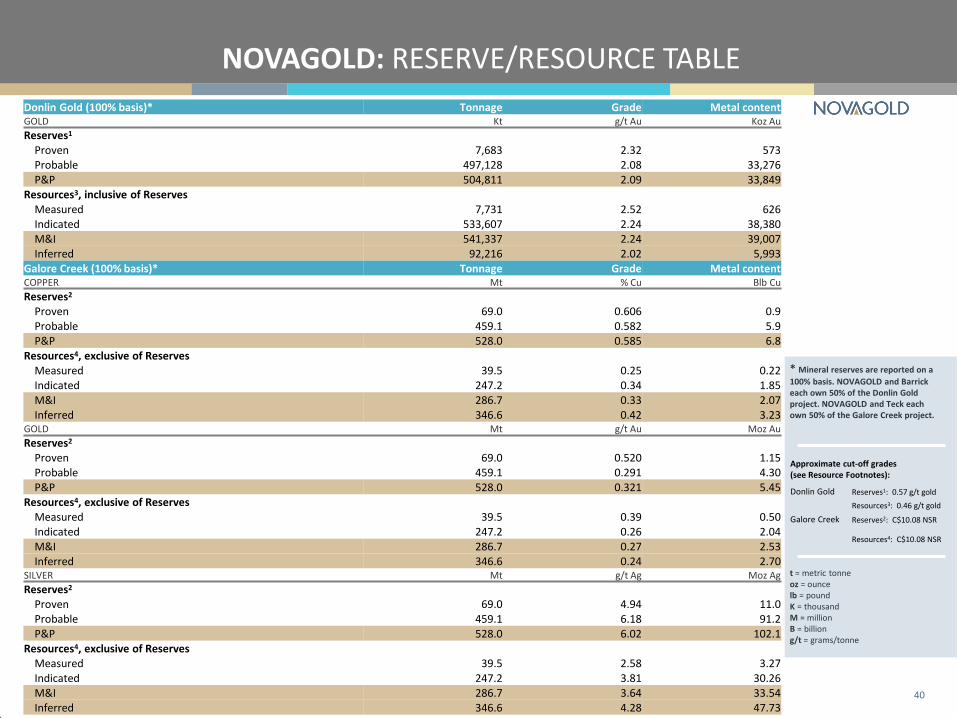
NOVAGOLD: RESERVE/RESOURCE TABLE
40
Donlin Gold (100% basis)* Tonnage Grade Metal content GOLD Kt g/t Au Koz Au
Reserves1 Proven 7,683 2.32 573 Probable 497,128 2.08 33,276 P&P 504,811 2.09 33,849 Resources3, inclusive of Reserves Measured 7,731 2.52 626 Indicated 533,607 2.24 38,380 M&I 541,337 2.24 39,007 Inferred 92,216 2.02 5,993 Galore Creek (100% basis)* Tonnage Grade Metal content COPPER Mt % Cu Blb Cu
Reserves2 Proven 69.0 0.606 0.9 Probable 459.1 0.582 5.9 P&P 528.0 0.585 6.8 Resources4, exclusive of Reserves Measured 39.5 0.25 0.22 Indicated 247.2 0.34 1.85 M&I 286.7 0.33 2.07 Inferred 346.6 0.42 3.23 GOLD Mt g/t Au Moz Au
Reserves2 Proven 69.0 0.520 1.15 Probable 459.1 0.291 4.30 P&P 528.0 0.321 5.45 Resources4, exclusive of Reserves Measured 39.5 0.39 0.50 Indicated 247.2 0.26 2.04 M&I 286.7 0.27 2.53 Inferred 346.6 0.24 2.70 SILVER Mt g/t Ag Moz Ag
Reserves2 Proven 69.0 4.94 11.0 Probable 459.1 6.18 91.2 P&P 528.0 6.02 102.1 Resources4, exclusive of Reserves Measured 39.5 2.58 3.27 Indicated 247.2 3.81 30.26 M&I 286.7 3.64 33.54 Inferred 346.6 4.28 47.73
* Mineral reserves are reported on a
100% basis. NOVAGOLD and Barrick each own 50% of the Donlin Gold project. NOVAGOLD and Teck each own 50% of the Galore Creek project.
t = metric tonne oz = ounce lb = pound K = thousand M = million B = billion g/t = grams/tonne
Approximate cut-off grades (see Resource Footnotes):
Donlin Gold Reserves1: 0.57 g/t gold
Resources3: 0.46 g/t gold
Galore Creek Reserves2: C$10.08 NSR
Resources4: C$10.08 NSR
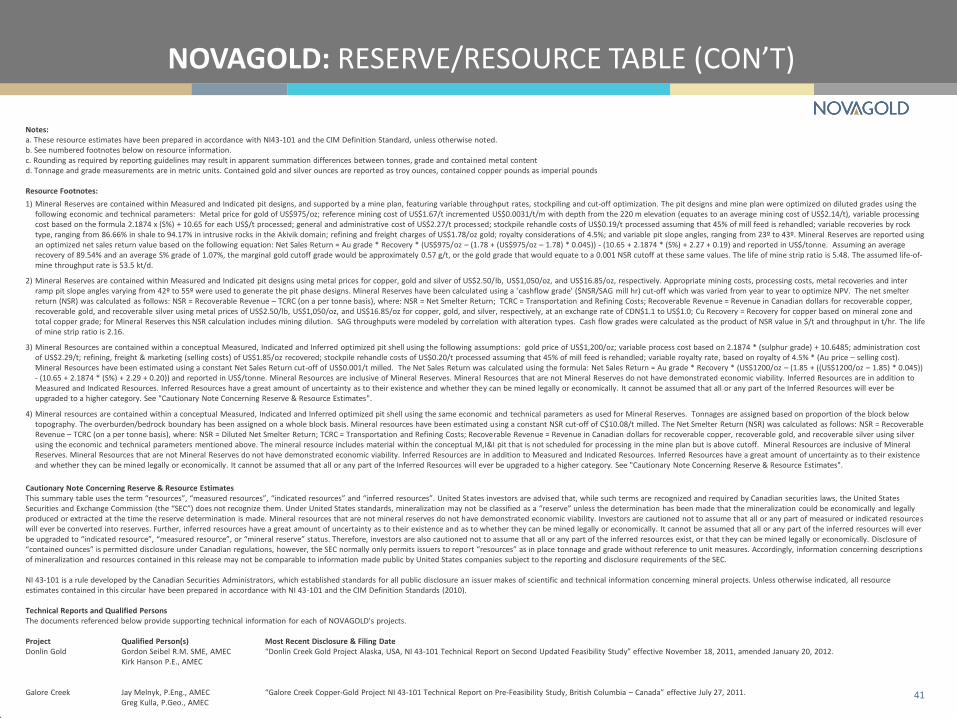
Notes: a. These resource estimates have been prepared in accordance with NI43-101 and the CIM Definition Standard, unless otherwise noted. b. See numbered footnotes below on resource information. c. Rounding as required by reporting guidelines may result in apparent summation differences between tonnes, grade and contained metal content d. Tonnage and grade measurements are in metric units. Contained gold and silver ounces are reported as troy ounces, contained copper pounds as imperial pounds Resource Footnotes:
1) Mineral Reserves are contained within Measured and Indicated pit designs, and supported by a mine plan, featuring variable throughput rates, stockpiling and cut-off optimization. The pit designs and mine plan were optimized on diluted grades using the following economic and technical parameters: Metal price for gold of US$975/oz; reference mining cost of US$1.67/t incremented US$0.0031/t/m with depth from the 220 m elevation (equates to an average mining cost of US$2.14/t), variable processing cost based on the formula 2.1874 x (S%) + 10.65 for each US$/t processed; general and administrative cost of US$2.27/t processed; stockpile rehandle costs of US$0.19/t processed assuming that 45% of mill feed is rehandled; variable recoveries by rock type, ranging from 86.66% in shale to 94.17% in intrusive rocks in the Akivik domain; refining and freight charges of US$1.78/oz gold; royalty considerations of 4.5%; and variable pit slope angles, ranging from 23º to 43º. Mineral Reserves are reported using an optimized net sales return value based on the following equation: Net Sales Return = Au grade * Recovery * (US$975/oz – (1.78 + (US$975/oz – 1.78) * 0.045)) - (10.65 + 2.1874 * (S%) + 2.27 + 0.19) and reported in US$/tonne. Assuming an average recovery of 89.54% and an average S% grade of 1.07%, the marginal gold cutoff grade would be approximately 0.57 g/t, or the gold grade that would equate to a 0.001 NSR cutoff at these same values. The life of mine strip ratio is 5.48. The assumed life-of-mine throughput rate is 53.5 kt/d.
2) Mineral Reserves are contained within Measured and Indicated pit designs using metal prices for copper, gold and silver of US$2.50/lb, US$1,050/oz, and US$16.85/oz, respectively. Appropriate mining costs, processing costs, metal recoveries and inter ramp pit slope angles varying from 42º to 55º were used to generate the pit phase designs. Mineral Reserves have been calculated using a 'cashflow grade' ($NSR/SAG mill hr) cut-off which was varied from year to year to optimize NPV. The net smelter return (NSR) was calculated as follows: NSR = Recoverable Revenue – TCRC (on a per tonne basis), where: NSR = Net Smelter Return; TCRC = Transportation and Refining Costs; Recoverable Revenue = Revenue in Canadian dollars for recoverable copper, recoverable gold, and recoverable silver using metal prices of US$2.50/lb, US$1,050/oz, and US$16.85/oz for copper, gold, and silver, respectively, at an exchange rate of CDN$1.1 to US$1.0; Cu Recovery = Recovery for copper based on mineral zone and total copper grade; for Mineral Reserves this NSR calculation includes mining dilution. SAG throughputs were modeled by correlation with alteration types. Cash flow grades were calculated as the product of NSR value in $/t and throughput in t/hr. The life of mine strip ratio is 2.16.
3) Mineral Resources are contained within a conceptual Measured, Indicated and Inferred optimized pit shell using the following assumptions: gold price of US$1,200/oz; variable process cost based on 2.1874 * (sulphur grade) + 10.6485; administration cost of US$2.29/t; refining, freight & marketing (selling costs) of US$1.85/oz recovered; stockpile rehandle costs of US$0.20/t processed assuming that 45% of mill feed is rehandled; variable royalty rate, based on royalty of 4.5% * (Au price – selling cost). Mineral Resources have been estimated using a constant Net Sales Return cut-off of US$0.001/t milled. The Net Sales Return was calculated using the formula: Net Sales Return = Au grade * Recovery * (US$1200/oz – (1.85 + ((US$1200/oz – 1.85) * 0.045)) - (10.65 + 2.1874 * (S%) + 2.29 + 0.20)) and reported in US$/tonne. Mineral Resources are inclusive of Mineral Reserves. Mineral Resources that are not Mineral Reserves do not have demonstrated economic viability. Inferred Resources are in addition to Measured and Indicated Resources. Inferred Resources have a great amount of uncertainty as to their existence and whether they can be mined legally or economically. It cannot be assumed that all or any part of the Inferred Resources will ever be upgraded to a higher category. See "Cautionary Note Concerning Reserve & Resource Estimates".
4) Mineral resources are contained within a conceptual Measured, Indicated and Inferred optimized pit shell using the same economic and technical parameters as used for Mineral Reserves. Tonnages are assigned based on proportion of the block below topography. The overburden/bedrock boundary has been assigned on a whole block basis. Mineral resources have been estimated using a constant NSR cut-off of C$10.08/t milled. The Net Smelter Return (NSR) was calculated as follows: NSR = Recoverable Revenue – TCRC (on a per tonne basis), where: NSR = Diluted Net Smelter Return; TCRC = Transportation and Refining Costs; Recoverable Revenue = Revenue in Canadian dollars for recoverable copper, recoverable gold, and recoverable silver using silver using the economic and technical parameters mentioned above. The mineral resource includes material within the conceptual M,I&I pit that is not scheduled for processing in the mine plan but is above cutoff. Mineral Resources are inclusive of Mineral Reserves. Mineral Resources that are not Mineral Reserves do not have demonstrated economic viability. Inferred Resources are in addition to Measured and Indicated Resources. Inferred Resources have a great amount of uncertainty as to their existence and whether they can be mined legally or economically. It cannot be assumed that all or any part of the Inferred Resources will ever be upgraded to a higher category. See "Cautionary Note Concerning Reserve & Resource Estimates".
Cautionary Note Concerning Reserve & Resource Estimates This summary table uses the term “resources”, “measured resources”, “indicated resources” and “inferred resources”. United States investors are advised that, while such terms are recognized and required by Canadian securities laws, the United States Securities and Exchange Commission (the “SEC”) does not recognize them. Under United States standards, mineralization may not be classified as a “reserve” unless the determination has been made that the mineralization could be economically and legally produced or extracted at the time the reserve determination is made. Mineral resources that are not mineral reserves do not have demonstrated economic viability. Investors are cautioned not to assume that all or any part of measured or indicated resources will ever be converted into reserves. Further, inferred resources have a great amount of uncertainty as to their existence and as to whether they can be mined legally or economically. It cannot be assumed that all or any part of the inferred resources will ever be upgraded to “indicated resource”, “measured resource”, or “mineral reserve” status. Therefore, investors are also cautioned not to assume that all or any part of the inferred resources exist, or that they can be mined legally or economically. Disclosure of “contained ounces” is permitted disclosure under Canadian regulations, however, the SEC normally only permits issuers to report “resources” as in place tonnage and grade without reference to unit measures. Accordingly, information concerning descriptions of mineralization and resources contained in this release may not be comparable to information made public by United States companies subject to the reporting and disclosure requirements of the SEC. NI 43-101 is a rule developed by the Canadian Securities Administrators, which established standards for all public disclosure an issuer makes of scientific and technical information concerning mineral projects. Unless otherwise indicated, all resource estimates contained in this circular have been prepared in accordance with NI 43-101 and the CIM Definition Standards (2010). Technical Reports and Qualified Persons The documents referenced below provide supporting technical information for each of NOVAGOLD's projects. Project Qualified Person(s) Most Recent Disclosure & Filing Date Donlin Gold Gordon Seibel R.M. SME, AMEC “Donlin Creek Gold Project Alaska, USA, NI 43-101 Technical Report on Second Updated Feasibility Study” effective November 18, 2011, amended January 20, 2012. Kirk Hanson P.E., AMEC Galore Creek Jay Melnyk, P.Eng., AMEC “Galore Creek Copper-Gold Project NI 43-101 Technical Report on Pre-Feasibility Study, British Columbia – Canada” effective July 27, 2011. Greg Kulla, P.Geo., AMEC Heather White, B.Sc., P.Eng., who is a consultant to NOVAGOLD and a “qualified person” under NI 43-101, has approved the scientific and technical information included in this Reserve and Resource Table.
NOVAGOLD: RESERVE/RESOURCE TABLE (CON’T)
41
NOVAGOLD RESOURCES INC. Suite 720 – 789 West Pender Street Vancouver, BC Canada V6C 1H2 T 604 669 6227 TF 1 866 669 6227 F 604 669 6272 www.novagold.com [email protected]
Mélanie Hennessey VP, Corporate Communications [email protected]
Erin O’Toole Analyst, Investor Relations [email protected]
CONTACT US
42