Embed Size (px)
Citation preview

The effect of patient-provider communication on medication adherence in hypertensive African Americans: Does race matter?
Antoinette Schoenthaler EdDCenter for Healthful Behavior Change
NYU School of Medicine
Supported by NHLBI NSRA F31 Fellowship and K23 HL098564-01A1
ICCH October 2011

Background• Patient-provider communication has emerged as an
important and potentially modifiable factor associated with improved patient outcomes
• Despite mounting evidence of the positive relationship between collaborative communication and medication adherence, particularly in minority patients, the basis of this association has not been well-studied1-4
• Race-concordant relationships may contribute to the higher rates of medication adherence noted in collaborative patient-provider interactions
¹Traylor et al JGIM 2011; 25:1172-1177. ²Howard et al. Research on Aging 2001;23:83-108; ³Konrad et al. AJPH 2005;95:2186-2190; 4Cooper et al., Ann Intern Med 2003;139:907-915

Study Aim
Among 597 hypertensive African American patients followed in 30 Community Healthcare Centers (CHC):
The aim of the study was:
• To determine whether the association between patients’ ratings of provider communication and medication adherence is modified by the racial composition of the patient-provider relationship

• Provider communication rated as more collaborative would be associated with better adherence for patients in race-concordant relationships compared to those in race-discordant relationships
Hypothesis

Methods
• Embedded within a group-randomized controlled trial Counseling African Americans to Control Hypertension (CAATCH) in 30 CHCs in NYC.
• Cross sectional research design using survey methods.
• All measures were self-report and required either a categorical response (yes/no) or based on Likert scales.
• All data was collected by CAATCH study staff prior to the delivery of the intervention.

Participants
Patient Eligibility:
▫ Self-identified as non-Hispanic African American (Black) receiving care in CHC site;
▫ Diagnosed with hypertension (ICD: 401-401.9);
▫ Taking at least one anti-hypertensive medication;
▫ 18 years of age or older;
▫ Fluent in English.
Provider Eligibility:
▫ MD/DO, NP, or PA providing care in CHC sites;
▫ Self-identified as non-Hispanic African American (Black) or Caucasian (White);
▫ Providing care to at least 5 patients with uncontrolled hypertension.

ModeratorRacial composition of patient-provider relationship
• Race-Concordant: Patient-provider relationship where both the patient and provider are of the same race (e.g. black/African American provider and patient)
• Race-Discordant: Patient-provider relationship where the patient is black/African American and the provider Caucasian American/white
• Analytical sample included 597 patients and 69 providers▫ 207 patients were in a race-discordant relationship ▫ 390 patients were in a race-concordant relationship

Independent Measure: Communication
• 11-item measure derived from a study assessing the effect of patient’s perception of provider communication on adherence to anti-depressant medications¹
• Sample questions include “To what degree is your doctor: √ Friendly during the visit, √ Asked if you had questions and concerns, √ Gave clear instructions on how to take medications.
• Responses range from 1 = not at all to 4 = very much.
• Treated as a continuous measure where lower scores indicate more collaborative communication.
¹Bultman & Svarstad, 2000

Dependent Measure:Medication Adherence
• Self-reported medication adherence was assessed with the well-validated Morisky scale¹
• Patients were given a score of “1” for each question they answered “no” to:
√ Have you ever forgotten to take your BP medicine?; √ Are you careless in regards to your medicine?; √ Do you skip your medicine when you are feeling well?;
and √ Do you skip your medication when you are not feeling
well?
• Adherence was coded as a continuous variable with higher scores indicating better adherence.
¹Morisky, Green, & Levine (1989)

Covariates
Demographics • Patient and Provider
Medical Comorbidity• Charlson Comorbidity Index was used to record the #
of comorbid conditions.
Cultural Competency• Provider’s exposure to cultural competency training
across medical education and training.
• Clinical Cultural Competency Questionnaire (CCCQ).•
• Continuous measure with higher scores indicating more exposure to cultural competency training (range: 1 - 4).

Analysis• Demographics between the patient-provider relationships
were compared and significant differences were included in the main analyses
• General linear mixed models (GLMM) were used to account for nested nature of the data (patients within providers within sites)
• Model 1: Main effects model• Model 2: Addition of Dyad typeXCommunication
Interaction term
• Post hoc analysis of simple slopes
• Significance levels were set at p ≤ .05.
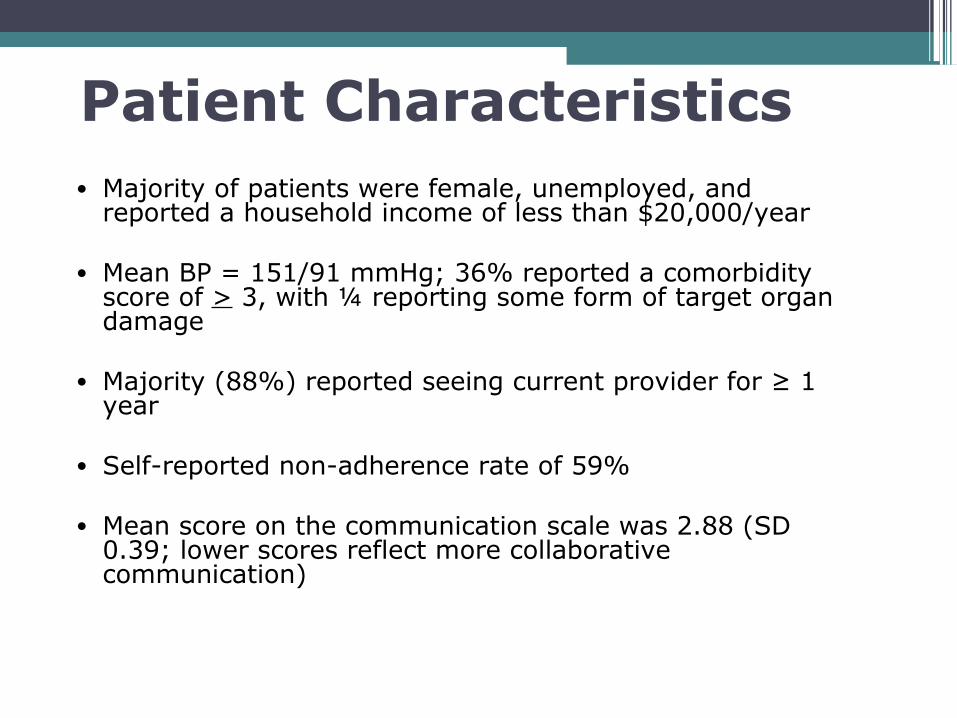
Patient Characteristics• Majority of patients were female, unemployed, and
reported a household income of less than $20,000/year
• Mean BP = 151/91 mmHg; 36% reported a comorbidity score of > 3, with ¼ reporting some form of target organ damage
• Majority (88%) reported seeing current provider for ≥ 1 year
• Self-reported non-adherence rate of 59%
• Mean score on the communication scale was 2.88 (SD 0.39; lower scores reflect more collaborative communication)

Patient Characteristics by Racial Composition of the Relationship
• Patients in race-discordant relationships were more likely to report being never married and/or widowed (p = 0.05) and prescribed more antihypertensive medications (2.05 vs. 1.88 p = 0.09).
• Patients in race-concordant relationships were more likely to report having 3 or more comorbid conditions than those in race-discordant relationships (36% vs. 26% p = 0.02).

Provider Characteristics• Majority of providers were female and internists, with a
mean age of 49 years and practice duration of 8.5 years
• On average, providers reported a little to some exposure to cultural competency training (mean = 2.7, SD= 1.0)
• White providers worked at their clinics significantly longer than black providers (10.4 years vs. 8.3 years, p = 0.03); and were more likely to be nurse practitioners (21% vs. 13%; p = 0.05)

Association between Racial Composition and Components of Collaborative Communication
Lower scores indicate more collaborative communication
Scale Item* (range: 1 – 4) Mean Score (SD) p
Race-Concordant Relationship (n = 390)
Race-Discordant Relationship (n = 207)
Asked if had questions or concerns 2.08 (1.05) 1.99 (0.99) 0.30
Helped with concerns related to the use of medication
1.91 (0.99) 1.84 (0.97) 0.75
Friendly during the visit
1.41 (0.68) 1.34 (0.61) 0.08
Gave clear instructions on how to take medication
1.60 (0.86) 1.40 (0.72)
0.001
Listened to you 1.48 (0.74) 1.36 (0.61) 0.001
Gave clear explanation about how medication would affect you
1.88 (1.04) 1.68 (0.96) 0.14
Talked about things that you could do to help you feel better
1.82 (1.01) 1.59 (0.86)
0.003
Encourages expression of problems 1.99 (1.08) 1.73 (0.97) 0.11
Asks about concerns 2.01 (1.12) 1.69 (0.98) 0.08
Listens to your concerns 1.72 (0.90)
1.53 (0.86)
0.43
Helped solve problems 2.03 (1.11) 1.76 (0.94)
0.006

Model 1 Model 2
df F B (SE) p df F B (SE) p
Patient age 1 3.12 0.01 (0.01) 0.08
Stroke 1 5.10 -0.69 (0.31) 0.03‡
Length of relationship ≥1 year 1 3.65 0.52 (0.27) 0.06
Provider birthplace U.S. 1 4.15 -0.35 (0.17) 0.04‡
Communication 1 4.46 -0.46 (0.22) 0.04‡ 1 8.25 -1.11 (0.39) 0.005‡
Dyad type 1 0.75 0.17 (0.20) 0.39 1 1.38 0.23 (0.20) 0.24
CommunicationxDyad 1 4.14 0.95 (0.47) 0.04‡
Results of the GLMM Testing the Effect Modification of Racial Composition

Adherence Association by Racial Composition of the Relationship
p = 0.91

Discussion
• African-American patients in race-discordant relationships who rated their communication with providers as more collaborative, had better medication adherence compared to those in race-concordant relationships.
• White providers’ communication that was rated as less collaborative was associated with poor adherence.
• There was no association between medication adherence and ratings of provider communication in race-concordant relationships

Limitations
• Cross-sectional design using self-report measures.
• Representativeness of providers practicing in ‘safety net’ CHCs.
• Continuity of care with primary care provider was not assessed.
• Patient choice of provider, including race of provider, was not assessed.

Implications
• Patient-provider relationships characterized by mutual respect, collaboration, and understanding may enable providers to bridge sociocultural gaps
• Need to extend beyond examining race as a demographic characteristic to a multi-dimensional identity to understand the role race con(dis)cordance plays in explaining differential outcomes between black and white patients
• Ex., new concepts of social concordance and shared identity

Model 1 Model 2
df F B (SE) p df F B (SE) pPatient age 1 3.12 0.01 (0.01) 0.08Patient gender Male 1 0.15 -0.07 (0.17) 0.70Marital Status 3 0.62 0.61
Insurance status 3 0.45 0.72
Diabetes 1 0.88 0.16 (0.17) 0.35
Stroke 1 5.10 -0.69 (0.31) 0.03‡
# HTN meds 1 0.54 0.06 (0.08) 0.46
Length of relationship ≥1 year 1 3.65 0.52 (0.27) 0.06Provider birthplace U.S. 1 4.15 -0.35 (0.17) 0.04‡
Type of provider MD 1 2.59 0.42 (0.26) 0.11Cultural competency training 1 1.64 -0.10 (0.08) 0.20Years at CHC 1 0.01 0.001 (0.01) 0.93Communication 1 4.46 -0.46 (0.22) 0.04‡ 1 8.25 -1.11 (0.39) 0.005‡
Dyad type 1 0.75 0.17 (0.20) 0.39 1 1.38 0.23 (0.20) 0.24
CommunicationxDyad 1 4.14 0.95 (0.47) 0.04‡

All Patients(N = 597)
Race-Concordant †
(n = 390)
Race-Discordant ‡
(n = 207) p*
Mean age (± SD)Range: 24-89 years
57.3 (12.3) 57.4 (12.7) 58.6 (13.4) 0.30
Female: n (%) 405 (69) 258 (68) 147 (72) 0.26Born in US: n (%) 420 (73) 270 (72) 150 (75) 0.24Marital status: n (%)* Single Married Divorced/Separated Widowed
155 (28)145 (26)173 (31)85 (15)
92 (26)104 (29)115 (32)48 (13)
63 (32)41 (21)58 (29)37 (19)
0.05
Education: n (%) < High school High school and above
218 (38)352 (61)
140 (38)228 (62)
78 (39)124 (61)
0.89
Unemployed: n (%) 378 (66) 128 (63) 138 (68) 0.24Income (%) ≤ $20,000 398 (70) 261 (69) 137 (70) 0.41Insurance status: n (%) None HMO/Private Medicare Medicaid
52 (9)100 (19)158 (28)242 (43)
37 (10)65 (18)
103 (28)164 (44)
15 (8)43 (23)55 (29)78 (41)
0.56
Comorbidity score: n (%) 0 1 - 2 ≥ 3
107 (19)261 (45)206 (36)
74 (20)168 (45)131 (35)
33 (16)93 (46)75 (37)
0.61
Comorbity: n (%) Stroke Diabetes
57 (10)185 (33)
31 (8) 110 (30)
26 (13) 75 (37)
0.090.07
SBP (114-211mm Hg) DBP (67-141mm Hg)
151 (15.7)91 (10.9)
151 (15.3)91 (10.9)
151 (16.3)90 (10.9)
0.360.86
Mean N of meds (± SD)Range: 1-5
1.94 (0.9) 1.88 (0.89) 2.05 (1.04) 0.09
% seeing provider ≥ 1 year 526 (88) 345 (89) 181 (87) 0.71Mean Communication Score¥
Range: 1-42.88 (0.39) 2.91 (0.4) 2.82 (0.37) 0.02
Mean adherence scoreRange: 0 - 4
2.86 (1.23) 2.88 (1.22) 2.81 (1.26) 0.36
% non-adherent 59 58.3 60.0 0.38
![[XLS] Object Summary.xlsx · Web view5/26/2010 5/26/2010. 5/2/2011 5/2/2011. 9/30/2011 9/30/2011. 7/6/2011 7/6/2011. 11/28/2011 11/28/2011. 12/6/2011 12/6/2011. 11/28/2011 11/28/2011](https://img.dokumen.tips/doc/110x75/5ae744ba7f8b9a87048f0cd5/xls-object-summaryxlsxweb-view5262010-5262010-522011-522011-9302011.jpg)


![[GESTIÓN+MEDICIÓN=PROGRESO] · 2015-12-03 · 3 Dic ’ 2010’ Ene’ 2011’ Feb’ 2011’ Mar’ 2011’ Abr’ 2011’ May’ 2011’ Jun’ 2011’ Jul’’ 2011’ Ago’](https://img.dokumen.tips/doc/110x75/5ecede15b16df948656232b5/gestinmedicinprogreso-2015-12-03-3-dic-a-2010a-enea-2011a-feba.jpg)